Table of Contents
- PREFACE
- 1. NEW ZEALAND
- 2. SUCCESSIVE GOVERNORS
- 3. EXECUTIVE COUNCIL, 1843-56
- 4. PARLIAMENTS
- 5. SUCCESSIVE MINISTRIES
- 6. PREMIERS,
WITH DATES OF THEIR ASSUMPTION OF AND RETIREMENT FROM OFFICE. WITH DATES OF THEIR ASSUMPTION OF AND RETIREMENT FROM OFFICE. - 7. SPEAKERS OF THE LEGISLATIVE COUNCIL,
WITH DATE OF THEIR APPOINTMENT AND DATE OF RETIREMENT OR DEATH. - 8. SPEAKERS OF THE HOUSE OF REPRESENTATIVES,
WITH DATES OF THEIR ELECTION AND DATES OF RETIREMENT OR DEATH. - 9. THE COLONIAL OFFICE
- 10. HONOURS HELD BY COLONISTS
- 11. FOREIGN CONSULS
- 12. AGENTS-GENERAL IN LONDON,
(With their Addresses) - 13. CROWN AGENTS FOR THE COLONIES
- 14. GOVERNOR OF NEW ZEALAND
- 15. EXECUTIVE COUNCIL, 1892.
His Excellency the GOVERNOR presides - 16. THE GENERAL ASSEMBLY
- LEGISLATIVE COUNCIL.
- ROLL OF MEMBERS
OF THE HONOURABLE THE
LEGISLATIVE COUNCIL,
Stating the Provincial District in which Members reside, and the Date of Writ of Summons. - HOUSE OF REPRESENTATIVES.
- ROLL OF MEMBERS
OF THE HOUSE OF REPRESENTATIVES,
With the Name of the District for which they are elected, and the Date of Notification of Return of Writ.
- 17. ECCLESIASTICAL
- 18. OFFICIAL LIST.
[1st August, 1892.] - CIVIL ESTABLISHMENT AT SEAT OF GOVERNMENT
- COLONIAL SECRETARY'S DEPARTMENT
- COLONIAL TREASURER'S DEPARTMENT
- LAND- AND INCOME-TAX DEPARTMENT
- DEPARTMENT OF JUSTICE
- POST OFFICE AND TELEGRAPH DEPARTMENT
- DEPARTMENT OF TRADE AND CUSTOMS AND MARINE
- MARINE
- STAMP DEPARTMENT
- LAND TRANSFER DEPARTMENT AND DEEDS REGISTRY
- EDUCATION DEPARTMENT
- DEPARTMENT OF LABOUR
- NATIVE DEPARTMENT
- MINES DEPARTMENT
- PUBLIC WORKS DEPARTMENT
- RAILWAY DEPARTMENT
- DEFENCE DEPARTMENT
- DEPARTMENT OF LANDS AND SURVEY
- AGRICULTURAL AND LIVE-STOCK DEPARTMENT
- GOVERNMENT LIFE INSURANCE DEPARTMENT
- PUBLIC TRUST OFFICE
- 19. ANNUAL PENSIONS
- 20. JUDICIAL
- 21. DEFENCES, MILITARY AND NAVAL
- MILITIA AND VOLUNTEER DISTRICTS.
- PERMANENT MILITIA.—ARTILLERY.
- PERMANENT MILITIA.—TORPEDO CORPS.
- VOLUNTEERS.—CAVALRY
- VOLUNTEERS.—MOUNTED RIFLES.
- VOLUNTEERS.—NAVAL ARTILLERY.
- VOLUNTEERS.—FIELD ARTILLERY.
- VOLUNTEERS.—ENGINEERS.
- VOLUNTEERS.—RIFLE CORPS.
- VOLUNTEERS.—CADET CORPS.
- ORDNANCE, ARMS, ETC.
- ENROLMENT, ETC.
- INSTRUCTORS.
- CAPITATION.
- ADMINISTRATION.
- 22. STATISTICAL INFORMATION
- 23. AGRICULTURE
- 24. THE FROZEN MEAT INDUSTRY
- 25. FOREST-TREES AND TIMBER INDUSTRY
- Order—CONIFERÆ
- Order—CUPULIFERÆ
- Order—MYRTACEÆ
- Order—MELIACEÆ
- Order—ONAGRARIEÆ
- Order—ARALIACEÆ
- Order—CORNEÆ
- Order—CCOMPOSITÆ
- Order—ERICEÆ
- Order—VVERBENAÆ
- Order—LAURINEÆ
- Order—MONIMIACEÆ
- Order—PROTEACEÆ
- Order—MAGNOLIACEÆ
- Order—VIOLARIEÆ
- Order—MALVACEÆ
- Order—TILIACEÆ
- Order—OLACINÆ
- Order—RHAMNEÆ
- Order—SAPINDACEÆ
- Order—CORIARIEÆ
- Order—LEGUMINOSÆ
- Order—SAXIFRAGEÆ
- Order—RUBIACEÆ
- Order—JASMINEÆ
- Order—SANTALACEÆE
- STRENGTH OF NEW ZEALAND TIMBERS
- NEW ZEALAND FUNGUS
- VALUE OF EXPORT TRADE
- THE TIMBER INDUSTRY
- 26. PHORMIUM TEN AX (NEW ZEALAND HEMP)
- 27. KAURI-GUM
- 28. LABOUR IN NEW ZEALAND
- 29. FISH AND FISHERIES
- 30. INTRODUCTION OF TROUT TO NEW ZEALAND
- 31. GOLD, COAL, AND OTHER MINERALS
- 32. HINTS TO PROSPECTORS FOE GOLD AND OTHER MINERALS
- 33. VARIETIES OF SOIL
- 34. BUILDING-STONES
- 35. BRICKS AND POTTERY
- 36. CLIMATE, TEMPERATURE, AND RAINFALL
- 37. MINERAL WATERS OF NEW ZEALAND
- THE THERMAL-SPRINGS DISTRICT AND THE GOVERNMENT SANATORIUM AT ROTORUA
- CLIMATE OF ROTORUA
- AREA OF THERMAL-SPRINGS DISTRICT
- PHYSICAL FEATURES
- VARIETIES OF MINERAL WATERS
- THE ROTORUA SANATORIUM
- THE HOSPITAL
- THE TARIFF
- THE PRIEST'S BATH
- THE PAVILION
- THE RACHEL BATH
- THE BLUE BATH
- CASES FOR TREATMENT
- CASES OF PARALYSIS
- A SUCCESSFUL CASE
- FURTHER CASES—PARAPLEGIA CURED
- RHEUMATISM AND SKIN-DISEASES
- CURES IN SEVERE RHEUMATISM
- GREAT SUCCESS IN CASES OF SKIN-DISEASE
- NEURALGIA
- CURATIVE EFFECTS OF MINERAL, WATERS
- VOLCANIC OUTBREAK AT ROTORUA
- ROTORUA AS A HEALTH RESORT
- ROUTE TO ROTORUA
- THE SANATORIUM WORKS AT ROTORUA
- MIDDLE ISLAND MINERAL SPRINGS
- 38. THE WEST COAST SOUNDS
- 39. RAILWAYS IN NEW ZEALAND: THEIR HISTORY AND PROGRESS
- 40. PORTS AND HARBOURS
- NORTH ISLAND
- AUCKLAND HARBOUR
- THAMES HARBOUR
- WAIHAU (COROMANDEL) HARBOUR
- MERCURY BAY
- TAURANGA HARBOUR
- TOLAGO BAY
- TURANGA (POVERTY BAY)
- NAPIER (OR AHURIRI) HARBOUR
- WELLINGTON (PORT NICHOLSON) HARBOUR
- WANGANUI RIVER
- PATEA HARBOUR
- NEW PLYMOUTH
- WAITARA RIVER
- KAWHIA HARBOUR
- MANUKAU HARBOUR
- KAIPARA HARBOUR
- MANGONUI HARBOUR
- WHANGAROA HARBOUR AND BAY
- BAY OF ISLANDS
- KORORAREKA BAY (PORT RUSSELL)
- WHANGAREI HARBOUR
- KAWAU BAY
- MIDDLE ISLAND.
- PORT LYTTELTON
- AKAROA HARBOUR
- PORT TIMARU (PATITI POINT).
- OAMARU HARBOUR,
- OTAGO HARBOUR
- BLUFF HARBOUR
- NEW RIVER HARBOUR, INVERCARGILL
- RIVERTON, JACOB'S RIVER
- THE WEST COAST SOUNDS
- HOKITIKA RIVER
- GREY RIVER
- BULLER RIVER (KAWATIRI), WESTPORT
- MOKIHINUI RIVER
- NELSON HAVEN
- PELORUS SOUND
- QUEEN CHARLOTTE SOUND
- PORT UNDERWOOD
- WAIRAU RIVER
- STEWART ISLAND.
- 41. RIVERS
- 42. GRAVING DOCKS AND PATENT SLIPS
- 43. LIGHTHOUSES
- 44. UNION STEAMSHIP COMPANY OF NEW ZEALAND (LIMITED)
- 45. THE NEW ZEALAND SHIPPING COMPANY (LIMITED)
- 46. SHAW SAVILL AND ALBION COMPANY (LIMITED)
- 47. TABLES OP DISTANCES, BY BAIL AND SEA
- 48. PUBLIC INSTRUCTION
- 49. NEW ZEALAND INSTITUTE
- 50. PUBLIC LIBRARIES AND MECHANICS' INSTITUTES
- 51. NEW ZEALAND GOVERNMENT LIFE INSURANCE DEPARTMENT
- 52. THE PUBLIC TRUST OFFICE OF NEW ZEALAND
- 53. PATENTS, DESIGNS, AND TRADE-MAKES
- 54. FIRE BRIGADES
- 55. FRIENDLY SOCIETIES
- 56. HOSPITALS
- 57. BENEVOLENT ASYLUMS AND CHARITABLE INSTITUTIONS
- 58. ORPHAN ASYLUMS
- 59. LUNATIC ASYLUMS
- 60. INDUSTRIAL SCHOOLS
- 61. COSTLEY TRAINING INSTITUTION, AUCKLAND
- 62. THE MAORIS: THEIR NUMBERS AND CONDITION AS AT PRESENT
- A. APPENDIX
- CROWN LANDS
- AREA OF THE COLONY (IN ACRES)
- LANDS AVAILABLE FOR SETTLEMENT
- CHARACTER OF THE LANDS SUITABLE FOR SETTLEMENT
- CROWN LANDS HELD ON PASTORAL LEASE
- LANDS HELD ON SETTLEMENT CONDITIONS
- NUMBER OF SELECTORS, 1891-92
- OPTIONAL SYSTEM OF LAND-TENURE
- ADMINISTRATION
- LAND DISTRICTS AND PRINCIPAL LAND OFFICES
- CLASSIFICATION OF LANDS
- TENURE
- MODE OF ACQUIRING CROWN LANDS
- CASH LANDS
- DEFERRED-PAYMENT LANDS
- PERPETUAL-LEASE LANDS
- PASTORAL RUNS
- SMALL, GRAZING-RUNS
- SMALL-FARM HOMESTEAD ASSOCIATIONS
- SUMMARY OF LANDS OPEN FOR SELECTION
- AUCKLAND
- HAWKE'S BAY
- TARANAKI
- WELLINGTON
- MARLBOROUGH
- NELSON
- CANTERBURY
- OTAGO
- SOUTHLAND
- WESTLAND
- CROWN LANDS GUIDE
- THE CUSTOMS TARIFF OF NEW ZEALAND
- POSTAL INFORMATION
- TELEGRAPHIC INFORMATION
- TELEPHONE EXCHANGES
- PRINCIPAL EVENTS
- B. ADDENDUM
- GENERAL INDEX
- C. STATISTICAL SUMMARY
- D. MAPS
THE preparation of this Handbook was undertaken by direction of the Hon. John Ballance, Premier of the Colony, in the beginning of May last.
The requirement that the work should be ready some time during the present session of Parliament, necessitated very special effort being made; and at one time it seemed doubtful whether or not a work, at once comprehensive and sufficiently reliable to be published by authority, could be got ready in the space allowed.
Considerable difficulty is experienced in preparing a book which should give much detail and matter of reference to be of use to persons residing in the colony, and at the same time contain descriptive matter, not overloaded with particulars, for the purposes of persons abroad who desire to form a general idea of what is done in New Zealand, of the peculiar advantages of the colony for settlement and as a place of residence. It is hoped that the material of this Handbook will be found to combine what is wanted for reference purposes with sufficient illustrative matter to serve the requirements of persons at a distance.
To insure publication at so early a date as the 1st September, a few sacrifices have been found unavoidable. The results of the legislation of the present session could not be treated of, and full criminal and private school statistics for 1891 were not to hand. But, with these exceptions, the statistical portion of the work gives complete figures for last year.
Following on the official and statistical information will be found a series of articles on subjects of importance to the colony, such as the leading industries, means of transport, social institutions, &c. Some of these were furnished either wholly or in part from Government departments, and the freest acknowledgment of kindly and willing assistance is due to all.
Full use of the report of the late Registrar-General (Mr. W. R. E. Brown) has been made in preparing the “Statistical Information,” and preceding portion of the work.
The “Descriptions of Forest Trees,” “Strength of Timbers,” a portion of the articles on “Fish” and “Climate,” “Varieties of Soil,” and “Building Stones,” have been taken, by permission, from the works of Sir James Hector.
E. J. VON DADELSZEN.
Registrar-General's Office,
Wellington,
31st August, 1892.
ACKNOWLEDGMENTS.
| Special Articles on | Furnished by |
|---|---|
| Agriculture | M. Murphy, F.L.S.; J. A. Johnstone; J Sawers, through Department of Agriculture. |
| Kauri-gum | J. M. Dargaville, J.P. |
| Labour | E. Tregear, F.R.G.S., F.R. Hist S., Secretary, Labour Department. |
| Introduction of Trout | L. H. B. Wilson, Assistant Secretary, Marine Department. |
| Mining | H. A. Gordon, F.G.S., Mines Department. |
| Railways | E. G. Pilcher, Secretary, Railway Commissioners. |
| Union Steamship Company | The General Manager. |
| New Zealand Shipping Company | The General Manager. |
| Public Instruction | Rev. W. J. Habens, B.A., Secretary, Education Department. |
| Government Life Insurance | D. M. Luckie, F.S.S., Assistant Commissioner. |
| Public Trust Office | J. K. Warburton, Public Trustee. |
| Patents | C. J. A. Haselden, J.P., Registrar. |
| The Maoris | W. J. Morpeth, Native Department. |
| Map… … … | Surveyor-General. |
OFFICE ASSISTANCE.
| For Statistical and Critical Work | Officers of Registrar-General's Department. |
| For general assistance | Mr. Charles Janion. |
N.B. Every care has been taken to avoid errors, but if any be discovered it is requested that they may be reported. Suggestions will also receive consideration.
Table of Contents
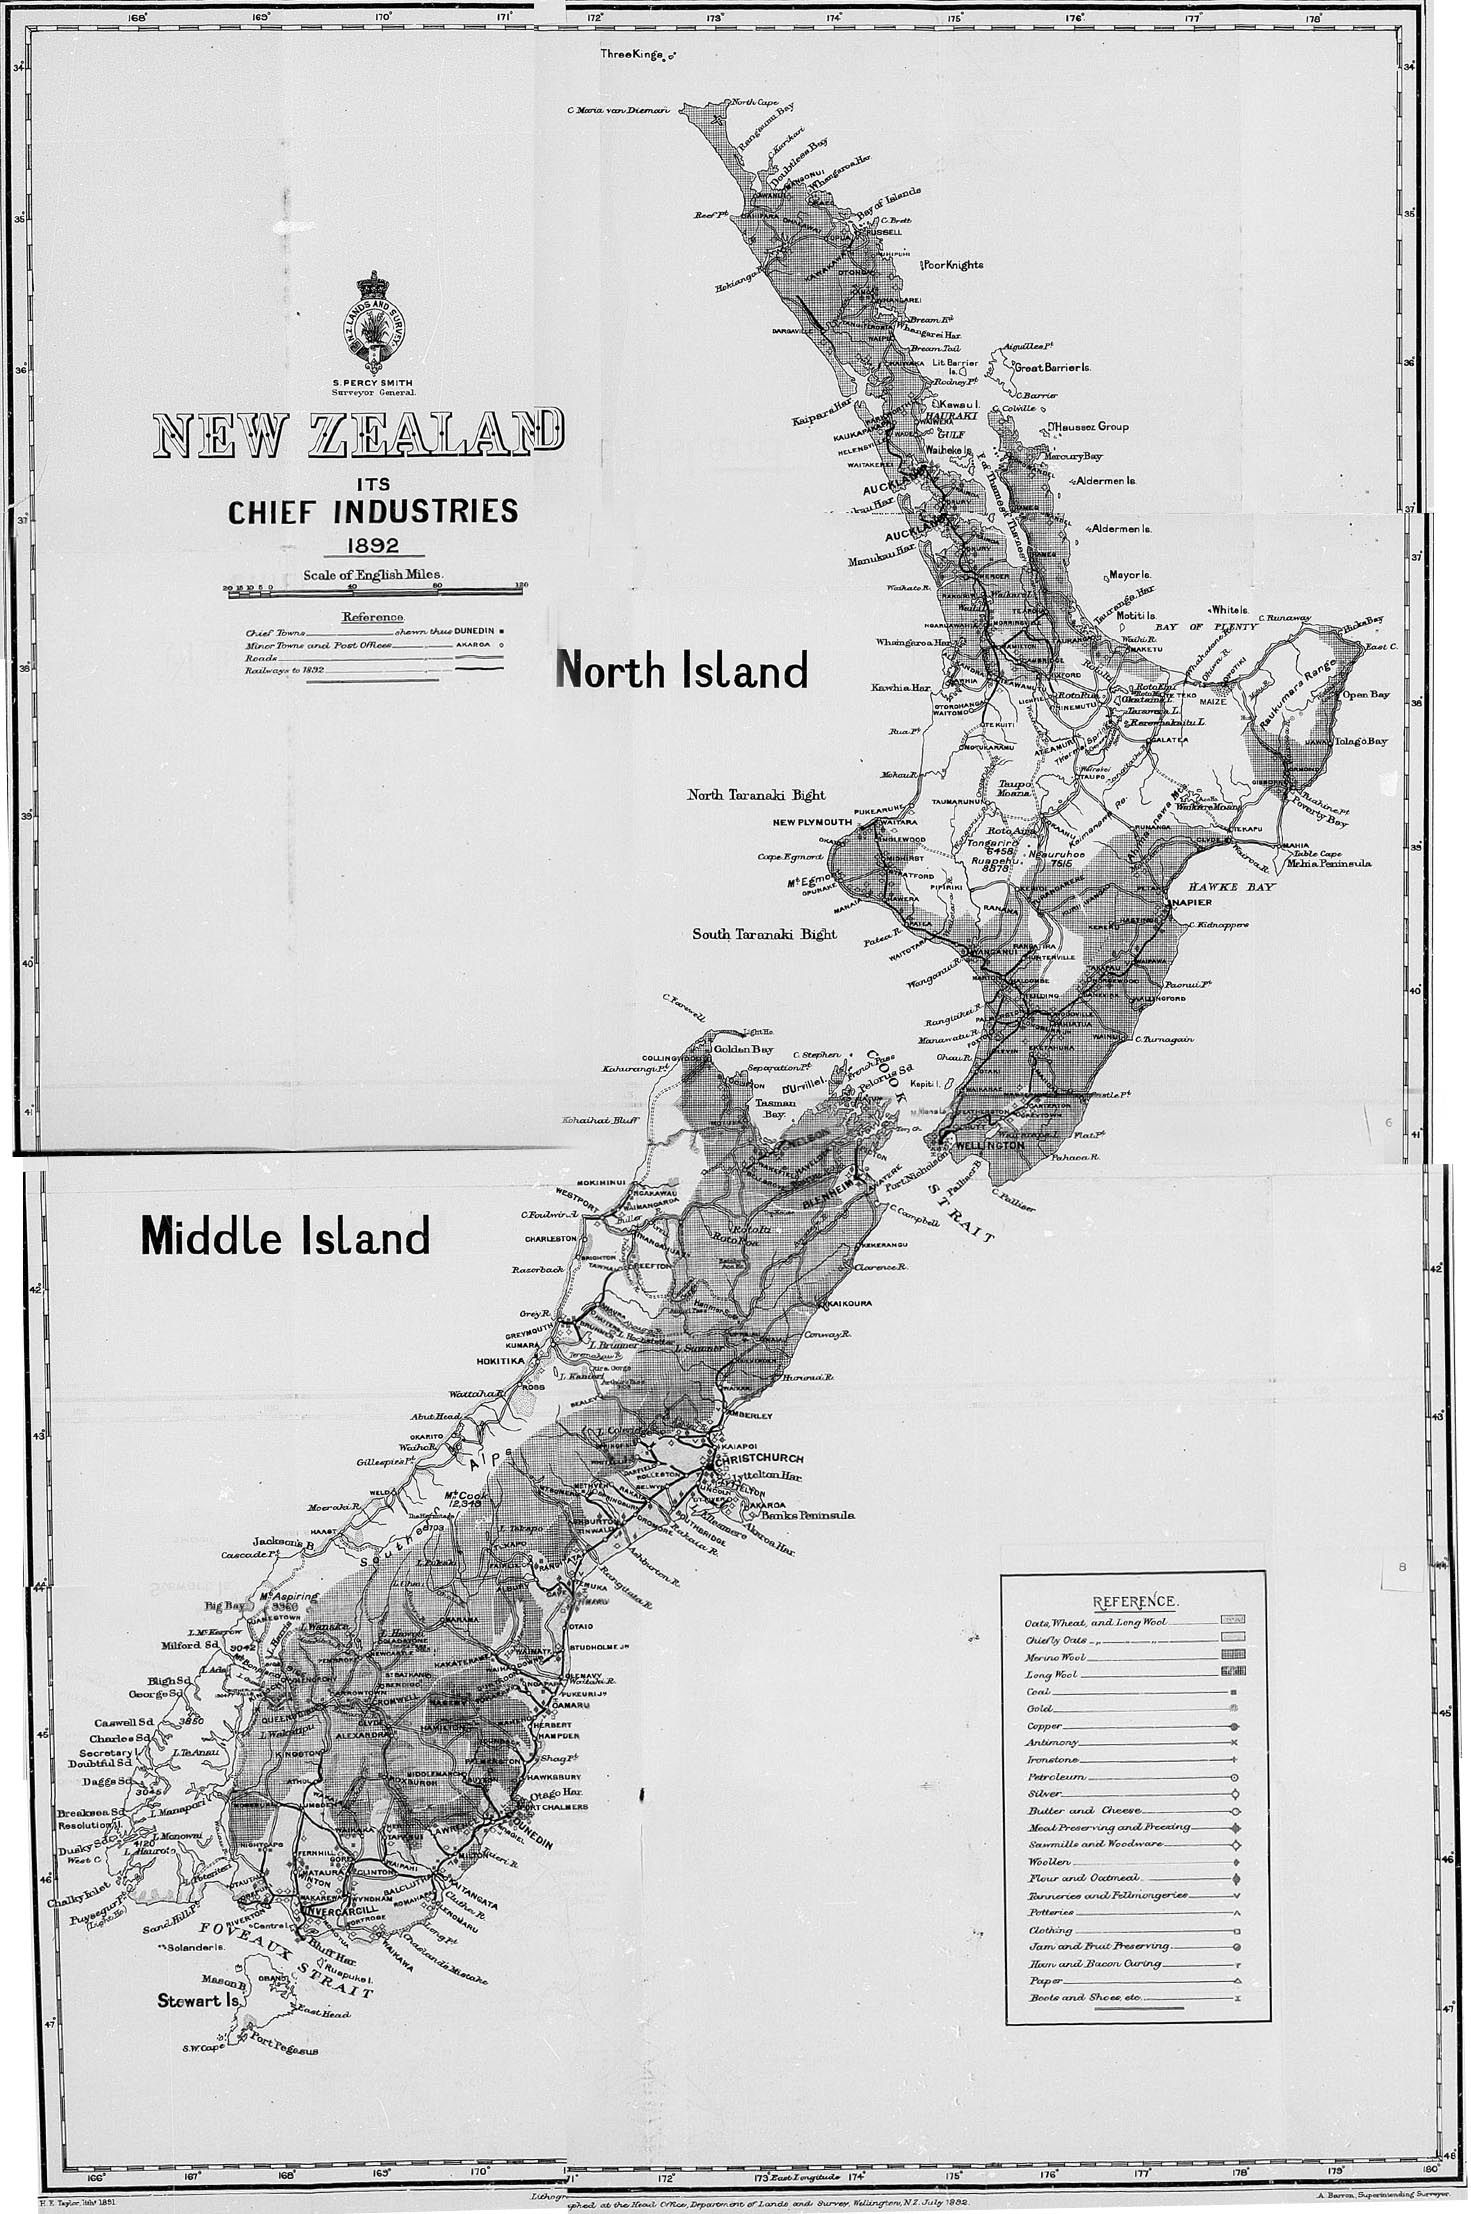
THE Colony of New Zealand consists of three main islands, with several groups of smaller islands lying at some distance from the principal group. The former are known as the North, the Middle, and Stewart Islands. These three islands have a coast-line amounting to 4,330 miles in length—namely, North Island; 2,200 miles; South Island, 2,000 miles; and Stewart Island, 130 miles. The other islands now included within the colony are the Chatham Islands, Auckland Islands, Campbell Islands, Antipodes Islands, Bounty Islands, and the Kermadec Islands. A protectorate over the Cook Islands is exercised by the Imperial Government, the Governor of New Zealand acting as responsible adviser. The British Resident was appointed on the recommendation of the New Zealand Government.
New Zealand is a mountainous country in many parts, but has, nevertheless, large plains in both North and Middle Islands. In the North Island, which is highly volcanic, is situated the famous Thermal Springs District, of which a special account will be given. The Middle Island is remarkable for the lofty Alps with magnificent glaciers, and its sounds or fiords, the scenery being unrivalled.
New Zealand is firstly a pastoral, and secondly an agricultural country. Sown grasses are grown almost everywhere, the extent of land laid down being seven and a half millions of acres. The land is admirably adapted for receiving these grasses, which, after the bush has been burnt off, are mostly sown over without previous ploughing. In the Middle Island a large area is covered with native grasses, all used for grazing purposes. The large extent of good grazing-land has made the colony a great wool- and meat-producing country; and its agricultural capabilities are, speaking generally, very great. The abundance of water and quantity of valuable timber are also leading characteristics.
New Zealand is, besides, a mining country. Coal is found in immense quantities, chiefly on the west coast of the Middle Island. Gold, alluvial and in quartz, is found in both islands, the yield having been over forty-seven millions sterling in value to the present time. Full statistical information is given further on, compiled up to the latest dates.
The first authentic account of the discovery of New Zealand is that given by Abel Jansen Tasman, a Dutch navigator. He sailed from Batavia on the 14th August, 1642, in the yacht “Heemskirk,” accompanied by the “Zeehaen” (or “Sea-hen”) fly-boat. After having visited Mauritius and discovered Tasmania, named by him “Van Diemen's Land,” in honour of Anthony van Diemen, the Governor of the Dutch possessions in the East Indies, he sailed in an easterly direction, and on the 13th December of that year sighted the west coast of the Middle Island of New Zealand, described by him as “a high mountainous country, which is at present marked in the charts as New Zealand.”
It has been assumed as probable that the first European who visited New Zealand was Juan Fernandez, who, having started from one of the ports of the west coast of South America in 1576, after sailing for about a month in a south-westerly direction, reached a land described by him as fertile and pleasant, and inhabited by a race of white people, well made, and dressed in a species of woven cloth. People of brown complexions were often described as white by the Spaniards; and, although there is no direct evidence that the land so discovered was New Zealand, yet no other seems to answer his description. It appears, however, certain that the country was visited before the date of Tasman's arrival in 1642, as the land he came to was shown in the Dutch chart used by him, and was named thereon “Zeland Nova,” William Bleau, a Dutchman, who died in 1638, having published an atlas in which indistinctly a line of coast is shown with the name against it, “Zelandia Nova.”
Tasman, under the belief that the land he saw formed part of a great polar continent, and was part of that country (subsequently found to be an island) discovered some years before by Schouten and Le Maire, to which the name of Staaten Land had been given, gave the same name of Staaten Land to New Zealand. Within about three months after this date Schouten's “Staaten Land” was found to be merely an inconsiderable island. Upon this discovery being announced, the country which Tasman had called by the same name received instead that of “New Zealand”—an evident restoration of the name previously given—by which name it has ever since been known. Tasman sailed along the coast to a bay, where he anchored. To this he gave the name of Murderers (now Massacre) Day, on account of an unprovoked attack on a boat's crew by the Natives, and the massacre of four white men. Thence he sailed along the west coast of the North Island, and gave the name of Cape Maria van Diemen to the north-western extremity thereof. After sighting the islands of the Three Kings he finally departed, not having set foot on the country.
There is no record of any visit to New Zealand after Tasman's departure until that of Captain Cook, who, after leaving the Society Islands, sailed in a southerly direction in search of a southern continent then believed to exist. He sighted land on the 6th October, 1769, and on the 8th of that month cast anchor in Poverty Bay. After having circumnavigated the North Island and the Middle and Stewart Islands—the latter having been considered as part of the Middle Island—he sailed from Cape Farewell on the 31st March, 1770, for Australia. He again visited New Zealand in 1773, in 1774, and in 1777.
M. de Surville, a French officer in command of the vessel “Saint Jean Baptiste,” being on a voyage of discovery, sighted the northeast coast of New Zealand on the 12th December, 1769, and remained for a short time. Another visit was shortly after paid by a French officer, M. Marion, du Fresne, who arrived on the west coast of New Zealand on the 24th March, 1772, but was treacherously murdered by the Natives on the 12th June following.
In 1793 the “Dædalus,” under the command of Lieutenant Hanson, was sent by the Government of New South Wales to New Zealand, and two chiefs were taken thence to Norfolk Island. There was after this an occasional intercourse between the islands of New Zealand and the English settlements in New South Wales.
In 1814 the first missionaries arrived in New Zealand—Messrs. Hall and Kendall — who had been sent as forerunners to Mr. Marsden. After a short stay they returned to New South Wales, and on the 19th November of that year again embarked, in company with Mr. Marsden, who preached his first sermon in New Zealand on Christmas Day, 1814, and returned to Sydney on the 23rd March, 1815. It was not until 1821 that the work of evangelisation was put on a somewhat permanent basis; but the first station, established by Mr. Leigh, a Wesleyan missionary, and his wife, at the valley of the Kaeo, Whangaroa, was not taken possession of until the 10th June, 1823.
Prior to the discovery and colonisation of New Zealand by Europeans, the earliest navigators and explorers found a race of people already inhabiting both, islands. Papers written in 1874 by Sir William Fox, M.H.R., and Sir Donald McLean, then Native Minister, state that at what time the discovery was made by the Maoris, or from what place they came, are matters which are lost in the obscurity which envelops the history of a people, without letters. Nor is there anything on record respecting the origin of the Maori people themselves. Little more can now be gathered from their traditions than that they were immigrants, and that when they came there were probably no other inhabitants of the country. The tradition runs that, generations ago, a large migration took place from an island in the Pacific Ocean, to which the Maoris give the name of Hawaiiki, a chief having been driven from it whose canoe arrived upon the shore of the North Island. Returning to his home with a flattering description of the country he had discovered, this chief, it is said, set on foot a scheme of emigration, whereupon a large fleet of double canoes started for the new land. The names of most of the canoes are still remembered, and each tribe agrees in its account of the doings of the people of the principal “canoes” after their arrival in New Zealand; and from these traditional accounts the descent of the numerous tribes has been traced. Calculations, based on the genealogical staves kept by the tohungas, or priests, indicate that about twenty-seven generations have passed since the migration, which would give for its date about the beginning of the fourteenth century. The position of Hawaiiki is not known, but there are several islands of this or a somewhat similar name. Similarity of language indicates a Polynesian origin, which would prove that they advanced to New Zealand through various groups of the Pacific islands, in which they left remains of the same race, who to this day speak the same or nearly the same tongue. When Captain Cook first visited New Zealand he availed himself of the assistance of a native from Tahiti, whose language proved to be almost identical with that of the New Zealanders, and through the medium of whose interpretation a large amount of the early information respecting the country and its inhabitants was obtained, which could not have been had without it.
A special article will be found further on dealing with the subject of the numbers and present condition of the Maoris.
The first attempt at colonisation was made in 1825 by a company formed in London. An expedition was sent out under the command of Captain Herd, who bought two islands in the Hauraki Gulf and a strip of land at Hokianga. The attempt, however, was a failure, owing to the savage character of the inhabitants. In consequence of frequent visits of numerous whaling vessels to the Bay of Islands, a settlement grew up at Kororareka—now called Russell—and in 1833 Mr. Busby was appointed British Resident there. A number of Europeans—generally men of low character—gradually settled in different parts of the country, and married Native women.
In 1838 a colonisation company, known as the New Zealand Company, was formed to establish settlement on systematic principles. A preliminary expedition, under the command of Colonel William Wakefield, was despatched from England on the 12th May, 1839, and arrived in New Zealand in the following August. Having purchased land from the Natives, Colonel Wakefield selected the shore of Port Nicholson, in Cook Strait, as the site of the first settlement. On the 22nd January, 1840, the first body of immigrants arrived, and founded the town of Wellington. About the same time—namely, on the 29th January, 1840—Captain Hobson, R.N., arrived at the Bay of Islands, empowered, with the consent of the Natives, to proclaim the sovereignty of the Queen over the islands of New Zealand, and to assume the government thereof. A treaty called “The Treaty of Waitangi,” to which in less than six months five hundred and twelve names were affixed, was entered into, by which all rights and powers of sovereignty were ceded to the Queen, all territorial rights being secured to the chiefs and their tribes. New Zealand was then constituted a dependency of the Colony of New South Wales; but on the 3rd May, 1841, it was proclaimed a separate colony. The seat of Government had been previously established at Auckland, round which a settlement was formed.
The New Zealand Company having decided to form another settlement, to which the name of “Nelson” was to be given, despatched a preliminary expedition from England in April, 1841, for the purpose of selecting a site, which resulted in the establishment of the settlement at the head of Blind Bay. About the same time a settlement was commenced at New Plymouth, by the arrival, on the 31st March, 1841, of a body of immigrants despatched by the New Plymouth Company, a colonisation company that had been formed in England, and had purchased 50,000 acres of land from the New Zealand Company.
The next important event in the progress of colonisation was the arrival at Port Chalmers, in March, 1848, of two ships containing immigrants, despatched by the Otago Association for the foundation of a settlement in that part of the colony by persons who belonged to or were in sympathy with the Free Church of Scotland.
In 1849 the “Canterbury Association for founding a Settlement in New Zealand” was incorporated. On the 16th December, 1850, the first emigrant ship despatched by the association arrived at Port Cooper, and the settlement of the adjoining country was commenced in a systematic manner, the intention having been to establish a settlement complete in itself, and composed entirely of members of the then United Church of England and Ireland.
The Proclamation of Captain Hobson on the 30th January, 1840, gave as the boundaries of the colony the following degrees of latitude and longitude: On the north, 34° 30′ S. lat.; on the south, 47° 10′ S. lat.; on the east, 179°.0′ E. long.; on the west, 166° 5′ E. long. These limits excluded small portions of the extreme north of the North Island and of the extreme south of Stewart Island.
In April, 1842, by Royal Letters Patent, and again by the Imperial Act 26 and 27 Vict., c. 23, 1863, the boundaries of the colony were altered so as to extend from 33° to 53° of south latitude and from 162° of east longitude to 173° of west longitude. By Proclamation bearing date the 21st July, 1887, the Kermadec Islands, lying between the 29th and 32nd degrees of south latitude and the 177th and 180th degrees of west longitude, were declared to be annexed to and to become part of the Colony of New Zealand.
The following now constitute the Colony of New Zealand:—
The island commonly known as the North Island, with its adjacent islets, having an aggregate area of 44,468 square miles, or 28,459,580 acres.
The island known as the Middle Island, with adjacent islets, having an aggregate area of 58,525 square miles, or 37,456,080 acres.
The South or Stewart Island, and adjacent islands, having an area of 665 square miles, or 425,390 acres.
The Chatham Islands, situate 536 miles eastward of Lyttelton, in the Middle Island, with an area of 375 square miles, or 239,920 acres.
The Auckland Islands, about 200 miles south of Stewart Island, extending about 30 miles from north to south, and nearly 15 from east to west, the area being 210,650 acres.
The Campbell Islands, in latitude 52° 33′ south, and longitude 169° 8. west, about 30 miles in circumference, with an area of 45,440 acres.
The Antipodes Islands, about 458 miles in a south-easterly direction from Port Chalmers, in the Middle Island. These are detached rocky islands, and extend over a distance of between four and five miles from north to south. Area, 12,960 acres.
The Bounty Islands, a small group of islets, thirteen in number, lying north of the Antipodes Islands, and about 415 miles in nearly an east-south-easterly direction from Port Chalmers. Area, 3,300 acres.
The Kermadec Islands, a group of which the largest is called Sunday or Raoul Island, lie about 614 miles to the north-east of Russell, in the Bay of Islands. Sunday Island is about 20 miles in circuit. The next in size is Macaulay Island, about three miles in circumference. Area of the group, 8,144 acres.
The total area of the colony is thus about 104,471 square miles, of which the aggregate area of the outlying groups of islands that are practically useless for settlement amounts to about 438 square miles.
A protectorate is exercised by the Imperial Government over the Cook Islands (or Hervey group) by Proclamation dated the 27th October, 1888. The British Resident* is appointed on the recommendation of the New Zealand Government. He acts for the colony as Government Agent in all matters of trade.
* Frederick J. Moss, Esq., late M.H.R., is now British Resident. His salary is paid by this colony.
The areas of the various Australian Colonies, as given by different authorities, differ considerably. Mr. Hayter, in his “Victorian Year-book,” gives the total area of the Australian Continent at 2,944,628 square miles, according to a computation made by the late Surveyor-General of Victoria, Mr. J. A. Skene, from a map of Continental Australia compiled and engraved under his direction; but in the case of each colony, except Victoria, the area computed by Mr. Skene differs from that given in the official records of that colony, the difference in the case of Western Australia amounting to over 84,000 square miles. The following areas are, therefore, taken from the official records of each colony:—
| Square Miles | |
|---|---|
| Queensland | 668,497 |
| New South Wales | 310,700 |
| Victoria | 87,884 |
| South Australia | 903,600 |
| Western Australia | 1,060,000 |
| Total Continent of Australia | 3,030,771 |
| Tasmania | 26,375 |
| New Zealand (including the Chatham and other islands) | 104,471 |
| Total Australasia | 3,161,617 |
The size of these colonies may be better realised by the comparison of their areas with those of European countries. The areas of the following countries—Austria-Hungary, Germany, France, Belgium, Holland, Denmark, Sweden and Norway, Portugal, Spain, Italy (including Sardinia and Sicily), Switzerland, Greece, Roumania, Bulgaria, Servia, Eastern Roumelia, and Turkey in Europe—amounting on the whole to less than 1,600,000 square miles, are little more than half the area of the Australian Continent. If the area of Russia in Europe be added to those of the other countries the total area would be about one-seventh larger than the Australian Continent, and about one-twelfth larger than that of the Australasian Colonies, including New Zealand. The area of the Colony of New Zealand is little more than one-seventh less than the area of Great Britain and Ireland, that of the Middle Island of New Zealand being a little larger than the combined areas of England and Wales.
| United Kingdom. | Area in Square Miles. |
| England and Wales | 58,311 |
| Scotland | 30,463 |
| Ireland | 32,531 |
| Total | 121,305 |
| New Zealand. | Area in Square Miles. |
| North Island | 44,468 |
| Middle Island | 58,525 |
| Stewart Island | 665 |
| Chatham Islands | 375 |
| Other islands | 438 |
| Total | 104,471 |
The North Island extends over a little more than seven degrees of latitude—a distance in a direct line from north to south of 430 geographical or 498 statute miles; but, as the northern portion of the colony, which extends over more than three degrees of latitude, takes a north-westerly direction, the distance in a straight line from the North Cape to Cape Palliser, the extreme northerly and southerly points of the island, is about 515 statute miles.
This island is, as a whole, hilly, and, in parts, mountainous in character, but there are large areas of plain or comparatively level country available, either now or in the future, when clear of forest or other indigenous vegetation, &c., for agricultural purposes. Of these, the principal are the plains in Hawke's Bay on the East Coast, the Wairarapa Plain in the Wellington District, and a strip of country along the West Coast extending from a point about thirty miles from the City of Wellington to a little north of New Plymouth, which is about 250 miles distant from Wellington. The largest plain in the North Island, Kaingaroa, extends from the shore of Lake Taupo in a north-north-easterly direction to the sea-coast in the Bay of Plenty; but a large portion is covered with pumice-sand, and is unsuitable for beneficial occupation. There are several smaller plains and numerous valleys suitable for agriculture. The level or undulating country in this island suitable for or capable of being made fit for agriculture has been estimated roughly at 13,000,000 acres. This includes lands now covered with standing forest, and swamps that are capable of drainage; also considerable areas of clay-marl and pumice-covered land. The clay-marl in its natural state is cold and uninviting to the agriculturist, but under proper drainage and cultivation it can be brought to a high state of productiveness. This kind of land is generally neglected at the present time, as settlers prefer soils more rapidly remunerative and less costly to work. The larger portion of this island was originally covered with forest. Although the area of forest-covered land is still very great, yet year by year the amount is being reduced, chiefly to meet the requirements of settlement, the trees being cut down and burnt, and grass-seed being then sown on the ashes to create pasture. Hilly as the country is, yet from the nature of the climate it is especially suited for the growth of English grasses, and wherever there is any soil, however steep the land may be, grasses will flourish. Very little of the land is consequently incapable of being made to supply food for cattle and sheep when treated as above or otherwise laid down in grass. The area of land in the North Island deemed purely pastoral or capable of being made so, being too steep for agricultural purposes, is estimated at 14,200,000 acres. In the centre of the island is a lake, about twenty miles across either way from the extreme points, called Taupo. A large area adjacent to the lake is at present worthless pumice-country. The Waikato River, the largest in the North Island, rising to the south of the lake, flows through it and out of its north-eastern point, and trends thence in a north-westerly direction until it flows into the ocean a little distance south of the Manukau Harbour. This river is navigable for small steamers for about a hundred miles from its mouth. The Maori King-country, occupied by Natives who for several years isolated themselves from the Europeans, lies to the west of Lake Taupo, and is bounded on the west by the sea. The River Thames, or Waihou, having its sources north of Lake Taupo, flows northward into the Firth of Thames. It is navigable only for small steamers about fifty miles. The other navigable rivers in this island are the Wanganui and Manawatu, which flow in a south-westerly direction into Cook Strait.
The mountains in the North Island are estimated to occupy about one-tenth of the surface, and do not exceed 4,000ft. in height, with the exception of a few volcanic mountains that are more lofty. Of these, the three following are the most important:—
The Tongariro Mountain, situated to the southward of Lake Taupo. It consists of a group of distinct volcanic cones, the lava-streams from which have so overlapped in their descent as to form one compact mountain-mass at the base. The highest of these cones is that of Ngauruhoe, which attains an elevation of 7,515ft. The craters of Ngauruhoe, the Red Crater (6,140ft.), and Te Mari (4,990ft.) are the three vents from which the latest discharges of lava have taken place, the most recent having occurred in 1868. These craters are still active, steam and vapour issuing from them with, at times, considerable force and noise, the vapours being charged with pungent gases and acids, making it dangerous to approach too near the crater-lips.
Ruapehu. This mountain lies to the south of Tongariro. It is an extinct volcanic cone, and reaches the height of 9,100ft., being in part considerably above the line of the limit of perpetual snow. The most remarkable feature of this mountain is the crater-lake on its summit. This lake is situated at the bottom of a funnel-shaped crater, its steep sides being mantled with ice and snow. The water occupies a circular basin about 500ft. in diameter, and is about 300ft. below the enclosing peaks, and quite inaccessible except by ropes. It is much disturbed by eddies, from which steam or vapour is given off. This lake, and the three craters previously mentioned on Tongariro, are all in one straight line, which, if produced, would pass through the boiling springs at Tokaanu on the southern margin of Lake Taupo, and through other hot springs on the north of the lake in the direction of White Island, an active volcano in the Bay of Plenty, situated about twenty-seven miles from the mainland.
Mount Egmont. This is also an extinct volcanic cone, rising to a height of 8,300ft. The upper part is always covered with snow. This mountain is situated close to New Plymouth, and is surrounded by one of the most fertile districts in New Zealand. Rising from the plains in its solitary grandeur, it is an object of extreme beauty and ceaseless admiration.
It is estimated that the area of mountain-tops and barren country at too high an altitude for sheep, and therefore worthless for pastoral purposes, amounts, in the North Island, to 300,000 acres.
The most remarkable feature of the North Island is the numerous hot springs, which occur in hundreds from Tongariro, south of Lake Taupo, to Ohaeawai, situated at almost the extreme north of the colony—a distance of 300 miles. Clouds of sulphurous steam are seen rising at all sorts of places over this extensive area, but the principal seat of hydrothermal action appears to be in the neighbourhood of Lake Rotorua. The district is generally known as the Hot- or Thermal-Springs District.
This district is situated about forty miles in a north-north-east direction from Lake Taupo. By the destruction of the famed Pink and White Terraces and of Lake Rotomahana on the occasion of the eruption of Mount Tarawera on the 10th June, 1886, the district has been deprived of attractions unique in character and of unrivalled beauty; but the natural features of the country—the lakes, geysers, and hot springs (the number of which is very great), some of which possess remarkable curative properties for certain complaints—still afford considerable attraction for tourists and invalids. Recently the world-wide importance of conserving this region as a sanatorium for all time has been recognised by the Government, and it is now dedicated by Act of Parliament to that purpose. A very interesting account of the “Thermal Springs of the North Island” will be found further on.
Notwithstanding the length of coast-line, good harbours in the North Island are not numerous. These on the west coast north of New Plymouth are bar-harbours, not suitable for large vessels. The principal harbours are the Waitemata Harbour, on which Auckland is situated—this is rather a deep estuary than a harbour; several excellent harbours in the northern peninsula; and Port Nicholson, on the borders of which Wellington is situated. This is a land-locked harbour, about six miles across, having a comparatively narrow but deep entrance from the ocean. The water is deep nearly throughout.
Cook Strait separates the North and Middle Islands. It is about sixteen miles across at its narrowest part, but in the widest about ninety. The strait is invaluable for the purpose of traffic between different parts of the colony, and is constantly traversed by vessels of the magnificent line of coastal steamers that trade in New Zealand waters.
The extreme length of the Middle Island, from Point Jackson, in Cook Strait, to Puysegur Point, at the extreme south-west, is about 525 statute miles; the greatest distance across at any point is in Otago (the southern) District, being about 180 miles.
The Middle Island is intersected along almost its entire length by a mountainous range known as the Southern Alps. Some of the summits reach a height of from 10,000ft. to 12,000ft., Mount Cook, the highest peak, attaining an altitude of 12,349ft.
In the south, in the vicinity of the sounds and Lake Te Anau, there is a large number of magnificent peaks, which, though not of great height, are, owing to their southerly position, nearly all crowned with perpetual ice and snow. Further north the mountains increase in height—Mount Earnslaw, at Lake Wakatipu; and Mount Aspiring, which has aptly been termed the New Zealand Matterhorn, nearly 10,000ft. in height, at Lake Wanaka. North-ward beyond this a fine chain of peaks runs as the backbone of the Middle Island to where Mount Cook, or Aorangi, towers majestic in the midst of the grandest scenes of the Southern Alps.
The scenery of the Southern Alps of New Zealand in many instances excels in beauty and grandeur that of the Alps of Switzerland, while in the Southern Alps there is also greater variety. In New Zealand no one has actually succeeded in making a complete ascent of any of the highest mountains. Many of the peaks and most of the glaciers are as yet unnamed; and there is, in parts of the Middle Island, still a fine field for exploration and discovery—geographical, geological, and botanical. The wonders of the Southern Alps are only beginning to be known; but the more they are known the more they are appreciated. The snow-line in New Zealand being so much lower than in Switzerland, the scenery, though the mountains are not quite so, high, is of surpassing grandeur.
There are extensive glaciers on both sides of the range, those on the western side being of exceptional beauty, as, from the greater abruptness of the mountain-slopes on that side, they descend to within about 700ft. of the sea-level, and into the midst of the evergreen New Zealand forest vegetation. The largest glaciers on each side of the range are easily accessible.
The following gives the sizes of some of the glaciers on the eastern slope:—
| Name. | Area of Glacier. | Length of Glacier. | Greatest Width. | Average Width. | |||
|---|---|---|---|---|---|---|---|
| Acres. | Miles | ch. | Miles | ch. | Miles | ch. | |
| Tasman | 13,664 | 18 | 0 | 1 | 14 | 1 | 15 |
| Murchison | 5,800 | 10 | 70 | 1 | 5 | 0 | 66 |
| Godley | 5,312 | 8 | 0 | 1 | 55 | 1 | 3 |
| Mueller | 3,200 | 8 | 0 | 0 | 61 | 0 | 50 |
| Hooker | 2,416 | 7 | 25 | 0 | 54 | 0 | 41 |
The Alletsch Glacier, in Switzerland, according to Ball, in the “Alpine Guide,” has an average width of one mile. It is in length and width inferior to the Tasman Glacier.
Numerous sounds or fiords penetrate the mountains abutting on the south-western coast, from the sea. They are long, narrow, deep (the depth of water at the upper part of Milford Sound is 1,270ft., although at the entrance only 130ft.), environed by giant mountains clothed with foliage to the snow-line; their steep sides often apparently within the steamer's length of the deck as she ploughs through their calm solitudes, with waterfalls, glaciers, and snow-fields at every turn. Some of the mountains rise almost precipitously from the water's edge to 5,000ft. and 10,000ft. above the sea. The great Sutherland Waterfall, 1,904ft. high, is near one of these sounds.
The general surface of the northern portion of the Middle Island, comprising the Provincial Districts of Nelson and Marlborough, is mountainous, but the greater part is suitable for grazing purposes. There are, some fine valleys and small plains suitable for agriculture, of which the Wairau Valley or Plain is the largest. Deep sounds, extending for many miles, break the coast-line abutting on Cook Strait. The City of Nelson is situated at the head of Blind Bay, which has a depth inwards from Cook Strait of about forty statute miles.
The Provincial District of Canterbury lies to the south of the Marlborough District, and on the eastern side of the island. Towards the north the land is undulating; then there is a stretch of almost perfectly level country extending in a south-westerly-direction for 160 miles, after which, on the south, the country is undulating as far as the borders of the Otago District. On the east a block of hill-country rises abruptly from the plain and extends for some miles seaward. This is Banks Peninsula, containing several good harbours, the principal being Port Cooper, on the north, on which is situated Lyttelton, the chief port of the district: the harbour of Akaroa, considered one of the finest in the colony, is on the southern coast of this peninsula.
The southern district of Otago is, on the whole, mountainous, but has many fine plains and valleys suitable for agricultural purposes. The mountains, except towards the west coast, are generally destitute of timber, and are suitable for grazing sheep. There are gold-fields of considerable extent in the interior of this district. The interior, lakes are very important features in Otago. Lake Wakatipu extends over fifty-four miles in length, but is not more than four miles at its greatest width. It is 1,070ft. above sea-level, and has a depth varying from 1,170ft. to 1,296ft. It covers an area of 114 square miles. Te Anau Lake, which covers an area of 132 square miles, is larger than Lake Wakatipu. These lakes are bounded on the west by broken, mountainous, and chiefly wooded country, extending to the ocean.
The chief harbours in the Otago District are those of Port Chalmers, at the head of which Dunedin is situated, and the Bluff Harbour, at the extreme south.
The District of Westland extends along the west coast of the Middle Island, abreast of the District of Canterbury. This district is more or less auriferous throughout. The western slopes of the central range of mountains are clothed with forest-trees to the snowline; but on the eastern slopes timber is scarce, natural grasses covering the ground.
The rivers in the Middle Island are for the most part mountain-torrents, fed by glaciers in the principal mountain-ranges. When the snow melts they become of considerable size, and their beds, when not confined by rocky walls, extend over considerable areas, chiefly covered by enormous deposits of shingle. The largest river in the island and in the colony is the Clutha. It is 154 miles in length, but is only navigable for boats or small river-steamers for about thirty miles. The rivers Buller, Grey, and Hokitika, on the West Coast, are navigable for a short distance from their mouths. They constitute the only ports in the Westland District. In their unimproved state they only admitted, owing to the bars at their mouths, vessels of small draught; but, in consequence of the importance of the Grey and Buller Rivers as the only ports available for the coal-export trade, the largest and most important coalfields being in their neighbourhood, large harbour-works have been undertaken, resulting in a deepening of the beds of these rivers, and giving a depth of from 18ft. to 24ft. of water on the bars.
The area of level or undulating land in the Middle Island that may be available for agriculture is estimated at about 15,000,000 acres. About 13,000,000 are suitable for pastoral purposes only, or may become so when cleared of forest and sown with grass-seed. The area of barren land and mountain-tops is estimated at about 8,000,000 acres.
Foveaux Strait separates the Middle from Stewart Island. This last island has an area of only 425,390 acres. It is mountainous in character, and chiefly covered with forest.
The outlying group of the Chatham Islands, 480 statute miles east-south-east from Wellington, and 536 miles eastward of Lyttelton, consists of two principal islands and several unimportant islets. The largest island contains about 222,490 acres, of which a largo and irregularly-shaped lake or lagoon absorbs 45,960 acres. About one quarter of the surface of the land is covered with forest, the rest with fern or grass. The hills nowhere rise to a great height. Pitt Island is the next in size; the area is 15,330 acres. The greater portion of both islands is occupied as sheep-runs.
The only island in any way suitable for settlement in the Kermadec group is Sunday Island, containing 7,800 acres. The highest point rises to an elevation of 1,720ft. The surface of the land is chiefly covered with wood and scrub. The other islands are mere rocks.
The largest of the Auckland Islands, about twenty-seven miles long by about fifteen miles broad, is very mountainous, the highest part being 2,000ft. above the sea. The west coast is bold and precipitous, but the east coast has several inlets. There is a good harbour both at the north and south ends. The wood on the island is, owing to the strong prevailing wind, scrubby in character. The New Zealand Government maintains at this island a dépôt of provisions and clothing for the use of shipwrecked mariners. These have already been found of inestimable value by an unfortunate shipwrecked crew condemned to some months' residence on the island.
Neither this nor the rest of the outlying islands of the group are suitable for settlement.
British sovereignty was proclaimed over New Zealand in January, 1840, and the country became a dependency of New South Wales until the 3rd May, 1841, when it was made a separate colony. The seat of Government was at Auckland, and the Executive comprised, with the Governor, three gentlemen, holding offices as Colonial Secretary, Attorney-General, and Colonial Treasurer.
In August, 1841; May, 1842; and January, 1844, three new members were nominated by Her Majesty as ex officio members of the Executive Council. They were not members of the General Assembly, opened for the first time on the 27th May, 1854, although they remained in office until the establishment of Responsible Government on the 7th May, 1856. Between the 14th June and the 2nd September, 1854, the Executive Council was variously constituted with three or four members of the House of Representatives and two Legislative Councillors, without portfolios.
The government of the colony was at first vested in the Governor, who was responsible only to the Imperial Government; but in 1852 an Act was passed by the Imperial Legislature which granted representative institutions to the colony. Under it the constitution of a General Assembly for the whole colony was provided for, consisting of a Legislative Council, the members of which were to be nominated by the Governor, and an elective House of Representatives. The first session of the General Assembly was opened on the 27th May, 1854, but the members of the Executive were not responsible to Parliament. The first Ministers under a system of Responsible Government were appointed on the 18th April, 1856. By the Act of 1852 the colony was divided into six provinces, each to be presided over by an elective Superintendent, and to have an elective Provincial Council, empowered to legislate, except on certain specified subjects. The franchise practically amounted to household suffrage. In each case the election was for four years; but a dissolution of the Provincial Council by the Governor could take place at any time, necessitating a fresh election both of the Council and of the Superintendent. The Superintendent was chosen by the electors of the whole province; the members of the Provincial Council by those of the electoral districts. The Provincial Governments remained as integral parts of the Constitution of the colony until the 1st November, 1876, when they were abolished by an Act of the General Assembly, that body having been vested with the power of altering the Constitution Act. On the same day an Act of the General Assembly which subdivided the colony (exclusive of the areas included within municipalities) into counties, and established a system of local county government, came into operation.
The Governor is appointed by the Queen. His salary is £5,000 a year, and is provided by the colony.
The present members of the Legislative Council hold their seats under writs of summons from the Governor, the appointments being for life unless vacated by resignation or extended absence. Two of the members of the Council are aboriginal native chiefs. In future the appointments are tenable for seven years only; but Councillors may be reappointed.
The members of the House of Representatives are elected for three years from the time of each general election; but at any time the dissolution of Parliament by the Governor necessitates such general election. Four of the members are representatives of Native constituencies, three members for the Maori districts being aboriginal natives and one a half-caste. An Act was passed in 1887 which provided that, on the termination of the then General Assembly, the number of members to be thereafter elected to the House of Representatives should be seventy-four in all, of whom four were to be elected under the provisions of the Maori Representation Acts, as representatives of Maori electors only. For the purposes of European representation the colony is divided into sixty-two electoral districts, four of which—the Cities of Auckland, Wellington, Christchurch, and Dunedin—return each three members, and all the other electorates one each. Members of the House of Representatives are chosen in every electoral district appointed for that purpose by the votes of the inhabitants.
In 1889 an amendment of the Representation Act was passed, which contained a provision prohibiting any elector giving his vote in respect of more than one electorate at any election. This provision greatly increased the effective power of those voters who were registered for one electoral district only, and resulted in a considerable addition to the number of so-called labour members in the House of Representatives. Every man registered as an elector, and not coming within the meaning of section 2 of “The Public-Offenders Disqualification Act, 1867,” but no other man, is qualified to be elected a member of the House of Representatives for any electoral district. The franchise for European representation is that every adult male, if resident one year in the colony and six months in one electoral district, can be registered as an elector. Freehold property of the value of £25 held for six months preceding the day of registration also entitles a man to register, if not already registered under the residential qualification. Maoris possessing a £25 free-hold under Crown title, or being on any ratepayers' roll, can also register. For Maori representation every adult Maori resident in any Maori electoral district (of which there are four only in the colony) can vole. Registration is not required in Native districts. The proportion of representation to population at the last general election for the House of Representatives, in December, 1890, was one European member to every 8,952 inhabitants, and one Maori member to every 10,413 Natives.
Up to the year 1865 the seat of Government of New Zealand was at Auckland. Several attempts were made by members of Parliament, by motions in the Legislative Council and House of Representatives, to have it removed to some more central place; but it was not until November, 1863, that Mr. Domett (then late Premier) was successful in carrying resolutions in the House of Representatives that steps should be taken for appointing some place in Cook Strait as the permanent seat of Government in the colony. The resolutions adopted were: “(1.) That it has become necessary that the seat of Government in the colony should be transferred to some suitable locality in Cook Strait. (2.) That, in order to promote the accomplishment of this object, it is desirable that the selection of the particular site in Cook Strait should be left to the arbitrament of an impartial tribunal. (3.) That, with this view, a Bill should be introduced to give effect to the above resolutions.” On the 25th November an address was presented to the Governor, Sir George Grey, K.C.B., by the Commons of New Zealand, requesting that the Governors of the Colonies of New South Wales, Victoria, and Tasmania might be asked to each appoint one Commissioner for the purpose of determining the best site in Cook Strait. Accordingly, the Hon, Joseph Docker, M.L.C., New South Wales; the Hon. Sir Francis Murphy, Speaker of the Legislative Council, Victoria; and E. C. Gunn, Esq., Tasmania, were appointed Commissioners.
These gentlemen, having made a personal inspection of all suitable places, arrived at the unanimous conclusion “that Wellington, in Port Nicholson, was the site upon the shores of Cook Strait which presented the greatest advantages for the administration of the government of the colony.”
The seat of Government was, in accordance with the recommendations of the Commissioners, removed to Wellington in February, 1865.
Nearly all the public works of New Zealand are in the hands of the Government of the colony, and in the early days they simply kept pace with the spread of settlement. In 1870, however, a great impetus was given to the progress of the whole country by the inauguration of the “Public Works and Immigration Policy,” which provided for carrying out works in advance of settlement. Railways, roads, and water-races were constructed, and immigration was conducted on a large scale. As a consequence the population increased from 267,000 in 1871 to 501,000 in 1881, and 634,058 at the close of the year 1891, exclusive of Maoris.
SUCCESSION OF GOVERNORS OF NEW ZEALAND, AND THE DATES ON WHICH THEY ASSUMED AND RETRIED FROM THE GOVERNMENT.
Captain William Hobson, R.N., from Jan., 1840, to 10 Sept., 1842.
[Proclamation of British Sovereignty by Captain Hobson in January, 1840, and New Zealand a dependency of the Colony of New South Wales until 3rd May, 1841, at which date it was proclaimed a separate colony. From January, 1840, to May, 1841, Captain Hobson was Lieutenant-Governor of New Zealand under Sir George Gipps, Governor of New South Wales, and from May, 1841, Governor of New Zealand; the seat of Government being at Auckland, where he died in September, 1842. From the time of Governor Hobson's death, in September, 1842, until the arrival of Governor Fitzroy, in December, 1843, the Government was carried on by the Colonial Secretary, Lieutenant Shortland.]
Lieutenant Shortland, Administrator, from 10 Sept., 1812, to 26 Dec., 1843.
Captain Robert Fitzroy, R.N., from 26 Dec., 1843, to 17 Nov., 1845.
Captain Grey (became Sir George Grey. K.C.B., in 1848), from 18 Nov., 1845, to 31 Dec., 1853.
[Captain Grey held the commission as Lieutenant-Governor of the colony until the 1st January, 1848, when he was sworn in as Governor-in-Chief over the Islands of New Zealand, and as Governor of the Province of New Ulster and Governor of the Province of New Munster. After the passing of the New Zealand Constitution Act, Sir George Grey was, on the 13th September, 1852, appointed Governor of the colony, the duties of which he assumed on the 7th March, 1853. In August, 1847, Mr. E. J. Eyre was appointed Lieutenant-Governor of New Munster: he was sworn in, 28th January, 1848. On 3rd January, 1848, Major-General George Dean Pitt was appointed Lieutenant-Governor of New Ulster: he was sworn in, 14th February, 1848; died, 8th January, 1851; and was succeeded as Lieutenant-Governor by Lieutenant-Colonel Wynyard, appointed 14th April, 1851; sworn in, 26th April, 1851. The duties of the Lieutenant-Governor ceased on the assumption by Sir George Grey of his office of Governor, on the 7th March, 1853.]
Lieutenant-Colonel Robert Henry Wynyard, C.B., Administrator, from 3 Jan., 1854, to 6 Sept., 1855.
Colonel Thomas Gore Browne, C.B., from 6 Sept., 1855, to 2 Oct., 1861.
Sir George Grey, K.C.B., Administrator, from 3 Oct., 1861; Governor, from 4 Dec., 1861, to 5 Feb., 1868.
Sir George Ferguson Bowen, G.C.M.G., from 5 Feb., 1868, to 19 Mar., 1873.
Sir George Alfred Arney, Chief Justice, Administrator, from 21 Mar. to 14 June, 1873.
Sir James Fergusson, Baronet, P.C., from 14 June, 1873, to 3 Dec., 1874.
The Marquis of Normanby, P.C., Administrator, from 3 Dec., 1874; Governor, from 9 Jan., 1875, to 21 Feb., 1879.
James Prendergast, Chief Justice, Administrator, from 21 Feb. to 27 Mar., 1879.
Sir Hercules George Robert Robinson, G.C.M.G., Administrator, 27 Mar., 1879; Governor, from 17 April, 1879, to 8 Sept., 1880.
James Prendergast, Chief Justice, Administrator, from 9 Sept. to 29 Nov., 1880.
Sir Arthur Hamilton Gordon, G.C.M.G., from 29 Nov., 1880, to 23 June, 1882.
Sir James Prendergast, Chief Justice, Administrator, from 24 June, 1882, to 20 Jan., 1883.
Lieutenant-General Sir William Francis Drummond Jervois, G.C.M.G., C.B., from 20 Jan., 1883, to 22 Mar., 1889.
Sir James Prendergast, Chief Justice, Administrator, from 23 Mar. to 2 May, 1889.
The Earl of Onslow, G.C.M.G., from 2 May, 1889, to 24 Feb., 1892.
Sir James Prendergast, Chief Justice, Administrator, from 25 Feb. to 6 June, 1892.
The Earl of Glasgow, G.C.M.G., from 7 June, 1892.
MEMBERS OF THE EXECUTIVE COUNCIL OF THE COLONY OF NEW ZEALAND PREVIOUS TO THE ESTABLISHMENT OF RESPONSIBLE GOVERNMENT (NOT INCLUDING THE OFFICERS COMMANDING THE FORCES).
Willoughby Shortland, Colonial Secretary, from 3 May, 1841, to 31 Dec., 1843; succeeded by Mr. Sinclair.
Francis Fisher, Attorney-General, from 3 May to 10 Aug., 1841; succeeded by Mr. Swainson.
George Cooper, Colonial Treasurer, from 3 May, 1841, to 9 May, 1842; succeeded by Mr. Shepherd.
William Swainson, Attorney-General, from 10 Aug., 1841, to 7 May, 1856.
Alexander Shepherd, Colonial Treasurer, from 9 May, 1842, to 7 May, 1856.
Andrew Sinclair, Colonial Secretary, from 6 Jan., 1844, to 7 May, 1856.
[The holders of these three last-mentioned offices were nominated by Her Majesty as ex officio members of the Executive Council. They were not members of the General Assembly, opened for the first time 27th May, 1854, although they remained in office until the establishment of Responsible Government.]
James Edward FitzGerald, M.H.R., without portfolio, from 14 June to 2 Aug., 1854.
Henry Sewell. M.H.R., without portfolio, from 14 June to 2 Aug., 1854.
Frederick Aloysius Weld, M.H.R., without portfolio, from 14 June to 2 Aug., 1854.
Francis Dillon Bell, M.L.C., without portfolio, from 30 June to 11 July, 1854.
Thomas Houghton Bartley, M.L.C, without portfolio, from 14 July to 2 Aug., 1854.
Thomas Spencer Forsaith, M.H.R., without portfolio, from 31 Aug. to 2 Sept., 1854.
Edward Jerningham Wakefield, M.H.R., without portfolio, from 31 Aug. to 2 Sept., 1854.
William Thomas Locke Travers, M.H.R., without portfolio, 31 Aug. to 2 Sept., 1854.
James Macandrew, M.H.R., without portfolio, from 31 Aug. to 2 Sept., 1854.
| NUMBER OF PARLIAMENTS SINCE THE CONSTITUTION ACT PASSED FOR CONFERRING REPRESENTATIVE INSTITUTIONS UPON THE COLONY OF NEW ZEALAND, WITH THE DATES OF OPENING THE SESSIONS AND DATES OF CLOSING OR DISSOLUTION. | ||
|---|---|---|
| No. of Parliament. | Date of Opening of Sessions. | Date of Closing or Dissolution. |
| First Parliament | 27 May, 1854 | 9 August, 1854. |
| 31 August, 1854 | 16 September, 1854. | |
| 8 August, 1855 | 15 September, 1855. | |
| Second Parliament | 15 April, 1856 | 16 August, 1856. |
| (There was no session held in the year 1857.) | ||
| 10 April, 1858 | 21 August, 1858. | |
| (There was no session held in the year 1859.) | ||
| 30 July, 1860 | 5 November, 1860. | |
| Third Parliament | 3 June, 1861 | 7 September, 1861. |
| 7 July, 1862 | 15 September, 1862. | |
| 19 October, 1863 | 14 December, 1863. | |
| 24 November, 1864 | 13 December, 1864. | |
| 26 July, 1865 | 30 October, 1865. | |
| Fourth Parliament | 30 June, 1866 | 8 October, 1866. |
| 9 July, 1867 | 10 October, 1867. | |
| 9 July, 1868 | 20 October, 1868. | |
| 1 June, 1869 | 3 September, 1869. | |
| 14 June, 1870 | 13 September, 1870. | |
| Fifth Parliament | 14 August, 1871 | 16 November, 1871. |
| 16 July, 1872 | 25 October, 1872. | |
| 15 July, 1873 | 3 October, 1873. | |
| 3 July, 1874 | 31 August, 1874. | |
| 20 July, 1875 | 21 October, 1875. | |
| Sixth Parliament | 15 June, 1876 | 31 October, 1876. |
| 19 July, 1877 | 10 December, 1877. | |
| 26 July, 1878 | 2 November, 1873. | |
| 11 July, 1879 | 15 August, 1879. | |
| Seventh Parliament | 24 September, 1879 | 19 December, 1879. |
| 28 May, 1880 | 1 September, 1880. | |
| 9 June, 1881 | 24 September, 1881. | |
| Eighth Parliament | 18 May, 1882 | 15 September, 1882. |
| 14 June, 1883 | 8 September, 1883. | |
| 5 June, 1884 | 24 June, 1884. | |
| Ninth Parliament | 7 August, 1884 | 10 November, 1884. |
| 11 June, 1885 | 22 September, 1885. | |
| 13 May, 1886 | 18 August, 1886. | |
| 26 April, 1887 | 15 July, 1887. | |
| Tenth Parliament | 6 October, 1887 | 23 December, 1887. |
| 10 May, 1888 | 31 August, 1888. | |
| 20 June, 1889 | 19 September, 1889. | |
| 19 June, 1890 | 3 October, 1890. | |
| Eleventh Parliament | 27 January, 1891 | 31 January, 1891. |
| 11 June, 1891 | 5 September, 1891. | |
| 23 June, 1892 | ||
| SINCE THE ESTABLISHMENT OF RESPONSIBLE GOVERNMENT IN NEW ZEALAND IN 1856. | ||
|---|---|---|
| Name of Ministry. | Assumed Office. | When retired. |
| 1. Bell-Sewell | 7 May, 1856 | 20 May, 1856. |
| 2. Fox | 20 May, 1856 | 2 June, 1856. |
| 3. Stafford | 2 June, 1856 | 12 July, 1861. |
| 4. Fox | 12 July, 1861 | 6 August, 1862. |
| 5. Domett | 6 August, 1862 | 30 October, 1863. |
| 6. Whitaker-Fox | 30 October, 1863 | 24 November, 1864. |
| 7. Weld | 24 November, 1864 | 16 October, 1865. |
| 8. Stafford | 16 October, 1865 | 28 Tune, 1869. |
| 9. Fox | 28 June, 1869 | 10 September, 1872. |
| 10. Stafford | 10 September, 1872 | 11 October, 1872. |
| 11. Waterhouse | 11 October, 1872 | 3 March, 1873. |
| 12. Fox | 3 March, 1873 | 8 April, 1873. |
| 13. Vogel | 8 April, 1873 | 6 July, 1875. |
| 14. Pollen | 6 July, 1875 | 15 February, 1876. |
| 15. Vogel | 15 February, 1876 | 1 September, 1876. |
| 16. Atkinson | 1 September, 1876 | 13 September, 1876. |
| 17. Atkinson (reconstituted) | 13 September, 1876 | 13 October, 1877. |
| 18. Grey | 15 October, 1877 | 8 October, 1879. |
| 19. Hail | 8 October, 1879 | 21 April, 1882. |
| 20. Whitaker | 21 April, 1882 | 25 September, 1883. |
| 21. Atkinson | 25 September, 1883 | 16 August, 1884. |
| 22. Stout-Vogel | 16 August, 1884 | 28 August, 1884. |
| 23. Atkinson | 28 August, 1884 | 3 September, 1884. |
| 24. Stout-Vogel | 3 September, 1884 | 8 October, 1887. |
| 25. Atkinson | 8 October, 1887 | 24 January, 1891. |
| 26. Ballance | 24 January, 1891 | Still in office. |
| Name of Premier. | Date of Assumption of Office. | Date of Retirement from Office. |
|---|---|---|
| Henry Sewell | 7 May, 1856 | 20 May, 1856. |
| William Fox | 20 May, 1856 | 2 June, 1856. |
| Edward William Stafford | 2 June, 1850 | 12 July, 1861. |
| William Fox | 12 July, 1861 | 6 August, 1862. |
| Alfred Domett | 6 August, 1862 | 30 October, 1863. |
| Frederick Whitaker | 30 October, 1863 | 24 November, 1864. |
| Frederick Aloysius Weld | 24 November, 1864 | 16 October, 1865. |
| Edward William Stafford | 16 October, 1865 | 28 June, 1869. |
| William Fox | 28 June, 1869 | 10 September, 1872. |
| Hon. Edward William Stafford | 10 September, 1872 | 11 October, 1872. |
| George Marsden Waterhouse | 11 October, 1872 | 3 March, 1873. |
| Hon. William Fox | 3 March, 1873 | 8 April, 1873. |
| Hon. Julius Vogel, C.M.G. | 8 April, 1873 | 6 July, 1875. |
| Daniel Pollen, M.L.C. | 6 July, 1875 | 15 February, 1876. |
| Sir Julius Vogel, K.C.M.G. | 15 February, 1876 | 1 September, 1876. |
| Harry Albert Atkinson | 1 September, 1876 | 13 September, 1876. |
| Harry Albert Atkinson (Ministry re-constituted) | 13 September, 1876 | 13 October, 1877. |
| Sir George Grey, K.C.B. | 15 October, 1877 | 8 October, 1879. |
| Hon. John Hall | 8 October, 1879 | 21 April, 1882. |
| Frederick Whitaker, M.L.C. | 21 April, 1882 | 25 September, 1883. |
| Harry Albert Atkinson | 25 September, 1883 | 16 August, 1884. |
| Robert Stout | 16 August, 1884 | 28 August, 1884. |
| Harry Albert Atkinson | 28 August, 1884 | 3 September, 1884. |
| Sir Robert Stout, K.C.M.G. | 3 September, 1884 | 8 October, 1887. |
| Sir Harry Albert Atkinson, K.C.M.G. | 6 October, 1887 | 24 January, 1891. |
| John Ballance | 24 January, 1891 |
| Name of Speaker. | Date of Appointment. | Date of Retirement. |
|---|---|---|
| Hon. William Swainson | 16 May, 1854 | 8 August, 1855. |
| Hon. Frederick Whitaker | 8 August, 1855 | 12 May, 1856. |
| Hon. Thomas Houghton Bartley | 12 May, 1856 | 1 July, 1868. |
| Hon. Sir John Larkins Cheese Richardson | 1 July, 1868 | 14 June, 1879. |
| Hon. Sir William Fitzherbert, K.C.M.G. | 14 June, 1879 | 23 January, 1891. |
| Hon. Sir Harry Albert Atkinson, K.C.M.G. | 23 January, 1891 | 28 June, 1892. |
| Hon. Henry John Miller | 8 July, 1892 |
| Name of Speaker. | Dates of Election. | Date of Retirement. |
|---|---|---|
| Sir Charles Clifford | 26 May, 1854 | |
| 15 April, 1856 | 3 June, 1861. | |
| Sir David Monro | 3 June, 1861 | |
| 30 June, 1866 | 14 August, 1871. | |
| Sir Francis Dillon Bell | 14 August, 1871 | 15 June, 1876. |
| Sir William Fitzherbert, K.C.M.G. | 15 June, 1876 | 13 June, 1879. |
| Sir George Maurice O'Rorke, Knt. Bach. | 11 July, 1879 | |
| 24 September, 1879 | ||
| 18 May, 1882 | ||
| 7 August, 1884 | ||
| 6 October, 1887 | 22 January, 1891. | |
| Major William Jukes Steward | 22 January, 1891 |
(DOWNING STREET, S.W., LONDON), WITH DATES OF APPOINTMENT.
Secretary of State—The Right Hon. Lord Knutsford, 14 Jan., 1887; created Baron Knutsford, 1888. Under-Secretaries—The Right Hon. Baron Henry de Worms, M.P., 20 Feb., 1888; Hon. Robert H. Meade, C.B., 1 Feb., 1892. Assistant Under-Secretaries —John Bramston, D.C.L., C.B., 30 June, 1876; Edward Wingfield, B.C.L., C.B., 19 July, 1878. Edward Fairfield, C.M.G., 1 Feb., 1892. Private Secretary to the Secretary of State—W. A. Baillie Hamilton, C.M.G. Assistant Private Secretaries—H. W. Just, B.A., and W. C. Bridgeman.
Bell, Sir Francis Dillon, K.B., 1873; K.C.M.G., 1881; C.B., 1886.
Buckley, Sir Patrick Alphonsus, K.C.M.G., 1892.
Buller, Sir Walter Lawry, F.R.S., C.M.G., 1875; K.C.M.G., 1886.
FitzGerald, James Edward, Esq., C.M.G., 1870.
Fox, Sir William, K.C.M.G., 1879.
Grace, Morgan Stanislaus, Esq., C.M.G.
Grey, Sir George, K.C.B., 1818.
Hall, Sir John, K.C.M.G., 1882.
Hector, Sir James, F.R.S., C.M.G., 1875; K.C.M.G., 1887.
Larnach, William James Mudie, Esq., C.M.G, 1879.
O'Rorke, Sir George Maurice, Knt. Bach., 1880.
Prendergast, Sir James, Knt. Bach., 1881.
Richardson, Hon. Edward, C.M.G., 1879.
Roberts, John, Esq., C.M.G.
Stafford, Sir Edward William, K.C.M.G., 1879; G.C.M.G., 1887.
Stout, Sir Robert, K.C.M.G., 1886.
Vogel, Sir Julius, C.M.G., 1872; K.C.M.G., 1875.
Whitmore, Colonel Sir George Stoddart, C.M.G., 1869; K.C.M.G., 1882.
EX-MINISTERS AND MINISTERS ALLOWED TO RETAIN THE TITLE OF “HONOURABLE” WITHIN THE COLONY.
Messrs. E. W. Stafford, J. Hall, and Colonel T. M. Haultain, gazetted March 23, 1870; Messrs. W. Fox, Julius Vogel, C.M.G., and W. Gisborne, gazetted February 13, 1873; Mr. W. H. Reynolds, by despatch from Secretary of State, May 11, 1876; Mr. E. Richardson, gazetted May 31, 1877; Messrs. W. Rolleston, John Bryce, K, Oliver, T. Dick, and W. W. Johnston, gazetted December 24, 1884; Sir Robert Stout, K.C.M.G., Sir Julius Vogel, K.C.M.G., Messrs. E. Richardson, J. Ballance, J. A. Tole, P. A. Buckley, W. H. Reynolds, and W. J. M. Larnach, C.M.G., gazetted February 2, 1888; Messrs. E. Mitchelson, T. Fergus, G. F. Richardson, and T. W. Hislop, gazetted June 4, 1891.
CONSULS OF FOREIGN COUNTRIES RESIDING IN, OR WITH JURISDICTION OVER, NEW ZEALAND IN THE YEAR 1892.
Netherlands.—Chevalier Daniel Ploos Van Amstel, Melbourne, Consul-General; Charles John Johnston, Wellington, Consul; Edward Bowes Cargill, Dunedin, and David Boosie Cruickshank, Auckland, Vice-Consuls.
Belgium.—Gustave Beckx, Melbourne, Consul-General; Charles John Johnston, Wellington, Alexander Beck, Christchurch, and Arthur Masy, Auckland, Consuls.
Italy.—Cavaliere Nicola Squitti, Barone de Palermiti e Guarna, Melbourne, Consul; Alexander Cracroft Wilson, Christchurch, George Fisher, Wellington, Edward Bowes Cargill, Dunedin, Dr. Francesco Rosetti, Hokitika, Geraldo Guiseppe Perotti, Greymouth, and Patrick Comiskey, Auckland, Consular Agents.
German Empire.—A. Pelldram, Sydney, Consul-General; John Hamann, Dunedin (acting), William Henry Simms, Christchurch, Friedrich August Krull, Wanganui, Hermann Brown, Auckland, Consuls; Augustus Friedrich Castendyk, Wellington, Vice-Consul.
France.—Felix Jacques de Lostalot de Bachoué, Wellington Vice-Consul; David Boosie Cruickshank, Auckland, Percival Clay Neill, Dunedin, and Hon. Edmund William Parker, Christchurch, Consular Agents.
Sweden and Norway.—Fortunatus Evelyn Wright, Christchurch, and Edward Pearce, Wellington, Consuls; Harlan Page Barber, Auckland, Vice-Consul; Edmund Quick, Dunedin, Consular Agent.
Denmark.—Edward Valdemar Johansen, Auckland, Consul; Edmund Quick, Dunedin, and Emil Christian Skog, Christchurch, Vice-Consuls.
Spain.—Don Francisco Arenas Y. Bonet, Christchurch, Vice-Consul.
Portugal.—John Duncan, Wellington, Consul; Henry Rees George, Auckland, and Edmund Quick, Dunedin, Vice-Consuls.
United States.—O. M. Spencer, Melbourne, Consul-General; John Darcy Conolly, Auckland, Consul (for New Zealand); Francis Hopes Webb, Auckland, Vice-Consul; Albert Cuff, Christchurch, Henry Stephenson, Russell, Robert Wyles, Mongonui, William Hort Levin, Wellington, and Henry Driver, Dunedin, Consular Agents.
Chili—William Henry Eldred, Sydney, Consul-General; David Boosie Cruickshank, Auckland, Consul; Edmund Quick, Dunedin, Consular Agent.
Argentine Republic.—John Lee Leesmith, Dunedin, Consul.
Columbia.—Thomas P. Fallon, Melbourne, Consul-General.
Hawaiian Islands.—Henry Driver, Dunedin, and James Cruickshank, Auckland, Consuls.
Table of Contents
W. B. Perceval, Esq., Westminster Chambers, 13, Victoria Street, S.W. Secretary—Walter Kennaway, Esq., C.M.G.
New South Wales.—Sir Saul Samuel, K.C.M.G., C.B., Westminster Chambers, 9, Victoria Street, S.W. Secretary—S. Yardley, Esq.
Victoria.—The Hon. James Munro, Victoria Chambers, 15, Victoria Street, S.W. Secretary—John Cashel Hoey, Esq., C.M.G.
South Australia.—Sir John Cox Bray, K.C.M.G., Victoria Chambers, 15, Victoria Street, S.W. Assistant, Samuel Deering, Esq.
Queensland.—Sir James E. Garrick, K.C.M.G., Q.C., Westminster Chambers, 1, Victoria Street, S.W. Charles Shortt Dicken, Esq., C.M.G.
Tasmania.—Sir Edward N. Coventry Braddon, K.C.M.G., Westminster Chambers, 5, Victoria Street, S.W.
Western Australia.—Crown Agents for the Colony—Sir Montagu P. Ommaney, K.C.M.G., and Ernest E. Blake, Esq., Colonial Office Buildings, Downing Street, S.W.
OFFICES: DOWNING STREET, S.W.; AND 1, TOKENHOUSE BUILDINGS, E.C., LONDON.
Crown Agents—Sir Montagu Frederick Ommaney, K.C.M.G., and Ernest Edward Blake. Accountant—J. W. Leonard. Registrar—J. Chadwick. Chief Cashier—L. Adams. Engineering Clerk and Head of Contract Branch—T. R. Marsh, M.A.
GLASGOW, His Excellency the Right Honourable David, Earl of, G.C.M.G., a captain of the royal navy, who served in the White Sea during the Russian war, and in the Chinese war of 1857, and retired in 1878; born 1833; married, in 1873, Dorothea Thomasina, daughter of Sir Edward Hunter-Blair; appointed February 24, and assumed office June 7, 1892, as Governor and Commander-in-Chief in and over Her Majesty's Colony of New Zealand and its dependencies, and Vice-Admiral of the same. Salary, £5,000. Residences: Government House, Wellington; and Government House, Auckland.
Private Secretary—Colonel Pat Boyle (late Grenadier Guards).
Assistant Private Secretary—George Maurice Gillington.
Aides-de-camp—Reginald Stanley Hunter-Blair (Captain, Gordon Highlanders) and Edward Francis Clayton (Lieutenant, Scots Guards).
ADMINISTRATOR OF THE GOVERNMENT—A dormant commission empowers the Chief Justice of the colony for the time being to administer the Government in case of the death, incapacity, or removal, or departure of the Governor.
Hon. J. Ballance, Premier, Colonial Treasurer, and Commissioner of Trade and Customs.
Hon. Sir P. A. Buckley, M.L.C., K.C.M.G., Attorney-General and Colonial Secretary.
Hon. W. P. Reeves, Minister of Education, Commissioner of Stamp Duties, and Minister of Labour.
Hon. R. J. Seddon, Minister for Public Works, Minister of Mines, Minister of Defence, and Minister of Marine.
Hon. J. McKenzie, Minister of Lands and Immigration and Minister of Agriculture.
Hon. A. J. Cadman, Minister of Native Affairs and Minister of Justice.
Hon. J. G. Ward, Postmaster-General and Telegraph Commissioner.
Hon. J. Carroll (without portfolio), representing the Native race.
[The above Ministers are also members of the Cabinet.]
Clerk of Executive Council—Alexander James Willis.
Table of Contents
- LEGISLATIVE COUNCIL.
- ROLL OF MEMBERS
OF THE HONOURABLE THE
LEGISLATIVE COUNCIL,
Stating the Provincial District in which Members reside, and the Date of Writ of Summons. - HOUSE OF REPRESENTATIVES.
- ROLL OF MEMBERS
OF THE HOUSE OF REPRESENTATIVES,
With the Name of the District for which they are elected, and the Date of Notification of Return of Writ.
The number of members at present constituting the Legislative Council is thirty-five. The number cannot be less than ten, but is otherwise unlimited. Councillors have been, hitherto summoned by the Governor for life. On the 17th September, 1891, however, an Act was passed making future appointments to the Council tenable for seven years only, to be reckoned from the date of the instrument of the Councillor's appointment, though every such. Councillor may be reappointed. The qualifications are that the person to be appointed be of the full age of twenty-one years, and a subject of Her Majesty, either natural-born or naturalised in New Zealand. All contractors to the public service to the amount of over £50 and Civil servants of the colony are ineligible to become Councillors. The honorarium is £100 for every session (except in the event of there being two sessions in one year, when the amount is £50 for the second session) if the Councillor reside beyond three miles in a direct line from the General Assembly building. Deductions are made in case of absence, except through illness or other unavoidable cause. A seat is vacated by any member of the Council—(1), If he takes any oath or makes any declaration or acknowledgment of allegiance, obedience, or adherence to any foreign Prince or Power; or (2), if he does, or concurs in, or adopts any act whereby he may become a subject or citizen of any foreign State or Power, or is entitled to the rights, privileges, or immunities of a subject of any foreign State or Power; or (3), if he is a bankrupt, or compounds with his creditors under any Act for the time being in force; or (4), if he is a public defaulter, or is attainted of treason, or is convicted of felony or any infamous crime; or (5), if he resigns his seat by writing under his hand addressed to and accepted by the Governor; or (6), if for more than one whole session of the General Assembly he fails, without permission of the Governor notified to the Council, to give his attendance in the Council. The presence of one-fourth of the members of the Council, exclusive of those who have leave of absence, is necessary to constitute a meeting for the exercise of its powers. This rule, however, may be altered from time to time by the Council. The ordinary sitting-days are Tuesdays, Wednesdays, Thursdays, and Fridays, from 2.30 p.m. to 5 p.m., resuming again at 7.30 when necessary.
| Speaker—The Hon. HENRY JOHN MILLER. | ||
|---|---|---|
| Chairman of Committees—The Hon. WILLIAM DOUGLAS HALL BAILLIE. | ||
| Name. | Provincial District. | Date of Appointment. |
| Acland, the Hon. John Barton Arundel | Canterbury | 8 July, 1865. |
| Baillie, the Hon. William Douglas Hall | Marlborough | 8 March, 1861. |
| Barnicoat, the Hon. John Wallis | Nelson | 14 May, 1883. |
| Bonar, the Hon. James Alexander | Westland | 27 June, 1868. |
| Bowen, the Hon. Charles Christopher | Canterbury | 23 January, 1891. |
| Buckley, the Hon. Sir Patrick Alphonsus, K.C.M.G. | Wellington | 25 July, 1878. |
| Dignan, the Hon. Patrick | Auckland | 3 February, 1879. |
| Grace, the Hon. Morgan Stanislaus, C.M.G. | Wellington | 13 May, 1870. |
| Hart, the Hon. Robert | Wellington | 9 July, 1872. |
| Holmes, the Hon. Mathew | Otago | 19 June, 1866. |
| Johnston, the Hon. Charles John | Wellington | 23 January, 1891. |
| Kenny, the Hon. Courtney William Aylmer Thomas | Marlborough | 15 May, 1885. |
| Mantell, the Hon. Walter Baldock Durant | Wellington | 19 June, 1866. |
| McLean, the Hon. George | Otago | 19 December, 1881. |
| Miller, the Hon. Henry John (Speaker) | Otago | 8 July, 1865. |
| Morris, the Hon. George Bontham | Auckland | 15 May, 1885. |
| Oliver, the Hon. Richard | Otago | 10 November, 1881. |
| Ormond, the Hon. John Davies | Hawke's Bay | 23 January, 1891. |
| Peacock, the Hon. John Thomas | Canterbury | 3 June, 1873. |
| Pharazyn, the Hon. Robert | Wellington | 15 May, 1885. |
| Pollen, the Hon. Daniel | Auckland | 12 May, 1873. |
| Reynolds, the Hon. William Hunter | Otago | 6 May, 1878. |
| Scotland, the Hon. Henry | Taranaki | 24 February, 1868. |
| Shephard, the Hon. Joseph | Nelson | 15 May, 1885. |
| Shrimski, the Hon. Samuel Edward | Otago | 15 May, 1885. |
| Stevens, the Hon. Edward Cephas John | Canterbury | 7 March, 1882. |
| Stewart, the Hon. William Downie | Otago | 23 January, 1891. |
| Swanson, the Hon. William | Auckland | 15 May, 1885. |
| Taiaroa, the Hon. Hori Kerei | Otago | 15 May, 1885. |
| Wahawaha, the Hon. Major Ropata, N.Z.C. | Auckland | 10 May, 1887. |
| Walker, the Hon. Lancelot | Canterbury | 15 May, 1885. |
| Whitmore, the Hon. Sir George Stoddart, K.C.M.G. | Hawke's Bay | 31 August, 1863. |
| Whyte, the Hon. John Blair | Otago | 23 January, 1891. |
| Williams, the Hon. Henry | Auckland | 7 March, 1882. |
| Wilson, the Hon. John Nathaniel | Hawke's Bay | 23 November, 1877. |
Clerk
of Parliaments, Clerk of the Legislative Council, and Examiner of Standing Orders
upon Private Bills—Leonard Stowe.
Clerk-Assistant—Arthur
Thomas Bothamley.
Second
Clerk-Assistant—George Moore.
Interpreter—Henry
S. Hadfield.
The number of members constituting the House of Representatives is seventy-four—seventy Europeans, and four Maoris. Previously (from 1881) the House consisted of ninety-five members— ninety-one Europeans, and four Maoris. The North Island returns thirty European members, and the Middle Island forty. The Cities of Auckland, Wellington, Christchurch, and Dunedin return each three members, and all other electoral districts one each. The elections are triennial, except in the case of a dissolution by the Governor. The qualification for membership is simply registration as an elector, and hot coming within the meaning of section 2 of “The Public Offenders' Disqualification Act, 1867.” The honorarium is £100 a session, with an additional £50 for expenses necessarily incurred; such sum of £50 not to be reducible in case there shall be two sessions of Parliament held in the same year; but members residing within three miles of the General Assembly building are allowed only £25. All contractors to the public service of New Zealand, when any public money above the sum of £50 is payable, directly or indirectly, to such person in any one financial year, and Civil servants of the colony, are incapable of being elected as or of sitting or voting as members. Twenty members, exclusive of the Speaker, constitute a quorum. Unless otherwise ordered, the sitting-days of the House are Tuesdays, Wednesdays, Thursdays, and Fridays, from 2.30 to 5.30, and resuming at 7.30 p.m. Order of admission to the Speaker's Gallery is by ticket to be obtained from the Speaker. The Stranger's Gallery is open free to the public.
| Speaker—The Hon. WILLIAM JUKES STEWARD. | ||
|---|---|---|
| Chairman of Committees—WILLIAM LEE REES. | ||
| Name. | Electoral District. | Date of Notification of Return of Writ. |
| Allen, James | Bruce | 12 May, 1892. |
| Ballance, Hon. John | Wanganui | 18 December, 1890. |
| Blake, Edwin | Avon | 18 December, 1890. |
| Bruce, Robert Cunningham | Rangitikei | 13 July, 1892. |
| Buchanan, Walter Clarke | Wairarapa | 18 December, 1890. |
| Buckland, William Francis | Manukau | 18 December, 1890. |
| Buick, Thomas Lindsay | Wairau | 18 December, 1890. |
| Cadman, Hon. Alfred Jerome | Thames | 18 December, 1890. |
| Carncross, Walter Charles Frederick | Taieri | 18 December, 1890. |
| Carroll, Hon. James | Eastern Maori | 6 January, 1891. |
| Dawson, William | Dunedin Suburbs | 18 December, 1890. |
| Duncan, Thomas | Oamaru | 18 December, 1890. |
| Duthie, John | City of Wellington | 18 December, 1890. |
| Earnshaw, William | Peninsula | 18 December, 1890. |
| Fergus, Hon. Thomas | Wakatipu | 18 December, 1890. |
| Fish, Henry Smith | City of Dunedin | 18 December, 1890. |
| Fisher, George | City of Wellington | 18 December, 1890. |
| Fraser, William | Te Aroha | 18 July, 1891. |
| Grey, Sir George, K.C.B. | Newton | 8 April, 1891. |
| Guinness, Arthur Robert | Grey | 18 December; 1890. |
| Hall, Hon. Sir John, K.C.M.G. | Ellesmere | 18 December; 1890. |
| Hall-Jones, William | Timaru | 18 December; 1890. |
| Hamlin, Ebenezer | Franklin | 18 December; 1890. |
| Harkness, Joseph George | City of Nelson | 18 December; 1890. |
| Hogg, Alexander Wilson | Masterton | 18 December; 1890. |
| Houston, Robert Morrow | Bay of Islands | 18 December; 1890. |
| Hutchison, George | Waitotara | 18 December; 1890. |
| Hutchison, William | City of Dunedin | 18 December; 1890. |
| Joyce, John | Akaroa | 18 December; 1890. |
| Kapa, Eparaima te Mutu | Northern Maori | 21 February, 1891. |
| Kelly, James | Invercargill | 18 December, 1890. |
| Kelly, William | East Coast | 18 December, 1890. |
| Lake, Edward | Waikato | 12 October, 1891. |
| Lawry, Frank | Parnell | 18 December, 1890. |
| Mackenzie, Mackay John Scobie | Mount Ida | 18 December, 1890. |
| Mackenzie, Thomas | Clutha | 18 December, 1890. |
| Mackintosh, James | Wallace | 18 December, 1890. |
| McGuire, Felix | Egmont | 24 February, 1891. |
| McKenzie, Hon. John | Waitaki | 18 December, 1890. |
| McLean, William | City of Wellington | 20 January, 1892. |
| Meredith, Richard | Ashley | 18 December, 1890. |
| Mills, Charles Houghton | Waimea-Picton | 18 December, 1890. |
| Mills, James | Port Chalmers | 18 December, 1890. |
| Mitchelson, Hon. Edwin | Eden | 18 December, 1890. |
| Moore, Richard | Kaiapoi | 18 December, 1890. |
| Newman, Alfred Kingcome | Hutt | 18 December, 1890. |
| O'Conor, Eugene Joseph | Buller | 18 December, 1890. |
| Palmer, Jackson | Waitemata | 18 December, 1890. |
| Parata, Tame | Southern Maori | 6 January, 1891. |
| Pinkerton, David | City of Dunedin | 18 December, 1890 |
| Rees, William Lee | City of Auckland | 18 December, 1890 |
| Reeves, Richard Harman Jeffares | Inangahua | 18 December, 1890 |
| Reeves, Hon. William Pember | City of Christchurch | 18 December, 1890 |
| Rhodes, Arthur Edgar Gravenor | Geraldine | 18 December, 1890 |
| Richardson, Hon. George Frederick | Mataura | 18 December, 1890 |
| Rolleston, Hon. William | Halswell | 18 December, 1890 |
| Russell, William Russell | Hawke's Bay | 18 December, 1890 |
| Sandford, Ebenezer | City of Christchurch | 18 December, 1890. |
| Saunders, Alfred | Selwyn | 18 December, 1890. |
| Seddon, Hon. Richard John | Westland | 18 December, 1890. |
| Shera, John McEffer | City of Auckland | 18 December, 1890. |
| Smith, Edward Metcalf | New Plymouth | 18 December, 1890. |
| Smith, William Cowper | Waipawa | 18 December, 1890. |
| Steward, Hon. William Jukes | Waimate | 18 December, 1890. |
| Swan, George Henry | Napier | 18 December, 1890. |
| Taipua, Hoani | Western Maori | 6 January, 1891. |
| Tanner, William Wilcox | Heathcote | 18 December, 1890. |
| Taylor, Richard Molesworth | City of Christchurch | 18 December, 1890. |
| Thompson, Robert | Marsden | 18 December, 1890. |
| Thompson, Thomas | City of Auckland | 18 December, 1890. |
| Valentine, Hugh Sutherland | Tuapeka | 18 December, 1890. |
| Ward, Hon. Joseph George | Awarua | 18 December, 1890. |
| Wilson, James Glenny | Palmerston | 18 December, 1890. |
| Wright, Edward George | Ashburton | 18 December, 1890. |
Clerk
of House of Representatives—G. Friend.
Serjeant-at-Arms—Lieut.-Colonel
P. F. de Quincey.
Deputy-Clerk
of Writs—H. Pollen.
Clerk-Assistant—H.
Otterson.
Second
Clerk-Assistant—A. J. Rutherford.
Reader
and Clerk of Bills and Papers—E. D. O'Rorke.
Interpreters—F.
S. Hamlin and G. Mair.
Acting
Librarian—H. L. James, B.A.
Table of Contents
There is no State Church in the colony, nor is State aid given to any form of religion. But, as the companies which founded the settlements of Wellington, Nelson, and Canterbury gave special facilities to intending settlers who were members of the United Church of Great Britain and Ireland, and the Otago settlement was intrusted to laymen belonging to or sympathizing with the Free Church of Scotland, liberal endowments of land were granted for Church purposes; and Government has subsequently given land for Church purposes—Protestant or Catholic—whenever it has been shown to be required by the inhabitants in any given locality.
The Right Rev. William Garden Cowie, D.D., Auckland; appointed 1869.
The Right Rev. Edward Craig Stuart, D.D., Waiapu; appointed 1877.
The Most Rev. Octavius Hadfield, Primate, Wellington; appointed 1870.
The Right Rev. Charles Oliver Mules, M.A., Nelson; appointed 1892.
The Right Rev. Churchill Julius, D.D., Christchurch; appointed 1890.
The Right Rev. Samuel Tarratt Nevill, D.D., Dunedin; appointed 1871.
The Bishop of Melanesia (Bishopric, June, 1892, vacant).
The Most Rev. Francis Redwood, S.M., D.D., Archbishop and Metropolitan, Wellington; consecrated 1874.
The principal present heads or officers of the various churches, and the places and times of holding their annual or periodical assemblies or meetings, are as follow:—
Church of England.—For Church purposes, the colony is divided into six dioceses—viz., Auckland, Waiapu, Wellington, Nelson, Christchurch, and Dunedin. The General Synod meets every third year in one of the various dioceses.—President, Bishop Hadfield, Primate, Wellington; Secretary, Rev. C. M. Nelson, M.A., Auckland; Lay Secretary, James Allen, Esq., M.H.R., Dunedin. The next General Synod will be held in Nelson, in February, 1893.
Roman Catholic Church.—The Diocese of Wellington, established in 1848, was in 1887 created the metropolitan see. There are three suffragan dioceses—Auckland, Christchurch, and Dunedin. A Retreat is held annually in each of the four dioceses.
Presbyterian Church of New Zealand.—The Assembly meets annually, in February, at Auckland, Wellington, and Christchurch in succession. Moderator. Rev. John Elmslie, M.A., D.D.; Clerk and Treasurer, Rev. David Sidey, Napier.
Presbyterian Church of Otago and Southland.—The Assembly meets annually in November at Dunedin. Moderator, Rev. John Steven; Clerk, Rev. W. Bannerman; Church Factor, Mr. Edmund Smith.
Wesleyan Methodist Church.—The annual Conference meets in March, the exact date being determined by the President, who holds office for one year. Each Conference determines where the next one shall assemble. President (1892-93), Rev. George Bond, Kaiapoi; Secretary, Rev. Henry Bull, Onehunga. The next Conference is to assemble in Dunedin on or about the 1st March, 1893.
Baptist Church.—The annual Conference is held in November, in one of the four principal centres. President, Professor Kirk, Wellington; Secretary, Rev. W. E. Woolley, Thames.
Congregational Union.—The annual meetings are held about the end of February, at such place as may be decided by the vote of the Council. Chairman. Rev. W. J. Habens, B.A., Wellington; Chairman Elect, Rev. H. W. J. Miller, Onehunga; Secretary, Mr. G. Fowlds, Auckland; Treasurer, Mr. W. H. Lyon, Auckland; Registrar, Rev. J. Foster, Ravensbourne, Dunedin. In 1893 the meeting will be held in Christchurch, by invitation of the Congregational Churches of that city.
Primitive Methodists.—The annual Conference is held in the month of January, at one of the four centres. President, James Bellringer, Esq., J.P., New Plymouth; Secretary, Rev. Thomas H. Lyon, Feilding, Wellington.
United Methodist Free Churches.—The Assembly meets annually in January, in Canterbury, Auckland, Wellington, or Hawke's Bay. President, Rev. John W. Worboys; Secretary, Rev. A. Peters.
Hebrew Church.—Ministers, Rev. S. A. Goldstein, Auckland; —-, Dunedin; Rev. H. van Staveren, Wellington; Rev. Adolph T. Chadowski, Christchurch; Mr. Alexander Singer, Hokitika; Rev. Isaac Zachariah, Greymouth. Annual meetings of the general Congregations are held at these places on the first Sunday in Elul (about the end of August).
Bible Christians.—A General Conference of the Connexion is held annually. Superintendent, Rev. J. Orchard, Christchurch; Secretary, Rev. J. Crewes, Wellington; Chapel Secretary, Rev. B. H. Ginger, Cromwell. The next district meeting is to be held at Addington, near Christchurch.
The following shows the number of persons (exclusive of Maoris) belonging to the different religious denominations in New Zealand, and the number of churches and chapels, according to the census of April, 1891; also, the number of officiating ministers, to 1st July, 1892.
| Religious Denominations. | Persons | Churches and Chapels. | Officiating Ministers. |
|---|---|---|---|
|
* Including 42 Dissenters; 55 Christian Israelites. * Including 2,326 of No denomination, so described. † Including 1,269 of No religion, so described; 123 Atheists; 65 Secularists. ‡ In addition to the number of churches and chapels here given, there are about 400 schoolhouses, dwellings, or public buildings used for public worship, besides 20 buildings open to more than one Protestant denomination. | |||
| Episcopalians— | |||
| Church of England, and Episcopalians not otherwise defined | 250,945 | 345 | 265 |
| Protestants (undescribed) | 2,386 | .. | .. |
| Presbyterians— | .. | .. | .. |
| Church of Scotland, Free Church of Scotland, Free Presbyterians, Presbyterian Church of New Zealand, Presbyterian Church of Otago and Southland, and Presbyterians otherwise defined | 141,477 | 246 | 188 |
| Methodists— | |||
| Wesleyan Methodists | 53,061 | 213 | 102 |
| Methodists (undefined) | 2,071 | .. | .. |
| Primitive Methodists | 5,220 | 41 | 25 |
| United Methodist Free Churches, Free Methodists, United Methodists | 1,905 | 14 | 18 |
| Bible Christians | 1,069 | 9 | 9 |
| Others | 89 | 1 | .. |
| Baptists | 14,825 | 32 | 18 |
| Congregational Independents | 6,685 | 21 | 19 |
| Lutheran, German Protestants | 5,616 | 13 | 10 |
| Unitarians | 308 | .. | .. |
| Society of Friends | 315 | .. | .. |
| Other Protestants— | |||
| Church of Christ (including Christian, Church of Christ, Christian Disciples, Disciples of Christ, Disciples) | 5,241 | 15 | 7 |
| Brethren (including Christian Brethren, Brethren, Exclusive Brethren, Open Brethren, Plymouth Brethren) | 3,537 | 3 | 1 |
| Believers in Christ | 193 | .. | .. |
| Evangelists (including Evangelical Union, Evangelical Church, Evangelical Christians, Evangelical Brethren) | 93 | .. | .. |
| Nonconformists | 77 | .. | .. |
| Salvation Army | 9,383 | 34 | 8 |
| Christadelphians | 700 | .. | .. |
| Swedenborgians (including New Church, New Jerusalem Church) | 178 | .. | .. |
| Seventh-day Adventists | 415 | 1 | 1 |
| Students of Truth | 325 | .. | 1 |
| Other Protestants (variously returned) | 536* | .. | .. |
| Catholics— | |||
| Roman Catholics | 85,856 | 181 | 126 |
| Catholics (undefined) | 1,416 | .. | .. |
| Greek Church | 56 | .. | .. |
| Catholic Apostolic | 150 | 1 | 1 |
| Other sects— | |||
| Hebrews | 1,463 | 5 | 7 |
| Mormons, Latter-day Saints | 206 | .. | .. |
| Spiritualists | 339 | .. | .. |
| Buddhists, Pagans, Confucians | 3,928 | .. | .. |
| Others (variously returned) | 154 | .. | .. |
| No denomination— | |||
| Freethinkers | 4,475 | .. | .. |
| Agnostic | 322 | .. | .. |
| Deists, Theists | 51 | .. | .. |
| Doubtful | 405 | .. | .. |
| No denomination (variously returned) | 2,999* | 18 | .. |
| No religion | 1,558† | .. | .. |
| Unspecified | 1,288 | .. | .. |
| Object to state | 15,342 | .. | .. |
| Totals | 620,658 | 1,197‡ | 764 |
The total number specified as to religion is 625,370 out of the number of adherents to the various Churches given above.
The following return shows the number of churches and chapels, schoolhouses, and other buildings used for public worship by the different religious denominations, in April, 1891; also the number of persons for whom there was accommodation, and the number usually attending, in each provincial district:—
| Provincial Districts. | Churches and Chapels. | School-houses used for Public Worship. | Dwellings or Public Buildings used for Public Worship. | Number of Persons | |
|---|---|---|---|---|---|
| For whom Accommodation. | Attending Services. | ||||
| Auckland | 288 | 68 | 43 | 66,167 | 37,650 |
| Taranaki | 46 | 17 | 11 | 8,472 | 5,322 |
| Hawke's Bay | 58 | 8 | 6 | 11,274 | 7,064 |
| Wellington | 178 | 18 | 19 | 40,192 | 25,631 |
| Marlborough | 30 | 1 | .. | 5,310 | 3,335 |
| Nelson | 76 | 6 | 10 | 15,030 | 8,879 |
| Westland | 33 | 2 | 3 | 6,705 | 4,445 |
| Canterbury | 256 | 33 | 19 | 60,755 | 41,771 |
| Otago | 232 | 88 | 50 | 64,209 | 42,958 |
| Totals | 1,197 | 241 | 161 | 278,114 | 177,055 |
Table of Contents
- CIVIL ESTABLISHMENT AT SEAT OF GOVERNMENT
- COLONIAL SECRETARY'S DEPARTMENT
- COLONIAL TREASURER'S DEPARTMENT
- LAND- AND INCOME-TAX DEPARTMENT
- DEPARTMENT OF JUSTICE
- POST OFFICE AND TELEGRAPH DEPARTMENT
- DEPARTMENT OF TRADE AND CUSTOMS AND MARINE
- MARINE
- STAMP DEPARTMENT
- LAND TRANSFER DEPARTMENT AND DEEDS REGISTRY
- EDUCATION DEPARTMENT
- DEPARTMENT OF LABOUR
- NATIVE DEPARTMENT
- MINES DEPARTMENT
- PUBLIC WORKS DEPARTMENT
- RAILWAY DEPARTMENT
- DEFENCE DEPARTMENT
- DEPARTMENT OF LANDS AND SURVEY
- AGRICULTURAL AND LIVE-STOCK DEPARTMENT
- GOVERNMENT LIFE INSURANCE DEPARTMENT
- PUBLIC TRUST OFFICE
Colonial Secretary—Hon. Sir P. A. Buckley, K.C.M.G.
Under-Secretary—Hugh Pollen
Chief Clerk—R. H. Govett
Clerks—R. F. Lynch, L. W. Loveday, R. Leckie, M. J. Hodgins
Housekeeper and Chief Messenger— F. H. Revell
Controller and Auditor-General—J. E. FitzGerald, C.M.G.
Assistant Controller and Auditor—J. C. Gavin
Chief Clerk—J. G. Anderson
Clerks—L. C. Roskruge, W. Dodd, P. P. Webb, A. Rowband, H. S. Pollen, W. G. Holdsworth, C. M. Georgeson, J. T. Dumbell, B. A. Meek
Extra Clerks—D. C. Innes, J. Swift, A. E. Bybles, J. Ward
Audit Officer, Agent-General's Office, London—C. F. W. Palliser
Audit Travelling Inspectors — A. H. Maclean, J. King, C. O'H. Smith, E. J. A. Stevenson, W. R. Holmes, A. W. Eames, E. T. Greville, G. H. I. Easton, J. M. Glasgow
Registrar-General—E. J. Von Dadelszen Clerks—G. Drury, E. F. Norris, E. H. Lyons, S. Coffey
Government Printer, Stationery Store Manager, and Controller of Stamp Printing—G. Didsbury
Superintending Overseer—J. Burns
Chief Clerk and Accountant—Samuel Costall
Overseers—J. Gamble, B. Wilson
Overseer, Machine-room—C. Young
Overseer, Binding Branch—W. Franklin
Stamp Printer—H. Hume
Stereotyper and Electrotyper—W. J. Kirk
Readers—A. F. Warren, J. W. Henley, W. Fuller, M. F. Marks
Clerk and Computer—B. B. Allen
Clerks, Stationery Office—F. Barraud, R. Watts, W. Phillips
Advertisement and Invoice Clerk—B. K. Manley
Sub-overseer, Binding Branch — G. F. Broad
Sub-overseer, Jobbing-room—G. Tattle
Night Foreman—J. F. Rogers
Forewoman, Binding Branch — Miss Marsden
Colonial Treasurer—Hon. J. Balance
Secretary to the Treasury, Receiver General, and. Paymaster-General — James B. Heywood
Accountant to the Treasury—Robert J. Collins
Cashier—W. T. Thane
Corresponding Clerk—H. Blundell
Clerks—A. M. Smith, C. Meacham, W. E. Cooper, R. B. Vincent, J. F. Andrews, J. R. Duncan, E. L. Mowbray, T. H. Burnett, J. Radcliffe, T. J. Davis, H. N. W. Church, J. Holmes, A. O. Gibbes, C. E. Chitty, J. Eman Smith, A. J. Morgan, F. H. Tuckey
Officer for Payment of Imperial Pensions at Auckland—B. J. Devaney
Commissioner of Taxes—C.M. Crombie
Deputy — Commissioner of Taxes —- J. McGowan
Chief Clerk—G. F. C. Campbell
Clerks—D. Walinsley, G. Maxwell, H.J. Knowles, A. F. Oswin, H. Nancarrow, D. R. Purdie, J. W. Black, J. P. Dugdale, M. C. Barnett, A. J. McGowan, J. M. King, C. V. Kreeft, G. W. Jänisch, H. H. Seed, T. Oswin, D. G. Clark, A. Fowler
Minister of Justice—Hon. A. J. Cadman
Under-Secretary—C. J. A. Haselden, J.P.
Chief Clerk—F. Waldegrave
Clerks—C. B. Jordan, E. W. Porritt
Attorney — General — Hon. Sir P. A. Buckley, K.C.M.G.
Solicitor-General—W. S. Reid
Assistant Law Officer—L. G. Reid
Law Draftsman—J. Curnin
Clerk—E. Y. Redward
Registrar of Patents, Designs, and Trademarks—C. J. A. Haselden, J.P.
Deputy Registrar—F. Waldegrave
Clerks—J. C. Lewis, F. J. Stewart
Chief Justice—
Wellington—Sir J. Prendergast, Knt. Bach.
Puisne Judges—
Wellington—C. W. Richmond
Auckland—E. T. Conolly
Christchurch—J. E. Denniston
Dunedin—J. E. Williams
Wairarapa—H. W. Robinson
Wanganui, New Plymouth, Hawera, and Palmerston North—C. C. Kettle
Nelson and Westport—L. Broad
Ashburton, Timaru, Oamaru, Queenstown, Naseby, Lawrence, Hokitika, Greymouth, and Reefton—C. D. R. Ward
Invercargill—C. E. Rawson
Auckland—H. C. Brewer
New Plymouth—W. Stuart
Napier—A. Turnbull
Gisborne—W. A. Barton
Wellington—D. G. A. Cooper
Nelson—L. Broad
Blenheim—J. Allen
Christchurch—A. R. Bloxam
Hokitika—A. H. King
Dunedin—C. McK. Gordon
Invercargill—F. G. Morgan
Auckland—H. C. Brewer
Taranaki—A. H. Holmes
Hawke's Bay—A. Turnbull
Poverty Bay—W. A. Barton
Wellington—D. G. A. Cooper
Wairarapa—J. M. Roberts
Wanganui and Rangitikei—A. D. Thomson
Nelson—W. Heaps
Westland North—A. Greenfield
Central Westland—H. Lucas
Marlborough—W. G. P. O'Callaghan
Canterbury—A. R. Bloxam
Timaru—C. A. Wray
Westland—A. H. King
Otago—C. McK. Gordon
Southland—W. Martin
Auckland—H. Williamson
New Plymouth—A. Standish
Gisborne—J. W. Nolan
Napier—A. J. Cotterill
Wellington—H. Gully
Wanganui—S. T. Fitzherbert
Nelson—C. Y. Fell
Blenheim—W. Sinclair
Christchurch—J. C. Martin
Timaru—J. W. White
Hokitika—W. M. Purkiss
Dunedin—B; C. Haggitt
Invercargill—T. M. Macdonald
Oamaru—A. G. Creagh
New Plymouth—A. Standish
Hawera—E. L. Barton
Wanganui and Palmerston North—S. T. Fitzherbert
Westport and Reefton—C. E. Harden
Hokitika and Greymouth.— W. M. Purkiss
Timaru—J. W. White
Oamaru—A. G. Creagh
Nelson—C. Y. Fell
Queenstown—Wesley Turton
Invercargill—T. M. Macdonald
Auckland—J. Giles
Pokeno, Waikato, &c.—T. Jackson
Onehunga, &c.—H. W. Bishop*
Tauranga, &c.—R. S. Bush
Thames, &c.—H. W. Northcroft*
Gisborne, &c.—J. Booth
* Are also Wardens of Goldfields.
New Plymouth—W. Stuart
Opunake, &c.—A. Tuke
Wellington, &c.—H. W. Robinson
Wanganui, &c.—C. C. Kettle
Palmerston North, &c.—H. W. Brabant
Wairarapa—J. M. Roberts
Napier, &c.—A. Turnbull
Nelson, &c.—L. Broad
Westport, Collingwood, &c.—A. Greenfield
Blenheim, &c.—J. Allen*
Christchurch, &c.—B. Beetham
Kaiapoi, &c.—G. A. Preece
Timaru, &c.—C. A. Wray
Greymouth, &c.—J. Keddell*
Hokitika, &c.—D. Macfarlane*
Dunedin, &c.—E. H. Carew
Oamaru, &c.—H. A. Stratford*
Lawrence, &c.—W. H. Revell*
Clyde, &c.—J. N. Wood*
Naseby—S. M. Dalgleish*
Invercargill, &c.—C. E. Rawson
Chatham Islands—F. J. W. Gascoyne
New Plymouth—A. H. Holmes
Hawera—A. Trimble
Wanganui—A. D. Thomson
Palmerston North—W. Matravers
Wairarapa—F. H. Ibbetson
Nelson—C. H. W. Bowen
Hokitika—C. A. Barton
Greymouth—F. J. D. Elmer
Westport—E. C. Kelling
Reefton—H. Lucas
Timaru—T. Howley
Ashburton—J. E. Colyer
Oamaru—W. G. Filleul
Invercargill—W. Martin
Queenstown—H. N. Firth
Lawrence—H. J. Abel
Naseby—B. Harper
Auckland—J. Lawson
Wellington—C. C. Graham
Christchurch-G. L. Greenwood
Dunedin—J. Ashcroft
Thames—F. J. Burgess
Coromandel—J. B. Gatland
Te Aroha—T. M. Lawlor
Whangarei—T. W. Taylor
Havelock and Cullensville (Marlborough) — W. A. Hawkins
* Are also Wardens of Goldfields.
Nelson—C. H. W. Bowen
Motueka—H. E. Gilbert
Collingwood—J. Mayne
Takaka—J. Nash
Murchison—J. Terry
Westport—E. C. Kelling
Charleston—A. A. Winterburn
Lyell—J. Terry
Reefton—H. Lucas
Ahaura—J. Watt
Greymouth—F. J. D. Elmer
Kumara—J. McEnnis
Hokitika—C. A. Barton
Stafford and Goldsborough—D. Hannan
Ross— W. Folley
Okarito—M. Donovan
Jackson's Bay—D. McKenzie
Naseby, St. Bathans, Hyde, Macraes, Hamiltons—B. Harper
Wyndham—C. J. Hinton
Waipori—F. W. Knight
Clyde, Blacks, and Alexandra—F. T. D. Jeffrey
Roxburgh—W. Fouhy
Cromwell—J. Fleming
Queenstown and Arrowtown — H. N. Firth
Lawrence—H. J. Abel
Dunedin (for Hindon)—W. E. Sessions
Riverton—A. M. Eyes
Switzers—Thomas Mayne
Pembroke—A. E. Remer
Tapanui—F. S. Parker
Inspector—Lieut.-Colonel Arthur Hume, N.Z.M.
Clerk—T. E. Richardson
Gaolers — Auckland, George Sinclair Reston; Dunedin, Samuel Charles Phillips; Hokitika, Bartholomew Lloyd O'Brien; Invercargill, John Henry Bratby; Lyttelton, Matthew Michael Cleary; Napier, Francis Edward Severne; New Plymouth, Edward Rickerby; Wanganui, Robert T. Noble Beasley; Wellington, Patrick Samuel Garvey; Nelson, Thomas E. Pointon
Postmaster-General and Commissioner of Telegraphs—Hon. J. G. Ward.
Superintendent—C. Lemon, Ph.D.
Secretary—W. Gray
Inspector—T. Rose
Controller of Money — orders, Savings-banks, and Accountant—G. Gray
Assistant Inspector—J. Grubb
Chief Clerk—E. J. Goodman
Clerks—L. Halliwell, W. R. Morris, H. Plimmer, F. V. Waters, E. Y. Senn, J. C. Williamson, W. Beswick, G. Cenci, A. P. Dryden, L. Ledger, V. J. Brogan, W. Callaghan, G. W. Moorhouse, W. Chegwidden, H. S. B. Miller, H. Huggins, G. V. Hudson, F. Perrin, J. Brennan, H. Cornwall, R. J. Thompson, R. E. Hayes, D. A. Jenkins, J. C. Redmond, C. B. Harton, R. F. Smith, J. D. Avery, H. E. Duff, J. G. Roache, J. Coyle, F. W. Faber, W. H. Carter, J. J. Murray, E. Bermingham, C. Bermingham, S. Brock, W. Menzies, W. J. Drake, F. Menzies, C. A. Ferguson, E. Harris, B. Kenny, V. Johnston, M. A. McLeod
Electrician—W. C. Smythe
Mechanician—H. F. Smith
Storekeeper—J. Black
Assistant Storekeeper—C. B. Mann
Circulation Branch—J. Hoggard, Chief Clerk
Auckland—S. B. Biss
* Thames—J. E. Coney
* Gisborne—W. W. Beswick
Napier—S. J. Jago
* New Plymouth—F. D. Holdsworth
* Wanganui—J. F. McBeth
* Blenheim—J. G. Ballard
* Nelson—R. Kirton
* Westport—R. Tait
* Greymouth—H. Calders
* Hokitika—J. Bull
Christchurch—S. J. Dick
* Timaru—E. Cook
* Oamaru—J. A. Hutton
Dunedin—E. D. Butts
* Invercargill—J. W. Wilkin
Commissioner of Trade and Customs—Hon. J. Ballance
* These are combined post- and telegraph-Offices.
Minister of Marine—Hon. R. J. Seddon
Secretary and Inspector of Customs and Secretary of Marine—W. T. Glasgow
Chief Clerk, Customs—T. Larchin
Clerks, Customs—E. T. W. Maclaurin, C. H. Smith. Audit—H. W. Brewer. H. Crowther (Writer)
Auckland—A. Rose
Poverty Bay—D. Johnson, jun.
Napier—E. R. C. Bowen
Wellington—W. T. Glasgow
Wanganui—A. Elliott
Wairau—E. W. Pasley
Nelson—W. Heaps
Westport—J. Mills
Greymouth—A. McDowell
Hokitika—E. Chilman
Lyttelton and Christchurch—D. McKellar (E. Patten, Acting)
Timaru—A. Hart
Oamaru—R. Thompson
Dunedin—C. W. S. Chamberlain
Invercargill and Bluff Harbour—J. Borrie
Thames—T. C. Bayldon, Coastwaiter
Russell—W. J. Walsh, Officer in Charge
Tauranga—J. Sheath, Officer in Charge
Whangaroa—A. P. Ratcliffe, Coastwaiter
Whangarei—J. Munro, Coastwaiter
Mongonui—A. D. Clemett, Officer in Charge
Hokianga—G. Martin, Coastwaiter
Kaipara—J. C. Smith, Officer in Charge
Waitara—J. Cameron, Coastwaiter
New Plymouth—T. A. Murphy, Officer in Charge
Foxton—J. B. Imrie, Officer in Charge
Patea—M. J. Cleary, Officer in Charge
Picton—J. B. Gudgeon, Officer in Charge
Chatham Islands—F. J. W. Gascoyne, Sub-Collector
Assistant Secretary—L. H. B. Wilson
Senior Clerk—G. Allport
Nautical Adviser—R. Johnson
Clerk—J. J. D. Grix
Examiners of Masters and Mates—R. Johnson and R. A. Edwin, Com. R.N.
Weather Reporter—R. A. Edwin, Com. R.N.
Examiners of Masters and Mates, Auckland—T. C. Tilly and M. T. Clayton
Examiners of Masters and Mates, Lyttelton—R. L. Owen and F. D. Gibson
Examiners of Masters and Mates, Dunedin—W. Thomson and John Orkney
Engineer Surveyors, Examiners of Engineers, and Inspectors of Machinery, Auckland — W. J. Jobson and L. Blackwood
Engineer Surveyor, Examiner of Engineers, and Inspector of Machinery, Wellington—H. A. McGregor
Chief Inspector of Machinery, Engineer Surveyor, and Examiner of Engineers—W. M. Mowatt
Engineer Surveyor, Examiner of Engineers, and Inspector of Machinery, Christchurch—G. Croll
Engineer Surveyors, Examiners of Engineers, and Inspectors of Machinery, Dunedin—A. Crawford and R. Duncan
Master of S.S. “Hinemoa”—J. Fairchild
Commissioner—Hon. W. P. Reeves
Secretary for Stamps—C. A. St. G. Hickson
Chief Clerk and Accountant — H. O. Williams
Custodian and Issuer of Stamps—W. H. Shore
Record and Receiving Clerk — J. P. Murphy
Clerk—C. J. Sisson
Chief Stamper—C. Howe
Auckland—Thomas Hall
Gisborne—W. W. Beswick
Taranaki—W. Stuart
Hawke's Bay—E. Bamford
Wellington—C. A. St. G. Hickson
Wanganui —J. F. McBeth
Nelson—W. W. de Castro
Marlborough—A. Y. Sturtevant
Canterbury—E. Denham
Timaru—E. Cook
Otago—G. G. Bridges
Southland—F. G. Morgan
Westland—A. H. King
Auckland—T. Kissling
Taranaki—W. Stuart
Wellington—G. B. Davy
Hawke's Bay—E. Bamford
Nelson—L. Broad
Marlborough—J. Allen
Canterbury — J. M. Batham and E. Denham
Otago—H. Turton
Southland—F. G. Morgan
Westland—A. H. King
Auckland—Thomas Hall
Taranaki—W. Stuart
Wellington—G. B. Davy
Hawke's Bay—E. Bamford
Nelson—L. Broad
Marlborough—G. B. Davy
Canterbury—J. M. Batham
Otago—G. G. Bridges
Southland—F. G. Morgan
Westland—A. H. King
Minister of Education (administering also Native schools, industrial schools, and the institution for deaf-mutes)—Hon. W. P. Reeves
Secretary for Education and Inspector-General of Schools — Rev. W. J. Habens, B.A.
Chief Clerk—Sir E. O. Gibbes, Bart.
Clerks—F. K. de Castro. H. B. Kirk, M.A., W. H. Russell, R. H. Pope, F. L. Severne
Organising Inspector of Native Schools—James H. Pope. Assistant Inspector, H. B. Kirk, M.A.
Auckland—V. E. Rice, Secretary
Taranaki—E. Veale, Secretary
Wanganui—A. A. Browne, Secretary
Wellington—A. Dorset, Secretary
Hawke's Bay—G. T. Fannin, Secretary
Marlborough—J. Smith; Secretary
Nelson—S. Ellis, Secretary
Grey—E. T. Robinson, Secretary
Westland—J. Gammell, B.A., Secretary
Canterbury North—J. T. Colborne-Veel, M.A., Secretary
Canterbury South — J. H. Bamfield, Secretary
Otago—P. G, Pryde, Secretary
Southland—J. Neill, Secretary
Auckland—H. N. Garland, Secretary
Taranaki—E. Veale, Secretary
Wellington—W. H. Warren, Secretary
Hawke's Bay—W. Parker, Secretary
Marlborough—J. Smith, Secretary
Nelson—H. Hobden, Secretary
Westland—E. T. Robinson, Secretary
Canterbury—H. H. Pitman, Steward of Reserves
Otago—C. Macandrew, Secretary
Auckland Industrial School — G. P. Hogan, Manager
Auckland Girls' Industrial School—Miss S. E. Jackson, Manager
St. Mary's Industrial School, Ponsonby—Rev. G. M. Lenihan, Manager
Thames Orphanage—Thomas Fulljames, Manager
St. Joseph's Industrial School, Wellington—Rev. T. G. Dawson, Manager
St. Mary's Industrial School, Nelson—Rev. W. J. Mahoney, Manager
Burnham Industrial School (Canterbury)—T. Palethorpe, Manager
Caversham Industrial School (Otago)—E. Titchener, Manager
Inspector—Duncan MacGregor, M.A., M.B., C.M.
Medical Superintendent, Auckland Asylum—Gray Hassell, M.D.
Medical Superintendent, Christchurch Asylum—E. G. Levinge, M.B.
Medical Superintendent, Wellington Asylum—E. E. Fookes, M.B.
Medical Superintendent, Seacliff Asylum—F. T. King, M.B.
Superintendent, Hokitika Asylum — H. Gribben
Superintendent, Nelson Asylum—J. Morrison
Ashburn Ball, Waikari (private asylum)—Joint proprietors, Dr. Alexander and J. Hume
Minister of Labour—Hon. W. P. Reeves
Secretary—E. Tregear
Chief Clerk—James Mackay
Clerks—J. Lomas, V. L. Willeston
Native Minister—Hon. A. J. Cadman
Chief Clerk and Accountant—W. J. Morpeth
Translator—G. H. Davies
Interpreter—T. G. Poutawera
Clerks—A. T. Bate, Captain W. de R. Barclay, R. C. Sim, E. A. Welch
Waikato, &c., G. T. Wilkinson; Pokeno, Thomas Jackson, R.M.; Mangonui and Hokianga, Bay of Islands, Whangarei, and Kaipara, H. W. Bishop, R.M.; Tauranga and Opotiki, R. S. Bush, R.M.; Gisborne, James Booth, R.M.; Taranaki, W. Rennell; Middle Island, Alexander Mackay; Chatham Islands, Major F. J. W. Gascoyne, R.M.
Chief Judge—H. G. Seth-Smith
Judges — A. Mackay, D. Scannell, L. O'Brien, R. Ward, G. E. Barton, S. W. von Stürmer, W. E. Gudgeon
Registrars—Auckland, H. F. Edger; Gisborne, J. Brooking; Wellington, W. Bridson
Clerks and Interpreters—A. F. Puckey, H. D. Johnson, E. Hammond, J. W. Browne, A. H. Mackay, R. G. Fountain
Clerks—J. Mackenzie, R. Poraumati, H. C. Jackson, E. S. Withers
R. S. Bush, J. Booth, H. W. Bishop, T. Jackson, H. W. Northcroft, C. C. Kettle, G. A. Preece, W. Stuart, E. H. Carew, Major F. J. W. Grascoyne
Minister of Mines—Hon. R. J. Seddon
Under-Secretary for Mines—H. J. H. Eliott
Inspecting Engineer—H. A. Gordon
Clerks—T. H. Hamer, T. S. M. Cowie, H. E. Radcliffe
Thames and Auckland Districts — G. Wilson; Dunedin and Southland Districts—J. Gow; West Coast Districts, N. D. Cochrane
The Director of the Geological Survey of New Zealand; the Surveyor-General; the Inspecting Engineer of Mines; W. M. Mowatt, Chief Inspector of Machinery, Wellington; James Bishop, of Brunnerton; Thomas Brown, of Denniston; and William Shore, of Kaitangata
Same official members as above Board, with the following private members:—Thomas Dunlop, of Thames; Patrick Quirk Caples, of Reefton; George Casley, of Reefton
The Director of the Geological Survey of New Zealand is Chairman of both Boards.
Minister in Charge—The Hon. Minister of Mines
Director — Sir J. Hector, K.C.M.G., M.D., F.R.S.
Clerk, Curator, and Meteorological Observer for Wellington—R. B. Gore
Analyst—W. Skey
Assistant Geologist—Alexander McKay, F.G.S.
Draughtsman—C. H. Pierard
Astronomical Observer—T. King
Meteorological Observer, Auckland—T. F. Cheeseman, F.L.S.
Meteorological Observer, Dunedin—H. Skey
Minister for Public Works—-Hon. R. J. Seddon
Under-Secretary—H. J. H. Blow
Engineer-in-Chief—W. H. Hales
Resident Engineer (unattached)—P. S. Hay, M.A., M.Inst.C.E.
Accountant—G. J. Clapham
Record Clerk—H. W. H. Millais
Clerks—J. A. McArthur, H. Thompson, W. D. Dumbell, W. Butler, E. Horneman
Draughtsmen — J. Campbell, W. G. Rutherford
District Engineer — Dunedin, E. R. Ussher, M.Inst.C.E.
Resident Engineers — Auckland, C. R. Vickerman; Te Aroha, G. Fitzgerald; Wellington, G. L. Cook, M.Inst.C.E.; Hunterville, R. W. Holmes; Greymouth, T. H. Rawson; Westport, J. A. Wilson, jun.
Assistant Engineers—W. A. Shain, A. C. Koch, H. Macandrew, J. J. Hay, M.A., W. H. Gavin, J. W. Richmond
Clerks and Draughtsmen — W. Black, C. T. Rushbrook, C. Wood, J. Young, A. R. Stone, J. Meenan
Commissioners — Messrs. J. McKerrow (Chief), J. P. Maxwell, M.Inst.C.E., W. M. Hannay
Secretary—E. G. Pilcher
Clerks—T. W. Waite, J. F. Bell, C. Isherwood, J. A. Tripe, B.A., F. S. Pope, J. E. Widdop
Audit Inspectors—H. Baxter, C. Wallnutt, D. Munro, C. L. Russell
Railway Accountant—A. C. Fife
Clerks—H. Davidson, G. G. Wilson, M. C. Rowe, J. H. Davies, S. P. Curtis, J. McLean, E. Davy, R. Allen, V. Jänisch, A. Morris, E. P. Brogan, W. F. Ambler, F. Hardwick, E. J. Fleming, R. J. Loe, F. W. Lash, A. H. Hunt, W. Bourke, J. M. O'Brien, E. Nicholson
Stores Manager—R. Carrow
Clerks—G. Pelton, R. E. Mackay, A. M. Heaton, J. Webster, J. E. Hasloch, L. G. Porter, W. B. Dyer, E. J. Maguinness
District Managers — Whangarei, H. B. Dobbie; Kawakawa, J. D. Harris; Auckland, C. Hudson; Wanganui (Traffic Agent), H. Buxton; Napier (Traffic Agent), A. Garstin; Wellington (Traffic Agent), B. Dawson; Greymouth, T. Ronayne; Westport, T. A. Peterkin; Nelson, F. W. Maclean; Picton, H. St. J. Christophers; Christchurch, W. H. Gaw; Dunedin, A. Grant; Invercargill, S. P. Whitcombe
Chief Engineer for Working Railways— J. H. Lowe, M.Inst.C.E.
Resident Engineers—Auckland, J. Coom; Wanganui, C.B. Hankey; Wellington-Napier, W. R. Carruthers; Christchurch, James Burnett; Dunedin, T. C. Maltby; Invercargill, J. I. Lawson
Locomotive Superintendent—T. F. Rotheram
Locomotive Engineers—Auckland, H. H. Jackson; Wellington and Napier-Taranaki, A. L. Beattie; Hurunui-Bluff, A. V. Macdonald
Minister of Defence—Hon. R. J. Seddon
Under — Secretary — Lieut. — Colonel A. Hume (acting)
Clerk—H. S. Royle
Major F. Y. Goring
Major W. B. Messenger
Major A. P. Douglas
Captain H. C. Morrison
Captain J. Coleman
Lieutenant J. E. Hume
Commissioner — Lieutenant — Colonel A. Hume
Clerks—J. M. Goldfinch, John Evans, John Tasker
Minister of Lands and Immigration—Hon. J. McKenzie
Secretary for Crown Lands and Surveyor-General—S. Percy Smith
Superintending Surveyor and Under-Secretary for Crown Lands—Alexander Barron
Chief Draughtsman—F. W. Flanagan
Draughtsmen — J. W. Kemp, G. P. Wilson, H. McCardell, T. M. Grant, H. A. R. Farquhar, A. Haylock, D. Watt
Chief Clerk—W. S. Short
Clerks—F. Samuel, J. B. Redward, F. T. O'Neill, A. A. S. Danby, H. M. Gore, J. K. Johnston, E. H. Hawthorne
Accountant—F. Bull
Bookkeeper—P. C. Willson
Photo-lithographer—D. Ross
Litho-printers—J. Craig, J. Conlin, F. Caulton, S. Smith, G. Jordan, H. Clark
Road Surveyors —C. W. Hursthouse, G. T. Murray, R. H. Reaney
Superintendent of Settlements—J. E. March
Chief Surveyor and Commissioner of Crown Lands—G. Müeller
Chief Draughtsman—W. C. Kensington
District Surveyors—P. Simpson, L. Cussen, J. Baber, jun., G. A. Martin
Chief Surveyor and Commissioner of Crown Lands—T. Humphries
District Surveyors—E. C. Cold Smith, J. Hay
Chief Surveyor and Commissioner of Crown Lands—-Sidney Weetman
District Surveyor—H. M. Skeet
Assistant Surveyor-General and Commissioner of Crown Lands—J. H. Baker
District Surveyors — L. Smith, J. D. Climie, W. D. B. Murray
Chief Surveyor and Commissioner of Crown Lands—J. S. Browning
District Surveyors—J. A. Montgomerie, F. S. Smith
Chief Surveyor and Commissioner of Crown Lands—H. G. Clark
District Surveyor—R. F. Goulter
Chief Surveyor and Commissioner of Crown Lands— J. H. Strauchon
District Surveyor—W. G. Murray
Chief Surveyor and Commissioner of Crown Lands—J. W. A. Marchant
District Surveyors—J. S. Welch, T. N. Broderick
Commissioner of Crown Lands—J. Maitland
Chief Surveyor—C. W. Adams
District Surveyors—D. Barron, J. Langmuir, E. H. Wilmot
Chief Surveyor and Commissioner of Crown Lands—G. W. Williams
District Surveyor—John Hay
Officer in Charge—P. Sheridan
Land Purchase Officers—W. J. Butler, G. T. Wilkinson
Auckland—G. Müeller, W. P. Moat, R. J. Gill, E. Lake, L. J. Bagnall
Hawke's Bay—T. Humphries, R. Harding, W. W. Carlile, T. Hallett, C. Hall
Taranaki—S. Weetman, T. Kelly, A. Standish, J. Livingston, G. A. Marchant
Wellington — J. H. Baker, W. W. McCardle, W. A. Fitzherbert, A. W. Hogg
Marlborough—H. G. Clark, G. Dodson, A. S. Collins, A. P. Seymour
Nelson—J. S. Browning, F. Hamilton, R. Hursthouse. J. Kerr
Westland — J. Spence, J. Bevan, L. Northcroft, A. Matheson
Canterbury — J. W. A. Marchant, D. McMillan, W. Kitson, W. C. Walkerl
Otago—J. P. Maitland, H. Clark, W. Dallas, J. Duncan, J. W. Thomson
Southland — G. W. Williams, T. Denniston, C. Cowan, A. Kinross
Minister in Charge—Hon. John McKenzie
Secretary of Agriculture and Chief Inspector of Stock— John D. Ritchie
Chief Clerk—Richard Evatt
Veterinary Surgeon—John F. McClean
Dairy Instructor—John Sawers
Fruit Expert—Lionel Hanlon
Auckland—E. Clifton (in charge), F. Schaw, Auckland; G. S. Cooke, Whangarei; W A. P. Sutton, Hamilton.
Napier—J. Drummond (in charge), H. Oldham, Napier; C. Thomson, Gisborne; D. Munro, Waimata, Herbertville
Wellington-West Coast—J. W. Smith, J. Harvey, jun., Masterton; Richard Hull, Wanganui; A. Monro, Hawera
Marlborough-Nelson—T. G. Richardson (in charge), H. M. Campbell, Nelson; John Moore, Blenheim
Canterbury-Kaikoura—R. F. Holderness (in charge), J. E. Thomson, Christchurch; C. A. Cunningham, Rangiora; W. A. Scaife, Waiau; W. G. Rees, Ashburton; A. Douglass (in charge), Timaru; H. S. Thomson, Lake Tekapo; C. C. Empson, Kurow
Otago—E. A. Dowden, Dunedin; B. Fullarton, Mosgiel; W. Miller, Oamaru; A. Ironside, Clyde; J. C. Miller, Naseby; R. H. Hassall, Tapanui, H. G. J. Hull, Balclutha; H. T. Turner, Invercargill; J. W. Raymond, Bluff
Commissioner—J. H. Richardson
Assistant Commissioner—D. M. Luckie, F.S.S.
Actuary—Morris Fox
Secretary—W.B. Hudson
Chief Medical Officer — J. Henry, L.R.C.P., Lond., &c.
Accountant—R. J. S. Todd
Assistant Actuary—G. Leslie
Chief Clerk—G. W. Barltrop
Assistant Accountant—J. H. Dean
Clerks—R. C. Niven, J. C. Young, G. A. Kennedy, D. J. McG. McKenzie, W. S. Smith, J. W. Kinniburgh, R. V. Blacklock, A. H. Hamerton, G. Crichton, G. G. Schwartz, R.T. Smith, G. von Schoen, A. R. Kennedy, T. L. Barker, C. E. Galwey, J. A. Thomson, P. Muter, F. B. Bolt, F. K. Kelling, A. D. Ellis, M. J. Heywood, H. S. Manning, L. B. Jordan, A. de Castro, E. J. Gormley, F. M. Leckie, G. D. Gardner, C. W. Palmer, R. P. Hood, W. C. Marchant, J. B. Young, H. Rose
Chief Messenger—W. Archer
Public Trustee—J. K. Warburton
Solicitor—F. J. Wilson
Chief Clerk—A. A. Duncan
Accountant—E. F. Warren
Examiner—T. S. Ronaldson
Clerks—T. T. Stephens, F. H. Morice, H. Beyer, T. D. Kendall, W. A. Fordham, F. Hyde, H. Oswin, E. C. McCarthy, P. Fair
Messenger—A. J. Cross
District Agent, Christchurch—J. J. M. Hamilton
West Coast Settlement Reserves Trustee—Wilfred Rennell
Clerks—A. Grant, Alfred Trimble.
PAID BY THE GOVERNMENT OF NEW ZEALAND, AS ON 31st MARCH, 1892.
[By an Act passed in 1871 the pension system was abolished in New Zealand.]
| * Per diem. | |||
|---|---|---|---|
| Under “The Civil Service Act, 1866.” | |||
| £ | s. | d. | |
| Allan, A. S. | 195 | 5 | 0 |
| Arrow, H. | 26 | 0 | 0 |
| Aubrey, H. R. | 223 | 6 | 8 |
| Austin, A.D. | 247 | 10 | 0 |
| Baddeley, H. C. | 225 | 0 | 0 |
| Bailey, B. | 198 | 13 | 9 |
| Barker, E. | 214 | 17 | 1 |
| Barnard, W. H. | 101 | 18 | 1 |
| Barr, A | 366 | 13 | 4 |
| Batkin, C.T. | 533 | 6 | 0 |
| Bicknell, F. | 96 | 13 | 4 |
| Blomfield, J. | 101 | 15 | 0 |
| Buchanan, J. | 127 | 13 | 6 |
| Bowron, G. | 89 | 18 | |
| Brewer, H. N | 124 | 7 | 6 |
| Brown, S. P. | 80 | 0 | 0 |
| Bull, E. | 105 | 14 | 3 |
| Burn, J. F. | 51 | 0 | 0 |
| Burgess, A | 116 | 13 | 4 |
| Campbell, F. E. | 466 | 13 | 0 |
| Carrington, O. | 300 | 0 | 0 |
| Chapman, R. | 255 | 19 | 0 |
| Cheeseman, W. F. | 154 | 15 | 1 |
| Clarke, H. T. | 400 | 0 | 0 |
| Clarke, H. | 98 | 13 | 0 |
| Corbett, W. | 273 | 4 | 0 |
| Creeke, W. | 52 | 15 | 8 |
| Crowe, A. | 68 | 12 | 3 |
| Culpan, W. | 62 | 10 | 0 |
| Cunningham, J. | 175 | 0 | 0 |
| Cunningham, P. | 65 | 11 | 11 |
| Curry H. | 65 | 0 | 0 |
| Daniell, H. C. | 266 | 12 | 4 |
| Dickey, A. J. | 122 | 0 | 5 |
| Earle, J. | 104 | 10 | 0 |
| Eliott, G. E. | 400 | 0 | 0 |
| Fenton, F. D. | 630 | 19 | 0 |
| Frazer, D. | 100 | 0 | 0 |
| Gill, R. J. | 228 | 11 | 5 |
| Gisborne, W. | 466 | 13 | 4 |
| Goring, F. | 150 | 0 | 0 |
| Graham, G. H. | 50 | 10 | 0 |
| Gregory, J. | 53 | 6 | 8 |
| Greenway, J. H. | 116 | 16 | 0 |
| Halliday, C. | 96 | 13 | 4 |
| Hamilton, M. | 200 | 0 | 0 |
| Harsant, W. | 151 | 13 | 4 |
| Hart, J. T. | 193 | 7 | 0 |
| Hartwright, H. | 152 | 7 | 8 |
| Hill, E. | 100 | 0 | 0 |
| Holden, T. | 31 | 5 | 0 |
| Johnston, D. | 366 | 13 | 4 |
| Judd, A. | 173 | 6 | 8 |
| Keetley, E. | 18 | 12 | 10 |
| Kelly, J. D. | 130 | 19 | 0 |
| Laing, E. B. | 112 | 10 | 0 |
| Lawlor, H. C. | 130 | 18 | 0 |
| Lewis, D. | 266 | 13 | 4 |
| Lincoln, R. S. | 68 | 17 | 0 |
| Lockwood, W. H. | 22 | 18 | 4 |
| Lodge, W. F. | 185 | 0 | 0 |
| Lusher, R. A. | 76 | 16 | 8 |
| McArthur, J. | 65 | 0 | 0 |
| Marshall, C. | 125 | 0 | 0 |
| Mathews, J. | 81 | 13 | 4 |
| Mathison, J. W. | 23 | 6 | 8 |
| Meech, W. | 64 | 16 | 7 |
| Meikle, A. M. | 145 | 14 | 3 |
| Mills, W. | 385 | 14 | 4 |
| Mitford, G. M. | 196 | 15 | 0 |
| Monson, J. R. | 271 | 16 | 0 |
| Monro, H. A. H. | 342 | 17 | 2 |
| Morrow, H. | 120 | 16 | 8 |
| McCarthy, S. | 55 | 16 | 8 |
| McCulloch, H. | 233 | 6 | 0 |
| McDonnell, R. T. | 150 | 0 | 0 |
| Ollivier, J. | 250 | 0 | 0 |
| Parker, T. W. | 242 | 3 | 9 |
| Parris, R. | 314 | 5 | 8 |
| Pauling, G. W. | 91 | 1 | 5 |
| Pearson, W. H. | 340 | 9 | 0 |
| Pickett, R. | 209 | 10 | 6 |
| Pinwell, A. | 120 | 17 | 0 |
| Pitt, H. | 100 | 0 | 0 |
| Plimpton, R. E. E. | 110 | 14 | 3 |
| Pollen, D. | 418 | 15 | 0 |
| Rogan, J. | 466 | 13 | 4 |
| Rough, D. | 277 | 1 | 8 |
| Sealy, H. B. | 285 | 14 | 3 |
| Searancke, W. N. | 240 | 0 | 0 |
| Sheath, A. B. | 129 | 9 | 0 |
| Shrimpton, J. | 146 | 14 | 0 |
| Sinclair, A. | 195 | 0 | 0 |
| Smith, J. E. | 484 | 11 | 6 |
| Smith, T. H. | 371 | 8 | 7 |
| Snodswell, T. | 83 | 14 | 0 |
| Snow, C. H. | 157 | 10 | 0 |
| Stewart, J. T. | 300 | 0 | 0 |
| Thomas, W. E. | 145 | 16 | 8 |
| Thomas, G. W. | 38 | 15 | 0 |
| Tidmarsh, W. | 69 | 7 | 3 |
| Tizard, E. P. | 180 | 19 | 0 |
| Tucker, W. | 104 | 13 | 4 |
| Veal, J. | 49 | 15 | 3 |
| Veale, J. S. | 56 | 2 | 10 |
| Warde, C. M. | 186 | 13 | 0 |
| Wardell, H. S. | 366 | 13 | 0 |
| Wayland, J. M. | 205 | 1 | 2 |
| White, W. | 36 | 5 | 0 |
| White, W.B. | 375 | 4 | 9 |
| Wilkin, J. T. W. | 127 | 19 | 4 |
| Wilcocks, E. S. | 250 | 0 | 0 |
| Williams, E. M. | 135 | 0 | 0 |
| Wilson, W.W. | 100 | 14 | 3 |
| Wrigg, H. C. W. | 157 | 2 | 10 |
| Young, W. | 350 | 0 | 0 |
| Under “The Hamerton Pènsion Act, 1891.” | |||
| Hamerton, R. C. | 250 | 0 | 0 |
| Under “The Meredith and Others Pensions Act, 1870.” | |||
| Collins, M. | 65 | 0 | 0 |
| Hamlin, E. B. | 50 | 0 | 0 |
| Meredith, E. | 46 | 0 | 0 |
| Under “The Military Pensions Act, 1866.” | |||
| Arapera te Reo | 20 | 0 | 0 |
| Brown, M. R. | 75 | 0 | 0 |
| Buck, C. M. | 70 | 0 | 0 |
| Hastings, L. | 55 | 0 | 0 |
| Iritona, Hanita | 12 | 0 | 0 |
| Marara, Ngakoa | 36 | 0 | 0 |
| McDonald, E. | 36 | 0 | 0 |
| Mere Karaka Kopu | 36 | 0 | 0 |
| Morrison, A. | 36 | 0 | 0 |
| Russell, C. | 36 | 0 | 0 |
| Von Tempsky, A. | 120 | 0 | 0 |
| Adamson, T. | 0 | 2 | 2* |
| Beamish, I. G. | 0 | 1 | 6* |
| Coffey, M. F. | 25 | 0 | 0 |
| Corbett, G. | 0 | 2 | 0* |
| Crawford, C. F. | 0 | 2 | 0* |
| Crosby, H. | 0 | 2 | 0* |
| Dore, G. H. | 0 | 2 | 0* |
| Gibbons, M. C. | 0 | 2 | 2* |
| Hamblyn, J. | 0 | 2 | 2* |
| Hope, E. L. | 0 | 1 | 6* |
| Kelly, T. | 0 | 2 | 2* |
| Kershaw, P. | 0 | 1 | 6* |
| Lacey, G. | 0 | 2 | 2* |
| Lake, T. | 0 | 2 | 6* |
| Lloyd, T. | 0 | 2 | 0* |
| McDonnell, W. | 150 | 0 | 0 |
| McKay, G. | 0 | 1 | 0* |
| McMahon, T. | 0 | 2 | 0* |
| Monck, J. B. | 0 | 1 | 0* |
| Percy, J. A. | 150 | 0 | 0 |
| Ross, E. O. | 75 | 0 | 0 |
| Shanaghan, J. | 0 | 1 | 6* |
| Shepherd, R. | 0 | 2 | 9* |
| Timms, W. | 0 | 1 | 6* |
| Tuffin, G. | 0 | 2 | 2* |
| Vance, P. | 0 | 2 | 2* |
| Walsh, W. | 0 | 1 | 6* |
| Wasley,— | 0 | 2 | 2* |
| Williamson, — | 0 | 2 | 0* |
| Anaru Patapu | 0 | 0 | 9* |
| Anaru Taruke | 0 | 0 | 6* |
| Apera te Kengua | 0 | 2 | 6* |
| Hemi Tongamu | 0 | 1 | 0* |
| Hone Parake | 0 | 0 | 6* |
| Karena Ruataniwha | 0 | 1 | 0* |
| Matiu Whitiki | 0 | 0 | 6* |
| Mauparoa | 0 | 1 | 0* |
| Mehaka Kepa | 0 | 0 | 9* |
| Pera Taitanui | 0 | 1 | 0* |
| Ruihana | 0 | 0 | 6* |
| Ramera Ngoto | 0 | 0 | 6* |
| Under “The Militia Act Amendment Act, 1862.” | |||
| Bending, W. | 0 | 2 | 0* |
| Bilton, F. | 0 | 2 | 0* |
| Collaghan, D. | 0 | 2 | 2* |
| Cody, W. | 0 | 1 | 0* |
| Dunn, A. J. N. | 0 | 2 | 0* |
| Hereford, A. | 130 | 0 | 0 |
| King, E. M. | 80 | 0 | 0 |
| Leaf, R. | 0 | 0 | 6* |
| Oxenham, W. | 0 | 1 | 6* |
| Sarten, L. | 0 | 2 | 0* |
| Skinner, W. H. | 0 | 2 | 6* |
| Vickery, W. | 0 | 2 | 0* |
| Woolf, T. | 0 | 2 | 0* |
| Under “The Nixon Pension Act, 1865.” | |||
| Sisters of the late Colonel Nixon | 150 | 0 | 0 |
| Under “The Schafer, McGuire, and Others Pensions Act, 1872.” | |||
| McGuire, E. | 0 | 1 | 0* |
| Russell, W. | 0 | 1 | 0* |
| Schafer, C. | 30 | 0 | 0 |
| Under “The Supreme Court Judges Act, 1874.” | |||
| Gresson, H. B. | 750 | 0 | 0 |
| Under “The Walsh and Other Pensions Act, 1867.” | |||
| Hewitt, E. A. | 50 | 0 | 0 |
The Minister of Justice is charged with all matters relating to the Supreme, District, Resident Magistrates, and Wardens' Courts, Crown Law Office, Coroners' inquests, patents, designs, and trademarks, bankruptcy, criminal prosecutions in the higher Courts, Justices of the Peace, Licensing Committees, and prisons. Circuit sittings of the Supreme Court are held at fourteen places, and offices of the Court are maintained at eleven places. There are five District Court Judges, who hold Courts at seventeen towns. At nearly every town in which sittings of the Supreme and District Courts are held there is a Crown Prosecutor, paid by fees, and a Sheriff.
There are twenty-eight salaried Resident Magistrates, who hold Courts at about one hundred and fifty-four places. Ten of these gentlemen are also Wardens, holding Wardens' Courts in the various goldfields. There are fifty-two civilian Clerks of Courts, and seventy-six who are also police sergeants or constables.
All the Resident Magistrates hold the office of Coroner, and are paid 10s. 6d. for each inquest, in addition to mileage at 1s. per mile, or actual expenses of locomotion. Besides these, there are thirty-four Coroners, who are paid £1 1s. for each inquest, and mileage.
Bankrupt estates are cared for by four Official Assignees, stationed at Auckland; Wellington, Christchurch, and Dunedin; and by nineteen Deputy Assignees, resident at as many other towns. The new Bankruptcy Act will abolish the distinction between Assignees and Deputy Assignees, and there will then probably be about a dozen Assignees. The Supreme and District Courts have jurisdiction in bankruptcy proceedings. It is proposed, in the new Act, to confer bankruptcy jurisdiction in small estates on some of the Resident Magistrates' Courts.
The Commission, of the Peace contains about seventeen hundred names, and additions are frequently made.
Witnesses in Criminal Courts are paid 6s. per diem, and in addition 4s. for every night they are absent from home. Witnesses in civil cases are paid variously from 6s. to £1 1s. a day, according to their; condition in life.
Intestate estates in New Zealand are dealt with by the Public Trust Office, and are referred to in the article on that institution.
The Native Land Court is an institution for the purpose of enabling Maoris to obtain legal titles to their lands. Its constitution and mode of procedure are referred to in the special article on the numbers-and present condition of the Maoris.
Table of Contents
- MILITIA AND VOLUNTEER DISTRICTS.
- PERMANENT MILITIA.—ARTILLERY.
- PERMANENT MILITIA.—TORPEDO CORPS.
- VOLUNTEERS.—CAVALRY
- VOLUNTEERS.—MOUNTED RIFLES.
- VOLUNTEERS.—NAVAL ARTILLERY.
- VOLUNTEERS.—FIELD ARTILLERY.
- VOLUNTEERS.—ENGINEERS.
- VOLUNTEERS.—RIFLE CORPS.
- VOLUNTEERS.—CADET CORPS.
- ORDNANCE, ARMS, ETC.
- ENROLMENT, ETC.
- INSTRUCTORS.
- CAPITATION.
- ADMINISTRATION.
The defence forces consist of the Permanent Militia, Artillery, and Torpedo Corps; and the auxiliary force, of Volunteers, Cavalry, Naval Artillery, Field Artillery, Engineers, and Rifle companies. The whole of these Forces are commanded by an Imperial officer, belonging to the Royal Artillery, who is under the orders of the Defence Minister. There is also an Under-Secretary for Defence, to whom all questions of expenditure are referred; while an engineer has charge of the defence-works, under the designation of Engineer for Defences.
The two islands are divided into eleven districts, commanded by a Field Officer of Militia or Volunteers, with a competent staff of drill-sergeants.
This Force is divided into four batteries, which are stationed at Auckland, Wellington (head-quarters), Lyttelton, and Dunedin; and their principal duties are to look after and take charge of all guns, stores, ammunition, and munitions of war at these four centres. The Force consists of three majors, two captains, one subaltern, with an establishment of 144 of all ranks.
This branch, like the Artillery, is divided amongst the four centres, for submarine and torpedo work, and consists of two captains, with a total of 64 of all ranks. They have charge of four torpedo-boats and four steam-launches, and all submarine-mining and torpedo-stores. They are all extensively employed in blowing up rocks and wrecks, and generally improving harbours.
There are five troops of Cavalry, three in the North Island and two in the Middle Island. These corps are kept in a state of efficiency by going into camp for eight days' training annually. The total strength of the five troops is 133 of all ranks.
There are ten corps of Mounted Rifles, seven in the North Island and three in the Middle Island, with a total strength of 538 of all ranks. The efficiency of these corps is, like the Cavalry, maintained by their going into camp for an annual training of eight days.
There are seventeen batteries of this branch of the service, seven in the North Island and ten in the Middle Island, having a total strength of 1,164 of all ranks. These corps are divided into port and starboard watches, and one watch is trained to assist the Permanent Artillery in working the heavy ordnance, while the other watch is trained in submarine and torpedo work, as auxiliaries to the Torpedo Corps. These corps have cutters and other boats provided and kept up for them, and are instructed in rowing, knotting, splicing, signalling, and such-like duties.
There are eleven batteries of Field Artillery, three in the North Island and eight in the Middle Island, with a total of 594 of all ranks. They are armed with 6-, 9-, and 12-pounder Armstrong breech-loading rifled guns on field-carriages.
This branch consists of three corps, with a total of 160 of all ranks. There is one corps in the North Island and two corps in the Middle Island. Besides carrying rifles, they are provided with entrenching tools, and all appliances for blowing up bridges or laying land-mines.
In this branch, of the service there are sixty-two corps, nineteen being in the North Island and forty-three in the Middle Island, with a total strength of 3,443 of all ranks, which includes garrison bands at places where four or more corps have their head-quarters.
There is a force of thirty-seven cadet corps—viz., seven in the North Island and thirty in the Middle Island, with a total strength of 2,085 of all ranks.
The armament at the forts of she four centres consists of 8in. 13-ton breech-loading rifled Elswick Ordnance Company's guns, with 6in. 5-ton of like pattern, and the whole mounted on hydro-pneumatic disappearing carriages; 7in. 7-ton muzzle-loading rifled guns, on traversing slides; 64-pounder rifled muzzle-loading converted 71cwt. guns, on garrison standing carriages and traversing slides; 64-pounder rifled muzzle-loading 64cwt. guns on traversing slides; 6-pounder quick-firing Nordenfeldts, on garrison pillar-mountings, and field-carriages; and Hotchkiss and Maxim quick-firing guns. The Volunteer Field Artillery are armed with 6-, 9-, and 12-pounder Armstrong breech-loading rifled guns, and the whole of the Force have carbines or rifles (short) of Snider pattern.
There is a large stock of Whitehead torpedoes, contact- and ground-mines, in charge of the Torpedo Corps, as well as four Thorneycroft torpedo-boats.
The Permanent Militia are enrolled for five years' service, and Volunteers for one year. The Permanent Militia is recruited from men who have one year's efficient service in the Volunteers; and after two years' service in the Permanent Militia men are eligible for transfer to police and prison service.
The Instructors for Permanent Artillery and Torpedo Corps are obtained from the School of Gunnery at Shoeburyness, and from the Royal Engineers, and receive a five years' engagement, alter completing which they return to the Royal Artillery or the Royal Engineers.
An annual capitation of £2 is granted to each efficient Volunteer, and a sum not exceeding £25 to each efficient cadet corps. One hundred rounds of Snider ball-cartridge are issued each year free to every efficient Volunteer, and twenty-five rounds to each efficient cadet.
The defence forces of New Zealand are administered under “The Defence Act, 1886.”
| EXPENDITURE ON THE ESTABLISHMENT AND MAINTENANCE OF DEFENCES FROM 1884-85 TO 1891-92. | |||
|---|---|---|---|
| Year. | Military Expenditure. | Harbour Defences. | Total. |
| £ | £ | £ | |
| 1884-85 | 90,810 | 9,001 | 100,417 |
| 1885-86 | 91,242 | 127,167 | 218,409 |
| 1886-87 | 89,927 | 139,429 | 229,356 |
| 1887-88 | 122,061 | 73,458 | 195,519 |
| 1888-89 | 53,591 | 50,089 | 103,680 |
| 1889-90 | 63,614 | 15,752 | 79,366 |
| 1890-91 | 80,891 | 10,798 | 91,689 |
| 1891-92 | 75,343 | 7,644 | 82,987 |
Table of Contents
[The progress of the colony from the beginning is shown in the statistical broadsheets following the Appendix.]
The population of the Colony of New Zealand was ascertained by the census of the 5th April, 1891, to be as under:—
| Males. | Females. | Total. | |
|---|---|---|---|
| Population (excluding Maoris) | 332,877 | 293,781 | 626,658 |
| Maoris | 22,835 | 19,118 | 41,953 |
| Morioris at Chatham Islands | 26 | 14 | 40 |
| Totals | 355,738 | 312,913 | 668,651 |
Of the total population, 4,944 persons—2,588 males and 2,356 females—were ascertained to be half-castes: 2,184 of these were half-castes living amongst and as Europeans, while 2,760 were found to be living with Maoris. The Maori population given above includes 251 Maori wives married to European husbands.
The Chinese population amounted to 4,444 persons, of whom 18 were females.
The following gives the number of the population of the principal divisions of the colony, according to the census:—
| North Island and adjacent islets, exclusive of Maoris | 281,455 |
| Middle Island, Stewart Island, and adjacent islets, exclusive of Maoris | 344,913 |
| Chatham Islands (exclusive of Natives) | 271 |
| Kermadec Islands | 19 |
| Total for the colony (exclusive of Maoris) | 626,658 |
Of the population, 53·09 per cent. were found to be males, and 46·91 females. In 1881 the proportions were 54·98 and 45·02 respectively; and in 1871, 58·62 per cent. and 41·38 per cent., the equalisation of the sexes progressing with the advance of time.
The proportion of females to males is greater in New Zealand than in Queensland, New South Wales, and Western Australia, but less than in Victoria, South Australia, and Tasmania.
| Females to every 100 Males at Census 1891. | |
|---|---|
| Queensland | 76·04 |
| New South Wales | 84·12 |
| Victoria | 90·16 |
| South Australia | 92·33 |
| Western Australia | 66·79 |
| Tasmania | 89·10 |
| New Zealand | 88·25 |
The dwellings of the people were found to be 119,766 occupied, 9,558 unoccupied, 425 building, besides 4,085 tents and dwellings with canvas roofs.
The British subjects were 612,064 in number, and the foreign subjects 14,594, or 97·67 and 2·33 per cent. of the population respectively.
The returns of birthplaces gave the following particulars:—
| Born in. | Persons. | Per Cent, of Population. |
|---|---|---|
| New Zealand | 366,716 | 58·61 |
| Australian Colonies | 15,943 | 2·55 |
| England | 117,070 | 18·71 |
| Wales | 2,214 | 0·35 |
| Scotland | 51,916 | 8·30 |
| Ireland | 47,034 | 7·61 |
| Other British dominions, and at sea | 4,998 | 0·80 |
| Foreign countries | 19,150 | 3·07 |
| Unspecified | 1,017 | .. |
| Total | 620,658 | 100·00 |
The New-Zealand-born population increased between 1886 and 1891 at the rate of 22·16 per cent., but the population born in the Mother-country, Australian Colonies, other British dominions, and foreign parts diminished in each case more or less during the quinquennium.
The total population of all ages increased between 1886 and 1891 at the rate of 8·33 per cent. The males increased 6·62 per cent., and females 10·34 per cent.
The following shows the number of males and females at each of the age-periods stated, and the proportion of persons at each age-period to the 100 of population at all ages, at the last census:—
| Ages. | Males. | Females. | Total Persons. | Proportion of Persons at each Age-period to every 100 of Population of specified Ago. |
|---|---|---|---|---|
| Under 5 years | 42,259 | 40,945 | 83,204 | 13·30 |
| 5 and under 10 years | 43,494 | 42,586 | 86,080 | 13·76 |
| 10 and under 15 years | 40,755 | 40,329 | 81,084 | 12·96 |
| 15 and under 21 years | 38,577 | 39,231 | 77,808 | 12·44 |
| 21 and under 40 years | 88,577 | 78,604 | 167,181 | 26·72 |
| 40 and under 55 years | 51,553 | 35,190 | 86,743 | 13·86 |
| 55 and under 65 years | 18,630 | 10,618 | 29,248 | 4·67 |
| 65 and upwards | 8,336 | 6,006 | 14,342 | 2·29 |
| Unspecified | 696 | 272 | 968 | .. |
| Totals | 332,877 | 293,781 | 626,658 | 100·00 |
Comparing the population at various age-periods in 1891 with the numbers as in 1886 it was found that the number under five years of age had decreased 4·17 per cent. At all previous census-periods an increase had been observed; but when it is borne in mind that the birth-rate fell with annual regularity from 34·35 in 1885 to 29·01 per 1,000 living in 1891, and that the actual number of births registered fell from 19,693 in 1885 to 18,273 in 1891, the results of the 1891 census are found to be just what might be expected. The number living under one year was 16,443 by the census; and the number of births in 1890, less the deaths of infants, was 16,840, thus nearly approximating to the census figures for those living under one year of age.
At all other periods of age, and on each sex, the census of 1891 shows an increase when compared with 1886; but. the increase in the males at the period 40-55 (a most valuable period for supporting the dependent population) is found to be only 1·42 per cent., and at the period 21-40 only 2·96 per cent., the increase at all ages being 6·62 per cent. on the males.
The proportions living at various age-periods show that 13·30 per cent. of the population were under five years, the percentage having fallen from 16·84 per cent. in 1881; and that at the period 65 and upwards the figures increased from 1·41 per cent. in 1881 to 2·29 per cent. in 1891.
The returns of religions showed that 81·03 per cent. of the people belonged to various Protestant denominations; 13·96 were Roman Catholics; and the remainder belonged to other sects, were of no denomination, or objected to state their religious views. The proportion of Roman Catholics is much greater in Australia than in New Zealand.
The subjoined table gives a summary of the results of the census of 1891, as to the religions of the people, with the proportion of each denomination to the whole population at that and each of the three previous censuses:—
| Demomination. | Number of Adherents in 1891. | Proportionsper Cent, of Population. | |||
|---|---|---|---|---|---|
| 1878. | 1881. | 1886. | 1891. | ||
| * In calculating the proportions for 1891 the “Unspecified” have not been taken into account. | |||||
| Church of England, and Protestants (undefined) | 253,331 | 42·55 | 41·50 | 40·17 | 40·51 |
| Presbyterians | 141,477 | 22·95 | 23·08 | 22·59 | 22·62 |
| Wesleyan Methodists | 53,061 | 7·79 | 8·07 | 7·81 | 8·49 |
| Other Methodists | 10,354 | 1·35 | 1·46 | 1·74 | 1·65 |
| Baptists | 14,825 | 2·21 | 2·34 | 2·48 | 2·37 |
| Congregational Independents | 6,685 | 1·34 | 1·38 | 1·35 | 1·07 |
| Lutherans | 5,616 | 1·36 | 1·18 | 1·02 | 0·90 |
| Salvation Army | 9,383 | .. | .. | 0·91 | 1·50 |
| Society of Friends | 315 | 0·04 | 0·05 | 0·05 | 0·05 |
| Unitarians | 308 | 0·11 | 0·10 | 0·08 | 0·05 |
| Other Protestants | 11,295 | 1·08 | 1·26 | 1·55 | 1·82 |
| Roman Catholics, and Catholics (undefined) | 87,272 | 14·21 | 14·08 | 13·94 | 13·96 |
| Greek Church | 56 | 0·02 | 0·01 | 0·01 | 0·01 |
| Hebrews | 1,463 | 0·34 | 0·31 | 0·27 | 0·23 |
| Buddhists. Confucians | 3,928 | 1·05 | 1·01 | 0·77 | 0·63 |
| Other denominations | 849 | 0·05 | 0·11 | 0·10 | 0·12 |
| No denomination | 8,252 | 0·53 | 0·89 | 1·05 | 1-32 |
| No religion | 1,558 | 0·05 | 0·06 | 0·17 | 0·25 |
| Unspecified | 1,288 | 0·42 | 0·27 | 0·50 | ..* |
| Object to state | 15,342 | 2·55 | 2·85 | 3·44 | 2·45 |
| Totals | 626,058 | 100·00 | 100·00 | 100·00 | 100·00 |
Freethinkers numbered 4,475 persons in 1891 and 3,925 in 1886. They are included above in the numbers for “No denomination.”
Methodists increased between 1886 and 1891 at the rate of 14·61 per cent.; Church of England adherents increased 9·02 per cent.; Presbyterians, 8·29 per cent.; Roman Catholics, 8·12 per cent.; while the Salvation Army had the highest rate of increase, 77·84 per cent.
Of persons of both sexes, 67·62 per cent. were found to be unmarried, 29·18 married, and 3·20 widowed. Taking the male sex, and comparing the results of three censuses, the proportions of unmarried and married diminish, but the proportion of widowed increases. On the female side, the proportions of unmarried and widowed increase, while the married diminish. The figures are as under:—
| Census. | Proportions per Cent. (Males). | Proportions per Cent. (Females). | ||||
|---|---|---|---|---|---|---|
| Unmarried | Married. | Widowed. | Unmarried. | Married. | Widowed. | |
| 1881 | 70·39 | 27·73 | 1·88 | 63·64 | 33·05 | 3·31 |
| 1886 | 70·35 | 27·61 | 2·04 | 64·59 | 31·74 | 3·67 |
| 1891 | 70·02 | 27·61 | 2·37 | 64·95 | 30·94 | 4·11 |
The Chinese are not included in the figures from which these calculations are taken.
The number of bachelors aged 20 and upwards was 70,197, and of spinsters aged 15 and upwards 67,700, being 105 bachelors to every 100 spinsters. In Canterbury and Otago only were the spinsters in excess of the bachelors, but notably so in Canterbury, as in 1886.
The number of husbands was 90,371, and of wives 90,765, giving an excess of 394 of the latter.
Of both sexes, 77·25 per cent. of the persons could read and write, 3·98 read only, and 18·77 could not read. Comparing with previous censuses, and for each sex separately, the proportion per cent. who could read and write will be found to rise steadily, while those reading only, or unable to read, diminish in number. The under-mentioned figures illustrate this:—
| Census. | Proportions per Cent. (Males). | Proportions per Cent. (Females). | ||||
|---|---|---|---|---|---|---|
| Read and Write. | Read only. | Cannot Read. | Read and Write. | Read only. | Cannot Read. | |
| 1881 | 73·31 | 5·01 | 21·68 | 68·94 | 6·39 | 24·67 |
| 1886 | 75·40 | 4·36 | 20·24 | 72·41 | 5·31 | 22·28 |
| 1891 | 77·95 | 3·74 | 18·31 | 76·47 | 4·24 | 19·29 |
Returning to the population of both sexes, the numbers living in 1891 able to “read and write,” “read only,” and “unable to read,” at various quinquennial periods of age, show conclusively that, whatever may be the degree of education of those at the higher ages, and who are passing away, the proportions of those reading only, or not able to read, at the periods when young people leave school are very low indeed, falling to 0·38 and 0·65 per cent. respectively at the age-period 15-20. The figures are as under:—
| PERSONS OF BOTH SEXES.—PROPORTIONS PER CENT. AT VARIOUS AGE-PERIODS. | |||
|---|---|---|---|
| Read and Write. | Read only. | Cannot Read. | |
| Under 5 years | .. | 0·81 | 99·91 |
| 5 to 10 years | 52·88 | 18·00 | 29·12 |
| 10 to 15 years | 97·72 | 1·28 | 1·00 |
| 15 to 20 years | 98·97 | 0·38 | 0·65 |
| 20 to 25 years | 98·81 | 0·39 | 0·80 |
| 25 to 30 years | 98·09 | 0·74 | 1·17 |
| 30 to 35 years | 96·87 | 1·59 | 1·54 |
| 35 to 40 years | 95·57 | 2·13 | 2·30 |
| 40 to 45 years | 93·98 | 2·83 | 3·19 |
| 45 to 50 years | 93·06 | 3·48 | 3·46 |
| 50 to 55 years | 92·26 | 3·89 | 3·85 |
| 55 to 60 years | 91·29 | 4·68 | 4·03 |
| 60 to 65 years | 89·56 | 5·37 | 5·07 |
| 65 to 70 years | 87·66 | 6·96 | 5·38 |
| 70 to 75 years | 85·96 | 7·77 | 6·27 |
| 75 to 80 years | 83·70 | 8·79 | 7·51 |
| 80 and upwards | 81·21 | 8·90 | 9·89 |
The columns of the census “household schedule” returned information as to attendance at school under the following heads:—
| Attending Government primary schools | 124,063 |
| Attending college, high, grammar, or private schools | 17,047 |
| Attending Sunday-schools | 101,975 |
| Receiving tuition at home | 8,178 |
Of those attending Sunday-schools, 9,971 were Sunday-school teachers. The number attending primary schools increased 12·13 per cent. since 1886; those attending private schools, 14·04 per cent.; attending Sunday-schools, 2·09 per cent.; and receiving tuition at home, 8·07 per cent., the population at 5-15 years of age increasing during the quinquennium by 10·20 per cent. The small increase in the attendance at Sunday-schools is notable, as at previous censuses far higher rates were obtained, while, on comparing the results for 1891 with 1886 as to sex, it is found that for males there is an actual decrease of 0·81 per cent., and for females an increase of only 4·84 per cent.
The compilation of the occupations of the people (exclusive of Maoris) gave the following result:—
| Occupations. | Numbers. | Proportions per Cent. | ||||
|---|---|---|---|---|---|---|
| Persons. | Males. | Females. | Persons. | Males. | Females. | |
| Total population | 626,658 | 332,877 | 293,781 | 100·00 | 100·00 | 100·00 |
| Section A.—Breadwinners. | ||||||
| Class I. Professional | 15,821 | 10,082 | 5,739 | 2·52 | 3·03 | 1·95 |
| Class II. Domestic | 24,928 | 5,537 | 19,391 | 3·98 | 1·66 | 6·60 |
| Class III. Commercial | 43,196 | 40,330 | 2,866 | 6·89 | 12·12 | 0·98 |
| Class IV. Industrial | 70,521 | 59,196 | 11,325 | 11·25 | 17·78 | 3·86 |
| Class V. Agricultural, pastoral, mineral, and other primary producers | 90,546 | 87,860 | 2,686 | 14·45 | 26·40 | 0·91 |
| Class VI. Indefinite | 7,751 | 4,341 | 3,410 | 1·24 | 1·30 | 1·16 |
| Section B.—Dependents (Non-breadwinners). | ||||||
| Class VII. Dependents | 373,895 | 125,531 | 248,364 | 59·67 | 37·71 | 84·54 |
The professional class embraces all persons not otherwise classed, mainly engaged in the government and defence of the country, in maintaining law and order, and in satisfying the higher intellectual, moral, and social wants of its inhabitants; the domestic, all persons engaged in the supply of board and lodging, and in rendering personal services for which rumuneration is usually paid; the commercial, all persons directly connected with the hire, sale, transfer, distribution, storage, and security of property and materials, and with the transport of persons or goods, or engaged in effecting communication; the industrial, all persons not otherwise classed, who are principally engaged in various works of utility, or in specialities connected with the manufacture, construction, modification, or alteration of materials so as to render them more available for the various uses of man, but excluding, as far as possible, all who are mainly or solely in the service of commercial interchange; the agricultural, pastoral, mineral, and other primary producers, all persons mainly engaged in the cultivation or acquisition of food products, and in obtaining other raw materials from natural sources; the indefinite, all persons who derive incomes from services rendered, but the direction of which services cannot be exactly determined; the dependents, all persons dependent upon relatives or natural guardians, including wives, children, and relatives not otherwise engaged in pursuits for which remuneration is paid, and all persons depending upon private charity, or whose support is a burthen on the public revenue.
If the population of the colony, as ascertained by the census, be corrected to the 31st December, 1891, by means of the returns showing the natural increase, arrivals and departures, the result is as follows:—
| — | Males. | Females. | Total. | |||
|---|---|---|---|---|---|---|
| Population (exclusive of Maoris) as enumerated at census, 5th April, 1891 | 332,877 | 293,781 | 626,658 | |||
| Increase from 5th April to 31st December, 1891,— | ||||||
| Males. | Females. | Total. | ||||
| By excess of births over deaths | 4,319 | 4,727 | 9,046 | |||
| Less excess of departures over arrivals | 1,022 | 624 | 1,646 | 3,297 | 4,103 | 7,400 |
| Estimated population (exclusive of Maoris) on 31st December, 1891 | 336,174 | 297, 884 | 634,058 | |||
| Maori population, Census, April, 1891 | 22,861 | 19,132 | 41,993 | |||
| Total estimated population of the colony on 31st December, 1891 | 359,035 | 317,016 | 676,051 | |||
It is necessary to explain that annual estimates of the Maori population cannot be made, as very few births or deaths occurring among them are registered; consequently the numbers obtained at one census period are necessarily used for stating the strength of the population until the results of the next census are known.
The population of the North Island and adjacent islets was estimated at 285,165 persons; that of the Middle Island, Stewart, and Chatham Islands, at 348,874 persons. Adding nineteen persons for the Kermadec Islands, the full population of 634,058 persons, excluding Maoris, is arrived at for the 31st December, 1891.
The increase of population during 1891 amounted to 8,557 persons, the excess of births and deaths being 11,755, and the decrease by excess of departures over arrivals 3,198.
The following shows the number of births in excess of the number of deaths in each of the past ten years:—
| 1882 | 13,308 |
| 1883 | 13,341 |
| 1884 | 14,106 |
| 1885 | 13,012 |
| 1886 | 13,164 |
| 1887 | 12,998 |
| 1888. | 13,194 |
| 1889 | 12,685 |
| 1890 | 12,284 |
| 1891 | 11,755 |
While the population increased from 517,707 persons in 1882 to 634,058 in 1891, or at the rate of 22 per cent., the excess of births over deaths was as high as 13,308 in the former year, and fell to 11,755 in the latter. Of the decline in the birth-rate, mention will be made further on.
The statistics of the colony show from the beginning an annual excess of immigration over emigration, with the exception of the years 1888, 1890, and 1891. In 1888 the excess of outgo reached 9,175 persons. In the following year there was a small increase by excess of immigration (214). In 1890 the tide again turned against New Zealand by 1,782 persons, while in 1891 the decrease amounted to 3,198. It would appear, however, that the excess of outgo has ceased, judging from the results of the March quarter's returns for the current year (1892), which give—immigration 4,575; emigration, 3,972. The returns for the month of May, being one in which an excess of outgo is looked for on account of the approach of winter, gives for immigration 1,057 persons, and for emigration 1,070 persons.
The populations of the several Australasian Colonies (exclusive of the aborigines of Australia and Maoris in New Zealand) were, as estimated for the 31st December, 1891, as under:—
| Population. | |
|---|---|
| Queensland | 410,346 |
| New South Wales | 1,157,020 |
| Victoria | 1,157,239 |
| South Australia | 325,766 |
| Western Australia | 53,285 |
| Tasmania | 152,619 |
| New Zealand | 634,058 |
| 3,890,333 |
There is not in New Zealand, as in each of the other Australasian Colonies, one metropolitan centre of population overshadowing, by comparison, the other towns of the colony. The configuration and physical features of the colony made it specially adapted for the establishment of settlements comparatively remote from one another. As a result, the colony was formerly divided into nine provinces, each having its capital town. Of these, the principal are the Boroughs of Auckland, Wellington, Christchurch, and Dunedin.
Auckland Borough, situate in the northern part of the North Island, had in April, 1891, a population of 28,613. As the population of the suburbs amounted to 22,514, the total population living in and around Auckland was 51,127.
The Borough of Wellington, the seat of Government, is situated on the border of Port Nicholson, at the southern extremity of the North Island. It contained in April, 1891, a population amounting to 31,021 persons. The suburban population is small, amounting only to 2,203 persons. The whole population in and around Wellington thus numbered 33,224.
The Borough of Christchurch is situated in the Canterbury District of the Middle Island. The recent census returns give a population of 16,223 in that borough, and of 31,623 in the suburbs, in which are included the Boroughs of St. Albans and Sydenham. The total population in the Borough and suburbs of Christchurch was thus 47,846.
The Borough of Dunedin, the principal town of the former Province of Otago, is the centre of a population amounting to 45,865, of which the Borough of. Dunedin contained 22,376, and the eight surrounding boroughs, which are practically suburbs of Dunedin, 23,489.
A complete list of the boroughs in the colony, with populations, is given below:—
| BOROUGHS OF NEW ZEALAND ARRANGED ACCORDING TO POPULATION. | |
|---|---|
| Population | |
| * These were town districts at the date of the census, and the populations stated are not exactly according to the borough boundaries. | |
| Wellington | 31,021 |
| Auckland | 28,613 |
| Dunedin | 22,376 |
| Christchurch | 16,223 |
| Sydenham | 9,680 |
| Napier | 8,341 |
| Nelson | 6,626 |
| Oamaru | 5,621 |
| St. Albans | 5,247 |
| Wanganui | 5,011 |
| Invercargill | 4,950 |
| Caversham | 4,690 |
| Thames | 4,618 |
| Palmerston North | 4,303 |
| South Dunedin | 4,222 |
| Lyttelton | 4,087 |
| Parnell | 3,967 |
| Roslyn | 3,845 |
| Greymouth | 3,787 |
| Timaru | 3,668 |
| Mornington | 3,523 |
| New Plymouth | 3,350 |
| North-east Valley | 3,337 |
| Blenheim | 3,294 |
| Masterton | 3,114 |
| Onehunga | 2,924 |
| Westport | 2,622 |
| Devonport | 2,455 |
| Hastings | 2,303 |
| Brunner | 2,231 |
| Hokitika | 2,178 |
| Petone | 2,178 |
| Gisborne | 2,158 |
| Newton | 2,087 |
| Port Chalmers | 2,028 |
| Ashburton | 1,900 |
| Rangiora | 1,783 |
| Gore | 1,618 |
| Newmarket | 1,586 |
| Feilding | 1,583 |
| Invercargill South | 1,559 |
| Maori Hill | 1,426 |
| Waimate | 1,379 |
| Kaiapoi | 1,371 |
| Lower Hutt | 1,329 |
| Mosgiel | 1,304 |
| West Harbour | 1,297 |
| Hawera | 1,284 |
| Melrose | 1,224 |
| Foxton | 1,223 |
| Hamilton | 1,212 |
| Kumara | 1,176 |
| Milton | 1,158 |
| St. Kilda | 1,153 |
| Kaitangata | 1,145 |
| Greytown | 1,141 |
| Carterton | 1,112 |
| Tauranga | 1,055 |
| Lawrence | 1,026 |
| Onslow | 979 |
| Marton | 976 |
| Woodville | 971 |
| Karori | 966 |
| Balclutha | 867 |
| Cambridge | 850 |
| Riverton | 843 |
| Ross | 822 |
| Palmerston South | 790 |
| Picton | 788 |
| Queenstown | 779 |
| Hawkesbury | 743 |
| Invercargill East | 736 |
| Invercargill North | 717 |
| Green Island | 687 |
| Patea | 676 |
| Campbelltown | 650 |
| Sumner | 614* |
| Akaroa | 571 |
| Naseby | 496 |
| Cromwell | 474 |
| Birkenhead | 455 |
| Richmond | 452* |
| Tapanui | 428 |
| Arrowtown | 426 |
| Roxburgh | 410 |
| Alexandra | 310 |
| Avenal | 302 |
| Hampden | 300 |
| Winton | 288 |
| Gladstone | 287 |
The number of persons who arrived in the colony in 1891 was 14,431, a decrease of 597 on the number in 1890. In the immigration returns, all persons above the age of 12 years are classed as adults; those under 12 as children. On that basis, the number of adults who arrived was 12,887, of whom 8,649 were males arid 4,238 were females. The number of children was 1,544, of whom 778 were males and 766 were females.
Of those who arrived, 2,435 came from the United Kingdom, 3,712 from Victoria, 6,704 from New South Wales and Queensland, 9 from South Australia, 719 from Tasmania, 199 from Fiji, 389 from Hawaii and the South Seas, and 264 from other ports.
There was not any free immigration in 1891, but 44 persons arrived who were nominated by friends in the colony, and whose passages were partially paid for by the Government. Of these, the number of each nationality was as follows: 25 English, 17 Irish, 1 Scotch, and 1 German. The terms of nomination were that for each adult £10, and for each child between the ages of 1 and 12 years £5, should be paid in the colony by friends. The system of nominated immigration was discontinued on the 16th December, 1890.
The number of Chinese who arrived in the colony in 1891 was 5.
In 1881 an Act was passed imposing a tax on every Chinese person landing in the colony, except in the case of any one of a crew of a vessel who might not remain in the colony. The object of the Act was so to restrict the introduction of Chinese as to prevent an increase in that part of the population. The following figures show that the desired effect has been so far obtained. In 1881 the Chinese population amounted to 5,004; in 1886 the number had diminished to 4,542, and, when the recent census was taken, there only were 4,444 Chinese in the colony.
Laws restricting the immigration of Chinese have been passed in the Australian Colonies as well as in New Zealand. In December, 1881, an Act was passed in New South Wales imposing a poll-tax of £10 per head on Chinese arriving in the colony. In 1888 the amount of the tax was raised to £100, vessels being also prohibited from carrying to the colony more than one Chinese passenger to every 300 tons. As a result, the number of Chinese who arrived in the colony in 1889 was only 7, of whom 6 held exemptions either as being British subjects or from having been residents in the colony. Chinese landing are also prohibited from engaging in mining without express authority under the hand and seal of the Minister of Mines, and are not permitted to become naturalised subjects.
The number of persons whose departures from this colony were recorded in 1891 was 17,629, of whom 11,396 were males and 6,233 were females, 2,508 being children under 12 years of age. Of these, 1,705 went direct to the United Kingdom, 3,841 to Victoria, 10,000 to New South Wales and Queensland, 16 to South and Western Australia, 1,159 to Tasmania, 149 to Fiji, 449 to Hawaii and the South Seas, and 310 to other ports.
There was a known loss by excess of emigration over immigration of 3,198 persons. The actual loss in the year would be somewhat greater, which is accounted for by unrecorded departures of persons from the colony.
There was a gain on passenger traffic with the United Kingdom of 730. This may be accepted as fairly accurate, the elements of disturbance arising only in the traffic between this and the Australian Colonies. There was an ascertained loss of 3,296 on the passenger traffic with New South Wales and Queensland, 129 on that with Victoria, 7 on that with South and Western Australia, and 440 on that with Tasmania. It may be reasonably assumed that the bulk of the unrecorded loss has been in the direction of that colony which has absorbed our greatest recorded loss, and that New South Wales has largely benefited by an influx of population from New Zealand. At first it may appear that New Zealand has been a great sufferer through this loss of population. If all the persons who went were of a class that would settle down to country pursuits and help to develop the resources of the colony, that opinion might be well founded; but the large expenditure on public works that has obtained for years has brought to, or developed in, the colony a class of persons living solely by such expenditure, who have realised rates of wages that could not be profitably given by farmers. On the cessation of such expenditure the result might reasonably be expected that numbers, unacquainted with farm-labour and disinclined thereto as being less remunerative than the labour they had been accustomed to, should migrate to places where the prospect of employment by expenditure on public works would be better. If they remained in the colony they would in all probability swell the number of those who call for further public expenditure, and, not being producers, it is questionable whether the loss to the colony in instances like these is such as to be deplored.
In the decennial period 1882-91 the apparent gain by net immigration from the United Kingdom was 38,431, while the loss to the Australian Colonies and Tasmania amounted to 22,121 persons, and to other places 867 persons.
By far the largest amount of emigration to the Australian Colonies in any one year occurred in 1888, when the expenditure of loan-money by the General Government was reduced to one-half of what it had been in the previous year, 1887.
The following table shows the immigration — distinguishing between the unassisted and the assisted—and the emigration for the past ten years:—
| Year. | Unassisted Immigrants. | Free and Assisted Immigrants. | Total Immigrants. |
|---|---|---|---|
| 1882 | 10,219 | 726 | 10,945 |
| 1883 | 13,313 | 5,902 | 19,215 |
| 1884 | 16,133 | 3,888 | 20,021 |
| 1885 | 15,127 | 1,072 | 16,199 |
| 1886 | 15,184 | 917 | 16,101 |
| 1887 | 12,403 | 1,286 | 13,689 |
| 1888 | 13,121 | 485 | 13,606 |
| 1889 | 15,301 | 91 | 15,392 |
| 1890 | 14,884 | 144 | 15,028 |
| 1891 | 14,387 | 44 | 14,431 |
| Year. | Emigrants. | Excess of Immigrants. | Excess of Emigrants. |
|---|---|---|---|
| 1882 | 7,456 | 3,489 | .. |
| 1883 | 9,186 | 10,029 | .. |
| 1884 | 10,700 | 9,321 | .. |
| 1885 | 11,695 | 4,504 | .. |
| 1886 | 15,037 | 1,064 | .. |
| 1887 | 12,712 | 977 | .. |
| 1888 | 22,781 | .. | 9,175 |
| 1889 | 15,178 | 214 | .. |
| 1890 | 16,810 | .. | 1,782 |
| 1891 | 17,629 | .. | 3,198 |
These numbers are based on returns sent to the Registrar-General, but the results of the recent census, as also those of the census of 1886, show that a number of persons left the colony, of whose departure there were no records.
There has been a large annual decrease of late years in the number of persons who leave the United Kingdom for the Australasian Colonies.
The number of births registered in 1891 was 18,273, being in the proportion of 29·01 per 1,000 of the population, this proportion being the lowest on record in the colony. The great decrease in the birth-rate is shown in the following table:—
| Year. | Number of Births. | Births per 1,000 of the Population. |
|---|---|---|
| 1882 | 19,009 | 37·32 |
| 1883 | 19,202 | 36·28 |
| 1884 | 19,846 | 35·91 |
| 1885 | 19,693 | 34·35 |
| 1886 | 19,299 | 33·15 |
| 1887 | 19,135 | 32·09 |
| 1888 | 18,902 | 31·22 |
| 1889 | 18,457 | 30·12 |
| 1890 | 18,278 | 29·41 |
| 1891 | 18,273 | 29·01 |
It will be observed that the number of births was less in 1891 than in 1884 by 1,573. A decrease in the birth-rate in a young country is to a certain point a natural result of the increasing proportion of the population under twenty-one years of age, but a decrease in the actual number of births is different from what might reasonably have been looked for.
The smaller proportion of wives under forty-five years of age and their higher average age would have an influence in lowering the birth-rate, but it is evident that lessened fertility is only one of the causes of the decrease in operation, another being the decrease in the marriage-rate; probably the most potent is a disinclination to assume the responsibilities of the burdens of a large family.
The birth-rate of New Zealand, 29·01 in 1891, was the lowest in the Australasian Colonies for that year. It is lower than any on record for the whole of England and Wales, although higher than the rates which obtain in some of the counties. The rate was also lower than that (30·03) in Scotland, but considerably higher than that (22·3) in Ireland, in 1890.
The births of 638 children in 1891 were illegitimate, or a proportion of 34·91 in every 1,000 children born.
The number of marriages in 1891 was 3,805, and the marriage-rate was 6·04 per 1,000 persons living. This rate is below that which obtains in the other Australasian Colonies. The New Zealand figures for ten years are given:—
| NUMBER OF MARRIAGES AND RATE PER 1,000 OF THE POPULATION. | ||
|---|---|---|
| Year. | No. of Marriages. | Rate per 1,000 living. |
| 1882 | 3,600 | 7·07 |
| 1883 | 3,612 | 6·82 |
| 1884 | 3,800 | 6·87 |
| 1685 | 3,813 | 6·65 |
| 1886 | 3,488 | 5·99 |
| 1887 | 3,563 | 5·97 |
| 1888 | 3,617 | 5·97 |
| 1889 | 3,632 | 5·93 |
| 1890 | 3,797 | 6·12 |
| 1891 | 3,805 | 6·04 |
The number of marriages stated does not include those between persons both of whom are of the aboriginal native race, these persons being exempted from the necessity of complying with the provisions of the Marriage Act, although they are at liberty to take advantage thereof; but only eight marriages in which both parties were Maoris were contracted in 1891 in terms of that Act.
Of the marriages in the past year, 22·18 per cent. were solemnised by the Ministers of the Church of England, 27·23 per cent. by ministers of the Presbyterian Churches, 15·27 per cent. by ministers of the Wesleyan and other Methodist Churches, 10·07 per cent. by ministers of the Roman Catholic Church, 5·12 per cent. by ministers of other denominations, and 20·13 per cent. by Registrars.
There was an increase in 1891 on the number and proportion of marriages solemnised by ministers of the Church of England and by Registrars during the previous year, but a decrease on the number and proportion of marriages by ministers of other principal denominations.
Registrars of Marriages in New Zealand, are prohibited by law from issuing certificates for the marriage of minors without the consent of their parents or lawful guardians, if there be any in the colony. If a declaration be made in any case that there is no parent or lawful guardian in the colony, then a certificate may be issued after the expiration of fourteen clays following the date on which the notice of intended marriage is given.
A marriage may not be solemnised in New Zealand except after the delivery to the minister or Registrar who officiates of a certificate issued by a Registrar, authorising such marriage, and if any persons knowingly and wilfully intermarry without such certificate the marriage is null and void; no clergyman or minister of any denomination is empowered to solemnise marriages until his name has been placed on the Registrar-General's list of officiating ministers for the year.
The ages at which persons may contract binding marriages are the same as in England—namely, 12 years for females and 14 for males. Marriage may be contracted at earlier ages than those stated, but would be voidable at the option of either of the parties upon reaching the age of 12 or 14, as the case may be, and without the necessity of proceedings in Court.
The deaths in 1891 numbered 6,518, being equivalent to a rate of 10·35 in every 1,000 persons living.
The death-rate in New Zealand contrasts very favourably with those in the other Australasian Colonies and in European countries, and furnishes evidence of the great salubrity of the climate of the colony. The following table gives the death-rates for a series of years in the several countries named:—
| Country. | 1882. | 1883. | 1884. | 1885. | 1886. | 1887. | 1888. | 1889. | 1890. | 1891. |
|---|---|---|---|---|---|---|---|---|---|---|
| New Zealand | 11·19 | 11·45 | 10·39 | 10·76 | 10·54 | 10·29 | 9·43 | 9·44 | 9·66 | 10·35 |
| Queensland | 17·99 | 18·82 | 22·97 | 19·58 | 17·29 | 14·56 | 14·66 | 15·44 | 14·98 | 12·90 |
| New South Wales | 16·12 | 14·68 | 16·14 | 16·41 | 14·89 | 13·15 | 13·54 | 13·42 | 12·90 | 14·26 |
| Victoria | 16·23 | 14·28 | 14·46 | 14·98 | 15·15 | 15·70 | 15·34 | 17·54 | 16·10 | 16·24 |
| South Australia | 14·84 | 14·55 | 15·24 | 12·48 | 13·38 | 12·77 | 12·52 | 11·49 | 12·40 | 13·26 |
| Western Australia | 14·16 | 17·93 | 21·87 | 17·61 | 21·56 | 16·83 | 15·91 | 14·19 | 11·26 | 16·96 |
| Tasmania | 15·79 | 17·06 | 15·50 | 15·40 | 14·58 | 15·45 | 14·11 | 14·10 | 14·74 | 15·00 |
| England | 19·6 | 19·6 | 19·7 | 19·2 | 19·5 | 19·1 | 18·1 | 18·2 | 19·5 | .. |
| Scotland | 19·4 | 20·2 | 19·6 | 19·3 | 18·9 | 19·0 | 18·0 | 18·4 | 19·7 | .. |
| Ireland | 17·3 | 19·2 | 17·5 | 18·4 | 17·8 | 18·2 | 17·9 | 17·4 | 18·2 | .. |
| Denmark | 19·3 | 18·4 | 18·4 | 17·9 | 18·2 | 18·3 | 19·7 | 18·6 | 19·0 | .. |
| Norway | 18·4 | 17·1 | 16·4 | 16·5 | 16·1 | 16·0 | 16·9 | 17·4 | 17·8 | .. |
| Sweden | 17·4 | 17·3 | 17·5 | 17·8 | 16·6 | 16·1 | 16·0 | 16·0 | .. | .. |
| Austria | 30·8 | 30·1 | 29·2 | 29·9 | 29·4 | 28·9 | 29·2 | 27·3 | 29·4 | .. |
| Hungary | 35·3 | 32·0 | 30·8 | 31·6 | 31·4 | 33·5 | 31·7 | .. | .. | .. |
| Switzerland | 21·9 | 20·4 | 20·2 | 31·3 | 20·7 | 20·2 | 19·9 | 20·3 | 20·9 | .. |
| German Empire | 25·7 | 25·9 | 26·0 | 25·7 | 26·2 | 24·2 | 23·7 | 23·7 | 24·4 | .. |
| Netherlands | 20·7 | 21·8 | 22·2 | 21·0 | 21·5 | 19·7 | 20·4 | 20·1 | 20·5 | .. |
| France | 22·2 | 22·2 | 22·2 | 21·9 | 22·5 | 22·0 | 21·8 | 20·5 | 22·8 | .. |
| Italy | 27·5 | 27·5 | 26·7 | 26·6 | 28·3 | 27·5 | 27·0 | 24·9 | 26·4 | .. |
The comparison of the above rates appears to place the Australasian Colonies as a whole in the foremost place for salubrity of climate and healthiness of people, New Zealand taking the lead by a wide interval; but it must be admitted a mere death-rate calculated on the whole population—that is, the proportion of all deaths to the 1,000 of population living in the middle of the year—although a very fair index of the sanitary condition of the same country if compared from year to year, and also useful for comparing the healthiness of different countries whose respective populations contain a fairly-equal proportionate number of persons living at each age-period of life, can scarcely be regarded as a perfect index of the comparative healthiness of new and old countries, or even of that of new countries one with another, when the relative proportions living at the several age-periods very considerably.
The truest rates of mortality are obtained by ascertaining the proportion of deaths of persons of certain ages to the numbers living at those ages.
The following statement gives the classification of diseases, with the percentage of deaths therefrom to the total mortality, and the proportion to the 10,000 of population in each class and order, in the years 1889, 1890, and 1891:—
| Class and Order. | Per 100 Deaths. | Per 10,000 of the Population. | ||||
|---|---|---|---|---|---|---|
| 1889. | 1890. | 1891 | 1889. | 1890. | 1891. | |
| Class I—Specific Febrile or Zymotic Diseases— | ||||||
| Order 1. Miasmatic diseases | 4·96 | 7·62 | 10·57 | 4·66 | 7·36 | 10-94 |
| Order 2. Diarrhöal diseases | 6·15 | 4·84 | 4·89 | 5·78 | 4·67 | 5·06 |
| Order 3. Malarial diseases | 0·06 | 0·02 | 0·02 | 0·07 | 0·02 | 0·02 |
| Order 4. Zoogenous diseases | .. | .. | 0·02 | .. | .. | 0·02 |
| Order 5. Venereal diseases | 0·31 | 0·30 | 0·20 | 0·29 | 0·29 | 0·21 |
| Order 6. Septic diseases | 1·27 | 0·95 | 1·09 | 1·19 | 0·92 | 1·13 |
| Total Class I. | 12·75 | 13·73 | 16·79 | 11·99 | 13·26 | 17·38 |
| Class II.—Parasitic Diseases | 0·28 | 0.33 | 0·20 | 0.26 | 0·32 | 0·21 |
| Class III.—Dietetic Diseases | 1·02 | 0·77 | 0·95 | 0·96 | 0·74 | 0·98 |
| Class IV.—Constitutional Diseases | 17·52 | 17·80 | 16·32 | 16·47 | 17·19 | 16·89 |
| Class V.—Developmental Diseases | 7·43 | 7·96 | 7·18 | 6·99 | 7·68 | 7·43 |
| Class VI.—Local Diseases— | ||||||
| Order 1. Diseases of nervous system | 10·95 | 11·19 | 10·23 | 10·30 | 10·81 | 10·59 |
| Order 2. Diseases of organs of special sense | 0·12 | 0·15 | 0·17 | 0·11 | 0·14 | 0·17 |
| Order 3. Diseases of circulatory system | 9·20 | 7·56 | 8·10 | 8·65 | 7·30 | 8·38 |
| Order 4. Diseases of respiratory system | 11·94 | 12·61 | 13·39 | 11·22 | 12·18 | 13·86 |
| Order 5. Diseases of digestive system | 8·85 | 9·23 | 8·42 | 8·33 | 8·91 | 8·72 |
| Order 6. Diseases of lymphatic system and ductless glands | 0·10 | 0·15 | 0·26 | 0·10 | 0·14 | 0·27 |
| Order 7. Diseases of urinary system | 3·14 | 2·67 | 3·41 | 2·95 | 2·58 | 3·53 |
| Order 8. Diseases of reproductive system— | ||||||
| (a) Of organs of generation | 0·47 | 0·43 | 0·29 | 0·44 | 0·42 | 0·30 |
| (b) Of parturition | 0·92 | 1·34 | 1·04 | 0·86 | 1·29 | 1·08 |
| Order 9. Diseases of organs of locomotion | 0·40 | 0·23 | 0·32 | 0·37 | 0·22 | 0·33 |
| Order 10. Diseases of integumentary system | 0·24 | 0·35 | 0·25 | 0·23 | 0·34 | 0·25 |
| Total Class VI | 46·33 | 45·91 | 45·88 | 43·56 | 44·33 | 47·48 |
| Class VII.—Violence— | ||||||
| Order 1. Accident or negligence | 7·83 | 7·51 | 6·80 | 7·37 | 7·25 | 7·03 |
| Order 2. Homicide | 0·17 | 0·11 | 0·11 | 0·16 | 0·11 | 0·11 |
| Order 3. Suicide | 0·80 | 1·07 | 0·86 | 0·75 | 1·03 | 0·89 |
| Order 4. Execution | .. | .. | .. | .. | .. | .. |
| Total Class VII | 8·80 | 8·69 | 7·77 | 8·28 | 8·39 | 8·03 |
| Class VIII.—Ill defined and Not-specified Causes | 5·87 | 4·81 | 4·91 | 5·52 | 4·64 | 5·08 |
Phthisis is by far the most serious cause of death. In 1889 it was the cause of 499 deaths, in 1890 of 520, and in 1891 of 495. Of those who died in 1891, 255 were males and 240 were females. The deaths were in the proportion of 7·86 in every 10,000 persons living; or among males, of 7·63 in every 10,000 living, and among females of 8·12 in every 10,000 living.
The death-rate from phthisis is considerably less than that in any of the Australian Colonies, but differs very slightly from that in Tasmania. In all these colonies the rate is materially increased by the deaths of persons who have arrived in a diseased condition, or constitutionally predisposed thereto; but there is no reason to think that the rate is more affected by this cause in the other colonies than in New Zealand; consequently the lower rate in New Zealand may be accepted as an indication of the superiority of its climate for withstanding the development of phthisical tendencies. The rate in this colony is a little more than half that which obtains in England.
The following table gives the ages, with the length of residence in the colony, of those who died from phthisis in 1891:—
| Length of Residence in the Colony. | Age at Death. | ||||||||||
|---|---|---|---|---|---|---|---|---|---|---|---|
| Under 5 years. | 5 to 10. | 10 to 15. | 15 to 25. | 25 to 35. | 35 to 45. | 45 to 55. | 55 to 65. | 65 to 75. | 75 and upwards. | Total | |
| MALES. | |||||||||||
| Under 1 month | .. | .. | .. | 1 | 1 | 1 | .. | .. | .. | .. | 3 |
| 1 to 6 months | .. | .. | .. | 4 | .. | 2 | .. | .. | .. | .. | 6 |
| 6 to 12 months | .. | .. | .. | 1 | .. | 1 | .. | .. | .. | .. | 2 |
| 1 to 2 years | .. | .. | .. | 1 | 1 | .. | .. | .. | .. | .. | 2 |
| 2 to 3 years | .. | .. | .. | 1 | 2 | 3 | .. | .. | .. | .. | 6 |
| 3 to 4 years | .. | .. | .. | 2 | .. | 2 | .. | .. | .. | .. | 4 |
| 4 to 5 years | .. | .. | .. | .. | 4 | 1 | .. | .. | .. | .. | 5 |
| 5 to 10 years | .. | .. | .. | 3 | 5 | 6 | 4 | .. | .. | .. | 18 |
| 10 to 15 years | .. | .. | .. | 1 | 3 | 10 | 2 | 1 | .. | .. | 17 |
| 15 to 20 years | .. | .. | .. | 3 | 5 | 11 | 11 | 3 | .. | 1 | 34 |
| 20 to 25 years | .. | .. | .. | 1 | 3 | 3 | 8 | 5 | 3 | .. | 23 |
| 25 years and upwards | .. | .. | .. | .. | 8 | 6 | 19 | 13 | 5 | .. | 51 |
| Not known | .. | .. | .. | .. | 2 | 4 | 3 | 4 | 1 | .. | 14 |
| Born in colony | 3 | 1 | 7 | 38 | 16 | 5 | .. | .. | .. | .. | 70 |
| Totals | 3 | 1 | 7 | 56 | 50 | 55 | 47 | 26 | 9 | 1 | 255 |
| FEMALES. | |||||||||||
| 1 to 6 months | .. | .. | .. | .. | .. | .. | .. | .. | .. | .. | .. |
| 6 to 12 months | .. | .. | .. | 1 | .. | 1 | .. | .. | .. | .. | 2 |
| 1 to 2 years | .. | .. | .. | .. | 2 | .. | .. | .. | .. | .. | 2 |
| 2 to 3 years | .. | .. | .. | .. | 2 | 1 | .. | .. | .. | .. | 3 |
| 3 to 4 years | .. | .. | .. | .. | .. | .. | .. | .. | .. | .. | .. |
| 4 to 5 years | .. | .. | .. | .. | 1 | .. | .. | .. | .. | .. | 1 |
| 5 to 10 years | .. | .. | .. | 1 | 7 | 4 | .. | .. | .. | .. | 12 |
| 10 to 15 years | .. | .. | .. | 7 | 5 | 9 | .. | .. | 1 | .. | 22 |
| 15 to 20 years | .. | .. | .. | 9 | 6 | 5 | 8 | 2 | 1 | .. | 31 |
| 20 to 25 years | .. | .. | .. | 3 | 4 | 3 | 2 | 1 | .. | .. | 13 |
| 25 years and upwards | .. | .. | .. | .. | 3 | 11 | 7 | 4 | 1 | 2 | 28 |
| Not known | .. | .. | .. | .. | 2 | 4 | .. | 6 | .. | .. | 8 |
| Born in colony | 8 | 1 | 10 | 71 | 22 | 6 | .. | .. | .. | .. | 118 |
| Totals | 8 | 1 | 10 | 92 | 54 | 44 | 17 | 9 | 3 | 2 | 240 |
| Totals of both sexes | 11 | 2 | 17 | 148 | 104 | 99 | 64 | 35 | 12 | 3 | 495 |
The shipping entered inwards for the year 1891 comprised 737 vessels, of 618,515 tonnage—viz., 432 sailing-vessels, of 209,590 tons, and 305 steamers, of 408,925 tons. Entered outwards, were 438 sailing-vessels, of 212,646 tons, and 306 steamers, of 413,161 tons.
The following table gives the number and tonnage of vessels inwards and outwards during the past ten years:—
| Year. | Vessels Inwards. | Vessels Outwards. | ||
|---|---|---|---|---|
| Number. | Tons. | Number. | Tons. | |
| 1882 | 795 | 461,285 | 769 | 438,551 |
| 1883 | 805 | 494,926 | 851 | 507,565 |
| 1884 | 852 | 529,188 | 872 | 534,242 |
| 1885 | 786 | 519,700 | 780 | 513,000 |
| 1886 | 725 | 502,572 | 707 | 488,331 |
| 1887 | 653 | 489,754 | 675 | 493,583 |
| 1888 | 683 | 526,435 | 701 | 531,478 |
| 1889 | 781 | 602,634 | 762 | 593,252 |
| 1890 | 744 | 662,769 | 745 | 649,705 |
| 1891 | 737 | 618,515 | 744 | 625,807 |
The above figures apply to the foreign trade only; but in a new country like New Zealand, as yet deficient in roads, but having an extensive seaboard and a number of good harbours, the coastal trade must be relatively very large, as is evidenced by the figures next given:—
| SHIPPING ENTERED COASTWISE (1891). | ||
|---|---|---|
| Number. | Tons. | |
| Sailing-vessels | 4,660 | 264,746 |
| Steamers | 13,063 | 3,802,059 |
| SHIPPING CLEARED COASTWISE (1891). | ||
|---|---|---|
| Number. | Tons. | |
| Sailing-vessels | 4,599 | 252,742 |
| Steamers | 12,958 | 3,736,601 |
The total value of the imports for the year 1891 was £6,503,849, or, deducting specie, £6,431,101. The yearly values of imports during the past ten years are subjoined:—
| Year. | Imports, inclusive of Specie. | Imports, exclusive of Specie. |
|---|---|---|
| £ | £ | |
| 1882 | 8,609,270 | 8,343,950 |
| 1883 | 7,974,638 | 7,773,966 |
| 1884 | 7,663,888 | 7,326,208 |
| 1885 | 7,479,921 | 7,278,101 |
| 1886 | 6,759,013 | 6,319,223 |
| 1887 | 6,245,515 | 6,064,281 |
| 1888 | 5,941,900 | 5,430,050 |
| 1889 | 6,308,863 | 5,980,583 |
| 1890 | 6,260,505 | 5,928,625 |
| 1891 | 6,503,849 | 6,431,101 |
The following is a list of the chief imports during 1891, arranged in groups, with the value set opposite each:—
| £ | |
| Apparel and slops | 324,515 |
| Boots and shoes | 149,495 |
| Cotton piece-goods | 361,855 |
| Drapery | 332,216 |
| Haberdashery | 89,126 |
| Hosiery | 74,229 |
| Hats and caps | 55,493 |
| Linen manufactures | 46,867 |
| Millinery | 23,440 |
| Silks | 66,344 |
| Woollen piece - goods and blankets | 149,991 |
| Total | 1,673,571 |
| Agricultural implements | 11,361 |
| Cutlery | 17,014 |
| Hardware and ironmongery | 160,440 |
| Iron rails and railway-bolts, &c. | 12,320 |
| Iron, other — pig, wrought, wire, &c. | 341,535 |
| Machinery | 178,151 |
| Nails | 24,254 |
| Railway plant | 16,261 |
| Sewing-machines | 25,773 |
| Steel and steel rails | 30,677 |
| Tools, artificers' | 37,813 |
| Total | 855,599 |
| Sugar | 381,029 |
| Tea | 159,893 |
| Total | 540,922 |
| Beer | 50,779 |
| Spirits | 169,448 |
| Tobacco | 128,500 |
| Wine | 49,932 |
| Total | 398,659 |
| Paper | 114,248 |
| Printed books | 114,969 |
| Stationery | 71,396 |
| Total | 300,613 |
| Bags and sacks | 165,289 |
| Coals | 120,422 |
| Fancy goods | 72,099 |
| Fruits (including fresh, preserved, bottled, dried) | 126,537 |
| Oils | 147,664 |
| Other imports (excluding specie) | 2,030,326 |
| Total (excluding specie) | 6,431,101 |
| Specie imported | 72,748 |
| Total imports | £6,503,849 |
The import of any article in a given year is seldom identical with the amount consumed in that time. To ascertain the latter we must look to the Quantity actually entered at the Customs for home consumption and subjected to duty within the twelve months. Thus the quantity of sugar, including glucose, molasses, and treacle, entered for consumption in 1891 was 54,769,741lb., which gave an average of 86·97lb. for every person, exclusive of Maoris; but the persons of this race are estimated to consume, on an average, about one-fourth as much as Europeans. On this basis the consumption for the population, exclusive of Maoris, was 85·54lb. per head.
The quantity of tea entered for consumption in 1891 was 4,055,193lb. Supposing Maoris to use, on an average, 1lb. per head per annum, the consumption of tea per head of the population, exclusive of Maoris, would be 6·37lb. in 1891.
The Australasian Colonies seem to be, in proportion to population, the largest tea-consumers in the world. The amount annually used in New South Wales is estimated to be 6·8lb. per head. The consumption for Victoria has been given by the Government Statist of that colony at 10·01lb., and for Tasmania at 5·35lb.; the figures for the United Kingdom being 4·70lb., for Canada 3·69lb., and for the United States 1·40lb. The consumption in New Zealand is thus somewhat less than in Victoria or New South Wales, but greater per head of population than in the other places.
The following table gives the consumption per head of alcoholic liquors by the population, including and excluding Maoris, showing separately the proportion of beer, wine, and spirits for the last ten years. The amount of beer manufactured in the colony in each year, except the quantity exported, has been included, as well as the amount brought into consumption from imports:—
| Year. | Beer. | Spirits. | Wine. | |||
|---|---|---|---|---|---|---|
| Excluding Maoris. | Including Maoris. | Excluding Maoris. | Including Maoris. | Excluding Maoris. | Including Maoris. | |
| Gal. | Gal. | Gal. | Gal. | Gal. | Gal. | |
| 1882 | 10·523 | 9·684 | 1·153 | 1·061 | 0·351 | 0·323 |
| 1883 | 9·435 | 8·709 | 1·088 | 1·005 | 0·315 | 0·291 |
| 1884 | 8·769 | 8·121 | 0·999 | 0·923 | 0·272 | 0·253 |
| 1885 | 8·414 | 7·840 | 0·899 | 0·825 | 0·261 | 0·243 |
| 1886 | 7·861 | 7·333 | 0·820 | 0·765 | 0·212 | 0·198 |
| 1887 | 7·651 | 7·148 | 0·770 | 0·719 | 0·198 | 0·185 |
| 1888 | 7·133 | 6 ·70 | 0·820 | 0·767 | 0·167 | 0·156 |
| 1889 | 7·627 | 7·136 | 0·598 | 0·560 | 0·176 | 0·165 |
| 1890 | 7·899 | 7·402 | 0·693 | 0·649 | 0·184 | 0·172 |
| 1891 | 7·646 | 7·168 | 0·699 | 0·655 | 0·172 | 0·161 |
The quantity of tobacco entered for use in 1891 was 1,363,556lb. This gave a consumption per head of population—including Maoris, who are heavy smokers—of 2·03lb. For the four years 1887-90 the average per head was 1·92lb.
Subjoined are the values of imports from various countries in 1891, arranged in order of magnitude:—
| £ | |
| United Kingdom | 4,369,633 |
| Australia and Tasmania | 1,013,549 |
| United States | 361,795 |
| India and Ceylon | 275,250 |
| Fiji and Norfolk Island | 178,259 |
| Mauritius | 70,650 |
| Pacific Islands | 68,095 |
| Germany | 66,102 |
| Hongkong and China | 40,718 |
| Philippine Islands | 11,155 |
| Singapore | 10,055 |
| Japan | 8,399 |
| Belgium | 6,591 |
| France | 6,482 |
| Egypt | 3,919 |
| Holland | 2,143 |
| Greece | 1,945 |
| Canada and Now Brunswick | 1,941 |
| Italy | 1,867 |
| Asia Minor | 1,369 |
| Spain | 1,318 |
| Portugal | 1,252 |
| Switzerland | 480 |
| Norway | 368 |
| Austria | 301 |
| Malta and Gibraltar | 117 |
| Canary Islands | 87 |
| Cape Colony | 9 |
The values of imports in each provincial district during 1891 were as under:—
| £ | |
| Auckland | 1,621,352 |
| Taranaki | 26,776 |
| Hawke's Bay | 194,653 |
| Wellington | 1,397,452 |
| Marlborough | 20,338 |
| Nelson | 157,606 |
| Westland | 58,736 |
| Canterbury | 1,247,683 |
| Otago | 1,758,406 |
The value of all the exports in 1891 was £9,566,397; the value of New Zealand produce exported £9,400,094, being at the rate of £14 16s. 6d. per head of population. The following table gives the values of the several exports of New Zealand produce in each of the past ten years:—
| EXPORTS OF NEW ZEALAND PRODUCE. | ||||||||
|---|---|---|---|---|---|---|---|---|
| Year | Wool. | Gold. | Frozen Meat. | Butter and Cheese. | Agricultural Produce. | Manufactures | Other N.Z. Produce. | Total. |
| £ | £ | £ | £ | £ | £ | £ | £ | |
| 1882 | 3,118,554 | 921,664 | 19,339 | 62,218 | 1,169,020 | 121,447 | 841,108 | 6,253,350 |
| 1883 | 3,014,211 | 892,445 | 118,328 | 48,912 | 1,537,015 | 121,446 | 1,122,887 | 6,855,244 |
| 1884 | 3,267,527 | 988,953 | 345,090 | 91,667 | 968,517 | 104,425 | 1,176,307 | 6,942,486 |
| 1885 | 3,205,275 | 890,056 | 373,857 | 138,129 | 688,415 | 120,539 | 1,175,640 | 6,591,911 |
| 1886 | 3,072,971 | 934,648 | 427,193 | 151,194 | 688,804 | 109,656 | 997,216 | 6,386,682 |
| 1887 | 3,321,074 | 747,878 | 455,870 | 109,383 | 588,022 | 124,382 | 1,204,372 | 6,551,081 |
| 1888 | 3,115,098 | 914,309 | 628,800 | 197,170 | 905,907 | 233,383 | 1,260,461 | 7,255,128 |
| 1889 | 3,976,375 | 785,490 | 783,374 | 213,945 | 1,424,297 | 569,880 | 1,288,647 | 9,042,008 |
| 1890 | 4,150,599 | 751,360 | 1,087,617 | 207,687 | 1,299,864 | 547,947 | 1,393,687 | 9,428,761 |
| 1891 | 4,129,686 | 1,007,172 | 1,194,724 | 236,933 | 894,467 | 420,357 | 1,516,755 | 9,400,094 |
The most important items of export under the heading “Other New Zealand Produce” are coal, silver, and minerals, kauri-gum, timber, bacon, salted and preserved meats, tallow, sheep- and rabbit-skins, hides, horses, and sausage-skins. The aggregate value of these in 1891 was £1,467,286. The declared-values of the chief articles exported are given in the table immediately below:—
| THE MINE. | £ |
| Coal | 91,173 |
| Gold | 1,007,172 |
| Silver and minerals | 14,854 |
| Total | 1,113,199 |
| THE FISHERIES. | |
| Fish | 7,373 |
| Oysters | 7,078 |
| Other | 2,693 |
| Total | 17,144 |
| THE FOREST. | |
| Fungus | 10,943 |
| Kauri-gum | 437,056 |
| Timber— | |
| Sawn and hewn | 182,431 |
| Other | 9,069 |
| Total | 639,499 |
| ANIMALS AND PRODUCE. | |
| Bacon and hams | 25,182 |
| Beef and pork (salted) | 15,795 |
| Butter | 150,258 |
| Cheese | 86,675 |
| Hides | 29,737 |
| Live-stock— | £ |
| Cattle | 7,335 |
| Horses | 39,551 |
| Sheep | 2,091 |
| Pigs and other live-stock | 1,767 |
| Preserved meats | 111,133 |
| Frozen meats | 1,194,724 |
| Sausage-skins | 22,011 |
| Sheepskins and pelts | 171,292 |
| Rabbitskins | 126,251 |
| Tallow | 173,257 |
| Wool | 4,129,686 |
| Other | 8,105 |
| Total | 6,294,850 |
| AGRICULTURE PRODUCTS. | |
| Bran and sharps | 41,572 |
| Chaff | 1,820 |
| Flour | 39,628 |
| Grain— | |
| Barley | 11,114 |
| Beans and peas | 19,327 |
| Malt | 29,873 |
| Oats | 331,544 |
| Wheat | 277,876 |
| Maize | 6,604 |
| Hops | 15,283 |
| Oatmeal | 16,800 |
| Potatoes | 59,116 |
| Seeds (grass and clover) | 34,625 |
| Other | 9,785 |
| Total | 894,467 |
| MANUFACTURES. | |
| Ale and beer | 1,809 |
| Apparel | 9,859 |
| Cordage | 1,990 |
| Leather | 58,112 |
| Phormium (New Zealand hemp) | 281,514 |
| Soap | 5,067 |
| Woollen manufactures | 17,347 |
| Other manufactures | 44,659 |
| Total | 420,357 |
| Miscellaneous | 20,573 |
| Total exports (colonial produce and manufactures) | 9,400,094 |
| Specie | 5,538 |
| Other exports (British and foreign) | 160,765 |
| Total exports | £9,566,397 |
The re-export trade of the colony would seem from the subjoined figures to have been almost stationary for the last ten years.
| EXPORTS OF BRITISH, FOREIGN, AND OTHER COLONIAL PRODUCE. | |
|---|---|
| £ | |
| 1882 | 142,115 |
| 1883 | 156,784 |
| 1884 | 147,741 |
| 1885 | 146,951 |
| 1886 | 147,831 |
| 1887 | 129,691 |
| 1888 | 148,078 |
| 1889 | 139,347 |
| 1890 | 140,555 |
| 1891 | 160,765 |
With these amounts may be compared the re-export trade of New South Wales—a colony having less than double the population of New Zealand—which, exclusive of specie, amounted in 1890 to £2,644,386, of which the re-exports to New Zealand were of the value of £105,654.
The quantity of wool exported in 1891—-106,187,114lb.—was greater than in any previous year by 3,370,037lb. The value of the wool exported in 1891 was £4,129,686. The annual production and the increase can be best estimated by taking the exports for the twelve months immediately preceding the commencement of shearing, and adding thereto the quantity used in the colony for manufacturing purposes.
The following shows the produce on that basis for the last ten years, ending respectively on the 30th September:—
| Year ending 30th September. | Quantity exported. | Quantity purchased by Local Mills. | Total Annual Produce. |
|---|---|---|---|
| Lb. | Lb. | Lb. | |
| 1882 | 64,402,712 | 2,200,000 | 60,602,712 |
| 1883 | 72,842,949 | 1,900,000 | 74,742,949 |
| 1884 | 77,022,894 | 1,580,000 | 78,602,894 |
| 1885 | 78,174,034 | 1,922,932 | 80,096,966 |
| 1886 | 89,485,757 | 1,879,999 | 91,365,756 |
| 1887 | 95,914,181 | 2,001,155 | 97,915,336 |
| 1888 | 89,276,268 | 4,079,563 | 93,355,831 |
| 1889 | 95,618,507 | 3,556,004 | 99,174,511 |
| 1890 | 102,522,185 | 2,979,293 | 105,501,478 |
| 1891 | 108,619,473 | 2,918,073 | 111,537,546 |
From these figures, it appears that the wool-clip has increased 67 per cent. within the last ten years, and this notwithstanding the large increase in the export of rabbit-skins, from 9,198,837 in number in 1882 to 14,302,233 in 1891, which does not indicate any great relief from the rabbit-pest.
The increase in the wool-production is of course mainly due to the greater number of sheep—namely, 18,128,186 in April, 1891, against 12,500,597 in May, 1882. It will be apparent from the following table that the tendency of increase is in the direction of the multiplication of the smaller flocks, the owners of which would be better able to cope with the rabbit difficulty than the large run-holders:—
| NUMBER OF FLOCKS, 1882 to 1891. | ||||||||||
|---|---|---|---|---|---|---|---|---|---|---|
| Size of Flocks. | 1882. | 1883. | 1884. | 1885. | 1886. | 1887. | 1888. | 1889. | 1893. | 1891. |
| Under 500 | 4,685 | 5,039 | 5,422 | 5,622 | 6,024 | 6,247 | 6,579 | 7,063 | 7,662 | 8,272 |
| 500 and under 1,000 | 841 | 970 | 1,033 | 1,146 | 1,189 | 1,139 | 1,182 | 1,381 | 1,528 | 1,691 |
| 1,000 and under 2,000 | 552 | 609 | 672 | 718 | 747 | 723 | 794 | 826 | 854 | 969 |
| 2,000 and under 5,000 | 416 | 467 | 473 | 505 | 532 | 531 | 524 | 597 | 586 | 666 |
| 5,000 and under 10,000 | 225 | 244 | 256 | 270 | 263 | 289 | 287 | 279 | 283 | 287 |
| 10,000 and under 20,000 | 209 | 200 | 211 | 213 | 228 | 221 | 213 | 239 | 236 | 239 |
| 20,000 and upwards | 133 | 149 | 154 | 157 | 166 | 166 | 166 | 152 | 160 | 169 |
| Total | 7,064 | 7,678 | 8,221 | 8,631 | 9,149 | 9,316 | 9,745 | 10,537 | 11,309 | 12,293 |
The amount of gold exported in 1891 was 251,161oz., but the produce (represented by the amount entered for duty) was 251,996oz.
The total quantity of gold entered for duty to the 31st December, 1891, which may be stated as approximately the amount obtained in the colony, was 12,070,217oz., of the value of £47,433,117.
Frozen meat now takes second place among the exports of New Zealand produce. An account of the development of this industry is given in a special article further on.
To ascertain the total value of the meat export in 1891 it is necessary to take into consideration, with the amount of £1,194,724, value of frozen meat before stated, the value of preserved meats, amounting to £111,133; of salted beef and pork, £15,795; and of bacon and hams, £25,182.
The value of the grain exported in 1891 amounted to £676,338, an amount considerably below the average for several years past, mainly owing to the poor harvest of the 1891 season. The grain exports were made up as under:—
| Bushels. | £ | |
|---|---|---|
| Wheat | 1,454,973 | 277,876 |
| Oats | 4,052,414 | 331,544 |
| Barley | 83,758 | 11,114 |
| Malt | 119,424 | 29,873 |
| Maize | 43,423 | 6,604 |
| Peas and beans | 123,067 | 19,327 |
| Total value | .. | £676,338 |
The quantity of butter exported amounted to 39,430cwt., the declared value of which was £150,258. Of this quantity, 28,989cwt., valued at £106,446, was shipped to the United Kingdom; 4,403 1/2cwt., value £17,911, to Victoria; and 3,589cwt., value £15,476, to New South Wales.
If the export of butter is to assume any large dimensions it must be by producing an article suitable to the requirements of the English market, for on that must the colony chiefly rely. It has been satisfactorily proved that butter from New Zealand can be delivered in good condition in England, and that for good samples remunerative prices are obtainable; but it is necessary that the butter sent should not only be good, but uniform in quality and colour. This can only be obtained by the operations of butter-factories. Upon the multiplication of these the future of the butter-export trade, with all its great possibilities, seems to depend.
The cheese exported was 39,770cwt., of a declared value of £86,675, of which 29,565cwt., valued at £63,271, was sent to the United Kingdom; 5,402cwt., value £11,975, to Queensland; 2,090cwt., value £4,910, to New South Wales; and 1,979cwt., value £4,794, to Victoria.
The following statement shows the total quantity of butter and cheese exported in the past seven years, and the amount of each sent to the United Kingdom:—
| Year. | Total Export of Butter. | Butter exported to the United Kingdom. | Total Export of Cheese. | Cheese exported to the United Kingdom. |
|---|---|---|---|---|
| Cwt. | Cwt. | Cwt. | Cwt. | |
| 1885 | 24,923 | 273 | 15,245 | 272 3/4 |
| 1886 | 23,175 | 635 | 10,429 | 17 |
| 1887 | 17,018 | 6,937 | 23,913 | 9,900 3/4 |
| 1888 | 29,995 | 11,460 | 36,682 | 25,436 1/4 |
| 1889 | 37,955 | 21,099 | 26,558 | 7,633 |
| 1890 | 34,816 | 26,579 | 40,451 | 31,043 |
| 1891 | 39,430 | 28,989 | 39,770 | 29,565 |
These figures abundantly illustrate not only our power to place satisfactory produce on the English market, but also the importance of that market as an outlet for an increase in our production.
The export of phormium for 1891 shows a falling off. The market prices continue low—under £18 a ton—a condition of things not encouraging to producers. Any considerable increase in the value of the fibre will doubtless result in temporarily increasing the output; but a large permanent development of this industry depends upon the invention of improvements in the machinery used that will result in lessening the cost of production and improving the quality of the fibre.
There were 8,388 tons of kauri-gum, valued at the rate of £52 2s. a ton, exported from the colony in 1891. This gum is obtained only in the extreme northern part of this colony; nowhere else in the world. A special article is devoted to an account of this industry.
The following table gives the value of the exports from each port in New Zealand for 1891, arranged in order of magnitude:—
| £ | |
|---|---|
| Lyttelton | 1,726,155 |
| Wellington | 1,274,574 |
| Dunedin | 1,243,743 |
| Auckland | 1,218,321 |
| Napier | 1,184,826 |
| Invercargill and Bluff | 674,545 |
| Timaru | 582,485 |
| Oamaru | 391,602 |
| Greymouth | 295,377 |
| Wanganui | 216,599 |
| Wairau and Picton | 151,817 |
| Poverty Bay | 123,892 |
| Hokitika | 110,575 |
| New Plymouth and Waitara | 106,113 |
| Kaipara | 91,871 |
| Nelson | 74,010 |
| Westport | 49,014 |
| Patea | 33,690 |
| Russell | 13,088 |
| Tauranga | 8 |
The total value of the external trade in 1891 was £16,070,246, equivalent to £25 10s. 4d. per head of the population, excluding Maoris. It will be seen from the figures given below that the ratio of trade to population has varied but little for several years. The highest record was in 1873, when the total trade per head reached £41 19s. 3d., the imports, in consequence of the large expenditure of borrowed money, having then amounted to £22 9s. 4d. per head, against £10 6s. 6d. in 1891.
It has been the practice to exclude the Maori population from consideration in estimating the trade per head, for, although they have an influence on the amount of trade, that influence is proportionately so much less than in the case of Europeans that a nearer approximation to correctness in respect of the amount per head of the European portion of the population is obtained by excluding rather than by including them. The effect of including them would be to reduce the proportion from £25 10s. 4d. to £23 18s. 5d.
The values of imports and exports per head of population, excluding Maoris, were, for each of the past ten years, as follow:—
| Year. | Imports per Head. | Exports per Head. | Total. | ||||||
|---|---|---|---|---|---|---|---|---|---|
| £ | s. | d. | £ | s. | d. | £ | s. | d. | |
| 1882 | 16 | 18 | 1 | 13 | 1 | 5 | 29 | 19 | 6 |
| 1883 | 15 | 1 | 3 | 13 | 8 | 2 | 28 | 9 | 5 |
| 1984 | 13 | 17 | 4 | 12 | 16 | 8 | 26 | 14 | 0 |
| 1885 | 13 | 4 | 9 | 12 | 1 | 5 | 25 | 6 | 2 |
| 1880 | 11 | 12 | 2 | 11 | 9 | 3 | 23 | 1 | 5 |
| 1887 | 10 | 9 | 5 | 11 | 10 | 3 | 21 | 19 | 8 |
| 1888 | 9 | 16 | 4 | 12 | 16 | 7 | 22 | 12 | 11 |
| 1889 | 10 | 5 | 6 | 15 | 4 | 5 | 25 | 9 | 11 |
| 1890 | 10 | 0 | 2 | 15 | 13 | 8 | 25 | 13 | 10 |
| 1891 | 10 | 6 | 6 | 15 | 3 | 10 | 25 | 10 | 4 |
The trade with the United Kingdom amounted to £11,510,464, comprising 71·8 per cent. of the total trade.
With the Australian Colonies and Tasmania, trade was done during 1891 to the value of £2,719,110, of which New South Wales claimed £1,259,532, and Victoria £1,183,143. The exports to New South Wales amounted in value to £817,886, and the exports to Victoria to £704,166.
The amount of colonial produce sent to New Zealand from the Australian Colonies is small compared with the amount of New Zealand produce sent to Australia. This is shown by the following statement of the trade between New Zealand and New South Wales and Victoria:—
| EXPORTS FROM NEW ZEALAND. | |
| £ | |
| To New South Wales, 1891 | 817,886 |
| To Victoria, 1891 | 704,166 |
| EXPORTS TO NEW ZEALAND. | |
| £ | |
| From New South Wales, 1891 | 441,646 |
| From Victoria, 1891 | 478,977 |
Of the £441,646 exported from New South Wales, £116,320 was the value of the coal sent. Of the £478,977 exported from Victoria, £60,200 consisted of gold coin minted in Melbourne.
The trade with Fiji made again an advance in the year. In 1888 it was £149,839; in 1889, £170,181; in 1890, £184,684; and in 1891, £221,603. The trade with the other Pacific Islands and Norfolk Island increased from £127,727 in 1889 and £135,592 in 1890 to £173,161 in 1891.
The following table shows the value of the total trade with the United States in each of the past ten years:—
| TRADE WITH THE UNITED STATES. | |||||
|---|---|---|---|---|---|
| Year. | Imports from | Exports to | Total Trade. | ||
| Atlantic Ports. | Pacific Ports. | Atlantic Ports. | Pacific Ports. | ||
| £ | £ | £ | £ | £ | |
| 1882 | 398,153 | 65,340 | 126,583 | 308,101 | 898,177 |
| 1883 | 357,871 | 61,379 | 158,426 | 272,563 | 850,239 |
| 1884 | 300,185 | 48,372 | 183,939 | 30,430 | 562,926 |
| 1885 | 366,873 | 34,659 | 130,053 | 274,825 | 806,410 |
| 1886 | 304,571 | 32,751 | 166,926 | 80,474 | 584,722 |
| 1887 | 263,377 | 35,359 | 241,388 | 168,092 | 708,216 |
| 1888 | 285,864 | 37,205 | 204,302 | 119,414 | 646,785 |
| 1889 | 307,156 | 35,280 | 242,778 | 98,584 | 683,798 |
| 1890 | 321,047 | 34,348 | 364,332 | 218,802 | 938,529 |
| 1891 | 317,913 | 43,882 | 395,386 | 119,822 | 877,003 |
Of the exports to the United States in 1891 the values of the principal New Zealand products were—kauri-gum, £271,945; phormium, £138,037; gold, £86,250; sheepskins, £3,226; and sausage-skins, £1,014.
The trade with India (including Burmah and Ceylon) reached a total of £277,801. The imports—tea, rice, castor-oil, woolpacks, &c.—were reckoned at £275,250, leaving a balance of only £2,551 for exports. It would appear that ships arriving with cargoes from Calcutta or Rangoon do not return to those places, but load here with wool or other colonial produce for England.
The following table gives the value of the imports and exports of the Australasian Colonies for the year 1891:—
| Colony. | Total Value of | Excess of | ||
|---|---|---|---|---|
| Imports. | Exports. | Imports over Exports. | Exports over Imports. | |
| £ | £ | £ | £ | |
| Queensland | 5,079,004 | 8,305,387 | .. | 3,226,383 |
| New South Wales | 25,383,397 | 25,944,020 | .. | 560,623 |
| Victoria | 21,711,608 | 16,006,743 | 5,704,865 | .. |
| South Australia | 9,956,542 | 10,512,049 | .. | 555,507 |
| Western Australia | 1,280,093 | 799,466 | 480,627 | .. |
| Tasmania | 2,051,964 | 1,440,818 | 611,146 | .. |
| New Zealand | 6,503,849 | 9,566,397 | .. | 3,062,548 |
The trade per head of the population in each of the colonies was as under:—
| TRADE PER HEAD OF THE POPULATION IN 1891. | |||||||||
|---|---|---|---|---|---|---|---|---|---|
| Colony. | Imports. | Exports | Total Trade. | ||||||
| £ | £ | £ | |||||||
| Queensland | 12 | 10 | 11 | 20 | 10 | 5 | 33 | 1 | 4 |
| New South Wales | 22 | 3 | 11 | 22 | 13 | 9 | 44 | 17 | 8 |
| Victoria | 18 | 18 | 7 | 13 | 19 | 1 | 32 | 17 | 8 |
| South Australia | 31 | 9 | 0 | 33 | 4 | 2 | 64 | 13 | 2 |
| Western Australia | 24 | 16 | 1 | 15 | 9 | 10 | 40 | 5 | 11 |
| Tasmania | 13 | 15 | 6 | 9 | 13 | 5 | 23 | 8 | 11 |
| New Zealand (exclusive of Maoris) | 10 | 6 | 6 | 15 | 3 | 10 | 25 | 10 | 4 |
The values of the exports of these colonies—chiefly those of New South Wales, Victoria, and South Australia—are largely increased by the inclusion of articles the produce or manufacture of other colonies and countries.
The following shows the value of home productions or manufactures exported from each colony in 1891, and the rate per head of the population:—
| Colony. | Home Produce exported. | Per Head of Population. | ||
|---|---|---|---|---|
| £ | £ | s. | d. | |
| Queensland | 7,979,080 | 19 | 14 | 3 |
| New South Wales | 21,103,816 | 18 | 9 | 1 |
| Victoria | 13,026,426 | 11 | 7 | 2 |
| South Australia | 4,685,313 | 14 | 10 | 7 |
| Western Australia | 788,874 | 15 | 7 | 11 |
| Tasmania | 1,367,927 | 9 | 3 | 8 |
| New Zealand | 9,400,094 | 14 | 16 | 6 |
The amount of the trade of each of these colonies with the United Kingdom in 1891 is set forth below:—
| Colony. | Imports from the United Kingdom. | Exports to the United Kingdom. | Total Trade with the United Kingdom. |
|---|---|---|---|
| £ | £ | £ | |
| Queensland | 2,814,006 | 3,307,674 | 6,121,680 |
| New South Wales | 10,580,230 | 8,855,465 | 19,435,695 |
| Victoria | 8,953,599 | 7,993,489 | 16,947,088 |
| South Australia | 2,876,548 | 4,524,396 | 7,400,944 |
| Western Australia | 568,570 | 427,693 | 996,263 |
| Tasmania | 655,006 | 379,822 | 1,034,828 |
| New Zealand | 4,369,633 | 7,140,831 | 11,510,464 |
The following statement shows the relative importance of the Australasian Colonies as markets for the productions of the United Kingdom:—
| EXPORTS OF HOME PRODUCTION FROM THE UNITED KINGDOM IN 1890 TO— | |
|---|---|
| £ | |
| British India and Ceylon | 34,562,616 |
| United States | 32,068,128 |
| Australasia | 23,006,004 |
| Germany | 19,293,626 |
| France | 16,567,927 |
| Holland | 10,121,160 |
The exports to other countries did not amount to £10,000,000 in any one case.
The Australasian Colonies as a whole, with a population under 4,000,000, thus take the third place in importance as consumers of British produce, the exports thereto being about two-thirds of the value of the similar exports to British India, with its 285,000,000 inhabitants.
The principal productions of these colonies will, for a lengthened period, consist of those arising from pastoral, agricultural, and mining pursuits. The immense areas of land capable of improvement and more beneficial occupation, and the large mineral resources only partially developed, forbid any expectation for a very considerable time of such an increase in manufacturing industries as would enable colonial, to supersede English products to any very material extent. The consumption per head of the population may be somewhat less in the future as the proportion of adults decreases owing to lessened immigration and increase by births; but the relatively high rates of wages, and the absence of causes for any extensive pauperism, will make the proportionate consumption of products for a long time high. The rapid growth of the Australasian population may thus be expected to largely increase the demand for British products, and the future of the trade between the United Kingdom and the Australasian Colonies will probably be such as to make them by a long way the principal markets for those products, and very important factors in the progress of the Imperial commonwealth.
There were 1,228 post-offices in New Zealand at the end of 1891.
The correspondence delivered and posted in each of the two past years, and the increase in each case, was:—
| Correspondence, &c. | 1890. | 1891. | Increase in 1891. |
|---|---|---|---|
| Letters delivered | 22,415,263 | 23,867,402 | 1,452,139 |
| Letters posted. | 21,501,937 | 23,745,462 | 2,243,525 |
| Post-cards delivered | 1,019,434 | 1,097,788 | 78,354 |
| Post-cards posted | 991,065 | 1,181,141 | 190,076 |
| Books and packets delivered | 2,838,329 | 3,312,781 | 504,452 |
| Books and packets posted | 3,320,801 | 3,827,980 | 507,179 |
| Newspapers delivered | 9,221,212 | 9,768,226 | 547,014 |
| Newspapers posted | 8,691,522 | 8,733,686 | 42,164 |
The average number of letters, &c., posted per head of the population in each of the past three years was—
| 1889. | 1890. | 1891. | |
|---|---|---|---|
| Letters | 34·25 | 34·64 | 37·70 |
| Post-cards | 1·52 | 1·60 | 1·88 |
| Books and parcels | 4·52 | 5·35 | 6·08 |
| Newspapers | 13·48 | 14·00 | 13·87 |
The facilities afforded for the transmission of parcels through the Post Office to places within and without the colony has proved of much convenience to the public, and the number of parcels posted is largely increasing annually. The regulations admit of parcels up to 11lb. in weight being sent to almost all the important countries of the world.
The following shows the number and weight of parcels posted in the last three years. The word “parcels” in the previous table includes the parcels herein mentioned:—
| Parcels. | 1889. | 1890. | 1891. | |||
|---|---|---|---|---|---|---|
| No. | Weight. | No. | Weight. | No. | Weight. | |
| Parcels posted | 104,586 | Lb. 281,767 | 121,292 | Lb. 336,644 | 162,282 | Lb. 432,635 |
The following table shows the number of parcels exchanged with the United Kingdom and the Australian Colonies in 1891:—
| Received. | Despatched. | |
|---|---|---|
| United Kingdom and foreign offices, via London | 17,115 | 3,253 |
| Victoria | 1,649 | 1,176 |
| South Australia | 113 | 107 |
| Tasmania | 76 | 250 |
| Western Australia | 14 | 31 |
The declared value of the parcels received from places outside the colony was £23,386, on which the Customs duty amounted to £3,835.
During 1891, 195,239 money-orders, for a total amount of £651,989 19s. 6d., were issued by the various post-offices in the colony. The money-orders from places beyond New Zealand which were paid m the colony numbered 21,514, for the amount of £77,219 3s. 6d.
The cost of the various mail-services between England and New Zealand was, in 1891, as follows:—
| SAN FRANCISCO SERVICE. | |||
| Payments— | £ | s. | d. |
| Subsidies, &c. | 21,564 | 15 | 10 |
| Interprovincial and other charges | 3,416 | 6 | 6 |
| 24,981 | 2 | 4 | |
| Receipts— | |||
| Postages received from England and the Australian Colonies | 11,669 | 15 | 5 |
| Postages collected in the colony | 9,856 | 15 | 0 |
| 21,526 | 10 | 5 | |
| Loss to the colony | £3,454 | 11 | 11 |
| DIRECT STEAM-SERVICE, NEW ZEALAND SHIPPING COMPANY | |||
| Payments— | £ | s. | d. |
| On weight, bonus, &c. | 8,667 | 8 | 4 |
| Interprovincial service | 2,769 | 4 | 7 |
| 11,436 | 12 | 11 | |
| Receipts— | |||
| Postages received from England | 6,311 | 6 | 6 |
| Postages collected in the colony | 2,434 | 0 | 10 |
| 8,745 | 7 | 4 | |
| Loss to the colony | £2,691 | 5 | 7 |
| PENINSULAR AND ORIENTAL AND ORIENT LINES SERVICES. | |||
| Payments— | £ | s. | d. |
| To P. and O. and Orient Lines | 801 | 0 | 4 |
| Transit across Australia | 5 | 13 | 10 |
| Transit across European Continent | 52 | 3 | 9 |
| Intercolonial services | 324 | 10 | 6 |
| 1,183 | 8 | 5 | |
| Receipts— | |||
| Postages collected from England and foreign offices | 210 | 7 | 7 |
| Postages collected in colony | 602 | 11 | 5 |
| 812 | 19 | 0 | |
| Loss to the colony | £370 | 9 | 5 |
The total amount of postages collected and contributions received for all these services in 1891 was £31,084 16s. 9d.
The average number of days in 1891 within which the mails were delivered between London and each of the under-mentioned ports in New Zealand was as follows:—
| London to— | San Francisco Service. | Direct Service. | P. and O. Line. | Orient Line. |
|---|---|---|---|---|
| Auckland | 35·00 | 48·25 | 43·61 | 42·19 |
| Wellington | 36·92 | 45·92 | 44·92 | 43·96 |
| Dunedin | 38·54 | 47·50 | 44·13 | 44·48 |
| Bluff | 39·29 | 48·25 | 43·38 | 43·73 |
There were 5,349 miles of telegraph-line open at the end of 1891, requiring 13,194 miles of wire. 1,968,264 telegrams were transmitted during the year: of these, the private and Press messages numbered 1,746,115, yielding a revenue of £117,633 15s. 9d.
There were twelve telephone exchanges and six sub-exchanges on the 31st March, 1892. The number of subscribers was increased from 2,592 in March, 1891, to 3,083 in March, 1892. The subscriptions to these exchanges during the year amounted to £18,571 7s. 8d., of which the working - expenses, maintenance, interest on capital cost, and allowance for depreciation, absorbed £15,026 12s. 2d.
The capital expended in connection with the several telephone exchanges up to the 31st March, 1892, including spare material on hand, was £88,368 17s. 9d.
The revenue of the General Government is of two kinds—ordinary and territorial. The ordinary revenue for the year ended 31st March, 1892, amounted to £3,872,591, and the territorial revenue to £309,436, giving a total of £4,182,027.
The principal heads of ordinary revenue were: The Customs, £1,625,271; stamps (including Postal and Telegraph revenue), £600,050; property-tax, £356,741; beer duty, £57,798; railways, £1,121,989; registration and other fees, £41,839; marine, £21,046; and miscellaneous, £47,857.
The territorial revenue consisted of receipts from land-sales to the sum of £103,240; with depasturing licenses, rents, and miscellaneous items, £206,196.
The revenue, together with the proceeds of debentures (£282,300) issued under “The Consolidated Stock Act, 1884.” for the accretions of Sinking Fund for the year, amounted to £4,464,327.
The Customs duties constitute the largest item of revenue, nearly all classes of imports being taxed under the tariff.
The direct taxation until lately consisted of a property-tax of 1d· in the pound on all assessed real and personal property (with exemption of £500), and the stamp duties; but in 1891 a Land and Income Assessment Act was passed, with the intention of repealing the property-tax. The Act of 1891 provides for an ordinary land-tax on the actual value of land, a deduction being allowed to each owner of the present value of improvements up to £3,000; and an owner is also allowed to deduct any amount owing by him secured by a registered mortgage. In addition to the above deductions, there is an exemption of £500 allowed when the balance, after making deductions as stated, does not exceed £1,500; and above that a smaller exemption is allowed, but it ceases when the balance amounts to £2,500.
Mortgages are subject to the land-tax. In addition to the ordinary land-tax there is a graduated land-tax which commences when the unimproved value is £5,000. For the graduated land-tax, the present value of all improvements is deducted; but mortgages are not deducted. The scale is as follows:—
| Where the value is £5,000 | and is less than £10,000 | one-eighth of a penny in the pound sterling. |
| Where the value is £10,000 | and is less than £20,000 | two-eighths of a penny in the pound sterling. |
| Where the value is £20,000 | and is less than £30,000 | three-eighths of a penny in the pound sterling. |
| Where the value is £30,000 | and is less than £40,000 | four-eighths of a penny in the pound sterling. |
| Where the value is £40,000 | and is less than £50,000 | five-eighths of a penny in the pound sterling. |
| Where the value is £50,000 | and is less than £70,000 | six-eighths of a penny in the pound sterling. |
| Where the value is £70,000 | and is less than £90,000 | seven-eighths of a penny in the pound sterling. |
| Where the value is £90,000 | and is less than £110,000 | one penny in the pound sterling. |
| Where the value is £110,000 | and is less than £130,000 | one penny and one-eighth of a penny in the pound sterling. |
| Where the value is £130,000 | and is loss than £150,000 | one penny and two-eighths of a penny in the pound sterling. |
| Where the value is £150,000 | and is less than £170,000 | one penny and three-eighths of a penny in the pound sterling. |
| Where the value is £170,000 | and is less than £190,000 | one penny and four-eighths of a penny in the pound sterling. |
| Where the value is £190,000 | and is less than £210,000 | one penny and five-eighths of a penny in the pound sterling. |
| Where the value is £210,000 | or exceeds that sum | one penny and six-eighths of a penny in the pound sterling. |
Income-tax will be levied on all incomes above £300, and from taxable incomes a deduction of £300 will be made. It is proposed to charge a higher rate on incomes derived from business than on those derived from employment or emolument. Companies will pay at the higher rate, and no exemption is allowed. No taxing Act has yet (July, 1892) been passed.
The indirect taxation is by way of Customs duty and excise duty on beer made in the colony. The following statement shows the amount raised by taxation in each of the past ten years:—
| Amount of Revenue raised by Taxation. | Amount per Head of Population (excluding Maoris). | |||
|---|---|---|---|---|
| £ | £ | s. | d. | |
| 1881 | 1,890,679 | 3 | 16 | 8 |
| 1882 | 1,956,557 | 3 | 16 | 10 |
| 1883 | 1,957,080 | 3 | 13 | 11 |
| 1884 | 1,815,674 | 3 | 5 | 9 |
| 1885 | 2,016,730 | 3 | 10 | 10 |
| 1886 | 1,882,050 | 3 | 4 | 8 |
| 1887 | 1,876,235 | 3 | 2 | 11 |
| 1888 | 2,031,658 | 3 | 7 | 1 |
| 1889 | 2,090,405 | 3 | 8 | 4 |
| 1890 | 2,173,985 | 3 | 10 | 0 |
| 1891 | 2,179,739 | 3 | 9 | 2 |
As the Maoris contribute somewhat to the Customs revenue, an allowance should he made on that account to ascertain more correctly the amount of taxation per head of the rest of the population. By including the Maori population the Customs duties per head of the rest of the population would he reduced by 3s. 1d. for the year 1891. If this amount be deducted from the taxation per head given for that year, the rate would be reduced from £3 9s. 2d. to £3 6s. 1d. This last rate may fairly be used for comparison with the rates in the neighbouring colonies.
The following were the rates of taxation per head in the Australasian Colonies in 1890:—
| £ | s. | d. | |
| Queensland | 3 | 8 | 2 |
| New South Wales | 2 | 9 | 10 |
| Victoria | 3 | 4 | 11 |
| South Australia | 2 | 4 | 4 |
| Western Australia | 4 | 10 | 7 |
| Tasmania | 3 | 3 | 3 |
| New Zealand | 3 | 6 | 11 |
The ordinary expenditure under permanent and annual appropriations was £4,192,947, the chief items being: Charges of the public debt, £1,892,929; subsidies and other payments to local bodies, £167,101; pensions, compensations, and other expenditure under special Acts of the Legislature, £88,751; contributions to cost of naval squadron, £20,712; working railways, £704,186; public instruction, £371,458; postal and telegraph, £266,727; defence, £166,157; and justice, £102,779. The expenditure out of the Land Fund was £120,031. Of this, £94,668 was expended on surveys, and £21,875 on payments to local bodies on account of their endowments. In addition to the above, £30,000 was carried to the Public Works Fund and spent in formation of roads to open up land for settlement. The total ordinary and territorial expenditure was therefore £4,342,978. It will be seen that the revenue for the year exceeded the expenditure by upwards of £121,000, and, adding the surplus at the beginning of the year, £144,000, less £100,000, which was used to pay off floating debt, there remains a surplus on the 31st March last of £165,000.
Debentures were redeemed to the amount of £350,671 during the year out of Sinking Fund moneys set free under “The Consolidated Stock Act, 1884.”
Besides expenditure out of revenue, there was also an expenditure out of the Public Works Fund of £391,612, of which £154,416 was for construction of railways, £101,716 for roads, £52,397 for purchase of Native lands in the North Island; £34,792 for public buildings, £27,773 for telegraph extension, £7,796 for the Department of Public Works, £7,347 for lighthouses and harbour defences, £2,257 for waterworks on goldfields, £816 for immigration, £264 on the thermal springs, and £2,038 on services not provided for.
The expenditure out of loan, which amounted to a million and a half of money in the year 1837, will be seen to have been greatly curtailed.
Besides the revenue raised by the General Government, the County and Borough Councils, the Town, Road, River, Harbour, and Drainage Boards levy rates and obtain revenue from other sources.
The colony is divided into 90 boroughs and 78 counties; within the latter there are 259 road districts and 46 town districts.
The following table shows the receipts from rates and other sources, with the expenditure and outstanding loans of the local governing bodies, for five financial years:—
| Year. | Receipts of Local Bodies. | Expenditure. | Outstanding Loans. | |
|---|---|---|---|---|
| From Rates. | From Government and other Sources, including Loans. | |||
| * Not including loans repayable to General Government by annual instalments amounting to £384,780. | ||||
| £ | £ | £ | £ | |
| 1886-87 | 434,236 | 1,782,696 | 1,885,000 | 5,020,747 |
| 1887-88 | 433,831 | 1,306,661 | 1,819,787 | 5,812,803 |
| 1888-89 | 445,928 | 992,567 | 1,560,604 | 5,892,050 |
| 1889-90 | 460,302 | 914,413 | 1,476,539 | 5,978,059 |
| 1890-91 | 463,581 | 899,666 | 1,381,319 | 6,042,693* |
Further particulars relating to local finance will be found under the head “Local Governing Bodies.”
The public debt of the colony amounted on the 31st March, 1892, to £38,713,068, being £117,282 less than it was on the 31st March, 1891. The annual charge on the consolidated revenue for interest and Sinking Fund is estimated at £1,842,686. The net indebtedness (after deducting the accrued Sinking Fund — £1,035,449) was £37,677,619.
By means of the sinking funds set free by the conversion of a portion of the debt, debentures to the amount of £350,671 were redeemed during the year under provisions of “The Consolidated Stock Act, 1884,” and the public debt was further reduced by £200,000 out of the surplus of the year 1890-91, and out of the balance of released Sinking Funds paid into the Public Works Fund. The debt under “The Consolidated Loan Act, 1867,” was also reduced by £54,500, and the last of the debentures under “The New Zealand State Forests Act, 1885,” amounting to £1,000, were paid off. The total deductions thus amount to £606,171.
The additions made to the debt were £282,300 of debentures under “The Consolidated Stock Act, 1881,” issued for estimated increases of the sinking fund of the year, and £157,000 raised under “The Government Loans to Local Bodies Act, 1886,” while conversion operations increased the debt by £49,589. These additions, amounting in the aggregate to £488,889, when deducted from the total paid off (£606,171), show a net reduction of the public debt of £117,282 on 31st March, 1892, as compared with the amount at the end of the previous financial year.
The following shows the debt of each of the Australasian Colonies on the 31st December, 1890:—
| Colony. | Amount of Debt. | Amount of accrued Sinking Fund. | Rate of Net Indebtedness per Head of Population at End of Year. | ||
|---|---|---|---|---|---|
| £ | £ | £ | s. | d. | |
| Queensland | 28,105,684: | .. | 66 | 9 | 7 |
| New South Wales | 48,425,333 | .. | 43 | 3 | 5 |
| Victoria | 41,443,216 | .. | 36 | 11 | 5 |
| South Australia | 20,401,500 | .. | 64 | 18 | 8 |
| Western Australia | 1,367,444 | 85,106 | 27 | 14 | 1 |
| Tasmania | 6,432,800 | 124,804 | 43 | 8 | 3 |
| New Zealand | 36,802,350 | 1,407,604 | 59 | 15 | 4 |
The amount of indebtedness per head of population was thus greater in Queensland and South Australia than in New Zealand. The net indebtedness per head in this colony has a decreasing tendency. In March, 1889, it was £60 12s. 2d.; in 1890, £60 5s. 4d.; in 1891, £59 11s. 11d.; and in March, 1892, £59 2s. 2d.; the increase of the population having been in a greater ratio than the increase of debt.
| Years ended 31st March | Amount of Debentures and Stock in Circulation. | Gross Indebtedness per Head of European Population. | Amount of Sinking Fund accrued. | Net Indebtedness. | Net Indebtedness per Head of European Population. | Annual Charge (Interest and Sinking Fund). | ||||
|---|---|---|---|---|---|---|---|---|---|---|
| £ | £ | s. | d. | £ | £ | £ | s. | d. | £ | |
| 1888 | 36,758,437 | 60 | 15 | 3 | 1,222,056 | 35,536,381 | 58 | 14 | 10 | 1,789,220 |
| 1889 | 38,375,050 | 62 | 17 | 10 | 1,395,389 | 36,979,661 | 60 | 12 | 2 | 1,866,588 |
| 1890 | 38,667,950 | 62 | 10 | 1 | 1,383,432 | 37,284,518 | 60 | 5 | 4 | 1,851,421 |
| 1891 | 38,830,350 | 61 | 19 | 4 | 1,486,427 | 37,343,923 | 59 | 11 | 11 | 1,864,575 |
| 1892 | 38,713,068 | 60 | 14 | 8 | 1,035,449 | 37,677,619 | 59 | 2 | 2 | 1,842,686 |
The debt of the colony as stated does not include the unpaid loans raised by the several local bodies, amounting at the end of March, 1891, to £6,042,693. These will be referred to when the particulars of the finance of local bodies are being touched upon.
Portions of the existing loans were either raised by the several Provincial Governments, or consist of loans raised for the purpose of paying off provincial liabilities. It is now almost impossible to ascertain the exact expenditure by these Governments on public works, or the allocation of the proceeds of their loans.
The burden of a public debt depends greatly on the extent to which it was expended on reproductive works, and the degree of prosperity enjoyed by the people. The rugged character of the country generally, and the natural difficulties appertaining to many of the sites on which the chief towns were built, very early necessitated a large outlay on roads and public works. The necessity was fully recognised, and to some extent met, by most of the Provincial Governments, which have justly received great credit for their far-seeing and liberal exertions in that direction. A great deal of road-making, often of a very costly character, was accomplished, harbour and other improvements begun, and immigration encouraged. Some railways were made in Canterbury, Otago, and Southland. The City of Christchurch and the agricultural plains of Canterbury were connected with the Port of Lyttleton by a railway, which required the construction of a long and very costly tunnel through the hills surrounding Lyttelton. In Otago, the City of Dunedin was connected with Port Chalmers by a railway, constructed by private individuals under the guarantee of the Otago Provincial Government; and some miles of railway were made in Southland, extending from the Town of Invercargill into the interior; but no general and comprehensive scheme of public works could be carried out by the separate exertions of the Provincial Governments. The General Government, therefore, in 1870, enunciated its public-works and immigration policy, by which it was proposed to raise a loan of ten millions for the construction of main trunk railways, roads, and other public works of colonial importance, and for the promotion of immigration on a large scale, the expenditure to be extended over a period of ten years. This policy was accepted by the Legislature, and embodied in “The Immigration and Public Works Act, 1870.”
The demands for local railways and other works soon caused the original proposals to be departed from, and entailed an expenditure at a much more rapid rate and to a far greater amount than was originally contemplated. Although many of the works undertaken have been directly unremunerative, yet the effect of the policy as a whole has been to largely develop the settlement of the country, and to enormously increase the value of landed property; land, in parts which before the construction of railways was valued at from £1 to £2 per acre, having been subsequently sold at prices varying from £10 to £20 per acre. In addition to the important indirect results of the policy, the railway- and telegraph-lines yield a revenue which covers a large proportion of the interest on their cost after paying working-expenses.
The following may be stated as approximately representing the loan expenditure by the General Government on certain public works to the 31st March, 1892:—
| £ | |
| Telegraphs | 634,421 |
| Waterworks on goldfields | 563,358 |
| Immigration | 2,145,967 |
| Roads and bridges | 3,604,925 |
| Land-purchases | 1,248,876 |
| Lighthouses, harbours, and defence works | 889,165 |
| Public buildings, including schools | 1,815,577 |
| Goal-mines and thermal springs | 25,435 |
| —- | |
| Railways (by the Provincial and General Governments) | 15,362,109 |
The total of these various items of expenditure amounts to £26,289,833. The expenditure by local bodies on harbours, roads, and other public works out of loans raised by them is not included, nor are the amounts expended out of loans by the Provincial Governments before their abolition on immigration and public works, except their outlay on railways, which, including the sum of £82,259 paid for the Dunedin and Port Chalmers line, represented the amount of £1,104,281. The expenditure on directly reproductive works—railways, telegraphs, and waterworks — has been £16,559,888. The expenditure on land is also partly reproductive, and that on immigration, roads, bridges, and lighthouses is of an indirectly reproductive character.
In 1888, the date of last assessment, the returns made to the Property-tax Department (which excluded the real estate belonging to Natives) gave the following as the gross private wealth:—*
| £ | |
| Real estate, exclusive of education, church, municipal, and other reserves | 84,208,230 |
| Furniture and household goods | 4,102,947 |
| Live-stock | 7,857,137 |
| Produce, merchandise, and agricultural implements | 13,597,008 |
| Shipping | 1,580,000 |
| All other property, including deposits in banks, but excluding mortgages and other debts | 24,535,854 |
| 135,881,176 |
The debts due to persons, whether secured by mortgage or not, have not been included as assets, because the value of the properties, mortgaged or otherwise liable for debts, have been given without any deduction on account of such debts.
* The private wealth for 1890 and 1891 is stated on p. 87.
From this should be deducted the amount of indebtedness to persons outside the colony, of which the amount secured by mortgage was estimated by the Property-tax Department at £16,205,356, and the amount not secured at £8,108,350, giving a total amount owed outside the colony of £24,313,706. If this amount be deducted from the gross private wealth, the balance of £111,567,470 should represent the net private wealth in the colony at the period mentioned, an amount equivalent to £184 per head of the population.
The property-tax returns, on account of understatements of values, &c., are not considered to fully represent the private wealth of the people. This might be estimated by adding together the values of all estates admitted to probate in any one year, and dividing the sum by the number of deaths occurring in that year. The quotient would then represent the average wealth per head. But any inference drawn from the figures for a single year would be untrustworthy. For a thinly-peopled country such as New' Zealand, an epidemic among young children, who have no property to leave, will unduly lower the average; while, on the other hand, the deaths of a few wealthy persons will raise it unwarrantably. By putting the figures for several years together, and taking the average for the term, we may partially, if not entirely, get rid of these disturbing elements and arrive at fairly correct results, as thus:—
| Years inclusive. | Amount sworn to. | Total Number of Deaths. | Average Amount left by each Person. | Average Number of Persons living. | Average Total Wealth for each Year of the Period. | ||
|---|---|---|---|---|---|---|---|
| £ | £ | s. | d. | £ | |||
| 1882-86 | 6,366,736 | 29,718 | 214 | 4 | 9 | 549,334 | 117,687,942 |
| 1887-91 | 6,927,252 | 30,129 | 229 | 18 | 4 | 613,227 | 140,991,067 |
In 1891 the value of the estates of deceased persons amounted to £1,543,361; of these, the value of 11, which were over £20,000 each, amounted to £517,247. If the years 1882-91 be taken as one period for the purpose of this calculation, the following results are arrived at:—
| Amount sworn to | £13,293,988. |
| Total number of deaths | 59,847. |
| Average amount left by each person | £222 2s. 8d. |
| Average number of persons living | 581,281. |
| Average total wealth for each year of the period | £129,121,886. |
It is, however, manifest that this average does not sufficiently exhibit the actual present amount of wealth. If the average amount per head—£222 2s. 8d.—for the period 1882-91 was the same at the end of the year 1891, then the total wealth possessed by the 634,058 persons in the colony at the end of 1891 would amount to £140,845,416. If, however, the amount per head was equal to the average for the period 1887-91—viz., £229 18s. 4d.—then the total private wealth at the end of 1891 amounted to £145,780,502. The figures given do not, however, represent the full amount of private wealth, as the amounts sworn to do not include the values of estates ca which no stamp duty is payable—viz., lands and goods passing to the husband or wife, and properties under £100. The total of these must be considerable, and they should give a substantial increase to the average amount per head, and therefore to the total wealth.
The private wealth of Victoria, calculated in the same manner by the Government Statist for that colony, amounted to an average of £399 per head of the population for the five years 1885-89 inclusive, or an average for the whole population of £407,284,836.
Similarly, the private wealth of New South Wales is given by the Government Statistician as an average of £369 for each person during the period 1886-90, and (assuming the real value of estates to be 10 per cent. above the value for probate) as amounting to a total of £455,500,000 at the end of the year 1890.
The returns of the property left by deceased persons show a very rapid increase of wealth; this is apparent from the following:—
| Colony. | Average Amount left by each deceased Person. | Average Total Wealth for each Year of the Period. | ||
|---|---|---|---|---|
| £ | s. | d. | £ | |
| New Zealand, 1882-86 | 214 | 4 | 9 | 117,687,942 |
| New Zealand, 1887-91 | 229 | 18 | 4 | 140,991,067 |
| New South Wales, 1875-79 | 178 | 0 | 0 | 115,112,600 |
| New South Wales, 1880-84 | 264 | 0 | 0 | 216,110,400 |
| New South Wales, 1886-90 | 369 | 0 | 0 | 455,500,000 |
| Victoria, 1877-81 | 223 | 0 | 0 | 186,578,971 |
| Victoria, 1882-86 | 305 | 0 | 0 | 285,527,885 |
| Victoria, 1887-89 | 454 | 0 | 0 | 482,155,264 |
The Government Statistician of New South Wales, in a recently-published paper, offers, instead of the above system, an estimate of wealth of the Australasian Colonies, “based on a valuation of the various elements of which that wealth is composed,” in which he states the total private wealth of Australasia for 1890 at £1,169,434,000, and that of New Zealand at £150,192,000. It will be observed that this sum is not very far in excess of the sum of £145,780,502, arrived at on the basis of the probate duty paid for 1891; and when it is considered that this amount is admittedly short, as not including estates on which no stamp duty is paid, being under £100 in value, or where the estate was left to husband or wife, the result may be said to be, in all probability, very near the truth.
The wealth of the United Kingdom is given by Mr. Giffen at ten thousand millions, equal to £270 per head of the population, but including public as well as private wealth.
The amounts for New Zealand and Australian Colonies stated refer only to private wealth. There is in addition in each colony a large amount of wealth—railways, lands, buildings, &c.—much of it reproductive, which belongs to the colony as a whole, and which requires to be taken into consideration when the burden of the debt is measured.
The length of Government railways open for traffic on the 31st March, 1892, was 1,869 miles, the total cost thereof having been £14,656,691, the average cost per mile being £7,842. The cash revenue for the year 1891-92 amounted to £1,115,431 10s. 10d., excluding the value of postal services; and the total expenditure to £706,517 6s. 2d. The net cash revenue—£408,914 4s. 8d.—was equal to a rate of £2 15s. 9d. per cent. on the capital cost; the percentage of expenditure to revenue was 63·34.
The following statement shows the number of miles of Government railways open, the number of train-miles travelled and of passengers carried, and the tonnage of goods traffic for the past five years:—
| Year | Length open. | Train-mileage. | Passengers. | Season Tickets issued. | Goods and Live-stock.* |
|---|---|---|---|---|---|
| * The equivalent tonnage for live-stock has boon given. | |||||
| 1886-87 | 1,722 | 3,008,949 | 3,426,403 | 11,821 | 1,783,524 |
| 1887-88 | 1,754 | 2,994,786 | 3,451,850 | 11,518 | 1,770,638 |
| 1888-89 | 1,773 | 2,796,007 | 3,132,803 | 11,817 | 1,954,126 |
| 1889-90 | 1,813 | 2,868,203 | 3,376,459 | 12,311 | 2,112,734 |
| 1890-91 | 1,842 | 2,894,776 | 3,433,629 | 13,881 | 2,134,023 |
| 1891-92 | 1,869 | 3,010,489 | 3,555,764 | 16,341 | 2,122,987 |
It will be observed that the number of passengers during the year 1891—92 was greater than in any previous year. As, however, the Commissioners anticipated, there was a slight falling-off in the net revenue, owing partly to heavier expenditure and partly to decrease in the goods traffic.
The particulars of the revenue and expenditure for the past five years are herewith given:—
| Year. | Passenger Faros. | Parcels and Luggage. | Goods and Live-stock. | Rents and Miscellaneous. | Total. | Expenditure. | Net Revenue. | Percentages of Expenditure to Revenue. | Percentages of Revenue to Capital Cost. | ||
|---|---|---|---|---|---|---|---|---|---|---|---|
| £ | £ | £ | £ | £ | £ | £ | £ | s. | d. | ||
| 1887-88 | 352,726 | 34,727 | 579,359 | 28,031 | 994,843 | 687,328 | 307,515 | 69·09 | 2 | 6 | 0 |
| 1883-89 | 323,447 | 34,102 | 610,488 | 29,578 | 997,615 | 647,045 | 350,570 | 64·83 | 2 | 12 | 0 |
| 1889-90 | 369,348 | 37,097 | 655,007 | 34,117 | 1,095,569 | 682,787 | 412,782 | 62·32 | 2 | 19 | 5 |
| 1890-91 | 353,593 | 38,997 | 690,779 | 38,332 | 1,121,701 | 700,703 | 420,998 | 62·47 | 2 | 18 | 11 |
| 1891-92 | 364,617 | 41,795 | 671,469 | 37,550 | 1,115,431 | 706,517 | 408,914 | 63·34 | 2 | 15 | 9 |
Although not included in the figures for the revenue, the real gain to the colony is greater than the amount of net revenue shown, by the value of the postal services performed by the railways (carriage of mails, &c.), amounting to £26,000 per annum.
In addition to the above railways there were 142 miles of private lines open for traffic on the 31st March, 1892—namely, the Wellington-Manawatu Railway, 84 miles; the Kaitangata Railway Company's line, 4 miles; and the Midland Railway, 54 miles.
The cost of the construction of the Wellington-Manawatu Railway was £757,966, being at the rate of £9,023 8s. 1d. per mile. The term “construction” used throughout includes equipment, rolling-stock, &c., not merely the construction of the road-line and buildings. The revenue for the twelve months ending the 28th February, 1892, amounted to £82,373, and the working-expenses to 32,746, equivalent to 39·75 per cent. of the revenue.
The revenue from the opened part of the Midland line (26 miles) was for the year ended the 30th June, 1891, £9,144 2s. 1d., and the expenditure £5,143 6s., equivalent to 56·24 per cent. of the revenue. The total expenditure on this line to the 30th June, 1891, was £854,646.
The following statement gives the number of miles of railway open for traffic and in course of construction in each of the Australasian Colonies at the end of 1890:—
| Colony. | Number of Miles open for Traffic on 31st Dec., 1890. | Number of Miles in course of Construction on 31st Dec., 1890. |
|---|---|---|
|
* 31st March, 1892. † Includes lines authorised. | ||
| Queensland | 2,142 | 601† |
| New South Wales | 2,263 | 151 |
| Victoria | 2,688 | 212 |
| South Australia | 1,610 | 54 |
| Western Australia | 513 | 290 |
| Tasmania | 399 | 74 |
| New Zealand* | 2,011 | 198 |
The total average liabilities and assets of the banks within the colonies for the last two years were as follows:—
| 1890. | 1891. | |||||
|---|---|---|---|---|---|---|
| £ | s. | d. | £ | s. | d. | |
| Liabilities | 13,356,598 | 4 | 3 | 13,820,457 | 19 | 8 |
| Assets | 17,735,258 | 16 | 7 | 16,814,518 | 9 | 7 |
Comparing the amounts with those in 1889, there was in 1891 an increase of £1,333,740 19s. 2d. on the liabilities, and a decrease of £838,397 1s. 1d. on the assets.
There was in 1891 a still further contraction in the average amount of advances by the banks. In 1886 these amounted to £15,834,877, equal to £27·20 per head of the population. In 1889 the amount was £14,272,481, equal to £23·25 per head. In 1890 the amount was further reduced to £13,996,085, equal to £22·55 per head; and in 1891 the amount had fallen to £11,449,745, an average of £18·18 per head of the mean population. The amount of discounts was less than in any year since 1873. The largest amount of discounts in any year was £6,061,959 in 1879, at the rate of £13·52 per head of population. In 1889 the amount was £2,850,944, equal to £4·64 per head of population; in 1890, £2,524,573, equal to £4·07 per head; and in 1891 it was £2,315,325, or £3·68 per head.
There was an increase of £427,488 in the deposits, which amounted to £12,796,098 in 1891, against £12,368,610 in 1890. Exclusive of Government deposits, the deposits bearing interest increased from £8,427,198 to £8,673,326, or by £246,128; and the deposits not bearing interest from £3,513,191 to £3,621,117, or by £107,926. Thus, there was an increase of £354,054 in the average amount of private deposits.
The following shows the average amount of notes in circulation, notes and bills discounted, and bullion and specie in the banks in each of the two past years:—
| Average Amount of | 1890. | 1891. | Increase or Decrease. |
|---|---|---|---|
| £ | £ | £ | |
| Notes in circulation | 902,988 | 937,309 | + 34,321 |
| Notes and bills discounted | 2,524,573 | 2,315,325 | -209,248 |
| Specie and bullion | 2,536,529 | 2,405,099 | -131,430 |
The number of post-offices open for the transaction of the savings-bank business at the end of 1891 was 322.
There were 25,131 new accounts opened in the year, and 17,872 accounts were closed. The total number of open accounts at the end of 1891 was 104,467, of which 76,077 were for amounts not exceeding £20.
The deposits received during the year amounted to £1,842,987 15s. 2d., and the withdrawals to £1,693,515 9s. 3d., the excess of deposits over withdrawals having thus been £149,472 5s. 11d. The total amount standing at credit of all accounts on the 31st December, 1891, was £2,695,447 11s. 6d., which gave an average amount at credit of each account of £25 16s.
There are seven savings-banks in the colony which are not connected with the Post Office. The total amount deposited in them in 1891 was £398,964 10s. 8d., of which the deposits by Maoris amounted to £112 16s. The withdrawals amounted to £412,374 2s. 7d., being in excess of the deposits by £13,409 11s. 11d. The total amount to the credit of the depositors at the end of the year was £711,501 1s. 3d., of winch the sum of £229 6s. 8d. was to the credit of Maoris.
The average deposits stated for the banks of issue represent the average for the four quarters of the year. If the amount of deposits at the end of the year be assumed to be equal to the average amount for the last quarter, then it may be stated that, exclusive of Government deposits, the deposits in the several banks of issue and in the two classes of savings-banks amounted at the end of 1891 to £15,701,392. In addition there was, in 1890, an amount of £285,528 14s. 8d. deposited with building societies; and it is also known that there were deposits with financial companies, of which no particulars have been supplied to the department. The known deposits amount on an average to £25 7s. 8d. per head of the population, exclusive of Maoris.
There were 44 registered building societies in operation in the colony at the end of 1890. Of these, 3 were terminable societies, the rest were permanent.
The total receipts by these societies during their financial year amounted to £715,393 11s. 11d., of which deposits comprised £323,216 2s.
The assets at the end of the year amounted to £1,030,770 10s., and the liabilities to £1,035,430 16s. 10d., of which the liabilities to shareholders, reserve fund, &c., amounted to £738,222 9s. 4d., those to depositors to £285,528 14s. 8d., and those to other creditors to £11,679 12s. 10d.
The Registrar of Friendly Societies received returns for the year 1890 from 357 lodges, courts, tents, &c., of various friendly societies throughout the colony, also from 31 central bodies. The number of members at the end of 1890 was 26,379.
The total value of the assets of these societies was £451,753, equivalent to £17 2s. 6d. per member. Of the total assets, the value of the sick and funeral benefit funds amounted to £403,290.
The receipts during the year on account of the sick and funeral funds amounted to £59,209, and the expenditure to £37,164, of which the sick-pay to members amounted to the sum of £24,690. In addition to the sick-pay, the sum of £24,832 was paid out of the medical and management expenses fund for medical attendance on and medicine supplied to the members and their families.
The surplus or deficiency ascertained at the last valuation of the different lodges, tents, &c., has been, stated by the Registrar. Of 328 bodies of whose funds and position valuations were made, only 77 were deemed to be solvent—showing a surplus. In 251 cases there was a deficiency which varied from a few shillings, or even less, to as much in one case as £31·50 per member. The Registrar, in his report published in 1891, remarked on the futility of any attempt to generalise the results: “The widest divergence between average values in the lodges, which are thus accidentally brought into juxtaposition, appears in a surplus of £20·7 per member, as contrasted with a deficiency of £22·3. Even within the smaller field of vision, which embraces one society only at a time, the branches exhibit marked contrasts in respect of their financial position.”
The adoption of insufficient scales of contributions, the neglect of the close investment of benefit funds, and, to some extent, the sinking of the capital of the benefit funds in unproductive building instead of having it invested at interest, are the chief factors m the present unsatisfactory condition of so many of the societies; and it almost appears as if the members of many of the bodies will not be convinced of the importance of those questions so frequently urged upon them until disaster has overtaken them.
Before referring to the results of each of the various systems in operation in 1891 for the disposal of Crown lands it is necessary to state that a description of these systems will be found in a special article, entitled “The Crown Lands,” belonging to the Appendix.
There were 56,050 acres of Crown land sold for cash or money-scrip during the year, the cash received having amounted to £53,568 4s. 2d. The scrip represented a value of £2,836 8s. 2d. The lands absolutely disposed of without sale amounted to 209,431 acres 3 roods 22 perches, of which the reserves set apart for public purposes amounted to 73,270 acres and 18 perches; the grants to Europeans or Natives under Native Reserves Acts, &c., or in fulfilment of engagements, 3,106 acres 2 roods 1 perch; those to Natives or Europeans under the Native Land Acts, 132,871 acres 1 rood 11 perches; and those in satisfaction of land-scrip or otherwise, 183 acres 3 roods 32 perches.
The total land alienated from the foundation of the colony to the 31st December, 1891, amounted to 20,013,615 acres. This does not include lands sold by Natives to Europeans direct, for which no Crown grants have been issued. Although the exact quantity so sold which still remains without Crown grants cannot be ascertained, it is believed to be very small.
In 1891 36,604 acres and 34 perches were taken up under the deferred-payment system. The total area of land taken up under this system, from its commencement to the 31st December, 1891, was 1,211,389 1/2 acres. Of this quantity, the area forfeited is 245,082 acres, and 481,356 acres have been finally alienated by completion of payments. The area still held under the system at the end of 1891 was, therefore, 484,951 acres. The following statement gives the number of acres taken up under this system in each of the past ten years:—
| Acres. | |
| 1882 | 83,930 |
| 1883 | 138,414 |
| 1884 | 48,502 |
| 1885 | 58,722 |
| 1886 | 52,711 |
| 1887 | 38,832 |
| 1888 | 82,017 |
| 1889 | 45,016 |
| 1890 | 39,106 |
| 1891 | 36,604 |
The operation of what is called the perpetual-lease system with right of purchase, which became part of the land-law of the colony in 1882, has had the effect of lessening the demand for land on deferred payments, as under the perpetual-lease system the rental is only 5 per cent: on the upset value of the land, and thus, until the purchase he (if at all) effected, the settler has all his capital available for beneficial improvements. 1,019,404 acres were in occupation under this system on the 31st December, 1891, in 3,802 holdings. 273,087 acres, in 827 holdings, were taken up during the year, but only 17,739 acres were converted into freehold. Although the right of converting the land from lease to freehold is highly valued, yet the temptation to postpone the use of that right is very great while interest at from 6 1/2 to 7 per cent. can be had on good investments, and only 5 per cent. need be paid in the form of rental to the Government.
The lands in the village settlements are partly disposed of upon deferred payments and partly for cash. The transactions are included in the sales of land previously stated, but the following details of the number and area of selection to the 31st December, 1891, are given in order to show the extent of these settlements:—
| No. | A. | R. | P. | |
| Village sections for cash | 913 | 598 | 2 | 32 |
| Village sections on deferred payments | 320 | 182 | 2 | 30 |
| Small-farm sections for cash | 543 | 4,723 | 0 | 4 |
| Small-farm sections on deferred payments | 1,006 | 11,499 | 2 | 21 |
| The freeholds acquired have been— | ||||
| Village sections | 165 | 95 | 1 | 6 |
| Small-farm sections | 623 | 6,955 | 0 | 27 |
| The forfeitures were— | ||||
| Village sections | 80 | 52 | 3 | 38 |
| Small-farm sections | 125 | 1,345 | 3 | 3 |
During 1891, 75 selectors took up 1,418 1/2 acres in village-homestead special settlements on perpetual lease.
The lands held from the Government on depasturing leases (exclusive of small grazing-runs) amounted to 12,519,115 acres, in 1,493 runs, yielding an annual rental of £142,507. The small grazing-runs numbered 47, containing a total area of 78,050 acres, and the rent received in 1891 amounted to £13,884 13s. 1d.
The results of the recent census show that in April, 1891, there were in New Zealand 43,777 occupied holdings of over 1 acre in extent, covering an area of 19,397,529 acres, of which 12,410,242 acres were the freehold of the occupier, and 6,987,287 acres held on lease from— (1) private individuals, (2) Natives, (3) public bodies, and (4) the Crown (for other than pastoral purposes). The following table shows the number of holdings of various sizes, and number of acres held in freehold and leasehold, excluding the Crown lands rented for pastoral purposes only:—
| Sizes of Holdings. | Number of Holdings. | Acreage. | |||
|---|---|---|---|---|---|
| Freehold. | Leasehold, &c.* | Total. | |||
| * Excluding Crown pastoral leases. | |||||
| Acres. | Acres. | ||||
| 1 to | 10 | 11,116 | 28,124 | 24,343 | 52,467 |
| 10 to | 50 | 8,899 | 148,965 | 105,751 | 254,716 |
| 50 to | 100 | 5,613 | 277,135 | 158,128 | 435,263 |
| 100 to | 200 | 6,851 | 654,729 | 374,022 | 1,028,751 |
| 200 to | 320 | 3,916 | 609,857 | 403,462 | 1,013,319 |
| 320 to | 640 | 3,802 | 1,057,676 | 660,070 | 1,717,746 |
| 640 to | 1,000 | 1,321 | 662,612 | 395,849 | 1,058,461 |
| 1,000 to | 5,000 | 1,675 | 2,144,627 | 1,280,558 | 3,425,185 |
| 5,000 to | 10,000 | 247 | 1,208,819 | 559,980 | 1,768,799 |
| 10,000 to | 20,000 | 189 | 1,911,063 | 788,341 | 2,699,404 |
| 20,000 to | 50,000 | 117 | 2,507,848 | 833,083 | 3,340,931 |
| 50,000 to | 100,000 | 24 | 801,647 | 723,000 | 1,524,647 |
| Upwards of 100,000 acres | 7 | 397,140 | 680,700 | 1,077,840 | |
| Totals, 1891 | 43,777 | 12,410,242 | 6,987,287 | 19,397,529 | |
| Totals, 1886 | 36,485 | 11,728,236 | 5,348,838 | 17,077,074 | |
| Totals, 1881 | 30,832 | 10,309,170 | 4,897,727 | 15,206,897 | |
The extent of land rented from the Crown for pastoral purposes, including the small grazing-runs, amounted, in April, 1891, to 12,469,976 acres.
The agricultural statistics, which are collected annually in February or March, only take into account such occupied holdings as are wholly or partly under cultivation, and do not include those occupied by aboriginal natives. Information relating to the farming operations of the Maoris is only obtained when a census of the Native race is taken. In 1891 the results of a census then taken showed that the Maoris had under wheat a total area of 11,203 acres; under maize, 5,599 acres; potatoes, 16,093 acres; other crops, 16,221 acres; and in sown grasses, 26,718 acres.
A summary of the results of the agricultural statistics collected in February, 1892, is exhibited in the two following tables: the first showing the number of holdings, and the acreage under various kinds of crops and in sown grasses; the second, the produce of the principal crops in each provincial district:—
| Provincial Districts. | Number of Holdings. | Number of Acres broken up, but not under Crop. | Number of Acres under Crop. | Total under all Kinds of Crops (including Sown Grasses), and of Land broken up, but not under Crop. | |||||||||||
|---|---|---|---|---|---|---|---|---|---|---|---|---|---|---|---|
| In Grain and Pulse. | In Green and other Crops. | In Sown Grasses. | |||||||||||||
| Wheat. | Oats. | Barley. | Other Crops. | Total under Grain-crops. | Oats sown for Green Food. | Potatoes. | Other Crops. | Total under Green and other Crops. | Hay. | In Grass (including Land in Hay) after having been broken up. | Grass-sown Lands (including Lands in Hay) not previously ploughed. | ||||
| Auckland | 9,842 | 18,406 | 6,459 | 6,633 | 926 | 5,603 | 19,621 | 16,780 | 4,450 | 34,662 | 55,892 | 10,246 | 356,049 | 748,237 | 1,198,205 |
| Taranaki | 2,635 | 1,508 | 2,386 | 2,534 | 145 | 211 | 5,276 | 1,478 | 872 | 5,306 | 7,656 | 2,500 | 83,520 | 237,068 | 335,028 |
| Hawke's Bay | 1,982 | 11,834 | 1,274 | 6,189 | 2,068 | 497 | 10,028 | 3,151 | 1,208 | 29,800 | 34,159 | 5,907 | 266,006 | 921,012 | 1,243,039 |
| Wellington | 6,334 | 3,822 | 12,039 | 14,364 | 340 | 478 | 27,221 | 4,579 | 1,974 | 29,165 | 35,718 | 5,179 | 201,187 | 1,398,260 | 1,666,208 |
| Marlborough | 811 | 4,368 | 7,179 | 2,900 | 2,420 | 1,278 | 13,777 | 3,116 | 1,221 | 4,017 | 8,354 | 1,959 | 51,181 | 168,644 | 246,324 |
| Nelson | 2,078 | 1,303 | 8,891 | 4,247 | 4,048 | 372 | 17,558 | 7,283 | 1,108 | 7,094 | 15,485 | 2,630 | 65,303 | 175,880 | 275,529 |
| Westland | 341 | 405 | 8,891 | 6 | .. | .. | 6 | 389 | 272 | 264 | 925 | 260 | 8,084 | 4,933 | 14,353 |
| Canterbury | 7,951 | 51,653 | 279,150 | 117,696 | 10,361 | 8,902 | 416,109 | 37,080 | 9,532 | 152,850 | 199,462 | 12,496 | 1,139,179 | 241,590 | 2,047,993 |
| Otago | 9,250 | 47,155 | 84,895 | 168,939 | 3,960 | 2,388 | 260,182 | 44,628 | 6,629 | 170,204 | 221,461 | 5,475 | 1,157,246 | 180,502 | 1,866,546 |
| Totals | 41,224 | 140,454 | 402,273 | 323,508 | 24,268 | 19,729 | 769,778 | 118,484 | 27,266 | 433,362 | 579,112 | 46,652 | 3,327,755 | 4,076,126 | 9,893,225 |
| PRODUCE OF PRINCIPAL CROPS. | |||||
|---|---|---|---|---|---|
| Provincial Districts. | Wheat. | Oats. | Barley. | Hay. | Potatoes. |
| Bush. | Bush. | Bush. | Tons. | Tons. | |
| Auckland | 169,409 | 195,142 | 25,416 | 12,851 | 20,842 |
| Taranaki | 68,820 | 103,467 | 2,484 | 4,130 | 5,201 |
| Hawke's Bay | 32,191 | 169,365 | 78,253 | 7,719 | 8,673 |
| Wellington | 331,847 | 480,310 | 8,652 | 8,307 | 13,702 |
| Marlborough | 170,212 | 102,065 | 50,880 | 2,305 | 7,914 |
| Nelson | 202,456 | 104,883 | 97,797 | 3,393 | 5,265 |
| Westland | .. | 180 | .. | 375 | 1,431 |
| Canterbury | 6,952,319 | 3,443,283 | 306,128 | 18,976 | 65,158 |
| Otago | 2,330,484 | 6,410,325 | 119,073 | 9,305 | 33,860 |
| Total | 10,257,738 | 11,009,020 | 688,683 | 67,361 | 162,046 |
From these tables it will be seen that the final results of the recent collection give the number of cultivated holdings over 1 acre in extent occupied by Europeans as 41,224. The practice largely obtains in the Otago and Canterbury Districts of persons taking unimproved lands from the proprietors for the purpose of raising one, two, or three grain-crops therefrom, the land being then sown down with grass-seed. The lands where so occupied are returned as separate holdings. When the low price of grain renders the cultivation for the crop only unprofitable, either land is not taken up in the manner indicated, or land so occupied reverts to the proprietor, and becomes part of his other holding.
In 1876 the number of occupied and cultivated holdings was estimated to be, on an average, 14·88 to every 100 adult males; in 1881, 17·30; in 1886, 20·17; and in 1891, 22·79. Assuming the ratio of adult males to total male population to be still the same as obtained by the census of 1891, the number of holdings in 1892 give an average of 24·43 to every 100 of the adult-male population. It is highly satisfactory to observe the progress, indicating as it does a continually increasing proportion of the grown people settling upon the land.
The extent of land in cultivation (including sown grasses and land broken up but not under crop) amounted to 8,893,225 acres. Of this area, land under artificial grasses comprised 83·25 per cent. of the total; under grain crops, 8·66 per cent.; under green and other crops, 6·51 per cent.; and land in fallow, 1·58 percent.
More than half the land under grain crops was in the Canterbury Provincial District, and more than one-third in Otago; but while the area of land in wheat was greater in Canterbury than in Otago by 194,255 acres, that under oats was less by 51,243 acres.
Of the total extent (24,268 acres) of land in barley, 10,361 acres were in Canterbury, 4,048 in Nelson, 3,960 in Otago, 2,420 in Marlborough, and 2,068 in Hawke's Bay.
The total area under wheat at the beginning of 1892 was 402,273 acres, and the produce was estimated at 10,257,738 bushels, an average yield per acre of 25·50 bushels. The produce in 1892 was greater by no less than 4,534,128 bushels than that obtained in 1891. This enormous difference is accounted for—first, by the larger area of land under wheat (402,273 acres against 301,460 in 1891), and secondly, by the increased average yield per acre, the average in 1891 having been only 18·99 bushels to the acre—the poorest on record.
The following gives the area in wheat and the estimated produce for each of the Australasian Colonies for the season of 1892:—
| Colony. | Wheat-crop, 1892. | ||
|---|---|---|---|
| Acres. | Bushels. | Bushels per Acre. | |
| Queensland | 19,306 | 392,309 | 20·33 |
| New South Wales | 356,666 | 3,963,668 | 11·11 |
| Victoria | 1,332,683 | 13,679,268 | 10·26 |
| South Australia | 1,552,423 | 6,436,486 | 4·90 |
| Western Australia | 26,866 | 295,526 | 11·00 |
| Tasmania | 47,584 | 937,680 | 19·25 |
| New Zealand | 402,273 | 10,257,738 | 25·50 |
| Totals | 3,737,801 | 35,962,677 | .. |
The amount of wheat consumed by the population or used up by them in any year is estimated by deducting from the results of the crop the amount exported in that year and the quantity of seed required for the next crop. It is impossible by this means to give an exact statement of the quantity required for actual consumption for several reasons: (1.) The crop itself is an estimate, and the actual harvested yield may be either considerably more or less. (2.) The amount retained in any one year may be largely in excess of the local requirements, and may form part of the following year's exports, thus apparently largely increasing the amount retained one year for consumption, and reducing the apparent amount retained for consumption the following year, which is calculated on the supposition that all the exports for that year are to be set against the crop for that year. It is thus clear that the results for any one year cannot be taken for the purpose of ascertaining the requirements of the people, and that even when taken for a term of years there will probably be a slight variation in the result, as any year's results are added to or subtracted from the computation.
The total average consumption of wheat in New Zealand for the period of 1877 to 1891, inclusive, estimated according to the foregoing method, was, apparently, 8·21 bushels per head of population, including Maoris. From this has to be deducted the wheat required for seed-purposes, estimated at 2 bushels to the acre. Exclusive of the quantity for seed, the requirements for food and other items of local consumption amounted to an average of 7·14 bushels per head.
The following table gives the particulars for each year and the results for the whole period:—
| TABLE SHOWING THE AMOUNT OF WHEAT ANNUALLY RETAINED IN THE COLONY. | ||||||||
|---|---|---|---|---|---|---|---|---|
| Year. | Produce (including estimated Quantity of Maori-grown Wheat and Imports of Wheat and Flour).* | Exports of Wheat and Flour.* | Retained in the Colony. | Used as Seed at 2 Bushels per Acre. | Difference for Food-consumption. | Mean Population (including Maoris). | Proportion per Head for Total retained for Food-consumption. | |
| For Food, &c. | Total retained | |||||||
| * In equivalent bushels of wheat. | ||||||||
| Bushels. | Bushels. | Bushels. | Bushels. | Bushels. | Persons. | Bush. | Bush. | |
| 1877 | 4,374,620 | 906,543 | 3,468,077 | 486,812 | 2,981,265 | 451,943 | 6·60 | 7·66 |
| 1878 | 6,537,770 | 1,897,354 | 4,640,416 | 529,722 | 4,110,694 | 467,000 | 8·80 | 9·94 |
| 1879 | 6,272,914 | 2,580,798 | 3,692,116 | 540,396 | 3,151,720 | 491,886 | 6·41 | 7·51 |
| 1880 | 7,801,892 | 3,147,586 | 4,654,306 | 649,898 | 4,004,408 | 518,275 | 7·73 | 8·98 |
| 1881 | 8,264,167 | 3,918,107 | 4,346,060 | 731,430 | 3,614,630 | 537,579 | 6·72 | 8·08 |
| 1882 | 8,360,295 | 3,721,812 | 4,638,483 | 781,636 | 3,856,847 | 552,991 | 6·91 | 8·39 |
| 1883 | 10,329,907 | 5,195,703 | 5,134,204 | 755,412 | 4,378,792 | 572,539 | 7·65 | 8·97 |
| 1884 | 9,934,101 | 2,885,390 | 7,048,711 | 540,086 | 6,508,625 | 595,411 | 10·93 | 11·84 |
| 1885 | 6,950,854 | 1,596,820 | 5,354,034 | 347,782 | 5,006,252 | 615,757 | 8·13 | 8·66 |
| 1886 | 4,290,826 | 1,675,201 | 2,615,625 | 506,050 | 2,109,575 | 624,086 | 3·38 | 4·19 |
| 1887 | 6,368,140 | 707,182 | 5,660,958 | 614,718 | 5,046,240 | 638,343 | 7·90 | 8·87 |
| 1888 | 9,472,895 | 2,547,033 | 6,925,862 | 724,306 | 6,201,556 | 647,340 | 9·58 | 10·70 |
| 1889 | 8,784,801 | 3,397,752 | 5,387,049 | 671,722 | 4,715,327 | 655,799 | 7·19 | 8·21 |
| 1890 | 8,468,853 | 4,899,069 | 3,569,784 | 602,920 | 2,966,864 | 664,460 | 4·47 | 5·37 |
| 1891 | 5,950,244 | 1,610,973 | 4,339,271 | 804,546 | 3,534,725 | 671,776 | 5·26 | 6·46 |
| Totals and Averages | 112,162,279 | 40,687,323 | 71,474,956 | 9,287,436 | 62,187,520 | 8,705,185 | 7·14 | 8·21 |
The difficulty of correctly estimating the consumption of breadstuffs is shown by the great differences in the estimates arrived at. Mr. Mulhall, in his “Dictionary of Statistics,” gives the consumption of wheat per inhabitant as follows:—
| Bushels of 60lb. each per Head. | |
| United Kingdom | 330lb., equal to 5·50 |
| Prance | 445lb., equal to 7·58 |
| Germany | 160lb., equal to 2·77 |
The average quantity required for local consumption per head of the population (exclusive of that for seed purposes) is estimated by the Government Statistician of New South Wales at 6·5 bushels for that colony, and by the Statist of Victoria at 4 1/2 to 5 bushels for the last-mentioned colony.
The consumption of wheaten breadstuffs in New Zealand is thus considerably in excess of that in Victoria, and is also in excess of the consumption per head in New South Wales and the other Australian Colonies. The flour used in the colony is produced by local mills, the quantity imported in 1891 having been only 1,063 centals, less than 50 tons; but the quantity exported amounted, to 3,588 tons.
If, in New Zealand, 7·14 bushels per head be taken as the amount of wheat actually required for home consumption by an estimated mean population in 1892 of 680,000 persons, and allowing seed for 420,000 acres at 2 bushels per acre, there would, on the wheat-crop of 1892 be a surplus available for export of 4,562,538 bushels, equivalent to about 122,219 tons.
The number of acres under oats (for grain) at the commencement of 1892 was 323,508, and the produce was estimated at 11,009,020 bushels, giving an average yield per acre of 34·03 bushels. Of the land in oats in 1892, rather more than 52 per cent., producing over 58 per cent. of the total crop, was in Otago. Canterbury took second place for oat-production, with 36·38 per cent. of the area and 31·28 per cent. of the produce.
The oat-crop in 1892 for all the Australasian Colonies was as follows:—
| Acres. | Bushels. | Average per Acre. | |
| Queensland | 715 | 16,669 | 23·31 |
| New South Wales | 12,958 | 276,259 | 21·32 |
| Victoria | 190,157 | 4,455,451 | 23·43 |
| South Australia | 12,637 | 80,876 | 6·16 |
| Western Australia | 1,301 | 18,214 | 14·00 |
| Tasmania | 28,360 | 876,573 | 30·91 |
| New Zealand | 323,508 | 11,009,020 | 34·03 |
| Totals | 569,636 | 16,733,062 | .. |
Only 24,268 acres were returned as under barley in 1892, the estimated crop being 688,683 bushels, an average yield per acre of 24·38 bushels. In the previous year the area under barley was 32,740 acres, and the crop 758,833 bushels.
The estimated potato-crop was 162,046 tons from 27,266 acres, or an average yield per acre of 5·94 tons.
The low prices of grain and the rapid expansion of the frozen-meat trade has caused greater attention to be given to sheep-feeding, and, as a result, a large increase in the extent of land under turnips and rape might be expected. In 1892 there were 422,354 acres under this class of crop, an area greater by 20,170 acres than in the previous year.
Only 639 acres were under hops in 1892, giving a total produce of 6,810cwt., but even this comparatively small area is more than sufficient to supply local requirements, the imports in 1891 having been slightly over 266cwt., while the exports amounted to 2,646cwt. In 1890 the total quantity used by the breweries in the colony amounted to 3,940cwt. Of the land under hops in 1892, 524 acres were in the Waimea County and 77 in Collingwood, both in the Provincial District of Nelson.
The cultivation of tobacco does not progress in New Zealand. In 1889, 34 acres were being cultivated; in 1890, 25 acres; in 1891, 16 acres; and in 1892, only 6 acres.
The relative duties imposed upon New-Zealand-grown and imported tobaccos are as follow:—
| New-Zealand-grown tobacco manufactured in the colony | 1s. the pound. |
| Imported manufactured tobacco | 3s. 6d. the pound. |
| Imported unmanufactured tobacco | 1s. 6d. the pound. |
| Imported tobacco manufactured in the colony | 1s. the pound. |
If the New-Zealand-grown leaf was of sufficiently good quality to be manufactured by itself the practical protection would amount to 2s. 6d. per pound, (i.e., the difference between the duty on the imported manufactured tobacco, 3s. 6d., and the excise duty on the New-Zealand-grown tobacco manufactured in the colony, 1s.). But, in order to produce a marketable commodity, New-Zealand-grown leaf is mixed with imported unmanufactured tobacco, on which a duty of 1s. 6d. the pound is levied. The difference in duties is not apparently sufficient to encourage the cultivation of tobacco to any extent.
There were 19,627 acres returned as being in orchards in 1892, an increase of 2,580 acres. The success of attempts that have been made to place fruit in a good saleable condition on the English market has given encouragement to cultivators, and fruits are expected in the not distant future to take an important place in the list of New Zealand exports.
New Zealand is pre-eminently and above all things a country suitable for grazing purposes. Wherever there is light and moisture English grasses thrive when the natural bush and fern and other vegetation are cleared off. In fact, the white-clover gradually overcomes the fern; and, from the mildness of the winter season, there are few places where there is not some growth even in the coldest months of the year. In all parts of the colony stock live, although in varying condition, without other food than such as they can pick up. Sown grass, as might be expected, takes the lead in the list of cultivations.
In February, 1892, there were 7,403,881 acres under artificial grasses. Of these, 3,327,755 acres had been previously ploughed, and presumably under grain or other crops, and 4,076,126 acres had not been ploughed; a large proportion consisting of what had been bush- or forest-land sown down with grass after the timber had been burnt or partially burnt off.
The following shows the acreage in sown grasses in each of the Australasian Colonies in 1892:—
| Acres. | |
| Queensland | 20,921 |
| New South Wales | 333,238 |
| Victoria | 174,982 |
| South Australia | 17,519 |
| Western Australia (1891) | 23,344 |
| Tasmania | 208,596 |
| New Zealand | 7,403,881 |
It will be observed that the area of land under sown grasses was over nine times greater in New Zealand than in the whole of Australia and Tasmania. When compared in size with the colonies of Australia, New Zealand is relatively small—about one-thirtieth of their total size—but when the grazing-capabilities are compared the relative importance of New Zealand is much greater. Australia is generally unsuitable, owing to conditions of climate, for the growth of English grasses, and the amount of feed produced by the natural grasses throughout the year is very much less per acre than that obtained from the sown-grass lands in New Zealand—so much so that it may be stated that the average productiveness of the grassland in New Zealand is probably about nine times as great as that in Australia; so that the land of this colony covered with artificial grass may be considered equal, for grazing purposes, to an area of Australian territory about nine times as great.
The total quantity of grass-seed produced was, in 1892, returned at 1,436,936 bushels, of which 572,425 bushels were cocksfoot and 864,511 bushels ryegrass. The value of both kinds together is calculated to be about £294,400.
The total value of all agricultural produce, &c., based on the returns for 1892, is estimated to amount to about £4,887,346, made up as follows:—
| £ | |
| Grain and pulse | 2,873,177 |
| Root-crops | 844,153 |
| Hops and other crops | 44,787 |
| Hay and green forage (excluding grass) | 392,314 |
| Grass-seed | 294,395 |
| Garden- and orchard-produce | 438,525 |
| Total value of agricultural produce | £4,887,351 |
Returns of sheep are sent annually, in April, to the Agricultural Department, but full returns of other stock are only obtained when a census is taken. The number of each kind of live-stock, according to the returns from the European portion of the population, in the colony in each of the census years 1886 and 1891 is given below:—
| Live-stock. | Census, 1831. | Census, 1886. |
|---|---|---|
| Horses | 211,040 | 187,382 |
| Brood-mares (included in foregoing) | 31,276 | 29,853 |
| Asses and mules | 348 | 297 |
| Cattle (including calves) | 788,919 | 853,358 |
| Breeding-cows (included in foregoing) | 280,711 | 279,136 |
| Milch-cows (also included in breeding-cows) | 206,906 | Not specified. |
| Sheep (including lambs) | 17,865,423 | 16,564,595 |
| Breeding-ewes (included in foregoing) | 7,371,429 | 6,457,355 |
| Goats | 9,055 | 10,220 |
| Pigs | 222,553 | 277,901 |
| Poultry | 1,790,070 | 1,679,021 |
| Ostriches | 179 | .. |
The above statement does not include the live stock owned by Maoris. A census was taken of the Native population, their stock and cultivations, about the same time the census of the rest of the population was taken, but not of so elaborate a character. The results of the Native census gave the following numbers of stock owned by them: Sheep, 262,763; cattle, 42,912; pigs, 86,259; no statement of the horses, which are numerous with them, being given. The full number of those kinds of stock for the colony was, therefore,—
| Sheep | 18,328,186 |
| Cattle | 831,831 |
| Pigs | 308,812 |
The number of sheep, ascertained from the compilation of the census results, was over one and a third million more than the number returned to the Department of Agriculture nearly a month later. The returns of sheep owned by Maoris are required to be made to that department. Some allowance should be made for the number slaughtered for home use and freezing in the interval, but that would only account for a comparatively small part of the difference. The fact that no house escapes visitation at the time of the census, and that the numbers then given are not used for taxing purposes, may probably largely account for the difference, and cause the census results to be accepted as the most accurate.
The following gives the number of the principal kinds of livestock in the several Australasian Colonies:—
| Sheep. | Cattle. | Horses. | |
|---|---|---|---|
|
* Including those owned by Maoris. † Excluding those owned by Maoris. | |||
| Queensland | 20,289,633 | 6,192,759 | 399,364 |
| New South Wales | 61,831,416 | 2,046,347 | 459,755 |
| Victoria | 12,919,428 | 1,813,159 | 440,496 |
| South Australia | 7,646,239 | 399,077 | 188,587 |
| Western Australia | 1,962,212 | 133,690 | 40,812 |
| Tasmania | 1,619,256 | 162,440 | 31,165 |
| New Zealand | *18,128,186 | *831,831 | †211,040 |
New Zealand thus takes third place in order for number of sheep, and fourth for the number of her cattle.
Butter has always held an important position among the productions of the New Zealand small farmer, but, made by different persons and in different ways, it has not been generally suitable for the requirements of the English market, although considerable quantities have been exported to Australia and also to the United Kingdom; but the success attending the efforts made to produce butter of uniform superior character in dairy factories, and the fairly remunerative prices that have been realised for such butter in England, have caused great attention to be given to the dairy factories for the purpose of supplying produce for the English market.
It is only in census years that any information is obtained of the quantity of butter and cheese annually produced in the colony, and the returns then given by farmers can only be deemed to be estimates, as the majority of them do not keep accounts of their production.
The following are the results of the returns made in the census years mentioned. The numbers represent the quantities produced in the preceding years:—
| ANNUAL PRODUCTION OF— | ||
|---|---|---|
| Cheese. Lb. | Butter. Lb. | |
| Census year, 1881 | 3,178,694 | 8,453,815 |
| Census year, 1886 | 4,594,795 | 12,170,964 |
| Census year, 1891 | 6,975,698 | 16,310,012 |
The figures for 1891 include 1,969,759lb. of butter and 4,390,400lb. of cheese made in factories.
The importance of the dairy industry to New Zealand caused the Government to appoint a Chief Dairy Instructor, to visit factories and give lectures and addresses on the benefits of co-operative dairying, the manufacture of cheese and butter, and subjects relating thereto. Information as to this industry will be found in a separate article further on.
The number of dairy factories ascertained by the census returns was 71 cheese- and butter-factories and 3 creameries, employing 218 men and 51 women. The total value of the produce for 1890 was £150,957, viz.: Cheese, £68,710; butter, £73,340; bacon, £1,707; other products, £7,200.
The growing importance of our export trade of butter and cheese with the United Kingdom, which must be regarded as the market chiefly to be considered, is shown in the table on page 72.
Important as are the grazing and dairy interests to New Zealand, yet the future is intimately bound up with mining interests: the mineral resources are very great. In the past these have had a most important influence on the development and progress of the colony. Gold to the value of £47,433,117 was obtained prior to the 31st December, 1891. The gold produce in 1891 was of the value of £1,007,488. In the earlier years the gold was obtained from alluvial diggings, but at the present time is largely taken from gold-bearing quartz, which is distributed widely through several parts of the colony, and thus there is a much better prospect for the permanency of this industry than was afforded by the alluvial diggings. The amount of silver extracted to the end of 1891 only amounted to £140,148 in value, but recent discoveries of ore give promise of large production in the future. Of other minerals, the product to the same date amounts to £9,810,255, of which kauri-gum yielded £5,831,743, and coal, with coke, £3,758,947. The following gives the production of precious metals and minerals during the year 1891:—
| Oz. | £ | Total Value since 1853. | |
| Gold | 251,996 | 1,007,488 | |
| Silver | 28,023 | 5,151 | £ |
| 280,019 | 1,012,639 | 47,573,205 | |
| Tons. | |||
| Copper-ore | 0 1/6 | 4 | 17,866 |
| Chrome-ore | .. | .. | 37,367 |
| Antimony-ore | 413 | 4,950 | 41,140 |
| Manganese-ore | 1,153 | 2,634 | 53,925 |
| Hæmatite-ore | 0 1/10 | 1 | 226 |
| Mixed minerals | 2 | 0 | 69,041 |
| Coal | 668,794 | 379,738 | 3,741,048 |
| Coke (exported) | 2,544 | 3,658 | 17,899 |
| Kauri-gum | 8,388 | 437,056 | 5,831,743 |
| £1,840,686 | £57,383,520 |
The approximate total output of the coal-mines to the 31st December, 1891, amounted to 7,131,986 tons.
[For full account of mines and minerals see special article, post.]
The following table shows the number of principal industries at the end of 1890, the number of hands employed, the amount of wages paid to them, the estimated value of capital invested in land, buildings, machinery, and plant, and the value of the manufactures in that year:—
| Nature of Industry. | Number of each Kind. | Number of Hands employed. | Amount paid in Wages. | Estimated Value of Land, Buildings, Machinery, and Plant. | Estimated Value of Produce and Manufactures in 1890. |
|---|---|---|---|---|---|
| £ | £ | £ | |||
| Rope- and twine-works | 24 | 222 | 13,658 | 36,086 | 76,711 |
| Flax-mills | 177 | 3,204 | 116,168 | 146,792 | 234,266 |
| Meat-preserving, freezing, and boiling-down works | 43 | 1,568 | 138,459 | 476,151 | 1,464,659 |
| Bacon-curing establishments | 33 | 84 | 6,696 | 14,180 | 83,435 |
| Cheese- and butter-factories | 74 | 269 | 11,928 | 100,453 | 150,957 |
| Grain-mills | 129 | 499 | 52,384 | 391,828 | 991,812 |
| Biscuit-factories | 22 | 331 | 17,199 | 48,960 | 127,147 |
| Fruit-preserving and jam-making works | 15 | 117 | 4,742 | 10,042 | 27,255 |
| Breweries | 102 | 476 | 54,825 | 236,825 | 66,764 |
| Malthouses | 27 | 87 | 7,875 | 42,442 | 80,341 |
| Aërated-water factories | 112 | 261 | 17,021 | 73,147 | 91,691 |
| Coffee- and spice-works | 17 | 81 | 6,562 | 30,850 | 64,024 |
| Soap- and candle-works | 19 | 209 | 21,394 | 74,443 | 155,714 |
| Saw-mills | 243 | 3,266 | 271,814 | 500,272 | 832,959 |
| Chaff-cutting establishments | 63 | 205 | 7,330 | 36,300 | 41,455 |
| Gas-works | 27 | 249 | 31,700 | 730,490 | 178,947 |
| Brick-, tile-, and pottery-works | 106 | 494 | 25,190 | 119,780 | 56,830 |
| Iron and brass foundries | 68 | 1,727 | 152,687 | 262,042 | 390,943 |
| Spouting- and ridging-works | 12 | 100 | 7,981 | 29,670 | 33,140 |
| Gold- and quarts-mining | 135 | 1,971 | 183,582 | 241,715 | 279,893 |
| Hydraulic gold-mining and gold-dredging | 74 | 495 | 32,904 | 154,270 | 73,713 |
| Collieries | 95 | 1,655 | 173,538 | 155,671 | 279,777 |
| Other industries | 295 | 1,881 | 117,415 | 671,172 | 860,851 |
| Totals | 2,570 | 29,880 | 2,209,859 | 5,826,976 | 9,422,146 |
The number of these industries has increased from 2 268 in 1885 to 2,570 in 1890, the number of hands employed from 25,655 to 29,880, and the value of the produce from £7,436,649 to £9,422,146. No information having been obtained at the census of 1886 as to the wages paid, no comparison can be made between the amount paid in 1885 and that in 1890. The value of land, buildings and plant increased only from £5,697,117 to £5,826,976, notwithstanding the increase of 302 in the number of industries.
The number of writs of summons tested in the Supreme Court in 1891 was 744. Of 184 cases tried, 110 were heard by a Judge sitting without a jury. Judgments were recorded for a total of £57,356, and 131 writs of execution were issued.
In the District Courts 72 civil cases were disposed of. Of these 53 were tried, 23 before a Judge alone. Judgments were recorded for £1,588 4s. 2d. The figures for the Resident Magistrates' Courts for 1891 are not yet made up: those for 1890 were—crises tried 17,790; amounts recovered, £141,077 7s. 11d.
The petitions in bankruptcy numbered 605 in 1891, of which 573 were made by debtors and 32 by creditors. This number was the lowest in any one of the past six years.
The following gives the number of petitions, the total amount of
THE items mentioned below having been accidentally omitted from the statement of industries on page 104, it is requested that this slip may be inserted opposite the incomplete table:—
| Nature of Industry. | Number of each Kind. | Number of Hands employed. | Amount paid in Wages. | Estimated Value of Land, Buildings, Machinery, and Plant. | Estimated Value of Produce and Manufactures in 1890. |
|---|---|---|---|---|---|
| £ | £ | £ | |||
| Printing, &c., establishments | 142 | 2,569 | 214,185 | 341,683 | 354,559 |
| For machines, tools, and implements | 43 | 557 | 45,856 | 76,783 | 147,364 |
| Coach-building and -painting | 108 | 678 | 52,601 | 96,225 | 139,660 |
| Tanning, fellmongering, and wool-scouring | 104 | 1,196 | 92,442 | 153,592 | 1,026,349 |
| Ship- and boat-building | 37 | 145 | 10,831 | 10,172 | 35,847 |
| Sail and oilskin factories | 32 | 124 | 6,335 | 16,799 | 31,088 |
| Furniture factories | 94 | 585 | 42,743 | 96,543 | 131,314 |
| Chemical works | 8 | 55 | 5,754 | 23,766 | 41,568 |
| Woollen mills | 8 | 1,175 | 79,040 | 259,955 | 279,175 |
| Clothing factories | 19 | 1,290 | 52,754 | 59,735 | 166,579 |
| Hat and cap factories | 16 | 112 | 6,276 | 26,005 | 21,628 |
| Boot and shoe factories | 47 | 1,943 | 124,990 | 82,137 | 403,736 |
| Year. | Petitions for | Decrees for | ||
|---|---|---|---|---|
| Dissolution of Marriage. | Judicial Separation. | Dissolution of Marriage. | Judicial Separation. | |
| 1887 | 26 | 6 | 16 | 1 |
| 1888 | 35 | 3 | 32 | .. |
| 1889 | 26 | 7 | 17 | 1 |
| 1890 | 24 | 8 | 21 | 3 |
| 1891 | 31 | 5 | 20 | 3 |
Excluding Maoris, 344 persons—321 men and 23 women—were indicated, &c., in the Supreme and District Courts during the year 1891. Of these, 201 men and 13 women were convicted—27 men and 4 women of offences against the person, 133 men and 8 women or offences against property, and 41 men and 1 woman of other offences. There were 12 Maoris indicted, viz. — 5 for larceny 2 for horse- and cattle-stealing), 1 for wilful damage, 2 for perjury, 2 for personation, and 2 for conspiracy: of these 7 were convicted. Thus the total number of persons convicted was 221, of whom 2 (both women) were sentenced to death, 6 men to penal servitude for seven years or upwards; 19 men and 5 women were released under the First Offenders' Probation Act, 10 men were held to bail, 2 men were fined, and the rest sentenced to terms of imprisonment, varying from seven years to one month.
The number of charges against persons for various offences brought before the Magistrates' Courts in 1890 was 18,701. These include repeated charges against the same person. In 1889 the number was 18,845; in 1888, 19,167; and in 1887, 20,336. Of these charges in 1890, 454 were against Maoris.
The summary convictions numbered 14,128, including 243 of Maoris; and 471 males, including 38 Maoris, and 25 females were committed for trial by the superior Courts.
There are in the colony 10 principal gaols and 28 minor ones.
The total number of prisoners in these gaols at the end of the year 1891 was (including 94 Maoris) 534, of whom 472 were males and 62 females. Included are 48 debtors and 83 lunatics.
It has been found impossible to collect complete statistics relating to education for the year 1891 in time for this publication, and the following summary for the previous year is accordingly given. Full details of the Government schools for 1891 will, however, be found in the special article dealing with the system of education in the colony:—
NUMBER OF PUBLIC (PRIMARY) SCHOOLS, COLLEGES, GRAMMAR AND HIGH SCHOOLS, PRIVATE SCHOOLS, INDUSTRIAL SCHOOLS, ORPHANAGES, AND NATIVE SCHOOLS, IS THE COLONY OF NEW ZEALAND, ON 31st DECEMBER, 1890; TOGETHER WITH THE NUMBER OF INSTRUCTORS, AND THE NUMBER OF SCHOLARS THEREIN.
| Description of Schools. | Number of Schools. | Number of Instructors. | Number of Scholars for the Fourth Quarter of 1890. | ||||
|---|---|---|---|---|---|---|---|
| Males. | Females. | Total. | Males. | Females. | Total. | ||
|
* Exclusive of 162 sewing mistresses. † Exclusive of 41 sewing mistresses. | |||||||
| EUROPEAN. | |||||||
| Public (Government) schools (scholars other than Maoris and half-castes) | 1,200 | 1,301 | 1,677 | 2,978* | 60,216 | 56,531 | 116,747 |
| Public (Government) schools (half-castes living among Europeans) | 328 | 333 | 661 | ||||
| Colleges, grammar and high schools (aided or endowed) | 22 | .. | .. | 145 | 1,293 | 824 | 2,117 |
| Private schools (excluding Maori scholars) | 298 | 108 | 630 | 738 | 5,759 | 7,867 | 13,626 |
| Industrial schools and orphanages | 10 | .. | .. | 10 | 388 | 330 | 718 |
| European children attending Native village schools | .. | .. | .. | .. | 201 | 205 | 406 |
| School for deaf-mutes | 1 | 3 | 1 | 4 | 28 | 14 | 42 |
| Totals—Europeans | 1,531 | .. | .. | 3,875 | 68,213 | 66,104 | 134,317 |
| MAORI. | |||||||
| Native village schools supported by Government (excluding European children stated above) | 68 | 59 | 35 | 94† | 1,032 | 821 | 1,853 |
| Native boarding-schools (maintenance of scholars paid by Government) | 4 | 5 | .. | 5 | 40 | 39 | 79 |
| Native boarding-schools (maintenance of scholars paid from endowments) | .. | 84 | 19 | 103 | |||
| Private Native schools | 2 | .. | 1 | 1 | 38 | 17 | 55 |
| Maori scholars attending public (Government) schools | .. | .. | .. | .. | 251 | 162 | 418 |
| Maori scholars attending private schools for Europeans | .. | .. | .. | .. | 16 | 49 | 65 |
| Half-castes living as Maoris attending public (Government) schools | .. | .. | .. | .. | 56 | 35 | 91 |
| Totals—Maoris | 74 | 64 | 36 | 100 | 1,517 | 1,142 | 2,659 |
The following gives, for the five years 1886-90, the number of private schools and of pupils attending them, exclusive of Maoris, the number of Roman Catholic schools and pupils being also shown separately:—
| Year. | Number of Private Schools. | Pupils. | Total Pupils. | Included in Previous Numbers. | ||
|---|---|---|---|---|---|---|
| Boys. | Girls. | Roman Catholic Schools. | Pupils at Roman Catholic Schools. | |||
| 1886 | 288 | 5,216 | 7,257 | 12,473 | 83 | 7,991 |
| 1887 | 299 | 5,771 | 7,616 | 13,387 | 90 | 8,946 |
| 1888 | 299 | 5,874 | 7,979 | 13,853 | 96 | 9,346 |
| 1889 | 293 | 5,778 | 7,680 | 13,458 | 95 | 9,024 |
| 1890 | 298 | 5,759 | 7,867 | 13,626 | 108 | 9,474 |
The census figures relating to attendance at school, given previously, will be found to show somewhat higher numbers than these. There are several reasons for this discrepancy, the chief being that the census was taken on the 1st April, 1891, and the attendance for the March quarter is always higher than for the preceding December quarter.
Information as to colleges, grammar and high schools (aided or endowed), industrial schools and orphanages, is given in a special article on “Public Instruction;” and as to Native schools in another article on “The Maoris: their number and present condition.”
The New Zealand University is not a teaching body; the undergraduates for the most part keep their terms at one of the affiliated institutions, which are the following: the Auckland University College, the Canterbury College, and the University of Otago; each having a staff of professors. The number of graduates at the end of 1891 who had obtained direct degrees was 324. The number of undergraduates on the roll of the University on the 1st June, 1891, was 1,161, but only 575 were keeping terms, of whom 364 were males and 211 females. Thirty-three of the males were medical students at the University of Otago. The number of students attending lectures at the affiliated institutions during the year 1891-92 was as follows:—
| Males. | Females. | ||||
|---|---|---|---|---|---|
| Matriculated. | Not matriculated. | Matriculated. | Not matriculated. | Total. | |
| Auckland University College | 33 | 59 | 22 | 42 | 156 |
| Canterbury College | 101 | 67 | 71 | 110 | 349 |
| University of Otago | 127 | 40 | 25 | 8 | 200 |
| Totals | 261 | 166 | 118 | 160 | 705 |
The total revenues for the financial year ended 31st March, 1891, of the various County and Borough Councils, and Road, Town, River, Drainage, and Harbour Boards, amounted to £1,363,247 17s. 4d., of which the receipts from rates amounted to £463,581 3s. 7d., and those from the General Government to £144,008 4s. 1d.
The following shows the amount of rates collected and the amount of indebtedness on account of loans at the end of each of the past ten financial years:—
| Year ended 31st March. | Rates collected by Local Bodies. | Outstanding Loans of Local Bodies. | ||
|---|---|---|---|---|
| £ | s. | d. | £ | |
| 1882 | 297,327 | 18 | 9 | 3,277,584 |
| 1883 | 327,128 | 8 | 11 | 3,540,046 |
| 1884 | 398,659 | 5 | 11 | 3,962,330 |
| 1885 | 401,392 | 18 | 6 | 4,313,223 |
| 1886 | 410,638 | 15 | 3 | 4,943,270 |
| 1887 | 434,236 | 12 | 2 | 5,620,747 |
| 1888 | 433,831 | 12 | 7 | 5,812,803 |
| 1889 | 445,928 | 19 | 10 | 5,892,050 |
| 1890 | 460,302 | 14 | 9 | 5,978,059 |
| 1891 | 463,581 | 3 | 7 | 6,042,693 |
The rates collected by the Drainage and Harbour Boards included in the above amounts were in each case for the year ending the previous 31st December.
The loans do not include those advanced by the General Government under special statutes, and repayable by instalments, of which the outstanding debentures at the end of March, 1891, amounted to £384,780 12s. 1d.
Of the amount—£6,042,693—-of indebtedness of local bodies for the year 1890-91, £985,114 was raised within and £5,057,579 outside the colony. The debt of the Harbour Boards was the largest item, £3,226,000; the Borough Councils owed £2,540,390; the Christchurch Drainage Board, £200,000; the River Boards, £49,155; Road Boards, £15,200; the counties, £8,010; and the Town Boards, £3,938. The lowest rate of interest paid was 4 per cent.; £2,644,558 of the total indebtedness was raised at 6 per cent., £2,394,329 at 5 per cent., and £399,026 bore interest as high as 7 per cent.
| LOANS OF LOCAL BODIES RAISED WITHIN AND WITHOUT THE COLONY. | ||||||||||||
|---|---|---|---|---|---|---|---|---|---|---|---|---|
| INDEBTEDNESS of Counties, Boroughs, Town, Road, and River Boards as on the 31st March, 1891, and of Harbour and Drainage Boards as on the 31st December, 1890, classified according to the Rates of Interest paid, distinguishing Loans raised in the Colony from those raised elsewhere. (See Note.) | ||||||||||||
| Loans raised in the Colony. | ||||||||||||
| Local Bodies. | 4% | 4 1/2% | 5% | 5 1/2% | 5 3/4% | 6% | 6 1/2% | 7% | 7 1/2% | 8% | 9% | Total. |
| * Not including loans repayable by annual instalments under “The Roads and Bridges Construction Act, 18825,” and “The Government Loans to Local Bodies Act, 1886,” together amounting to £384,780 12s. 1d. | ||||||||||||
| £ | £ | £ | £ | £ | £ | £ | £ | £ | £ | £ | £ | |
| Counties | .. | .. | .. | .. | .. | 4,000 | 500 | 3,510 | .. | .. | .. | 8,010 |
| Boroughs | .. | .. | 83,700 | 11,500 | 6,000 | 305,485 | 27,976 | 164,866 | .. | 6,484 | .. | 606,011 |
| Town Boards | .. | .. | .. | .. | .. | 3,238 | 500 | .. | .. | .. | 200 | 3,938 |
| Road Boards | .. | .. | 4,200 | .. | .. | 6,000 | 1,500 | 2,500 | .. | 1,000 | .. | 15,200 |
| River Boards | .. | .. | 5,500 | .. | .. | 16,335 | .. | 2,500 | 3,820 | .. | .. | 28,155 |
| Harbour Boards | .. | .. | 249,500 | 35,000 | .. | 19,650 | 10,000 | 9,650 | .. | .. | .. | 323,800 |
| Total | .. | .. | 342,900 | 46,500 | 6,000 | 354,708 | 40,476 | 183,026 | 3,820 | 7,484 | 200 | 985,114 |
| Loans raised outside the Colony. | ||||||||||||
| Boroughs | .. | 150,300 | 561,429 | .. | .. | 1,008,350 | .. | 214,300 | .. | .. | .. | 1,934,379 |
| River Boards | .. | .. | 21,000 | .. | .. | .. | .. | .. | .. | .. | 21,000 | |
| Harbour Boards | 250,000 | 100,000 | 1,409,000 | .. | .. | 1,081,500 | .. | 1,700 | .. | .. | .. | 2,902,200 |
| Drainage Board | .. | .. | .. | .. | .. | 200,000 | .. | .. | .. | .. | .. | 200,000 |
| Total | 250,000 | 250,300 | 2,051,429 | .. | .. | 2,289,850 | .. | 216,000 | .. | .. | .. | 5,057,579 |
| Total Loans raised. | ||||||||||||
| Counties | .. | .. | .. | .. | .. | 4,000 | 500 | 3,510 | .. | .. | .. | 8,010 |
| Boroughs | .. | 150,300 | 645,129 | 11,500 | 6,000 | 1,313,835 | 27,976 | 379,166 | .. | 6,484 | .. | 2,540,390 |
| Town Boards | .. | .. | .. | .. | .. | 3,238 | 500 | .. | .. | .. | 200 | 3,938 |
| Road Boards | .. | .. | 4,200 | .. | .. | 6,000 | 1,1500 | 2,500 | .. | 1,000 | .. | 15,200 |
| River Boards | .. | .. | 26,500 | .. | .. | 16,335 | .. | 2,500 | 3,820 | .. | .. | 49,155 |
| Harbour Boards | 250,000 | 100,000 | 1,718,500 | 35,000 | .. | 1,101,150 | 10,000 | 11,350 | .. | .. | .. | 3,226,000 |
| Drainage Board | .. | .. | .. | .. | .. | 200,000 | .. | .. | .. | .. | .. | 200,000 |
| Total loans raised | 250,000 | 250,000 | 2,394,329 | 46,500 | 6,000 | 2,644,558 | 40,476 | 399,026 | 3,820 | 7,484 | 200 | 6,042,693 |
The total value of rateable property in counties which was not included in any road or town district was, on the 31st March, 1891, £27,058,062; of this, the value of the rateable Crown and Native lands amounted to £5,855,005. The rateable value of Crown and Native lands was less than in the previous year by £185,650, but the rateable value of the rest of the land was greater by £510,917; the increase in the total of the rateable values being £325,267.
The revenue for the financial year 1890-91 of all the counties in which the Counties Act is in full operation was £239,818 18s. 6d. Of this, the sum of £121,446 19s. 7d. was raised by rates.
The expenditure of these counties amounted altogether to £291,201 8s., of which the sum of £196,550 13s. 5d. was spent on public works, £39,158 2s. 7d. on management, and £25,914 2s. on hospitals and charitable aid.
In the majority of the boroughs the rates are levied on the annual values of the rateable properties, and the returns only give those values; but in thirteen boroughs the capital values only are the bases for rating purposes. The total annual value of properties in 74 of the boroughs was, in March, 1891, £2,079,459, a decrease on the total value in 1890 of £2,879. The Act under which the valuation is made provides for a reduction from the renting-value of 20 per cent. on houses and buildings, and 10 per cent. on land. The actual annual value of the properties will therefore be greater than the rating values by from 11 to 25 per cent.
The estimated capital value in the remaining thirteen boroughs was £2,643,750.
The total revenues of the boroughs for the past year amounted to £425,800 5s. 7d.; of this, the sum of £213,508 12s. 2d. was received from rates.
Of a total expenditure by the boroughs amounting to £443,361 4s. 7d., the sum of £166,548 16s. 3d. was spent on public works, £20,165 4s. 5d. on hospitals and charitable aid, and £44,950 16s. 9d. on management.
The indebtedness of the boroughs on account of outstanding loans was, at the end of March, 1891, £2,540,390.
The properties in the various town districts are not rated on a uniform system. In the majority of the districts the rate is levied on the total value of the property; in the others, on the annual value; but in each of the road districts the rate is levied on the total value.
The estimated total value of properties in the first-mentioned town districts in March, 1891, was £1,377,562, and the annual value of the properties in the rest of the districts was £44,141.
The total rateable value of properties in the road districts was £43,309,243. In each case the value of rateable Crown and Native lands are included. These amounted in March, 1891, to £2,469,865 of the total value of rateable properties in road districts; also to £32,539 of the total value, and to £662 of the annual value, of property in town districts.
Excluding the Crown and unoccupied Native lands, the values of the rateable properties in the colony in each of the years ending in March, 1889, 1890, and 1891 were as follows:—
| — | 31st March, 1889. Rated on | 31st March, 1890. Rated on | 31st March, 1891. Rated on | |||
|---|---|---|---|---|---|---|
| Total Value. | Annual Value. | Total Value. | Annual Value. | Total Value. | Annual Value. | |
| £ | £ | £ | £ | £ | £ | |
| In counties (not in road districts) | 20,971,397 | .. | 20,692,140 | .. | 21,203,057 | .. |
| In road districts | 41,882,668 | .. | 41,075,208 | .. | 40,839,378 | .. |
| In town districts | 1,540,183 | 49,594 | 1,491,758 | 49,251 | 1,345,023 | 43,479 |
| In boroughs | 2,123,294 | 2,279,491 | 2,082,338 | 2,311,694 | 2,643,750 | 2,079,459 |
| Totals | 66,517,542 | 2,329,085 | 65,341,444 | 2,360,945 | 66,031,208 | 2,122,938 |
Assuming that the capital value is worth sixteen times the stated annual value (it should be worth more, for, as has been previously remarked, the stated annual value should be increased from 11 to 25 per cent., according to whether the property consists of land or houses, in order to arrive at the full annual value), then the total value of all rateable property, excepting Crown and unoccupied rateable Native lands, in each of the five past years would be as follows:—
| Year. | Value of Properties rated on Basis of Total Value. | Annual Value of Properties rated on that Basis. | Annual Value capitalised by multiplying by 16. | Total Value of Rateable Property in Colony, except Crown and Native Lands. |
|---|---|---|---|---|
| £ | £ | £ | £ | |
| 1886-87 | 64,458,314 | 2,353,410 | 37,654,560 | 102,112,874 |
| 1887-88 | 66,784,806 | 2,223,950 | 35,583,200 | 102,368,006 |
| 1888-89 | 66,517,542 | 2,329,085 | 37,265,360 | 103,782,902 |
| 1889-90 | 65,341,444 | 2,360,945 | 37,775,120 | 103,116,564 |
| 1890-91 | 66,031,208 | 2,122,938 | 33,967,008 | 99,998,216 |
The total revenue of the Town Boards amounted to £14,751 11s. 9d., of which rates yielded £4,874 5s. 5d.
The total revenue of the Road Boards amounted to £127,104 0s. 8d., of which rates yielded £77,699 2s. 3d.
The total revenue of the River Boards, exclusive of the Inch-clutha Board, which is also a Road Board, amounted to £8,598 6s. 9d., of which the receipts from rates amounted to £6,951 8s. 11d.
Of the total revenue of the Harbour Boards, amounting to £287,880 11s. 9d., rates yielded £20,621 10s. 6d. There is only one Drainage Board—that for the Christchurch district. The revenue for 1890-91 amounted to £14,734 3s. 1d., chiefly from rates, which yielded £14,721 18s. 1d.
The amount of direct taxation imposed on the people by these local bodies in the form of rates amounted to a gross sum of £463,581 3s. 7d., equivalent to an average of 14s. 10d. per head of the population.
Table of Contents
IT may be said, without fear of contradiction, that there is no part of the British dominions where agriculture, in its most extended sense, can be carried on with so much certainty, and with such good results, as in New Zealand. The range of latitude, extending as it does from 34° to 47° south, secures for the colony a diversity of climate which renders it suitable for all the products of subtropical and temperate zones, while the insular position secures it from the continuous and parching droughts which periodically inflict such terrible losses on the agriculturist and pastoralist of Australia and South America.
Again, the climate, although somewhat variable, never reaches the extremes of heat or cold. So genial, indeed, is it that most animals and plants, when first introduced to the colony, assume a vigour unknown to them before.
All the best forage-plants and grasses thrive most admirably, continuing to grow throughout the year with little intermission. Stock of all kinds thrive and fatten rapidly on the pastures, coming to maturity at an early age, without the aid of roots or condimental foods. All kinds of cereals flourish equally well, more especially Indian corn, which produces from 50 to 80 bushels per acre.
So full is the soil of plant-food that several continuous crops of potatoes and cereals may be taken with little apparent exhaustion. Wheat, oats, and barley thrive where the soil is not too rich; otherwise they produce enormous crops of straw, without a corresponding yield of corn. The tobacco-plant thrives well, as also hops and sorghum, broom - corn, peanut, hemp, ramee or rheea (China grass), together with a large variety of economic plants, the growth of which will one day afford employment for a large population. In addition to these, oranges, lemons, limes, olives, and vines, with all the British, Chinese, and Japanese fruits, flourish, requiring but ordinary care. Potatoes are grown to a considerable extent, and yield heavy crops.
Much of the country along the south-west and west coast is being rapidly taken up, and the primeval forest is fast disappearing before the settler's axe. For the most part, the soil is fertile, and the growth of grass and clover is extremely rapid and vigorous when sown on the surface, after the felled timber has been destroyed by fire.
To the British husbandman it will seem almost incredible that the best pasture-grasses grow and thrive as they do with no other preparation than the ashes resulting from the burnt timber—no ploughing and no previous loosening of the soil, this, of course, being impossible amongst the forest of stumps; and yet, in less than a year from the date of scattering the seed, this same land will fatten from five to six sheep per acre.
So rapidly are these fertile forest-lands being cleared and converted into pastures that the demand for stock (principally dairy) has greatly increased, and this demand must continue for a series of years before it is fully met.
Before the introduction of the factory system stock were so unsaleable, especially in the North Island, that little or no attention was paid to this branch of rural economy; and the supply fell to the lowest ebb. The demand which has now set in is chiefly due to the settlement of the bush-lands with small selectors and the development of the dairy industry.
Those who in the past have watched the progress of New Zealand, especially of the North Island, have always maintained that as soon as the Maori difficulties should be ended, and other impediments to settlement overcome, the prosperity of the country would advance at a very rapid rate. The time has now come, and all that is now required to enhance and expedite the coming prosperity is wise legislation with respect to settlement, so that the unoccupied lands may be taken up by a thrifty class of small settlers.
There are millions of acres yet unoccupied, a great portion of which is of good quality, and only waiting the hand of man to make it carry, with very little cost, large herds of dairy stock, with flocks of long-wool and crossbred sheep. The west coast of the island is essentially a cattle-country. The midland districts are also adapted to long-wool sheep, as is the country along the east coast. The bulk of the country may be described as good sheep-land, a large portion of which is quite capable of carrying two sheep to the acre, and some of it as many as three or four.
If the North Island has a magnificent inheritance in her forests, the Middle Island can boast of her magnificent plain-lands, rolling downs, and vast mountain-ranges, all of which, to a greater or less degree, have already been made to contribute to the wealth of the colony.
The middle portion of the Middle Island presented to the first-comers a vast plain, covered with little more than waving tussock-grass, offering little or no obstruction to the plough.
Travelling south, the country assumes a different character: easy, undulating downs, well watered, here and there interspersed with fertile plains, the greater portion admirably adapted for agriculture, and all of it for pastoral purposes.
The climate of the Middle Island is not so warm in summer nor so mild in winter as that experienced in the North Island. However, as has already been stated, there are no extremes of heat or cold. Much more might be said in praise of the colony, which is rapidly gaining for itself the right to be called the “Britain of the South.” Without dwelling further upon such topics, it is deemed necessary to say so much as a prelude to the more solid matter-of-fact statements, in order that readers may better comprehend the comparative ease with which agricultural and pastoral pursuits are earned on in New Zealand as compared with other countries less favourably situated.
The Canterbury Plains, the great wheat-growing area of the Middle Island, extend inland forty miles to the commencement of the ranges, by 150 miles running north and south, or an area of about 3,000,000 acres. The greater portion of this vast plain is admirably adapted for the production of wheat of the best quality, the growing of which is carried on extensively, more especially since the introduction of the reaper-and-binder. The area under this cereal in 1891-92 was 279,150 acres, with an estimated yield of 6,952,319 bushels. The land for the most part is free from stones or impediments of any kind. Single-furrow ploughs are now rarely seen, double- and three-furrow ploughs being in general use. Three horses, occasionally four, with a man or boy, can turn over 3 acres per day, at a cost of 6s. per acre. A stroke of the disc or other harrow followed by the seed-drill and light harrow completes the operation of sowing.
Seed-sowing commences in May, and can be continued as weather permits through the winter, and on into September and even October. From 1 1/4 to 1 1/2 and 2 bushels of seed per acre are usually sown, increasing as the season advances.
Good results are usually obtained by feeding-off the early-sown grain with sheep, followed by the harrow and roller. The usual average on the better class of soil is from 40 to 60 bushels per acre of dressed grain. The general average of the whole colony is 25 to 26 bushels. This discrepancy is accounted for by the fact that so much wheat is grown en the lighter soils.
Several varieties of wheat are grown, but Hunter's White, Pearl, and Velvet Chaff are the favourite kinds for winter sowing. Red and White Tuscan are usually sown in spring.
Dressing the seed with genuine bluestone is found to be a certain specific for smut in its various forms.
The Oamaru (North Otago) district is famous for the quality of its wheat, grown on limestone soil.
Otago and Southland also grow wheat, but they excel in the production of oats, the acreage being 84,895 acres of wheat, yielding 2,330,484 bushels, and 168,939 acres of oats, yielding 6,410,325 bushels, this last season, while Canterbury only produced half this quantity of oats.
The usual yield of oats in Otago and Southland is from 40 to 80 bushels per acre, the cost of production being about the same as wheat—viz., £2 per acre when grown out of grass-land, and £1 10s. from stubble The varieties of oats most in favour are Winter Dun, Canadians, Sparrowbill, Tartary, and Danish.
Malting barley, of very superior quality, is grown in Nelson and Marlborough, where the soil and climate appear to be peculiarly adapted to its culture.
The total area and yield of cereals grown in New Zealand last year was—Wheat, 402,273 acres, yielding 10,257,738 bushels; oats, 323,508 acres, yielding 11,009,020 bushels; barley, 24,268 acres, yielding 688,683 bushels; maize, 5,447 acres, yielding 238,746 bushels; rye, 4,730 acres, yielding 91,271 bushels; with peas and beans, 9,552 acres, yielding 245,910 bushels.
Potatoes: Potatoes are largely grown throughout New Zealand. On suitable soils very heavy crops are raised, it being no uncommon thing to dig from eight to ten tons per acre, although the general average is much lower, for the reason that unsuitable land is frequently devoted to this crop. The bulk of the crop is planted without manure, but, where used, bonedust and superphosphate (from 1cwt. to 2cwt. per acre) is applied with good results. The potato is, however, an expensive crop to grow, costing from £5 to £6 per acre, and many farmers are now devoting their potato-land to grass. The land is usually broken out of grass, skim-ploughed in autumn, ploughed deeply in spring, and thoroughly tilled. The seed—15cwt. per acre—is then ploughed in under every third furrow, the after-culture consisting of harrowing just as the crop is appearing over ground. By this means myriads of seedling weeds are destroyed, drill grubbing, hoeing, horse-hoeing, and earthing-up being the subsequent operations. A heavy crop of wheat, beans, or any other cereal can always be relied upon after potatoes.
Turnips: The turnip-crop has now become one of the most important in the colony, ranking next to wheat and oats. The area under this crop this season, according to the agricultural statistics, is 422,354 acres, as against 402,273 acres under wheat. On virgin soil turnips can always be relied upon as a certain crop, even on a single furrow and a couple of strokes of the harrow. But as very much of the soil in Canterbury has already been cropped, turnips cannot now be grown successfully without the aid of manure. In the nature of things, farm-yard manure cannot be procured; artificial manures are therefore largely used, from 1cwt. to 1 1/2cwt. of superphosphate per acre being now applied with the best results, securing ample crops of sound roots, from 15 to 30 tons per acre. The seed is sometimes sown in drills on the flat, the manure being dropped in front of the seed by the same machine, from 1/2lb. to 1lb. per acre of seed being used. Sometimes the manure is sown in a liquid state by machines manufactured for the purpose: this system invariably secures a rapid and vigorous braird, forcing the young plant into the rough leaf, after which it is secure from the attack of the turnip-beetle. So soon as the turnip-plants reach the third or fourth leaf, they are thinned in a primitive and yet in a thoroughly-efficient method. A scuffler, made for the purpose, is drawn across the drills, bunching the turnips and loosening the soil in a thorough manner. The drill-grubber and scuffler are used as required till the leaves meet. This kind of culture produces capital crops. A very large extent is also sown broadcast, and, if found too thickly sown, the harrows are run through them; in any case a stroke of the harrows is a great help to the growth of the plant. The varieties used are Devonshire Grey for early and very late sowing; Purple- and Green-top Aberdeen are the most generally grown. Swede turnips, from their proneness to the attack of the blight aphis, are not so much sown; they, however, produce enormous crops in suitable soils. The turnip-crop is invariably fed-off by sheep intended for freezing. It is estimated that an acre of good turnips, with a little hay or chaff, will fatten from eight to fourteen sheep. Turnip-sowing commences in November, and may be continued till the end of December. Stubble turnips may be sown in March, but this can only be considered as a catch-crop. It, however, often proves of great value, supplying an abundance of green feed for ewes with early lambs. Turnip-land is usually sown with spring wheat, oats, or barley.
Rape is largely grown as sheep-feed, and may be sown either in early spring, or immediately after harvest, the stubble being skim-ploughed. This crop is invaluable in the early spring, and may be fed-off in time for oats or barley.
Mangolds and Carrots are extensively grown in some districts. They cost more money than turnips to produce, as they must be hand-hoed; nor are they so suitable a crop for cleaning the land. Turnip-sowing does not commence till November, affording ample time for the destruction of seedling weeds; this important opportunity is largely lost in the culture of the mangold, which should be sown in October. The mangold is, however, an invaluable crop on a stock farm, as they have only reached their primest condition when the turnip-supply is exhausted. From thirty to sixty tons per acre is not an uncommon yield of these roots.
Carrots are also a valuable crop, especially for horses; on sandy loams the crop reaches fifteen to twenty tons per acre.
Clover: Since the introduction of the humble-bee into New Zealand, growing clover for seed has become a lucrative industry, adding materially to the farmers' income. Clover is sown with a spring crop, usually of corn, lightly grazed in the following autumn, and then reserved for a crop of hay, which, according to the season, yields from two to three tons per acre—cut in November or early in December. The after-growth is then allowed to flower and seed, which it does very freely. Thousands of humble-bees may be seen in the clover-fields during the months of January and February. The seed ripens in March, and is then cut and dried, and threshed out by machines known as clover-shellers. From 200lb. to 300lb. of seed per acre is considered a fair crop, and sells readily at 5d. to 6d. per pound. Thus, an acre of clover may yield in hay and seed quite £10 or £11, as well as a considerable amount of feeding, since clover-haulm is much sought after by stock of all kinds.
Grass-seed saving: All the most valuable of the strong-growing grasses flourish throughout New Zealand. Cocksfoot has been a staple product of Banks Peninsula for many years, the soil for the most part consisting of decomposed volcanic rocks and vegetable mould. The seed is of the finest description, frequently weighing 20lb. to the bushel (12lb. being a standard bushel). This grass thrives on a very wide range of soils, from the richest to the poorest, preferring, of course, the better soils. It may be found on the dry stony plains of the interior green and healthy, while the surrounding herbage has yielded to the heat of the summer sun. Large quantities of the seed are grown in the North Island as well. Out of the total of 572,425 bushels of cocksfoot-seed produced last year, 255,325 bushels were grown in the North Island. This seed sells readily at from 3d. to 4d. per pound.
Growing ryegrass for seed is also an important industry. Last season 864,511 bushels were gathered. Of this, the North Island contributed 191,746 bushels. The seed is usually secured by stripping; sometimes it is cut and tied. The average yield is from 15 to 20 bushels per acre. A common practice is to graze the land till midsummer; to take the stock off for a few weeks, and then to run the stripper over the ground. By this primitive method 10 bushels per acre is sometimes secured. Ryegrass-seed is usually in good demand, and sells readily at from 3s. 6d. to 4s. per bushel.
Meadow-fescue, one of the most valuable of all the grasses for permanent pasture on good land, is grown in the North and Middle Islands, but not very largely as yet. There can be no doubt but that the growing of grass-seeds, including the finer varieties, must become in the near future a very lucrative industry.
Small Seeds: New Zealand, from the nature of her soil and climate, offers a fine field for growing all kinds of farm and garden seeds. It has already attracted the attention of some of the larger seed-merchants of Great Britain, whose agents have recently visited the colony with a view to negotiating with farmers and others to grow certain kinds of seeds. This is an industry peculiarly adapted to small holdings.
Pulse: Peas and beans are largely grown for pig-feeding and for export, and also form an excellent preparation for wheat. An extensive trade in peas of a certain description is done in the manufacturing towns of Great Britain; and efforts are now being made to secure a share of this trade by producing peas suitable for human food. The business is likely to prove a most remunerative one. Thirty bushels of peas is considered a fair crop, while 40 to 70 bushels of beans are often secured.
Cape Barley: The demand for early-spring feed has resulted in the growing of this plant for forage purposes. Its extreme hardiness renders it peculiarly adapted for autumn sowing. If sown in March it is ready for feeding off in May; it may be fed off again in July, and on till the beginning of October, when, if allowed to run to seed, it will produce 40 to 60 bushels per acre, or it may be ploughed-in for turnips. It is equally adapted for dairy stock, horses, and pigs.
Tares are also grown, but not so largely as they deserve to be, especially for dairy stock. Mixed with oats, barley, or rye, they are excellent milk-producers; and, when grown luxuriantly, they destroy all kinds of weeds, and leave the land in fine condition for a spring corn-crop.
Lucerne: This permanent fodder-plant thrives admirably in most parts of New Zealand, yielding three to five cuttings in the year; and, if properly attended to, it will continue to yield liberal cuttings for seven or eight years. This is a most excellent crop for the small or large farmer, furnishing, as it does, an abundant supply of succulent fodder during the drier months of midsummer, as well as in the early spring.
A cursory glance has now been taken at arable farming in New Zealand. Every impartial mind will admit that nature has been lavish of her gifts—she has supplied all the raw material, with climate and soil; all that is necessary is industry, guided by intelligence and perseverance.
It may be thought, because remuneration for manual labour is higher in the colony than it is in Great Britain, that therefore farming operations must cost more.
This is, however, erroneous. It is within the mark to assert that five hundred acres or more can be worked at less cost than probably it would take to work a hundred-acre farm in Great Britain, for the following reasons: firstly, the genial nature of the climate is such that it is not necessary to house stock during the winter months, saving thereby the cost of attendance; secondly, farming operations may be carried on uninterruptedly throughout the ploughing and sowing season; thirdly, the paddocks are so large, and usually level, that the double- and treble-furrow plough may be worked by one man or youth. The colonial farmer has availed himself of all the most modern labour-saving machinery.
The hay-crop is simply cut one day, raked into windrows next, and, in a couple more, it is ready for stacking.
Wheat is cut and tied by machinery, and stooked, requiring no capping. It is frequently threshed out of the stook in favourable seasons, thereby saving the cost of stacking and thatching, but this system is not advocated except in hot, dry seasons.
The manure bill, which is such a heavy item of annual expenditure with the British farmer, is unknown or nearly so to the colonial farmer. As has already been stated, 1cwt. to 1 1/2cwt. of super-phosphates per acre is used with the turnip and other root-crops, and even this is not used in a large number of cases. It will thus be seen how many advantages the colonial farmer has over the farmer of the old country.
Sheep: New Zealand has proved itself to be admirably adapted for the breeding of all classes of sheep, from the fine-combing Merino to the strongest type of Lincoln, with the intermediate breeds. The Merino occupies and thrives on the wild lands of the colony, from the snow-line to the border of the plains, as well as on the drier portions of the plains. The Merino ewe furnishes the foundation for all the cross-bred varieties. On the rich, moist soils the Lincoln and Bomney Marsh flourish, while the finer English and Border Leicesters occupy the drier lands.
Crossbred Sheep: Those bred from Merino ewes and long-wool rams are the most suitable for the frozen-meat trade, and are known as “freezers.”
The dapper little Southdowns flourish wherever crossbreds thrive. Their more ponderous cousins, the Shropshire and Hampshire Downs, have their admirers, especially the Shropshire, which is largely used for crossing, with a view to producing early-maturing lambs. English Leicesters are much sought after also for this purpose.
Since the development of the frozen-meat trade, sheep-farming has undergone a radical change in the colony. At one time wool was the chief consideration, the surplus stock finding their way into the boiling-down vat, the tallow being the only available product. Things have undergone a marvellous change since 1882, the inaugural year of the frozen-meat trade. Banning has assumed a new phase, sheep-raising for mutton being now the most profitable branch of farm management. Sheep have risen 100 per cent. in value since that industry took hold in the colony. Small and large flocks of pure and crossbred sheep are now kept on all farms which are suitable for them, the object being the production of early lambs for freezing, which sell readily at from 10s. 6d. to 12s. each. The percentage of increase all over the colony is very high, particularly so in the paddocks, where 100 to 125 per cent. is not uncommon in favourable seasons, while on the hill and unimproved country it varies from 45 to 80 per cent.
Disease among the flocks is of rare occurrence where ordinary care is taken. Whenever it does occur, it may generally be traced to overstocking, or excessive moisture.
Shearing commences in September, and continues till January. The usual price per hundred is 15s. to £1. Shearing-machines are gradually coming into use, and will doubtless become general when better understood.
The average clips for the various breeds of sheep are approximately as follow: Merino, from 4lb. to 7lb.; quarter-breds, about 6 1/2lb.; half-breds, 7 1/2lb.; three-quarter-breds, 8 1/2lb.; Leicester, 10 1/2lb.; Lincoln, 11lb. Of course, very much larger clips are obtained from special flocks, as much as 25lb. to 30lb. per sheep; but the above figures represent general averages.
The staple of New Zealand wool, especially the long-wool and crossbred, is remarkable for its freedom from breaks and other imperfections incidental to countries subject to long droughts and scarcity of feed.
The coming sheep for New Zealand will be that which combines the best fleece and the most suitable carcase for freezing purposes, together with early maturity. This is the problem which some sheep-breeders have set themselves to work out. Whether such an animal, having fixity of type, can be evolved remains to be proved.
The capability of New Zealand for producing mutton has not nearly reached its limit. When the frozen-meat trade was first seriously considered, an assertion which was made to the effect that the colony could find 1,000,000 sheep per annum for freezing without impairing the breeding-flocks was treated as highly chimerical by sheep-breeders of long experience. It is found, however, on reference to the statistical returns, that during the year 1891 1,788,619 sheep and lambs were exported from New Zealand; and not only so, but the flocks have gone on steadily increasing, numbering, according to returns made to the Agricultural Department, 18,475,500 in 1892, as against 16,753,752 in 1891. There are twenty-one freezing-works in the colony, with a full freezing-capacity of 3,665,000 per annum.
An interesting article on sheep-farming is appended hereto:—
The production of wool and mutton in New Zealand is undoubtedly the premier industry of the colony, as may be inferred from the fact that out of a total of £9,566,397, representing the whole of the past year's exports, no less than £5,662,081, or nearly 60 per cent., was due to sheep-farming, made up as follows:—
| £ | |
| Value of wool exported | 4,129,686 |
| Value of sheepskins | 171,292 |
| Value of mutton | 1,076,713 |
| Value of tallow | 173,257 |
| Value of preserved meats | 111,133 |
| Total | £5,662,081 |
As the country is probably not much more than half tested as to its sheep-carrying capacity, and its consequent power of production, it can readily be seen that, when increased areas have been opened up and laid down in English grasses, and more winter feed grown—such as turnips, mangolds, &c.—New Zealand will offer more than ever before a wide and lucrative field for industrious men of young or middle age, possessed of moderate means and an intelligent knowledge of that most valuable of all animals—the sheep.
In a brief article like this it is impossible to go into minute details with regard to sheep-farming in New Zealand; and, in consequence, the statements which follow must be regarded as general in their character, but nevertheless they are absolutely reliable.
It is a well-known fact that climate and soil exercise the most potent influence on the development of animals (as well as human beings) reared in any country, and these conditions being exceedingly favourable in New Zealand render this colony the most suitable of the British possessions for sheep-farming.
It may unhesitatingly be asserted that not even Great Britain itself is so favourable to the production of the sheep as is New Zealand, for the colony possesses all the climatic and soil advantages of the Mother - country, without the drawbacks of long and severe winters, wet seasons, foot-and-mouth disease, &c.; and the prolonged droughts of the Australian Continent are unknown.
Until the commencement of the frozen-meat industry, in 1882, sheep-farmers in New Zealand confined their attention exclusively to producing the class of sheep that would cut the heaviest fleece; but of late years the ideal has been, and still is, early maturity of mutton and good fleece together. The two qualities have been best combined by the judicious crossing of Down rams with long-wool ewes in the North Island; and in the Middle Island, of Leicester, Lincoln, Romney Marsh, and Cheviot rams with large-framed four-year-old Merino ewes. The climate and soil in New Zealand are of such varied character that in some districts it has been found that one cross does better than another. For examples the following are given: In the North Island, until lately, the Lincoln and Romney Marsh breeds have predominated; but since the starting of the frozen-meat trade it has been found necessary, in order to produce an earlier maturing of sheep with a better quality of fleece, to put Hampshire, Shropshire, or Southdown rams to the long-wool ewes; and the desired result has in every case been achieved.
In the Middle Island, where the variations in climate and soil are much greater, and the country, generally speaking, more mountainous, the Merino for many years reigned almost supreme. Here, too, however, the export trade of frozen mutton has revolutionised sheep-farming. Merino mutton was not suitable for the Home markets — at all events not so suitable and profitable as the breeding of a larger sheep; besides, it came into competition with the River Plate and Australian mutton, with the result that it made a very low price, and, in consequence, judicious crossing, as already stated, was tried, with eminently satisfactory results.
In the most mountainous districts, pure-bred Merinos are still kept, and ewes of this breed, when three or four years old, always command very payable prices for putting to the long-wool rams on the downs and low-lying lands. In some districts the cross between the Leicester (especially the Border Leicester) and Merino ewe is found most suitable, in others, again, where the climate is wetter, the Romney Marsh cross is regarded as best; whilst on heavy rich lands some prefer the Lincoln cross, and, on high cold country, the Cheviot cross is regarded with much favour by others.
The result of this crossing is a sheep which, if nourished well during lambhood and afterwards kept on good pasture until after first shearing, is considered, so far as quality of mutton is concerned, equal to the best Welsh and Scotch. [See account of “Interesting Experiment by the Earl of Onslow,” at end of article on Frozen Meat.]
The weight of these half-bred sheep at two-tooth varies, according to feeding and breeding, from 56lb. to 65lb. The Border Leicester cross, maturing earlier than the others, gives the best return at two-tooth, if the climatic conditions are favourable. From the wool-producing point of view, the half-bred sheep is the most profitable; at all events, it has been so for many years. Of course, the weight per fleece is much less than in the case of long-wools, but this deficiency is more than counterbalanced by the extra value of the staple. Given two flocks of equally well-fed two-tooth sheep, on properties suitable to each breed—one for instance Lincoln, and the other the half-bred, by Border Leicester rams from Merino ewes—and the result, according to present values, would approximately be this, viz.: Lincoln, two-tooth, clipping 12lb. wool at 6d. = 6s.; half-bred, two-tooth, clipping 9lb. wool at 9d. = 6s. 9d.
Again, the pure-bred sheep would probably have the advantage in weight per carcase to the extent of 4lb. or 5lb.; but the extra value of the half-bred mutton at Smithfield, or any other of the meat-markets—say, 1/2d. per pound—would give the finer (or half-bred) sheep a further advantage over its coarser competitor of 10d. or 1s. per carcase or, say, a total of 1s. 7d. or 1s. 9d. per sheep.
Another advantage that the breeding of half bred sheep possesses is that there is a market in the colony for all the wool of that description that is produced, and the growers, in consequence, very often obtain at their doors more for their wool-clip than they would realise in London, without incurring the very heavy charges incidental to sending it there. American buyers, too, visit the colony annually to purchase this class of wool, and, as it is produced nowhere else in the world to any great extent, New-Zealanders may be said practically to have the trade in this class of wool in their own hands.
Two other important points in connection with sheep-farming in New Zealand call for the special notice of the would-be colonist— namely: (1) the low cost of the production of mutton, (2) the high percentage of natural increase. Respecting the first point, it has been proved beyond all doubt that, under ordinary conditions, the very choicest of mutton can be produced so as to pay the grower handsomely when sold at 2d. per pound for the carcase at the nearest shipping-port. To the British sheep-farmer this statement, of course, is valueless by itself; but, when we add that this mutton would only cost the London butcher, delivered ex steamer at the dock, 3 5/8d. per pound, he will be able to realise in some measure what a wonderful grazing-country New Zealand is, and he will be able to understand how it is that men of the right stamp who have come to the colony-have done so well. Then, with regard to the high percentage of increase, there need only be cited a few average returns from well-known flocks to show what excellent lambings New Zealand farmers, obtain under good management.
| LAMBING RETURNS.—AVERAGES. | ||||||
|---|---|---|---|---|---|---|
| Locality. | Breed of Flock. | Breed of Rams. | Breed of Ewes. | No. of Ewes. | Percentage of Lambs. | Remarks. |
| North Island | Lincoln | Lincoln | Lincoln | 7,517 | 81·04 | Land merely surface-sown in English-grass pasture. |
| North Island | Lincoln | Lincoln | Lincoln | 5,301 | 85·05 | |
| North Island | Lincoln | Lincoln | 7/8 Lincoln | 12,177 | 100·00 | |
| North Island | Romney | Romney | Romney | 1,141 | 96·17 | |
| North Island | Lincoln | S'uthd'wn | Lincoln | 2,033 | 94·71 | |
| Middle Island | Merino | Merino | Merino | 14,765 | 75·36 | Mountainous country in native past're, unimproved. |
| Middle Island | Merino | B. Leic'str | Merino | 4,235 | 88·94 | |
| Middle Island | Cross-bred | B. Leic'str | Cross-bred | 8,624 | 80·82 | In English-grass pasture. |
| Middle Island | Half-bred | B. Leic'str | Half-bred | 2,747 | 82·79 | |
| Middle Island | B. Leic'str | B. Leic'str | B. Leic'str | 778 | 90·77 | |
| Middle Island | Lincoln | Lincoln | Lincoln | 452 | 88·08 | |
| Middle Island | R. Marsh | R. Marsh | R. Marsh | 253 | 111·46 | |
| Middle Island | E. Leic'str | E. Leic'str | E. Leic'str | 464 | 93·34 | |
| Middle Island | Shropsh're | Shropsh're | Shropsh're | 168 | 97·41 | |
| Middle Island | S'uthd'wn | S'uthd'wn | S'uthd'wn | 114 | 96·87 | |
| The above returns are fair average ones, hut much higher might have been exhibited if exceptional cases had been selected. | ||||||
As showing the activity of the woollen industry in the colony, it may be mentioned that there are now eight woollen-and-worsted-mills in full operation, three of them on a very extensive scale, and their output is yearly increasing. The amount of wool purchased for use in these mills during the year 1891 was about 3,000,000lb.
The following figures show the development of this industry:—
| 1886. | 1891. | |
| Number of woollen-mills | 6 | 8 |
| Hands employed— | ||
| Men | 360 | 426 |
| Boys | 118 | 176 |
| Women | 263 | 373 |
| Girls | 126 | 200 |
| Value of wool used | £67,675 | £118,081 |
The manufacture for the years 1885 and 1890 was—
| 1885. | 1890. | |
| Tweed (yards) | 642,568 | 966,864 |
| Cloth (yards) | 116,619 | 34,840 |
| Flannel (yards) | 254,654 | 773,528 |
| Blankets (pairs) | 14,358 | 19,829 |
| Shawls and rugs (number) | 17,954 | 18,728 |
Besides the above, large quantities of yarn, knitted goods, shirtings, &c., were turned out.
There are few, if indeed there are any, climates better adapted for the breeding and rearing of horses of all kinds than that of New Zealand. Horses, light and heavy, are always in demand in the Australian Colonies, commanding remunerative prices; and it is more than probable that a lucrative trade will be done in the near future with the Western States of America. Indeed, shipments have already been made to that country of heavy Clydesdales. Some of the best blue blood of this breed has from time to time been imported from Scotland, with the result that the breed is now well established in the colony.
The light-horse stock of the colony has made itself conspicuous by the production of animals which have rendered themselves famous on the Australian turf. The demand for horses suitable for remounts for the cavalry service in India is a continuous one, affording a ready market for the proper stamp of animals. Shipments have from time to time been made to that country with considerable success, and this trade is likely to increase. There is, however, a great scope for enterprise in this direction. During the commercial depression which visited New Zealand in common with every other civilised country, but which has now passed away, giving place to an era of unrivalled prosperity, the breeding of horses was much neglected. Steps are now, however, being taken to repair the loss entailed by such neglect, and it is hoped the colony will therefore soon regain its partially-lost prestige in this direction.
At the date of last census—April, 1891—-there were, including 42,912 owned by Maoris, 831,831 head of cattle in the colony, and although for the last few years the demand has not been encouraging to breeders, it is now satisfactory to note that, with the improved demand for dairy produce and frozen beef, prices for cattle have advanced considerably, and for the future better returns may be looked for.
The colony possesses all the best strains of blood, and this is evidenced by the superior class of cattle to be met with throughout the settled districts.
The trade in frozen beef is now attaining considerable proportions. Last year 103,007cwt. of beef, valued at £108,409, were shipped, principally from the North Island. This trade is likely to largely increase.
The breeding of dairy stock offers an ample field for profitable investment. Milking-cattle now command a comparatively high price, and will continue to do so for an indefinite period, owing to the fact that stock were allowed to run low for want of a market which has lately sprung up with the building of factories. The rearing of well-bred heifer calves will amply repay all the time and trouble bestowed upon them. It may be well to remark that separated milk may be restored to its original value for feeding purposes (or nearly so) by the addition of linseed mucilage, and therefore an acre or so of European flax should be grown upon every farm where stock-rearing is carried on. Much has yet to be done in the way of improving the dairy stock of the colony, a matter which is now attracting a large share of attention. The yield of milk from fairly good milking-cattle is approximately 500gal. per annum, although 700gal. are frequently obtained from selected herds. The average quantity obtained will no doubt be increased as more attention is paid to breeding and proper feeding.
The average yield of butter from milk passed through the separator is 1lb. for every 2 1/2gal. of milk; so that the average cow produces 200lb. of butter, value £10; or 500lb. of cheese, at about equal value with the butter, estimating it at 4 1/2d. per pound. There is thus a good margin of profit.
From £5 to £8 per head can now readily be obtained for young milking-stock. Three years ago they were hardly saleable at any price. To the British farmer this may not appear a satisfactory price; but when it is considered that no housing or hand-feeding is required, the price leaves a very good return.
New Zealand may claim to be the Denmark of the South, without ever having to enter into competition with the Denmark of the North, for the reason that our seasons are opposite. The dairy industry is steadily growing into a very important one. In the North Island, along the west coast, factories are springing up in all directions. This will be the great dairying district of the colony, the humidity of its climate rendering it better adapted to this industry than any other. The luxuriance of the pastures has to be seen to be appreciated. Large tracts of bush-lands are being thrown open for small settlements, and are eagerly taken up for the most part by thrifty hard-working men. Land is procurable either by purchase, deferred payment, or perpetual lease, on the easiest terms. Homes are being built up in all directions, with dairying for the chief industry. The very nature of the industry renders it peculiarly suited to small selectors.
It is hardly necessary to point out that all butter and cheese intended for export will have to be factory made, for the reason that no other will command the highest price, and because so much more can be made of the milk by the use of the separator. One illustration will serve for our purpose. Experience has demonstrated to a certainty that 27 1/2lb. (or 2 1/2gal.) of fairly good milk will produce 1lb. of butter which averages 2d. per pound more than ordinary farmers' butter; whereas it takes 33lb. (or 3gal.) of milk treated in the old-fashioned manner of setting in pans to produce the same quantity of butter—which means exactly 50 per cent. more returns from milk treated on the factory system.
The factory system is now fairly well established. With judicious supervision, and the institution of regulations providing for the grading and proper handling of butter for export, the industry is sure to go on flourishing, and will secure to thousands lucrative employment.
In the Middle Island it has not taken root to the same extent as in the North. It is true that cheese-factories are becoming numerous in Otago and Southland, with a few butter-factories. Like all other new industries, losses have been made; happily, however, the initial stage has now been passed, and, with good prices for the output last season, averaging 4d. to 5d. per pound for cheese at the factory, matters are now in a satisfactory condition. In Canterbury, the dairy-factory system has only been partially adopted. This apparent apathy may be accounted for by the fact that the Canterbury farmers have, from the first, devoted themselves to wheat-growing; subsequently, sheep-raising has been added to their usual occupations with considerable profit. A large quantity of butter has been made on farms in former years, but the price obtainable was as low as from 3d. to 4d. per pound, so that to a very large extent the business was abandoned. It is now found that butter and cheese give a more certain and remunerative return; hence the desire for factories is becoming more general. A movement is now on foot having for its object a central factory for Canterbury, to be fed by creameries in the surrounding districts. The carrying-out of this comprehensive scheme would render Canterbury famous as a butter-producing district. The success which has attended the erection of certain factories on the co-operative principle, a system which experience has amply demonstrated is the only sure foundation to build upon—viz., that the milk-suppliers shall largely be the shareholders—is bearing good fruit, and a large number of factories are being put up on these conditions.
The Chief Dairy Instructor reports:—
“There are now seventy-eight cheese- and butter-factories scattered throughout the colony, the buildings and plant having an aggregate value of nearly £80,000. At the present time (June, 1892) ten new factories are in course of erection, and negotiations are going on in several districts for the establishment of others. Every reasonable assistance is given by the Government to encourage the development of the industry through the employment of itinerant instructors, and by the publication and distribution of pamphlets treating on dairy husbandry.
“These pamphlets are mailed free to all dairy-factory proprietors for circulation among their milk-suppliers, and to any other parties associated with dairying, on application. Parties contemplating the establishment of factories will be supplied free of charge with sketch-plans of buildings suitable to their requirements, and other needful information.
“To meet the many inquiries, plans have been prepared for buildings of various sizes, and detailed information is furnished in pamphlet form, having reference to the business basis, and containing schedule of plant required, so as to insure economy in the application of labour and uniformity in the quality of the productions.
“The formation of dairy associations for the purpose of guarding the interests of the trade is already showing what good service such institutions are capable of rendering.
“It is worthy of note that several of our dairy factories have now earned a desirable distinction in the London market for the quality of their products—both butter and cheese. Brands of butter which were last year quoted at from £1 10s. to £2 under the Danish brands have, during the past season, been quoted at about the highest figures realised on the London market.
“Cheese from our best factories has successfully competed with the best Canadian brands, which seem to dominate the market. But, unfortunately, this distinction is only earned by a few of our best factories.
“Towards showing the benefits derived from the factory system as compared with individual dairying, it is satisfactory to note that, out of an even line of three shipments of butter sent Home, the factory brands realised from £5 15s. to £6 3s., while that from private dairies brought from £4 15s. to £5 15s. The higher quotations must be considered satisfactory.
“It is also pleasing to note the rapid development which the dairy industry has undergone during the last ten years. In 1880 the value of our exports of dairy products was £1,033, while for 1891 the value rose to £236,933, and I am sanguine that the present year's export will show, from the same amount of produce, a considerable increase in pecuniary value. I hope by future efforts to see a still brisker trade established, so that the settlers may derive a benefit, and find some solace for past losses.
“It is generally conceded that no country possesses greater natural advantages for dairy pursuits than New Zealand. This, at any rate, is true of Taranaki. Any one acquainted with the large areas of splendid pasture-land in Taranaki must have had the conviction forced upon him that this locality is pre-eminently fitted to become a great centre for manufacturing dairy products. In soil, climate, seasons, and settlement, Taranaki has every natural advantage. Winter pasturage is generally abundant, and so the farmer is to a great extent relieved of the labour and expense of storing up much winter feed. Little or no housing is required for the cattle throughout the winter, and so the farmer can carry on his business under the most favourable circumstances, as very little of the profits of the season are consumed in maintaining the cows from one season to another.”
Regarding the importation of butter into the united Kingdom during the past two years, Messrs. John McNairn and Co., of Glasgow, in their circular dated 1st April, 1892, report as follows:—
“We have pleasure in bringing before your notice the following tabulated statement with reference to the quantity of butter imported into the United Kingdom during the last two years and also the first two months of the present year, and which, we hope, will be interesting and valuable to our friends in the colonies:—
| To United Kingdom: Butter imported from | Quantities. | Values. | ||
|---|---|---|---|---|
| 1890. | 1891. | 1890. | 1891. | |
| Cwt. | Cwt. | £ | £ | |
| Sweden | 224,235 | 234,987 | 1,715,722 | 1,269,187 |
| Denmark | 824,749 | 876,211 | 4,422,257 | 4,865,840 |
| Germany | 104,450 | 115,509 | 544,271 | 615,791 |
| Holland | 156,069 | 146,539 | 792,786 | 770,460 |
| France | 525,105 | 535,196 | 2,847,144 | 3,038,063 |
| Canada | 15,155 | 46,267 | 60,739 | 187,392 |
| United States | 84,553 | 63,693 | 322,385 | 251,750 |
| Other countries* | 93,401 | 117,205 | 433,544 | 592,268 |
| Totals | 2,027,717 | 2,135,607 | 11,138,848 | 11,590,751 |
| ARRIVALS AND VALUE FOR THE FIRST TWO MONTHS OF 1892 AGAINST THE PREVIOUS YEAR. | ||||
|---|---|---|---|---|
| To United Kingdom: Butter imported from | Quantities. | Values. | ||
| 1891. | 1892. | 1891. | 1892. | |
| * Principally Australia and New Zealand. | ||||
| Cwt. | Cwt. | £ | £ | |
| Sweden | 36,615 | 40,277 | 209,491 | 230,623 |
| Denmark | 129,448 | 133,871 | 777,040 | 822,156 |
| Germany | 25,720 | 31,724 | 133,400 | 207,048 |
| Holland | 8,249 | 8,828 | 44,699 | 52,287 |
| France | 86,316 | 91,837 | 505,853 | 518,663 |
| Canada | 340 | 187 | 1,314 | 865 |
| United States | 16,606 | 9,750 | 66,779 | 41,879 |
| Other countries* | 40,688 | 60,548 | 195,964 | 325,409 |
| Totals | 343,982 | 377,022 | 1,934,540 | 2,198,930 |
“You will notice the vast amount of butter that is imported from Denmark and other continental countries, but we are pleased to see also that our colonies are increasing their exports very materially; and, from what we can learn and read, we expect they will be very heavy competitors with the Continent of Europe. This year, throughout Scotland, Australian and New Zealand butter has pleased extraordinarily well, and buyers are feeling that when the season is over it will be a felt want. As already pointed out, the butter preferred is the very highest class, and packed in patent boxes. We would also refer again to the importance of having the butter-boxes lined with grease-proof paper, so as to avoid its being touched by the wood, which is a most important part in the packing.”
Referring to the quality of New Zealand cheese, the same firm (Messrs. John McNairn and Co.), in a memorandum under date of 18th March, 1892, says, “The quality of the cheese this year has been perfection. We have never seen finer New Zealand cheeses; and if the same quality is kept up, we shall always be able to get a price for them second to none.”
The following are the values of exports from this colony for the years 1890 and 1891:—
| Butter. | Cheese. | |||
|---|---|---|---|---|
| Cwt. | £ | Cwt. | £ | |
| 1890 | 39,430 | 150,258 | 39,770 | 86,675 |
| 1891 | 34,816 | 122,701 | 40,451 | 84,986 |
These useful adjuncts to the dairy hold a very important position on almost all arable farms. The favourite breed is the improved Berkshire. The large and small breeds of White Yorkshire are also to be met with, but are not so generally approved of as the black pigs. The rearing and fattening of pigs is a profitable investment. Unlike the pampered pigs of Britain, they require no better attention than a good grass paddock, with a liberal supply of unthreshed pea-haulm, plenty of water, and shelter from the sun during the warmest summer months.
From the North Cape to the Bluff Hill, in the extreme south of the Middle Island, the climate and soil are eminently adapted for the growth of a large variety of fruits. In the Auckland District, oranges, lemons, and limes flourish: many groves are now coming into full profit, and afford light and pleasant employment to a large number of persons. This employment will go on increasing as the trees become older. The olive flourishes, bearing heavy crops of fruit, and the manufacture of oil will one day become a very important industry.
Vine-growing is also carried on successfully in many districts, tons of fruit being sold in the Auckland markets annually.
Away in the far north the banana grows and ripens its fruit, buy it is not thought that it will ever enter into successful competition with those imported at so cheap a rate from the Pacific Islands.
Extensive orchards of apples have existed in Auckland for more than half a century, producing abundance of fruit of excellent quality, yielding returns equal to £40 or £50 per acre, provided they are kept free from pests. Orchard-planting is progressing rapidly, and must one day become a very important industry.
Now that the problem of landing the fruit in good condition on the London market has been satisfactorily solved, considerable quantities have been shipped Home, with varying success. It is satisfactory to note that fruits of the proper varieties, and which were properly packed, have invariably realised remunerative prices. Much has yet to be done in the way of arriving at the best method of packing and the best treatment on the voyage, the best varieties to grow, and the exact stage of ripening at which the fruit should be picked. Up to the present the trade with the United Kingdom has been mostly of an experimental character. Shipments have been sent Home as ordinary cargo, at little more than half the cost for freight in the cool-chamber, and have realised as much as 16s. per case, leaving a fair profit. The present cost of shipping apples in the cool-chamber is 4s. 4d. per case, the other expenses bringing it up to nearly 8s. per case. Shipped as general cargo the charges would be, approximately, 5s. 6d. per case. If shipping as ordinary cargo is found successful the industry will at once become a most profitable one, adding immensely to the general prosperity of the colony. Pears, plums, quinces, apricots, figs, walnuts, cherries, gooseberries, currants, strawberries, and raspberries grow luxuriantly, producing abundant crops of fruit.
Little has yet been done in the way of bottling or drying fruit for home use. This is an industry which only awaits development.
Cider is manufactured to a considerable extent, and fruit wines are gradually finding their way into consumption.
A considerable trade is also done in colonial-manufactured jams.
Before planting of fruit-trees was commenced on a large scale, with a view to the export trade, little attention was paid to the varieties selected. The result is that many bearing trees have proved unsuitable to the new requirements, and are now being cut down and regrafted or replanted. According to latest advices, the following varieties of apple are said to be in most request in the London market, always commanding a quick sale at good prices—namely, Ribstone Pippin, Cox's Orange Pippin, Waltham Abbey, Stunner Pippin, Scarlet Pearmain, Adam's Pearmain, and New York Pippin. The soil best adapted for growing apples is a strong loam with a clay subsoil; but they will thrive in almost any kind of soil, provided it is in good heart and that water does not stagnate in the subsoil.
One of the peculiarities of the climate of New Zealand is that all kinds of fruit-trees are forced into bearing at an earlier stage than is the case in Great Britain.
This industry is assuming important dimensions, and is incidental to the frozen-meat trade, resulting from the bye-products in the shape of offal. The blood is manufactured into a nitrogenous manure of great value, containing from 11 to 12 per cent. of nitrogen, the other refuse being manufactured into what is commercially known as animal guano.
Above are enumerated a few of the salient points which go to prove conclusively that, as a country for settlement, New Zealand is not surpassed by any part of the British possessions, being one where the industrious man, with moderate means, can settle down with much comfort. The land, it is true, is perhaps dearer in some districts than that which may be found in South America, South Africa, or Canada, but this difference in price is far outweighed by other considerations, such as the superiority of climate, and security to life and property; besides which there are all the privileges of living under a stable system of government. Pit these advantages against the insecurity of life and property in South America and South Africa, and the rigour of Canadian winters, the balance will be immensely in favour of New Zealand. Another great advantage enjoyed by the agriculturist of New Zealand is that he is nowhere far from the sea-board, giving him the advantage of cheap water-carriage for his produce to the markets of the world.
| TABLE SHOWING THE GROSS RETURN FOR THE COLONY OF WHEAT, OATS, BARLEY, ETC. | ||
|---|---|---|
| Wheat. | Bush. | |
| 1891—Number of acres, 301,460 | yield, 5,723,610 | average per acre, 18·99 |
| 1892- Number of acres, 402,273 | yield, 10,257,738 | average per acre, 25·50 |
| Increase in acres, 100,813 | 4,534,128 | —Increase in bshls. for 1892. |
| Oats. | Bush. | |
| 1891—Number of acres, 346,224 | yield, 9,947,036 | average per acre, 28·73 |
| 1892—Number of acres, 323,508 | yield, 11,009,020 | average per acre, 34·03 |
| Decrease in acres, 22,716 | 1,061,984 | —Increase in bshls. for 1892. |
| Barley. | Bush. | |
| 1891—Number of acres, 32,740 | yield, 758,833 | average per acre, 23·18 |
| 1892—Number of acres, 24,268 | yield, 688,683 | average per acre, 28·38 |
| Decrease in acres, 8,472 | 70,150 | —Decrease in bshls. for 1892. |
| Potatoes. | Tons. | |
| 1891—Number of acres, 32,691 | yield, 178,121 | average per acre, 5·45 |
| 1892—Number of acres, 27,266 | yield, 162,046 | average per acre, 5·94 |
| Decrease in acres, 5,425 | 16,075 | —Decrease in bshls. for 1892. |
| TABLE SHOWING THE NUMBER OF ACRES UNDER WHEAT, OATS, BARLEY, AND POTATOES IN 1892, AND YIELD PER ACRE IN BUSHELS AND TONS FOR THE SEVERAL PROVINCIAL DISTRICTS. | |||
|---|---|---|---|
| Wheat. | |||
| Bushels. | Bushels. | ||
| Canterbury | 279,150 acres | yield, 6,952,319 | average per acre, 24·91 |
| Otago | 84,895 acres | yield, 2,330,484 | average per acre, 27·45 |
| Wellington | 12,039 acres | yield, 331,847 | average per acre, 27·50 |
| Nelson | 8,891 acres | yield, 202,456 | average per acre, 22·77 |
| Marlborough | 7,179 acres | yield, 170,212 | average per acre, 23·71 |
| Auckland | 6,459 acres | yield, 169,409 | average per acre, 26·23 |
| Taranaki | 2,386 acres | yield, 68,820 | average per acre, 28·84 |
| Hawke's Bay | 1,274 acres | yield, 32,191 | average per acre, 25·27 |
| Totals | 402,273 | 10,257,738 | 25·50 |
| Oats. | |||
| Bushels. | Bushels. | ||
| Otago | 108,939 acres | yield, 6,410,325 | average per acre, 37·94 |
| Canterbury | 117,696 acres | yield, 3,443,283 | average per acre, 29·26 |
| Wellington | 14,364 acres | yield, 480,310 | average per acre, 33·44 |
| Auckland | 6,633 acres | yield, 195,142 | average per acre, 29·42 |
| Hawke's Bay | 6,189 acres | yield, 169,365 | average per acre, 27·37 |
| Nelson | 4,247 acres | yield, 104,883 | average per acre, 24·70 |
| Marlborough | 2,900 acres | yield, 102,065 | average per acre, 35·19 |
| Taranaki | 2,534 acres | yield, 103,467 | average per acre, 40·83 |
| Westland | 6 acres | yield, 180 | average per acre, 30·00 |
| Totals | 323,508 | 11,009,020 | 34·03 |
| Barley. | |||
| Bushels. | Bushels. | ||
| Canterbury | 10,361 acres | yield, 306,128 | average per acre, 29·55 |
| Nelson | 4,048 acres | yield, 97,797 | average per acre, 24·16 |
| Otago | 3,960 acres | yield, 119,073 | average per acre, 30·07 |
| Marlborough | 2,420 acres | yield, 50,880 | average per acre, 21·02 |
| Hawke's Bay | 2,068 acres | yield, 78,253 | average per acre, 37·84 |
| Auckland | 926 acres | yield, 25,416 | average per acre, 27·45 |
| Wellington | 340 acres | yield, 8,652 | average per acre, 25·45 |
| Taranaki | 145 acres | yield, 2,484 | average per acre, 17·13 |
| Total | 24,268 | 688,683 | 28·38 |
| Grass-seeds | |||
| Cocksfoot. Bushels of 12lb. | Ryegrass. Bushels of 20lb. | ||
| Canterbury | 300,245 | 303,573 | |
| Wellington | 89,073 | 21,160 | |
| Taranaki | 85,184 | 4,029 | |
| Hawke's Bay | 43,918 | 65,472 | |
| Auckland | 37,150 | 101,085 | |
| Otago | 8,408 | 355,107 | |
| Nelson | 4,054 | 1,904 | |
| Marlborough | 4,392 | 12,181 | |
| Westland | 1 | .. | |
| Totals | 572,425 | 864,511 | |
| Potatoes. | |||
| Tons. | Tons. | ||
| Canterbury | 9,532 acres | yield, 65,158 | average per acre, 6·84 |
| Otago | 6,629 acres | yield, 33,860 | average per acre, 5·11 |
| Auckland | 4,450 acres | yield, 20,842 | average per acre, 4·68 |
| Wellington | 1,974 acres | yield, 13,702 | average per acre, 6·94 |
| Marlborough | 1,221 acres | yield, 7,914 | average per acre, 6·48 |
| Hawke's Bay | 1,208 acres | yield, 8,673 | average per acre, 7·18 |
| Nelson | 1,108 acres | yield, 5,265 | average per acre, 4·75 |
| Taranaki | 872 acres | yield, 5,201 | average per acre, 5·96 |
| Westland | 272 acres | yield, 1,431 | average per acre, 5·26 |
| Totals | 27,266 | 162,046 | 5·90 |
| TABLE SHOWING THE TOTAL NUMBER OF ACRES UNDER TURNIPS AND RAPE. | ||
|---|---|---|
| 1891. | 1892. | |
| Acres. | Acres. | |
| Otago | 170,905 | 168,156 |
| Canterbury | 146,275 | 150,034 |
| Wellington | 27,721 | 29,001 |
| Auckland | 24,425 | 32,077 |
| Hawke's Bay | 17,406 | 27,748 |
| Taranaki | 5,688 | 5,020 |
| Nelson | 6,217 | 6,424 |
| Marlborough | 3,404 | 3,638 |
| Westland | 143 | 250 |
| Totals | 402,184 | 422,354 |
| Increase for 1892, 20,170 acres. | ||
| TABLE SHOWING THE TOTAL NUMBER OF ACRES UNDER OTHER CROPS. | ||
|---|---|---|
| 1891. | 1892. | |
| Acres. | Acres. | |
| Canterbury | 16,387 | 11,718 |
| Auckland | 8,480 | 8,188 |
| Otago | 3,658 | 4,436 |
| Hawke's Bay | 2,959 | 2,549 |
| Nelson | 1,419 | 1,042 |
| Marlborough | 1,365 | 1,657 |
| Taranaki | 713 | 497 |
| Wellington | 776 | 642 |
| Westland | 18 | 8 |
| Totals | 35,775 | *30,737 |
| Decrease for 1892, 5,038 acres. | ||
| * Including under maize | 5,447 acres; produce | 238,746 bushels. |
| Including under rye and bore | 4,730 acres; produce | 91,271 bushels. |
| Including under peas | 6,254 acres; produce | 147,391 bushels. |
| Including under beans | 3,298 acres; produce | 98,529 bushels. |
| Including under hops | 639 acres; produce | 6,810 cwt. |
| Including under tobacco | 6 acres; produce | 1,482 lb. dried leaf. |
| Including under mangolds, beet, carrots, onions, and parsnips | 5,377 acres. | |
| Including under maize cut for green fodder | 1,679 acres. | |
| Including under other crops | 3,307 acres. | |
| TABLE SHOWING THE TOTAL NUMBER OF ACRES UNDER OATS FOR GREEN FODDER AND HAY. | ||
|---|---|---|
| 1891. | 1892. | |
| Acres. | Acres. | |
| Canterbury | 50,697 | 37,080 |
| Otago | 49,681 | 44,628 |
| Auckland | 13,969 | 16,780 |
| Nelson | 7,784 | 7,283 |
| Wellington | 4,031 | 4,579 |
| Marlborough | 3,012 | 3,116 |
| Hawke's Bay | 3,800 | 3,151 |
| Taranaki | 1,354 | 1,478 |
| Westland | 366 | 389 |
| Totals | 134,694 | 118,484 |
| Decrease in 1892, 16,210 acres. | ||
| TABLE SHOWING THE NUMBER OF ACRES OF GRASS, AFTER HAVING BEEN BROKEN UP, INCLUDING SUCH AS ARE IN HAY. | ||
|---|---|---|
| 1891. | 1892. | |
| Acres. | Acres. | |
| Otago | 1,144,451 | 1,157,246 |
| Canterbury | 1,135,564 | 1,139,179 |
| Auckland | 365,168 | 356,049 |
| Hawke's Bay | 225,848 | 266,006 |
| Wellington | 183,394 | 201,187 |
| Taranaki | 75,784 | 83,520 |
| Nelson | 66,787 | 65,303 |
| Marlborough | 49,584 | 51,181 |
| Westland | 3,963 | 8,084 |
| Totals | 3,250,543 | 3,327,755 |
| Increase for 1892, 77,212 acres. | ||
| TABLE SHOWING THE NUMBER OF ACRES OF GRASS - SOWN LANDS (SURFACE-SOWN), NOT PREVIOUSLY PLOUGHED, INCLUDING SUCH AS ARE IN HAY. | ||
|---|---|---|
| 1891. | 1892. | |
| Acres. | Acres. | |
| Wellington | 1,257,499 | 1,398,260 |
| Hawke's Bay | 795,429 | 921,012 |
| Auckland | 695,573 | 745,237 |
| Canterbury | 274,221 | 241,590 |
| Taranaki | 215,687 | 237,068 |
| Otago | 186,401 | 180,502 |
| Nelson | 160,112 | 175,880 |
| Marlborough | 122,335 | 168,644 |
| Westland | 8,418 | 4,933 |
| Totals | 3,715,675 | 4,076,126 |
| Increase for 1892, 360,451 acres. | ||
| TABLE SHOWING THE TOTAL NUMBER OF ACRES IN HAY. | ||
|---|---|---|
| 1891. | 1892. | |
| Acres. | Acres. | |
| Auckland | 11,105 | 10,246 |
| Hawke's Bay | 6,887 | 5,907 |
| Canterbury | 6,419 | 12,496 |
| Wellington | 6,034 | 5,179 |
| Otago | 5,820 | 5,475 |
| Taranaki | 3,418 | 2,500 |
| Nelson | 2,922 | 2,630 |
| Marlborough | 1,130 | 1,959 |
| Westland | 310 | 260 |
| Totals | 44,045 | 46,652 |
| Increase for 1892, 2,607 acres. | ||
| TABLE SHOWING THE TOTAL NUMBER OF ACRES UNDER CROP, EXCLUSIVE OF GRASS-LANDS, AND OF LANDS BROKEN UP BUT NOT UNDER CROP. | ||||
|---|---|---|---|---|
| Under Crop (1891). | Under Crop (1892). | Broken up, but not in Crop, in 1891. | Broken up, but not in Crop, in 1892. | |
| Acres. | Acres. | Acres. | Acres. | |
| Canterbury | 566,153 | 615,571 | 58,875 | 51,653 |
| Otago | 479,235 | 481,643 | 74,181 | 47,155 |
| Auckland | 70,038 | 75,513 | 34,662 | 18,406 |
| Wellington | 63,313 | 62,939 | 4,381 | 3,822 |
| Hawke's Bay | 36,218 | 44,187 | 27,959 | 11,834 |
| Nelson | 31,855 | 33,043 | 4,246 | 1,303 |
| Marlborough | 22,803 | 22,131 | 4,094 | 4,368 |
| Taranaki | 15,380 | 12,932 | 1,221 | 1,508 |
| Westland | 773 | 931 | 890 | 405 |
| Totals | 1,285,768 | 1,348,890 | 210,509 | 140,454 |
| Increase for 1892, 63,122 acres. | Decrease for 1892, 70,055 acres. | |||
| NOTE. — In the returns of agricultural statistics as above summarised, gardens, orchards, plantations of forest-trees, holdings of one acre or less in extent, and holdings occupied by aboriginal natives, are not included, but the returns for 1892 show a total extent of land, in gardens, of 9,608 acres; in orchards, of 19,627 acres; and in plantations of forest-trees, of 38,723 acres. | ||||
Table of Contents
One of the most remarkable and rapid developments of trade in New Zealand of late years is the freezing of mutton and beef, and its transport to the English market. It is only a little over ten years ago that the first trial shipment of frozen mutton, conducted by Mr. Thomas Brydone, the general manager of the New Zealand and Australian Land Company, left Port Chalmers, in the ship “Dunedin,” for London, and since that time the growth of this export has been almost phenomenal. The project of sending fresh meat to England was then regarded as impossible of fulfilment; and Mr. Haslam's statement, that vessels would be able to carry carcases of 10,000 sheep, was considered visionary. But the improvements made by him in refrigerating machinery have enabled his prophecy to be more than fulfilled, as vessels are now fitted to carry four and five times the number of sheep he mentioned. The yearly export of frozen meat has gradually increased in value since 1882 from £19,339 to £1,194,724 in 1891, the last representing the carcases of 1,447,583 sheep, 338,444 lambs, and parts of carcases — which weighed 103,007cwt.—of bullocks. The greatly-improved price of sheep caused by the demand for this export trade has much encouraged the farmers of the colony, and has caused increased attention to be given to clearing and laying down bush-land in grass, and otherwise improving holdings, in order to increase the bearing-capabilities of the land. With the total value of the meat export in 1891, it is necessary also to take into consideration the value of preserved meats, amounting to £111,133; of salted beef and pork, £15,795; and of bacon and hams, £25,182.
Notwithstanding the large increase in the numbers of sheep exported in 1890, the sheep returns for April, 1891, gave an addition of nearly 600,000 on the number in May of the previous year, thus showing that, even with the present flocks, there is a reserve that might supply a much larger export than at present; and the further progressive increase in the number of sheep that may be looked forward to from the extension of clearing and improvements gives promise of a future export of a magnitude possibly manifold greater than the present. The markets of the civilised world are, having regard to the growth of population, without a corresponding increased area for food-production, practically unlimited. This export has had the effect of helping the colony through a period of great depression, and, next to the production of wool, with which it is now inseparably connected, may be regarded as the most important factor in our well-being. It would be an idle speculation to consider in what condition New Zealand would have been had the process for meat-freezing now in use not been discovered, but then' can be no doubt that it has been of almost incalculable value to this colony.
The trade outgrew the available shipping. That state of things, however, did not last long, and magnificent cargo and passenger steam- and. sailing-ships, provided with capacious refrigerating-chambers, owned by the Shaw-Savill and Albion and New Zealand Shipping Companies, are constantly visiting the various ports to take in the frozen carcases and meat to convey them direct to the English market. In his very interesting work “New Zealand after Fifty Years,” Mr. Edward Wakefield gives a very comprehensive and graphic account of the growth in this colony of the frozen-meat trade. “Writing of the wonderful success of the pastoral industries, he says,—
“The frozen-meat trade furnishes one of the most remarkable instances of the application of a scientific principle to commerce. The sheep-farmers in New Zealand did not know what to do with their surplus stock. They boiled them down for tallow, or they preserved them in tins. But there was often very little profit on either of those processes, and both together failed to meet the requirements of the case. Meanwhile the great cities in Great Britain were in chronic want of meat, and especially of mutton. One day it was discovered that mutton could be sent from New Zealand to Great Britain in a frozen state without losing anything in quality. The process is in principle this: Air, at the ordinary natural temperature, is compressed to, say, one-third of its natural bulk by steam-power. It is then let into a chamber with walls impervious to heat. The sudden expansion of the air to its natural bulk again reduces it to one-third of its former temperature, producing an intense cold within the chamber, and this process being constantly maintained by steam-power the temperature within the chamber is permanently kept down to a point corresponding to the compression of the air. The carcases of the sheep, ready dressed for sale, are placed in the chamber, where they are frozen quite hard, and remain entirely unchanged until they are landed in England. There they are slowly thawed, and are not only as wholesome, but as palatable and as agreeable in appearance as the best English mutton.
“The arrival of the first vessel, a sailing-ship, with a small cargo of frozen mutton, in 1881, created a profound sensation in England, and the most erroneous and absurd notions were entertained regarding it. A violent prejudice was created against the meat, which was declared to be unfit for human food, and to have lost all its nutriment by being frozen. The Duke of St. Albans wrote to the Times protesting against fresh meat being brought from the Antipodes to compete with English meat. His Grace, however, sought to allay the alarm of the English farmers by assuring them that the thing could not last—that it was merely one of those unnatural experiments which are often attempted but which always fail, and that even if the supply could be kept up from New Zealand, which was impossible, the inferiority of the meat would soon render it unsaleable. The success of the shipment, nevertheless, was unmistakeable, and it was immediately followed by others. Many mistakes were made at first, and heavy losses were incurred, especially by the employment of defective machinery on board the ships, and by exposing the meat too long before it was frozen. For a time the trade appeared to be in a precarious condition, and it looked as if the Duke of St. Albans' prediction would be verified. The colonists, however, pushed it on with great enterprise, rectified their mistakes, adopted a variety of improvements, and very soon found out how to organize the export. The solution of all their difficulties, in fact, was found to lie in having freezing-works, on shore, near to the place of shipment, or near a railway leading to the place of shipment. At Petone, near Wellington, a hulk is used for this purpose, moored to a wharf close to the slaughter-house. The sheep, which are specially bred and selected for the Home market, are taken from adjoining paddocks in perfect condition, skilfully slaughtered, skinned, and dressed, and trucked down to the hulk, the whole interior of which is a freezing-chamber, kept at an even temperature by a powerful steam-engine and a compressor, as already described. As soon as the hulk is full, she is towed across the harbour to the wharf, where the vessel for England is lying, perhaps a mail-steamer of 4,000 or 5,000 tons. The frozen carcases, each encased in a clean calico bag, are promptly transferred from the freezing-chamber of the hulk to the freezing-chamber of the steamer. In other cases no hulk is employed, but the freezing-works consist of a large building with a chamber, and powerful engines constantly at work. The frozen carcases are passed through small hatches into tightly-closed vans, and carted or railed alongside the steamer, and at once transferred to her freezing-chamber. The whole of the operations are perfectly cleanly and inoffensive, the frozen carcases being as hard as marble, and the calico bags as unsoiled as a lady's muslin dress. In this way a large vessel, calling at two or three ports, will take in a cargo of 20,000 or 30,000 carcases in a few clays, and land them in London in precisely the same state in which they left the works.
“Innumerable trials have been made, by which it is incontestably proved that the most fastidious connoisseur cannot tell New Zealand frozen mutton which has been killed two months from English mutton a week from the daisies, when it comes to table. The result is that the trade has already expanded enormously. The export this year (1889) will probably not be less than a million carcases of mutton and lamb, besides a very large quantity of beef. It may be asked, How about the Duke of Albans' assurance that the colony could never keep up the supply? How are the flocks affected by this enormous drain of a million sheep and lambs a year—a thing never before heard of in any country in the world? The reply is that the flocks are not at all diminished by the export. The colony could not afford to have them diminished, because it is to them it looks for its greatest staple of all—its wool. The effect of the export of meat, however, is not to diminish the flocks at all, but merely to keep both the flocks and the pastures up to the highest standard of quality by the regular withdrawal of the surplus stock. Not only prime wethers, but ewes and broken-mouthed sheep are worth exporting, and fetch a remunerative price. Thus there is no overstocking of pastures, and there are no old, unprofitable, degenerate flocks. On the other hand, the certainty of the market for mutton has enabled the farmers to put into permanent pasture great tracts of country which they could not afford to deal with before; and also to resort largely to turnip-feeding, by which means they have immensely increased the carrying-capacity of the country. This process can be extended almost incalculably. In a word, New Zealand can already send a million sheep a year to England as the surplus of her farms, and greatly to their benefit; and there is every reason to believe that within a very few years she will be able to send two millions a year, and still possess larger flocks and better flocks than ever.
“The meat is sold wholesale in London at about 4 1/2d. per pound. At that price the grower gets from 12s. to 14s. per head, including what he makes by the skin and the offal; which pays very well.
“It will be readily understood that a trade of this magnitude employs in all its branches—pasturing, cultivation, shepherding, slaughtering, freezing, carrying, shipping, fellmongering, and so on— a very large population. These are distributed among various classes of the community, and include the wealthiest landowners in the colony, a multitude of smaller landowners or leaseholders, and working-men of all sorts and conditions. The actual freezing of the meat is mostly in the hands of companies, who either buy the stock and freeze them and ship them on their own account, or freeze for the growers on a fixed tariff of charges. These companies are all doing very well, the dividend last year being 10 per cent. in almost all instances, after making ample reserves. One company—the Gear Company, of Wellington—have paid back 60 per cent. of their whole capital in dividends in six years from their start, besides acquiring their land, works, and appliances, which are of great value. The Wellington Refrigerating Company, another important organization at the capital of New Zealand, is also making great strides. On the whole, there is no industry in the colony which is more uniformly flourishing than the meat industry; and all the various classes of people concerned in it may be deemed to be very fortunately situated.”
It will be seen from the following returns that Mr. Wakefield's expectation is likely to be soon fulfilled. There are now twenty-one freezing establishments in the colony—twelve in the North Island and nine in the Middle Island. The weight and value of frozen meat exported, during the period 1882-91 were as follow:—
| Cwt. | £ | |
| 1882 | 15,244 | 19,339 |
| 1883 | 87,975 | 118,328 |
| 1884 | 254,069 | 345,090 |
| 1885 | 296,473 | 373,857 |
| 1886 | 346,055 | 427,193 |
| 1887 | 402,107 | 455,870 |
| 1888 | 552,298 | 628,800 |
| 1889 | 656,822 | 783,374 |
| 1890 | 898,894 | 1,087,617 |
| 1891 | 1,000,307 | 1,194,724 |
Preserved meats also form a considerable item of export. The total value in 1891 was: Preserved meats, £111,133; salted beef and pork, £15,795; bacon and hams, £25,182. The quantity tinned in 1890 was 6,291,278lb., valued at £122,230, to which may be added corned beef, valued at £14,006; tallow, £144,282; bonedust, £15,484; oil, horns, hoofs, &c., £13,075; bringing up the total value of all produce in this industry for the year 1890 to £1,464,659.
The results of the census of April, 1891, show the numbers of carcases and value of sheep and lambs frozen, and the quantities and value of beef frozen and meats preserved, in the various provincial districts of the colony, the produce of the year 1890, to have been as follow:—
| Provincial Districts. | Frozen Sheep and Lambs. | Frozen Beef. | Preserved Meats. | |||
|---|---|---|---|---|---|---|
| Carcases. | Value. | Quantity. | Value. | Quantity. | Value. | |
| No. | £ | Lb. | £ | Lb. | £ | |
| Auckland | 61,385 | 39,368 | 400,601 | 2,983 | 1,112,240 | 23,205 |
| Taranaki | 7,347 | 3,822 | 611,902 | 4,050 | 1,234,376 | 15,430 |
| Hawke's Bay | 335,966 | 170,195 | 2,660,300 | 21,514 | 205,636 | 5,215 |
| Wellington | 370,102 | 229,864 | 15,002,432 | 162,792 | 1,350,173 | 23,809 |
| Marlborough | 43,095 | 21,283 | 226,200 | 1,697 | 382,500 | 18,950 |
| Canterbury | 640,723 | 369,574 | 197,037 | 2,052 | 554,593 | 12,622 |
| Otago | 272,293 | 121,930 | 54,947 | 458 | 1,451,760 | 22,999 |
| Totals | 1,730,911 | 956,036 | 19,153,419 | 195,546 | 6,291,278 | 122,230 |
In connection with the foregoing must be taken into account the output, during the same period, of the following products:—
| Provincial Districts. | Tallow. | Corned Beef, | Bonedust. | Neatsfoot and Trotter Oil. | Bones, Horns, Hoofs &c. | |||||
|---|---|---|---|---|---|---|---|---|---|---|
| Quan. | Value. | Casks. | Value | Quan. | Value. | Quan. | Value. | Quan. | Value. | |
| Tons. | £ | No. | £ | Tons. | £ | Gal. | £ | Tons. | £ | |
| Auckland | 1,023 | 19,886 | 5,616 | 12,475 | 800 | 5,600 | 1,928 | 467 | 315 | 1,300 |
| Taranaki | 452 | 9,072 | 193 | 500 | 240 | 1,200 | 362 | 70 | 15 | 60 |
| Hawke's Bay | 1,256 | 24,464 | .. | .. | 115 | 460 | 2,780 | 548 | 2,160 | 1,611 |
| Wellington | 2,402 | 50,377 | 530 | 1,031 | 530 | 2,800 | 1,143 | 178 | 74 | 1,583 |
| Marlborough | 51 | 1,070 | .. | .. | .. | .. | .. | .. | .. | .. |
| Canterbury | 1,521 | 33,254 | .. | .. | 668 | 3,674 | 3,162 | 530 | 479 | 1,900 |
| Otago | 365 | 6,159 | .. | .. | 350 | 1,750 | 1,200 | 217 | 16 | 36 |
| Totals | 7,070 | 144,282 | 6,339 | 14,006 | 2,703 | 15,484 | 10,575 | 2,010 | 3,059 | 6,490 |
The number of works and hands employed, the total value of all products set forth in the two preceding tables, and the approximate value of the land, buildings, machinery, and plant were as follow:—
| Provincial Districts. | No. of Works. | Number of Hands employed. | Total Value of all Produce for the Year 1890. | Approximate Value of | |||
|---|---|---|---|---|---|---|---|
| M. | F. | Land. | Buildings. | Machinery and Plant. | |||
|
* Taranaki also exported 500,000lb. of chilled meat of the value of £4,000, which is included in this sum-total (£38,204) as the product for that provincial district. † This item includes the value of 125 bales rabbit-skins (£2,875), and 205 bales sheepskins (£1,700). | |||||||
| £ | £ | £ | £ | ||||
| Auckland | 7 | 189 | 3 | 105,284 | 11,200 | 20,900 | 15,400 |
| Taranaki | 3 | 75 | .. | 38,204* | 340 | 7,500 | 5,750 |
| Hawke's Bay | 6 | 210 | .. | 224,007 | 14,255 | 36,644 | 33,183 |
| Wellington | 8 | 325 | 1 | 472,434 | 23,527 | 41,305 | 41,884 |
| Marlborough | 3 | 115 | .. | 47,575† | 400 | 16,500 | 12,500 |
| Canterbury | 6 | 342 | 3 | 423,606 | 12,200 | 72,250 | 46,650 |
| Otago | 10 | 305 | .. | 153,549 | 5,284 | 28,508 | 23,971 |
| Totals | 43 | 1,561 | 7 | 1,464,659 | 67,206 | 229,607 | 179,338 |
During his visit to the Canterbury Agricultural and Pastoral Association's show at Christchurch, in November, 1891, Earl Onslow (then Governor of New Zealand) supplied the Christchurch papers with the result of an experiment which he has recently made with frozen mutton, the object being to ascertain whether the difference in price of English and New Zealand mutton was due to any great divergence of quality, or to prejudice; and, if so, whether the latter had any just cause for its existence.
Six sheep were selected by Mr. John Grigg, at Belfast, and were transmitted in the usual way to Messrs. Fitter. His Excellency selected from the different classes of London society six gentlemen of his acquaintance, who are known to have first-rate cooks, and to have no personal interest in English sheep-breeding. Messrs. Fitter were desired to deliver a sheep thawed and ready for consumption at the London house of each of these six gentlemen.
In writing to advise them of the shipment His Excellency informed them that the sheep were not sent as a present for which any thanks were expected, but that he might, for his own personal information, ascertain whether the freezing process in any way caused deterioration in a joint of mutton which he had himself found when eaten in the colony to be equal to that which careful breeding and considerable expense had enabled him to produce from his own flock of pedigree Southdowns. To make certain that the opinions-given were without favour or prejudice His Excellency caused a seventh sheep to be sent round the world and brought back to him in Christchurch, and he has no reason to doubt the perfect good faith of his correspondents.
The gentlemen selected were Baron Henry de Worms, M.P.; the Earl of Rosebery; Sir Augustus Harris, of Drury Lane Theatre, Sheriff of London; Sir Morell Mackenzie, M.D.; M. Waddington, the Ambassador in London from the French Republic; and General Sir Henry de Bathe, one of the committee of the Beefsteak Club, whose members have a house-dinner once a week, at which one member of the committee has to dine, to select the principal dish, and to be responsible for its excellence.
The following are the opinions which His Excellency received:—
Baron de Worms, M.P., Under-Secretary for Colonies.—“We found it quite excellent. The freezing did not hurt it in the least; in fact, the greatest epicure would fail to discern that it was not Homegrown.”
Lord Rosebery.—“The mutton was excellent, and not to be distinguished from English mutton.”
General Sir H. de Bathe, of the Beefsteak Club.—“Last Friday we had a large assemblage at the B.S.C. to eat your mutton. The consensus of opinion was that it was most excellent. Dick Grain, Frank Burnand Bancroft, G. A. Sala, Alf. Watson, and some dozen others all so agree. I, who am a dweller on the Southdowns, can safely aver that your individual sheep was better than what I can buy in Chichester, where it always wants age and colour. It was as tender as a chicken. Could the club make arrangements for a regular supply of mutton of same quality; and, if so, should we have to pay more than our London butcher's prices?”
Mons. Waddington, French Ambassador in London.—“The New Zealand mutton was a great success. I had recommended it to my cook, and it was carefully roasted. All present pronounced it quite equal to the best English mutton. The freezing of the meat had produced no appreciable difference.”
Sir Morell Mackenzie.—“Last week we had a little dinner of connoisseurs on purpose to sit in judgment on the mutton. I can only say that my friends and I were unanimous in giving a most favourable opinion. It had a great deal of flavour, and was very tender. In fact, I only recollect tasting mutton as good on one or two occasions. I suppose, however, that the specimen you were good enough to send me was much better than the ordinary consignments from New Zealand.”
Sheriff Sir Augustus Harris, Drury Lane Theatre.—“We duly received the sheep. Had it cooked and eaten. It was really delicious. Never had I tasted anything more tender or better flavoured. All I can say is, the trial was perfectly successful, if, as I suppose, it is an experiment of some new process.”
Mr. Grigg has since assured His Excellency that two-thirds of the sheep sent from Belfast are of similar quality. The inference to be drawn is that there is no foundation for any prejudice which may have been formed against New Zealand mutton, and that some effort might, with advantage, be made to induce those at Home who are in a position to set the fashion to use the primest New Zealand meat, and thereby remove any feeling of prejudice which may still exist in the minds of the masses. Also, that it should be made easy for those who desire to do so to obtain in the West End of London the best joints from carefully-selected carcases.
Table of Contents
- Order—CONIFERÆ
- Order—CUPULIFERÆ
- Order—MYRTACEÆ
- Order—MELIACEÆ
- Order—ONAGRARIEÆ
- Order—ARALIACEÆ
- Order—CORNEÆ
- Order—CCOMPOSITÆ
- Order—ERICEÆ
- Order—VVERBENAÆ
- Order—LAURINEÆ
- Order—MONIMIACEÆ
- Order—PROTEACEÆ
- Order—MAGNOLIACEÆ
- Order—VIOLARIEÆ
- Order—MALVACEÆ
- Order—TILIACEÆ
- Order—OLACINÆ
- Order—RHAMNEÆ
- Order—SAPINDACEÆ
- Order—CORIARIEÆ
- Order—LEGUMINOSÆ
- Order—SAXIFRAGEÆ
- Order—RUBIACEÆ
- Order—JASMINEÆ
- Order—SANTALACEÆE
- STRENGTH OF NEW ZEALAND TIMBERS
- NEW ZEALAND FUNGUS
- VALUE OF EXPORT TRADE
- THE TIMBER INDUSTRY
The indigenous forest of New Zealand is evergreen, and contains a large variety of valuable woods. The general character of these woods resembles the growths of Tasmania and the Continent of Australia, most of them being harder, heavier, and more difficult to work than the majority of European and North American timbers. They vary, however, very much among themselves. Many varieties are very durable, and manuka, totara, kauri, black-birch, kowhai, and matai appear to be the most highly esteemed on the whole. It is estimated that there are in New Zealand at the present time about 10,000,000 acres of forest-land.
From “The New Zealand Handbook” (1886), by Sir James Hector, is extracted the following information, descriptive of the principal forest-trees:—
Dammara australis, Lambert.
Kauri.—The kauri is the finest forest-tree in New Zealand, and attains a height of 120ft. to 160ft. The trunk is sometimes 80ft. to 100ft. high before branching, and attains a diameter at the base of 10ft. to 20ft. The timber is in high repute for masts and spars, deck- and other planking of vessels, and is largely used for house-finishings. There is abundant evidence of its durability for more than fifty years in some of the old mission-buildings at the Bay of Islands. The buried logs of an ancient kauri forest near Papakura have been excavated and found to be in a perfectly sound condition, and used for sleepers on the Auckland and Waikato Railway. On the Thames Goldfield kauri is used for mine-props, struts, and cap-pieces. It forms the bulk of the timber exported from New Zealand. Some of the largest and soundest kauri timber has richly mottled shading, which appears to be of an abnormal growth, due to the bark being entangled in the ligneous growth, causing shaded parts, broad and narrow, according as the timber is cut relative to their planes. This makes a rich and valuable furniture-wood, and in the market is known as “mottled kauri.” The kauri-pine occurs only in the North Island and north of Mercury Bay, and grows best near the sea, on wet clay land. The kauri-forests are largely composed of other trees as well as their characteristic tree. The turpentine of this tree forms the celebrated kauri-gum, which is extensively excavated from the site of old forests as far south as Taranaki. [Fuller particulars concerning this product are given in an article on “Kauri-gum,” and the exports appear on the statistical broadsheet.]
Libocedrus doniana, Endl.
Kawaka, Cypress, Cedar.—This handsome tree attains a height of 60ft. to 100ft., and a diameter of 3ft. to 5ft. Wood, reddish, fine-grained, and heavy; used by the Maoris for carving, and said to be excellent for planks and spars; grows in the North Island, being abundant in the forests near the Bay of Islands, and to the north of Auckland.
Libocedrus bidwillii, Hook.
Pahautea, Cedar.—A handsome conical tree, 60ft. to 80ft. high, 2ft. to 3ft. in diameter. In Otago it produces a dark-red free-working timber, rather brittle, chiefly adapted for inside work. Found on the central ranges of the North Island, and common throughout the forests of the Middle Island, growing at altitudes of 500ft. to 4,000ft. This timber has been used for sleepers on the Otago railways of late years, is largely employed in that district for fencing purposes, and is frequently mistaken for totara. In former years it was believed to be suitable only for inside work.
Podocarpus ferruginea, Don.
Miro, Bastard Black-pine of Otago.—A large ornamental and useful timber tree; attains a height of 40ft. to 60ft., trunk 2ft. to 3ft. in diameter. A useful wood, but not so durable as the matai, or true black-pine wood; reddish, closed-grained, and brittle; the cross section of the timber shows the heartwood star-shaped and irregular. The timber is generally thought to be unfitted for piles, and marine works, except when only partially exposed to the influence of sea-water, as shown in the railway embankment at Bluff Harbour, where it is reported to have been durable. Grows in the North and Middle Islands at altitudes below 1,000ft.
Podocarpus totara, A. Cunn.
Totara.—A lofty and spreading tree, 60ft. to 120ft. high, 4ft. to 10ft. in diameter. Wood very durable and clean-grained, in appearance like cedar, and works with equal freedom; it is adapted for every kind of carpenters' work. It is used extensively in Wellington for house-building and piles of marine wharves and bridges, and railway-sleepers, and is one of the most valuable timbers known. The wood, if felled during the growing-season, resists for a long time the attacks of teredo worms. It splits freely, and is durable as fencing and shingles. Totara post-and-rail fences are expected to last from forty to fifty years. The Maoris made their largest canoes from this tree, and the palisading of their pas consisted almost entirely of this wood. Grows throughout the North and Middle Islands upon both flat and hilly ground; the timber from trees grown on hills is found to be the most durable.
Podocarpus spicata, Br.
Matai, Mai, Black-pine of Otago.—A large tree, 80ft. high, trunk from 2ft. to 4ft. in diameter. Wood yellowish, close-grained, and durable; used for a variety of purposes—piles for bridges, wharves, and jetties, bed-plates for machinery, millwrights' work, flooring, house-blocks, railway-sleepers, and fencing-Bridges in various parts of the colony afford proof of its durability. Mr. Buchanan has described a log of matai that he found had been exposed for at least two hundred years in a dense damp bush in North-east Valley, Dunedin, as proved by its being enfolded by the roots of three large trees of Griselinia littoralis, 3ft. 6in. in diameter, with over 300 growth-rings. Grows in both North and Middle Islands, at altitudes under 1,500ft.
Podocarpus dacrydioides, A. Rich.
Kahikatea, White-pine.—A very fine tree, 100ft. to 150ft. high, trunk 4ft. in diameter. Timber white and tough, soft, and well adapted for indoor work, but will not bear exposure. Abundant throughout the North and Middle Islands. When grown on dry soil it is good for the planks of small boats, but when from swamps it is almost useless. A variety of this tree, known as yellow-pine, is largely sawn in Nelson, and considered to be a durable building-timber.
Dacrydium cupressinum, Soland.
Rimu, Red-pine.—Tree, pyramidal, with weeping branches when young; trunk 80ft. to 130ft. high, and 2ft. to 6ft. in diameter. An ornamental and useful timber; wood red, clear-grained, heavy, and solid; much used for joisting and planking, and general building purposes, from Wellington southward. Its chief drawback is in being liable to decay under the influence of wet. It is largely used in the manufacture of furniture, the old wood being handsomely marked like rosewood, but of a lighter-brown hue. The juice of this pine is agreeable to drink, and was manufactured into spruce beer by Captain Cook. Grows throughout the North and Middle Islands, but is of best quality in the central district.
Dacrydium colensoi, Hook.
Manoao, Yellow-pine.—A very ornamental tree, 20ft. to 80ft. high. Wood light yellow. It is the most durable and strongest timber in Now Zealand. Posts of this wood have been in use among the Maoris for several hundred years. It is found in the North and Middle Islands at an altitude as great as 4,000ft. This tree is curious from having two kinds of leaves on the same branches. It is greatly valued for furniture.
Phyllocladus trichomanoides, Don.
Tanekaha, Celery-leaved Pine.—A slender, handsome tree, 60ft. high; trunk rarely exceeds 3ft. in diameter; wood pale, close-grained, and excellent for planks and spars; resists decay in most positions in a remarkable manner. The bark is highly prized on account of its superior dyeing and tanning properties. It is one of the best vegetable dyes, especially for yellow, pink, and fawn colours. Grows in the North Island, especially in the hilly districts.
Phyllocladus alpinus, Hook.
Toatoa.—A small ornamental and densely-branched tree, sometimes 2ft. in diameter. Bark used for dyeing and making tar. Found in both North and Middle Islands.
Fagus menziesii, Hook.
Tawhai, Red-birch (from the colour of the bark).—A handsome tree, 80ft. to 100ft. high; trunk 2ft. to 3ft. in diameter. The timber is chiefly used in the Lake District in the Middle Island. Durable, and adapted for masts and oars, and for cabinet and coopers' work. Grows in the North Island on the mountain-tops, but abundant in the Middle Island at all altitudes to 3,000ft.
Fagus fusca, Hook.
Tawhai, Tawhairaunui, Black-birch of Auckland and Otago (from colour of bark), Red-birch of Wellington and Nelson (from colour of timber).—This is a noble tree, 60ft. to 90ft. high; the trunk 5ft. to 8ft. in diameter. The timber is excessively tough and bard to cut. It is highly valued in Nelson and Wellington as being both strong and durable for all purposes. It is found from Kaitaia in the North Island to Otago in the Middle Island, but is often locally absent from extensive districts, and grows at all heights up to 3,000ft.
Fagus solandri, Hook.
White-birch of Nelson and Otago (from colour of bark), Black-heart Birch of Wellington.—A lofty, beautiful evergreen tree, 100ft. high; trunk, 4ft. to 5ft. in diameter. The heart timber is darker than that of Fagus fusca, and is very durable. The wood is well adapted for fencing and bridge-piles, and the bark is useful as a tanning material. This tree occurs only in the southern part of the North Island, but is abundant in the Middle Island, at 3,000ft. to 5,000ft. altitude.
Leptospermum scoparium, Forst.
Kahikatoa, Tea-tree of Cook.—It is ornamental, and useful for fuel and fencing; generally a small shrub, but occasionally 20ft. in height in the South. Abundant throughout the Islands.
Leptospermum ericoides, A. Rich.
Manuka.—A slender tree, 10ft. to 80ft. high, highly ornamental, more especially when young. The timber can be had 28ft. to 30ft. long, and 14in. in diameter at the butt, and 10in. at the small end. The wood is hard and dark-coloured, largely used at present for fuel and fencing, axe-handles and sheaves of blocks, and formerly by the Natives for spears and paddles. The old timber, from its dark-coloured markings, might be used with advantage in cabinet-work, and its great durability might recommend it for many other purposes. Highly valued in Otago for jetty- and wharf-piles, as it resists the marine worm better than any other timber found in the district. It is extensively used for house-piles. The lightest-coloured wood, called “white manuka,” is considered the toughest, and forms an excellent substitute for the “hornbeam” in the cogs of large spur-wheels. It is abundant as a shrub, and is found usually on the poorest soils, but is rare as a tree in largo tracts to the exclusion of other trees.
Metrosideros lucida, Menzies.
Rata, Ironwood.—A very ornamental tree; attains a height of from 30ft. to 60ft., and a diameter of 2ft. to 10ft. The timber of this tree forms a valuable cabinet wood; it is of a dark-red colour; splits freely. It has been much used for knees and timbers in ship-building, and would probably answer well for cogs of spur-wheels. Grows rarely in the North Island, but is abundant in the Middle Island, especially on the West Coast.
Metrosideros robusta, A. Cunn.
Rata.—A tall erect tree, 50ft. to 60ft. high; diameter of trunk 4ft., but the descending roots often form a hollow stem 12ft. in diameter. Timber closely resembles the last-named species, and is equally dense and durable, while it can be obtained of much larger dimensions. It is used for ship-building, but for this purpose is inferior to the pohutukawa. On the tramways at the Thames it has been used for sleepers, which are perfectly sound after some years' use. Grows in the North Island; usually found in hilly situations from Cape Colville southwards.
Metrosideros tomentosa, A. Cunn.
Pohutukawa.—This tree has numerous massive arms; its height is from 30ft. to 60ft.; trunk, 2ft. to 4ft. in diameter. The timber is specially adapted for the purposes of the ship-builder, and has usually formed the framework of the numerous vessels built in the northern districts. Grows on rocky coasts, and is almost confined to the Provincial District of Auckland.
Dysoxylum spectabile, Hook.
Kohekohe.—A large forest-tree, about 40ft. to 50ft. high. Its leaves are bitter, and used to make a stomachic infusion; wood tough, but splits freely, and is considered durable as piles under sea-water. Grows in the North Island.
Eugenia maire, A. Cunn.
Mairetawhake.—A small tree about 40ft. high; trunk, 1ft. to 2ft. in diameter. Timber compact, heavy, and durable. Used for mooring-posts and jetty-piles on the Waikato, where it has stood well for many years. It is highly valued for fencing. Common on swampy land in the North Island.
Fuchsia excorticata, Linn.
Kotukutuku. The fruit is called Konini.—A small and ornamental tree 10ft. to 30ft. high; trunk sometimes 3ft. in diameter. It appears to furnish a durable timber. House-blocks of this wood, which had been in use in Dunedin for more than twenty years, were still sound and good. The wood might be used as dye-stuff, if rasped up and bled in the usual way, and, by mixing iron as a mordant, shades of purple may be produced even to a dense black, that makes good writing-ink. The juice is astringent and agreeable, and yields a medical extract. Its fruit is pleasant, and forms the principal food of the wood-pigeon. Grows throughout the islands.
Griselinia littoralis, Raoul.
Pukatea, Broadleaf.—An erect and thickly-branched bush-tree, 50ft. to 60ft. high; trunk, 3ft. to 10ft. in diameter. Wood splits freely, and is valuable for fencing and in ship-building; some portions make handsome veneers. Grows chiefly in the Middle Island and near the coasts.
Olearia avicenniœfolia, Hook.
Mingimingi, Yellow-wood.—An ornamental shrub-tree, flowers numerous; trunk, 2ft. in diameter. Wood close-grained, with yellow markings, which render it desirable for cabinet-work; good for veneers. Occurs in Middle Island.
Olearia nitida.
An ornamental shrub-tree, 20ft. high and 2ft. in diameter. Wood close-grained, with yellow markings; useful for cabinet-work. Found in the mountainous region of the North Island and throughout the Middle Island.
Olearia cunninghamii.
An ornamental shrub-tree, 12ft. to 20ft. high, with very showy flowers. Found abundantly on west coast of Middle Island, and not uncommon in North Island.
Dracophyllum longifolium, Br.
Neinei.—An ornamental shrub-tree with long grassy leaves. Wood white, marked with satin-like specks, and is adapted for cabinet-work. Grows in Middle Island and in Auckland Group and Campbell Island; none of the Middle Island specimens are as large in the foliage as those in the Auckland Islands. The tree in the vicinity of Dunedin attains a diameter of 10in, to 12in.
Nesodaphne tarairi, Hook.
Tarairi.—A lofty forest-tree, 60ft. to 80ft. high, with stout branches. Wood white, splits freely, but not much valued. Grows in northern parts of North Island.
Nesodaphne tarairi, Hook.
Tawa.—A lofty forest-tree, 60ft. to 70ft. high, with slender branches. The wood is light and soft, and is much used for making butter-kegs. Grows in the northern parts of the Middle Island, and also on the North Island, chiefly on low alluvial grounds; is commonly found forming large forests on river-flats.
Atherosperma novœ-zealandiœ, Hook.
Pukatea.—Height, 150ft., with buttressed trunk 3ft. to 7ft. in diameter; the buttresses 15ft. thick at the base; wood soft and yellowish, used for small boat-planks. A variety of this tree has dark-coloured wood that is very lasting in water, and greatly prized by the Maoris for making canoes. Grows in the North Island, and northern parts of the Middle Island.
Knightia excelsa, Br.
Rewarewa.—A lofty slender tree, 100ft. high. Wood handsome, mottled red and brown; used for furniture and shingles, and for fencing, as it splits easily. It is a most valuable veneering wood. Common in the forests of the North Island, growing upon the hills in both rich and poor soils.
Drimys axillaris, Forst.
Horopito.—Pepper-tree, Winter's Bark.—A small slender evergreen tree, very handsome. Whole plant aromatic and stimulant; used by the Maoris for various diseases. Wood very ornamental in cabinet-work, making handsome veneers. Grows abundantly in forests throughout the islands. At altitudes of 1,000ft. the foliage becomes dense and reddish-coloured.
Drimys colorata, Raoul.
This is a very distinct species, very common near Dunedin; it is a very ornamental shrub-tree, with leaves blotched with red.
Hoheria populnea, A. Cunn.
Houhere, Ribbon-wood of Dunedin.—An ornamental shrub-tree, 10ft. to 30ft. high. Bark fibrous and used for cordage, and affords a demulcent drink. Wood splits freely for shingles, but is not durable. Grows abundantly throughout the islands. Bark used for making a tapa cloth by the Maoris in olden times.
Aristotelia racemosa, Hook.
Mako.—A small handsome tree, 6ft. to 20ft. high, quick-growing, with large racemes of reddish nodding flowers. Wood very light, and white in colour, and might be applied to the same purposes as the lime-tree in Britain; it makes good veneers.
Elœocarpus dentatus, Vahl.
Hinau.—A small tree, about 50ft. high, and 18in. thick in stem, with brown bark yielding a permanent blue-black dye, which is used for tanning; and by the Maoris for colouring mats and baskets. Wood a yellowish-brown colour and close-grained; very durable for fencing and piles. Common throughout the islands.
Dodonœa viscosa, Forst.
Ake.—A small tree 6ft. to 12ft. high. Wood very hard, variegated black and white, used for Maori clubs; abundant in dry woods and forests.
Alectryon excelsum, D.C.
Titoki.—A beautiful tree, with large panicles of reddish flowers. Trunk 15ft. to 20ft. high, and 12in. to 20in. in diameter. Wood has similar properties to ash, and is used for similar purposes. Its toughness makes if; valuable for wheels, coach-building, &c. The oil of the seeds was used for anointing the person. Grows in the North and Middle Islands; not uncommon in forests.
Coriaria ruscifolia, Linn.
Tupakihi, Tree Tutu.—A perennial shrub, 10ft. to 18ft. high; trunk 6in. to 8in. in diameter. The so-called berries (fleshy petals) vary very much in succulence, the less juicy bearing seeds which, according to Colenso, are not poisonous. The juice is purple, and affords a grateful beverage to the Maoris; and a wine, like elderberry wine, has been made from them. The seeds and leaves contain a poisonous alkaloid, and produce convulsions, delirium, and death, and are sometimes fatal to cattle and sheep. Abundant throughout the islands.
Sophora tetraptera, Aiton.
Kowhai.—A small or middling-sized tree. It has a splendid appearance, with large pendulous yellow flowers. Wood red; valuable for fencing, being highly durable; it is also adapted for cabinet-work. It is used for piles in bridges, wharves, &c. Abundant throughout the islands.
Carpodetus serratus, Forst.
Tawiri.—White Mapau, White-birch (of Auckland).—A small tree 10ft. to 30ft. high; trunk unusually slender; branches spreading in a fan-shaped manner, which makes it of very ornamental appearance; flower white, profusely produced. The wood is soft and tough, and might be used in the manufacture of handles for agricultural implements and axes. Grows in the North and Middle Islands; frequent by the banks of rivers.
Weinmannia racemosa, Forst.
Towhai, Kamahi.—A large tree; trunk 2ft. to 4ft. diameter and 50ft. high. Wood close-grained and heavy, but rather brittle; might be used for plane-making and other joiners' tools, block-cutting for paper and calico printing, besides various kinds of turnery and wood-engraving. The bark of this tree is largely used for tanning. The extract of the bark is chemically allied to the gum kino of commerce, their value being about equal. Grows in the middle and southern parts of the North Island and throughout the Middle Island.
Coprosma linariifolia, Hook.
Karamu.—An ornamental shrub-tree; wood close-grained and yellow; might be used for turnery. Grows in mountain localities of the North and Middle Islands. Several other species of this genus grow to a considerable size, and have ornamental timber. It has been proposed to use the berries of Coprosma baueriana as a substitute for coffee.
The following table gives the results of experiments, extending over a period of some years, made as to the strength of the principal timbers of the colony. The dimensions of the specimens experimented on were 1in. square and 12in. long:—
| No. | Native Names in Alphabetical Order. | Specific Gravity. | Weight of a Cubic Foot. | Greatest Weight carried with Unimpaired Elasticity. | Transverse Strength. |
|---|---|---|---|---|---|
| Lb. | Lb. | Lb. | |||
| 1 | Hinau, or pokako (Elaocarpus dentatus) | 0·562 | 33·03 | 94·0 | 125·0 |
| 2 | Kahika, supposed white-pine | 0·502 | 31·28 | 57·3 | 77·5 |
| 3 | Kahikatea, white - pine (Podocarpus dacrydioides) | 0·488 | 30·43 | 57·9 | 106·0 |
| 4 | Kauri (Dammara australis) | 0·623 | 38·96 | 97·0 | 165·5 |
| 5 | Kawaka (Libocedrus doniana) | 0·637 | 39·69 | 75·0 | 120·0 |
| 6 | Kohekohe (Dysoxylum spectabile) | 0·678 | 42·25 | 92·0 | 117·4 |
| 7 | Kowhai (Sophora tetraptera, var. grandiflora) | 0·884 | 55·11 | 98·0 | 207·5 |
| 8 | Maire, black-maire (Olea cunninghamii) | 1·159 | 72·29 | 193·0 | 314·2 |
| 9 | Maire-tawhake (Eugenia maire) | 0·790 | 49·24 | 106·0 | 179·7 |
| 10 | Mako (Aristotelia racemosa) | 0·593 | 33·62 | 62·0 | 122·0 |
| 11 | Manoao (Dacrydium colensoi) | 0·788 | 49·01 | 200·0 | 230·0 |
| 12 | Mangi, or mangeao (Tetranthera calicaris) | 0·621 | 38·70 | 109·0 | 137·8 |
| 13 | Manuka (Leptospermum ericoides) | 0·943 | 59·00 | 115·0 | 239·0 |
| 14 | Mapau, red-mapau, or red-birch (Myrsine urvillei) | 0·991 | 61·82 | 92·0 | 192·4 |
| 15 | Matipo - tarata, black - mapau (Pittosporum tenuifolium) | 0·955 | 60·14 | 125·0 | 243·0 |
| 16 | Matai (Podocarpus spicata) | 0·787 | 49·07 | 133·0 | 197·2 |
| 17 | Miro (Podocarpus ferruginea) | 0·658 | 40·79 | 103·0 | 190·0 |
| 18 | Puriri (Vitex littoralis) | 0·959 | 59·05 | 175·0 | 223·0 |
| 19 | Rata, or iron - wood (Metrosoideros lucida) | 1·045 | 65·13 | 93·0 | 196·0 |
| 20 | Rewarewa (Knightia excelsa) | 0·785 | 48·92 | 93·0 | 161·0 |
| 21 | Rimu, red-pine (Dacrydium cupressinum) | 0·563 | 36·94 | 92·8 | 140·2 |
| 22 | Taraire (Nesodaphne taraire) | 0·888 | 55·34 | 99·6 | 112·3 |
| 23 | Tawa (Nesodaphne tawa) | 0·761 | 47·45 | 142·4 | 205·5 |
| 24 | Tawiri -kohu- kohu, or white-mapau (Carpodotus serratus) | 0·822 | 51·24 | 80·0 | 177·6 |
| 25 | Titoki (Alectryon excelsum) | 0·916 | 57·10 | 116·0 | 248·0 |
| 26 | Totara (Podocarpus totara) | 0·559 | 35·17 | 77·0 | 133·6 |
| 27 | Towai, red-birch (Fagus menziesii) | 0·626 | 38·99 | 73·6 | 158·2 |
| 28 | Towai, black-birch (Fagus fusca) | 0·780 | 48·62 | 108·8 | 202·5 |
| 29 | Whawhako (see also Maire) (Eugenia maire) | 0·637 | 39·63 | 75·0 | 120·0 |
| 30 | Whau (Entelea arborescens) | 0·187 | 11·76 | 13·0 | 32·0 |
The experiments were conducted in the following manner: A pressure of 50lb. was applied for two minutes (as measured by a sand-glass), and the sample was then released; 75lb. were then applied for the same time, and then 100lb., and so on, increasing by 25lb. each time. Each time the sample -was released the point on the deflection-scale to which it returned was read, and when it came to be notably under the original reading it was allowed to remain unloaded for two minutes, to see whether it would in time recover itself. Then the pressure was gradually increased, without being removed, until the specimen broke.
The New Zealand fungus known to commerce is found upon various kinds of decayed timber in the North Island, in what are called new bush settlements. It favours damp localities. After the trees have been cut down, and fire passed through them, the growth of fungus commences. The preparation consists of simply spreading the fungus out to dry. It is used by the Chinese for mixing with food, and for medicinal purposes.
In the year 1888, the export of this article reached 9,844cwt., valued at £19,201; and, in 1891, the figures were 7,934cwt., value £10,943.
The following table shows the quantities and values of timber (sawn and hewn) exported in 1871, 1881, and the last five years:—
| Quantity. | Value. | |
|---|---|---|
| Ft. | £ | |
| * In 1871 the export of logs, spars, shingles, &ca., amounted in value to £6,079. | ||
| 1871* | 3,214,742 | 14,200 |
| 1881 | 13,180,280 | 65,119 |
| 1887 | 30,919,464 | 127,108 |
| 1888 | 43,474,434 | 177,877 |
| 1889 | 42,568,600 | 176,608 |
| 1890 | 42,098,863 | 181,689 |
| 1891 | 42,824,305 | 182,431 |
The saw-milling industry stands fourth in importance, estimated by the value of the output of the industries of the colony. The number of mills in the North Island in 1891 was 119, employing 1,990 hands. In the Middle Island there were 124 mills and 1,270 hands.
The total approximate value of the land was £160,750; of the buildings, £92,848; and of the machinery and plant, £246,674.
The details of this industry, showing the number of saw-mills and sash-and-door factories in operation in 1891, the number of hands employed and amount of horse-power in the various provincial districts of the colony, also the produce of the several districts, and the total value of all manufactures for the year 1890 is set forth in the following table:—
| Provincial Districts. | Number of Mills. | Hands employed. | Amount of Horse-power | Produce for the Year 1890. | Value of Undressed Timber resawn, &c., at Country-Mill Prices. | Value of other Materials used | Total Value of all Manufactures for the Year 1890. | |||||||||
|---|---|---|---|---|---|---|---|---|---|---|---|---|---|---|---|---|
| Sawn Timber. | Value of Posts, Rails, &c. | Rosawing, Planed Flooring, Skirting, &c. | Moulding. | Doors and Sashes. | ||||||||||||
| M. | F. | Quantity. | Value | Quantity. | Value | Quantity. | Value. | Quan. | Value. | |||||||
| H.P. | Ft. | £ | £ | Ft. | £ | Run. ft. | £ | No. | £ | £ | £ | £ | ||||
| Auckland | 47 | 1,004 | 3 | 1,436 | 70,006,749 | 294,673 | 27,143 | 14,536,398 | 76,694 | 2,904,000 | 7,516 | 21,162 | 10,952 | 62,057 | 340 | 416,978 |
| Taranaki | 11 | 206 | .. | 201 | 6,342,562 | 24,506 | 315 | 908,814 | 4,580 | 213,336 | 1,285 | 1,870 | 6,339 | 3,306 | 1,381 | 37,025 |
| Hawke's B'y | 13 | 165 | .. | 215 | 8,439,565 | 26,849 | 1,263 | 1,680,029 | 4,276 | 138,000 | 335 | 220 | 190 | 3,030 | 100 | 32,913 |
| Wellington | 48 | 615 | 2 | 820 | 27,044,739 | 79,676 | 7,357 | 5,524,885 | 24,167 | 1,429,385 | 7,586 | 6,230 | 9,736 | 14,879 | 2,910 | 128,522 |
| Marlb'rough | 6 | 60 | .. | 116 | 3,260,662 | 8,753 | 216 | 150,000 | 162 | .. | .. | .. | .. | .. | .. | 9,131 |
| Nelson | 34 | 192 | .. | 396 | 10,304,080 | 27,337 | 1,322 | 326,600 | 771 | 487,500 | 852 | 614 | 486 | 834 | 285 | 30,768 |
| Westland | 13 | 72 | .. | 208 | 3,030,747 | 9,133 | 40 | 156,925 | 485 | 26,150 | 47 | 311 | 124 | 29 | 30 | 9,829 |
| Canterbury | 20 | 249 | 1 | 281 | 3,978,146 | 16,049 | 5,469 | 2,224,065 | 12,739 | 1,904,494 | 4,078 | 4,206 | 3,112 | 12,336 | 348 | 41,447 |
| Otago | 51 | 697 | .. | 964 | 29,708,971 | 79,559 | 13,168 | 4,944,233 | 20,221 | 1,333,719 | 4,087 | 17,662 | 9,311 | 15,970 | 3,953 | 126,346 |
| Totals | 243 | 3,260 | 6 | 4,637 | 162,116,221 | 566,535 | 56,293 | 30,451,949 | 144,095 | 8,436,584 | 25,786 | 52,275 | 40,250 | 112,441 | 9,347 | 832,959 |
The preparation of Phormium for export is an industry of New Zealand which has not made vast progress like that of wool, meat, and some other products, on account of the difficulty of constructing suitable machinery for its treatment. Its value was well known to the Maoris, it having been an article of export since 1809; and as early as in the years 1828-32, when New Zealand was only visited by whalers and Sydney traders, fifty thousand pounds' worth was sold in Sydney alone. In 1861 the increasing demand for white rope, and the limited quantity of manila, led to a rise in its value from £21 to £56 per ton, and even to £76 per ton in America during the late civil war. These high prices stimulated the endeavour to introduce Phormium fibre to compete with manila. But the greatest difficulty in its preparation has been to do away with the gummy or mucilaginous products found in the leaf.
The name Phormium tenax is derived from the Greek word phormos (a basket) and Latin tenax (strong). Sir James Hector, in Appendix I. to his work on the “Phormium Tenax as a Fibrous Plant” (1889), gives fifty-five different names as applied to the Phormium plant by the Maoris, but says it is doubtful if more than twenty marked varieties can be distinguished. The Phormium plant grows in bunches or groups of plants or shoots; each shoot has five leaves. Ten of these shoots go to a bunch on the average, or, in all, fifty leaves. These vary, according to the soil, from 5ft. to 10ft. in length, and each consists of a double-bladed leaf, which, when closed, is from 2in. to 4in. wide.
Select Committees have at various times been appointed by the General Assembly to consider all matters pertaining to the flax industry, and their reports have been published in the Journals of the House of Representatives, and have led to an increased trade in the industry. The latest of these reports was brought up on the 26th August, 1890. The Committee were much impressed with the rapid increase of the export of the New Zealand flax-fibre; and, notwithstanding the serious decline in prices—a decline which was equally shared by kindred fibres—manufacturers were not discouraged, but, on the contrary, were producing largely. Whilst the fibre as now exported is fit only for the manufacture of rope and twine, and for such purposes for which manila and sisal are used, the Committee was strongly of opinion that the New Zealand fibre is capable of greater possibilities; and, that steps might be taken to further the industry, they recommended that the Government should offer a bonus of £10,000 for—
A process of flax-dressing which will reduce the cost of production;
A process which will improve the quality of dressed fibre, making it suitable for textile purposes; and
A mode of utilising the waste products of the industry.
As a result of their investigations, the Committee urged that flax-owners should see that the flax is cut in such a manner as to leave the heart of the flax-fans uninjured, and that attention should be given to the planting and cultivation of the best varieties of flax, with a view to the production of fibre of superior quality. They found that the market price in London was prejudicially affected by the fact that the contents of a single bale, as well as the several bales of one consignment, often vary very widely; also, that, although the Phormium fibre is not liable to spontaneous combustion, dampness has the effect of rotting, or so seriously discolouring the fibre, as to render it almost valueless on reaching the Home market.
With all these drawbacks to the industry, which it is sought to overcome, the export is fluctuating, although the number of flax-mills in the colony has risen from 30 in 1886 to 177 at the census of 1891; the number of hands employed has also risen correspondingly from 249 to 3,204; and the approximate value of the manufacture, during the same period, from £43,094 to £234,266; but a large permanent development of this industry depends upon the invention of improvements in the machinery used that will result in lessening the cost of production and improving the quality of the fibre.
The export of Phormium for the years 1881 and 1887-91, with the quantities and values, was as follows:—
| Year. | Tons. | £ |
|---|---|---|
| 1881 | 1,308 | 20,285 |
| 1387 | 1,578 | 25,094 |
| 1888 | 4,042 | 75,269 |
| 1889 | 17,084 | 361,182 |
| 1890 | 21,158 | 381,789 |
| 1891 | 15,809 | 281,514 |
These are exporters' declared values, which would doubtless be higher than the value given by mill-proprietors, quoted above, in the figures showing the output.
Kauri-gum is formed of the turpentine that has exuded from the kauri tree, the finest and, for general purposes, the most useful forest-tree in New Zealand.
Thirty years ago the Maoris were the only people who employed themselves in searching for this gum, which at that time was to be found on, or cropping out of, the surface of the ground where, perhaps ages before, forests of kauri had stood. After a few years' exports this surface-gum became exhausted, and then the Maoris began to dig for the gum that was to be found within a few inches below the surface. As the uses for it increased, its market value rose, and presently Europeans betook themselves to digging for it, until, at the present time, it is estimated that there are probably as many as four thousand whites and a thousand Maoris engaged in the work in the Auckland Provincial District, where alone the gum is to be found. The best qualities are obtained from the undulating, open, fern land north of Auckland; but considerable quantities, although of inferior grade, are taken from the branches of standing kauri-trees in the forest, and, in the summer time, from the bottoms of many of the swamps.
The country on both sides of the Northern Wairoa River, of which the town of Dargaville is the centre, is the chief source of the supply of this commodity, the output of which has steadily increased over the last thirty years, notwithstanding that it is not being reproduced, except to a very inappreciable extent, in the existing forests, and these are being rapidly cut down now, because of the commercial value of the timber. The cause of the increased output is, of course, that a greater number of men are now engaged in gum-digging, attracted, doubtless, by the higher price paid for the gum, and by the comparatively easy and independent mode of life the occupation affords. Within a measurable period of time the production of this gum must cease; although competent persons estimate that it will take fifty years at least, at the present rate, to exhaust the gum-deposits in the Auckland District. It is a remarkable fact that new parties of diggers have been known to work over the same piece of ground year after year, and that the last to work it have obtained as much gum as the first. In some places gum-bearing land has been purchased from the Crown for settlement purposes, and the gum unearthed in ploughing it has sold for enough to pay the purchase-money of the land, and for ploughing, fencing, and sowing it as well.
The ordinary method of searching for the gum is by first feeling for it a little below the surface with a steel-pointed piece of iron about 1/2 in. in diameter and 4ft. long, called a “gum-spear,” and then digging it out with an ordinary spade. A skilful and industrious digger can earn as much as £3 to £4 per week at the work, and even children can make a few shillings a day at it. As, however, the gumfields offer a refuge for all sorts and conditions of men, many who are old and infirm resort to them, and so the average earnings of those engaged in the work is reduced to £1 15s. or £2 per week.
The gum is used principally in the manufacture of varnish, but it is found useful for many other purposes, such as dressing “glazed” calicoes, &c. The best quality, which is scarce, is worth as much as £8 to £10 per hundredweight, while the poorest quality is worth only about £1 per hundredweight, in London.
The following are the quantities and values of the exports in ten-year periods since 1853:—
| Year. | Tons | £ |
|---|---|---|
| 1853 | 829 | 15,971 |
| 1861 | 9,888 | |
| 1871 | 5,054 | 167,958 |
| 1881. | 5,460 | 253,778 |
| 1891 | 8,388 | 437,056 |
This last is the highest value for any year. In 1888 the number of tons was the greatest—8,482; but the value—.£;380,933—was less than last year's.
There can be little doubt that as a field of labour New Zealand offers exceptional advantages. The average climate permits of work being done in the open air all the year round, and a large area of the country is fertile. The mineral wealth of the islands is almost inexhaustible, and the geographical position of the colony offers a commercial future of the highest promise. The dangers and hardships endured by the pioneer settlers in the early days are now almost forgotten; and, although there is much heavy work remaining to be done, still, in a country where the Natives are no longer troublesome, and where the lands are traversed by railway and telegraph lines, the settler will find his toil lighter and his reward more sure than that of his predecessors. For those wishing to become citizens of the colony and to secure a share of the success which has attended the efforts of many thousands of hard-working and now prosperous people, the following remarks are intended.
The conditions under which men labour in the country districts differ so much according to the individual training, means, and necessities of each person that it is difficult to give one all-round rule suitable for the requirements of each and every would-be settler. Some desire to see themselves at once masters of property, and owning house, farm, and stock; others are contented if they can only find plenty of employment as wages-men for others. The large majority look forward to some day holding their own farms (either as freehold or under a perpetual lease), and these only accept hire from their richer brothers as a temporary aid enabling them to lay by a store which will some day permit them to become settlers on their own account. They thus gain knowledge as well as pecuniary assistance; and it is a golden rule for a new arrival to guide himself by to endeavour to gain his experience by working for another person until the strangeness and novelty of life under altered conditions has worn off. In bush-farming especially everything must be so new to one coming from another country that he will find countless fresh sources of knowledge opening up everywhere. First, the wood-lore has to be learnt; the names of the trees, their usefulness for sawn timber or for fuel; or, on the other hand, their uselessness save for “burning off.” So, also, the handling of axe and bill-hook so as to avoid danger in under-scrubbing, felling, and clearing, is not learnt in a day, and requires time before anything like skill is developed. “Logging up” the great scorched logs on the burnt spaces, and sowing down the clearings with grass-seed follow the felling; and when the ground is sufficiently clear for the cattle to be able to wander among the stumps and logs, come the tasks of splitting posts and rails for fences, and then of selecting the stock. If the farm selected is in the fern land or open country so much technical knowledge and so much hard toil is not at first required, but in its place comes the use of plough and harrow. Lessons must be learnt concerning the seasons (with their antipodean changing of winter months for summer), and diligent exercise in acquiring local knowledge from neighbours. However well versed a farmer or a farmhand may be in the methods used in cultivating land in other countries, he will achieve little in this colony until he has made himself acquainted with a system fitted to the climate, soil, and markets of his colonial farm. The largest grain-producing districts are in the Middle Island, and a yield far above the average of land in the Old Country results, if we take into consideration the absence of high-farming, and that the soil is seldom treated with heavy dressings of manure. Much of the work on dairy-farms has been lessened by the establishment of factories for the manufacture of cheese and butter. They are generally owned by co-operative societies of the farmers supplying the milk, and these receive a certain agreed-upon price for each gallon of milk supplied, and divide the profits of the butter and cheese afterwards on the ratio of the individual milk-supply. These establishments are by degrees removing the work of butter- and cheese-making from the farmer's family; they will help to firmly establish a large and increasing export trade, and to make the market firm by equalizing and steadying the quality of the product.
To those whose proclivities tend towards a pastoral life, occupation as stockriders, shepherds, &c., on one of the large cattle- and sheep-runs common in the colony may be obtained. These runs in some cases comprise very rich country acquired in early days from the Natives, but such holdings are few. Generally, the runs consist of second-class or slightly-broken land, unfit for the purposes of agriculture; or, if not unfit, still not of so attractive a character as other properties still obtainable from the Crown or private persons. A run usually contains several thousands of acres, and as, very often, parts of it are mountainous, the work of mustering the cattle and sheep is full of excitement and sometimes of danger. The life for some months of the year is by no means a toilsome one, but this is made-up for by the long hours required and untiring activity to be displayed at other times. On a cattle-run the tasks of mustering and drafting the stock and branding the youngsters are very heavy work, needing the display of considerable powers of rough-riding among the horsemen; while on a sheep-run the lambing and shearing-seasons tax every power of the station-hands. A large number of men move about the country as shearing-time approaches, in the hope of being engaged as extra helpers; and these men are hard to wean from their nomadic life to more settled pursuits; but as their labour is almost a necessity at times, both to the sheep-farmer and the agriculturist (at harvest), it is difficult to see how their places could be supplied if their gipsy-life should be discontinued. To those who love the saddle and take interest in the care of animals station-life offers innumerable attractions, and if to this is added (after a due apprenticeship) the ownership of such property, then the hope of a pecuniary reward presents itself, of a value greater than the settler can hope to obtain in any other pursuit.
We will now consider the employment of labour in the country districts at occupations not strictly of a pastoral or agricultural character. First of these is work about saw-mills. Thousands of men are employed in the business of procuring sawn timber and forwarding it to the market. There is a difficulty in obtaining stone and brick for building purposes in localities far from towns; the materials being costly on account of the high wages of labourers, their actual weight, and the difficulty of transport. The place of these materials is generally supplied by the use of sawn timber, a product almost everywhere obtainable, through New Zealand's wealth of forest trees. In the far north many of the mills are worked for the kauri-pine logs. The trees being felled, the logs are rolled down into the streams, which, being dammed up by the timber, rise in times of heavy rain, until they break through in full flood, bearing their burden to the mouths of the rivers on whose banks the mills are erected, and where the logs are captured. In the south, rough tramways are laid down in the bush, and the logs hauled on low carriages to the mills by horse- or bullock-teams. Here the great round baulks of timber are “broken down” being cut lengthwise (by saws moving up and down vertically) into “flitches,” which are passed over to the circular-saws to be ripped into boards and scantling. All this entails, necessarily, a great variety of labour; first, the employment of gangs of men in the bush clearing roads, felling the trees, cross-cutting them into logs, and moving them out with screw-jacks to open points whence they can be shifted to the mill. The team-driving (or in the north, the rafting), the machine-tending, the handling and cartage of planks, &c., offer diversities of labour and degrees of wages suited to all ages of workers and stages of skill.
Next to the saw-mill work as to the number of hands employed comes the occupation of flax-milling. The New Zealand flax, or hemp, is the product of a plant peculiar to this country. When growing, it looks like a clump of broad green sword-like blades, each blade being 2in. or 3in. wide, and rising to 6ft. or 8ft. in height. The clumps stand close together, often covering large tracts of country, much of which is shallow swamp. Men are employed in cutting the leaves close to the ground and gathering them into bundles, which are then carried to the mill. This mill consists of cleaning and scutching machinery, which removes the green portion of the plant and produces the hemp in long white fibres, which are then tied into hanks, pressed into bales, and sent to Europe and America to be made into cordage and binder-twine. A great deal of the work performed about flax-mills is comparatively unskilled labour, although, of course, a certain knowledge of machinery and deftness of manipulation is necessary in working the actual mill itself. [There is a separate article on this subject.]
A very valuable source of revenue to New Zealand has been the fields of kauri-gum, mostly found to the north of Auckland. Kauri-gum is the product of the giant kauri-pine, a tree still found lifting its huge bulk on the hills of the North Island, but which was formerly widely spread over spaces which now are open country. This fact is known by the deposits of amber-like gum which in large masses is found beneath the soil. A wandering population follows the occupation of seeking for this deposit; and, as the gum-digger's outfit consists of a spear, a spade, and a sack, it is a pursuit to which men often turn when out of employment, without capital or other resources. With the spear the digger prods about in localities which seem to him to be probable hiding-places of his treasure, and on the “feel” of the brittle gum beneath the surface be quickly brings it to the light of day by means of his spade. Then the sack is brought into requisition, and the gum is carried to camp, to be scraped and cleaned by the light of the evening fire. It is a free, careless life, usually solitary, and often full of hardship, but having charms for those to whom regular hours and steady employment under the direction of others would be irksome. Nor is it without monetary reward: diggers often make from £2 to £4 a week each, and a man at this employment must be very idle or very stupid who cannot earn a fairly good living. [The value of this product is given in a special article.]
Of our mineral wealth and the large population employed in mining industries it is unnecessary here to speak, since in another portion of this publication the subject will receive attention. Suffice it to say that those to whom agricultural or pastoral life seems tame find in the direction of mining for minerals an outlet for their energies. The life is rough and hard, is full of danger and toil, but it is one which, when commenced, exerts a fascination whose spell is hard to break. A life on the plains or in cities offers little temptation to gold-miners, who, in the mountain air, work with intense energy all day, and at night he down to dream of the riches the hills and rivers could yield if they would disclose their secrets. Of course among gold-miners there are many who prefer a safe weekly -wage to the alternations of hope and disappointment, while among the coal-miners the great bulk of the workers are either wages-men or are on small contracts, whose steady yield almost takes the place of regular earnings.
To many, however, life in the country is hardly endurable. Early habits and training, or the gregarious instinct, induce them to prefer the busy crowded towns to the quiet farm or silent forest. To such at one period New Zealand could offer but small inducement; but with the rapid growth of her cities and encouragement shown to manufacturers a large population now derives its support from industries worked in urban localities. Not only are there numerous shops for the retail distribution of goods, offices and warehouses for the transfer and storage of merchandise, but factories and workshops are everywhere coming into existence, with their attendant workers busily engaged in their various duties. There are factories for the production of woollen goods, clothing, hats, boots, leather, saddlery, agricultural implements, carriages, bicycles, tinware, ironware, railway material, paper, glass soap, candles, cordage, casks, baskets, tinned meats, biscuits, confectionery, &c.; besides flour-mills, breweries, gasworks, freezing-works, foundries, dye-works, fellmongeries, and many other businesses by means of which advancing civilisation supplies the luxuries and necessities of a people.
Besides occupation for those working on the soil of the colony there is the possibility of earning a competency for those willing to gather the ever-renewed “harvest of the sea.” Every bay and harbour (besides many of the open roadsteads) are haunts of incalculable numbers of fish, almost all of which are fit for the table and many of them of great delicacy. They can be caught with little trouble, and without that terrible risk which fills with care and often with sorrow, the breasts of the wives and children of the fishermen who sail the stormy seas of Northern Europe. The fisher-life is followed by a considerable number of persons in New Zealand at the present time, but the work they do is but inconsiderable compared to that which awaits innumerable hands in the future. A few successful attempts have been made to commence the canning and preserving of fish, but the trade is in its infancy, and promises to be an almost unlimited source of profit to those willing to invest their energies and means in its development. As a general rule the fisheries are in the hands of a few poor men, and, as little capital is required for an outfit (a boat, a net, and a few lines), the life offers attractions and reward to any hard-working men.
With the desire of expediting and assisting the engagement of labour, and encouraging local industries, the Government has formed a department, under the direction of the Minister of Labour and administered by the Secretary. The central office is the Bureau of Industries, in the Government Building, Wellington. There is a bureau in each of the large towns, viz., in Auckland, Christchurch, and Dunedin, and these bureaux are under the charge of the Inspectors of Factories in these cities. In the country districts the police sergeants and local constables everywhere are agents of the Bureau, and send in regular reports as to the requirements of workmen and employers. A new-comer to New Zealand who wishes to ascertain the exact position of any particular occupation (as to wages, market, requirements, &c.) will do well to visit some office of this department and obtain the desired knowledge, which the Bureau agents and Inspectors of Factories will be glad to impart.
The subject of labour in the colony would be incomplete without some reference to the position of women's work. On the farms the wives and daughters of settlers find occupation in duties which present an unceasing round of service. These duties are in many cases now being lightened by the institution of dairy factories, which relieve the women of the task of butter-making; still, the housework, cooking, and washing for a family, if properly carried out prevent any idleness or ennui from visiting the household. The life on the whole is a happy one, blest by the buoyant health of those who live in the clear fresh air; and, except in the cases of the more solitary and isolated farms, there is plenty of visiting and flitting about—no population being so constantly on the wing as that of New Zealand, as is testified by the crowded trains and steamers which serve a people sparse and scattered as it at present is. Domestic service attracts few, and it is difficult to keep good female servants, as they marry as soon as their worth becomes known. In towns the tendency of the young women is to obtain work either in shops or factories, and they prefer the slightly higher wages and regular hours of commerce and manufacture to the obligations of domestic service. It is a preference which does not tend to fit them for the care of a home when they marry and have to provide for the comfort of husband and children; but the semi-independence, shorter hours, and better pay explain its attractiveness for the young; while the necessity for workers, if industries are to be carried on, renders their choice of a calling useful to the bulk of the community.
Having thus briefly spoken of labour for those likely to find employment, it will be well to warn those who are thinking of coming to the colony unprepared to work at any of the occupations mentioned. It is not the mere idler to whom the caution is addressed, for the idle person is as useless in Great Britain as in New Zealand; it is to those who are of diligent and industrious habits, but trained in some calling not required in the colony, and insusceptible of change. The clerk, the shopman, the highly-educated man without capital, will probably find that the openings for employment suitable to them have been already filled or that there are at any rate very many applicants. The chance of a new-comer obtaining a place as clerk or teacher is not great, seeing that he has to compete against sons of men of old standing and influence. It may be broadly stated that the town occupations (even mechanical) are sufficiently well supplied. If, on the other hand, there is a sturdy determination to be ready for any emergency, to rough it in the “bush,” on a farm, a station, a mill, or at any other undertaking which requires pluck and muscle to carry out, then the future need not be feared, but the worker may look forward confidently to the possession shortly of one of the many comfortable and pleasant homes with which New Zealand abounds.
The average rates of wages in each provincial district of the colony are shown in the table next following, and will be found to afford sufficient evidence of satisfactory remuneration for all classes of labour. There is also a table of prices of produce, live-stock, and provisions, which is worthy of attention, especially as regards the prices of meat and other necessaries of life:—
| AVERAGE RATES OF WAGES IN EACH PROVINCIAL DISTRICT OF NEW ZEALAND DURING THE YEAR 1891. | |||||||||
|---|---|---|---|---|---|---|---|---|---|
| Description of Labour. | Auckland. | Taranaki. | Hawke's Bay. | Wellington. | Marlborough. | Nelson. | Westland (Goldfield) | Canterbury. | Otago (Part Goldfield). |
| 1. AGRICULTURAL LABOUR | |||||||||
| Farm-labourers: | |||||||||
| With board, per week | 8/ to 20/ | 16/ to 20/ | 20/ to 25/ | 15/ to 20/ | 20/ | 20/ | 25/ | 20/ | 15/to 20/ |
| Without board, per day | 5/ to 6/ | 4/ to 7/ | 7/ | 6/6 to 7/ | 7/ | 6/ | 6/ | 7/ | 7/ |
| Ploughmen: | |||||||||
| With board, per week | 12/ to 25/ | 20/ to 25/ | 20/ to 25/ | 15/ to 25/ | 25/ | 25/ | 30/ | 20/ to 22/6 | 20/ to 22/6 |
| Without board, per day | 5/ to 7/ | 6/ to 7/ | 7/ | .. | 7/ | 7/6 | 7/ | .. | 8/ |
| Reapers: | |||||||||
| With board, per week | 15/ to 25/ | 48/ to 60/ | 20/to 25/ | 20/ | 30/ | 48/ | 40/ | 40/ | 40/ to 50/ |
| Without board, per day | 6/ | 8/ to 10/ | 7/ | .. | 7/ | 9/ | .. | 1/6 p. hour | 8/ to 9/ |
| Mowers: | |||||||||
| With board, per week | 15/ to 20/ | 48/ to 60/ | 20/ to 25/ | 20/ | 30/ | 60/ | 40/ | 50/ | 40/ to 50/ |
| Without board, per day | 6/ | 8/ to 10/ | 7/ | .. | 8/ | 11/6 | .. | 1/6 p. hour | 8/ to 9/ |
| Threshers: | |||||||||
| With board, per week | 10/ to 15/ | 40/ to 48/ | 20/ to 25/ | 20/ | 30/ | 42/ | 40/ | 40/ | 50/ to 60/ |
| Without board, per day | 6/ | 6/ to 8/ | 7/ | .. | 7/ | 8/6 | .. | 10/ | 7/ to 10/ |
| 2. PASTORAL LABOUR. | Per week. | ||||||||
| Shepherds, with board, per annum | £26 to £52 | 25/p.week | 25/ to 30/ | £52 to £100 | £60 | £75 | .. | £75 to £80 | £; 50 to £; 60 |
| Stockkeepers, with board, per annum | £26 to £65 | 30 p. week | 25/ to 30/ | £52 to £75 | £50 | .. | .. | £50 to £55 | £55 to £65 |
| Hutkeepers, with board, per annum | £20 to £35 | .. | 20/ to 25/ | £1 p. week | £50 | .. | .. | £35 to £40 | £50 |
| Station-labourers: | |||||||||
| With board, per week | 10/ to 15/ | 20/ | 20/ to 25/ | 20/ | 20/ | 25/ | .. | 20/ to 25/ | 15/ to 20/ |
| Without board, per day | .. | .. | .. | .. | 6/ | .. | .. | 6/ | .. |
| Sheep-washers: | |||||||||
| With board, per day | 8/ | .. | 5/ | 20/ p. week | 7/ | .. | .. | 8/ | .. |
| Without board, per day | 10/ | .. | .. | .. | .. | .. | .. | 9/ | 7/ to 10/ |
| Shearers, with board, per 100 sheep sheared | 15/ to 17/6 | 17/6 | 17/6 | 17/6 to 20/ | 16/ | 16/8 | .. | 20/ | 15/to 17/6 |
| Men-cooks on stations, with board, per week | 10/ to 25/ | 20/ | 20/ to 30/ | 20/ to 25/ | 25/ | 30/ | .. | 20/ to 25/ | 20/ to 25/ |
| 3. ARTISAN LABOUR (per day, without board). | |||||||||
| Masons | 8/ to 9/ | 8/ | 12/ | 9/ to 12/ | 10/ | 12/ | 14/ | 10/ | 9/ to 12/ |
| Plasterers | 8/ | 8/ | 11/ | 9/ to 12/ | 12/ | 12/ | 14/ | 10/ | 9/ to 15/ |
| Bricklayers | 8/ | 8/ | 12/ | 9/ to 12/ | 10/ | 12/ | 14/ | 10/ | 11/ to 12/ |
| Carpenters | 7/ to 8/ | 7/ to 8/ | 9/ | 8/ to 10/ | 9/ | 9/ | 12/ | 8/ to 9/ | 8/ to 11/ |
| Smiths | 7/ to 10/ | 8/ | 10/to 11/ | 8/ to 12/ | 10/ | 11/ | 12/ | 8/ | 8/ to 12/ |
| Wheelwrights | 7/ to 8/ | 8/ | 10/ | 8/ to 10/ | 10/ | 10/ | 12/ | 9/ | 10/ to 12/ |
| Shipwrights | 8/ | .. | 12/ | 10/ to 11/ | 10/ | 12/ | 12/ | 9/ | 12/ to 15/ |
| Plumbers | 6/ to 7/ | 8/ | 10/ | 8/ to 10/ | 9/ | 12/ | 12/ | 8/ 9/ | 9/ to 13/ |
| Painters | 6/ to 6/6 | 6/ | 9/ | 7/ to 10/ | 9/ | 9/ | 10/ | 8/ | 8/ to 10/ |
| Saddlers | 6/ to 7/ | 8 | 9/ | 10/* | 10/ | 8/ | 10/ | 8/ | 8/to 10/ |
| Shoemakers | 6/ to 7/ | 6/ | 9/ | 8/6 to 10/* | 8/ | 8/6 | 12/ | 8/ | 7/6 to 8/ |
| Coopers | 7/ to 7/6 | 6/ | 9/ | 8/6 to 10/ | 8/ | 10/ | 12/ | 8/ | 8/ to 12/ |
| Watchmakers | 7/ to 12/ | 8/ | 10/ | 10/ | 10/ | 10/ | 15/ | 8/ | 9/ to 12/ |
| 4. SERVANTS. | |||||||||
| Married couples without family, with board, per annum | £52 to £75 | £40 to £50 | £70 to £80 | £70 to £90 | £70 | £50 | .. | £70 to £75 | £65 to £80 |
| Married couples with family, with board, per annum | £50 to £70 | .. | .. | £65 | £60 | £45 | .. | £60 to £70 | £50 to £65 |
| Grooms, with board, per week | 15/ to 25/ | 20/ to 25/ | 25/ | 15/ to 25/ | 20/ | 20/ | 25/ | 25/ to 30/ | 15/ to 25/ |
| Gardeners: | |||||||||
| With board, per week | 10/ to 25/ | 20/ | 25/ to 30/ | 20/ to 25/ | 30/ | 20/ | 40/ | 30/ | 20/ to 30/ |
| Without board, per day | 6/ | 6/ to 8/ | 7/ to 9/ | 7/ to 9/ | 8/ | .. | 10/ | 10/ | 7/ to 8/ |
| Cooks, with board, per week | 12/to 20/ | 10/ to 20/ | 15/ to 25/ | 15/ to 25/ | 20/ | 11/ | 25/ | 15/to 20/ | 15/ to 20/ |
| Laundresses, with board, per week | 12/ to 20/ | 15/ | 12/ to 15/ | 12/ | 12/ | 12/ | 20/ | 15/ to 20/ | 12/ to 15/ |
| General house-servants, with board, per week | 5/ to 10/ | 8/ to 12/6 | 10/ to 14/ | 10/ to 15/ | 10/ | 10/ | 15/ | 15/ to 18/ | 10/ to 12/ |
| Housemaids, with board, per week | 5/ to 10/ | 6/ to 12/6 | 10/ to 12/ | 10/ to 15/ | 10/ | 10/ | 15/ | 10/ | 10/ to 12/ |
| Nursemaids, with board, per week | 3/ to 7/ | 4/ to 9/ | 5/ to 8/ | 5/to 10/ | 7/ | 7/ | 10/ | 7/ to 8/ | 5/ to 8/ |
| Needlewomen: | |||||||||
| With board, per week | 10/ to 15/ | .. | .. | 13/6 | 20/ | 15/ | 18/ | 20/ | 15/ |
| Without board, per day | 3/ to 4/ | 4/ | 2/6 to 4/ | 3/6 to 5/ | 3/ | .. | .. | 5/ | 3/to 4/ |
| 5. MISCELLANEOUS. | |||||||||
| General labourers, without board, per day | 5/ to 7/ | 6/ to 6/6 | 7/ to 8/ | 6/ to 8/ | 7/ | 7/ | 10/ | 6/ to 7 | 6/ to 7/ |
| Stonebreakers, without board, per cubic yard | 3/ to 3/6 | 4/ | 2/ | 3/ to 3/6 | .. | 5/ | .. | 3/6 | 3/6 |
| Seamen, with board, per month | £5 to £8 | .. | £7 | £7 to £8 | £7 | £8 | £5 to £8 | £7 to £8 | £4 to £8 |
| Miners, without hoard, per day | 6/6 to 7/ | 8/ | .. | .. | 9/ | 9/ | 10/ | 12/ | 9/ to 10/ |
| Per day. | Per day. | Per day. | Per day. | Per day. | Per day. | Per day. | Per day. | Per day. | Per week. | |
|---|---|---|---|---|---|---|---|---|---|---|
|
* £2 to £2 10s. per week. * Mostly piecework. † With board, | ||||||||||
| Engine drivers, without board | 8/ | 8/ to 9/ | 8/to 11/ | 6/to 11/6 | 11/ | 10/ | 12/ | 12/ | 9/ to 12/ | 60/ |
| Per week. 40/ to 60/ | ||||||||||
| Tailors, | 8/* | 6/ | 10/ | Per day. 10/ | 9/ | 9/ | 10/ | 8/ | 8/6 to 9/ | 50/ to 60/ |
| Per week. 40/to 50/ | ||||||||||
| Tailoresses, | 5/* | 4/ | Per week. 15/to 25/ | Per day. 5/ to 8/ | 3/ | 5/ | 5/ | 3/6 | 3/ to 4/ | 25/ to 30/ |
| Per week. 20/ | ||||||||||
| Dressmakers, | 3/ to 4/ | 4/ to 5/ | 10/to 20/ | 15/ to 30/ | 3/ | 3/ | 3/ | 3/ | 3/ | 18/ |
| Milliners, | 4/ to 6/6 | 4/ to 5/ | 20/ to 35/ | 20/ | 8/ | 4/6 | 5/ | 3/ | 3/6 to 5/ | 20/ |
| Machinists, | 3/6 | 3/6 to 4/ | 20/ to 25/ | 20/ to 25/ | 5/ | 2/ | 5/ | 3/6 | 2/6 to 3/ | 18/ |
| Storekeepers, | 6/ to 7/ | 10/ | Per week. 9/6 | 30/ to 60/ | 8/ | Per week. 50/ | Per week. 60/ to 100/ | .. | 7/ | 50/ to 80/ |
| Storekeepers' assistants, | 5/ to 6/6 | 3/ to 8/6 | .. | 18/ to 60/ | 7/ | 35/ | 40/ to 60/ | 7/ | 5/ | 20/ to 50/ |
| Drapers' assistants | 7/ to 7/6 | 3/ to 9/ | Per week. 40/to 80/ | 30/ to 60/ | 8/ | 40/ | 60/ to 100/ | 8/6 | 5/ to 6/ | 40/ to 50/ |
| Grocers' assistants, | 6/ to 6/6 | 3/ to 9/ | 40/ to 65/ | 20/ to 60/ | 7/ | 40/ | 40/ to 60/ | 7/ | 5/ | 20/ to 50/ |
| Butchers, | 6/ to 7/ | 7/ to 8/ | 40/ to 50/ | 30/ to 60/ | 7/ | 40/ | 40/ to 60/ | 7/ | 7/ | 40/ to 60/ |
| Bakers, | 6/ to 7/ | 8/ to 8/6 | 40/ to 60/ | 30/ to 50/ | 8/ | 40/ | 40/ to 60/ | 7/ | 8/ to 9/ | 30/ to 35/† |
| Storemen, | 6/to 7 | 5/ to 6/6 | 40/ to 60/ | 40/ | 8/ | 55/ | 60/to 70/ | 8/ | 9/ | 40/ to 50/ |
| Compositors, | 7/to 12/* | 8/ to 9/ | 50/ | 30/ to 60/ | 10/ | 60/ | 60/ to 70/ | 10/ | 9/ to 10/ | 40/ to 70/ |
| AVERAGE PRICES OF PRODUCE, LIVE-STOCK, PROVISIONS, ETC., IN EACH PROVINCIAL DISTRICT OF NEW ZEALAND DURING THE YEAR 1891. | |||||||||
|---|---|---|---|---|---|---|---|---|---|
| Articles. | Auckland. | Taranaki. | Hawke's Bay. | Wellington. | Marlb'rough. | Nelson. | Westland (Goldfield). | Canterbury. | Otago (Part Goldfield). |
| I. AGRICULTURAL PRODUCE. | |||||||||
| Wheat per bushel | 3/6 to 5/ | 3/9 to 5/ | 4/ | 4/3 to 4/9 | 4 | 4/ | 5/ | 4/6 | 4/6 to 5/ |
| Barley per bushel | 3/6 | 3/ to 3/6 | 2/6 | 2/9 to 3/3 | 3/ | 2/8 | 3/6 | 3/6 | 2/6 to 3/ |
| Oats per bushel | 2/4 to 2/9 | 2/ to 2/6 | 2/6 | 1/10 to 2/2 | 1/6 | 1/10 | 2/9 | 1/10 | 1/6 to 2/ |
| Maize per bushel | 2/4 to 4/ | 3/3 to 3/6 | 3/3 | 3/ to 4/6 | 5/ | 4/6 | 3/9 | 2/9 to 5/3 | |
| Bran per bushel | 10d. to 1/6 | 1/ to 1/9 | 1/3 | 7d. to 1/ | 1/6 | 1/ | 1/2 | 7 1/2d. | 9d. to 1/ |
| Hay per ton | 50/ to 72/6 | 35/to 60/ | £3 | 60/ to 70/ | £3 | £3 10s. | £3 | 40/ to 70/ | |
| II. FLOUR AND BREAD. | |||||||||
| Flour, wholesale per ton of 2,000lb. | £12 to £16 | £30/ to 310/ | £15 | £12 to £14 | £12 | £11 | £13 10s. | £13 | 240/ to 270/ |
| Flour, retail | 7/ to 8/ | 7/ to 8/6 | 8/ | 7/3 to 8/ | 7/6 | 7/ | 7/6 | 6/9 | 6/6 to 7/6 |
| Bread per 41b. loaf | 7d. to 8d. | 7 1/2d. | 7d. | 7d. to 8d. | 7d. | 7d. | 8d. | 6d. | 6d. to 7d. |
| III. LIVE-STOCK AND MEAT. | |||||||||
| Horses, draught per head | £10 to £16 | £17 to £20 | £20 to £40 | £20 to £30 | £20 | £30 | £30 | £12 to £23 | £20 to £25 |
| Horses, saddle and harness, per head | £5 to £14 | 120/ to 150/ | £8 to £20 | £10 to £25 | £10 | £10 | £20 | £3 to £12 | £15 to £18 |
| Cattle, fat per head | £4 to £5 | £5 to £6 | £5 5s. | 110/ to 160/ | £6 | £7 | £7 10s. | £5 to £9 | £7 to £9 |
| Cattle, milch cows per head | 70/ to 80/ | 90/ to 95/ | £3 to £6 | £4 to £5 | £7 | £4 | £8 10s. | £3 to £8 | £3 to £7 |
| Sheep, fat per head | 14/ to 15/ | 11/ to 12/ | 10/6 | 10/ to 12/ | 10/ | 10/ | 18/ | 13/ to 16/ | 14/ to 15/ |
| Lambs, fat per head | 7/ to 12/6 | 8/6 | 8/ | 8/ to 9/ | 8/ | 9/ | 12/ | 10/ to 14/ | 8/ to 11/ |
| Butchers' meat: | |||||||||
| Beef per lb. | 4 1/2d. to 6d. | 3d. | 4d. | 3d. to 5d. | 4d. | 5 1/2d. | 6d. | 5d. | 4d. to 5d. |
| Mutton per lb. | 3d. to 5d. | 3d. to 3 1/2d. | 3d. | 2d. to 4 1/2 d. | 3d. | 4d. | 6d. | 3d. | 3d. to 4d. |
| Veal per lb. | 5d. | 4d. to 4 1/2d. | 4d. | 4d. to 6d. | 4d. | 6d. | 8d. | 4d. | 3d. to 5d. |
| Pork per lb. | 4d. to 5d. | 4d. to 5d. | 5d. | 4d. to 6d. | 5d. | 6d. | 6d. | 6d. | 4d. to 6d. |
| Lamb per lb. | 4d. to 5d. | 4d. to 6d. | 5d. | 6d. to 7d.;3/ to 3/6 per qr | 4 1/2d. | 5d. | 10d. | 6d. | 4d. to 5d. |
| IV. DAIRY PRODUCE. | |||||||||
| Butter, fresh per lb. | 6 1/2d. to 10d. | 8 1/2d. to 9d. | 1/3 | 9d. | 6d. | 8d. | 1/6 | 10d. | 8d. to 1/1 |
| Butter, salt per lb. | 5d. to 8d. | 6d. to 8d. | 10d. | 7d. | 6d. | 6d. | 1/3 | 8d. | 6d. to 10d. |
| Cheese, colonial per lb. | 5d. to 8d. | 4 1/2d. to 7d. | 6d. | 6d. to 7d. | 4d. | 7d. | 9d. | 5d. | 5d. to 7d. |
| Cheese, imported per lb. | 1/ | 7d. | 9d. | 10d. to 1/3 | 6d. | 1/ | 1/ | 8d. to 1/ | |
| Milk per quart | 3d. to 6d. | 3d. | 3d. | 3d. | 3d. | 4d. | 8d. | 3d. | 2 1/2d. to 4d. |
| V. FARM-YARD PRODUCE. | |||||||||
| Geece per pair | 7/ to 9/ | 4/6 | 8/ | 6/ to 11/ | 5/ | 3/ | 10/ | 6 | 8/ to 10/ |
| Ducks per pair | 3/ to 4/6 | 3/6 | 5/ | 4/ to 5/6 | 4/ | 4/ | 6/ | 4/ | 4/6 to 6/6 |
| Fowls per pair | 2/6 to 4/ | 2/ to 2/6 | 3/ | 3/ to 5/ | 2/ | 3 | 5/ | 2/6 | 3/ to 4/6 |
| Turkeys per head | 5/6 to 10/ | 3/ to 4/6 | 5/ | 5/ to 6/ | 2/6 | 8/ | 7/6 | 5 | 5/6 to 8/ |
| Bacon per lb. | 6d. to 10d. | 7d. 7 1/2d. | 10d. | 6 1/2d. to 8d. | 8d. | 6d. | 9d. | 6d. | 7d. to 9d. |
| Ham per lb. | 8d. to 10d. | 8d. to 9 1/2d. | 1/ | 9d. to 1/ | 8d. | 9d. | 1/ | 9d. | 9d. to 11d. |
| Eggs per doz. | 10d. to 1/2 | 9d. to 1/ | 1/6 | 1/ to 1/3 | 8d. | 8d. | 1/9 | 10d. | 7d. to 1/1 |
| VI. GARDEN PRODUCE. | |||||||||
| Potatoes, wholesale per ton | £210/ to £6 | 30/ to 92/6 | £4 | £115/ to £6 | £2 | £2 | £3 10/ | £2 to £4 | £110/ to £5 |
| Potatoes, retail per cwt. | 3/ to 6/ | 2/ to 5/ | 6/ | 4/ to 7/6 | 3/ | 3/ | 5/ | 3/ to 5/ | 2/ to 6/ |
| Onions per lb. | 2d. to 2 1/2d. | 2d. to 3d. | 3d. | 1d. to 3d. | 1d. | 1d. | 2d. | 2d. | 1d. to 5d. |
| Carrots per doz. bnchs. | 6d. to 3/ | 1/6 to 2/ | 3/ | 1/6 to 3/ | 2/ | 3/ | 2/ | 1/ to 3/ | |
| Turnips per doz. bnchs. | 6d. to 3/ | 2/ | 3/ | 1/6 to 2/ | 2/ | 3/ | 2/ | 1/ to 3/ | |
| Cabbages per doz. | 1/. to 2/6 | 1/ to 1/6 | 2/ | 1/ to 2/6 | 2/ | 2/ | 3/ | 2/ | 1/ to 3/ |
| VII. MISCELLANEOUS ARTICLES. | |||||||||
| Tea per lb. | 2/ to 2/3 | 2/3 to 2/6 | 2/6 | 2/ to 4/ | 2/6 | 2/ | 2/6 | 2/ | 2/ to 2/6 |
| Coffee per lb. | 1/6 to 1/10 | 1/8 to 1/9 | 1/8 | 1/4 to 1/10 | 1/10 | 1/10 | 2/ | 1/6 | 1/8 to 1/10 |
| Sugar per lb. | 3d. to 4d. | 3d. to 3 1/2d. | 3 1/2d. | 2 3/4d. to 4d. | 3 1/2d. | 3 1/2d. | 3 1/2d. | 3d. | 3d. to 3 1/2d. |
| Rice per lb. | 3d. to 4d. | 3d. to 4d. | 3d. | 2d. to 4d. | 3 1/2d. | 4d. | id. | 2 1/2d. | 3d. to 4d. |
| Salt per lb. | 3/1d. to 2d. | 1d. | 1 1/2d. | 3/1 d. to 1d. | 1d. | 1d. | 1d. | 1/2d. | 1d. to 2d. |
| Soap per cwt. | 16/ to 40/ | 20/ to 24/ | 12/6 | 10/ to 25/ | 27/ | 17/ | 22/ | 18/ | 16/ to 25/ |
| Candles per lb. | 6d. to 10d. | 7d. to 10d. | 9d. | 7d. to 10d. | 1/ | 8d. | 10d. | 8d. | 7d. to 10d. |
| Tobacco per lb. | 5/6 to 6/ | 6/ | 6/ | 4/9 to 6/ | 6/ | 6d. | 6/ | 5/ | 5/6 |
| Coals per ton | 25/ to 45/ | 27/6 to 47/6 | 50/ | 31/ to 60/ | 40/ | 40/ | 21/ | 30/ | 20/ to 35/ |
| Firewood per cord | 24/ to 45/ | 17/ to 20/ | 35/ | 20/ to 36/ | 25/ | 30/ | 25/ | 35/ | 15/ to 35/ |
| VIII. BEER, WINE, SPIRITS. | |||||||||
| Beer, colonial per hhd. | £4 to £410/ | £5 | £410/to £5 | £4 10/to £5 | £413/ | £4 13/ | £5 | £4 | £4 to £5 |
| Beer, English, bottled per doz. qrts. | 13/ to 18/ | 16/to 18/ | 14/ | 14/ to 15/ | 13/ | 13/ | 18/ | 12/6 | 12/ to 14/ |
| Brandy per gallon | 27/ to 30/ | 27/6 to 30/ | 30/ | 26/ to 32/6 | 25/ | 26/ | 25/ | 28/ | 25/ to 30/ |
| Rum per gallon | 27/ to 30/ | 25/ to 27/6 | 25/ | 23/ to 30/ | 24/ | 21/ | 23/ | 23/ | 23/ to 25/ |
| Whisky per gallon | 27/ to 30/ | 25/ to 30/ | 30/ | 25/ to 30/ | 25/ | 24/ | 25/ | 26/ | 25/ to 28/ |
| Gin per gallon | 22/ to 28/ | 25/ to 27/6 | 30/ | 20/ to 30/ | 18/6 | 21/ | 25/ | 23/ | 20/ to 26/ |
| Wine, Australian per gallon. | 15/ to 18/ | 17/6 to 24/ | 10/ | 12/ to 22/6 | 15/ | 14/ | 17/ | 17/ | 13/ to 18/ |
| Wine, European per gallon | 18/ to 20/ | 25/ to 32/6 | 22/6 | 22/6 to 27/6 | 15/ | 20/ | 20/ | 25/ | 16/ to 22/ |
New Zealand fishes resemble those which are found on the coast between Madeira and the Bay of Biscay more than they do those which are caught about the north of Scotland. Of the sea-fishes that are used as food in New Zealand, we have among the constant residents on all parts of our coast the hapuku, tarakihi, trevally, moki, aua, rock-cod, wrasse, and patiki; and, while the snapper, mullet, and gurnet are only met with in the north, the trumpeter, butterfish, and red-cod are confined to the south. But, with the exception of the patiki, or flounder, and the red-cod, none of these are representatives of fishes that are common even in the south of Britain; while from the more northern seas similar fishes are altogether absent.
In addition to those which remain throughout the year, a very large number of the fishes of the New Zealand coast, owing to its geographical position, are pelagic in their habits, and roam over a wide range of ocean, visiting these shores only irregularly in pursuit of food. Of the edible fishes of this class by far the largest number are visitors from warmer latitudes, such as the frostfish, barracouta, horse-mackerel, kingfish, dory, warehou, mackerel, and garfish; while only the ling, hake, haddock, and a few other fishes rare and worthless as food, are among those of more southern types which reach the New Zealand coast in their migrations.
There is, however, no reason to complain of any want of useful variety in the New Zealand fishes as compared with Britain, for we find that out of 208 species of fishes enumerated as occurring in the British seas, including many which are extremely rare or only occasional visitors, only 40 are considered to have a marketable value. In New Zealand, notwithstanding our very imperfect knowledge (especially with regard to the gregarious tribes, which there is reason to believe inhabit shoals at some distance from land), out of 192 sea-fishes, some of which are only known from single specimens, we have nearly as many varieties used for food as are brought to market in the British Islands.
Of 142 species of fish enumerated as found in New Zealand, 67 species are, so far as we know, peculiar to New Zealand; 75 are common to the coasts of Australia or Tasmania; while 10 species are found in New Zealand and other places, but not in the Australian seas. New Zealand ichthyology thus presents a very distinct character, the thorough deciphering of which affords a wide field for future observation and scientific investigation.
The following is a list of the fishes which are chiefly met with in the market: Hapuku, kahawai, red-snapper, snapper, tarakihi, moki, trumpeter, frostfish, barracouta, horse-mackerel, trevally, kingfish, warehou, mackerel, rock-cod, gurnard, mullet, sea-mullet, butter-fish, haddock, red-cod, whiting, ling, flounder or patiki, sole, garfish, grayling, smelt, kokopu, sardine, sprat, eel (tuna), black-eel, congereel, and silver-eel. Four species of oysters inhabit the coast of New Zealand.
At the census of 1891 returns were received from 253 fishing industries, employing 667 persons. The boats used were 418 in number, and the tonnage 788; 1,340 nets were in use. For oyster-dredging, 13 boats and 22 dredges were employed.
The fur-seal is found on the islands near the coast of New Zealand. The export of skins amounted to 1,322 for the year 1891.
The sperm-whale is found in the region of the ocean lying to the north-east of the colony. The harbours of New Zealand were formerly visited by whalers, for the purpose of refitting, carrying on shore-fishing, and barrelling their oil. The industry is not a great one at the present time, the export for 1891 having been: Whale-oil. sperm, 3,585gal.; whalebone, 25cwt.
It may be fairly said that there have been few, if any, more successful instances of the introduction of exotic forms of life than that of trout in New Zealand. From a few hundred ova imported in 1867,1868, and 1869, have sprung the countless numbers that now inhabit many of our rivers. Trout were first introduced into the colony from Tasmania. In 1867 a few hundred were procured, but, of the fry that were hatched out, nearly all appear to have been lost. In 1868 and 1869, however, further shipments were procured and hatched out at the fish-ponds at Opoho, near Dunedin, and at Christchurch. The fish reared from these ova are the parents of the fish now inhabiting our streams, although more recently ova of the Loch Leven and Scotch brown-trout have been introduced, as also a few salmon-trout. It appears to be impossible to trace from what stream in England the trout now in the colony originated; the ova imported into Tasmania were procured from the Weycombe, Bucks; from the Wey, at Acton, Hants; and from Alresford, on the Itchen, Hants; but to which ova the descent of our trout is to be attributed is not now ascertainable.
Fish-hatcheries are now established at several places, the most important being those at Clinton, in the Middle Island (Otago Acclimatisation Society), and at Masterton, in the North Island (Wellington Acclimatisation Society). From these and other hatcheries many thousand young fry and eyed ova are turned out annually; for instance, in 1891-92, 502,760 were turned out by the Otago Society, 425,291 by the Wellington Society, and 201,500 by the Southland Society. The total number of all kinds of trout (including eyed ova) distributed by the Otago Society up to the 31st March last was 4,143,854. These fry are used both to replenish the stock in rivers where trout have already been placed and to stock new waters. Owing to the large supply of food in New Zealand waters the trout have reached a very great size. Many large fish have been caught in Lake Wakatipu by means of nets; but they are not readily caught with bait in the New Zealand lakes. Large trout are killed in the rivers with rod and line; the largest known to have been so caught was one of 26 1/2 lb., killed in Hall's Creek, running into Lake Ellesmere.
The following is the record of one day's fishing at the mouth of the Rakaia, on the 22nd September, 1891: 30 fish, 1711b. 12oz., the largest weighing 11lb.
There is reason to believe that the average size of trout in many rivers will diminish as they increase in numbers.
The habit of the trout appears to have changed considerably since their introduction into New Zealand. The large trout inhabit the estuaries, and only run up the rivers for the purpose of spawning. Many have also been caught in the sea. These trout, as also the trout found in most of the lakes, are excellent eating.
Besides the common brown-trout (Salmo fario, var. ausonii), the rainbow-trout (Salmo irideus) has been introduced into the Auckland waters, where the temperature of the water is more suited to it than to the brown-trout.
Other varieties of trout have also been introduced in New Zealand—namely, the Loch Leven trout (a very fine fish found in Loch Leven), and the Bum trout; but there is reason to believe that these trout will, owing to the feed and climate, merge into one variety.
The American brook-trout (S. fontinalis) has also been introduced in considerable numbers to many streams, but, apparently, without much success, as, except in one or two streams, but few have ever been caught.
Besides trout, carp, tench, and perch have been introduced, the last-named of which appears to have been most successful.
In order to fish for trout it is necessary to procure a license from an acclimatisation society. The fee is £1, and it is practically applicable to the whole of New Zealand, as it will be indorsed to make it available in any district. The open season extends from the 1st October to the 31st March.
Table of Contents
The discovery of metalliferous ore and minerals in New Zealand was made shortly after gold was found in Australia. It is said that Mr. Hargreaves, the first discoverer of gold in New South Wales, previous to visiting that colony, asserted to several people in the Auckland District that gold would be found there, as the formation-of the country reminded him of California, where be had previously been. It was not, however, until 1852 that the discovery of auriferous deposits was made generally known by Mr, C. Ring, of Coromandel, who obtained a small quantity of gold, intermixed with quartz, in a creek which now bears his name; but the hostility of the Natives prevented further discovery until 1862, when the district was proclaimed a goldfield.
In the Middle Island, small samples of gold were discovered in the Otago District in 1853, at a place known as the Fortifications, which is now in the West Taieri goldfield. Intimation of gold being found in this district was officially given by Mr. C. W. Ligar, then Surveyor-General of the colony, to Captain Cargill, the then Superintendent of Otago; and afterwards, on several occasions, rumours were circulated that gold was found in the beds of several of the creeks and streams in the interior of Otago, and small parcels were occasionally brought to Dunedin; but at that time the gold-diggings attracted little or no attention in this colony.
The first payable goldfield was at Collingwood, in the Nelson District, which was opened in 1857; and in that year 10,437 oz. of gold were produced. Owing, however, to the small population at that time in the colony, together with the great attraction presented by the Australian goldfields, very little attention was given to the gold discoveries in New Zealand. From 1857 up to 1861, when gold was discovered at Tuapeka, or Gabriel's Gully, in Otago, the produce of the Collingwood goldfield only amounted to 41,872oz. of gold.
Gold was previously discovered in the early portion of 1861 in the vicinity of the Lindis River. The Provincial Government at that time were constructing a road to give access to the pastoral districts beyond the Lindis Pass, when the workmen came, accidentally, on an auriferous deposit, which gave fair prospects of its becoming a valuable discovery; but the general yield of gold from this portion of the Otago District has never been great.
Shortly after the discovery of gold at the Lindis, Mr. Gabriel Read, who had formerly been digging on the Victorian goldfields, found gold in Gabriel's Gully, where the auriferous deposits were so rich and so easily worked that the discovery flashed like lightning throughout the whole of the Australian goldfields, which at that time were beginning to be on the wane; and thousands of miners on the Australian soil quickly collected all their belongings, which in those days were easily carried, and came to New Zealand to try and better their fortunes. It may be mentioned that the first real discoverer of gold in payable quantities for working was Mr. Edward Peters, a native of Bombay, who, in 1858, found gold in the south branch of the Tokomairiro River, known afterwards as the Woolshed diggings, and who stated at that time that the ground was payable for working, showing a good sample of gold that he had obtained. Subsequently, the same person found gold in a gully near the north bank of the Tuapeka River, not far from the afterwards celebrated Gabriel's Gully, discovered at a later date by Mr. Gabriel Read, and which was the means of bringing thousands of people to the country who never otherwise would have come. In Mr. Read's report of the discovery to Major Richardson, Superintendent of Otago, he states:—
I take the liberty of troubling you with a short report on the result of a prospecting tour which I commenced about a fortnight age. During shat period I travelled inland about thirty-five miles, and examined the ravines and tributaries of the Waitahuna and Tuapeka Rivers. My equipment consisted of a tent, blanket, spade, tin dish, butcher's knife, and about a week's supply of provisions. I examined a largo area of country, washed dishfuls of earth in different localities, and found gold in many places, which would hold out a certainty that men with proper appliances would be munificently remunerated. In one place, for ten hours' work, with pan and butcher's knife, I was enabled to collect about 7oz. of gold.
This discovery was made known in June, 1861, and by the end of December in that year 187,696oz. of gold, representing a value of £727,321, were produced from this locality alone; and the population of Otago had increased in six months from 12,000 to 30,000.
As soon as the rush set in to Gabriel's Gully, Weatherstone, Munroe's, and Waitahuna Gullies were opened; and early in 1862 further auriferous deposits were found at Waipori and the Woolshed; the latter being the place which, three years previously, Mr. Edward Peters reported would be payable for working. Discoveries of smaller extent were afterwards found at Turnbull Gully, Deepdell Creek, Fillyburn, and Murphy's Gully.
In August, 1862, Messrs. Hartley and Reilly arrived at Dunedin with 1,047oz. gold, which they found by cradling and washing the sands on the beaches of the Clutha River, between what is now known as Clyde and Cromwell. As soon as this became known the excitement was so great that men left lucrative employment and comfortable homes to follow the life of a digger. Prices of agricultural produce and food of all descriptions went up, and the demand for teamsters was so great to take goods and tools to this new Eldorado that £120 per ton was paid for the carriage of goods from Dunedin; and on the arrival of the first wagon with flour, nine miles from the diggings, it was surrounded by a crowd of miners from the field, when the whole of the flour was handed cut and equally distributed to the crowd at 2s. 6d. a pannikinful. The demand for sawn timber was also so great that boards were stripped from drays and wagons, and sold, the usual price for an empty gin-case being £5. Every one at that time was thoroughly satisfied with his earnings—the beaches along the river were literally strewn with golden sand. But this state of things did not last long. As soon as the snow on the mountains began to melt, the water in the river rose to a vertical height of from 16ft. to 20ft., covering all the auriferous gravel-beaches, leaving those who had been previously at work in a very despondent state. By this time a large mining population had gathered on the field, and they turned their attention to the beds of the different streams and creeks flowing into the Clutha River, and almost immediately rich deposits of auriferous drift were discovered at Conroy's, Butcher's, Potter's, and Campbell's Gullies, also at Bannockburn, Cardrona, Arrow, Shotover, Skipper's, Nokomai, and the Nevis, all of which have contributed largely to the product of gold. Before the end of December, 1802, over 70,000oz. of gold were forwarded by escort from Dunstan alone—which was then the general name given to Clyde—to Dunedin.
In March, 1863, and following months, the Teviot, Benger, and Upper Manuherikia goldfields were opened up; and in May of the same year another important discovery was made by Mr. W. Parker, at Hogburn, which afterwards led to further discoveries of auriferous drifts at Hill's Creek, Dunstan Creek, Kyeburn, Hyde, Hamilton's, Macraes, and Mount Burster—the latter place being nearly 4,000ft. above the level of the sea; but being at so high an elevation the rich auriferous deposits that exist there can only be worked for about six or seven months in the year.
Further discoveries have been made from time to time of auriferous deposits at Cambrian, Tinker's, Matakanui, Bound Hill, Orepuki, and, in recent years, at Mount Criffel—the latter being 4,000ft. above sea-level—where some of the oldest drifts are found that exist in the Otago District. Gold has also been found on the beaches of the Waiau River, south of Orepuki, intermixed with platinum.
About the end of 1863 gold was found at Wakamarina, in the Marlborough District, where some very rich finds were obtained from the beds of the Deep Creek, Dead-horse Creek, and the Wakamarina River. This field still continues to support a small mining population.
Early in 1864 a party of Maoris, while searching for greenstone—which is highly prized by them for making ornaments, and, formerly, tomahawks and adzes—found gold in the bed of the Greenstone River, on the West Coast of the Middle Island. This discovery led to a large rush taking place from other parts of New Zealand, and also from the Australian Colonies. This portion of the colony, which was at that time in its natural state, covered with a dense forest and tangled undergrowth, has now a European population of about 33,000, all of whom are either directly or indirectly supported by the mining industry.
As soon as the rush set in to the West Coast, the auriferous deposits at Waimea, Kanieri, Blue Spur, and Jones's (now known as Boss), were discovered; and these led to further discoveries in the Grey Valley, No Town, Bed Jack's, Noble's, Orwell Creek, Antonio's, Maori Gully, Lyell, Charleston, and Brighton; the last large field opened up on the West Coast being Kumara, where a large population has been employed for the last fourteen years, and where more gold has been taken from a comparatively small area— within a compass of 2,500 acres—than on any other field on the West Coast.
During the early period of mining in the colony gold-mining operations were chiefly confined to alluvial drifts. This was especially the case in regard to mining in the Middle Island; but in the North Island all the gold has been obtained from quartz-lodes. In July, 1867, gold was discovered in a creek-bed at the Thames in pieces of quartz, and on the 10th August of the same year Messrs. Hunt, White, Clarkson, and Cobley found a very rich leader of auriferous quartz in the Kuranui Stream. This led to very rich discoveries of gold in the Shotover, Moanataiari, Long Drive, Caledonian, and other claims. The dividends from the Caledonian claim in one year amounted to about £657,000. Several years later gold-bearing lodes were discovered at Karangahake, Waitekauri, Waihi, Te Aroha, and Kuaotunu; and at the present time some of the mines at Karangahake and Waihi are giving excellent returns. The average value of the ore for three months' crushing from the Crown claim at Karangahake was about £15 per ton from a very large lode.
In 1872 the Reefton field was discovered; and since then, up to the end of December, 1891, a period of nearly twenty years, 540,324 tons of quartz have been crushed, which yielded an average of an ounce to the ton. The total value of gold produced from this field, both from quartz and alluvial workings, is about £2,020,500, out of which dividends have been paid by quartz companies to the extent of £509,051. The lodes in this district are not particularly rich, but large bodies of ore exist which can be made to pay for working, with proper machinery and appliances.
The following table shows the quantity and value of gold entered for duty for exportation from the colony up to the 31st; March, 1892; but this does not necessarily show the whole of the gold produced, as no doubt a considerable quantity has been taken out of the colony from time to time by private individuals who have evaded the duty, and a considerable quantity also manufactured into jewellery and ornaments: —
| Quantity. | Value. | |
|---|---|---|
| Oz. | £ | |
| Auckland | 1,696,473 | 0,350,684 |
| Wellington | 188 | 706 |
| Marlborough | 73,801 | 286,535 |
| Nelson | 240,011 | 950,793 |
| West Coast | 5,231,499 | 20,779,574 |
| Canterbury | 48 | 192 |
| Otago | 4,889,563 | 19,310,707 |
| Totals | 12,131,583 | £47,679,191 |
From this it will be seen that Auckland contributed about 13·4 per cent. Wellington, Nelson, Marlborough, and Canterbury, 2·6 per cent.; West Coast, 43·5 per cent.; and Otago, 40·5 per cent, of the gold produced. Taking the returns of the yield of gold for the last year, ending the 31st March, 1892, the quantities and value were as follow:—
| Quantity. | Value | |
|---|---|---|
| Oz. | £ | |
| Auckland | 40,525 | 162,760 |
| Marlborough | 7,020 | 28,026 |
| Nelson | 5,301 | 20,192 |
| West Coast | 118,158 | 472,672 |
| Otago | 105,531 | 423,527 |
| Totals | 276,535 | £107,177 |
It is only a few years ago since people began to look for argentiferous ore. In 1885 Mr. La Monte came to this colony for the purpose of erecting a smelting-furnace to treat the auriferous ores found on the Hauraki Peninsula by the same process that he had adopted at Sunny Corner, in New South Wales; and, on examining the lodes in the Karangahape district, he found rich argentiferous ore being thrown over the mullock-tips. This fact, together with the technical education which has since been given at the Schools of Mines, has induced the miners in the northern districts to search for silver as well as gold; and within the last two years a considerable quantity of bullion has been exported. All the gold found in the North Island contains a considerable percentage of silver, but it is purchased by the banks for the value of the gold according to assay, the silver being afterwards separated; the only silver, therefore, hitherto exported is that which has been separated by the banks. At Waihi and Karangahake from about three-fourths to one-half of the bullion is silver; and at the Thames and Coromandel the gold sold to the banks contains about one-fourth of the weight in silver. The price given for gold varies from £2 13s. to £3 per ounce. Recently, a large number of argentiferous lodes have been found at Puhipuhi, but these have not yet been properly prospected, and the method employed for extracting the silver from the ore, which contains about 98 per cent, of silica, has hitherto been very crude. Only 100 tons of ore have yet been treated, which produced about 1,200oz. of silver. Silver-ore is also found in the Collingwood district, and at Mount Rangitoto, on the West Coast, but no systematic method of mining has been ever carried on at either of these places. The total quantity of silver exported up to the end of December last was 582,633oz., representing a value of £140,148.
Copper-ore has been found and worked in different parts of the colony. An English company in the early period of the colony's history worked a lode on the Island of Kawau for some time. Copper-ore has also been worked on the Great Barrier Island, near Auckland; at the Dun Mountain, and also in the vicinity of the Roding River, in the Nelson District. Lodes also occur in D'Urville Island, Cook Strait; in several places on the West Coast; and at Waitahuna, Waipori, and Moke Creek, in the district of Otago. A considerable quantity of native copper was found at the Dun Mountain and in the vicinity of the Roding River, but not in sufficient quantities to pay the great cost of transit to a port of shipment. A good deal of copper pyrites is found in some of the auriferous and argentiferous lodes in the North Island, associated with galena and zinc-blende; and at the present time prospecting operations are being carried on at Maharahara, in the District of Napier, on a large lode containing copper-ore. Recently, a lode of chalcopyrite ore has been discovered in the Whangaroa County, in the Auckland District, which averages fully 6ft. in width. This lode was lately examined by Mr. Alexander McKay, F.G.S., Assistant-Geologist, and samples of it brought by him which were tested at the Colonial Laboratory, gave 31 per cent, of copper. This is apparently the best lode as yet discovered in the colony. The quantity of copper-ore exported up to the end of December last was 1,394 tons, having a value of £17,866.
Antimony ore is found in a great many places in the colony, associated with gold and silver in quartz-lodes, mainly at Puhipuhi, Thames, and Te Aroha, in the Auckland District; and in the Middle Island at Reefton, and at Langdon's, near Brunnerton, on the west coast, and also in several localities in the Otago District. There is a company at the present time working a large lode of antimony at Endeavour Inlet, which is likely to prove remunerative to the owners. A sulphide lode occurs a few miles south of Collingwood, which contains, on assay, about 186oz. of silver to the ton. The total quantity of ore and star antimony exported from the colony up to the end of December last was 2,786 tons, representing a value of £41,140.
Large deposits of manganese ore occur in different portions of the colony; and in many places it is profitably worked in the North Island, where it is adjacent to a harbour for shipment. Deposits of this ore are worked successfully at the Island of Waiheke, Puerua Bay, Helena Bay, and Mangapai. Formerly, large quantities were got at the Bay of Islands. There is also a deposit of good ore at Hikurangi, but the cost of transit from the latter place to a port of shipment prohibits it being worked successfully. In 1890, some 320 tons of ore were obtained from the Island of Kawau, and it is said that the deposit there is likely to be soon reworked. Ores are also found in Wellington, Napier, and Otago; and at Port Hardy, in D'Urville Island. The total quantity of manganese ore exported up to the end of December last was 16,456 1/2 tons, representing a value of £53,925.
This ore is chiefly associated with magnesian rock. Previous to 1867, lodes of this mineral were worked in the vicinity of Aniseed Valley and the Dun Mountain, District, of Nelson. The total quantity of ore exported has been 5,666 tons, having a value of £37,367. In recent years no work has been done on any of these lodes.
This occurs as galena, in different districts. It generally contains a certain percentage of silver; on the Hauraki Peninsula it occurs in auriferous lodes, and is generally associated in this locality with zinc-blende, as at the Champion Mine, Tui Creek, and Sylvia Mine,. at Tararu Creek. At Wangapeka, and between there and the Owen Reefs, some of the quartz lodes carry a large percentage of galena. It is also found in the Collingwood District, where, at Richmond Hill, there is an argentiferous lode which gives an assay value of £50 per ton. This ore also occurs in quartz lodes at Mount Rangitoto, and further southwards, in the Westland District.
There are large deposits of iron ore in the colony, of various kinds, such as impure magnetite at Manukau, Auckland, which contains 70 per cent, of iron; bog-iron ore, at Spring Swamp, Auckland, which contains 51 per cent., and brown iron ore at Raglan, which has from 46 to 51 per cent, of iron. There is also magnetite and hæmatite at Dunstan, Otago, and at the Dun Mountain, Nelson, which varies from 62 to 68 per cent, of hon. There is a large deposit of hæmatite at Parapara, with bituminous coal within four miles of it, and alongside the hæmatite is a belt of limestone, the whole of these being within a mile of the ocean beach, where large vessels could be brought if a wharf was erected. This hæmatite contains from 42 to about 60 per cent, of iron. There are also deposits of hæmatite near Kamo, in the Whangarei District, and also in the Tararu Creek, at the Thames. On the ocean beaches on the west coast of both islands, large quantities of magnetic iron-sand are found, showing that there is abundance of iron ore in the colony.
This mineral is found in many parts of the colony, especially in alluvial drifts. In very few instances has it been found in situ. Rounded pellets of cinnabar are found among the auriferous drift gravels at Waipori, and between there and Waitahuna. It was also found recently at Puhipuhi, by Mr. A. McKay, F.G.S., Assistant-Geologist, in the bed of a gully amongst the loose drift. At Tui Creek, near Te Aroha, cinnabar is found in the centre of a large lode of quartz, which also contains gold, silver, galena, and zinc-blende; and, on the opposite side of the Te Aroha Range, it has been found in the bed of the Waiorongomai Stream. Again, at Ohaeawai, in the Bay of Islands County, there are large deposits of cinnabar in the vicinity of the hot pools, where pure quicksilver can be seen, in minute particles, amongst the black mud, indicating that it has been extracted from the ore, being condensed on coming in contact with the vapour, and exposure to the atmosphere.
Tin ore is found widely distributed amongst the gravel-drifts in the vicinity of the Remarkables, in Stewart Island; and a lode occurs following the ridge of these mountains which also contains wolfram. But none of the deposits yet found will pay for working at the present time.
About thirty years ago, mineral oils were found in the colony, or, rather, traces of them. A very thick, heavy petroleum oil—more of a lubricant than an illuminant—was found oozing out on the sea-beach, near the Sugar Loaves, at New Plymouth. Petroleum was also found many years ago near Gisborne, as well as near the East Cape. According to the analyses of these oils, made in the Colonial Laboratory, the sample from New Plymouth had a specific gravity of 0·96, while that from Gisborne and the East Cape had a specific gravity of 0·83 and 0·84 respectively—all taken at a temperature of 60°. Bores have been put down at each of the places named, the deepest of which was at the East Cape, being about 1,700ft.; the one near Gisborne, about 1,320ft.; and the one at New Plymouth, 930ft.; but no steady supply of oil was got in any of them. Recently some gentlemen have taken up a lease of land for mineral oil about twenty miles from Rotorua, near Waiotapu Valley. Large quantities of petroleum can be seen at one place on the top of some of the hot pools.
The vast extent of coal measures in New Zealand will make coal-mining one of the largest industries in the colony, especially on the west coast of the Middle Island, where bituminous coal exists equal, if not superior, to that found in any part of the world. The super-excellency of this coal was fully tested on H.M.S. “Calliope” during a hurricane at Samoa, about three years ago, when by its aid she steamed out of the roadstead, the German and American war vessels being torn from their anchorages and driven upon the beach.
The following table will show the progressive increase in the output of coal from 1878 to the end of 1891:—
| Year. | Raised in the Colony. | Imported. | Total raised in the Colony and imported per Annum. | Exported. | Total Consumption of Coal within the Colony | Yearly increased Consumption within the Colony. | |
|---|---|---|---|---|---|---|---|
| Total. | Yearly Increase. | ||||||
| * Shows a decreased consumption from that of the former year. | |||||||
| Tons. | Tons. | Tons. | Tons. | Tons. | Tons. | Tons. | |
| 1878 | 162,218 | .. | 174,148 | 336,366 | 3,921 | 332,445 | .. |
| 1870 | 231,218 | 69,000 | 158,076 | 389,294 | 7,195 | 382,099 | 49,654 |
| 1880 | 299,923 | 68,705 | 123,298 | 423,221 | 7,021 | 416,200 | 34,101 |
| 1881 | 337,262 | 37,339 | 129,962 | 467,224 | 6,626 | 460,598 | 44,398 |
| 1882 | 378,272 | 41,010 | 129,582 | 507,854 | 4,245 | 503,609 | 43,011 |
| 1883 | 421,764 | 43,492 | 123,540 | 545,304 | 7,172 | 538,132 | 34,523 |
| 1884 | 480,831 | 59,067 | 148,444 | 629,275 | 6,354 | 622,921 | 84,789 |
| 1885 | 511,063 | 30,232 | 130,202 | 641,265 | 2,371 | 638,894 | 15,973 |
| 1886 | 534,353 | 23,290 | 119,873 | 654,226 | 2,862 | 651,364 | 12,470 |
| 1887 | 558,620 | 24,267 | 107,230 | 665,850 | 12,951 | 652,899 | 1,535 |
| 1888 | 613,895 | 55,275 | 101,341 | 715,236 | 27,678 | 687,558 | 34,659 |
| 1889 | 586,445 | *27,450 | 128,063 | 714,508 | 39,290 | 675,218 | *12,340 |
| 1890 | 637,397 | 50,952 | 110,939 | 748,336 | 33,404 | 714,932 | 39,714 |
| 1891 | 668,794 | 31,397 | 125,318 | 794,112 | 29,093 | 764,019 | 49,087 |
It will be seen from the above table that there has been a steady-increase in the output of coal from the mines in the colony, year after year, since the records have been kept by the Mines Department—with the exception of the year 1889, when the output was 27,450 tons less than for the year previous. The yearly increased output is principally due to the greater demand for consumption within the colony. During a period of thirteen years the consumption of coal in New Zealand has increased to the extent of 431,574 tons per annum, showing that other industries are quickly springing up, requiring fuel for generating motive-power.
The coal-mining industry has hitherto been limited to the demand for coal within the colony. The present state of our harbours on the west coast of the Middle Island, where our large bituminous coalfields exist, will not permit of sufficient quantity to be shipped on one bottom to a foreign market, so as to be able to compete successfully with coal from New South Wales and other countries in the world. But the harbour-works now in course of construction, when completed, will afford facilities for coal-mine proprietors in the colony to compete with those of other countries in foreign markets. This refers specially to bituminous coal, which, so far, has only been found on the wept coast of the Middle Island.
A semi-bituminous coal is also found near the Bay of Islands, in the North Island, at Kawakawa, and recently two mines have been opened up at Hikurangi. From the Kawakawa mine the most of the workable coal has been taken out, but there is an extensive field of semi-bituminous coal between Hikurangi and Hukerenui awaiting development.
The following table will show the output of the different classes of coal in the colony for the last two years, and the total output since records were kept by the Mines Department:—
| Name of Coal. | Output of Coal. | Total Output of Coal from Mines in the Colony. | |
|---|---|---|---|
| 1891. | 1890. | ||
| Tons. | Tons. | Tons. | |
| Bituminous | 387,839 | 323,712 | 3,531,749 |
| Pitch | 96,979 | 124,593 | 1,112,965 |
| Brown | 161,904 | 171,725 | 2,275,364 |
| Lignite. | 22,072 | 17,367 | 211,908 |
| Totals | 668,794 | 637,397 | 7,131,986 |
This shows that the output of pitch and brown coal is decreasing, while there is an increased output of 64,127 tons of bituminous coal last year over the previous one. The output of lignite depends entirely on the consumption within the district in which it is raised.
The following table will also show the quantity of coal raised in the different localities in the colony for the same period as shown in the previous table:—
| Name of District. | Output of Coal. | Increase. | Decrease. | Approximate Total Output of Coal to 31st Dee., 1891. | |
|---|---|---|---|---|---|
| 1890. | 1891. | ||||
| Tons. | Tons. | Tons. | Tons. | Tons. | |
| Kawakawa | 30,367 | 28,254 | .. | 2,113 | 769,246 |
| Whangarei, Kamo, and Whauwhau | 19,633 | 10,228 | .. | 3,405 | 265,860 |
| Waikato | 64,729 | 55,869 | .. | 8,860 | 596,529 |
| Mokau | 1,188 | 3,713 | 2,525 | .. | 4,901 |
| Pelorus | .. | .. | .. | .. | 711 |
| West Wanganui | 4,092 | 3,328 | .. | 764 | 40,114 |
| Westport | 170,406 | 206,184 | 35,778 | .. | 1,191,867 |
| Reefton | 6,010 | 4,556 | .. | 1,454 | 47,740 |
| Greymouth | 118,847 | 145,351 | 26,504 | .. | 1,522,030 |
| Malvern | 15,083 | 14,775 | .. | 308 | 274,328 |
| Timaru | 1,430 | 1,488 | 58 | .. | 5,442 |
| Otago | 176,428 | 164,870 | .. | 11,558 | 2,218,982 |
| Southland | 29,184 | 24,178 | .. | 5,006 | 194,236 |
| Totals | 637,397 | 668,794 | 64,865 | 33,468 | 7,131,986 |
The principal districts where bituminous coals are worked are Westport, Greymouth, West Wanganui, and Kawakawa; but at the latter place the present mines are pretty well exhausted, so chat the two former localities may be looked on as the principal bituminous coal-producing districts in the future. The output last year may be said to have been principally from two mines—the Westport Colliery, at Denniston, and the Greymouth Coal Company's Mine, Brunnerton: the output from the former being 192,606 tons, and from the latter 145,321 tons. There are two large mines being opened out—one at Mokihinui, in the Westport District, and one at the Blackball, in the Greymouth District, which will soon considerably augment the output from these districts. According to rough surveys made by the Geological Department, the area of the coalfields in the colony is estimated at 485,700 acres, of which about 255,400 acres contain bituminous coal. Taking the depth of the bituminous coal-seams in the colony, they would average between 4ft. and 5ft.
As regards the quality of the coal, it cannot be surpassed. The late Sir John Coode, in his Presidential address to the Institution of Civil Engineers, London, stated: “The bituminous coal found on the west coast of the Middle Island is declared by engineers to be fully equal, if not superior, to the best description from any part of the world.”
The following table shows the composition of the coal found in different parts of the colony:—
| Description. | Name of Mine, and District. | Analysis. | ||||
|---|---|---|---|---|---|---|
| Fixed Carbon. | Hydro-Carbon. | Water. | Ash. | Evaporative Power. | ||
| Anthracite | Acheron, Canterbury | 84·12 | 2·06 | 1·80 | 12·12 | 10·93 |
| Bituminous | Coalbrookdale, Westport | 74·83 | 20·50 | 1·16 | 3·51 | 10·72 |
| Bituminous | Coalbrookdale, Westport | 70·00 | 22·15 | 2·52 | 5·33 | 9·10 |
| Bituminous | Banbury | 69·97 | 25·71 | 0·99 | 3·33 | 9·09 |
| Altered brown coal | Malvern Hills, Canterbury | 68·54 | 19·89 | 4·15 | 7·42 | 8·87 |
| Bituminous. | Tyneside, Greymouth | 65·59 | 29·18 | 0·82 | 4·41 | 8·52 |
| Glance coal | Rakaia Gorge, Canterbury. | 64·51 | 21·27 | 6·76 | 7·46 | 8·30 |
| Bituminous | Wallsend, Greymouth | 62·87 | 31·64 | 1·66 | 3·83 | 8·17 |
| Bituminous | Grey River | 62·37 | 29.44 | 1·99 | 6·20 | 8·01 |
| Pitch coal | Kawakawa, Bay of Islands | 61·16 | 28·00 | 2·51 | 8·33 | 7·95 |
| Bituminous | Preservation Inlet, Southland | 60·88 | 20·69 | 4·33 | 6·19 | 7·91 |
| Pitch coal | Black Ball Creek, Grey River, Greymouth | 60·20 | 29·97 | 8·01 | 1·82 | 7·82 |
| Bituminous | Mokihinui, Westport | 59·75 | 32·14 | 3·97 | 4·14 | 7·76 |
| Bituminous | Coalpit Heath, Greymouth | 58·81 | 38·98 | 1·02 | 1·19 | 7·64 |
| Bituminous | Mokihinui, Westport | 57·92 | 34·94 | 3·96 | 3·18 | 7·50 |
| Bituminous | Brunner Mine, Greymouth | 56·62 | 35·68 | 1·59 | 6·11 | 7·36 |
| Bituminous | Brunner Mine, Greymouth | 56·21 | 37·83 | 1·50 | 4·56 | 7·36 |
| Bituminous | Westport | 56·01 | 37·17 | 2·60 | 4·22 | 7·28 |
| Bituminous | Mokihinui, Westport | 55·59 | 38·86 | 3·16 | 2·39 | 7·20 |
| Bituminous | Brunner, Greymouth | 54·16 | 35·85 | 2·50 | 7·49 | 7·04 |
| Altered brown coal | Malvern Hills, Canterbury | 53·29 | 32·04 | 12·65 | 2·02 | 6·92 |
| Bituminous | Otamataura Creek, Southland | 52·89 | 36·63 | 2·19 | 8·29 | 6·90 |
| Bituminous | Wallsend, Greymouth | 53·10 | 35·47 | 1·41 | 10·02 | 6·90 |
| Bituminous | Near Cape Farewell, Collingwood | 48·59 | 43·17 | 2·18 | 6·06 | 6·31 |
| Pitch coal | Shag Point, Otago | 43·19 | 30·15 | 15·82 | 10·94 | 5·61 |
| Pitch coal | Kawakawa, Bay of Islands | 50·15 | 42·63 | 4·18 | 3·04 | 6·50 |
| Glance coal | Whangarei, Whangarei | 50·11 | 38·68 | 8·01 | 3·20 | 6·50 |
| Pitch coal | Kamo, | 50·01 | 37·69 | 9·61 | 2·69 | 6·50 |
| Brown coal | Malvern Hills, Canterbury | 49·99 | 35·42 | 1.1·79 | 2·80 | 6·49 |
| Brown coal | Fernhill, Otago | 49·95 | 36·95 | 12·00 | 1·10 | 6·49 |
| Brown coal | Allandale, Otago | 47·31 | 36·26 | 12·41 | 6·02 | 6·15 |
| Brown coal | Kaitangata Otago | 46·48 | 33·48 | 14·66 | 5·38 | 6·04 |
| Brown coal | Shag Point Otago | 46·21 | 3265 | 16·02 | 5·12 | 6·00 |
| Brown coal | Homebush, Canterbury | 44·92 | 36·00 | 15·83 | 3·25 | 5·83 |
| Brown coal | Hokonui | 44·28 | 38·22 | 16·50 | 1·00 | 5·75 |
| Brown coal | Kaitangata, Otago | 44·11 | 38·32 | 15·44 | 2·13 | 5·74 |
| Brown coal | Nightcaps, Southland | 43·62 | 33·68 | 18·33 | 4·37 | 5·67 |
| Brown coal | Springfield, Canterbury | 42·68 | 33·66 | 18·65 | 5·01 | 5·55 |
| Brown coal | Orepuki, Southland | 42·64 | 36·26 | 14·44 | 6·66 | 5·54 |
| Pitch coal | Walton's, Whangarei, Hikurangi | 38·80 | 41·20 | 7·20 | 12·80 | 4·96 |
| Brown coal | Kaitangata, Otago | 38·29 | 32·43 | 17·50 | 11·78 | 4·47 |
| Brown coal | Shag Point | 35·76 | 30·92 | 13·22 | 20·16 | 4·64 |
| Brown coal | Allandale | 34·72 | 40·26 | 18·99 | 4·86 | 4·51 |
| Pitch coal | Grey River, Greymouth | 34·72 | 55·48 | 6·20 | 2·60 | 4·51 |
This mineral is found in many parts of the colony—namely, at Wakatipu, Cromwell, Waipori, Waitahuna, Macrae's, and other places in Otago; and at Wakamarina, in Marlborough. A company was formed some years ago to work a mine at Bucklerburn, at the head of Lake Wakatipu, in Otago, where scheelite is found intermixed in a quartz-lode. Some 37 tons of ore were shipped to Germany, which was at that time the only market for this mineral. This realised price varying from £17 to £29 per ton for ore containing about 62 per cent, of scheelite. The demand then almost ceased, and the company suspended operations, and has done no work for the last five years. The ore occurs in pockets or bunches amongst the quartz, but it does not occur in large enough quantities to justify any one entering into contracts to supply certain quantities within stated periods.
Recently rubies have been found in boulders, intermixed amongst the alluvial drift, in the vicinity of Rimu, in the district of West-land, Middle Island; but so far they have been too small to be of much value. One of the boulders containing rubies was sent to Professor Ulrich, of the Otago University, who stated that they are the true “Oriental rubies,” a variety of corundum, as conclusively proved by their strong dichrosive, crystalline form— hexagonal prism—and hardness, which exceeds that of a topaz, being 9° according to Moh's scale. They are found embedded in an emerald-green matrix, being an infusible silicate of alumina, coloured green by chromium oxide. This discovery was made during last year. No one, previous to this, ever dreamed of rubies being found in these boulders. In some of the river-beds there are large quantities of what is termed ruby-sand; but this is ground up to such an extent that it is not of great value.
In comparing New Zealand with other mining countries in the world, it is found to offer advantages which very few possess. The elevations at which the auriferous drifts are found give great facilities for the storage of tailings. Its mineral and metalliferous lodes are distributed throughout the length and breadth of the colony; its extensive areas of auriferous drifts in the Middle Island can be commanded with an abundant water-supply; its large rapid-flowing rivers can be made to supply a motive-power for driving every class of machinery; and when the rivers, creeks, and streams are not in the immediate vicinity of mining operations, these rapid currents can be utilised to generate electrical force, as is done at Skipper's, where a crushing battery of thirty head of stampers and air-compressing machinery is driven by electricity transmitted over a range about 2,000ft. above the level of the sea, and for a distance of nearly two miles. And, again, the same power is used in working dredging machinery—for lifting the auriferous drifts in the bed of the Shotover River, at the sandhills; the electrical plant being placed about a mile and a half from the place where dredging operations are carried on.
Table of Contents
The topographical features of New Zealand present many advantages for prospecting in search of mineral deposits and metalliferous lodes. The veins in the sides of the different gorges, and faces of the ranges exposed by the denuding action of rapid streams, also the slips from the mountain-ranges, disclose the character of the country rocks, affording great facilities for examining their constituents geologically. There are, however, many difficulties and obstacles to be overcome in carrying on prospecting operations.
Most of the metalliferous lodes are found in the high lands, a great portion of which are covered with forest-timber, having a dense undergrowth, where very seldom the country rock is exposed to view. Although the sides of the cliffs, precipices, gorges, and beds of rapid streams disclose the formation in which metalliferous veins exist, it is very difficult to trace these veins for any great distance. The broken nature of the country renders prospecting a laborious undertaking, where, in general, men have to carry provisions, tools, and tents for miles on their backs, crossing rapid streams and rivers in their search for the precious metals.
In regard to prospecting for auriferous drifts, there is no country in the world which offers better facilities. There is an abundance of water, which is the first consideration in testing and working the ground. Gold is abundantly distributed through the alluvial drifts over a large extent of country in the valleys, owing to a system of concentration that for thousands of years has been taking place, by flowing rivers and streams sweeping away the lighter materials and sands, and leaving the denser particles behind in beds or layers containing rich deposits of gold. The tops of the mountains in many places show ancient channels where this work of concentration had at some very remote period been going on, as, for instance, on Mount Criffel and Mount Burster, in Otago. The more one travels in New Zealand and studies the formation, the more one is impressed with the immense mineral wealth it contains, and views with wonder the effects of the great convulsions and cataclysms that it must have undergone to leave it in its present state. It must be admitted that, as yet, comparatively very little has been done to unfold its riches; and the question is, how to arrive at the best method of carrying on prospecting operations in order to develop its wealth.
The prospector has no difficulty in recognising gold in the alluvial drifts, and also in many of the lodes; but there are a number of lodes existing, highly auriferous, but gold cannot be recognised in them by the eye. It is found in combination with other metals, which necessitates the prospector being acquainted with the means of determining whether gold is present, or what metals the ore contains. It may be, therefore, of interest to state some of the principal indications as likely to guide the prospector in searching for lodes or mineral deposits.
Of the minerals and metalliferous ores that exist in New Zealand, there are none deserving of more attention than those containing gold and silver. When gold is found in a metallic condition, it is generally easily recognisable by its bright yellow colour; but in lodes it is in many instances found in combination with metallic sulphides, such as iron, arsenical and copper pyrites, zinc-blende, galena, sulphides of antimony, silver, &c., and when in combination with these substances it is seldom discernible to the eye, and the ore has to be subjected to a test to prove what it contains. Hence, in order to carry on prospecting in an intelligent manner, the prospector should have a knowledge of the different ores met with, and be able to test then- value. For example, the lode in the Sylvia Mine at the Thames contains in many instances a high percentage of gold, and very little of it can be either seen in the ore or extracted by the ordinary battery process; it is in combination with other metallic sulphides—namely, silver, copper, zinc, galena, &c.
The first question the prospector has to consider is the character of the rock and any indication that would be likely to guide him in searching for an auriferous or argentiferous lode. be must divest his mind of all theories that an auriferous or metalliferous lode must run in a certain direction to be a payable one.
Auriferous quartz-lodes in New Zealand run in every direction; some of them may be termed east-and-west reefs, dipping to the northwards. But the general run of the quartz-lodes on the west coast of the Middle Island, and also in the North Island, run from a few points west of north to north-west and south-east, and generally dipping westward. In the North Island these lodes traverse through different formations in every direction. They are found in tufaceous sandstone, decomposed diorite, porphyry, porphyritic tufa, earthy clay, and aphanite slates having bands of bard blue rock—anamesite—and hard green dioritic rock running through it. On the west coast of the Middle Island they occur in metamorphic highly-silicious schistose rock, sandstone—some of which are ferruginous in character—and slates belonging to the Maitai series of the carboniferous age; while in Otago the auriferous lodes occur in a finely-laminated quartzose, mica, and chlorite schists. The Otago formation is seen again at Wakamarina, Mahakipawa, and Jackson's Head in the Marlborough. District, and both gold and silver are found in a granitoid rock at Mount Rangitoto, in the Westland District, and there is an argentiferous lode in gneissic rock at Richmond Hill, in the Collingwood District.
With regard to the character of auriferous or argentiferous quartz, it is held by many that the structural appearance of quartz has a great deal to do with indicating its auriferous or argentiferous character. When the quartz has ribbon-like bands or laminations, with regular streaks between them, or chlorite partings all running parallel with one another, or in wavy bands and lines, with a certain parallelism which gives the quartz a regular structure: wherever lodes containing quartz of this character are found, they should be well prospected; for, although the stone may be barren in some portions of the lode, there is every probability of striking a shot of gold in stone of this description. On the other hand, if the markings or partings of the quartz be very irregular, forming as it were a heterogeneous mass of lines or marks, it is very seldom that such quartz contains much gold or silver.
In prospecting for auriferous quartz-lodes, if the outcrop cannot be seen on the surface, the prospector, in carrying on operations in a new part of the country, should first search up the beds of creeks and streams, and carefully examine the country rock wherever it is laid bare, either by slips from the ranges or in the cliffs in gorges cut out by the action of water. In some instances he might perchance trace the gold in the alluvial drift in the bed of a stream up to the source from which the gold came, but the chances of doing so are very remote as for instance, almost every creek and stream flowing from the high land into the Clutha River contains gold in the gravel-drifts, but very few auriferous lodes have yet been discovered in their vicinity.
After a lode has been found it should be thoroughly prospected, so as to fully ascertain the length of the shot of gold, and the depth that it will go down. Different levels should be put in to test its value before incurring any expense in erecting machinery to crush the stone. The eager desire to form companies and erect a crushing-plant before thoroughly prospecting a mine has resulted in many failures in New Zealand, and brought the mining industry into disrepute more than anything else, and has resulted in many instances in companies having to give up valuable mining properties, because, having spent all their capital on machinery, they cannot carry on prospecting operations.
In reference to the occurence of gold in particular places in lodes, this question is not fully understood; but we know from the results of working lodes that in scarcely one instance in New Zealand does a lode carry sufficient gold to pay for working continuously for its whole length. The gold is found in shots, which seldom exceed 400ft. in length; a barren part will come in and cut off the gold, although the structural appearance of the quartz may remain almost the same; still, by driving along the lode for some distance, another shot of gold is likely to be found. The prospector must not be disheartened if a lode cut entirely out, so long as the walls are clearly defined and a parting is distinguishable. The walls may be almost close together, or the fissure may have been filled with soft mullocky substance; but so long as a parting can be seen it should be followed, as there is every probability of auriferous quartz coming in again, especially if it be a true fissure lode—that is, a lode cutting through the country rock at an angle from its bedding-planes. On the other hand, if a lode follows the bedding-planes of the rock, or in the lines of its stratification, there is always a chance of its wedging out, both in depth and lengthways, and there is far less chance of again picking it up than there would be if it were a true fissure lode.
In prospecting alluvial drifts the work is of a more simple character, and the prospector has more to guide him than in prospecting for lodes. Every gully, river, creek; and stream has originally been cut out by the action of a flowing water, and the light sand, soil, and materials have been carried away with the current, while the denser particles have been left behind. The beds of all the gulches are merely Nature's sluice-boxes, and the rough uneven surfaces of the rocks in their beds are ripples for saving the gold. Therefore, if the prospector cannot find any gold in these, he may be tolerably certain that there is not a large area of auriferous drift in the locality. This does not apply only to the present river-beds, but also to ancient watercourses which are found on the mountains-tops, as at Mount Criffel, Mount Burster, and in places on the ranges alongside the Arrow and Shotover Rivers. Wherever these ancient river-beds or watercourses are found, they are likely to contain rich layers of auriferous drift, if there be any in the locality.
Having briefly described some of the principal indications which tend to guide the prospector, it will be well to refer to the manner in which be can distinguish the metalliferous ores, so as to roughly ascertain whether they are likely to be payable for working.
This is always distinguishable when found in alluvial drifts, and also when it is found in a free state in lodes, by its bright, lustrous, yellow colour, being soft and ductile; but when found in mundic lodes, either as iron, arsenical, or copper pyrites, one can only ascertain its presence by testing it, either by chemicals or by a fire-assay. In some lodes the pyrites contain sufficient gold to pay all expenses in connection with the working of a mine, and therefore it is of the utmost importance that every pyritous ore should be tested, at least to see whether the presence of gold can be detected, which will entail a few chemicals.
The prospector should have a small agate mortar, a small porcelain basin, some nitric and muriatic acids, with a small quantity of sulphate of iron or green copperas, and also a little ferrocyanide of potassium, spirit-lamp, blow-pipe, some powdered borax, micro-cosmic salt, and carbonate of soda.
Test.—Pulverise, say, 1lb. of pyrites to the finest powder, put it in the porcelain basin and add some strong nitric acid, which will boil up and give off brown poisonous fumes. Stir up occasionally with glass rod, and keep adding a little nitric acid until the brown fumes cease entirely. Wash the powder thoroughly in clean water by decanting it several times until the water ceases to produce a blue colour, when a little ferrocyanide of potassium is added. This removes all the arsenic, sulphur, iron, and copper. Then add two parts of. strong muriatic acid, and one part of nitric acid; place this mixture over the spirit-lamp, and evaporate to dryness; stir up with about one pint of hot water, and filter. Boil down the filtrate to about half a small wineglassful, and add to the clear liquid a few drops of strong muriatic acid, and also add about one-fifth of its bulk of a strong solution of sulphate of iron. If there be gold present, this will gradually give a brown precipitate, which will settle to the bottom of the vessel. After standing about twenty-four hours, the liquid may be decanted off, and the brown dust in the bottom will be pure gold.
This metal is, in some forms, hard to distinguish; it occurs in New Zealand principally in combination with gold, and as a sulphide ore. In very few instances is it found as native silver, but more generally as a metallic sulphide, antimonide, chloride, chloro-bromide, arsenide, &c. A very simple test is given by C. H. Aaron for testing the presence of silver in ore, namely:—
Test.—The ore should be finely pulverised and mixed with about one-tenth of its weight in salt and half as much copperas. Get an old frying-pan and line it with clay; place the mixture in the pan, and heat it gently over a fire, and stir it with an iron rod so long as any smell of sulphur can be detected; then subject the mixture to a light red heat for a few minutes, until it swells and becomes sticky when stirred, care being taken not to fuse the ore. The mixture is then taken out and allowed to cool, after which more salt is added, and the stuff mixed with water to a consistency of mortar. Then take a thin strip of copper, carefully cleaned, and insert it in the mixture for about ten minutes; after which, remove the copper and wash it in clean water. If silver be present, the copper will be coated with a white substance; and, if the ore be very rich, it will appear grey and rough.
Where silver is found at Waihi, Karangahake, and Puhipuhi, it is in quartz-lodes, the quartz being hard and brittle, having blackish-blue and brownish ribbon-like bands and sometimes ruby silver through it, running parallel to each other. The silver at Waihi and Karangahake is principally in the form of a sulphide, but at Puhipuhi it occurs both as a sulphide and antimonial ore. It can be tested by pulverising a small quantity of these bluish bands or ruby silver in an agate mortar, and boiling a little of the powder in dilute nitric acid, which will dissolve the silver. Add water, and filter through blotting-paper, and add to the filtrate a few drops of muriatic acid or common salt. If silver be present, a white crudy precipitate, as chloride of silver, will be the result; if mercury or lead be in the pulverised ore, the same white crudy precipitate will also be obtained, but if some of the crudy substance be boiled in a test-tube, the chloride of lead will dissolve, while it does not produce the same effect with the chloride of silver. On the white crudy substances being exposed to sunlight, the chloride of silver will turn black, while the chloride of mercury remains white.
Silver-chloride and bromide-silver ores are not affected by acids. Ammonia and cyanide of potassium both dissolve them, and a solution obtained from either of these—nitric acid—will throw down a white crudy precipitate, which turns black on exposure to sunlight. This description of silver-ore is very easily fused into a bead of silver by the blow-pipe, when heated with a little carbonate of soda on charcoal.
Stephanite, pyrargyrite, dycrasite, and proustite are different in appearance. The colour and streak of stephanite is iron-black; while in the case of pyrargyrite and proustite the colour of the former is all shades of reddish-black, with red streak, while the latter is both red in colour and streak; and dycrasite is in colour and streak white.
Sulphide of silver, when nearly pure, such as argentite, resembles the colour of black-lead, and can be as easily cut with a knife as the hardest leads used in drawing-pencils. The hardness of both this and antimonial silver-ores averages from 2·0 to 2·5, with the exception of dycrasite, which is from 3·5 to 4·0 in hardness.
Chloride and chloro-bromide of silver are exceedingly soft ores— they can be cut like wax with a knife. In colour, they are grey, greyish-green, yellowish-green, and generally becoming darker by exposure to the atmosphere. There is, however, very little of this description of ore yet found in New Zealand. Selenides and tellurides of silver—namely, naumanite and hessite—have been found in the range between Te Aroha and Karangahake; but, so far, no large deposit of this ore has yet been discovered.
This metal is always found in its metallic state among the gravel-drifts; it has not, so far, been found in situ. Small quantities of it are found in the gravel-drifts in the vicinity of the Waiau River, in Southland, amongst the drifts in the Clutha Valley, and in some places on the West Coast. The miners, when working the drifts at the mouth of the Waiau River, got several ounces of this metal along with the gold in their sluices, and for some time did not know what it was. Its colour is steel-gray, and it is found in flattened grains. Unlike most other metals, it is scarcely fusible, and it takes a considerable time to dissolve it in boiling aqua regia.
Tin has been found at Stewart Island, both in the alluvial drifts and also in situ., in a lode running along the top of the range termed “The Remarkables.” It is found in blackish dark-brown pellets, both in the drifts and in the quartz-lode; but in the latter there is more wolfram than tin, which is both slightly similar in colour and appearance, and about the same specific gravity; therefore, the experienced miner will have great difficulty in recognising the one from the other; but a simple test with the blow-pipe will leave no doubt on the subject. It can, however, be distinguished from wolfram by its hardness, which is from 5·0 to 5·5, while cassiterite, or tin-ore, is from 6·0 to 7·0. Wolfram has a submetallic lustre, having a dark-grey or brownish-black colour. By scratching it, the streak will be dark reddish-brown to black, while cassiterite has a more adamantine appearance, with tetragonal crystals having a white or greyish-brown streak.
Test.—Take a few grains of the dark heavy pellets of the ore, and pulverize them to fine dust in an agate mortar; scoop out a cavity in a piece of charcoal, and mix the ore with pulverized potassium cyanide and charcoal-dust; place the mixture in the cavity of the charcoal, and use the blow-pipe, and in a few minutes, if the pellets be oxide of tin, it will be reduced to a button of metallic tin; but, if the whole of the ore has not been successfully fused, let the charge be scraped clean out of the cavity in the charcoal and placed in the agate mortar, mixed with a little water, and the mass pounded or crushed with the pestle, when bright discs or flakes of metallic tin will be found. Or it may be tested by placing some of the powdered dust in a porcelain basin and adding strong muriatic acid, and boiling it over a spirit-lamp. Hydrogen will be liberated, and chloride of tin formed. Filter through some blotting-paper, and add to the filtrate a solution of sulphuretted hydrogen, which will give a chocolate-brown precipitate.
Cassiterite, or tin-stone—peroxide of tin—contains about 78·5 per cent, of tin and 21·5 per cent, oxygen. It is found disseminated in granite gneiss, clay slate, chlorite and mica slate, and also in beds and veins in irregular masses. It is found associated with quartz, fluor-spar, apatite, and also with wolfram, molybdenum, arsenical iron, and copper-pyrites, magnetic iron-ore, blende, copper glance, and other minerals. The lodes, however, always occur in or in close proximity to granitoid rocks.
Antimony-ore is readily recognisable on account of its grey, bluish metallic lustre and fracture; it occurs chiefly in the crystalline slate and in the primary rocks. It is found associated with quartz, gold, silver, copper, iron, lead, and other mineral ores. The largest antimony lode which is being worked at the present times at Endeavour Inlet, Queen Charlotte Sound, where the ore is in the form of antimonite—sulphide of antimony—and where, in some places, the lode is 4ft. in thickness, traversing through a subschistose rock.
Antimony ore is also being worked at Waipori, and at Barewood, in Otago, in a quartzose mica schist formation; and a few years ago some workings were carried on at the Carrick Range, near Cromwell. It is abundantly distributed in some of the auriferous lodes at Reefton, in the Grey district, and also in Coromandel and Puhipuhi, where it gives considerable trouble in the treatment of the auriferous ores.
Test.—Antimonial ores can be tested in the same manner as that described for tin, with the blow-pipe, using the same flux; or, they can be dissolved in hot, strong, muriatic acid, and evaporated to dryness, when the residue will be soluble with tartaric acid, and will give a bright orange precipitate with sulphuretted hydrogen.
This metal is found in its metallic state in places, but more generally in metallic oxides, carbonates, silicates, and sulphides. It is found in many instances in combination with gold, silver, tin, zinc, lead, quicksilver, nickel, bismuth, sulphur, and arsenic. Copper-ore is abundantly distributed, and disseminated in different formations, all through New Zealand. When found in auriferous and argentiferous lodes, it is generally in the form of copper-pyrites—chalcopyrite—having a brass-yellow metallic appearance. The ore is found in different geological formations, but chiefly in crystalline slates, metamorphic schist, indurated unaltered sandstone, and Palæzoic slates, granitoid and serpentine rocks, and is found in lodes and veins associated with quartz, fluor-spar, and diabase rock, &c. In New Zealand, copper-ore has been worked at Kawau, Great Barrier, and D'Urville Islands, and considerable workings were carried on at the Dun Mountain, and also at the head of the Aniseed Valley, in the Nelson District; while indications of copper-ore are found in many places, both in the North Island and Middle Island. The outcrop of copper-ore lodes can, in some places, be distinguished by the quantity of gossan, iron-pyrites, and the green and blue spots here and there, according to the amount of oxygen and carbonic acid it has absorbed; and when the lodes are in serpentine formations, bunches of metallic copper are likely to be found; but in this formation the lodes in general are very irregular, the ore occurring more in nests and bunches here and there through the rock in a certain belt. If a good gossan or iron-pyrites lode be found at the outcrop with copper stains through it, that is a good indication of copper being found, for in all likelihood rich copper-ore will replace the gossan and iron-pyrites in going down. This has been the case in Cornwall, in England, where very few lodes paid for working until they were some distance under the outcrop at the surface.
Test.—A very simple test will ascertain whether any ore contains copper by merely pulverizing it to fine dust, and letting some of it fall in the flame of a spirit lamp or candle; it produces a green colour. Ores of copper are soluble in nitric acid, and when in solution have a bluish colour, but by adding ammonia in excess will assume a bright blue colour.
The principal ores in New Zealand are galena—sulphide of lead— and cerusite—carbonate of lead. They are generally found in quartz lodes, in combination with gold, silver, zinc, copper, antimony, &c. Sometimes the whole of these metals are found together, as at the Sylvia Claim, Tararu, Thames, and in Champion Lode, Tui Greek, Te Aroha, in the Auckland District; while near Mount Owen, in the Nelson District, lead is principally found in combination with silver. Lead-ores, however, are to be found of all colours, from white, as in mendipite, to black in descloizite; and it is found in nearly all geological formations, in different parts of the world; but the ores generally found in this colony are galenite and cerusite. The former is of a lead-grey metallic lustre and fracture, and is sometimes found in laminated crystals. Cerusite has more of a whitish-grey appearance, and it is not so heavy as galenite, the latter being about three times the weight of quartz, while cerusite is about two and a-half times the weight of the same rock.
Test.—All ores of lead are easily reduced into a metallic form with the blow-pipe at a low fusing point, and, by using the outer or oxidizing flame of the blow-pipe, there will be a yellow or orange incrustation on the charcoal.
This metal is widely distributed over the whole of New Zealand, principally in the form of oxide of manganese, which varies in colour from reddish-brown to iron-black, having a sub-metallic appearance; but, unless lodes of this ore are found near the ocean, where vessels can load, the market price will not admit of its being worked if the cost of transit to a port of shipment is heavy, it being only worth from £2 15s. to £4 per ton when taken to Europe. A lode of carbonate of manganese—rhodochrosite—occurs within three miles of the Wellington and Manawatu Railway, near Paraparaumu, which is said to be 30ft. in thickness. This is a rare mineral, and said to be a very valuable one, the pure carbonate being worth from 8d. to 10d. per lb. However, no steps have, as yet, been taken to work it. It has different colours: rose-red, yellowish-grey, dark red, brown, and brownish-black, and the ore is very brittle.
Test.— Pulverize a small quantity in an agate mortar, and add a small quantity of muriatic acid, and warm to dryness. Dissolve the powder in water; filter, and heat in a porcelain basin with a little caustic soda and saltpetre, until the mixture is in a state of perfect fusion. If manganese be present, the mixture will have a deep green colour, darkening to blue on cooling. By adding an excess of either muriatic, tartaric, or sulphuric acid it will have a reddish colour.
This is found in many places in the auriferous and argentiferous lodes in combination with galena, iron, and copper-pyrites, and renders ore very refractory in treatment when extracting the gold and silver. It is generally found in New Zealand in sphalerite—sulphide of zinc—which varies in colour, being brown, brownish-black, bluish-black, sometimes having a reddish and greenish tinge; but in general it has a dirty bluish-black appearance, which makes the Cornish miners term it “black-jack.” “When pure, it has a whitish-yellow colour, and semi-transparent. The more iron is in combination with the blende, the darker and dirtier it looks. It is infusible by itself with the blow-pipe, but, when mixed with powdered charcoal, it can be fused by the reducing inner flame into metallic zinc. In the oxidizing, or outer flame, there will be a yellow incrustation on the charcoal when hot, and white when cold. It dissolves easily in warm, strong muriatic acid, giving off sulphuretted hydrogen, which is easily recognisable by its odour.
About 5,666 tons of chrome-ore have been shipped to Europe from New Zealand, from the Nelson District, in which it occurs as chromite or oxide of chrome. The lodes are in a magnesian rock formation, termed dunite, closely resembling serpentine; but no work has been done on the chrome lodes in this district for the last twenty-five years. The ore has a sub-metallic lustre, and is of brownish iron-black colour, and sometimes slightly magnetic. Before the blow-pipe this ore is by itself infusible, but, with micro-cosmic salt and borax, it gives a bead which becomes green when cold.
The only nickel ore yet found in New Zealand is awaruite, an entirely new mineral, and said to be very valuable. Its name is derived from the Maori name of Big Bay, on the west coast of the Middle Island, “Awarua,” near where it is found. Professor Ulrich, of the Otago University, considers this new mineral identical in its composition with the meteorite oktibbehite. It is found over a large area in the vicinity of the Red Hill, Gorge, and Cascade Rivers, in the alluvial drifts; and it has also been found in situ disseminated through some portions of the olivine and serpentine rocks of which the Red Hill is composed. It is found in the drifts and in the serpentine rock in silver-white specks of metallic lustre, and is highly magnetic. In the alluvial drifts in the Gorge River it is found in sluicing for gold, and several samples have been sent up from this locality to the Colonial Laboratory for analysis. This mineral is readily distinguishable by its colour, and its great affinity for the magnet.
Test.—All nickel ores are, when finely powdered, soluble in either nitric or muriatic acid, or in aqua regia. The testing of nickel-ores, except in case of some of them where the blow-pipe can be used, is too complicated for any ordinary prospector to attempt, as all the different metals in combination with the nickel have to be removed by different precipitants. With the blow-pipe, a little finely-powdered dust, mixed with borax, on a platinum wire in the oxidizing flame, will produce a bead of a violet to deep-yellow colour when hot, and brown when cold. The addition of nitre renders the brown bead violet. In the reducing flame metallic nickel is produced, and colours the bead ash-grey at first.
The tungstate of lime is now greatly inquired after by merchants in Europe, who are offering £12 and £14 per ton for ore containing 40 per cent, of this mineral, which is used for the manufacture of tungstic acid, and also in the manufacture of iron and steel castings for the purpose of making them brittle—such as in shells used for war purposes. It is of a yellowish-white colour, very dense and brittle, and about 2 1/4 times the weight of quartz-rock. It is generally associated with crystalline rocks, and found in connection with cassiterite, fluorite, apatite, molybdenite, or wolfram in quartz. This mineral was worked some years ago by a company at the head of Lake Wakatipu; but the market at that time for its purchase was limited to one or two firms in Europe, and the demand also being then very small, it did not pay to send it Home at the prices then offering.
Test.—Before the blow-pipe, with microcosmic salt, it fuses into a bead, which is green when hot and blue when cold. When finely pulverised, it dissolves in muriatic or nitric acids, forming a salt of lime which is soluble in water, and liberates tungstic acid in the form of a yellow residue. This yellow powder is further distinguished by its becoming blue when brought into contact with lime and dilute sulphuric or muriatic acid.
The recent methods adopted for working on the ocean-beaches and in the beds of rivers deserve attention by the prospector, as there are rich deposits of gold which cannot be obtained by the ordinary method of mining, on account of the water which covers the auriferous drifts and sands.
On the west coast of the Middle Island the whole of the ocean-beach sand is less or more auriferous, from Karamea to Milford Sound, and on the east coast, from the mouth of the Clutha River to Preservation Inlet; and gold is found on the ocean-beach between the mouth of the Rakaia River and Lake Ellesmere. The beds of most of the rivers on the West Coast, and also most of the rivers in the Otago District, contain rich auriferous drifts, and have of recent years been made to yield up their treasures by means of dredging-machines. Some attempts at working these beaches and riverbeds have been very successful; but, at the same time, there have been many failures, principally due to the inefficient gold-saving appliances, and partly to the claims not being sufficiently prospected before starting to use dredging machinery. There is no doubt that this branch of gold-mining will increase every year; but, in order to insure the success of each venture, more money should be expended in prospecting the ground. Tubes should be put down at certain intervals, and the whole of the material in each tube taken out and washed on proper gold-saving tables; or, what would be better, to have a prospecting plant with a small wrought-iron cylinder with elevating buckets to lift the material, so that the quantity of gold per cubic yard of the drift or sand could be accurately ascertained.
Par more attention should be paid to prospecting the ground before thinking of any further expenditure in the erection of large dredging-plants; and, if this were carefully attended to, it would insure each dredging venture being made a commercial success, and develop an industry which would soon assume large proportions.
It is patent to every one having a knowledge of the metalliferous and mineral deposits of New Zealand that the wealth of this kind the colony contains must, in the future, be one of the most prominent factors in producing prosperity. Such wealth has in the past contributed largely to the greatness of all countries where minerals are found, and in no case more so than in that of Great Britain and the United States of America. When we consider the immense mineral resources New Zealand contains, along with a climate which cannot be surpassed, having an abundant water-supply and every facility for carrying on extensive mining operations, we may safely predict that the time will come when these resources will be among the chief means of increasing her prosperity, and raising her to a prominent position.
Table of Contents
In the north of Auckland, including the lower portion of the Waikato Valley, light basic volcanic soils prevail, interspersed with areas of clay-marl, which in the natural state is cold and uninviting to the agriculturist, but which, under proper drainage and cultivation, can be brought to a high state of productiveness. The latter soils, however, are generally neglected at the present time by the settlers, who prefer the more easily-worked and more rapidly-remunerative soils derived from the volcanic rocks.
In this district, which extends round to Taranaki and Wanganui, the soil is all that can be desired, and is probably one of the richest areas in the Southern Hemisphere. The surface-soil is formed by the decomposition of calcareous marls, which underlie the whole country, intermixed with debris from the lava-streams, and tufaceous rocks of the extinct volcanic mountains. The noble character of the forest which generally covers the area proves the productiveness of the soil, although at the same time it greatly impedes the progress of settlement.
In this district of the North Island, from Taupo towards the Bay of Plenty, the surface-soil is derived from rocks of a highly silicious character, and large areas are covered with little else than loose friable pumice-stone. Towards the coast, and in some limited areas near the larger valleys, such as the Waikato and the Thames, and also where volcanic rocks of a less arid description appear at the surface, great fertility prevails, and any deficiencies in the character of the soil are amply compensated for by the magnificence of the climate of this part of New Zealand. On the eastern side of the slate range which extends through the North Island, the surface of the country is generally formed of clay-marl and calcareous rocks, the valleys being occupied by shingle-deposits from the slate and sandstone rocks of the back ranges, with occasional areas of fertile alluvium of considerable extent. It is only the latter portions of this district which can be considered as adapted for agriculture, while the remainder affords some of the finest pastoral land to be met with in any part of the colony.
In the Middle Island the chief agricultural areas are in the vicinity of the sea-coast, but there are also areas in the interior, and in the vicinity of the lake districts, where agriculture can be profitably followed. The alluvial soils of the lower part of the Canterbury Plains, and of Nelson, Otago, and Southland, are the most remarkable for their fertility; but scarcely less important are the low rolling downs formed by the calcareous rocks of the Tertiary formation, which skirt the higher mountain masses, and frequently have their quality improved by the disintegration of interspersed basaltic rocks.
On the western side of the Middle Island the rapid fall of the rivers carries the material derived from the mountain-ranges almost to the sea-coast, so that comparatively small areas are occupied by good alluvial soil; but these, favoured by the humidity of the climate, possess a remarkable degree of fertility.
Table of Contents
Abundant supplies of excellent stones for roads and building purposes are found in many parts of the North Island, and throughout the Middle Island. The varieties useful as such may be divided into—
Basalts and diorites.
Trachytes, granites, and crystalline schists.
Limestones (freestones in part).
Sandstones (freestones).
Basalts, locally called “Milestones,” occur of a quality useful for road-metal, house-blocks, and ordinary rubble masonry. They are found partly underlying and partly overlying the Tertiary rocks, interstratified with tufaceous clays and local beds of altered volcanic ash. In the North Island these volcanic rocks are largely developed, and include some of very recent date. True lavas and scorias are of frequent occurrence in the northern part of the island. The latter have been quarried by the prisoners at Mount Eden, Auckland; their colour is dark-grey, and, though absorbent, they are very hard and coherent. In the Middle Island, on the other hand, the igneous rocks appear to be of much earlier date, and to have been nearly all of submarine origin. They are principally confined to the eastern seaboard, only rarely occurring at a greater distance than forty miles from the coast. The Halswell quarries, Canterbury, produce an exceedingly hard and close-grained stone, of a dull leaden-grey colour; but its excessive hardness will necessarily limit its usefulness.
Diorite.—This stone occurs on the west coast of Otago, also at the Great Barrier Island, and many other localities where it can be quarried.
Aphanite occurs as a conglomerate at Dog Island, and elsewhere as a breccia.
Porphyrites.—These stones are found at Flagstaff Hill, Water of ‘Leith, and in the Malvern Hills.
Syenites occur at Dog Island and the Bluff, and at various localities on the West Coast, and in Stewart Island; but the chief supply now available for industrial purposes is at the Bluff, and from the Boulder Bank at Nelson, where a beautiful green variety occurs. It is hard, compact, and of a uniformly bluish-grey tint of great beauty; consequently it is suitable for kerbing, paving, and massive masonry, as well as for monumental and architectural work.
The group of trachytes contains many varieties, both of composition and texture, but they all, together with the granites, are distinguished from the first group by containing a large proportion of silica.
At Port Chalmers a fine grey stone occurs. Another kind, a, good freestone, is obtained at Harbour Cove (Otago), and Creightonville (Canterbury).
Granular trachytes are obtained from Governor's Bay, Lyttelton.
Trachyte porphyry is found at Taiaroa Head, Moeraki, and Portobello; and from Port Chalmers a breccia is obtained, with which the graving-dock there is entirely built. All the kerbing in Dunedin is from the quarries of this stone.
Sanadine trachyte is found at Portobello, Otago Harbour.
Phonolite or clinkstone of a columnar character occurs at Bell Hill, and a laminated and spheroidal variety at Blanket Bay.
The gaol and some other old buildings of Dunedin are built of a spheroidal clinkstone, which is of a mottled grey colour, and exceedingly hard and compact. The foundations: of buildings in the city are frequently constructed with the same stone, which is eminently suited for the purpose. This stone is probably metamorphosed tufaceous sandstone.
Granite is only found as mountain-mass at Preservation and Chalky Inlets, on the western coast of the Middle Island, but exists in large veins and blocks in Stewart Island, and along the whole of the West Coast.
At the first-named localities the granite is of a pinkish tinge with grey spots, and rather coarse in the grain.
The veins and blocks supply a fine-grained, beautifully-coloured stone, more suitable for architectural and monumental work than the former.
At Seal Island a fine grey granite vein occurs, having a smooth grain.
Granite rocks occur in detached areas in the Westland District, but not in accessible situations, being very different in that respect to those occurring on the south-west coast, where they admit of being quarried and shipped with great facility. At Astrolabe Island, and Tonga Harbour on the west shore of Blind Bay, is probably the easiest place from which granite could be quarried. It is there of fine quality, and breaks out in masses that renders it suitable for kerbing and harbour-works.
A variety with garnets is found at Metal Mountains West Coast.
Gneiss of equally good quality with the granite is to be found in many inlets on the south-west coast of the Middle Island, and on the north shore of Milford Sound there is one point where there is an immense accumulation of blocks of a grey variety mottled with crystals of garnet, and of all sizes and shapes, lying as if ready for shipment. Other localities are “Connecting Arm,” and Anchor Harbour.
The purest form of this series is found in many localities in the-Middle Island; statuary-marble occurs among the gneiss and hornblende schists of the West Coast, the grain of most samples hitherto found being rather coarse, but closer-grained kinds exist in Caswell Sound, and also in the Mount Arthur district of Nelson.
Granular or crystalline and subcrystalline limestones of every shade and colour, texture and hardness, occur plentifully, chiefly in the Middle Island.
Extensive masses of the harder compact kinds occur in the Carboniferous formation. They are, generally speaking, of a blue colour and unfossiliferous.
One mass or stratum occurs in the slates of the Kakanui Range; it is several hundred feet in thickness, with an outcrop of five miles in length, and is probably the best in Otago.
A great variety of excellent building-stones might be obtained from the Horse Range (Shag Valley side); at Twelve-mile Creek, on Lake Wakatipu; Malvern Hills, Canterbury; and Hokanui Hills, Southland. In the latter provincial district a very fine kind is obtainable, very slightly coloured; it belongs to the Cretaceo-tertiary series.
A white granular limestone called the Oamaru stone is worked in extensive quarries in the Oamaru district; but it occupies a large tract of country in the north part of Otago and throughout Canterbury, and has a remarkable uniformity of colour and. texture; its weight, wet from the quarry, is 1051b. per cubic foot, and whim perfectly dry, 921b. A considerable quantity has been exported to Melbourne.
The principal buildings of Dunedin are built of this stone, which shows a very fair amount of durability.
At Wairoa, Auckland, there is a good hard close-grained stone, light-buff colour, mottled with black grains.
Freestone.—A fine limestone of a brown tint occurs near Dunedin, at Boat Harbour; it works freely, seems durable, and is said to exist in large quantities, and to be procurable in moderately-sized blocks; it has the disadvantage of not being in an easily-accessible situation.
A hard, shelly, and white limestone, belonging to a younger formation than the Oamaru stone, occurs at Kakanui, and is used in some structures in that locality; it is of a uniform colour and consistency, and easily worked, and procurable in large blocks. The supply is unlimited.
Southland possesses a fair stone of this kind.
A valuable limestone occurs on the Otago Peninsula, near Port Chalmers, in two beds, one dark-coloured and the other yellow; the last contains a rather large amount of fine-grained sand, yellow and black. They burn to pretty good quicklime.
A good stone for lime occurs in Scinde Island, Napier; it is fossiliferous and of Upper Tertiary age.
At Oamaru a compact variety of limestone is largely burnt for lime, but it is found in dislocated and concretionary masses intermixed with quantities of worthless rock, which greatly increases the expense of extraction. It is fossiliferous.
A hard very compact grey-coloured stone of considerable purity occurs near the Moke Creek copper-lodes, and would afford the flux required for reducing the ore. It is fossiliferous and of Lower Tertiary date.
Travertine limestone is found at Dunstan Gorge, Otago; it makes very white lime. It has the usual porosity of this kind of stone.
Geodic limestone.—This occurs at Hampden, Otago, and has numerous sparry cavities lined with crystallized calc-spar.
Cellular limestone occurs at Nelson. This kind has numerous angular cells or holes.
A limestone breccia occurs at Ruataniwha.
Lithographic limestone.—A lithographic limestone is found at Oamaru; it is a very fine-grained stone, hard and compact; its fracture is conchoidal. It occurs in concretions in the limestone and not in slabs. The quarry is situated where the Lower Tertiary strata have undergone alterations by the extrusion of submarine igneous rocks, probably during their deposition. An extensive deposit of lithographic limestone also occurs at the Abbey Rocks, near the Paringa River, Westland, from which locality large slabs could be obtained. Lithographic limestone is also found in the Chatham Islands.
Chalk, with black-and-white flints, is found at Kaikoura Peninsula and the northern part of Canterbury; a very pure bed of this material, which is of value for the manufacture of cement, exists near Oxford.
Sandstones are very plentiful throughout the islands, and are very varied in hue. The different kinds may be classed under the following heads:—
Silicious Sandstones, in which the cementing paste is a silicious infiltration.
Calcareous Sandstone, having carbonate of lime for its cohesive power.
Argillaceous Sandstones, or Claystones, in which clay replaces either of the above substances.
The true silicious sandstones are found at the base of the Tertiary and in the Upper Secondary formations, where they are associated with beds of coal.
Calcareous Sandstones.—These are confined to the Upper Tertiary rocks, and are variable and concretionary.
Argillaceous Sandstones or Mudstones-Claystones. — These, like the last kind, are found only in the Upper Tertiary beds, and are as variable.
Natural-cement stones, or septaria, occur in the lower parts of the marine Tertiary series, and in some cases are quite equal in quality to those which are burnt for the manufacture of hydraulic cement in Europe. The cement hitherto used so largely in New Zealand has been imported, but with the great resources that the colony possesses in the raw material for the manufacture, this will probably not be long continued.
Materials for Portland Cement.—The manufacture of Portland cement might he made an important industry in New Zealand, excellent chalk and lime and non-ferruginous clay being obtainable. The Italian pozzuolana might be imitated also, as there are extensive deposits of volcanic tufas occurring in the North and Middle Islands. Those volcanic sands would require then to be ground up with an admixture of lime, and making, when correctly proportioned, an excellent hydraulic mortar.
The materials for brickmaking are plentiful throughout the colony. The success of the pottery works that have been established at Tokomairiro, also at Christchurch and other places, has proved the adaptability of the fire-clay and pottery clays of the colony for the best kinds of fire-bricks, drain-pipes, chimney-pots, tiles, and all kinds of pottery, porcelain, and terra-cotta goods.
Table of Contents
Meteorological observations have been made ever since the founding of the colony, though at first they were of an irregular character, and only with the view of comparing the climate of New Zealand with that of other countries. From 1853 meteorological reports appear regularly appended to the Registrar-General's statistics; but it was not until 1859 that systematic observations were undertaken by a department established by Government. In that year nine stations, equipped with carefully-compared instruments. were established at Mongonui, Auckland, Napier, New Plymouth, and Wellington, in the North Island; Nelson, Christchurch, Dunedin, and Invercargill, in the Middle Island; and some years later two additional ones—one at Hokitika, and the other at the Bealey.
Subsequently, several new stations were established, making in all fifteen, from which monthly returns were sent to the head office in Wellington. Since then the number of chief stations has been reduced to six, but the number of secondary stations at which rainfall and weather is recorded has been increased to over sixty in number.
The climate resembles that of Great Britain, but is more equable, the extremes of daily temperature only varying throughout the year by an average of 20°, whilst London is 7° colder than the North and 4° colder than the Middle Island of New Zealand. The mean annual temperature of the North Island is 57°, and of the Middle Island 52°, that of London and New York being 51°.
The mean annual temperature of the different seasons for the whole colony is: In spring, 55°; in summer, 63°; in autumn, 57°; and in winter, 48°.
Meteorological observations were taken in 1891, at 9.30 a.m. daily, at six different stations—namely, at Auckland, in the northern part of the North Island; at Te Aroha and Rotorua, in the hot-springs district; at Wellington, at the extreme south of the North Island; at Lincoln, in the Canterbury District, about midway in the Middle Island; and at Dunedin, in the southern district of the Middle Island. The differences of situation—Auckland, Wellington, and Dunedin being seaports, the other three inland stations—of elevation, and of -latitude between the several stations involve considerable differences of temperature.
The following table gives the mean temperature of air in the shade for the year at each station, and the maximum and minimum temperature recorded:—
| Station. | 1891 | |||
|---|---|---|---|---|
| Mean Temp. in Shade. | Max. Temp. recorded. | Min. Temp. recorded. | Extreme Range. | |
| Fahr.° | Fahr.° | Fahr.° | Fahr.° | |
| Auckland | 59·2 | 80·0 | 39·0 | 41·0 |
| Te Aroha | 58·0 | 87·0 | 23·8 | 63·2 |
| Rotorua | 53·3 | 85·0 | 21·5 | 63·5 |
| Wellington | 54·8 | 81·0 | 31·3 | 49·7 |
| Lincoln | 53·1 | 94·2 | 22·8 | 71·4 |
| Dunedin | 50·7 | 81·0 | 28·0 | 53·0 |
It will be observed that, although the mean temperature for the year was highest at Auckland, the highest temperature reached was at Lincoln (in the Middle Island); and the lowest minimum was at Rotorua (in the North Island).
The climate on the west coast of both islands is more equable than on the east, the difference between the average summer and winter temperature being nearly four degrees greater on the southeast portion of the North Island, and seven degrees on that of the Middle Island, than on the north-west, on which the equatorial winds impinge. This constant wind is the most important feature in the meteorology of New Zealand, and is rendered more striking by comparing the annual fluctuation of temperature on the opposite seaboards of the Middle Island, which have a greater range of temperature by eighteen degrees at Christchurch, on the east, than at Hokitika, on the west.
The rainfall varies much at the different stations, and from year to year. The following shows the rainfall for the last three years:—
| Station. | 1889. | 1800. | 1891. | |||
|---|---|---|---|---|---|---|
| Rainfall. | Number of Days on which Rain fell. | Rainfall. | Number of Days on which Rain fell. | Rainfall. | Number of Days on which Rain fell. | |
| Inches. | Inches. | Inches. | ||||
| Auckland | 41·970 | 162 | 46·100 | 176 | 36·040 | 149 |
| Te Aroha | 55·620 | 130 | 64·110 | 129 | 43·270 | 119 |
| Rotorua | £0·630 | 131 | 50·411 | 162 | 48·940 | 132 |
| Wellington | 31·356 | 155 | 45·230 | 165 | 35·125 | 106 |
| Lincoln | 20·384 | 109 | 14·830 | 104 | 20·575 | 98 |
| Dunedin | 23·446 | 131 | 27·984 | 155 | 32·734 | 151 |
The following is the annual average rainfall at the four principal stations in New Zealand, for the ten years ending August, 1891:—
| North Island. | |
| Auckland | 39·131 |
| Wellington | 48·600 |
| Middle Island. | |
| Lincoln | 26·691 |
| Dunedin | 35·655 |
Daily observations have not been continued at Hokitika, on the west coast of the Middle Island, since 1880; but for the ten years 1871 to 18S0 inclusive the annual rainfall there averaged 122·990in., the greatest rainfall for any one of those years having been 154·446 inches, and the smallest 96·170 inches.
The greatest rainfall in any twenty-four hours during the year 1891 occurred at Auckland—4·020 inches, on the 22nd February.
The observations that have been taken show that the northern part of New Zealand is within the influence of the subtropical winter rainfall, the probability of rainfall in winter in that part of the colony being twice as large as in summer.
In the south, however, the rainfall, though irregular, is distributed more equally over the year. The chief difference to be observed is that on the west coast spring rains prevail, and summer rains on the east coast; while in the middle of the colony the driest season is autumn, and in the south it is the winter and spring.
The contrast between the rainfalls on the east and west coasts, as with the temperature, is “most striking. Thus, in the North Island, Napier on the east has only, half the amount of rain that falls in Taranaki on the west. But the Middle Island, with its longitudinal range of lofty mountains, exhibits this feature in a still more marked manner, for the rainfall on the west is nearly five times greater than that on the east. The excess of precipitation on the coast is clearly illustrated by the distribution of the glaciers on the opposite sides of the range: those on the west slope have an excessive supply of snow, and descend to a line where the mean annual temperature is 503° Fahr., while on the east slope they descend only to the mean annual temperature of 37°. The winter snow-line on the Southern Alps' on the east side is 3,000 feet, and that on the west side is 3,700 feet.
Periods of lasting drought are almost unknown in New Zealand, and only in two instances do the records show a whole month at any station without rain.
The configuration of the colony—its great length from north to south compared with its breadth, its great extent of coast-line, and the division of the two principal parts by Cook Strait—renders it very subject to the influence of sea-breezes. As a consequence, in parts, at times, there is much motion in the atmosphere, and windy days are prevalent.
Owing to the fact that most atmospheric disturbances pass from west to east, with the centres of the depression to the south of New Zealand, there is a marked prevalence of westerly winds throughout all seasons, but they are much modified by the form of the land. When the centres pass to the north of New Zealand, the result is that the north-east winds impinge on the east coast, bringing rain, followed by cold south-easters, with heavy storms of rain and snow during winter in the south.
The more common westerly winds begin in the north-north-west, with heavy rain on the west coast, and gradually veer to south-west, when-fair bright weather sets in on that coast; but the same southerly wind, sweeping along the east side of the islands, brings heavy strong weather, locally known as “southerly bursters,” which, from the shape of the coast, reach the region of Cook Strait as south-east-storms. All the other winds are either land- or sea-draughts, with light fine weather, or are moderate winds produced by the circulation of the atmosphere round anticyclonic areas of high barometric pressure that are far more persistent in their influence than the fast-moving cyclonic or low-pressure areas.
The number of days on which there were gales or high winds in 1891, at each station, were as follow:—
| Number of Days on which there were Gales or High Winds. | Maximum Velocity of Wind, in Miles, in any 24 Hours. | |
|---|---|---|
| Auckland | 21 | .. |
| Te Aroha | 22 | .. |
| Rotorua | 2 | .. |
| Wellington | 68 | 700 |
| Lincoln | 9 | 649 |
| Dunedin | 23 | 570 |
Its position near the narrowest part of Cook Strait renders Wellington peculiarly subject to wind; but the maximum force of the wind was greater at Lincoln. The records for the first six months at Auckland were too unreliable to enable correct data to be supplied for the whole year; but, during the second six months, a maximum force of 765 miles in twenty-four hours was experienced in September, and of 754 in December, 1890.
Thunderstorms are most frequent where the changes of wind are most suddenly felt, from the moist equatorial currents to the cold polar currents of the south-west. They are most frequent in spring on the west coast, except in the extreme south-west of Otago, where, during winter, thunderstorms are of almost daily occurrence.
Table of Contents
- THE THERMAL-SPRINGS DISTRICT AND THE GOVERNMENT SANATORIUM AT ROTORUA
- CLIMATE OF ROTORUA
- AREA OF THERMAL-SPRINGS DISTRICT
- PHYSICAL FEATURES
- VARIETIES OF MINERAL WATERS
- THE ROTORUA SANATORIUM
- THE HOSPITAL
- THE TARIFF
- THE PRIEST'S BATH
- THE PAVILION
- THE RACHEL BATH
- THE BLUE BATH
- CASES FOR TREATMENT
- CASES OF PARALYSIS
- A SUCCESSFUL CASE
- FURTHER CASES—PARAPLEGIA CURED
- RHEUMATISM AND SKIN-DISEASES
- CURES IN SEVERE RHEUMATISM
- GREAT SUCCESS IN CASES OF SKIN-DISEASE
- NEURALGIA
- CURATIVE EFFECTS OF MINERAL, WATERS
- VOLCANIC OUTBREAK AT ROTORUA
- ROTORUA AS A HEALTH RESORT
- ROUTE TO ROTORUA
- THE SANATORIUM WORKS AT ROTORUA
- MIDDLE ISLAND MINERAL SPRINGS
New Zealand is singularly rich in springs of water that hold mineral salts in solution, and some of these are well noted for their valuable medicinal properties. Both hot and cold springs are found, the former being, with few exceptions, confined to districts of the North Island, where volcanic forces have been active during the latest Tertiary period, and are not yet dormant. A few thermal springs are found to escape from the Upper Mesozoic rocks, in localities where the source of heat can only be attributed to chemical decomposition of bituminous matters and sulphides; and in a few instances warm waters spring from Palæozoic rock-formations in the Middle Island. The cold mineral springs have a wider distribution, but have only as yet been examined from comparatively few localities.
The mineral waters of New Zealand are classified, from analyses that have been made in the Colonial Laboratory, under the following groups: Saline, alkaline, alkaline-silicious, hepatic or sulphurous, and acidic waters.
The following account of the Thermal-springs District and the Government Sanatorium at Rotorua is by Dr. Cinders, the Medical Superintendent:—
The geographical position of the North Island of New Zealand will naturally suggest something of the character of its inland climate at an elevation of 1,000ft. Rotorua is some 40 miles from the coast. Its elevation is 990ft. above the sea-level. The atmosphere is drier and more bracing than that of the coast—in winter considerably colder, and in summer perhaps somewhat hotter; but a dry pleasant heat, free from the moist oppressiveness which characterises the summer heat of Auckland and other coast towns. The mean temperature of spring is 53°, of summer 66°, of autumn 57°, and of winter 45°. The relative moisture of the air for the four seasons (taking complete saturation at 100°) is—for spring, 74°; for summer, 66°; for autumn, 67°; and for winter, 74°. The steam which rises so abundantly and perpetually all over the district no doubt adds considerably to the moisture of the atmosphere. This was clearly shown in the month of June, 1886, when the great eruption of Tarawera took place. The relative moisture for that month was 10° in excess of the average, owing to the immense amount of vapour caused by the eruption. The rainfall for the year is about 50in., and the number of days on which rain Jails about 140. Auckland has 18in. less rain, and 13 more rainy days. The daily range of temperature is greatest in the summer and least in the winter. This condition maintains throughout the whole of New Zealand, and constitutes one of the greatest charms of its climate. No matter how hot a summer's day may be, the nights are invariably cool. The mean daily range of temperature for spring is 21°, for summer 28°, for autumn 23°, and for winter 20°. The most agreeable months of the year for an invalid to visit Rotorua are February, March, and April; the least are August, September, and October; but, as there is ample boarding-accommodation close to the baths, the invalid is virtually independent of the weather. Our climate, therefore, may be said to be mild, equable, and agreeable. By an equable climate I do not wish to imply one in which the same conditions prevail for long periods of the year, but rather one in which the different factors—temperature, moisture, light, electricity, wind, and atmospheric pressure—are subject to moderate variations. Our patients, it must be remembered, are a mixed class, consisting chiefly of fairly vigorous individuals, in whom it is necessary to maintain the energy of the different organs and functions, and the normal power of adaptation and resistance to climatic conditions. Such a climate we enjoy at Rotorua.
The thermal-springs district of New Zealand comprises an area of upwards of 600,000 acres, or close on 1,000 square miles. The length of the district is some 50 miles, with an average breadth of 20 miles. Its altitude averages from 1,000ft. to 2,000ft. above sea-level.
The general physical features of this region embrace extensive pumice-plains, intersected in various directions by high ranges of igneous formation, winch are relieved here and there by enormous trachytic cones. Extensive forests of extraordinary luxuriance and beauty clothe the mountains and border the extensive plateaux, while hot lakes, boiling geysers, and thermal springs are dotted far and wide over the country. The thermal-springs district, however, as defined on the maps, by no means embraces the whole volcanic and hydrothermal activity of the island. Although the volcanic slopes of Ruapehu and Tongariro bound this region on the south, hot springs are found here and there for fully 250. miles beyond its western boundary—in fact, as far north as the Bay of Islands. Within the district it is no exaggeration to say that hundreds of hot springs exist, to say nothing of mud-volcanoes, solfataras, and fumeroles.
These springs are of the most varied chemical character, and every degree of temperature from 60° to 212.° Not a twentieth part of them have as yet been submitted to analysis. Those which have been examined in the laboratory of the Geological Survey Department in Wellington are divided by Sir James Hector into five classes: (1) Saline, containing chiefly chloride of sodium; (2) alkaline, containing carbonates and bicarbonates of soda and potash; (3) alkaline-silicious, containing much silicic acid, but changing rapidly on exposure to the atmosphere, and becoming alkaline; (4) hepatic, or sulphurous, characterised by the presence of sulphuretted hydrogen and sulphurous acid; and (5) acidic waters, containing an excess of sulphuric or hydrochloric acid, or both. In addition to these we have saline waters, containing iodine, cold acidulous chalybeates, and saline acidulous chalybeates. These, however, are in situations at present inaccessible to the invalid, or, if not out of reach, at least destitute of the conveniences and comforts essential to the sick, but no doubt destined in the near future to attain a high medical reputation.
The Government of New Zealand has very wisely chosen the southern shore of Lake Rotorua as the basis of operations for opening up this wonderful district. Here are grouped together numerous examples of the five classes of springs I have enumerated, and here the Government have fixed their first sanatorium and bathing establishment, to which it is desired specially to direct attention. The sanatorium reserve at Rotorua comprises an area of some 50 acres, bounded on the north and east by the lake, and on the west and south by the Township of Rotorua. Ten years ago this was a howling wilderness, covered with tea-tree scrub, and diversified only by clouds of steam rising from the various hot springs. Here the adventurous invalid of that day had to pitch his tent, and be satisfied with a hole in the ground for a bath; and if the spring he wished to use happened to be too hot for his purpose, he probably had to dig the hole for himself, and regulate the supply and temperature of the water to the best of his hydraulic ability. In many instances he immortalised himself by giving his name to the spring—names still retained. Thus we have “Cameron's Bath,” “McHugh's Bath,” “Mackenzie's Bath,” and “The Priest's Bath.” Other springs have received their names from some real or imaginary quality. Thus we have “Madame Rachel,” “The Pain-killer,” “The Coffeepot,” and “The Blue Bath.” Now this area of desolation is completely transformed. Walks and drives planted with evergreen. trees traverse it from end to end, fountains and flower-gardens-delight the eye, and commodious buildings for the accommodation and convenience of invalids are springing up on every side. The principal of these are the Sanatorium Hospital, the medical residence, the Priest's Pavilion, the Rachel Pavilion, the Blue Swimming-bath (to which is attached the sulphur-vapour bath and the-electrical department), and Brent's boarding-house.
The Hospital, which was opened in 1886, was unfortunately destroyed by fire in November, 1888. A new and far more commodious building has been erected by the Government. It is designed to accommodate twenty-one patients—twelve males and nine females. The stipulations made by the Government with regard to admission are that the patient shall be able to show that his case is one likely to be benefitted by the use of the baths, and that he is unable to pay the usual hotel or boarding-house charges.
The Government tariff has not yet been decided on, but it is not likely to exceed £1 or £1 5s. per head per week. A patient will be allowed to remain three months, but if at the expiration of that time the Medical Officer is of opinion that a longer period is desirable, a second three months will be granted; but in all cases six months will be the extreme limit. A low tariff of this kind will enable the Charitable Aid Boards of the country to send up for treatment a class of patients who would not otherwise be able to avail themselves of the springs, and at the same time will in no way interfere with the private enterprise of hotel and boarding-house proprietors.
We have no spring in the district that has obtained a higher reputation, or proved itself more generally useful, than that known as the Priest's Bath. The character of the water is sulphurous, aluminous, and strongly acid. Its temperature varies from 98° to 106°. This variation is due to the rise and fall of the lake and the direction of the wind. When the lake is high and the wind blowing in the direction of the baths the conditions are favourable to a high temperature, and vice versá, the cold water of the lake affording a more efficient barrier to the escape of heat than the open pumice-gravel of which the shore is composed. The solid constituents of the water amount to 96 grains per gallon, consisting of sulphates and silica. Of these, the sulphates of alumina and soda are the most abundant; but the most important constituents are—free sulphuric acid, 22gr., and free hydrochloric acid, 3gr. per gallon. A patient emerging from this bath looks like a boiled lobster, and I regard this determination of blood to the skin as a most important therapeutic factor: the vascular and nervous apparatus of the skin are powerfully stimulated by it, and internal congestions relieved. Our alkaline waters, on the other hand, which contain the chlorides and silicates of the alkalies, have a soothing and emollient effect on the skin, and are of great value in eczema, and other cutaneous ailments. The water of the Priest's Spring is brilliantly clear when undisturbed, and pale-green in colour. A faint odour of sulphuretted hydrogen pervades the vicinity, which gas, together with sulphurous acid, is copiously evolved. Since the eruption of Tarawera this offensive odour has been much modified, owing, I believe, “to an increased evolution of sulphurous-acid gas at that time. Fortunately for the nasal organs and general comfort of bathers, these gases effect a mutual decomposition, resulting in the formation of sulphur and water, thus—2H2S+SO2=3S+2H2O; which means that two parts of sulphuretted hydrogen, combining with one part of sulphurous acid, form three parts of sulphur and two of water. “Wherever steam, charged with these gases, is able to penetrate, sulphur is deposited. This is the origin of all the sulphur in the district. It permeates readily the silicious-sinter rock, forming beautiful needle-like crystals of sulphur in its interspaces. Sulphur being thus constantly transformed from the gaseous to the solid state in the water of this spring, it is very possible that, coining into contact with the skin in this nascent and impalpable form, its therapeutic power may be considerably enhanced: there can be no doubt about its absorption, for our patients tell us that their underclothing is redolent of sulphur for weeks after returning home.
The Priest's Bathing-pavilion is a building 74ft. long by 44ft. wide, having a superficial area of 3,256 square feet. It is divided into male and female departments. Each department comprises two public piscina, 16ft. by 12ft., with two private baths for special cases, lounging-rooms, and comfortable dressing-rooms. Bach bath is provided with a cold fresh-water shower, and douches either hot or tepid, thus materially enhancing the hydropathic efficiency of this remarkable water.
Adjoining this structure is the Rachel Bathing-pavilion. Here we have a water diametrically opposite in character to the last described—an alkaline silicious water, having a temperature at its source of 180°. This source is a caldron of enormous depth, situated some 200 yards from the bathing-pavilion, and yielding 50,000 gallons daily. We have a simple system of cooling by which the water may be used at any desired temperature. Here also is a separate department for each sex, each containing a public piscina 16ft, square, four private baths, a lounging- or waiting-room kept at a constant temperature of 70° by hot-water pipes, and dressing-rooms. The solid constituents of this water amount to 116gr. per gallon, and consist of the chlorides of sodium and potassium, sulphate and carbonate of soda, silicates of soda lime and magnesia, oxides of iron and aluminium, and silica. Its reaction is alkaline, and it contains a small amount of sulphuretted hydrogen. The delicious sense of bien-itre produced by bathing in this water, with the soft satiny feeling it communicates to the skin, most be felt to be appreciated. It is useful in all forms of skin-disease—indeed, in eczema it may be considered specific if continued long enough in conjunction with a suitable regimen. I frequently recommend the internal use of this water. Its taste is not unpleasant, and its action is mildly antilithic. Waters containing silicates are said to be useful in the uric-acid diathesis, and I certainly have found it suit gouty patients admirably.
The Blue Bath is a Warm swimming-bath 62ft. long by 27ft. wide. It is built of stone and concrete, with a smooth surface of Portland cement. Its depth is from 4ft. 6in. to 3ft. It contains about 30,000 gallons of water, maintained at a temperature of 98°. This is the popular pleasure-bath of the Sanatorium, in which our rheumatic invalids are able to take exercise without undue fatigue. It was completed in 1885, and opened by Mr. George Augustus Sala. During the excavation necessary for its formation the workmen struck upon a remarkable sulphur-cavern, its-roofs and sides thickly coated with brilliant acicular crystals of sulphur, and at its base a hot spring yielding steam so strongly impregnated with sulphur-gases as to be quite irrespirable. This we have conducted to the surface, and employ as-a sulphur-vapour bath, diluting it, as occasion requires, with steam of a milder character. In sciatica and all forms of rheumatism this is one of our most popular and efficacious remedies. In this building we have our electrical room, supplied with faradic and constant-current batteries, and a galvanic bath. No hospital at the present day is without its electrical apparatus, yet few hospital men, and still fewer busy general practitioners, have time to devote to the study it necessitates. It appears destined to become a specialty; and certainly there could be no wider field for its exercise than a sanatorium like that of Rotorua, where neurotic, rheumatic, and paralytic patients congregate, and where constant bathing modifies so favourably the normal resistance of the] skin to the electrical current.
The selection of eases suitable for treatment at Rotorua is a most important matter. I am aware that a strong tendency exists both with physician and patient to try anything as a dernier ressort. It is a serious matter, however, to put a patient to the trouble and expense, and possibly the pain, of making a long and weary journey, to rob him of the comforts of home and the society of his friends, without at least some reasonable hope that his labour will not be in vain. And yet this is constantly being done. Some six years ago, when I first took up my present position as Superintendent of the Sanatorium at Rotorua, I found that numbers of patients were being sent to the district who ought never to have left their homes. Advanced phthisis, chronic Bright's disease, spinal caries, and psoas abscess were a few of the ailments supposed to be cured by hot water. This state of things, fortunately, has been remedied to a certain extent by a pamphlet I wrote at the request of the Government, giving the medical men of New Zealand a few hints on the selection of cases suitable for treatment at the springs.
The two most important questions to be answered before deciding to send a case to Rotorua are— (1) Has the patient sufficient strength to bear the journey? and (2) is the case one likely to benefit by treatment? With regard to the first question, it must be remembered that the five hours' coaching from Oxford to Rotorua is rather a trying ordeal for an invalid, and will continue to be so until the railway now in course of construction is complete. A case otherwise suitable, however, need not be kept away because the journey may occasion considerable fatigue, or even increase of pain, provided there is sufficient vitality to render such inconvenience a mere matter of temporary concern. Nor need the partial or even total loss of the patient's locomotive power prevent his coming. We have many instances on record of patients who, on arrival, required the aid of crutches, or to be actually carried to the bath, and yet went away enjoying the full use of their limbs. In considering the second question, medical men will not need to be reminded that where profound organic structural change exists, very little benefit can be expected, so that considerable discrimination must be exercised in selecting cases of paralysis for treatment. Hot water has no regenerating power that I am aware of where nerve-elements are extensively destroyed. The same may be said of osteo-arthritis, or chronic rheumatic arthritis, with structural change and great deformity of the joints. Such cases may improve in general health, gain weight, and lose pain, but there the improvement ends. Our treatment is contra-indicated in phthisis as long as active destructive change is going on in the lungs. Certain chronic poitrinaires, however, pay us periodical visits with advantage.
There is a form of incomplete paraplegia very common amongst old miners: the patient gets about a little with the help of a stick; his walk is shaky and tottering; his general health usually good; often the mind is somewhat crippled—a mild form of dementia; the bowels are generally torpid; there is often dribbling of urine, or, at best, very feeble control of the sphincter; the muscles are not atrophied, and respond normally to both the galvanic and faradic current. I consider such cases incurable; hot baths are certainly useless. Their mental condition, however, is capable of great improvement by proper discipline and diet, and the bowels and bladder may be kept in a state of perfect comfort by galvanism intelligently applied. As they may enjoy this amount of benefit in any hospital, it is useless to send them to Rotorua. Cases of paraplegia, in which the muscles are extensively atrophied, and there is absolutely no response to either galvanism or faradism, are usually hopeless. In hemiplegia, on the other hand, presumably from cerebral embolism, or from small hemorrhages, as, for example, from rupture of the miliary aneurisms of Charcot, we have had some excellent results.
Some time ago, a man about forty years of age, in a state of delirium tremens, attempted to commit suicide with a pair of scissors. He gave himself four stabs with the pointed blade in the left side of the chest. One wound just touched the lung, and there was some extravasation of air into the cellular tissue. In ten days the wounds had healed, and I was about to discharge him, when he was suddenly seized with paralysis. He never lost consciousness, but was unable to articulate, and lost all motor power on the left side. I did not think it wise to commence electrical treatment or hot bathing for the first three weeks. At the end of that time the muscles of the arm and leg were flabby and wasted, and hot sulphur-baths, with faradism, were commenced. The muscles regained their normal condition in a marvellously short time, in a fortnight he was able to walk, and at the end of two months could speak quite intelligibly, and use both hand and arm very well.
Primary functional paralysis, in which there is reason to believe that the nerve-centres have undergone no organic change—such paralysis, for example, as may be induced by depressing morbid influences, as malaria, influenza, sexual excesses, mental or physical fatigue, exposure to wet and cold, alcoholism, or hysteria, are likely to benefit by treatment at Rotorua. A lady, aged thirty-six, after a long attack of malarial fever, found herself completely paraplegic. After a time she was able to move on crutches, but had a tendency to fall backwards. Her condition improved up to a certain point, when she remained stationary for some months. Fearing she might be crippled for life, she determined to try the thermal springs of Rotorua, and I received her into my house as a private patient. I found her able to swing herself along on crutches, bearing her weight on the left leg, the right being perfectly powerless. Singularly enough, she could walk on her knees, which seemed to point to the fact that the lesion then existing must be below the spinal origin of the nerves supplying the psoas and iliacus muscles: this, together with the fact that she had tried the faradic current at home, and found it injurious, narrowed down the field for electrical treatment very considerably. I chose two large electrodes: the anode was placed on the right sacro-iliac synchondrosis, and the cathode on the calf of the right leg, and a continuous current from ten cells allowed to flow for fifteen minutes daily. In addition to this she had two hot sulphur-baths every day. In three weeks she was perfectly well. Another more recent cure is even more remarkable. H. C., a bushman, aged twenty-three, had become completely paraplegic, presumably from exposure to wet and cold. He had been for many months dependent on a Charitable-aid Board, who sent him to Rotorua. For three weeks he was carried to his bath, at the end of which time he was able to stand alone. At the end of five weeks he could walk with two sticks, and ride on horseback. In three months he was as well as ever he had been in his life.
Rheumatism and skin-diseases form fully 75 per cent, of the cases we are called upon to treat, and these usually in a very chronic form. In rheumatism and rheumatic gout we have much success, especially where arthritic degeneration is not too pronounced. Hot acidic sulphur-baths at a temperature not exceeding 104°, or sulphur-vapour up to 115°, taken twice daily for a carefully-regulated time, according to individual tolerance—which we find to vary greatly—forms our routine treatment. These waters redden the skin, and cause some tingling sensation for an hour or two. Occasionally some irritation of the skin occurs, which is readily allayed by a few warm alkaline showers or douches. In those numerous and well-known cases of chronic hip-rheumatism, initiated frequently by injury, we find nothing so efficacious as the hot douche. The beneficial result is due partly to the quality of the water, and largely to its mechanical action: fortunately, our arrangements are so complete that we are able to vary the temperature and percussive power of the douche at will. We are able to quote several cases of cure even where a considerable amount of fibrous anchylosis has existed. If the rheumatic patient progresses favourably under the bath-treatment alone, neither medicines nor electricity are employed, but if after a few weeks his progress is not satisfactory, we find galvauo-faradism a valuable adjunct. Usually thirty cells are put into circuit with a faradic machine, and the double current applied in the labile manner to the parts affected for fifteen minutes daily. We find this answer better than either current alone. In cases of muscular atrophy, faradism is had recourse to from the commencement.
Two typical cases of cure, one of uncomplicated and the other of complicated rheumatism, will be sufficient to quote. Dr. MacGregor, the Government Inspector of Hospitals for New Zealand, quotes the following cases in connection with our Sanatorium: “A.B., a young man, became affected with rheumatism while serving as a common sailor on the coast, and was reduced to helplessness. He had spent his all without gaining relief. When he had got half-way to Rotorua he found himself at a roadside hotel unable to go further, but a good Samaritan coming along conveyed him in his own carriage to Rotorua, and confided him to the care of Dr. Ginders. In less than a month he was discharged cured.” I think it is only due to the “good Samaritan” to state that his name was Sir Robert Stout, then Premier of New Zealand. The second case is a remarkable one: C.H., aged forty-nine, an innkeeper; height, 5ft. 11in.; greatest weight attained, 12st. 101b., present weight, 10st. 61b.; always temperate; family history good—no gout or rheumatism. Got his first attack twenty years ago—sub-acute rheumatism of the feet. Never had venereal disease in any form. The attacks recurred every winter, each being more severe than the last. The ankles, knees, elbows and hands became affected. For the last nine years he has spent six months of each year in bed. On his arrival at Rotorua his appearance was that of a man of seventy; his hair white, his complexion pale and anæmic, his back bent, liver sluggish, bowels torpid, appetite bad with slight enlargement of knees, elbows, and knuckles. He commenced taking two acid sulphur-baths daily, and during the first month improved wonderfully; when suddenly he got an acute exacerbation of pain, and had to take to his bed, fully impressed that his annual hibernation had commenced. He was relieved, however, after a few days, and was able to leave his bed. Very soon serious costiveness set in. Having in vain tried other remedies, as a last resource I tried faradism. All serious symptoms at once disappeared. He rapidly gained strength, resumed his bathing, and, after spending three months with us, considered himself in better condition than he had been for ten years. Very cold weather having set in, I sent him home, in appearance a new man, free from pain, his general health excellent, and with an addition of 71b. to his weight.
Perhaps there is no class of diseases in which we meet with more uniform success than those affecting the skin. The solid and gaseous constituents of the waters are no doubt important, but I have more confidence in the influence of change and all that it implies in its effect on both mind and body, combined with the prolonged maceration of the cuticle, and the constant exposure of the skin to air and light, which frequent bathing entails. General eczema, which may have resisted every form of treatment for years, is generally cured in a period varying from six to thirteen weeks, if the patient is willing to submit himself to rigorous medical discipline. The same may be said of psoriasis—at least, as far as its disappearance for a longer or shorter period is concerned. It is rare, indeed, to see psoriasis completely eradicated. For ringworm and the impetiginous eczema of children the water of the Priest's Spring is specific. In sycosis epilation is necessary, after which our alkaline waters complete the cure.
Neuralgias, as a rule, do remarkably well. Patients suffering from sciatica are a numerous class with us, most of them presenting a very chronic history. When the disease is not distinctly associated with the gouty or rheumatic diathesis, is not of long standing, and has been caused by exposure to cold, it is very quickly cured. A few baths relieve the pain, and there is rarely any stiffness or weakness remaining. Chronic cases are not so easily dealt with: they require great patience and perseverance on the part of both physician and patient. Our routine treatment consists of hot baths, sulphur-vapour, the douche, and galvanism. After six or eight weeks it frequently happens that nothing remains to remind the patient of his old enemy beyond some slight weakness or soreness of the limb, and I usually advise him to try a week's sea-bathing on his way home. In order to accomplish this he should arrive in Rotorua not earlier than September, or later than February. We have had some good results in the treatment of cervico-brachial neuralgia. Some time ago a lady, who had long suffered from neuralgia of the circumflex nerve, came to Rotorua for treatment. She carried her arm in a sling, and dreaded the slightest movement. In spite of her suffering, she had attained the terrific weight of 17st. After two weeks' bathing, and the application of a very mild galvanic battery, she was able to use her arm, and in a month was completely cured.
There is a strong tendency on the part of patients not to believe in any form of electrical treatment unless the current is almost strong enough to lift them off their feet. The sooner they are disabused of this idea the better. Every week's experience convinces me more fully that for success in the treatment of neuralgias the galvanic current can scarcely be too weak, and in facial neuralgias, and paralysis especially, the greatest caution is requisite.
To enumerate every ailment in which our thermal springs have proved useful would prolong this paper indefinitely. Suffice it to say that in many cases their healing-power has been discovered accidentally. Many ladies bathing for rheumatism have found themselves cured of chronic metritis and leucorrhœa, and, as a result of such cures, have proved fruitful after years of sterility. Congestion of the liver, biliary catarrh with jaundice and hæmorrhoids, have been cured by the acid sulphur waters, which also prove useful as a topical application in ozæna and ulcerated throat. This class of water also tends to reduce plethora and corpulency without prostration, insures healthy action of the skin, and relieves torpor of the bowels.
Possibly doubt may still exist in some minds as to the safety of Rotorua as a place of residence—a doubt in some measure justified by the volcanic disturbances of 1886. There appear to me to be valid reasons for believing that such fears are groundless. In the North Island of New Zealand there exists two belts of volcanic and hydrothermal action. They run from north-west to south-east, and from north-east to south-west respectively, and may be indicated on the map by two lines, one drawn in the first direction, from the extinct volcano Rangitoto, in Auckland Harbour, through the Tarawera Range to the coast; and the other in the second direction, from the active volcano, White Island, in the Bay of Plenty, to Tongariro, near Taupo. These two lines will be seen to cross each other in Lake Rotomahana, the site of the late gigantic explosion. It is, therefore, I think, reasonable to suppose that such immense relief as was then given to the pent-up plutonic forces in the very centre of the volcanic area renders the recurrence of similar phenomena in our time highly improbable.
The popularity of Rotorua as a health resort is steadily increasing, and all that is wanting to secure its permanent success is through railway-communication with Auckland. With regard to the hotel and boarding-house accommodation provided for invalids and tourists, we have, at a distance of one mile from the Sanatorium, three hotels, each possessing valuable thermal springs, with comfortable bath-houses, the use of which is free to visitors. The tariff varies from 8s. to 10s. per day, but for visitors who may wish to remain for several weeks a lower charge may be arranged for.* At present we have only one boarding-house in close proximity to the Government baths; it is capable of accommodating about twenty visitors. The Medical Superintendent receives four resident patients in his house. Where privacy and home comfort, combined with constant medical supervision, are to be desired, this provision will be appreciated.
The most direct route for invalids from the Australian Colonies is from Sydney to Auckland, and thence by rail to Oxford, continuing the journey by coach to Rotorua. More vigorous individuals, who may wish to see something of the country, may take steamer from Melbourne to the Bluff, land at Wellington, and travel overland to Rotorua, a four days' journey, and most enjoyable in summer. Patients should be recommended to bring plain warm clothing, and substantial boots and shoes. Jewellery and valuable watches had bettor be left at home, as they are not improved by the vapours that hang about the baths.
Regarding the works now being undertaken by the Government at the Sanatorium at Rotorua, Mr Malfroy, the Government Inspector, under date Rotorua, 6th April, 1891, writes:—
The new Sanatorium building was completed on the 22nd December last, and the term of maintenance expired on the 22nd March. It is a good substantial building, where, the convenience and comforts of invalids are well provided for, and, having a nice appearance, it acids greatly to the importance and attraction of the place. It is calculated to give accommodation for twenty-one patients—viz., twelve males and nine females. It was open at the beginning of February, and has been well patronised, considering that it has not been advertised in any way, and it is therefore hardly known that such an institution is in existence.
* The annual report of the overseer of works at the Government Sanatorium et Rotorua, presented to Parliament in July, 1892, states that, “The cost of boarding and lodging naturally varies very much in the different houses, being from £3 10s. to £2 2s. per week in hotels, from £2 2s. to £1 5s. in boarding-houses, and a few cottages (two to four rooms) can be routed at from 7s. to 10s. per week; to any one living in cottages or tents, the actual cost of living would be from 10s. to 15s. per week. As to the baths, they are much cheaper than the same class of baths in any part of Europe, being as follow: Sulphur-vapour, packs, and galvanic baths, 1s. each; ordinary immersion bath, with hot douche and cold shower, 6d. each; or course of twenty-five baths, 10s. In all cases towels and linen are included.”
The grounds have been improved by the extension of the clearing, formation of new footpaths, and planting of trees. The ornamental trees, shrubs, fruit-trees, flower and kitchen gardens, all show a healthy growth. This is a subject of surprise to those visitors who saw the place in its early days, when it was thought that nothing would grow here.
The bath-accommodation has been improved by the covering in and the erection of dressing-rooms in the gentlemen's Rachel sitz-bath, and increased by the erection of a new Priest bath for the use of the sanatorium patients. This new building is 24ft by 12ft. with 8ft. walls, built on the panel pattern, and specially-grooved boards for roof, so as to use as few nails as possible, owing to the corrosive influence of the atmosphere. The bath proper consists of a piscine 12ft. by 10ft., and 3ft. deep, with broad flights of stairs, and submerged seats around three sides.
The baths have been well patronised during the past twelve months. The number of baths taken was 10,442, and cash received £277 13s., besides hospital patients' and free baths, amounting to 762, showing a slight increase in the number of baths, and a decrease of £27 in the receipts. This, however, can be accounted for. First, there were 724 hospital patients' baths not paid for; and, secondly, last year was the Exhibition year. But the high reputation which this place is slowly acquiring as the health resort of the Australian Colonies is proved by the fact that, independent of the excursionists or sight-seeing tourists, there are quite a number of persons whose faces become familiar by their repeated visits and long stay in this place. Those from the Australian Colonies come here to spend a few months of the summer, and thus escape the excessive heat of their own; whilst those from the south of this colony come here in winter, for a milder and drier climate.
The number of visitors to the place from the 1st April, 1890, to the 31st March, 1891, was 2,590. This number is only approximately correct, as several of the houses keep no record, and there is also a small number of visitors who put up with residents, as relations or friends, not included in the above.
Taking the foregoing into consideration, and the fact that the railway, which is being steadily extended, will in all probability be completed to this place in a couple of years, also that this district is now practically a public domain, I would most respectfully suggest that a substantial sum of money be placed on the estimates to lay out and form roads and tracks. These should be laid out at once, before any of the land is disposed of; plant trees, &c., in the different public reserves, before the great influx of visitors—which the completion of the railway is bound to bring—actually takes place; for, in addition to its being much easier to protect young plantations now than it will be later on, any public money so expended judiciously and at the proper season of the year, would so enhance the value of the land in the eyes of the public that the Government would be more than repaid in the increased rental they would receive.
The works proposed are—Clearing, laying out roads and tracks, planting trees and shrubs: first, in the sanatorium reserve; second, in the Pukeroa reserve; third, in the public reserve about Arikikapakapa; fourth, to lay out and form roads and tracks to the most important sights of this locality, which contains almost every variety of thermal phenomena, from bubbling hot springs to the terrifying geysers, hot and cold lakelets of various colours, mud-volcanoes, mud-puffs and boiling-mud holes of all colours, shapes, and forms. I feel certain that if the thermal wonders in the vicinity of Rotorua were known and made accessible, so that tourists could walk amongst them at their leisure; without the cost, weariness, and hurry-scurry of the present system of long journeys to far-off places, they would stay longer in the district, and be better pleased with it than they are under present circumstances.
In conclusion, I would say that the more I become acquainted with the resources and natural wonders of this district, and compare the great climatic advantages which they possess over those of the same class which I have seen and read about in Europe and America, the more I am convinced that they are sure to eventually prove a great source of Wealth to the colony; but, like many well-known rich mines, it is useless unless there is a proper plant with modern scientific knowledge to extract all possible good out of it; and, from what I saw, heard, and read on this subject during my leave of absence, I am confident that we are not effecting half the cures which might be done with better balneals and therapeutic appliances and knowledge.
With regard to the volcanoes, springs, &c., I have to report having visited the Tarawera Mountain lately, and, from the changes which I noticed, I believe that it is evidently becoming an active, volcano. There are now several places about the mountains where a stick can be charred and set ablaze by simply thrusting it for a minute or so into the scoria to be found about the different craters.
The water has risen very fast during the last twelve months. It is now filled to about its original level—namely, 10ft. above the present level of Tarawera Lake. It will require to rise about 150ft. more before it overflows into said lake through the blocked-up valley of the original creek, which seems the lowest spot on the dividing-ridge; but, as the superficial area of Rotomahana Lake will greatly increase as the water rises, it may not overflow for years.
The water of this lake, which was formerly cold, is now steaming all over, and it may, in reality, be named the real Rotomahana of the district.
These lakes have all gone down considerably from 10ft. to 15ft. below the original level. The cause of this rather sudden fall in the lakes should be worth inquiring into. The erosion of the surface about the ashfields is still going on, and offers a most interesting lesson in practical geological formations, for it is very seldom that so good an opportunity offers itself to watch the great changes which are made in a few months by the ordinary rainfall; and, to my mind, the study would offer a solution to many of the disputed theories of the formation of our alluvial goldfields.
The thermal springs, &c., have generally been at their usual or normal state of activity during the past year. The experiments I carried out in 1888 to make the Pohutu Geyser play more frequently have quite succeeded. It played regularly twice in twenty-four hours from the time the works were finished—September, 1887, to December, 1889—-when it stopped playing altogether. On my return from Europe in February, 1890, being informed that Pohutu had not been in eruption for the last nine weeks, I went over the same day, and, finding that my former works had been tampered with, I had them repaired, and the consequence was that Pohutu played up beautifully, throwing water from 40ft. to 80ft. high for two hours, a few hours afterwards, and it has continued to play twice in twenty-four hours ever since. The works about Pohutu had also the effect of starting a new geyser in the river-bed, known as the “Torpedo,” from the peculiar noise it makes in its explosions under several feet of river-gravel and water.
The experimental works in connection with the acceleration of the new terrace-formation round the Waikite Geyser have also been a success. The rough walls of moss and stones built in September, 1888, are all thoroughly cemented together, and one of them specially is now so completely coated over with stalactites and stalagmites of a siliceous formation that it is difficult to detect anything of the artificial works.
The Oruawhata springs became so quiet about the beginning of last year that at times there was no water discharged, and the Blue Bath could not be kept warm. It occurred to me that perhaps by contracting the orifice of the spring-tube and extending it upwards, so as to prevent the hot water flowing out of the actual spring from mixing with the cooled water of the pool, I might be able to get it to rise a foot or so, which would enable us to take it direct to the Blue Bath. On experimenting, I found that this theory was correct; but, instead of a small force, I found there was a powerful geyser-action. I thereupon fixed three pipes in the three principal spring-tubes, connected them by a similar number of pipes to three valves, so as to be able to regulate the admission of the cooled water ejected into the different geysers or springs; and I find by these means I am able to regulate and control the geyser-action at will, causing either one or the other of them to play constantly or intermittently, throwing water as much as 40ft. high, or to reduce it to a mere bubbling hot spring, and even silencing them for two or three months at a time. This novelty of having hot water fountains or geysers which can be controlled at will in a flower-garden is greatly attracting the attention of visitors. I also notice that this geyser-action of the Oruawhatu and Pohutu has increased the silicating property of the water. At Pohutu especially the whole area reached by the water is becoming quite white, and the spray has killed the manuka over a large area.
[Since the foregoing was written (in April, 1891), the succeeding annual report of the overseer of works at the Rotorua Sanatorium has been laid before Parliament. It shows that the number of baths taken during the year 1891-92 was 17,521, and the cash received £277 13s., thus showing an increase of 7,079 baths, and £50 11s. in cash, over the previous year. The number of hospital patients' baths was 5,112. The number of visitors registered at the hotels, boarding- and lodging-houses, &c., during the same period was 2,885, or an increase of 286 on the previous year's return. This number is, however, only approximately correct, as several houses keep no records.]
The mineral springs found in the Middle Island are altogether insignificant compared with those of the North.
Aërated chalybeate waters of medicinal value are found. The principal of these springs are situated in the broad valley near the confluence of the Hanmer with the Waiau-ua River, at an altitude of about 1,200ft. They are alkaline, with a strong escape of sulphuretted hydrogen, and are useful in rheumatic and. cutaneous diseases. The Hanmer Sanatorium is within a day's journey of Christchurch, sixty-nine miles of which is by rail to Culverden, and twenty -four miles by coach. There are two bath-houses, with twelve baths, in which any temperature up to 112° Fahr. can be obtained direct from the earth. There are two accommodation-houses; and invalids have fine opportunities for recruiting, either by driving on the plains or climbing the mountains, some of which are over 6,000ft. high.
The water of the Hanmer Springs may be classed as a muriated alkaline saline, slightly hepatic or sulphurous. Used for bathing purposes only, what physiological effects may we expect from it? Patients who frequent the thermal springs are always anxious to see the analysis of the waters in which they bathe, and are usually under the impression that they absorb into their systems the entire list of salts enumerated. This is an error. The body cannot absorb any salts from an aqueous solution. If the water, or any portion of it, is allowed to dry on the skin, a minute quantity of the constituent solids, of course, remains, which the friction of the clothing incorporates with the fatty elements of the integument, and is so absorbed.
There are within a distance of 120 miles, on the south-west coast of the Middle Island of New Zealand, no less than thirteen deep inlets or sounds, running inland, some of them a distance of 20 miles. These sounds are surrounded by high and precipitous mountains, many rising almost perpendicularly from the water's edge to an elevation of 3,000ft. to 6,700ft. The names of these thirteen deep inlets, or sounds, south to north, are—Preservation Inlet, Chalky Inlet (Edwardson Sound), Dusky Sound, Breaksea Sound, Daggs Sound, Doubtful Sound, Thompson Sound, Nancy Sound, Charles Sound, Caswell Sound, George Sound, Bligh Sound, and Milford Sound. By far the most majestic and awe-inspiring is Milford Sound, the northernmost of the series of inlets. Though comparatively inconsiderable in extent, yet, in remarkable features and magnificent scenery, it far surpasses the rest. The mountains by which it is surrounded are the highest on the coast, with the exception of Mount Cook, 120 miles to the north-east. Pembroke Peak, about three miles inland, perpetually snow-capped, rises over its northern side to an elevation of 6,700ft., and Llawrenny Peak, a very remarkable saddle-backed mountain, attains nearly the same elevation on the southern side. But perhaps the most striking features are the remarkably-shaped Mitre Peak, rising abruptly to a height of 5,560ft. immediately over the south side of the sound, and a dome-shaped mountain on the opposite shore, nearly bare of vegetation, which, from its peculiar colour, resembles a huge mass of metal.
From Anita Bay the sound runs south-east for a mile and a half, when the narrow entrance is reached, barely exceeding a quarter of a mile in width, towering perpendicular cliffs rising on either side, and the soundings in mid-channel being 60 fathoms. The sound then trends in an easterly and south-east direction for six miles between stupendous cliffs, the widths varying from one-third to three-quarters of a mile. Near the north shore, where there is a large waterfall, the depth is 214 fathoms. The following extract from a description given of this sound by the Rev. W. S. Green, a member of the English Alpine Club, and who successfully ascended Mount Cook in 1883, is taken from his “High Alps of New Zealand”:—
Vertical cliffs rose for thousands of feet on either hand, and we drove in before a blast so strong as almost to make steaming unnecessary. The surface of the sea would now and then be torn off in sheets, driven along in spindrift, and again all would be calm as glass. Waterfalls, resembling the Staubach, came down the cliffs from far above the clouds, and were blown away into spray while in mid-air by the fury of the storm. Wherever vegetation could get a footing on these immense precipices lovely tree-ferns and darker shrubs grew in profusion, all dripping with moisture, and running up the cliffs in long strips of verdure till lost to our view aloft in the torn white mists. The vivid green of the foliage was the feature of all this wondrous scene which struck me most. Two or three miles up the sound, we steamed close to an immense waterfall which, in one plunge of 300ft.; leaped into the sound with a roar like thunder, drowning our voices and sending great gushes of spray over the steamer's deck. The face of another great cliff was so draped with numberless small falls that it scored to be covered with a veil of silver gauze about 300 yards in width. While passing along here we fired a gun; echo after echo resounded from cliff to cliff, and from invisible crags high over our heads the echo again returned as a voice from the clouds. The mist now showed an inclination to clear off, the rain ceased, and as we entered the inner basin of the sound the forest increased in beauty. The totara pines, draped with festoons of grey lichen, contrasted well with the soft green of the great fern-fronds, and formed a suitable background to the scarlet blossoms of the rata (Metrosideros lucida) which here and there lit up the upper surface of the forest with patches of intense colour. Gleams of sunshine began to dart through the clouds, giving a momentary flash on one of the numerous cascades, and then, passing over forest and cliff, added new beauties of light and shade. When about eight miles from the open sea a booming sound rose higher over the voices of the numerous cascades, growing louder as we advanced, and rounding a forest-clad point we came upon the grandest of New Zealand waterfalls—the great Bowen Fall. Its first fall is only about 50ft. into a rocky basin, but, leaping from it upwards and outwards in a most wonderful curve, it plunges down with a deafening roar in a single leap of 300ft. The “Te Anau” was allowed to drift up in the eddy caused by the fall, and, being caught by the stream in the midst of drenching clouds of spray, she was spun round as though she were a mere floating twig; then, steaming to a short distance, she stopped again. The weather had now taken up sufficiently for us to see through an opening in the clouds the snow-clad top of Mitre Peak, which rises in one grand precipice of 5,560ft. from the surface of the sound. The glacier on Pembroke Peak showed for a few minutes, and was then lost to view; but what we saw formed the grandest combination of scenery upon which my eyes had ever rested. As these sounds are from 200 to 300 fathoms deep there are but few places in them where a ship could anchor; had we stayed there for the night, we should have made the steamer fast to the trees.
The nature of the country about Milford Sound may be inferred from the fact, also stated by Mr. Green, that although only about ten miles of land divide the head of the sound from the Greenstone track to Lake Wakatipu, the forest is so dense and the mountains so rugged that this divide has never been crossed by civilised man. This denial of access overland applies to all the sounds. They belong, it would seem, more to ocean than to land; and the ocean alone gives the right-of-way to their hidden chambers.
In connection with the general subject, a few words may be said of the Fiord County, on the west coast of Otago, and which, as its name implies, is the county of fiords. Its area is 2,101,248 acres. The population is small indeed within this county. The census of 1891 gave the number as 65 men and 6 women; its return in agricultural statistics is nil. On its coast, and on the contiguous coast of the Wallace and Lake Counties, almost all the possible combinations of the sublime and the beautiful in scenery are to be found. Nature here has set apart her own domain a sacred grove, where her worshippers can approach and learn from her things that are good. It is well for man to have places, as well as times of rest, where +++++++++++++++he can pause and take breath, and then go back to his daily round of hard work with lifted thought and recruited strength. Nature in this respect has been bountiful to New Zealand. Two noted instances of her beneficence are these fiords in the Middle Island, and the district of the Hot Lakes in the North Island, which is not only a wonderland, but also a sanatorium.
Of late years, during the summer season, the Union Steamship Company has facilitated transit to this otherwise impenetrable and rugged Sounds country by inaugurating special excursions, which have been largely and gladly availed of by tourists from all parts of the world.
Some years ago, Sutherland, a prospector, established for himself a home seven miles up Milford Sound, at a bend of the sound which is known as the Freshwater Basin, into which the ever-rushing stream of the Bowen Falls mingles with the otherwise silent and deep waters of the Sound. In the course of his ramblings Sutherland discovered an immensely high waterfall, which has now become famous as “The Sutherland Waterfall.” It is in three leaps, but the total fall is 1,904ft. Thus there is added to the already well-known grandeur of the Sounds this additional charm for those who delight in beholding the wondrous works of Mature.
The Government is endeavouring to open up communication inland from Milford Sound with the settled districts of Otago by Lake Howden, towards the mouth of the Clinton River. Up to the present, convict labour has been employed; but the work has not proceeded satisfactorily, and the convicts have been removed, leaving the completion of the undertaking as a matter for the future.
When the extent and magnitude of railway operations at the present day is considered, it seems hardly credible that but little more than fifty years have elapsed since the inauguration in Great Britain of railway communication, the marvellous development of which has been such a remarkable feature of the progressive Victorian era. It was about the time that the period of excitement known as the “railway mania” was agitating England that affairs in the far-off and then little-known islands of New Zealand were beginning to assume a settled aspect. The Proclamation constituting the infant settlements a separate colony under British sovereignty had been made but a few years previously—indeed, almost concurrently with the opening of the London and Birmingham Railway—one of the first important connections between a manufacturing-centre and a seaport.
It was thus impossible for many of the colonial pioneers to have seen a railway, or to have participated in the great social changes which immediately followed on the initiation of this novel mode of transit.
The march of events proceeded so rapidly that by the time later settlements were formed there were among the colonists many who had a keen perception of the advantages which would attend the introduction of railways into the new countries they were helping to found. The progress of settlement was, however, naturally, somewhat slow in those days; and it was not until 1860 that a contract was let for the construction of the first New Zealand railway; although in the neighbouring colonies of New South Wales and Victoria, possessing larger populations, induced by the gold discoveries, railways had been running some years previously, the first turf of the first railway in the Australian Colonies having been turned near Sydney, on the 3rd July, 1850. Ten years later the enterprising settlers of Canterbury, New Zealand, obtained parliamentary sanction for the promotion of a railway to overcome the natural difficulties which stood in the way of communication between Christchurch, the chief town, and Lyttelton, the seaport, and generally to facilitate intercourse between the port and the country. A high range of hills divided the towns, the only means of access at that time being by two difficult roads around its base, and by the Heathcote River, which possessed a shifting sand-bar. The first portion of this line was completed and opened for traffic on the 1st December, 1863; and, until the piercing of the tunnel through the dividing-range was accomplished, traffic was carried on by means of the river and the opened portion of the line as far as Ferrymead Junction. An account of the opening is given in the Illustrated London News of 5th March, 1864, which states that “the ceremony was performed by His Honour the Superintendent, who, with his Executive, and other members of the Government, made the first trip down the line. The event, as may be supposed, was one of no ordinary interest to the province, and drew together a large number of inhabitants. Trains continued to run up and down throughout the day, and afforded gratuitous rides, as well as immense amusement, to crowds of colony-bred young people, to whom a ride in a railway-train was, perhaps, a novelty, as well as to many others who had not enjoyed that mode of conveyance since they emigrated from the Old Country. The day's festivities were crowned with a déjeuner, given by Messrs. George Holmes and Edward Richardson [now Hon. E. Richardson, C.M.G.], the enterprising contractors, to which more than five hundred invited guests sat down. The sturdy Maoris, too, who had laboured as ‘navvies,’ were not forgotten, but were regaled by their employers in good old English style.” The completion of the line to Lyttelton, which was opened on the 9th November, 1867, and the successful accomplishment of the great work of piercing the tunnel, a mile and a half in length, through the dividing-range, was also hailed with great rejoicing. Pending the completion of this work, other lines were being proceeded with inland towards the Canterbury Plains, and other provinces were not slow to follow the example of Canterbury.
In 1863 the Provincial Council of Auckland put in hand the construction of a line between Auckland and Drury, with a branch to Onehunga; and it is interesting to note that this railway was projected in view of the ultimate establishment of a main trunk line to Wellington, although the immediate necessity which gave rise to it appears to have been the want of military transport to the seat of war in the Waikato. Fighting was suspended, however, and the railway was not finished for some years later, after undergoing many vicissitudes. In the same year an Act was passed to authorise the construction of the Bluff Harbour and Invercargill Railway by the Provincial Council of Southland, and this line was finished and opened for traffic on the 5th February, 1867. This line was, at a later date, extended inland to Winton, and many odd stories are told of the primitive style of travelling on this portion, which was little better than a broad-gauge wooden tramway.
Meantime the Province of Marlborough had been making strenuous efforts to obtain railway communication between Picton and the Wairau district; and eventually an Act was passed, in 1865, authorising its promotion by a company, but the undertaking lapsed, and was not revived until the public-works policy was proceeded with.
In view of the probable extension of railway enterprise, the question of what should be the proper gauge for lines constructed in the colony had not been lost sight of; for, as early as 1860, the Government were asked, in connection with the Lyttelton-Christchurch line, then under construction, what steps had been taken to ascertain this important particular. The reply was that, on the recommendation of the late Robert Stephenson, the 5ft. 6in. gauge had been adopted as best suited to the circumstances of the colony. The gauge of 5ft. 3in., known as the Irish gauge, was, however, afterwards approved for the Canterbury lines; and this decision must have been further modified later, for we find that the Auckland-Drury, Dunedin-Clutha, Nelson-Foxhill, and others were originally laid out on the standard English gauge of 4ft. 8 1/2in. Had the construction of railways proceeded piecemeal by the provinces in the fashion it commenced, no doubt the inconvenience and expense now being experienced in Australia would have found their counterparts in this colony; but the inauguration of the public-works policy finally settled the question as far as New Zealand is concerned.
Up to 1870 there were in operation 46 miles of railway only. In that year, when the colony was feeling the disheartening effects of the Native war, which had just then come to an end, the Colonial Treasurer, Mr. (now Sir Julius) Vogel, promulgated his famous public-works policy, under which some ten millions of pounds were borrowed from the British capitalist and expended in the encouragement of immigration, the construction of railways and roads in all parts of the colony, the extension of telegraphic communication, the supply of water to the goldfields, and the purchase of Native lands. Provision having been made by Parliament for the necessary borrowing powers and administration, the Railways Act of 1870 authorised certain lines to be constructed on specified terms, and surveys of others to be made, for consideration by the General Assembly. Of these lines the extension in Canterbury was proceeded with vigorously out of provincial funds. Some of the others had been authorised to be constructed on terms involving a guarantee by the colony of 5 1/2 per cent, interest; the latter were held over, pending negotiations with English capitalists; and, finally, arrangements were made on modified, terms with Messrs. Brogden and Sons, the well-known English railway contractors, for the construction of several sections of light narrow-gauge lines, which were designed with a view to the early production of revenue, and at some sacrifice of convenience in travelling and in working. Severe gradients were adopted in preference to expending large sums for flatter lines; and, similarly, curves of sharp radius were allowed in place of easier but more costly routes.
Unfortunately, the inception of the scheme gave rise to so many demands from all parts of the country that considerable variations had to be made in the original proposals of the author, with the result that railway accommodation has in some parts been provided in advance of actual requirements, thus reducing the productiveness of the system as a whole.
The increase of population and the growing settlement of the country has also rendered necessary considerable alterations in the original character of the lines and their equipments, and, in order to keep up with popular demands and increased traffic, continual improvement is going on in the more advanced districts.
In 1876, the abolition of the provinces placed the earlier-constructed railways in the hands of the General Government, and the gauge of the line in Canterbury was assimilated to that of the Government system, now rapidly extending. At the present time the gauge all over the colony is 3ft. 6in., and, although the greater part of the permanent-way was originally laid in 40lb. material, the increase of traffic has since compelled its renewal in heavier metals, and a uniform weight of 53lb. steel-rail is now nearly always used in this process.
There are now open for traffic 1,869 miles of railway, the construction of which has cost about £7,842 per mile. This includes the expenditure on the Provincial Government lines, and the purchase-money paid for district railways built by local syndicates and taken over by the Government, also the cost of rolling-stock and equipments. There are in addition 130 miles of private railway in the colony, the principal of which is the Wellington-Manawatu Railway, connecting the capital with the main trunk line through the North island. The lines under construction by the New Zealand Midland Company, incorporated for the purpose of connecting the east and west coasts of the Middle Island and Nelson, will, when that purpose is accomplished, form no inconsiderable portion of the colonial system.
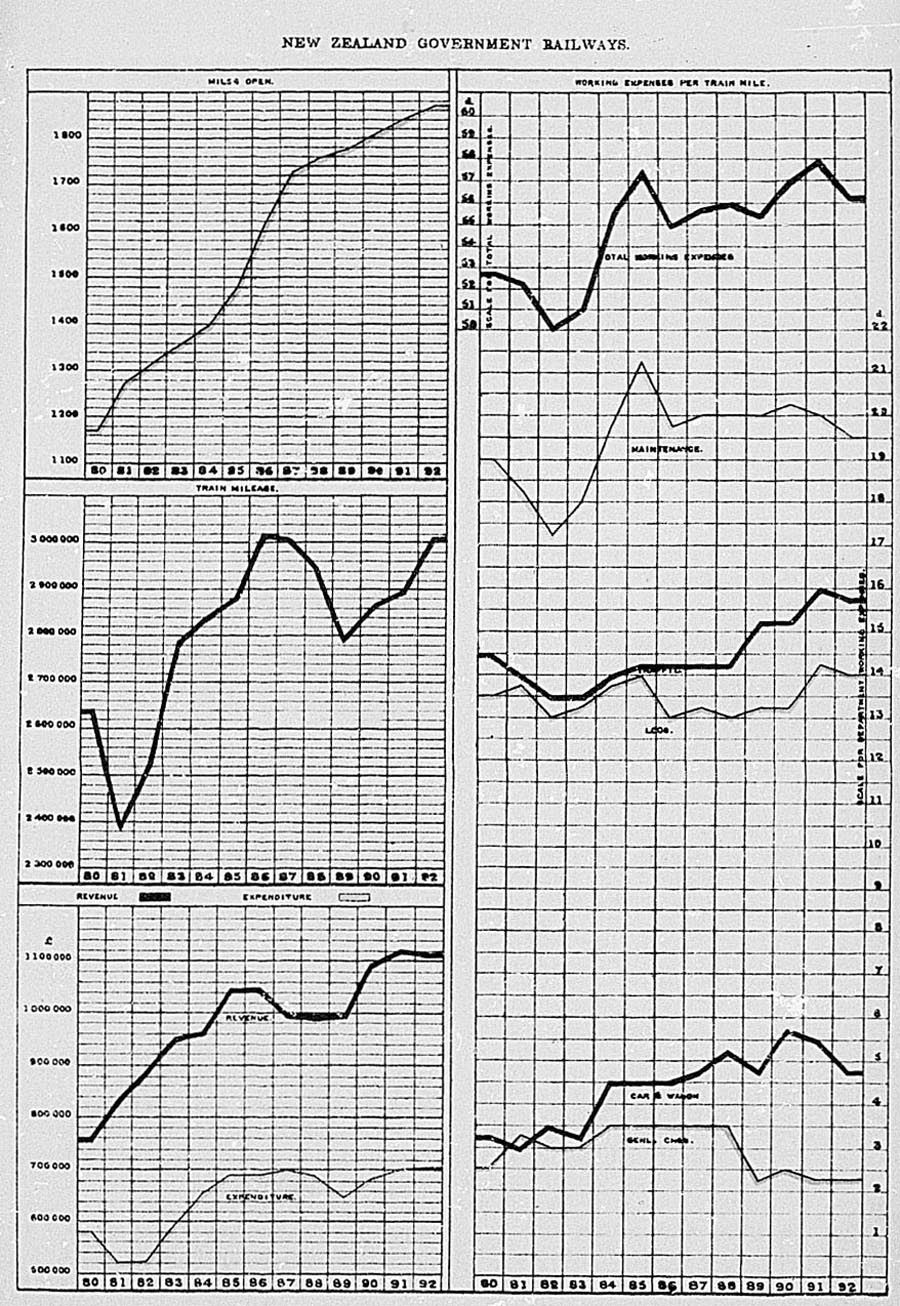
In spite of many peculiar disadvantages, due chiefly to the physical configuration of the country, the New Zealand railways have realised profits nearly sufficient to cover the total interest payable on the cost of construction—a result which may be considered satisfactory when it is remembered that they were not constructed with that expectation. The average rate of interest earned for the past twelve years is about 3 per cent. This is sufficiently accounted for by the large mileage of railway in proportion to the population, the location of the population along the coast-line mainly, the active competition of water-carriage against the railways at many points, the very short distances over which traffic can be carried, the importation by sea of the great proportion of mercantile products which are used by the population, the extension of the railways inland to mountainous and pastoral districts almost devoid of population, which together form a combination of circumstances adverse to the railway-system such as probably has no parallel in any other country. The imposition of rates for carriage has also to be largely guided by the peculiar circumstances attending colonial settlement.
The whole railway-system of the colony is at present divided into ten sections, all varying in their characteristics. The Kawakawa and Whangarei Sections, in the extreme north, are short lines, built to coalfields chiefly, but in course of time will no doubt be extended to tap large timber-areas further inland. The Auckland Section forms the northern portion of the North Island Main Trunk Railway, terminating eventually at Wellington, on the shores of Cook Strait, and traversing in its course rich forests of valuable timber and a large area of rich country. By means of its branches, also, the marvellous regions of the Thermal-springs District are brought within easy reach of the traveller for health and excitement. The Napier (114 miles), Taranaki (214 miles), Wellington (91 miles) group of lines serve the southern portion of the North Island, and are well supplied with traffic arising from the frozen-meat industry and timber trade, besides live-stock, and general traffic incidental to the rapid growth of settlement in the grand pastoral country through which the lines run.
In the northern portion of the Middle Island the character of the country has prevented little more than the first link in the chain of through communication being accomplished. On the West Coast, however, the lines and harbour-works constructed for the purpose of developing the vast mineral wealth of that region have been highly successful, and rank among the best-paying portions of the system. During last year 159,000 tons of coal and coke were carried over the Greymouth Section, and 200,000 tons over the Westport line. In connection with the latter, the Westport Coal Company's incline, between the mine and the railway, deserves special reference as a peculiar and almost unique specimen of engineering work.
It is on the East Coast, however, that the actual working portion of the main trunk line is to be found. The present terminus is Culverden, from whence extension will be made northward. From Culverden to Amberley the country is but sparsely settled; but beyond that point to Christchurch there are numerous small farms and holdings. Around Christchurch in various directions are branch lines, serving districts of more or less importance. The main line proceeds south across the extensive Canterbury Plains, touching at Rakaia, Ashburton, and Timaru, all centres of large agricultural and pastoral districts. Near Oamaru the character of the country changes to undulating limestone-downs of great fertility and particularly well adapted for the growth of wheat. Approaching Dunedin the line has to pass through some hilly country, involving some heavy cuttings and tunnelling. Between Christchurch and Dunedin a daily express-train is run, doing the distance —230 miles—in nine hours and three-quarters.
In the country south and on to Invercargill and the Bluff, the southernmost port in the colony, and, indeed, all along the line from Christchurch, evidences may be seen on every side of industrial enterprise in the shape of meat-preserving and freezing works, chemical manufactories, dairy factories, coal-mines, sawmills, and timber dépôts, all of which assist in the production of traffic, the development of which is generally regarded as an indication of the colony's progress. Large supplies of brown coal are drawn from the mines in the Canterbury and Otago Districts, and are used for locomotive purposes, in addition to meeting the local requirement for home consumption.
The management of the New Zealand State railways was placed by Parliament a few years ago in the hands of three Commissioners, and freed from political control. The respective sections are under the control of local District Officers, representing the traffic, loco motive, and maintenance branches, except on the smaller lines, where one officer combines the three charges. At head-quarters the two latter branches are controlled by a Locomotive Superintendent and a Chief Engineer respectively, the traffic branch being directly under the supervision of the Commissioners. The total number of men employed in all ranks is about 4,900.
There are workshops at all the large centres, the principal one being as Addington, near Christchurch, at which for many years the building of rolling-stock and more recently the construction of locomotives, has been successfully carried on.
Prior to 1872, when operations under the public-works policy commenced, there were only 65 miles open for traffic. On the 31st March, 1892, twenty years later, there were 1,869, producing a gross annual revenue of £1,115,432; the net revenue being £408,914, equal to a dividend of £2 15s. 9d. per cent, on the total cost of all opened lines to same date.
Nearly all the stations are connected by telegraph or telephone, and at many of them the combined duties of a post- and telegraph-office are carried on. As regards signalling, the lines are practically all single-track, and do not require elaborate arrangements in that respect. On portions where extra precaution is necessary, the “Winter” block system is in operation. The “Vacuum” automatic brake is in use in some parts.
The working expenses of the lines for the year ending the 31st March, 1892, amounted to £706,517, absorbing 63·34 per cent. of the receipts; but, as the cost of improvement in renewing rails, in reconstructing rolling-stock and more permanent structures is borne by working-expenses, they are thus made to appear heavier than they otherwise would do.
The gradual but steady growth of the business of the railways is illustrated by tire following table, taken from the latest annual report of the Commissioners:—
| COMPARISON OF TRAFFIC, REVENUE, AND EXPENDITURE FOR THE LAST THIRTEEN FINANCIAL YEARS. | |||||||||
|---|---|---|---|---|---|---|---|---|---|
| Year. | Miles. | Revenue. | Expenditure. | Expenditure per Cent. of Revenue. | Tonnage. | Parcels, Horses, and Dogs. | Cattle, Sheep, and Pigs. | Passengers. | Season tickets. |
| £ | £ | No. | No. | No. | No. | ||||
| 1879-80 | 1,172 | 762,573 | 580,010 | 76·06 | 1,108,108 | 180,331 | 285,209 | 2,967,090 | 5,077 |
| 1880-81 | 1,277 | 836,454 | 521,957 | 62·40 | 1,377,783 | 286,865 | 300,704 | 2,849,561 | 6,499 |
| 1881-82 | 1,319 | 892,026 | 523,099 | 58·04 | 1,437,714 | 316,611 | 343,751 | 2,911,477 | 7,207 |
| 1882-83 | 1,358 | 953,347 | 592,821 | 62·18 | 1,564,793 | 341,186 | 477,075 | 83,378 | 8,621 |
| 1883-84 | 1,396 | 961,304 | 655,990 | 68·24 | 1,700,040 | 359,896 | 686,287 | 3,272,644 | 9,036 |
| 1884-85 | 1,477 | 1,045,712 | 690,026 | 65·99 | 1,749,856 | 347,425 | 729,528 | 3,232,886 | 8,999 |
| 1885-86 | 1,613 | 1,047,419 | 690,340 | 65·91 | 1,823,767 | 349,428 | 858,662 | 3,362,266 | 10,717 |
| 1886-87 | 1,727 | 998,768 | 699,072 | 69·99 | 1,747,754 | 372,397 | 942,017 | 3,426,403 | 11,821 |
| 1887-88 | 1,758 | 994,843 | 687,328 | 69·09 | 1,735,762 | 399,109 | 940,209 | 3,451,850 | 11,518 |
| 1888-89 | 1,777 | 997,615 | 647,045 | 64·86 | 1,920,431 | 399,056 | 919,392 | 3,132,803 | 11,817 |
| 1889-90 | 1,809 | 1,095,570 | 682,787 | 62·32 | 2,073,955 | 405,838 | 1,068,575 | 3,376,459 | 12,311 |
| 1890-91 | 1,842 | 1,121,701 | 700,703 | 62·47 | 2,086,011 | 413,074 | 1,348,364 | 3,433,629 | 13,831 |
| 1891-92 | 1,869 | 1,115,432 | 706,517 | 63·34 | 2,066,791 | 430,216 | 1,153,501 | 3,555,764 | 16,341 |
For the past year the tonnage of the principal products of the colony carried over the railways was Wool, 85,888 tons; timber and firewood, 258,355 tons; grain, 44 ......................, 873,898 tons.
The receipts from passengers were £364,617, including season-tickets, £22,054.
The average revenue per was £597 17s. 8d., and the average expenditure £378 14s., equal to 7s. 4 3/4d. and 4s. 8 1/3d. per train-mile respectively.
The total number of miles travelled by trains was 3,010,489; and the statement below shows the traffic ton-mileage, and rate of working for the five chief sections of the system for three years:—
| Section. | 1839-90. | 1890-91. | 1891-92. | |||
|---|---|---|---|---|---|---|
| Ton-mileage. | d. | Ton-mileage. | d. | Ton-mileage. | d | |
| Auckland | 8,177,770 | 2·16 | 9,228,869 | 1·85 | 9,899,396 | 1·76 |
| Napier-Taranaki | 9,517,532 | 2·33 | 10,093,156 | 2·51 | 11,710,544 | 2·15 |
| Wellington | 4,516,965 | 2·42 | 5,063,457 | 2·35 | 5,632,828 | 2·11 |
| Hurunui-Bluff | 46,789,728 | 2·07 | 53,350,677 | 1·93 | 50,106,636 | 2·00 |
| Totals | 69,001,995 | 2·14 | 77,736,159 | 2·02 | 77,349,404 | 2·00 |
The cost of maintenance per mile for last year (1891-92) was £131 3s. 6d. being the lowest rate yet reached.
There are 266 locomotives in use on all lines, of various classes, ranging from the light shunting-engine of 11 tons weight to the larger goods-engines of English and American type, 54 tons in weight. There are also in use several locomotives built in the colony, the principal being those recently constructed in the Addington workshops, and specially designed by the local officers for working over heavy grades at moderate speeds.
Of carriages, first class, second class, and composite, there are 490, including several saloon cars of a special design for express and tourist traffic. There are 8,257 wagons in use, a number of these being specially constructed to serve the frozen-meat industry, winch forms so large a proportion of the traffic in some districts.
The passenger fares on the New Zealand railways are generally at the rate of 2 1/2d. per mile first class, and 1 2/3d. per mile second class; the return fare being calculated at one-third increase on these rates. For suburban and local traffic, however, the rates are much lower; in some cases of commutation tickets being as low as 7/8d. first class, and 1/2d. second class, per mile; while excursion and tourist traffic is encouraged by greatly reduced fares during the season for such business.
Compared with the Australian Colonies, which are better circumstanced as regards the absence of competition, and a larger population, especially in suburban areas, the New Zealand railways may be said to fairly hold their own. A table is attached which compares the principal points of interest in the working of the chief colonial lines:—
| COMPARATIVE STATEMENT OF THE MILEAGE OPEN, CAPITAL EXPENDED, EXPENSES, ETC., OF RAILWAYS IN QUEENSLAND, NEW SOUTH WALES, VICTORIA, SOUTH AUSTRALIA, AND NEW ZEALAND. | |||||||||||||
|---|---|---|---|---|---|---|---|---|---|---|---|---|---|
| Railways. | Miles open. | Population (approximately). | Miles of Line open for every 1,000 of Population. | Capital Cost. | Cost per Mile open. | Train-miles. | Gross Earnings. | Earnings per Train-mile. | Working-expenses. | Working-expenses per Train-mile. | Percentage of Net Earnings to Cost. | Percentage of Expenses to Revenue. | Year ending |
| £ | £ | £ | d. | £ | d. | ||||||||
| Queensland | 2,195 | 394,000 | 5·57 | 15,101,617 | 6,880 | 3,770,977 | 908,704 | 57·83 | 645,597 | 41·09 | 1·74 | 71·05 | 30/6/91 |
| New South Wales | 2,182 | 1,160,000 | 1·88 | 31,768,617 | 14,559 | 8,410,421 | 2,974,421 | 84·88 | 1,831,371 | 52·26 | 3·60 | 61·57 | 30/6/91 |
| Victoria | 2,763 | 1,148,000 | 2·40 | 35,518,871 | 13,153 | 12,249,747 | 3,298,567 | 64·63 | 2,310,645 | 45·27 | 2·78 | 70·05 | 30/6/91 |
| South Australia | 1,666 | 320,000 | 5·26 | 11,398,839 | 6,842 | 3,769,225 | 1,223,999 | 77·94 | 617,179 | 39·30 | 5·32 | 50·42 | 30/6/91 |
| New Zealand | 1,869 | 863,500 | 2·79 | 14,656,691 | 7,842 | 3,010,489 | 1,115,432 | 88·92 | 706,517 | 56·32 | 2·79 | 63·34 | 31/3/92 |
The question of results cannot, however, be decided by a glance at such figures alone. There are many factors to be taken into consideration when judging of the benefits gained by the country through the construction of its railways. The advancement of settlement, the opening up new country and increasing its productiveness, the provision of employment for large numbers, the cheapening of transit both for goods and passengers, and many other items, must all be reckoned as value obtained for the expenditure, in addition to the mere monetary returns; and, if this is done, the net gain to the colony due to the public-works policy must be generally admitted.
Table of Contents
- NORTH ISLAND
- AUCKLAND HARBOUR
- THAMES HARBOUR
- WAIHAU (COROMANDEL) HARBOUR
- MERCURY BAY
- TAURANGA HARBOUR
- TOLAGO BAY
- TURANGA (POVERTY BAY)
- NAPIER (OR AHURIRI) HARBOUR
- WELLINGTON (PORT NICHOLSON) HARBOUR
- WANGANUI RIVER
- PATEA HARBOUR
- NEW PLYMOUTH
- WAITARA RIVER
- KAWHIA HARBOUR
- MANUKAU HARBOUR
- KAIPARA HARBOUR
- MANGONUI HARBOUR
- WHANGAROA HARBOUR AND BAY
- BAY OF ISLANDS
- KORORAREKA BAY (PORT RUSSELL)
- WHANGAREI HARBOUR
- KAWAU BAY
- MIDDLE ISLAND.
- PORT LYTTELTON
- AKAROA HARBOUR
- PORT TIMARU (PATITI POINT).
- OAMARU HARBOUR,
- OTAGO HARBOUR
- BLUFF HARBOUR
- NEW RIVER HARBOUR, INVERCARGILL
- RIVERTON, JACOB'S RIVER
- THE WEST COAST SOUNDS
- HOKITIKA RIVER
- GREY RIVER
- BULLER RIVER (KAWATIRI), WESTPORT
- MOKIHINUI RIVER
- NELSON HAVEN
- PELORUS SOUND
- QUEEN CHARLOTTE SOUND
- PORT UNDERWOOD
- WAIRAU RIVER
- STEWART ISLAND.
[Inserted for general information, but not for navigation purposes.]
Harbour Boards are constituted under special Acts of Parliament to regulate the management of harbours and to make provision for matters connected therewith. The Boards are elective, or partly elective and partly nominated by the Government; they can impose wharfage dues and other charges on shipping. There are at the present time twenty-one Harbour Boards in the colony, each having special local laws in force. Ports where there are no Harbour Boards are under direct control of Government.
The following are the principal harbours and rivers, with the depth of water at entrance and at anchorage, also the berthage-accommodation and depth of water at quayage, taken from “The New Zealand Pilot, 1891,” and other official sources:—
The least depth of water to be passed over in entering the Auckland Harbour by the channel westward of Rangitoto Island is 5 1/4 fathoms at low water. By the channel southward of Rangitoto the least depth is 15ft. at low water, north-eastward of Bean Rock. There is good anchorage in 4 to 8 fathoms, 4 to 5 cables' length off the city.
There are extensive wharves in this harbour, with commodious goods-sheds—one, recently erected, having storage for about 8,000 tons—quaying, &c., giving in all 9,000ft. of berthage for shipping, of which 3,700ft. has a depth alongside of from 18ft. to 25ft. at low-water ordinary springs. The wharves are Hobson Street Wharf, Queen Street Wharf, ferry jetties, and Railway Wharf. The outer western tee of Queen Street Wharf was completed in June, 1891, and is now 431ft. long by 96ft. 4in. wide, and is capable of accommodating any of the large ocean-going steamers. A boat-harbour, 110ft. by 102ft., has lately been formed at the south-west corner of the approach to Queen Street Wharf.
There are six cranes on the main wharves, having power to lift from 3 to 15 tons each.
The former townships of Grahamstown, Shortland, and Tararu are now amalgamated in the town of Thames, situated 2 miles south-eastward of Tararu Point, on the right bank of the entrance to Kauaeranga River. The goods wharf, at the northern end of the town, is about 1,400ft. in length, and has from 9ft. to 10ft. of water alongside at high-water springs. Shortland wharf is 1 mile southeastward of the goods wharf, on the eastern side of the mouth of the Kauaeranga River. Vessels drawing 5ft. to 6ft. can load alongside this wharf in smooth water. The river in the upper reaches has been cleared, and rendered navigable for light-draught steam-vessels for a distance of about 80 miles from its mouth.
The depth of water on the bar at 4 miles distance from the river-mouth, and in the channel, is 16ft. at high-water springs, and 13 1/2ft. 6in. at neaps; at low water there is only 4ft. 6in. on the bar. The berthing space amounts to 1,060ft., viz., at the goods wharf, 500ft.; Shortland wharf, 400ft.; Kopu wharf, 40ft.; Kirikiri, 40ft.; Turu, 40ft. The three last-named are timber jetties, with a berth at the end. There is a solid training-wall and road 1,500ft. long. Vessels of 500 tons can be berthed at the river wharves.
This harbour is 1 mile wide at the entrances, and carries a depth of upwards of 5 fathoms for nearly 1 mile inside. There is a wharf at the head of McGregor Bay with 9ft. to 10ft. alongside it at high-water ordinary springs.
Tins large inlet, 30 miles south-east of Cape Colville, is 5 miles wide at its entrance, and is the seat of a considerable timber trade. The least depth to be passed over by vessels proceeding to the anchorage in Mangrove River, just within the Heads, is 2 1/4 fathoms at low water.
This is the only harbour on the East Coast between Mercury Bay and Port Nicholson that affords shelter in all winds for vessels of burthen. The least depth to be passed over by a vessel proceeding to the anchorage under Maunganui, or off Maketu Mound, is about 21ft. at low water, and 27ft. at high water.
There are two wharves, with berthage for vessels drawing 16ft. and 12ft. respectively. To approach the wharves the least depth is 9ft. at low water and 15ft. at high water.
Within the south head of Tolago Bay is the cove where Captain Cook watered, and beyond is to be seen the remarkable arch in the cliffs which he has described. Several initials are cut on the rock where the artificial well exists, made by his crew.
Is 5 miles in breadth from head to head, and nearly 4 miles in depth. There are two small rivers, in the bay—Turanganui and Waipaoa. The first named is celebrated as the place where Captain Cook first landed in New Zealand. From the untoward circumstances attending his landing and unsuccessful attempts to obtain provisions, he named the bay “Poverty.” The Town of Gisborne is situated on the right hank of the Turanganui River, near the entrance Harbour-works are in course of construction. The extent of works actually constructed comprise a timber wharf and viaduct, 1,580ft. long; sea-mole, 1,100ft. (out of 1,900ft. proposed); and a training-wall in lieu of a groin en the west beach (only partly completed), 530ft. The depth of water in the river varies from 3ft. 9in. to 8ft. 6in. The present (June, 1892) berthage at Haiti Wharf is 100ft., and at the timber-wharf, on the west side of Turanganui River, 250ft.
This port is the only harbour deserving the name between Tauranga and Port Nicholson. The entrance is narrow, but inside it expands into a large sheet of water. The depth at entrance at ordinary high-water springs is 14ft., and at low water lift. The length of quayage is 1,800ft. The depth of water at the wharves is similar to the depths at the entrance under the same conditions. There is one crane capable of lifting 15 tons, and good anchorage will be found in the roadstead, where vessels can load and discharge by lighters. A breakwater is in course of construction, at which the largest vessels visiting the colony will be able to lie.
This is an excellent and spacious harbour. The least depth to be passed over by vessels entering Port Nicholson is about 6 1/2 fathoms at low water, in the fairway about 1 mile southeastward of Gordon Point. Chaffer's Passage, to the westward of Barret Reef, is 3 cables wide, with depths of from 7 to 10 fathoms, but is seldom used. The main entrance has a clear breadth of not less than 6 cables for a distance of 1 1/2 miles.
The Queen's Wharf, at Lambton Harbour, has 24ft. and 30ft. depths at the outer berths. The outer cross-head of the wharf is 660ft. long. There is ample storage-accommodation at each berth. There are 6,850ft. of berthage, having from 12ft. to 30ft. at low water.
In addition, to the above berthage of 6,850ft. in the aggregate at Queen's, Jervois, and the Railway Wharves, four wool-jetties, and the timber breastwork (of 160ft.), there are 1,200ft. lineal of breastwork-berths, having depths of from 5ft. to 6ft. at low water, available for small coastal craft.
The Board has erected a complete and elaborate system of hydraulic plant, comprising a 10-ton fixed crane, having a variable rake up to 32ft., so as to command the hatchways of the largest ocean liners; it is fixed at the outer tee of the Queen's Wharf, where there is a depth at low water of 27ft. There are five fixed double-powered 2-ton cranes on the wharf for handling cargo, and twelve portable double-powered 2-ton cranes, having variable rakes up to 32ft., to work cargo from ocean-steamers and sailing-ships. There are also movable winches for working cargo by means of tackle from ships' yard-arms or derricks, together with sundry smaller hydraulic plant in the sheds and stores. There is also on Jervois Quay a 40-ton derrick crane, the depth of water alongside being 20ft.
There are seven hydraulic pumping-presses for wool and flax; also hydraulic appliances in wharf-sheds, to facilitate handling of cargo.
The Railway Wharf and wool-jetties, on the north-west side of Lambton Harbour, are distant 750ft. from the Queen's Wharf.
Entrance lies in the depth of the great bight between Cape Terawhiti and Cape Egmont, and about an equal distance from both. The depth on the bar is 3ft. to 6ft, at low-water springs, and 9ft. to 12ft. at high water. Vessels drawing 10ft. can load at the town wharf; vessels over 10ft. draught load at the lower anchorage, 2 miles from the town. The harbour extends from the mouth of the river 20 miles inland. The depth of water varies at high- and low-water springs from 13ft. to 10ft. There are two wharves—railway and cattle—aggregating 1,800ft. berthage. The breakwater in course of construction has reached a length of 900ft. from the North Head. Power of Government cranes, 5 tons.
The bar of this river has shifted very little since the harbour-works have been in progress. It has a depth of 10ft. to 13ft. at high-water springs. A rubble and concrete breakwater, 955ft. long and 20ft. wide, has been constructed to keep the channel over the bar straight. The width from the breakwater to the North Spit is 139ft., the depth of water at end of breakwater 23ft., and along it 17ft. The depth of water in the harbour varies from 2ft. to 6ft., and in the river channel from 6ft. to 15ft., according to tide. There are two wharves—Railway Wharf, 550ft. and Town Wharf, 100ft.; the berthing-space being 650ft., at which vessels from 70 to 100 tons burthen, and drawing not more than 10ft. to 12ft., can be accommodated.
This port and roadstead is 18 miles north-eastward of Cape Egmont. A breakwater has been constructed from a point nearly half a mile north-eastward of the main Sugarloaf. Its present extent is 1,950ft., in a N.E. by N. 1/2 N. direction. There is a wharf close south-eastward of the breakwater, with berthage 400ft. in length on each side, which is connected with New Plymouth by-railway, and has a depth of 12ft. at low water at its outer end, and 8ft. at its inner end.
This river is 10 miles north-eastward of New Plymouth. It is navigable as far as the Railway Wharf, where a bridge crosses, a distance of about three-quarters of a mile from the bar. Length of Railway Quay, 442ft.; depth at quay side at ordinary spring-tides, high water, 10ft.; low water, 7ft. There is a bar at the entrance to the port, with 12ft. of water at high-water ordinary spring-tides and 9ft. at neap-tides. Two cranes, to lift from 2 to 5 tons each, are situated at the Railway Quay. There are two cattle-wharves, which-can only be reached by vessels drawing 9ft. or less, and which have 10ft. and 12ft. respectively at high water, and 5ft. and 7ft. at low water. Two training-walls have been constructed to improve the channel. The south-west training-wall is 1,254ft. long, and the north-east training-wall about 700ft. Besides the foregoing there is an open roadstead at the port.
This harbour is the most considerable inlet on the west coast south of Manukau Harbour. The south channel is the only one used, being nearly 2 cables wide, with 17ft. in it at low water; the northern has nearly (1890) closed. When within, and the flats are covered, the harbour presents a considerable expanse of water, 6 miles in length by 4 miles in width. The channel, which for the first mile is between sandbanks, is little more than a cable wide, with 4 and 5 fathoms; the banks have only 2ft. or 3ft. on them, and are distinguished by the stream.
This extensive inlet, immediately opposite to Auckland Harbour, from which it is separated by an isthmus at its narrowest part of about 6 or 7 miles, and affording water-communication within a short distance of the city, is of considerable importance, as by its means Auckland enjoys rapid communication with Taranaki, Wellington, Nelson, and all the ports on the western coast. The bar of the main channel, a quarter of a mile in breadth, had, in 1890, a least depth in the channel of 21ft. at low-water springs. This channel is, however, seldom used. In the same year there was a depth of 5 fathoms in the south channel, abreast of Heron Spit, gradually shoaling to 2 1/4 fathoms between the inner shoals. Onehunga, the port of entry, is about 6 miles from Auckland, and is connected by an excellent road, and also a railway.
Kaipara Harbour, 40 miles north of Manukau Harbour, is one of the most extensive inlets in New Zealand. The entrance to it, as is the case with all the ports on the west coast of this Island, is attended with difficulties, but, when once within, there is perfect security for any number of vessels of the largest size. There is an extent of 700 miles of water-frontage inside.
Five miles within the heads three large rivers branch off in different directions, winding through land abounding with the kauri and other valuable timber. These rivers are navigable for many miles for vessels of moderate tonnage. The Kaipara itself, the southern branch, flows through a valley formed by the hills which bound the coast between Kaipara and Manukau Harbours, and is only separated from an inlet of Auckland Harbour by a distance of about 3 miles.
In December, 1890, the least depth on the line of the leading beacons of Kaipara bar was 5 fathoms at low water. Inside the bar a depth of 6 to 9 fathoms is maintained for 1 3/4 miles, when the water gradually deepens, the channel narrowing to three-quarters of a mile.
At Helensville, the depth alongside the Kauri Timber Company's wharf is 9ft. at low water, 5ft. alongside West Brothers', and 4ft. at Douglas Brothers'.
At Te Kopuru, the depth alongside the Kauri Timber Company's wharf is 4ft. to 12ft. at low water; and alongside the same company's wharf at Aratapu the depth is 2ft. to 6ft.
At Dargaville, vessels load alongside the Railway Wharf, where there is a depth of lift, at low water and 22ft. at high water. The railway has been constructed from Dargaville up the Kaihu Valley, to assist the kauri-timber trade.
Is in the south-east corner of Doubtless Bay, distant from Flathead Islet nearly 5 miles. It is 1 1/2 cables wide at the entrance. The depth in the fairway between the heads at low water is 4 fathoms.
The average width of the main branch of this harbour is about one-third of a mile. The most convenient anchorage is in Kaouou Bay, on the western side of the harbour, immediately inside the entrance.
This extensive bay or gulf is comprised between Capes Wiwiki and Brett, is nearly 10 miles wide at its entrance, and is deep enough to take the largest vessels afloat; a peninsula, 3 miles in length, may be said to divide it into two distinct portions. On the western side of the peninsula just mentioned is Kororareka (Port Russell), the principal and best-known anchorage. In the eastern portion of the bay are the numerous islands from which its name is derived.
There is no bar or shallow to be crossed in the Bay of Islands by vessels proceeding to Port Russell, the water shoaling gradually from the entrance to the anchorage. The water-area is about square miles. The depth of water at the outer end of the Government Wharf at low-water springs is 19ft.; length of quayage, 300ft.; the depth alongside at ordinary springs is at high water 21 1/2ft., and low water 15 1/2ft. There is one hand ballast-crane, capable of discharging 7 tons per hour, and other cranes to lift from 1 to 2 tons. In going to Opua coaling-wharf the least depth is about 22ft. at low water and 31ft. at high-water springs. The length of the Government Wharf is 450ft.; the depth alongside at ordinary springs is, at high water 24ft., low water 18ft. There are three steam ballast-cranes, capable of discharging 50 tons per hour.
The least depth to be passed over by vessels proceeding to either Passage Island or Single-tree Point anchorages is 4 1/4 fathoms at low water and 5 1/2 fathoms at high water. There is a railway-wharf, which can be reached by vessels 14ft. draught at high-water springs.
Formerly known as Port Cooper, the principal port for the Canterbury District, lies on the north-west side of Banks Peninsula. The entrance is 1 mile wide. The Town of Lyttelton is situated on the north shore, within the inner harbour, four miles from the heads. Since the beginning of 1877 extensive improvements have been in progress. A secure inner harbour has been formed by the construction of moles of rubble, faced seaward with blocks of stone, extending from Officer and Naval Points. The eastern, or Officer Point, breakwater is 2,010ft. in length, 40ft. wide on top, and is 6ft. above high-water spring-tide. The western, or Naval Point, breakwater, is 1,400fb. in length. The entrance between the mole-heads is 650ft. wide. The space of water thus enclosed is about 107 acres, with sets of Mitchell's patent screw moorings laid down for vessels up to 2,000 tons. The present depth of water inside the breakwaters and at the wharves varies from 20ft. at low-water to 31 1/2ft. at high-water springs. Vessels drawing 25ft. may be berthed inside the moles almost at any time of tide, and there is accommodation for vessels up to 5,000 tons at several of the wharves. The ocean-steamer (No. 7) jetty is upwards of 1,017ft. in length, and affords berthage for the largest vessels visiting Lyttelton; two other jetties have a depth alongside of about 25ft. at low water. The Gladstone Pier is 1,810ft. in length. There are timber breastworks from this pier extending westward to No. 7 jetty, 2,531ft. Including the above, the extent of wharfage in this harbour is 10,041ft., which is capable of very considerable extension. The wharves are all connected by and with the railway, and have extensive storage-accommodation.
* Kawan Island was for many years and, till recently, the private property and residence of Sir George Grey, K.C.B., M.H.R., twice a Governor of New Zealand. During his residence here he stocked the island with cattle, sheep, deer, kangaroos, and various sorts of birds. Every rare plant that will live at Madeira flourishes at Kawau, the climate of which island is similar to that of St. Michael's, in the Azores.
Lyttelton is the port of Christchurch (distant 7 miles), the chief town of the Provincial District of Canterbury, and the outlet of the rich agricultural and pastoral district of the Canterbury Plains.
Penetrates Banks Peninsula in a northerly direction more than 8 miles, its inner part approaching within 4 miles of the head of Pigeon Bay. It is a magnificent port, affording secure and landlocked anchorage to any number of vessels, and is easy of access. The harbour - entrance is nearly 1 mile in breadth, increasing to a mile and a quarter, which it carries to the anchorage in Pakaeriki Bay, on the eastern shore, nearly 6 miles from the heads, where there is excellent anchorage in 4 fathoms at low water, little more than half a mile off the town.
At the extreme end of the Ninety-Mile Beach is a rocky projection, on the northern part of which is the Township of Timaru, the site formerly of an old whaling-station, but now a port of considerable importance for the southern part of the Canterbury District. The breakwater — constructed for the formation of the harbour— commences upwards of 1 cable eastward of the lighthouse, and runs out N.E. by N. 1,250ft., thence curving to the northward for a further distance of 1,028ft. making a total length of 2,278ft., exclusive of the shore-end. It is 30ft. wide on the top, and is formed principally of concrete blocks, each weighing 30 tons. A rubble wall—north mole—commences from the shore three-quarters of a mile north-westward of the breakwater shore-end and extends 2,400ft. in an easterly direction to a point 350ft. from the breakwater, and somewhat within its extremity. Latterly, the trade of the port has been entirely carried on under the breakwater, and now the north mole is completed smooth water is assured at all times. Several sets of moorings have been laid down within the breakwater. Dredging is proceeding within the harbour, and the ocean steam-vessels' berth has a depth of 22ft. at low-water springs. The general depth in the harbour is (June, 1892) 20ft. to 26ft. A steam-vessel of 3,720 tons burden was laden here with great rapidity, the wharves being worked by the Railway Department, and having five travelling steam-cranes, their lifting-power being from 2 to 12 tons. The space enclosed has an area of 50 acres. Moody Wharf has berthage-accommodation of 250ft. on each side, with 18ft. at low-water springs: the main wharf, 1,000ft. on one side, with 23ft. at low-water spring-tides.
Formerly, like Timaru, an open roadstead, has been constructed in the first bight northward of Cape Wanbrow, and is the shipping-port of the largest grain-producing district in the Middle Island. The breakwater commences a cable north-westward of the principal lighthouse, and runs in a north-by-west direction 1,850ft.; it is 36ft. wide on the top. A mole, 1,700ft. in length, runs in an easterly direction from the shore, commencing half a mile northwestward of the inner end of the breakwater. The mole and breakwater thus enclose a space 60 acres in extent, forming a safe harbour, with an entrance 600ft. in width, the channel and harbour varying from 17ft. to 28ft. in depth. Four wharves—Macandrew (350ft.), Cross (310ft.), Normanby (507ft.), and Sumpter (743ft.)— have, collectively, berthage of 1,910ft. in length, with 8ft. to 20ft. of water at low spring-tides. The railway is connected with Normanby and Macandrew Wharves, and there are five cranes, varying from 1 1/2 to 5 tons each. Moorings have been laid down in the harbour.
At the entrance to this harbour there is a mole at the North Head 4,100ft. long, projecting in a north-easterly direction from the low sandbank on the western side of the harbour-entrance. Within the entrance a spacious sheet of water extends to the south-westward for a distance of 11 miles, the area being, approximately, 12,750 acres, and at its head stands the City of Dunedin.
The Town of Port Chalmers is at the head of Koputai Bay, about 6 miles above the bar, where there is good anchorage for large vessels in 5 fathoms.
The depth of water in the lower harbour (Port Chalmers) ranges up to 60ft. at low water; and in the upper harbour (Dunedin), to 20ft. at low water; to which 6ft. 6in. has to be added for high-water springs. The bar at the lower harbour is 24ft., and in the new channel 20ft.; the channel to Port Chalmers is 22ft.: all at low water. In Victoria Channel, at the upper harbour, there is 13ft. at low water, to which 6ft. 6in. should be added for high-water springs. In this (upper) harbour there is a half-tide training-wall 5 miles in length. 14,520ft. of walling has been run round the Board's endowment on the foreshore, 4,661ft. of which have been faced with wharves. The berthage at the six wharves at Dunedin aggregates 5,332ft., and at the three piers at Port Chalmers 2,560ft. There are nine cranes in use, ranging from 1 to 10 tons. There is extensive storage accommodation in commodious sheds at Port Chalmers.
Awarua or Bluff Harbour, the first port of call and last of departure of the intercolonial steamers running between Melbourne, Dunedin, Lyttelton, and Wellington, is at high tide an extensive sheet of water, stretching in two arms to the north and east respectively 4 and 5 miles. The available space for anchorage, however, is narrow and confined, and, for vessels of large tonnage, does not extend much above a mile from the entrance. Campbelltown stands at the foot of the Bluff. Entering by the south channel, the least depth to be passed over up to the anchorage is 5 fathoms at low water; entering by the north channel the least depth is 3 1/2 fathoms.
At Campbelltown, on the northern side of the Bluff, is an extensive wharf with a greatest depth of 19ft. alongside at low water. Vessels discharge directly into the railway-trucks. Steam-vessels of moderate size and power can enter or leave Bluff Harbour at all times, irrespective of the tides. Campbelltown is the port of Invercargill, and has large stores for grain, which is shipped in great quantities at this port. There are three wharves, two of 400ft. and one of 800ft. in length.
Oreti (New) River is accessible in moderate weather, at high water, for vessels drawing from 13ft. to 15ft. of water. Training-walls have been built near Invercargill, and dredging operations are in progress between the training-walls, Invercargill, situated on the east side of the river, about 10 miles from the bar, is the principal town of the County of Southland.
The New River Harbour has a depth at low water of 14ft., and at high water of 21ft. The depth of the channel to the upper pool is 18ft. The berthing-space at Invercargill Jetty is 200ft; one crane, to lift 5 tons. There are training-walls of 50 chains on each side of the channel near the jetty, at which vessels drawing 9 1/2ft. may be berthed.
From New River the coast trends in a long sandy beach to the north-west, 15 miles, when it curves round to Howell Point, and forms a shallow bay or bight just within it. In this bight, at 1 1/2 miles north-west of that point, is Riverton Township, at the entrance of Jacob's River, the bar of which is nearly dry at low water; but vessels of 7ft.- or 8ft.-draught can enter at high water. There is an area within the harbour of about 1,500 acres, having a depth of from 12ft. to 4ft. at high- and low-water springs. The depth of the channel varies from 5ft. to 16ft. There is a wharf with 180ft. of berthage, and a jetty of 100ft. The depth of water at the wharves is 12ft., and vessels of 120 tons can be berthed at the wharf.
The only natural harbours along the whole extent of the west coast of the Middle Island—a distance of 500 miles—are those singular and truly remarkable sounds or inlets which penetrate its south-western shores between the parallels of 44° and 46° south latitude. These are thirteen in number. The larger sounds are generally divided into several arms, penetrating the coast in some instances for a distance of 20 miles, with a breadth rarely exceeding a mile, and studded with numerous islets. The smaller sounds generally run in for a distance of from 6 to 8 miles, with a width of about half a mile, and anchorage is seldom to be found except at their inner extremes. The shores, which rise almost perpendicularly from the water's edge, are, in the immediate neighbourhood of the sounds, covered with trees suitable for all proposes, among them the red-pine, which, although -heavier and inferior to the kauri of the North Island, is well adapted for masts; and a vessel requiring spars could procure them of any size, up to a sloop-of-war's lower mast, with little difficulty. The most remarkable feature, common to the whole, is the great depth of water. Soundings can rarely be obtained under 80 or 100 fathoms, and frequently at much greater depths; and the shores within a few yards are quite steep. These sounds form the subject of a separate article.
This river is navigable for vessels up to 10ft. draught for a distance of three-quarters of a mile from the entrance, but the bar is constantly shifting its position and varying in depth.
Two training-walls have been constructed at this port. The north wall has been completed to a length of 2,000ft.; the south wall has been completed to a length of 670ft. This work has been well protected with stone. The depth of water at high-water ordinary springs is 6ft. to 22ft. within the river. The depth of the channel over the bar at high-water ordinary springs varies from 8ft. to 15ft. Spring-tides range from 8ft. to 10ft. The berthing-space at Gibson's Quay amounts to 1,000ft., and the draught of water at the wharf varies from 18ft. to 22ft. at high water.
The Grey or Mawhera River flows through an extensive valley, the river trending from its mouth in an easterly direction, about 15 miles, when it divides.
On account of the extensive deposits of coal being worked in and adjacent to the valley, which are connected with Greymouth (the port town) by railway, two extensive breakwaters have been constructed at the mouth of the river to deepen the channel at the entrance, and enable larger steamers than formerly to enter. These, on the recommendation of the late Sir John Coode, have been carried out—the north breakwater 1,100ft., and the south breakwater 3,260ft. into the sea, to confine the river and direct the current square on to the bar. There are also internal training-walls constructed. These works have so far been perfectly successful; they have really clone somewhat more than was expected of them. Prior to their initiation there was seldom more than 10ft. of water on the bar, and the channel was tortuous and constantly changing its position; now the channel is straight and permanent, and for the most time the channel has varied from 18 1/2ft. to 26 1/2ft. at high-water springs, and 8ft. to 16ft. at low-water springs. The average depth of water on the bar at spring tides during the year 1891 was 21ft. 11in.
The berthing-space is 1,824ft., being 1,032ft. with 12ft. at low-water springs at the upper wharf, and 792ft. at the lower wharf, with 16ft. at low-water springs. Vessels of 1,000 tons can now be berthed at the wharf.
As showing the bearing of the Greymouth Harbour works on the progress of the colony, it is stated that the output of coal in the Brunner (Grey River) mines for the three years ending December, 1880, averaged 29,840 tons only; whereas the output for the three years ending December, 1891, has averaged 134,020 tons, an increase of over 104,000 tons per annum. There are six cranes in use; the lifting-power is from 1 1/2 to 12 tons.
The bar- entrance of this river bears E. 3/4 E. distant 6 miles from Cape Foulwind, and E. 3/4 N. from the Northern Steeple. It is one of the largest rivers in New Zealand, and has its source in the Lakes Rotoroa and Rotoiti, 40 miles south-westward of Nelson. In its course to the sea it receives the accession of several smaller streams; its width varies from a quarter to one-third of a mile. Near to this port also vast deposits of excellent coal are being successfully hewn.
The general plan of the Westport Harbour works is much the same as that for Greymouth, but on a larger scale.
The works executed to date consist in the completion of the west and east breakwaters to the points proposed by the late Sir J. Coode. The west breakwater is 4,276ft. long, and the east breakwater is 4,736ft. The west breakwater overlaps the east breakwater by 400ft., and the waterway at the entrance to the breakwaters at low-water spring-tides is 700ft. wide.
The berthages at the merchandise wharf have been dredged, and are now 15ft. deep at low-water springs, for 50ft. in width; outside of this the depth gradually lessens, until 150ft. off the wharf there is 5ft. at low-water springs. The berthages at the coal-staiths have been dredged, and are 18ft. deep at low-water springs for 70ft. in width, and for 200ft. outside of this they are 9ft. deep at low-water springs, to facilitate the swinging of vessels.
The fairway inside the bar has been dredged, and at present exhibits no depth throughout its course shoaler than 19ft. 6in. at high-water springs.
The merchandise wharf is 350ft. long, and 10ft. above high-water spring-tides.
The coal-staiths are 1,200ft. long, and rise from 20ft. above high-water springs at the up-stream end to 36ft. above the same level at the down-stream end. They are capable of storing 2,000 tons of coal in 36 bins, besides which they have 19 shoots. The lips of the bins and shoots, to which telescopic shoots are fitted, range from 7ft. 9in. to 25ft. 4in. above high-water spring-tides.
The despatch in coal-loading at the staiths is from 200 to 250 tons per hour.
The principal coal-mines are connected by railway with the coal-staiths.
The average depth on the bar at present (June, 1892) is 21ft. at high-water spring-tides, the range of tide being 9ft. 6in. at springs, and 5ft. 6in. at neaps.
The harbour-works at Westport promise to be a complete success. Before these works began the usual depth of water on the bar was from 9ft. to left., and since the completion of the works the usual depth is from 18ft. to 25ft. These depths are taken at high water, the rise of tide being from 6ft. to 10ft.
Although only in its infancy, the coal trade of Westport is fast assuming large proportions. For the three years ending the 31st December, 1891, the annual output of the mines has averaged 181,200 tons. This progress is mainly due to the success of the harbour-works.
This river, 22 miles north of the Buller River, has a depth of 6ft. to 7ft. at low water within the bar. The wharf and coal-staiths are connected with the coal-mines by a railway 3 miles in length. The coal-measures of this district are extensive, and the quality good.
Lies at the head of Blind Bay. At the distance of 4 1/2 miles from the entrance commences the long and remarkable boulder-bank, the southern portion of which forms the natural breakwater to the harbour. The least depth to be passed over by vessels entering Nelson Haven is about 6ft. 6in. at low-water, and 19ft. at high-water springs. There is good anchorage outside the bar in moderate weather. The berthage-accommodation at the Railway Wharf amounts to 1,025ft., and at the Albion Wharf to 422ft. The lifts consist of one sheer-legs, 20 tons; stationary hand-crane, 1 1/2 tons; and a steam-crane on wheels, 3 tons. The draught of water at low-water springs varies at the Railway Wharf from 18ft. to 23ft.; and at the Albion Wharf, 7ft.
This great inlet, similar in character to Queen Charlotte Sound, extends in a southerly direction about 25 miles, branching off to the eastward and westward into numerous arms and creeks, and embracing no less an extent of coast-line than 250 miles. The depth of water in this sound varies from 45 to 16 fathoms, gradually decreasing towards its head, where it receives two rivers—the Pelorus (Hoiere) and Kaituna—between the mouths of which is situated the township of Havelock. The Mahakipawa gold-diggings are situated in an arm of the Sound near Havelock.
The entrance to this Sound lies between Capes Koamaru and Jackson, distant from each other little more than 6 miles. The Sound runs in a S.S.W. direction 14 miles to the western entrance of Tory Channel, and then S.W. by W. for 11 miles to its head, near which is the town of Picton. The depth of water generally varies from 20 to 25 fathoms. It is indented on either side with numerous bays, particularly on the north side, there being ten above Ship Cove. All these bays afford secure anchorage, but the least depth of water to be found in them is 16 fathoms, except at the head of the sound. There is anchorage in 6 and 9 fathoms near the head of the eastern arm off the town of Picton, which is built on the site formerly occupied by the Maori village of Waitohi. The wharf at Picton has a depth of 23ft. alongside at low water.
Picton is the chief port of Marlborough, and vessels are laden there direct for London with cargoes of wool, grain, flax, and other produce. There are saw-mills in the vicinity, and coal has been found near, but not in sufficient quantities to be worked. Antimony-mines are in operation, and there is gold amongst the hills bordering the Sound. Picton is connected with the chief town, Blenheim, by rail, the distance being 18 miles.
Is a good and spacious harbour, accessible in all weathers, and a frequent port of refuge for vessels unable to enter Port Nicholson or to pass through Cook Strait. It lies at the north end of Cloudy Bay, and is 32 miles from the entrance of Port Nicholson.
After winding through the plain of the same name, this river falls into Cloudy Bay, 5 1/2 miles from White Bluff, and 9 miles from Port Underwood. It is one of the principal outlets for the produce of the Wairau and surrounding districts. Steamers drawing 5ft. to 6ft. trade regularly from Wellington to Marlboroughtown, 8 miles up the river, and also up the Opawa River, 11 miles to Blenheim.
This portion of New Zealand, which was first seen by Captain Cook in 1770, and considered by him as part of what is now known as the Middle Island, was in 1808, discovered to be an island by the master of a merchant-vessel, whose name, by common consent, it has since retained. It possesses, on its eastern and south-eastern sides, several excellent ports, affording every facility for shipping.
Table of Contents
The following is a schedule of the principal rivers in New Zealand, showing, approximately, the areas of watersheds, the average annual rainfall, and the estimated discharge for each:—
| River. | Area in Square Miles. | Average Rainfall. | Estimated Discharge in Cubic Feet par Minute. |
|---|---|---|---|
| NOTE.—Rivers marked(*) have mountain sources not trapped by lakes, and are there-fore subject to exceptional floods. | |||
| North Island. | Inches. | ||
| Waikato | 4,768 | 40 | 839,168 |
| Kaipara | 2,622 | 47 | 545,376 |
| Wanganui | 2,525 | 47 | 525,200 |
| Manawatu* | 2,239 | 65 | 642,593 |
| Thames and Piako | 1,779 | 48 | 377,148 |
| Rangitaiki | 1,633 | 30 | 215,556 |
| Whakatane | 1,014 | 35 | 156,156 |
| Rangitikei | 1,435 | 50 | 315,700 |
| Wairoa* | 1,303 | 45 | 257,994 |
| Mohaka | 1,034 | 45 | 204,732 |
| Ngaruroro* | 843 | 40 | 148,368 |
| Tutaekuri and Esk | 487 | 35 | 73,998 |
| Tukituki | 815 | 35 | 125,510 |
| Mokau | 815 | 60 | 215,445 |
| Patea | 622 | 55 | 151,146 |
| Waipaoa, Poverty Bay* | 602 | 30 | 80,066 |
| Turanganui | 75 | 35 | 11,550 |
| Hokianga | 560 | 50 | 123,760 |
| Waiapu* | 505 | 40 | 88,880 |
| Waitara | 501 | 56 | 123,747 |
| Middle Island. | |||
| Clutha | 8,248 | 30 | 1,088,736 |
| Waitaki | 4,730 | 26 | 539,220 |
| Waiau | 3,079 | 41 | 557,299 |
| Mataura* | 2,378 | 30 | 316,274 |
| Buller* | 2,341 | 95 | 990,879 |
| Taieri | 2,317 | 37 | 379,988 |
| Grey* | 1,572 | 90 | 624,084 |
| Wairau* | 1,562 | 35 | 240,548 |
| Oreti | 1,422 | 40 | 250,272 |
| Waimakariri* | 1,922 | 55 | 345,546 |
| Rakaia* | 1,401 | 50 | 308,220 |
| Rangitata* | 752 | 48 | 159,424 |
| Selwyn (Lake Ellesmere) | 718 | 30 | 94,776 |
| Jacobs | 633 | 40 | 11,408 |
| Haast* | 412 | 125 | 227,424 |
| Kaduka (Martin's Bay) | 283 | 127 | 158,480 |
| Hokitika* | 382 | 120 | 202,460 |
| Oamaru | 23 | 22 | 2,231 |
| Milford Lagoon and Opihi | 888 | 28 | 109,224 |
The Waikato, in the North Island, and the Clutha, in the Middle Island, are the two largest rivers in New Zealand.
The Waikato River takes its rise about the centre of the Island, in Tongariro Mountain, and south of Lake Taupo, and has several branches, the principal of which is the Waipa. It has a shifting bar, and is only accessible to small vessels; it is said to be navigable for vessels of 30 tons for 60 or 70 miles, and for a much greater distance for boats. There are 3 1/2 fathoms at low water within the entrance.
The Clutha (Matau) River runs into Molyneux Bay. The old entrance, 4 1/2 miles north-westward of Nugget Point, has silted up, and is nearly dry at low water. The entrance, opened by a flood in 1879, is situated further northward, and is shallow and dangerous. This river is estimated at 220 miles in length, having its source north of the Wanaka Lake, at a height of 974ft. above the sea-level, and calculated to discharge 1,088,736 cubic feet of water per minute. The quantity of water is greater and its temperature lower in summer than winter, this being caused by the melting of the snows on the western ranges of mountains. Several tributaries flow into the Clutha River, the most notable being Pomahaka, Manuherikia, Cardrona, and Kawarau, the latter draining Lake Wakatipu.
Table of Contents
Vessels visiting New Zealand, and requiring docking or repairs, will find ample accommodation at the principal ports of the colony.
There are in New Zealand four graving-docks; two of these are situated in Auckland, one at Lyttelton, and one at Port Chalmers.
The dimensions of the docks at Auckland are as follow:—
| Calliope Dock. | Auckland Dock. | |
| Length over all | 525 feet | 312 feet. |
| Length on floor | 500 feet | 300 feet |
| Breadth over all | 110 feet | 65 feet |
| Breadth on floor | 40 feet | 42 feet |
| Breadth at entrance | 80 feet | 43 feet |
| Depth of water on sill at high water (ordinary spring-tides) | 33 feet | 13 1/2 feet |
The graving-dock at Lyttelton also is capable of docking a first-class ironclad, or any of the large ocean-steamers now running to the colony; its general dimensions are:—
| Length over all | 503 feet. |
| Length on floor | 450 feet |
| Breadth on floor | 46 feet |
| Breadth over all | 82 feet |
| Breadth at entrance | 62 feet |
| Breadth where ship's bilge would be | 54 feet |
| Depth of water over the sill at high-water springs | 23 feet |
The workshop at this dock is so fitted that any repairs required by steamers, &c., can be well and promptly carried out. A patent slip is also provided at this port, on which a vessel of 300 tons can be taken up.
There is a patent slip alongside the dock, with a cradle 150ft. in length, and suitable for vessels of 300 tons.
The docks at Auckland and Lyttelton are the property of the respective Harbour Boards, but that at Port Chalmers is vested in the Otago Dock Trust, a body entirely distinct from the Otago Harbour Board. Vessels of large size can be taken in the Otago Dock, as the following measurements will show:—
| Length over all | 335 feet. |
| Length on the floor | 328 feet. |
| Breadth over all | 68 feet. |
| Breadth on floor | 41 feet. |
| Breadth where ship's bilge would be | 43 feet. |
| Breadth at dock-gates | 50 feet. |
In connection with the Otago Dock there is a large machineshop) steam-hammer, and forge, with all the appliances necessary for performing any work that may be required by vessels visiting the port. An 80-ton sheer-legs has also recently been erected for heavy lifts.
There is also a floating dock and a patent slip, only used for taking up small vessels, The floating dock is 170ft. long, and 42ft. broad, with a depth on sill, when sunk, of lift.
It is proposed to build a new graving-dock at Port Chalmers, to be 500ft. in length, with a depth of 27ft. on the sill.
The port of Wellington has no dock; but there is a well-equipped patent slip in Evans Bay, on which vessels of 2,000 tons can be safely hauled up. This slip is the property of a private company, and is in no way connected with the Harbour Board. The slip is 1,070ft. long, with a cradle 260ft. in length. There is a depth of 32ft. at high water at the outer end of the slip. A dolphin and buoys are laid down for swinging ships in Evans Bay.
The coasts of New Zealand are, considering their extent, fairly well lighted, but there are still many places where lights are wanted. Additions to the existing lights are made from time to time as funds are available.
The lighthouse towers are built of either iron, stone, or timber, the latter material having been selected partly for cheapness and partly from fear of earthquakes; but the use of it for this purpose is now abandoned.
There are twenty-six coastal lights in New Zealand—namely, seven of the first order, thirteen of the second order, three of the third order, and three of smaller orders.
The apparatus used to concentrate the rays of the light are all, with one exception, of the system known as “dioptric,” where the optical agent is wholly glass. The exception is that of Dog Island, a “catadioptric” light, where the optical agents are glass and metallic reflectors.
The forms of the apparatus used are all of the most approved type, and, at the time of their erection, of the latest pattern.
The lamps used are of various kinds; in some of them the oil flows into the wicks by gravity; these are called “fountain” lamps; in others, the oil is supplied by small pumps driven by clockwork; these are known as “mechanical” lamps; whilst in others the oil is forced up by a piston, in which case it is called a “pressure” lamp.
The light itself is produced by the consumption of lighthouse paraffin—a mineral oil distilled from shale—in lamps with burners having concentric wicks, the number of wicks increasing with the power of the apparatus, the maximum number being five, as used in Cuvier Island Lighthouse. The burners are those known as Captain Doty's Patent.
The following are the characteristics of the lights used in New Zealand:—
The “fixed” light, in which the light is always seen.
The “revolving” light, in which the light, at equal periods, gradually comes into view, attains its full power, and disappears.
The “flashing” light, showing flashes at short, regular intervals.
There has been no special difficulty in the erection of lighthouses in New Zealand, apart from the difficulty caused by indifferent landings. There are no lighthouses built in the sea, such as the well-known Eddystone or Bell Rock. That on The Brothers is the only one that it is considered necessary to keep as a rock-station: that is, the keepers are relieved from time to time, three always being at the station and one on shore.
The cost of the erection of the lighthouses has been about £158,000; the annual consumption of oil is about 17,000gals.; and the cost of maintenance, irrespective of the cost of maintaining the lighthouse steamer, is about £11,000 a year.
The following table shows the names of the lighthouses, indicating also their situation, the order of apparatus, description, period (in seconds), and colour of lights, and of what material the respective towers are built:—
| Name of Light-house. | Order of Apparatus. | Description. | Period of Revolving Light, in | Colour or Light. | Tower built of |
|---|---|---|---|---|---|
| Dioptric. | Seconds. | ||||
| Cape Maria van Diemen | 1st order | Revolving | 60 | White | Timber. |
| .. | Fixed | .. | Red, to show over Columbia Reef | ||
| Moko Hinou (Auckland) | 1st order | Flashing | 10 | White | Stone. |
| Tiri-Tiri (Auckland) | 2nd order | Fixed | .. | White, with red arc over Flat Rock | Iron. |
| Ponui Passage | 5th order | Fixed | .. | White and red | Timber. |
| Cuvier Island | 1st order | Revolving | 30 | White | Iron. |
| Portland Island | 2nd order | Revolving | 30 | White | Timber. |
| .. | Fixed | .. | Red, to show over Bull Rock | ||
| Pencarrow Head | 2nd order | Fixed | .. | White | Iron. |
| Cape Egmont | 2nd order | Fixed | .. | White | Iron. |
| Manukau Head | 3rd order | Fixed | .. | White | Timber |
| Kaipara Head | 2nd order | Flashing | 10 | White | Timber |
| Brothers (in Cook Strait) | 2nd order | Flashing | 10 | White | Timber |
| .. | Fixed | .. | Red, to show over Cook Rock | ||
| Cape Campbell | 2nd order | Revolving | 60 | White | Timber |
| Godley Head (Lyttelton) | 2nd order | Fixed | .. | White | Stone. |
| Akaroa Head | 2nd order | Flashing | 10 | White | Timber. |
| Moeraki | 3rd order | Fixed | .. | White | Timber |
| Taiaroa Head | 3rd order | Fixed | .. | Red | Stone. |
| Cape Saunders | 2nd order | Revolving | 60 | White | Timber. |
| Nugget Point | 1st | Fixed | .. | White | Stone. |
| Waipapapa Point | 2nd order | Flashing | 10 | White | Timber. |
| Catadioptric. | |||||
| Dog Island | 1st order | Revolving | 30 | White | Stone. |
| Centre Island | 1st order | Fixed | .. | White, with red arcs over inshore dangers | Timber. |
| Puysegur Point | 1st order | Flashing | 10 | White | Timber |
| Cape Foulwind | 2nd order | Revolving | 30 | White | Timber |
| Farewell Spit | 2nd order | Revolving | 60 | White, with red arc over Spit end | Timber |
| Nelson | 4th order | Fixed | .. | White, with red arc to mark limit of anchorage | Iron. |
| French Pass | 6th order | Fixed | .. | Red and white, with white light on beacon | Iron |
A lighthouse is in course of construction on Stephens Island (Cook Strait). It will be of the first order dioptric, double flash at intervals of thirty seconds; colour white. It is to be built of iron, and will probably be complete early in 1893.
One of the most successful enterprises to which this colony has given birth is the Union Steamship Company of New Zealand (Limited). Its history is a reflex, to a great extent, of the later history of the colony—the one has grown, the other has expanded. Thirty-three years ago a small paddle-steamer was found sufficient for the requirements of Otago, and continued so until the opening of the Otago goldfields in 1862, when the sudden increase of trade resulting therefrom necessitated the employment of additional tonnage; and, one after, another, five steamers were purchased, and connections formed with other ports in the Middle Island. In course of time, as trade grew, it became apparent that a bold step must be taken if it were to be retained in the hands of those under whom it had grown, and this feeling eventuated in the formation, in 1875, of the Union Steamship Company of New Zealand (Limited), with a powerful proprietary and influential board of directors.
The trade of the company was at first confined to the coastal services of the colony, with an occasional extension to Sydney; the intercolonial service being carried on by the fleet of Messrs. McMeckan, Blackwood, and Co., of Melbourne. In 1878, however, the Union Company purchased the steamers and interests of that firm; and in this way the entire intercolonial, and the bulk of the New Zealand coastal, trade passed into their hands. Energetic steps were taken to develop the intercolonial and coastal trades, and, with a boldness which was at the time considered temerity, orders were sent Home to build several new steamers of the latest design.
The courage of the directors was rewarded by seeing their fleet fully occupied, and, in pursuance of their policy to keep well ahead of the colony's requirements, they continued to order steamer after steamer, each more luxuriously fitted than its predecessor. Every scientific improvement, either in the machinery or the fitting of vessels, was brought into requisition for their construction, until, from the modest beginning already noted, the fleet of the Union Steamship Company has grown to be the largest and most powerful in the Southern Hemisphere.
It is unnecessary to record how, year after year, the fleet and trade of the company have grown to their present dimensions; it need only be stated that at the present time the fleet of the company engaged in regular employment numbers 53 steamers, of an aggregate tonnage of 58,000.
The connections of the company have extended with their fleet. In 1885, in conjunction with the Oceanic Steamship Company of San Francisco, they took up the mail-service between the colonies and San Francisco, and have retained it ever since. In 1891 they purchased the plant arid business of the Tasmanian Steam Navigation Company, which for many years had carried on the trade between Tasmania and Australia. Besides the New Zealand coastal and intercolonial services between New Zealand, Tasmania, and Australia, the company run regular services from New Zealand and Australia to the Fijian, Samoan, and other of the South Sea Island groups, and make periodical connection with Calcutta.
The company's interests are so closely interwoven with those of the colony that it is almost regarded as a national institution. It gives employment to a large number of people, and is the cause of the circulation of a large sum of money. It employs, afloat and ashore, over two thousand persons, and expends in wages and other disbursements in the colonies over three-quarters of a million per annum.
The directors take a special interest in the welfare of the company's employés. Their crews enjoy peculiar comforts and privileges. A benefit society has been established in the interests of their men afloat, to which the company contributes an annual subsidy; the latter also contributes a considerable proportion of the annual premiums of their officers' life insurances.
As showing the extent of its traffic, it may be mentioned that, according to latest returns, the company's vessels steam annually 1,500,000 miles, in the course of which they consume 135,000 tons of coal.
Most of the steamers of the company bear the native names of the lakes of New Zealand. They are household words throughout the colonies, and are synonymous with everything that makes a sea voyage enjoyable—the accommodation, attendance, and regularity being all of the best. The high character borne by their officers, and the reputation they enjoy for seamanship and sobriety, give confidence to all those who “go down to the sea in ships.”
Although the progress of the company is largely the result of the prosperity of the colony—and the state of trade of the latter has a barometric effect on the company's operations—it could not have attained and held its present position without having wise heads and judgment to direct its affairs. It has always been fortunate in numbering amongst its directors men who hold leading positions in the commercial community, and whose energy and judgment are mutually recognised.
The following are the names of the company's fleet, with their gross registered tonnage: Monowai, 3,433; Mararoa, 2,465; Tekapo, 2,439; Rotokino, 2,004; Tarawera, 2,003; Waihora, 2,003; Talune, 2,000; Hauroto, 1,988; Wakatipu, 1,944; Wairarapa, 1,786; Manapouri, 1,783; Rotomahana, 1,727; Oonah, 1,700; Taieri 1,668; Te Anau, 1,652; Taviuni, 1,490; Pukaki, 1,443; Corinna, 1,280; Flora, 1,273; Pateena, 1,212; Ovalau, 1,200; Poherua, 1,175; Araivata, 1,098; Ringarooma, 1,096; Upolu, 1,000; Flinders, 948; Penguin, 935; Takapuna, 930; Rotorua, 926; Janet Nicoll, 779 Mangana, 752; Ohau, 740; Taupo, 737; Rosamond, 721; Wainui, 640; Dingadee, 640; Omapere, 601; Moreton, 581; Mawhera, 554; Grafton, 548; Brunner, 540; Wareatea, 460; Australia, 459; Orowaiti, 453; Kawatiri, 453; Mahinapua, 423; Southern Cross, 263; Oreti, 219; Kanieri, 203; Manawatu, 183; Beautiful Star, 177; Maori, 174; Waihi, 92. Total tonnage, 57,993. The indicated horse-power ranges from 100 to 2,800.
The head office of the company is in Dunedin, and it possesses thirty branches and agencies throughout the colonies, and an office and local Board in London.
The New Zealand Shipping Company is a colonial enterprise. It was founded at Christchurch, New Zealand, in 1872, with a capital of £100,000. In the following year the capital was increased to £250,000; and it now stands at £800,000, authorised capital, of which £475,048 has been subscribed.
The company's operations from the year 1873 until 1882 were the loading and despatching, from London, of a monthly line of sailing-vessels to each of the principal ports in New Zealand.
Prior to the formation of the company, the trade to and from the colony was in the hands of two firms; but in 1872 a combination of merchants and agriculturists in New Zealand formed the company, considering that the time had arrived when the interests of the community demanded the establishment of an independent line. At first the newly-fledged company had to depend mainly on chartered ships, but gradually they secured a fleet of their own, in which large numbers of passengers were conveyed, and neither pains nor expense were spared to have the fleet thoroughly equipped for safety and comfort. Many of these vessels have been noted for speed; and one of them — the Otaki—made the fastest passage Homewards on record, having completed the trip, in 1877, in 69 days from Port Chalmers to the London Docks, or 63 days from land to land.
Between the years 1877 and 1882, inclusive, when the New Zealand Shipping Company was under contract with the New Zealand Government to carry immigrants from the Old Country, their vessels brought out close on 20,000 immigrants and passengers.
In January, 1883, a new departure was made by the company despatching from London the s.s. British King, 3,559 tons register, being the pioneer of a direct monthly line of steamers. A feeling had been growing in the colony for some time that, for want of a regular direct steam service, a number of desirable emigrants were diverted to, if not intercepted by, their Australian neighbours, whilst merchants and others, who required supplies quickly from England, were often put to great inconvenience through the delay inseparable from transhipment at Melbourne and Sydney. On the other hand, the success of the frozen-meat trade gave the New Zealand colonists a prospect for the disposal of their beef and mutton, which they so much needed, and increased the desire for rapid steam-service. Accordingly, in 1882, the Colonial Legislature agreed to call for tenders for a monthly service of steamers from England, the voyages each way to be made in 50 days. Pending the decision as to this service, the New Zealand Shipping Company inaugurated a direct steam-service by the despatch of the British King, as above mentioned, which steamer made the passage out to the colony in 49 days, having been detained two days at Capetown for coal.
Foreseeing, however, that a fifty-days' service would not meet the desires of the New Zealand public, the company determined on constructing steamers which would make the passages with regularity under 45 days out and 42 days Home. By such a service they anticipated that the colony might enjoy a direct mail-service with the Mother-country; and, at the same time, the shippers of frozen meat would get the accelerated transit so desirable for that commodity. They, therefore, contracted with the firm of Messrs. John Elder and Co., Glasgow, for the building of five steamers, all fitted with refrigerating machinery and chambers, capable of carrying 12,000 to 15,000 carcases of mutton, and with accommodation for about 80 first-class, 80 second-class, and 250 third-class passengers. The meat-chambers have since been enlarged, and will now carry more than double the above quantities. Several small chambers have also been constructed, which in the season are filled with dairy-produce and fruit, these cool-chambers being kept at a higher degree of temperature than the meat-chambers.
To show the great regularity with which these steamers make their passages, the company recently compiled a series of results showing that the five steamers have completed 73 voyages round the -world, the longest average passage being—homeward, 40 days 1 hour; and the shortest, 39 days 2 hours; and outward, longest, 43 days 4 horns; shortest, 41 days 20 hours; and all these 73 voyages were performed without any serious casualty or loss of life.
These fine mail-steamers have just been supplemented by the addition of the Ruahine, a vessel of 6,127 tons register, specially built to carry a large quantity of frozen meat, dairy-produce, and general cargo, and at the same time fitted for carrying a large number of passengers of all classes. All the arrangements on board are of the most modern type, and calculated to ensure the comfort and safety of those who travel by her.
The great expansion of the trade demanded more accommodation for cargo than was afforded by the mail-liners, and the company promptly responded to the colonists' requirements by acquiring two cargo-steamers—the Tekoa, 4,050 tons register, and the Otarama, 3,808 tons register; and, by chartering the well-known Ducal liners Duke of Westminster, Duke of Sutherland, and Duke of Buckinghamr they thereby initiated a monthly line of cargo-steamers in addition to the mail-boats.
During the past three years the Company has been despatching vessels to the United States, carrying flax and gum, and has now become the principal carrier in the trade.
The company's fleet now consists of—
Mail — steamers: Tongariro, 4,163 tons register, carries 27,000 carcases frozen mutton; Aorangi, 4,163 tons, 27,000 carcases; Ruapehu, 4,163 tons, 27,000 carcases; Kaikoura, 4,474 tons, 34,500 carcases; Rimutaka, 4,473 tons, 37,000 carcases; Ruahine, 6,127 tons, 71,000 carcases.
Cargo-steamers: Tekoa, 4,050 tons register, carries 60,000 carcases frozen mutton; Otarama, 3,808 tons, 53,000 carcases.
Chartered Cargo — steamers: Duke of Sutherland, 3,116 tons register, carries 40,000 carcases frozen mutton; Duke of Westminster, 3,726 tons, 40,000 carcases; Duke of Buckingham, 3,123 tons, 37,000 carcases.
Sailing-vessels: Mataura, 898 tons register, carries 11,000 carcases frozen mutton; Opawa, 1,131 tons, 11,000 carcases; Turakina, 1,247 tons, 13,000 carcases; Rangitikei, 1,227 tons; Waimea, 871 tons; Waimate, 1,156 tons; Wairoa, 1,057 tons; Orari, 1,051 tons; Hurunui, 1,053 tons; Waitangi, 1,161 tons; Waipa, 1,057 tons; Rakaia, 1,057 tons.
In addition to these the company charters a large number of sailing-vessels for homeward loading.
The number of vessels despatched by the company from the colony during the twelvemonths ending the 30th June, 1891, was as follows: Mail-boats, 13 steamers; cargo-boats, 8 steamers; sailing-vessels, 51 ships, 8 of which were to the United States.
Table of Contents
Early in the sixties, the firm of Shaw, Savill, and Co. (then trading under the name of Willis, Gann, and Co.), and some time later, the Albion Company, of Glasgow, established a line from that city to this colony. These two firms subsequently amalgamated under the title of Shaw Savill and Albion Company, Limited, and now possess a large fleet of magnificent, full-powered steamships trading from New Zealand to London, viâ Rio de Janeiro, Teneriffe, and Plymouth, and outwards viâ Madeira, Cape of Good Hope, and Hobart, on alternate Thursdays, fortnightly, with the New Zealand Shipping Company, doing the trip each way in about 42 days.
The mall-steamers, Ionic, 4,753 tons, Tainui, 5,031 tons, Doric, 4,744 tons, Arawa, 5,026 tons, and Coptic, 4,448 tons register, can each carry about 60 saloon and 60 second-saloon passengers.
Like the sister company (the New Zealand Shipping Company), the Shaw Savill and Albion Company have greatly accelerated the growth of the frozen-meat trade by providing first-class steamships fitted with refrigerating-chambers, and thus meeting the requirements of toe colony in this respect.
The following table shows the estimated cargo-capacities of this company's steamships for the carriage of frozen meat, wool, dairy-produce, &c.:—
| Steamer. | Frozen-meat Capacity. | Wool capacity (Dumped). | Cool-chamber Capacity. |
|---|---|---|---|
| Sheep. | Hales. | Tons Measurement. | |
| Doric | 31,800 | 4,000 | 110 |
| Arawa | 30,500 | 1,800 | 160 |
| Coptic | 30,500 | 3,500 | 100 |
| Ionic | 32,500 | 4,000 | 125 |
| Tainui | 31,150 | 1,800 | 135 |
| Mamari | 41,000 | 3,500 | 360 |
| Matatua | 38,000 | 2,400 | 218 |
| Maori | 32,000 | 2,400 | 147 |
| Rangatira | 45,000 | 5,000 | 230 |
| Pakeha | 45,000 | 5,000 | 200 |
In addition to the mail- and cargo-steamers, the Shaw Savill and Albion Company has a fleet of thirty-three first-class steel sailing-ships. These vessels are despatched at regular intervals, carrying goods from and to all ports in New Zealand. Occasionally the sailing-ships take a few passengers who may prefer the longer voyage of about three months. Of these sailing-ships six are fitted up as “freezers” for the carriage of meat, with a capacity of about 10,000 sheep each.
Wellington to Cape Horn, 4,400 miles; to Rio de Janeiro, 6,750; to Teneriffe, 10,240; to Madeira, 10,445; to Plymouth, 11,655; to Gravesend, 11,946 miles. Gravesend to Plymouth, 291 miles; to Madeira, 1,501; to Teneriffe, 1,706; to Capetown. 6,291; to Hobart, 11,951; to Otago, 13,013; to Lyttelton, 13,203; to Wellington, 13,345 miles.
|
* Direct. † Viâ French Pass. | |
|---|---|
| BY RAIL. | |
| Miles. | |
| Auckland to Onehunga | 8 |
| Auckland Kaukapakapa | 44 |
| Auckland Frankton Junction | 85 |
| Auckland Te Awamutu | 100 |
| Auckland Te Kuiti | 126 |
| Auckland Cambridge | 101 |
| Auckland Lichfield | 145 |
| Auckland Mercer | 43 |
| Auckland Te Aroha | 115 |
| Auckland Helensville | 38 |
| Opua to Kawakawa | 8 |
| Whangarei Wharf to Kamo | 6 |
| Napier to Hastings | 12 |
| Napier to Ormondville | 66 |
| Wellington to Palmerston North | 89 |
| Wellington to Masterton | 71 |
| Wellington to Eketahuna | 93 |
| Wellington to Featherston | 50 |
| Wellington to Foxton | 104 |
| Wellington to Patea | 186 |
| Wellington to Hawera | 204 |
| Wellington to Feilding | 100 |
| Wellington to Wanganui | 151 |
| Wellington to New Plymouth | 251 |
| Wellington to Lower Hutt | 8 |
| Wellington to Longburn Junction | 84 |
| Wellington to Napier | 200 |
| Wellington to Spit | 202 |
| Wanganui to Rangatira | 19 |
| Picton to Blenheim | 18 |
| Nelson to Belgrove | 22 |
| Greymouth to Brunnerton | 8 |
| Greymouth to Reefton | 52 |
| Westport to Waimangaroa | 10 |
| Westport to Ngakawau | 20 |
| Christchurch to Rangiora | 20 |
| Christchurch to Kaiapoi | 14 |
| Christchurch to Culverden | 69 |
| Christchurch to Oxford (West) | 41 |
| Christchurch to South bridge | 31 |
| Christchurch to Little River | 36 |
| Christchurch to Springfield | 44 |
| Christchurch to Whitecliffs | 42 |
| Christchurch to Methven | 58 |
| Christchurch to Lyttelton | 7 |
| Christchurch to Ashburton | 53 |
| Christchurch to Temuka | 89 |
| Christchurch to Timaru | 100 |
| Christchurch to Oamaru | 152 |
| Christchurch to Dunedin | 230 |
| Ashburton to Springburn | 30 |
| Timaru to Fairlie Creek | 39 |
| Timaru to Waihao Downs | 41 |
| Oamaru to Hakateramea | 43 |
| Oamaru to Tokaraki | 25 |
| Oamaru to Ngapara | 17 |
| Dunedin to Palmerston South | 41 |
| Dunedin to Lawrence | 60 |
| Dunedin to Port Chalmers | 8 |
| Dunedin to Milton | 36 |
| Dunedin to Clinton | 74 |
| Dunedin to Kingston | 174 |
| Dunedin to Invercargill | 139 |
| Dunedin to Dunback | 50 |
| Dunedin to Mosgiel | 10 |
| Dunedin to Outram | 19 |
| Dunedin to Stirling | 50 |
| Dunedin to Kaitangata | 55 |
| Dunedin to Middlemarch | 49 |
| Dunedin to Balclutha | 53 |
| Invercargill to Kingston | 87 |
| Invercargill to Bluff Harbour | 17 |
| Invercargill to Riverton | 26 |
| Invercargill to Orepuki | 43 |
| Invercargill to Clinton | 66 |
| Invercargill to Heriot | 76 |
| Invercargill to Glenham | 33 |
| Invercargill to Mokotua | 13 |
| Riverton to Nightcaps | 31 |
| Lumsden to Gore | 37 |
| Lumsden to Kingston | 38 |
| Lumsden to Invercargill | 50 |
| BY SEA.—COASTAL. | |
| Miles. | |
| Auckland to Russell | 128 |
| Auckland to Tauranga | 133 |
| Auckland to Gisborne | 301 |
| Auckland to Napier | 387 |
| Auckland to Wellington | 564 |
| Wellington to Lyttelton | 175 |
| Port Chalmers to Bluff Harbour | 132 |
| Tauranga to Gisborne | 206 |
| Gisborne to Napier | 86 |
| Napier to Wellington | 203 |
| Lyttelton to Akaroa | 44 |
| Akaroa to Port Chalmers | 159 |
| Lyttelton to Port Chalmers | 190 |
| Manukau Harbour to New Plymouth | 135 |
| New Plymouth to Wanganui | 100 |
| New Plymouth to Nelson | 148 |
| New Plymouth to Wellington* | 172 |
| Wellington to Port Chalmers* | 332 |
| Nelson to Picton † | 85 |
| Picton to Wellington | 53 |
| Nelson to Wellington* | 101 |
| Nelson to Westport | 160 |
| Westport to Greymouth | 63 |
| Greymouth to Hokitika | 20 |
| Nelson to Greymouth* | 208 |
| INTERCOLONIAL. | |
| Miles. | |
| Auckland to Sydney | 1,281 |
| Auckland to Levuka (Fiji) | 1,172 |
| Russell to Sydney | 1,172 |
| Wellington to Sydney | 1,239 |
| Wellington to Melbourne | 1,479 |
| Bluff to Melbourne | 1,200 |
| Bluff to Hobart | 930 |
| Hokitika to Newcastle | 1,085 |
| Greymouth to Melbourne | 1,206 |
| TRANSPACIFIC. | |
| Miles. | |
| Auckland to Honolulu | 3,810 |
| Honolulu to San Francisco | 2,100 |
The provision made in New Zealand for public instruction is on a liberal scale. The whole cost of primary schools is borne by the State, the instruction imparted in them is wholly secular, and the committee of any school may bring into operation, within its district, certain sections of “The Education Act, 1877,” for the purpose of compelling parents to send their children to school. The primary schools—“public schools” as they are designated in the Act—are nearly 1,300 in number. The average attendance of pupils during the first quarter of 1892 was 98,714. The salaries of teachers at the rates in force at the end of 1891 amount to £302,990. The number of teachers receiving not less than £400 each was 5; 56 others were in receipt of not less than £300 each; 215 had less than £300, but not less than £200; 1,064 had less than £200, but not less than £100; and 1,879 (including 987 pupil-teachers and 154 teachers of sewing) had less than £100 each.
The country is divided into thirteen education districts, over each of which an Education Board presides, and into smaller districts, in each of which a School Committee, elected by the householders, has authority, subject to the general control of the Board. The Board of an Education District receives and disburses the money voted by the General Assembly for purposes of primary instruction, and, subject to the condition of consultation with the Committee of the school district, appoints, the teachers. The Boards also appoint the inspectors; but the inspectors work under regulations made by the Governor in Council, who also makes the regulations under which the Minister grants certificates to teachers after examination and adequate experience.
The regular income of the Boards consists of a capitation-allowance of £3 15s. a year for every unit of average attendance, together with a capitation-grant of not more than 1s. 6d. for the maintenance of scholarships tenable in secondary schools, and a grant in aid of inspection. A sum of money (varying considerably from year to year) is always voted to be distributed among the Boards, and expended by them on the erection of school-buildings. The following statement shows the aggregate income and expenditure of the thirteen Boards for the year 1891:—
| DR. | |||
| £ | s. | d. | |
| To Balances, 1st January, 1890 | 27,690 | 2. | 5 |
| Government grants— | |||
| Maintenance | 342,244 | 10 | 0 |
| Buildings | 66,737 | 10 | 3 |
| Reserves revenues | 34,741 | 11 | 1 |
| Local receipts— | |||
| Fees, donations, &c. | 1,866 | 2 | 0 |
| For buildings | 241 | 14 | 0 |
| Interest | 613 | 15 | 11 |
| Refunds, deposits, &c. | 232 | 15 | 11 |
| Total | £474,368 | 1 | 7 |
| C R. | |||
| £ | s. | d. | |
| By Boards administration | 10,549 | 19 | 5 |
| Inspection and examination | 11,143 | 10 | 6 |
| Teachers' salaries and allowances, and training | 307,692 | 16 | 3 |
| Incidental expenses of schools | 29,712 | 3 | 8 |
| Scholarships | 6,475 | 3 | 6 |
| Interest | 318 | 1 | 3 |
| Buildings, sites, plans, &c. | 42,150 | 17 | 4 |
| Refunds and sundries | 640 | 12 | 5 |
| Balances | 65,684 | 17 | 3 |
| Total | £474,368 | 1 | 7 |
The sum of the numbers on the rolls of the several schools at the several dates of examination in 1891 was 118,440. Of this number there were 40,297 in preparatory classes, and 1,120 pupils who had passed the sixth (the highest) standard at the examination in a previous year, leaving 77,023 in the standard classes. Of this last number, 2,944 were absent on examination — day, and 2,983 were exempt from examination on account of short attendance. Of the rest, 59,511 passed (Standard I., 13,788; II., 14,193; III., 12,138; IV., 9,851; V., 6,068; VI., 3,473), and 11,585 failed.*
The secondary schools of the colony are not supported directly by the State, nor are they open to all pupils without charge. Some of these schools have endowments of land, originating in agreements between colonising companies and the early settlers, or in State grants; and some receive aid from School Commissioners, who administer public reserves for education. At the end of 1891 there were twenty-four schools, with an average attendance of 2,205 pupils. The aggregate income of these incorporate schools from school-fees (not including boarding-fees) was £20,197; and, from endowments, £26,163.
The University of New Zealand is a corporate body which does not itself maintain a staff of professors or lecturers, but has its functions restricted to the encouragement of learning by the conferring of degrees and certificates of proficiency, and by a liberal system of scholarships. The University has a statutory grant of £3,000 a year from the Treasury, and an income of about £2,000 from the fees paid for examinations and degrees. Without counting ad eundem graduates, the University has now 324 graduates on its register. The Senate of the University was originally nominated by the Governor, but since the graduates have become numerous they meet in Convocation, and, as vacancies occur in the Senate, the Senate and Convocation alternately have the right of election to fill the vacancies. There are three institutions in which most of the undergraduates keep terms and receive instruction: the University of Otago, founded and endowed by the Provincial Government of Otago; Canterbury College, similarly instituted by the Provincial Government of Canterbury; and Auckland University College, established by Act of Parliament since the abolition of provinces, and endowed with a statutory grant of £4,000 a year. The number of students at each of these institutions in 1891 was as follows: Otago University, 200; Canterbury College, 349; Auckland University College, 156.
* NOTE.— School children, not over fifteen years of age living in a neighbourhood whore there is a railway-station but no public school, can obtain free second-class tickets to and from a station in the neighbourhood of the nearest primary school; and all children under fifteen can obtain tree tickets to enable them to attend a private school. Also, second-class tickets are issued at 10s. a quarter to children under sixteen, to enable them to go to any school their parents choose.
The Department of Education, over which the Minister of Education presides, is charged with the general administration of the public-school system, and, besides, has the direct management of Native schools (with about 2,000 pupils), of industrial schools (with which a boarding-out system is connected), and of an institution for deaf-mutes (conducted on the pure oral system), and takes an active interest in the instruction of the blind.
[Abridged from the Twenty-third Annual Report, 3rd August, 1801.]
The first scientific society in New Zealand was founded in Wellington in 1851, the first President being Sir George Grey, K.C.B., D.C.L. It was named “The New Zealand Society.”
In 1862 a second society was established in Christchurch as the Philosophical Institute of Canterbury, the first President being Mr. Julius Haast (since Sir Julius von Haast, K.C.M.G., Ph.D.). Much useful work was done by these societies, but they met at very irregular intervals, and the funds collected were inadequate for the proper publication of the papers that were communicated by the members. They therefore languished, owing to their being merely local societies, not having the sympathy of the colony.
The Exhibition held in Dunedin in 1865 brought prominently before the public the advantage of a more general organization for the development of the resources of the colony, and, in 1867, soon after the establishment of a scientific department by the General Government, the New Zealand Institute Act was passed, and its administration was placed under the present Director of the Geological and Natural History Survey (Sir James Hector, F.R.S., K.C.M.G.).
The New Zealand Institute has now been in ulceration for twenty-four years, which is a sufficient period in the history of a new country to indicate how far the practical results obtained by the working of one of its institutions have fulfilled the anticipations of its original promoters.
The object sought was to foster public interest in the collection and discussion of original observations respecting the resources and natural history of the country. The constitution of the New Zealand Institute was intended to provide for the combination of local efforts by enabling the joint publication of the papers read and discussed before local societies.
The Institute commenced with four branch societies in 1869 and only 258 members, but there are now eight societies affiliated; the number of members had increased to 1,327 in 1881, but has since fallen off to about 950, each of whom pays one guinea a year, which may be considered as a voluntary tax for an educational purpose.
The members now on the roll of the Institute are: Honorary members, 28; ordinary members—Auckland Institute, 205; Hawke's Bay Philosophical Institute, 99; Wellington Philosophical Society, 151; Philosophical Institute of Canterbury, 98; Nelson Philosophical Society, 38; Westland Institute, 76; Otago Institute, 117; Southland Institute, 72: making a total of 884.
There have now been 1,623 original communications published in twenty-three volumes of the Transactions of the Institute, nearly all of which relate directly to the colony, and place on record matters of fact and observation that otherwise might not have been published. Of these papers, 378 are on miscellaneous subjects, chiefly relating to the Ethnology of the aboriginal races, or connected with the Industrial Resources of the colony; 613 are descriptive of the Zoology of New Zealand; 203 refer to its Botany; 113 are on Metallurgy and Chemistry in its relation to the colony; and 216 are on its Geology and Physical Geography. In addition to these papers, which are published at length, abstracts of about 970 different communications are given in the Proceedings of the societies. The total number of the communications to the Institute have thus been 2,493. Besides these, a number of popular lectures are given each year under the auspices of the various societies, of which no record is kept. The average size of the annual volume of Transactions and Proceedings is 640 pages and about 40 plates.
Forty-seven of the most distinguished men in science and literature, who have rendered special service to New Zealand, have been elected honorary members, while there are seventy-five corresponding societies and institutions that exchange their publications with the Institute.
The following table shows the number of public libraries, mechanics' institutes, and other literary and scientific institutions in the colony in April, 1891, in respect of which returns were furnished to the Registrar-General, specifying the number of institutions in each provincial district, the number of members, and the number of volumes:—
| Provincial Districts. | Number of | ||
|---|---|---|---|
| Institutions. | Members. | Volumes. | |
| Auckland | 71 | 2,791 | 73,086 |
| Taranaki | 5 | 348 | 5,378 |
| Hawke's Bay | 21 | 1,314 | 18,710 |
| Wellington | 22 | 1,515 | 31,682 |
| Marlborough | 5 | 234 | 5,868 |
| Nelson | 29 | 1,009 | 28,578 |
| Westland | 6 | 238 | 5,283 |
| Canterbury | 66 | 3,263 | 79,774 |
| Otago | 73 | 3,777 | 82,411 |
| Totals | 298 | 14,489 | 330,770 |
Table of Contents
This department of the Government has been in existence for fully twenty-two years. It possesses the prominent, and, in the history of life insurance institutions, the unique, advantage of being based on the solid principle of State security, payment of all policies being guaranteed by the Government of the colony.
Combined with this inviolable safeguard for its policy-holders, there is the further advantage that its premium rates for life insurance are the lowest in Australasia. There are also other attractive features in the liberal conditions embraced in the assurance policy, and its freedom from numerous restrictions which in the Old World still continue, more or less, to hamper and narrow the policy contracts of many old-established offices.
The leading characteristic and the chief object of the establishment of this department was to provide the unquestionable security of the State for every policy-holder insured in the office. Prior to the time of its inception, there had been numerous disastrous failures of life offices in Great Britain, as well as in the United States—failures productive of grave and serious losses to many thousands of unfortunate families, many of whom were reduced to absolute penury. It was to prevent the possibility of such disasters occurring in New Zealand that the Legislature of the Colony, in 1869, passed an enactment, under which this department was established and placed on a commercial footing, and has since enjoyed a marked and successful progress.
The subjoined table shows the growth of the department's business since its establishment up to the close of the last calendar year:—
| BUSINESSFOR TWENTY-TWO YEARS. | |||||||||
|---|---|---|---|---|---|---|---|---|---|
| Year. | New Business. | Business in Force at End of each Period. | Income (from) | Paid to Policyholders. | Added to Funds. | Accumulated Funds. | |||
| No. of Policies. | Sum Assured. | No. of Policies. | Sum Assured. | Interest. | Premiums. | ||||
| £ | £ | £ | £ | £ | £ | £ | |||
| 1869-7059 | 59 | 30,250 | 59 | 30,250 | .. | 357 | .. | .. | (-)386 |
| 1870-71 | 404 | 176,111 | 454 | 200,611 | .. | 7,151 | .. | (5,499) | 5 113 |
| 1871-72 | 1,357 | 461,310 | 1,689 | 625,421 | 543 | 17,545 | 1,526 | 10,041 | 15,154 |
| 1872-73 | 1,157 | 428,615 | 2,634 | 995,986 | 1,343 | 30,132 | 3,213 | 21,761 | 36,915 |
| 1873-74 | 1,499 | 510,010 | 3,953 | 1,453,496 | 2,332 | 43,379 | 7,033 | 30,321 | 67,236 |
| 1874-75 | 1,374 | 483,223 | 4,989 | 1,836,859 | 4,207 | 64,275 | 14,221 | 42,732 | 109,968 |
| 1875-76 | 1,249 | 481,170 | 6,153 | 2,282,129 | 6,669 | 72,253 | 23,755 | 43,749 | 153,717 |
| 1876-77 | 1,411 | 564,228 | 7,149 | 2,716,907 | 9,133 | 82,852 | 14,438 | 65,677 | 219,394 |
| 1877-78 | 1,994 | 681,109 | 8,711 | 3,251,220 | 12,601 | 98,582 | 21,645 | 73,129 | 292,523 |
| 1878-79 | 2,073 | 687,574 | 10,223 | 3,726,330 | 16,737 | 115,858 | 35,699 | 79,367 | 371,890 |
| 1879-80 | 2,266 | 722,554 | 11,656 | 4,171,504 | 21,098 | 125,076 | 39,088 | 87,446 | 459,336 |
| 1880-81 | 1,790 | 550,351 | 12,411 | 4,352,496 | 26,506 | 130,048 | 39,394 | 97,895 | 557,231 |
| 1881-82 | 2,523 | 702,909 | 13,810 | 4,695,388 | 31,310 | 139,996 | 53,593 | 96,659 | 653,890 |
| Half-year 1882 | 2,547 | 631,279 | 15,892 | 5,176,217 | 17,711 | 77,076 | 27,448 | 50,999 | 704,889 |
| 1883 | 5,113 | 1,039,916 | 19,917 | 5,898,951 | 41,173 | 174,372 | 42,923 | 141,271 | 846,160 |
| 1884 | 3,309 | 800,016 | 21,003 | 6,135,636 | 48,472 | 179,959 | 72,783 | 126,616 | 972,776 |
| 1885 | 4,379 | 859,770 | 23,218 | 6,466,276 | 52,150 | 188,586 | 72,626 | 129,259 | 1,102,035 |
| 1886 | 3,560 | 717,464 | 24,714 | 6,670,741 | 58,205 | 197,324 | 81,660 | 129,899 | 1,231,934 |
| 1887 | 3,124 | 766,952 | 25,439 | 6,831,933 | 66,380 | 201,904 | 125,019 | 96,559 | 1,328,493 |
| 1888 | 2,957 | 785,093 | 26,168 | 7,076,252 | 73,421 | 208,740 | 110,411 | 123,986 | 1,452,479 |
| 1889 | 3,187 | 781,255 | 27,218 | 7,326,129 | 81,386 | 217,308 | 112,102 | 129,969 | 1,582,448 |
| 1890 | 2,761 | 684,242 | 28,102 | 7,544,030 | 89,796 | 223,610 | 113,744 | 132,745 | 1,715,193 |
| 1891 | 2,934 | 699,901 | 29,226 | 7,782,734 | 96,379 | 234,496 | 144,574 | 132,604 | 1,847,797 |
| 757,552 | 2,830,879 | 1,146,895 | 1,847,797 | ||||||
The progress shown by these figures indicates the popularity of the department, and the appreciation of the advantages it offers to the people of the colony. Not the least attractive circumstance relating to the Insurance Department is the fact that the favourable climatic conditions of the colony, and its equable temperature, exercise a beneficial influence on the tables of mortality.
Those mortality tables display a lower death-rate in New Zealand than is shown by any other British colony, or, indeed, by any other country or State in the world. The following table shows the annual death-rate per 1,000 of the population of the Australasian Colonies. The figures are computed for the year 1891:—
| Colony. | Death-rate per 1,000. |
| Victoria | 16·24 |
| New South Wales | 14·26 |
| Queensland | 12·90 |
| South Australia | 13·26 |
| Western Australia | 16·96 |
| Tasmania | 15·00 |
| New Zealand | 10·35 |
The rates of premiums charged by the Government Insurance Department for whole-life and endowment assurances at the various ages are specified below, the rates being based on age for nearest birthday, which is in itself an advantage to the policy-holder:—
| ANNUAL PREMIUMS for £100. | |||||||||
|---|---|---|---|---|---|---|---|---|---|
| Age nearest Birthday. | Payable at Death Table I. | Payable at Death or in 25 or 30 years. | |||||||
| Table III. 25. | Table III. 30. | ||||||||
| £ | s. | d. | £ | s. | d. | £ | s. | d. | |
| 20 | 1 | 15 | 2 | 3 | 7 | 10 | 2 | 16 | 0 |
| 21 | 1 | 15 | 11 | 3 | 8 | 0 | 2 | 16 | 4 |
| 22 | 1 | 16 | 8 | 3 | 8 | 3 | 2 | 16 | 7 |
| 23 | 1 | 17 | 5 | 3 | 8 | 5 | 2 | 16 | 10 |
| 24 | 1 | 18 | 3 | 3 | 8 | 8 | 2 | 17 | 1 |
| 25 | 1 | 19 | 1 | 3 | 9 | 0 | 2 | 17 | 6 |
| 26 | 2 | 0 | 1 | 3 | 9 | 4 | 2 | 17 | 11 |
| 27 | 2 | 1 | 1 | 3 | 9 | 9 | 2 | 18 | 4 |
| 28 | 2 | 2 | 1 | 3 | 10 | 1 | 2 | 18 | 10 |
| 29 | 2 | 3 | 2 | 3 | 10 | 6 | 2 | 19 | 4 |
| 30 | 2 | 4 | 3 | 3 | 11 | 0 | 2 | 19 | 10 |
| 31 | 2 | 5 | 5 | 3 | 11 | 5 | 3 | 0 | 5 |
| 32 | 2 | 6 | 8 | 3 | 11 | 11 | 3 | 1 | 0 |
| 33 | 2 | 7 | 11 | 3 | 12 | 5 | 3 | 1 | 8 |
| 34 | 2 | 9 | 3 | 3 | 13 | 0 | 3 | 2 | 4 |
| 35 | 2 | 10 | 8 | 3 | 13 | 8 | 3 | 3 | 2 |
| 36 | 2 | 12 | 2 | 3 | 14 | 4 | 8 | 4 | 0 |
| 37 | 2 | 13 | 9 | 3 | 15 | 0 | 3 | 4 | 10 |
| 38 | 2 | 15 | 4 | 3 | 15 | 10 | 3 | 5 | 10 |
| 39 | 2 | 17 | 1 | 3 | 16 | 8 | 3 | 6 | 11 |
| 40 | 2 | 18 | 11 | 3 | 17 | 7 | 8 | 8 | 0 |
| 41 | 3 | 0 | 10 | 3 | 18 | 7 | 3 | 9 | 4 |
| 42 | 3 | 2 | 10 | 3 | 19 | 9 | 3 | 10 | 9 |
| 43 | 3 | 5 | 1 | 4 | 1 | 1 | 3 | 12 | 3 |
| 44 | 3 | 7 | 5 | 4 | 2 | 6 | 3 | 14 | 0 |
| 45 | 3 | 9 | 10 | 4 | 4 | 1 | 3 | 15 | 10 |
| 46 | 3 | 12 | 6 | 4 | 5 | 9 | .. | ||
| 47 | 3 | 15 | 3 | 4 | 7 | 6 | .. | ||
| 48 | 3 | 18 | 1 | 4 | 9 | 6 | .. | ||
| 49 | 4 | 1 | 2 | 4 | 11 | 7 | .. | ||
| 50 | 4 | 4 | 4 | 4 | 13 | 11 | .. | ||
The following extract from the Financial Statement by the Hon. John Ballance, the Premier and Colonial Treasurer, delivered in Parliament on the 30th June, 1892, forms a fitting conclusion to this notice of the State Life Insurance Department, which has now passed its majority, and has achieved the successful position testified to by the facts and figures herein narrated:—
“The Government Insurance Department continues to make satisfactory progress, and shows an increase in the new business for the year, while there is at the same time a diminution in the ratio of expenses and a marked decrease in the number and amount of the lapsed policies.
“The amount of new business reached in round numbers was £700,000. The income for the year was £330,895, being an increase of £17,470 over the previous year. The accumulated fund has increased during the year by £132,603, and by December next will probably exceed two millions sterling.
“The valuation for the five years ending with 1890 was duly made by Messrs. Bailey, Hardy, and King, consulting actuaries to the department in London, to whom data were despatched in March, 1891. The results of their investigation were cabled from London at the end of October last, and disclosed a surplus of £239,475. This result is all the more gratifying, inasmuch as the valuation was more severe than on any previous occasion, the-computations being on a 4-per-cent. basis, instead of 4 1/2 per cent. as formerly. The report of these gentlemen will be laid before Parliament in conjunction with the Commissioner's annual report; and attached will be an independent report and valuation made by Mr. Morris Fox, the actuary of the department, and completed by that officer as early as April of last year. The surplus reported by Mr. Fox was £6,823 less than that of Messrs. Bailey, Hardy, and King, the relatively trifling difference being due to extreme caution on the part of Mr. Fox in estimating the liabilities under the department's policies, leading him to constitute some small additional reserves which the London actuaries do not appear to have thought it essential to provide.
“I am pleased to be able to state that the Commissioner informs me that another official valuation made by Mr. Fox for the year 1891 shows that the rate of profits is fully maintained. I have made inquiry into the position of the department, and am enabled to say that it is in a satisfactory condition, and that its management displays both competency and carefulness.”
Table of Contents
The Public Trust Office has been established for the purpose of affording a secure and convenient recourse for persons resident abroad as well as in New Zealand who may desire to form trusts in the colony, and may be in doubt or difficulty as to the choice of trustees or executors; and for persons also who may be unable or unwilling to undertake or continue the trusts which are imposed upon or accepted by them.
The Public Trust Office was constituted by “The Public Trust Office Act, 1872,” and its functions have since been much enlarged by amending Acts, necessary to enable the office to meet the growing requirements of the public and its business. The Amendment Act of 1891 presents many new and important features. It facilitates the administration of properties placed in the office; authorises a more prompt distribution of the residue of intestate estates; provides absolute security from loss to properties of the funds which arising from them may be invested at the discretion of the Public Trustee in mortgages of real estate within the colony, or in General Government securities of the colony; insures the regular and punctual payment of interest on such funds; and, by rendering practicable a more efficient conduct of the office and of the arrangement of the accounts, has raised the office in the estimation of the public.
Although primarily established for the custody and management of property held in trust within the colony, the expansion of the business has compelled the office to extend the range of its operations, and it now undertakes, besides the minor duties which are imposed upon it almost annually by various statutes, the services which may be generally summarised as follows: (1) Administration of estates under will; (2) administration of all kinds of money trusts, including marriage settlements; (3) administration of intestate estates; (4) administration of estates of lunatic patients; (5) managing property of absent heir or devisee; (6) managing unoccupied lands of absent owners; and (7) administration of Native reserves for the benefit of the Native owners.
One of the greatest attractions of the Public Trust Office is undoubtedly the security which it affords to all who place their affairs in its charge. It is a Government department. The integrity of its officers is guaranteed by statute; and, by “The Public Trust Office Acts Amendment Act, 1891,” the colony guarantees the integrity of the capital funds of properties, placed in the Public Trust Office where there is no direction for the investment of such funds, or where there is no other direction for their investment than generally, at the option of the Public Trustee, in General Government securities of New Zealand or in mortgage of real estate within the colony.
The colony also guarantees on such capital funds for investment a common rate of interest, to be credited quarterly, free of all office charges, to the properties from which the funds arise. This rate of interest has now been determined at 5 per cent, on so much of the funds for investment as, arising from one property, do not exceed £3,000, and 4 per cent, on the amount in excess of £3,000; and this rate, which is allowed free of all charges of the Public Trust Office, will result in an income of—
| £650 a year from | £1,000, or 5 per cent. |
| £150 a year from | £3,000, or 5 per cent. |
| £100 a year from | £4,000, or 4 3/4 per cent. |
| £230 a year from | £5,000, or 4 3/5 per cent. |
| £270 a year from | £6,000, or 4 1/2 per cent., and so on. |
The value of this guarantee will be obvious when it is considered that it is: (1) The guarantee of the colony against loss from investments in bad or insufficient securities; (2) the guarantee of the colony against loss from delay in the investment of moneys; (3) the guarantee of the colony that the interest determined by Order in Council shall be regularly and punctually paid, free of all charges of the Public Trust Office.
A person making a will or arranging a trust must always be seriously concerned as to the security of the capital funds; and the larger the capital funds the greater will be the concern for security, and the less for a high rate of interest.
This is one of the most important branches of the Public Trust Office. A very large number of people die without having made provision by will for the administration of their estates. In such cases it is tire duty of the Public Trustee to administer estates where relatives are unknown, or are known to reside out of the colony, or where the person entitled by law to administer declines or neglects to apply for letters of administration within due time after death. Very few persons realise the care and responsibility inseparable from the administration of an estate, and no person should assume these before considering whether it is not better to decline and allow the estate to be administered by the Public Trustee, who is a responsible officer appointed by the Legislature and experienced in this class of work. After the assets of an estate are realised and the debts and expenses paid, the Public Trustee, on receiving satisfactory proofs of kinship, distributes the residue in accordance with the law.
The Public Trustee is authorised to administer intestate estates consisting only of personalty not exceeding £250 in value without an order of the Court, thus achieving expedition and economy in the administration of personal property of small value.
To anyone desirous of appointing a trustee, or to any present trustee wishing to be relieved of his trusts, the Public Trust Office offers a safe and ready means.
Any property can be vested in the Public Trustee upon trusts defined in the deed creating the trust. Incomes from trusts can be paid over in any way desired.
It is gratifying to be able to state that the reputation and benefits of the office are attracting attention in the United Kingdom, and already several trusts of moneys belonging to persons resident there have been accepted by the office. The incomes derived therefrom are paid in England through the Agent-General for the colony.
When all the property in an estate has been realised and the money has been transferred to the common fund of the office, the income is paid to beneficiaries free of all commission; but during the progress of administration, while the realisation of the property is taking place, certain moderate fees and percentages are charged. These charges have been so adjusted as to fall as lightly as possible on the properties administered, but so as to secure a return sufficient to meet the cost of maintaining the department and leave a margin for any losses by investments. It will be found that the charges of the office for administering a property will compare very favourably with the total cost of an administration by any other means.
The assets of estates are conserved or realised to the best advantage by the duly appointed agents of the Public Trustee, and under his direction, due regard being paid to all surrounding circumstances and to the provisions of any law, will, or trust deed affecting the same.
Wills of living persons, whether under such wills the Public Trustee is or is not appointed executor, may be deposited in the office for safe custody. Testators are recommended to obtain a provisional acceptance of their wills by the Board of the office, the advantage of which is that the testators are made aware before death whether the Public Trustee would be likely to accept the trusts of their wills, and obtain free of charge a careful consideration of any objections which might exist to the wills of which the office may be expected to undertake the executorship.
The Public Trustee, in his official capacity, never dies, never leaves the country, and never becomes disqualified. It will thus be apparent that by his appointment as trustee the preparation of the numerous deeds, and the consequent expense, which might become necessary in the case of a private trustee are altogether obviated. These advantages will be readily appreciated by all who-have any knowledge of the incidents of trusteeships.
The legal expenses attending the administration of trusts are minimised by his appointment as trustee. The office solicitor advises on all matters of administration without charge to the estates.
As executor of a will, the Public Trustee must act alone. The law forbids him to act in conjunction with another.
The Act which deals with these subjects was passed in 1889, and came into force on the 1st January, 1890. It is in principle and all important matters a reprint of the British Act, the variations being, generally speaking, only such as are required by the circumstances of the colony. It follows, therefore, that, in questions of interpretation of the law, the decisions of the English Courts are taken as a guide in the New Zealand Patent Office and Supreme Court.
The Patent Office is in the Government Buildings, at Wellington. The head of the office is styled “Registrar of Patents, Designs, and Trade-marks,” and all communications should he addressed to that officer.
Fees are payable preferably to the credit of the Public Account at any branch of the Bank of New Zealand, and, when so paid, the-bank receipt must be forwarded with the necessary documents to the Registrar; but, where this mode of payment is inconvenient, drafts or post-office orders will be accepted; cheques cannot be received.
Forms of application for letters patent or for registration of trade-marks are supplied gratis.
The office is glad to give inventors and others any information in its power; but it declines the responsibility of making searches, and also of advising on questions of law, or on matters on which the Registrar may have to decide judicially.
Inventors are advised to search for themselves personally, or by their agents, both in the Patent Office and in the Patent Office library in the Museum, in Wellington, to ascertain that their inventions have not been anticipated by others. Copies of specifications filed in Great Britain, Canada, the United States, Australia, &c., may be inspected free in the Patent Office library. As patents are issued in the colony at the risk of the applicants, the importance of such a search is apparent.
Local patent offices are appointed in the principal towns of the colony for the receipt of applications for letters patent.
A “Patent Office Supplement” to the New Zealand Gazette is published fortnightly, and contains notices of applications for patents, and for registration of trade-marks, and a variety of information concerning them. The subscription to this Supplement is 10s. a year.
A patent may be granted to one or more persons, provided that one is the actual inventor, or to the assignee or authorised agent of the inventor. Every application for a patent must be in the form prescribed in the Act, and must be accompanied by a provisional or complete specification in the prescribed form; fee, 10s. If a provisional specification is lodged with the application, a complete Specification must be deposited within nine months; fee, 10s. Copies of the complete specification and of drawings, if any, are required. The acceptance of the complete specification is gazetted, and any person may, within two months of the date of the Gazette, give notice in duplicate of opposition, stating the grounds of the-objection. The Registrar will then fix a day for hearing the case, and decide thereon. He has power to examine witnesses on oath, and to make such orders as to costs as he may think fit. Fifteen months from the date of the acceptance of the application is allowed for payment of a farther fee of £2 and the issue of the patent. The [Registrar may grant an extension of time on good cause being shown and on payment of extra fees. The term of a patent is fourteen years, subject to payment of £5 within four years, and £10 within seven years. A specification may be amended under certain conditions, but no substantial alteration or enlargement can be allowed. The Governor may order a patentee to grant licenses on terms, but there is no provision for compulsory working. A patent may be revoked by the Supreme Court.
Designs may be registered on application in the prescribed form, with drawings or other representation?, and are then copyright.
Applications for registration of trade-marks are to be made in the prescribed form, and accompanied by four representations of the mark; fee, 5s. Certain essential particulars are required in a trademark, and the mark is to be registered for particular goods or a class of goods. Every application for registration of a trade-mark is gazetted, and within two months any person may give notice in duplicate of objections. The applicant may send to the Registrar a counter-statement in duplicate. The Registrar will then hear both sides and decide the case.
An address for service in the colony must be given with all applications and objections.
Appeal may be made to the Supreme Court in Wellington against decisions of the Registrar. The Registrar has power to correct clerical errors.
Assignments and licenses must be registered in the Patent Office. The colony has joined the International Convention, and has thus secured seven months priority of right for patents, and four for trade-marks. A similar arrangement has also been made between Victoria and New Zealand. Patents and trade-marks are open to inspection, but designs are not, while the copyright exists.
Only persons registered as patent agents are allowed to so term themselves. Any person representing an article to be patented when no patent for it has been granted in the colony, or falsely describing a design or trade-mark to be registered, is liable to a penalty of £50. Other offences against the Act are punishable by fine or imprisonment.
A careful perusal of the Act and regulations is advised, as otherwise unnecessary delay and expense may be incurred.
There are sixty-seven fire brigades in the colony, having a total strength of over 200 officers and 1,200 men. A great number of these brigades have formed themselves into a union, under the name of the “United Fire Brigades Association of New Zealand.” The last annual conference was held in Christchurch, on the 14th and 15 March, 1892. The annual report stated that the total number of brigades now on the roll of the association was fifty-five. There is an Accident Society established in connection with the association, with a membership of about 320. It provides for an allowance of £1 10s. per week if a member be incapacitated from following his usual employment by accident whilst on duty as a fireman, and, if totally disabled or killed, a sum of £50 is assured.
The New Zealand “Friendly Societies Act, 1882,” is, with a few slight alterations, copied from the Act of 1875. That Act was drawn on the principle recommended by the Royal Commission presided over by Sir Stafford Northcote—namely, that the State should legislate only for the protection of the rights of members of registered societies, registration being optional, and that the responsibility of solvency should rest with the societies themselves. There are in New Zealand few societies which have not availed themselves of the facilities and privileges conferred by registration.
Inadequate rates of contribution were originally adopted by many societies. In some instances the rates have been raised, and the financial position correspondingly improved; in others there has been exhibited persistent disregard of advice and warning. This is the principal cause of deficiency. Other causes are excessive sickness, losses through unprofitable investments (chiefly in buildings), and negligence in regard to investment of funds.
From the compilation of New Zealand friendly society statistics, it is found that there is great divergence in the rates of sickness and mortality from other experience. The mortality, in common with the mortality of the whole population, is conspicuously light. On the other hand, the sickness greatly exceeds the expectation as based on English rates.
In the Statistical Information will be found particulars as to the number of lodges and members in New Zealand.
Table of Contents
Prior to the abolition of the provinces the hospitals of the colony were supported mainly out of provincial revenues. Subsequently thereto, the expenditure for hospitals became to a large extent a charge on the revenues of counties and municipal corporations, until October, 1885, when “The Hospitals and Charitable Institutions Act, 1885,” passed by the General Assembly, came into operation.
The portion of the colony included within the threes principal islands—the North, Middle, and Stewart Islands—was by the above Act divided into twenty-eight hospital districts, each consisting of one or more counties with the interior boroughs, to be presided over by elected Boards, designated “Hospital and Charitable-aid Boards.”
The revenues of these Boards accrue from the following sources:—
Rents and profits of land and endowments vested in the Board, or set apart for the benefit of particular institions;
Voluntary contributions;
Grants from contributory local authorities; and
Subsidies from the Consolidated Fund (these being at the rate of 10s. for every £1 of bequests, but in no case exceeding £500 in respect of any one bequest; £1 4s. for every £1 of voluntary contributions; and £1 for every £1 received from any local authority).
The contributory local authorities—being the County and Borough Councils, and Boards of road and town districts where the Counties Act is not in operation—are empowered by the Act to raise, by special rates, the amounts assessed by the Hospital District Boards, as the proportionate contributions for the purpose of the Hospital and Charitable-aid Fund.
The District Boards undertake the general management and control of the hospitals that are not incorporated in terms of the Act, and are required to contribute to the support of the incorporated hospitals. Incorporated hospitals are those having not less than one hundred subscribers who contribute not less than £100 annually to the institution by amounts of not less than 5s., and have been declared by the Governor in Council, after receipt by him of a duly-signed petition, to be a body-politic and corporate.
There are 38 hospitals in the colony, of which 25 are incorporated institutions, and 13 are directly managed and controlled by district Boards. In 1891 these hospitals afforded accommodation for 968 male and 423 female patients, a total of 1,391. The number of cubic feet of space included within the walls of all the sleeping-wards was 1,847,128, which gave an average of 1,328 cubic feet to each bed. 5,401 males and 2,088 females were admitted as patients during the year 1891, and 566 male and 172 female patients were inmates at the end of the year. The total number of indoor patients during the year was 8,207—viz., 5,954 males and 2,253 females.
The various benevolent asylums and charitable institutions are placed on a similar footing to the hospitals. The Boards of hospital districts are constituted Hospital and Charitable-aid Boards; but, for the purpose of distributing charitable aid only, some of the hospital districts have been united into larger districts, so that, although there are 28 Boards for hospital purposes, there are only 21 for charitable-aid purposes.
Returns were received, in 1891, from 13 benevolent asylums (not including orphanages) established for the support of certain indigent persons. These have accommodation for 495 males and 294 females. The number of inmates in these institutions at the end of 1891 was 667, of whom 468 were males and 199 were females. Outdoor relief was given by four of these institutions to 3,868 persons, including 2,377 children.
There are six orphan asylums in the colony: two are maintained by District Hospital Boards, one by the Church of England authorities, and three by clergy of the Roman Catholic Church; four of these receive, at the charge of the State, orphan, destitute, and other children that may be committed to them by a Resident Magistrate.
Exclusive of the children so committed, 8 male and 28 female orphans were received during the year 1891, and 59 male and 119 female orphans remained as inmates at the end of the year.
The orphanages that receive committed children are, for that purpose, constituted “industrial schools.” The particulars of the committed children will be found included with those of the committed children attending the Government industrial schools.
There are seven public lunatic asylums in the colony (one being, however, only an auxiliary institution to the district asylum), maintained wholly or in part out of the public revenue. There is also one private asylum, licensed by the Governor for the reception of lunatics. There were, at the end of 1891, 1,115 male and 734 female patients belonging to these asylums. Of these, 931 males and 626 females were supposed to be incurable, 17 males and 31 females were out on trial, and 167 males and 77 females were supposed to be curable. 127 male and 126 female patients were discharged during the year.
The following shows the proportion of insane—or, preferably, of inmates of lunatic asylums—to the population (exclusive in each case of Maoris) at the end of the years stated:—
| 1884, | 1 insane person to every 393 of population. |
| 1885, | 1 insane person to every 382 of population. |
| 1886, | 1 insane person to every 370 of population. |
| 1887, | 1 insane person to every 360 of population. |
| 1888, | 1 insane person to every 365 of population. |
| 1889, | 1 insane person to every 349 of population. |
| 1890, | 1 insane person to every 348 of population. |
| 1891, | 1 insane person to every 343 of population. |
It must not be overlooked that the proportions are increased by the admission into the asylums of inebriates, idiots, and others, who should not properly be there.
There are four industrial schools maintained by the Government, and one maintained wholly by the local authorities. In addition, three orphanages under the control of the Roman Catholic clergy have been constituted industrial schools for the reception of children committed under the Industrial Schools Act. The Government pays a contribution of 1s. a day for each child committed to these institutions. 184 children of both sexes were committed to these schools in 1891—namely, 122 boys and 62 girls.
The following shows the number of children committed to the industrial schools in each year since 1886:—
| In 1886 | 238 children were committed. |
| 1887 | 224 children were committed. |
| 1888 | 190 children were committed. |
| 1889 | 169 children were committed. |
| 1890 | 158 children were committed. |
| 1891 | 184 children were committed. |
The number of committed children belonging to these schools at the end of 1891 was 1,492—namely, 857 boys and 635 girls. Of these, 527 were actually in the schools, 422 were boarded out, 391 were at service, 119 were with friends, and the others-were variously accounted for.
Of those admitted during the year, 34—namely, 29 boys and 5 girls—had been guilty of punishable offences.
Six children (two boys and four girls) were transferred to the Costley Training Institution of Auckland in 1891. This institution was established and is maintained out of funds bequeathed for such purpose chiefly by the generosity of one individual, and has for its objects the selection of a certain number of boys and girls of ages fit to be apprenticed, being inmates of the schools established under “The Industrial Schools Act, 1882,” in or near the City of Auckland, the boys to be apprenticed to suitable trades and maintained at aforesaid institution until they are fit to be left to their own control, and the girls to be provided with domestic service or other suitable employment.
There were 36 inmates of the institution at the end of 1891—namely, 27 boys of ages varying from 13 to 19, and 9 girls. All the boys were either learning a useful trade or held situations in offices or other positions of respectability. The girls were all either in service or boarded out with respectable families.
Possessed of great intelligence, susceptible of civilisation, and the owners of an immense area of land, the Native people form an important element in the New Zealand population.
Now that the Maori wars are over, the Natives have turned their attention to peaceful pursuits; and, had it not been for the baneful effects of war, their social condition might have been far in advance of what it is at present. Loss of life in the field, death from disease, the privations incident to war-time, and the disturbances in their ordinary occupations, perceptibly diminished their numbers and checked for years the progress they were making in civilisation.
According to the census of 1891—which is considered to be approximately correct—the population, including the Chatham Islands, was 22,861 males and 19,132 females—a total of 41,993. In 1886 the numbers were 22,840 males and 19,129 females — a total of 41,969. It would therefore appear that the numbers are now being maintained, more especially when it is borne in mind, that about 100 Natives lost their lives in the Tarawera eruption, which occurred after the census of 1886 was taken. But there is, notwithstanding the above figures, indication of a low birth-rate and a high juvenile mortality tending to a racial decrease (see table and remarks at end of article), and this tendency has been attributed to the following causes: An excessive infantile mortality, owing to improper food, exposure, want of ordinary care and cleanliness; the constitutions of the parents debilitated by past debauchery; the practice of placing their sick in the hands of the Native doctor (tohunga) instead of applying to the medical officer of the district; the sterility induced by widespread immorality among quite young females before marriage; the partial adoption of European habits and costume and the continual reversion to the habits and costume of barbarism, with a system rendered more susceptible to external influences, especially those of a humid and changeable climate, thereby tending to promote the spread of diseases, notably those affecting the respiratory organs; and to a certain extent the continual intertribal marriages, resulting in diminished fruitfulness and enfeebled constitutions.
The Natives are rich in land. It is estimated that they own more than ten millions of acres. In this area there are valuable lands, but allowance must be made for mountain-ranges and portions where the soil is poor. The following figures will show that the Natives are utilising their lands, although not to the extent that might be wished. According to the census of 1891, they had, in crop and grass, 75,833 acres: of which 11,203 acres wore in wheat, 5,599 acres in maize, 16,093 acres in potatoes, 18,220 acres in other crops, and 26,718 acres in sown grasses, and owned 262,763 sheep; 42,912 cattle; 86,259 pigs, besides horses, of which no account has been taken.
The Maoris take no small interest, in education, and the aptitude for learning shown by their children at the schools provided for then is most marked. For many years the Government has maintained schools in Native districts, and solid work has been done in giving the children an English education. In December, 1891, the numbers on the rolls of the ordinary Native schools, public, and boarding-schools were 3,775. At the same date the number of Native village schools was 67, and boarding-schools 4. The public schools at which Native children attended were 218. The Native schools are inspected periodically by the Government Inspector, and the day on which this official makes his inspection is one of no small interest and excitement to the youthful Maori.
The Natives are represented in Parliament. There are four constituencies, each sending a member of the Native race to the House of Representatives. At present one of these representatives, who is a half-caste, is a member of the Executive Council. There are also two Maoris in the Legislative Council. The Native members take a keen and intelligent interest in all questions affecting their people, and are well able to hold their own on the floor of the House.
The following table shows, with the population at the census, the large proportional number of votes recorded at the election in October, 1890, of Native members for the House of Representatives, under the Maori Representation Acts of 1867, 1872, and 1876:—
| Electoral Districts. | Maori Population, Census, 1691. | Number of Votes recorded. |
|---|---|---|
| * Being 22,861 males and 19,132 females (including 251 wives of European husbands). | ||
| North Island— | ||
| Northern Maori | 8,970 | 1,649 |
| Eastern Maori | 14,440 | 3,131 |
| Western Maori | 16,365 | 1,916 |
| Middle Island— | ||
| Southern Maori | 2,218 | 390 |
| Totals | 41,993* | 7,086 |
The institution, above all others, in which the Natives take a lively interest is the Native Land Court. This tribunal was established, in 1865, for the purpose of clothing their lands with titles, and it has been in existence ever since. The Natives bring their claims before the Court, and, upon evidence brought before it, judgment is given in accordance with customs relating to Native land-tenure. Large and valuable blocks are constantly being passed through the Court, and at times the claims of the contending parties are keenly contested. In some cases, when the blocks are very valuable, the attention of the Court is occupied for many weeks. The Court consists of the Chief Judge and a staff of Judges, Recorders, Native Assessors, Registrars, Clerks, and Interpreters. The Assessors sit on the bench with the Judges and Recorders. It has been the practice of the Court to hold its sittings in such localities as were considered suitable, but the present Government has adopted the method of locating Judges in particular districts. It is believed that this system will facilitate work, and meet the convenience of the Natives concerned. As might be expected, great difficulties have been experienced in dealing with lands belonging to a people emerging from the conditions of life to which the Maoris were accustomed, and a great deal of legislation on the subject has been the result. Probably in no country in the world is there a tribunal like the Native Land Court of New Zealand, and, all things considered, the amount of work it has done has been very considerable.
A Minister of the Crown is charged with Native affairs, and the Native Department is under his control. The Native Land Court is administered by this Minister, but he does not interfere with its judicial functions.
The Native Office is the medium by which the Maoris communicate with the Government on matters relating to their lands, land-disputes, roads, surveys, and other subjects in which they are interested. The Natives are good letter-writers, and do not fail—as the translators of the department well know—to keep up a constant correspondence with the Government. This department also disburses annually the sum of £7,000, set apart by the Constitution Act for Native purposes. The amount is mainly spent in pensions to Natives for valuable services rendered to the Crown, and in providing medical and charitable aid.
The Native question now has lost much of the importance it once possessed. The days of Maori disturbances are happily past, and the whistle of the railway-engine may now be heard in places where the Maoris fought with us in time of war. Flocks of sheep belonging to Natives may now be seen passing along roads in neighbourhoods once the hotbed of disaffection.
The latest feature in Native affairs is the change which has come over Tawhiao, the so-called Maori King. Hitherto he and his people have remained in comparative isolation from the Europeans. He has, however, quite recently seen fit to altar his policy, and has accepted a pension from the present Native Minister. This is looked upon as an auspicious event, and it is hoped that it will lead to the end of the “King movement,” which, although it has lost much of its former power, has, nevertheless, by its existence, tended to maintain an isolation injurious to both races.
| NUMBERS OF THE PRINCIPAL, MAORI TRIBES AND AGES OF THE PEOPLE, ACCORDING TO THE RESULTS OF THE CENSUS OF APRIL, 1691. | |||||||
|---|---|---|---|---|---|---|---|
| Principal Tribe. | Numbers under and over 15 Years. | Total Population. | |||||
| Under 15. | Over 15. | ||||||
|
* Including 119 males and 118 females; ages not specified. † Including 1 male and 1 female; ages not specified. ‡ Including 120 males and 119 females; ages not specified. | |||||||
| Male. | Female. | Male. | Female. | Male. | Female. | Persons. | |
| Arawa | 678 | 564 | 1,369 | 1,102 | 2,047 | 1,666 | 3,713 |
| Muaupoko | 6 | 2 | 45 | 36 | 51 | 38 | 89 |
| Ngatiporou | 628 | 581 | 1,348 | 1,138 | 1,976 | 1,719 | 3,695 |
| Ngatikahungunu | 938 | 796 | 1,963 | 1,497 | 2,901 | 2,293 | 5,194 |
| Ngaiterangi | 235 | 192 | 505 | 384 | 740 | 576 | 1,316 |
| Ngapuhi | 1,357 | 1,205 | 2,095 | 1,657 | 3,452 | 2,862 | 6,314 |
| Ngatimaniapeto | 284 | 256 | 527 | 464 | 811 | 720 | 1,531 |
| Ngatimaru | 203 | 188 | 542 | 416 | 745 | 604 | 1,349 |
| Ngatiawa | 320 | 280 | 806 | 615 | 1,132 | 895 | 2,027 |
| Ngatiraukawa | 291 | 248 | 576 | 484 | 867 | 732 | 1,599 |
| Ngatiruanui | 107 | 67 | 373 | 288 | 480 | 355 | 835 |
| Ngatiwhatua | 72 | 65 | 195 | 139 | 267 | 204 | 471 |
| Rangitane | 14 | 14 | 43 | 27 | 57 | 41 | 98 |
| Rarawa | 41491 | 382 | 701 | 526 | 1,115 | 908 | 2,023 |
| Taranaki | 91 | 65 | 260 | 193 | 351 | 258 | 609 |
| Urewera | 204 | 245 | 418 | 344 | 622 | 589 | 1,211 |
| Waikato | 665 | 636 | 1,502 | 1,120 | 2,167 | 1,756 | 3,923 |
| Whanau-a-Apanui | 142 | 108 | 225 | 221 | 367 | 329 | 696 |
| Whanganui | 310 | 224 | 676 | 537 | 986 | 761 | 1,747 |
| Whakatohea | 101 | 99 | 179 | 167 | 280 | 266 | 546 |
| Unspecified | 40 | 26 | 87 | 53 | 246 | 197 | 443* |
| Others | 17 | 12 | 48 | 29 | 65 | 41 | 106 |
| Population. | |||||||
| North Island | 7,123 | 6,255 | 14,483 | 11,437 | 21,725 | 17,810 | 39,535* |
| Middle Island | 374 | 366 | 598 | 543 | 973 | 910 | 1,883† |
| Stewart Island | 31 | 34 | 41 | 30 | 72 | 64 | 136 |
| Chatham Island Maoris | 22 | 40 | 43 | 43 | 65 | 83 | 148 |
| Morioris | 4 | 2 | 22 | 12 | 26 | 14 | 40 |
| Maori wives living with European husbands | 251 | 251 | 251 | ||||
| Totals | 7,554 | 6,697 | 15,187 | 12,316 | 22,861 | 19,132 | 41,993‡ |
The males under 15 years of age were in the proportion of 33·22 to every 100 of the male population, and the similar proportion among the females was 35·22 per cent.
In the European portion of the population the proportions were: Males under 15 years, 38·08 per cent., and females under 15 years 42·20 per cent., of the totals of the respective sexes.
The variation in the proportions for the two races would seem to indicate that a low birth-rate or high juvenile mortality obtains amongst the Maoris.
Table of Contents
- CROWN LANDS
- AREA OF THE COLONY (IN ACRES)
- LANDS AVAILABLE FOR SETTLEMENT
- CHARACTER OF THE LANDS SUITABLE FOR SETTLEMENT
- CROWN LANDS HELD ON PASTORAL LEASE
- LANDS HELD ON SETTLEMENT CONDITIONS
- NUMBER OF SELECTORS, 1891-92
- OPTIONAL SYSTEM OF LAND-TENURE
- ADMINISTRATION
- LAND DISTRICTS AND PRINCIPAL LAND OFFICES
- CLASSIFICATION OF LANDS
- TENURE
- MODE OF ACQUIRING CROWN LANDS
- CASH LANDS
- DEFERRED-PAYMENT LANDS
- PERPETUAL-LEASE LANDS
- PASTORAL RUNS
- SMALL, GRAZING-RUNS
- SMALL-FARM HOMESTEAD ASSOCIATIONS
- SUMMARY OF LANDS OPEN FOR SELECTION
- AUCKLAND
- HAWKE'S BAY
- TARANAKI
- WELLINGTON
- MARLBOROUGH
- NELSON
- CANTERBURY
- OTAGO
- SOUTHLAND
- WESTLAND
- CROWN LANDS GUIDE
- THE CUSTOMS TARIFF OF NEW ZEALAND
- POSTAL INFORMATION
- TELEGRAPHIC INFORMATION
- TELEPHONE EXCHANGES
- PRINCIPAL EVENTS
THE Crown Lands Department publishes periodically, under the authority of the Minister of Lands, a “Crown Lands Guide.” The object of the publication is to afford such general information as to the character and localities of Crown lands, with the terms and conditions on which they may he obtained, as will enable persons in quest of land to set about its selection without much trouble.
The total area of the colony is nearly 67,000,000 acres, which is held approximately as follows:—
| Acres. | |
|---|---|
| Freehold | 13,592,000 |
| Held by lease, &c., with right of purchase | 1,703,950 |
| Held on lease from the Crown | 12,544,700 |
| Reserved for public purposes | 6,589,150 |
| Crown lands | 8,430,200 |
| Midland Railway Company | 4,000,000 |
| Native lands | 10,850,000 |
| Barren, lakes, &c. | 9,000,000 |
| 66,710,000 |
The lands held on pastoral lease and the unoccupied Crown lands represent the lands which are available for future settlement; the area amounts to 20,974,900 acres, and may be classified as follows:—
| Acres. | |
|---|---|
| Crown lands suitable for close settlement | 2,000,000 |
| Crown pastoral lands for settlement | 5,000,000 |
| Crown lands suited for mixed agriculture and pasture | 13,974,900 |
| 20,974,900 |
The unoccupied Crown lands suitable for settlement which the colony has to deal with at the present day, as a rule, are covered with forest, which has to be cleared before any return can be secured from them. The occupied pastoral lands are generally well grassed, but are mainly suitable for mixed agriculture and pasture. The cost of clearing forest land varies: in the North Island, where most of the clearing is done, it ranges from £1 5s. to £2 per acre.
The occupation of the Crown lands hold for pastoral purposes only on the 31st March, 1892, was—
| No. of Runs. | Acres. | |
|---|---|---|
| North Island | 66 | 314,960 |
| Middle Island | 1,204 | 11,514,239 |
| 1,270 | 11,829,109 |
Held on settlement conditions signifies that the freehold belong to the Crown, but completion of the conditions of improvement at any time enables the holder to buy out the land, except with regard to village-homestead special settlements on perpetual lease and small grazing-runs (see description of tenure further on):—
| No. of Holdings. | Acres. | |
|---|---|---|
| Deferred-payment land | 3,512 | 513,773 |
| Perpetual-lease land | 3,607 | 1,075,413 |
| Agricultural-lease land (on goldfields only) | 88 | 6,606 |
| Village-settlement deferred payment | 458 | 5,434 |
| Village-settlement perpetual lease | 206 | 3,746 |
| Village — homestead special settlements, perpetual lease | 895 | 23,535 |
| Special-settlement associations, deferred payment | 706 | 70,769 |
| Special settlement associations, perpetual lease | 13 | 1,922 |
| Homestead land | 136 | 18,433 |
| Small grazing-runs | 369 | 690,059 |
| 9,990 | 2,409,090 |
During 1891-92 there were 1,953 selectors of Crown land in the colony, who took up holdings of the following sizes:—
| 214 selected under | 1 acre. |
| 581 selected from | 1 to 50 acres. |
| 617 selected from | 51 to 250 acres. |
| 255 selected from | 251 to 500 acres. |
| 187 selected from | 501 to 1,000 acres. |
| 99 selected from | 1,001 and upwards. |
The following figures show the number of selectors who took up land during the past ten years, on improvement conditions:—
| Year ending 31st March. | No. of Selectors. | Area (Acres). |
|---|---|---|
| 1883 | 644 | 89,696 |
| 1884 | 841 | 160,810 |
| 1885 | 872 | 103,208 |
| 1886 | 1,009 | 114,285 |
| 1887 | 2,423 | 287,323 |
| 1888 | 1,577 | 317,932 |
| 1889 | 1,636 | 444,074 |
| 1890 | 1,332 | 348,176 |
| 1891 | 1,221 | 412,409 |
| 1892 | 1,372 | 488,788 |
The average-sized holding for the last few years is 220 acres; and for the whole colony there were in February, 1892, somewhat upwards of forty-one thousand agricultural and pastoral holdings. The number of freeholders has, during the last three years, increased at the average rate of nearly 2,000 per annum.
The monthly average of rural lands selected on improvement conditions is as follows:—
| On deferred payment | 24 selectors, 2,431 acres. |
| On perpetual lease | 75 selectors, 11,545 acres. |
Under the two systems above, most of the rural lands are now selected.
DIGEST OF THE LAND-LAWS.
The following are the principal features of the land-laws of the colony:—
The settlement lands are mostly now dealt with under the system which gives to the selector the option of paying cash, purchasing on deferred payments, or acquiring a perpetual lease with a right to buy the freehold, and most of the lands are selected under the last tenure. Deferred payments and cash follow in the order named, some of the other tenures of the Land Act having almost fallen into disuse.
The Crown lands are administered under the authority of “The Land Act, 1885,” and the amendments of 1887 and 1888, by the Hon. the Minister of Lands, at Wellington. For convenience, the colony is divided into ten land districts, each being under the local direction of a Commissioner and a Land Board. The Commissioner's office is known as the principal land office. In each district there is a principal land office, and in some of the larger districts one or more sub-offices. It is with these land offices the selector has to transact all business, from the first consultation of the maps, the subsequent selection and purchase of land, to the final receipt of the Crown grant.
The names of the land districts and of the towns where each principal office is situated are, beginning with the most northerly and taking them geographically, as under:—
| Land District. | Town where Principal Land Office is situated. |
| Auckland | Auckland. |
| Taranaki | New Plymouth. |
| Hawke's Bay | Napier. |
| Wellington | Wellington. |
| Nelson | Nelson |
| Marlborough | Blenheim. |
| Canterbury | Christchurch. |
| Otago | Dunedin. |
| Southland | Invercargill. |
| Westland | Hokitika. |
Crown lands are divided into three classes:—
Town and village lands, being sites reserved for towns and villages (sold at auction).
Suburban land, being land in the vicinity of any town lands (generally sold at auction).
Rural land, being land not reserved for towns or villages or other public purposes, designated either first- or second-class land, according to quality (generally offered for selection on a day publicly notified, at an upset advertised price).
Rural lands are, after forty-five days' notification, open on application either for cash, deferred payments, or perpetual lease, at the option of the applicant.
If the whole of the lands are not selected on the day appointed the balance remains open for selection at the upset price at any time thereafter, and on either of the three tenures given above, at the option of the selector.
The following is the manner of acquiring Crown Lands:—
1. By application—or free selection, as it is frequently termed—a form (to be obtained at any land office) is filled in, and signed by the applicant or his agent, stating the tenure on which the land is wanted. All applications for surveyedland are deemed simultaneous if made on the same day, and, if there be more than one application, the right to occupy will be decided by lot. In the case of unsurveyed lands, priority of application determines the right thereto.
Nearly all rural lands are now dealt with under these systems—that is, free selection; and the ballot system of determining the right to occupy, here described, applies equally to the deferred-payment and perpetual-lease systems referred to further on.
If lands are previously notified (i.c., declared to be open for sale or selection under the three systems), no person can acquire for cash a greater area on application than 640 acres of first-class land, and 2,000 acres of second-class land in any one land district.
2. Land which has not been notified under the Act of 1887 may be sold either on application or by auction, without restriction as to the area that may be purchased. If by auction, it must have been previously surveyed and marked off on the ground into definite areas, or “sections.”
If the lands have been surveyed and notified they are acquired, as above; one-fifth of the price is paid in with the application, and the remaining four-fifths, with Crown-grant fee, within thirty days. If unsurveyed, the cost of survey is paid in with the application, and counts as part of the purchase-money. On completion of survey, the balance, together with Crown-grant fee, being paid, completes the transaction.
Application is made first as in the case of cash lands; but 25 per cent. has to be added to the upset cash prices as advertised, to arrive at the deferred-payment prices, and with the application must be deposited the first half-year's instalment and license-fee of £1 1s.
If the land is not surveyed the survey-fee has to be paid in with the application, which goes towards purchase of the land.
The principal features of the deferred-payment system are: Any person of the age of seventeen years and upwards may become a selector, on making the statutory declaration in section 113, and who is not disqualified in terms of sections 108 and 100 of “The Land Act, 1885.”
The size of allotment is, subject to the Land Act, determined by the Governor. If suburban land, an allotment must not exceed 20 acres; if rural agricultural land, 640 acres—to which area a selection is restricted.
The price per acre on deferred payment of suburban land is not less than £4 10s.; of rural land, not less than 18s. 9d. for first-class, and for second-class land generally from 7s. 6d. to £1 per acre.
The deferred payments are made in equal instalments, every six months over which the period extends.
In suburban land this is five years; therefore there are ten instalments, payable one each on the 1st January and the 1st July of each year for five years.
It rural land the period is ten years, and therefore there are twenty equal instalments, payable one each on the 1st January and the 1st July of each year. Thus, for example, if the land was offered for application at £1 an acre, the selector would have 1s. per acre to pay every six months for ten years. Licenses may be extended for a further period of four years on application to the Commissioner, and the payments spread over such extended period. One-third of the money as received is paid over to the County Council or Road Board of the district, to be expended on roads and bridges leading to or opening up such lands or for water-supply.
Residence on the land by the purchaser must begin within six months of issue of license, and continue, in the case of suburban land, for four years, and in rural land for six years. But these periods can be shortened if, on effecting all the improvements (particulars of which are given at page 284), the purchaser pays up the remaining instalments of the purchase-money. Residence is not compulsory if the purchaser is residing on another deferred-payment section any part of which is within three miles of his subsequent selections. But residence may be dispensed with altogether where land is wholly or mostly covered with bush or is a swamp, or if the purchaser effects double the value of the improvements prescribed for each year.
Any selector who has complied with all the conditions of his purchase for a period of one year may apply to have the value of the unpaid instalments capitalised (full particulars of which may be obtained at any land office), at the present value of an annuity or annuities of the same amount as the payments required to be made by the selector, and payable for the same period. Interest is there-after payable at the rate of 5 per cent. per annum by the selector, instead of the half-yearly instalments above referred to. Interest is payable on the 1st January and the 1st July in each year. After the capitalised value has been ascertained, any selector may, on the 1st January or the 1st July, pay any portion of such capitalised value in sums of not less than £10, and thereafter the interest payable shall be proportionately reduced. Any time after effecting improvements, and within eighteen years of the date of his license, the selector is entitled to his Crown grant, provided he has paid the whole of the capitalised value, together with interest on the due dates; or he may exchange the deferred-payment license for a perpetual lease, in which case all past payments go to credit of rent.
A license is issued to the selector as soon as may be after selecting the land.
Applications are made in manner precisely similar to that for cash or deferred payment, on forms provided at the land offices. 2 1/2 per cent. of the value of the land, to represent the first half-year's rent, together with £1 10s. license-fee, must accompany the application if for surveyed land, and if for unsurveyed land the survey-fee. This latter fee goes towards reducing the price of the land.
The main features of this system of leasing Crown lands are as follow:—
By securing to lessees the value of their improvements on an indefeasible title, with perpetual rights of renewal, they have all the security and permanence of freehold tenure, without requiring to sink any capital in the purchase of the land.
Any person of the age of seventeen years or upwards may become a lessee.
The annual rent is by law 5 per cent. on the capital value of the land; thus, land valued at £1 per acre would be leased at a rental of 1s. per acre per annum.
If a lease is not executed within thirty days from the day of the acceptance of the application, or within fifteen days of the date on which it may be ready for execution, the deposits made with the application shall be forfeited.
No person who owns the freehold of or who holds a license or lease from the Crown of land which, together with the area of the lands applied for, comprises a greater area than 640 acres of first-class or 2,000 acres of second-class land shall be capable of becoming a lessee.
Every lease shall be for a fixed term, so as to expire on the 30th June after the expiration of thirty years from the date of the commencement of the term.
All leases are renewable under the following conditions: Before the end of the thirty years, a valuation of the fee-simple of the land, less improvements, is made, and an offer of a new lease for another twenty-one years, at a rent of 5 per cent., is made to the tenant. If the lease is refused by the holder, it is put up to auction, burdened with the value of improvements, which has to be paid by the incoming tenant to the Receiver of Land Revenue, and by him to the outgoing tenant when the transfer has been accomplished.
All rents are payable to the Receiver of Land Revenue of the district, in equal half-yearly instalments, in advance on the 1st January and the 1st July in each year.
One-third of the rents paid during the first fifteen years of each lease are handed over to the County Council or Road Board of the district, to be expendedon roads and bridges leading to or opening up the land leased, or on water-supply. Lessees shall be liable for all rates, taxes, or assessments of any kind whatsoever.
No lessee may transfer, sub-let, or otherwise part with his lease, neither is a mortgagee capable of entering into possession or of foreclosing, nor a trustee in bankruptcy or a sheriff or any other officer of a Court entitled to sell by virtue of any process of Court, until the statutory declarations prescribed by the Act have been deposited with the Commissioner of Crown Lands.
Surrenders of leases are permitted with the consent of the Land Board.
Lands which have been leased may be resumed for public purposes on payment of compensation, to be fixed by arbitration, an abatement of rent being allowed in the proportion that the area of land resumed bears to the whole area leased.
Every lessee is required to reside upon the land leased within six months of the commencement of his term, and to continue such residence for a period of six consecutive years thereafter. The Board may, however, in the case of bush or swamp-lands, dispense with residence for two years; or, in the case of youths living with their parents or near relatives, until three years after the commencement of their term; or may dispense with residence altogether, if the lessee resides on lands contiguous to the land leased, or if he makes twice the amount of improvements required by the Act.
Any lessee holding land, which does not interfere with gold-mining, or which is not an education or endowment reserve, has the right of purchase whenever he shall have fulfilled all the conditions of improvement, at the price fixed at the time when the lease is granted; such price to be the capital value on which he has paid rent at 5 per cent.
Suburban.—Must bring into cultivation not less than a tenth of the allotment the first year, one-fifth the second year, and, within four years, must have three-fourths cultivated, the whole fenced, and have made substantial improvements to the value of at least £10 per acre.
Rural: First Class.—Must bring into cultivation not less than one-twentieth the first year, one-tenth the second year, and, within four years, must have cultivated one-fifth, and within six years, in addition to the cultivation of one-fifth, have effected permanent improvements to the value of £1 per acre; or the whole of the improvements may be effected at any time, and the title obtained.
Rural: Second Class.—Must effect substantial improvements to a value equal to 10 per cent. of the value of the land within one year from the date of the license, another 10 per cent. within the second year, and a third 10 per cent. before the end of the sixth year.
The term “substantial improvements of a permanent character” means and includes reclamation from swamps, clearing of bush or scrub, cultivation, planting with trees or live hedges, the laying-out and cultivation of gardens, fencing, draining, making roads, sinking wells or water-tanks, constructing water-races, or in any way improving the character or fertility of the soil, or the erection of any building. This definition of the term improvements applies to all classes of land where improvements are required by the Crown as part of the contract.
“Cultivation” means the clearing of land for cropping, or clearing and laying down with artificial grasses.
Under this system the settler makes no payment for the land, the only cost to him being the expenses of survey. On the fulfilment of conditions, which are five years' residence, the erection of a house, and the cultivation of one-third of the selection if open land, and one-fifth if bush-land, the Crown grant is issued.Any person of the age of eighteen years or upwards may select from 75 to 50 acres, according to quality of land, and a person under eighteen years of age 30 to 20 acres: Provided that no family or household shall have more than 200 acres of first-class or 300 acres of second-class lands. Selectors on the homestead system are debarred from obtaining land on the deferred-payment or perpetual-lease system; nor can any one who has obtained land on these systems, or who is the owner of freehold land, obtain land under the homestead system.
Are exposed for sale by auction twelve months before the expiration of the existing licenses or leases, at an upset rent. No larger extent of land than will be sufficient to carry all the year round twenty thousand sheep, or five thousand head of cattle, can be offered in one lot.
In the event of an existing licensee not acquiring the license for the run he occupies when it is submitted to auction, he shall be entitled to compensation for necessary buildings, plantations, fences, and ditches for draining, made on the lands, to be paid by the incoming tenant before being let into possession: But the amount of compensation paid may not in any case exceed three times the amount of the average annual rent paid under the existing lease or license. No claim for compensation for improvements can be made either against the Crown or any Land Board.
Pastoral lands are usually classified into first- and second-class country. First-class lands are let for a certain fixed term; second-class runs are let for a term, but may be resumed if required for sale.
The term of lease may be for any period not exceeding twenty-one years; and there is no restriction as to the number of leases any one may hold.
The essential features in this system are—absolute lease for twenty-one years, without any right of determination on the part of the Government; full valuation for improvements at the end of the lease; the right to cultivate the land in addition to the exclusive right of pasturage; no right of purchase of any part of the land in the lease, but the right to select 150 acres around the homestead through which no road can be taken or other public privilege exorcised without payment of compensation to the lessee.
Runs are not to exceed in area 20,000 acres, and are let by public auction, on the following conditions:—
The lease is for twenty-one years, and at the end of that term a renewal for a second term of twenty-one years, at a rent to be fixed by valuation, may be offered. If the offer be refused, the lease is put up to auction, burdened with the valuation for improvements, to be paid by the incoming tenant. In any case, where it is determined that the run shall not again be offered for further lease, the outgoing tenant is paid the value of his improvements by the Government.
The upset rent is 2 1/2 per cent. of such price as the Land Board and Governor may agree upon, not being less than the price of Crown lands in the district; which means that the upset rent may vary from 1 1/2d. per acre upwards.
No person is allowed to lease more than one run.
Residence on the run is compulsory within twelve months of the commencement of the lease, and thereafter for six years, unless the lessee resides on land in his occupation within ten miles of the run leased by him.
Improvements have to be effected equal in value to four years' rental by the end of the first six years of the lease. Thereafter there is no condition of residence or improvement obligatory, the only condition for the remainder of the term being payment of rent. One-fourth of the rent paid for the first fifteen years is returned to the County Council or Road Board as received, to be expended on roads or bridges leading, to or opening up the lands leased.
Any association of persons of not less than twelve may arrange for a block of land, to contain not less than 1,000 acres, nor more than 11,000 acres, to be held under lease, with perpetual right of renewal, but with no right to acquire the freehold. The number of persons to be located in each block must not be less than one for every 200 acres of the total area.
Land will be disposed of at a rental to be arranged between the Minister of Lands and the association, being 5 per cent. on a capital value of not less than £1 an acre. Provision is made so that rent need not be paid for the first two years, by allowing it to be collected at a later period or adding the sum to the capital value. A deposit of 10s. per member must be made at the time of application.
Residence must commence within six months from date of allotment, except in bush-lands, when it is not compulsory for the first two years.
Improvements are required as follows: Within two years, not less than one-tenth of land selected must be cultivated; within four years, one-fifth; within six years, in addition to the cultivation of one-fifth, permanent improvements of a value of £1 for every acre must be placed upon each holding.
No person can become a settler under this system who is a holder of land on deferred payments, or who has acquired any freehold under that system, or who is the holder of land on perpetual lease, or who is the owner of a pre-emptive right or the owner in fee of any land in New Zealand which, together with the land included in his application, would exceed 320 acres.
There are other systems on which land may be acquired, particulars of which can be procured at all land offices in the colony, but those which are described above are the most popular.
Schedules of lands open may be obtained at any of the land offices in the colony, and plans of the sections may be inspected at the land office for the district in which such lands are situated.
SURVEY CHARGES ON UNSURVEYED LANDS.
The following rules, regulations, and orders shall extend and apply to unsurveyed rural lands open for purchase or selection.
The following charges for surveys of such lands are hereby imposed:—
Not exceeding 30 acres, £6.
Exceeding 30 and up to 50 acres, 3s. 6d. per acre, but not less than £6.
Exceeding 50 and up to 100 acres, 3s. per acre, but not less than £8 15s.
Exceeding 100 and up to 200 acres, 2s. 6d. per acre, but not less than £15.
Exceeding 200 and up to 300 acres, 2s. per acre, but not less than £25.
Exceeding 300 and up to 500 acres, 1s. 8d. per acre, but not less than £30.
Exceeding 500 and up to 1,000 acres, 1s. 4d. per acre, but not less than £41 10s.
Exceeding 1,000 and up to 2,000 acres, 1s. per acre, but not less than £66 10s.
For the survey of any area of rural land, being open land, the scale of charges shall be two-thirds the foregoing rates.
Incase any questions shall arise as to what lands are included in the expression “open land,” the same shall be settled by the Surveyor-General, whose decision shall be conclusive.
All such charges shall, at the time of making application to purchase or select such land, be paid by the applicant to a Receiver of Land Revenue for the district in which the land is situated, and shall be dealt with and disposed of in accordance with the regulations from time to time in force under “The Land Act, 1885,” or its amendments relating to deposits for surveys.
Where the Commissioner declines, under section 18 of “The Land Act Amendment Act, 1887,” to allow an applicant to have the land applied for surveyed at his own expense, then the scale of charges imposed by these regulations shall apply to any such case.
Where application is made to select unsurveyed rural lands upon deferred payment or on perpetual lease, the survey charges shall be made on the scale hereby imposed, or the Commissioner may allow the applicant to have the land surveyed at his own expense, as provided by section 18 of “The Land Act Amendment Act, 1887; “ and. in either of such cases, the cost of survey shall be deducted from the cash value of the land so selected.
Should the land so selected be reserved or withdrawn from sale, the applicant shall be repaid the cost of the survey according to the scale imposed by these regulations, or that may have been paid by him if the survey has been made under section 18 aforesaid; but, should the applicant in any case refuse or delay to complete such selection after survey, he shall forfeit the cost of such survey.
On the 1st January, 1892, Crown lands suitable for settlement, amounting to 920,806 acres, were open for selection in the ten land districts of the colony, nearly the whole of which may be selected under the three systems already referred to—i.c., cash, deferred payment, or perpetual lease, at the option of the selector:—
There are about 352,667 acres now open for selection, either as surveyed or unsurveyed land, in sections of sizes varying from a few acres up to the limit of 2,000 acres. The greater portion of this land is covered with forest, sometimes heavy, sometimes light; generally with enough timber scattered through it to provide for fencing and building. The soil varies very much in different districts, from poor clays, or light soils, up to good agricultural lands, and the prices vary also from 5s. per acre up to about £2 per acre, according to quality of soil, accessibility, &c.
In this district there are 38,257 acres now open for selection, generally on the same systems as above. The lands are mostly open or interspersed, with bush, and are situated in various parts of the district. The soil is generally good, the surface somewhat broken, and therefore more suited for pastoral than agricultural purposes. The sections vary in sizes as above, with prices ranging from 5s. to £2 per acre, according to locality, &c.
In this land district, on the west coast of the North Island, there are 3,664 acres open for selection. These lands are wholly bush-covered, the forest ranging from heavy timber to light bush, interspersed with old Native clearings. The soil is good, and much of it volcanic, while some is a kind of marl locally called papa. In the latter country the surface is frequently broken, but makes excellent grazing country. Prices vary from 10s. to £2 per acre, according to situation and character of land.
The lands open for selection in this district comprise 87,166 acres, either surveyed or unsurveyed, scattered in various parts of the district, and are of various qualities, but nearly always good. The land is mostly covered with forest, a good deal of it broken, but well suited for grazing purposes, the soil being good, and often formed by the papa or marl before referred to, or by decomposed slates. The limestone lands of the eastern district are very rich, and take grass remarkably well. Prices vary from 10s. up to £2 an acre, according to position and quality.
The lands now open for selection—9,313 acres—consist principally of forest-clad hills, situated in the bays and sounds of the, northern part of the Middle Island; the soil is generally fair. The prices vary from 10s. to £1 10s. per acre.
In the Nelson District the area now open for selection is 257,481 acres, in sections of various sizes up to the limit allowed. These lands may be selected for cash, or under the 10-per-cent. leasing system peculiar to Nelson. The general description of the Nelson lands is hilly country, covered with bush, chiefly birch, and mostly suited for grazing purposes. The prices vary from 6s. up to £2 per acre. Practically, there are largo areas in Nelson which are open for selection before survey, on a system which refers to the Nelson lands alone.
In this district there are 27,678 acres open for selection at the present time: nearly the whole of it is on the Canterbury Plains, and is open land, level or undulating, the quality varying a good deal. The price of some of this land is £2 per acre, and it can only be purchased for cash. Some of it, however, is available for selection under the three systems already referred to. These lands are also open and generally grassed; the soil is good, but it varies somewhat in different localities.
There is also in this district a very large area of education endowments open for selection on the same terms as the ordinary Crown lands, namely, at £2 an acre cash. These endowment lands are dealt with by the Commissioner of Crown Lands at Christchurch.
In the beginning of 1893, a further area of about 25,300 acres will be ready for disposal on settlement conditions.
The area open for selection, amounting to about 57,490 acres, is scattered about in various parts of the district, and for the greater part the land is open and generally of good quality, to a certain extent in natural grasses. In the south-eastern parts of the district—Catlin's River—a considerable area of forest-land of good quality is now open, or in process of being prepared for selection; and as these lands are of good quality, and within from twelve to twenty-five miles of a railway-station, it is expected that a good deal of settlement will take place. The prices of land in Otago vary from 10s. to £1 10s. an acre, according to locality and quality.
In the beginning of 1893 about forty-three runs, chiefly situated in the interior, and containing an area of about 242,000 acres, will be opened for settlement.
In this, the southern land district, there are about 87,000 acres open for selection at the present time, the most of it for cash: but still there are a number of sections opened under the three systems mentioned above, at prices varying from 10s. to £2 an acre. The character of the soil varies a good deal, from alluvial flats to hill-slopes, which are sometimes open and covered with natural grass, at others under forest.
Early in 1893, thirty-four runs, of an area of 152,000 acres, the leases of which fall in then, will be open for settlement as grazing-runs and smaller settlement.
The lands open for selection in this district amount to about 89,070 acres, and they are principally in the southern part. Most of the district is covered with heavy forest, and the lands now open for selection are in their nature hilly and broken, or are river-flats, where the soil is very good. Mining, however, is the principal industry on this coast. Prices vary from 10s. to £1 per acre.
The “Crown Lands Guide,” published yearly, has now reached its twelfth issue. The price is 1s. In addition to the foregoing, the “Guide” also gives instructions to and general information for intending applicants for Crown lands, conditions relating to the occupation of Crown lands on the deferred-payment and perpetual-lease systems, and a brief general description of the lands now open for selection in each provincial district, together with the ruling prices. There is an accompanying map, which shows on a small scale the land districts, principal towns, railway-lines, and the land for sale and in preparation for sale. The information contained in the “Guide” is compiled and corrected quarterly for each land district, and published in pamphlet form, copies of which can be obtained free on application at any land office.
[Under “The Customs and Excise Duties Act, 1888.”]
NOTE.—The word “iron,” where used in this Schedule or in Schedule B, includes steel, or steel and iron combined. The letters n.o.e mean “not otherwise enumerated.”
ACID, acetic, 1 1/2d. the lb.
Acid, tartaric, 1d. the lb.
Aërated and mineral waters and effervescing beverages, £20 per cent. ad valorem
Ale, porter, beer of all sorts, cider, and perry, the gallon, or for six reputed quart bottles, or twelve reputed pint bottles, 1s. 6d. the gallon
Almonds, in the shell, 2d. the lb.
Almonds, shelled, n.o.e., 3d. the lb.
Apothecaries' wares, £15 per cent. ad valorem
Apparel and ready-made clothing, and all articles n.o.e. made up wholly or in part from textile or other piece-goods, £25 per cent. ad valorem
BACON and hams, 2d. the lb.
Bags, flour, £20 per cent. ad valorem
Bags, calico, forfar, hessian, and linen, £20 per cent. ad valorem
Bagging and bags n.o.e., £15 per cent. ad valorem
Baking-powder, £15 per cent. ad valorem
Baskets and wickerware, £20 per cent. ad valorem
Bellows other than forge, £15 per cent. ad valorem
Bicycles, tricycles, and the like vehicles, £20 per cent. ad valorem
Biscuits, ships' plain and unsweetened, 3s. the cwt.
Biscuits, other kinds, 2d. the lb.
Bitters, in bottles, jars, or other vessels packed in cases or other packages, 16s. the liquid gallon
Bitters, in bulk, 15s. the liquid gallon
Blacking and boot-gloss, £20 per cent. ad valorem
Blacklead, £20 per cent. ad valorem
Blankets, £20 per cent. ad valorem
Blocks, wooden tackle, £20 per cent. ad valorem
Blue, 2d. the lb.
Boiled sugars, comfits, lozenges, Scotch mixtures, and sugar-candy, 2d. the lb., including internal packages
Boilers, land and marine, £20 per cent. ad valorem
Boots, shoes, slippers, goloshes, clogs, and pattens, n.o.e., £20 per cent. ad valorem
Boot and shoe vamps and uppers and laces, £20 per cent. ad valorem
Brass cocks, valves, unions, lubricators, and whistles, £20 per cent. ad valorem
Brass manufactures n.o.e., £20 per cent. ad valorem
Brooms and brushes n.o.e., £20 per cent. ad valorem
Brushware n.o.e., £20 per cent. ad valorem
Buckets and tubs, of wood, £20 per cent. ad valorem
CANDIED peel, 5d. the lb.
Candles, 2d. the lb. or package of that reputed weight, and so in proportion for packages of greater or less reputed weight
Capers, £20 per cent. ad valorem
Caps, apparel, £20 per cent. ad valorem
Caps, percussion, 1s. the thousand
Cards, playing, 6d. the pack
Carpetbags, £20 per cent. ad valorem
Carpets, £15 per cent. ad valorem
Carraway seeds, £15 per cent. ad valorem
Carriages, carts, drays, wagons, and perambulators, and wheels for the same, £20 per cent. ad valorem
Carriage-shafts, spokes, felloes, and naves or hubs, bent wheel-rims, and other bent carriage-timber, n.o.e., £15 per cent. ad valorem
Cartridges and cartridge-cases, £15 per cent. ad valorem
Catsup, £20 per cent. ad valorem
Cement, 2s. the barrel
Chaff, £1 the ton
Chaff-cutters, corn-crushers, and corn-shellers, £20 per cent. ad valorem
Chicory, 3d. the lb.
China, porcelain, and parianware, £20 per cent. ad valorem
Chocolate, 3d. the lb.
Chocolate confectionery, and all preparations of chocolate or cocoa, 3d. the lb., including internal packages
Chutney, £20 per cent. ad valorem
Cigars and cigarettes, 7s. the lb.
Clocks, £20 per cent. ad valorem
Cocoa. 3d. the lb.
Coffee, raw, 3d. the lb.
Coffee, roasted, 5d. the lb.
Coffee, essence of, £15 per cent. ad valorem
Collars and cuffs, of paper or other material, £25 per cent. ad valorem
Composition piping, 3s. 6d. the cwt.
Confectionery n.o.e., 2d. the lb., including internal packages
Copper manufactures n.o.e., £20 per cent. ad valorem
Copying-presses, £15 per cent. ad valorem
Cordage and rope, n.o.e., £20 per cent. ad valorem
Cordials, in bottles, jars, or other vessels, packed in cases or other packages, 16s. the liquid gallon
Cordials, in bulk, 15s. the liquid gallon
Corks, bottling, £15 per cent. ad valorem
Cotton counterpanes, £20 per cent. ad valorem
Cotton piece-goods, n.o.e., £10 per cent. ad valorem
Crab-winches, cranes n.o.e., capstans, and windlasses, £20 per cent. ad valorem
Cream of tartar, 1d. the lb.
Curry powder and paste, £20 per cent. ad valorem
Cutlery, £20 per cent. ad valorem
DESKS, £20 per cent. ad valorem
Doors, plain, 2s. each
Doors, glazed with ornamental glass, 4s. each
80. Drainage pipes and tiles, £20 per cent. ad valorem
Drained peel, 3d. the lb.
Drapery n.o.e., £20 per cent. ad valorem
Drawings, £15 per cent. ad valorem
Dressing-cases, £20 per cent. ad valorem
Drugs and druggists' sundries, £15 per cent. ad valorem
Drugget, £15 per cent. ad valorem
EARTHENWARE, stoneware, and brownware, £20 per cent. ad valorem
Earthen flooring and garden tiles, £20 per cent. ad valorem
Earthen gas-retorts, £20 per cent. ad valorem
Essences, flavouring, £15 per cent. ad valorem
FANCY goods, and toys, £20 per cent. ad valorem
Feathers, ornamental, including ostrich, £25 per cent. ad valorem
Filters, £20 per cent. ad valorem
Firearms: Fowling-pieces, rifles, and other kinds, £15 per cent. ad valorem
Firebricks n.o.e., fireclay ground, and fireclay goods, £20 per cent. ad valorem
Fireworks n.o.e., £20 per cent. ad valorem
Fish, dried, pickled, or salted, n.o.e., 10s. the cwt.
Fish, potted and preserved, 2d. the lb. or package of that reputed weight, and so in proportion for packages of greater or less reputed weight
Fish-paste, £20 per cent. ad valorem
Floorcloth, £15 per cent. ad valorem
Fruit, fresh, namely, apples, pears, plums, cherries, peaches, nectarines, apricots, quinces, tomatoes, and lemons, 1/2d. the lb.
Fruits, dried, 2d. the lb.
Fruits, preserved in juice or syrup, £20 per cent. ad valorem
Fruit pulp and partially-preserved fruit n.o.e., 1 1/2d. the lb.
Fruit preserved by sulphurous acid, 1/2d. the lb.
Furniture and cabinetware n.o.e. and other than iron, £25 per cent. ad valorem
Furniture knife and plate powder and polish, £15 per cent. ad valorem
Furs, £25 per cent. ad valorem
GALVANISED-IRON manufactures n.o.e., £25 per cent. ad valorem
Gaspipes, iron, £5 per cent. ad valorem
Gelatine, £15 per cent. ad valorem
Glass, crown, sheet, and common window, 2s. the 100ft. superficial
Glass, plate, polished, coloured, and other kinds, n.o.e., £15 per cent. ad valorem
Glassware, £15 per cent. ad valorem
Globes and chimneys for lamps, £15 per cent. ad valorem
Glucose, 1d. the lb.
Glue and size, 1 1/2d. the lb.
Glycerine, refined, £15 per cent. ad valorem
Grain, namely, barley, 2s. the 100lb.
Grain and pulse of every kind n.o.e., 9d. the 100lb.
Grain and pulse of every kind, when ground or in any way manufactured, n.o.e., 1s. the 100lb.
Greenstone, cut and polished, £20 per cent. ad valorem
HABERDASHERY n.o.e., £20 per cent. ad valorem
Hair brushes and combs, £20 per cent. ad valorem
Hardware, ironmongery, and holloware, £20 per cent. ad valorem
Harness, £20 per cent. ad valorem
Harness oil and composition and leather-dressing, £15 per cent. ad valorem
Hats, £20 per cent. ad valorem
Honey, 2d. the lb.
Hops, 6d. the lb.
131. Hosiery n.o.e. £20 per cent. ad valorem
Handbills, programmes and circulars, playbills and printed posters, £20 per cent. ad valorem
INK, writing, £20 per cent. ad valorem
Iron bridges and iron material n.o.e., for the construction of bridges, wharves, jetties, or patent slips, £20 per cent. ad valorem
Iron fencing-wire, 1s. the cwt.
Iron barbed fencing-wire, 2s. the cwt.
Iron gates and gate-posts, staples, standards, straining posts and apparatus, £20 per cent. ad valorem
Iron columns for buildings, and other structural ironwork, £20 per cent. ad valorem
Iron doors for safes and vaults, £20 per cent. ad valorem
Iron galvanised tiles, ridging, guttering, and spouting, £20 per cent. ad valorem
Iron galvanised corrugated sheets, screws, and nails, 2s. the cwt.
Iron plain galvanised sheet and hoop, 1s. 6d. the cwt.
Iron nails, 2s. the cwt.
Iron pipes, and fittings for same, wrought, £5 per cent. ad valorem
Ironwork and wirework, £20 per cent. ad valorem
Iron tanks, 10s. each
Iron tanks of and under 200 gallons, 5s. each
Iron weighbridges for carts, £20 per cent. ad valorem
Isinglass, £15 per cent. ad valorem
JAMS, jellies, marmalade, and preserves, 2d. the lb. or package of that reputed weight, and so in proportion for packages of greater or less reputed weight
151 Japanned and lacquered metalware, £25 per cent. ad valorem
Jewellery, £20 per cent. ad valorem
LAMPS, lanterns, and lamp-wick, £15 per cent. ad valorem
Lawn-mowers, £20 per cent. ad valorem
Lead in sheets, 1s. 6d. the cwt.
Lead piping, 3s. 6d. the cwt.
Leather, chamois, £15 per cent. ad valorem
Leather—
Bolting and belt, harness, bridle, legging, and bag leather, 6d. the lb.
Kip (other than East India kip), cordovan, kangaroo (tanned), levant cow and horse hides, 3d. the lb.
Buff, split, roans, persians, sheepskins or basils, lambskins and goatskins (dressed), 2d. the lb.
N.o.e., including sole-leather and East India kip, 1d. the lb.
Leather bags, £20 per cent. ad valorem
Leather cut into shapes, £20 per cent. ad valorem
Leather-cloth bags, £20 per cent. ad valorem
Leather leggings, £20 per cent. ad valorem
Leather manufactures n.o.e., £20 per cent. ad valorem
Liqueurs, in bottles jars, or other vessels, packed in cases or other packages, 16s. the liquid gallon
Liqueurs in bulk, 15s. the liquid gallon
Liquorice, £15 per cent. ad valorem
Looking-glasses, £15 per cent. ad valorem
Lime and lemon, juice, sweetened or aërated, £20 per cent. ad valorem
MACHINERY n.o.e., £20 per cent. ad valorem
Magic-lanterns and dissolving-view apparatus and slides, £20 per cent. ad valorem
Maize, 9d. the 100lb.
Maizena and cornflour, 1/4d. the lb.
173. Malt, 2s. the bushel.
Mantelpieces, £20 per cent. ad valorem
Marble, granite, and other stone, sawn on not more than two sides, and not dressed or polished, £5 per cent. ad valorem
Marble, granite, and other stone dressed or polished, and articles made therefrom, £20 per cent. ad valorem
Matches—
Wooden: In boxes containing not more than 60 matches, 1s. the gross of boxes
In boxes containing over 60 and not more than 100 matches, 2s. the gross of boxes
In boxes containing more than 100 matches for every 100 matches or fraction thereof contained in one box, 2s. the gross of boxes
Wax: “Plaid vestas “ in cardboard boxes containing under 100 matches, 1s. 4d. the gross of boxes
“Pocket vestas” in tin or other boxes containing under 100 matches, 2s. the gross of boxes
“Sportsman's,” “ovals,” and “No. 4 tins vestas “ in boxes containing not more than 200 matches, 5s. 6d. the gross of boxes
Other kinds, for every 100 matches or fraction thereof contained in one box, 2s. 9d. the gross of boxes
Mats, £15 per cent. ad valorem
Matting, £15 per cent. ad valorem
Meats, potted or preserved, £20 per cent. ad valorem
Metal manufactures, namely, air-gratings, ash-pans, barrow-wheels, bill-files, brackets, bolts and nuts, blacksmiths' tongs, boat-hooks, copper boilers and furnaces, bolt-rings, lifting bottle-jacks, wrought-iron braces, copper and brass branch-pipes, brazed copper pipes, cake-rollers, camp-ovens and three-legged pots, cast iron of all sorts moulded (n.o.e.), castings of steel (n.o.e.), cast-iron cylinders, wrought-iron cisterns, coal scoops and scuttles, contractors' forgings, condensers for salt water and steam-engines, wire and steel cork-drawers, crowbars, blacklead crucibles, campers and frames, doorknockers, porters and scrapers, drain grates and frames, drain gratings, dumb-bells, engine castings (n.o.e.), engineers' forgings (n.o.e.), fenders, fire-dogs, fire-guards, flower-stands, fittings for pumps engines and machinery (n.o.e.), garden reels rollers seats and syringes, grates, gridirons, grindstone fittings, gun-metal engine fittings, napping quartz and spalling hammers, hasps and staples, hat-stands, heel- and toe-plates, holdfasts, hook-and-eye hinges, horseshoes, hay-rakes and horse-rakes, horse-power gear, hydraulic mains, kitchen-ranges and colonial ovens, lamp-posts, leadenware, wrought-iron or steel letters and figures, forged levers, connecting or split links, hydraulic lifts, manger rings, mangles, marine engine-cranks and pillars, maul rings, meat-hooks, monkeys for pile-driving, ornamental gratings, painted and brass casings for engines, pepper malt bean and oat mills, picks and mattocks, pulley-blocks, quarry mauls and picks, quoits, railway chairs bolts fastenings and rail-dogs, connecting-rods, roller-skates, sack-trucks, iron safes and boxes, sash-weights, bright wrought-iron shafting, iron sluice-valves, soldering-irons, iron stands, stamped ironware n.o.e., stench-traps, troughs, truck wheels, cast tue-irons, wedges, wrought-iron wheelbarrows and wheels, £20 per cent. ad valorem
Milk, preserved, £20 per cent. ad valorem
Millinery, viz., trimmed hats, caps, and bonnets, £20 per cent. ad valorem
Millinery n.o.e., £20 per cent. ad valorem
Musical instruments, namely, organs, harmoniums, and pianofortes, and parts of either (except action-work not made up), £20 per cent. ad valorem
Musical instruments n.o.e., £15 per cent. ad valorem
Mustard, 2d. the lb.
NAILS n.o.e., 3s. the cwt.
Naphtha, 6d. the gallon
190. Nets and netting, £20 per cent. ad valorem
Nuts of all kinds, except cocoanuts, 2d. the lb.
OIL mineral, 6d. the gallon
Oil olive, in bulk, 6d. the gallon
Oil perfumed, £25 per cent. ad valorem
Oil vegetable, in bulk, n.o.e., 6d. the gallon
Oil vegetable or other, in bottle, £15 per cent. ad valorem
Oil n.o.e., 6d. the gallon
Olives, £20 per cent. ad valorem
Opium, £2 the lb.
200: Oysters, preserved, 2d. the lb. or package of that reputed weight, and so in proportion for packages of greater or less reputed weight
PAINTINGS, framed or unframed, £15 per cent. ad valorem
Paints and colours ground in oil, 2s. the cwt.
Paints and colours mixed ready for use, 4s. the cwt.
Paper bags, coarse, including sugar-bags, 7s. 6d. the cwt.
Paper bags n.o.e., £25 per cent. ad valorem
Paperhangings, £15 per cent. ad valorem
Paper, wrapping, brown, 4s. the cwt.
Paper, wrapping, other kinds, including cartridge, small hands, and sugar- paper, 5s. the cwt.
Paper, writing, n.o.e., £15 per cent. ad valorem
Papier-maché ware, £20 per cent. ad valorem
Patent and proprietary medicines, and medicinal and other preparations or compounds not otherwise enumerated, recommended to the public under any general name or title as specifics for any disease or affection whatever affecting the human or animal bodies, £25 per cent. ad valorem
Pearl barley, 1s. the cwt.
Peas, split, 2s. the cwt.
Pepper, cayenne, £15 per cent. ad valorem
Perfumery n.o.e., £25 per cent. ad valorem
Perfumed spirits and Cologne water, £1 1s. the gallon
Photographic chemicals n.o.e., £15 per cent. ad valorem
Photographic goods n.o.e., £20 per cent. ad valorem
Pickles, 2s. the dozen pints or reputed pints, and in the same proportion for larger or smaller reputed sizes
Pictorial calendars, show-cards, and other pictorial lithographs and prints on and after the 1st January, 1889, £25 per cent. ad valorem
Pictures and engravings, £15 per cent. ad valorem
Picture-frames, £15 per cent. ad valorem
Pipes, tobacco, £15 per cent. ad valorem
Plate, gold and silver, £20 per cent. ad valorem
Platedware, £20 per cent. ad valorem
Portmanteaus trunks (other than iron), and travelling-bags, £20 per cent. ad valorem
Powder, sporting, 6d. the lb.
Provisions, n.o.e., £20 per cent. ad valorem
Pumps and other apparatus for raising water n.o.e., £20 per cent. ad valorem
Putty, 2s. the cwt.
RAILWAY and tramway plant and materials, n.o.e., £20 per cent. ad valorem
Raspberry vinegar, £20 per cent. ad valorem
Rico and rice flour, 6s. the cwt.
Rice, undressed and dressed in bond, 4s. the cwt.
Rice manufactured into starch in bond, 2s. the cwt.
Rugs, woollen, cotton, opossum, or other, £20 per cent. ad valorem
237. SACCHARINE, 5s. the ounce
Sacks, other than cornsacks, £15 per cent. ad valorem
Saddlery, £20 per cent. ad valorem
Sad-irons, £20 per cent. ad valorem
Salt, except rock salt, 10s. the ton
Sardines, 2d. the pound or package of that reputed weight, and so in proportion for packages of greater or less reputed weight
Sarsaparilla, £25 per cent. ad valorem
Sauces, 3s. the dozen pints or reputed pints, and in the same proportion for larger or smaller reputed sizes
Sausage-skins, £20 per cent. ad valorem
Sashes, plain, 2s. the pair
Sashes, glazed, with ornamental glass, 4s. the pair
Shawls, £20 per cent. ad valorem
Shot, 10s. the cwt.
Silks, satins, velvets, plushes, n.o.e., composed of silk mixed with any other material, in the piece, £25 per cent. ad valorem
Snuff, 7s. the lb.
Soap, common, 5s. the cwt.
Soap, scented and fancy, £25 per cent. ad valorem
Soap powder, extract of soap, dry soap, and soft soap, £20 per cent. ad valorem
Soda ash, 1s. the cwt.
Soda, carbonate and bicarbonate, 1s. the cwt.
Soda, crystals, 2s. the cwt.
Solid wort, 6d. the lb.
Spices, including pepper and pimento, unground, 2d. the lb.
Spices, including pepper and pimento, ground, 4d. the lb.
Spirits and strong waters, the strength of which can be ascertained by Sykes's hydrometer—
In bottles, jars, or other vessels, packed in cases or other packages, 16s. the proof gallon
In bulk, 15s. the proof gallon
(No allowance beyond 16·5 under proof shall be made for spirits or strong waters of a less hydrometer strength than 16·5 under proof)
Spirits and strong waters mixed with any ingredient in any proportion exceeding 33 per cent. of proof spirit, and although thereby coming under the designation of patent or proprietary medicines, or under any other designation excepting medicinal tinctures specified in the British Pharmacopoeia—
In bottles, jars, or other vessels, packed in cases or other packages, 16s. the liquid gallon
In bulk, 15s. the liquid gallon
Spirits and strong waters, sweetened or mixed, when not exceeding the strength of proof—
In bottles, jars, or other vessels, packed in cases or other packages, 16s. the liquid gallon
In bulk, 15s. the liquid gallon
Spirits and strong waters in cases shall be charged as follows on and after the 1st December, 1888, namely:—
Two gallons and under, as two gallons; over two gallons and not exceeding three, as three gallons; over three gallons and not exceeding four, as four gallons; and so on for any greater quantity contained in any case
Spirits, methylated, 1s. the liquid gallon
Starch, 2d. the lb.
Stationery, manufactured, namely, account-books, billheads, cheques, labels, and other printed and ruled paper, blank and head-line copybooks, drawing-books, blotting-pads, sketch-books, manifold writers, albums, diaries, plain and faint-lined ruled books, and other printed or lithographed stationery, £25 per cent. ad valorem
268. Stationary n.o.e., £15 per cent. ad valorem
Statues, statuettes, casts and bronzes, £20 per cent. ad valorem
Steam-engines and parts of steam-engines n.o.e., £20 per cent. ad valorem
Stearine, 1 1/2d. the lb.
Sugar, 1/2d. the lb.
Sulphur, 6d. the cwt.
Syrups, £20 per cent. ad valorem
TARPAULINS, tents, rick- and wagon-covers; aprons and elevators for reaping-and-binding machines, £15 per cent. ad valorem
Tea, 6d. the lb.
Textile piece-goods other than cotton or silk, £20 per cent. ad valorem
Timber, sawn, rough, 2s. the 100ft. superficial
Timber, sawn, dressed, 4s. the 100ft. superficial
Timber, shingles and laths, 2s. the thousand
Timber, palings, 2s. the hundred
Timber, posts, 8s. the hundred
Timber, rails, 4s. the hundred
Tinware, and tinsmiths' furniture n.o.e. £25 per cent. ad valorem
Tobacco, 3s. 6d. the lb.
Tobacco, unmanufactured, entered to be manufactured in the colony, at the time of removal from a bonded warehouse, or from' any importing ship, to any licensed tobacco manufactory, for manufacturing purposes only into tobacco, cigars, cigarettes, or snuff, 2s. the lb. until the 31st December, 1891
By “The Customs and Excise Duties Act, 1891,” it is enacted that on and after the 1st day of January, 1892, and until the 31st day of December, 1893, the duty on manufactured tobacco shall be 1s. 6d. the lb.
And on and after the 1st day of January, 1894, until the 31st day of December, 1896, the duty on unmanufactured tobacco shall be 2s. the lb.
Toilet preparations n.o.e., £25 per cent. ad valorem
Treacle and molasses, 1/2d. the lb.
Turnery, £15 per cent. ad valorem
Turpentine, 6d. the gallon
Twine, binder, £15 per cent. ad valorem
Twine n.o.e., £20 per cent. ad valorem
UMBRELLAS, parasols, and sunshades, £20 per cent. ad valorem
Upholstery n.o.e., £25 per cent. ad valorem
VARNISH, 1s. 6d. the gallon
Vegetables, fresh, dried, or preserved, £20 per cent. ad valorem
Vinegar, 6d. the gallon
WALKING-STICKS, £20 per cent. ad valorem
Washing powder, £20 per cent. ad valorem
Watches, £20 per cent. ad valorem
Waterworks pipes, iron, £5 per cent. ad valorem
Wax, paraffin, mineral, vegetable, and Japanese, 1 1/2d. the lb.
Weighing-machines, £15 per cent. ad valorem
Whips, £15 per cent., ad valorem
Whiting and chalk, 1s. the cwt.
Wine, sparkling, 9s. the gallon
Wine, Australian, containing not more than 35 per cent. of proof spirit verified by Sykes's hydrometer, the gallon, or for 6 reputed quart bottles, or 12 reputed pint bottles, 5s. the gallon
Wine, other than sparkling and Australian, containing less than 40 per cent. of proof spirit verified by Sykes's hydrometer, the gallon, or for 6 reputed quart bottles, or 12 reputed pint bottles, 6s. the gallon
Wire mattresses and webbing, £20 per cent. ad valorem
Woodenware n.o.e., £15 per cent. ad valorem
311. Woolpacks, 2s. 6d. the dozen
Woolpacks of the kind known as “woolpockets,” and not exceeding the measurement of 18 by 21 by 30 inches, 6d. the dozen
YARNS n.o.e., £20 per cent. ad valorem
ZINC tiles, ridging, guttering, piping, £20 per cent. ad valorem
Zinc manufactures n.o.e., £25 per cent. ad valorem.
ACCOUTREMENTS for military purposes; but excepting uniform clothing
Acid, nitric and pyrogallic
Almonds, Barbary, Sicily, and French, used in confectioners' manufactures
Alum
Anchors
Anchovies, salted, in casks
Anvils
Arsenic
Arrowroot
Artists' canvas, colours, brushes, and pallet-knives
Ash timber, unwrought
Axes and hatchets
Axles, axle arms and boxes
BAGS, gunny
Bellows' nails
Blacksmiths' bellows
Blindwebbing and tape
Bookbinders' materials, viz., cloth, leather, thread, headbands, webbing, end-papers, tacketing-gut, marbling colours, marble paper, blue paste for ruling-ink, staple presses, wire staples, staple sticks
Boot-elastic
Boots, shoes, and slippers, viz., children's Nos. 0 to 3
Borax
Bottles of all kinds, empty
Brace-elastic and brace-mountings
Brass in pigs, bars, tubes, or sheets
Brass tubing and stamped work, in the rough for gasaliers and brackets
Brush woodware
Building materials n.o.e.
Bunting, suitable only for ships' flags
Butter- and cheese-cloth
Buttons, braids, tapes, wadding, pins, needles, and such minor articles required in the making-up of apparel, boots, shoes, hats, caps, saddlery, umbrellas, parasols, and sunshades, as may be enumerated in any Order of the Commissioner, and published in the Gazette
CALICO, white and grey, in the piece
Candlenuts and candlenut kernels
Candlewick
Card- or paste-board plain, of sizes not less than that known as “royal “
Cardboard boxes, materials for, namely, gold and silver paper plain and embossed, gelatine and coloured papers, known as “box papers “
351. Carriage- and cart-makers' materials, viz., springs, mountings, trimmings, brass hinges, bolts and nuts, tacks, tire-bolts, shackle-holders, and other iron fittings; rubber cloth, American cloth
Carriage- and cart-shafts, spokes and felloes in the rough; elm hubs; poles if unbent and unplaned
Chains, iron
Charts and maps
Churns
Cochineal
Cocoa beans
Cocoanuts
Coir
Copper, in pigs, bars, tubes, or sheets
Copper and composition rod, bolts, sheathing, and nails
Corduroy, cotton, in the piece
Cork soles
Corn riddles and sieves
Cornsacks
Cotton-waste
DUCK in the piece
Dye-stuffs, and dyeing materials, crude
ENGINEERS' machine-tools
Essential oils
FELT, sheathing
Fire-engines
Flour-mills, patent porcelain or steel roller
Forfar, dowlas, and flax sheeting in the piece, the fair market value of which does not exceed sevenpence the yard
Forges
GAS-ENGINES and hammers
Gelatine dry-plates
Glassmakers' moulds
Glycerine, crude
Goatskins, undressed
Gold size
Grindery, except heel- and toe-plates
Groats, prepared
Gum arabic and tragacanth
Gum-boots
Guttapercha, not being wearing apparel, and n.o.e.
HATMAKERS' materials, viz., silk plush, felt hoods, shellac, galloons, calicoes, spale-boards for hat-boxes
Hessians
Hickory, unwrought
Hickory spokes and felloes
Hogskins
Hydraulic cranes
INK, printing
Iron, boiler-plate and end-plates for boilers
Iron, plain black sheet
Iron, plates, rivets, bolts, nuts, screws and castings for ships
Iron, rod, bolt, bar, hoop, and pig
Iron rolled girders
Iron and steel cordage
Iron wire n.o.e.
Iron wire netting
402. KANGAROO-SKINS, undressed
LEAD, in pigs or bars
Leather, morocco, japanned, and enamelled
Leather-cloth
Lignum-vitæ
Locomotives
MACCARONI and vermicelli
Machinery for agricultural purposesn.o.e., also materials for manufacturing the same, viz., reaper-knife sections, fingers, brass and steel springs and tilt-rakes, chaff-cutting knives, set-screws, malleable castings, fittings for threshing-mills, discs for harrows, forgings for ploughs, mouldboard-plates and steel share-plates cut to pattern, and skeith-plates
Machinery for dairying purposes
Machinery, electric, and appliances
Machinery for mining purposes, including dredges and dredging appliances
Machinery for oil-refining and boring
Machinery for refrigerating and preserving meat
Machine saws
Metal fittings for portmanteaus, travelling-bags, and leggings
Metal frames for bags and satchels
Metal sheaves for blocks
Metallic capsules
Mill-board
Moleskin, cotton, in the piece
NITRATE of silver
OIL, candlenut
Oil, cod-liver
Oil, fish, whale, and seal, in bulk
Oil, palm
Oil. rhodium
PAINTINGS, statuary, and works of art, presented to or imported by any museum, public library, or other public institution for use therein, or for public exhibition
Paints, n.o.e.
Paper, for printing purposes only
Paper, hand-made or machine-made book, or writing, of sizes not less than the size known as “demy,” when in original wrappers, and with uncut edges as it leaves the mill
Paper, albumenised
Passengers' baggage and effects, including only wearing apparel, and other personal effects that have been worn or are in use by persons arriving in the colony; also implements, instruments, and tools of trade, occupation, or employment of such persons; and household effects not exceeding £100 in value used abroad for more than a year by the persons or families bringing them to the colony, and not intended for any other person or persons or for sale; also cabin furnishings belonging to such persons
Peanuts, for manufacture of oil
Pearlash
Potash and caustic potash
Perambulators, bicycles, tricycles, and the like vehicles, fittings for, n.o.e.
Phosphorus
Photographic cameras and lenses
Pitch and tar
Plaster of Paris
Ploughs and harrows
Powder, blasting
444. Portable and traction engines
Precious stones unset
Printed books, papers, and music, n.o.e.
Printing machinery, presses, type, and materials
Rails for railways and tramways
ROSIN
Rivets and washers of all kinds
SADDLERS' ironmongery, hames, and mounts for harness; straining surcingle brace girth and roller webs; collar-check, legging buckles
Saddle-trees
Saffron
Sago and tapioca
Sailcloth
Salt rock
Saltpetre
Schoolbooks, slates, and apparatus
Scrub-exterminator
Scythes
Sealskins, undressed
Sewing, knitting, and kilting machines
Sewing cottons, silks, and threads
Shale waste or unrefined mineral oil
Sheep-dip
Ship-chandlery, n.o.e.
Ships' rockets, blue lights, and danger signals
Shirtings, coloured cotton, in the piece
Shirtings, union, in the piece, the fair market value of which does not exceed 7d. the yard
Silica fire-bricks
Silk, for flour-dressing
Silk twist (shoemakers' and saddlers')
Soda, caustic
Soda, sulphate
Soda-water machines
Spades, shovels, and forks
Spirits, after being rendered not potable by manufacture into perfumery or other articles, in the colony, in accordance with prescribed regulations
Spirits of tar
Staymakers' binding, eyelet-holes, corset-fasteners, jean, ticks, lasting, sateen, and cotell
Steam-engines, non-condensing, the area of whose cylinder or cylinders exceeds 1,000 circular inches; and condensing engines, the area of whose cylinders exceeds 2,500 circular inches
Steam boiler-tubes and Bowling's expansion-rings
Steel
Stones, mill, grind, oil, and whet
Strychnine
Surveyors' steel bands
Swords
TACKS of all kinds
Tailors' trimmings, viz., Verona and Italian cloth, black and brown canvas, buckram, wadding, padding; silk, worsted, and cotton bindings, and braids; stay-binding; hessians, brown linen, silesias, union body linings, jeans, striped and checked drills, pocketings
Tailors' buckles
Tanning materials, crude
Tin, pig, bar, or sheet
Tinsmiths' fittings and planished furniture
493. Tobacco for sheepwash, after being rendered unfit for human consumption, in accordance with prescribed regulations
Tools, artificers'
Treacle and molasses, when mixed with bone-black in such proportions and under such regulations as the Commissioner may prescribes in that behalf
UMBRELLA-MAKERS'materials, namely, reversible and levantine silk-mixtures, of not less than 44in. in width; alpaca cloth, with border; zanella cloth, with border; sticks, runners, notches, caps, ferrules, cups, ribs, stretchers, tips, and rings for use in the making of umbrellas, parasols, and sunshades
Upholsterers' webbing, hair-seating, imitation hair-seating, curled hair gimp, tufts and studs
WATERPROOF material in the piece
Wax, bottling
Wire, brass, copper, and lead
Yarn, coir, flax and hemp
ZINC, plain sheet
ARTICLES and materials (as may from time to time be specified by the Commissioner) which are suited only for, and are to be used and applied solely in, the fabrication of goods within the colony. All decisions of the Commissioner in reference to articles so admitted free, to be published from time to time in the Gazette
And all articles not otherwise enumerated.
TOBACCO, 1s. the lb.
Cigars, cigarettes, and snuff, 1s. 6d. the lb.
From the 1st January, 1889, to the 31st December, 1891; but by “The Customs and Excise Duties Act, 1891,” it is enacted that on and after the 1st day of January, 1892, and until the 31st day of December 1896, the Excise duty on tobacco, and on cigars, cigarettes, and snuff shall be—
Tobacco, 1s. the lb.
Cigars, cigarettes, and snuff, 1s. 6d. the lb.
For the United Kingdom, Continent of Europe, Asia, Africa, America, the West Indies, and China viâ San Francisco, from Auckland every fourth Saturday, from July 16, 1892. Mails leave Greymouth and Hokitika on the Monday; Westport, Picton, and Invercargill on the Tuesday; Nelson, Dunedin, Lyttelton, and Napier on the Wednesday; Wellington on the Thursday; and New Plymouth and Thames on the Friday preceding the day the steamer leaves Auckland. The mails are delivered in. London in 32 days.
For the Continent of Europe and United Kingdom viâ Rio de Janeiro and Teneriffe (for specially-addressed correspondence only), on Thursday, July 7, and thereafter every alternate Thursday.
For the United Kingdom and Continent of Europe, also India, China. &c., leave Sydney July 4, and Melbourne July 5 (arriving in London August 10), and thereafter every fourth week. Connecting steamers leave the Bluff the Friday week prior to date of departure from Melbourne, and by later opportunity, if available, viâ Bluff, Wellington, or Auckland. Correspondence intended for the other weekly mails from Australia homewards must be specially addressed.
For the Australian Colonies and Tasmania viâ the Bluff and Melbourne, weekly; and viâ Auckland and Sydney, weekly during the summer and fortnightly during the winter; also by the mail steamer arriving from San Francisco, monthly.
From the United Kingdom, Continent of Europe, Asia, Africa, America, the West Indies, and China viâ San Francisco (leaving London Saturday, June 11), at Auckland on Friday, July 15, and thereafter arrive every fourth Friday. Mails due at Thames and New Plymouth on the Saturday; Wellington on the Sunday; and Napier, Lyttelton, Dunedin, and Nelson on the Monday; Invercargill on the Tuesday; and Westport, Greymouth, and Hokitika on the Wednesday after arrival at Auckland.
From the United Kingdom viâ the Cape of Good Hope and Hobart (for specially-addressed correspondence only), leaving London on Friday, June 10, and arriving at. Lyttelton on July 27, and thereafter fortnightly.
From the United Kingdom and Continent of Europe, also India, China, &c., viâ Melbourne or Sydney, leaving London on the two succeeding Fridays following the despatch of the mail viâ San Francisco, connecting at Melbourne or Sydney with steamers for New Zealand.
From the Australian Colonies and Tasmania viâ Melbourne and the Bluff, weekly; and viâ Sydney and Auckland weekly during the summer, and fortnightly during the winter.
Mails are despatched by every coastal steamer from and to the under-mentioned ports:—
Between Auckland, Gisborne, Napier, and Wellington, once weekly.
Between Onehunga, New Plymouth, and Nelson, twice weekly.
Between Nelson and Picton, four times a week.
Between Wellington and Lyttelton, almost daily.
Between Wellington and Nelson, almost daily.
Between Wellington and Picton, three times a week.
| RATES OF POSTAGE. | ||||||||||||||||
|---|---|---|---|---|---|---|---|---|---|---|---|---|---|---|---|---|
| Correspondence addressed to | Registration. | Letters. | Post-cards. | Book-post. | Pattern and Sample Packets. | Newspapers. | Parcels. | |||||||||
| Books and Printed Papers, except Newspapers | Commercial Papers. | |||||||||||||||
| Fee. | Not exceeding 1/2oz. | Every additional 1/2oz. | Single, each. | Reply paid, each. | For every 2oz. or fraction of 2oz. | Not exceeding 1/2oz. | Not exceeding 4oz. | Not exceeding 10oz. | Every additional 2oz. | Not exceeding 4oz. | Every additional 2oz. | Each. | For every 2oz. or fraction of 2oz. | Not exceeding 1lb. | Every additional 1lb. | |
|
* Cook Islands—Rarotonga, Hervey, Mangaia; Ducie Island, Easter Island, Fiji Islands, New Guinea (British), Now Guinea (German), New Hebrides, Norfolk Island, Pitcairn Island, Samoan Islands (Navigators), Solomon Islands, Tongan Group (Friendly Islands). a See Parcel Post Tariff for Australia. b See Parcel Post Tariff for United Kingdom, &c. Prepayment of postage can only be effected by means of postage-stamps. | ||||||||||||||||
| New Zealand (including Chatham and Kermadec Islands): | d. | d. | d. | d. | d. | d. | d. | d. | d. | d. | d. | d. | d. | d. | d. | d. |
| Town correspondence, viz., correspondence for delivery from the post office at which posted | 3 | 1 | 1 | 1 | 2 | 1/2 | 1/2 | 1 | .. | 1/2 | 1 | 1/2 | 1/2 | .. | 6 | 3 |
| Inland correspondence, viz., correspondence for delivery at any other office than that at which posted | 3 | 2 | 2 | 1 | 2 | 1/2 | .. | 1 | .. | 1/2 | 1 | 1/2 | 1/2 | .. | 6 | 3 |
| Australian Colonies and the South Sea Islands enumerated below* | 3 | 2 | 2 | 1 | 2 | 1/2 | .. | .. | 2 1/2 | 1 1/2 | 1 | 1/2 | 1 | .. | a | a |
| Great Britain and Ireland | 3 | 2 1/2 | 2 1/2 | 1 1/2 | 3 | 1/2 | .. | .. | 2 1/2 | 1/2 | 1 | 1/2 | 1 | .. | b | b |
| British Colonies, Foreign Countries, and South Sea Islands (other than those enumerated below) | 3 | 2 1/2 | 2 1/2 | 1 1/2 | 3 | 1/2 | .. | .. | 2 1/2 | 1/2 | 1 | 1/2 | .. | 1/2 | b | b |
The following is a list of the Post Offices in New Zealand, with the names of the Head Offices of the Postal Districts in which they are situated, and the number of miles they are distant from the Head Offices respectively.
| Miles distant from Head Office. | Post Office. | Head Office. |
|---|---|---|
|
All Head Offices are Money Order Offices and Post Office Savings Banks. Money Order Offices and Post Office Savings Banks are marked thus* Telegraph Offices thus † Combined Postal and Railway Offices thus ‡ Telephone Offices thus § Money Order Offices, but not Post Office Savings Banks, thus || | ||
| ‡†5 | ABBOTSFORD | Dunedin |
| 7 1/2 | Adair | Timaru |
| 43 | Adam's Flat | Dunedin |
| §8 | Addison's | Westport |
| †*22 | Ahaura | Greymouth |
| 224 | Ahipara | Auckland |
| †*56 | Akaroa | Christchurch |
| §136 | Akitio | Wellington |
| 76 | Akuaku | Gisborne |
| 10 | Albany | Auckland |
| 180 | Albert Town | Dunedin |
| ‡†28 | Albury | Timaru |
| §*108 | Alexandra | Auckland |
| †*120 | Alexandra South | Dunedin |
| ||86 | Alford Forest | Christchurch |
| 114 | Alfredton | Wellington |
| 16 | Alfriston | Auckland |
| 4 | Alma | Oamaru |
| 49 | Alton | Wanganui |
| ‡†*30 | Amberley | Christchurch |
| 48 | Annandale | Invercargill |
| 40 | Annat | Christchurch |
| §3 | Anderson's Bay | Dunedin |
| 52 | Antonio's Flat | Greymouth |
| 53 | Aongatete | Thames |
| 123 | Aotea | Auckland |
| 129 | Apiti | Wellington |
| 116 | Aponga | Auckland |
| 12 | Appleby | Nelson |
| §35 | Ararimu South | Auckland |
| §*96 | Aratapu | Auckland |
| 3 | Arch Hill | Auckland |
| 24 | Ardmore | Auckland |
| 14 | Arnold | Greymouth |
| †*123 | Arrowtown | Invercargill |
| 52 | Arthurton | Invercargill |
| 113 | Arthur's Point | Invercargill |
| †*53 | Ashburton | Christchurch |
| 67 | Ashburton Forks | Christchurch |
| 100 | Ashburton Gorge | Christchurch |
| 22 | Ashley Bank | Christchurch |
| §68 | Ashley-Clinton | Napier |
| 63 | Ashton | Christchurch |
| §*96 | Ashurst | Wellington |
| 44 | Athenree | Thames |
| §115 | Atiamuri | Napier |
| 69 | Athol | Invercargill |
| † * | AUCKLAND. | |
| §‡*6 | Avondale | Auckland |
| §103 | Awahuri | Wellington |
| 48 | Awakino | N. Plymouth |
| 71 | Awamoko | Oamaru |
| §218 | Awanui | Auckland |
| §16 | Awatere | Blenheim |
| 25 | Awatuna | Wanganui |
| 22 | Awhitu | Auckland |
| 29 | Awhitu Central | Auckland |
| ‡22 | Aylesbury | Christchurch |
| 124 | BABYLON | Auckland |
| ‡29 | Balcairn | Christchurch |
| †*52 | Balclutha | Dunedin |
| 116 | Bald Hill Flat | Dunedin |
| §*68 | Balfour | Invercargill |
| 121 | Ballance | Wellington |
| §156 | Bannockburn | Dunedin |
| 22 | Barkley Village | Invercargill |
| 47 | Barrhill | Christchurch |
| 48 | Barry's Bay | Christchurch |
| 17 | Barrytown | Greymouth |
| 77 | Batley | Auckland |
| 53 | Baton | Nelson |
| 14 | Beaconsfield | Dunedin |
| †*84 | Bealey | Christchurch |
| §72 | Beaumont | Dunedin |
| 128 | Beck's | Dunedin |
| §‡*8 | Belfast | Christchurch |
| ‡†*23 | Belgrove | Nelson |
| 5 | Bell Block | New Plymouth |
| 153 | Bendigo | Dunedin |
| 34 | Benmore | Invercargill |
| 37 | Bennett's | Christchurch |
| 20 | Berlin's | Westport |
| §28 | Berwick | Dunedin |
| 79 | Bideford | Wellington |
| 262 | Big Bay | Invercargill |
| ‡31 | Birdling's Flat | Christchurch |
| 3 | Birkenhead | Auckland |
| 60 | Bishop's | Dunedin |
| 16 | Blackball | Greymouth |
| 10 | Blackbridge | Wellington |
| 61 | Blackburn | Napier |
| 77 | Blackmount | Invercargill |
| 51 | Black's Point | Greymouth |
| ||§109 | Blackstone Hill | Dunedin |
| 36 | Black-water | Greymouth |
| † * | BLENHEIM. | |
| §63 | Bluespur | Dunedin |
| †*17 | Bluff | Invercargill |
| §*35 | Bombay | Auckland |
| 26 | Brighton | Westport |
| §12 | Brighton | Dunedin |
| §*12 | Bright-water | Nelson |
| §11 | Broad Bay | Dunedin |
| 12 | Broadfield | Christchurch |
| 223 | Broadwood | Auckland. |
| 19 | Brookby | Auckland |
| 16 | Brooklyn | Auckland |
| 20 | Brookside | Christchurch |
| 128 | Bruce Bay | Hokitika |
| †*7 | Brunnerton | Greymouth |
| 9 | Brunswick | Wanganui |
| §33 | Buckland | Auckland |
| †*40 | Bull's | Wanganui |
| §93 | Bunnythorpe | Wellington |
| ‡4 | Burke's | Dunedin |
| §51 | Burke's Pass | Timaru |
| 16 | Burnett's Face | Westport |
| 3 1/2 | Burwood | Christchurch |
| ‡†8 | Burnham | Christchurch |
| 85 | Bushside | Christchurch |
| 54 | CABBAGE BAY | Auckland |
| 50 | Cairnbrae | Christchurch |
| 15 1/2 | Callaghan's | Hokitika |
| §122 | Cambrian | Dunedin |
| †*100 | Cambridge | Auckland |
| 8 | Cameron's Terrace | Greymouth |
| §*108 | Campbelltown | Wellington |
| 32 | Canvastown | Blenheim |
| §*7 | Cape Foulwind | Westport |
| †*43 | Capleston | Westport |
| §28 1/2 | Cardiff | New Plymouth |
| §192 | Cardrona | Dunedin |
| 126 | Carnarvon | Wellington |
| †*58 | Carterton | Wellington |
| 75 | Cass River | Christchurch |
| 4 | Castlecliff | Wanganui |
| §108 | Castlepoint | Wellington |
| ‡23 | Cave | Timaru |
| ‡†*2 | Caversham | Dunedin |
| 34 | Charing Cross | Christchurch |
| *18 | Charleston | Westport |
| || | Chatham Islands | Wellington |
| 49 | Chatton | Invercargill |
| 3 | Chelsea | Auckland |
| 108 | Cheltenham | Wellington |
| ‡†*42 | Chertsey | Christchurch |
| †*70 | Cheviot | Christchurch |
| 64 | Chorlton | Christchurch |
| † * | CHRISTCHURCH | |
| 60 | Churchill | Auckland |
| 7 | Claremont | Timaru |
| 64 | Clareville | Wellington |
| 33 | Clark's | Dunedin |
| 48 | Clarkesville | Dunedin |
| 15 | Clarkville | Christchurch |
| 44 1/2 | Claudeboye | Timaru |
| 110 | Claverley | Christchurch |
| §*28 | Clevedon | Auckland |
| 3 1/2 | Clifton | Invercargill |
| †*74 | Clinton | Dunedin |
| 7 | Clive | Napier |
| 27 | Clonmore | Greymouth |
| †*126 | Clyde | Dunedin |
| 29 | Coal Creek | Westport |
| §102 | Coal Creek Flat | Dunedin |
| ||‡†38 | Coalgate | Christchurch |
| 97 | Coal Island | Invercargill |
| 31 | Colac Bay | Invercargill |
| §*65 | Collingwood | Nelson |
| 105 | Colyton | Wellington |
| †*42 | Coromandel | Auckland |
| 23 | Courtenay | Christchurch |
| 17 | Coutts Island | Christchurch |
| 22 | Cowes | Auckland |
| 93 | Cricklewood | Napier |
| 36 | Crofton | Wanganui |
| †*140 | Cromwell | Dunedin |
| §39 | Cronadun | Westport |
| 103 | Crookston | Dunedin |
| 39 | Cross' Creek | Wellington |
| 13 | Cryer's Landing | Thames |
| † * | Cullensville | Blenheim |
| ‡†*69 | Culverden | Christchurch |
| 112 | Cunningham's | Wellington |
| 32 | Oust | Christchurch |
| 15 | DACRE | Invercargill |
| 17 | Dairy Flat | Auckland |
| 37 | Dalmore | Invercargill |
| ‡†*81 | Danevirk | Napier |
| ‡†*40 | Darfield | Christchurch |
| ‡†*102 | Dargaville | Auckland |
| 37 | Deep Creek | Blenheim |
| §*13 1/2 | Denniston | Westport |
| § * | Devonport | Auckland |
| 29 | Dieffenbach | Blenheim |
| §20 | Dillmanstown | Hokitika |
| ‡†*37 | Dipton | Invercargill |
| 47 | Dorie | Christchurch |
| 27 1/2 | Dovedale | Nelson |
| §‡25 | Doyleston | Christchurch |
| 74 | Dreyerton | Wellington |
| 44 | Driving Creek | Auckland |
| 46 | Dromore | Christchurch |
| §38 | Drummond | Invercargill |
| †*22 | Drury | Auckland |
| 145 | Drybread | Dunedin |
| 92 | Dumbarton | Dunedin |
| §‡*52 | Dunback | Dunedin |
| † * | DUNEDIN. | |
| †*1 | Dunedin North | Dunedin |
| 16 | Dunganville | Greymouth |
| 103 | Dunrobin | Dunedin |
| ‡†*23 | Dunsandel | Christchurch |
| ‡†*28 | Duntroon | Oamaru |
| §*50 | Duvauchelle | Christchurch |
| ‡71 1/2 | EALING | Christchurch |
| 52 | Eastern Bush | Invercargill |
| 46 1/2 | East Chatton | Invercargill |
| §‡40 | East Oxford | Christchurch |
| 2 1/4 | Eastown | Wanganui |
| 13 | East Taieri | Dunedin |
| ‡†*23 | Edendale | Invercargill |
| 11 | Egmont Village | New Plymouth |
| 65 | Eiffelton | Christchurch |
| §†93 | Eketahuna | Wellington |
| 58 | Elgin | Christchurch |
| ‡†5 | Ellerslie | Auckland |
| ‡†*21 | Ellesmere | Christchurch |
| 45 | Elmslie's Bay | Nelson |
| §*64 | Eltham | Wanganui |
| 40 | Endeavour Inlet | Blenheim |
| §7 | Enfield | Oamaru |
| 5 | Epsom | Auckland |
| §90 | Ettrick | Dunedin |
| 19 | Evansdale | Dunedin |
| §63 | Evans Fiat | Dunedin |
| §95 | Eweburn | Dunedin |
| 65 | Eyreton | Christchurch |
| 204 | FAIRBURNS | Auckland |
| 6 1/4 | Fairdown Junct. | Westport |
| §25 | Fairfax | Invercargill |
| 7 | Fairfield | Dunedin |
| ‡†*38 | Fairlie | Timaru |
| 4 | Fairview | Timaru |
| ‡†*50 | Featherston | Wellington |
| †*99 | Feilding | Wellington |
| §54 | Fern Flat | Westport |
| 12 | Fernhill | Napier |
| 24 | Fernside | Christchurch |
| §67 | Ferntown | Nelson |
| 2 | Fitzroy | New Plymouth |
| 37 | Flag Swamp | Dunedin |
| 15 | Flaxton | Christchurch |
| 63 | Flemington | Christchurch |
| ‡†*13 | Fordell | Wanganui |
| ||§56 | Fortrose | Invercargill |
| 22 | Foxhill | Nelson |
| *117 | Fowler's | Wellington |
| 14 | Fox's | Hokitika |
| †*103 | Foxton | Wellington |
| 113 | Frankton | Invercargill |
| ‡84 | Frankton Junction | Auckland |
| §75 1/2 | Frasertown | Napier |
| 8 | Freeman's | Auckland |
| 210 | GALATEA | Auckland |
| 23 | Gap | Invercargill |
| 32 1/2 | Gapes Valley | Timaru |
| §75 | Garston | Invercargill |
| 21 | Gebbie's Flat | Christchurch |
| §18 | Georgetown | Oamaru |
| †*23 | Geraldine | Timaru |
| 54 | German Bay | Christchurch |
| 161 | Gibbston | Dunedin |
| 7 | Giles Terrace | Westport |
| 107 | Gillespie's Beach | Hokitika |
| §98 | Gimmerburn | Dunedin |
| † * | GISBORNE. | |
| §70 | Gladstone | Wellington |
| 147 | Glenary | Dunedin |
| §77 | Glendermid | Dunedin |
| 3 | Glen-iti | Timaru |
| 71 | Glenoamaru | Dunedin |
| §134 | Glenorchy | Invercargill |
| §41 | Glenore | Dunedin |
| 47 | Glenroy | Christchurch |
| §41 | Glentunnel | Christchurch |
| 54 | Glorit | Auckland |
| §*10 1/2 | Goldsborough | Hokitika |
| †*40 | Gore | Invercargill |
| 13 | Governor's Bay | Christchurch |
| 16 | Granity Creek | Westport |
| §‡37 | Greatford | Wanganui |
| §32 | Greendale | Christchurch |
| 12 | Green Hills | Invercargill |
| 9 | Greenhithe | Auckland |
| *5 | Green Island | Dunedin |
| 3 1/2 | Greenmeadows | Napier |
| 16 1/2 | Greenpark | Christchurch |
| 20 | Greenstone | Greymouth |
| 63 | Greenstreet | Christchurch |
| 61 | Green Valley | Dunedin |
| † * | GREYMOUTH. | |
| ‡†*15 | Greytown South | Dunedin |
| †*53 | Greytown North | Wellington |
| 31 | Groper's Bush | Invercargill |
| 27 | Grove | Blenheim |
| 15 | Grovebush | Invercargill |
| 2 | Grovetown | Blenheim |
| 25 | Gummie's Bush | Invercargill |
| 98 | Gumtown | Auckland |
| 120 | HAAST | Hokitika |
| §78 | Hakaru | Auckland |
| §44 | Hakateramea | Oamaru |
| ‡†*107 | Halcombe | Wellington |
| *44 | Half-Moon Bay | Invercargill |
| 18 | Halkett Town | Christchurch |
| 7 | Halswell | Christchurch |
| †*86 | Hamilton | Auckland |
| §*93 | Hamilton's | Dunedin |
| ‡†*22 | Hampden | Oamaru |
| || | Hanmer Plain | Christchurch |
| 114 | Harapipi | Auckland |
| 10 | Harben | Westport |
| 6 1/2 | Harewood Road | Christchurch |
| ‡ † * m | Hastings | Napier |
| 98 | Hautapu | Auckland |
| Hautere Cross | Wellington | |
| §14 | Havelock North | Napier |
| †*28 | Havelock | Blenheim |
| 23 | Havelock Suburban | Blenheim |
| 54 | Hawarden | Christchurch |
| §174 | Hawea Flat | Dunedin |
| †*60 | Hawera | Wanganui |
| 98 | Hawkeswood | Christchurch |
| ‡5 | Heathcote Valley | Christchurch |
| 41 1/2 | Heddon Bush | Invercargill |
| 20 | Hedgehope | Invercargill |
| 130 | Helena Bay | Auckland |
| ‡†*38 | Helensville | Auckland |
| 12 | Henderson's Mill | Auckland |
| 44 | Hende's Perry | Hokitika |
| §22 | Henley | Dunedin |
| ‡†*13 | Herbert | Oamaru |
| †*89 | Herbertville | Napier |
| 234 | Herekino | Auckland |
| §*106 | Heriot | Dunedin |
| 134 | Hermitage | Timaru |
| 120 | Hicks Bay | Gisborne |
| 6 | Highcliffe | Dunedin |
| §105 | Hikurangi | Auckland |
| §15 | Hikutaia | Thames |
| 55 | Hillend | Dunedin |
| §26 | Hillgrove | Oamaru |
| 22 | Hilton | Timaru |
| 32 | Hindon | Dunedin |
| ‡†*64 | Hinds | Christchurch |
| 98 | Hiwinui | Wellington |
| 29 | Hobsonville | Auckland |
| 5 | Hoho | Hokitika |
| 28 | Hokonui | Invercargill |
| † * | HOKITIKA. | |
| 47 | Homewood | Blenheim |
| 10 | Hope | Nelson |
| ‡†6 | Hornby | Christchurch |
| 24 | Horokiwi | Wellington |
| §*43 | Hororata | Christchurch |
| 63 | Horowhenua | Wellington |
| 80 | Horseshoe Bend | Dunedin |
| 58 | Hoteo North | Auckland |
| §15 | Howick | Auckland |
| 22 | Huia | Auckland |
| 12 | Huirangi | New Plym'th |
| 114 | Hukerenui | Auckland |
| 11 | Humphrey's | Hokitika |
| 24 | Hunter | Timaru |
| †*51 | Hunterville | Wanganui |
| ‡†*65 | Huntly | Auckland |
| ‡27 | Hunua | Auckland |
| 62 | Hurunui | Christchurch |
| †*8 | Hutt | Wellington |
| §*75 | Hyde | Dunedin |
| §27 | INANGAHUA JUNC. | Westport |
| 53 | Inch-Clutha | Dunedin |
| ‡†*12 1/2 | Inglewood | New Plym'th |
| 139 | Inland Mokau | Auckland |
| † * | INVERCARGILL | |
| 29 | Irwell | Christchurch |
| 23 | Isla Bank | Invercargill |
| 39 | JACKSON'S | Hokitika |
| 192 | Jackson's Bay | Hokitika |
| 50 | Jerusalem | Wanganui |
| §*6 | Johnsonville | Wellington |
| §*174 | KAEO | Auckland |
| †*12 | Kaiapoi | Christchurch |
| 13 | Kai-awa | Thames |
| 64 | Kaihiku | Dunedin |
| §13 | Kai Iwi | Wanganui |
| §179 | Kaikohe | Auckland |
| ‡†* 38 | Kaikora North | Napier |
| †*90 | Kaikoura | Blenheim |
| *16 | Kaimata | Greymouth |
| 52 | Kaipara Flats | Auckland |
| §*213 | Kaitaia | Auckland |
| †*54 | Kaitangata | Dunedin |
| ‡†*27 | Kaitoke | Wellington |
| 100 | Kaitawa | Wellington |
| 10 1/2 | Kaituna | Blenheim |
| 49 | Kaiwaiwai | Wellington |
| 66 | Kaiwaka | Auckland |
| §*2 | Kaiwarawara | Wellington |
| 55 | Kaiwera | Invercargill |
| 28 | Kakahu Bush | Timaru |
| §*12 | Kokanui | Oamaru |
| 55 | Kakapuaka | Dunedin |
| §44 | Kakaramea | Wanganui |
| †*99 | Kamo | Auckland |
| §3 1/2 | Kanieri | Hokitika |
| 7 | Kanieri Forks | Hokitika |
| 44 | Kanohi | Auckland |
| §74 | Kaponga | Wanganui |
| 70 | Kapuni | Wanganui |
| 51 | Karamea | Westport |
| 96 | Karamu | Auckland |
| §28 | Karangahake | Thames |
| 107 | Karioi | Napier |
| 27 | Karitane | Dunedin |
| §3 | Karori | Wellington |
| †*54 | Katikati | Thames |
| 19 | Kauangaroa | Wanganui |
| §*43 | Kaukapakapa | Auckland |
| 102 | Kaurihohore | Auckland |
| †*161 | Kawakawa | Auckland |
| 143 | Kawarau Gorge | Dunedin |
| 225 | Kawerua | Auckland |
| §140 | Kawhia | Auckland |
| †*50 | Kekerangu | Blenheim |
| §‡*99 | Kelso | Dunedin |
| 28 | Kenepuru | Blenheim |
| §5 1/2 | Kennington | Invercargill |
| 48 | Kereru | Napier |
| 187 | Kerikeri | Auckland |
| 11 | Kerry Town | Timaru |
| 58 | Ketu Bay | Blenheim |
| §4 1/2 | Khandallah | Wellington |
| †*104 | Kihikihi | Auckland |
| 35 | Killinchy | Christchurch |
| 30 | Kimberley | Christchurch |
| 4 | Kingsland | Auckland |
| ‡†*87 | Kingston | Invercargill |
| 137 | Kinloch | Invercargill |
| 5 | Kirikiri | Thames |
| §86 1/2 | Kirikiriroa | Auckland |
| ‡†*24 | Kirwee | Christchurch |
| 112 | Kiwitea | Wellington |
| 51 | Kohekohe | Auckland |
| §*194 | Kohukohu | Auckland |
| 13 | Kokiki | Greymouth |
| 54 | Komokoriki | Auckland |
| 65 | Koputarua | Wellington |
| 12 1/2 | Koromiko | Blenheim |
| †*108 | Kuaotunu | Auckland |
| †*19 | Kumara | Hokitika |
| 25 | Kumeu Flat | Auckland |
| ||sect;115 | Kumeroa | Napier |
| 1 1/4 | Kuranui | Thames |
| §26 | Kuri Bush | Dunedin |
| 45 | Kuripapanga | Napier |
| 68 | Kuripuni | Wellington |
| §‡*42 | Kurow | Oamaru |
| §81 | Kyeburn | Dunedin |
| 93 | Kyeburn Diggings | Dunedin |
| 79 | Kyle | Christchurch |
| 69 | LAKE COLERIDGE | Christchurch |
| 94 | Lake Pukaki | Timaru |
| 31 | Lakeside | Christchurch |
| 64 | Lake Tekapo | Timaru |
| 47 | Lauriston | Christchurch |
| † *60 | Lawrence | Dunedin |
| 60 | Le Bon's Bay | Christchurch |
| ‡† *27 | Leeston | Christchurch |
| 27 | Lee Stream | Dunedin |
| 58 | Leigh | Auckland |
| 27 | Leithfield | Christchurch |
| 10 | Lepperton | New Plymouth |
| 60 | Levin | Wellington |
| § † * | Lichfield | Auckland |
| 25 | Limehills | Invercargill |
| 110 | Linburn | Dunedin |
| ‡†*12 | Lincoln | Christchurch |
| 80 | Linton | Wellington |
| 72 | Lismore | Christchurch |
| 63 | Little Akaloa | Christchurch |
| §32 | Little Grey Junction | Greymouth |
| ‡† *36 | Little River | Christchurch |
| Livingstone | Oamaru | |
| 27 | Loburn | Christchurch |
| 14 | Lochiel | Invercargill |
| 57 | Long Bay Road | Christchurch |
| 69 | Longbeach | Christchurch |
| §84 | Longburn | Wellington |
| 8 1/2 | Longbush | Invercargill |
| †*60 | Longford | Westport |
| 64 | Longridge Village | Invercargill |
| §44 | Lovell's Flat | Dunedin |
| §142 | Lowburn Ferry | Dunedin |
| 12 | Lower Kokatahi | Hokitika |
| 29 | Lower Moutere | Nelson |
| 115 | Lower Shotover | Invercargill |
| 166 | Luggate | Dunedin |
| ‡†*50 | Lumsden | Invercargill |
| †*38 | Lyell | Westport |
| 47 | Lyndhurst | Christchurch |
| †*7 | Lyttelton | Christchurch |
| 12 | MABEL BUSH | Invercargill |
| §130 | Macetown | Invercargill |
| §*63 | Macrae's Flat | Dunedin |
| 92 | Maharahara | Napier |
| ‡†*10 | Maheno | Oamaru |
| 49 | Main | Wanganui |
| §103 | Mahia | Napier |
| 52 | Maioro | Auckland |
| 106 | Makakahi | Wellington |
| 8 | Makara | Wellington |
| §3 1/2 | Makaraka | Gisborne |
| 48 | Makarau | Auckland |
| §*104 | Makaretu | Napier |
| 6 | Makarewa | Invercargill |
| 220 | Makarora | Dunedin |
| †*102 | Maketu | Thames |
| ‡† *19 | Makikihi | Timaru |
| 101 | Makino | Wellington |
| 8 | Makirikiri | Wanganui |
| §‡*70 | Makotuku | Napier |
| 123 | Makuri | Wellington |
| 116 | Malaghan's | Invercargill |
| †*64 | Manaia | Wanganui |
| 34 | Manaroa | Blenheim |
| §50 | Mandeville | Invercargill |
| 118 1/2 | Mangahao | Wellington |
| 69 | Mangamako | Wanganui |
| 128 | Mangakahia | Auckland |
| 87 | Mangamahoe | Wellington |
| 29 | Mangamahu | Wanganui |
| §*104 | Mangapai | Auckland |
| 11 | Mangare | Auckland |
| 8 | Mangare Bridge | Auckland |
| 112 | Mangatainoka | Wellington |
| §*84 | Mangawai | Auckland |
| 126 | Mangawhara | Auckland |
| §*101 | Mangawhare | Auckland |
| 44 | Manuka Creek | Dunedin |
| 52 | Manukau | Wellington |
| ‡15 | Manurewa | Auckland |
| §*50 | Manutahi | Wanganui |
| 38 | Maori Bay | Blenheim |
| §123 | Maori Point | Invercargill |
| §28 | Maraekakaho | Napier |
| 28 | Maraetai | Auckland |
| 44 | Marahau | Nelson |
| 99 | Mararoa | Invercargill |
| 93 | Mareretu | Auckland |
| 132 | Maropiu | Auckland |
| 38 | Marowhenua | Oamaru |
| 12 | Marsden | Greymouth |
| §81 | Marsden Point | Auckland |
| 5 | Marshland | Christchurch |
| §*57 | Martinborough | Wellington |
| 256 | Martin's Bay | Invercargill |
| †*33 | Marton | Wanganui |
| 83 | Marumaru | Napier |
| 73 | Maryville | New Plymouth |
| †*67 | Masterton | Wellington |
| §*49 | Matakana | Auckland |
| 39 | Matakana Lower | Auckland |
| §145 | Matakanui | Dunedin |
| §87 | Matakohe | Auckland |
| 121 | Matamata | Auckland |
| 74 | Matamau | Napier |
| 58 | Matarawa | Wellington |
| §137 | Matata | Thames |
| †*32 | Mataura | Invercargill |
| 53 | Maude Island | Blenheim |
| §*37 | Mauku | Auckland |
| 110 | Maungakaramea | Auckland |
| 201 | Maungamuka | Auckland |
| 158 | Maunganui Bluff | Auckland |
| 103 | Maungatapere | Auckland |
| 49 | Maungatawhiri | Auckland |
| §*91 | Maungaturoto | Auckland |
| 24 | Maungatua | Dunedin |
| *83 | Mauriceville | Wellington |
| 39 | Mawheraiti | Greymouth |
| 20 | Maxwelltown | Wanganui |
| 74 | Mayfield | Christchurch |
| 5 | Meanee | Napier |
| 57 | Medbury | Christchurch |
| †*43 | Mercer | Auckland |
| 70 | Mere-mere | Wanganui |
| 42 | Merrivale | Invercargill |
| 29 | Merton | Dunedin |
| ‡†*57 | Methven | Christchurch |
| §‡;*52 | Middlemarch | Dunedin |
| §22 1/2 | Midhirst | New Plymouth |
| 240 | Milford Sound | Invereargill |
| §32 | Millburn | Dunedin |
| §86 | Miller's Flat | Dunedin |
| †*36 | Milton | Dunedin |
| 37 | Mimihau | Invereargill |
| ||†13 | Miranda | Thames |
| *95 | Mititai | Auckland |
| 79 | Moawhanga | Napier |
| §*50 | Mohaka | Napier |
| 45 | Mokau | New Plymouth |
| 118 | Moko Creek | Invereargill |
| §25 | Mokihinui | Westport |
| 40 | Mokoreta | Invereargill |
| 71 | Molesworth | Blenheim |
| Momohaki | Wanganui | |
| †*184 | Mongonui | Auckland |
| 69 | Moonlight | Dunedin |
| ‡†*102 | Morrinsville | Auckland |
| 56 | Morrison's Bush | Wellington |
| ‡†*11 | Mosgiel | Dunedin |
| §58 | Mossburn | Invereargill |
| 55 | Motonau | Christchurch |
| †*36 | Motueka | Nelson |
| §20 | Motueka Wharf | Nelson |
| 201 | Motukaraka | Auckland |
| 60 | Motuotaria | Napier |
| §31 | Motupiko | Nelson |
| 53 | Motupipi | Nelson |
| 6 | Mount Albert | Auckland |
| 8 | Mount Cargill | Dunedin |
| §*3 | Mount Eden | Auckland |
| §3 | Mount Roskill | Auckland |
| §*78 | Mount Somers | Christchurch |
| 35 | Mullet Point | Auckland |
| §52 | Murchison | Westport |
| §14 | Muriwai | Gisborne |
| 6 | Myross Bush | Invereargill |
| † * | NAPIER. | |
| †*92 | Naseby | Dunedin |
| † * | NELSON. | |
| §*20 | Nelson Creek | Greymouth |
| §*75 | Nenthorn | Dunedin |
| 20 | Netherton | Thames |
| 23 | Neudorf | Nelson |
| 16 | Nevesville | Thames |
| 162 | Nevis | Dunedin |
| §6 | New Brighton | Christchurch |
| 59 | Newland | Christchurch |
| 97 | Newman | Wellington |
| §*3 | Newmarket | Auckland |
| † * | NEW PLYMOUTH. | |
| †*1 1/2 | Newton | Auckland |
| *4 | Ngahauranga | Wellington |
| 16 | Ngahere | Greymouth |
| §74 | Ngaire | Wanganui |
| §18 | Ngakawau | Westport |
| §‡;*17 | Ngapara | Oamaru |
| 98 | Ngaroto | Auckland |
| †*74 | Ngaruawahia | Auckland |
| §175 | Ngawha | Auckland |
| §32 | Ngatimote | Nelson |
| 111 | Ngunguru | Auckland |
| §44 | Nightcaps | Invercargill |
| 84 | Nokomai | Invereargill |
| ‡†*64 | Normanby | Wanganui |
| §*73 1/2 | Norsewood | Napier |
| 62 | North Albertland | Auckland |
| §2 | Northcote | Auckland |
| 8 | North-east Harbour | Dunedin |
| 31 | North Loburn | Christchurch |
| 13 | North Taieri | Dunedin |
| 19 | No Town | Greymouth |
| §8 1/4 | OAKURA. | New Plymouth |
| † * | OAMARU. | |
| 41 | Oaonui | New Plymouth |
| †*173 | Ohaeawai | Auckland |
| §10 | Ohariu | Wellington |
| 58 | Ohau | Wellington |
| ‡†*94 | Ohaupo | Auckland |
| 61 | Ohinewai | Auckland |
| 65 | Ohingaite | Wanganui |
| 144 | Ohiwa | Thames |
| 17 | Ohoka | Christchurch |
| 132 | Ohonga | Wellington |
| §68 | Okaiawa | Wanganui |
| §181 | Okaihau | Auckland |
| 56 | Okain's Bay | Christchurch |
| 15 | Okaramio | Blenheim |
| 83 | Okarito | Hokitika |
| §18 | Okato | New Plymouth |
| §110 | Okete | Auckland |
| 7 | Okoia | Wanganui |
| §135 | Okoroire | Auckland |
| 54 | Okupu | Auckland |
| 164 | Okura | Hokitika |
| Omaio | Thames | |
| 192 | Omanaia | Auckland |
| §*215 | Omapere | Auckland |
| 72 | Omarama | Oamaru |
| 4 | Omata | New Plymouth |
| 18 | Onamalutu | Blenheim |
| †*8 | Onehunga | Auckland |
| 98 | Onepoto | Napier |
| 43 | Onewhero | Auckland |
| §*46 | Ongaonga | Napier |
| 32 | Opaheke | Auckland |
| 75 | Opaki | Wellington |
| †*139 | Ophir | Dunedin |
| 48 | Opio | Invercargill |
| †*154 | Opotiki | Thames |
| §‡151 | Opua | Auckland |
| 113 | Opuawhanga | Auckland |
| †*48 | Opunake | New Plymouth |
| 30 | Oraki | Invercargill |
| ‡†19 | Orari | Timaru |
| §‡*43 | Orepuki | Invercargill |
| §24 | Oreti Plains | Invercargill |
| §28 | Orewa | Auckland |
| §12 | Ormond | Gisborne |
| §‡*69 | Ormondville | Napier |
| §90 | Oroua Bridge | Wellington |
| 101 | Oroua Downs | Wellington |
| 36 | Orton | Timaru |
| 189 | Oruru | Auckland |
| 29 | Orwell Creek | Greymouth |
| §*9 | Otahuhu | Auckland |
| 15 | Otaio | Timaru |
| §18 | Otakaia | Dunedin |
| §68 | Otakeho | Wanganui |
| †*47 | Otaki | Wellington |
| §20 | Otakou | Dunedin |
| 52 | Otama | Invercargill |
| §48 | Otama Bridge | Invercargill |
| 64 | Otara | Invercargill |
| 58 | Otaraia | Invercargill |
| ‡†*32 | Otautau | Invercargill |
| 18 | Oteramika | Invercargill |
| 35 | Oteramika Gorge | Invercargill |
| §37 | Otiake | Oamaru |
| 5 | Otipua | Timaru |
| 57 | Otira Gorge | Hokitika |
| 111 | Otonga | Auckland |
| 117 | Otonga East | Auckland |
| §*114 | Otorohanga | Auckland |
| ‡†*18 | Outram | Dunedin |
| §*78 | Owake | Dunedin |
| §62 1/2 | Owen Junction | Nelson |
| 28 | Owharoa | Thames |
| ‡†*41 | Oxford | Christchurch |
| §‡130 | Oxford North | Auckland |
| †*22 | PAEROA | Thames |
| §20 | Pahautanui | Wellington |
| §*84 | Pahi | Auckland |
| §*110 | Pahiatua | Wellington |
| 27 | Paikakariki | Wellington |
| §18 | Pakarae | Gisborne |
| 65 | Pakiri | Auckland |
| §13 | Pakuranga | Auckland |
| †*41 | Palmerston | Dunedin |
| †*88 | Palmerston North | Wellington |
| §9 | Panmure | Auckland |
| §10 | Papakaio | Oamaru |
| §‡*19 | Papakura | Auckland |
| ‡†*3 | Papanui | Christchurch |
| 43 | Paparata | Auckland |
| §*85 | Paparoa | Auckland |
| §11 | Papatoitoi | Auckland |
| 35 | Parakakau | Auckland |
| 33 | Paraparaumu | Wellington |
| 1 3/4 | Parawai | Thames |
| 60 | Parawanui | Wanganui |
| 16 | Paremata | Wellington |
| 286 | Parenga | Auckland |
| 10 | Pareora | Timaru |
| 132 | Paringa | Hokitika |
| 110 | Park Hill | Dunedin |
| 42 | Parkhurst | Auckland |
| §*1 | Parnell | Auckland |
| 5 | Paroa | Greymouth |
| §*86 | Parua Bay | Auckland |
| 43 | Patangata | Napier |
| †*49 | Patea | Wanganui |
| §104 | Patearoa | Dunedin |
| 100 | Paterangi | Auckland |
| 49 | Paterson's Inlet | Invercargill |
| 28 | Patoka | Napier |
| §35 | Patumahoe | Auckland |
| §9 | Patutahi | Gisborne |
| 33 | Peel Forest | Timaru |
| §133 | Pemberton | Wellington |
| *176 | Pembroke | Dunedin |
| 47 | Pendarves | Christchurch |
| ‡†6 | Penrose | Auckland |
| 194 | Peria | Auckland |
| §6 | Petane | Napier |
| §*7 | Petone | Wellington |
| 104 | Piako | Auckland |
| †*18 1/2 | Picton | Blenheim |
| §*21 | Pigeon Bay | Christchurch |
| §76 | Pihama | Wanganui |
| §45 | Pine Bush | Invercargill |
| 59 | Pipiriki | Wanganui |
| ‡†*13 | Pleasant Point | Timaru |
| 27 | Pleasant Valley | Timaru |
| 119 | Pleckville | Wellington |
| 104 | Pohangina | Wellington |
| ‡†*40 | Pokeno | Auckland |
| 42 | Pokeno Valley | Auckland |
| 48 | Pollok Settlement | Auckland |
| 90 | Pomahaka | Dunedin |
| 119 | Pongakawa | Thames |
| §*1 1/2 | Ponsonby | Auckland |
| †*74 | Porangahau | Napier |
| §13 | Porirua | Wellington |
| 108 | Poroti | Auckland |
| †*1 | Port Ahuriri | Napier |
| §*65 | Port Albert | Auckland |
| §90 | Port Awanui | Gisborne |
| †*8 | Port Chalmers | Dunedin |
| 50 | Porter's Pass | Christchurch |
| 60 | Port Fitzroy | Auckland |
| 16 | Port Levy | Christchurch |
| §69 | Port Molyneux | Dunedin |
| §13 | Portobello | Dunedin |
| 30 | Port Underwood | Blenheim |
| 60 | Port Waikato | Auckland |
| §68 | Pouto | Auckland |
| §9 | Prebbleton | Christchurch |
| §62 | Puerua | Dunedin |
| 134 | Puhipuhi | Auckland |
| §35 | Puhoi | Auckland |
| 30 | Pukearuhe | New Plymouth |
| §70 | Pukekararo | Auckland |
| ‡†*30 | Pukekohe | Auckland |
| 34 | Pukekohe East | Auckland |
| §‡*48 | Pukerau | Invercargill |
| 100 | Pukerimu | Auckland |
| §9 | Puketapu | Napier |
| 139 | Puketutu | Auckland |
| 38 | Puketitiri | Napier |
| ‡†6 | Pukeuri Junction | Oamaru |
| 58 | Pukiore | Wanganui |
| 184 | Punakitere | Auckland |
| §*30 | Pungarehu | New Plymouth |
| 36 | Puni | Auckland |
| §25 | Puniho | New Plymouth |
| †12 | Purakanui | Dunedin |
| 59 1/2 | Puramahoi | Nelson |
| 31 | Purangi | New Plymouth |
| 93 | Purekireki | Dunedin |
| 9 | Puriri | Thames |
| 97 | Puysegur Point | Invercargill |
| 16 | Putiki Bay | Auckland |
| 60 | QUARRY HILLS | Invercargill |
| §158 | Queensberry | Dunedin |
| †*109 | Queenstown | Invercargill |
| 76 | RAE'S JUNCTION | Dunedin |
| §*124 | Raglan | Auckland |
| §38 | Rahotu | New Plymouth |
| †*35 | Rakaia | Christchurch |
| 26 | Ramarama | Auckland |
| §190 | Rangiahua | Auckland |
| †*20 | Rangiora | Christchurch |
| §*56 | Rangiriri | Auckland |
| ‡†25 | Rangitata | Timaru |
| 30 | Rangitata Island | Timaru |
| 17 | Rangitira Valley | Timaru |
| 94 | Rangitukia | Gisborne |
| §34 | Rata | Wanganui |
| 84 | Ratanui | Dunedin |
| 39 | Ratapapa | Wanganui |
| 234 | Raukokore | Thames |
| §3 | Ravensbourne | Dunedin |
| †*198 | Rawene | Auckland |
| 36 | Razorback | Auckland |
| 103 | Red Hill | Auckland |
| 23 | Red Jack's | Greymouth |
| †*48 | Reefton | Greymouth |
| 3 | Remuera | Auckland |
| §*6 1/2 | Renwicktown | Blenheim |
| 31 | Rewiti | Auckland |
| ‡†*8 | Richmond | Nelson |
| §5 1/2 | Rimu | Hokitika |
| 18 | Rissington | Napier |
| §‡*57 | Riversdale | Invercargill |
| †*25 | Riverton | Invercargill |
| §38 | Riwaka | Nelson |
| 52 | Robinson's Bay | Christchurch |
| ‡†*15 | Rolleston | Christchurch |
| §65 | Romabapa | Dunedin |
| 9 | Roslyn Bush | Invercargill |
| †*20 | Ross | Hokitika |
| §79 | Rotherham | Christchurch |
| 204 | Rotoiti | Auckland |
| 188 | Rotorua | Auckland |
| 105 | Rough Ridge | Dunedin |
| 35 | Round Hill | Invercargill |
| 77 | Rowsell's | Auckland |
| †*96 | Roxburgh | Dunedin |
| 82 | Ruapuna | Christchurch |
| 108 | Ruatangata | Auckland |
| 76 | Ru Point | Auckland |
| †*147 | Russell | Auckland |
| 45 | Russell's Flat | Christchurch |
| 7 | Rutherglen | Greymouth |
| 10 | Ryal Bush | Invercargill |
| 12 | SADDLE HILL | Dunedin |
| ‡†*11 | St. Andrew | Timaru |
| †*117 | St. Bathan's | Dunedin |
| 24 | St. Kilda | Westport |
| 6 | St. John's College | Auckland |
| 20 | Saltwater Creek | Christchurch |
| 1 | Sandie Town | Timaru |
| 40 | Sandy Bay | Nelson |
| 11 | Sandymount | Dunedin |
| †*120 | Sanson | Wellington |
| 91 | Scarrotts | Auckland |
| 130 | Scott's Ferry | Wellington |
| 39 | Scott's Gap | Invercargill |
| ‡†*24 | Seacliff | Dunedin |
| 68 | Seafield | Christchurch |
| 63 | Seaview | Christchurch |
| 29 | Seaward Downs | Invercargill |
| 6 | Seaward Moss | Invercargill |
| †25 | Sefton | Christchurch |
| ‡†22 | Selwyn | Christchurch |
| 120 | Serpentine | Dunedin |
| 40 | Shaftesbury | Thames |
| 35 | Shag Point | Oamaru |
| 45 | Shag Valley | Dunedin |
| 69 | Shannon | Wellington |
| ‡†*38 | Sheffield | Christchurch |
| §45 | Sherry River | Nelson |
| §125 | Skipper's | Invercargill |
| 4 1/2 | Sockburn | Christchurch |
| ‡†*30 | Southbridge | Christchurch |
| 19 | Southbrook | Christchurch |
| §*1 1/2 | South Dunedin | Dunedin |
| 41 | South Hillend | Invercargill |
| 40 | South Malvern | Christchurch |
| §73 | South Norsewood | Napier |
| ‡27 | Springbank | Christchurch |
| 82 | Springburn | Christchurch |
| §*4 | Spring Creek | Blenheim |
| §14 1/2 | Spring Grove | Nelson |
| ‡†*43 | Springfield | Christchurch |
| 33 | Spring Hills | Invercargill |
| §17 | Springston | Christchurch |
| §*8 1/2 | Stafford | Hokitika |
| 36 1/2 | Stanley Brook | Nelson |
| 112 | Stan way | Wellington |
| §*9 | Stillwater | Grey mouth |
| §*50 | Stirling | Dunedin |
| §4 | Stoke | Nelson |
| 65 | Stony Creek | Dunedin |
| ‡†*25 | Stratford | New Plymouth |
| ‡†24 | Studholme Junction | Timaru |
| ‡6 | Styx | Christchurch |
| §7 1/2 | Sumner | Christchurch |
| 18 | Sutherland's | Timaru |
| 23 | Swannanoa | Christchurch |
| 16 | Swanson | Auckland |
| §*1 | Sydenham | Christchurch |
| 42 1/2 | TADMOR | Nelson |
| 85 | Tahatika | Dunedin |
| §190 | Taheke | Auckland |
| §34 | Taieri Beach | Dunedin |
| §32 | Taieri Mouth | Dunedin |
| 16 | Taioma | Dunedin |
| 35 | Taipo | Hokitika |
| §*100 | Tairua | Auckland |
| 12 | Taita | Wellington |
| §17 | Tai Tapu | Christchurch |
| 215 | Takahue | Auckland |
| §*53 | Takaka | Nelson |
| §60 | Takaka East | Nelson |
| §‡*59 | Takapau | Napier |
| §6 | Takapuna | Auckland |
| 95 | Tamahere | Auckland |
| 48 | Tamumu | Napier |
| 112 | Tangihua | Auckland |
| 95 | Taonui | Wellington |
| †*96 | Tapanui | Dunedin |
| 140 | Tapapa | Auckland |
| ||§12 | Tapu | Thames |
| §6 | Taradale | Napier |
| 2 | Tararu | Thames |
| 20 | Tarata | New Plymouth |
| †44 | Tarawera | Napier |
| §18 | Tariki Road | New Plymouth |
| §159 | Tarras | Dunedin |
| §78 | Taueru | Wellington |
| 48 | Tauherinikau | Wellington |
| 73 | Tauhoa | Auckland |
| §155 | Taumarere | Auckland |
| 42 | Taumutu | Christchurch |
| 21 | Taupaki | Auckland |
| ‡†*69 | Taupiri | Auckland |
| †*90 | Taupo | Napier |
| †*84 | Tauranga | Thames |
| 11 | Tawa Flat | Wellington |
| 98 | Tawhere | Auckland |
| 1/4 | Taylorville | Wanganui |
| §173 | Te Ahuahu | Auckland |
| 81 | Te Akatea | Auckland |
| 108 | Te Anau | Invercargill |
| 67 | Te Arai | Auckland |
| §9 | Te Arai Bridge | Gisborne |
| 110 | Te Araroa | Gisborne |
| § * | Te Aro | Wellington |
| †*34 | Te Aroha | Thames |
| ‡†29 | Te Aute | Napier |
| 36 | Te Awaite | Blenheim |
| †*101 | Te Awamutu | Auckland |
| 13 | Teddington | Christchurch |
| 59 | Te Houka | Dunedin |
| 270 | Te Kao | Auckland |
| 199 | Te Kaha | Thames |
| 30 | Te Kapa | Auckland |
| 18 | Te Karaka | Gisborne |
| †*94 | Te Kopuru | Auckland |
| 125 | Te Kuiti | Auckland |
| ‡†9 | Templeton | Christchurch |
| †*12 | Temuka | Timaru |
| †*95 | Te Nui | Wellington |
| §*90 | Te Puke | Thames |
| 158 | Terakenga | Auckland |
| 111 | Te Rori | Auckland |
| 102 | Terrace End | Wellington |
| 9 | Teremakau | Greymouth |
| 150 | Te Teko | Thames |
| 223 | THAMES. | |
| † * | The Forks | Hokitika |
| 78 | The Port | Nelson |
| †*1 | The Reefs | Invercargill |
| 129 | Thornbury | Invercargill |
| ‡†*20 | Thorpe | Nelson |
| 32 | Three Mile | Hokitika |
| 3 | Tikinui | Auckland |
| 81 | Tikokino | Napier |
| §*50 | Tikorangi | New Plymouth |
| 15 | TIMARU. | |
| † * | Tiniroto | Gisborne |
| 42 | Tinwald | Christchurch |
| ‡†*54 | Tisbury | Invercargill |
| 5 | Titirangi | Auckland |
| 12 | Toiro | Dunedin |
| 58 | Tokaanu | Napier |
| 131 | Tokatea | Auckland |
| §46 | Tokatoka | Auckland |
| 91 | Toko | New Plymouth |
| 31 | Tokomaru | Wellington |
| 76 | Tokomaru Bay | Gisborne |
| §60 | Tokonui Gorge | Invercargill |
| 55 | Tolaga Bay | Gisborne |
| §35 | Tophouse | Nelson |
| †49 | Totara | Auckland |
| 169 | Totara Flat | Greymouth |
| §*29 | Totaranui | Nelson |
| 32 | Towai | Auckland |
| §121 | Trentham | Wellington |
| 21 | Tryphena | Auckland |
| 56 | Tuakau | Auckland |
| §†*35 | Tuamarina | Blenheim |
| 6 | Tuapeka Mouth | Dunedin |
| §75 | Tuapeka West | Dunedin |
| §69 | Tuhara | Napier |
| 74 | Tuhikaramea | Auckland |
| 100 | Tuparoa | Gisborne |
| 82 | Turakina | Wanganui |
| ‡†*23 | Turiroa | Napier |
| 67 1/2 | Turua | Thames |
| §8 | Tutaekara | Wellington |
| 102 | Twelve Mile Landing | Greymouth |
| 10 | ||
| ‡†*20 | UPPER HUTT | Wellington |
| 15 | Upper Kokatahi | Hokitika |
| 111 | Upper Kuaotunu | Auckland |
| 74 | Upper Matakitaki | Westport |
| 36 | Upper Motupiko | Nelson |
| §20 | Upper Moutere | Nelson |
| §*1 1/4 | Upper Symonds St. | Auckland |
| §45 | Upper Takaka | Nelson |
| 78 | Upper Waiau Ferry | Christchurch |
| 34 | Upper Waiwera | Auckland |
| 24 | Urenui | New Plymouth |
| 184 | Utakura | Auckland |
| 93 | VICTORIA | Napier |
| 210 | Victoria Valley | Auckland |
| §48 | View Hill | Christchurch |
| 36 | WADDINGTON | Christchurch |
| §*24 | Wade | Auckland |
| §8 | Waerangahika | Gisborne |
| 18 | Waerangaokuri | Gisborne |
| 97 | Wahanui | Napier |
| §*118 | Waharoa | Auckland |
| §*12 | Waianiwa | Invercargill |
| ‡2 | Waiareka Junction | Oamaru |
| †*83 | Waiau | Christchurch |
| 157 | Waihaha | Auckland |
| 63 | Waihakeke | Wellington |
| 30 | Waihao | Timaru |
| §58 | Waihemo | Dunedin |
| §*32 | Waihi | Thames |
| 38 | Waihoa Forks | Timaru |
| §†*26 | Waihola | Dunedin |
| 252 | Waihopo | Auckland |
| §12 1/2 | Waihopa | Blenheim |
| §112 | Waihou | Auckland |
| 20 | Wai-iti | Nelson |
| †*132 | Waikaia | Dunedin |
| 56 | Waikaka | Invercargill |
| 48 | Waikaka Valley | Invercargill |
| 15 | Waikakaho | Blenheim |
| 39 | Waikanae | Wellington |
| ‡†*50 | Waikari | Christchurch |
| 74 | Waikawa | Invercargill |
| 73 | Waikawa Township | Invercargill |
| 68 | Waikawa Valley | Invercargill |
| 114 | Waikiekie | Auckland |
| §3 | Waikivi | Invercargill |
| ||§96 | Waikoikoi | Dunedin |
| 11 | Waikomiti | Auckland |
| §†*32 | Waikouaiti | Dunedin |
| 31 | Waikoukou | Auckland |
| 18 | Waikuku | Christchurch |
| §205 | Waima | Auckland |
| 222 | Waimamaku | Auckland |
| §*11 | Waimangaroa | Westport |
| 18 1/2 | Waimata Valley | Gisborne |
| §177 | Waimate North | Auckland |
| †*30 | Waimate | Timaru |
| 16 | Waimatuku | Invercargill |
| 28 | Waimauku | Auckland |
| 16 | Waimea West | Nelson |
| 80 | Waingaro | Auckland |
| 60 | Wainui | Christchurch |
| §15 | Wainuiomata | Wellington |
| 8 | Waiomio | Thames |
| 14 | Waiongona | New Plymouth |
| ||§38 | Waiorongomai | Thames |
| 48 | Waiotahi | Thames |
| ‡†*56 | Waipahi | Invercargill |
| ‡41 | Waipara | Christchurch |
| 101 | Waipatiki | Napier |
| †*43 | Waipawa | Napier |
| 47 | Waipipi | Auckland |
| §*70 | Waipiro Bay | Gisborne |
| ||§40 | Waipori | Dunedin |
| †*92 | Waipu | Auckland |
| 19 | Waipuku | New Plymouth |
| †*48 | Waipukurau | Napier |
| 63 | Wairangi | Auckland |
| §25 | Wairau Valley | Blenheim |
| §*42 | Wairio | Invercargill |
| †*71 | Wairoa | Napier |
| 28 | Waitaha Ferry | Hokitika |
| ‡†*52 | Waitahuna | Dunedin |
| 55 | Waitahuna Gully | Dunedin |
| 20 | Waitakerei | Auckland |
| ‡†39 | Waitaki | Timaru |
| 212 | Waitapu | Auckland |
| ‡†*10 | Waitara | New Plymouth |
| ‡†*17 | Waitati | Dunedin |
| *31 | Waitekauri | Thames |
| 30 | Waitemata Mills | Auckland |
| §59 | Waitepeka | Dunedin |
| §102 | Waitetuna | Auckland |
| 20 | Waitohi Flat | Timaru |
| ‡†*22 | Waitotara | Wanganui |
| 173 | Waitoto River | Hokitika |
| 19 | Waituna | Invercargill |
| 115 | Waituna West | Wellington |
| †*44 | Waiuku | Auckland |
| †*30 | Waiwera | Auckland |
| §68 | Waiwera South | Dunedin |
| 59 | Wakanui | Christchurch |
| §8 | Wakapuaka | Nelson |
| ‡†*17 | Wakefield | Nelson |
| §7 | Wallacetown | Invercargill |
| 65 | Wallingford | Napier |
| 114 | Walton | Auckland |
| 18 | Wangaehu | Wanganui |
| 60 | Wangaloa | Dunedin |
| † * | WANGANUI. | |
| 30 | Wangaparoa | Auckland |
| †*95 | Wangarei | Auckland |
| §81 | Wangarei Heads | Auckland |
| *168 | Wangaroa | Auckland |
| 173 | Wangaruru | Auckland |
| †*130 | Waotu | Auckland |
| 61 | Warepa | Dunedin |
| †*43 | Warkworth | Auckland |
| ‡†3 | Washdyke | Timaru |
| 70 | Wataroa | Hokitika |
| 66 | Waterton | Christchurch |
| †*29 | Waverley | Wanganui |
| 61 | Way by | Auckland |
| 62 | Weatherstone | Dunedin |
| 104 | Weber | Napier |
| 102 | Wedderburn | Dunedin |
| 12 1/2 | Weedons | Christchurch |
| † * | WELLINGTON. | |
| §*2 | Wellington South | Wellington |
| §*57 | Wellsford | Auckland |
| 64 | Wendon | Invercargill |
| 67 | Wendonside | Invercargill |
| 60 | Wendon Valley | Invercargill |
| 17 1/2 | Westbrook | Greymouth |
| 4 | Western Springs | Auckland |
| 28 | West Eyreton | Christchurch |
| 15 | West Melton | Christchurch |
| §4 | Weston | Oamaru |
| 4 1/2 | West Plains | Invercargill |
| † * | WESTPORT. | |
| 93 | Whakahara | Auckland |
| 106 | Whakataki | Wellington |
| §*135 | Whakatane | Thames |
| 123 | Whananaki | Auckland |
| 116 | Whangamata | Auckland |
| 224 | Whangape | Auckland |
| §*50 | Whangapoua | Auckland |
| 9 | Whare Flat | Dunedin |
| 69 | Wharehine | Auckland |
| 46 | Wharekuri | Oamaru |
| 101 | Whareora | Auckland |
| 30 | Whatatutu | Gisborne |
| §90 | Whatawhata | Auckland |
| 62 | Wheatstone | Christchurch |
| §208 | Whirinaki | Auckland |
| §‡*41 | White Cliffs | Christchurch |
| 46 | White's Point | Westport |
| 20 | Whitford | Auckland |
| †*90 | Whitianga | Auckland |
| 61 | Willowby | Christchurch |
| 86 | Wimbledon | Napier |
| ‡†*16 | Winchester | Timaru |
| 59 | Winchmore | Christchurch |
| 12 | Windsor | Oamaru |
| 54 | Windwhistle House | Christchurch |
| ‡†58 | Winslow | Christchurch |
| ‡†*19 | Winton | Invercargill |
| §30 | Woodbury | Timaru |
| 16 | Woodend | Christchurch |
| ‡†*11 | Woodlands | Invercargill |
| 21 | Woodside | Dunedin |
| 4 | Woodstock | Hokitika |
| †*105 | Woodville | Wellington |
| * | Woolston | Christchurch |
| 13 | Wright's Bush | Invercargill |
| †*27 | Wyndham | Invercargill |
| 7 | YALDHURST | Christchurch |
Money Orders are issued at the several Post Offices in the foregoing list marked with an asterisk * between the hours of 9 a.m. and 4 p.m., except on Saturday, when the offices are not closed before 5 p.m.
The Money Order Offices at Auckland, Christchurch, Dunedin, and Wellington close at 1 p.m. on Saturday, except when English mails are despatched later than 1 p.m., when the offices named remain open until 2 p.m.
The commission charged on Money Orders is as follows:—
BY TELEGRAPH.
(Within New Zealand.)
For every £1 or fraction of £1: 3d., and a telegraph fee of 1s. for each Order.
Money Order Telegrams can be sent as “urgent” upon payment of 2s. on each Order in addition to the ordinary rates. Such telegrams will rate as “Urgent Ordinary Telegrams,” and be sent in the order of their receipt with other telegrams of the like code.
| BY POST. | ||||
|---|---|---|---|---|
| For Sums | For Money Orders Payable in | |||
| New Zealand. | Australia and Tasmania. | United States and Canada. | United Kingdom and Hongkong. | |
| s. d. | s. d. | s. d. | s. d. | |
| Not exceeding £1 | 0 6 | 0 6 | 1 6 | 1 0 |
| From £1 to £2 | 0 6 | 0 6 | 1 6 | 1 0 |
| ″ 2 to 3 | 0 6 | 1 0 | 2 6 | 2 0 |
| ″ 3 to 4 | 0 6 | 1 0 | 2 6 | 2 0 |
| ″ 4 to 5 | 0 6 | 1 0 | 3 6 | 3 0 |
| ″ 5 to 6 | 1 0 | 1 6 | 3 6 | 3 0 |
| ″ 6 to 7 | 1 0 | 1 6 | 4 6 | 4 0 |
| ″ 7 to 8 | 1 0 | 2 0 | 4 6 | 4 0 |
| ″ 8 to 9 | 1 0 | 2 0 | 5 6 | 5 0 |
| ″ 9 to 10 | 1 0 | 2 0 | 5 6 | 5 0 |
| ″ 10 to 11 | 1 6 | 2 6 | 7 0 | |
| ″ 11 to 12 | 1 6 | 2 6 | 7 0 | |
| ″ 12 to 13 | 1 6 | 3 0 | 8 0 | The maximum amount for which a single Order can be issued upon the United Kingdom and Hongkong is £10. |
| ″ 13 to 14 | 1 6 | 3 0 | 8 0 | |
| ″ 14 to 15 | 1 6 | 3 0 | 9 0 | |
| ″ 15 to 16 | 2 0 | 3 6 | 9 0 | |
| ″ 16 to 17 | 2 0 | 3 6 | 10 0 | |
| ″ 17 to 18 | 2 0 | 4 0 | 10 0 | |
| ″ 18 to 19 | 2 0 | 4 0 | 11 0 | |
| ″ 19 to 20 | 2 0 | 4 0 | 11 0 | |
Postal Notes for fixed sums from 1s. up to £1 are issued and paid at all Money Order Offices in New Zealand.
The following are the amounts for which Postal Notes are issued, together with the-poundage payable in respect of each note:—
| Amount of Note. | Poundage. |
|---|---|
| s. d. | d. |
| 1 0 | 1/2 |
| 1 6 | 1/2 |
| 2 6 | 1 |
| 5 0 | 1 1/2 |
| 7 6 | 2 |
| 10 0 | 3 |
| 12 6 | 3 |
| 15 0 | 3 |
| 17 6 | 3 |
| 20 0 | 3 |
Broken amounts may be made up by the use of postage-stamps, not exceeding 5d. in value, affixed to the back of any one Postal Note. Those stamps must be affixed only by the senders or remitters of such Postal Notes.
[Special attention is directed to annotations (*) and (†).]
|
(*) Denotes that the limits of weight and dimensions of pattern- and sample-packets for these countries are: Length, 1ft.; width, 8in.; depth, 4in.; weight, 12oz. (†) Denotes that gold, silver, precious stones, jewellery, &c., may be sent to these countries by letter-post (such articles, however, if addressed to any of the other countries with which New Zealand has parcel-post exchanges can be sent by parcel-post, except in cases in which they are specially prohibited). |
|---|
| Abyssinia |
| Accra |
| Aden |
| Addah |
| Afghanistan |
| Africa, East |
| Africa—South, South-east, and South-west |
| Africa, West |
| Ahgwey |
| Akassa |
| Albania |
| Alexandretta |
| Algeria |
| Ambrizette |
| Anam |
| Andorra |
| Angola |
| Annobon |
| Anguilla |
| Antigua |
| Arabia |
| Argentine Republic* |
| Asaba |
| Asia, Central |
| Ascension |
| Austria-Hungary |
| Azores |
| Bagamoyo† |
| Bagdad |
| Bahamas |
| Balearic Islands |
| Barbados |
| Bechuanaland (liable to additional charge on delivery) |
| Belgium* |
| Benguela |
| Belize |
| Benin |
| Bermuda† |
| Beyrout |
| Bolivia |
| Bonny |
| Buen Ayre |
| Borneo, Dutch and British |
| Bourbon |
| Brass |
| Brazil |
| British Columbia* |
| British Guiana |
| Bulgaria |
| Burmah |
| Cabenda |
| Calabar |
| Cambodia |
| Cameroons† |
| Canada* |
| Canary Islands |
| Candia |
| Cape Coast Castle |
| Cape Colony |
| Cape Verd Islands |
| Cayenne |
| Celebes |
| Central Asia |
| Ceylon |
| Chandernagore |
| Chili |
| China |
| Cochin China |
| Colombia (Republic of, or United States of) |
| Comoro Islands |
| Congo |
| Corea |
| Costa Rica |
| Crete |
| Cuba |
| Curaçoa |
| Cyprus† |
| Dar-es-Salaam† |
| Delagoa Bay |
| Denmark |
| Diego Garcia |
| Dominica |
| Ecuador |
| Egypt |
| England† |
| Falkland Islands |
| Faröe Islands† |
| Fernando Po |
| Forcados |
| France* |
| Gaboon |
| Galapagos Archipelago |
| Gambia† |
| Germany† |
| Gibraltar† |
| Goa |
| Gold Coast |
| Gorée |
| Grand Bassam |
| Great Britain and Ireland† |
| Greece* |
| Greenland |
| Grenada† |
| Grenadines† |
| Guadeloupe |
| Guatemala |
| Guiana, British, Dutch, French |
| Guinea |
| Half Jack |
| Hawaiian Islands |
| Hayti |
| Heligoland† |
| Holland |
| Honduras, British, and Republic (except western portion) |
| Honduras Republic, western portion of |
| Hong Kong† |
| Honolulu |
| Hungary |
| Iceland |
| India, British, French, Portuguese |
| Inhambane |
| Ionian Islands |
| Ireland† |
| Italy* |
| Jamaica† |
| Japan* |
| Java |
| Kilwakivinje |
| Labuan† |
| Lagos (Africa)† |
| Lamu |
| Liberia |
| Lindi |
| Loanda |
| Los Islands |
| Luxemburg*† |
| Macao |
| Madagascar |
| Madeira |
| Madura |
| Mahé (Seychelles) |
| Malta† |
| Manila |
| Manitoba* |
| Martinique |
| Mashonaland |
| Mauritius |
| Mayotte |
| Metelin or Mytilene |
| Mexico |
| Moluccas |
| Mombasa |
| Monaco |
| Monrovia |
| Montenegro |
| Montserrat† |
| Morocco |
| Mosquito Territory |
| Mossamedes |
| Mozambique |
| Muscat |
| Natal |
| Nevis |
| New Brunswick* |
| Newfoundland |
| Nicaragua |
| Nicobar Islands |
| Niger Territory |
| Norway |
| Nossi Bé |
| Novo Rodondo |
| Nova Scotia* |
| Ontario* |
| Opobo |
| Orange Free State |
| Palestine |
| Panama |
| Paraguay |
| Patagonia |
| Pellew Islands |
| Penang† |
| Persia |
| Peru |
| Philippine Islands |
| Poland |
| Pondicherry |
| Porto Rico |
| Portugal* |
| Prince Edward Island* |
| Quebec* |
| Quilimane |
| Réunion |
| Rhodes |
| Roumania |
| Russia |
| St. Croix (West Indies) |
| St. Domingo |
| St. Eustatius |
| St. Helena |
| St. John's (West Indies) |
| St. Kitt's |
| St. Lucia (West Indies) |
| St. Martin's |
| St. Pierre et Miquelon |
| St. Thomas (West Indies) |
| St. Thomas (West Africa) |
| St. Vincent (Cape Verd) |
| St. Vincent (West Indies)† |
| Salt Pond |
| San Salvador (Central America) |
| San Salvador (West Indies) |
| Samsoun |
| Sandwich Islands |
| Sarawak |
| Scotland† |
| Senegal |
| Senegambia |
| Servia |
| Sette Cama |
| Seychelles |
| Sherboro |
| Siam |
| Siberia |
| Sicily* |
| Sierra Loone† |
| Singapore† |
| Smyrna |
| Socotra |
| Spain |
| Straits Settlements† |
| Suakim |
| Sumatra |
| Surinam |
| Sweden |
| Switzerland |
| Syria |
| Tanga |
| Tangiers |
| Teneriffe |
| Tobago |
| Togo Territory† |
| Tortola |
| Transvaal |
| Trebizond |
| Trinidad |
| Tripoli |
| Tunis |
| Turkey, European and Asiatic |
| Turk's Island |
| United Kingdom |
| United States of America* |
| United States of Colombia |
| Uruguay |
| Vancouver Island* |
| Venezuela |
| Virgin Islands |
| West Indies |
| Whydah |
| Zanzibar |
| Zululand |
Letters not fully prepaid, or posted wholly unpaid, are charged double the deficiency at the prepaid rate, on delivery.
No letter should exceed 2ft. in length or 1ft. in width or depth.
A “Postal and Telegraph Guide,” giving full details—price 6d.—is published quarterly by the department, and can be had at all Chief Post Offices, and at any other office, post free, on a application.
In order that a parcel may go by parcel post it must be handed in at a post-office counter or delivery-window, and the postage due prepaid. The words “Parcel Post” should be written on the parcel, or on the label to be obtained from the post-office for affixing to the parcel.
The rates of postage for a parcel are:—
| s. d. | |
|---|---|
| Not exceeding 1lb. in weight | 0 6 |
| Exceeding 1lb., but not exceeding 2lb. | 0 9 |
| Exceeding 2lb., but not exceeding 3lb. | 1 0 |
| Exceeding 3lb., but not exceeding 4lb. | 1 3 |
| Exceeding 4lb., but not exceeding 5lb. | 1 6 |
| Exceeding 5lb., but not exceeding 6lb. | 1 9 |
| Exceeding 6lb., but not exceeding 7lb. | 2 0 |
| Exceeding 7lb., but not exceeding 8lb | 2 3 |
| Exceeding 8lb., but not exceeding 9lb | 2 6 |
| Exceeding 9lb., but not exceeding 10lb. | 2 9 |
| Exceeding 10lb., but not exceeding 11lb. | 3 0 |
No parcel exceeding 11lb. in weight, or the dimensions hereafter specified, will be accepted; and unpaid or insufficiently prepaid parcels will be refused The dimensions allowed for a parcel are: Greatest length, 3ft. 6in.; greatest length and girth combined, 6ft. For example: A parcel measuring 3ft. 6in. in length may measure as much as 2ft. 6in. in girth. A shorter parcel may be thicker; thus, if it measures only 3ft. in length, it may be 3ft. in girth round its thickest part. The weights and dimensions given above apply only to parcels for places served by railway, coach, or steamboat.
To all places not served by railway, coach, or steamer, only parcels not exceeding 5lb. in weight, and not measuring more than 2ft. in length or 1ft. in breadth or depth, may be accepted, and provided they are not of such a fragile nature as to prevent their being sent with safety in the ordinary mail-bag.
The full postage must be prepaid by ordinary postage-stamps, which must be affixed by the sender or the person handing in the parcel.
To Queensland, South Australia, Tasmania, Victoria, and Western Australia: For a parcel not exceeding 1lb. in weight, 8d.; for every additional pound, or thereof, 6d. extra.
To the United Kingdom: For a parcel not exceeding 2lb. In weight, 1s. 6d.; for every additional pound or fraction thereof, 9d. extra.
Parcels may be forwarded to foreign countries, viâ London, at rates and conditions according to distance. (See “Postal and Telegraph Guide.”)
Postage must be fully prepaid by means of postage-stamps affixed to the parcels. Insufficiently prepaid parcels will not be accepted.
Parcels should be securely and substantially packed and closed by the sender. If wax is used, it should be of the special quality which resists the heat of a hot climate.
Parcels for transmission to the United Kingdom must be posted or delivered at the parcel post-office at the port where the steamer takes her final departure at least twelve hours before the close of the ordinary letter-mail. The hour for closing parcel-post mails elsewhere will be duly notified by Postmasters.
Each parcel should be plainly directed: the direction should give name and full address of the person for whom the parcel is intended. The words “Parcels Post” should be written on the upper left-hand corner, as also the name and address of the sender.
Parcels must not be posted in a posting-box, but should be presented at the post-office counter.
On payment of a fee of 4d., the sender can, at time of posting, receive a certificate of posting. The certificate imposes no liability on the department, and is merely intended as evidence of posting.
Parcels are received and forwarded at owner's risk, and the Postmaster-General is not liable for any loss of, or damage to, any parcel.
A table giving the names of the foreign countries to which parcels can be forwarded, through London, the conditions as to weight, dimensions, and rates of postage payable, is given in the quarterly “Postal Guide.”
Every Money Order Office, except Alford Forest, Chatham Islands, Coalgate, Fortrose, Hanmer Plain, Kumeroa, Miranda, Tapu, Waiorongomai, and Waipori, is also a Post Office Savings Bank, and open for bank business during the same hours as for money orders.
The Savings Bank Offices at Auckland, Christchurch, Dunedin, and Wellington close, however, at 1 p.m. on Saturdays, but open again from 7 to 8.30 p.m. on Saturdays for the receipt of savings-bank deposits and the opening of new accounts only.
Deposits of one shilling, or of any multiple of one shilling, may be made at any Post Office Savings Bank.
Interest is allowed to each depositor at the rate of 4 1/2 per cent. per annum on the balance at the credit of his account when it does not exceed £200, and at the rate of 4 per cent. when it exceeds £200; but no interest will be allowed on more than £500.
Telegraphic messages may be forwarded from any of the Telegraph Offices given on page 304 to 316 (marked with a dagger †), generally between the hours of 9 a.m. and 5 p.m.; but at the more important head offices the hours are from 8 a.m. till 8 p.m., and at others from 9 a.m. till 5 p.m. and from 7 to 8 p.m.
The following are the rates for ordinary telegrams from any telegraph-station to any other telegraph-station:—
| s. d. | |
|---|---|
| For the first eighteen words, or less, including address and signature | 1 0 |
| For every additional word | 0 1 |
On Sundays, double the above rates are charged.
Telegrams will be delivered free of charge within a radius of one mile of the station to which they may be transmitted by wire.
| s. d. | |
|---|---|
| For any distance not exceeding half a mile beyond the free delivery | 0 6 |
| For any distance over half a mile, hut not exceeding one mile beyond the free delivery | 1 0 |
| For any distance over one mile, but not exceeding, two miles beyond the free delivery | 1 6 |
The foregoing charges provide for ordinary delivery only. For messages to be delivered by special messenger, the cost of such delivery to be added and paid for. If required to be delivered beyond the distance of three miles, all moneys disbursed in payment of cab-fares, omnibus-fares, horse-hire, porterage, or any other expenses incurred in delivery, will be charged.
Telegrams marked “Urgent” are received at any Telegraph Office and transmitted in the order of their priority with other messages of the like code.
Urgent telegrams take precedence of all ordinary messages.
The fee for an urgent telegram is double of that for an ordinary telegram.
All ordinary telegrams lodged at any Telegraph Station after 8 p.m. are treated as “Urgent,” and charged for accordingly.
Urgent telegrams lodged on Sunday are charged four rates.
When the sender of an urgent telegram desires to pay for an urgent reply, the words “Urgent, reply paid urgent” must be inserted in the instructions. When the reply required is not to be urgent, the instruction should be “Urgent, reply paid” only.
Delayed telegrams are received at and forwarded from any telegraph-office in the colony, final delivery to the address given being effected by post. When readdressed the usual inland postage to be charged.
Delayed telegrams are not received on Sunday.
These telegrams will continue to be subject to delays whenever the wires are occupied with ordinary and other messages which have a prior right to transmission.
After receipt at the telegraph-offices to which they are addressed, every delayed telegram will immediately be posted and then delivered either over the public counter, through private boxes, or by first delivery by letter-carrier.
Senders of delayed telegrams are requested to give as full address as possible.
Delayed telegrams cannot be made “Reply paid,” but may be made “Repetition paid.”
Delayed telegrams for delivery within the colony, with the word “Delayed” inserted under the head of “Instructions,” will be sent at the following rates, which in all cases must be prepaid:—
| s. d. | |
|---|---|
| For the first eighteen words, inclusive of address and signature | 0 6 |
| For every additional word | 0 0 1/2 |
If any sum payable shall include the fraction of a penny, then one penny shall be payable in lieu of such fraction.
| Ten Words. | Each Additional Word. | |
|---|---|---|
| Australia and Tasmania— | s. d. | s. d. |
| New South Wales | 9 6 | 1 0 |
| Queensland, including Thursday Island | 11 0 | 1 1 |
| South Australia | 11 0 | 1 1 |
| Tasmania | 12 0 | 1 2 |
| Victoria | 10 0 | 1 1 |
| Western Australia | 12 0 | 1 2 |
| Europe and Foreign Countries— | Each Word. | |
| Europe | 10 2 | |
| Gibraltar | 10 2 | |
| Malta | 10 2 | |
| Naples | 10 2 | |
| Brindisi | 10 2 | |
| Port Said | 10 7 | |
| Suez | 10 7 | |
| Aden | 11 0 | |
| Colombo | 8 11 | |
| British South African Company's Stations | 16 5 | |
| Cape Colony | 16 2 | |
| Natal | 16 0 | |
| Transvaal | 16 2 | |
| Mauritius | 16 2 | |
| Hong Kong | 9 2 | |
| India | 8 10 | |
| New York | 11 2 | |
| Canada | 11 2 | |
| California | 11 8 | |
| Brazil | 19 8 |
In addition to the entrance-fee of £1, the charge per annum, payable in respect of the hire of any telephone instrument connected with a Government telephone exchange, is as follows:—
To every subscriber for a single wire, £5 per annum as from the date of connection.
The above rate is for connection with a telephone exchange of warehouses, stores, shops, and business places not more than half a mile from the exchange, and of private residences not more than one mile from the exchange.
For every additional mile or fraction, thereof, for each year commencing from the date of connection, and for every following year, £1.
Where any connection with an exchange is over two miles in length, the applicant will be required to hold the same for five years; and, whore the line is two miles and under, the term will be one year.
If a connection with a telephone exchange necessitates the erection of a new line of poles beyond the two miles, then the additional charge for every mile after the second mile will be at the rate of £2 10s. for every such mile or fraction thereof.
In the event of such line being used for additional wires a proportionate reduction will be made to the original subscriber for every wire so erected; but in no case will the reduction be more than £1 10s. per mile after the second mile or fraction thereof.
DATES OF SOME OF THE PRINCIPAL EVENTS IN THE HISTORY OF NEW ZEALAND.
Dec. 13, 1642.—Discovery of New Zealand by Abel Jansen Tasman.
Oct. 8, 1769.—Captain Cook landed at Poverty Bay on his first visit.
1814.—First arrival of the Rev. Mr. Marsden at Bay of Islands, and introduction of Christianity. Horses, oxen, sheep, and poultry first brought to the colony.
1823, 1828.—Acts passed by the Imperial Parliament extending the jurisdiction of the Courts of justice in New South Wales to all the British subjects in New Zealand.
1825.—First attempt at colonisation by an expedition under the command of Captain Herd, who bought two islands in the Hauraki Gulf.
1827.—Destruction of mission-station at Wangaroa by Hongi's forces.
1831.—Application of thirteen chiefs for the protection of King William the Fourth.
1833.—Mr. Busby appointed British Resident, to live at the Bay of Islands.
1835.—Declaration of independence of the whole of New Zealand as one nation, with the title of “The United Tribes of New Zealand.”
1838.—The Roman Catholic Bishop Pompallier, with several priests, arrived at Hokianga.
May 12, 1839.—Departure of the preliminary expedition of the New Zealand Company from England.
June, 1839.—Issue of Letters Patent authorising the Governor of New South Wales to include within the limits of that colony any territory that might be acquired in sovereignty by Her Majesty in New Zealand.
Sept. 16, 1839.—First body of New Zealand Company's emigrants sailed from Gravesend.
Sept. 20, 1839.—Arrival in Port Nicholson of the preliminary expedition of the New Zealand Company under Colonel Wakefield.
Jan. 20, 1840.—First steamer arrived in New Zealand.
Jan. 22, 1840.—Arrival of first body of immigrants at Port Nicholson.
Jan. 29, 1840.—Captain Hobson, R.N., arrived at the Bay of Islands. On the following day (Jan. 30) he hoisted the Union flag, and read the commission, under the Great Seal of the United Kingdom, which extended the boundaries of the Colony of New South Wales so as to embrace and comprehend the Islands of New Zealand; also Ins own commission as Lieutenant-Governor over territory that might be acquired in sovereignty.
Feb. 5, 1840.—Treaty of Waitangi signed.
May 21, 1840.—Date of Proclamations of sovereignty over the Islands of New Zealand.
June 17, 1840.—The Queen's sovereignty over the Middle Island formerly proclaimed at Cloudy Bay, by Major Bunbury, H.M. 80th Regiment, and Captain Nias, R.N.
Aug. 11, 1840.—The British flag hoisted at Akaroa by Captain Stanley, R.N., and British authority established. The French frigate “L'Aube” arrived there on the 13th August, and the vessel “Comte de Paris,” with fifty-seven immigrants, on the 16th August, in order to establish a French colony.
Sept. 18, 1840.—The British flag hoisted at Auckland. The Lieutenant-Governor's residence established there.
1840.—Formation of Wanganui settlement under the name of “Petre.”
Feb. 12, 1841.—Issue of charter of incorporation to the New Zealand Company.
Mar. 31, 1841.—Arrival of first New Plymouth settlers.
May 3, 1841.—New Zealand proclaimed to be independent of New South Wales.
Oct., 1841.—Selection of site for settlement at Nelson.
Feb. 1, 1842.—Settlement founded at Nelson.
May 29, 1842.—Arrival of Bishop Selwyn in the colony.
Sept. 10, 1842.—Death of Governor Hobson. Lieutenant Shortland, R.N., Colonial Secretary, became Acting-Governor until the arrival of Captain Fitzroy.
June, 1843.—Affray with Natives at the Wairau, and massacre by Rangihaeata of Captain Wakefield, R.N., agent at Nelson of the New Zealand Company, and others, who had surrendered.
Dec. 1, 1843.—Arrival of Captain Fitzroy, R.N., as Governor.
July 8, 1844.—The Royal flagstaff at Kororareka cut down by Heke.
Mar. 10, 1845.—Attack on and destruction of Town of Kororareka by Heke.
Oct. 1, 1845.—Receipt of despatch notifying recall of Governor Fitzroy.
Nov. 14, 1845.—Arrival of Captain Grey, as Lieutenant-Governor of the colony, from South Australia.
Jan. 11, 1846.—Capture of pa at Ruapekapeka, Bay of Islands, and termination of Heke's war.
Mar. 3, 1846.—Commencement of Native hostilities in the Hutt Valley, near Wellington.
May 16, 1846.—Attack by Natives on a military outpost in the Hutt Valley.
July 23, 1846.—Capture of Te Rauparaha at Porirua, near Wellington. He was detained for a year as a prisoner on board a ship of war.
Aug. 28, 1846.—The New Zealand Government Act passed by the Imperial Parliament, under which a charter was issued dividing the colony into two provinces, and granting representative institutions.
May 19, 1847.—Attack by Natives on settlement of Wanganui.
Jan. 1, 1848.—Captain Grey sworn in as Governor-in-Chief over the Islands of New Zealand, also as Governor of the Province of New Ulster and Governor of the Province of New Munster.
Jan. 3, 1848.—Major-General Pitt appointed by Governor Grey to be Lieutenant-Governor of the Province of New Ulster.
Jan. 28, 1848.—Assumption by Lieutenant-Governor E. J. Eyre, at Wellington, of the administration of the Government of the Province of New Munster.
Feb. 21, 1848.—Peace ratified at Wanganui.
Mar. 7, 1848.—Suspension by Imperial statute of that part of the New Zealand Government Act which had conferred representative institutions.
Mar., 1848.—Otago founded by a Scotch company under the auspices of the Free Church of Scotland.
Oct., 1848.—Severe earthquake at Wellington.
July, 1850.—Surrender of the New Zealand Company's charter, all its interests in the colony reverting to the Imperial Government.
Dec, 1850.—Canterbury founded by the Canterbury Association in connection with the Church of England.
Jan. 8, 1851.—Death of Major-General Pitt, Lieutenant-Governor of the Province of New Ulster.
April 14, 1851.—Lieutenant-Colonel Wynyard appointed Lieutenant-Governor of the Province of New Ulster.
1852.—Discovery of gold at Coromandel by Mr. Charles Ring.
June 30, 1852.—The Constitution Act passed by the Imperial Parliament, granting representative institutions to the colony, and subdividing it into six provinces.
Jan., 1853.—Promulgation of the Constitution Act.
Mar. 7, 1853.—Assumption by Sir George Grey, K.C.B., of the duties of Governor of the colony, in terms of the appointment after the passing of the New Zealand Constitution Act, and cessation of the duties of the Lieutenant-Governors of New Ulster and New Munster.
Dec. 31, 1853.—Departure of Governor Sir George Grey.
Jan. 3, 1854.—Lieutenant-Colonel Wynyard assumed the administration of the Government.
May 27, 1854.—Opening at Auckland of the first session of the General Assembly by Lieutenant-Colonel Wynyard, Administrator of the Government.
Jan., 1855.—Very severe earthquake on each side of Cook Strait.
Sept. 6, 1855.—Arrival of Governor Colonel T. Gore Browne, C.B.
Nov. 12, 1855.—First members elected to House of Representatives under system of Responsible Government.
Aug. 8, 1855.—General Assembly opened.
Sept. 15, 1855.—General Assembly prorogued.
May 7, 1856.—Appointment of the first Ministry under the system of Responsible Government, under Mr. Sewell, Colonial Secretary.
May 14, 1856.—Defeat of Mr. Sewell's Ministry.
May 20, 1856.—Appointment of a Ministry under presidency of Mr. W. Fox, as Attorney-General.
May 28, 1856.—Defeat of Mr. Fox's Ministry, by a majority of one, on a direct vote of want of confidence.
June 2, 1856.—Appointment of a Ministry under the presidency of Mr. E. W. Stafford.
1857.—First payable goldfield in the colony opened at Collingwood, in the Nelson Province.
Nov. 1, 1858.—Establishment of the Province of Hawke's Bay.
March, 1859.—Te Teira offered land at Waitara for sale to the Government.
Nov. 1, 1859.—Establishment of the Province of Marlborough.
Mar., 1860.—Commencement of hostilities against Wiremu Kingi te Kangitake at Waitara.
Mar. 18, 1860.—Capture of Maori pa at Waitara.
Mar. 28, 1860.—Engagement at Waireka.
June 27, 1860.—Engagement of Puketakauere at Waitara.
Nov. 6, 1860.—Defeat at Mahoetahi, with heavy loss, of a force of Waikato Natives who had crossed the Waitara River to join Wiremu Kingi.
Dec. 31, 1860.—Capture of the Matarikoriko Pa, and defeat of a large body of Waikato Natives.
Jan. 23, 1861.—The Natives made a determined attack on the redoubt at Huirangi occupied by Imperial troops, and were repulsed with heavy loss.
April 1, 1861.—Establishment of Province of Southland.
May 21, 1861.—A truce agreed to.
May, 1861.—Discovery of gold at Gabriel's Gully, Otago.
July 5, 1861.—Defeat of Air. Stafford's Ministry, by a majority of one, on a vote of want of confidence.
July 12, 1861.—Appointment of a Ministry under the Premiership of Mr. Fox.
July 29, 1861.—Incorporation of the Bank of New Zealand.
Sept. 26, 1861.—Arrival of Sir George Grey, K.C.B., at Auckland, from the Cape Colony, to succeed Governor Gore Browne. Sir George Grey was sworn in as Governor on the 3rd October,
Oct. 2, 1861.—Departure of Governor Gore Browne.
June 28, 1862.—Coromandel proclaimed a goldfield.
July 28, 1862.—Defeat of Mr. Fox's Ministry by the casting-vote of the Speaker, on a proposed resolution in favour of placing the ordinary conduct of Native affairs under the administration of the Responsible Ministers.
Aug. 6, 1863.—Appointment of a Ministry under the leadership of Mr. Alfred Domett.
Feb. 7, 1863.—Wreck of H.M.S. “Orpheus” on Manukau Bar; 181 lives lost.
Feb. 26, 1863.—Definite relinquishment by the Imperial Government of control over administration of Native affairs.
May 4, 1863.—Treacherous assault near Tataraimaka by Natives on a military escort. Murder of Lieutenant Tragett, Dr. Hope, and five soldiers of the 57th Regiment.
June 4, 1863.—Defeat of Natives at Katikara, by a force under Lieut.-General Cameron.
July 17, 1863.—Action at Koheroa, in the Auckland Province. Commencement of the Waikato war.
Oct. 27, 1863.—Resignation of the Domett Ministry in consequence of difficulties experienced in connection with arrangements for finding a fitting representative of the Government in the Legislative Council.
Oct. 30, 1863.—Appointment of the Ministry formed by Mr. Fox, under the premiership of Mr. F. Whitaker.
Nov., 1863.—Acceptance by the General Assembly of colonial responsibility in Native affairs.
Nov. 20, 1863.—Battle at Rangiriri. Defeat of Natives and unconditional surrender of 183.
Dec. 1, 1863.—The first railway in New Zealand opened for traffic by W. S. Moorhouse, Superintendent of Canterbury. The line was from Christchurch to Ferrymead Junction.
Dec. 3, 1863.—The New Zealand Settlements Act passed, giving the Governor power to confiscate the lands of insurgent Natives.
Dec. 8, 1863.—Occupation of Ngaruawahia. The British flag hoisted on the Maori king's flagstaff.
Feb. 11, 1864.—Engagement with Natives on Mangapiko River. Major (then Captain) Heaphy, of the New Zealand Forces, won the Victoria Cross for distinguished bravery on this occasion.
Feb. 22, 1864.—Defeat of Natives at Rangiaohia.
April 2, 1864.—Attack on and capture of pa at Orakau, Waikato.
April 21, 1864.—Engagement near Maketu, Bay of Plenty. Tribes of the Rawhiti defeated by Arawa Natives, under Captain McDonnell.
April 29, 1864.—Assault on Gate Pa, Tauranga, Bay of Plenty, and repulse of large British force by the Maoris. The pa was abandoned by the Natives during the following night.
April 30, 1864.—Repulse of attack by rebel Hauhau Natives on redoubt at Sentry Hill, Taranaki.
May 14, 1864.—Battle of Moutoa, an island in the Wanganui River, between friendly and rebel Hauhau Natives. Complete defeat of rebels.
June 21, 1864.—Engagement at Te Ranga, near Tauranga, by Lieut.-Colonel Greer, 68th Regiment. Severe defeat of the Natives.
1864.—Discovery of gold on the west coast of the Middle Island.
Sept. 10, 1864.—Escape of Maori prisoners from Kawau.
Oct. 3, 1864.—Wellington chosen as the seat of Government.
Nov. 24, 1864.—Appointment of a Ministry under the premiership of Mr. F. A. Weld, the Whitaker-Fox Ministry having resigned during the recess.
Dec. 17, 1864.—Confiscation of Native lands in Waikato by Sir George Grey.
Feb. 1865.—Removal of the seat of Government to Wellington.
Mar. 2, 1865.—Barbarous murder of the Rev. Mr. Volkner, a Church of England missionary, at Opotiki, by Hauhau fanatics, under Kereopa.
June 8, 1865.—Submission of the Maori Chief Wiremu Tamihana te Waharoa (William Thompson).
June 17, 1865.—Murder of Mr. Fulloon, a Government officer, and his companions, at Whakatane, by Hauhau fanatics.
July 22, 1865.—Capture of the Wereroa Pa, near Wanganui.
Aug. 2, 1865.—Assault and capture of the Pa Kairomiromi, at Waiapu, by Colonial Forces under Captain Fraser, and Native Contingent under the Chief Te Mokena. Eighty-seven rebels killed.
Sept. 2, 1865.—Proclamation of peace issued by Governor Sir George Grey, announcing that the war, which commenced at Oakura, was at an end.
Sept. 30, 1865.—Murder by Hauhaus, at Kakaramea, of Mr. Broughton, when sent as friendly messenger to them by Brigadier-General Waddy.
Oct. 12, 1865.—Resignation of Mr. Weld's Ministry, on account of a resolution adverse to the Government policy, having been defeated only by the casting-vote of the Speaker.
Oct. 16, 1865.—Appointment of a Ministry under the premiership of Mr. E. W. Stafford.
Dec. 25, 1865.—Defeat of rebel Natives at Wairoa, Hawke's Bay, by Colonial Forces and Native Contingent.
Jan. 4, 1866.—Defeat of Natives at Okotuku Pa, on the west coast of the North Island, by force under Major-General Chute.
Jan. 7, 1866.—Assault on and capture of Putahi Pa, by force under Major-General Chute.
Jan. 13, 1866.—Assault on and capture of Otapawa Pa, by force under Major-General Chute.
Jan. 17, 1866, to Jan. 25, 1866.—Period of Major-General Chute's march through the bush to New Plymouth.
Jan., 1866.—Escape of a large number of Native prisoners from the hulk at Wellington; many wore drowned in trying to swim ashore.
Mar. 29, 1866.—Submission of the rebel chiefs Te Heuheu and Herekiekie, of Taupo district.
Mar., 1866.—A detachment of Maori prisoners sent to the Chatham Islands.
June 15, 1866.—Commencement of Panama steam mail-service.
Aug. 26, 1866.—The Cook Strait submarine telegraph cable laid.
Oct. 2, 1866.—Engagement with rebel Natives at Pungarehu, West Coast, by Colonial Forces, under Major McDonnell.
Oct. 8, 1866.—First Act passed to impose stamp duties.
Oct. 12, 1866.—Defeats of rebel Natives at Omaranui and at Petane, Hawke's Bay, by Colonial Forces.
Oct. 10, 1867.—An Act passed to establish an institute for the promotion of Science and Art in the colony.
Oct. 10, 1867.—An Act passed for the division of the colony into four Maori electorates, and the admission of four Maori members to the House of Representatives.
Jan., 1868.—Establishment of the County of Westland.
Feb., 5, 1868.—Arrival of Governor Sir George F. Bowen, G.C.M.G.
July 4, 1868.—Seizure by Maori prisoners, under the leadership of Te Kooti, of the schooner “Rifleman,” and their escape from the Chatham Islands.
July 12, 1868.—Night attack by Natives on redoubt at Turuturu Mokai. Sub-Inspector Ross and seven Europeans killed. Natives driven off by the arrival of a force under Major Von Tempsky.
Aug. 8, 1868.—Pursuit by Lieut.-Colonel Whitmore of escaped Chatham. Island prisoners, and indecisive engagement in the gorge of the Ruako Ture.
Aug. 21, 1868.—Attack on Ngutu-o-te-Manu by force under Lieut.-Colonel McDonnell. Defeat of Natives; four Europeans killed and eight wounded.
Sept. 7, 1868.—Engagement in bush at Ngutu-o-te-Manu. Major Von Tempsky, Captains Buck and Palmer, Lieutenants Hunter and Hastings, and fourteen men killed.
Oct. 19, 1868.—Bishop Selwyn left New Zealand.
Nov. 7, 1868.—Attack on Moturoa. Repulse of Colonial Forces, with severe loss.
Nov. 10, 1868.—Massacre of thirty-two Europeans at Poverty Bay by Te Kooti's band of Natives; who had escaped from the Chatham Islands.
Nov. 24, 1868, Dee. 3, 3, 1868, Dec. 5, 1868.—Engagements between friendly Natives and rebels under To Kooti, at Patutahi, Poverty Bay district.
Jan. 5, 1866.—Assault on, and capture of, Ngatapa Pa, Poverty Bay district, after a siege of six days, by the Colonial Forces of Europeans and friendly Natives. Dispersion and pursuit of Te Kooti's band. More than 136 rebel Natives were killed.
Fob. 13, 1869.—Treacherous murder of the Rev. John Whitely and seven other Europeans at the White Cliffs, Taranaki.
Feb. 18, 1869.—Attack by rebel Natives on a foraging-party at Karaka Flat; one sergeant and six men killed.
Mar. 3, 1869.—Termination of Panama mail-service.
Mar. 13, 1869.—Attack on, and defeat of, Titokowaru's force at Otauto.
April 10, 1869.—Native pa at Mohaka taken by Te Kooti, who killed forty friendly Natives and several Europeans in the neighbourhood.
April 12, 1869.—First arrival of H.R.H. the Duke of Edinburgh in Wellington, in H.M.S. “Galatea.”
May 6, 1869.—Surprise and capture of Ahikereru and Oamaru Teangi Pas, Waiwera country. Defeat of Te Kooti.
June 13, 1869.—Surrender to Major Noake and Mr. Booth, R.M., of the chief Tairua, with 122 men, women, and children of the Pakakohe Tribe, near Wanganui.
June 24, 1869.—Defeat of Mr. Stafford's Ministry on a want-of-confidence motion.
June 28, 1869.—Appointment of a Ministry under the premiership of Mr. W. Fox.
Oct., 1869.—Seventy-four prisoners from the bands of Te Kooti and Titokpwaru sentenced to death, after trial, for treason. The sentences of seventy-three were commuted to penal servitude for various terms.
Oct. 4, 1869.—Pourere Pa stormed and taken by Lieut.-Colouel McDonnell, with a mixed force of Europeans and Natives.
Jan., 1870.—Three hundred friendly Natives under Topia, and three hundred under Major Kepa (known as Kemp), started up the Wanganui River, in pursuit of Te Kooti, who retreated into the Urewera country.
Jan. 25, 1870.—Capture of Tapapa Pa, occupied by To Kooti.
Feb. 24, 1870.—The last detachment of the Imperial troops left the colony.
Mar. 25, 1870.—Major Kepa, with Native force, captured the position hold by To Kooti at Maraetahi, in Urewera country; nineteen rebels killed and seventy-three of Te Kooti's men taken prisoners. Te Kooti escaped with twenty followers.
Mar. 26, 1870.—Commencement of San Francisco mail-service.
June 28, 1870.—Enunciation in the House of Representatives of the public-works policy by the Colonial Treasurer, Mr. Vogel.
July, 1870.—Thirty prisoners of Te Kooti's band sentenced to death. The sentences were commuted to penal servitude.
Aug. 27, 1870.—Arrival in Wellington of H.R.H. the Duke of Edinburgh in H.M.S. “Galatea.” Second visit.
Sept. 12, 1870.—An Act passed to establish the New Zealand University.
Sept. 12, 1870.—The Land Transfer Act passed, to simplify the title to land and dealings with real estates.
Oct. 6, 1870.—Southland Province reunited with Otago.
Dec. 5, 1870.—Honiani te Puni, the chief of the Ngatiawas, a staunch friend of the Europeans, died at Pitone, near Wellington, aged ninety years.
Mar., 1871.—Commencement of railway construction under the public-works policy.
Aug. 4, 1871.—Death of Tamati Waka Nene, the great Ngapuhi chief and friend of the Europeans.
Nov., 1871.—Capture of the notorious rebel Kereopa, the murderer of the Rev. Mr. Volkner, by the Ngatiporous.
Jan. 5, 1872.—Execution of Kereopa at Napier.
Jan., 1872.—Remission of sentences on fifty-eight Native prisoners then undergoing imprisonment for rebellion.
Feb. 22, 1872.—Visit of William King, the Maori chief of Waitara, to New Plymouth, and resumption of amicable relations with the Europeans.
May 9, 1872.—A general thanksgiving-day for the recovery of H.R.H. the Prince of Wales.
Sept. 6, 1872.—Defeat and resignation of Mr. Fox's Ministry.
Sept. 10, 1872.—Appointment of a Ministry under the premiership of the Hon. E. W. Stafford.
Oct. 4, 1872.—Defeat of the Stafford Ministry on a vote of want of confidence moved by Mr. Vogel.
Oct. 11, 1872.—Appointment of a Ministry under the premiership of the Hon. G. M. Waterhouse, M.L.C.
Oct. 11, 1872.—First appointment of Maori chiefs (two) to be members of the Legislative Council.
Oct. 25, 1872.—The Public Trust Office Act passed.
Jan., 1873.—Establishment of the New Zealand Shipping Company.
Mar. 3, 1873.—The Hon. W. Fox appointed Premier on the resignation of that office by the Hon. G. M. Waterhouse, the other members of the Ministry being confirmed in their offices.
Mar. 19, 1873.—Departure of Governor Sir G. F. Bowen, G.C.M.G.
Mar. 21, 1873.—Assumption of the Government by Sir G. A. Arney, Chief Justice, as Administrator.
April 8, 1873.—Resignation of the premiership by the Hon. W. Fox, on the return of the Hon. J. Vogel, C.M.G., from Australia. Appointment of Mr. Vogel as Premier; the other Ministers being confirmed in their offices.
June 14, 1873.—Arrival of Governor Sir J. Fergusson, P.C.
Aug. 22, 1874.—The Imprisonment for Debt Abolition Act passed.
Nov. 27, 1874.—Sir James Fergusson left Now Zealand.
Dec. 3, 1874.—Arrival of Governor the Marquis of Normanby, P.C.
1874.—31,774 immigrants were introduced this year under the immigration and public-works policy.
Jan. 3, 1875.—Visit of Sir Donald McLean to the Maori King; resumption of amicable relations.
July 6, 1875.—Resignation of the Ministry, in consequence of the absence of Sir J. Vogel, K.C.M.G., in England, and his being unable to attend the session of Parliament. Reconstitution thereof, under the premiership of the Hon. Dr. Pollen, M.L.C.
July, 1875.—Establishment of the Union Steam Shipping Company of New Zealand.
1875.—18, 324 immigrants were introduced this year under the immigration and public-works policy.
Oct. 12, 1875.—The Abolition of Provinces Act passed.
Feb. 15, 1876.—Resignation of the Hon. Dr. Pollen's Ministry, and reconstitution under the premiership of Sir J. Vogel, K.C.M.G.
Feb. 18, 1876.—Completion of the work of laying the telegraph cable between New Zealand and New South Wales.
June, 1876.—Death of Dr. Isaac Earl Featherston, while acting as Agent-General for the colony in England. He was the first to hold that office, and had previously been Superintendent of the Province of Wellington from the time of the first establishment of provincial representative institutions.
Sept. 1, 1876.—Resignation of Sir J. Vogel's Ministry in view of the appointment of Sir J. Vogel as Agent-General. Formation of a Ministry under the premiership of Major Atkinson.
Sept. 13, 1876.—Resignation of Major Atkinson's Ministry in consequence of doubts being entertained as to the constitutional position thereof. Reconstruction of the Ministry under the premiership of Major Atkinson.
Nov. 1, 1876.—The Abolition of Provinces Act, 1875, “came into full operation. Complete abolition of provincial institutions. The colony subdivided into counties and municipal boroughs.
Oct. 8, 1877.—Defeat of the Atkinson Ministry on a vote of want of confidence moved by Mr. Larnach.
Oct. 15, 1877.—Appointment of a Ministry under the premiership of Sir George Grey, K.C.B.
Nov. 29, 1877.—The Education Act, providing for the free and compulsory education of children, passed.
April 11, 1878.—Bishop Selwyn died, in England.
Feb. 29, 1879.—Departure of Governor the Marquis of Normanby, P.C.
Mar., 1879.—Removal of surveyors from the Waimate Plains by Natives acting under Te Whiti's orders.
Mar. 27, 1879.—Arrival of Governor Sir Hercules G. B. Robinson, G.C.M.G.
May 25, 1879.—The Natives from Parihaka, by order of Te Whiti, began ploughing up lands occupied by Europeans.
June, 1879.—Arrest of 180 of these Natives for causing disturbances.
July 29, 1879.—Defeat of the Grey Ministry on an amendment to the Address in Reply, moved by Sir William Pox, followed by a dissolution of Parliament.
Oct. 3, 1879.—Defeat and subsequent resignation of Sir George Grey's Ministry.
Oct. 8, 1879.—Appointment of a Ministry under the premiership of the Hon. John Hall.
Dec. 19, 1879.—An Act passed to assess property for the purpose of taxation.
Dec. 19, 1879.—The Triennial Parliament Act passed.
Dec. 19, 1879.—An Act passed to qualify every resident male of twenty-one years of age and upwards to vote.
June, 1889.—First portion of the Maori prisoners released by the Government.
Sept. 8, 1880.—Departure of Governor Sir Hercules G. B. Robinson, G.C.M.G.
Oct., 1880.—Release of the last portion of the Maori prisoners.
Oct. 26, 1880.—Sir Francis Dillon Bell appointed Agent-General.
Nov. 29, 1880.— Arrival of Governor Sir A. H. Gordon, G.C.M.G.
April 29, 1881.—“Tararua,” steamer, wrecked; 130 lives lost.
June 26, 1881.—Severe earthquakes in Wellington.
Nov. 5, 1881.—March of force of Constabulary and Volunteers on Parihaka, and arrest of Te Whiti and Tohu, without bloodshed.
April 21, 1882.—Resignation (during the recess) of the Hon. J. Hall's Ministry, and its reconstruction under the premiership of the Hon. F. Whitaker, M.L.C.
June 23, 1882.—Departure of Governor Sir A. H. Gordon.
June 24, 1882.—Assumption of the Government by Sir J. Preudergast, Chief Justice.
1882.—Frozen meat first exported in this year.
Jan. 20, 1883.—Arrival of Governor Sir W. F. D. Jervois, G.C.M.G., C.B.
Jan. 26, 1883.—A direct line of steam — communication between England and Now Zealand inaugurated by the New Zealand Shipping Company.
Feb. 13, 1883.—Proclamation of amuesty to Maori political offenders.
Feb. 19, 1883.—Liberation of Te Whiti and Tohu.
Sept. 25, 1883.—Resignation of the office of Premier and his scat in the Ministry by the Hon. F. Whitaker, and the appointment of the Hon. Major H. A. Atkinson to be Premier, the members of Mr. Whitaker's Ministry being confirmed in their offices.
June 11, 1884.—Defeat of Major Atkinson's Government.
June 27, 1884.—Dissolution of the General Assembly.
Aug. 16, 1884.—Resignation of Major Atkinson's Ministry in consequence of the result of the general election. Formation of a Ministry under the premiership of Mr. Robert Stout.
Aug. 20, 1884.—Defeat of Mr. Stout's Ministry by an amendment, expressive of want of confidence, to the Address in Reply being carried.
Aug. 28, 1884.—Appointment of a Ministry under the premiership of Major Atkinson.
Aug. 29, 1884.—Defeat of Major Atkinson's Ministry on a vote of want of confidence.
Sept. 3, 1884.—Appointment of a Ministry under the premiership of Mr, Robert Stout.
Nov. 8, 1884.—An Act passed to enable certain loans of the New Zealand Government to be converted into inscribed stock and the accrued sinking funds-released.
Aug. 1, 1885.—The New Zealand Industrial Exhibition opened at Wellington,
June 10, 1886.—Volcanic eruptions at Tarawera, and destruction of the famed Pink and White Terraces.
May 28, 1887.—Defeat of Sir Robert Stout's Ministry.
July 15, 1887.—Dissolution of the General Assembly, after prorogation, on the 10th June.
July 21, 1887.—A Proclamation issued declaring the Kermadec Islands to be annexed to, and form part of, the Colony of New Zealand.
Oct. 8, 1887.—Appointment of a Ministry under the premiership of Major H. A. Atkinson, Sir Robert Stout's Ministry having resigned in consequence of the result of the election.
Dec. 19, 1887.—An Act passed to reduce the number of members of the House of Representatives, after the expiration of the General Assembly then sitting, to seventy-four, including four Maori representatives.
Dec. 23, 1887.—The Australian Naval Defence Act, being an Act to provide for the establishment of an additional naval force on the Australian station, at the joint charge of the Imperial and the several Colonial Governments, was passed by the New Zealand Legislature.
October 27, 1888.—Formal Proclamation of British Protectorate of Cook Group of islands, by Captain Bourke, R.N., of H.M.S. “Hyacinth.”
Mar. 22, 1889.—Departure of Governor Sir W. F. D. Jervois, G.C.M.G., C.B., from the colony.
Mar. 23, 1889.—Assumption of the Government by Sir James Prendergast.
May 2, 1889.—Arrival of the Earl of Onslow, G.C.M.G.
Sept. 2, 1889.—Electors prohibited by statute from voting in respect of more than one electorate at any election for the House of Representatives.
Dec. 5, 1890.—First election of members of the House of Representatives under a practical manhood suffrage, and on the one-man-one-vote principle.
Jan. 24, 1891.—Notification by Governor of acceptation of resignation (during the recess) of the Hon. Sir H. A. Atkinson's Ministry. Appointment of a Ministry under the premiership of the Hon. John Ballance.
April 22, 1891.—Proclamation by Governor of New Zealand to inhabitants at Raratonga of appointment of British Resident for the Protectorate of the Cook Islands.
Jan. 19, 1892.—Electoral districts of the colony based on population as ascertained by the results of the census of 1891 proclaimed.
Feb. 2, 1892.—Departure of Governor the Earl of Onslow.
Feb. 25, 1892.—Assumption of the Government by Sir James Prendergast, Chief Justice.
June 7, 1892.—Arrival of Governor the Earl of Glasgow, G.C.M.G.
June 28, 1892.—Death of Sir H. A. Atkinson, K.C.M.G., Speaker of the Legislative Council, and previously four times Premier.
Table of Contents
SINCE the completion of the printing of the part of this “Handbook” relating to “Statistical Information,” an interesting report by the Commissioner of Taxes, on the general valuation of land under “The Land and Income Assessment Act, 1891,” has been presented to Parliament.
The following extracts are given, and special attention is drawn to the Commissioner's remarks on the land-values and increased settlement. The definitions of the words “land” and “improvements” in the meaning of the above-mentioned Act are as follow:—
“Land” means and includes all lands, tenements, buildings, and hereditaments, whether corporeal or incorporeal, and also includes all chattel interests in land.
“Improvements” include houses and buildings, fencing, planting, draining of land, clearing from timber, scrub, or fern, laying down in grass or pasture, and any other improvements whatsoever, the benefit of which is unexhausted at the time of valuation.
A general assessment is an undertaking of very considerable magnitude, for all land in the colony has to be valued, whether occupied or unoccupied, whether belonging to companies or persons, or local bodies, to Natives, or the Crown.
Much interesting information may be extracted from an examination of the results of a general land-valuation as to the colony as a whole and its various-parts. The two natural divisions of Now Zealand may be taken first, and the figures for two assessments are:—
| 1888. | 1891. | Increase. | |
|---|---|---|---|
| North Island | £49,607,873 | £57,441,115 | £7,833,242 |
| Middle Island | 61,529,841 | £64,783,914 | 3,254,073 |
| Totals | £111,137,714 | £122,225,029 | £11,087,315 |
Comparing the total valuation of 1888 with 1891, there is an increase of £11,000,000, a result that is highly satisfactory, and will no doubt be a surprise to many persons, even to those who take an interest in watching affairs having a more or less direct bearing on land-values and increased settlement. Of this large additional value, the North Island claims nearly £8,000,000, the increase in the counties being £6,500,000, and the boroughs, £1,800,000. In the Middle Island the increase is £3,000,000, and it may be said that the whole is in the counties, the boroughs showing an increase of £300,000 only. The value of the boroughs in each island is about the same, being £18,184,297 in the North Island, and £18,222,565 in the Middle The North Island counties reach a total of £39,256,818, and those in the Middle, £46,561,349. It appears probable that by November, 1894, the North Island will have reached a total land-value nearly equal to the Middle, for there is every indication that settlement will continue to proceed much more rapidly than in the Middle Island, and there is a great deal of land that is likely to be improved during the next two years, in addition to a large area that has been taken in hand since last November. As an instance of progress, Oroua County may be cited, for its value rose in three years from £1,397,753 in 1888, to £2,268,854 in 1891.
In considering the results of this assessment, it should be remembered that it has been made at a time when in no part of the colony did any excitement in land-dealing exist, and there was nothing like a boom, if one or two small local districts are excepted. In many parts of the colony there has been a great deal of improving done, and on the whole there has been in the districts which show the greatest increase a steady and bonâ fide demand for good to fair land. Itwill be seen that very few portions of the Auckland Provincial District show an increased value, but in several counties in the southern part of the North Island there has been a most marked increase in the total assessed value. It has been asserted—it is always so—that values have been placed at too high a figure by assessors: but this is not the case, and the higher total must be ascribed—firstly, to the increased extent of improved land, and to a generally firmer feeling in the land-market; and, secondly, to many larger properties having been raised to their fair market value.
In the North Island the counties rank thus as to total value: Hawke's Bay, £3,673,889; Oroua, £2,268,854; Waipawa, £2,179,812; Eden, £2,002,677; Cook, £1,885,856; Wairarapa South, £1,872,035; Patangata, £1,863,936; Wairarapa North, £1,831,209; Rangitikei, £1,475,473; Manukau, £1,385,330; Hawera, £1,247,436; Wanganui, £1,176,106; and Hutt, £1,030,745, all the others having a total value of less than £1,000,000. Whangaroa, with a value of £63,825 stands at the bottom of the list.
The North Island counties may be classed into four groups: Auckland Provincial District, excepting Waiapu and Cook Counties; East Coast, from Waiapu County to Waipawa; and West Coast, from Clifton to Herowhenua, in each of which the total value is about £11,000,000; and then, from Pahiatua to the Hutt, there is a total value of something over £5,000,000. These figures exclude boroughs.
Selwyn still has the honour of being the richest county in the colony, its value being £7,446,756, and with its neighbour, Ashley—£3,801,341—-(the second in the colony), makes £11,248,097, nearly equal to the value of all the Auckland counties. Next in the Middle Island to Ashley comes Southland, with a value of £3,739,513; then Ashburton, £3,630,383; Geraldine, £3,257,696: Waitaki, £2,709,379; Waimate, £2,462,433; Marlborough, £1,837,632; Wallace, £1,364,016; Taieri, £1,330,718; Waimea, £1,196,226; Clutha, £1,151,046; Akaroa, £1,169,379; and Westland, £1,048,156, the remaining counties having a value of less than £1,000,000, Sounds—£171,095—-being the lowest. Stewart Island has a value of £85,021, and in the tables is included in the Middle Island.
The total improved value of all the counties in Canterbury is £22,504,009, and of those in Otago and Southland, £15,333,847, the Canterbury counties having increased nearly £2,000,000 since 1888, and the Otago and Southland counties nearly £1,000,000.
Some of the road districts in the Middle Island reach a very high total—Levels, £1,539,999, being the highest, and next are Ellesmere, £1,227,768, and Waipara, £1,187,535. In the North Island, Featherston Road District has a value of £1,138,953. There is a wide margin between these totals and £6,031, the total of landed properties in the Upper Hurford Road District, Taranaki County. Small road districts are very numerous in the North Island, and particularly so in several Auckland counties and in Taranaki County.
In Eden, Manukau, and Peninsula Counties the value of the improvements is higher than that of the unimproved land; and in Hutt County the value of improvements nearly reaches that of the land. Selwyn County has improvements assessed at £2,549,817; Southland, £1,292,111; Hawke's Bay, £1,115,306; and Eden, £1,010,269. The following counties have improvements assessed at nearly one million: Oroua, £970,437; Geraldine, £941,513; Ashburton, £938,917; Waipawa, £931,930; and Ashley, £927,930.
The results of the assessments for the four largest boroughs or cities are:—
| Improved Value. | Improvements. | Unimproved Value. | |
|---|---|---|---|
| £ | £ | £ | |
| Auckland | 4,934,288 | 2,453,472 | 2,471,496 |
| Wellington | 5,865,778 | 2,432,749 | 3,440,182 |
| Christchurch | 3,403,566 | 1,527,626 | 1,820,770 |
| Dunedin | 4,193,422 | 2,069,905 | 2,124,467 |
In considering these figures, it must be remembered that Wellington has no populous and valuable boroughs close to it, as the other cities have.
The second-class boroughs in the colony rank thus for improved value: Napier, £1,275,853; Invercargill, £959,140; Nelson, £942,370; Lyttelton, £851,730; Sydenham, £821,060; Oamaru, £612,571; Wanganui, £543,403; St.Albans, £524,822; Palmerston North, £489,618; Caversham, £466,074; Tiimaru, £442,830; and Devonport, £407,333. Patea, with £43,378, has a less value, than any other borough in the North Island, while Alexandra, £13,578, and Hampden, £13,195, have the lowest value in the Twiddle.
The following are the results of the assessment under “The Land and Income Assessment Act, 1891,” made as at 1st November, 1891, distinguishing the value of improvements from that of the unimproved value:—
| Counties or Boroughs. | Actual Value, including Improvements. | Value of Improvements. | Unimproved Value. |
|---|---|---|---|
| £ | £ | £ | |
| Counties | 85,818,167 | 27,922,735 | 57,880,233 |
| Boroughs | 36,406,862 | 18,442,562 | 17,907,662 |
| Totals | 122,225,029 | 46,365,297 | 75,787,895 |
The following comparative table shows the improved value of land in the different counties, according to the returns made at the assessments of 1888 and 1891:—
| County. | 1888. | 1891. |
|---|---|---|
| * Included in Cook County. | ||
| £ | £ | |
| Mongonui | 180,489 | 190,158 |
| Whangaroa | 71,810 | 63,825 |
| Bay of Islands | 349,441 | 365,069 |
| Hokianga | 504,663 | 422,365 |
| Whangarei | 536,657 | 523,420 |
| Hobson | 284,362 | 325,974 |
| Otamatea | 249,250 | 258,496 |
| Rodney | 273,640 | 293,235 |
| Waitemata | 656,300 | 632,012 |
| Eden | 2,174,570 | 2,002,677 |
| Manukau | 1,339,646 | 1,385,330 |
| Coromandel | 192,882 | 217,120 |
| Thames | 238,533 | 253,013 |
| Ohinemuri | 193,319 | 204,704 |
| Raglan | 267,678 | 357,941 |
| Waikato | 633,571 | 682,774 |
| Piako | 753,700 | 689,384 |
| Waipa | 490,626 | 464,086 |
| Tauranga | 256,966 | 282,723 |
| Rotorua | 119,979 | 168,371 |
| Whakatane | 516,184 | 663,785 |
| East Taupo | 301,781 | 301,681 |
| West Taupo | 268,799 | 235,997 |
| Kawhia | 41,232 | 354,269 |
| Islands— | ||
| Great Barrier, &c. | 54,409 | 55,284 |
| Waiheke, &c. | 63,288 | 71,343 |
| Waiapu | * | 472,548 |
| Cook | 1,762,045 | 1,885,856 |
| Wairoa | 793,898 | 1,101,072 |
| Hawke's Bay | 3,182,295 | 3,673,889 |
| County. | 1888. | 1891. |
|---|---|---|
| * Included in Clifton, Taranaki, Hawera, and Patea Counties. | ||
| Waipawa | 1,644,874 | 2,179,812 |
| Patangata | 1,474,757 | 1,863,936 |
| Clifton | 393,138 | 441,325 |
| Taranaki | 918,098 | 969,579 |
| Stratford | * | 560,345 |
| Hawera | 986,150 | 1,247,436 |
| Patea | 681,345 | 823,675 |
| Waitotara | 597,036 | 731,668 |
| Wanganui | 955,468 | 1,176,106 |
| Rangitikei | 1,082,922 | 1,475,473 |
| Oroua | 1,397,753 | 2,268,854 |
| Manawatu | 536,996 | 810,171 |
| Horowhenua | 569,274 | 858,648 |
| Pahiatua | 334,562 | 511,400 |
| Wairarapa North | 1,540,345 | 1,831,209 |
| Wairarapa South | 1,537,761 | 1,872,035 |
| Hutt | 1,349,510 | 1,030,745 |
| Collingwood | 279,864 | 323,910 |
| Buller | 670,788 | 651,129 |
| Inangahua | 895,519 | 874,948 |
| Grey | 499,593 | 861,890 |
| Westland | 1,309,797 | 1,048,156 |
| Waimea | 1,194,006 | 1,196,226 |
| Sounds | 136,906 | 171,095 |
| Marlborough | 1,716,044 | 1,837,632 |
| Kaikoura | 349,932 | 350,521 |
| Cheviot | 466,912 | 486,765 |
| Amuri | 791,1 | 921,221 |
| Ashley | 3,436,251 | 3,801,341 |
| Selwyn | 7,021,548 | 7,446,756 |
| Akaroa | 1,005,291 | 1,169,379 |
| Ashburton | 3,174,931 | 3,630,383 |
| Geraldine | 3,094,079 | 3,257,696 |
| Mackenzie | 749,974 | 736,021 |
| Waimate | 2,278,351 | 2,462,433 |
| Waitaki | 2,404,762 | 2,709,379 |
| Vincent | 873,259 | 791,595 |
| Maniototo | 689,286 | 449,650 |
| Waihemo | 421,313 | 417,887 |
| Waikouaiti | 619,522 | 602,015 |
| Taieri | 1,299,370 | 1,330,718 |
| Peninsula | 405,897 | 414,146 |
| Tuapeka | 897,650 | 938,701 |
| Bruce | 889,245 | 957,438 |
| Clutha | 1,032,686 | 1,151,046 |
| Lake | 449,132 | 382,722 |
| Southland | 3,257,610 | 3,739,513 |
| Wallace | 1,237,825 | 1,364,016 |
| Fiord | .. | .. |
| Stewart Island | 39,451 | 85,021 |
| Total counties | 76,340,577 | 85,818,167 |
Another table is added to show the actual value of land, including improvements, value of improvements, and the unimproved value in the different boroughs of the colony, according to the returns made at the assessment in November, 1891:—
| Borough. | Actual Value, including Improvements. | Value of Improvements. | Unimproved Value. |
|---|---|---|---|
| £ | £ | £ | |
| Birkenhead | 77,532 | 35,199 | 42,333 |
| Devonport | 407,333 | 244,155 | 163,468 |
| Auckland | 4,934,288 | 2,453,472 | 2,471,496 |
| Parnell | 366,098 | 227,173 | 138,775 |
| Newmarket | 182,353 | 100,026 | 82,327 |
| Newton | 222,355 | 86,748 | 135,607 |
| Onehunga | 250,634 | 139,008 | 111,406 |
| Thames | 227,171 | 150,624 | 76,547 |
| Tauranga | 63,026 | 37,873 | 25,153 |
| Hamilton | 90,142 | 45,558 | 44,584 |
| Cambridge | 70,279 | 44,758 | 25,521 |
| Gisborne | 317,989 | 169,478 | 148,511 |
| Napier | 1,275,853 | 608,696 | 667,157 |
| Hastings | 372,458 | 141,866 | 230,592 |
| Woodville | 102,226 | 44,374 | 57,852 |
| Now Plymouth | 341,117 | 175,496 | 165,621 |
| Hawera | 84,834 | 46,920 | 37,914 |
| Patea | 43,378 | 31,323 | 12,055 |
| Wanganui | 543,403 | 253,082 | 290,321 |
| Marton | 83,915 | 50,179 | 33,736 |
| Feilding | 146,884 | 78,635 | 68,199 |
| Palmerston North | 489,618 | 179,325 | 310,293 |
| Foxton | 85,743 | 45,988 | 39,755 |
| Masterton | 356,860 | 196,999 | 159,861 |
| Carterton | 88,650 | 57,335 | 31,315 |
| Greytown | 115,649 | 81,554 | 34,095 |
| Lower Hutt | 244,075 | 84,897 | 159,178 |
| Petone | 268,358 | 125,817 | 145,221 |
| Onslow | 144,053 | 73,250 | 70,803 |
| Karori | 118,728 | 44,133 | 74,595 |
| Wellington | 5,865,778 | 2,432,749 | 3,440,182 |
| Melrose | 203,517 | 74,088 | 129,429 |
| Picton | 88,195 | 47,006 | 41,189 |
| Nelson | 942,370 | 552,463 | 389,397 |
| Richmond | 84,285 | 40,910 | 43,375 |
| Blenheim | 378,943 | 211,302 | 167,481 |
| Westport | 166,987 | 109,205 | 57,782 |
| Greymouth | 299,077 | 184,514 | 114,543 |
| Brunner | 115,892 | 99,726 | 16,166 |
| Kumara | 33,565 | 26,620 | 6,945 |
| Hokitika | 102,708 | 84,654 | 18,054 |
| Ross | 16,961 | 11,711 | 5,250 |
| Rangiora | 158,017 | 86,856 | 71,161 |
| Kaiapoi | 134,055 | 87,032 | 47,023 |
| St. Albans | 524,822 | 239,634 | 284,938 |
| Christchurch | 3,403,566 | 1,527,626 | 1,820,770 |
| Sydenham | 821,060 | 487,184 | 333,876 |
| Sumner | 102,145 | 41,899 | 60,246 |
| Lyttelton | 851,730 | 701,240 | 150,490 |
| Akaroa | 49,407 | 29,779 | 19,028 |
| Ashburton | 223,091 | 132,358 | 90,733 |
| Timaru | 442,830 | 290,369 | 151,661 |
| Waimate | 75,399 | 56,640 | 18,759 |
| Oamaru | 612,571 | 333,458 | 279,113 |
| Hampden | 13,195 | 7,966 | 5,229 |
| Palmerston | 51,182 | 34,411 | 16,771 |
| Hawkesbury | 45,716 | 25,893 | 19,823 |
| Port Chalmers | 200,043 | 139,097 | 60,946 |
| West Harbour | 137,015 | 68,775 | 68,240 |
| North-east Valley | 276,835 | 146,564 | 130,271 |
| Maori Hill | 142,890 | 75,542 | 67,348 |
| Roslyn | 360,962 | 191,352 | 169,610 |
| Mornington | 284,875 | 159,461 | 125,414 |
| Dunedin | 4,193,422 | 2,069,905 | 2,124,467 |
| Caversham | 466,074 | 248,916 | 217,158 |
| South Dunedin | 223,534 | 146,925 | 82,609 |
| St. Kilda | 118,477 | 41,635 | 76,842 |
| Green Island | 36,962 | 23,377 | 13,585 |
| Mosgiel | 122,625 | 69,184 | 53,441 |
| Naseby | 24,186 | 21,746 | 2,440 |
| Cromwell | 22,168 | 17,510 | 4,658 |
| Alexandra | 13,578 | 10,623 | 2,955 |
| Roxburgh | 20,123 | 16,956 | 3,167 |
| Lawrence | 79,066 | 60,482 | 18,584 |
| Tapanui | 16,155 | 13,580 | 2,575 |
| Milton | 78,207 | 62,195 | 14,012 |
| Balclutha | 53,210 | 38,663 | 14,547 |
| Kaitangata | 54,976 | 33,843 | 21,133 |
| Arrowtown | 24,586 | 19,574 | 5,012 |
| Queenstown | 65,153 | 51,629 | 13,524 |
| Gore | 142,708 | 76,537 | 66,171 |
| Winton | 20,195 | 12,230 | 7,965 |
| Gladstone | 26,541 | 12,716 | 13,825 |
| Avenal | 15,269 | 8,582 | 6,687 |
| North Invercargill | 28,293 | 12,653 | 15,640 |
| East Invercargill | 42,996 | 24,611 | 18,385 |
| Invercargill | 959,140 | 440,200 | 517,879 |
| South Invercargill | 79,526 | 36,713 | 42,813 |
| Riverton | 59,626 | 37,602 | 22,024 |
| Campbelltown | 97,380 | 47,950 | 49,430 |
| Totals | 36,406,862 | 18,442,562 | 17,907,662 |
- Accumulation, 89
- Addendum—
- Land Values and Increased Settlement, 333
- Agents for the Colonies, Grown, 24
- Agents-General in London, 24
- Ages of Parties to Marriage, 63
- Of Population, 51
- Supporting and Dependent Population, Proportions at, New Zealand, 52
- Agricultural and Live-stock Department, 42
- Pastoral, and Dairy Produce, 93-103
- Statistics (see Cultivation), 95
- Agriculture, 114-135
- Artificial Manures, 132
- Butter Import, United Kingdom, 130
- Cattle, 126
- Cereals, 116
- Cost of Working a Farm in New Zealand, 120
- Dairy Industry, 127
- Stock, 126
- Fruit Industry, 131
- Horse-breeding, 126
- In Middle Island, 115
- In North Island, 114
- Lambing Returns—Averages, 125
- Root-crops, 117
- Seeds, 118
- Statistics, 133-135
- Value of Produce exported, 122
- Woollen Manufactories, 125
- Ahuriri (Napier) Harbour, 232
- Akaroa Harbour, 237
- Alcohol in Ten Years, Consumption of, 68
- Annual Meetings of Religious Bodies, 30-32
- Antimony, 175
- Hints to Prospectors for, 188
- Appendix—
- Crown Lands, 277
- Customs Tariff of New Zealand, 289
- Events in the History of New Zealand, Principal, 323
- Postal Information, 302
- Telegraphic Information, 321
- Telephone Exchange, 323
- Archbishop, Roman Catholic, 30
- Area of Australasian Colonies (each), 7
- Compared with European Countries, 7
- Of New Zealand, 6
- In Acres, 279
- North, Middle, Stewart, and other Islands, 5, 6
- Of United Kingdom compared with New Zealand, 7
- Arms, Ordnance, &c., 48
- Arrivals (see Immigration).
- And Departures (see Immigration and Emigration).
- Artificial Manures, 132
- Artillery, 47, 48
- Assembly—
- Presbyterian Church of Otago and Southland, 31
- Of New Zealand, 31
- The General, 26
- United Methodist Free Churches, 31
- Assignees in Bankruptcy, Official, 36
- Asylums, Benevolent, 270
- Lunatic, 271
- Inspector of, 39
- Orphan, 271
- Attorney-General, 35
- Auckland Docks, 245
- Harbour, 230
- Audit Office, 34
- Travelling Inspectors, 34
- Australasian Statistics (see broadsheet).
- Australian Colonies, The, 6
- Awarua (Bluff) Harbour, 239
- Bankruptcy, 105
- Official Assignees in, 36
- Realisation of Assets, 105
- Banks of Issue—
- Advances and Discounts, 89
- Assets and Liabilities, 90
- Deposits, 90
- In all Classes of—Average per Head, 91
- Notes in Circulation, &c., 90
- Savings—
- Private, 90
- Deposits, Withdrawals, 90
- Post-office, 90
- Deposits, Withdrawals, Open Accounts, Amounts to Credit, 90
- Baptist Annual Conference, 31
- Barley and Potatoes, Yield of Wheat, Oats 133
- Cultivation of, 99
- Export of, 69
- Bay of Islands, 235
- Beer, Consumption of, per Head, 68
- Benevolent Asylums and Charitable Institutions, 270
- Bible Christians, 31
- Birthplaces of Population, 51
- Birth-rate, Ten Years, 61
- Compared with United Kingdom, 61
- Decline of, 61
- Births, 61
- Excess of, over Deaths, for Ten Years, 56
- Illegitimate, 62
- Registered, Ten Years, 61
- Bishops, Church of England, 30
- Roman Catholic, 30
- Bluff Harbour, 239
- Board of Examiners under “The Coal Mines Act, 1891”, 40
- “The Mining Act, 1891”, 40
- Boards, Members of Land, 42
- Of Education, 39
- Boroughs, Expenditure of, 111
- Indebtedness of, 111
- Principal, Population of, 57, 58
- Revenue of, 111
- Value of Rateable Property, 111
- Botanic Garden Board, New Zealand Institute and, 40
- Boundaries of the Colony, 5
- Bowen Fall, The, 220
- Breadstuffs in Various Countries and Colonies, Consumption of, 98
- Bricks and Pottery, 199
- Brigades, Fire, 268
- British Subjects in Now Zealand at Time of Census, 50
- Building Societies, 91
- Amounts deposited with, 91
- Income, Assets, Liabilities, Reserve Funds, 91
- Building-stones, 194-199
- Basalts and Diorite, 195
- Cement, 198
- Crystalline Schists, 196
- Earthy Limestone, 197
- Granite, 196
- Limestones, 196
- Marble, 196
- Buller River (Kawatiri), 241
- Butter, 102
- And Cheese, Export of, 131
- Export of, 72
- To United Kingdom, Seven Years, 72
- Into United Kingdom, Importation of, 129-131
- Cadet Corps, 48
- Campbelltown, 239
- Capitation to Efficient Volunteers and Cadets, 49
- Catholic Church, Roman, 31
- Cattle, 101
- In Colony, Number of, 126
- Causes of Death, 64
- Phthisis, 65
- Ages and Length of Residence in Colony of Persons dying from, 65
- Deaths from, increased by Introduction of Phthisical Persons, 65
- Deaths from, at various Ages, 65
- Table showing the Percentage of Deaths from each, 64
- Cavalry, Volunteers, 47
- Cement, 198
- Portland, 199
- Census Results, 50-55
- People, Ages of the, 51
- Birthplaces of, 51
- Conjugal Condition of, 53
- Degree of Education of, 53, 54
- Dwellings of, 50
- Occupations of, 55
- Religions of, 52
- Cereals, 116
- Chapels, Churches and, 32
- Charitable Institutions, Benevolent Asylums, and, 270
- Cheese, 103
- Cheese and Butter Factories, Number of, 128
- Export of, 72
- Butter and, 131
- Chief Postmasters, 37
- Chinese—
- Immigration and Emigration of, 59
- Poll-tax on, 59
- Christians, Bible, 31
- Chrome, 175
- Hints to Prospectors for, 191
- Church, Baptist, 31
- Churches and Chapels in Provincial Districts, 33
- Church, Hebrew, 31
- Of England, 30
- Of England Bishops, 30
- Of New Zealand, Presbyterian, 31
- Of Otago and Southland, Presbyterian, 31
- Primitive Methodist, 31
- Roman Catholic, 31
- United Methodist Free, 31
- Wesleyan Methodist, 31
- Cinnabar, 176
- Cities (see Boroughs), 57
- Civil Establishment at Seat of Government, 34
- Clerks of District Courts, 36
- Mining Registrars', 36
- Resident Magistrates', 36
- Warden's Court, 36
- Climate, Temperature, Rainfall, &c., 199-203
- Comparison between East and West Coast Climates, 200
- Meteorological Observations, 199
- Rainfall, 201
- Temperature, 199
- Thunderstorms, 203
- Winds, 202
- Clothing, Imported, 67
- Coal, Description of, in New Zealand, 178
- Import and Export of, 67-69
- Output of, 179
- Raised in the Colony, 177
- Coast-waiters, Officers in Charge of Ports, and, 37
- Colonial Office, The, 22
- Secretary's Department, 34
- Treasurer's Department, 34
- Colonies, Crown Agents for the, 24
- The Australian, 6
- Colonisation, 4
- Colonists, Honours held by viii, 22
- Colony, Boundaries and Area of the, 5
- Crown Agents for the, 24
- Commissioner, Government Life Insurance, 43
- New Zealand Police Force, 41
- Of Telegraphs, 36
- Commissioners of Railways, 41
- School, 39
- Company, New Zealand Shipping, 251
- Shaw Savill and Albion, 253
- Union Steamship, 249
- Congregational Union, Annual Meetings of, 31
- Consolidated Stock Act, Creations under, equal to Increase of Sinking Fund, 83
- Constitution and Government, 14-16
- Consuls, Foreign, 23
- Cook Strait, 10
- Copper, 174
- Coromandel Harbour, 231
- Cost of Working a Farm in New Zealand, 120
- Council, Executive, 1892, 25
- Legislative, Roll of Members of the, 26
- Successive Speakers of the Legislative, 21
- Councils, Executive, 1843-56, 18
- Counties (see Local Bodies).
- Court Judges, District, 35
- Supreme, 35
- Courts, Bankruptcy, 105
- Civil Cases, Supreme and District, 105
- Clerks of District, 36
- Native Land, 274
- Recorders of, 40
- Resident Magistrates', Civil Cases, 105
- Charges for Offences before, 106
- Committals, 106
- Summary Convictions before, 106
- Supreme and District, Convictions, 106
- Divorce and Separation, 106
- Crime (see Courts and Offences).
- Crown Agents for the Colonies, 24
- Lands, Alienated, 92,93
- “Guide”, 279
- Crown Lands of New Zealand—
- Area of the Colony, in Acres, 279
- Available for Settlement, 279
- Held on Settlement Conditions, 280
- Land Laws, Digest of the—
- Administration of the, 281
- Cash Lands, 282
- Classification of Lands, 281
- Deferred-payment of Lands, 282
- Homestead System, 284
- Land Districts and Principal Land Offices, 281
- Mode of acquiring Crown Lands, 281
- Optional System of Land Tenure, 281
- Pastoral Buns, 285
- Perpetual-lease Lands, 283
- Small-farm Homestead Associations, 286
- Small Grazing-runs, 285
- Tenure, 281
- Selectors, 1891-92, Number of, 280
- Summary of Lands open for Selection, 287
- Systems of Disposal, 92, 93
- Crown Law Officers, 35
- Prosecutors, 35
- Solicitors, 35
- Crystalline Schists, 196
- Cultivation, Barley, 99
- Extent of Land in, 96
- Holdings over 1 acre, occupied, 96
- To every 100 Adult Males, 96
- Hops, 99
- Land in Sown Grasses, 100
- Under Grain-crops in Provincial Districts, 96
- Cultivation, Oats, 99
- In Australian Colonies, 99
- Orchards, 100
- Potatoes, 99
- Tobacco, 100
- Turnips, 99, 117
- Wheat, 96
- In Australian Colonies, 97
- Customs and Marine, Department of Trade and, 37
- Collectors of, 37
- Duties, Revenue from, 79
- Tariff of Now Zealand, The, 289
- Dairy Factory Companies, 103
- Farming, 126
- Industry 127-131
- Produce, Export of, 72
- 1881, 1886, 1891 103
- Stock, 126
- Dargaville, 235
- Dates of Principal Events in the History of Now Zealand, 323
- Deaf-mutes, Institution for, 107
- Death-rate, 1882-91, New Zealand, 63
- 1881-90, various Countries and Colonies, 63
- Affected by Proportions Living at different Age-periods, 63
- Australian Colonies, 262
- New Zealand compared with England, 63
- Deaths, 63-65
- Amount left by each Deceased Person, 86
- Causes of (see Causes), 64
- Debt, General Government (see Public Debt).
- Of Local Bodies, 109
- Deeds, Registrar-General of Lands and, 38
- Defences, Military and Naval, 47
- Administration, 49
- Artillery—Permanent Militia, 47
- Cadet Corps—Volunteers, 48
- Capitation, 49
- Cavalry—Volunteers, 47
- Engineers—Volunteers, 48
- Enrolment, &c., 49
- Expenditure and Maintenance, 49
- Field Artillery—Volunteers, 48
- Instructors, 49
- Militia and Volunteer Districts, 47
- Mounted Rifles—Volunteers, 47
- Naval Artillery—Volunteers, 48
- Ordnance, Arms, &c., 48
- Rifle Corps—Volunteers, 48
- Torpedo Corps—Permanent Militia, 47
- Deferred-payment Lands, Disposal of, 92
- Delayed Telegrams, 322
- Denominations, Religious, 32
- Departures (see Immigration and Emigration).
- Designs, and Trade-marks, Patents, 266
- Discovery and Early Settlement, 2
- Of Gold in New Zealand, 169-173
- Diseases, 64
- Distances, by Rail and Sea, Table of, 255
- District Courts, Clerks of, 36
- Land Registrars, 38
- Divorce and Separation, 100
- Docks and Patent Slips, Graving, 245
- Drainage Board, Revenue, 113
- Early Settlement, Discovery and, 2
- Ecclesiastical, 30
- Education (see Public Instruction, also Schools), 256-258
- Department, 38
- Minister of, 38
- Of the People, Degree of, 53
- Reserves, Administrators of, 39
- University, 108
- Education Boards, Expenditure of, 257
- Income of, 257
- Egmont, Mount, 9
- Electorates, 28, 29
- Electric Telegraph, 79
- Emigration (see Immigration and Emigration).
- Engineers, Volunteers, 48
- Enrolment of Permanent Militia, 49
- Estates, Intestate, 265
- Examiners of Titles under “The Coal-mines Act, 1891,” Board of, 38-40
- Under “The Mining Act, 1891,” Board of, 40
- Excise, Tables of Duties of, 301
- Executive Council, 1892, 25
- Executive Councils, 1843-56, 18
- Expenditure, Boroughs, 111
- Charges of Public Debt, 82
- Counties, 111
- General Government, 81
- On Education, 81
- On Railways, 88, 89
- On Reproductive Public Works, 85
- Out of Loan by General Government on certain Public Works, 82
- Out of Revenue and out of Loan, 81, 82
- Exports, 69-76
- And Imports, Total Value of, 66-69
- From United Kingdom to various Countries and Colonies, 76
- Of Butter to United Kingdom, Seven Years, 72
- Of Coal, 69
- Of Dairy Produce, 72
- Exports of Frozen Meat, 71, 139
- Value, Ten Years, 139
- Of Gold, 71
- Of Grain, 71
- Of Home Produce, per Head, 69
- Of Phormium, 72
- Re-exports, exclusive of Specie, 70
- Of New South Wales compared with New Zealand, 70
- Value of, from different Ports, 73
- Principal Articles of New Zealand Produce, 69
- Wool, Ten Years, 70
- Factories, 104
- Farming, Dairy, 126
- Sheep, 122
- Farm in New Zealand, Cost of Working, 120
- Features of the Middle Island, 10
- Of the North Island, 7
- Finance, 79
- Fire Brigades, 268
- Fish and Fisheries—
- Kinds used for Food, 167
- Persons employed in Fishing, Number of, 168
- Variety of Species, 167
- Flax, Export of, 72
- Preparation, &c., 153
- Flocks of Sheep, Number and Size of, 71
- Foreign Consuls, 23
- Forest-trees and Timber Industry—
- Export Trade, Value of, 151
- Forest Timbers, Description of, 43-149
- Fungus, New Zealand, 151
- Strength of Timbers, 150
- Timber Industry and Produce, 151, 152
- Foveaux Strait, 13
- Frauds Prevention Act, Truss Commissioners under Native Lands, 40
- Freestone, 197
- Freezing Establishments, Number of, 139
- Process, and Growth of Industry, 137
- Friendly Societies, 269
- Lodges, &c., Assets, Receipts, Sick and Funeral Funds, Expenditure, Sick Pay, Funeral Donations, Management Expenses, 91
- Registry Office, 34
- Frozen Beef, Quantities and Values of, 140
- Meat, Value of Export for Ten Years, 69, 139
- Meat Industry, 136-141
- An Interesting Experiment, 141
- Bonedust, Quantity and Value of Output, 140
- Bones, Horns, Hoofs, &c., Output of, 140
- Corned Beef, Casks, and Value of Output, 140
- Frozen Sheep, Output, 140
- Increase in Numbers of Sheep, 136
- Neatsfoot- and Trotter-oil, Quantities and Values of Output, 140
- Preserved Meats, Export and Output, 140
- Process of Freezing and Growth of Industry, 137
- Provincial Districts, Quantities from the various, 140, 141
- Tallow, Output of, 140
- Sheep and Lambs, Carcases and Value of, 140
- Fruit Industry, The, 131, 132
- Fungus, New Zealand, 151
- Gaolers, 36
- Gaols and Prisoners, 106
- General Assembly, The, 26
- Post Office Department, 36
- Geological Survey, Museum, and Observatories, 40
- Glaciers in Middle Island, 11
- Gold, Coal, and other Minerals, 169-176
- Antimony, 175
- Chrome, 175
- Cinnabar, 176
- Coal, 177
- Composition of, 179, 180
- Output of, 178, 179
- Gold, Coal, Quantities and Values exported, 177
- Copper, 174
- Exported, 71, 173
- Hints to Prospectors for, 182-193
- In New Zealand, Discovery of, 169-173
- Iron, 176
- Lead, 175
- Manganese, 175
- Mineral Oils, 177
- Mining generally, 181
- Produced, 71, 173
- Scheelite, 180
- Quantities and Values exported, 173
- Silver, 174
- Stones, Precious, 181
- Tin, 176
- Government—
- Life Insurance Department, 43, 260
- Chief Object, 260
- New Business, 262
- Progress of Business, 260
- The Seat of, 16
- Governor of New Zealand, 25
- Governors, Successive, 17
- Grain exported, 71
- Grown in each Provincial District, 96
- (See also Cultivation.)
- Grazing-runs, Small, 93
- Grass Lands, Acres of, 135
- Grass-seeds, Cocksfoot and Rye-grass, 134
- Graving Docks and Patent Slips, 245
- Auckland Docks, 245
- Lyttelton Dock and Patent Slip, 245
- Port Chalmers Dock, 246
- Wellington Patent Slip, 246
- Grey River, 240
- Gum, Kauri, 154
- Harbour Boards' Revenue, 113
- Harbourmasters, 38
- Harbours—
- Middle Island, 236
- North Island, 230
- Hay, Acres in, 135
- Hebrew Ministers, 31
- Hemp, New Zealand, 153
- Hints to Prospectors for Gold and other Minerals—, 182
- Antimonial Silver-ores, 187
- Antimony, 188
- Chrome, 191
- Copper, 189
- Gold, 185
- Lead, 189
- Manganese, 190
- Nickel, 191
- Platinum, 187
- Scheelite, 192
- Silver, 186
- Tin, 187
- Hints to Prospectors for Gold and other Minerals—
- Tin, Cassiterite or Tin-stone, 188
- Zinc, 190
- Hokitika River, 240
- Honours held by Colonists, 22
- Hops cultivated, 99
- Horse-breeding, 126
- Horses, 101
- Hospitals—, 209
- Accommodation, and Indoor Patients, 270
- General Management, 270
- Number of Districts, 269
- Outdoor Relief, 270
- Revenues of Boards (how raised), 269
- Hot Springs (see Mineral Waters of New Zealand), 203
- House of Representatives—, 15, 27
- Roll of Members of the, 28
- Speakers of the, 22
- Illegitimacy, 62
- Immigration and Emigration, 58-61
- Assisted and Unassisted Immigrants (Ten Years), 60
- Each Australian Colony, 59
- Excess of Departures on Reduction of Expenditure in Loan Money, 60
- Immigration, 61
- From United Kingdom, Australian Colonies, and other Places, 59
- Gain by net Immigration in Ten Years, 60
- Nominated Immigrants, and Terms for, 59
- Of Chinese, 59
- Poll-tax on Chinese, 59
- Minister of Lands and, 41
- Importation of Butter into United Kingdom, 129-131
- Imports and Exports, Total Value of, 66-69
- For Ten Years, 66, 69
- Imports—
- Beer, Spirits, and Wine, Consumption of, 68
- Coal, 67
- From Different Countries, 1891, 68
- United Kingdom to Australasia, 76
- United States, Ten Years, 74
- Per Head of Population, Ton Years, 73
- Principal Articles, in Groups, 1891, 67
- Clothing, &c., 67
- Spirits, 67
- Sugar and Tea, 67
- Consumption of, per Head of Population, 67
- Tobacco, Consumption of, 68
- Value of, 66
- Deducting Specie, 66
- For Ten Years, 66
- Per Head of Population, Australian Colonies, 75
- Wine, 67
- Income-tax Department, Land and, 34
- Proposed, 80
- Increased Value of Land with Improvements, 333
- Indebtedness, Foreign, 86
- Of Boroughs, 109
- Of Local Bodies, 84, 109
- For Ten Years, 109
- Indebtedness, To Persons outside Colony, 86
- Industrial Schools, 272
- Industries, various, 104
- Industry, Frozen Meat, 136-142
- Information, Postal, 302
- Telegraphic, 321
- Inspector of Lunatic Asylums, 39
- Inspectors, Police Department, 41
- Of Stock, 42
- Institute, New Zealand, 258
- Instruction, Public, 256
- Instructors, Military and Naval, 49
- Insurance Department, Government Life, 43, 260-263
- Interesting Experiment—Frozen Sheep, 141
- Intestate Estates, 265
- Introduction of Trout to New Zealand, 168, 169
- Invercargill (New River) Harbour, 239
- Iron, 176
- Machinery, &c., imported, 67
- Islands, Description of the—
- Antipodes, 6
- Auckland, 6, 13
- Bounty, 6
- Campbell, 6
- Chatham, 6, 13
- Kermadec, 6, 13
- Middle, 10
- North, 7
- Stewart, 13
- Outlying, 13
- Jacob's River, Riverton, 239
- Joint-Stock Companies—
- Registrar of, 38
- Assistant Registrars of, 38
- Judicial, 46
- Justice Department, 35
- Kaipara Harbour, 234, 235
- Kauri-gum—
- Quantities and Values exported, 72, 154, 155
- Where found and Method of Searching for it, 72, 155
- Kawatiri (Buller) River, 241, 242
- Kawau Bay, 236
- Kawhia Harbour, 234
- Kororareka Bay (Port Russell), 236
- Labour—
- Department, 39
- In New Zealand, 156-166
- Occupation and Local Industries, Kinds of, 158-161
- Prices of Provisions, Live-stock, &c., 165, 166
- Wages, Average Rates of, 161-164
- Minister of, 39
- Lakes, 10, 12
- Lambing Averages, 125
- Land—
- Alienated from Foundation of Colony, 92
- And Income-tax Department, 34
- Boards, Members of, 42
- Crown, Methods of Disposal of, by (1) Cash, (2) Deferred-payment, (3) Perpetual Lease, (4) Homestead, (5) Agricultural Lease on Goldfields, (6) Small Grazing-runs, (7) Pastoral Runs, 281-286
- Fit for Agriculture and Pasture, 8, 13
- Held as Pastoral Runs, 93
- Revenue from, 93
- Held as Small Grazing-runs, 93
- Increased Value of, with Improvements, 333
- Laws, Digest of the, 281
- On Perpetual Lease, 93
- Purchase Branch, 42
- Quality of, 8, 13
- Registrars, District, 38
- Sold on Deferred Payments, 92
- Sold for Cash, 92
- Revenue from, 79
- Tax upon—proposed, 79
- Graduated, 80
- Transfer Department, 38
- Village Settlements, sold on Deferred Payments and for Cash, 93
- Without Sale, 92
- Lands—
- And Deeds, Registrar-General of, 38
- And Immigration, Minister of, 41
- And Survey Departments, 41
- Available for Settlement, 279
- Crown, 279
- Frauds Prevention Act, Commissioners under, 40
- Open for Selection, Summary of, 287
- Survey Charges on Unsurveyed, 286
- Land-values and Increased Settlement—
- General Valuation, 333
- Results of Assessments, 1888 and 1891, 335
- Total Valuations in Boroughs, 337
- Law and Crime, 105
- Law Office, Crown, 35
- Lead, 175
- Hints to Prospectors for, 189, 190
- Legislative Council, 26
- Roll of Members of the Honourable the, 26, 27
- Letters delivered and posted, 77
- Rates of Postage on, 303
- Times of Arrival of Colonial and Foreign, 302
- Times of Despatch of Colonial and Foreign, 302
- Life Insurance Department, Government, 43, 260-263
- Agencies, 43
- Annual Premiums, 262
- Commissioner, 43
- Death-rate, 262
- New Business, 262, 263
- Progress of Business, 260-262
- Lighthouses, Names and Number of, where situate, Colour, Order, &c., 247, 248
- Limestones, 196
- List of Official Departments, 34-43
- Live-stock, 101
- Department, Agricultural and, 42, 43
- Live-stock, Export of, 69
- In Australasian Colonies, 102
- Inspectors, 43, 44
- Loans—
- General Government (see Public Debt).
- Local Bodies, Outstanding at various Interest, 110
- Local Bodies—
- Expenditure of Boroughs, 111
- Counties, 111
- Indebtedness, 109
- Of Boroughs, 109
- Ten Years, 109
- Outstanding Loans at various Bates of Interest, 110
- Property in Town Districts, 111
- Rates collected in Ten Years, 109
- Revenue of, 109
- Boroughs, 111
- Counties, 111
- Drainage Board, 113
- Harbour Boards, 113
- River Boards, 112
- Road Boards, 112
- Town Boards, 112
- Value of all Rateable Property, Three Years, 112
- Capitalising Annual Values, 112
- In Boroughs, 111
- In Road Districts, 111
- Outlying Road Districts, 111
- Taxation by, 113
- Lunatic Asylums, 271
- Inspector of, 39
- Lyttelton, Port of, 236
- Magistrates, Resident, 35
- Courts, Clerks of Resident, 36
- Mail-services, Cost of, England and New Zealand, 78
- Mails—
- Interprovincial Coastal, 302
- Times of Arrival of Colonial and Foreign, 302
- Times of Departure of Colonial and Foreign, 302
- Manganese, 175
- Hints to Prospectors for, 190
- Mangonui Harbour, 235
- Manufactories, 104
- Manufactures, Value of, 105
- Manukau Harbour, 234
- Manures, Artificial, 132
- Maoris, The, 3, 4
- Ages of the People, 276
- Charged with Offences, 106
- Charges and Convictions, all Courts, 106
- Education, 274
- Electoral Districts and Votes recorded, 274
- Lands, 273
- Marriage between, 62
- Native Affairs, 275
- Land Court, 274
- Population, 56, 273-270
- Representation, 274
- Maoris, The—
- Seldom register Births and Deaths, 56
- Their Numbers and Condition as at present, 273-276
- Their Part in Government, 15
- They Contribute towards Taxation, 81
- Tribes, Principal, 276
- Map of New Zealand (at end).
- Marble, 196
- Marine Department, 37, 38
- Minister of, 37
- Marriage—
- Ages at which Sexes may contract, 63
- Between Maoris, 62
- By Registrars, 62
- Forms of, 62
- Of Minors, Consent necessary for, 62
- Proportions of each Denomination, 62
- Rate, New Zealand the lowest among the Australasian Colonies, 62
- Meat, Export of Frozen, 139, 140
- Industry, Frozen, 136-142
- Trade, 71
- Members of Land Boards, 42
- House of Representatives, Roll of, 28
- Legislative Council, Roll of, 26
- Mercury Bay, 231
- Meteorological Observations, 199
- Middle Island, Physical Features of, 10
- Ports, Harbours, &c., 236-243
- Milford Sound, 219
- Military and Naval Defences, 47
- Militia, Permanent and Volunteer, 47
- Mills, 104
- Mineral Oils, 177
- Minerals, Gold, Coal, and other, 169-181
- Mineral Waters of New Zealand, 203-219
- Bath, Accommodation at Rotorua, 215
- The Blue, 208
- The Rachel, 207
- The Priest's, 206
- Curative Effects of Mineral Waters, 213
- Echo Lake, 217
- Middle Island Mineral Waters, 218
- Neuralgia, Patients suffering from, 212
- Paralysis, Cases of, 209
- Cases for Treatment, 208
- Paraplegia cured, 210
- Rheumatism and Skin-diseases, 210
- Cases of Severe, 211
- Rotomahana Lake, Old, 216
- Rotorua, as a Health Resort, 213
- Climate of, 203
- Hospital, 206
- Physical Features of, 204
- Route to, 214
- Sanatorium, 205, 214
- Skin Diseases, Great Success in Cases of, 212
- Tariff, 206
- Volcanic Outbreak at, 213
- Works at, 214
- Tarawera, Rotoehu, and Rotomahana, 217
- Mineral Waters of New Zealand—
- Thermal Springs, The, 217
- District, 203
- Mines Department, 40
- Inspectors of, 40
- Minister of, 40
- Mining, 103
- Generally, 181
- Registrars, 36
- Ministers, Cabinet, 25
- Number of Officiating, under Marriage Act, 32
- Ministries, Successive, 20
- Mitre Peak, 219
- Mokihinui River, 242
- Money-orders, 78, 316
- Mountains, 9, 11
- Mount Cook, 11
- Egmont, 9
- Ruapehu, 9
- Tongariro, 9
- Mounted Rifles—Volunteers, 47
- Museum and Observatories, Geological Survey, 40
- Napier (or Ahuriri) Harbour, 232
- Native Agents, 39
- Department, 39
- Land Court, 39, 274
- Recorders of the, 40
- Land Frauds Prevention Act, Trust Commissioners under, 40
- Nelson Haven, 242
- New Plymouth, 233
- New River Harbour, Invercargill, 239
- New Zealand, 1
- Abolition of Provincial Governments in, 14
- Area of, 5
- Arrival of Missionaries in, 3
- Boundaries of, 5
- Captain Cook's Visits to, 2
- Colonisation of, 4
- Colony divided into Six Provinces, 14
- Company, 4
- County Government in, 14
- Discovery of, 2
- General Assembly of, 26
- Governor of, 25
- Governors of, Successive, 17
- Institute, 258
- Botanic Garden Board, and, 40
- Labour in, 156-161
- Lieutenant Hanson's Visit to, 3
- Made a Separate Colony, 5
- Map of (at end).
- Middle Island of, Physical Features of the, 10
- North Island of, Physical Features of the, 7
- Permanent Militia, 47
- Police Force, 41
- Premiers of, 21
- Provincial Governments abolished in, 14
- Representative Government granted in, 14
- New Zealand—
- Settlement at Port Nicholson, 4
- Canterbury, 5
- Nelson, 5
- New Plymouth, 5
- Otago, 5
- Shipping Company, The, 251
- Sovereignty of Queen proclaimed, 4
- Surville and Marion du Fresno's Visit, 3
- Tasman's Visit, 2
- Treaty of Waitangi, 4
- Nickel, Hints to Prospectors for, 191
- Oamaru Harbour, 238
- Oat-crop of Australasian Colonies, 99
- Oats, Barley, and Potatoes, Yield of Wheat, 133
- Oats, Cultivation of, 99
- Export of, 71
- For Fodder and Hay, Acres under, 135
- Observatories, Geological Survey, and Museum, 40
- Occupations of the People, 55
- Offences—
- Charges for, before Resident Magistrates' Courts (1890), 106
- Committals for, 106
- Maoris charged with, 106
- Convicted before Supreme and District Courts, 106
- Summarily convicted, 106
- Summary Convictions for, 1890, 106
- Officers in Charge of Telegraph-offices, 37
- Office, The Colonial, 22
- Official Assignees in Bankruptcy, 36
- Official List, 34-43
- Officiating Ministers, Number of, 32
- Oils, Mineral, 177
- Orchards, 100
- Oreti (New) River, Invercargill, 239
- Orphan Asylums, 271
- Otago Harbour, 238
- Outlying Islands of New Zealand, The, 13
- Parcel Post, 320
- Foreign, 320
- Parliament, Members of, 26-29
- Parliaments, Successive, 19
- Pastoral and Dairy Produce, 101
- Pastoral Leases—
- Operations under, 93
- Receipts from, 79, 93
- Patea Harbour, 233
- Patent Office, 35
- Patents, Designs, and Trade-marks, 266-268
- Patent Slips, Graving-docks and, 245
- Patiti Point, Port Timaru, 237
- Pelorus Sound, 242
- Pensions, Annual, 44
- Permanent Militia, 47
- Perpetual Leases—
- Description of, 92
- Operations under, 93
- Phormium—
- Export of, 72, 154
- Its Preparation and Dressing, 153
- Mills, 104
- New Zealand Hemp, 153
- Physical Features of the Middle Island, 10-13
- North Island, 7
- Picton, 243
- Pigs, 101, 131
- Platinum, Hints to Prospectors for, 187
- Police Department, 41
- Force, New Zealand, 41
- Population—
- At Age-periods, 51
- At Census, 1891, 50
- At Supporting and Dependent Ages, 52
- Birthplaces of, 51
- Chinese, 50
- Conjugal Condition of, 53
- Degree of Education of, 53, 54
- Dwellings of, 50
- In different Islands, 50
- In Principal Towns and Suburbs, 57, 58
- Maoris, 50
- Occupations of, 55
- Of Australasian Colonies, 57
- On 31st December, 1891, 55
- Proportions of the Sexes in New Zealand and Australian Colonies, 50
- Religious Denominations, 52
- Portland Cement, Materials for, 199
- Port Nicholson Harbour, 232
- Ports, and Coastwaiters, Officers in Charge of, 37
- And Harbours, 230-243
- Middle Island, 236
- North Island, 230
- Postage, Rates of, 303
- Postal Union, 318
- “Postal and Telegraph Guide”, 319
- Postal Information—
- Mails, Interprovincial Coastal, 302
- Inward Foreign and Colonial, Arrival of, 302
- Outward Foreign and Colonial, Despatch of, 302
- Money-orders, 316
- Parcel-post, 320
- Foreign, 320
- Postal-notes, 316
- Post offices in the Colony, Names of, 304-316
- Rates of Postage, 303, 318
- Post Office, 77
- Post Office and Telegraph Department, 36
- Average Time in which Mails delivered, 79
- Book and Parcels, 77
- General, 36
- Increase of Correspondence, 77
- Letters posted, per Head of Population, 77
- Mail-services, England and New Zealand, Cost of, 78
- Money-orders, 78
- Newspapers, 77
- Post-cards, 77
- Savings-banks, 90
- Postmaster-General and Commissioner of Telegraphs, 36
- Postmasters, Chief, 37
- Potatoes, Cultivation of —, 95, 96, 99
- Export of, 70
- Yield of, 133, 134
- Pottery, Bricks and, 199
- Poverty Bay, 232
- Precious Stones, 181
- Premiers, 21
- Premier's Office, 34
- Presbyterian Church of New Zealand, 31
- Of Otago and Southland, 31
- Preservation Inlet, 219
- Preserved Meats, Quantities and Values of, 140
- Prices of Provisions, Live-stock, &c., 165
- Primitive Methodist Annual Conference, 31
- Principal Events in the History of New Zealand, 323-331
- Printing and Stationery Department, 34
- Prisoners (see Gaols).
- Prisons Department, 36
- Private Wealth (see Wealth).
- Probation Act, First Offenders treated under, 106
- Produce, Agricultural, Pastoral, and Dairy, 95-103
- Mining, Manufacturing, &c., 103-105
- Production, 93
- Property-tax, 79
- Prosecutors, Crown, 35
- Prospectors for Gold and other Minerals, Hints to, 182
- Provisions, Live-stock, &c., Prices of, 165
- Public Debt, 82
- Charges of, 82
- Net Indebtedness, 82
- Of Australasian Colonies, 83
- Old Provincial Loans, 84
- Sinking Fund accrued, 82
- Increase of Stock created for, 79, 83
- Public Instruction, 256-258
- Administration, 258
- Attendance at Schools, 256
- Number of Districts, 256
- Schools, 256
- Secondary Schools, 257
- University of New Zealand, 257
- Public Trustee, 43
- Public Trust Office, 263-266
- Assets of Estates, 266
- Charges, 266
- Constitution and Objects, 264
- Intestate Estates, 265
- Security, 264
- Wills and Trusts, 265
- Public Works, 16
- Department, 40
- District Offices, 40
- Expenditure on, 82, 85
- Minister for, 40
- Queen Charlotte Sound, 243
- Rail and Sea, Table of Distances by, 255
- Railway Commissioners, 41
- Department, 41
- Railways, Australasian Colonies, Miles of, in, 89
- Comparative Statement of Mileage open in Australian Colonies, 229
- Comparison of Traffic, Revenue, and Expenditure for Thirteen Years, 227
- Cost of Maintenance, 228
- Government, Goods and Live-stock carried, 88
- Length and Cost, 88
- Particulars of Revenue from, 88
- Passengers, 88
- Profit on Working, 88
- Revenue and Expenditure, 88
- Train-miles, 88
- In New Zealand: Their History and Progress, 221-230
- Management, 226
- Miles of Railway open for Traffic, 224, 226
- Passenger Fares, 228
- Traffic, 227
- Private, 89
- Cost of Construction, Revenue, and Working, 89
- Traffic, Revenue, and Expenditure for Thirteen Years, 227
- Working Expenses, 227
- Rainfall, Climate, Temperature, and, 201
- Rape, Acres under, Turnips and, 99, 134
- Rateable Property, Value of, in Boroughs, 111
- Colony for Five Years, capitalised, 112
- Outlying Districts, 111
- Road Districts, 111
- Town Districts, 111
- Rates, collected by Local Bodies, Ten Years, 109
- Of Wages, Average, 161-164
- Receivers of Gold Revenue, 36
- Registrar-General, 34
- Of Land and Deeds, 38
- Registrar of Joint-stuck Companies, 38
- Mining, 36
- Registrars, Supreme Court, 35
- Registry Office, Friendly Societies, 34
- Religious Denominations, 30-33
- Representation Electorates reduced in Number, 15
- New Zealand, European, 15
- Maori, 15
- Resident Magistrates, 35
- Resident Magistrates' Courts, Clerks of, 36
- Civil Cases, 105
- Revenue—
- From Government Railways, 79
- From Property-tax, 79
- General Government (Ordinary and Territorial) 79
- And Local Government, 109
- Of Boroughs, 111
- Of Counties, 111
- Of Drainage Board, 113
- Of Harbour Boards, 113
- Of River Boards, 112
- Of Road Boards, 112
- Of Town Boards, 112
- Territorial (see Lands), 79
- Rifle Corps, Volunteer, 48
- River Boards, Revenue, 113
- Rivers, 8, 12
- In North and Middle Islands, 244
- Riverton, Jacob's River, 239
- Road Boards, Revenue, 113
- Value of Rateable Property, 111
- Roll of Members of the House of Representatives, 28
- Legislative Council, 26
- Roman Catholic Archbishop, 30
- Bishops, 30
- Suffragan Dioceses, 31
- Root-crops, 117
- Rotorua as a Health Resort, 213, 214
- Sanatorium, 203, 205, 214
- Ruapehu Mountain, 9
- Russell, Port, 236
- Salmon-trout, Introduction of, 168, 169
- Sanatorium, Rotorua, 203, 205, 214
- Sandstones, 198
- Savings-Banks, Post-Office, 90
- Private, 90
- Scheelite, 180
- Hints to Prospectors for, 192
- School Commissioners, Secretaries to, 39
- Schools, Children attending, 107, 108
- Industrial, 107, 272
- Institution for Deaf-mutes, 107
- Maori Children attending, 107
- Native, Village, &c., 107
- Orphan, 107, 271
- Private, 108
- Number of, and Attendance at, 108
- Public, 107, 256
- Attendance at, 107, 256
- Teachers at, 107, 256
- Roman Catholic, 108
- Superior, High, Grammar, &c., 107, 257
- Total Children receiving Education at, 107, 108
- Seat of Government, 16
- Civil Establishment at, 34
- Secondary Schools, 257
- Seeds, 112
- Settlement, Discovery and Early, 2
- Shaw-Savill and Albion Company, 253
- Sheep, 101
- Farming, 122
- In Colony, Increase in Number of, 135
- Number and Size of Flocks, 71
- Sheriffs, 35
- Shipping, 00
- Coastwise, Vessels and Tonnage, 66
- Inwards and Outwards, Ten Years, 66
- Silver, 174
- Hints to Prospectors for, 186
- Sinking Fund (see Public Debt).
- Slips, Patent, 245
- Societies, Friendly, 269
- Soil, Varieties of, 193
- Solicitors, Crown, 35
- Sound, Pelorus, 242
- Queen Charlotte, 243
- Sounds, West Coast (Middle Island), 11, 219
- Sown Grasses, Extent of, 100
- New Zealand, compared with Australia, 100
- Speaker of House of Representatives, 28
- Legislative Council, 26
- Speakers of the House of Representatives, Successive, 22
- Legislative Council, Successive, 21
- Spirits, Consumption per Head, Ten Years, 68
- Springs, The Thermal, 217
- Stamp Department, 38
- Stationery Department, Printing and, 34
- Statistical Information, 50-113
- Statistics, broadsheets (at end).
- Stewart Island, 243
- Stock in New Zealand, 121, 122
- Inspectors of, 42
- Stones, Building, 194-198
- Precious, 181
- Successive Governors, 17
- Ministries, 20
- Premiers, 21
- Sugar, Consumption of, 67
- Supreme Court, Civil Cases, 105
- Judges, 35
- Registrars, 35
- Sheriffs, 35
- Survey Charges on Unsurveyed Lands, 286
- Sutherland Waterfall, The, 221
- Table of Distances by Rail and Sea, 255
- Tariff of New Zealand, The Customs, 289
- Tauranga Harbour, 231
- Taxation by General Government, 79
- Income-tax (proposed), 80
- Land-tax, Ordinary (proposed), 79
- Graduated, Rate of (proposed), 80
- Per Head in New Zealand, for Ten Years, excluding Maoris, 81
- In Australasian Colonies, 81
- Property-tax, 79
- Rate of, per head, including Maoris, 81
- Taxation by Local Bodies, 109
- Tax, Land and Income Assessment, Increased Value of Land, 332
- Tea, Consumption of, 67
- Telegraph Department, 36
- Telegraphic Information—, 321
- Delayed Telegrams, 322
- Hours of Business, 321
- Ordinary Telegrams, Rates of, 321
- Telegrams to Places beyond the Colony, Rates for, 322
- Urgent Telegrams, 321
- Telegraph-offices, Officers in Charge of, 37
- Telegraphs, Commissioner of, 36
- Telephone Exchanges, 79
- Temperature and Rainfall, Climate, 199, 203
- Thames Harbour, 231
- Thermal-springs District, 9, 203
- Thunderstorms, 203
- Timaru, Port, 237
- Timber exported, 69
- Industry, Forest-trees and, 143-152
- Timbers, Strength of New Zealand, 150
- Quantities and Values of Exports of, 151
- Tin, 176
- Hints to Prospectors for, 187
- Titles, Examiners of, 38
- Tobacco, Consumption of, 68
- Cultivation of, 100
- Tolago Bay, 231
- Tongariro Mountain, 9
- Town Districts (see Local Bodies).
- Towns, Principal, and Suburbs, 57
- Trade 66-76
- Importance of Australasian Colonies as Markets for Great Britain, 76
- New Zealand, Total Value of, 73
- Atlantic and Pacific Ports of United States, Ten Years, 74
- Per Head, Population, Ten Years, 73
- With Australia, 74
- With India, 75
- With United Kingdom, 73
- With United States, 74
- Of Australasian Colonies, Value of, per Head, 75
- Of Australasian Colonies with United Kingdom, 76
- (See Imports).
- (See Exports).
- Shipping (see Shipping).
- Trade and Customs, Commissioner of, 37
- Department, 37
- Trade-marks, Patents, Designs, and, 266
- Trees, Timber and Forest-, 143
- Trout to New Zealand, Introduction of, 108, 169
- Fish-hatcheries, Number established, 168
- Fishing, Record of Day's, 169
- Habit of Trout, 169
- Trust Commissioners under Native Lands Frauds Prevention Act, 40
- Trustee, Public, 43
- Trust Office, Public, 43
- Trusts, Wills and, 265
- Turanga (Poverty Bay), 232
- Turnips and Rape, 99, 134
- Underwood, Port, 243
- Union Steamship Company of New Zealand, 249
- United Methodist Free Church, Annual Meetings of the, 31
- University of New Zealand, 108
- Unsurveyed Lands, Survey Charges on, 286
- Value of Land, Increased, 333
- Value of Produce exported, 69
- Varieties of Soil, 193
- Vessels (see Shipping).
- Vital Statistics, 61-65
- Volunteers, 47, 48
- Wages, Average Rates of, 161-164
- Waihau (Coromandel) Harbour, 231
- Wairau River, 243
- Waitara River, 234
- Wanganui River, 233
- Wardens' Courts, Clerks of, 36
- Wealth, Private, by Property-tax Returns, 85
- Calculated from Probate Returns, 86
- Of United Kingdom, 87
- New South Wales and Victoria, 87
- Understated, 86
- Weather Reporter (Marine), 37
- Wellington (Port Nicholson) Harbour, 232
- Wesley an Methodist Church, 31
- West Coast Sounds, The, 219, 240
- Westport Harbour (Buller River), 241
- Whangaroa Harbour and Bay, 235
- Wheat, Amount annually retained in Colony, 98
- Consumption of, in New Zealand, 97
- Crops of Australasian Colonies, 97
- Cultivation, 96
- Export of, 71
- Oats, Barley and Potatoes, Yield of, 133, 134
- Wills and Trusts, 265
- Winds, 202
- Wine, Consumption of, per Head for Ten Years, 68
- Wool, exported, 70, 121
- Increase in Production of, Ten Years, 70
- Used at Local Mills, 70
- Woollen Manufactures, 125
- Exported, 70
- Mills, Number of, 125
- Works, Public, 16
- Zinc, Hints to Prospectors for, 190
| STATISTICAL SUMMARY OF THE COLONY OF NEW ZEALAND FROM 1853 TO 1891 INCLUSIVE. | ||||||||||||||
|---|---|---|---|---|---|---|---|---|---|---|---|---|---|---|
| Year. | Population (exclusive of Maoris) | Births. | Deaths. | Marriages. | Immigration, excess over Emigration. | Crown Lands.* | Occupied and Cultivated Holdings over One Acre in extent. | |||||||
| Males. | Females. | Totals. | Waste Lands sold for Cash in each Year. | Cash realised. | Lands finally alienated under the Deferred-payment System. | Free Grants.* | Let on Perpetual Lease. | |||||||
| Land taken up. | In Occupation on December 31. | |||||||||||||
| Acres. | £ | Acres. | Acres. | Acres. | Acres. | Number. | ||||||||
| 1853 | .. | .. | .. | .. | .. | .. | 1,091 | .. | .. | .. | .. | .. | .. | .. |
| 1854 | 17,914 | 14,640 | 32,554 | .. | .. | .. | 2,057 | .. | .. | .. | .. | .. | .. | .. |
| 1855 | 20,781 | 16,411 | 37,192 | 1,460 | 470 | 406 | 3,937 | .. | .. | .. | .. | .. | .. | .. |
| 1856 | 25,356 | 20,184 | 45,540 | 1,722 | 406 | 404 | 2,525 | 51,972 | 33,156 | .. | 14 | .. | .. | .. |
| 1857 | 27,606 | 22,196 | 49,802 | 1,966 | 434 | 478 | 3,042 | 141,159 | 79,060 | .. | 6,169 | .. | .. | .. |
| 1858 | 33,679 | 25,734 | 59,413 | 2,272 | 582 | 534 | 6,130 | 239,128 | 150,839 | .. | 6,277 | .. | .. | .. |
| 1859 | 41,107 | 30,486 | 71,593 | 2,647 | 704 | 603 | 8,637 | 477,021 | 222,885 | .. | 45,730 | .. | .. | .. |
| 1860 | 45,394 | 34,317 | 79,711 | 3,146 | 1,092 | 690 | 6,064 | 424,254 | 204,113 | .. | 47,616 | .. | .. | .. |
| 1861 | 61,062 | 37,959 | 99,021 | 3,441 | 1,109 | 878 | 16,222 | 449,358 | 235,365 | .. | 18,834 | .. | .. | .. |
| 1862 | 79,680 | 46,132 | 125,812 | 4,064 | 1,231 | 1,091 | 20,991 | 658,337 | 536,657 | .. | 40,335 | .. | .. | .. |
| 1863 | 105,978 | 58,070 | 164,048 | 5,115 | 1,983 | 1,485 | 35,120 | 529,437 | 380,998 | .. | 66,853 | .. | .. | .. |
| 1864 | 106,580 | 65,573 | 172,158 | 6,501 | 2,921 | 1,878 | 8,527 | 691,174 | 595,858 | .. | 47,198 | .. | .. | .. |
| 1865 | 117,376 | 73,231 | 190,607 | 7,490 | 2,757 | 1,908 | 12,309 | 503,112 | 341,094 | .. | 62,681 | .. | .. | .. |
| 1866 | 125,080 | 79,034 | 204,114 | 8,466 | 2,540 | 2,038 | 7,599 | 603,406 | 528,028 | .. | 55,975 | .. | .. | .. |
| 1867 | 131,929 | 86,739 | 218,668 | 8,918 | 2,702 | 2,050 | 4,859 | 288,917 | 287,416 | .. | 76,743 | .. | .. | .. |
| 1868 | 134,621 | 91,997 | 226,618 | 9,391 | 2,662 | 2,085 | 860 | 199.309 | 102,065 | .. | 42,205 | .. | .. | 11,932 |
| 1869 | 140,112 | 97,137 | 237,249 | 9,718 | 2,721 | 1,931 | 3,641 | 112,211 | 115,941 | .. | 145,449 | .. | .. | 13,476 |
| 1870 | 145,732 | 102,668 | 248,400 | 10,277 | 2,703 | 1,851 | 3,577 | 76,766 | 88,419 | .. | 37,256 | .. | .. | 10,211 |
| 1871 | 156,431 | 110,555 | 266,986 | 10,592 | 2,642 | 1,864 | 4,786 | 92,642 | 110,973 | .. | 123,796 | .. | .. | 14,874 |
| 1872 | 162,404 | 117,156 | 279,560 | 10,795 | 3,194 | 1,873 | 4,973 | 338,516 | 389,107 | .. | 183,673 | .. | .. | 15,304 |
| 1873 | 170,406 | 125,540 | 295,496 | 11,222 | 3,64 | 2,276 | 8,811 | 790,245 | 980,758 | .. | 484,541 | .. | .. | 15,883 |
| 1874 | 194,349 | 147,511 | 341,860 | 12,844 | 4,161 | 2,828 | 38,106 | 648,800 | 860,471 | .. | 238,581 | .. | .. | 16,092 |
| 1875 | 213,294 | 162,562 | 375,856 | 14,438 | 5,712 | 3,209 | 25,270 | 318,682 | 448,697 | .. | 486,335 | .. | .. | 17,250 |
| 1876 | 225,580 | 173,495 | 399,075 | 16,168 | 4,904 | 3,196 | 11,955 | 497,416 | 846,831 | .. | 31,145 | .. | .. | 18,750 |
| 1877 | 227,681 | 180,937 | 408,618 | 16,856 | 4,685 | 3,114 | 6,376 | 777,862 | 1,314,480 | 79,324 | 40,314 | .. | .. | 20,519 |
| 1878 | 240,627 | 191,892 | 432,519 | 17,770 | 4,645 | 3,377 | 10,502 | 642,667 | 1,252,993 | 54,861 | .. | .. | 21,048 | |
| 1879 | 257,894 | 205,835 | 463,729 | 18,070 | 5,583 | 3,352 | 18,723 | 79,575 | 146,733 | 37,953 | .. | .. | 23,129 | |
| 1880 | 268,364 | 216,500 | 484,864 | 19,341 | 5,347 | 3,181 | 7,231 | 131,798 | 184,488 | 18,978 | 41,972 | .. | .. | 24,147 |
| 1881 | 274,986 | 225,924 | 500,910 | 18,732 | 5,491 | 3,277 | 1,616 | 235,815 | 351,430 | 39,494 | 530,650 | .. | .. | 26,298 |
| 1882 | 283,303 | 234,404 | 517,707 | 19,009 | 5,701 | 3,600 | 3,489 | 138,512 | 209,004 | 27,487 | 122,100 | .. | .. | 27,352 |
| 1883 | 294,665 | 246,212 | 540,077 | 19,202 | 6,061 | 3,612 | 10,029 | 113,500 | 141,251 | 24,229 | 228,698 | 26,786 | 26,364 | 28,587 |
| 1884 | 306,667 | 257,637 | 564,304 | 19,846 | 5,740 | 3,800 | 9,321 | 96,267 | 124,928 | 40,023 | 121,611 | 20,975 | 41,561 | 29,814 |
| 1885 | 312,125 | 263,101 | 575,226 | 19,693 | 6,081 | 3,813 | 4,504 | 49,613 | 84,282 | 34,637 | 456,080 | 24,441 | 51,367 | 31,763 |
| 1886 | 317,646 | 271,740 | 589,386 | 19,299 | 6,135 | 3,88 | 1,064 | 39,964 | 43,836 | 29,292 | 185,764 | 46,367 | 93,868 | 33,332 |
| 1887 | 324,558 | 278,803 | 603,361 | 19,135 | 6,137 | 3,563 | 977 | 21,154 | 25,330 | 18,496 | 316,488 | 64,595 | 150,218 | 34,743 |
| 1888 | 324,948 | 282,432 | 607,380 | 18,902 | 5,708 | 3,617 | -9,175 Dec. | 64,898 | 52,379 | 23,630 | 142,351 | 178,138 | 312,495 | 35,747 |
| 1889 | 328,588 | 287,464 | 616,052‡ | 18457 | 5,772 | 3,632 | 214 | 42,617 | 4,950 | 24,773 | 60,708 | 242,790 | 544,914 | 38,178 |
| 1890 | 332,557 | 292,951 | 625,508‡ | 18,278 | 5,994 | 3,797 | -1,782 Dec. | 98,479 | 108,959 | 46,808 | 135,763 | 271,736 | 798,571 | 38,083 |
| 1891 | 336,174 | 297,884 | 634,058 | 18,273 | 6,518 | 3,805 | -3,198 Dec. | 56,060 | 53,568 | 52,021 | 209,432 | 273,087 | 1,019,405 | 41,224 |
| Land (including Sown Grasses) under Cultivation. | Live Stock.† | Postal. | Electric Telegraph. | Miles of Railway. | |||||||||||
|---|---|---|---|---|---|---|---|---|---|---|---|---|---|---|---|
| Horses. | Horned Cattle. | Sheep. | Pigs. | Letters (received and despatched). | Newspapers (received and despatched). | Postal. Revenue. | Number of Money Orders issued. | Amount of Money Orders issued. | Miles of Line. | Number of Messages. | Cash and Cash Values. | Open for Traffic. | Under Construction. | Railway Receipts. | |
|
* The waste or Crown lands sold or granted in each year prior to 1856 cannot be accurately stated. The total gross quantity of land disposed of by Crown grants up to the end of 1892, including lands sold and lands disposed of without sale, was 20,364,208 statute acres. The figures under the head “Free Grants” represent in each year the total quantity of free grants to immigrants and naval and military settlers grants for public purposes and Native reserves and old land claims; also, from the year 1872, grants to Natives under the provisions of the Native Land Acts. † This information has been ascertained only for the years in which a census of the colony was taken. ‡ Corrected by means of results of census taken in April, 1891. The population of the colony (other than Maoris) according to the census of 5th April, 1891, was 626,658 persons at that date; the Maori population was 41,993. § Excluding those owned by Maoris. || Including those owned by Maoris. ¶ Government Railways; there are, besides, 142 miles of private lines. | |||||||||||||||
| Acres. | Number. | Number. | £ | Number. | £ | £ | £ | ||||||||
| .. | .. | .. | .. | 119,039 | 177,583 | .. | .. | .. | .. | .. | .. | .. | .. | .. | .. |
| .. | .. | .. | .. | .. | 138,492 | 201.391 | .. | .. | .. | .. | .. | .. | .. | .. | .. |
| .. | .. | .. | .. | .. | 171,407 | 238,522 | .. | .. | .. | .. | .. | .. | .. | .. | .. |
| .. | .. | .. | .. | .. | 196,760 | 271,254 | .. | .. | .. | .. | .. | .. | .. | .. | .. |
| 121,648 | .. | .. | .. | .. | 337,721 | 498,163 | .. | .. | .. | .. | .. | .. | .. | .. | .. |
| 141,007 | 14,912 | 137,204 | 1,523,324 | 40,734 | 482,856 | 684,348 | 6,024 | .. | .. | .. | .. | .. | .. | .. | .. |
| 156,940 | .. | .. | .. | .. | 707,870 | 839,385 | 7,812 | .. | .. | .. | .. | .. | .. | .. | .. |
| .. | .. | .. | .. | .. | 890,369 | 1,029,356 | 10,068 | .. | .. | .. | .. | .. | .. | .. | .. |
| 226,621 | 28,275 | 193,285 | 2,761,583 | 43,270 | 1,236,768 | 1,428,351 | 14,108 | .. | .. | .. | .. | .. | .. | .. | .. |
| .. | .. | .. | .. | .. | 2,122,232 | 2,064,123 | 22,710 | 1,410 | 6,590 | .. | .. | .. | .. | .. | .. |
| .. | .. | .. | .. | .. | 3,403,248 | 3,397,669 | 32,329 | 11,586 | 55,703 | .. | .. | .. | .. | .. | |
| 382,655 | 49,409 | 249,760 | 4,937,273 | 61,276 | 4,151,142 | 4,306,017 | 39,302 | 16,591 | 78,556 | .. | .. | .. | .. | .. | .. |
| .. | .. | .. | .. | .. | 4,443,473 | 4,206,992 | 46,475 | 17,236 | 78,576 | .. | .. | .. | .. | .. | .. |
| .. | .. | .. | .. | .. | 4,758,644 | 4,373,039 | 49,598 | 22,710 | 108,779 | 699 | 48,231 | 9,114 | .. | .. | .. |
| 676,909 | 65,715 | 312,835 | 8,418,579 | 115,104 | 4,811,240 | 3,060,888 | 55,331 | 24,473 | 115,610 | 714 | 87,436 | 14,29 | .. | .. | .. |
| 783,435 | .. | .. | .. | .. | 4,977,199 | 3,283,615 | 57,107 | 25,854 | 118,211 | 1,471 | 134,647 | 26,224 | .. | .. | .. |
| 997,477 | .. | .. | .. | .. | 5,016,595 | 3,563,147 | 58,007 | 28,427 | 127,218 | 1,611 | 1,73,746 | 32,649 | .. | .. | .. |
| 1,140,279 | .. | .. | .. | .. | 5,645,879 | 3,889,662 | 55,780 | 31,864 | 140,454 | 1,887 | 238,195 | 27,422 | .. | .. | .. |
| 1,226,222 | 81,028 | 436,592 | 9,700,629 | 151,460 | 6,01,697 | 4,179,784 | 70,249 | 36,291 | 157,397 | 2,015 | 369,085 | 37,203 | .. | .. | .. |
| 1,416,933 | .. | .. | .. | .. | 6,958,543 | 4,411,091 | 94,733 | 44,660 | 191,009 | 2,312 | 491,205 | 44,669 | .. | .. | .. |
| 1,651,712 | .. | .. | .. | .. | 7,915,985 | 5,269,195 | 94,706 | 52,351 | 219,258 | 2,389 | 637,941 | 55,195 | 145 | 434 | .. |
| 1,943,653 | 99,261 | 494,113 | 11,674,863 | 123,741 | 9,058,456 | 6,306,692 | 104,371 | 62,712 | 263,164 | 2,632 | 844,301 | 62,322 | 209 | 621 | 21,198 |
| 2,377,402 | .. | .. | .. | .. | 10,427,851 | 6,811,277 | 122,496 | 73,027 | 293,481 | 3,156 | 993,323 | 74,420 | 542 | 464 | 72,073 |
| 2,940,711 | .. | .. | .. | .. | 11,770,737 | 7,962,748 | 129,263 | 80,255 | 310,268 | 3,170 | 1,100,599 | 80,841 | 718 | 427 | 469,051 |
| 3,523,277 | .. | .. | .. | .. | 13,054,870 | 8,066,311 | 143,600 | 90,672 | 334,973 | 3,307 | 1,182,955 | 85,589 | 1,052 | 251 | 569,898 |
| 3,982,866 | 137,768 | 578,430 | 13,069,338 | 207,337 | 15,524,761 | 9,410,366 | 158,998 | 101,017 | 368,255 | 3,434 | 1,260,324 | 92,433 | 1,089 | 142 | 758,096 |
| 4,506,889 | .. | .. | .. | .. | 20,957,818 | 10,057,944 | 141,448 | 117,999 | 428,673 | 3,512 | 1,448,943 | 112,351 | 1,171 | 284 | 762,572 |
| 4,768,192 | .. | .. | .. | .. | 22,824,468 | 10,272,917 | 149,517 | 135,648 | 465,405 | 3,758 | 1,304,712 | 100,023 | 1,288 | 192 | 836,077 |
| 5,189,104 | 161,736 | 698,637 | 12,985,085 | 200,083 | 25,557,931 | 12,248,043 | 156,579 | 135,556 | 452,182 | 3,824 | 1,438,772 | 101,566 | 1,333 | 187 | 892,026 |
| 5,651,255 | .. | .. | .. | .. | 30,525,579 | 13,313,099 | 168,325 | 148,162 | 499,368 | 3,974 | 1,570,189 | 102,378 | 1,371 | 171 | 953,347 |
| 6,072,949 | .. | .. | .. | .. | 33,588,408 | 13,030,563 | 172,665 | 172,556 | 541,133 | 4,074 | 1,599,400 | 102,958 | 1,404 | 224 | 961,304 |
| 6,550,399 | .. | .. | .. | .. | 35,257,846 | 14,093,742 | 188,772 | 186,052 | 572,666 | 4,264 | 1,654,305 | 101,482 | 1,479 | 158 | 1,045,712 |
| 6,668,920 | .. | .. | .. | .. | 35,829,855 | 14,233,878 | 197,456 | 188,622 | 581,395 | 4,463 | 1,774,273 | 112,778 | 1,613 | 179 | 1,047,418 |
| 6,845,177 | 187,382 | 853,358 | 16,564,595 | 277,901 | 38,084,592 | 14,324,047 | 206,029 | 155,680 | 547,755 | 4,546 | 1,836,266 | 115,666 | 1,721 | 71 | 998,768 |
| 7,284,752 | .. | .. | .. | .. | 39,377,774 | 15,381,323 | 213,355 | 159,579 | 555,744 | 4,646 | 1,835,394 | 116,211 | 1,753 | 169 | 994,843 |
| 7,670,167 | .. | .. | .. | .. | 40,398,020 | 16,202,849 | 212,247 | 162,387 | 555,996 | 4,790 | 1,765,860 | 104,116 | 1,777 | 163 | 997,615 |
| 8,015,426 | .. | .. | .. | .. | 42,301,233 | 16,721,016 | 222,978 | 172,076 | 589,545 | 4,874 | 1,802,987 | 106,462 | 1,809 | 176 | 1,095,569 |
| 8,462,495 | .. | .. | .. | .. | 43,917,200 | 17,912,734 | 229,867 | 176,427 | 602,077 | 5,060 | 1,961,161 | 110,697 | 1,842 | 132 | 1,121,701 |
| 8,893,225 | 211,040§ | 831,831|| | 18,128,186|| | 308,812|| | 47,612,864 | 18,501,912 | 245,395 | 195,239 | 651,990 | 5,349 | 1,968,264 | 117,634 | 1,869 | 170 | 1,115,432 |
| Year. | Shipping. | Exports (the Produce of New Zealand). | Exports (the Produce of New Zealand). | |||||||||||||||||
|---|---|---|---|---|---|---|---|---|---|---|---|---|---|---|---|---|---|---|---|---|
| Inwards. | Outwards. | Registered Vessels belonging to the Colony. | Wool. | Grain. | Frozen Meat. | Flax (Phormium). | Gold. | Gum (Kauri). | Provisions, Tallow, Timber, &c. | |||||||||||
| Number of Vessels. | Tonnage. | Number of Vessels. | Tonnage. | Number of Vessels. | Gross Tonnage. | Quantity. | Value. | Quantity. | Value. | Quantity. | Value. | Quantity. | Value. | Quantity | Value. | Quantity. | Value. | Value. | Total Value. | |
| Lb. | £ | Bushels. | £ | Cwt. | £ | Tons. | £ | Oz. | £ | Tons. | £ | £ | £ | |||||||
| 1853 | 238 | 65,505 | 229 | 62,891 | .. | .. | 1,071,340 | 66,507 | 59,959 | 19,042 | .. | .. | 46 | 1,046 | .. | .. | 829 | 15,971 | 200,706 | 303,282 |
| 1854 | 293 | 74,831 | 293 | 76,718 | .. | .. | 1,254,416 | 70,103 | 94,600 | 41,019 | .. | .. | 48 | 1,563 | .. | .. | 1,660 | 28,864 | 179,341 | 320,890 |
| 1855 | 378 | 88,614 | 341 | 79,825 | .. | .. | 1,772,344 | 93,104 | 150,352 | 82,302 | .. | .. | 150 | 4,674 | .. | .. | 355 | 4,514 | 181,273 | 365,867 |
| 1856 | 326 | 85,748 | 323 | 82,991 | .. | .. | 2,559,618 | 146,070 | 66,150 | 24,132 | .. | .. | 22 | 552 | .. | .. | 1,440 | 18,591 | 129,088 | 318,433 |
| 1857 | 289 | 78,309 | 283 | 76,524 | 186 | 6,662 | 2,648,716 | 176,579 | 81,757 | 29,676 | .. | .. | 38 | 710 | 10,436 | 40,442 | 2,521 | 35,250 | 86,737 | 369,394 |
| 1858 | 339 | 90,118 | 322 | 82,293 | 189 | 6,852 | 3,810,372 | 254,022 | 71,403 | 20,680 | .. | .. | 64 | 1,516 | 13,533 | 52,443 | 1,810 | 20,036 | 85,252 | 433,949 |
| 1859 | 438 | 136,580 | 398 | 120,392 | 213 | 7,883 | 5,096,751 | 339,779 | 118,740 | 39,016 | .. | .. | 77 | 1,593 | 7,336 | 28,427 | 2,010 | 20,776 | 91,717 | 521,308 |
| 1860 | 398 | 140,276 | 398 | 140,293 | 238 | 8,527 | 6,665,880 | 444,392 | 55,683 | 13,112 | .. | .. | 61 | 1,240 | 4,538 | 17,585 | 1,046 | 9,851 | 62,953 | 549,133 |
| 1861 | 596 | 197,986 | 546 | 205,350 | 252 | 9,144 | 7,855,920 | 523,728 | 8,118 | 2,518 | .. | .. | 2 | 43 | 194,234 | 752,657 | 856 | 9,888 | 50,407 | 1,339,241 |
| 1862 | 813 | 301,365 | 783 | 288,647 | 287 | 10,825 | 9,839,265 | 674,226 | ,602 | 1,821 | .. | .. | 13 | 161 | 410,862 | 1,591,389 | 1,103 | 11,107 | 79,216 | 2,358,020 |
| 1863 | 1,154 | 419,935 | 1,094 | 394,665 | 343 | 15,189 | 12,585,980 | 830,495 | 3,238 | 1,160 | .. | .. | 13 | 251 | 628,450 | 2,431,723 | 1,400 | 27,027 | 52,235 | 3,342,891 |
| 1864 | 1,117 | 426,004 | 1,089 | 433,253 | 423 | 22,573 | 16,691,666 | 1,070,997 | 3,580 | 722 | .. | .. | 7 | 170 | 480,71 | 1,857,847 | 2,228 | 60,590 | 60,308 | 3,050,634 |
| 1865 | 862 | 295,625 | 783 | 283,020 | 466 | 24,484 | 19,180,500 | 1,141,761 | 25,447 | 6,076 | .. | .. | 3 | 75 | 574,574 | 2,226,474 | 1,867 | 46,060 | 82,975 | 3,503,421 |
| 1866 | 1,019 | 330,303 | 986 | 306,97 | 493 | 26,787 | 22,810,776 | 1,354,152 | 32,610 | 7,297 | .. | .. | 45 | 996 | 735,376 | 2,844,517 | 2,535 | 70,572 | 118,556 | 4,396,100 |
| 1867 | 944 | 309,568 | 950 | 308,169 | 366 | 23,240 | 27,152,966 | 1,580,608 | 158,812 | 26,986 | .. | .. | 126 | 4,256 | 686,753 | 2,700,275 | 2,685 | 77,491 | 89,848 | 4,479,464 |
| 1868 | 851 | 277,105 | 873 | 287,710 | 372 | 24,539 | 28,875,163 | 1,516,548 | 633,676 | 114,468 | .. | .. | 534 | 8,137 | 637,474 | 2,504,326 | 2,690 | 72,493 | 52,790 | 4,268,762 |
| 1869 | 764 | 250,731 | 771 | 247,764 | 381 | 25,990 | 27,765,636 | 1,371,230 | 520,556 | 96,441 | .. | .. | 2,028 | 45,245 | 614,281 | 2,362,995 | 2,850 | 111,307 | 102,916 | 4,090,134 |
| 1870 | 756 | 273,151 | 766 | 265,407 | 384 | 26,743 | 37,039,763 | 1,703,944 | 854,897 | 141,135 | .. | .. | 5,471 | 132,578 | 544,880 | 2,157,585 | 4,391 | 175,074 | 234,366 | 4,544,682 |
| 1871 | 729 | 274,643 | 709 | 265,618 | 371 | 27,107 | 37,793,734 | 1,606,144 | 1,032,902 | 164,087 | .. | .. | 4,248 | 90,611 | 730,029 | 2,787,520 | 5,054 | 167,958 | 354,784 | 5,171,104 |
| 1872 | 775 | 300,302 | 743 | 285,366 | 364 | 23,963 | 41,886,997 | 2,537,919 | 1,058,480 | 178,886 | .. | .. | 3,985 | 99,405 | 445,370 | 1,730,992 | 4,811 | 154,167 | 405,817 | 5,107,186 |
| 1873 | 739 | 289,297 | 704 | 281,847 | 411 | 30,035 | 41,535,185 | 2,702,471 | 587,881 | 136,382 | .. | .. | 6,454 | 143,799 | 505,337 | 1,987,425 | 2,833 | 85,816 | 422,077 | 5,477,970 |
| 1874 | 856 | 399,296 | 822 | 385,533 | 471 | 38,935 | 46,848,735 | 2,834,695 | 1,162,782 | 291,103 | .. | .. | 2,038 | 37,690 | 376,388 | 1,505,331 | 2,568 | 79,986 | 403,338 | 5,152,143 |
| 1875 | 926 | 416,727 | 940 | 417,820 | 502 | 42,025 | 54,401,540 | 3,398,155 | 1,276,927 | 231,417 | .. | .. | 639 | 11,742 | 355,322 | 1,407,770 | 3,230 | 138,523 | 288,237 | 5,475,844 |
| 1876 | 878 | 393,180 | 866 | 393,334 | 538 | 44,401 | 59,853,454 | 3,395,816 | 2,172,098 | 337,878 | .. | .. | 897 | 18,285 | 318,367 | 1,268,559 | 2,888 | 109,234 | 359,129 | 5,488,901 |
| 1877 | 812 | 388,568 | 848 | 400,609 | 533 | 42,479 | 64,481,324 | 3,658,938 | 1,323,910 | 276,452 | .. | .. | 1,053 | 18,826 | 366,955 | 1,476,312 | 3,632 | 118,348 | 509,841 | 6,078,484 |
| 1878 | 926 | 456,490 | 886 | 428,493 | 541 | 46,965 | 59,270,256 | 3,292,807 | 2,112,214 | 508,767 | .. | .. | 622 | 10,666 | 311,437 | 1,244,190 | 3,445 | 132,975 | 595,214 | 5,780,508 |
| 1879 | 894 | 473,940 | 908 | 475,752 | 563 | 64,457 | 62,220,810 | 3,126,439 | 3,470,344 | 660,557 | .. | .. | 445 | 7,874 | 284,100 | 1,134,641 | 3,228 | 147,535 | 486,409 | 5,563,455 |
| 1880 | 730 | 395,675 | 786 | 424,041 | 559 | 66,316 | 66,860,150 | 3,169,300 | 5,540,445 | 898,997 | .. | .. | 894 | 15,617 | 303,215 | 1,220,263 | 4,725 | 242,817 | 555,306 | 6,102,400 |
| 1881 | 765 | 420,134 | 762 | 413,487 | 572 | 72,387 | 59,415,940 | 2,909,760 | 5,815,960 | 986,072 | .. | .. | 1,308 | 26,285 | 250,683 | 996,867 | 5,460 | 253,778 | 589,488 | 5,762,250 |
| 1882 | 795 | 461,285 | 769 | 438,551 | 584 | 76,196 | 65,322,707 | 3,118,554 | 4,310,984 | 907,961 | 15,244 | 19,339 | 2,040 | 41,955 | 230,893 | 921,664 | 5,533 | 260,369 | 983,508 | 6,253,350 |
| 1883 | 805 | 494,926 | 851 | 507,565 | 579 | 84,903 | 68,149,430 | 3,014,211 | 6,723,303 | 1,286,724 | 87,975 | 118,328 | 2,013 | 36,761 | 222,899 | 892,445 | 6,518 | 336,606 | 1,170,169 | 6,855,244 |
| 1884 | 852 | 529,188 | 872 | 534,242 | 583 | 92,696 | 81,139,028 | 3,267,527 | 5,361,167 | 743,807 | 254,069 | 345,090 | 1,525 | 23,475 | 246,392 | 988,953 | 6,393 | 342,151 | 1,231,483 | 6,942,486 |
| 1885 | 786 | 519,700 | 780 | 513,000 | 597 | 95,887 | 86,507,431 | 3,205,275 | 4,478,264 | 496,371 | 296,473 | 373,857 | 1,063 | 16,316 | 222,732 | 890,056 | 5,876 | 299,762 | 1,310,274 | 6,591,911 |
| 1886 | 725 | 502,572 | 707 | 488,331 | 571 | 94,196 | 90,853,744 | 3,072,971 | 3,441,803 | 449,415 | 346,055 | 427,193 | 1,1 | 15,922 | 235,578 | 939,648 | 4,920 | 257,653 | 1,223,880 | 6,386,682 |
| 1887 | 653 | 489,754 | 675 | 493,583 | 557 | 94,027 | 88,824,382 | 3,321,074 | 3,987,189 | 419,525 | 402,107 | 455,870 | 1,570 | 25,094 | 187,938 | 747,878 | 6,790 | 362,434 | 1,219,206 | 6,551,081 |
| 1888 | 683 | 526,435 | 701 | 531,478 | 524 | 86,132 | 83,225,733 | 3,115,008 | 4,997,587 | 653,311 | 552,298 | 628,800 | 4,042 | 75,269 | 229,608 | 914,309 | 8,482 | 380,933 | 1,487,498 | 7,255,128 |
| 1889 | 781 | 602,634 | 762 | 593,252 | 520 | 87,411 | 102,227,354 | 3,976,375 | 6,027,201 | 970,695 | 656,822 | 783,374 | 17,084 | 361,182 | 197,492 | 785,490 | 7,519 | 329,590 | 1,835,302 | 9,044,607 |
| 1890 | 744 | 662,769 | 745 | 649,705 | 521 | 98,907 | 102,817,077 | 4,150,599 | 7,999,139 | 1,074,354 | 898,894 | 1,087,617 | 21,158 | 381,789 | 187,641 | 751,360 | 7,438 | 378,563 | 1,604,479 | 9,428,761 |
| 1891 | 737 | 618,515 | 744 | 625,807 | 521 | 102,068 | 106,187,114 | 4,129,686 | 5,877,059 | 676,338 | 1,000,307 | 1,194,724 | 15,809 | 281,514 | 251,161 | 1,007,172 | 8,388 | 437,056 | 1,673,604 | 9,400,094 |
| Imports. | Coal-mines Output from. | Revenue. | Expenditure. | Public Debt (Debentures and Stock in Circulation). | Debt of Local Bodies. | Banks. (Average of Four Quarters.) | Savings Banks.* | Friendly Societies registered. | Schools and Scholars.† | Convictions in Superior Courts after Commitment. | ||||||||||
|---|---|---|---|---|---|---|---|---|---|---|---|---|---|---|---|---|---|---|---|---|
| Primary Schools. | Private Schools. | |||||||||||||||||||
| Total Value. | Ordinary. | Territorial. | Total for Year. | Out of Revenue. | Out of Loan. | Deposits. | Assets. | Liabilities. | Number of Depositors. | Balance to credit on 31st Dec. | No. of Lodges, &c. | No. of Members. | Schools. | Scholars. | Schools. | Scholars. | ||||
|
* Post Office Savings Banks were first opened in 1867. † Statistics of schools and scholars not being complete for years prior to 1874. no figures are entered. ‡ Exclusive of charges for sinking fund met by debentures issued to an equivalent amount. § Approximate. || There was an accrued sinking fund amounting to £1,037,557 in December, 1892, leaving a net indebtedness of £37,872,330. ¶ In addition to these there were in December, 1891, 2,205 scholars at high schools and 2,231 children attending the Native schools, nearly all of which are maintained by Government, besides 705 at industrial schools and orphanages | ||||||||||||||||||||
| £ | Tons. | £ | £ | £ | £ | £ | £ | £ | £ | £ | £ | £ | ||||||||
| 597,827 | Prior to 1878, 703,413. | 83,069 | 66,751 | 149,820 | .. | .. | .. | .. | .. | .. | .. | .. | .. | .. | .. | .. | .. | .. | .. | 13 |
| 891,201 | 111,214 | 180,826 | 292,040 | .. | .. | .. | .. | .. | .. | .. | .. | .. | .. | .. | .. | .. | .. | .. | 21 | |
| 813,460 | 113,596 | 62,300 | 175,896 | .. | .. | .. | .. | .. | .. | .. | .. | .. | .. | .. | .. | .. | .. | .. | 31 | |
| 710,868 | 112,152 | 76,177 | 88,329 | .. | .. | .. | .. | .. | .. | .. | .. | .. | .. | .. | .. | .. | .. | .. | 28 | |
| 992,994 | 157,064 | 91,193 | 248,257 | .. | .. | .. | .. | 343,316 | 419,860 | 432,494 | .. | .. | .. | .. | .. | .. | .. | .. | 27 | |
| 1,141,273 | 179,856 | 161,799 | 341,655 | .. | .. | .. | .. | 448,078 | 705,738 | 616,769 | 715 | 7,862 | .. | .. | .. | .. | .. | .. | 62 | |
| 1,551,030 | 217,767 | 241,882 | 459,649 | .. | .. | .. | .. | 541,213 | 1,003,584 | 678,474 | 802 | 7,996 | .. | .. | .. | .. | .. | .. | 70 | |
| 1,548,333 | 248,978 | 215,760 | 464,739 | .. | .. | .. | .. | 644,521 | 992,082 | 801,588 | 1,104 | 12,450 | .. | .. | .. | .. | .. | .. | 91 | |
| 2,493,811 | 344,110 | 347,354 | 691,464 | .. | .. | .. | .. | 882,754 | 1,235,952 | 1,097,162 | 1,144 | 22,921 | .. | .. | .. | .. | .. | .. | 100 | |
| 4,626,082 | 579,179 | 606,830 | 1,186,009 | .. | .. | 836,000 | .. | 1,596,446 | 2,691,117 | 2,092,497 | 1,496 | 29,768 | .. | .. | .. | .. | .. | .. | 145 | |
| 7,024,674 | 856,432 | 524,409 | 1,380,836 | .. | .. | 1,289,750 | .. | 2,092,090 | 4,028,766 | 2,962,585 | 2,371 | 44,117 | .. | .. | .. | .. | .. | .. | 234 | |
| 7,000,655 | 894,071 | 714,770 | 1,608,841 | .. | .. | 2,219,450 | .. | 2,480,303 | 5,063,458 | 3,343,172 | 4,669 | 94,248 | .. | .. | .. | .. | .. | .. | 262 | |
| 5,594,977 | 1,025,782 | 500,045 | 1,525,827 | .. | .. | 4,368,681 | .. | 2,638,414 | 5,455,289 | 3,522,146 | 4,304 | 87,400 | .. | .. | .. | .. | .. | .. | 332 | |
| 5,894,863 | 1,202,282 | 776,429 | 1,978,711 | .. | .. | 5,435,728 | .. | 3,097,473 | 5,891,532 | 4,010,110 | 4,513 | 91,863 | .. | .. | .. | .. | .. | .. | 277 | |
| 5,344,607 | 1,302,425 | 561,730 | 1,864,155 | .. | .. | 5,781,193 | .. | 2,904,594 | 5,947,160 | 3,737,695 | 6,579 | 156,855 | .. | .. | .. | .. | .. | .. | 240 | |
| 4,985,748 | 1,195,512 | 425,323 | 1,620,835 | .. | .. | 7,182,743 | .. | 3,102,727 | 5,734,745 | 3,838,220 | 8,121 | 243,615 | .. | .. | .. | .. | .. | .. | 248 | |
| 1,976,126 | 1,072,925 | 382,070 | 1,454,995 | .. | .. | 7,360,616 | .. | 3,174,831 | 6,231,416 | 3,863,006 | 10,103 | 320,383 | .. | .. | .. | .. | .. | .. | 277 | |
| 4,639,015 | 1,057,050 | 327,589 | 1,384,639 | .. | .. | 7,841,891 | .. | 3,127,769 | 6,315,354 | 3,819,670 | 12,137 | 388,804 | .. | .. | .. | .. | .. | .. | 231 | |
| 4,639,015 | 1,057,050 | 327,589 | 1,384,639 | .. | .. | 7,841,891 | .. | 3,127,769 | 6,315,354 | 3,819,670 | 12,137 | 388,804 | .. | .. | .. | .. | .. | .. | 231 | |
| 4,078,193 | 964,417 | 377,699 | 1,342,116 | .. | .. | 8,900,991 | .. | 3,334,672 | 5,871,888 | 3,988,400 | 14,275 | 454,966 | .. | .. | .. | .. | .. | .. | 180 | |
| 5,142,951 | 1,056,044 | 618,772 | 1,674,816 | .. | .. | 9,985,386 | .. | 3,919,838 | 5,429,747 | 4,628,819 | 17,289 | 597,002 | .. | .. | .. | .. | .. | .. | 190 | |
| 6,464,687 | 1,510,600 | 1,265,788 | 2,776,388 | .. | .. | 10,913,936 | .. | 4,713,806 | 7,267,720 | 5,538,030 | 21,807 | 812,144 | .. | .. | .. | .. | .. | .. | 189 | |
| 8,121,812 | 1,917,712 | 1,150,900 | 3,068,612 | 2,960,710 | 2,725,893 | 13,366,936 | .. | 5,564,434 | 9,954,216 | 6,490,504 | 27,215 | 943,753 | .. | .. | 544 | 38,215 | 188 | 8,237 | 194 | |
| 8,029,172 | 2,125,206 | 688,722 | 2,813,9928 | 3,431,972 | 3,107,867 | 17,400,031 | .. | 5,967,205 | 10,087,178 | 6,987,318 | 30,310 | 897,326 | .. | .. | 599 | 45,562 | 182 | 7,316 | 257 | |
| 6,905,171 | 2,430,672 | 1,149,622 | 3,580,294 | 4,305,337 | 2,066,104 | 18,678,111 | .. | 6,238,471 | 11,776,070 | 7,221,399 | 32,577 | 905,146 | .. | .. | 680 | 51,964 | 244 | 9,357 | 249 | |
| 6,973,418 | 2,340,841 | 1,575,182 | 3,916,023 | 3,822,425 | 1,827,904 | 20,691,111 | .. | 7,185,106 | 12,992,104 | 8,152,230 | 35,709 | 964,430 | 89 | 8,560 | 730 | 56,239 | 252 | 9,992 | 250 | |
| 8,755,663 | 162,218 | 2,658,708 | 1,509,181 | 4,167,889 | 4,365,275 | 1,287,869 | 22,608,311 | .. | 8,960,369 | 15,393,630 | 10,031,009 | 39,926 | 1,043,204 | 88 | 8,828 | 748 | 65,040 | 236 | 9,206 | 292 |
| 8,374,585 | 231,218 | 2,816,244 | 18,661 | 3,134,905 | 3,845,035 | 1,973,239 | 23,958,311 | .. | 8,020,073 | 16,054,295 | 9,057,463 | 42,679 | 990,337 | 110 | 9,759 | 817 | 75,556 | 257 | 10,234 | 296 |
| 6,162,011 | 299,923 | 2,895,128 | 389,914 | 3,285,042 | 4,019,850 | 2,228,990 | 28,583,231 | .. | 8,538,935 | 14,220,275 | 9,550,177 | 47,462 | 1,148,992 | 138 | 13,165 | 836 | 82,401 | 278 | 11,238 | 330 |
| 7,457,045 | 337,262 | 3,206,554 | 550,939 | 3,757,493 | 3,675,797 | 1,069,927 | 29,659,111 | 3,039,807 | 9,069,377 | 14,863,645 | 10,083,188 | 61,054 | 1,549,515 | 179 | 14,484 | 869 | 83,560 | 266 | 9,987 | 270 |
| 8,609,270 | 378,272 | 3,408,351 | 508,809 | 3,917,160 | 3,824,735 | 821,976 | 30,235,711 | 3,277,584 | 8,945,346 | 17,162,234 | 10,015,273 | 68,358 | 1,832,047 | 272 | 18,634 | 911 | 87,179 | 262 | 10,002 | 265 |
| 7,974,038 | 421,764 | 3,470,191 | 401,076 | 3,871,267 | 3,924,005 | 1,191,784 | 31,385,411 | 3,540,046 | 8,659,477 | 17,794,761 | 9,706,700 | 73,546 | 1,784,631 | 315 | 21,882 | 943 | 92,476 | 257 | 11,2555 | 258 |
| 7,663,888 | 480,831 | 3,280,115 | 427,373 | 3,707,488 | 3,853,618† | 1,565,748 | 32,860,982 | 3,962,330 | 9,643,214 | 18,442,139 | 10,691,599 | 79,514 | 1,926,759 | 323 | 23,107 | 987 | 97,238 | 265 | 12,203 | 287 |
| 7,479,921 | 511,063 | 3,464,252 | 395,744 | 3,859,996 | 4,045,901† | 1,178,884 | 35,790,422 | 4,313,223 | 10,083,296 | 18,811,567 | 11,130,244 | 85,769 | 2,142,560 | 334 | 23,500§ | 1,021 | 102,407 | 280 | 11,989 | 266 |
| 6,759,013 | 534,353 | 3,349,891 | 338,125 | 3,688,016 | 4,170,465† | 1,583,723 | 37,587,776 | 4,943,270 | 10,579,711 | 19,041,827 | 11,603,194 | 91,296 | 2,133,861 | 358 | 25,000§ | 1,054 | 106,328 | 288 | 12,497 | 286 |
| 6,245,515 | 558,620 | 3,141,573 | 321,922 | 3,463,495 | 3,954,290† | 1,572,786 | 38,225,537 | 5,620,747 | 11,031,614 | 18,799,847 | 11,995,495 | 97,496 | 2,407,776 | 372 | 25,300§ | 1,093 | 110,919 | 299 | 13,417 | 347 |
| 5,941,900 | 613,895 | 3,779,581 | 330,234 | 4,109,815 | 3,962,912† | 824,880 | 38,325,550 | 5,812,803 | 11,155,778 | 18,709,444 | 12,108,353 | 103,046 | 2,691,693 | 372 | 25,500§ | 1,128 | 112,685 | 299 | 13,893 | 308 |
| 6,308,863 | 586,445 | 3,635,768 | 356,151 | 3,991,919 | 3,981,721† | 515,058 | 38,483,250 | 5,892,050 | 11,528,424 | 17,652,915 | 12,486,717 | 110,566 | 2,858,644 | 387 | 26,200§ | 1,155 | 115,456 | 293 | 13,516 | 276 |
| 6,260,525 | 637,397 | 3,843,862 | 364,166 | 4,208,028 | 4,081,566† | 398,817 | 38,802,350 | 5,978,059 | 12,368,610 | 17,735,259 | 13,356,598 | 118,344 | 3,137,023 | 387 | 26,700§ | 1,200 | 117,912 | 298 | 13,626 | 270 |
| 6,503,849 | 668,794 | 3,804,307 | 341,923 | 4,146,230 | 4,135,543† | 518,348 | 38,844,914 | 6,042,693 | 12,796,098 | 16,814,518 | 13,820,458 | 126,886 | 3,406,949 | 390 | 28,000§ | 1,255 | 119,523 | 281 | 14,142 | 283 |