Table of Contents
- Accumulation 123
- Ages of Parties to Marriage 48, 49
- Ages of Population 26
- Ages Males, at Militia 27
- Supporting and Dependent Population, Proportions at, New Zealand, Australia, England 27
- Agricultural, Pastoral and Dairy Produce 132-147
- Agricultural, Statistics (see Cultivation) 131
- Alcohol, Consumption of 85
- Alcohol, Ten Years 86
- Aliens, Naturalisation of 36
- Appendix A. Dates of Principal Events 177
- Appendix B. Customs and Excise Duties 189
- Appendix C. Report on Thermal-springs District by Dr. Ginders 202
- Area of Australasian Colonies (each) 7
- Area compared with European Countries 8
- Area of New Zealand 6
- Area North, Middle, Stewart, and other Islands 6
- Area of United Kingdom compared with New Zealand 8
- Arrivals (see Immigration).
- Arrivals and Departures (see Immigration and Emigration).
- Asylums, Benevolent 71
- Asylums, Lunatic 71
- Asylums, Orphan 71
- Australasian Statistics (see broadsheet).
- Bankruptcy 151
- Bankruptcy Realisation of Assets 151
- Banks of Issue, Assets, and Liabilities 124
- Banks Advances, and Discounts 124
- Banks Deposits 124
- Banks Notes in Circulation, &c. 124
- Banks Deposits in all Classes of 125
- Banks Savings, Private 125
- Banks Deposits, Withdrawals 125
- Banks Post-office 124
- Banks Savings, Post-office, Deposits, Withdrawals, Open Accounts Amounts to Credit 125
- Barley, Cultivation of 137
- Barley, Export of 98
- Beer. Consumption of, per Head 85
- Benevolent Asylums and Orphanages 71
- Birth-places of Population 25
- Birth-rate, Ten. Years 39
- Birth-rate, Causes of Decline 40
- Birth-rate, compared with United Kingdom 40
- Birth-rate, Australasian Colonies 40
- Birth-rate, Decline of 40
- Births 39-44
- Births Excess of, over Deaths, for Ten Years 22
- Births Illegitimate 41
- Births in Australian Colonies, Ten Years 41
- Births Numbers born in each Sex 41
- Births registered, Ten Years 39
- Births Registration of 22
- Births Limit of Time for 22
- Births Twins 41
- Boroughs, Expenditure of 168
- Boroughs, Indebtedness of 168
- Boroughs, Principal, Population of 27, 28
- Boroughs, Revenue of 168
- Boroughs, Value of Rateable Property 168
- Boundaries of New Zealand 5
- Breadstuffs, Consumption of, in various Countries and Colonies 120
- Building Societies 125, 126
- Building Societies Amounts deposited with 125
- Building Societies Income, Assets, Liabilities, Reserve Funds 126
- Butter 98
- Butter Export of 98, 99
- Butter to United Kingdom, Six Years 99
- Cattle 140, 141
- Causes of Death 56
- Causes of Death Accident 68
- Causes of Death Cancer 65
- Causes of Death Increase in Deaths by 65
- Causes of Death Rate from New Zealand, England 65
- Causes of Death Circulatory System 67
- Causes of Death Childbirth 67
- Causes of Death Diarrhœal Diseases 61
- Causes of Death Date varying with Temperature 61
- Causes of Death Dietetic Diseases 62
- Causes of Death Diphtheria 61
- Causes of Death Nervous Diseases 66
- Causes of Death Phthisis 62
- Causes of Death Ages and Length of Residence in Colony of Persons dying from 63
- Causes of Deaths from, increased by Introduction of Phthisical Persons 62
- Causes of Deaths from, in Proportion to New Zealand born 64
- Causes of Deaths from, at various Ages 64
- Causes of Rates from New Zealand, Australia, and England 62
- Causes of Principal Zymotic Diseases 60
- Causes of Respiratory Organs 67
- Causes of Small-pox 60
- Causes of Specific Febrile or Zymotic Diseases 60
- Causes of Suicide 68
- Causes of Typhoid or Enteric Fever 61
- Causes of Typhoid or Enteric Fever, Rates from 62
- Causes of Violence 68
- Census Results 21
- Charitable-aid 68-69
- Charitable-aid Boards 70
- Cheese 98
- Cheese, Export of 98
- Chinese 29
- Chinese, Immigration and Emigration of 29
- Chinese, Poll-tax on 29
- Cities (see Boroughs).
- Clothing, Imported 82
- Coal, Description of, in New Zealand 148
- Coal, Import and Export of 82, 93
- Coal, Output of 148
- Conditions of Parties married 45
- Consolidated Stock Act 114
- Consolidated Stock Act Creations under, equal to Increase of Sinking Fund 114
- Constitution and Government 5
- Coroners' Inquests 139
- Costley Training Institution 73
- Counties (see Local Bodies).
- Courts, all Kinds, Total Civil Cases 151
- Courts, Bankruptcy 151
- Courts, Civil Cases, Supreme and District 151
- Courts, Resident Magistrates', Civil Cases 151
- Courts, Charges for Offences before 153
- Courts, Charges and Convictions, Ten Years, with Proportion to Population 154
- Courts, Committals 153
- Courts, Decrease in Charges and Convictions before 154
- Courts, Summary Convictions before 154
- Courts, Supreme and District, Convictions 154
- Courts, Divorce and Separation 152
- Crime (see Courts and Offences).
- Crown and Native Lands, Value of Rateable 168
- Crown Lands, alienated 126
- Crown Systems of Disposal 128
- Crown (see Lands).
- Cultivation, Barley 137
- Cultivation, Extent of Land in 132
- Cultivation, Holdings over 1 acre, occupied 131
- Cultivation, to every 100 Adult Males 132
- Cultivation, Hops 137
- Cultivation, Land in sown Grasses 139
- Cultivation, Land under Grain Crops in Provincial Districts 132
- Cultivation, Oats 136
- Cultivation, in Australian Colonies 137
- Cultivation, Orchards 138
- Cultivation, Potatoes 137
- Cultivation, Tobacco 138
- Cultivation, Turnips 137
- Cultivation, Wheat 133
- Cultivation, in Australian Colonies 133
- Customs and Excise Duties Tariff 189
- Customs Duties, Revenue from Imports for Ten Years 112
- Customs from Imports for Australasian Colonies 112
- Customs Primage Duty 112
- Dairy Factory Companies 147
- Dairy Produce, Export of 98, 99
- Dairy 1886,1891 142
- Deaf-mutes, Institution for 166
- Death-rate, 1881-90, New Zealand 51
- Death-rate, 1881-90, various Countries and Colonies 51
- Death-rate, Affected by Proportions Living at different Age-periods 51
- Death-rate, Adjusted 51
- Death-rate, New Zealand compared with England 53
- Death-rate, Rule to find 52
- Death-rate, Infantile, in Chief Towns 59
- of Children, under Five Years 43, 53
- Death-rate, Australia and England 43
- Death-rate, of Infants 54
- Death-rate, Australasian Colonies 55
- Death-rate, of Sexes at Age-periods 54
- Deaths 50, 68
- Deaths Amount left by each Deceased Person 119
- Deaths Average Age at 54
- Deaths Causes of (see Causes).
- Deaths Excess of Male Births met by high Mortality among Male Infants 54
- Deaths in Hospital 70
- Deaths of Persons over Seventy-five Years of Age 53
- Debt, General Government (see Public Debt).
- Debt, of Local Bodies 121
- Defence, Permanent Militia 171
- Defence, Police 171
- Defence, Volunteers 171
- Defence, Fire Brigades 172
- Deferred-payment Lands, Disposal of 128
- Departures (see Immigration and Emigration).
- Diseases 57,59
- Diseases in Hospitals 79
- District Courts, Civil Cases 151
- Divorce and Separation 152
- Divorce New Zealand, Australia, and England 152
- Drunkenness 153
- Drainage Board, Revenue 170
- Education (see Schools).
- Education Boards, Income of 165
- Education Boards, Expenditure of 166
- Education Boards, University 163
- Electorates 36,37
- Electric Telegraph 119
- Emigration (see Immigration and Emigration).
- Excise Duties 201
- Expenditure, Boroughs 168
- Expenditure, Charges of Public Debt 114
- Expenditure, Counties 168
- Expenditure, General Government 114
- Expenditure, Life Assurance Companies 172
- Expenditure, on Education 114
- Expenditure, on Railways 117
- Expenditure, on Railways, Government, Working 121
- Expenditure, on Reproductive Public Works 117
- Expenditure, out of Loan by General Government 114, 117
- Expenditure, out of Loan by General Government on certain Public Works 117
- Expenditure, out of Revenue and out of Loan 114
- Exports 92, 107
- Exports and Imports, Total Value of 100
- Exports from United Kingdom to various Countries and Colonies 105
- Exports of Butter to United Kingdom, Six Years 99
- Exports of Coal 93
- Exports of Dairy Produce 98
- Exports of Frozen Meat 96, 98
- Exports Value, Nine Years 94
- Exports of Gold 96
- Exports of Grain 98
- Exports of Grass-seed 93
- Exports of Home Produce from New Zealand, Victoria, and New South Wales, compared 102
- Exports of Home Produce per Head 92
- Exports for each of Australasian Colonies 105
- Exports of Phormium, Growth of 99
- Exports Re-exports, exclusive of Specie 94
- Exports of New South Wales compared with New Zealand 95
- Exports Value of, from different Ports, 1889-90 100
- Exports Principal Articles, 18S9-90 93
- Exports Principal Articles of New Zealand Produce, 1881 to 1890 94
- Exports Re-export Trade 94
- Exports Wool exported, Ten Years 94
- Exports Increase in Quality and Value of 95
- Factories 149
- Finance 111
- Fire Brigades 172
- Fire Inquests 161
- Flocks of Sheep, Number and Size 96
- Friendly Societies (Lodges, &c., Assets, Receipts, Sick and Funeral Funds, Expenditure, Sick Pay, Funeral Donations, Management Expenses) 126
- Frozen Meat Industry 96
- Frozen Export of 96
- Frozen Nine Years, Value 94
- Frozen Increase, of Trade encourages Settlement 97
- Gaols—Ages, Birthplaces, and Religions of Distinct Prisoners 157
- Gaols—Ages, Ages and Offences of New-Zealand-horn Prisoners 160
- Gaols—Ages, Convicted Prisoners in Proportion to Population 161
- Gaols—Ages, First Offenders treated under Probation Act 158
- Gaols—Ages, Ages of 158
- Gaols—Ages, Imprisonment of Distinct Persons, Comparison for Five Years 155
- Gaols—Ages, Offences for which Imprisonment 155
- Gaols—Ages, Persons repeatedly imprisoned in Year 156
- Gaols—Ages, Prisoners received in 154
- Gaols—Ages, not counting Readmissions 155
- Gaols—Ages, Proportions of Prisoners at each Age-period 161
- Gaols—Ages, Proportions of Sexes amongst Convicted Prisoners 161
- Glaciers in Middle Island 17
- Gold exported 96
- Gold produced 96
- Government (see Constitution).
- Government, Representation, Australian Colonies, United Kingdom, &c 37
- Government, General Assembly of Nov/Zealand... 36
- Government, Native Members 37
- Government, Reduction of Electorates 37
- Grain grown in each Provincial District 132
- Grain exported 98
- Grain (see also Cultivation)
- Grazing-runs, Small 129
- Grass sown land, Extent of 139
- Grass-seed, Export of 93
- Harbours, North Island 16
- Harbours, South Island 19
- Harbours, Boards Revenue 170
- Hops, cultivated 137
- Horses 140
- Hospitals, Accommodation in 69
- Hospitals, Admission to 70
- Hospitals, Contributions by Local Bodies raised by Bates 69
- Hospitals, Deaths in 70
- Hospitals, Functions of District Boards 69
- Hospitals, Incorporated 69
- Hospitals, Outdoor Relief 70
- Hospitals, Revenues of Boards, how raised 69
- Hot Springs (see Thermal Springs).
- House of Representatives 36
- Illegitimacy 41
- Illegitimacy in Australasian Colonies 41
- Immigration and Emigration 28-35
- Immigration Assisted and Unassisted Immigrants, Ten Years 33
- Immigration each Australian Colony 35
- Immigration England and Australasian Colonies, Ten Years 35
- Immigration Excess of Immigration 31-34
- Immigration Excess of Departures in 1888 and 1890 24
- Immigration Excess of Departures on Reduction of Expenditure in Loan Money 31
- Immigration from United Kingdom, Australian Colonies, and other Places 31
- Immigration Gain by net Immigration in Ten Years 33
- Immigration Nominated Immigrants, and Terms for 29
- Immigration of Chinese 29
- Immigration Poll-tax on Chinese 29
- Immigration Proportion of Emigrants from England to Australia coming to New Zealand 35
- Imports and Exports, Total Value of 100
- Imports and Exports, for Ten Years 100
- Imports and Exports, of Coal 82, 93
- Imports 80-92
- Imports Beer, Spirits, and Wine, Consumption of 85
- Imports for Provincial Districts, Increase or Decrease of 89
- Imports from Different Countries, 1889-90 88
- Imports from India, 1889-90 103
- Imports from United Kingdom so Australasia 105
- Imports from United States, Ten Years 103
- Imports of Beer 85
- Imports of Coal 82
- Imports of Spirits 85
- Imports of Wine 85
- Imports per Head of Population, Ten Years 101
- Imports Principal Articles, in groups, 1888-89-90 81
- Imports Clothing, &c. 82
- Imports Sugar and Tea, per Head of Population 83
- Imports Consumption of 83-85
- Imports Tobacco, Consumption of 87
- Imports Value of 80
- Imports deducting Specie 80
- Imports for Nine Years 80
- Imports per Head of Population, Australian Colonies 104
- Indebtedness, Foreign Unsecured 118
- Indebtedness, of Boroughs 168
- Indebtedness of Local Bodies 121
- Indebtedness of Local Bodies for Ten Years 167
- Indebtedness of Local Bodies to Persons outside Colony 118
- Industrial Schools 72
- Industrial Committed Children at 73
- Industrial Cost of 166
- Industrial Costley Training Institution in connection with 73
- Industries, Various 149
- Inebriates in Lunatic Asylums 72
- Inquests; Coroners', on Bodies 161
- Inquests; on Fires 161
- Insanity (see Lunatic Asylums).
- Iron, Machinery, &c., imported 83
- Islands, Description of the Antipodes 6
- Islands, Description of the Auckland 6, 20
- Islands, Description of the Bounty 6
- Islands, Description of the Campbell 6
- Islands, Description of the Chatham 6,20
- Islands, Description of the Kermadec 7,20
- Islands, Description of the Middle 18
- Islands, Description of the North 8
- Islands, Description of the Stewart 6
- Kauri Gum exported 99
- Kauri Gum where obtained 99
- Lakes 12, 14
- Land alienated from Foundation of Colony 127
- Land disposed of on Agricultural Lease 128
- Land disposed on Homestead System 128
- Land disposed on Perpetual Lease 129
- Land disposed as Pastoral Buns 129
- Land disposed Revenue from 114
- Land disposed as Small Grazing-runs 129
- Land disposed without Sale 127
- Land fit for Agriculture and Pasture 9, 19
- Land Quality of 9, 19
- Land sold on Deferred Payments 129
- Land sold for Cash 127
- Land Revenue from 114
- Land Village Settlements, sold on Deferred-payments and for Cash 130
- Land Crown, Methods of Disposal of, by (1) Cash, (2) Deferred-payment, (3) Lease, (4) Homestead, (5) Agricultural Lease on Goldfields, (6) Small Grazing-runs, (7) Pastoral Runs 128
- Law and Crime 151
- Legislative Council 36
- Letters 107
- Letters Post-cards, Parcels, and Newspapers per Head 107
- Life Assurance Companies 172
- Life Assurance Expenditure of Companies 172
- Life Assurance Expenses of Companies per cent, of Revenue 173
- Life Assurance Insurances effected in 1890 172
- Life Assurance Management Expenses of Companies 173
- Life Assurance Policies discontinued 172
- Life Assurance outstanding, end of 1890 172
- Life Assurance surrendered or lapsed 172
- Life Assurance transferred 172
- Life Assurance Revenues of Companies 172
- Live Stock 140
- Live Stock Export of 93
- Live Stock in Australasian Colonies 141
- Loans, General Government (see Public Debt).
- Loans, Local Bodies, Outstanding at various Interest 167
- Local Bodies, Expenditure of Boroughs 168
- Local Bodies, Expenditure of Counties 168
- Local Bodies, Indebtedness 167
- Local Bodies, of Boroughs 168
- Local Bodies, Ten Years 167
- Local Bodies, Outstanding Loans 167
- Local Bodies, at Various Bates of Interest 167
- Local Bodies, Property in Town Districts 169
- Local Bodies, Bates collected in Ten Years 167
- Local Bodies, Revenue of 167
- Local Bodies, Boroughs 168
- Local Bodies, Counties 168
- Local Bodies, Drainage Boards 170
- Local Bodies, Harbour Boards 170
- Local Bodies, River Boards 170
- Local Bodies, Road Boards 170
- Local Bodies, Town Boards 170
- Local Bodies, Value of all Rateable Crown and Native Lands 168
- Local Bodies, Value of all Rateable Property, Three Years 169
- Local Bodies, Value of all Rateable Property, Capitalising Annual Values 170
- Local Bodies, Value of all Rateable Property in Boroughs 168
- Local Bodies, in Road Districts 169
- Local Bodies, Outlying Road Districts 169
- Local Bodies, Taxation by 170
- Lunatic Asylums 71, 72
- Lunatic Asylums Proportion of Lunatics recovered 71
- Lunatic Asylums to Population 72
- Lunatic Asylums in Australian Colonies 72
- Mail Services, Cost of, England and New Zealand 109
- Manufactories 149
- Manufactures, Value of 150
- Maoris 38, 39
- Maoris Charges and Convictions, all Courts 154
- Maoris Marriage between 46
- Maoris need not register Births and Deaths 21
- Maoris charged with offences 154
- Maoris Paucity of Numbers at earlier Ages 38
- Maoris Population 38
- Maoris Decrease of, and Cause 38, 39
- Maoris their Part in Government 39
- Maoris they Contribute towards Taxation 113
- Maoris Prisoners in Gaol 155
- Maoris Schools for 165, 166
- Marriage, Ages at which Sexes may contract 49
- Marriage, in various Countries 49
- Marriage, Average Age of each Sex at 49
- Marriage, Age of Parties to 48
- Marriage, between Maoris 46
- Marriage, by Registrars 46
- Marriage, Brides and Bridegrooms under Twenty-one Years 50
- Marriage, Children to a 41
- Marriage, Decrease in 42
- Marriage, in European Countries 43
- Marriage, Children living to each 43, 44
- Marriage, surviving Fifth Year of Age, New Zealand, Australia, and England 44
- Marriage, Conditions of Parties to 45
- Marriage, Forms of 46
- Marriage, in different Quarters of Year 45
- Marriage of Minors, Consent necessary for 48
- Marriage England and New Zealand compared 50
- Marriage Proportions of each Denomination 46
- Marriage Bate, New Zealand and Australian Colonies, Ten Years 44
- Marriage New Zealand the lowest 44
- Marriage considered as an Index to Prosperity 44
- Marriage New Zealand lower than England 45
- Marriage in European Countries 45
- Marriage Signatures by Mark 47
- Marriage solemnised by various Religious Denominations 46
- Meat trade 97
- Memorabilia 177
- Meteorology 73
- Middle Island, Description of 16
- Militia, Permanent 171
- Mills 149
- Mining and other Produce 150
- Money Orders 108
- Mountains 10, 16
- Native race (see Maoris).
- Naturalisation of Aliens 36
- New Zealand, Abolition of Provincial Governments in 5
- New Zealand, Area of 6, 8
- New Zealand, Arrival of Missionaries in 3
- New Zealand, Boundaries of 5
- New Zealand, Captain Cook's Visits to 2
- New Zealand, Coast-line of 8
- New Zealand, Colonisation of 3
- New Zealand, Colony divided into Six Provinces 5
- New Zealand, County Government in 5
- New Zealand, Discovery of 1
- New Zealand, General Assembly of 5
- New Zealand, Lieutenant Hanson's Visit to 3
- New Zealand, Made a separate Colony 4
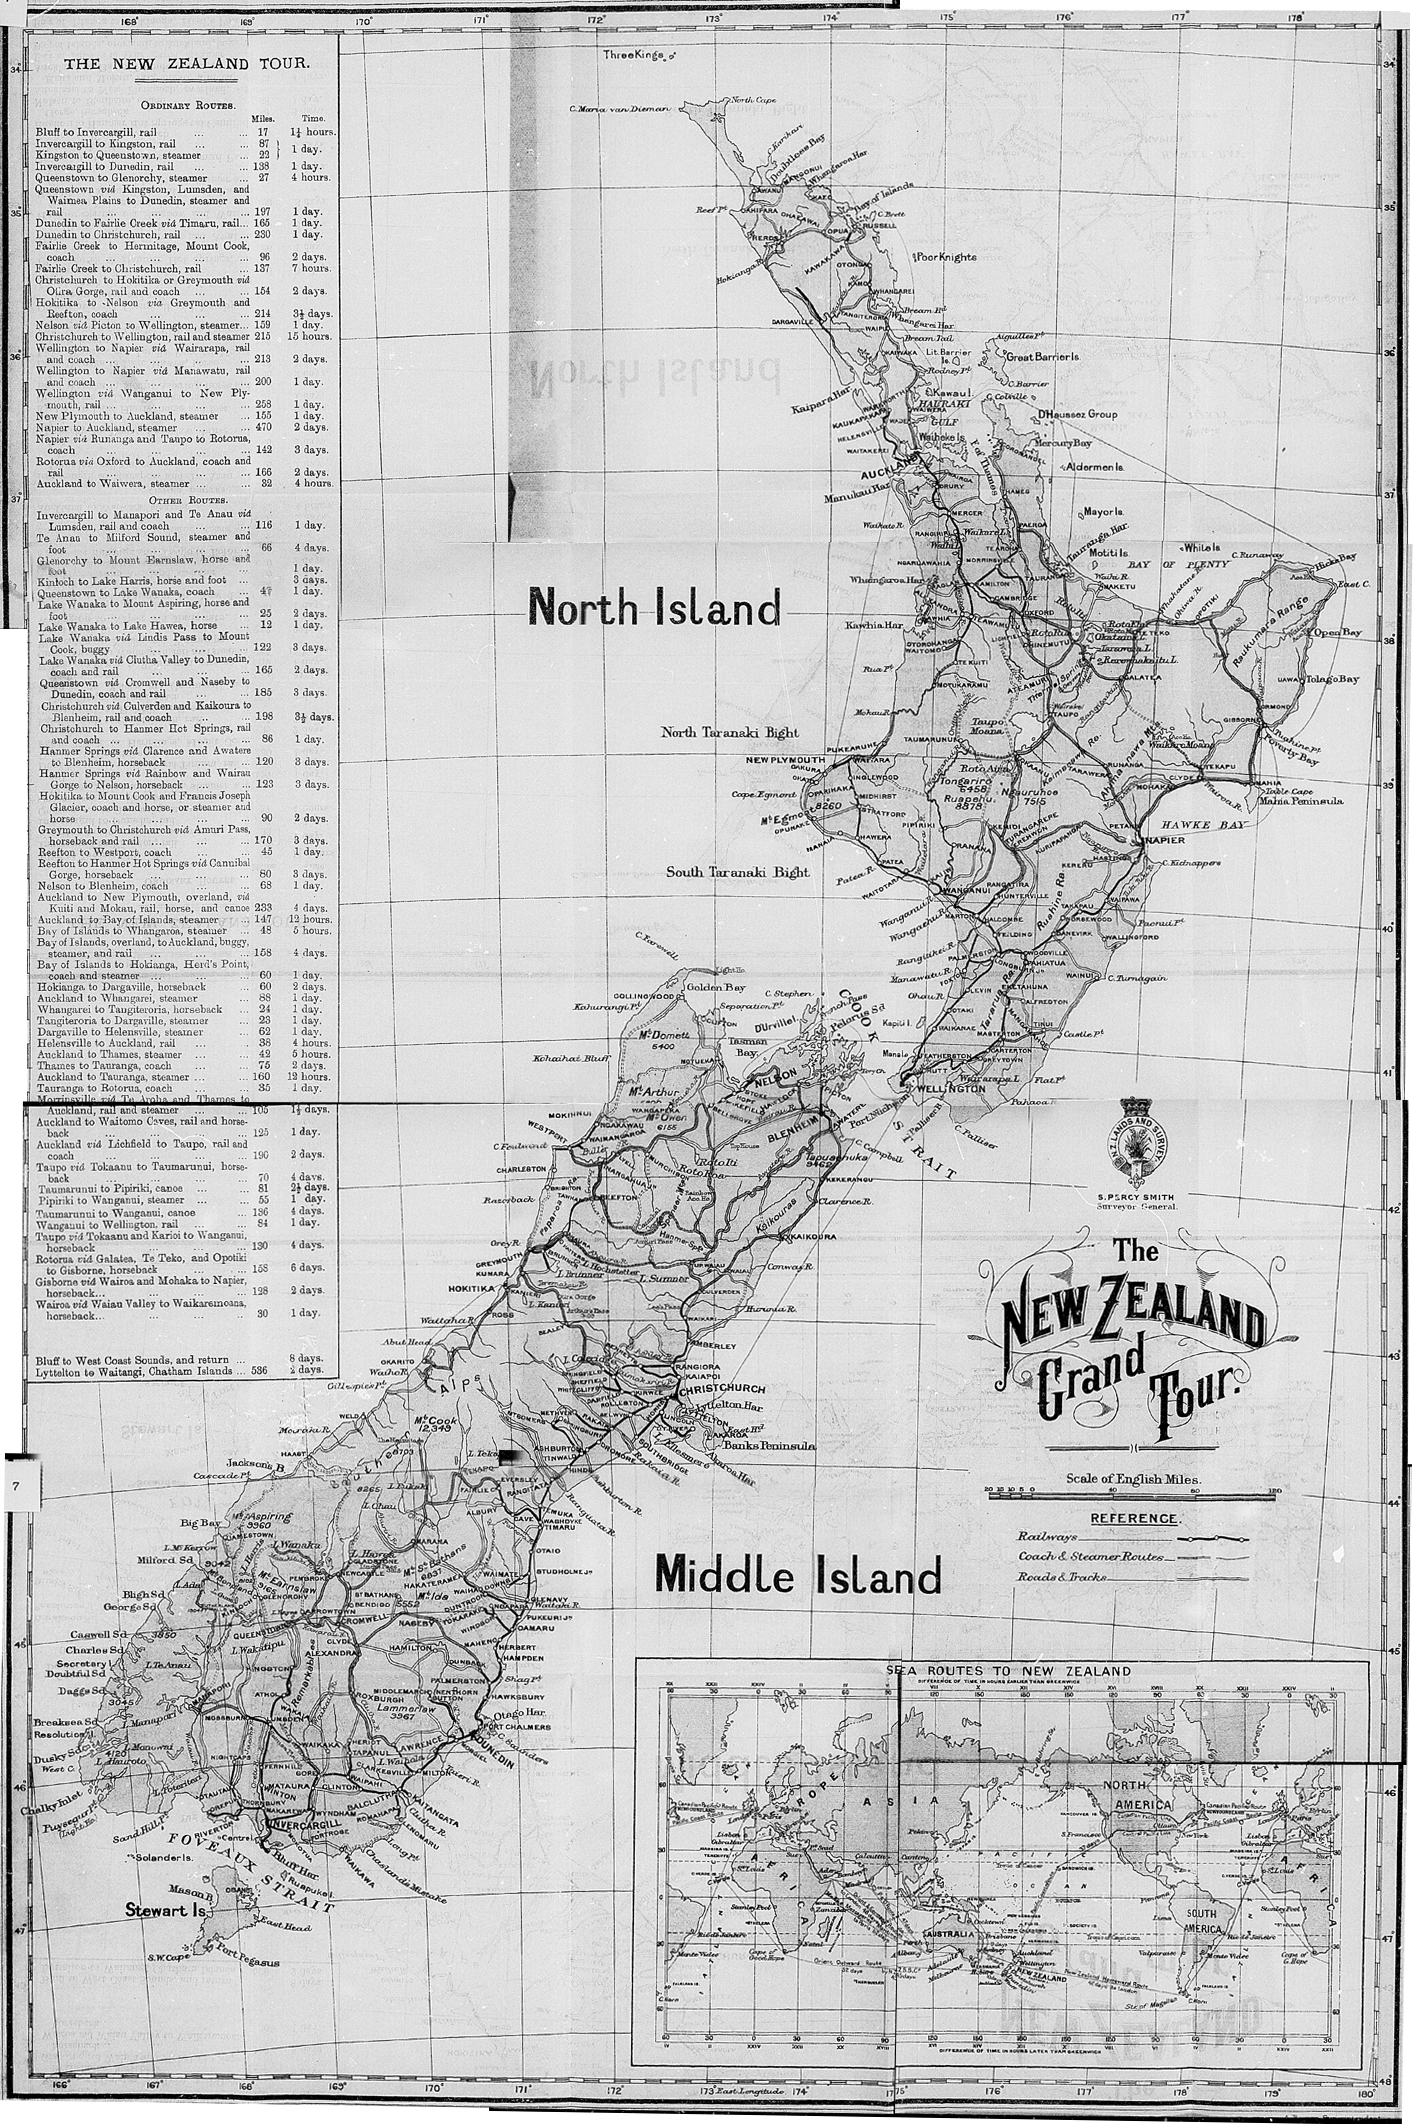
- New Zealand, Map of (after title).
- New Zealand, Middle Island of, Description of 11
- New Zealand, New Zealand Company 3
- New Zealand, North Island of, Description of 8
- New Zealand, Provincial Governments abolished in 5
- New Zealand, Representative Government granted in 5
- New Zealand, Settlement at Port Nicholson 4
- New Zealand, Settlement Otago 4
- New Zealand, Settlement Canterbury 4
- New Zealand, Settlement Nelson 4
- New Zealand, Settlement New Plymouth 4
- New Zealand, Sovereignty of Queen proclaimed 4
- New Zealand, Surville and Marion du Fresne's Visit 2
- New Zealand, Tasman's Visit 2
- New Zealand, Treaty of Waitangi 4
- Oat Crop of Australasian Colonies 137
- Oats, Cultivation of 136
- Oats, Export of 98
- Offences against Person and Property 154
- Offences against Persons and Property, Convictions for Five Years, with Proportions to Population, in all Courts 154
- Offences Assault, Five Years 153
- Offences Charges for, before Resident Magistrates' Courts 154
- Offences Committals for 153
- Offences Decrease in 153
- Offences Drunkenness, Five Years 153
- Offences, Larceny, Five Years 153
- Offences, Maoris charged with 154
- Offences, Maoris convicted before Supreme and District Courts 154
- Offences, Maoris summarily convicted 154
- Offences, Summary Convictions for 154
- Oil, Mineral 149
- Orchards 188
- Orphanages 71
- Parliament of New Zealand 36, 37
- Pastoral and Dairy Produce 142
- Pastoral Leases, Operations under 130
- Pastoral Receipts from 114
- Permanent Militia 171
- Perpetual Leases, Description of 129
- Perpetual Leases, Operations under 130
- Petroleum Oil 149
- Phormium, Export of 99
- Phormium, Palling Price 99
- Phormium, Mills 150
- Physical Features of New Zealand 8
- Police 171
- Population, 1890 21
- Population, at Age-periods 27
- Population, at Census 1891 21
- Population, at Supporting and Dependent Ages 27
- Population, Birthplaces of 25
- Population, Chinese 29
- Population, Different Islands 21
- Population, in Principal Towns and Suburbs 27, 28
- Population, Males at Militia Age 27
- Population, Maoris 21, 38
- Population, Maoris Ages of 38
- Population, Maoris Ages of Decrease of, and Cause 38
- Population, Natural Increase of 22
- Population, of Australasian Colonies, April, 1891 24
- Population, Proportions of Persons at Age-periods, New Zealand, Australia, and England 27
- Population, Proportions of the Sexes in New Zealand and Australian Colonies 24
- Population, Religious Denominations 25
- Post Office 107
- Post Office Average Time in which Mails delivered 110
- Post Office Increase of Correspondence 107
- Post Office Letters posted, per Head of Population 107
- Post Office Post-cards 107
- Post Office Books and Parcels 107
- Post Office Newspapers 107
- Post Office Money Orders 108
- Post Office Mail Services, England and New Zealand, Cost of 109
- Post Office Savings Banks 124
- Potatoes, Cultivation of 137
- Potatoes, Export of 93
- Primage Duty 112
- Prisoners (see Gaols).
- Private Wealth (see Wealth).
- Probation Act, First offenders treated under 158
- Produce, Agricultural, Pastoral, and Dairy 132, 147
- Produce, Mining, Manufacturing, &c. 150
- Production 127
- Property-tax 113, 117
- Public Debt 115
- Public Debt Charges of 114
- Public Debt Net Indebtedness 115
- Public Debt of Australasian Colonies 120
- Public Debt Old Provincial Loans 115
- Public Debt Sinking Fund accrued 115
- Public Debt Increase of Stock created for 114
- Railways, Australasian Colonies, Miles of, in 123
- Railways, Government, Goods and Live-stock carried 122
- Railways, Government, Length and Cost 121
- Railways, Government, Particulars of Revenue from 122
- Railways, Government, Passengers 121
- Railways, Government, Profit on Working 122
- Railways, Government, Revenue and Expenditure 121
- Railways, Government, Train-miles 121
- Railways, Private 123
- Railways, Private Cost of Construction, Revenue, and Working 123
- Rainfall Private 74
- Rainfall Private Rateable Property, Value of, in Boroughs 168
- Rainfall Private Rateable Property, Value of, Colony, capitalised 170
- Rainfall Private Rateable Property, Value of, Colony for Three Years 169
- Rainfall Private Rateable Property, Value of, Road Districts 169
- Rainfall Private Rateable Property, Value of, Town Districts 169
- Rainfall Private Rateable Property, Value of, Outlying 168
- Rates, collected by Local Bodies, Ten Years 167
- Rates of Wages 110
- Religious Denominations 25
- Representation, Australian Colonies, United Kingdom, Prance, and United States 37
- Representation, Electorates reduced in Number 37
- Representation, New Zealand, European 37
- Representation, Maori 37
- Resident Magistrate's Courts, Civil Cases 151
- Revenue from Customs Duties on Imports for Australian Colonies, Ten Years 112
- Revenue from Customs Duties on Imports for Ten Years 112
- Revenue from Government Railways 121
- Revenue from Primage Duty 112
- Revenue from Property-tax 113
- Revenue General Government (Ordinary and Territorial) 111
- Revenue and Local Government 115
- Revenue of Boroughs 168
- Revenue of Counties 168
- Revenue of Drainage Boards 170
- Revenue of Harbour Boards 170
- Revenue of Life Assurance Companies 172
- Revenue of Local Bodies 115
- Revenue of River Boards 170
- Revenue of Road Boards 170
- Revenue of Town Boards 170
- Revenue Territorial (see Lands) 111, 114
- Rivers 10, 19
- River Boards, Revenue 170
- Road Boards, Revenue 170
- Road Boards, Value of Rateable Property 169
- Sanatorium at Rotorua. Appendix C 12
- Savings Banks, Post Office 124
- Savings Banks, Private 125
- Schools, Children under Fifteen at 165
- Schools, Costley Training Institution 73
- Schools, Expenditure of Education Boards 166
- Schools, Income of Education Boards 165
- Schools, Industrial 72
- Schools, Industrial cost of 166
- Schools, Institution for Deaf-mutes 166
- Schools, Maori Children attending 165
- Schools, Native, Village, &c. 165
- Schools, Native, Village, Expenditure 166
- Schools, Numbers in Attendance 162
- Schools, Orphan 71, 162
- Schools, Private 162, 164
- Schools, Private Number, Attendance 164
- Schools, Public 162, 163
- Schools, Public Attendance at 163
- Schools, Public Subjects of Instruction 162
- Schools, Public Teachers at 163
- Schools, Public The System 162
- Schools, Roman Catholic 164
- Schools, Superior, High, Grammar, &c 163
- Schools, Total Children receiving Education at 164
- Schools, Total Children receiving Education at Ages Five to Fifteen 164
- Schools, Sheep 140
- Schools, Number and Size of Flocks 96
- Shipping 76-80
- Shipping Coastwise, Vessels and Tonnage 79
- Shipping Crews 76
- Shipping Entered and cleared, with Cargoes and in Ballast, 1889-90 78
- Shipping Foreign, entered, for Three Years 77
- Shipping Increase of, in 1890 76
- Shipping Inwards and Outwards, Ten Years 79
- Shipping Nationality of Vessels 77
- Shipping Registered Vessels, Sailing and Steam 80
- Shipping Sailing and Steam, entered and cleared, Comparison of l889-90 78
- Sinking Fund (see Public Debt).
- Small-pox 60
- Sounds of Middle Island 17
- Sown Grasses, Extent of 139
- Sown Grasses, New Zealand, compared with Australia 139
- Spirits, Consumption per Head 85
- Spirits, Consumption per Head Ten Years 86
- Statistical Summary of New Zealand, 1840-52 (see broadsheet).
- Statistical Summary of New Zealand, 1853-90
- Sugar, Consumption of 83, 84
- Supreme Court, Civil Cases 151
- Tariff of New Zealand. Appendix B 189
- Taxation by General Government 113
- Taxation by General Government Bate of, including Maoris 114
- Taxation by General Government Property-tax 113
- Taxation by Local Bodies 170
- Taxation per Head in New Zealand, including and excluding Maoris 113
- Taxation per Head in Australasian Colonies 113
- Tea, Consumption of 110
- Telegraph 110
- Telephone Exchanges 110
- Temperature 74
- Thermal-Springs District 11
- Thermal-Springs Area of District 203
- Thermal-Springs Climate of 202
- Thermal-Springs Diseases successfully treated at 208
- Thermal-Springs Mr. Malfroy's Report on 12
- Thermal Springs, Dr. Ginders' Report on. Appendix C 202
- Thermal-Springs Hospital at 204
- Thermal-Springs Physical Features of District 203
- Thermal-Springs Principal Baths at 204
- Thermal-Springs Rotorua Sanatorium 12, 204
- Thermal-Springs The Route to 213
- Thermal-Springs Varieties of Mineral Waters 203
- Timber exported 93
- Tobacco, Consumption of 87
- Tobacco, Cultivation of 138
- Town Districts (see Local Bodies).
- Towns, Principal and Suburbs 27
- Trade 76
- Trade (see Imports).
- Trade (see Exports).
- Trade Australasian, Probable Vast Expansion of 107
- Trade Importance of Australasian Colonies as Markets for Great Britain 105
- Trade New Zealand, Total Value of 100
- Trade New Zealand, Total Value of Atlantic and Pacific Ports of United States, Ten Years 103
- Trade New Zealand, Total Value of per Head, Population, Ten Years 101
- Trade New Zealand, Total Value of with United Kingdom 101
- Trade New Zealand, Total Value of with Australia 101
- Trade New Zealand, Total Value of with United States 103
- Trade New Zealand, Total Value of with India 103
- Trade of Australasian Colonies, Value of 104
- Trade of Australasian Colonies with United Kingdom 105
- Trade of United Kingdom, Proportion of, belonging to New Zealand 105
- Trade Shipping (see Shipping).
- Trade Total of Australasia with United Kingdom 105
- Turnips, Cultivation of 137
- Twins 41
- University of New Zealand 163
- Value of Produce 150
- Vaccination 60
- Vaccination Inattention to 60
- Vital Statistics 39
- Volunteers 171
- Vessels (see Shipping).
- Wages, Rates of 110
- Wealth, Private, by Property-tax Returns 117
- Wealth, Private, understated 118
- Wealth, Private, Calculated from Probate Returns 118
- Wealth, Private, New South Wales and Victoria 119
- Wealth, Private, Wealth of United Kingdom 120
- Wheat, Consumption of, in New Zealand 134
- Wheat, Crops of Australasian Colonies 133
- Wheat, Cultivation 133
- Wheat, Export of 98
- Wind 75
- Wine, Consumption of, per Head 85
- Wine, Consumption of, per Head Ten Years 86
- Women, Married, Fertility of 40
- Wool, exported 95
- Wool, Increase in Production of, Ten Years 95
- Wool, used at Local Mills 95
- Woollen Manufactures exported 93
Table of Contents
THE first authentic account of the discovery of New Zealand is that given by Abel Jansen Tasman, a Dutch navigator. He sailed from Batavia on the 14th August, 1642, in the yacht “Heemskirk,” accompanied by the “Zeehaen” (or “Sea-hen”) fly-boat. After having visited Mauritius and discovered Tasmania, named by him “Van Diemen's Land,” in honour of Anthony van Diemen, the Governor of the Dutch possessions in the East Indies, he sailed in an easterly direction, and on the 13th December of that year sighted the west coast of the Middle Island of New Zealand, described by him as “a high mountainous country, which is at present marked in the charts as New Zealand.”
It has been assumed as probable that the first European who visited New Zealand was Juan. Fernandez, who, having started from one of the ports of the west coast of South America in 1576, after sailing for about a month in a south-westerly direction, reached a land described by him as fertile and pleasant, and inhabited by a race of white people, well made, and dressed in a species of woven cloth. People of brown complexions were often described as white by the Spaniards; and, although there is no direct evidence that the land so discovered was New Zealand, yet no other seems to answer his description. It appears, however, certain that the country was visited before, the date of Tasman's arrival in 1642, as the land he came to was shown in the Dutch chart used by him, and was named thereon “Zeland Nova,” William Bleau, a Dutchman, who died in 1638, having published an atlas in which indistinctly a line of coast is shown with the name against it, “Zelandia Nova”
Tasman, under the belief that the land he saw formed part of a great Polar continent, and was part of that country (subsequently found to be an island) discovered some years before by Schouten and Le Maire, to which the name of Staaten Land had been given, gave the same name of Staaten Land to New Zealand. Within about three months after this date Schouten's “Staaten Land” was found to be merely an inconsiderable island. Upon this discovery being announced, the country which Tasman had called by the same name received instead that of “New-Zealand”—an evident restoration of the name previously given — by which name it has ever since been known. Tasman sailed along the coast to a bay, where he anchored. To this he gave the name of Murderers (now Massacre) Bay, on account of an unprovoked attack oil a boat's crew by the Natives, and the massacre of four white men. Thence he sailed along the west coast of the North Island, and gave the name of Cape Maria van Diemen to the north-western extremity thereof. After sighting the Islands of the Three Kings he finally departed, not having set foot on the country.
There is no record of any visit to New Zealand after Tasman's departure until that of Captain Cook, who, after leaving the Society Islands, sailed in a southerly direction in search of a southern continent then believed to exist. He sighted land on the 6th October, 1769, and on the 8th of that month cast anchor in Poverty; Bay. After having circumnavigated the North Island and the Middle and Stewart islands—the latter having been considered as part of the Middle Island—he sailed from Cape Farewell on the 31st March, 1770, for Australia. He again visited New Zealand in 1773, in 1774, and in 1777.
M. de Surville, a French officer in command of the vessel “Saint Jean Baptiste,” being on a voyage of discovery, sighted the north-east coast of New Zealand on the 12th December, 1769, and remained for a short time.
Another visit was shortly after paid by a French officer, M. Marion du Fresne, who arrived on the west coast of New Zealand on the 24th March, 1772, but was treacherously murdered by the Natives on the 12th June following.
In 1793 the “Dædalus,” under the command of Lieutenant Hanson, was sent by the Government of New South Wales to New Zealand, and two chiefs were taken thence to Norfolk Island. There was after this an occasional intercourse between the Islands of New Zealand and the English settlements in New South Wales.
In 1814 the first missionaries arrived in New Zealand—Messrs. Hall and Kendall—who had been sent as fore-runners to Mr. Marsden. After a short stay they returned to New South Wales, and on the 19th November of that year again embarked, in company with Mr. Marsden, who preached his first sermon in New Zealand on Christmas Day, 1814, and returned to Sydney on the 23rd March, 1815. It was not until 1821 that the work of evangelization was put on a somewhat permanent basis; but the first station, established by Mr. Leigh, a Wesleyan missionary, and his wife, at the valley of the Kaeo-Wangaroa, was not taken possession of until the 10th June, 1823.
The first attempt at colonisation was made in 1825 by a company formed in London. An expedition was sent out under the command of Captain Herd, who bought two Islands in the Hauraki Gulf and a strip of land at Hokianga. The attempt, however, was a failure, owing to the savage character of the inhabitants. In consequence of frequent visits of numerous whaling-vessels to the Bay of Islands, a settlement grew up at Kororareka—now called Russell—and in 1833 Mr. Busby was appointed British Resident there. A number of Europeans—generally men of low character—gradually settled in different parts of the country, and married Native women.
In 1838 a colonisation company, known as the New Zealand Company, was formed to establish settlement on systematic principles, A preliminary expedition, under the command of Colonel William Wakefield, was despatched from England on the 12th May, 1839, and arrived in New
Zealand in the following August. Having purchased the land from the land from the Natives, Colonel Wakefield selected the shore of Port Nicholson, in Cook Strait, as the site of the first settlement. On the 22nd January, 1840, the first body of immigrants arrived, and founded the Town of Wellington. About the same time—namely, on the 29th January, 1840—-Captain Hobson, R.N., arrived at the Bay of Islands, empowered, with the consent of the Natives, to proclaim the sovereignty of the Queen over the Islands of New Zealand, and to assume the government thereof. A treaty called “The Treaty of Waitangi,” to which in less than six months five hundred and twelve names were affixed, was entered into, by which all rights and powers of sovereignty were ceded to, the Queen, all territorial rights being secured to the chiefs and their tribes. New Zealand was then constituted a dependency of the Colony of New South Wales, but on the 3rd May, 1841, it was proclaimed a separate colony. The seat, of Government had been previously established at Auckland, round which a settlement was formed.
The New Zealand Company, having decided to form another settlement, to which the name of “Nelson” was to be given, despatched a preliminary expedition from England in April, 1841, for the purpose of selecting a site, which resulted in the establishment of the settlement at the head of Blind Bay. About the same time a settlement was commenced at New Plymouth, by the arrival, on the 31st March, 1841, of a body of immigrants despatched by the New Plymouth Company, a colonisation company that had been formed in England, and had purchased 50,000 acres of land from the New Zealand Company.
The next important event in the progress of colonisation was the arrival at Port Chalmers, in March, 1848, of two ships containing immigrants, despatched by the Otago Association for the foundation of a settlement in that part of the colony by persons who belonged to or were in sympathy with the Free Church of Scotland.
In 1849 the “Canterbury Association for founding a Settlement in New Zealand” was incorporated. On the 16th December, 1850, the first emigrant ship despatched by the association arrived at Port Cooper, and the settlement of the adjoining country was commenced in a systematic manner, the intention having been to establish a settlement complete in itself, and composed entirely of members of the then United Church of England and Ireland.
The government of the colony was at first vested in the Governor, who was responsible only to the Imperial Government; but in 1852 an Act was passed by the Imperial Legislature which granted representative institutions to the colony. The colony was thereby divided into six provinces, each to be presided over by an elective Superintendent, and to have an elective Provincial Council, empowered to legislate, except on certain specified subjects. The Act also provided for the constitution of a General Assembly for the whole colony, consisting of a Legislative Council, the members of which were to be nominated by the Governor, and an elective House of Representatives. The first session of the General Assembly was opened on the 27th May, 1854, but the members of the Executive were not responsible to Parliament. The first Ministers under a system of Responsible Government were appointed on the 18th April, 1856.
The Provincial Governments remained as integral parts of the Constitution of the colony until the 1st November, 1876, when they were abolished by an Act of the General Assembly, that body having been vested with the power of altering the Constitution Act. On the same day an Act of the General Assembly which subdivided the colony (exclusive of the areas included within municipalities) into counties, and established a system of local county government, came into operation.
The Proclamation of Captain Hobson on the 30th January, 1840, gave as the boundaries of the colony the following degrees of latitude and longitude:—
| On the north | 34° 30' south latitude. |
| On the south | 47° 10' south latitude. |
| On the east | 179° 0' east longitude. |
| On the west | 166° 5' east longitude. |
These limits excluded small portions of the extreme north of the North Island and of the extreme south of Stewart Island.
In April, 1842, by Royal Letters Patent, and again by the Imperial Act 26 and 27 Vict., c. 23, 1863, the boundaries of the colony were altered so as to extend from 33° to 53° of south latitude, and from 162° of east longitude to 173° of west longitude. By Proclamation bearing date the 21st July, 1887, the Kermadec Islands, lying between the 29th and 32nd degrees of south latitude and the 177th and 180th degrees of west longitude, were declared to be annexed to and to become part of the Colony of New Zealand.
The following now constitute the Colony of New Zealand:—
The Island commonly known as the North Island, with its adjacent islets, having an aggregate area of 44,468 square miles, or 28,459,580 acres.
The Island known as the Middle Island, with adjacent islets, having an aggregate area of 58,525 square miles, or 37,456,080 acres.
The South or Stewart Island, and adjacent islands, having an area of 665 square miles, or 425,390 acres.
The Chatham Islands, situate 536 miles eastward of Lyttelton, in the Middle Island, with an area of 375 square miles, or 239,920 acres.
The Auckland Islands, about 200 miles south of Stewart Island, extending about 30 miles from north to south, and nearly 15 from east to west, the area being 210,650 acres.
The Campbell Islands, in latitude 52° 33' south, and longitude 169° 8' west, about 30 miles in circumference, with an area of 45,440 acres.
The Antipodes Islands, about 458 miles in a southeasterly direction from Port Chalmers, in the Middle Island. These are detached rocky islands, and extend over a distance of between 4 and 5 miles from north to south. Area, 12,960 acres.
The Bounty Islands, a small group of islets, thirteen in number, lying north of the Antipodes Islands, and about 415 miles in. nearly an east-south-easterly direction from Port Chalmers. Area, 3,300 acres.
The Kermadec Islands, a group of which the largest is called Sunday or Raoul Island, lie about 614 miles to the north-east of Russell, in the Bay of Islands. Sunday Island is about 20 miles in circuit. The next in size is Macauley Island, about 3 miles in circumference. Area of the group, 8,144 acres.
The total area of the colony is thus about 104,471 square miles, of which the aggregate area of the outlying groups of islands that are practically useless for settlement amounts] to about 438 square miles.
The areas of the various Australian Colonies as given by different authorities differ considerably. Mr. Hayter, in his “Victorian Year-book,” gives the total area of the Australian Continent at 2,944,628 square miles, according to a computation made by the late Surveyor-General of Victoria, Mr. J. A. Skene, from a map of continental Australia compiled and engraved under his direction; but in the case of each colony except Victoria the area computed by Mr. Skene differs from that given in the official records of that colony, the difference in the case of Western Australia amounting to over 84,000 square miles. The following areas are therefore taken from the official records of each colony:—
| Square Miles. | |
|---|---|
| Queensland | 668,497 |
| New South Wales | 310,700 |
| Victoria | 87,884 |
| South Australia | 903,690 |
| Western Australia | 1,060,000 |
| Total Continent of Australia | 3,030,771 |
| Tasmania | 26,375 |
| New Zealand (including the Chatham and other islands) | 104,471 |
| Total Australasia | 3,161,617 |
The size of these colonies may be better realised by the comparison of their areas with those of European countries. The areas of the following countries—Austria-Hungary, Germany, France, Belgium, Holland, Denmark, Sweden
and Norway, Portugal, Spain, Italy (including Sardinia and Sicily), Switzerland, Greece, Roumania, Bulgaria, Servia, Eastern Roumelia, and Turkey in Europe—amounting on the whole to less than 1,600,000 square miles, are little more than half the area of the Australian Continent. If the area of Russia in Europe he added to those of the other countries the total area would be about one-seventh larger than the Australian Continent, and about one-twelfth larger than that of the Australasian Colonies, including New Zealand. The area of the Colony of New Zealand is a little more than one-seventh less than the area of the United Kingdom and Ireland, that of the Middle Island of New Zealand being a little larger than the combined areas of England and Wales.
| United Kingdom. | Area in Square Miles. |
|---|---|
| England and Wales | 58,311 |
| Scotland | 30,463 |
| Ireland | 32,531 |
| Total | 121, 305 |
| Now Zealand. | Area in Square Miles. |
| North Island | 44,468 |
| Middle Island | 58,525 |
| Stewart Island | 665 |
| Chatham Islands | 375 |
| Other islands | 438 |
| Total | 104,471 |
The Colony of New Zealand chiefly consists of the three Islands, the North, the Middle, and Stewart Islands, extending over nearly thirteen degrees of latitude, and having a coast-line amounting to 4,330 miles in length—namely, North Island, 2,200 miles; Middle Island, 2,000 miles; and Stewart Island, 130 miles. The North Island extends over a little more than seven degrees of latitude—a distance in a direct line from north to south of 430 geographical or 498 statute miles; but, as the northern portion of the colony, which extends over more than three degrees of latitude, takes a north-westerly direction, the distance in a straight line from the North Cape to Cape Palliser, the extreme northerly and southerly points of the Island, is about 515 statute miles.
This Island is as a whole hilly, and even in parts mountainous in character, but there are large areas of plain or comparatively level country, available, either now or in the future, when cleared of forest or other indigenous vegetation, &c., for agricultural purposes. Of these, the principal are the plains in Hawke's Bay on the East Coast, the Wairarapa Plain in the Wellington District, and a strip of country along the West Coast extending from a point about 30 miles from the City of Wellington to a little north of New Plymouth, which is about 250 miles distant from Wellington. The largest plain in the North Island, Kaingaroa, extends from the shore of Lake Taupo in a north-north-easterly direction to the sea-coast in the Bay of Plenty; but a large portion is covered with pumice-sand, and is unsuitable for beneficial occupation. There are several smaller plains and numerous valleys suitable for agriculture. The level or undulating country in this Island suitable for or capable of being made fit for agriculture has been estimated roughly at 13,000,000 acres. This includes lands now covered with standing forest, and swamps that are capable of drainage; also considerable areas of clay-marl and pumice-covered land. The clay-marl in its natural state is cold and uninviting to the agriculturist, but under proper drainage and cultivation it can be brought to a high state of productiveness. This kind of land is generally neglected at the present time, as settlers prefer soils more rapidly remunerative and less costly to work.
The larger portion of this Island was originally covered with forest. Although the area of forest-covered land is still very great, yet year by year the amount is being reduced; chiefly to meet the requirements of settlement, the trees being cut down and burnt, and grass-seed being then sown on the ashes to create pasture. Hilly as the country is, yet from the nature of the climate it is especially suited for the growth of English grasses, and wherever there is any soil, however steep the land may be, grasses will flourish. Very little of the land is consequently incapable of being made to supply food for cattle and sheep when treated as above or otherwise laid down to grass. The area of land in the North Island deemed purely pastoral or capable of being made so, being too steep for agricultural purposes, is estimated at 14,200,000 acres. In the centre of the Island is a lake, about twenty miles across either way from the extreme points, called Taupo. A large area adjacent to the lake is at present worthless pumice-country. The Waikato River, the largest in the North Island, rising to the south of the lake, flows through it and out of its north-eastern point, and trends thence in a north-westerly direction until it flows into the ocean a little distance south of the Manukau Harbour. This river is navigable for small steamers for about 100 miles from its mouth. The Maori King-country, occupied by Natives who for several years isolated themselves from the Europeans, lies to the west of Lake Taupo, and is bounded on the west by the sea.
The River Thames, having its sources north of Lake Taupo, flows northward into the Firth of Thames. It is navigable only for small steamers about 50 miles. The other navigable rivers in this Island are the Wanganui and Manawatu, which flow in a south-westerly direction into Cook Strait.
The mountains in the North Island are estimated to occupy about one-tenth of the surface, and do not exceed 4,000ft. in height, with the exception of a few volcanic mountains that are more lofty. Of these, the following are the most important:—
The Tongariro Mountain, situated to the southward of Lake Taupo. It consists of a group of distinct volcanic cones, the lava-streams from which have so overlapped in their descent as to form one compact mountain-mass at the base. The highest of these cones is that of Ngaruahoe, which attains an elevation of 7,515ft. The craters of Ngaruahoe, the Red Crater (6,140ft.), and Te Mari (4,990ft.) are the three vents from which the latest discharges of lava have taken place; the most recent having occurred in 1868. These craters are still active, steam and vapour issuing from them with, at times, considerable force andnoise, the vapours being charged with pungent gases and acids, making it dangerous to approach too near the crater-lips.
Ruapehu.—This mountain lies to the south of Tongariro. It is an extinct volcanic cone, and reaches the height of 9,100ft., being in part considerably above the line of the limit of perpetual snow. The most remarkable feature of this mountain is the crater-lake on its summit. This lake is situated at the bottom of a funnel-shaped craters, its steep sides being mantled with ice and snow. The water occupies a circular basin about 500ft. in diameter, and is about 300ft. below the enclosing peaks, and quite inaccessible except by ropes. It is much disturbed by eddies, from which steam or vapour is given off. This lake, and the three craters previously mentioned on Tongariro, are all in one straight line which if produced would pass through the boiling springs at Tokaanu on the southern margin of Lake Taupo, and through other hot springs on the north of the lake in the direction of White Island, an active volcano in the Bay of Plenty, situated about 27 miles from the mainland.
Mount Egmont.—This is also an extinct volcanic cone, rising to a height of 8,300ft. The upper part is always covered with snow. This mountain is situated close to New Plymouth, and is surrounded by one of the most fertile districts in New Zealand. Rising from the plains in its solitary grandeur, it is an object of extreme beauty and ceaseless admiration.
It is estimated that the area of mountain-tops and barren country at too high an altitude for sheep, and therefore worthless for pastoral purposes, amounts in the North Island to 300,000 acres.
The most remarkable feature of the North Island is the numerous hot springs, which occur in hundreds from Tongariro, south of Lake Taupo, to Ohaeawai, situated at almost the extreme north of the colony—a distance of 300 miles. Clouds of sulphurous steam are seen rising at all sorts of places over this extensive area, but the principal seat of hydrothermal action appears to be in the neighbourhood of Lake Rotorua. The district is generally known as the Hot- or Thermal-Springs District.
This district is situated about 40 miles in a north-northeast direction from Late Taupo. By the destruction of the famed Pink and White Terraces and of Lake Rotomahana on the occasion of the eruption of Mount Tarawera on the 10th June, 1886, the district has been deprived of attractions unique in character and of unrivalled beauty; but the natural features of the country—the lakes, geysers, and hot springs (the number of which is very great), some of which possess remarkable curative properties for certain complaints—still afford considerable attraction for tourists and invalids.
Recently the world-wide importance of conserving this region as a sanatorium for all time has been recognised by the Government, and it is now dedicated by Act of Parliament to that purpose.
A very interesting paper on the Thermal-Springs District, written by Dr. Ginders, the Medical Superintendent of the Government, Sanatorium at Rotorua, will be found as Appendix C to this work; and the following extracts from the report of Mr. Malfroy, the Government Inspector of Works at Rotorua, gives additional information, and will doubtless be found of interest: —
The new sanatorium building was completed on the 22nd December last, and the term of maintenance expired on the 22nd March. It is a good substantial building, where the convenience and comforts of invalids are well provided for, and, having a nice appearance, it adds greatly to the importance and attraction of the place. It is calculated to give accommodation for twenty-one patients—viz., twelve males and nine females. It was open at the beginning of February, and has been well patronised, considering that it has not been advertised in any way, and it is therefore hardly known that such an institution is in existence.
The grounds have been improved by the extension of the clearing, formation of new footpaths, and planting of trees. The ornamental trees, shrubs, fruit-trees, flower- and kitchen-gardens, all show a healthy growth, This is a subject of surprise to those visitors who saw the place in its early days, when it was thought that nothing would grow here.
The bath-accommodation has been improved by the covering-in and the erection of dressing-rooms in the gentlemen's Rachel sitz-bath, and increased by the erection of a new Priest bath for the use of the sanatorium patients. This new building is24ft. by 12ft., with 8ft. walls, built on the panel pattern, and specially-grooved boards for roof, so as to use as few nails as possible, owing to the corrosive influence of the atmosphere. The bath proper consists of a piscine 12ft. by 10ft. and 3ft. deep, with broad flights of stairs, and submerged seats around three sides.
The baths have been well patronised during the past twelve months. The number of baths taken was 10,442, and cash received £227 2s., besides hospital patients' and free baths amounting to 762, showing a slight increase in the number of baths, and a decrease of £27 in the receipts. This, however, can be accounted for. First, there were 724 hospital patients' baths not paid for; and, secondly, last year was the Exhibition year. But the high reputation which this place is slowly acquiring as the health resort of the Australian Colonies is proved by the fact that, independent of the excursionists or sight-seeing tourists, there are quite a number of persons whose faces become familiar by their repeated visits and long stay in this place. Those from the Australian Colonies come here to spend a few months of the summer and thus escape the excessive heat of their own; whilst those from the south of this colony come here in winter for a milder and drier climate.
The number of visitors' to the place from the 1st April, 1890, to the 31st March, 1891, is 2,590. This number is only approximately correct, as several of the houses keep no record, and there is also a small number of visitors who put up with residents, as relations or friends, not included in the above.
Taking the foregoing into consideration, and the fact that the railway, which is being steadily extended, will in all probability be completed to this place in a couple of years, also that this district is now practically a public domain, I would most respectfully suggest that a substantial sum of money be placed on the estimates to lay out and form roads and tracks—these should be laid out at once before any of the land is disposed of—plant trees, &c., in the different public reserves, before the great influx of visitors—which the completion of the railway is bound to bring—actually takes place, for, in addition to its being much easier to protect young plantations now than it will be later on, any public money so expended judiciously and at the proper season of the year would so enhance the value of the land in the eyes of the public that the Government would be more than repaid in the increased rental they would receive.
The works proposed are: Clearing, laying out roads and tracks, planting trees and shrubs. First, in the sanatorium reserve; second, in the Pukeroa reserve; third, in the public reserve about Arikikapakapa; fourth, to lay out and form roads and tracks to the most important sights of this locality, which contains almost every variety of thermal phenomena, frombubbling hot springs to the terrifying geysers, hot and cold lakelets of various colours, mud-volcanoes, mud-puffs and boiling-mud holes of all colours, shapes, and forms. I feel certain that if the thermal wonders in the vicinity of Rotorua were known and made accessible, so that tourists could walk amongst them at their leisure, without the cost, weariness, and hurry-scurry of the present system of long journeys to far-off places, they would stay longer in the district, and be better pleased with it than they are under present circumstances.
In conclusion, I would say that the more I become acquainted with the resources and natural wonders of this district, and compare the great climatic advantages which they possess over those of the same class which I have seen and read about in Europe and America, the more I am convinced that they are sure to eventually prove a great source of wealth to the colony; but, like many well-known rich mines, it is useless unless there is a proper plant with modern scientific knowledge to extract all possible good out of it; and, from what I saw, heard, and read on this subject during my leave of absence, I am confident that we are not affecting half the cures which might be done with better balneals and therapeutic appliances and knowledge.
With regard to the volcanoes, springs, &c., I have to report having visited the Tarawera Mountain lately, and, from the changes which I noticed, I believe that it is evidently becoming an active volcano. There are now several places about the mountains where a stick can be charred and set ablaze by simply thrusting it for a minute or so into the scoria to be found about the different craters.
Old Rotomahana Lake.—The water has risen very fast during the last twelve months. It is now filled to about its original level—namely, 10ft. above the present level of Tarawera Lake. It will require to rise about 150ft. more before it overflows into said lake through the blocked-up valley of the original creek, which seems the lowest spot on the dividing-ridge, but, as the superficial area of Rotomahana Lake will greatly increase as the water rises, it may not overflow for years.
Echo Lake.—The water of this lake, which was formerly cold, is now steaming all over, and it may, in reality, be named the real Rotomahana of the district.
Lakes Tarawera, Rotoehu, and Rotomahana have all gone down considerably from 10ft. to 15ft. below the original level. The cause of this rather sudden fall in the lakes, as more fully reported in my report of 3rd March, should be worth inquiring into. The erosion of the surface about the ash-fields is still going on, and offers a most interesting lesson in practical geological formations, for it is very seldom that so good an opportunity offers itself to watch the great changes which are made in a few months by the ordinary rainfall; and, to mymind, the study would offer a solution to many of the disputed theories of the formation of our alluvial goldfields.
The thermal springs, &c., have generally been at their usual or normal state of activity during the past year. The experiments I carried out in 1888 to make the Pohutu Geyser play more frequently have quite succeeded. It played regularly twice in twenty-four hours from the time the works were finished — September, 1887, to December, 1889 — when it stopped playing altogether. On my return from Europe in February, 1890, being informed that Pohutu had not been in eruption for the last nine weeks, I went over the same day, and, finding that my former works had been tampered with, I had them repaired, and the consequence was that Pohutu played up beautifully, throwing water from 40ft. to 80ft, high for two hours, a few hours afterwards, and it has continued to play twice in twenty-four hours ever since. The works about Pohutu had also the effect of starting a new geyser in the river-bed, known as the “Torpedo,” from the peculiar noise it makes in its explosion under several feet of river-gravel and water.
The experimental works in connection with the acceleration of the new terrace-formation round the Waikite Geyser have also been a success. The rough walls of moss and stones built in September, 1888, are all thoroughly cemented together, and one of them specially is now so completely coated over with stalactites and stalagmites of a siliceous formation that it is difficult to detect anything of the artificial works.
The Oruawhata springs became so quiet about the beginning of last year that at times there was no water discharged, and the Blue Bath could not be kept warm. It occurred to me that perhaps by contracting the orifice of the spring-tube, and extending it upwards, so as to prevent the hot water flowing out of the actual spring from mixing with the cooled water of the pool, I might be able to get it to rise a foot or so, which would enable us to take it direct to the Blue Bath. On experimenting I found that this theory was correct, but instead of a small force I found there was a powerful geyser-action. I thereupon fixed three pipes in the three principal spring-tubes, connected them by a similar number of pipes to three valves, so as to be able to regulate the admission of the cooled water ejected into the different geysers or springs, and I find by these means that I am able to regulate and control the geyser-action at will, causing either one or the other of them to play constantly or intermittently, throwing water as much as 40ft. high, or to reduce it to a mere bubbling hot spring, and even silencing them for two or three months at a time. This novelty of having hot-water fountains or geysers which can be controlled at will in a flower-garden is greatly attracting the attention of visitors. I also notice that this geyser-action ofthe Oruawhata and Pohutu has increased the silicating property of the water. At Pohutu especially the whole area reached by the water is becoming quite white, and the spray has killed the manuka over a large area.
Notwithstanding the length of coast-line, good harbours in this Island are not numerous. Those on the west coast north of New Plymouth are bar-harbours not suitable for large vessels. The principal harbours are the Waitemata Harbour, on which Auckland is situated—this is rather a deep estuary than a harbour; several excellent harbours in the northern peninsula; and Port Nicholson, on the borders of which Wellington is situated. This is a land-locked harbour about 6 miles across, having a comparatively narrow but deep entrance from the ocean. The water is deep nearly throughout.
Cook Strait separates the North and Middle Islands. It is about 16 miles across at its narrowest part, but in the widest about 90. The strait is invaluable for the purpose of traffic between different parts of the colony, and is constantly traversed by vessels of the magnificent line of coastal steamers that trade in the New Zealand waters.
The extreme length of the Middle Island, from Point Jackson, in Cook Strait, to Puysegur Point, at the extreme south-west, is about 525 statute miles; the greatest distance across at any point is in Otago (the southern) District being about 180 miles.
The Middle Island is intersected along almost its entire length by a mountainous range known as the Southern Alps. Some of the summits reach a height of from 10,000ft. to 12,000ft.; Mount Cook, the highest peak, attaining an altitude of 12,349ft.
In the South, in the vicinity of the Sounds and Lake Te Anau, there is a large number of magnificent peaks, which, though they are not of great height, are, owing to their southerly position, nearly all crowned with perpetual ice and snow. Further north the mountains increase in height: Mount Earnslaw, at Lake Wakatipu, and Mount Aspiring, winch has aptly been termed the New Zealand Matterhorn, nearly 10,000ft. in height, at Lake Wanaka. Northward beyond this a fine chain of peaks runs as thebackbone of the South Island to where Mount Cook, or Aorangi, towers majestic in the midst of the grandest scenes of the Southern Alps.
The scenery of the Southern Alps of New Zealand in many instances excels in beauty and grandeur that of the Alps of Switzerland, while in the Southern Alps there is greater variety. In New Zealand no one has actually succeeded in making a complete ascent of any of the highest mountains. Many of the peaks and most of the glaciers are, as yet, unnamed; and there is, in parts of the Middle Island, still a fine field for exploration and discovery — geographical, geological, and botanical. The wonders of the Southern Alps are only beginning to be known; but the more they are known the more they are appreciated. The snow-line in New Zealand being so much lower than in Switzerland, the scenery, though the mountains are not quite so high, is of surpassing grandeur.
There are extensive glaciers on both sides of the range, those on the western side being of exceptional beauty, as, from the greater abruptness of the mountain-slopes on that side, they descend to within about 700ft. of the sea-level and into the midst of the evergreen New Zealand forest vegetation. The largest glaciers on each side of the range are easily accessible.
The following gives the sizes of some of the glaciers on the eastern slope:—
| Name. | Area of Glacier. Acres. | Length of Glacier. Miles ch. | Greatest Width. Miles ch. | Average Width. Miles ch. |
|---|---|---|---|---|
| Tasman | 13,664 | 18 0 | 2 14 | 1 15 |
| Murchison | 5,800 | 10 70 | 1 5 | 0 66 |
| Godley | 5,312 | 8 0 | 1 55 | ] 3 |
| Mueller | 3,200 | 8 0 | 0 61 | 0 50 |
| Hooker | 2,416 | 7 25 | 0 54 | 0 41 |
The Alletsch Glacier in Switzerland, according to Ball in the “Alpine Guide,” has an average width of one mile. It is in length and width inferior to the Tasman Glacier.
Numerous sounds or fiords penetrate the mountains, abutting on the south-western coast, from the sea. They are long, narrow, deep (the depth of water at the upper part of Milford Sound is 1,270ft., although at the entrance only 130ft.), environed by giant mountains clothed with foliageto the snow-line ; their steep sides often apparently within the steamer's length of the deck as she ploughs through their calm solitudes, with waterfalls, glaciers, and snow-fields at every turn. Some of the mountains rise almost precipitously from the water's edge to 5,000ft. and 10,000ft. above the sea. The great Sutherland Waterfall, 1,904ft. high, is in one of these sounds.
The general surface of the northern portion of this Island, comprising the Provincial Districts of Nelson and Marlborough, is mountainous, but the greater part is suitable for grazing purposes. There are some fine valleys and small plains suitable for agriculture, of which the Wairau Valley or Plain is the largest. Deep sounds, extending for many miles, break the coast-line abutting on Cook Strait. The City of Nelson is situated at the head of Blind Bay, which has a depth inwards from Cook Strait of about 40 statute miles.
The Provincial District of Canterbury lies to the south of the Marlborough District, and on the eastern side of the Island. Towards the north the land is undulating; then there is a stretch of almost perfectly level country extending in a south-westerly direction for 160 miles, after which, on the south, the country is undulating as far as the borders of the Otago District. On the east a block of hill-country rises abruptly from the plain and extends for some miles seaward. This is Banks Peninsula, containing several good harbours, the principal being Port Cooper, on the north, on which is situated Lyttelton, the chief port of the district; the harbour of Akaroa, considered one of the finest in the colony is on the southern coast of this peninsula.
The southern district of Otago is on the whole, mountainous, but has many fine plains and valleys suitable for agricultural purposes. The mountains, except towards the west coast, are generally destitute of timber, and are suitable for grazing sheep. There are goldfields of considerable extent in the interior of this district. The interior lakes are very important features in Otago. Lake Wakatipu extends over 54 miles in length, but is not more than 4 miles at its greatest width. It is 1,070ft. abovesea-level, and has a depth varying from 1,170ft. to 1,296ft. It covers an area of 114 square miles. Te Anau Lake, which covers an area of 132 square miles, is larger than Lake Wakatipu. These lakes are bounded on the west by broken, mountainous, and chiefly wooded country, extending to the ocean.
The chief harbours in the Otago District are those of Port Chalmers, at the head of which Dunedin is situated, and the Bluff Harbour at the extreme south.
The District of Westland extends along the west coast of the Middle Island, abreast of the District of Canterbury. This district is more or less auriferous through-out. The western slopes of the central range of mountains are clothed with forest-trees to the snow-line; but on the eastern slopes timber is scarce, natural grasses covering the ground.
The rivers in the Middle Island are for the most part mountain-torrents, fed by glaciers in the principal mountain-ranges. When the snow melts they become of considerable size, and their beds, when not confined by rocky walls, extend over considerable areas, chiefly covered by enormous deposits of shingle. The largest river in the Island and in the colony is the Clutha. It is 154 miles in length, but is only navigable for boats or small river-steamers for about thirty miles. The rivers Buller, Grey, and Hokitika, on the West Coast, are navigable for a short distance from their mouths. They constitute the only ports in the Westland District. In their unimproved state they only admitted, owing to the bars at their mouths, vessels of small draught; but in consequence of the importance of the Grey and Buller Rivers as the only ports available for the coal-export trade, the largest and most important coalfields being in their neighbourhood, large harbour-works have been undertaken, resulting in a deepening of the beds of these rivers, and giving a depth of from 18ft. to 24ft. of water on the bar.
The area of level or undulating land in the Middle Island that may be available for agriculture is estimated at about 15,000,000 acres; about 13,000,000 are suitable for pastoral purposes only, or may become so when cleared offorest and sown with grass seed. The area of barren land and mountain-tops is estimated at about 8,000,000 acres.
Foveaux Strait separates the Middle from Stewart Island. This last island has an area of only 425,390 acres. It is mountainous in character, and chiefly covered with forest.
The outlying group of the Chatham Islands, 480 statute miles east-south-east from Wellington and 536 miles eastward of Lyttelton, consists of two principal islands and several unimportant islets. The largest island contains about 222,490 acres, of which a large and irregularly-shaped lake or lagoon absorbs 45,960 acres. About one quarter of the surface of the land is covered with forest, the rest with fern or grass. The hills nowhere rise to a great height. Pitt Island is the next in size. The area is 15,330 acres. The greater portion of both islands is occupied as sheep-runs.
The only island in any way suitable for settlement in the Kermadec group is Sunday Island, containing 7,800 acres. The highest point rises to an elevation of 1,720ft. The surface of the land is chiefly covered with wood and scrub. The other islands are mere rocks.
The largest of the Auckland Islands, about 27 miles long by about 15 miles broad, is very mountainous, the highest part being 2,000ft. above the sea. The west coast is bold and precipitous, but the east coast has several inlets-There is a good harbour both at the north and south ends. The wood on the island is, owing to the strong prevailing wind, scrubby in character. The New Zealand Government maintains at this island a dépôt of provisions and clothing for the use of shipwrecked mariners. These have already been found of inestimable value by an unfortunate shipwrecked crew condemned to some months' residence on the island.
Neither this nor the rest of the outlying islands of the-colony are suitable for settlement.
Prior to the results of the recent census being ascertained, the population of the colony on the 31st December, 1890, had been estimated as follows:—
| Males. | Females. | Total. | |
|---|---|---|---|
| Population (other than Maoris) | 330,534 | 294,247 | 630,781 |
| Maoris, as at census of 1836 | 22,840 | 19,129 | 41,909 |
| 359,374 | 313,376 | 672,750 |
The results of the census have shown that this estimate was considerably in excess of the real numbers, owing to unrecorded departures from the colony during the five years since the census of 1880 was taken.
An annual estimate of the Maori population cannot be made, as very few of the births or deaths occurring among them are registered; consequently the numbers obtained at one census-period are necessarily used for the purpose of stating the strength of the population until the results of the next census are known. The preliminary statement of the result of the special Maori census recently taken gives 41,523 as the present number of that race, exclusive of those on the Chatham Islands.
Correcting the estimate of population above given by the results of the census, the following may be accepted as the estimated number of the population on the 31st December, 1890:—
| Males. | Females. | Total. | |
|---|---|---|---|
| Population (other than Maoris) corrected from census results) | 332,557 | 292,951 | 625,508 |
| Maoris, as per census, March, 1891 | 22,633 | 18,890 | 41,523 |
| Totals | 355,190 | 311,841 | 667,031 |
[The number of Maoris according to the Census of 1891 cannot be exactly stated for want of returns from the Chatham Islands, which are not yet forthcoming. In 1880 the number was 195, of whom 103 were males and 92 females.]
The following gives the number of the population of the principal divisions of the colony on the 5th April, 1891, according to the results of the recent census:—
| North Island and adjacent islets, exclusive of Maoris | 281,455 |
| Middle Island, Stewart Island, and adjacent islets (exclusive of Maoris) | 344,913 |
| Chatham Islands (exclusive of Natives) | 271 |
| Kermadec Islands | 19 |
| Total for the colony (exclusive of Maoris) | 626,658 |
The increase of population during 1890 was about 9,456, after allowing for a proportion of the unrecorded departures discovered by the census returns. As the number of births exceeded the number of deaths by 12,284, the difference between that number and 9,456 represents the excess of emigration over immigration, amounting to 2,828.
There is good reason to believe that very few of the births or deaths that occur remain unregistered. It follows as a matter of course that where a limit of time is given within which a birth has to be registered there will be occasional instances of neglect of attention to the requirements of the law; but it has been made evident that such neglects are very exceptional, and that the number of unregistered events is so small as not to appreciably affect the numbers given.
The following shows the number of births in excess of the number of deaths in each of the past ten years:—
| 1881 | 13,241 |
| 1882 | 13,308 |
| 1883 | 13,341 |
| 1884 | 14,106 |
| 1885 | 13,612 |
| 1886 | 13,164 |
| 1887 | 12,998 |
| 1888 | 13,194 |
| 1889 | 12,685 |
| 1890 | 12,284 |
It is a very striking fact that in 1890, when the population was greater than in 1881 by nearly 25 per cent., or by nearly 124,598 persons, the excess of births over deaths should have been less than in 1881 by 7 per cent.
The excess of births over deaths in 1890 was equivalent to 1.98 per cent. of the mean population for the year. The actual increase to population was not so great, owing to the number of persons who left the colony having been much greater than the number who came thereto; but if, in future years, the arrivals and departures should be fairly equal, the above rate of natural increase would give a population at the end of 1896 exceeding 700,000.
In only two years in the history of the colony do the official records show that a greater number of persons leftthan arrived: these years were 1888, when 9,175 more persons were known to have left than arrived, and 1890, when the excess of known departures was 1,782; but, from the result of the censuses of 1886 and 1891, it is manifest that, notwithstanding the efforts made to obtain correct statements of the numbers who leave, there has been annually a considerable amount of emigration of which no record is kept. It was apparent from the census results of 1886 that over 7,000 persons, whose departures were not recorded, had left the colony since the census of 1881 was taken. The emigration records were made up from returns supplied by the various shipping companies of persons who had booked their passages. It is, however, a common practice for persons to go on board the intercolonial steamers without previously booking their passages, and pay their passage-money on the voyage. The large unrecorded loss was attributed to this fact; and arrangements were then made with the Union Steamship Company for the purser of each vessel leaving the colony for Australian ports to supply, on his return to the colony, a statement of the actual number of passengers on board the vessel on her outward voyage. These returns have been found of great value for the purpose of correcting the official returns sent by the various Customs officers: and it was hoped that the unrecorded departures would be rendered almost a nil quantity.
The results of the last census have, however, shown that hope to be vain, as the deficiency on the estimate of population amounted to nearly 4,500 persons. No returns are received from the pursers of the Ellis line of steamers, and it is more than probable that numbers have left by that line whose departures have not been recorded. It is even thus difficult to account for the full loss, unless it were the case that other steamers were crowded in excess of the number allowed of which excess no report was made.
The excess of immigration or emigration in each of the past five years according to official records is given herewith:—
| Excess of Immigration. | Excess of Emigration. | |
|---|---|---|
| 1886 | 1,064 | ... |
| 1887 | 977 | ... |
| 1888 | ... | 9,175 |
| 1889 | 214 | ... |
| 1890 | ... | 1,782 |
The net loss by excess of emigration over immigration in the five years was thus apparently 8,702. The actual loss, judging from the census results, was nearly 13,200.
The populations of the several Australasian Colonies (exclusive of the aborigines of Australia) were, according to the preliminary census returns on the 5th April, 1891, as follows:—
| Males. | Females. | Total. | |
|---|---|---|---|
| Queensland | 223,781 | 170,157 | 393,938 |
| New South Wales | 616,008 | 518,199 | 1,134,207 |
| Victoria | 599,172 | 541,233 | 1,140,405 |
| South Australia | 166,374 | 153,632 | 320,006 |
| Western Australia | 29,878 | 19,957 | 49,835 |
| Total Australia | 1,635,213 | 1,403,178 | 3,038,391 |
| Tasmania | 77,560 | 69,107 | 146,667 |
| New Zealand— | |||
| European, Chinese, &c. | 332,877 | 293,781 | 626,658 |
| Maoris | 22,633 | 18,890 | 41,523 |
| Total Australasia | 2,068,283 | 1,784,956 | 3,853,239 |
Excluding the Maori population, the females in the colony are in the proportion of 88.25 to every 100 males. The proportion of females to males is greater in New Zealand than in Queensland, New South Wales, and Western Australia, but less than in Victoria, South Australia, and Tasmania.
| Females to every 100 Males at Census, 1891. | |
|---|---|
| Queensland | 76.04 |
| New South Wales | 84.12 |
| Victoria | 90.16 |
| South Australia | 92.33 |
| Western Australia | 66.79 |
| Tasmania | 89.10 |
| New Zealand | 88.25 |
As the information relating to the birthplaces, religions, ages, &c., of the people, as at the census of 1891, will not be available in time for this publication, it may be found convenient for purposes of reference to reproduce some of the results of the census of 1886.
| Where born. | Males. | Females. | Total. | Persons. Proportions per cent. |
|---|---|---|---|---|
| British possessions— | ||||
| New Zealand | 150,513 | 149,677 | 300,190 | 51.89 |
| Australian Colonies | 8,502 | 8,743 | 17,245 | 2.98 |
| England and Wales | 73,608 | 54,030 | 127,638 | 22.06 |
| Scotland | 31,752 | 23,058 | 54,810 | 9.48 |
| Ireland | 27,932 | 23,476 | 51,408 | 8.89 |
| Other possessions | 2,344 | 1,609 | 3,953 | 0.68 |
| Foreign countries— | ||||
| Germany | 3,255 | 1,752 | 5,007 | 0.86 |
| Denmark and possessions | 1,417 | 761 | 2,178 | 0.38 |
| Sweden and Norway | 2,144 | 633 | 2,777 | 0.48 |
| France and possessions | 551 | 235 | 786 | 0.14 |
| China | 4,532 | 18 | 4,550 | 0.79 |
| Other countries | 3,395 | 1,192 | 4,587 | 0.79 |
| At sea and not specified | 2,276 | 1,077 | 3,353 | 0.58 |
| Totals | 312,221 | 266,261 | 578,482 | 100.00 |
The increase in the proportion, born in the colony in 1886 on that in 1881 was. 6.29. The proportion in 1891 will probably be found to be not less than 58 per Cent.
The following table gives a summary of the results of the census of 1886 regarding the religions of the people, also the proportion of each denomination to the whole population at that and each of the three previous censuses:—
| Denomination. | Number of Adherents in 1886. | Proportions per Cent. of Population. | |||
|---|---|---|---|---|---|
| 1874. | 1878. | 1881. | 1886. | ||
| Church of England, and Protestants undefined | 232,369 | 42.45 | 42.55 | 41.50 | 40.17 |
| Presbyterians | 130,643 | 24.19 | 22.95 | 23.08 | 22.59 |
| Wesleyan Methodists | 45,164 | 7.59 | 7.79 | 8.07 | 7.81 |
| Other Methodists | 10,128 | 0.82 | 1.35 | 1.46 | 1.74 |
| Baptists | 14,357 | 2.12 | 2.21 | 2.34 | 2.48 |
| Congregational Independents | 7,787 | 1.82 | 1.34 | 1.37 | 1.35 |
| Lutherans | 5,917 | 1.31 | 1.36 | 1.18 | 1.02 |
| Salvation Army | 5,276 | ... | ... | ... | 0.91 |
| Society of Friends | 282 | 0.05 | 0.04 | 0.05 | 0.05 |
| Unitarians | 466 | 0.12 | 0.11 | 0.10 | 0.08 |
| Other Protestants | 8,951 | 0.90 | 1.08 | 1.26 | 1.55 |
| Roman Catholics, and Catholics undefined | 80,667 | 13.48 | 14.21 | 14.08 | 13.94 |
| Greek Church | 48 | 0.01 | 0.02 | 0.01 | 0.01 |
| Jews | 1,559 | 0.41 | 0.34 | 0.31 | 0.27 |
| Pagans or Confucians | 4,472 | 1.59 | 1.05 | 1.01 | 0.77 |
| Other denominations | 619 | 0.08 | 0.05 | 0.11 | 0.10 |
| No denomination | 6,046 | 0.43 | 0.53 | 0.89 | 1.05 |
| No religion | 973 | 0.05 | 0.05 | 0.06 | 0.17 |
| Not described | 2,869 | 0.32 | 0.42 | 0.27 | 0.50 |
| Object to-state | 19,889 | 2.26 | 2.55 | 2.85 | 3.44 |
| Totals | 578,482 | 100.00 | 100.00 | 100.00 | 100.00 |
The ascertained Protestants in New Zealand in 1886 amounted to 79.75 per cent. of the whole population. This, however, may be deemed to be considerably below the real proportion, as the persons who object to state their belief are generally Protestants of various denominations having objections to being required to give the information.
The proportion of Roman Catholics is much greater in Australia than in New Zealand. At the census of 1881 it was 27.63 per cent. in New South Wales, 25.47 per cent. in Queensland, 23.60 per cent in Victoria, and 15.23 per cent. in South Australia.
The following shows the number of males and females at each of the age-periods stated, and the proportion of persons at each age-period to the 100 of population at all ages, at the last census:—
| Ages. | Males. | Females. | Total Persons. | Proportion of Persons at each Age-period to every 100 of Total Population. |
|---|---|---|---|---|
| Under 5 years | 43,820 | 43,008 | 86,828 | 15.01 |
| 5 and under 10 years | 42,524 | 41,791 | 84,315 | 14.58 |
| 10 and under 15 years | 34,065 | 33,320 | 67,385 | 11.65 |
| 15 and under 21 years | 34,309 | 35,272 | 69,581 | 12.03 |
| 21 and under 40 years | 86,028 | 69,464 | 155,492 | 26.88 |
| 40 and under 55 years | 50,830 | 30,891 | 81,721 | 14.13 |
| 55 and under 65 years | 12,857 | 7,579 | 20,436 | 3.53 |
| 65 and upwards | 6,003 | 4,430 | 10,433 | 1.80 |
| Unspecified | 1,785 | 506 | 2,291 | 0.39 |
| Totals | 312,221 | 266,261 | 578,482 | 100.00 |
Of the proportion of unspecified persons, 0.37 consisted of those evidently over 21 years of age. Thus, of the total population (exclusive of Maoris), 53.26 per cent. were under 21 years of age. Dealing with the sexes separately, 57.64 per cent. of the females and but 49.57 of the males were under 21. At each year of age under 15, except at the years 1 to 2 and 12 to 13, the males were more numerous than the females; but between the years 15 and 20 the females were more numerous than the males. At 20 to 21 the males were in the, minority, but at all ages above 21 the males were most numerous.
The following shows the proportion per 10,000 persons living at each of the several age-periods mentioned in the Australasian Colonies respectively and in England:—
| Under 15 Years. | 15 to 65 Years. | 65 Years and upwards. | |
|---|---|---|---|
| New Zealand, 1886 | 4,126 | 5,694 | 180 |
| New South Wales, 1881 | 3,987 | 5,768 | 245 |
| Queensland, 1886 | 3,348 | 6,527 | 125 |
| Victoria, 1881 | 3,847 | 5,908 | 245 |
| South Australia, 1881 | 3,885 | 5,879 | 236 |
| Western Australia, 1881 | 3,855 | 5,891 | 254 |
| Tasmania, 1881 | 3,811 | 5,702 | 487 |
| England, 1881 | 3,645 | 5,897 | 458 |
The ages at which males in New Zealand are liable to serve in the Militia are between 17 and 55 years—namely, between 17 and 30 years in the first class, between 30 and 40 years in the second class, and between 40 and 55 in the third class. When the census of 1886 was taken the numbers at these ages (exclusive of Chinese and Maoris) were approximately as follow:—
| Males from 17 to 30 years of age | 65,584 |
| Males from 30 to 40 years of age | 40,328 |
| Males from 40 to 55 years of age | 49,324 |
| Total | 155,236 |
From this the adult foreigners who were not naturalised should be deducted. The male foreigners who were not British subjects (deducting Chinese) numbered 9,177: doubtless these were chiefly adults. The above number of 155,236 may be fairly reduced by 8,000 for the number. On account of the large excess of departures over arrivals of adult males since then, the number at the Militia ages at the present time is doubtless less than in 1886; but until the work of tabulating the results of the recent census has been completed the correct number cannot be ascertained.
There is not in New Zealand, as in each of the other Australasian Colonies, one metropolitan centre of population overshadowing, by comparison, the other towns of the colony. The configuration and physical features of the colony made it specially adapted for the establishment of settlements comparatively remote from one another. As aresult the colony was formerly divided into nine provinces, each having its capital town. Of these, the principal are the Boroughs of Auckland, Wellington, Christchurch, and Dunedin.
Auckland Borough, situate in the northern part of the North Island, had in April, 1891, a population of 28,613. As the population of the suburbs amounted to 22,514, the total population centred in and around Auckland was 51,127.
The Borough of Wellington, the seat of Government, is situated en the border of Port Nicholson, at the southern extremity of the North Island. It contained in April, 1891, a population amounting to 31,021 persons. The suburban population is small, amounting only to 2,203 persons. The whole population in and around Wellington thus numbered 33,224.
The Borough of Christchurch is situated in the Canterbury District of the Middle Island. The recent census returns give a population of 16,223 in that borough, and of 31,623 in the suburbs, in which are included the Boroughs of St. Albans and Sydenham. The total population in the Borough and suburbs of Christchurch was thus 47,846.
The Borough of Dunedin, the principal town of the former Province of Otago, is the centre of a population amounting to 45,865, of which the Borough of Dunedin contained 22,376; and eight surrounding boroughs, which are practically suburbs of Dunedin, 23,489.
The number of persons who arrived in the colony in 1890 was 15,028, a decrease of 364 on the number in 1889. In the immigration returns all persons above the age of 12 years are classified as adults, those under 12 as children. On that basis the number of adults who arrived was 13,319, of whom 8,858 were males and 4,461 were females. The number of children was 1,709, of whom 895 were males and 814 were females.
Of those who arrived, 2,812 came from the United Kingdom, 4,854 from Victoria, 6,147 from New South Wales and Queensland, 14 from South and Western Australia, 524 from Tasmania, 150 from Fiji, 451 from Hawaii (including the arrivals by the mail steamers fromSan Francisco via Hawaii) and the South Seas, and 76 from other ports.
There was not any free immigration in 1890, but 144 persons arrived who were nominated by friends in the colony and whose passages were partially paid for by the Government. Of these, the number of each nationality was as follows: 67 English, 41 Irish, 27 Scotch, 5 German, 3 Danish, and 1 Norwegian. The terms of nomination were that for each adult £10, and for each child between the ages of 1 and 12 years £5, was paid in the colony by friends. The system of nominated immigration was discontinued on the 16th December, 1890.
The number of Chinese who arrived in the colony in 1890 was 18.
In 1881 an Act was passed imposing a tax on every Chinese person landing in the colony, except in the case of any one of a crew of a vessel who might not remain in the colony. The object of the Act was so to restrict the introduction of Chinese as to prevent an increase to that part of the population. The following figures show that the desired effect has been so far obtained. In 1881 the Chinese population amounted to 5,004, in 1886 the number had diminished to 4,542, and when the recent census was taken there were only 4,292 Chinese in the colony.
The following shows the number of arrivals in and departures from the colony of Chinese in each of the past ten years:—
| Year. | Arrivals. | Departures. |
|---|---|---|
| 1881 | 1,029 | 371 |
| 1882 | 23 | 168 |
| 1883 | 44 | 297 |
| 1884 | 84 | 306 |
| 1885 | 94 | 164 |
| 1886 | 239 | 181 |
| 1887 | 354 | 246 |
| 1888 | 308 | 211 |
| 1889 | 16 | 104 |
| 1890 | 18 | 169 |
Restrictive legislation on the immigration of Chinese has been passed in the Australian Colonies as well as in New Zealand. In December, 1881, an Act was passed in NewSouth Wales imposing a poll-tax of £10 per head on Chinese arriving in the colony. In 1888 the amount of the tax was raised to £100; vessels being also prohibited from carrying to the colony more than one Chinese passenger to every 300 tons. As a result the number of Chinese who arrived in the colony in 1889 was only 7, of whom 6 had exemption either as being British subjects, or from having been residents in, but temporarily absent from, the colony. Chinese landing are also prohibited from engaging in mining without express authority under the hand and seal of the Minister of Mines, and are not permitted to become naturalised subjects.
The number of persons whose departures from this colony were recorded was 16,810, of whom 10,809 were males and 6,001 were females, inclusive of 2,147 children under 12 years of age. Of these, 1,863 went direct to the United Kingdom, 4,884 to Victoria, 8,581 to New South Wales and Queensland, 68 to South Australia, 329 to Tasmania, 101 to Fiji, 796 (including passengers for San Francisco) to Hawaii and the South Seas, and 188 to other ports.
There was a known loss by excess of emigration over immigration of 1,782 persons. The actual loss in the year was greater, as it has been previously stated that the census returns are deficient of the estimate by nearly 4,500, to be accounted for by unrecorded departures of persons from the colony in the previous five years. A proportion of these should be added to the ascertained loss in 1890.
There was a gain on passenger traffic with the United Kingdom of 949. This may be accepted as fairly accurate, the elements of disturbance arising only in the traffic between this and the Australian Colonies. There was an ascertained loss of 2,434 on the passenger traffic with New South Wales and Queensland, 30 on that with Victoria, and 54 on that with South and Western Australia; that with Tasmania resulting in a gain of 195 to this colony. It may be reasonably assumed that the bulk of the unrecorded loss has been in the direction of that colony which has absorbed our greatest recorded loss, and that New South Wales has largely benefited by an influx of population from New Zealand. At first it may appear that New Zealand has been a great sufferer through this loss of population. If all the persons who went were of a class that would settle down to country pursuits and help to develop the resources of the colony, that opinion might be well founded; but the large expenditure on public works that has obtained for years has brought to, or developed in, the colony a class of persons living solely by such expenditure, who have realised rates of wages that could not be profitably given by farmers. On the cessation of such expenditure the result might reasonably be expected that numbers, unacquainted with farm-labour and disinclined thereto as being less remunerative than the labour they had been accustomed to, should migrate to places where the prospect of employment by expenditure on public works would be better. If they remained in the colony they would in all probability swell the number of those who call for further public expenditure, and, not being producers, it is questionable whether the loss to the colony in instances like these is such as to be deplored.
The information relating to the number of recorded arrivals and departures is presented in a tabular form:—
| Country. | 1890. | 1889. | ||||
|---|---|---|---|---|---|---|
| Arrivals there-from. | Departures thereto. | Excess of Immigration. | Excess of Emigration. | Excess of Immigration. | Excess of Emigration. | |
| United Kingdom | 2,812 | 1,863 | 949 | .. | 1,236 | .. |
| New South Wales and Queensland | 6,147 | 8,581 | .. | 2,434 | .. | 2,048 |
| Victoria | 4,854 | 4,884 | .. | 30 | 784 | .. |
| South and Western Australia | 14 | 68 | .. | 54 | .. | .. |
| Tasmania | 524 | 329 | 195 | .. | 332 | .. |
| Fiji | 150 | 101 | 49 | .. | 113 | .. |
| Hawaii and South Seas | 451 | 796 | .. | 345 | .. | 60 |
| Other ports | 76 | 188 | .. | 112 | .. | 143 |
| Totals | 15,028 | 16,810 | 1,193 | 2,975 | 2,465 | 2,251 |
The following table shows the recorded movements of population between New Zealand and the United Kingdom, the Australian Colonies and Tasmania, and other places, in each of the past ten years:—
| Arrivals therefrom. | Departures thereto. | |
|---|---|---|
| United Kingdom,— | ||
| 1881 | 3,507 | 669 |
| 1882 | 3,205 | 464 |
| 1883 | 10,398 | 912 |
| 1884 | 9,860 | 1,457 |
| 1885 | 7,241 | 1,857 |
| 1886 | 6,893 | 2,385 |
| 1887 | 4,906 | 2,086 |
| 1888 | 4,138 | 1,964 |
| 1889 | 3,275 | 2,039 |
| 1890 | 2,812 | 1,863 |
| Totals | 56,235 | 15,696 |
| Australian Colonies and Tasmania,— | ||
| 1881 | 5,579 | 6,757 |
| 1882 | 6,975 | 6,297 |
| 1883 | 8,056 | 7,434 |
| 1884 | 9,064 | 8,171 |
| 1885 | 7,899 | 9,103 |
| 1886 | 8,133 | 11,686 |
| 1887 | 8,035 | 9,600 |
| 1888 | 8,784 | 19,649 |
| 1889 | 11,212 | 12,144 |
| 1890 | 11,539 | 13,862 |
| Totals | 85,276 | 104,703 |
| Other places,— | ||
| 1881 | 602 | 646 |
| 1882 | 765 | 695 |
| 1883 | 761 | 840 |
| 1884 | 1,097 | 1,072 |
| 1885 | 1,059 | 735 |
| 1886 | 1,075 | 966 |
| 1887 | 748 | 1,026 |
| 1888 | 684 | 1,168 |
| 1889 | 905 | 995 |
| 1890 | 677 | 1,085 |
| Totals | 8,373 | 9,228 |
In the above period the apparent gain by net immigration was as follows: Males over 12 years of age, 10,350; females over 12 years, 8,683; male children, 697; female children, 527. There was a considerable gain in exchange of population with the United Kingdom, but a loss on that with the Australian Colonies and other places.
| — | Males over 12. | Females over 12. | Males under 12. | Females under 12. | Total. |
|---|---|---|---|---|---|
| Gain on passenger traffic with the United Kingdom, 1881-90 | 18,057 | 13,844 | 4,578 | 4,060 | 40,539 |
| Loss on passenger traffic with the Australian Colonies and Tasmania, 1881-90 | 7,223 | 4,978 | 3,781 | 3,445 | 19,427 |
| Loss on passenger traffic with other ports, 1881-90 | 484 | 183 | 100 | 88 | 855 |
It will be observed, on reference to the previous table, that by far the largest amount of emigration to the Australian Colonies in any one year occurred in 1888, when the expenditure of loan-money by the General Government was reduced to one-half of what it had been in the previous year, 1887.
The following table shows the immigration — distinguishing between the unassisted and the assisted—and the emigration for the past ten years:—
| Year. | Unassisted Immigrants. | Free and Assisted Immigrants. | Total Immigrants. |
|---|---|---|---|
| 1881 | 9,585 | 103 | 9,688 |
| 1882 | 10,219 | 726 | 10,945 |
| 1883 | 13,313 | 5,902 | 19,215 |
| 1884 | 16,133 | 3,888 | 20,021 |
| 1885 | 15,127 | 1,072 | 16,199 |
| 1886 | 15,184 | 917 | 16,101 |
| 1887 | 12,403 | 1,286 | 13,689 |
| 1888 | 13,121 | 485 | 13,606 |
| 1889 | 15,301 | 91 | 15,392 |
| 1890 | 14,384 | 144 | 15,028 |
| Year. | Emigrants. | Excess of Immigrants. | Excess of Emigrants. |
|---|---|---|---|
| 1881 | 8,072 | 1,616 | ... |
| 1882 | 7,456 | 3,489 | ... |
| 1883 | 9,186 | 10,029 | ... |
| 1884 | 10,700 | 9,321 | ... |
| 1885 | 11,695 | 4,504 | ... |
| 1886 | 15,037 | 1,064 | ... |
| 1887 | 12,712 | 977 | ... |
| 1888 | 22,781 | ... | 9,175 |
| 1889 | 15,178 | 214 | ... |
| 1890 | 16,810 | ... | 1,782 |
These numbers' are based on returns sent to this office, but it has been previously stated that the results of the recent census, as also of those of 1886, showed that a large number of persons had left the colony of whose departures there were no records. The estimated unrecorded loss in the above ten years is about 11,694: this would reduce the net gain of population in the ten years from excess of immigration to about 8,563 persons, instead of 20,257 as shown by the above table.
The returns made by the Board of Trade do not distinguish between the departures from the United Kingdom for New Zealand and those for Australia. The departures for Australasia as a whole are only given. In 1890 these amounted to 21,570. The number of persons who arrived in New Zealand direct from the United Kingdom amounted to 2,812, or equal to 13 per cent. of the entire direct emigration from the United Kingdom to the Australasian Colonies. This proportion is greater than in 1889: the number does not represent all the persons who come from the United Kingdom to this colony, as many come viâ the Suez Canal or San Francisco, and thus appear as arrivals from Australia or Hawaii.
There has been a large annual decrease of late years in the number of persons who leave the United Kingdom for these southern colonies.
| Year. | Emigration from United Kingdom to Australasia. | Arrivals in New Zealand from United Kingdom. | Arrivals in New Zealand per 100 Departures for Australasia from United Kingdom. |
|---|---|---|---|
| 1881 | 24,093 | 3,507 | 14.55 |
| 1882 | 38,604 | 3,205 | 8.30 |
| 1883 | 73,017 | 10,398 | 14.24 |
| 1884 | 45,944 | 9,860 | 21.46 |
| 1885 | 40,689 | 7,241 | 17.80 |
| 1886 | 44,055 | 6,893 | 15.65 |
| 1887 | 35,198 | 4,906 | 13.94 |
| 1888 | 31,725 | 4,138 | 13.04 |
| 1889 | 28,334 | 3,275 | 11.36 |
| 1890 | 21,570 | 2,812 | 13.03 |
As the population of New Zealand (exclusive of Maoris) comprises 13.44 per cent. of the population of Australasia, not including Fiji, it would appear as if the attractions of this colony were proportionately less than those of Australia, but, as previously stated, the above numbers do not take account of persons who arrive from England viâ Australia and the United States.
The following shows the immigration and emigration for each of the Australasian Colonies during the year 1890. As there is no record of those who travel overland from one Australian Colony to another, the numbers given refer to those who arrive and depart by sea, except that those for Queensland, New South Wales, and South Australia include arrivals and departures by train across the border. The figures for departures are for all the colonies admittedly imperfect, on account of the number of persons who leave, by sea of whose departure no record is obtained:—
| Colony. | Arrivals, 1890. | Departures, 1890. | Excess of Arrivals over Departures, 1890. |
|---|---|---|---|
* Excess of departures. | |||
| Queensland | 33,005 | 26,656 | 6,349 |
| New South Wales | 140,108 | 110,797 | 29,311 |
| Victoria | 79,777 | 63,820 | 15,957 |
| South Australia | 47,835 | 48,849 | -1,014* |
| Western Australia | 3,567 | 1,996 | 1,571 |
| Tasmania | 29,517 | 27,070 | 2,547 |
| New Zealand | 15,028 | 16,810 | -1,782* |
Aliens residing in the colony may, on taking the oath of allegiance to Her Majesty, obtain letters of naturalisation which entitle them to enjoy all the rights and capacities which a natural-horn subject of the United Kingdom can enjoy or transmit within this colony. 418 aliens were naturalised in 1890.
As the diversity of nationality is considerable, the following statement is given of the number of each:—
| Natives of | |
|---|---|
| Germany | 134 |
| Sweden and Norway | 122 |
| Denmark | 58 |
| Iceland | 1 |
| Italy and Sicily | 18 |
| Austria | 15 |
| Bohemia | 1 |
| Russia | 7 |
| Poland | 3 |
| Finland | 4 |
| Switzerland | 13 |
| France | 11 |
| China | 7 |
| Greece | 6 |
| Portugal and Azores | 4 |
| United States | 4 |
| Turkey and Syria | 5 |
| Netherlands | 3 |
| Roumania | 1 |
| Mexico | 1 |
| Total | 418 |
The number of natives of each country naturalised during the last ten years is shown hereunder:—
| Natives of | |
|---|---|
| Germany 1 | 724 |
| Denmark | 369 |
| Sweden | 273 |
| Norway | 190 |
| China | 176 |
| Switzerland | 87 |
| Italy | 75 |
| Austria-Hungary | 66 |
| France | 28 |
| Finland | 23 |
| Russia | 22 |
| Poland | 13 |
| Holland | 18 |
| Portugal | 17 |
| Greece | 14 |
| United States of America | 11 |
| Belgium | 5 |
| Turkey | 5 |
| Other places | 4 |
| Total | 2,120 |
The natives of Germany comprised 34 per cent. of the number naturalised in the period 1881-90, Swedes and Norwegians 22 per cent., Danes 17 per cent., and Chinese 8 per cent.
The General Assembly was dissolved by Proclamation on the 3rd October, 1890. Immediately prior to that date it consisted of the Legislative Council, Inning 39 members, and the House of Representatives, having 95 members. The members of the Legislative Council hold their seats under writs of summons from the Governor, the appointmentsbeing for life unless vacated by resignation or extended absence. Two of the members of the Council are aboriginal native chiefs. The members of the House of Representatives are elected for a period of three years: 4 of the members were representatives of Native constituencies, 3 members of the Maori districts being aboriginal natives, and 1 a half-caste.
An Act was passed in 1887 which provided that, on the termination of the then General Assembly, the number of members to be thereafter elected to the House of Representatives should be 74 in all, of whom 4 were to be elected under the provisions of the Maori Representation Act, as representatives of Maori electors only.
A general election took place shortly after the dissolution, the results of which were officially notified on the 18th December, 1890. The House of Representatives then consisted of 74 members, of whom 4 (3 Maoris and 1 half-caste) represented Maori constituents.
In 1889 an amendment of the Representation Act was passed, which contained a provision prohibiting any elector giving his vote in respect of more than one electorate at any election. This provision greatly increased the effective power of those voters who were registered for one electorate district only, and resulted in a considerable addition to the number of so-called labour members in the House of Representatives. The proportion of representatives, members of Parliament or Congress, to population in each of the Australian Colonies (exclusive of Maori members and Maori population in New Zealand) and the countries named, at the dates given, was as follows:—
| Country. | Year. | Population. | No. of Members. | Average Number of Population to each Member. |
|---|---|---|---|---|
* Census. | ||||
| New Zealand | 1891* | 626,658 | 70 | 8,952 |
| Queensland | 1891* | 393,938 | 72 | 5,471 |
| New South Wales | 1891* | 1,134,207 | 124 | 9,147 |
| Victoria | 1891* | 1,140,405 | 86 | 13,260 |
| South Australia | 1891* | 320,431 | 52 | 6,162 |
| Tasmania | 1891* | 146,667 | 36 | 4,074 |
| United Kingdom (middle of year) | 1890 | 38,227,321 | 670 | 57,050 |
| France | 1886* | 38,218,903 | 584 | 65,444 |
| United States | 1890* | 62,622,250 | 334 | 187,461 |
The number of the Maori race at the time of the first foundation of the colony was estimated at about 80,000. Twenty years previously the number had been estimated at 100,000. In 1857 the results of an attempted enumeration of the race gave a total of 56,049 of both sexes. Owing to the objections made by the Natives to stating their numbers, and the difficulties experienced in obtaining information in those parts to which the European was not allowed access, the subsequent attempts at enumeration have not been altogether satisfactory, although at every succeeding census the approximation to accuracy becomes greater. The census of 1886 gave the number of 22,840 males and of 19,129 females—a total of 41,969, being a decrease of 2,128, or at the rate of 4.83 per cent. on the number in 1881. The preliminary results of the recent census in 1891 gave the number of males at 22,633 and of females at 18,890—a total of 41,523, or less by only 446 than that in 1886. With respect to this decrease it has to be observed that it was estimated that over 100 Natives were overwhelmed by the mud discharged from Tarawera on the occasion of the eruption on the 10th June, 1886; also that the numbers given do not include the resident Natives of the Chatham Islands, who, through an oversight, were not enumerated. In 1886 the number amounted to 195. Allowing for the loss of life from this exceptional cause, and for the omission stated, the rate of decrease for the five years 1886-91 is enormously reduced on that for the period 1881-86; so much so that the population must lately have been in a stationary condition. The low proportion in 1886 of males and females under 15 years of age to every 100 of the population—viz., 31.82 per cent. in the case of males and 33.59 in that of females—indicated a low birth-rate and a high juvenile mortality, tending to a racial decrease.
On account of the want of records of births and deaths it cannot be stated whether any improvement has occurred in either of these matters, and the ages of the Maoris as in 1891 will not be tabulated in time to be available for this report.
Various causes have been given to account for the decrease in the numbers of the race. Among these arethe following: An excessive infantile mortality, owing to improper food, exposure, want of ordinary care and cleanliness; the constitutions of the parents debilitated by past debauchery; the practice of placing their sick in the hands of the Native doctor (tohunga) instead of applying, until too late, to the medical officer of the district; the sterility induced by the widespread immorality among quite young females before marriage; the partial adoption of European habits and costume, and the continual reversion to the habits and costume of barbarism with a system rendered more susceptible to external influences, especially those of a humid and changeable climate, thereby tending to promote the spread of diseases, notably those affecting the respiratory organs; and to a certain extent the continued intertribal marriages, resulting in diminished fruit-fullness and enfeebled constitutions.
The Maoris show great aptitude for civilisation. They possess fine characteristics, mental and physical, and many rapidly adopt the manners and customs of their civilised neighbours. The Native members of the Legislative Council and the House of Representatives take a dignified, active, and intelligent part in the debates, especially in those having any reference to the interests of their race.
The hostility to the Europeans—which, however, was entertained by only a portion of the race—may be regarded as a thing of the past, and not likely to be revived in an aggressive form, although all the tribes have not fully emerged from the state of isolation with which they have hedged themselves round.
The number of births registered in 1890 was 18,278, being in the proportion of 29.44 per 1,000 of the population. The number of births was less by 179 than in 1889, and the proportion the lowest on record in the colony. The great decrease in the birth-rate is shown in the following table:—-
| Year. | Number of Births. | Births per 1,000 of the Population. |
|---|---|---|
| 1881 | 18,372 | 37.95 |
| 1882 | 19,009 | 37.32 |
| 1883 | 19,202 | 36.28 |
| 1884 | 19,846 | 35.91 |
| 1885 | 19,693 | 34.35 |
| 1886 | 19,299 | 33.15 |
| 1887 | 19,135 | 32.09 |
| 1388 | 18,902 | 31.22 |
| 1889 | 18,457 | 30.07 |
| 1890 | 18,278 | 29.44 |
It will be observed that the number of births was less in 1890 than in 1884 by 1,568. A decrease in the birthrate in a young country is to a certain point a natural result of the increasing proportion of the population under twenty-one years of age, but a decrease in the actual number of births is different from what might reasonably have been looked for. The number of births given in each year is the number that was registered, but there is good reason to believe that very few births remain unregistered, and that the registration may at the present time be deemed as complete as could be expected.
The smaller proportion of wives under forty-five years of age and their higher average age would have an influence in lowering the birth-rate, but it is evident that lessened fertility is only one of the causes of the decrease in operation, another being the decrease in the marriage-rate: probably the most potent is a disinclination to assume the responsibilities and burdens of a large family.
The birth-rate, 29.44 in 1890, is lower than any on record for the whole of England and Wales, although higher than the rates which obtain in some of the counties. The rate was also lower than that (30.1) in Scotland, but considerably higher than that (22.8) in Ireland, in 1889.
The rate in New Zealand in 1890 was the lowest in the Australasian Colonies. The following shows the birth-rates of those colonies in each of the past six years:—
| Colony. | 1885. | 1886. | 1887. | 1888. | 1889. | 1890. |
|---|---|---|---|---|---|---|
| Queensland | 36.66 | 40.21 | 38.09 | 37.77 | 36.27 | 40.95 |
| New South Wales | 37.64 | 37.03 | 36.42 | 36.18 | 33.73 | 35.35 |
| Victoria | 30.74 | 31.23 | 32.39 | 32.49 | 32.95 | 33.60 |
| South Australia | 37.30 | 35.32 | 34.63 | 33.34 | 32.37 | 32.75 |
| Western Australia | 35.22 | 39.21 | 37.34 | 35.88 | 37.14 | 32.55 |
| Tasmania | 35.08 | 34.15 | 33.87 | 33.10 | 31.94 | 33.49 |
| New Zealand | 34.35 | 33.15 | 32.09 | 31.32 | 30.07 | 29.44 |
The male births in New Zealand in 1890 numbered 9,293, and the female 8,985: the proportion was thus 103.43 males to 100 females. In 1889 the proportion was 106.38 males to 100 females. There are on an average more male to female births in all the Australasian Colonies than in England, but the proportion of male births is greater in many of the European States.
There were 190 cases of twin births (380 children) in 1890; there were also two cases of triplet births. The number of children born was 18,278; the number of mothers was 18,084: thus on an average 1 mother in every 95 gave birth to twins. In 1889 the proportion was 1 in 120. and in 1888 it was 1 in 97.
The births of 603 children were illegitimate: thus 10 in every 303, or 33 in every 1,000 children born, were illegitimate.
The following table gives the rates of illegitimacy in each of the Australasian Colonies. The rate of illegitimacy has considerably increased of late years in New Zealand, but it is less than in any other of the Australasian Colonies except South Australia:—
| Year. | Queensland. | New South Wales. | Victoria. | South Australia. | Tasmania. | New Zealand. |
|---|---|---|---|---|---|---|
| 1881 | 4.20 | 4.35 | 5.09 | 2.25 | ... | 2.85 |
| 1882 | 4.40 | 4.26 | 4.75 | 2.25 | 4.40 | 2.87 |
| 1883 | 3.66 | 4.24 | 4.69 | 1.75 | 3.96 | 2.78 |
| 1884 | 4.05 | 4.40 | 4.29 | 2.10 | 4.46 | 2.95 |
| 1885 | 4.08 | 4.60 | 4.36 | 2.42 | 4.55 | 3.20 |
| 1886 | 3.97 | 4.65 | 4.75 | 2.38 | 4.13 | 3.12 |
| 1887 | 4.49 | 4.59 | 4.78 | 2.49 | 3.40 | 3.23 |
| 1888 | 4.13 | 5.08 | 4.80 | 2.67 | 3.62 | 3.05 |
| 1889 | 4.68 | 5.33 | 4.97 | 2.47 | 4.02 | 3.32 |
| 1890 | ... | 5.26 | 5.09 | 2.50 | 4.05 | 3.30 |
The rates in the Colonies of Queensland, New South Wales, and Victoria are somewhat higher than the rate in England, which was 4.59 in 1889.
The average number of children to a marriage may be ascertained by comparing the number of legitimate birthsfor a series of years with the number of marriages during a series of years of the same number, but commencing with the year preceding that for which the first number of births is taken; for, although in the earlier years births will be included that are the fruits of marriages solemnised prior to the commencement of the period, yet there will be omitted the number of children that might be born subsequently to the period, of parents married within the time.
As the records of illegitimate births cannot be accepted as at all reliable prior to 1875, that year has been taken as the starting-point for the calculation:—
| Year. | Marriages. | Legitimate Births. | Proportion of Births to every Marriage solemnised in the Preceding Year. |
|---|---|---|---|
| 1875 | 3,209 | ... | ... |
| 1876 | 3,196 | 16,807 | 5.24 |
| 1877 | 3,114 | 16,505 | 5.16 |
| 1878 | 3,377 | 17,341 | 5.57 |
| 1879 | 3,352 | 17,655 | 5.23 |
| 1880 | 3,182 | 18,870 | 5.63 |
| 1881 | 3,279 | 18,198 | 5.72 |
| 1882 | 3,600 | 18,463 | 5.63 |
| 1883 | 3,614 | 18,668 | 5.19 |
| 1884 | 3,802 | 19,259 | 5.33 |
| 1885 | 3,815 | 19,063 | 5.01 |
| 1886 | 3,489 | 18,697 | 4.90 |
| 1887 | 3,565 | 18,518 | 5.31 |
| 1888 | 3,617 | 18,325 | 5.14 |
| 1889 | 3,632 | 17,845 | 4.93 |
| 1890 | ... | 17,675 | 4.87 |
| Sums and proportion | 51,843 | 271,889 | 5.24 |
The average number of births per marriage was, for the first seven years 5.45, and for the last seven years 5.07, thus showing in the last period a decrease in the number of births to a marriage in the ratio of 7 per cent. In the Australian Colonies a similar decrease is noticeable. The Government Statist of Victoria has remarked that in all the Australasian Colonies, except Tasmania, there is atendency for the average number of children to a marriage to decrease. The average number of children to a marriage is greater in New Zealand than in the other Australasian Colonies. The number given in the Victorian Year-book for each of the colonies named is as follows:—
| — | Victoria. | New South Wales. | Queensland. | South Australia. | Tasmania. |
|---|---|---|---|---|---|
| Mean of numbers for nine years, 1880-88 | 4.20 | 4.70 | 4.63 | 4.69 | 4.43 |
The following statement of the average number of children to a marriage in various European countries is taken from the Victorian Year-book:—
| Children to each Marriage. | |
|---|---|
| Ireland | 5.46 |
| Italy | 4.56 |
| Scotland | 4.43 |
| Holland | 4.34 |
| Belgium | 4.21 |
| England | 4.16 |
| Sweden | 4.01 |
| Denmark | 3.55 |
| France | 2.98 |
With the exception of Ireland, the largest number of children to a marriage in either of the colonies or countries mentioned is in New Zealand; and it appears doubtful whether the number given for Ireland is not too large, as the registration of marriages is not so complete in that country as the registration of births.
The numbers given represent those of children born to a marriage; but a comparison of the strength of families in the different countries cannot well be instituted without taking into consideration the variations in the mortality of children. Some of these variations are thus shown:—
| — | In New Zealand. | In New South Wales. | In Victoria. | In England. |
|---|---|---|---|---|
| Proportion per 1,000 of children born who die under 5 years of age | }121.37 | 173.77 | 178.68 | 233.50 |
Consequently the average number of children in each family living to the age of five years would be, on the basis of the preceding numbers, as follows:—
| New Zealand. | New South Wales. | Victoria. | England. |
|---|---|---|---|
| 4.60 | 3.88 | 3.52 | 3.19 |
or, for every 100 families, there would be the following number of children who had survived the fifth year of age:—
| In New Zealand | 460 |
| In New South Wales | 388 |
| In Victoria | 352 |
| In England | 319 |
The very leading position held by New Zealand is undoubtedly due to the much lower rate of mortality among infants under one year of age.
The number of marriages in 1890 was 3,797, an increase of 165 on the number in 1889. The marriage-rate was 6.12 per 1,000 persons living, both the number of marriages and the rate being greater than in any year since 1885. This rate is below that which obtains in the other Australasian Colonies. The respective rates for these colonies are shown in the following table:—
| Year. | Queensland. | New South Wales. | Victoria. | South Australia. | Western Australia. | Tasmania. | New Zealand. |
|---|---|---|---|---|---|---|---|
| 1881 | 7.70 | 8.26 | 6.79 | 8.00 | 6.60 | 7.39 | 6.64 |
| 1882 | 8.56 | 8.74 | 7.09 | 8.55 | 7.07 | 8.03 | 7.07 |
| 1883 | 8.93 | 8.87 | 7.43 | 8.33 | 6.95 | 9.01 | 6.82 |
| 1884 | 8.91 | 8.49 | 7.73 | 8.13 | 7.11 | 7.81 | 6.87 |
| 1885 | 8.93 | 8.18 | 7.72 | 7.66 | 7.51 | 7.97 | 6.65 |
| 1886 | 8.67 | 7.99 | 7.84 | 6.24 | 7.98 | 7.26 | 5.99 |
| 1887 | 8.21 | 7.42 | 7.62 | 6.31 | 7.58 | 6.71 | 5.97 |
| 1888 | 8.63 | 7.37 | 8.03 | 6.70 | 7.18 | 6.58 | 5.97 |
| 1889 | 8.37 | 6.76 | 8.14 | 6.47 | 6.99 | 6.50 | 5.94 |
| 1890 | 8.49 | 7.14 | 8.21 | 7.06 | 5.80 | 6.64 | 6.12 |
| Means | 8.54 | 7.92 | 7.66 | 7.45 | 7.08 | 7.39 | 6.40 |
The marriage-rate is commonly taken as an index of the prosperity of the people. Assuming the correctness of this view, it appears that during the past ten years there has been a larger measure of general prosperity in all the other colonies than in New Zealand. The marriage-rate isalso less in New Zealand than in most of the European countries.
| England, 1889 | 7.37 |
|---|---|
| Scotland, 1889 | 6.45 |
| Ireland, 1889 | 4.55 |
| Denmark, 1889 | 7.08 |
| Sweden, 1888 | 5.92 |
| Austria, 1889 | 7.49 |
| Hungary, 1888 | 9.26 |
| Switzerland, 1889 | 7.34 |
| German Empire, 1889 | 8.03 |
| Netherlands, 1889 | 6.95 |
| Belgium, 1889 | 7.18 |
| France, 1889 | 7.09 |
| Spain, 1889 | 6.71 |
| Italy, 1889 | 7.48 |
The greatest number of marriages in 1890 occurred in the autumn quarter, ending the 30th June, and the smallest number in the winter quarter, ending the 30th September. Marriages have generally been most numerous in the autumn, or June quarter; next so in the summer quarter, ending the 31st March; next in the spring quarter, ending the 31st December; and least numerous in the winter quarter. In 1890 the experience of former years was maintained.
Of the marriages which were solemnised in 1890, 3,317 were between bachelors and spinsters, 157 between bachelors and widows, 225 between widowers and spinsters, and 98 between widowers and widows. Divorced males and females have been classified as bachelors or spinsters: 8 divorced males and 2 divorced females wore married during the year.
The proportion of each class of marriage to all the marriages approximates very closely from year to year, thus:—
| Marriages between— | 1887. | 1888. | 1889. | 1890. |
|---|---|---|---|---|
| Bachelors and, spinsters | 86.87 | 86.04 | 87.61 | 87.36 |
| Bachelors and widows | 4.57 | 4.75 | 3.61 | 4.13 |
| Widowers and spinsters | 6.12 | 6.47 | 5.97 | 5.93 |
| Widowers and widows | 2.44 | 2.74 | 2.81 | 2.58 |
| 100.00 | 100.00 | 100.00 | 100.00 |
The number of marriages given does not include those between persons both of whom are of the aboriginal native race, these persons being exempted from the necessity of complying with the provisions of the Marriage Act, although they are at liberty to take advantage thereof: but only 11 marriages in which both parties were Maoris were contracted in 1890 in terms of that Act.
Of the marriages in the past year, 21.66 per cent. were solemnised by ministers of the Church of England, 27.59 per cent. by ministers of the Presbyterian Churches, 15.58 per cent. by ministers of the Wesleyan and other Methodist Churches, 10.45 per cent. by ministers of the Roman Catholic Church, 5.27 per cent. by ministers of other denominations, and 19.45 per cent. by Registrars.
There was a decrease, in 1890, on the number and proportion of marriages solemnised by ministers of the Church of England during the previous year, but an increase on the number and proportion of marriages by ministers of other principal denominations and by Registrars.
The following shows the proportions of marriages by ministers of the principal denominations in the past four years, and the proportions of the persons of these denominations to the total population:—
| Denomination. | Percentage of Marriages. | Percentage of Denomination to Total Population in 1886. | |||
|---|---|---|---|---|---|
| 1887. | 1888. | 1889. | 1890. | ||
| Church of England | 21.60 | 21.95 | 23.11 | 21.66 | 40.17 |
| Presbyterians | 24.49 | 24.33 | 26.75 | 27.59 | 22.59 |
| Wesleyan and other Methodists | 14.73 | 14.10 | 15.08 | 15.58 | 9.55 |
| Roman Catholics | 11.81 | 11.69 | 10.40 | 10.45 | 13.95 |
| Other denominations | 4.15 | 5.70 | 5.23 | 5.27 | ... |
| By Registrars | 23.22 | 22.23 | 19.43 | 19.45 | ... |
| 100.00 | 100.00 | 100.00 | 100.00 | ... | |
It will be observed that the proportions of marriages by ministers of the Presbyterian and Wesleyan Churches aregreater than the proportions of the members of these denominations to the total population. It is manifest that the marriages solemnised by them include those of members of other religious bodies, and that the persons married before Registrars to a large extent consist of nominal members of the Church of England. As all marriages between members of the Roman Catholic Church are, by requirement of that Church, solemnised by the ministers thereof, it appears that fewer marriages in proportion to their numbers occur among the members of that Church than among members of other bodies.
Of the men married in 1890, 62, or 16.33 in every 1,000, and, of the women, 78, or 19.23 in every 1,000, signed the register by marks.
The extent of illiteracy in the population measured by the proportion of married persons who affix their marks to instead of signing the marriage register has greatly decreased in the last few years—in the ten years 1881-90 to the extent of about one-half among the males and about three-fifths among the females. This is shown in the following table:—
| Denomination. | 1881. | 1886. | 1890. | |||
|---|---|---|---|---|---|---|
| M. | F. | M. | F. | M. | F. | |
| Church of England | 16.59 | 27.15 | 9.33 | 12.00 | 6.08 | 4.86 |
| Presbyterians | 10.25 | 29.61 | 9.79 | 7.62 | 8.59 | 15.27 |
| Wesleyan and other Methodists | 32.41 | 41.79 | 6.33 | 14.78 | 15.20 | 10.14 |
| Roman Catholics | 117.78 | 133.33 | 46.45 | 65.57 | 35.26 | 42.82 |
| Other denominations | 10.36 | 20.72 | 11.49 | 22.99 | 15.00 | 0.00 |
| By Registrars | 39.22 | 93.51 | 35.98 | 62.03 | 29.77 | 40.60 |
| Total Marriages | 32.04 | 50.20 | 19.21 | 28.96 | 16.33 | 19.23 |
It will be observed that the largest proportion who signed by marks was of Roman Catholics, but the decrease in 1890 on the proportions in 1881 was at the rate of
70 per cent. in the case of the males and of 68 per cent. in the case of females who could not write. The proportion of illiterates was next greatest among those married before Registrars; but it must be remembered that, as previously stated, a large proportion of the persons married before Registrars are nominally members of the Church of England.
Of the persons married in 1890, 72 males and 864 females were under 21 years of age, 9 of the males were between 18 and 19; but 292 of the females were under 19, of whom 1 was under 15, 4 between 15 and 16, and 24 between 16 and 17 years of age. The proportion of males married is greatest at the ages 25 to 30, and that of the females at from 21 to 25 years.
The following are the proportions of men and women at each age-period to every 100 married during the past three years:—
| Age. | 1888. | 1889. | 1890. | |||
|---|---|---|---|---|---|---|
| M. | F. | M. | F. | M. | F. | |
| Under 21 years | 1.85 | 24.30 | 1.63 | 23.02 | 1.89 | 22.75 |
| 21 and under 25 | 28.17 | 42.05 | 27.45 | 44.00 | 27.84 | 44.38 |
| 25 and under 30 | 33.81 | 21.15 | 34.22 | 20.54 | 35.11 | 20.49 |
| 30 and under 40 | 26.02 | 8.98 | 26.21 | 9.09 | 25.15 | 8.77 |
| 40 and under 50 | 6.69 | 2.74 | 7.65 | 2.64 | 6.77 | 2.71 |
| 50 and under 60 | 2.52 | 0.61 | 2.04 | 0.55 | 2.53 | 0.61 |
| 60 and under 70 | 0.88 | 0.14 | 0.63 | 0.16 | 0.55 | 0.26 |
| 70 and upwards | 0.06 | (one) | 0.17 | ... | 0.16 | (one) |
Registrars of Marriages in New Zealand are prohibited by law from issuing certificates for the marriage of minors without the consent of their parents or lawful guardians, if there be any in the colony. If a declaration be made in any case that there is no parent or lawful guardian in the colony, then a certificate may be issued after the expiration of fourteen days following the date on which the notice of intended marriage is given.
A marriage may not be solemnised in New Zealand except after the delivery to the minister or Registrar whoofficiates of a certificate issued by a Registrar, authorising such marriage, and if any person knowingly and wilfully intermarry without such certificate the marriage is null and void; and no clergyman or minister of any denomination is empowered to solemnise marriages until his name has been placed on the Registrar-General's list of officiating ministers for the year.
The ages at which persons may contract binding marriages are the same as in England—namely, 12 years for females and 14 for males. Marriage may be contracted at earlier ages than those stated, but would be voidable at the discretion of either of the parties upon reaching the age of 12 or 14, as the case may be, and without the necessity of proceedings in Court.
The following statement gives the ages at which persons can contract binding marriages in each of the countries named:—
| Country. | Males. Age. | Females. Age. |
|---|---|---|
* Roman Catholics and Orthodox Greek Church. † Protestants. ‡ Dispensation for serious motives. § Dispensation possible, but rare. || Varying in different cantons. | ||
| Austria | 14* | 12* |
| 18† | 15† | |
| Belgium | 18 | 15‡ |
| Denmark | 20 | 16† |
| France | 18 | 16§ |
| Greece | 15 | 12 |
| Italy | 18 | 15 |
| Netherlands | 18 | 16 |
| Portugal | 14 | 12 |
| Prussia | 18 | 14 |
| Russia (generally) | 18 | 16 |
| Norway | 20 | 16 |
| Sweden | 21 | 15 |
| Switzerland | 14-20 | 12-18|| |
The average age of the males in this colony who married in 1890 was 29.73 years, and of the females 24.90 years. In England the mean age of those whose ages were stated was 28.28 years for men, and 25.95 years forwomen. Thus the average age at which men many is higher in the colony than in England, but that of the women is lower.
The proportion of males under 21 who marry in England is much greater than in New Zealand; but the proportion of females under 21 who marry is much greater in the colony.
In 1889, in England, of every 1,000 males married whose ages were stated, 61 were under 21 years of age, and of every 1,000 females 199 were under 21 years of age, In New Zealand, in 1890, the proportions were 19 males and 227 females in every 1,000 married. While in New Zealand the proportion of bridegrooms under 21 years of age fluctuates within narrow limits, the proportion of brides under 21 years of age is steadily decreasing: this is shown by the following proportions for each sex under 21 years of age in every 100 married:—
| Year. | Bridegrooms under 21 in every 100. | Brides under 21 in every 100. |
|---|---|---|
| 1881 | 1.95 | 29.08 |
| 1882 | 1.80 | 29.39 |
| 1883 | 1.52 | 27.18 |
| 1884 | 1.87 | 27.10 |
| 1885 | 1.97 | 26.49 |
| 1886 | 1.95 | 26.09 |
| 1887 | 1.91 | 25.49 |
| 1888 | 1.85 | 24.30 |
| 1889 | 1.62 | 23.02 |
| 1890 | 1.89 | 22.75 |
The deaths in 1890 numbered 5,994, being equivalent to a rate of 9.66 in every 1,000 persons living. This is higher than the rate (9.44) in 1889; but, with the exception of the rates in 1888 and 1889, the death-rate in 1890 was the lowest on record.
The death-rate in New Zealand contrasts very favourably with those in the other Australasian Colonies and in European countries, and furnishes evidence of the great salubrity of the climate of the colony. The following table gives the death-rates for a series of years in the several countries named:—
| Country. | 1881. | 1882. | 1883. | 1884. | 1885. | 1886. | 1887. | 1888. | 1889. | 1890. |
|---|---|---|---|---|---|---|---|---|---|---|
| New Zealand | 11.13 | 11.19 | 11.45 | 10.39 | 10.76 | 10.54 | 10.29 | 9.43 | 9.44 | 9.60 |
| Queensland | 15.02 | 17.99 | 18.82 | 22.97 | 19.58 | 17.29 | 14.56 | 14.66 | 15.44 | 14.98 |
| New South Wales | 15.17 | 16.12 | 14.68 | 16.14 | 16.41 | 14.89 | 13.15 | 13.54 | 13.42 | 12.90 |
| Victoria | 14.16 | 16.23 | 14.28 | 14.46 | 14.98 | 15.15 | 15.70 | 15.34 | 17.54 | 16.10 |
| South Australia | 13.90 | 14.84 | 14.55 | 15.24 | 12.48 | 13.38 | 12.77 | 12.52 | 11.49 | 12.40 |
| Western Australia | 13.80 | 14.16 | 17.93 | 21.87 | 17.61 | 21.56 | 16.83 | 15.91 | 14.19 | 11.20 |
| Tasmania | 14.77 | 15.79 | 17.06 | 15.50 | 15.40 | 14.58 | 15.45 | 14.11 | 14.10 | 14.74 |
| England | 18.9 | 19.6 | 19.5 | 19.5 | 19.0 | 19.3 | 18.8 | 17.8 | 17.9 | ... |
| Scotland | 19.3 | 19.3 | 20.1 | 19.4 | 19.1 | 18.6 | 18.7 | 17.6 | 18.0 | ... |
| Ireland | 17.5 | 17.4 | 19.2 | 17.6 | 18.4 | 17.9 | 18.3 | 18.0 | 17.5 | ... |
| Denmark | 18.3 | 19.3 | 18.4 | 18.4 | 17.9 | 18.2 | 18.3 | 19.7 | 18.6 | ... |
| Norway | 16.8 | 18.4 | 17.1 | 16.4 | 16.5 | 16.1 | 16.0 | 16.9 | 17.4 | ... |
| Sweden | 17.7 | 17.4 | 17.3 | 17.5 | 17.8 | 16.6 | 16.1 | 16.0 | ... | ... |
| Austria | 30.6 | 30.8 | 30.1 | 29.2 | 29.9 | 29.4 | 28.9 | 29.2 | 27.3 | ... |
| Hungary | 34.4 | 35.3 | 32.0 | 30.8 | 31.6 | 31.4 | 33.5 | 31.7 | ... | ... |
| Switzerland | 22.4 | 21.9 | 20.4 | 20.2 | 21.3 | 20.7 | 20.2 | 19.9 | 20.3 | ... |
| German Empire | 25.5 | 25.7 | 25.9 | 26.0 | 25.7 | 26.2 | 24.2 | 23.8 | 23.8 | ... |
| Netherlands | 21.5 | 20.7 | 21.8 | 22.2 | 21.0 | 21.5 | 19.7 | 20.4 | 20.1 | ... |
| France | 22.0 | 22.2 | 22.2 | 22.2 | 21.9 | 22.5 | 22.0 | 21.8 | 20.5 | ... |
| Italy | 27.6 | 27.5 | 27.5 | 26.7 | 26.6 | 28.3 | 27.5 | 27.0 | 24.9 | ... |
The comparison of the above rates appears to place the Australasian Colonies as a whole in the foremost place for salubrity of climate and healthiness of people, New Zealand taking the lead by a wide interval; but it has been shown in previous reports that a mere death-rate calculated on the whole population—that is, the proportion of all deaths to the 1,000 of population living in the middle of the year—although a very fair index of the sanitary condition of the same country if compared from year to year, and also useful for comparing the healthiness of different countries' whose respective populations contain a fairly-equal proportionate number of persons living at each age-period of life, cannot be regarded as a fair index of the comparative healthiness of new and old countries, or even of that of new countries one with another, when the relative proportions living at the several age-periods vary considerably.
The truest rates of mortality are., obtained by ascertaining the proportion of deaths of persons of certain ages to the numbers living at those ages; but, as information respecting the ages of the people is only obtained when a census is taken, correct rates on this basis can only be obtained after a census.
In practice, the use of so many rates would be productive of extreme inconvenience, and for a single form of death-rate for purposes of comparison the death-rate designated by the, Victorian Statist, as the “adjusted death-rate” appears the most suitable. There is, however,this objection to it: that, being based on the mortality experienced at respective age-periods, it can only be correctly ascertained immediately after a census has been taken, when the numbers living at each age of life are ascertainable; but it would be more or less incorrect for intermediate years. For the purpose of constructing this-death-rate it is necessary, to select a population in which the conditions as to age are of a normal character, and free from the fluctuations incident to the growth of the population of a new country. That of England and Wales appears to be such an one: it may be described as the model population. The number living in every 10,000 persons in England and Wales when the last census was taken, at each of the several quinquennial age-periods up to 25, and at each of the decennial periods 25 to 75, and for the period 75 and upwards, is first ascertained. Then the actual death-rate per 1,000 persons living at each of those age-periods in the colony or country under consideration is used as a basis to find what the number of deaths-would be for the numbers given at each age-period in the model population. The result represents the total number of deaths in the colony in every 10,000 persons living in the proportions as to the age-periods given in the model population.
The following table illustrates the method adopted:—
| Ages. | Model Population, being Actual Proportions per 10,000 Persons in England and Wales at the Census of 1881. | New Zealand Death-rates experienced in Census-year 1886. | Deaths in Model Population according to-Bates in Previous Column. |
|---|---|---|---|
| Under 5 years | 1,356 | 28.52 | 38.673 |
| 5 and under'10 years | 1,212 | 8.06 | 3.709 |
| 10 and under 15 years | 1,078 | 2.46 | 2.652 |
| 15 and under 20 years | 981 | 3.45 | 3.384 |
| 20 and under 25 years | 896 | 5.11 | 4.579 |
| 25 and under 35 years | 1,460 | 6.07 | 8.862 |
| 35 and under 45 years | 1,132 | 7.87 | 8.909 |
| 45 and under 55 years | 837 | 11.87 | 9.935 |
| 55 and under 65 years | 591 | 27.77 | 16.412 |
| 65 and under 75 years | 328 | 46.47 | 15.242 |
| 75 and upwards | 129 | 123.16 | 15.888 |
| Totals | 10,000 | 128.245 |
This amounted to a rate at all ages of 12.82 per 1,000 of the New Zealand population in 1886, grouped in the proportions at each age-period according to the numbers in the model population. The death-rate for that year, calculated according to the ordinary method, was 10.54, which, to the extent of the difference between 10.51 and 12.82, was erroneous for the purpose of comparison with the death-rate of such a population as that of England and Wales. Although, on account of the normal condition of the population, the ordinary annual death-rate in England, and probably also in most of the European countries, may be considered as equivalent to an adjusted rate constructed in the above manner, yet, as has been previously stated, this is not the case in young countries, and in them such adjusted rate can only be made correctly at long intervals. But the difference shown in the above two rates—2.28 per 1,000 persons—affords some index of the measure of addition to be made to the New Zealand rate when it is compared with that of England.
It is not considered expedient to make further calculations as to the death-rates at age-periods in New Zealand and the Australian Colonies until information as to the numbers living at each age-period, obtained at the recent census, is made public. The results of calculations in former years show that the mortality of children under 5 years of age is very much lower in New Zealand than in either of the other of the Australasian Colonies, and only about half that in England. To this fact New Zealand is chiefly indebted for her low average death-rate. The absence of the same proportion of old people that obtains in England, and among whom the mortality is relatively very great, also has the effect of helping to keep down the rate in this and the Australian Colonies.
Of the persons who died in 1890, 233 males and 167 females were at or over 75 years of age. Of these, 112 males and 69 females were under 80 years of age, 65 males and 66 females were at and over 80 and under-85 years of age, 44 males and 27 females were from 85 to under 90, 9 males and 3 females were from 90 to 95, 2males and 1 female between 95 and 100 years, and 1 male reached the age of 101.
The combined ages of all the males who died amounted to 117,206 years, and those of the females to 72,111 years, giving an average age at death of 33.81 years for the males and 28.62 years for the females.
The average age at death of persons of each sex, in each of the past four years, was as follows:—
| Males. | Females. | |
|---|---|---|
| 1887 | 28.78 years | 23.37 years |
| 1888 | 32.16 years | 27.85 years |
| 1889 | 32.29 years | 27.69 years |
| 1890 | 33.81 years | 28.62 years |
More males than females are born annually, and more male than female infants die in proportion to the number of each sex born. In 1890, the number of male children born was 9,293, and the number of deaths of male infants under 1 year of age was 775, being at the rate of 83 in every 1,000 born; the number of females born was 8,985, and the number that died under 1 year of age was 663, being in the proportion of 74 in every 1,000 born.
The following gives the proportion of deaths of male and female infants at the ages stated to the 1,000 births of each sex respectively for the year 1890, and also the numbers and averages for the ten years 1881-90:—
| Year. | Sex. | Under 1 month. | 1 and under 3 months. | 3 and under 6 mouths. | 6 and under 12 months. | Total under 12 months |
|---|---|---|---|---|---|---|
* Total number of births, 96,931 males and 93,212 females. | ||||||
| DEATHS TO THE 1,000 BIRTHS. | ||||||
| 1890 | Male | 28.73 | 16.26 | 17.86 | 20.55 | 83.40 |
| Female | .49 | 12.13 | 14.35 | 20.81 | 73.78 | |
| NUMBER OF DEATHS. | ||||||
| Ten years, 1881-90* | Male | 3,101 | 1,769 | 1,941 | 2,368 | 9,179 |
| Female | 2,365 | 1,440 | 1,598 | 2,075 | 7,478 | |
| DEATHS TO THE 1,000 BIRTHS. | ||||||
| Ten years, 1881-90 | Male | 31.99 | 18.25 | 20.02 | 24.43 | 94.69 |
| Female | 25.37 | 15.45 | 17.14 | 22.26 | 80.22 | |
The mortality of male infants in 1890 was at each period of life specified much below the average for the past ten years, but the mortality of female infants was greater than the average for the first month, and afterwards much less. The probability of living during the first year of age is much greater in favour of female than of male infants. The result of the past ten years shows that in equal numbers born there are—
| 100 deaths of males to 79.31 deaths of females under 1 month of age; |
| 100 deaths of males to 84.66 deaths of males from 1 to 3 months of age; |
| 100 deaths of males to 85.61 deaths of males from 3 to 6 months of age; |
| 100 deaths of males to 91.12 deaths of males from 6 to 12 months of age; |
| 100 deaths of males to 84.72 deaths of males under 12 months of age. |
It will be observed that the proportionate mortality among male infants is greatest during the first month of life, and gradually diminishes after that time.
The rates of infantile mortality—that is, the proportion the deaths of children under 1 year of age bear to the births—are higher in the Australian Colonies than in New Zealand. The following table gives the rate in each of the colonies named for each of the ten years 1881-90:—
| Year. | Queensland. | New South Wales. | Victoria. | South Australia. | Tasmania. | New Zealand. |
|---|---|---|---|---|---|---|
| 1881 | 11.17 | 11.56 | 11.49 | 12.74 | 10.34 | 9.24 |
| 1882 | 13.95 | 13.12 | 13.91 | 15.19 | 10.36 | 8.83 |
| 1883 | 13.34 | 11.48 | 11.44 | 14.56 | 12.39 | 10.39 |
| 1884 | 14.74 | 12.62 | 11.37 | 13.42 | 9.98 | 7.93 |
| 1885 | 14.85 | 13.12 | 12.57 | 11.34 | 11.26 | 8.92 |
| 1886 | 12.59 | 12.85 | 12.73 | 12.62 | 10.48 | 9.84 |
| 1887 | 11.29 | 10.59 | 13.00 | 11.12 | 10.09 | 9.38 |
| 1888 | 12.07 | 11.09 | 12.75 | 9.59 | 9.43 | 7.07 |
| 1889 | 13.62 | 12.50 | 15.21 | 9.42 | 10.64 | 7.89 |
| 1890 | .. | 10.45 | 11.74 | 9.65 | 10.55 | 7.87 |
Infantile mortality is as a rule greatest in the large towns, where the population is dense and the sanitary conditionsare less favourable than in country districts. The absence in New Zealand of any such large centres of population as obtain in some of the Australian Colonies may partially account for the lower rates of infantile mortality in this colony. The following shows the proportion of infantile deaths to births in each of the four principal boroughs in New Zealand during the past five years:—
| Boroughs. | 1886. | 1887. | 1888. | 1889. | 1890. |
|---|---|---|---|---|---|
| Auckland | 17.31 | 14.40 | 11.36 | 10.80 | 9.89 |
| Wellington | 17.26 | 16.16 | 10.41 | 12.42 | 9.77 |
| Christchurch | 15.03 | 12.25 | 13.23 | 13.11 | 11.94 |
| Dunedin | 11.25 | 10.09 | 7.30 | 9.59 | 8.22 |
The great decrease in these rates in 1890 compared with those in 1886 evidences great improvements in the sanitary conditions in these several boroughs. The saving of life resulting from the smaller rates of infantile mortality in 1890 on those in 1887 (the mortality in 1886 having been exceptionally great, the next year is selected for the purpose of comparison) amounts to a difference of 112 children: that is, if the mortality among infants had been as great in proportion to the number of births in 1890 as in 1887, there would have been 112 more deaths of children in these boroughs in 1890 than actually occurred.
The following statement gives the classification of diseases, with the percentage of deaths therefrom to the total mortality, and the proportion to the 10,000 of population in each class and order, in the years 1888, 1889, and 1890:—
| Class and Order. | Per 100 Deaths. | Per 10,000 of the Population. | ||||
|---|---|---|---|---|---|---|
| 1888. | 1889. | 1890. | 1888. | 1889. | 1890. | |
| Class I.—Specific Febrile or Zymotic Diseases— | ||||||
| Order 1. Miasmatic diseases | 6.90 | 4.96 | 7.62 | 6.51 | 4.66 | 7.36 |
| Order 2. Diarrhæal diseases | 3.75 | 6.15 | 4.84 | 3.53 | 5.78 | 4.67 |
| Order 3. Malarial diseases | .. | 0.06 | 0.02 | .. | 0.07 | 0.02 |
| Order 4 Zoogenous diseases | .. | .. | .. | .. | .. | .. |
| Order 5. Venereal diseases | 0.26 | 0.31 | 0.30 | 0.25 | 0.29 | 0.29 |
| Order 6. Septic diseases | 1.32 | 1.27 | 0.95 | 1.24 | 1.19 | 0.92 |
| Total Class I. | 12.23 | 12.75 | 13.73 | 11.53 | 11.99 | 13.26 |
| Class II.—Parasitic Diseases | 0.35 | 0.28 | 0.33 | 0.33 | 0.26 | 0.32 |
| Class III.—Dietetic Diseases | 0.82 | 1.02 | 0.77 | 0.78 | 0.96 | 0.74 |
| Class IV.—Constitutional Diseases | 17.85 | 17.52 | 17.80 | 16.83 | 16.47 | 17.19 |
| Class V.—Developmental Diseases | 7.81 | 7.43 | 7.96 | 7.37 | 6.99 | 7.68 |
| Class VI.—Local Diseases— | ||||||
| Order 1. Diseases of nervous system | 11.98 | 10.95 | 11.19 | 11.30 | 10.30 | 10.81 |
| Order 2. Diseases of organs of special sense | 0.05 | 0.12 | 0.15 | 0.05 | 0.11 | 0.14 |
| Order 3. Diseases of circulatory system | 8.52 | 9.20 | 7.56 | 8.03 | 8.65 | 7.30 |
| Order 4. Diseases of respiratory system | 12.93 | 11.94 | 12.61 | 12.19 | 11.22 | 12.18 |
| Order 5. Diseases of digestive system | 8.46 | 8.85 | 9.23 | 7.98 | 8.33 | 8.91 |
| Order 6. Diseases of lymphatic system and ductless glands | 0.16 | 0.10 | 0.15 | 0.15 | 0.10 | 0.14 |
| Order 7. Diseases of urinary system | 2.61 | 3.14 | 2.67 | 2.46 | 2.95 | 2.58 |
| Order 8. Diseases of reproductive system— | ||||||
| (a) Of organs of generation | 0.34 | 0.47 | 0.43 | 0.31 | 0.44 | 0.42 |
| (b) Of parturition | 1.26 | 0.92 | 1.34 | 1.19 | 0.86 | 1.29 |
| Order 9. Diseases of organs of locomotion | 0.37 | 0.40 | 0.23 | 0.35 | 0.37 | 0.22 |
| Order 10. Diseases of integumentary system | 0.33 | 0.24 | 0.35 | 0.31 | 0.23 | 0.34 |
| Total Class VI. | 47.01 | 46.33 | 45.91 | 44.32 | 43.56 | 44.33 |
| Class VII.—Violence— | ||||||
| Order 1. Accident or negligence | 8.22 | 7.83 | 7.51 | 7.75 | 7.37 | 7.25 |
| Order 2. Homicide | 0.09 | 0.17 | 0.11 | 0.08 | 0.16 | 0.11 |
| Order 3. Suicide | 0.68 | 0.80 | 1.07 | 0.64 | 0.75 | 1.03 |
| Order 4. Execution | ||||||
| Total Class VII. | 8.99 | 8.80 | 8.69 | 8.47 | 8.28 | 8.39 |
| Class VIII.—Ill-defined and Not-specified Causes | 4.94 | 5.87 | 4.81 | 4.66 | 5.52 | 4.64 |
The following gives the causes of death, in 1890, in order of their fatality:—
| — | Males. | Females. | Total. |
|---|---|---|---|
| Phthisis | 298 | 222 | 520 |
| Accidents | 372 | 78 | 450 |
| Endocarditis, valvular disease, pericarditis | 191 | 130 | 321 |
| Cancer | 156 | 139 | 295 |
| Pneumonia | 188 | 106 | 294 |
| Bronchitis | 164 | 119 | 283 |
| Diarrhæa | 136 | 108 | 244 |
| Debility, atrophy, inanition | 129 | 111 | 240 |
| Old age | 125 | 94 | 219 |
| Premature birth | 109 | 96 | 205 |
| Enteric (typhoid), and simple and ill-defined fever | 72 | 77 | 149 |
| Convulsions | 73 | 71 | 144 |
| Apoplexy | 82 | 55 | 137 |
| Hemiplegia, paralysis of insane | 88 | 49 | 137 |
| Enteritis | 76 | 58 | 134 |
| Diphtheria | 54 | 62 | 116 |
| Diseases of liver (including cirrhosis, 26) | 69 | 42 | 111 |
| Inflammation of the brain and its membranes | 56 | 43 | 99 |
| Childbirth and puerperal fever | 99 | 99 | |
| Whooping-cough | 32 | 50 | 82 |
| Bright's disease | 53 | 25 | 78 |
| Influenza | 46 | 24 | 70 |
| Diseases of respiratory organs not herein particularised | 41 | 26 | 67 |
| Diseases of stomach, gastritis | 35 | 30 | 65 |
| Suicide | 52 | 12 | 64 |
| Peritonitis | 26 | 31 | 57 |
| Dentition | 30 | 25 | 55 |
| Rheumatic fever, rheumatism | 23 | 28 | 51 |
| Tuberculosis not particularised herein, scrofula | 21 | 27 | 48 |
| Ill-defined causes not particularised herein | 36 | 12 | 48 |
| Diseases of digestive system not otherwise specified | 25 | 23 | 48 |
| Diseases of the nervous system not otherwise specified | 29 | 19 | 48 |
| Tubercular meningitis, acute hydrocephalus | 24 | 23 | 47 |
| Croup | 23 | 19 | 42 |
| Diabetes mellitus | 23 | 15 | 38 |
| Syncope | 16 | 21 | 37 |
| Patty degeneration of the heart | 19 | 16 | 35 |
| Ileus, obstruction of intestines | 18 | 17 | 35 |
| Tabes mesenterica, tubercular peritonitis | 19 | 16 | 35 |
| Congenital defects | 17 | 16 | 83 |
| Intemperance | 24 | 8 | 32 |
| Scarlet fever, scarlatina | 19 | 12 | 31 |
| Diseases of the spinal cord, paraplegia | 23 | 7 | 30 |
| Softening of the brain | 18 | 12 | 30 |
| Dysentery | 19 | 11 | 30 |
| Aneurism | 25 | 4 | 29 |
| Epilepsy | 16 | 12 | 28 |
| Laryngitis | 14 | 11 | 25 |
| Pleurisy | 14 | 10 | 24 |
| Diseases of urinary system not particularised herein | 17 | 7 | 24 |
| Diseases of bladder and prostate | 19 | 4 | 23 |
| Erysipelas | 9 | 12 | 21 |
| Atelectasis | 11 | 9 | 20 |
| Diseases of circulatory system not otherwise mentioned | 12 | 7 | 19 |
| Acute nephritis | 9 | 9 | 18 |
| Anæmia, chlorosis, leucocythæmia | 10 | 8 | 18 |
| Pyæmia, septicæmia | 6 | 11 | 17 |
| Hernia | 7 | 9 | 16 |
| Simple cholera | 6 | 10 | 16 |
| Want of breast-milk | 7 | 7 | 14 |
| Asthma | 9 | 4 | 13 |
| Sore throat, quinsy | 8 | 5 | 13 |
| Hypertrophy of heart | 7 | 5 | 12 |
| Thrush | 7 | 5 | 12 |
| Diseases of uterus and vagina | 11 | 11 | |
| Syphilis | 5 | 5 | 10 |
| Ovarian disease | 10 | 10 | |
| Cerebro-spinal meningitis | 2 | 7 | 9 |
| Idiopathic tetanus | 4 | 5 | 9 |
| Diseases of ear and eye | 6 | 3 | 9 |
| Intussusception of intestine | 8 | 1 | 9 |
| Diseases of lymphatic system and ductless glands | 4 | 5 | 9 |
| Eczema | 6 | 3 | 9 |
| Uræmia | 5 | 4 | 9 |
| Diseases of larynx and trachea not otherwise mentioned | 5 | 3 | 8 |
| Diseases of integumentary system not otherwise mentioned | 7 | 1 | 8 |
| Gonorrhæa, stricture of urethra, ulcer of groin | 8 | 8 | |
| Constitutional diseases not otherwise mentioned | 5 | 3 | 8 |
| Caries, necrosis | 7 | 7 | |
| Ulceration of intestines | 2 | 5 | 7 |
| Murder, manslaughter | 5 | 2 | 7 |
| Mumps | 2 | 3 | 5 |
| Worms | 1 | 4 | 5 |
| Gout | 4 | 1 | 5 |
| Diseases of organs of locomotion not otherwise mentioned | 5 | 5 | |
| Ulcer, bed-sore | 3 | 1 | 4 |
| Calculus | 3 | 1 | 4 |
| Suppression of urine | 2 | 2 | 4 |
| Hydatids | 2 | 1 | 3 |
| Stomatitis, cancrum oris | 2 | 1 | 3 |
| Pelvic abscess | 2 | 1 | 3 |
| Typhus fever | 2 | 2 | |
| Rickets | 2 | 2 | |
| Arthritis, ostitis | 2 | 2 | |
| Disorders of menstruation | 2 | 2 | |
| Chicken-pox | 1 | 1 | |
| Measles | 1 | 1 | |
| Remittent fever | 1 | 1 |
The deaths in 1890 from specific febrile or zymotic diseases amounted to 823, being in the proportion of 132 in every 100,000 persons living—an increase of 87 in the number and of 12 in the proportion to population over 1889. There was a large increase in the number of deaths from influenza, whooping-cough, and enteric fever, but a decrease in the number from diarrhæal diseases.
The following are the diseases in this class which caused the greatest mortality in the past six years.—
| Diseases. | 1885. | 1886. | 1887. | 1888. | 1889. | 1890. |
|---|---|---|---|---|---|---|
| Measles | 1 | 49 | 28 | 5 | 2 | 1 |
| Scarlet fever and scarlatina | 12 | 7 | 18 | 21 | 19 | 31 |
| Diphtheria | 104 | 78 | 92 | 143 | 113 | 116 |
| Whooping-cough | 91 | 132 | 138 | 72 | 19 | 82 |
| Influenza | 5 | 11 | 9 | 9 | 9 | 70 |
| Diarrhæal diseases | 399 | 455 | 475 | 214 | 355 | 290 |
| Enteric or typhoid fever | 118 | 123 | 158 | 130 | 118 | 145 |
| Puerperal fever | 48 | 33 | 24 | 39 | 25 | 19 |
Attention was drawn last year to the absence of smallpox as a cause of death, and, probably owing to the immunity the colony has had from that disease, to the increasing neglect of the precautionary measure of vaccination. In 1889 the number of children under 1 year of age successfully Vaccinated was 8,928, in the ratio of 48.37 per cent. of those born. A greater neglect of vaccination has been shown in 1890, as the number of infants under 1 year successfully vaccinated was only 7,798, the proportion being 42.66 per cent. of those born. The successful vaccinations of children from 1 to 14 years numbered 2,985 in 1889, but only 1,559 in 1890. However stringent the regulations may be relative to the admission of ships and passengers arriving from infected ports, yet, considering the facility with which the virus of small-pox may be transmitted by apparel, &c., and the length of time during which it may retain its energy, it can hardly be expected but that the disease may appear some day in our midst. In that case the growing indifference to vaccination may be a cause of bitter regret.
The deaths from scarlet fever were more numerous in 1890. Of the 31 deaths, 23 occurred in the Provincial District of Wellington, 9 having occurred in the Borough of Wellington. Of the rest, 5 occurred in the Auckland District, 1 in Hawke's Bay, 1 in Westland, and 1 in Otago.
The deaths from diphtheria were slightly more numerous in 1890 than in 1889. The greatest number of these deaths (46) occurred in Otago, the next greatest number (29) in Canterbury; but in proportion to population the deaths were most numerous in Marlborough, next so in Taranaki, then in Otago. Wellington gave the smallest proportion of these deaths, that in Auckland being slightly higher, but next to Wellington.
There was in 1890 a very considerable decrease in the mortality from diarrhæal diseases upon that in 1889, although the deaths were more numerous than in 1888. The mortality from these diseases fluctuates considerably from year to year, and is apparently greatly regulated by the varying temperature of seasons and years. The following table, showing the mean maximum temperature in the summer months at the stations specified, exhibits the rise or fall of mortality from diarrhæal diseases with the rise and fall of temperature:—
| 1887. Fahr. ° | 1888. Fahr. ° | 1889. Fahr. ° | 1890. Fahr. ° | |
|---|---|---|---|---|
| Auckland | 76.53 | 70.77 | 74.46 | 73.60 |
| Wellington | 71.83 | 67.00 | 68.83 | 69.30 |
| Lincoln | 74.30 | 71.03 | 72.47 | 70.26 |
| Dunedin | 71.77 | 66.13 | 67.83 | 68.00 |
| Averages | 73.60 | 68.73 | 70.89 | 70.29 |
| Deaths in year from diarrhæal diseases per 10,000 persons living} | 7.96 | 3.53 | 5.78 | 4.67 |
The number of deaths from typhoid fever increased from 118 in 1889 to 145 in 1890. The greatest mortality from this disease occurred in Auckland. The following shows the number of these deaths in every 10,000 persons living in each of the provincial districts during the past four years:—
| 1887. | 1888. | 1889. | 1890. | |
|---|---|---|---|---|
| Auckland | 4.0 | 4.1 | 1.8 | 3.9 |
| Taranaki | (1 death) | 2.6 | 2.0 | 1.8 |
| Hawke's Bay | 5.1 | 2.7 | 4.9 | 1.1 |
| Wellington | 3.6 | 2.1 | 2.4 | 2.5 |
| Marlborough | 2.6 | 1.7 | 0.0 | 0.0 |
| Nelson | 0.6 | 1.3 | 1.3 | 2.6 |
| Westland | 0.0 | (1 death) | (1 death) | (1 death) |
| Canterbury | 2.9 | 1.3 | 3.1 | 2.3 |
| Otago | 1.2 | 1.4 | 0.7 | 1.4 |
Deaths from enteric or typhoid fever are, proportionally to population, more numerous in all the Australasian Colonies than in England; but, of these colonies, the proportion is least in New Zealand, where it is only slightly in excess of that in England.
Among the deaths from dietetic diseases are those of 24 males and 8 females from alcoholic intemperance. In 1889 the deaths of 27 males and 12 females were registered from this cause. These do not include the numbers who die from diseases which are caused or developed by habits of intemperance; or diseases which have, in consequence of those habits, assumed a fatal character.
Phthisis is by far the most serious cause of death. In 1889 it was the cause of 499 deaths, and in 1890 of 520. Of those who died in 1890, 298 were males and 222 were females. The deaths were in the proportion of 8.37 in every 10,000 persons living, or among males of 9.01 in every 10,000 living, and among females 7.65 in every 10,000 living.
The death-rate from phthisis is considerably less than that in any of the Australian Colonies, but differs very slightly from that in Tasmania. In all those colonies the rate is materially increased by the deaths of persons who have arrived in a diseased condition, or constitutionally predisposed thereto; but there is no reason to think that the rate is more affected by this cause in the other colonies than in New Zealand, consequently the lower rate in New Zealand may be accepted as an indication of the superiority of its climate for withstanding the development of phthisical tendencies. The rate in this colony is a little more than half that in England.
The following table gives the ages, with the length of residence in the colony, of those who died from phthisis in 1890:—
| Length of Residence in the Colony. | age at death. | ||||||||||
|---|---|---|---|---|---|---|---|---|---|---|---|
| Under 5 years. | 5 to 10. | 10 to 15. | 15 to 25. | 25 to 35. | 35 to 45. | 45 to 55. | 55 to 65. | 65 to 75. | 76 and upwards. | Total. | |
| MALES. | |||||||||||
| Under 1 month | .. | .. | .. | .. | .. | .. | .. | 1 | .. | .. | 1 |
| 1 to 6 months | .. | .. | .. | 1 | 8 | 1 | .. | .. | .. | .. | 10 |
| 6 to 12 months | .. | .. | .. | 1 | 2 | .. | .. | .. | .. | .. | 3 |
| 1 to 2 years | .. | .. | .. | 1 | 6 | .. | 2 | .. | .. | .. | 9 |
| 2 to 3 years | .. | .. | .. | .. | 2 | 1 | 2 | .. | .. | .. | 5 |
| 3 to 4 years | .. | .. | .. | 1 | 4 | 2 | 1 | .. | 1 | .. | 9 |
| 4 to 5 years | .. | .. | .. | 1 | 3 | 1 | .. | .. | .. | .. | 5 |
| 5 to 10 years | .. | .. | .. | 3 | 10 | 12 | 3 | 2 | .. | .. | 30 |
| 10 to 15 years | .. | .. | .. | 2 | 6 | 7 | 2 | 1 | 1 | .. | 19 |
| 15 to 20 years | .. | .. | .. | 6 | 5 | 7 | 4 | 3 | .. | .. | 25 |
| 20 to 25 years | .. | .. | .. | 2 | 1 | 5 | 7 | 6 | .. | .. | 21 |
| 25 years and upwards | .. | .. | .. | .. | 8 | 9 | 25 | 18 | 5 | .. | 65 |
| Not known | .. | .. | .. | 3 | 6 | 4 | 2 | 4 | 1 | .. | 20 |
| Born in colony | 3 | .. | 5 | 48 | 16 | 3 | 1 | .. | .. | .. | 76 |
| Totals | 3 | .. | 5 | 69 | 77 | 52 | 49 | 35 | 8 | .. | 298 |
| FEMALES. | |||||||||||
| 1 to 6 months | .. | .. | .. | .. | .. | .. | .. | .. | .. | .. | .. |
| 6 to 12 months | .. | .. | .. | .. | .. | .. | .. | .. | .. | .. | .. |
| 1 to 2 years | .. | .. | .. | .. | 1 | 1 | .. | .. | .. | .. | 2 |
| 2 to 3 years | .. | .. | .. | .. | .. | 1 | 1 | .. | .. | .. | 2 |
| 3 to 4 years | .. | .. | .. | 2 | .. | .. | .. | .. | .. | .. | 2 |
| 4 to 5 years | .. | .. | .. | .. | .. | .. | 1 | .. | .. | .. | 1 |
| 5 to 10 years | .. | .. | .. | 4 | 5 | 5 | 2 | .. | .. | .. | 16 |
| 10 to 15 years | .. | .. | .. | 3 | 13 | 5 | 1 | .. | .. | .. | 22 |
| 15 to 20 years | .. | .. | .. | 7 | 7 | 6 | 6 | 3 | .. | .. | 29 |
| 20 to 25 years | .. | .. | .. | .. | 3 | 2 | 2 | 1 | .. | .. | 8 |
| 25 years and upwards | .. | .. | .. | .. | 9 | 5 | 14 | .. | 1 | .. | 29 |
| Not known | .. | .. | .. | 2 | .. | 1 | .. | 7 | .. | .. | 10 |
| Born in colony | 6 | 4 | 7 | 61 | 17 | 4 | 1 | 1 | .. | .. | 101 |
| Totals | 6 | 4 | 7 | 79 | 55 | 30 | 28 | 12 | 1 | .. | 222 |
| Totals of both sexes | 9 | 4 | 12 | 148 | 132 | 82 | 77 | 47 | 9 | .. | 520 |
Of those who died from phthisis, 177, or 34 per cent., were horn in the colony. In 1888 the similar number was 145, and the proportion 30 per cent. In 1889 the number was 140, percentage 29. 32 of the deaths, or 6.1 per cent., were of persons who had not resided three years in the colony, and may probably be considered to have arrived in a diseased condition. Of the 30 whose length of residence was not stated, some may have been only a short time in the colony; and, of the rest, many possibly who have survived a three years' residence may yet owetheir deaths to constitutional weakness which affected them before arrival. There is much therefore to make what may be termed the liability to the development of phthisis in New Zealand less than would appear from the rate given. In 1886 the New-Zealand-born population comprised 51.89 per cent. of the population. The results of the recent census in this respect are not yet available, but the proportion cannot have been well less than 55.5 per cent. in the middle of 1890. That proportion would give a New-Zealand-born population amounting to 344,533. The deaths from phthisis of persons born in the colony were 177, amounting to a proportion of 5.14 in every 10,000 of the New-Zealand-born. This is a somewhat higher rate than in 1889, when it was estimated at 4.32. These are the proportions which are properly comparable with the death-rate from phthisis in England, which averaged 15.98 in every 10,000 persons living for the four years 1886-89.
The following table gives the number of deaths from phthisis at each age-period, and the proportions to every 100 deaths from that cause, for each sex for the ten years 1881-90:—
| Age at Death. | Males. | Females. | ||
|---|---|---|---|---|
| Number of Deaths. | Per 100 Deaths from Phthisis. | Number of Deaths. | Per 100 Deaths from Phthisis. | |
| Under 5 years | 59 | 2.11 | 71 | 3.30 |
| 5 and under 10 yrs. | 18 | 0.64 | 51 | 2.37 |
| 10 and under 15 yrs. | 29 | 1.04 | 85 | 3.96 |
| 15 and under 20 yrs. | 192 | 6.87 | 281 | 13.08 |
| 20 and under 25 yrs. | 391 | 13.98 | 388 | 18.05 |
| 25 and under 35 yrs. | 780 | 27.90 | 618 | 28.76 |
| 35 and under 45 yrs. | 581 | 20.78 | 367 | 17.08 |
| 45 and under 55 yrs. | 472 | 16.88 | 189 | 8.79 |
| 55 and under 65 yrs. | 210 | 7.51 | 75 | 3.49 |
| 65 and under 75 yrs. | 56 | 2.00 | 21 | 0.98 |
| 75 and upwards | 8 | 0.29 | 2 | 0.09 |
| Not specified | ... | ... | 1 | 0.05 |
| 2,796 | 100.00 | 2,149 | 100.00 | |
The mortality was greatest in both sexes at the age-period 25-35; but more persons died from phthisis between 20 and 25 years of age than in any other quinquennial period of life. Under 20 years of age the mortality from this disease is greater among females than males; after 25 the mortality is greater among the males, the disproportion in favour of the females increasing with advancing age.
Cancer was given as the cause of 295 deaths in 1890. In 1889 the number of deaths from this disease was 260., in 1888 263, and in 1887 238. The increase in the mortality from cancer in New Zealand, as well as in England, is considerable. In reference to this subject the Registrar-General of England made the following remarks in his Fifty-second Report:—
To what causes such increase may be due is a question outside a purely statistical report; but it may be pointed out that, if it be true, as appears to be the general though not the universal opinion of medical experts, that the development of new growths is often due to a constitutional and inheritable tendency, and if, as undoubtedly is the case, such development does not as a rule manifest itself till after the usual age of marriage and of parturition, it must follow as a necessary arithmetical consequence that the tendency shall spread wider and wider among the population. In the case of a disease such as tubercular phthisis, which in a large proportion of cases manifests itself before the age of marriage, there will be, at any rate to a certain extent, a constant, if an insufficient, weeding-out from the candidates for matrimony of those who are most seriously liable to this disease; but in the case of cancer there will be no such preservative influence, and so long as persons with this inherited tendency marry, practically without let or hindrance of any kind, there must, as already said, be a constantly-growing proportion of the population that shares in the constitutional defect.
The rapidity of the increase in the death-rate from cancer, both in England and in New Zealand, is shown by the following table:—
| Year. | New Zealand. | England. |
|---|---|---|
| 1881 | 2.69 | 5.20 |
| 1882 | 2.89 | 5.32 |
| 1883 | 2.99 | 5.46 |
| 1884 | 3.46 | 5.60 |
| 1885 | 3.13 | 5.66 |
| 1886 | 3.68 | 5.83 |
| 1887 | 3.99 | 6.06 |
| 1888 | 4.34 | 6.10 |
| 1889 | 4.25 | 6.43 |
| 1890 | 4.75 | — |
The increase, especially in the case of the deaths of males, has been deemed to be partially due to improved diagnosis and a more careful definition of the cause of death; but, as medical practitioners conversant with the treatment of this disease are of opinion that it is becoming more common, the increase shown by the death registers may be considered, as to a large extent an actual one, and more especially so in the case of females, as cancerous affections among them are less difficult of recognition than among males.
The following table gives the death-rates from cancer of males and females for the past ten years:—
| Year. | Males. | Females. |
|---|---|---|
| 1881 | 2.25 | 3.16 |
| 1882 | 2.79 | 3.00 |
| 1883 | 2.70 | 3.32 |
| 1884 | 3.26 | 3.69 |
| 1885 | 2.82 | 3.43 |
| 1886 | 3.69 | 3.67 |
| 1887 | 3.96 | 4.03 |
| 1888 | 4.19 | 4.53 |
| 1889 | 3.47 | 4.06 |
| 1890 | 4.72 | 4.79 |
Diseases of the nervous system caused 671 deaths in 1890, being in the ratio of 10.89 in every 10,000 persons living. This was an increase of 39 on the number and of 0.59 on the ratio in 1889. The mortality from these diseases was numerically and proportionately greater among males than females. Of the deaths, 391, or 11.83 per 10,000 living, were of males; and 280, or 9.65 per 10,000 living, were of females. The following are the diseases in this group or order which caused the greatest mortality in the last three years:—
| Disease. | Deaths in 1888. | Deaths in 1889. | Deaths in 1890. | |||
|---|---|---|---|---|---|---|
| Males. | Females. | Males. | Females. | Males. | Females. | |
* Not including paralysis of insane. | ||||||
| Inflammation of the brain | 60 | 42 | 60 | 45 | 56 | 43 |
| Apoplexy | 99 | 65 | 85 | 68 | 82 | 55 |
| Hemiplegia and paralysis* | 44 | 41 | 52 | 33 | 57 | 36 |
| Epilepsy | 20 | 13 | 14 | 13 | 16 | 12 |
| Convulsions | 84 | 62 | 77 | 56 | 73 | 71 |
Of the deaths from diseases of the nervous system in 1890, 210 were of children under 5 years of age, of which 143 were from convulsions and 45 from inflammation of the brain.
Diseases of the circulatory system caused 453 deaths in 1890. This was less than the number in 1889 by 78. Of the 453 deaths, 270 were of males and 183 of females. The mortality from these diseases is greater among males than females. The proportion to every 10,000 of each sex living was—in 1889, of males 10.11, and of females 6.97; in 1890, of males 8.17, and of females 6.31.
Diseases of the respiratory organs were more fatal in 1890 than in the previous year, the deaths having been 756 I in 1890, against 689 in 1889. The most fatal of these diseases were—croup, which caused 42 deaths, viz., 23 of males and 19 of females; bronchitis, which caused 164 deaths of males and 119 of females; and pneumonia, 188 deaths of males and 106 of females.
Diseases of parturition caused 80 deaths; puerperal fever, puerperal pyæmia and septicæmia, caused 19. The number of all these, 99, represents the mortality incidental to child-bearing. This is in the ratio of 1 death to every 184 children born, or, allowing for twin and triplet births, 1 in every 182 child-bearing women died. This is a much greater rate of mortality than in 1889, when the proportion was 1 death in 235 mothers.
In 1889 the proportion of violent deaths among males was 12.70 in every 10,000 males living; in 1890 it was 12.98. The proportions of female deaths were 3.19 in 1889 and 3.17 in 1890 in every 10,000 females living. 12 per cent. of the male and 13 per cent. of the female deaths from violence were suicidal.
The following gives the number of deaths from external or violent causes in the ten years 1881-90:—
| M. | F. | |
|---|---|---|
| Accident or negligence— | ||
| Fractures, &c. | 1,671 | 163 |
| Gunshot wounds | 96 | 3 |
| Cut, stab | 37 | 19 |
| Burns and scalds | 209 | 222 |
| Poison | 83 | 28 |
| Drowning | 1,327 | 232 |
| Suffocation | 143 | 78 |
| Otherwise or unspecified | 207 | 67 |
| Total accidents | 3,773 | 812 |
| Homicide— | ||
| Murder or manslaughter | 41 | 31 |
| Battle wounds | 2 | 0 |
| Total homicides | 43 | 31 |
| Suicide— | ||
| Gunshot wounds | 122 | 7 |
| Cut, stab | 71 | 7 |
| Poison | 80 | 31 |
| Drowning | 42 | 19 |
| Hanging | 115 | 17 |
| Unspecified | 22 | 3 |
| Total suicides | 452 | 84 |
| Execution— | ||
| Hanging | 4 | 0 |
Prior to the abolition of the provinces the hospitals were supported mainly out of provincial revenues. Subsequently thereto the expenditure for hospitals became to a large extent a charge on the revenues of counties and Muncipal Corporations until October, 1885, when “The Hospitals and Charitable Institutions Act, 1885,” passed by the General Assembly, came into operation.
The portion of the colony included within the three principalIslands—the North, Middle, and Stewart Islands— was by this Act divided into 28 hospital districts, each consisting of one or more counties with the interior boroughs— to be presided over by elected Boards, designated “Hospital and Charitable Aid Boards.” The revenues of these Boards accrue from the following sources:—
Rents and profits of land and endowments vested in the Board, or set apart for the benefit of particular institutions;
Voluntary contributions;
Grants from contributory local authorities; and
Subsidies from the Consolidated Fund (these being at the rate of 10s. for every £1 of bequests, but in no case exceeding £500 in respect of any one bequest; £1 4s. for every £1 of voluntary contributions; and £1 for every £1 received from any local authority).
The contributory local authorities — being the County and Borough Councils, and Boards of road and town districts where the Counties Act is not in operation—are empowered by the Act to raise by special rates the amounts assessed by the Hospital District Boards as the proportionate contributions for the purpose of the Hospital and Charitable Aid Fund.
The District Boards undertake the general management and control of the hospitals that are not incorporated in terms of the Act, and are required to contribute to the support of the incorporated hospitals. Incorporated hospitals are those having not less than one hundred subscribers who contribute not less than £100 annually to the institution by amounts of not less than 5s., and have been declared by the Governor in Council, after receipt by him of a duly-signed petition, to be a body politic and corporate.
There are 38 hospitals in the colony, of which 25 are incorporated institutions and 13 are directly managed and controlled by District Boards. These hospitals afforded, on the whole, accommodation in 1890 for 964 male and 424 female patients, a total of 1,388. Owing to local changes the bed-accommodation was less than in 1889 to
the extent of that for 12 males and 4 females. The number of cubic feet of space included within the walls of all the sleeping-wards was 1,834,095, which gave an average of 1,321 cubic feet to each bed. 5,143 males and 2,059 females were admitted as patients during the year 1890, and 550 male and 169 female patients were inmates at the end of the year. The total number of indoor patients during the year was 7,929—viz., 5,690 males and 2,239 females.
Of the inmates in 1890, 497 males, or 8.73 in the 100 male patients, and 162 females, or 7.24 in the 100 female patients, died. In 1889 the proportions of deaths were 8.53 per cent. of the males and 6.69 per cent. of the females; in 1888, 8.81 per cent. of males and 6.64 per cent. of females. 1,402 patients were suffering from accidents—of whom 48 died—and 11 from attempted suicide: of these, one died.
Diseases of the respiratory system supplied the largest number (730) of patients of any of the orders: of these, 91 died. The largest number of these cases in any one hospital was 111 in Dunedin, resulting in 18 deaths.
Miasmatic diseases were the next most prolific source of sickness. The patients therefrom in all the hospitals amounted to 725, of whom 59 died. Of these diseases typhoid fever supplied 402 patients and 46 deaths. The greatest number of cases from this cause in any one hospital was 123 in Wellington, with 12 deaths. In Auckland Hospital there were 110 patients from typhoid fever, and 16 deaths. The largest number of cases in any other hospital was 39 in Christchurch, with 4 deaths.
In addition to the indoor patients, outdoor relief was given to a very large number of persons; but, as in some of the hospitals no records are kept of the outdoor patients, it is impossible to state the number of distinct persons who received such relief.
The various benevolent asylums and charitable institutions are placed on a similar footing to the hospitals. The Boards of hospital districts are constituted Hospital and Charitable Aid Boards; but, for the purpose of distributing charitable aid only, some of the hospital districtshave been united into larger districts, so that, although there are 28 Boards for hospital purposes, there are only 21 for charitable-aid purposes.
There are 10 benevolent asylums (not including orphanages) established for the support of certain indigent persons. These have accommodation for 441 males and 234 females. The number of inmates in all these institutions at the end of 1890 was 565, of whom 402 were males and 163 were females. Outdoor relief was given by two of these institutions to 3,502 persons, including 2,426 children.
There are 6 orphan asylums in the colony: 2 are maintained by District Hospital Boards, 1 by the Church of England authorities, and 3 by clergy of the Roman Catholic Church; 4 of these receive, at the charge of the State, orphan, destitute, and other children that may be committed to them by a Resident Magistrate.
Exclusive of the children so committed, 25 male and 29 female orphans were received during the year, and 67 male and 107 female orphans remained as inmates at the end of the year.
The orphanages that receive committed children are, for that purpose, constituted “industrial schools.” The particulars of the committed children will be found included with those of the committed children attending the Government industrial schools.
There are 7 public lunatic asylums in the colony (one being, however, only an auxiliary institution to the district asylum), maintained wholly or in part out of the public revenue. There is also one private asylum, licensed by the Governor for the reception of lunatics. There were, at the end of 1890, 1,095 male and 702 female patients belonging to these asylums. Of these, 910 males and 588 females were supposed to be incurable, 12 males and 21 females were out on trial, and 173 males and 93 females were supposed to be curable. 127 male and 110 female patients were discharged during the year. The percentage of recoveries on admissions during the year was 47.69; being, of males 42.61, and of females 55.00.
The proportion of recoveries in each of the under-mentioned colonies and England was as follows:—
| New Zealand | 47.69 |
| New South Wales | 44.36 |
| Victoria | 44.36 |
| South Australia (1888) | 38.47 |
| England | 38.71 |
The rates of recoveries in some of the colonies—New Zealand included—are increased by the discharge of persons temporarily admitted who should not properly be inmates of lunatic asylums. This is evident from the fact that, of 186 discharged as recovered, from the asylums in New Zealand in 1890, 57 had not been inmates more than three months, and 142 not more than twelve months.
The following shows the proportion of insane — or, preferably: of inmates of lunatic asylums—to the population (exclusive in each case of Maoris) at the end of the years stated:—
| 1884, 1 insane person to every 393 of population. |
| 1885, 1 insane person to every 382 of population. |
| 1886, 1 insane person to every 370 of population. |
| 1887, 1 insane person to every 360 of population. |
| 1888, 1 insane person to every 365 of population. |
| 1889, 1 insane person to every 349 of population. |
| 1890, 1 insane person to every 348 of population. |
It must not be overlooked that the proportions are increased by the admission into the asylums of inebriates, idiots, and others who should not properly be there.
The proportion of insane persons to the 1,000 of the population in each of the under-mentioned colonies was as follows:—-
| New South Wales, 1889 | 2.65 |
| Victoria 1889 | 3.24 |
| Queensland 1889 | 2.35 |
| South Australia 1889 | 2.43 |
| New Zealand, 1890 | 2.87 |
There are 4 industrial schools maintained by the Government, and 1 maintained wholly by the local authorities. In addition, 3 orphanages under the control of the Roman Catholic clergy have been constituted industrial schools for the reception of children committed under the Industrial Schools Act. The Government pays a contribution of 1s. a day for each child committed to these institutions.158 children of both sexes were committed to these schools in 1890—namely, 99 boys and 59 girls.
There has been of late years a steady decrease in the number of committed children.
| In 1886 | 238 children were committed. |
| In 1887 | 224 children were committed. |
| In 1888 | 190 children were committed. |
| In 1889 | 169 children were committed. |
| In 1890 | 158 children were committed. |
The number of committed children belonging to these schools at the end of 1890 was 1,454—namely, 828 boys and 626 girls. Of these, 544 were actually in the schools, 427 were boarded out, 372 were at service, 82 were' with friends, and the others were variously accounted for.
Of those admitted during the year, 38—namely, 32 boys and 6 girls—had been guilty of punishable offences.
Two children were transferred to the Costley Training Institution of Auckland. This institution was established and maintained out of funds bequeathed for such a purpose chiefly by the generosity of one individual, and has for its objects the selection of a certain number of boys and girls of ages fit to be apprenticed, being inmates of the schools established under “The Industrial Schools Act, 1882,” in or near the City of Auckland, and the apprenticing the boys to suitable trades, the maintaining such boys at the said institution until they are capable of being left to their own control, and providing the girls with domestic service or other suitable, employment. There were 35 inmates of the institution at the end of 1890—namely, 28 boys of ages varying from 13 to 19, and 7 girls. All the boys except 2 were either learning a useful trade, or held situations in offices or other positions of respectability; 2 were attending school. The girls were all hoarded out with families the head of which is a responsible and experienced matron.
Meteorological observations were taken in 1890 at 9.30 a.m. daily at six different stations—namely, at Auckland, in the northern part of the North Island; at Te Aroha and Rotorua, in the hot-springs district; at Wellington, at the extreme south of the North Island; at Lincoln, in theCanterbury District, about midway in the Middle Island; and at Dunedin, in the southern district of the Middle Island. The differences of situation,—Auckland, Wellington, and Dunedin being seaports, the other three inland stations,—of elevation, and of latitude between the several stations involve considerable differences of temperature.
The following table gives the mean temperature in the shade for the year at each station, and the maximum and minimum temperature recorded:—
| Station. | 1890. | |||
|---|---|---|---|---|
| Mean Temp. in shade. | Max. Temp. recorded. | Min. Temp. recorded. | Extreme Range. | |
| Fahr. | Fahr. | Fahr. | Fahr. | |
| Auckland | 60.0 | 82.0 | 40.0 | 42.0 |
| Te Aroha | 59.1 | 90.8 | 26.0 | 64.8 |
| Rotorua | 54.3 | 85.5 | -26.0 | 59.9 |
| Wellington | 55.8 | 82.0 | 32.0 | 50.0 |
| Lincoln | 53.2 | 94.8 | 26.4 | 68.4 |
| Dunedin | 51.1 | 84.0 | 31.0 | 53.0 |
In each case the maximum was only reached on one day in the year. Although the average heat was greatest in Auckland, the range of temperature was least. Wellington takes the second place for equability of climate, but nowhere are there any extremes of heat or cold.
The rainfall varies much at the different stations, and from year to year. The following shows the rainfall for the last three years:—
| Station. | 1888. | 1889. | 1890. | |||
|---|---|---|---|---|---|---|
| Rainfall. | Number of Days on which Rain fell. | Rainfall. | Number of Days on which Rain fell. | Rainfall. | Number of Days on which Rain fell. | |
| Inches. | Inches. | Inches. | ||||
| Auckland | 34.600 | 174 | 41.970 | 162 | 46.100 | 176 |
| Te Aroha | No observations. | 55.620 | 130 | 64.110 | 129 | |
| Rotorua | 40.120 | 126 | 50.630 | 181 | 50.411 | 162 |
| Wellington | 41.009 | 186 | 31.356 | 155 | 45.230 | 165 |
| Lincoln | 29.155 | 128 | 20.384 | 109 | 14.836 | 104 |
| Dunedin | 48.356 | 157 | 23.446 | 131 | 27.984 | 155 |
The greatest rainfall in any 24 hours occurred at Te Aroha, 2.8 inches.
Daily observations have not been continued at Hokitika, on the west coast of the Middle Island, since 1880; but for the ten years 1871 to 1880 inclusive the annual rainfall there averaged 122.990in., the greatest rainfall for any one of those years having been 154.446in., and the smallest 96.170in.
The configuration of the colony—its great length from north to south compared with its breadth, its great extent of coast-line, and the division of the two principal parts by Cook Strait—renders it very subject to the influence of sea-breezes. As a consequence, in parts at times there is much motion in the atmosphere, and windy days are prevalent.
The number of days on which there were gales or high winds in 1890 at each station is as follows:—
| Number of Days on which there were Gales or High Winds. | Maximum Velocity of Wind in Miles in any 24 Hours. | |
|---|---|---|
| Auckland | 44 | ... |
| Te Aroha | 31 | ... |
| Rotorua | 3 | ... |
| Wellington | 67 | 680 |
| Lincoln | 28 | 723 |
| Dunedin | 13 | 570 |
Its position near the narrowest part of Cook. Strait renders Wellington peculiarly subject to wind; but the maximum force of the wind is greater at other stations. The records for the first six months at Auckland were too unreliable to enable correct data to be supplied for the whole year; but during the second six months a maximum force of 765 miles in 24 hours was experienced in September, and of 754 in December, 1890.
The shipping inwards in 1890 was less than in 1889 by 37 vessels, but the tonnage was greater by 60,135. Of this, the vessels inwards with cargoes were less numerous by 53, but the tonnage was greater by 2,032. This almost stationary condition of the tonnage of vessels inwards with cargoes was due to a want of expansion in the import trade, the value of which was less by £-18,338 in 1890 than in 1889. The vessels inwards in ballast were more numerous by 16 in 1890 than in 1889, and their tonnage was greater by 58,103, owing to the greater demands on tonnage to meet the requirements of the increased export trade. In 1889 the value of the exports was £9,339,265, which were shipped in 734 vessels, of 577,087 tonnage; in 1890 the value of the exports was £9,811,720, which supplied cargoes for 729 vessels, of 644,032 tonnage: an increase of 66,945 on the tonnage in 1889.
The following table shows the number of British, colonial, and foreign vessels inwards in 1890:—
| Nationality. | Number. | Tons. | Crews. | |
|---|---|---|---|---|
| British— | ||||
| Sailing | 138 | 154,046 | 3,033 | |
| Steam | 52 | 126,059 | 3,753 | |
| Colonial— | ||||
| Sailing | 256 | 67,609 | 2,044 | |
| Steam | 221 | 230,888 | 11,554 | |
| Foreign— | ||||
| Sailing | 51 | 36,013 | 640 | |
| Steam | 26 | 48,154 | 2,451 | |
| Totals | Sailing | 445 | 257,668 | 5,717 |
| Steam | 299 | 405,101 | 17,758 | |
The following are the numbers and tonnage of vessels of each foreign nationality that entered in the past three years:—
| Nationality. | Sailing or Steam. | 1888. | 1889. | 1890. | |||
|---|---|---|---|---|---|---|---|
| Number. | Tonnage. | Number. | Tonnage. | Number. | Tonnage. | ||
| American | Sailing | 11 | 6,975 | 22 | 12,084 | 23 | 13,481 |
| American | Steam | 18 | 34,902 | 18 | 34,902 | 16 | 31,024 |
| French | Sailing | .. | .. | 1 | 317 | 1 | 599 |
| Austrian | Sailing | .. | .. | 1 | 452 | 1 | 452 |
| German | Sailing | 6 | 2,488 | 9 | 5,676 | 12 | 11,190 |
| Italian | Sailing | .. | .. | 1 | 747 | .. | .. |
| Norwegian | Sailing | 5 | 4,560 | 8 | 6,241 | 8 | 5,260 |
| Swedish | Sailing | 3 | 2,273 | 2 | 1,451 | 4 | 4,129 |
| Danish | Sailing | 2 | 649 | .. | .. | .. | .. |
| Dutch | Sailing | 1 | 394 | .. | .. | .. | .. |
| Chilian | Sailing | 1 | 133 | 2 | 306 | 1 | 173 |
| Bolivian | Sailing | .. | .. | 1 | 587 | .. | .. |
| Nicaraguan | Sailing | .. | .. | .. | .. | 1 | 729 |
| Tongan | Sailing | .. | .. | 2 | 170 | .. | .. |
| Cook Islands | Sailing | .. | .. | 1 | 41 | .. | .. |
| Hawaiian | Steam | 9 | 15,417 | 8 | 13,704 | 10 | 17,130 |
| Totals | .. | 56 | 67,791 | 76 | 76,678 | 77 | 84,107 |
The foreign shipping comprised 13 per cent. of the tonnage of all the shipping inwards, and it was greater by 9.77 per cent. than the foreign shipping inwards in 1889. The most noticeable feature is the large proportionate increase in the tonnage of German shipping, which in 1890 was about three and a half times more than in 1888, and 97 per cent. more than in 1889. Although, the tonnage of Norwegian shipping was less than in 1889, it was more than 15 per cent. in excess of that in 1888. The tonnage of the Swedish shipping, which fell off in 1889, was 81 per cent. more in 1890 than in 1888.
The Hawaiian steam-vessels consist of the American steam-vessels but on the Hawaiian register. Now they are all, except one, registered at San Francisco.
The following table shows the tonnage of vessels inwards from and outwards to different countries, with cargoes and in ballast, in 1889 and 1890:—
| Countries whence arrived or for which cleared. | Entered, 1889. | Entered, 1890. | Cleared, 1889. | Cleared, 1890. | ||||
|---|---|---|---|---|---|---|---|---|
| With Cargo. | In Ballast. | With Cargo. | In Ballast. | With Cargo. | In Ballast. | With Cargo. | In Ballast. | |
| ... | Tons. | Tons. | Tons. | Tons. | Tons. | Tons. | Tons. | Tons. |
| United Kingdom | 147,108 | ... | 149,818 | 8,246 | 211,914 | ... | 301,880 | ... |
| Australia | 226,571 | 89,285 | 238,496 | 108,184 | 271,542 | 7,178 | 251,491 | 3,055 |
| Tasmania | 49,189 | 717 | 39,125 | 12,856 | 32,348 | ... | 22,638 | 339 |
| Norfolk Island | 717 | ... | 688 | ... | 840 | ... | 688 | ... |
| Fiji | 10,752 | 55 | 11,891 | ... | 7,590 | ... | 8,204 | 850 |
| Sandwich Islands | 24,303 | ... | 24,077 | ... | 24,303 | ... | 26,213 | ... |
| Other Pacific islands | 14,124 | 2,161 | 13,581 | 875 | 10,930 | 1,430 | 15,344 | 1,429 |
| Guam | ... | ... | ... | ... | 709 | ... | 121 | ... |
| United States— | ||||||||
| East Cost | 9,900 | ... | 12,700 | ... | 9,504 | ... | 13,268 | ... |
| West Cost | 1,352 | ... | ... | ... | ... | 1,116 | ... | .. |
| Hongkong | 2,108 | ... | 1,062 | ... | 2,503 | ... | 1,062 | ... |
| Bengal | 5,174 | ... | 3,190 | ... | 1,653 | 1,080 | 1,071 | ... |
| Cape Colony | ... | 1,429 | ... | 17,141 | 834 | ... | 868 | ... |
| Natal | ... | 1,296 | ... | 2,229 | ... | ... | 344 | ... |
| Mauritius | 4,961 | 1,574 | 5,906 | ... | ... | ... | 241 | ... |
| Argentine Republic | ... | 3,998 | ... | 3,645 | ... | ... | ... | ... |
| Brazil | ... | 1,115 | ... | 3,678 | ... | ... | ... | ... |
| Peru | ... | ... | ... | ... | ... | 3,186 | ... | ... |
| Chili | ... | ... | ... | ... | ... | 1,852 | ... | ... |
| Java | 3,316 | ... | 1,674 | 1,399 | ... | ... | ... | ... |
| Uruguay | ... | ... | ... | 1,480 | ... | ... | ... | ... |
| Germany | ... | ... | 437 | ... | 1,336 | ... | ... | ... |
| France | ... | ... | ... | ... | ... | 599 | ... | ... |
| Whale Fisheries | 1,429 | ... | 391 | ... | 1,081 | 323 | ... | ... |
Although the names of several South American States appear on the list, yet no vessels with cargoes arrive from or leave for them. The shipping arrivals consist only of vessels in ballast seeking cargoes. The number of vessels entered of any foreign country, as shown in the previous table, is not an index of the measure of trade with that country—as an instance: in 1890, twelve German ships, of 11,190 tons, were entered inwards, but only one vessel, of 437 tons, arrived direct from Germany with a cargo, and not one cleared outwards for that country. The following table gives the number and tonnage of vessels inwards and outwards during the past ten years:—
| Year. | Vessels Inwards. | Vessels Outwards. | ||
|---|---|---|---|---|
| No. | Tons. | No. | Tons. | |
| 1881 | 765 | 420,134 | 762 | 413,487 |
| 1882 | 795 | 461,285 | 769 | 438,551 |
| 1883 | 805 | 494,926 | 851 | 507,565 |
| 1884 | 852 | 529,188 | 872 | 534,242 |
| 1885 | 786 | 519,700 | 780 | 513,000 |
| 1886 | 725 | 502,572 | 707 | 488,331 |
| 1887 | 653 | 489,754 | 675 | 493,583 |
| 1888 | 683 | 526,435 | 701 | 531,478 |
| 1889 | 781 | 602,634 | 762 | 593,252 |
| 1890 | 744 | 662,769 | 745 | 649,705 |
There was in 1890 a considerable increase in the number and tonnage of sailing-vessels entered and cleared coastwise; and a considerable decrease in the number, but an increase in the tonnage, of steamers engaged in the coastal trade entered and cleared.
| — | 1889. | 1890. | ||
|---|---|---|---|---|
| No. | Tons. | No. | Tons. | |
| Sailing-vessels | 4,192 | 220,494 | 4,596 | 247,978 |
| Steamers | 12,974 | 3,380,232 | 12,565 | 3,462,395 |
| — | 1889. | 1890. | ||
|---|---|---|---|---|
| No. | Tons. | No. | Tons. | |
| Sailing-vessels | 4,058 | 216,680 | 4,582 | 247,593 |
| Steamers | 12,881 | 3,371,178 | 12,534 | 3,446,318 |
There was a slight decrease in the number of sailing-vessels on the New Zealand register at the end of 1890 on the number at the beginning of the year, but the difference of tonnage was very small indeed, yet showing a slight increase. There was an increase of 9 in the number of steamers on the register, with an increase of 7,190 tons.
| Upon the Register. | Sailing-vessels. | Steam-vessels. | Total. | |||
|---|---|---|---|---|---|---|
| No. | Tons, net. | No. | Tons, net. | No. | Tons, net. | |
| Dec. 31, 1889 | 350 | 34,911 | 170 | 30,919 | 520 | 65,830 |
| Dec. 31, 1890 | 342 | 34,947 | 179 | 38,109 | 521 | 73,056 |
The total declared values of the imports in 1890 amounted to £6,200,525, being a decrease on the total values in 1889 of £48,338. If the specie be deducted in each case, then the decrease on the values of other articles imported in 1890 amounted to £51,688. It is evident, from the contraction of imports in 1890, that the large excess of exports over imports, which amounted in value to more than £3,000,000 in 1889, and more than £3,500,000 in 1890, was all required to meet demands outside the colony in respect of public and private indebtedness, and that the purchasing-power of the inhabitants of the colony has in no way improved.
The following table gives the value of imports yearly during the past nine years:—
| Year. | Imports, inclusive of Specie. | Imports, exclusive of Specie. |
|---|---|---|
| £ | £ | |
| 1882 | 8,609,270 | 8,343,950 |
| 1883 | 7,974,638 | 7,773,966 |
| 1884 | 7,663,888 | 7,326,208 |
| 1885 | 7,479,921 | 7,278,101 |
| 1886 | 6,759,013 | 6,319,223 |
| 1887 | 6,245,515 | 6,064,281 |
| 1888 | 5,941,900 | 5,430,050 |
| 1889 | 6,308,863 | 5,980,583 |
| 1890 | 6,260,505 | 5,928,625 |
The values given include an increase of 10 per cent. on the declared values of goods liable to duty, and in the case of goods not liable to duty the declared values have been taken in the earlier y oars and in the last quarter of 1890, but in the years 1888-89, and nine months of 1890, when the primage duty was in force, these also include an addition of 10 per cent.
The following table shows the value of certain principal articles imported in each of the years 1888, 1889, and 1890:—
| Groups of Principal Articles imported. | 1888. | 1889. | 1890. |
|---|---|---|---|
* This amount is greater than the amount giver, in last year's report by £11,766, the value of foreign-post parcels, which had not been included in the amount then given. | |||
| £ | £ | £ | |
| Apparel and slops | 236,707 | 330,304 | 319,235 |
| Boots and shoes | 145,742 | 117,907 | 127,371 |
| Cotton piece-goods | 266,646 | 330,534 | 312,935 |
| Drapery | 508,558 | 360,226 | 315,169 |
| Haberdashery | 80,376 | 74,513 | 88,945 |
| Hosiery | 55,617 | 57,992 | 68,807 |
| Hats and caps | 37,459 | 53,854 | 48,927 |
| Linen manufactures | 23,464 | 44,914 | 42,605 |
| Millinery | 31,749 | 22,336 | 21,384 |
| Silks | 32,694 | 75,248 | 76,807 |
| Woollen piece-goods and blankets | 91,001 | 125,622 | 150,555 |
| Totals | 1,510,013 | 1,593,450 | 1,572,740 |
| Agricultural implements | 11,922 | 7,740 | 9,602 |
| Cutlery | 13,502 | 17,883 | 16,786 |
| Hardware and ironmongery | 140,572 | 149,207 | 165,158 |
| Iron rails and railway - bolts, &c. | 13,943 | 14,016 | 40,700 |
| Iron, other—pig, wrought, wire, &c. | 248,948 | 380,897 | 330,727 |
| Machinery | 164,462 | 190,676 | 195,467 |
| Nails | 24,256 | 24,182 | 27,408 |
| Railway plant | 23,926 | 13,161 | 12,131 |
| Sewing-machines | 10,281 | 24,981 | 23,531 |
| Steel and steel rails | 18,214 | 40,086 | 50,989 |
| Tools, artificers' | 27,758 | 38,972 | 42,930 |
| Totals | 697,784 | 901,801 | 915,429 |
| Sugar | 350,637 | 398,527 | 383,610 |
| Tea | 186,217 | 137,925 | 154,057 |
| Totals | 536,854 | 536,452 | 537,667 |
| Beer | 47,852 | 54,323 | 54,164 |
| Spirits | 154,594 | 182,740 | 144,914 |
| Tobacco | 106,246 | 105,402 | 103,064 |
| Wine | 42,407 | 47,214 | 50,435 |
| Totals | 351,099 | 389,679 | 352,577 |
| Paper | 94,614 | 107,885 | 111,896 |
| Printed books | 94,423 | 110,874 | 105,344 |
| Stationery | 58,543 | 66,219 | 66,793 |
| Totals | 247,580 | 284,978 | 284,033 |
| Bags and sacks | 152,140 | 178,727 | 59,892 |
| Coals | 98,431 | 114,053 | 102,166 |
| Fancy goods | 64,806 | 69,448 | 59,745 |
| Fruits (including fresh, preserved, bottled, dried) | 113,311 | 83,317 | 108,610 |
| Oils | 121,159 | 121,232 | 111,720 |
| Other imports (excluding specie) | 1,536,873 | *1,707,446 | 1,824,316 |
| Totals (excluding specie) | 5,430,050 | *5,980,583 | 5,928,895 |
| Specie imported | 511,850 | 328,280 | 331,630 |
| Total imports | 5,941,900 | *6,308,863 | 6,260,525 |
The values of imports of the first or clothing group show an apparent decrease of £20,710; while imports of woollen goods, boots and shoes, haberdashery, and hosiery showed a considerable increase, those of apparel and slops, cotton piece-goods, and drapery were much less. The imports of silk, which in 1889 were nine times as great as in 1887 and 130 per cent. more than in 1888, showed a still further increase in 1890.
There was a marked increase in 1890 in the value of the imports of the next—the iron and hardware—group. The increase on the value in 1888 is very great, but the value in 1889 is much below what it was in the four earliest years of the nine years 1882-90. The value of agricultural implements imported in 1890 (£9,602), though greater than that in 1889, was considerably less than in any other of the past nine years, especially so than that in 1882-£35,607, and in 1883, £47,432.
The value of sugar (including molasses and treacle) imported in 1890 was less than in 1889, although greater than in 1888. The values of these imports for the past three years averaged £377,591 per annum, but for the three years 1882, 1883, and 1884 the average, with a much smaller population, was £615,206 for each year. The smaller average amount for the past three years was due to a decrease in the value of sugar, not to a reduction in the amount imported; which in the years 1882-84 gave an annual average of 50,240,277lb., and that in the years 1888-90 an annual average of 55,540,313lb. The declared values for the earlier three years gave 2 15/16d. per pound for sugar, and for the later three years 1 5/8d. per pound—a decrease nearly equivalent to three times the amount of Customs duty thereon.
The value of the total tea imports have also been much less in the past three-yearly period than in the period 1882-84. In the earlier period the average annual quantity imported was 3,773,161lb., of the value of £229,906. In the period 1888-90 the average annual quantity was 4,008,494lb., of the value of £159,399. Thus, while in the earlier period the average declared value of tea was 1s. 2 3/5d., in the period 1888-90 it was 9 1/2d. As the duty on tea is 6d. per pound, the decrease in price shown above is nearly equivalent to the whole amount of duty paid.
The quantities entered at the Customs for home consumption, and for which duty is paid in any one year, represent with sufficient accurateness the amount actually consumed during that period.
The quantity of sugar entered for consumption in 1890 was 55,025,396lb., which gave an average of 88.64lb. forevery person, exclusive of Maoris; but the persons of this race are estimated to consume, on an average, about one-fourth as much as Europeans. On this basis the consumption for the population, exclusive of Maoris, amounted to 87.181lb. per head.
The following table, giving the consumption per head of sugar in different countries, is, with the exception of the figures for New Zealand, taken from the Victorian Year-book of 1889-90:*—
| South Australia | 102.11 |
| Western Australia | 93.51 |
| Victoria | 90.75 |
| Tasmania | 90.49 |
| New Zealand | 87.18 |
| United Kingdom | 68.99 |
| Queensland | 62.93 |
| New South Wales | 60.95 |
| Argentine Republic | 50.04 |
| Denmark | 29.69 |
| Holland | 28.37 |
| Switzerland | 22.81 |
| France | 22.16 |
| Sweden | 17.51 |
| Belgium | 15.74 |
| Germany | 15.01 |
| Austria-Hungary | 13.23 |
| Norway | 11.37 |
| Finland | 11.22 |
| Portugal | 9.56 |
| Roumania | 7.71 |
| Russia | 7.69 |
| Spain | 5.11 |
| Servia | 4.41 |
| Italy | 3.20 |
The Government Statist of Victoria states that fifteen million pounds of sugar, or nearly 15lb. per head, are used annually for the manufacture of beer. This appears a very high estimate. In the brewers' returns supplied for the year 1885 it was stated that 1,377,050lb. of sugar had been used in the production of 4,735,735 gallons of beer. This was rather less than 2 1/2lb. per inhabitant. The amount of home-made beer consumed in New South Wales in 1889 was 9,515,000 gallons. If the proportion of sugar used was the same as in New Zealand that would give 2,766,757lb., or about 2 1/2lb. per inhabitant. The consumption of sugar in New South Wales is given by the Government Statist at 94lb. per person, presumably including the quantity used for beer manufacture and other industries. This, having regard to the quantity consumed in each of the other colonies, is presumably more correct than 60.95lb. as above given.
Extracted from a paper read by Dr. O. J. Broch before the Statistical Society of Paris, on the 15th June, 1887.
In taking into consideration the amount of tea consumed by the population, the quantity used by the Maori population must be exceptionally regarded, as the habits of the race are not sufficiently assimilated to those of the European portion of the population to enable proportions calculated on the total population of the colony to represent fairly correct data for the European portion of the population.
It has been estimated that the consumption of tea by the members of the Maori race may be taken on an average to be not more than 1lb. per head per annum. On this basis the consumption of tea per head of the population, exclusive of Maoris, was 6.30lb. in 1890.
The Australasian Colonies are, in proportion to their population, by far the largest tea-consuming countries in the world. In 1889 the annual consumption in New South Wales was 7 1/4lb. The consumption for Australia as a whole has been given by the Government Statist of Victoria at 7.66lb., and for Tasmania at 5.35lb.; the consumption for the United Kingdom being 4.70lb., that for Canada 3.69lb., and that for the United States 1.40lb. The consumption in New Zealand is thus somewhat less than in Australia, but greater per head of population than in any other country.
The value of beer imported in 1890 differed very little from that in 1889, but there was a considerable decrease in the value of spirits imported. On the other hand, there was an increase of £3,221 in the value of wine imported in 1890. The quantity entered for consumption ex warehouse, together with that in the case of beer, upon which excise has been paid, must be taken to comprise the standard of consumption rather than the imports. On this basis there was in 1890 an increased consumption per head of population in beer, spirits, and wine, which may indicate that the previous decrease in consumption has not been wholly due to the growth of temperance habits, but to some extent to a diminished purchasing-power.
The following table gives the consumption per head of the population, including and excluding Maoris, showing separately the proportion of beer, wine, and spirits for the last ten years. The amount of beer manufactured in the colony in each year, except the quantity exported, hasbeen included, as well as the amount brought into consumption from imports:—
| Year. | Beer. | Spirits. | Wine. | |||
|---|---|---|---|---|---|---|
| Excluding Maoris. | Including Maoris. | Excluding Maoris. | Including Maoris. | Excluding Maoris. | Including Maoris. | |
* The proportions for 1890 are higher than those in the statistical volume, as the census results showed that too high an estimate had been made of the mean population in 1890. These calculations are based on a corrected estimate. | ||||||
| Gal. | Gal. | Gal. | Gal. | Gal. | Gal. | |
| 1881 | 10.215 | 9.377 | 1.159 | 1.064 | 0.335 | 0.308 |
| 1882 | 10.523 | 9.684 | 1.153 | 1.061 | 0.351 | 0.323 |
| 1883 | 9.435 | 8.709 | 1.088 | 1.005 | 0.315 | 0.291 |
| 1884 | 8.769 | 8.121 | 0.999 | 0.923 | 0.272 | 0.253 |
| 1885 | 8.414 | 7.840 | 0.899 | 0.825 | 0.261 | 0.243 |
| 1886 | 7.861 | 7.333 | 0.820 | 0.765 | 0.212 | 0.198 |
| 1887 | 7.651 | 7.148 | 0.770 | 0.719 | 0.198 | 0.185 |
| 1888 | 7.133 | 6.670 | 0.820 | 0.767 | 0.167 | 0.156 |
| 1889 | 7.624 | 7.136 | 0.598 | 0.560 | 0.176 | 0.165 |
| 1890* | 7.960 | 7.460 | 0.697 | 0.654 | 0.185 | 0.174 |
The above rates of consumption in this colony compare very favourably with the rates of consumption in other countries. This is manifest from the following statement of the annual consumption of beer and spirits per bead in various countries:*—
| — | Beer. | Spirits. |
|---|---|---|
Taken, except as regards New Zealand, from the Victorian Year Book of 1889-90. | ||
| Gal. | Gal. | |
| United Kingdom | 28.74 | 0.59 |
| Germany | 19.38 | 0.95 |
| Holland | 19.05 | 2.08 |
| South Australia | 20.04 | 0.49 |
| Victoria | 19.36 | 1.32 |
| New S'th Wales | 11.94 | 1.15 |
| United States | 10.74 | 1.34 |
| Queensland | 10.23 | 1.59 |
| Tasmania | 10.02 | 0.59 |
| Switzerland | 8.15 | 1.04 |
| New Zealand (including Maoris) | 7.46 | 0.65 |
| Austria - Hungary | 6.83 | 0.63 |
| France | 4.53 | 0.85 |
| Canada | 3.05 | 1.19 |
| Sweden | 2.52 | 1.27 |
The very considerable reduction in the rate of consumption of all these liquors within the last ten years should give great encouragement to the advocates of temperance principles in the prosecution of their work.
The quantity of tobacco entered for consumption in 1890 was 1,279,449lb., an increase of 27,636lb. on the quantity similarly entered in 1889. This gave a consumption per head of population—including Maoris, who consume large quantities of tobacco—of 1.93lb. In 1887 it was 1.91lb., and in 1888 1.92lb. The consumption in 1890 was therefore proportionately about the same.
It appears from the following statement of the consumption of tobacco in different countries† that in New Zealand it is, proportionately to population, much less than in most of the other countries named.
| Lb. | |
|---|---|
| Holland | 6.92 |
| United States | 4.40 |
| Austria-Hungary | 3.77 |
| Denmark | 3.70 |
| New South Wales | 3.53 |
| Queensland | 3.49 |
| Western Australia | 3.26 |
| Switzerland | 3.24 |
| Belgium | 3.15 |
| Germany | 3.00 |
| Victoria | 2.93 |
| Finland | 2.73 |
| Norway | 2.29 |
| Canada | 2.11 |
| France | 2.05 |
| Sweden | 1.87 |
| Tasmania | 1.85 |
| New Zealand, 1890 | 1.93 |
| South Australia, 1890 | 1.70 |
| Spain | 1.70 |
| United Kingdom | 1.41 |
| Italy | 1.34 |
| Russia | 1.23 |
There was an increase in 1890 in the value of the imports from the United Kingdom to the extent of £83,193, or nearly at the rate of 2 per cent. The increase in the value of imports from Germany amounted to £31,339—a comparatively small amount, but very large having regard to the value of imports in 1889, which amounted to only £18,964. The increase in 1890 was thus at the rate of 165 per cent.—another evidence of theenterprise of the German merchants, which has been very noticeable in recent years. The principal increases in imports from other countries were in those from Belgium, the United States, and the Fiji and Pacific islands.
Chiefly taken from the Victorian Year Book of 1889-90, and derived from a paper read by Dr. O. J. Broch before the Statistical Society of Paris, in June, 1887.
The following are the values of imports from different countries in 1889 and 1890, given in the order of the increase or decrease from each:—
| Country. | 1889. | 1890. | Increase. |
|---|---|---|---|
| £ | £ | £ | |
| United Kingdom | 4,138,077 | 4,221,270 | 83,193 |
| Germany | 18,964 | 50,303 | 31,339 |
| United States | 342,536 | 355,395 | 12,859 |
| Pacific Islands | 26,213 | 38,235 | 12,022 |
| Fiji and Norfolk Island | 127,131 | 138,274 | 11,143 |
| Belgium | 2,420 | 5,714 | 3,294 |
| Canada and New Brunswick | 3,132 | 4,100 | 968 |
| West Indies | 83 | 83 | |
| India and Ceylon | 204,373 | 132,847 | Decrease. 71,526 |
| Hongkong and China | 111,621 | 59,421 | 52,200 |
| Mauritius | 129,943 | 91,520 | 38,423 |
| Australia and Tasmania | 1,107,132 | 1,087,593 | 19,539 |
| Java | 44,026 | 36,120 | 7,906 |
| Philippine Islands | 19,239 | 12,478 | 6,761 |
| Japan | 8,297 | 5,708 | 2,589 |
| France | 7,231 | 5,851 | 1,380 |
| Other European countries | 6,978 | 6,149 | 829 |
| Asia Minor | 1,110 | 382 | 728 |
| Singapore | 7,922 | 7,384 | 538 |
| Cape Colony | 77 | 1 | 76 |
| Brazil | 5 | 5 |
The increase or decrease of imports in each provincial district in 1890 compared with those in 1889 was as follows:—
| Provincial District. | Value of Imports in 1890. | Increase on Value in 1889. | Decrease on Value in 1889. | Rate per Cent. of Increase or Decrease. |
|---|---|---|---|---|
| £ | £ | £ | ||
| Auckland | 1,406,477 | 11,190 | + 0.80 | |
| Taranaki | 24,575 | 4,868 | +21.70 | |
| Hawke's Bay | 162,097 | 11,690 | - 6.72 | |
| Wellington | 1,282,821 | 72,251 | + 5.97 | |
| Marlborough | 19,547 | 1,189 | - 5.73 | |
| Nelson | 151,422 | 4,805 | + 3.28 | |
| Westland | 93,426 | 31,697 | +51.35 | |
| Canterbury | 1,269,572 | 70,793 | - 5.28 | |
| Otago | 1,836,751 | 91,515 | - 4.75 |
The want of expansion in the value of the import trade naturally leads to a question as to the causes of the want of increase, and how far it is attributable to a diminished purchasing-power in the population.
On reviewing the value of the imports for several years past, during some of which, owing to the large sums spent out of loan, the fluctuations were considerable, the year 1880 stands out as that in which the value of imports approximated closely to that in 1890—viz., £6,162,011 in 1880, £6,260,525 in 1890, the population in the interval having increased at the rate of 29 per cent. This year, therefore, will be selected for the purpose of comparing the values of imports in that and the past year, and thus, if possible, of ascertaining to what extent changes in values may account for the want of increase in the import-values. As the volume of much of the imports has been stated in a manner that gives no indication of their weight or quantity,a comparison can only be instituted between certain kinds of goods. In the following tables only goods have been selected in respect of which the quantities imported can be fairly compared, and a large number of individually small import-value have been omitted.
The first part includes those only of which the quantity imported was greater in 1890 than in 1880. The last column shows what the value of the imports would have been if the same prices had ruled in 1890 as in 1880.
The second part deals similarly with articles of which the quantity imported in 1890 was less than in 1880.
| — | Quantity imported. | Declared Values. | Assumed Values in 1890, calculated on Values in 1880. | ||
|---|---|---|---|---|---|
| 1880. | 1890. | 1880. | 1890. | ||
| £ | £ | £ | |||
| Boots and shoes | 28,053 doz. pr. | 50,078 doz. pr. | 97,788 | 127,371 | 174,563 |
| Cocoa and chocolate | 207,430 lb. | 286,358 lb. | 16,988 | 24,488 | 23,452 |
| Fruit— | |||||
| Dried currants | 1,776,936 lb. | 2,534,023 lb. | 21,225 | 26,171 | 30,268 |
| Raisins | 832,804 lb. | 1,112,341 lb. | 15,734 | 18,938 | 21,016 |
| Unenumerated | 518,588 lb. | 550,374 lb. | 9,586 | 8,440 | 10,170 |
| Iron | |||||
| Galv. corrugated | 79,580 cwt. | 81,878 cwt. | 89,282 | 78,539 | 91,860 |
| Galv. plain sheet | 6,200 cwt. | 12,385 cwt. | 7,397 | 12,156 | 14,776 |
| Pig | 2,652 tons | 3,819 tons | 11,696 | 16,728 | 16,843 |
| Plato | 154 tons | 661 tons | 2,018 | 7,206 | 8,662 |
| Sheet | 284 tons | 971 tons | 3,900 | 11,791 | 13,299 |
| Bolts and nuts | 195 tons | 288.60 tons | 4,236 | 5,775 | 6,269 |
| Wire-fencing | 60,540 cwt. | 120,065 cwt. | 39,534 | 60,086 | 78,405 |
| Leather | 4,355 cwt. | 4,829 cwt. | 57,296 | 63,791 | 63,532 |
| Manure, bone dust | 3,187 tons | 3,713 tons | 23,264 | 20,209 | 27,104 |
| Nails | 17,082 cwt. | 35,878 cwt. | 19,024 | 27,408 | 39,957 |
| Oils— | |||||
| Castor, bulk | 47,336 gallons | 68,756 gallons | 8,142 | 9,388 | 11,826 |
| Kerosene | 512,563 gallons | 1,174,587 gallons | 28,510 | 51,405 | 65,199 |
| Linseed | 100,606 gallons | 117,156 gallons | 15,291 | 14,211 | 17,806 |
| Olives | 17,239 gallons | 36,691 gallons | 3,245 | 6,137 | 6,907 |
| Paints and colours ground in oil | 17,705 cwt. | 20,352 cwt. | 27,777 | 25,939 | 31,873 |
| Paper— | |||||
| Printing | 21,969 cwt. | 58,324 cwt. | 65,036 | 68,582 | 172,660 |
| Wrapping | 5,688 cwt. | 7,251 cwt. | 8,928 | 8,461 | 11,381 |
| Rice | 39,812 cwt. | 43,254 cwt. | 39,695 | 34,159 | 43,124 |
| Salt, coarse and fine | 5,633 tons | 8,325 tons | 15,480 | 20,434 | 22,894 |
| Seeds, grass and clover | 41,344 bush. | 117,209 bush. | 47,785 | 77,327 | 130,102 |
| Spirits, whiskey | 188,742 gallons | 198,140 gallons | 61,901 | 67,728 | 64,983 |
| Starch | 558,880 lb. | 833,347 lb. | 7,826 | 9,181 | 11,669 |
| Steel (not rails) | 128 tons | 1,828 tons | 2,910 | 28,977 | 41,558 |
| Sugar, raw | 1,870,064 lb. | 35,166,389 lb. | 22,559 | 166,595 | 424,220 |
| Tea | 3,697,906 lb. | 3,849,105 lb. | 250,765 | 154,057 | 261,018 |
| Tobacco— | |||||
| Manufactured | 934,558 lb. | 1,115,302 lb. | 55,228 | 66,492 | 65,913 |
| Cigars | 41,115 lb. | 62,473 lb. | 14,301 | 17,886 | 21,730 |
| Cigarettes | 11,114 lb. | 54,281 lb. | 4,368 | 17,785 | 21,333 |
| Varnish | 18,250 gallons | 25,163 gallons | 8,132 | 12,400 | 11,212 |
| 1,106,847 | 1,366,241 | 2,057,575 | |||
| — | Quantity imported. | Declared Values. | Assumed Values in 1890, calculated on Values in 1880. | ||
|---|---|---|---|---|---|
| 1880. | 1890. | 1880. | 1890. | ||
| £ | £ | £ | |||
| Tartaric acid | 103,206 lb. | 30,454 lb. | 8,985 | 6,035 | 7,875 |
| Bags— | |||||
| Cornsacks | 305,315 dozen | 201,501 dozen | 113,912 | 56,806 | 75,179 |
| Woolpacks | 20,977 dozen | 18,507 dozen | 35,874 | 19,381 | 31,650 |
| Beer, bottled | 371,827 gallons | 275,109 gallons | 88,328 | 53,787 | 65,352 |
| Candles | 2,048,704 lb. | 1,428,728 lb. | 57,222 | 29,002 | 39,905 |
| Cement | 115,156 barrels | 58,865 barrels | 86,212 | 33,634 | 44,070 |
| Coal | 123,298 tons | 110,932 tons | 169,550 | 102,166 | 152,555 |
| Coffee, raw | 384,561 lb. | 359,990 lb. | 18,686 | 18,251 | 17,492 |
| Fish, bottled, preserved | 1,187,996 lb. | 1,083,029 lb. | 33,668 | 24,313 | 30,693 |
| Iron, bar, bolt, and rod | 5,394 tons | 3,910 1/4 tons | 53,828 | 36,066 | 39,021 |
| Iron tanks | 3,121 No. | 2,637 No. | 12,019 | 8,908 | 10,155 |
| Jams, jellies, and preserves | 1,612,628 lb. | 254,831 lb. | 38,854 | 4,906 | 6,140 |
| Machines, sewing | 6,069 No. | 5,286 No. | 26,465 | 22,086 | 23,001 |
| Sauces | 14,223 doz. pt. | 13,000 doz. pt. | 10,996 | 7,912 | 10,050 |
| Spirits— | |||||
| Brandy | 218,274 gallons | 112,065 gallons | 109,574 | 48,827 | 56,257 |
| Geneva | 71,197 gallons | 65,585 gallons | 18,989 | 13,741 | 17,492 |
| Gin | 17,035 gallons | 8,081 gallons | 4,630 | 2,131 | 2,196 |
| Rum | 57,170 gallons | 29,746 gallons | 10,151 | 5,759 | 5,282 |
| Sugar, refined | 317,021 cwt. | 211,128 1/4 cwt. | 555,175 | 212,590 | 369,736 |
| Vinegar | 106,112 gallons | 70,599 gallons | 9,910 | 6,364 | 7,158 |
| 1,463,034 | 712,704 | 1,011,259 | |||
The declared values of the articles imported in 1890 specified in the first part, although greater than the declared values of the same articles imported in 1880 by £259,394, are, on the whole, less than what the values would have been, if the prices in 1880 had been maintained, by £691,334. So with respect to the articles in Part II.: if the prices ruling in 1880 had been maintained the declared value in 1890 would have amounted to £1,011,259, instead of £712,704.
The declared values of the articles mentioned in both tables amounted in 1890 to £2,078,945. The values, assessed at the prices that ruled in 1880, would amount to £3,068,834. This is greater than the declared values of these imports by £989,889, or to the extent of 47.61 per cent. These articles comprise only a portion of the imports in 1890; and, if the decrease in prices be assumed to apply to the rest of the imports in an equal degree, then the total value of the imports, less specie, in 1890 would have amounted, on the basis of the prices in 1880, to £8,756,642. It was stated that since 1880 the population had increased at the rate of 29 per cent. for the period. If the values of imports, less specie, in 1880 were increased at the rate of 29 per cent. the result would be £7,736,338,or about one million less than the amount would have been in 1890 calculated on the prices in 1880. This indicates that the cause of the want of increase in the value of the imports has not been due to decreased consumption but to reduced prices, in consequence of which there has been an equal or greater proportionate consumption of goods in 1890 at a less cost to the colony than in 1880. There is also this further consideration: that there is a large decrease in the imports of many kinds of goods which are produced in the colony. The reduction in the quantities imported of these kinds does not so much imply diminished consumption thereof as that the requirements were met by local production, for, as the assumed values of all imports in 1890, computed on the prices that obtained in 1880, show a higher proportionate increase on the value in 1880 than the increase on the population between the same years, it is manifest that any large reduction in the quantity and value of one class of imports necessitates an increase in other classes to maintain the amount of the values.
This also applies to the great reduction in the quantities as well as values of the imports of spirits between 1880 and 1890, a reduction, as to quantities, really a matter for congratulation, as evidencing habits of greater temperance on the part of the younger and growing than of the elder members of the population, and also showing, for the reason given, an increased consumption on other goods of a more useful and beneficial character. The decrease in the quantity of spirits imported in 1890 amounted to 25.13 per cent. on the quantity (gallons) imported in 1880—this with an increase of population to the extent of 29 per cent.
The value of all the exports in 1890 was £9,811,720, against 9,311,864 in 1889, an increase of £469,856. The exports in 1889 were of greater value than those in 1888 by £1,571,940. The value of exports in 1890 was thus greater than that in 1888 by £2,041,796, an increase for the two years at the rate of over 26 per cent. The value of New Zealand produce exported in 1890 amounted to £9,428,761, being at the rate of £15 3s. 5d. per head of population. In 1889 the value of home produce exported was £9,044,607.
In the following table the principal articles of New Zealand produce exported in the last two years are stated, with the export values of each, and the increase or decrease during the past year:—
| Principal Articles exported. | 1889. | 1890. | Increase. | Decrease. |
|---|---|---|---|---|
| £ | £ | £ | £ | |
| Wool | 3,976,375 | 4,150,599 | 174,224 | ... |
| Tallow | 159,460 | 162,471 | 3,011 | ... |
| Hides | 41,641 | 35,906 | ... | 5,735 |
| Sheepskins and pelts | 110,608 | 122,790 | 12,182 | ... |
| Rabbitskins | 96,039 | 111,880 | 15,841 | ... |
| Gold | 785,490 | 751,360 | ... | 34,130 |
| Coal | 76,228 | 67,003 | ... | 9,225 |
| Silver and minerals | 23,586 | 21,054 | ... | 2,532 |
| Flour | 158,296 | 87,368 | ... | 70,928 |
| Bran and sharps | 46,270 | 26,924 | ... | 19,346 |
| Wheat | 489,728 | 672,247 | 182,519 | ... |
| Barley | 85,778 | 33,425 | ... | 52,353 |
| Malt | 9,839 | 21,304 | 11,465 | ... |
| Oats | 360,086 | 231,397 | ... | 128,689 |
| Beans and peas | 25,228 | 28,613 | 3,385 | ... |
| Oatmeal | 27,377 | 16,524 | ... | 10,853 |
| Potatoes | 93,996 | 80,794 | ... | 13,202 |
| Hops | 15,963 | 9,528 | ... | 6,435 |
| Grass-seed | 45,181 | 24,605 | ... | 20,576 |
| Live-stock— | ||||
| Cattle | 10,425 | 7,151 | ... | 3,274 |
| Horses | 20,728 | 29,700 | 8,972 | ... |
| Sheep | 3,764 | 2,761 | ... | 1,003 |
| Butter | 146,840 | 122,701 | ... | 24,139 |
| Cheese | 67,105 | 84,986 | 17,881 | ... |
| Bacon and hams | 31,156 | 32,128 | 972 | ... |
| Salt beef and pork | 28,853 | 20,322 | ... | 8,531 |
| Preserved meats | 106,772 | 136,182 | 29,410 | ... |
| Frozen meats | 783,374 | 1,087,617 | 304,243 | ... |
| Sausage-skins | 12,993 | 21,568 | 8,575 | ... |
| Fish | 9,909 | 7,714 | ... | 2,195 |
| Oysters Leather | 8,745 | 7,044 | ... | 1,701 |
| Leather | 65,361 | 67,966 | 2,605 | ... |
| Ale and beer | 1,982 | 1,827 | ... | 155 |
| Soap | 2,804 | 4,963 | 2,159 | ... |
| Woollen manufactures | 30,841 | 13,317 | ... | 17,524 |
| Phormium (N.Z. hemp) | 361,185 | 381,789 | 20,607 | ... |
| Timber— | ||||
| Sawn and hewn | 177,608 | 181,689 | 4,081 | ... |
| Logs | 124 | 5 | ... | 119 |
| Kauri-gum | 329,590 | 378,563 | 48,973 | ... |
| Fungus | 15,903 | 12,823 | ... | 3,080 |
It will be observed that the increase in the value of exports was almost confined to pastoral products, as wool, meat, &c., the increase in that class having amounted to £527,907. There was a decrease in the value of exports of both dairy and agricultural produce; in the last to the extent of £134,433, for, although there was a large increase in the value of wheat exported, this was more than counterbalanced by a decrease in the values of other agricultural exports—barley, oats, flour, &c. There was an increase of £48,973 in the value of kauri-gum exported, and the largest item in our manufactures—Phormium— gave an increase to the value of £20,607. There was again a reduction in the value of gold exported; and the coal export, which in 1889 was greater in value by £14,861 than in 1888, decreased in value in 1890 by £9,225.
The following table gives the values of the several exports of New Zealand produce in each of the past ten years:—
| Year | Wool. | Gold. | Frozen Meat. | Butter and Cheese. | Agricultural Produce. | Manufactures | Other N.Z. Produce. | Total. |
|---|---|---|---|---|---|---|---|---|
| £ | £ | £ | £ | £ | £ | £ | £ | |
| 1881 | 2,909,760 | 996,867 | ... | 14,608 | 1,089,739 | 87,321 | 363,955 | 5,762,250 |
| 1882 | 3,118,554 | 921,664 | 19,339 | 62,218 | 1,169,020 | 121,447 | 841,108 | 6,253,350 |
| 1883 | 3,014,211 | 892,445 | 118,328 | 48,912 | 1,537,015 | 121,446 | 1,1,887 | 6,855,244 |
| 1884 | 3,267,527 | 988,953 | 345,090 | 91,667 | 968,517 | 104,485 | 6,942,486 | |
| 1885 | 3,205,275 | 890,056 | 373,857 | 138,129 | 688,415 | 120,539 | 1,175,640 | 6,591,911 |
| 1886 | 3,072,971 | 939,648 | 427,193 | 151,194 | 688,804 | 109,656 | 997,216 | 6,386,682 |
| 1887 | 3,321,971 | 747,878 | 455,870 | 109,483 | 588,022 | 124,382 | 1,204,372 | 6,551,081 |
| 1888 | 3,115,098 | 914,309 | 628,800 | 197,170 | 905,907 | 233,383 | 1,260,461 | 7,255,128 |
| 1889 | 3,976,375 | 785,490 | 783,374 | 213,945 | 1,424,297 | 569,880 | 1,288,647 | 9,042,008 |
| 1890 | 4,150,599 | 751,360 | 1,087,617 | 207,687 | 1,289,864 | 547,947 | 1,393,687 | 9,428,761 |
The most important items of export under the heading “Other New Zealand Produce” are coal, silver and minerals, kauri-gum, timber, bacon, salted and preserved meats, tallow, sheep- and rabbit-skins, hides, horses, and sausage-skins, of which the total value in 1890 was £1,321,261. The export-value of each item is given in the table on page 93.
Of the exports in 1890, the produce of other countries exported, exclusive of specie, amounted in value to £140,555. Although this amount is slightly more than the similar value in the previous year, yet it is evident, from the figures hereunder given, that the re-export trade of the colony is practically stationary.
| £ | |
|---|---|
| 1881 | 132,868 |
| 1882 | 142,115 |
| 1883 | 156,781 |
| 1884 | 147,741 |
| 1885 | 146,951 |
| 1886 | 147,831 |
| 1887 | 129,691 |
| 1888 | 148,078 |
| 1889 | 139,347 |
| 1890 | 140,555 |
With these amounts may be compared the re-export trade of New South Wales, having less than double the population of this colony, which, exclusive of specie, amounted in 1890 to £2,614,386, of which those to New Zealand were of the value of £105,654.
The quantity of wool exported in 1889 was greater than in any previous year by 11,373,610 lb.; the quantity exported in £390 was greater than that in 1889 by 589,723 lb. The value of the wool exported in 1890 was £1,150,599, an increase of £174,221 on 1889. The annual production and the increase can be best estimated by taking the exports for the twelve months immediately preceding the commencement of shearing, and adding thereto the quantity used in the colony for manufacturing purposes.
The following shows the produce on that basis for the last ten years ending respectively on the 30th September:—
| Year ending 30th September. | Quantity exported. | Quantity purchased by Local Mills. | Total Annual Produce. |
|---|---|---|---|
| Lb. | Lb. | Lb. | |
| 1881 | 60,477,151 | 1,500,000 | 61,977,151 |
| 1882 | 64,402,712 | 2,200,000 | 66,602,712 |
| 1883 | 72,842,949 | 1,900,000 | 74,742,919 |
| 1884 | 77,022,894 | 1,580,000 | 78,602,894 |
| 1885 | 78,174,034 | 1,922,932 | 80,096,966 |
| 1886 | 89,485,757 | 1,879,999 | 91,365,756 |
| 1887 | 95,914,181 | 2,001,155 | 97,915,336 |
| 1888 | 89,276,268 | 4,079,563 | 93,355,831 |
| 1889 | 95,618,507 | 3,556,004 | 99,174,511 |
| 1890 | 102,522,185 | 2,979,293 | 105,501,478 |
Thus, instead of the wool-clip for the season having been greater in 1890 than in 1889 by only 589,23 lb., as seemedthe case from a consideration of the exports for the calendar years, the real increase was 6,326,967 lb., this notwithstanding the large increase in the export of rabbit-skins from 11,342,778 in number in 1889 to 12,543,293 in 1890, which does not indicate any great relief from the rabbit-pest. The increase in the wool-production is to a large extent due to the greater number of sheep—namely, 16,116,328 in May, 1890, against 15,423,328 in May, 1889. But it will be apparent from the following table that the tendency of increase is in the direction of the multiplication of the smaller flocks, the owners of which would be better able to cope with the rabbit difficulty than the large run-holders:—
| Size of Flocks. | 1881. | 1882. | 1883. | 1884. | 1885. | 1880. | 1887. | 1888. | 1889. | 1890. |
|---|---|---|---|---|---|---|---|---|---|---|
| Under 500 | 4,727 | 4,685 | 5,039 | 5,422 | 5,622 | 6,024 | 6,247 | 6,579 | 7,063 | 7,662 |
| 500 and under 1,000 | 704 | 844 | 970 | 1,033 | 1,146 | 1,189 | 1,139 | 1,182 | 1,381 | 1,528 |
| 1,000 and under 2,000 | 500 | 552 | 609 | 672 | 718 | 747 | 723 | 794 | 826 | 854 |
| 2,000 and under 5,000 | 350 | 416 | 467 | 473 | 505 | 532 | 531 | 524 | 597 | 586 |
| 5,000 and under 10,000 | 236 | 225 | 244 | 256 | 270 | 263 | 289 | 287 | 279 | 283 |
| 10,000 and under 20,000 | 201 | 209 | 200 | 211 | 213 | 228 | 221 | 213 | 239 | 236 |
| 20,000 and upwards | 139 | 133 | 149 | 154 | 157 | 166 | 166 | 166 | 152 | 160 |
| Totals | 6,857 | 7,064 | 7,678 | 8,221 | 8,631 | 9,149 | 9,316 | 9,745 | 10,537 | 11,309 |
The amount of gold exported in 1890 was 187,641 oz., being less by 9,851 oz. than the amount in 1889, but the produce (represented by the amount entered for duty) in 1890 was 193,193oz.
The total quantity of gold entered for duty to the 31st December, 1890, which may be stated as approximately the amount obtained in the colony, was 11,818,221oz., of the value of £46,425,629.
The large increase in 1890 in the value of frozen meat exported placed that article in the second place in the list of exports for value. The growth of this export has been almost phenomenal. Ten years ago the project of sending fresh meat to England was regarded as impossible of fulfilment, and Mr. Haslam's statement that vessels would be able to carry carcases of 10,000 sheep was considered visionary. The improvements made by him inrefrigerating machinery have enabled his prophecy to be more than fulfilled, as vessels are now fitted to carry four and five times the number of sheep he mentioned. 1882 was the first year in which there was any export of frozen meat from New Zealand, the value of the export having been then only £19,339. In 1890 the value-of this export had risen to £1,087,617, representing the carcases of 1,330,176 sheep, of 279,741 lambs, and parts of carcases— which weighed 98,234cwt.—of bullocks. The greatly improved prices of sheep, caused by the demand for this export trade, has much encouraged the farmers of the colony, and has caused increased attention to be given to clearing and laying-down bush-land in grass, and otherwise improving holdings in order to increase the bearing-capabilities of the land. Notwithstanding the large increase in the numbers of sheep exported in 1890, the sheep returns for May in that year gave an addition of nearly 700,000 on the number in May of the previous year, thus showing that, even with the present flocks, there is a reserve that might supply a much larger export than at present, and the further progressive increase in the number of sheep that may be looked forward to from the extension of clearing and improvements gives promise of a future export of a magnitude possibly manifold greater than the present. The markets of the civilised world are, having regard to the growth of population, without a corresponding increased area for food-production, practically unlimited. This export has had the effect of helping the colony through a period of great depression, and, next to the production of wool, with which it is now inseparably connected, may be regarded as the most important factor in our well-being. It would be an idle speculation to consider in what condition New Zealand would have been, had the process for meat-freezing now in use not been discovered, but there can be no doubt that it has been of almost incalculable value to this colony. The rapid growth of the frozen-meat export, and its relative importance to other articles of export, may be ascertained by a reference to the figures given in the table on page 94.
To ascertain the total value of the meat export in 1890 it is necessary to take into consideration the value of preserved meats, amounting to £136,182; of salted beef and pork, £20,322; and of bacon and hams, £32,128.
The grain exported was, on the whole, of more value than in 1889 by £16,327. The wheat export was more valuable by £182,519, that of malt by £11,465, and that of beans and peas by £3,385; but there was a decrease in 1890 in the value of oats exported to the extent of £128,689, and of barley to the extent of £52,353. There was a decrease in the quantity of butter exported in 1890, although the quantity exported to the United Kingdom, which promises to be our best market for this export, was greater by 5,480cwt.
There was a decrease in the quantity of butter exported to New South Wales from 10,457cwt. in 1889 to 1,980cwt. in 1890, but an increase in the quantity to Victoria from 2,250cwt. in 1889 to 4,239cwt. in 1890. If the export of butter is to assume any large dimensions it must be by producing an article suitable to the requirements of the English market, for on that must the colony chiefly rely. It has been satisfactorily proved that butter can be delivered from New Zealand in good condition in England, and that for good samples remunerative prices are obtainable; but it is necessary that the butter sent should be not only of good quality, but uniform in quality and colour. This can only be obtained by the operations of butter-factories. Upon the multiplication of these the future of the butter-export trade, with all its great possibilities, seems to depend.
There was an increase of 13,893cwt. in the quantity of cheese exported in 1890. 31,043cwt., or nearly 77 per cent. of the total quantity exported, was sent to the United Kingdom. The next largest quantity exported to any other country was 4,528cwt. to Queensland.
The following statement shows the total quantity of butter and cheese exported in the past six years, and the amount of each sent to the United Kingdom:—
| Year. | Total Export of Butter. | Butter exported to the United Kingdom. | Total Export of Cheese. | Cheese exported to the United Kingdom. |
|---|---|---|---|---|
| Cwt. | Cwt. | Cwt. | Cwt. | |
| 1885 | 24,923 | 273 | 15,245 | 272 3/4 |
| 1886 | 23,175 | 635 | 16,429 | 17 |
| 1887 | 17,018 | 6,937 | 23,913 | 9,900 3/4 |
| 1888 | 29,995 | 11,460 | 36,682 | 25,436 1/4 |
| 1889 | 37,955 | 21,099 | 26,558 | 7,633 |
| 1890 | 34,816 | 26,579 | 40,451 | 31,043 |
These figures abundantly illustrate not only our power to place satisfactory produce on the English market, but also the importance of that market as an outlet for an increase in our production.
The quantity of Phormium exported in 1890 was greater than in 1889, notwithstanding a decrease in the price, which in the export-values amounted to £3 2s. per ton. The low price obtained for this product is apparently now discouraging production, as the quantity already exported this year, 1891, is much less than in the corresponding period of 1890. Any considerable increase in the value of the fibre will doubtless result in temporarily increasing the production; but a large permanent development of this industry depends upon the invention of improvements in the machinery used that will result in lessening the cost of production and improving the quality of the fibre.
It will be observed that the value of kauri-gum exported increased from £329,590 in 1889 to £378,563 in 1890. The increase is due to higher prices realised, as the quantity produced was 7,438 tons in 1890, against 7,519 in 1889.
This article is obtained only in the extreme northern part of this colony; nowhere else in the world. It is found over a large area of land north of Auckland, which in long-past periods was covered with kauri forests thathave quite disappeared, by probing the ground with a pointed instrument. When discovered it has to be dugout from a depth of from 2ft. to 3ft. below the surface. The industry has for many years afforded employment to a large number of persons. The gum was an exudation from the trees that formerly existed on the now barren sites, as the land where the gum is found is almost, if not quite, worthless for the purpose of cultivation.
The following table gives the value of the exports from each of the ports for the years 1889 and 1890, with the increase or decrease for the past year:—
| — | 1889. | 1890. | Increase | Decrease. | Rate of Increase or Decrease per Cent. |
|---|---|---|---|---|---|
| £ | £ | £ | £ | ||
| Lyttelton | 2,021,225 | 2,251,412 | 230,187 | .. | + 11.38 |
| Wellington Dunedin | 3,386,922 | 1,506,383 | 119,461 | .. | + 8.61 |
| Dunedin | 1,210,397 | 1,117,011 | .. | 93,386 | - 7.71 |
| Auckland | 1,042,087 | 1,237,600 | 195,513 | .. | + 18.76 |
| Napier | 1,000,382 | 963,520 | .. | 36,862 | - 3.68 |
| Timaru | 665,638 | 624,809 | .. | 40,829 | - 6.13 |
| Invercargill and Bluff | 477,949 | 475,997 | .. | 1,952 | - 0.41 |
| Oamaru | 474,818 | 464,017 | .. | 10,801 | - 2.06 |
| Greymouth | 180,241 | 237,700 | 57,459 | .. | + 31.88 |
| Wairau | 154,455 | 87,314 | .. | 67,141 | - 43.47 |
| Wanganui | 131,473 | 118,615 | .. | 12,858 | - 9.78 |
| Poverty Bay | 126,097 | 183,700 | 57,603 | .. | + 45.68 |
| Kaipara | 90,839 | 78,906 | .. | 11,933 | - 13.13 |
| Hokitika | 86,876 | 87,409 | 533 | .. | - 0.61 |
| Nelson | 85,229 | 68,658 | .. | 16,571 | - 19.44 |
| New Plymouth | 61,520 | 61,968 | 448 | .. | + 0.73 |
| Picton | 47,849 | 140,716 | 92,867 | .. | + 194.08 |
| Patea | 35,222 | 34,708 | .. | 516 | - 1.46 |
| Westport | 30,365 | 43,956 | 13,591 | .. | 44.76 |
| Russell | 17,344 | 19,264 | 1,920 | .. | + 11.07 |
| Hokianga | 5,451 | .. | .. | 5,451 | - Inf. |
| Mongonui | 3,069 | 2,803 | .. | 266 | 8.67 |
| Whangaroa | 3,027 | .. | .. | 3,027 | - Inf. |
| Tauranga | 790 | 33 | .. | 757 | - 95.82 |
The total value of the external trade in 1890 was £16,072,245, equivalent to £25 17s. 9d. per head of the population, excluding Maoris. In 1889 the corresponding amount per head was £25 9s. 11d. The highest record was in 1873, when the total trade per head amounted to £41 19s. 3d., the imports, in consequence of the largeexpenditure of borrowed money, having then amounted to £22 9s. 4d. per head, against £10 1s. 8d. in 1890.
For reasons which have been given in previous years, it has been the practice to exclude the Maori population from consideration in estimating the trade per head, for, although they have an influence on the amount of trade, that influence is proportionately so much less than in the case of Europeans that a nearer approximation to correctness in respect of the amount per head of the European portion of the population is obtained by excluding than by including; them. The effect of including them would be to reduce the proportion from £25 17s. 9d. to £24 5s. 4d.
The values of imports and exports per head of population, excluding Maoris, were, for each of the past ten years, as follow:—
| Year. | Imports per Head. | Exports per Head. | Total. | ||||||
|---|---|---|---|---|---|---|---|---|---|
| £ | s. | d. | £ | s. | d. | £ | s. | d. | |
| 1881 | 15 | 2 | 3 | 12 | 5 | 8 | 27 | 7 | 11 |
| 1882 | 16 | 18 | 1 | 13 | 1 | 5 | 29 | 19 | 6 |
| 1883 | 15 | 1 | 3 | 13 | 8 | 2 | 28 | 9 | 5 |
| 1884 | 13 | 17 | 4 | 12 | 16 | 8 | 26 | 14 | 0 |
| 1885 | 13 | 4 | 9 | 12 | 1 | 5 | 25 | 6 | 2 |
| 1886 | 11 | 12 | 2 | 11 | 9 | 3 | 23 | 1 | 5 |
| 1887 | 10 | 9 | 5 | 11 | 10 | 3 | 21 | 19 | 8 |
| 1888 | 9 | 16 | 4 | 12 | 16 | 7 | 22 | 12 | 11 |
| 1889 | 10 | 5 | 6 | 15 | 4 | 5 | 25 | 9 | 11 |
| 1890 | 10 | 1 | 8 | 15 | 16 | 1 | 25 | 17 | 9 |
The trade with the United Kingdom amounted to £11,622,620, being an increase of £896,627 on that in 1889. This trade comprised 72.3 per cent. of the total trade in 1890, against 68.6 per cent. in 1889.
The trade with the Australian Colonies and Tasmania in 1890 amounted to £2,721,811, against £3,252,803 in 1889, a decrease of £530,962, which was chiefly caused by a contraction in the value of exports from New Zealand to those colonies to the extent of £511,423. The trade with New South Wales amounted to £1,261,561, of which theexports thereto amounted in value to £885,737; which included New Zealand produce to the extent of £770,679, or to more than double the value of all the imports from New South Wales, which amounted in 1890 to £375,824. The trade with Victoria amounted to £1,157,585, a decrease on the amount in 1889 of £,201,852. The exports thereto amounted to £567,727 in value; of these, the value of New Zealand produce was £410,569, including gold of the value of £290,674.
The amount of colonial produce sent to New Zealand from the Australian Colonies is small compared with the amount of New Zealand produce sent to Australia. This is shown by the following table-statement of the trade between New Zealand and New South Wales and Victoria:—
| Exports from New Zealand to | New Zealand Produce. | Total Export. |
|---|---|---|
| £ | £ | |
| New South Wales, 1890 | 770,679 | 885,737 |
| Victoria, 1890 | 440,569 | 567,727 |
| Exports to New Zealand from | Home Produce. | Total Export to New Zealand. |
| £ | £ | |
| New South Wales, 1890 | 142,071 | 294,113 |
| Victoria, 1889 | 147,998 | 356,212 |
Of the £142,071 exported from New South Wales, £86,453 was the value of the coal sent. Of the £147,998 exported from Victoria, £110,000 consisted of gold coin minted in Melbourne.
The trade with Fiji made again an advance in the year. In 1888 it was £149,839; in 1889, £170,181; and in 1890, £184,684. The trade with the other Pacific islands and Norfolk Island increased from £127,727 to £135,592.
The trade with the United States increased greatly in 1800—viz., from £683,798 in 1889 to £938,529, this last amount being the greatest on record. The following table shows the value of the total trade with that country in each of the past ten years:—
| Year. | Imports from | Exports to | Total Trade. | ||
|---|---|---|---|---|---|
| Atlantic Ports. | Pacific Ports. | Atlantic Ports. | Pacific Ports. | ||
| £ | £ | £ | £ | £ | |
| 1881 | 302,138 | 41,507 | 116,629 | 239,158 | 699,432 |
| 1882 | 398,153 | 65,340 | 126,583 | 308,101 | 898,177 |
| 1883 | 357,871 | 61,379 | 158,426 | 272,563 | 850,239 |
| 1884 | 300,185 | 48,372 | 183,939 | 30,430 | 562,926 |
| 1885 | 366,873 | 34,659 | 130,053 | 274,825 | 806,410 |
| 1886 | 304,571 | 32,751 | 166,926 | 80,474 | 584,722 |
| 1887 | 263,377 | 35,359 | 241,388 | 168,092 | 708,216 |
| 1888 | 265,864 | 37,205 | 204,302 | 119,414 | 646,785 |
| 1889 | 307,156 | 35,280 | 242,778 | 98,584 | 683,798 |
| 1890 | 321,047 | 34,348 | 364,332 | 218,802 | 938,529 |
Of the exports to the United States in 1890 the value of New Zealand products amounted to £478,594, the principal items being the following: Kauri-gum, £262,213; Phormium, £138,416; gold, £63,681; sheepskins, £5,010; and sausage-skins, £1,756. No wool was exported thither in 1890.
The trade with India decreased from £217,316 in 1889 to £137,389 in 1890—at the rate of 37 per cent. The value of imports fell from £204,373 to £132,817, and that of exports thereto from £12,973 to £4,542. These exports in 1890 consisted mainly of three items—viz., horses, of the value of £3,050; cheese, £538; and preserved meats, £631; leaving only £499 for distribution among minor items.
Ceylon and Burmah, are included in the term India, but the imports from Ceylon increased from £10,227 in 1889 to £19,264 in 1890.
The following table gives the value of the imports and exports of the Australasian Colonies for the year 390:—
| Colony. | Total Value of | Excess of | ||
|---|---|---|---|---|
| Imports. | Exports. | Imports over Exports. | Exports over Imports. | |
| £ | £ | £ | £ | |
| Queensland | 15,066,700 | 8,554,512 | .. | 3,487,812 |
| New South Wales | 22,615,004 | 22,045,937 | 569,067 | .. |
| Victoria | 22,954,015 | 13,266,222 | 9,687,793 | .. |
| South Australia | 8,262,673 | 8,827,378 | .. | 564,705 |
| Western Australia | 874,447 | 671,813 | 202,634 | .. |
| Tasmania | 1,897,512 | 1,486,992 | 410,520 | .. |
| New Zealand | 6,260,525 | 9,811,720 | .. | 3,551,195 |
| Totals | 67,930,876 | 64,664,574 | 3,266,302 | .. |
The trade per head of the population in each of the colonies was as follows:—
| Colony. | Imports. | Exports. | Total Trade. | ||||||
|---|---|---|---|---|---|---|---|---|---|
| £ | s. | d. | £ | s. | d. | £ | s. | d. | |
| Queensland | 12 | 4 | 4 | 20 | 12 | 7 | 32 | 16 | 11 |
| New South Wales | 20 | 14 | 4 | 20 | 0 | 0 | 40 | 10 | 4 |
| Victoria | 20 | 15 | 5 | 11 | 17 | 3 | 32 | 7 | 8 |
| South Australia | 26 | 10 | 6 | 28 | 6 | 9 | 54 | 17 | 3 |
| Western Australia | 19 | 7 | 8 | 14 | 17 | 10 | 34 | 5 | 6 |
| Tasmania | 13 | 4 | 0 | 10 | 6 | 11 | 23 | 10 | 11 |
| New Zealand (exclusive of Maoris) | 10 | 1 | 8 | 15 | 16 | 1 | 25 | 17 | 9 |
The values of the exports of these colonies—chiefly those of New South Wales, Victoria, and South Australia—are largely increased by the inclusion of articles the produce or manufacture of other colonies and countries.
The following shows the value of home productions or manufactures exported from each colony in 1890, and the rate per head of the population:—
| Colony. | Home Produce exported. | Per Head of Population. | ||
|---|---|---|---|---|
| £ | £ | s. | d. | |
| Queensland | 8,412,244 | 20 | 5 | 8 |
| New South Wales | 17,232,725 | 15 | 12 | 8 |
| Victoria | 10,291,821 | 9 | 4 | 0 |
| South Australia | 4,410,062 | 14 | 3 | 2 |
| Western Australia | 659,661 | 14 | 12 | 5 |
| Tasmania | 1,430,806 | 9 | 19 | 1 |
| New Zealand | 9,428,761 | 15 | 3 | 9 |
The amount of the trade of each of these colonies with the United Kingdom in 1890 is set forth below:—
| Colony. | Imports from the United Kingdom. | Exports to the United Kingdom. | Total Trade with the United Kingdom. |
|---|---|---|---|
| £ | £ | £ | |
| Queensland | 2,120,071 | 2,365,673 | 4,485,744 |
| New South Wales | 8,628,007 | 6,623,431 | 15,251,438 |
| Victoria | 9,607,193 | 6,850,014 | 16,457,207 |
| South Australia | 2,483,416 | 4,296,647 | 6,780,063 |
| Western Australia | 415,149 | 335,162 | 750,311 |
| Tasmania | 680,760 | 323,239 | 1,003,999 |
| New Zealand | 4,221,270 | 7,401,350 | 11,622,620 |
The following statement shows the relative importance of the Australasian Colonies as markets for the productions of the United Kingdom:—
| £ | £ | |
|---|---|---|
| British India and Ceylon | 34,562,616 | |
| United States | 32,068,128 | |
| Australasia— | ||
| Queensland | 2,128,216 | |
| New South Wales | 7,334,666 | |
| Victoria | 7,101,348 | |
| South Australia | 2,040,559 | |
| Western Australia | 464,209 | |
| Tasmania | 609,344 | |
| New Zealand | 3,314,482 | |
| Fiji | 13,180 | |
| 23,006,004 | ||
| Germany | 19,293,626 | |
| France | 16,567,927 | |
| Holland | 10,121,160 | |
| China and Hongkong | 9,138,429 | |
| Cape of Good Hope and Natal | 9,128,164 | |
| Argentine Republic | 8,416,112 | |
| Italy | 7,757,862 | |
| Belgium | 7,638,712 | |
| Brazil | 7,458,628 | |
| Canada | 6,827,023 | |
| Turkey | 6,778,061 | |
| Russia | 5,751,601 | |
| Spain | 4,999,705 | |
| Japan | 4,081,793 | |
| Egypt | 3,381,830 | |
| Chili | 3,130,072 | |
| Sweden | 3,061,976 |
The exports of home produce to other countries did not in any case amount to £3,000,000.
The amounts given as the value of exports of home produce from the United Kingdom to the several Australasian Colonies differ; widely from the values given of all imports into the colonies from the United Kingdom, because the latter include more than British products, and the twelve months for arrival into the colonies of those exports would not correspond with the twelve months during which they were exported: the time of transit must be allowed for.
The Australian Colonies as a whole, with a population under 4,000,000, thus takes third place in importance as consumers of British produce, the exports thereto being about two-thirds of the value of the similar exports to British India, with its 285,000,000 inhabitants.
The principal productions of these colonies will, for a lengthened period, consist of those arising from pastoral, agricultural, and mining pursuits. The immense areas of land capable of improvement and more beneficial occupation, and the large mineral resources only partially developed, forbid any expectation for a very considerable time of such an increase in manufacturing industries as would enable colonial to supersede English products to any very material extent. The consumption per head of the population may be somewhat less in the future as theproportion of adults decreases owing to lessened immigration and increase by births; but the relatively high rates of wages, and the absence of causes for any extensive pauperism, will make the proportionate consumption of products for a long time high. The rapid growth of the Australasian population may thus be expected to largely increase the demand for British products, and the future of the trade between the United Kingdom and the Australasian Colonies will probably be such as to make them by a long way the principal markets for those products, and very important factors in the progress of the Imperial commonwealth.
There were 1,185 post-offices in New Zealand at the end of 1890, being an increase of 18 on the number in 1889.
There was again in 1890 a large increase in the number of letters, post-cards, book-packets, &c., delivered and posted, and of newspapers posted. In 1889 there was a decrease in the number of newspapers delivered. The increase in 1890 is eighteen times greater than the decrease in 1889. The following were the numbers delivered and posted in each of the past two years, and the increase in each case:—-
| — | 1889. | 1890. | Increase in 1800. |
|---|---|---|---|
| Letters delivered | 21,274,390 | 22,415,203 | 1,140,867 |
| Letters posted | 21,026,837 | 21,501,937 | 475,100 |
| Post-cards delivered | 914,342 | 1,019,434 | 105,092 |
| Post-cards posted | 935,818 | 991,005 | 55,247 |
| Books and parcels delivered | 2,004,719 | 2,838,329 | 233,010 |
| Books and parcels posted | 2,776,774 | 3,320,801 | 544,027 |
| Newspapers delivered | 8,448,635 | 9,221,212 | 772,577 |
| Newspapers posted | 8,272,381 | 8,691,522 | 419,141 |
The average number of letters, &c., posted per head of the population in each of the past three years was—
| — | 1888. | 1889. | 1890. |
|---|---|---|---|
| Letters | 32.22 | 34.25 | 34.64 |
| Post-cards | 1.37 | 1.52 | 1.60 |
| Books and parcels | 3.91 | 4.52 | 5.35 |
| Newspapers | 12.79 | 13.48 | 14.00 |
The facilities afforded for the transmission of parcels through the Post Office to places within and without the colony have proved of much convenience to the public, and the number of parcels posted is largely increasing annually. The regulations admit of parcels up to 5lb. in weight being sent to the United Kingdom, India, and the Australian Colonies, except to New South Wales, Queensland, and Fiji, the limit for these being 3lb. for bonâ fide patterns, &c. The limit for inland parcels is 11lb.
The following shows the number and weight of parcels posted in the last three years. The word “parcels” in the previous table includes the parcels herein mentioned:—
| 1888. | 1889. | 1890. | ||||
|---|---|---|---|---|---|---|
| No. | Weight. | No. | Weight. | No. | Weight. | |
| lb. | lb. | lb. | ||||
| Parcels posted | 79,778 | 204,723 | 104,586 | 281,767 | 121,292 | 336,644 |
The following table shows the number of parcels exchanged with the United Kingdom and the Australian Colonies in 1890:—
| Country. | Number of Parcels. | |
|---|---|---|
| Received. | Despatched. | |
| United Kingdom and Foreign Offices, viâ London | 13,491 | 2,693 |
| Victoria | 1,426 | 751 |
| South Australia | 71 | 88 |
| Tasmania | 45 | 128 |
| Western Australia | 2 | 19 |
The declared value of the parcels received from places outside the colony was £13,834, on which the Customs duty amounted to £2,375 19s. 3d.
During 1890, 176,427 money-orders, for a total amount of £602,077 1s. 11d., were issued by the various post-offices in the colony. In the previous year the number was 172,076, representing the amount of £589,515 14s. 9d. The money-orders from places beyond New Zealand which were paid in the colony numbered 21,106, for the amount of £75,865 17s. 11d.
The cost of the various mail services between England and New Zealand was, in each of the years 1889 and 1890, as follows:—
| 1889. | 1890. | |||||
|---|---|---|---|---|---|---|
| £ | s. | d. | £ | s. | d. | |
| Payments— | ||||||
| Subsidies &c. | 21,876 | 13 | 8 | 12,272 | 17 | 2 |
| Light-dues, interprovincial and other charges | 5,517 | 14 | 4 | 4,426 | 15 | 6 |
| 27,394 | 8 | 0 | 16,519 | 12 | 8 | |
| Receipts— | ||||||
| Postages collected in england and the colony | 25,295 | 14 | 1 | 22,816 | 5 | 3 |
| Payments by non - contracting colonies | 5,011 | 8 | 4 | 1,169 | 8 | 5 |
| 30,307 | 2 | 5 | 23,985 | 13 | 8 | |
| Profit to the colony | 2,912 | 14 | 5 | 7,466 | 1 | 0 |
| 1889. | 1890. | |||||
|---|---|---|---|---|---|---|
| £ | s. | d. | £ | s. | d. | |
| Payments— | ||||||
| On weight, bonus, &c. | 16,544 | 16 | 10 | 13,272 | 8 | 9 |
| Light-dues and interprovincial service | 3,936 | 0 | 0 | 3,864 | 0 | 0 |
| 20,480 | 16 | 10 | 17,136 | 8 | 9 | |
| Receipts— | ||||||
| Postages collected in england and the colony | 15,189 | 0 | 0 | 14,161 | 10 | 4 |
| Cost to the colony | 5,291 | 16 | 8 | 2,974 | 18 | 5 |
| 1889. | 1890. | |||||
|---|---|---|---|---|---|---|
| £ | s. | d. | £ | s. | d. | |
| Payments— | ||||||
| To P. and O. and Orient Lines | 519 | 8 | 4 | 575 | 8 | 1 |
| Transit across Europe | 28 | 13 | 2 | 30 | 16 | 3 |
| Intercolonial services, &c. | 212 | 19 | 4 | 208 | 3 | 11 |
| 761 | 0 | 10 | 814 | 8 | 3 | |
| Receipts— | ||||||
| Postages collected in England and the colony | 862 | 17 | 11 | 924 | 13 | 2 |
| Profit to the colony | 101 | 7 | 1 | 110 | 4 | 11 |
The total amount of postages collected and contributions received for all these services in 1890 was £39,071 17s. 2d., against £46,359 0s. 0d. in 1889.
The average number of days in 1890 within which the mails were delivered between London and each of the under-mentioned ports in New Zealand was as follows:—
| San Francisco Service. | Direct Service. | P. and O. Line. | Orient Line. | |
|---|---|---|---|---|
| London to— | ||||
| Auckland | 35.69 | 48.38 | 44.35 | 43.04 |
| Wellington | 37.62 | 46.15 | 44.38 | 44.92 |
| Dunedin | 39.00 | 47.00 | 43.21 | 44.48 |
| Bluff | 39.75 | 48.00 | 42.46 | 43.73 |
There were 5,060 miles of telegraph line open at the end of 1890, requiring 12,771 miles of wire, an increase during the year of 186 miles of line and of 914 miles of wire. 1,961,161 telegrams were transmitted during the year: of these, the private and Press messages numbered 1,731,381, yielding a revenue of £110,696 17s. 8d., being an increase on the results of 1889 of 145,224 telegrams and of £4,233 19s. 4d. of revenue.
There were 14 telephone exchanges and 1 sub-exchange on the 31st March, 1891, an increase of 1 sub-exchange during the year. The number of subscribers was increased from 2,384 in March, 1890, to 2,592 in March, 1891. The subscriptions to these exchanges during the year amounted to £19,252 1s. 3d., of which the working-expenses, maintenance, interest on capital cost, and allowance for depreciation absorbed £13,265 10s. 7d.
The capital expended in connection with the several telephone exchanges up to the 31st March, 1891, including spare material on hand, was £69,172 17s. 1d.
The average rates of wages were somewhat lower in some parts of the colony at the end than at the beginning of 1890. The decrease appears to have been most marked in the Auckland Provincial District.
The following were some of the ruling rates in some of the districts at the end of 1890:—
| — | Auckland. | W'gton. | Can'bury. | Otago. |
|---|---|---|---|---|
* Per week, with board. † Per week, without board. | ||||
| Agricultural and Pastoral— | ||||
| Farm-labourers, with board, per week | 10/ to 20/ | 15/to 25/ | 15/ to 20/ | 15/ to 20/ |
| Farm-labourers, without board, per day | 6 | 7/ to 7/6 | 6/ to 8 | .. |
| Ploughmen, with board, per week | 10/ to 20/ | 20/ to 30/ | 17/ to 25/ | 15 to 27/6 |
| Reapers with board, per week | 10/ to 15/ | 25/ to 30/ | 30 to 40/ | 20/ to 25/ |
| Shepherds, with board, per annum | £45 | £40 to £100 | £52 to £65 | £50 to £65 |
| Station-labourers, with board, per wk. | 12/ to 20/ | 15/to 20/ | 15/ to 20/ | 15/ to 20/ |
| Artisans— | ||||
| Masons, plasterers, per day | 8/ to 9/ | 9/to 15 | 8/ to 10/ | 10 to 12/ |
| Bricklayers, per day | 7, to 10/ | 10/to 12/ | 10/ | 10/ to 12/ |
| Carpenters per day | 7 to 10/ | 9/to 10 | 9 | 9/ to 12/ |
| Plumbers per day | 7/ to 8/ | 10/ to 12/ | 10/ | 8/to 12/ |
| Painters per day | 6/6 to 8 | 7/ to 10/ | 9/ | 8/ to 12/ |
| Shoemakers per day | 7/ to 8/ | 8/ to 10/ | 10/ | 8, to 10/ |
| Servants— | ||||
| Married couples, without family, with board, per annum | £50 to £70 | £65 to £90 | £65 to £75 | £60 to £75 |
| Grooms, with board, per week | 15/ to 20/ | 20/to 30/ | 20 to 25/ | 15/ to 25 |
| Cooks with board, per week | 15 to 20/ | 10/to 30 | 15/ to 25/ | 13 to 20/ |
| Laundresses with board, per week | 8/ to 15/ | 12 to 25/ | 12/6 to 17/6 | 12/ to 24/ |
| Housemaids with board, per week | 8/ to 12 | 10/ to 25/ | 8/ to 12/ | 10/ to 15/ |
| Needlewomen, without board, per day | 3/6 to 4/6 | 3/6 | 8/ to 12/* | 7/ to 20/* |
| General labourers with board, per week | 6/ | 6/ to 8/ | 7/ | 5/ to 9/ |
| Seamen, with board, per month | £5 to £7 | £7 | £7 | £4 to £7 |
| Tailors, without board, per day | 8 to 10/ | 8/6 to 10/ | 10/ | 6/ to 12/ |
| Dressmakers without board, per day | 3/6 to 4/ | 3/6 to 8/ | 35/† | 3/ to 6/ |
| Storemen without board, per day | 6/ to 7/ | 8/to 9/ | 45/† | 8 to 10/ |
| Compositors without board, per day | 7/ to 12/ | 10/ | 35/† | 10/ |
The ordinary and territorial revenue of the colony received during the year 1890 amounted to £4,208,028 15s. 3d., of which the ordinary revenue amounted to £3,843,862 7s. 10d. and the territorial revenue to £364,166 7s. 3d. The ordinary revenue in 1890 was greater than that in 1889 by £208,094, of which increase railways yielded the largest proportion, viz., £125,778. The revenue from Customs duties was greater in 1890 than in any previous year. The following were the amounts of revenue realised by Customs duties in each of the past ten years:—
| Year. | Amount. | Increase. | Decrease. | Bate per cent. of Increase or Decrease. | Customs Revenue per Head of Population. | |||||
|---|---|---|---|---|---|---|---|---|---|---|
| Excluding Maoris. | Including Maoris. | |||||||||
* These proportions are slightly different from those given in last year's report. The population has been recalculated since then on the basis of the census returns. | ||||||||||
| £ | £ | £ | £ | s. | d. | £ | s. | d. | ||
| 1881 | 1,421,609 | 163,495 | ... | + 12.99 | 2 | 17 | 7 | 2 | 12 | 11 |
| 1882 | 1,515,906 | 94,297 | ... | + 6.63 | 2 | 19 | 6 | 2 | 14 | 9 |
| 1883 | 1,414,182 | ... | 101,724 | - 6.71 | 2 | 13 | 5 | 2 | 9 | 4 |
| 1884 | 1,413,014 | ... | 1,168 | - 0.08 | 2 | 11 | 2 | 2 | 7 | 4 |
| 1885 | 1,427,978 | 14,964 | ... | + 1.06 | 2 | 9 | 10 | 2 | 6 | 5 |
| 1886 | 1,311,808 | ... | 116,170 | - 8.13 | 2 | 5 | 1 | 2 | 2 | 0 |
| 1887 | 1,280,585 | ... | 31,223 | - 2.38 | 2 | 2 | 11 | 2 | 0 | 1 |
| 1888 | 1,396,391 | 115,806 | ... | + 9.04 | 2 | 6 | 2 | 2 | 3 | 2 |
| 1889 | 1,469,017 | 72,626 | ... | + 5.20 | *2 | 8 | 0 | *2 | 5 | 0 |
| 1890 | 1,541,395 | 72,378 | ... | + 4.92 | 2 | 9 | S | 2 | 6 | 7 |
The amounts above given represent the actual collections in the year, and differ from those given in the finance tables of the statistical volume, which include only the amounts brought to account before bank-closing hours on the last day of the year. The receipts from the imposition of the primage-duty of 1 per cent. are included in the Customs revenue for the past three years. In 1890 this duty yielded £41,311, against £56,047 in 1889; but it was only collected up to the end of September, 1890, having been specially imposed for the purpose of paying off certain deficiency bills to the amount of £128,600.
The following were the amounts of Customs revenue in the several Australasian Colonies in 1890, and the rates per head of the population:—
| Colony. | Customs Duties Revenue in 1890. | Amount per Head of Population. | ||
|---|---|---|---|---|
| £ | £ | s. | d. | |
| Queensland | 1,243,046 | 2 | 19 | 11 |
| New South Wales | 1,888,321 | 1 | 14 | 3 |
| Victoria | 2,658,010 | 2 | 7 | 6 |
| South Australia | 602,527 | 1 | 18 | 8 |
| Western Australia | 182,546 | 4 | 0 | 11 |
| Tasmania | 329,067 | 2 | 5 | 9 |
| New Zealand— | ||||
| Excluding Maoris | 1,541,395 | 2 | 9 | 8 |
| Including Maoris | 2 | 6 | 7 | |
In the following statement showing the amount raised by taxation in each of the past ten years, the property-tax raised during the financial year ending the 31st March of the calendar year following is included instead of that collected in each calendar year, as from the varying dates of collection the amounts received in each calendar year have sometimes differed widely even on the same rate of assessment:—
| Year. | Amount of Revenue raised by Taxation. | Amount per Head of Population (excluding Maoris). | ||
|---|---|---|---|---|
| £ | £ | s. | d. | |
| 1881 | 1,890,679 | 3 | 16 | 8 |
| 1882 | 1,956,557 | 3 | 16 | 10 |
| 1883 | 1,957,080 | 3 | 13 | 11 |
| 1884 | 1,815,674 | 3 | 5 | 9 |
| 1885 | 2,016,730 | 3 | 10 | 10 |
| 1886 | 1,882,050 | 3 | 4 | 8 |
| 1887 | 1,876,235 | 3 | 2 | 11 |
| 1888 | 2,031,658 | 3 | 7 | 1 |
| 1889 | 2,090,405 | 3 | 8 | 4 |
| 1890 | 2,173,985 | 3 | 10 | 0 |
As the Maoris contribute somewhat to the Customs revenue, an allowance should be made on that account to ascertain more correctly the amount of taxation per head of the rest of the population. It has been shown that by including the Maori population the Customs duties per head of the rest of the population would be reduced by 3s. 1d. for the year 1890. If this amount be deducted from the taxation per head given for that year, the rate would be reduced from £3 10s. to £3 6s. 11d. This last rate may fairly be used for comparison with the rates in the neighbouring colonies.
The following were the rates of taxation per head in the Australasian Colonies in 1890:—
| £ | s. | d. | |
|---|---|---|---|
| Queensland | 3 | 8 | 2 |
| New South Wales | 2 | 9 | 10 |
| Victoria | 3 | 4 | 11 |
| South Australia | 2 | 4 | 4 |
| Western Australia | 4 | 10 | 7 |
| Tasmania | 3 | 3 | 3 |
| New Zealand | 3 | 6 | 11 |
The territorial revenue increased from £356,151 in 1889 to 364,106 in 1890. There was an increase in the receipts on account of land sales from £91,628 to £154,584, but a decrease on other sources of revenue; the receipts from depasturing licenses, rents, &c., decreased from £223,752 to £172,016.
There are two classes of expenditure—out of revenue, and out of loans. The expenditure chargeable against ordinary and territorial revenue in 1890 amounted to £4,081,566, being less than the revenue received for the same period by £126,462. The expenditure, as stated in the accounts of the Treasury, is in excess of this amount by £288,000, being the charges on account of the Sinking Fund which have been omitted, as they are practically met by stock created Tinder the provisions of “The Consolidated Stock Act, 1884,” to the amount of the annual increase of the Sinking Fund. The proceeds of such stock become part of the Consolidated Fund. As the amount so raised by loan is equivalent to the amount of charges on account of the Sinking Fund, that amount has been omitted, in the figures given, from both the revenue and expenditure as above stated.
The expenditure on account of charges of the public debt, including the amount stated as the charges on account of the Sinking Fund, amounted in 1890 to £1,928,289 2s. 2d., against £1,891,701 15s. 5d. in 1889, an increase in the year to the extent of £36,587 6s. 9d. of annual charge. The expenditure on account of public instruction, including expenditure on school buildings, amounted to £397,884 18s. 11d., equal to 12s. 9 3/4d. per head of the population.
Exclusive of £53,009 17s. 11d. advanced as loans to local bodies, the expenditure in 1890 charged against loans amounted to £345,807 2s. 3d., against £456,632 4s. 11d. in 1889. Of this expenditure in 1890, the amount of £187,228 11s. 4d. was for railway construction, £71,370 15s. 2d. for road formation, £26,668 9s. for public buildings, £14,997 12s. 9d. for telegraph extension, and £21,972 14s. 8d. for land purchases. The balance was expended on account of various other services, including£10,254 5s. 6d. on account of the Public Works departmental charges.
Besides the revenue raised by the General Government, the County and Borough Councils, and the Town, Road, River, Harbour, and Drainage Boards levy rates, and obtain revenue from other sources.
To give a just idea of the full cost of Government to the people in 1890, the revenue of the local bodies must be added to that of the General Government. This is done in the following statement:—
| £ | £ | |||||
|---|---|---|---|---|---|---|
| General Government revenue for the year ending 31st December, 1890 | 4,208,028 | 15 | 3 | |||
| Local bodies' revenue (County and Borough Councils, Town, Road, and River Boards for the year ending 31st March, 1891; Drainage and Harbour Boards for the year ending 31st December, 1890) | 1,126,345 | 18 | 7 | |||
| Deduct amount of receipts from the General Government | 144,008 | 4 | 1 | |||
| 982,337 | 14 | 6 | ||||
| Total revenue | 5,190,300 | 9 | 9 | |||
—an amount equal to £8 7s. 3d. per head of the mean population.
The public debt of the colony amounted to £38,802,350 on the 31st December, 1890, being an increase of £319,100 during the year. The net indebtedness (after deducting the accrued Sinking Fund) was £37,394,745, being an increase of £231,854 on the net indebtedness at the end of 1889. The increase in the amount of the Sinking Fund during the year amounted to £87,246. These two last amounts are together equivalent to the increase in the gross debt. It must not be overlooked that an additional debt is created each year equivalent to the charges on account of the Sinking Fund.
Portions of the existing loans were either raised by the several Provincial Governments when in existence, or consist of loans raised for the purpose of paying off their several liabilities. It is now well nigh impossible to ascertain the exact expenditure by those governments on public works, or their allocation of the proceeds of the loans they raised.
The burden of a public debt depends greatly on the extent to which it was expended on reproductive works, and the degree of prosperity enjoyed by the people. The rugged character of the country generally, and the natural difficulties appertaining to many of the sites on which the chief towns were built, very early necessitated a large outlay on roads and public works. The necessity was fully recognised, arid to some extent met, by most of the Provincial Governments, which have justly received great credit for their far-seeing and liberal exertions in that direction. A great deal of road-making, often of a very costly character, was accomplished, harbour and other improvements begun, and immigration encouraged. Some railways had been made in Canterbury, Otago, and Southland. The City of Christchurch and the agricultural plains of Canterbury had been connected with the Port of Lyttelton by a railway, which required the construction of a long and very costly tunnel through the hills which surrounded Lyttelton. In Otago the City of Dunedin had been connected with Port Chalmers by a railway, constructed by private individuals under the guarantee of the Otago Provincial Government, and some miles of railway had been made in Southland, extending from the Town of Invercargill into the interior; but no general and comprehensive scheme of public works could be carried out by the separate exertions of the Provincial Governments. The General Government therefore in 1870 enunciated its public-works and immigration policy, by which it was proposed to raise a loan of ten millions for the construction of main trunk railways, roads, and other public works of colonial importance, and for the promotion of immigration on a large scale, the expenditure to be extended over a period of ten years. This policy was accepted by the Legislature, and embodied in “The Immigration and Public Works Act, 1870.”
The demands for local railways and other works soon caused the original proposals to be departed from, and entailed an expenditure at a much more rapid rate and to a far greater amount than was originally contemplated. Although many of the works undertaken have been directly unremunerative, yet the effect of the policy as a whole has been to largely develop the settlement of the country, andto enormously increase the value of landed property: land in parts which, before the construction of railways, was valued at from £1 to £2 per acre having been subsequently sold at prices varying from £10 to £20 per acre. In addition to the important indirect results of the policy, the railway- and telegraph-lines yield a revenue which covers a large portion of the interest on their cost after paving working-expenses.
The following may be stated as approximately representing the loan expenditure by the General Government on certain public works on the 31st March, 1890:—
| £ | |
|---|---|
| Telegraphs | 606,647 |
| Waterworks on goldfields | 561,101 |
| Immigration | 2,145,150 |
| Roads and bridges | 3,598,163 |
| Land purchases | 1,196,179 |
| Lighthouses, harbours, and defence works | 881,818 |
| Public buildings, including schools | 1,780,785 |
| Coal-mines and thermal springs | 25,171 |
| Railways by the Provincial and General Governments | 15,208,374 |
The total of these various items, of expenditure amounts to £26,003,688. The expenditure by local bodies on harbours, roads, and other public works out of loans raised by them is not included, nor are the amounts expended out of loans by the Provincial Governments before their abolition on immigration and public works, except railways, which, including the sum of £82,259 paid for the Dunedin and Port Chalmers line, represented the amount of £1,104,281. The expenditure on directly reproductive works—railways, telegraphs, and waterworks—has been £16,376,122. The expenditure on land is also directly reproductive, and that on immigration, roads, bridges, and lighthouses is of an indirectly reproductive character.
The assessments for the purpose of the property-tax are only made triennially. Except at such times there are no reliable data for estimating the wealth of the colony. In 1888 the returns made to the Property-tax Department (which excluded the real estate belonging to Natives) gave the following as the gross private wealth.
| £ | |
|---|---|
| Real estate, exclusive of education, church, municipal, and other reserves | 84,208,230 |
| Furniture and household goods | 4,102,947 |
| Live-stock | 7,857,137 |
| Produce, merchandise, and agricultural implements | 13,597,008 |
| Shipping | 1,580,000 |
| All other property, including deposits in banks, but excluding mortgages and other debts | 24,535,854 |
| £135,881,176 |
The debts due to persons, whether secured by mortgage or not, have not been included as assets, because the values of the properties, mortgaged or otherwise liable for debt, have been given without any deduction on account of such debts.
From this should be deducted the amount of indebtedness to persons outside the colony, of which the amount secured by mortgage has been estimated by the Property-tax Department at £16,205,356, and the amount not secured at £8,108,350, giving a total amount owed outside the colony of £24,313,706. If this amount be deducted from the gross private wealth, the balance of £111,567,470 should represent the net private wealth in the colony at the period mentioned, an amount equivalent to £184 per head of the population.
The property-tax returns, on account of understatements of values, &c., are not considered to fully represent the, private wealth of the people. This may be estimated by means of the values of estates of deceased persons, but only with any degree of approximation to correctness, by including together the results of several years, as any one year's results may be materially affected, especially in a country having a relatively small population, by the deaths in that year of a few wealthy persons. The following result is arrived at by this method:—
| Years, inclusive. | Amount sworn to. | Total Number of Deaths. | Average Amount left by each Person. | Average Number of Persons living. | Average Total Wealth for each Year of the Period. | ||
|---|---|---|---|---|---|---|---|
| £ | £ | s. | d. | £ | |||
| 1882-86 | 6,366,736 | 29,718 | 214 | 4 | 9 | 549,334 | 117,687,942 |
| 1887-90 | 5,383,891 | 23,611 | 228 | 0 | 6 | 608,560 | 138,766,894 |
In. 1890 the value of the estates of deceased persons amounted to £1,590,702; of these, the value of 16,which were over £20,000 each, amounted to £764,161. In consequence the average total for the period 1887-90 has been exceptionally increased. If the years 1882-90 be taken as one period for the purpose of this calculation, the following results are arrived at:—
| Years, inclusive. | Amount sworn to. | Total Number of Deaths. | Average Amount left by each Person. | Average Number of Persons living. | Average Total Wealth for each Year of the Period. | ||
|---|---|---|---|---|---|---|---|
| £ | £ | s. | d. | £ | |||
| 1882-90 | 11,750,627 | 53,329 | 220 | 6 | 10 | 575,657 | 126,841,223 |
It is, however, manifest that this average does not sufficiently exhibit the actual present amount of wealth. If the average amount per head, £220 6s. 10d., for the period 1882-90 was the same at the end of the year 1890, then the total wealth possessed by the 625,508 persons in the colony at the end of 1890 would amount to £137,825,475. If, however, the amount per head was equal to the average for the period 1887-90, viz., £228 0s. 6d., then the total private wealth at the end of 1890 amounted to £142,631,461. The figures given do not, however, represent the full amount of private wealth, as the amounts sworn to do not include the values of properties left to the husband or wife, on which no stamp-duty is payable. The total of these must be considerable, although probably on the average much less than the values of other properties not so devised, and they should give a substantial increase to the average amount per head, and therefore to the total wealth.
The private wealth of Victoria, calculated in the same manner by the Government Statist for that colony, amounted to an average of £348 per head of the population for the five years 1884-88 inclusive, or an average for the whole population of £345,313,092.
The Government Statist of New South Wales similarly calculated the wealth of that colony for the period 1885—-89 at £319 for each person, or an average total private wealth of £332,445,850.
The returns of the property left by deceased persons show a very rapid increase of wealth; this is apparent from the following:—
| Colony. | Average Amount left by each deceased Person. | Average Total Wealth for each Year of the Period. | ||
|---|---|---|---|---|
| £ | s. | d. | £ | |
| New Zealand, 1882-86 | 214 | 4 | 9 | 117,687,942 |
| New Zealand, 1887-90 | 228 | 0 | 6 | 138,841,223 |
| New South Wales, 1875-79 | 178 | 0 | 0 | 115,112,600 |
| New South Wales, 1880-84 | 264 | 0 | 0 | 216,110,400 |
| New South Wales, 1885-89 | 319 | 0 | 0 | 332,445,850 |
| Victoria, 1877-81 | 223 | 0 | 0 | 186,578,971 |
| Victoria, 1882-86 | 305 | 0 | 0 | 285,527,885 |
| Victoria, 1887-89 | 454 | 0 | 0 | 482,155,264 |
The wealth of the United Kingdom is given by Mr. Giffen at ten thousand millions, equal to £270 per head of the population.
The amounts stated only refer to private wealth. There is in addition in each colony a large amount of wealth— railways, lands, buildings, &c.—much of it reproductive, which belongs to the colony as a whole, and which requires to be taken into consideration when the burden of the national debt is measured.
The following shows the debt of each of the Australasian Colonies on the 31st December, 1890:—
| Colony. | Amount of Debt. | Amount of accrued Sinking Fund. | Rate of Net Indebtedness per Head of Population at End of Year. | ||
|---|---|---|---|---|---|
| £ | £ | £ | s. | d. | |
| Queensland | 28,105,684 | ... | 66 | 9 | 7 |
| New South Wales | 48,425,333 | ... | 43 | 3 | 5 |
| Victoria | 41,443,216 | ... | 36 | 11 | 5 |
| South Australia | 20,401,500 | ... | 64 | 18 | 8 |
| Western Australia | 1,367,444 | 85,106 | 27 | 14 | 1 |
| Tasmania | 6,432,800 | 124,804 | 43 | 8 | 3 |
| New Zealand | 38,802,350 | 1,407,604 | 59 | 15 | 4 |
The amount of indebtedness per head of population was thus greater in Queensland and South Australia than in New Zealand. The net indebtedness per head in this colony has a decreasing tendency. In 1888 it was £60 17s. 6d., in 1889 £59 18s. 3d., and in 1890 £59 15s. 4d.; the increase of the population having been in a greater ratio than the increase of debt.
The debt of the colony as stated does not include the unpaid loans raised by the several local bodies, amounting at the end of March, 1891, to £6,042,693. These will be referred to when the particulars of the finance of local bodies are being touched upon.
The length of Government railways open for traffic on the 31st March, 1891, was 1,842 miles, an increase during the year of 29 miles, the total cost thereof having been £14,278,586, the average cost per mile being £7,752. The returns from the Railway Department give a somewhat different mileage, the last being calculated for revenue purposes, and varying somewhat from the exact measurement which has been paid for. The cash revenue for the year amounted to £1,121,701 9s. 2d., an increase of £26,131 15s. 4d. on the amount received in 1889-90; but, as the expenditure increased from £682,787 4s. 6d. to £700,703 8s. 7d., or by £17,916 4s. 1d, the net increase of revenue amounted only to £8,215 11s. 3d. The value of the postal services is not included in the revenue. The net cash revenue, £420,998 0s. 7d., was equal to a rate of £2 18s. 11d. per cent. of the capital cost. This was a slightly lower percentage than in 1889-90, when the net railway revenue was equal to £2 19s. 5d. per cent.; but in 1888-89 the revenue only yielded £2 12s. per cent. on capital cost, and in 1887-88 £2 6s. The percentage of expenditure to revenue was 62.47, against 62.32 in the previous year, and 64'86 in 1888-89. In 1887-88 the percentage was 69.09.
The following statement shows the number of miles of Government railways open, the number of train-miles travelled and of passengers carried, and the tonnage of goods traffic for the past five years:—
| Year. | Length open. | Train-mileage. | Passengers. | Season Tickets issued. | Goods and Live-stock.* |
|---|---|---|---|---|---|
* The equivalent tonnage for live-stock has been given. | |||||
| 1886-87 | 1,722 | 3,008,949 | 3,426,4031 | 11,821 | 1,783,524 |
| 1887-88 | 1,754 | 2,994,786 | 3,451,850 | 11,518 | 1,770,638 |
| 1888-89 | 1,773 | 2,796,007 | 3,132,803 | 11,817 | 1,954,126 |
| 1889-90 | 1,813 | 2,868,203 | 3,376,459 | 12,311 | 2,112,734 |
| 1890-91 | 1,842 | 2,894,776 | 3,433,629 | 13,881 | 2,134,023 |
The number of passengers, although, greater in the last than in the two previous years, was smaller than in 1887-88, and it will be observed by the next table that the revenue from passengers was only slightly above that in 1887-88. It is reported by the Railway Commissioners that the lines, with all rolling-stock and appliances, have been maintained in good order, and that the plant has improved in value and efficiency, also that renewals have been effected with heavier rails and more permanent materials.
The expenditure was increased in the past year in consequence ox concessions involving reductions in the hours of labour in certain cases, which necessitated an increase in the staff of employés, and also by additional cost of fuel owing to the strikes.
Owing to an expected reduction in grain and flax traffic, and the reductions in rates and fares for the promotion of settlement and encouragement of industries, the Commissioners anticipate a smaller net revenue for this current year, 1891-92, than was obtained in 1890-91.
The particulars of the revenue and expenditure for the past five years are herewith given:—
| Year. | Passenger Fares. | Parcels and Luggage. | Goods and Live-stock. | Rents and Miscellaneous. | Total. | Expenditure. | Net Revenue. | Percentages of Expenditure to Revenue. |
|---|---|---|---|---|---|---|---|---|
| £ | £ | £ | £ | £ | £ | £ | ||
| 1886-87 | 356,253 | 33,749 | 581,350 | 27,416 | 998,706 | 699,072 | 299,690 | 69.99 |
| 1887-88 | 352,726 | 34,727 | 579,359 | 28,031 | 994,843 | 087,328 | 307,515 | 69.09 |
| 1888-89 | 323,447 | 34,102 | 610,488 | 29,578 | 997,615 | 647,045 | 350,570 | 64.86 |
| 1889-90 | 369,348 | 37,097 | 655,007 | 34,117 | 1,095,569 | 682,787, | 412,782 | 62.32 |
| 1890-91 | 353,593 | 38,997 | 690,779 | 38,332 | 1,121,701 | 700,703 | 420,998 | 62.47 |
Although not included in the figures for the revenue, the real gain to the colony is greater than the amount of net revenue shown, by the value of the postal services performed by the railways (carriage of mails, &c.), amounting to £26,000 per annum.
In addition to the above railways there were 114 miles of private lines open for traffic on the 31st March, 1891, namely, the Wellington—Manawatu Railway, 84 miles; the Kaitangata Railway Company's line, 4 miles; and the Midland Railway, 26 miles.
The cost of the construction of the Wellington—Manawatu Railway was £750,509, being at the rate of £8,934 12s. 7d. per mile. The term construction used throughout includes equipment, rolling-stock, &c., not merely the construction of the road-line and buildings. The revenue for the twelve months ending the 28th February, 1891, amounted to £71,801, and the working-expenses to £25,840, equivalent to 35.99 per cent. of the revenue.
The revenue from the opened part of the Midland line (26 miles) was for the year ended the 30th June, 1891, £9,144 2s. 1d., and the expenditure £5,143 6s., equivalent to 56.24 per cent. of the revenue.
The following statement gives the number of miles of railway open for traffic and in course of construction in each of the Australasian Colonies at the end of 1890:—
| Colony. | Number of Miles open for Traffic on 31st Dec., 1890. | Number of Miles in course of Construction on 31st Dec., 1890. |
|---|---|---|
* 31st March, 1890. † Includes lines authorised. | ||
| Queensland | 2,142 | 601† |
| New South Wales | 2,263 | 151 |
| Victoria | 2,688 | 212 |
| South Australia | 1,610 | 54 |
| Western Australia | 513 | 290 |
| Tasmania | 399 | 74 |
| New Zealand* | 1,816 | 132 |
The total average liabilities and assets of the banks within the colonies for the last two years were as follows:—
| 1869. | 1890. | |||||
|---|---|---|---|---|---|---|
| Liabilities | £12,486,717 | 0 | 6 | £13,356,598 | 4 | 3 |
| Assets | 17,652,915 | 10 | 8 | 17,735,258 | 16 | 7 |
Comparing the amounts with those in 1888, there was in 1890, an increase of £1,248,244 8s. 2d. on the liabilities and a decrease of £974,185 14s. 1d. on the assets.
There was in 1890 a still further contraction in the average amount of advances by the banks. In 1886 these amounted to £15,834,877, equal to £27.20 per head of the population. In 1889 the amount was £14,272,481, equal to £23.25 per head. In 1890 the amount was further reduced to £13,996,085, equal to £22.55 per head. The amount of discounts was less than in any year since 1873. The largest amount of discounts in any year was £6,061,959 in 1879, at the rate of £13.52 per head of population. In 1889 the amount was £2,850,944, equal to £4.64 per head of population; and in 1890 it was £2,524,573, equal to £4.4.07 per head.
There was an increase of £840,182 in the deposits, which amounted to £12,368,610 in 1890, against £11,528,428 in 1889. Exclusive of Government deposits, the deposits bearing interest increased from £7,775,465 to £8,427,198, or by £651,732; and the deposits not bearing interest from £3,306,733 to £3,513,191, or by £206,458. Thus, there was an increase of £858,191 in the average amount of private deposits. It is to be observed that in 1889 there was an increase of £489,648 on the average amount of private deposits in 1888; the private deposits in 1890 having been thus greater than in 1888 by £1,347,839.
The following shows the average amount of notes in circulation, notes and bills discounted, and bullion and. specie in the banks in each of the two past years:—
| — | 1889. | 1890. | Increase or Decrease. |
|---|---|---|---|
| £ | £ | £ | |
| Notes in circulation | 879,440 | 902,988 | + 23,548 |
| Notes and bills discounted | 2,850,945 | 2,524,573 | - 320,372 |
| Specie and bullion | 2,217,833 | 2,536,529 | + 313,696 |
The number of post-offices open for the transaction of the savings-bank business at the end of 1890 was 296.23,719 new accounts were opened in 1890, an increase on the number in 1889 of 1,941. 17,256 accounts were closed, as against 15,521 in 1889. The ct increase in the number of open accounts at the end of 1890 was thus 6,463. The total number of open accounts at the end of 1890 was 97,208, of which 71,017 were for amounts respectively not exceeding £20.
The deposits received during the year amounted to £1,658,543 3s. 5d. This was greater than the amount of deposits in any previous year by £113,796. The withdrawals during the year amounted to £1,500,437 9s. 5d.; the excess of deposits over withdrawals during the year having thus been £158,105 14s. The total amount standing at credit of all accounts on the 31st December, 1890, was £2,441,876 8s. 7d., which gave an average amount at credit of each account of £25 2s. 4d., against a corresponding average of £24 2s. 11d. in 1889.
There are seven savings-banks in the colony which are not connected with the Post Office. The total amount deposited in them in 1890 was £389,296 14s. 1d., of which the deposits by Maoris amounted to £305 15s. The withdrawals amounted to £391,041 7s. 7d., being in excess of the deposits by £1,744 13s. 6d. The total amount to the credit of the depositors at the end of the year was £695,146 15d. 11d., of which the sum of £154 15s. was to the credit of Maoris.
The average deposits stated for the banks of issue represent the average for the-four quarters of the year. If the amount of deposits at the end of the year be assumed to be equal to the average amount for the last quarter, then it may be stated that, exclusive of Government deposits, the deposits in the several banks of issue and in the two classes of savings-bank amounted at the end of 1890 to £15,247,136. In addition there was an amount of £285,528 14s. 8d. deposited with building societies; and it is also known that there were deposits with financial companies of which no particulars have been supplied to the department. The known deposits amount on an average to £24 7s, 6d. per head of the population, exclusive of Maoris, against £22 19s. 9d. in 1889.
There were 44 registered building societies in operation in the colony at the cud of 1890, 5 less in number than in 1889. Of these, 3 were terminable societies, the rest were permanent.
The total receipts by these societies during their financial year amounted to £715,393 11s. 11d., of which deposits comprised £323,216 2s.
The assets at the end of the year amounted to £1,030,770 10s., and the liabilities to £1,035,430 16s. 10d., of which the liabilities to shareholders, reserve fund, &c., amounted to £738,222 9s. 4d., those to depositors to £285,528 14s. 8d. and those to other creditors to £11,679 12s. 10d.
The Registrar of Friendly Societies received returns for the year 1889 from 364 lodges, courts, tents, &c., of various friendly societies throughout the colony, also from 31 central bodies. The number of members at the end of 1889 was 20,013, being 1,075 more than at the end of 1888.
The total value of the assets of these societies was £430,543 18s. 3d., equivalent to £.16 11s. per member, against £16 3s. 10d. in 1888. Of the total assets the value of the sick and funeral benefit funds amounted to £380,971 7s. 10d., an increase of £24,992 1s. 9d. on the value of these funds at the end of 1888.
The receipts during the year on account of the sick and funeral funds amounted to £57,801, and the expenditure to £38,352, of which the sick-pay to members amounted to the sum of £23,004. In addition to the sick-pay the sum of £23,359 was paid out of the medical and management expenses fund for medical attendance on and medicine supplied to the members and their families.
The surplus or deficiency ascertained at the last valuation of the different lodges, tents, &c., has been stated by the Registrar. Of 364 bodies, of whose funds and position valuations were made, only 82 were deemed to be solvent—showing a surplus. In 256 cases there was a deficiency which varied from a few shillings, or even less, to as much in one case as £34.57 per member. The Registrar in his last report remarked on the unsatisfactoriness of any attempt to generalise the results: “The widest divergence between average values in the lodges,which are thus accidentally brought into juxtaposition, appears in a surplus of £20.7 per member as contrasted with a deficiency of £22.3 Even within the smaller field of vision, which embraces one society only at a time, the branches exhibit marked contrasts in respect of their financial position.”
The adoption of insufficient scales of contributions, the neglect of the close investment of benefit funds, and, to some extent, the sinking of the capital of the benefit funds in unproductive buildings instead of having it invested at interest, are the chief factors in the present unsatisfactory condition of so many of the societies; and it almost appears as if the members of many of the bodies will not be convinced of the importance of those questions so frequently urged upon them until disaster has overtaken them.
98,479 acres of Crown land were sold for cash or money-scrip during the year, the cash received having amounted. to £101,968 15s. 8d. The scrip represented a value of £6,990 5s. 10d. The lands absolutely disposed of without sale amounted to 135,763 acres 1 rood 28 perches, of which the reserves set apart for public purposes amounted to 66,089 acres 3 roods 33 perches; the grants to Europeans or Natives under Native Reserves Acts, &c., or in fulfilment of engagements, to 12,421 acres; those to Natives or Europeans under the Native Land Acts to 28,431 acres 12 perches; and those in satisfaction of land-scrip or otherwise to 28,815 acres 1 rood 23 perches.
The total land alienated from the foundation of the colony to the 31st December, 1890, amounted to 19,666,917 acres. This docs not include lands sold direct by Natives to Europeans, for which no Crown grants have been issued. Although the exact quantity so sold which still remains without Crown grants cannot be ascertained, it is believed to be very small.
Before referring to the results of each of the various systems in operation in 1890 for the disposal of Crown lands it seems desirable to give a précis of the system now in force.
Rural lands are open for application on immediate or deferred payments, or on perpetual lease, at option of applicant.
Immediate Payment (area restricted to 640 acres of first-class land and 2,000 acres of second-class land in any one land district):—
Town lands, sold by auction; minimum upset price, £30 per acre.
Suburban lands, sold by auction; minimum upset price, £3 per acre.
Village lands (sections under 1 acre), on application, at £5 per section.
Village lands (termed “small farms,” 1 to 50 acres), on application, at not less than £1 per acre.
Rural lands, sold by auction or on application, up to £2 or more per acre, according to quality.
Deferred Payment (area restricted to 610 acres of first-or second-class land):—
Suburban lands, sold at £4 10s. per acre.
Rural lands, sold at not less than £1 per acre, except in certain parts, when price may be less, according to quality.
Village lands, sections under 1 acre, and small farms, 1 to 50 acres, not less than £1 per acre.
Lease for First Term of 30 Years, with Perpetual Right of Renewal at Intervals of 21 Years (area restricted to 640 acres of first-class land or 2,000 acres of second-class land):—
Land taken up under this system is subject to a rental of 5 per centum annually on the capital value, which varies according to the position and quality of the land from about £1 to £3 per acre, with right of purchase as soon as conditions of improvement have been complied with.
Homestead System (area restricted to 200 acres for a family or household).
Agricultural Lease on Goldfields:—
In force in Otago. Permits of land being made available for agriculture while liable to be taken for mining purposes.
Small Grazing - runs (area not exceeding 20,000 acres):—
Runs thus classed are let by public auction for a term of 21 years, with a right of renewal for a second term of 21 years. The lessee has the exclusive right of the natural pasturage, and may cultivate any part, or all, of the area leased. At the end of the term of lease full valuation is allowed for improvements. The upset price is 2 1/2 per cent. on the capital value. Rents vary from 3d. to 1s. 8d. per acre.
Pastoral Runs:—
These runs are let in areas from 5,000 acres and upwards for terms not exceeding 21 years. Twelve months before a lease falls in a new lease of the run is offered for sale by auction for another term. The outgoing tenant is allowed a valuation, not exceeding three years' rental, for improvements. There is no restriction as to the number of runs which may be leased by one person or company.
The average rental of these runs is about 4d. per acre.
In 1890 39,106 acres and 29 perches were taken up under the deferred-payment system. The total area of land taken up under this system, from its commencement to the 31st December, 1890, amounted to 1,175,020 1/4 acres. Of this quantity the area forfeited is 239,238 acres, and 120,460 1/2 acres have been finally alienated by completion of payments. The area still held under the system, at the end of 1890, was, therefore, 515,322 acres. The following statement gives the number of acres taken up under this system in each of the past ten years:—
| Acres. | |
|---|---|
| 1881 | 109,769 |
| 1882 | 83,930 |
| 1883 | 138,414 |
| 1884 | 48,502 |
| 1885 | 58,722 |
| 1886 | 52,711 |
| 1887 | 38,832 |
| 1888 | 82,017 |
| 1889 | 45,016 |
| 1890 | 39,106 |
The operation of what is called the perpetual-lease system with right of purchase, which became part of the land law of the colony in 1882, has had the effect of lessening the demand for land on deferred payments, as under the perpetual-lease system the rental is only 5 per cent. on theupset value of the land, and thus, until the purchase be (if at all) effected, the settler has all his capital available for beneficial improvements. 798,571 1/2 acres were in occupation under this system on the 31st December, 1890, in 3,109 holdings. 271,786 1/4 acres, in 795 holdings, were taken up during the year, but only 5,338 1/4 acres were converted into freehold. Although the right of converting the land from lease to freehold is highly valued, vet the temptation to postpone the use of that right is very great while interest at from 6 1/2 to 7 per cent. can be had on good investments and only 5 per cent. need be paid in the form of rental to the Government.
The lands in the village-settlements are partly disposed of upon deferred payments and partly for cash. The transactions are included in the sales of land previously stated, but the following details of the number and area of selections to the 31st December, 1890, are given in order to show the extent of these settlements: —
| No. | A. | R. | P. | |
|---|---|---|---|---|
| Village sections for cash | 860 | 564 | 0 | 32 |
| Village sections on deferred payments | 319 | 182 | 1 | 30 |
| Small-farm sections for cash | 582 | 5,216 | 2 | 15 |
| Small-farm sections on deferred payments | 1,115 | 13,767 | 2 | 6 |
| The freeholds acquired have been,— | ||||
| Village sections | 158 | 89 | 2 | 34 |
| Small-farm sections | 531 | 5,596 | 3 | 25 |
| The forfeitures were,— | ||||
| Village sections | 79 | 52 | 2 | 27 |
| Small-farm sections | 128 | 1,388 | 3 | 8 |
During 1890 17 selectors took up 440 3/4 acres in village-homestead special settlements on perpetual lease. The Government advanced to them £1,291 for clearing the land and building houses.
The lands held from the Government on depasturing leases (exclusive of small grazing-runs) amounted to 11,912,513 acres, in 1,401 runs, yielding an annual rental of £132,568. The small grazing-runs numbered 35, andcontained a total area of 79,892 acres. The rent they yielded in 1890 amounted to £10,874 14s. 6d.
The area of land open for sale or selection in the several land districts on the 1st January, 1890, was as follows, a large portion, however, being of very inferior quality:—
| Land District. | Surveyed. | Unsurveyed.* | Total. |
|---|---|---|---|
* Partially roaded and prepared for selection. | |||
| Acres. | Acres. | Acres. | |
| Auckland | 192,940 | 122,578 | 315,518 |
| Taranaki | 34,258 | 34,258 | |
| Hawke's Bay | 24,030 | 9,804 | 33,834 |
| Wellington | 75,043 | 47,815 | 122,858 |
| Nelson | 44,680 | 90,400 | 135,080 |
| Marlborough | 2,192 | 10,280 | 12,472 |
| Canterbury | 9,690 | 29,548 | 39,238 |
| Otago | 66,895 | 3,200 | 70,095 |
| Southland | 70,350 | 30,000 | 100,350 |
| Westland | 10,835 | 76,915 | 87,750 |
| Totals | 530,913 | 420,540 | 951,453 |
The number of cultivated holdings over one acre in extent in March, 1891, was 38,083, a reduction of 95 on the number in 1890. There was a large decrease in the number of holdings in Otago and Canterbury, but a considerable increase in the number in Wellington and Hawke's Bay. The decrease in Otago and Canterbury—which are the principal grain-growing districts—is doubtless caused by the amalgamation of holdings, due probably to a large extent to the low price of wheat, which rendered the cultivation thereof as a crop unprofitable. The practice largely obtains in those districts of persons taking unimproved lands from the proprietors for the purpose of raising one, two, or three grain crops therefrom, the land being then sown down with grass-seed. The lands where so occupied are returned as separate, holdings. When the low price of grain renders the cultivation for the crop only unprofitable, either land is not taken up in the manner indicated, or land so occupied reverts to the proprietor, and becomes part of his other holding. The increase in theNorth Island is due to the growth of settlement. The number of stated holdings includes those in which the only cultivation consists of the land being under artificial grasses, but it does not include land occupied by Maoris.
In 1876 the number of these holdings was estimated to be on an average 14.88 to every 100 adult males; in 1881, 17.30 to every 100 adult males; in 1886, 20.17; and in 1890, 23.22. The work of compiling the results of the census is not sufficiently forward to enable the number of adult males in 1891 to be stated, but, owing to the decrease in the number of holdings already referred to, the proportion per 100 adult males will probably be less than that given for 1890.
The extent of land in cultivation (including grass-sown land, and land broken up but not in crop) amounted in March, 1891, to 8,462,495 acres, being an increase of 447,069 acres on the similar extent in February 1890. The area under artificial grasses comprised 82.32 per cent against 81.41 in 1890, and 81.87 per cent. in 1889; and that under grain crops 8.31 per cent., against 10.31 per cent. in 1890, and 10.35 in 1889.
More than half the grain crops were grown in the Canterbury District, and more than one-third in Otago. This is in accordance with the experience of previous years The following shows the acreage and proportion of land under grain crops in each provincial district:—
| Acres. | Per cent. | |
|---|---|---|
| Canterbury | 353,727 | 50.29 |
| Otago | 247,679 | 35.22 |
| Wellington | 28,933 | 4.11 |
| Auckland | 24,945 | 3.54 |
| Nelson | 15,649 | 2.23 |
| Marlborough | 14,680 | 2.09 |
| Hawke's Bay | 10,906 | 1.55 |
| Taranaki | 6,796 | 0.97 |
| Westland | 14 | ... |
| Totals | 703,329 | 100.00 |
While the area of land under wheat was greater in Canterbury than in Otago by 155,001 acres, the area under oats was less by 71,278 acres.
The total area under wheat (exclusive in this case and in that of other crops of Maori cultivations) at the beginning of 1891 was 301,460 acres, less by 34,401 acres than the corresponding area in 1890. The produce in 1891 was estimated at 5,723,610 bushels, or less by 2,724,896 bushels than in 1890, and less by 3,046,636 bushels than in 1889. The large decrease is only partly due to a smaller breadth of land being under wheat, the greater portion of the decrease was caused by a smaller production per acre, the yield for 1891, 18.99 bushels per acre, being the poorest on record. In 1890 the average estimated yield was 25.15 bushels per acre, and in 1889 24.22. The highest average yield was 24.06 bushels in the Wellington District; in Marlborough the yield was 22.64 bushels' in Otago it was 21.73 bushels; but the bulk of the crop was grown in Canterbury, with a yield averaging only 17.88 bushels.
The following gives the area in wheat and the estimated produce for each of the Australasian Colonies for the season of 1891:—
| Colony. | Wheat Crop, 1891. | ||
|---|---|---|---|
| Acres. | Bushels. | Bushels per Acre. | |
| Queensland | 10,390 | 207,990 | 20.02 |
| New South Wales | 333,233 | 3,649,216 | 10.95 |
| Victoria | 1,145,163 | 12,751,295 | 11.13 |
| South Australia | 1,673,573 | 9,399,389 | 5.62 |
| Western Australia | 33,820 | 465,025 | 13.75 |
| Tasmania | 39,452 | 642,980 | 16.30 |
| New Zealand | 301,460 | 5,723,610 | 18.99 |
| Totals | 3,537,091 | 32,839,505 | ... |
The amount of wheat consumed by the population or used up by them is estimated by deducting from the results of the crop the amount exported in that year and the quantity of seed required for the next crop. It is impossible by this means to give an exact statement of the quantity required for actual consumption for several reasons: (1.) The crop itself is an estimate, and the actual harvested yield may be either considerably more or less. (2.) The amount retained in any one year maybe largely in excess of the local requirements, and may form part of the following year's exports, thus apparently largely increasing the amount retained one year for consumption, and reducing the apparent amount retained fur consumption the following year, which is calculated on the supposition that all the exports for that year are to be set against the crop for that year. It is thus clear that the results for any one year cannot be taken for the purpose of ascertaining the requirements of the people, and that even when taken for a term of years there will probably be a slight variation in the result as any year's results are added to or subtracted from the computation.
The total average consumption of wheat in New Zealand for the period of 1877 to 1890 inclusive, estimated according to the foregoing method, was apparently 8.36 bushels per head of population, including Maoris. Prom this has to be deducted the wheat required for seed purposes, estimated at 2 bushels to the acre. Exclusive of the quantity for seed, the requirements for food and other sources of local consumption amounted to an average of 7.30 bushels per head.
The following table gives the particulars for each year and the results for the whole period:—
| Year. | Produce (including estimated Quantity of Maori-grown Wheat and Imports of Wheat and Flour*) | Exports of Wheat and Flour.* | Retained in the Colony. | Used as Seed at 2 Bushels per Acre. | Difference for Food-consumption. | Mean Population (including Maoris). | Proportion per Head for Total retained for Food-consumption. | |
|---|---|---|---|---|---|---|---|---|
| For Food, &c. | Total retained. | |||||||
* In equivalent bushels of wheat. | ||||||||
| Bushels. | Bushels. | Bushels. | Bushels. | Bushels. | Persons. | Bushels. | Bushels. | |
| 1877 | 4,374,620 | 906,543 | 3,468,077 | 486,812 | 2,981,265 | 451,943 | 6.60 | 7.66 |
| 1878 | 6,537,770 | 1,897,354 | 4,640,416 | 529,722 | 4,110,694 | 467,000 | 8.80 | 9.94 |
| 1879 | 6,272,914 | 2,580,798 | 3,692,116 | 540,396 | 3,151,720 | 491,886 | 6.41 | 7.51 |
| 1880 | 7,801,892 | 3,147,586 | 4,654,306 | 649,898 | 4,004,408 | 518,275 | 7.73 | 8.98 |
| 1881 | 8,264,167 | 3,918,107 | 4,346,060 | 731,430 | 3,614,630 | 537,579 | 6.72 | 8.08 |
| 1882 | 8,360,295 | 3,721,812 | 4,638,483 | 781,636 | 3,856,847 | 552,991 | 6.91 | 8.39 |
| 1883 | 10,329,907 | 5,195,703 | 5,134,204 | 755,412 | 4,378,792 | 572,539 | 7.65 | 8.97 |
| 1884 | 9,934,101 | 2,885,390 | 7,048,711 | 540,086 | 6,508,625 | 595,411 | 10.93 | 11.84 |
| 1885 | 6,950,854 | 1,596,820 | 5,354,034 | 347,782 | 5,006,252 | 615,757 | 8.13 | 8.66 |
| 1886 | 4,290,826 | 1,675,201 | 2,615,625 | 506,050 | 2,109,575 | 624,086 | 3.38 | 4.19 |
| 1887 | 6,368,140 | 707,182 | 5,660,958 | 614,718 | 5,046,240 | 638,343 | 7.90 | 8.87 |
| 1888 | 9,472,895 | 2,547,033 | 6,925,862 | 724,306 | 6,201,556 | 647,340 | 9.58 | 10.70 |
| 1889 | 8,784,801 | 3,397,752 | 5,387,049 | 671,722 | 4,715,327 | 655,799 | 7.19 | 8.21 |
| 1890 | 8,468,853 | 4,899,069 | 3,569,784 | 602,920 | 2,966,864 | 664,460 | 4.47 | 5.37 |
| Totals and averages) | 106,212,055 | 39,076,350 | 67,135,685 | 8,482,890 | 58,652,795 | 8,033,409 | 7.30 | 8.36 |
The difficulty of correctly estimating the consumption of breadstuffs is shown by the great differences in the estimates arrived at. Mr. Mulhall, in his “Dictionary of Statistics,” gives the consumption of wheat per inhabitant as follows:—
| Bushels of 60lb. each per Head. | |
|---|---|
| United Kingdom | 330lb., equal to 5.50 |
| France | 455lb., equal to 7.58 |
| Germany | 166lb., equal to 2.77 |
The average quantity per head of the population required for local consumption (exclusive of that for seed purposes) is estimated by the Government Statist of New South Wales at 6.5 bushels for that colony, and by the Statist of Victoria at 4 1/2 to 5 bushels for the last-mentioned colony.
The consumption of wheaten breadstuffs in New Zealand is thus considerably in excess of that in Victoria, and is also in excess of the consumption per head in New South Wales and in the others of the Australian Colonies, The flour used in the colony is produced by local mills, the quantity imported in 1890 having been only 109 centals, less than 5 tons; but the quantity exported amounted to 9,937 tons.
The number of acres under oats for grain at the commencement of 1891 was 346,224, a decrease of 79,847 on the number in 1890. The produce was estimated at 9,947,036 bushels, being less than the estimated crop in 1890 by 3,726,548 bushels. The yield per, acre in 1891 was estimated at 28.73 bushels, against 32.10 in 1890, an average decrease of 3.37 bushels per acre. The yield per acre was greater in Otago in 1891 than in 1890, but in all the other provincial districts it was considerably less. In Canterbury it decreased nearly one-third—from 30.44 to 20.75 bushels per acre. Of the land under cats in 1891, over 53 per cent. producing nearly 63 per cent. of the crop, was in Otago. Canterbury took second place for oat production with 32.65 per cent. of the area, but only 23.58 per cent. of the produce. The oat crop in 1890-91 for all the Australasian Colonies was as follows:—
| Colony. | Oat Crop, 1891. | ||
|---|---|---|---|
| Acres. | Bushels. | Bushels per Acre. | |
| Queensland | 411 | 8,967 | 21.82 |
| New South Wales | 14,103 | 256,659 | 18.20 |
| Victoria | 221,048 | 4,919,325 | 22.25 |
| South Australia | 12,475 | 116,229 | 9.32 |
| Western Australia | 1,933 | 37,713 | 19.50 |
| Tasmania | 20,740 | 519,395 | 25.04 |
| New Zealand | 346,224 | 9,947,036 | 28.73 |
| Totals | 616,934 | 15,805,324 | ... |
It will be observed that the oat crop in New Zealand comprised nearly 63 per cent. and the area thereof 56 per cent. of that for the whole of Australasia. The total yield of oats in all the above colonies was less than in 1890 by 5,392,902 bushels. New Zealand out of her then crop exported 2,230,421 bushels to those colonies; but, with a crop less in 1891 by 3,726,548 bushels, there will apparently not be much available surplus to meet the requirements of the adjoining colonies.
There was in this colony a decrease in the quantity of land sown with barley from 42,402 acres in 1890 to 32,740 in 1891, and a decrease in the crop, estimated to amount to 583,990 bushels, the total crop in 1891 being estimated at 758,833 bushels, the average yield per acre being only 23.18 bushels, against 31.67 in 1890.
There was an increase in the breadth of hind under potatoes—30,577 acres in 1890, 32,691 in 1891. The yield in 1891 was estimated at 178,121 tons, equal to ah average of 5.45 tons per acre.
There was in 1891 a much greater quantity of land sown with turnips and rape than in 1890. The low price of grain has caused greater attention to be given to sheep-feeding, and as one of the results there were 402,184 acres under turnips and rape in 1891, against 352,903 in 1890, an increase of 49,281 acres.
The acreage under hops in 1891 was 577, against 585 in 1890. Even this small area is more than enough tosupply local requirements, for, while the imports of hops Mere slightly under 458cwt., the exports amounted to 1,943 1/2cwt. Of the land under hops in 1891, 464 acres were in the County of Waimea and 66 in the County of Collingwood, both in the Nelson Provincial District. The cultivation of tobacco does not progress: in 1889 34 acres were under cultivation, in 1890 25 acres, and in 1891 only 16.
The relative duties imposed upon New-Zealand-grown and imported tobaccos are as follow:—
| New-Zealand-grown tobacco manufactured in the colony | 1s. the lb. |
| Imported manufactured tobacco | 3s. 6d. the lb. |
| Imported unmanufactured tobacco | 2s. the lb. |
| Imported tobacco manufactured in the colony | 1s. the lb. |
If the New-Zealand-grown leaf was of sufficiently good quality to be manufactured by itself, the practical protection would amount to 2s. 6d. per lb. (i.e., the difference between the duly on the imported manufactured tobacco, 3s. 6d., and the excise duty on the New-Zealand-grown tobacco manufactured in the colony, 1s.). But, in order to produce a marketable tobacco, New-Zealand-grown leaf is mixed with imported unmanufactured tobacco, on which a duty of 2s. the lb. is levied. The differential duties are not apparently sufficient to encourage the cultivation of tobacco to any extent.
17,047 acres were returned as being in orchards in 1891, an increase of 1,276. The success of attempts that have been made to place fruit in a good saleable condition on the English market has given encouragement to cultivators. and fruits are expected in the not distant future to take an important place in the list of New Zealand exports.
New Zealand is pre-eminently and above all things a country suitable for grazing purposes. Wherever there is light and moisture English grasses thrive when the natural bush and fern and other vegetation are cleared off. In fact, the white clover gradually overcomes the fern, and from the mildness of the winter season there are few places where there is not some growth throughout the worstmonths of the year. In all parts of the colony stock live, although in varying condition, without other food than they can pick up. Sown grass land, as might be expected, takes the lead in the list of cultivations.
In March, 1891, there were 6,966,218 acres under artificial grasses, being an increase of 411,169 on the corresponding acreage in 1890. Of these, 3,250,543 acres had been previously ploughed, and presumably under grain or other crops, and 3,715,675 acres had not been ploughed, a large proportion consisting of what had been bush or forest land sown down with grass after the timber had been burnt or partially burnt off.
The following shows the acreage in sown grasses in each of the Australasian Colonies:—
| Acres. | |
|---|---|
| Queensland | 22,252 |
| New South Wales | 385,504 |
| Victoria | 235,241 |
| South Australia | 21,431 |
| Western Australia | 23,344 |
| Tasmania | 201,060 |
| New Zealand | 6,966,218 |
It will be observed that the area of land under sown grasses was about eight times greater in New Zealand than in the whole of Australia and Tasmania. When compared in size with the colonies of Australia, New Zealand is relatively small—about one-thirtieth of their total size—hut when the grazing capabilities are compared the relative importance of New Zealand is much altered. Australia is generally unsuitable, owing to conditions of climate, for the growth of English grasses, and the amount of feed produced by the natural grasses throughout the year is very much less per acre than that obtained from the sown grass lands in New Zealand—so much so that it may be stated that the average productiveness of the grass land in New Zealand is probably about nine times as great as that in Australia; so that the land of this colony covered with artificial grass may be considered equal, for grazing purposes, to an area of Australian territory about nine times as great.
Returns of sheep are sent annually, on the 1st May, to the Stock Department, but full returns of other stock are only obtained when a census is taken. The number of each kind of live-stock, according to the returns from the European portion of the population, in the colony in each of the census years 1886 and 1891 is given below:—
| Live-stock. | Census, 1891. | Census, 1886. |
|---|---|---|
| Horses | 211,040 | 187,382 |
| Brood-mares (included in foregoing) | 31,276 | 29,853 |
| Asses and mules | 348 | 297 |
| Cattle (including calves) | 788,919 | 853,358 |
| Breeding-cows (included in foregoing) | 280,711 | 279,136 |
| Milch-cows (also included in breeding-cows) | 206,906 | Not specified |
| Sheep (including lambs) | 17,865,423 | 16,564,595 |
| Breeding-ewes (included in foregoing) | 7,371,429 | 6,457,355 |
| Goats | 9,055 | 10,220 |
| Pigs | 222,553 | 277,901 |
| Poultry | 1,790,070 | 1,679,021 |
| Ostriches | 179 | ... |
The above statement does not include the numbers of the stock owned by Maoris. A census was taken of the Native population, their stock and cultivations, about the same time the census of the rest of the population was taken, but not of so elaborate a character. The results of the Native census gave the following numbers of stock owned by them: Sheep, 251,763; cattle, 42,912; pigs, 86,259; no statement of the horses, which are numerous with them, being given. The full number of those kinds, of stock for the colony was, therefore,—
| Sheep | 18,117,186 |
| Cattle | 831,831 |
| Pigs | 308,812 |
The number of sheep, ascertained from the compilation of the census results, was over one and a third million more than the number returned to the Stock Department nearly a month later. The returns of sheep owned byMaoris are required to be made to that department. Some allowance should be made for the number slaughtered for home use and freezing in the interval, but that would only account for a comparatively small part of the difference. The fact that no house escapes visitation at the time of the census, and that the numbers then given are not used for taxing purposes, may probably largely account for the difference and cause the census results to be accepted as the most accurate. The following recent case is illustrative of the incorrectness of some of the returns sent to the Sheep Department. A return was made giving the number of a flock at over 7,700. There was reason to doubt the correctness of the number, and when another return was called for the number was given as over 12,400.
The following gives the number of the principal kinds of live-stock in the several Australasian Colonies:—
| Colony. | Sheep. | Cattle. | Horses. |
|---|---|---|---|
Including those owned by Maoris. † Excluding those owned by Maoris. | |||
| Queensland, 1889 | 18,007,234 | 5,558,264 | 365,812 |
| New South Wales, 1889 | 55,986,431 | 1,909,009 | 444,163 |
| Victoria, 1889 | 12,736,143 | 1,782,978 | 436,459 |
| South Australia, 1889 | 7,004,642 | 359,938 | 187,686 |
| Western Australia, 1889 | 2,524,913 | 130,970 | 44,384 |
| Tasmania, 1889 | 1,619,256 | 162,440 | 31,165 |
| New Zealand, 1890 | *18,117,186 | *831,831 | †211,040 |
New Zealand thus takes second place in order for number of sheep, but fourth for the number of her cattle.
Butter has always held an important position among the productions of the New Zealand small farmer, but, made by different persons and in different ways, it has not been generally suitable for the requirements of the English market, although considerable quantities have been exported to Australia and also to the United Kingdom; but the success attending the efforts made to produce butter of uniform superior character in dairy-factories, and the fairly-remunerative prices that have been realised for suchbutter in England, have caused great attention to be given to the increase of dairy-factories for the purpose of supplying produce for the English market.
It is only in census years that any returns are obtained of the quantity of butter and cheese annually produced in the colony, and the returns then given by farmers can only be deemed to be estimates; as the majority of them do not keep accounts of their production.
The following are the results of the returns made in the census years mentioned. The numbers represent the quantities produced in the preceding years:—
| Cheese. | Butter. | |
|---|---|---|
| lb. | lb. | |
| Census year, 1881 | 3,178,694 | 8,453,815 |
| Census year, 1886 | 4,594,795 | 12,170,964 |
| Census year, 1891 | 6,975,698 | 16,310,012 |
The figures for 1891 include 1,969,759 lb. of butter and 4,390,400lb. of cheese made in factories.
The importance of the dairy industry to New Zealand caused the Government to appoint a Mr. John Sawers as Chief Dairy Instructor, whose duty it is to travel throughout the length and breadth of the land, visit factories, and give lectures and addresses on the benefits of co-operative dairying, the manufacture of cheese and butter, and cognate subjects relating thereto. The following extracts from his last annual report may be read with interest:—
While the dairying industry has not yet developed into anything like the importance it is destined to assume, I think we cannot shut our eyes to the fact that during the past two years a considerable forward movement has been made, more especially during the past year. I have myself been repeatedly complimented from various sources for what was, perhaps undeserved, benefits received from my instruction, not only from dairy-factory operatives, but from merchants dealing in the commodity. Notwithstanding the fact that some of our dairy-factory companies have had to succumb through financial difficulties, and some, through mismanagement, even forced into liquidation, still the future of our outlook is very hopeful. A more practical acquaintance with the nature and the handling of milk and its products on the part of factory-managers, and a better knowledge of commercial principles on the part of the managing committees of the factories, will inevitably secure our desired ends. This n only be broughtabout by continued steady instruction, combined with experience attained in the actual working of dairy-factories. The complete revolution necessary in the industry cannot be effected in a day, but changes must be made by degrees. But that the industry is being founded on a more certain basis there can no longer be any room for further doubt.
From communications received from some of the principal London brokers, I learn that they recognise a marked and sustained improvement in the quality of both cheese and butter shipments of recent manufacture; at the same time, they express the opinion that finality in the matter of improvement has not yet been reached. The chief complaint among the London brokers is the absence of uniformity, and this cannot easily be remedied while there is throughout the colony such an extensive system of private dairying at work. Uniformity cannot easily be engendered without the establishment of the factory system. It is worthy of note that several of our dairy-factories have now earned a desirable distinction in the London market for the quality of their products—both butter and cheese. Brands of butter which were last year quoted at from £1 10s. to £2 under the Danish brands have during the past season been quoted at about the highest figures realised on the London market. Cheese from our best factories has successfully competed with the best Canadian brands, which seem to dominate the market. But, unfortunately, this distinction is only earned by a few of our best factories. Towards showing the benefits derived from the factory system as compared with individual dairying, it is satisfactory to note that, out of an even line of three shipments of butter sent home, the factory brands realised from £5 15s. to £6 3s., while that from private dairies brought from £4 15s. to £5 15s. The higher quotations must be considered satisfactory.
It is also pleasing to note the rapid development which the dairy industry has undergone during the last ten years. In 1880 the value of our exports of dairy-products was £1,033, while for 1890 the value rose to £207,687, and I am sanguine that the past season's export will show, from the same amount of produce, a considerable increase in pecuniary value. I hope by future efforts to see a still brisker trade established, so that the settlers may derive a benefit, and find some solace for past losses.
It is generally conceded that no country possesses greater natural advantages for dairy pursuits than New Zealand; this, at any rate, is true of Taranaki. Any one acquainted with the large areas of splendid pasture-land in Taranaki must have had the conviction forced upon him that this locality is pre-eminently fitted to become a great centre for manufacturing dairy-products. In soil, climate, seasons, and settlement Taranakihas every natural advantage. Winter pasturage is generally abundant, and so the farmer is to a great extent relieved of the labour and expense of storing up much winter feed. Little or no housing is required for the cattle throughout the winter, and so the farmer can carry on his business under the most favourable circumstances, as very little of the profits of the season are consumed in maintaining the cows from one season to another. At the same time, I have endeavoured to impress upon the farmers of this district the desirability of growing a little winter feed; likewise the benefits of some better means of shelter during the cold season. I could see that it was the practice of the farmers there generally to allow the cows to wander over the bare pastures and find what shelter they could get under the lee of a few trees during the cold season. The result of this negligence is that the cows start the season under the most unfavourable circumstances, many of them being nothing but a complete rack of bones. Indeed, in most instances the winter management of dairy cows in Taranaki is conducted in a very primitive manner, no other food being provided than what the cows can pick up by grazing on the cold, bare pastures day and night. Under such a system the largest profits cannot be secured. It is true that every cow has a limit of milk-production, but, at the same time, it lies with the breeders' and milk-producers' skill to obtain that maximum. There is no doubt that the farmers would derive great pecuniary advantage from pursuing a more systematic method of feeding dairy cows during winter. But all these essentials must be rather the result of time than the efforts of any one individual, and they will not be brought about until a more comprehensive system of co-operative dairying is set going.
Very little cheese is made in Taranaki. Cheese-factories have been erected from time to time, but, through want of skill in management, they have proved failures, and so the attempt to make it has almost been abandoned.
If the soil and climate of Taranaki were not favourable for cheese-making one could understand such an unsatisfactory state of things existing, but, in my opinion, the soil and climate are eminently fitted for the production of first-class cheese. Soil and climate are certainly thoroughly suitable, the district being more favoured with moisture than most parts of New Zealand. This constant supply of moisture from the atmosphere is very favourable to the growth of grasses and of green crops generally. Most of the soil being of a light friable loam, with the rock not far from the surface, this moisture is just what is required. There is a constant fresh spring of grass, and not many hot days. These circumstances are conducive to the exigencies of cow-life, and, in a secondary degree, to the manufacture of butter and cheese. Probably nowhere in the colony can better butter and cheese be produced, coupled at the same time with large flows of milk.
Towards showing the vast importance of the dairy industry to Taranaki, it is worthy of note that during the six months ending the 31st March last something like 600 tons of butter have been exported. This we can safely estimate as having netted to the exporters 8d. per pound, giving an aggregate value of £44,800; yet the industry there is capable of immense expansion.
The reason why so large a quantity of inferior butter is produced is not far to seek:—
A large majority of the dairies are too small, except to supply factories, and are therefore compelled to keep their cream far too long before churning.
Very inferior accommodation for the milk and cream, which applies to most of the factories also.
A prejudiced inclination to adhere to ancient customs and “rule-of-thumb” methods in manufacture.
A want of technical knowledge in the treatment of milk and cream suitable to the pastures and climate.
Want of skill in the selection of packages and the style of packing.
The want of proper cool cars on our railways and cool space on our coasting-steamers.
There are other minor difficulties to be contended with but these are the principal causes whereby a large percentage of inferior butter gluts our markets, and at the same time interferes with the demand among local consumers. This also, when exported, accounts for ruinous rates being returned to producers, and at the same time acts prejudicially to the sale of good butter in the Home and intercolonial markets.
All these items affecting so much the production of a higher-priced article are receiving due consideration from my hands, although it is a difficult matter to overcome—especially among private makers—the fancied superiority of their skill in the production of fine goods.
Like many other zealous advocates for the extension of dairy-farming in New Zealand and reform in dairy practices, I place exclusive reliance upon the establishment of the factory system as being the only means whereby the ultimate success of the industry can be assured. What the refrigerator has done for the grazier, cheese-factories and creameries will do for the dairy-farmer if properly carried out. What would the frozen-meat trade be to-day if every farmer could refrigerate his own produce and trifle with it according to his own peculiar notions, as he does at the present time with his dairy-produce? Were there not such a division of labour in the frozen-meat trade it would, in my opinion, very swiftly come to ruin. The dairying industry, like the frozen-meat trade, has many features peculiar to it which seem to characterize it in a general way from almost any other known industry.
The advantages of a well-organized system of co-operative dairying . . . to all the dairy districts of New Zealand would be difficult to estimate. Such a system, if properly governed, would, in my opinion, solve many of the difficulties which now beset the small farmer. Co-operative dairying is a matter fraught with benefit to all.
As a means of reducing the temperature in butter-factories, I have suggested a process which may now be seen in operation at Messrs. J. and R. Cuddie's factory at Mosgiel. I have examined this method of cooling during the year, and find it both cheap and effective. The system consists of an underground air-drain 200ft. long, from which coiled tin piping is carried to the well. The air is drawn through this drain and coiled pipe inserted in the well by means of a small fan driven by a one-horse-power engine. By this process the air, in passing through the underground drain and coiled pipe, is cooled to near the temperature of the water, which stands at a temperature of about 52°. The cool chamber is half underground, the walls being double brick, with air-space between. It is well roofed and lined, and a thickness of 2ft. of sawdust is placed on top of the ceiling, so that the building is not affected by the fluctuating temperature of the outside atmosphere. Since the Messrs. Cuddie have introduced this system of cooling, the butter-product of the firm has materially improved, and, in my opinion, it has not many successful rivals in New Zealand. The manager in this factory is now also a thorough master of his work. Although this system is practicable at Mosgiel, it cannot be introduced in many places on account of the want of cool spring-water.
The much-disputed point of freezing versus chilling butter has been settled during the year in favour of the system which I have always advocated—viz., chilling salted butters, while fresh may be frozen. From repeated experiments during the year I have proved that the lower the temperature of the room in which butter is kept—if that be above freezing-point—the better will the butter keep while there, and the better will it keep when brought into the warmer temperature of stores and warehouses. The same applies to its treatment before shipment and during transit.
Towards showing the present extent of the factory system, it is gratifying to be able to show that there are now sixty-two large cheese- and butter-factories in operation, the buildings and plant showing an aggregate value of upwards of £70,000.
Some of the cheese-factories are now turning out from 100 to 160 tons of cheese annually, and the butter-factories and creameries 50 to 140 tons of butter annually.
The industry is now assuming dimensions which justify the belief that we have at last succeeded in establishing it as one of our most important industries. I am of opinion that in afew years hence, if a systematic course of instruction is pursued, New Zealand, taking all things into consideration, will be as eminent in the manufacture of dairy-produce as any of the American or European nations. I believe it will yet become a successful rival to the frozen-meat and wool trade, and, as a means of employing labour and maintaining a large population, it will be superior to either.
The census returns show a larger number of dairy-factories than that given by Mr. Sawers; but his number, 64, refers only to large factories. The number ascertained by the census returns was 71 cheese- and butter-factories and 3 creameries, employing 218 men and 51 women. The total value of the produce for 1890 was £150,957—viz., cheese, £68,710; butter, £73,340; bacon, £1,707; other products, £7,200.
The growing importance of our export trade of butter and cheese with the United Kingdom, which must be regarded as the market chiefly to be considered, will be evident from a consideration of the statement on page 99 of the quantity exported during the last six years.
Important as are the grazing and dairy interests to New Zealand, yet the future is intimately bound up with mining interests: the mineral resources are very great. In the past these have had a most important influence on the development and progress of the colony. Gold to the value of £46,425,629 was obtained prior to the 31st December, 1890. The gold produce in 1890 was of the value of £773,438. In the earlier years the gold was obtained from alluvial diggings, but at the present time largely from gold-bearing quartz, which is distributed widely through several parts of the colony, and thus there is a much better prospect for the permanency of this industry than was afforded by the alluvial diggings. The amount of silver extracted to the end of 1890 only amounted to £134,997, but recent discoveries of ore give promise of large production in the future. Of other minerals, the product to the same date amounts to £8,969,020, of which kauri-gum. yielded £5,394,687, and coal, with coke, £3,362,363.
The following gives the production of precious metals and minerals during the year 1890:—-
| Oz. | £ | |
|---|---|---|
| Gold | 193,193 | 773,438 |
| Silver | 32,637 | 6,162 |
| Tons. | ||
| Antimony ore | 515 | 11,121 |
| Manganese ore | 482 | 1,004 |
| Hematite ore | 1 1/2 | 5 |
| Mixed minerals | 19 | 273 |
| Coal | 635,481 | 349,936 |
| Coke (exported) | 2,218 | 3,334 |
| Kauri-gum | 7,438 | 378,563 |
| £1,523,836 |
The approximate total output of the coal-mines to the 31st December, 1890, amounted to 6,456,674 tons. Extensive coalfields exist in the colony, coal being found in various parts, and mines are worked in the Provincial Districts of Auckland, Nelson, Canterbury, and Otago. The different kinds of coal have been classed by Sir James Hector as follows:—
Class 1: Hydrous, containing an excess of water.—This class includes lignite, brown coal, and pitch-coal.
Class 2: Anhydrous, containing very little water.—In this class are glance-coal, semi-bituminous, and bituminous coal.
Of the hydrous coals, brown coal is of value for local consumption, but useless for the production of gas or steam. Pitch-coal is a valuable coal for fuel and steam purposes but does not yield gas.
Of the anhydrous coals, the bituminous coal is of a very superior kind, being equal to, if not better than, the best descriptions used in any part of the world. It is especially valuable for gas companies, and is eagerly sought for gasworks and iron-foundries, even at an advance of 10 to 20 per cent. on the price of any other coal. Engineers of local steamers esteem it 20 per cent. better than the best New South Wales coal for steam purposes. The valuable character of this coal for steam purposes was shown when H.M.S. “Calliope” was, on account of using it, enabled to weather the hurricane at Samoa, which was so disastrous to vessels of other nations, and escape to sea. Sir James Hector has recently estimated the various coalfields in thecolony to contain on the whole 444 million tons; but the incompleteness of the surveys necessarily makes the estimate a very rough and probably very insufficient one.
Petroleum oils of good quality have been found at the Sugarloaves rocks, a short distance from the mainland near New Plymouth; at Waipaoa, near Poverty Bay; and at Manutahi, Waiapa, East Cape. The attempts made at Waipaoa to secure oil in marketable quantities have been so far unsuccessful, and it is still uncertain whether better results will be obtained from the borings now in operation at the Sugarloaves, Taranaki.
There are several mineral products not enumerated in the list given which exist in the colony, some in ascertained considerable quantities—e.g., iron, copper, chrome, lead and zinc ores. The purest form of marble is found in many localities in the Middle Island, also a great variety of excellent limestones suitable for building and other purposes.
The following table shows the number of principal industries at the end of 1890, the number of hands employed, the amount of wages paid to them, the estimated value of capital invested in land, buildings, machinery, and plant, and the value of the products or manufactures in that year:—
| Nature of Industry. | Number of each Kind. | Number of Hands employed. | Amount paid in Wages. | Estimated Values of Land, Buildings, Machinery, and Plant. | Estimated Value of Produce and Manufactures in 1890. |
|---|---|---|---|---|---|
| £ | £ | £ | |||
| Printing, &c., establishments | 142 | 2,569 | 214,185 | 341,683 | 354,559 |
| For machines, tools, and implements | 43 | 556 | 46,887 | 76,783 | 148,364 |
| Coach-building and -paining | 108 | 678 | 52,601 | 96,225 | 139,660 |
| Tanning, fellmongering, and wool-scouring | 104 | 1,196 | 92,442 | 153,592 | 1,026,349 |
| Ship- and boat-building | 37 | 145 | 10,831 | 10,172 | 35,847 |
| Sail and oilskin factories | 32 | 124 | 6,335 | 16,799 | 31,083 |
| Furniture factories | 94 | 585 | 42,743 | 96,543 | 131,314 |
| Chemical works | 8 | 55 | 5,754 | 23,766 | 41,568 |
| Woollen mills | 8 | 1,175 | 79,040 | 259,955 | 279,175 |
| Clothing factories | 19 | 1,290 | 52,754 | 59,735 | 166,579 |
| Hat and cap factories | 16 | 112 | 6,276 | 26,005 | 21,628 |
| Boot and shoe factories | 47 | 1,943 | 124,990 | 82,137 | 403,736 |
| Rope- and twine-works | 24 | 222 | 13,658 | 36,086 | 76,711 |
| Flax-mills | 177 | 3,204 | 116,168 | 146,792 | 234,266 |
| Meat-preserving, freezing, and boiling-down works | 43 | 1,568 | 138,459 | 476,151 | 1,464,659 |
| Bacon-curing establishments | 33 | 84 | 6,696 | 14,180 | 83,435 |
| Cheese and butter factories | 74 | 269 | 14,928 | 100,453 | 150,957 |
| Grain-mills | 129 | 499 | 52,384 | 391,828 | 991,812 |
| Biscuit factories | 22 | 331 | 17,199 | 48,960 | 127,147 |
| Fruit-preserving and jam-making works | 15 | 117 | 4,742 | 10,042 | 27,255 |
| Breweries | 102 | 476 | 54,825 | 236,825 | 66,764 |
| Malthouses | 27 | 87 | 7,875 | 42,442 | 80,341 |
| Aërated-water factories | 112 | 261 | 17,021 | 73,147 | 91,691 |
| Coffee- and spice-works | 17 | 81 | 6,562 | 30,850 | 64,024 |
| Soap- and candle-works | 10 | 209 | 21,394 | 74,443 | 155,714 |
| Saw-mills | 243 | 3,266 | 271,814 | 500,272 | 832,959 |
| Chaff — cutting establishments | 63 | 205 | 7,330 | 36,300 | 41,455 |
| Gas-works | 27 | 249 | 31,700 | 730,490 | 178,947 |
| Brick-, tile-, and pottery-works | 106 | 494 | 25,190 | 119,780 | 56,830 |
| Iron and brass foundries | 68 | 1,727 | 152,687 | 262,042 | 390,943 |
| Spouting- and ridging-works | 12 | 100 | 7,981 | 29,670 | 33,140 |
| Gold- and quartz-mining works | 135 | 1,971 | 183,582 | 241,715 | 278,893 |
| Hydraulic gold — mining and gold-dredging | 74 | 495 | 32,904 | 154,270 | 73,713 |
| Collieries | 95 | 1,655 | 173,538 | 155,671 | 279,777 |
| Other industries | 295 | 1,881 | 117,415 | 671,172 | 860,851 |
| Totals | 2,570 | 29,880 | 2,209,859 | 5,826,976 | 9,422,146 |
The number of these industries has increased from 2,268 in 1885 to 2,570 in 1890, the number of hands employed from 25,655 to 29,880, and the value of the produce from £7,436,649 to £9,422,146. As no information was obtained at the census of 1886 as to the wages-paid, no comparison can be made between the amount paid in 1885 and that in 1890. The value of land, buildings, and plant increased only from £5,697,117 to £5,826,976, notwithstanding the increase of 302 in the number of industries.
The number of writs of summons tested in the Supreme Court in 1890 was 929, against 1,023 in 1889 and 1,131 in 1888. The number of civil cases tried was 182, against 195 in the previous year: 119 of these cases were tried before a Judge without a jury. The total of the amounts for which judgments were recorded was £160,104 9s. 4d. 155 writs of execution were issued during the year from the Supreme Court.
The number of civil cases disposed of in the District: Courts was 89, of which 68 were tried, 39 before a Judge only, and 29 before juries. The total of the amounts sued for was £11,736 7s. 6d., and judgments were recorded for £2,657 10s. 2d. 17,790 civil cases were tried in the various Resident Magistrates' Courts. The total of the sums sued for was £275,283 14s. 8d.; judgments were given for £141,077 7s. 11d. The total number of civil cases in all the Courts was 18,808, against 19,087 in 1889; the total amount for which judgments were recorded was £303,839 7s. 5d., against £446,570 in 1889.
The petitions in bankruptcy numbered 652 in 1890, of which 627 were made by debtors and 25 by creditors. This number was the lowest in any one of the past six years.
The following gives the number of petitions, the total amount of the unsecured assets, the amount of debts proved, and the amount paid in dividends and preferential claims for the past five years:—
| Year. | No. of Petitions in Bankruptcy. | Debtors' Statements of Assets, excluding Amounts secured to Creditors. | Amounts realised by Official Assignees. | Amount of Debts proved. | Amounts paid in Dividends and Preferential Claims. |
|---|---|---|---|---|---|
| £ | £ | £ | £ | ||
| 1886 | 1,089 | 415,953 | 128,370 | 566,291 | 102,966 |
| 1887 | 1,036 | 311,745 | 135,633 | 50,759 | 109,255 |
| 1888 | 881 | 252,322 | 98,213 | 371,741 | 79,843 |
| 1889 | 724 | 441,874 | 187,048 | 55,165 | 95,032 |
| 1890 | 652 | 262,733 | 112,951 | 381,124 | 122,276 |
Of the bankruptcies in 1890, in 170 cases the liabilities were under £100; in 203 cases, from £100 to £250; in 121 cases, from £250 to £500; in 64 cases, from £500 to £1,000; in 52 cases, from £1,000 to £2,000; in 30 cases, from £2,000 to £5,000; and in 12 cases the liabilities were over £5,000.
The petitions in 1890 tinder “The Divorce and Matrimonial Causes Act, 1867,” were 32 in number—one less than in 1889: 24 were for dissolution of marriage, and 8 for judicial separation; 21 decrees for dissolution of marriage were granted. The proceedings under the Act for the past five years were as follows:—
| Year. | Petitions for | Decrees for | ||
|---|---|---|---|---|
| Dissolution of Marriage. | Judicial Separation. | Dissolution of Marriage. | Judicial Separation. | |
| 1886 | 31 | 3 | 24 | ... |
| 1887 | 26 | 6 | 16 | 1 |
| 1888 | 35 | 3 | 32 | ... |
| 1889 | 26 | 7 | 17 | 1 |
| 1890 | 24 | 8 | 21 | 3 |
The petitions for dissolution of marriage amounted on the average for the five years to 7.85 in every 1,000 marriages, and the decrees for dissolution to 6.08.
The proportion of petitions and decrees for dissolution of marriage to the number of marriages is much higher in New Zealand than in either England and Wales, New South Wales, or Victoria. The annual average in every 1,000 marriages for these countries is as follows:—
| Country. | Petitions for Dissolution of Marriage. | Decrees for Dissolution of Marriage. |
|---|---|---|
| New Zealand | 7.85 | 6.08 |
| England and Wales | 1.88 | 0.95 |
| New South Wales | 4.97 | 3.33 |
| Victoria | 3.79 | 1.82 |
In 1889 a Divorce Act was passed in Victoria to allow of divorces being granted for wilful desertion, habitual drunkenness, imprisonment under certain circumstances of either party, and of adultery on the part of the husband.These additional causes for divorce will doubtless largely increase the proportion of decrees in that colony. It has to be admitted that the large proportion of divorces in New Zealand is not due to any relaxation in the stringency of the causes for divorce, which are the same as in England.
The number of charges against persons for various offences brought before the Magistrates' Courts in 1890 was 18,701. These include repeated charges against the same person. In 1889 the number was 18,845, in 1888 19,167, and in 1887 20,336. Of these charges in 1890, 454 were against persons of the aboriginal native race—an increase of 85 on the corresponding number in 1889.
The summary convictions numbered 14,128, including 243 of persons of the Native race. 471 males, including 38 Maoris, and 25 females were committed for trial by the superior Courts—a decrease of 7 in the number of males other than Maoris, but an increase of 5 in the number of females other than Maoris similarly committed in 1889.
Of the persons other than Maoris, 17 males and 1 female were convicted in the superior Courts of offences against the person; 130 males and 8 females, of offences against property; and 34 males and 2 females, of other offences.
The number of summary convictions in the various Magistrates' Courts for certain of the most numerous offences, in each of the past five years, together with the proportion per 1,000 of the mean population (exclusive of Maoris), are given herewith:—
| Number. | |||||
|---|---|---|---|---|---|
| 1886. | 1887. | 1888. | 1889. | 1890. | |
| Assaults | 705 | 731 | 633 | 636 | 705 |
| Larceny | 845 | 764 | 882 | 988 | 855 |
| Drunkenness | 5,983 | 5,372 | 5,402 | 5,152 | 5,677 |
| Per 1,000 of the Population. | |||||
|---|---|---|---|---|---|
| 1886. | 1887. | 1888. | 1889. | 1890. | |
| Assaults | 1.21 | 1.23 | 1.05 | 1.04 | 1.14 |
| Larceny | 1.45 | 1.28 | 1.46 | 1.61 | 1.38 |
| Drunkenness | 10.28 | 9.01 | 8.92 | 8.39 | 9.14 |
While there has been again a decrease in the number of charges brought before the various Magistrates' Courts there has been an increase in the actual number of convictions in these Courts, but a decrease in the proportion to the 1,000 of the population:—
| Year. | Charges before Magistrates. | Summary Convictions. | Convictions in Superior Courts. | |||
|---|---|---|---|---|---|---|
| No. | Proportion per 1,000 of Population. | No. Proportion per 1,000 of Population. | No. | Proportion per 1,000 of Population. | ||
| 1881 | 19,297 | 39.11 | 13,795 | 28.16 | 214 | .43 |
| 1882 | 22,108 | 43.41 | 16,220 | 31.85 | 200 | .39 |
| 1883 | 22,511 | 42.52 | 16,590 | 31.35 | 189 | .36 |
| 1884 | 23,105 | 41.81 | 17,672 | 31.98 | 219 | .39 |
| 1885 | 22,709 | 39.61 | 17,566 | 30.64 | 223 | .39 |
| 1886 | 21,227 | 36.46 | 16,428 | 28.22 | 259 | .44 |
| 1887 | 19,924 | 33.41 | 15,278 | 25.61 | 334 | .56 |
| 1888 | 18,829 | 30.92 | 14,259 | 23.55 | 255 | .42 |
| 1889 | 18,476 | 30.10 | 13,861 | 22.57 | 225 | .37 |
| 1890 | 18,247 | 29.39 | 13,885 | 22.37 | 192 | .31 |
The convictions for offences against the person and property in the inferior and superior Courts were in each of the past five years in the following proportions per 1,000 of population:—
| 1886. | 1887. | 1888. | 1889. | 1890. | |
|---|---|---|---|---|---|
| Offences against the person | 1.39 | 1.43 | 1.25 | 1.22 | 1.31 |
| Offences against property | 2.42 | 2.46 | 2.35 | 2.49 | 2.27 |
In 1890 there were 432 Maori males and 22 Maori females charged in the various Magistrates' Courts with the commission of various offences. Of these, 236 males and 7 females were summarily convicted, and 38 males were committed for trial by the superior Courts. 35 Maoris, all males, were convicted in the Supreme Court during the years, of whom one was found guilty of murder.
The returns from the various gaols give a total of 4,330 prisoners received during the year 1890, an increase of 277 on the number in 1889. Of those received in 1890, 143 were confined on account of debt or lunacy, including 15Maoris, arid 113 were Maoris who had been charged with various offences. Exclusive of debtors, lunatics, and Maoris, 4,074 persons were received in the gaols during the year, an increase of 288 on the number in 1889.
The number received includes persons awaiting trial but not convicted during the year, also the repeated admissions of the same persons, and transfers from gaol to gaol of persons undergoing sentence. In addition to the usual returns, a separate card for each admission is furnished from each gaol; this, by throwing out all the cards over one referring to the same person, enables the actual number of distinct persons received in the various gaols during the year to be ascertained. The number of distinct persons (exclusive of Maoris) received in gaols in 1890, and who were convicted of offences, was 2,397, a decrease of 2 on the number in 1889. These numbers do not include children committed to the industrial schools who had not been convicted of any statutory offence.
The following shows the number of distinct persons (exclusive of Maoris) imprisoned in the past five years who were convicted of offences, only one cause being given when the person was imprisoned at different times either for the same or some other offence:—
| Offences. | 1886. | 1887. | 1888. | 1889. | 1890. |
|---|---|---|---|---|---|
| Felony and larceny | 594 | 526 | 563 | 527 | 516 |
| Misdemeanour | 90 | 120 | 97 | 131 | 101 |
| Injury to property | 54 | 62 | 47 | 53 | 65 |
| Assault and resisting the police | 209 | 178 | 162 | 170 | 206 |
| Acts of vagrancy | 205 | 238 | 251 | 351 | 333 |
| Drunkenness | 1,077 | 1,038 | 938 | 802 | 808 |
| Other offences | 545 | 477 | 473 | 365 | 368 |
| Totals | 2,774 | 2,639 | 2,531 | 2,399 | 2,397 |
In 1885 these convicted prisoners averaged 53.56 in every 10,000 of the population; in 1886 the average was 47.82; in 1887, 44.25; in 1888, 41.81; in 1889, 39.00; and in 1890, 38.61. There has been since 1885 a decrease at the rate of 21.46 per cent. in the number of distinct convicted prisoners, and a reduction of 14.95 in the proportion to the 10,000 of population.
It must be understood that the actual number of imprisonments for some of the above offences were much more numerous than the figures given, as a considerable number of persons underwent repeated imprisonments for either the same or some other offence Thus, many persons given as imprisoned for larceny underwent other imprisonments for drunkenness, &c. Many imprisoned for drunkenness were several times in gaol during the year for the same or other offences, as assault, riotous' or indecent conduct, &c. In many cases there were several charges against the same person at the one time, of which the most serious followed by conviction has been selected. These numbers do not include Maori prisoners.
As the tables in the statistical volume which give the ages, birthplaces, and religions of prisoners include every admission, there is a repetition of the same particulars of a prisoner for every fresh admission of that person into gaol. The following table shows the number of distinct persons (exclusive of Maoris) received into gaol and convicted for each class of offence stated in 1890, classified according to the religious denominations to which they belong, their birthplaces, and ages:—
| — | Felony and Larceny. | Misdemeanour. | Injury to Property. | Assault and resisting Police. | Vagrancy. | Drunkenness. | Other Offences. | Totals. | ||||||||
|---|---|---|---|---|---|---|---|---|---|---|---|---|---|---|---|---|
| M. | F. | M. | F. | M. | F. | M. | F. | M. | F. | M. | F. | M. | F. | M. | F. | |
| Religions,— | ||||||||||||||||
| Church of England | 242 | 31 | 46 | 5 | 26 | 7 | 88 | 5 | 105 | 37 | 250 | 40 | 146 | 7 | 903 | 32 |
| Roman Catholic | 103 | 14 | 28 | 1 | 14 | 7 | 80 | 6 | 65 | 44 | 229 | 57 | 99 | 27 | 618 | 156 |
| Presbyterian | 64 | 9 | 14 | 1 | 5 | .. | 19 | .. | 47 | 16 | 135 | 24 | 40 | 2 | 324 | 52 |
| Wesleyan | 26 | 2 | 2 | .. | 4 | .. | 3 | .. | 8 | .. | 13 | 3 | 12 | 1 | 68 | 6 |
| Others | 25 | .. | 4 | .. | 2 | .. | 5 | .. | 11 | .. | 52 | 5 | 34 | .. | 133 | 5 |
| Totals | 460 | 56 | 94 | 7 | 51 | 14 | 195 | 11 | 236 | 97 | 679 | 129 | 331 | 37 | 2,046 | 351 |
| Birthplaces,— | ||||||||||||||||
| England and Wales | 158 | 19 | 31 | 2 | 15 | 3 | 72 | 3 | 86 | 24 | 243 | 29 | 120 | 6 | 725 | 86 |
| Scotland | 51 | 9 | 10 | 1 | 6 | 1 | 15 | .. | 36 | 13 | 110 | 20 | 37 | .. | 265 | 44 |
| Ireland | 68 | 15 | 23 | 1 | 12 | 5 | 55 | 6 | 56 | 30 | 211 | 62 | 68 | 21 | 493 | 140 |
| New Zealand | 111 | 8 | 17 | 2 | 11 | 4 | 29 | 1 | 17 | 24 | 36 | 11 | 37 | 8 | 258 | 58 |
| Australian Colonies | 26 | 1 | 3 | 1 | 3 | 1 | 8 | 1 | 13 | 4 | 17 | 3 | 13 | 1 | 83 | 12 |
| Other British Possessions | 3 | .. | 1 | .. | 1 | .. | 3 | .. | 3 | 1 | 14 | 1 | 6 | .. | 31 | 2 |
| China | 6 | .. | .. | .. | .. | .. | .. | .. | 3 | .. | .. | .. | 1 | .. | 10 | .. |
| Other Countries | 37 | 4 | 9 | .. | 3 | .. | 13 | .. | 22 | 1 | 48 | 3 | 49 | 1 | 181 | 9 |
| Totals | 460 | 56 | 94 | 7 | 51 | 14 | 195 | 11 | 236 | 97 | 679 | 129 | 331 | 37 | 2,046 | 351 |
| Ages,— | ||||||||||||||||
| Under 10 | 5 | .. | 1 | .. | .. | .. | .. | .. | .. | .. | .. | .. | .. | .. | 6 | .. |
| 10 and under 12 | 5 | .. | .. | 1 | 2 | .. | .. | .. | .. | .. | .. | .. | .. | .. | 7 | 1 |
| 12 and under 15 | 14 | .. | 1 | .. | 3 | .. | .. | .. | .. | .. | .. | .. | 2 | .. | 20 | .. |
| 15 and under 20 | 64 | 5 | 3 | 1 | 1 | 2 | 7 | .. | 5 | 13 | 5 | 3 | 19 | .. | 104 | 24 |
| 20 and under 25 | 70 | 4 | 10 | 1 | 7 | 2 | 38 | 1 | 22 | 12 | 44 | 4 | 53 | 5 | 244 | 29 |
| 25 and under 30 | 50 | 9 | 10 | 1 | 9 | 2 | 39 | .. | 21 | 20 | 60 | 11 | 48 | 5 | 237 | 48 |
| 30 and under 40 | 87 | 13 | 32 | 1 | 16 | 5 | 57 | 5 | 60 | 31 | 166 | 38 | 106 | 9 | 524 | 102 |
| 40 and under 50 | 89 | 18 | 25 | 2 | 6 | 3 | 24 | 2 | 56 | 14 | 187 | 42 | 54 | 12 | 441 | 93 |
| 50 and under 60 | 56 | 7 | 8 | .. | 2 | .. | 16 | 2 | 44 | 3 | 151 | 25 | 34 | 6 | 311 | 43 |
| 60 and over | 20 | .. | 4 | .. | 5 | .. | 14 | 1 | 28 | 4 | 66 | 6 | 15 | .. | 152 | 11 |
| Totals | 460 | 56 | 94 | 7 | 51 | 14 | 195 | 11 | 236 | 97 | 679 | 129 | 331 | 37 | 2,046 | 351 |
Of the above, prisoners convicted, 32 males and 2 females were released on probation under “The First Offenders' Probation Act, 1886.” The Inspector of Prisons in his last report made the following remarks in reference to the operation of that Act: “It is exceedingly gratifying to be again able to report that this Act continues to work successfully and well, and generally carries out the intentions and purport of its introduction; in fact, the more it is known the better it is liked. It has certainly already rescued many from a career of crime. . . . During the past year 93 offenders were brought under its provisions, as against 83 in 1889. Of these, 44 satisfactorily carried out the conditions of their licenses and were discharged, 2 were re-arrested and committed to prison, 2 absconded, and 1 died, leaving 44 still under the supervision of the Probation Officers.”
“The great argument in favour of the First Offenders' Probation Act is that it endeavours to work reformation in persons who are only just entering on a dishonest course. . . . If by any means short of increasing crime persons can be saved or reformed when young, or even when come to years of discretion, without being sent to prison, then surely a great and good work is being done. . . . In New Zealand there is every reason to believe and hope that the more the judicious exercise of the First Offenders' Probation Act is extended the greater, in a corresponding degree, will be the decrease of crime.”
Of the persons placed under the First Offenders' Probation Act in 1890, 17 were under 15 years of age and 30 from; 15 to 20 years of age.
The number of distinct prisoners in New Zealand cannot be compared with the number of prisoners in any other country for the purpose of estimating the relative amount of criminality in each country, as nowhere else, so far as it is known, is any accurate account taken of the number of distinct prisoners apart from the number of admissions into gaol. The data arc therefore dissimilar for the purpose of comparison.
The following are the proportions of those belonging to each of the four principal denominations in every 100 distinct convicted prisoners in each of the five past years:—
| Denominations of Convicted Prisoners. | Proportion per 100 of Convicted Prisoners. | Proportion of Denomination per 100 of Population at Census of 1886. | ||||
|---|---|---|---|---|---|---|
| 1886. | 1887. | 1888. | 1889. | 1890. | ||
| Church of England | 41.7.1 | 43.54 | 42.99 | 43.31 | 43.18 | 40.17 |
| Roman Catholic | 34.39 | 32.51 | 31.88 | 32.85 | 32.29 | 13.95 |
| Presbyterian | 15.57 | 15.31 | 16.48 | 15.21 | 15.68 | 22.59 |
| Wesleyan | 2.27 | 2.61 | 2.45 | 2.71 | 3.09 | 9.55 |
Still excluding Maoris, the following are the proportions of distinct convicted prisoners, classified according to birthplace, for each of the past five years:—
| Birthplaces. | Number of Convicted Prisoners. | Proportion of each Nationality to every 100 Prisoners. | Proportion of Persons of each Nationality to every 100 of Population, 1886. | ||||||||
|---|---|---|---|---|---|---|---|---|---|---|---|
| 1886. | 1887. | 1888. | 1889. | 1889. | 1886. | 1887. | 1888. | 1889. | 1890. | ||
| England and Wales | 986 | 912 | 848 | 807 | 811 | 35.54 | 34.56 | 33.51 | 33.64 | 33.83 | 22.06 |
| Scotland | 376 | 337 | 328 | 313 | 309 | 13.55 | 12.77 | 12.96 | 13.05 | 12.89 | 9.48 |
| Ireland | 750 | 701 | 703 | 639 | 633 | 27.04 | 26.56 | 27.78 | 26.64 | 20.41 | 8.89 |
| New Zealand | 280 | 302 | 319 | 294 | 316 | 10.09 | 11.44 | 12.60 | 12.25 | 13.18 | 51.89 |
| Australian Colonies | 126 | 108 | 102 | 107 | 95 | 4.54 | 4.09 | 4.03 | 4.46 | 3.96 | 2.98 |
| Other British Possessions | 42 | 56 | 44 | 27 | 33 | 1.52 | 2.12 | 1.74 | 1.13 | 1.38 | 0.68 |
| China | 16 | 17 | 12 | 19 | 10 | 0.58 | 0.65 | 0.47 | 0.79 | 0.42 | 0.79 |
| Other Foreign Countries | 198 | 206 | 175 | 193 | 190 | 7.14 | 7.81 | 6.91 | 8.04 | 7.93 | 3.23 |
A considerable decrease is observable in the number of prisoners born in the United Kingdom. This result, as years progress and the population of the colony consists more and more of those born therein, might naturally be expected. So also, for a similar reason, might an increase be expected in the number of New-Zealand-born prisoners. There is such an increase, but it is small. In 1886 the number of native-burn prisoners was 280, in 1890 316. This is a small proportion considering that the New-Zealand born comprise more than half of the population.
The following table relates to the New-Zealand-horn prisoners (exclusive of Maoris). These are also so many distinct persons:—
| Offences. | Under 10. | 10 and under 12. | 12 and under 15. | 15 and under 20. | 20 and under 25. | 25 and under 30. | 30 and under 40. | 40 and upwards. | Totals. | |||||||||
|---|---|---|---|---|---|---|---|---|---|---|---|---|---|---|---|---|---|---|
| M. | F. | M. | F. | M. | F. | M. | F. | M. | F. | M. | F. | M. | F. | M. | F. | M. | F. | |
| Felony and larceny | 5 | .. | 3 | .. | 14 | .. | 43 | 3 | 33 | 1 | 8 | 3 | 2 | 1 | 3 | .. | 111 | 8 |
| Misdemeanour | 1 | .. | .. | 1 | 1 | .. | 2 | 1 | 5 | .. | 4 | .. | 3 | .. | 1 | .. | 17 | 2 |
| Injury to property | .. | .. | 2 | .. | 3 | .. | 1 | 1 | 2 | 2 | 1 | .. | 2 | 1 | .. | .. | 11 | 4 |
| Assault and resisting police | .. | .. | .. | .. | .. | .. | 4 | .. | 13 | 1 | 8 | .. | 3 | .. | 1 | .. | 29 | 1 |
| Acts of vagrancy | .. | .. | .. | .. | .. | .. | 2 | 10 | 6 | 8 | 5 | 2 | 3 | 3 | 1 | 1 | 17 | 24 |
| Drunkenness | .. | .. | .. | .. | .. | .. | 4 | .. | 12 | 3 | 7 | 3 | 10 | 3 | 3 | 2 | 36 | 11 |
| Others | .. | .. | .. | .. | 2 | .. | 7 | .. | 14 | 4 | 8 | 4 | 5 | .. | 1 | .. | 37 | 8 |
| Totals | 6 | .. | 5 | 1 | 20 | .. | 63 | 15 | 85 | 19 | 41 | 12 | 28 | 8 | 10 | 3 | 258 | 58 |
| Totals, 1889 | 2 | .. | 4 | 1 | 15 | 4 | 62 | 14 | 59 | 20 | 42 | 12 | 37 | 2 | 15 | 5 | 236 | 58 |
| Totals, 1888 | 5 | .. | 10 | .. | 35 | .. | 63 | 19 | 61 | 11 | 40 | 9 | 42 | 13 | 9 | 2 | 265 | 54 |
| Totals, 1887 | 4 | .. | 4 | .. | 17 | 1 | 79 | 19 | 60 | 11 | 39 | 7 | 37 | 15 | 6 | 3 | 246 | 56 |
| Totals, 1886 | 6 | 10 | 27 | 91 | 59 | 39 | 39 | 9 | 280 | |||||||||
There were, for all offences, 316 distinct New-Zealand-born convicted prisoners, against 294 in 1889; of these, in 1890, 110 were under 20 years of age. There was a slight increase in the number convicted of felony or larceny, and a considerable increase in the numbers convicted of acts of vagrancy and drunkenness.
Of the convicted prisoners of all nationalities males comprised 85.36 and the females 14.64 per cent. In 1889 the proportions were males 85.36 and females 14.84 per cent. The male prisoners were in the proportion of 6.18 in every 1,000 of the male population; the female prisoners in the proportion of 1.21 per 1,000 of the female population.
The following were the respective proportions of the convicted prisoners at each age-period of life to every 100 prisoners of each sex for each of the past two years:—
| Age. | Male Prisoners. | Per 100 Male Prisoners. | Female Prisoners. | Per 100 Female Prisoners. | ||||
|---|---|---|---|---|---|---|---|---|
| 1889. | 1890. | 1889. | 1890. | 1889. | 1890. | 1889. | 1890. | |
| Under 20 years | 138 | 137 | 6.76 | 6.70 | 28 | 25 | 7.87 | 7.12 |
| 20 and under 30 years | 432 | 481 | 21.15 | 23.51 | 77 | 77 | 21.63 | 21.94 |
| 30 and under 40 years | 551 | 524 | 26.97 | 25.61 | 93 | 102 | 26.12 | 29.06 |
| 40 and under 50 years | 491 | 441 | 24.03 | 21.55 | 105 | 93 | 29.49 | 26.50 |
| 50 and under 60 years | 292 | 311 | 14.29 | 15.20 | 42 | 43 | 11.80 | 12.25 |
| 60 years and upwards | 139 | 152 | 6.80 | 7.43 | 11 | 11 | 3.09 | 3.13 |
| 2,043 | 2,04 | 100.00 | 100.00 | 356 | 351 | 100.00 | 100.00 | |
Inquests were held during the year on the bodies of 604 males and 158 females. Of these, the deaths of 293 males and 47 females were attributed to accidental causes. Of these, 111 males and 19 females were drowned; 10 males were killed through being run over by an engine, train, tramcar, &c. In 1889 11 deaths were attributed to railway accidents.
There were 63 inquests on suicidal deaths, 52 on the bodies of males and 11 on those of females. In 1889 the corresponding numbers were males 41 and females 6.
There were 30 inquests held after fires in 1890, but in only 8 instances was there a verdict of incendiarism given. In 20 cases there was not sufficient evidence to enable a decision as to the cause of fire to be arrived at.
At the end of 1890 there were 1,605 schools of all classes, at which members of the European and Maori races were being educated. This was an increase of 47 on the number in 1889. The public primary schools numbered 1,200 in 1890, against 1,155 in 1889. The number of aided or endowed colleges, grammar, and high schools was 22, the same as in the previous year. The number of private schools was 298 in 1890, an increase of 5 in the year. There were also 10 industrial schools and orphanages, public and private, and 1 Government school for deaf mutes.
The number of schools established for the education of the Native or Maori race was 74, a decrease of 4 on the number in 1889.
Education at the public schools is free (except at those which have been converted into district high schools, at which the pupils taught the higher branches are charged fees) and purely secular. The attendance of all children between the ages of 7 and 13 is compulsory, except when special exemptions are granted, or they are being otherwise sufficiently educated.
The subjects of instruction at the primary schools are required by the Education Act to be the following: Reading, writing, arithmetic, English grammar and composition, geography, history, elementary science and drawing, object-lessons, vocal music, and (in the case of girls) sewing and needlework, and the principles of domestic economy. It is also required that provision shall be made for the instruction in military drill of all boys in those schools.
The number of young people of European descent, including half-castes living among Europeans, on the rolls of attendance of the various schools in the last quarter of 1890 was 134,317, an increase on the corresponding number in 1889 of 2,446. Of these, 117,408 attended the public schools, 2,117 attended the colleges, grammar and high schools, 13,626 attended private schools, 718 were inmates of orphanages and industrial schools, 406 attended Native village schools, and 42 were deaf-mutes at the Government institution.
There was, thus, an increase (exclusive of Maoris) during the year of 2,389 in the number attending the public schools, and of 168 in the number attending private schools. The attendance at the college, grammar, and high schools was less by 30, and that of European children at the Native village schools by 26.
Exclusive of Maoris, but including 338 male and 333 female half-castes living among the Europeans, there were 60,544 boys and 56,864 girls in attendance at the public primary schools during the last quarter of 1890, an increase on the numbers in 1889 of 1,254 boys and 1,135 girls. The average attendance of the pupils for the last quarter was again rather better than in the preceding year, having amounted to 81.98 per cent. of the roll-number at the end of the year, against 81.7 in 1889, and 79.3 in 1888.
There were 1,301 male and 1,677 female teachers (exclusive of 162 sewing-mistresses) at the public schools at the end of 1890. Of the males, 237, and of the females, 698, were pupil-teachers.
The secondary or superior schools consist of aided or endowed colleges and grammar and high schools. Of the 22 schools of this class, 8 were for boys only, 6 for girls only, and 8 for boys and girls. The number of regular instructors in 1890 was 123, and that of visiting instructors, 22. The number of pupils on the roll for the last term of 1890 was 2,117; of these, 1,293 were boys and 824 girls. There was an increase of 12 in the number of boys, but a decrease of 42 in the number of girls, on the roils for the last term of 1889.
The New Zealand University is not a teaching body; the undergraduates for the most part keep their terms at one of the affiliated institutions, which are the following: the Auckland University College, the Canterbury College, and the University of Otago, each having a staff of professors. The number of graduates on the 1st June, 1890, who had obtained direct degrees was 272. The number of undergraduates on the roll of the University at that date was 1,161, but only 575 were keeping terms, of whom 364 were males and 211 females. 33 of the males were medical students at the University of Otago. Thenumber of students attending lectures at the affiliated institutions during the year 1890—91 was as follows: At the Auckland University College, 50 matriculated and 97 non-matriculated; at Canterbury College, 151 matriculated and 116 non-matriculated; at the Otago University, 144 matriculated and 38 non-matriculated.
There were 298 private schools in operation in the colony at the end of 1890, an increase of 5 in the number in 1889; 33 were for boys, 49 for girls, and 216 for children of both sexes. The number of pupils attending them was 13,691, viz., 5,775 boys and 7,916 girls, of whom 16 boys and 49 girls were Maoris. The number of pupils at these schools (exclusive of Maoris) was greater than in 1889 by 168. Of the private schools 108 were Roman Catholic, with an attendance of 9,474 pupils, As there was an increase of 13 in the number of Roman Catholic schools and of 450 in the number of pupils attending them, it follows that there was a decrease of 8 in the number of other private schools, and of 282 in the number of pupils (other than Maoris) attending them.
The following gives, for the past five years, the number of private schools and of pupils attending them, exclusive of Maoris, the number of Roman Catholic schools and pupils being also shown separately:—
| Year. | Number of Private Schools. | Pupils. | Total Pupils. | Included in previous Numbers. | ||
|---|---|---|---|---|---|---|
| Boys. | Girls. | Roman Catholic Schools. | Pupils at Roman Catholic Schools. | |||
| 1886 | 288 | 5,216 | 7,257 | 12,473 | 83 | 7,991 |
| 1887 | 299 | 5,771 | 7,616 | 13,387 | 90 | 8,946 |
| 1888 | 299 | 5,874 | 7,979 | 13,853 | 96 | 9,346 |
| 1889 | 293 | 5,778 | 7,680 | 13,458 | 95 | 9,024 |
| 1890 | 298 | 5,759 | 7,867 | 13,626 | 308 | 9,474 |
The total number of children of European descent (including only those half-castes who live among Europeans) known to be in the receipt of some educational training at the end of 1890 was 134,317; of these, 128,809were from 5 to 15 years of age. The results of the last census relative to the ages of the population are not yet available: it cannot therefore as yet be stated what proportion of the population at 5—15 years of age are not attending school.
The number of Native village schools at the end of 1890 either supported or subsidised by the Government was 68, a decrease of 4 on the number in 1889. In addition, there were 4 boarding-schools for Native children, the cost of whose maintenance was paid either by the Government or from endowments, and 2 private Native schools.
The number of Maori children attending schools at the end of 1890 was 2,659—viz., 1,517 males and 1,142 females. These included 91 children of mixed European and Native blood who were living as members of Native tribes.
The number at the several schools in each of the two past years was as follows:—
| Schools. | Maori Children attending Schools. | |||||
|---|---|---|---|---|---|---|
| Boys. | Girls. | Total of both Sexes. | ||||
| 1889. | 1890. | 1889. | 1890. | 1889. | 1890. | |
| At public European schools | 273 | 307 | 164 | 197 | 437 | 504 |
| At Native village schools | 1,159 | 1,032 | 871 | 821 | 2,030 | 1,853 |
| At subsidised or endowed boarding-schools | 106 | 124 | 53 | 58 | 159 | 182 |
| At private European or Native schools | 54 | 54 | 56 | 66 | 110 | 120 |
| Totals | 1,592 | 1,517 | 1,144 | 1,142 | 2,736 | 2,059 |
There was thus in 1890 a decrease of 75 in the number of Maori boys and 2 in that of Maori girls who were attending school.
The total income of the various Education Boards for the year 1890 amounted to £394,506 14s. 2d., exclusive of balances on the 1st January of that year amounting to £32,802 17s. 10d. The grants by the Government amounted to £356,659 3s., an increase of £21,540 17s. 7d. on the amount of the grants in 1889. These grants consist(I) of a statutory allowance of £3 15s. per child in daily average attendance, (2) a further capitation allowance of 1s. 6d. for scholarships, and (3) a varying sum for school buildings.
The total expenditure in 1890 amounted to £397,942 1s. 3d., of which the sum of £336,670 6s. 6d. was spent on the maintenance of the schools, £9,696 19s. for expenses of the Boards, £10,725 for inspection of schools and examination of pupil-teachers, £39,225 7s. 3d. on school buildings, and £1,624 8s. 6d. for miscellaneous services.
The expenditure in 1890 on account of Native village schools was £14,939 16s. 4d.; against £13,451 5s. 3d. in 1889. Further sums amounting to £2,626 9s. 6d. were expended for the following purposes: Maintenance of Maori children at subsidised boarding-schools, £1,460 17s. 7d.; inspection, £625 5s. 5d.; and general charges, £540 6s. 6d.
The following was the cost of the Government industrial schools in 1890:—
| School. | Cost of School. | Cost of Boarding-out. | Recoveries. | Net Cost. | ||||||||
|---|---|---|---|---|---|---|---|---|---|---|---|---|
| £ | s. | d. | £ | s. | d. | £ | s. | d. | £ | s. | d. | |
| Auckland | 502 | 11 | 9 | 359 | 19 | 6 | 215 | 1 | 5 | 647 | 9 | 10 |
| Kohimarama | 1,467 | 0 | 1 | 866 | 3 | 6 | 561 | 7 | 1 | 1,771 | 6 | 6 |
| Burnham | 2,930 | 14 | 4 | 3,458 | 12 | 2 | 3,654 | 1 | 11 | 2,735 | 4 | 7 |
| Caversham | 2,654 | 1 | 3 | 3,169 | 19 | 1 | 4,368 | 5 | 9 | 1,455 | 14 | 7 |
| 7,554 | 7 | 5 | 7,854 | 14 | 3 | 8,799 | 6 | 2 | 6,609 | 15 | 6 | |
| Salary and expenses of Visiting Officer | 209 | 13 | 7 | |||||||||
| Total | £6,819 | 9 | 1 | |||||||||
The net cost of these schools was less than in 1889 by £2,871 1s. 3d., due to the decline in the number of children and the larger amounts recovered from the Charitable Aid Boards and parents.
Among the children enumerated as attending school are 42 deaf-mute pupils at the Government institution for deaf mutes, at Sumner, near Christchurch. The children are taught to speak with the mouth, and to read articulate speech by observing the movement of the lips. Many of the pupils who have left the institution have thus become qualified to take a part in conversation, and to be useful members of society.
The total revenues for the past financial year of the various County and Borough Councils, and Road, Town, River, Drainage, and Harbour Boards, amounted to £1,363,247 17s. 4d., of which the receipts from rates amounted to £463,581 3s. 7d., and those from the General Government to £144,008 4s. 1d.
The following shows the amount of rates collected and the amount of indebtedness on account of loans at the end of each of the past ten financial years:—
| Year ended 31st March. | Rates collected by Local Bodies. | Outstanding Loans of Local Bodies. | ||
|---|---|---|---|---|
| £ | s. | d. | £ | |
| 1882 | 297,327 | 18 | 9 | 3,277,581 |
| 1883. | 327,128 | 8 | 11 | 3,510,046 |
| 1884 | 398,659 | 5 | 11 | 3,962,330 |
| 1885 | 401,392 | 18 | 6 | 4,313,223 |
| 1886 | 410,638 | 15 | 3 | 4,943,270 |
| 1887 | 434,236 | 12 | 2 | 5,620,747 |
| 1888 | 433,831 | 12 | 7 | 5,812,803 |
| 1889 | 445,928 | 19 | 10 | 5,892,050 |
| 1890 | 460,302 | 14 | 9 | 5,978,059 |
| 1891 | 463,581 | 3 | 7 | 6,012,693 |
The rates collected by the Drainage and Harbour Boards included in the above amounts were in each case for the year ending the previous 31st December.
The loans do not include those advanced by the General Government under special statutes, and repayable by instalments, of which the outstanding debentures at the end of March, 1891, amounted to £384,780 12s. 1d.
Of the other loans outstanding at the end of the last financial year, those raised in the colony amounted to £985,114, at rates of interest varying from 5 to 9 per cent.; but only £200 was at 9 per cent; the amount of £451,006 bore interest at rates exceeding 6 per cent.; the amount of £2,644,558 was at 6 per cent.; and the amount of £2,947,129 was raised at varying rates under 6 per cent.
The total value of rateable property in counties which was not included in any road or town district was on the 31st March, 1891, £27,058,062; of this, the value of the rateable Crown and Native lands amounted to £5,855,005. The rateable value of Crown and Native lands was less than in the previous year by £185,650, but the rateable value of the rest of the land was greater by £510,917; the increase in the total of the rateable values being £325,267.
The revenue for the past financial year of all the counties in which the Counties Act is in full operation was £239,848 18s. 6d., a decrease of £11,164 1s. 6d. on the revenue of the previous year. Of the revenue in the past year the sum of £121,446 19s. 7d. was raised by rates.
The expenditure of these counties amounted altogether to £291,201 8s., of which the sum of £196,550 13s. 5d. was spent on public works, £39,158 2s. 7d. on management, and £25,914 2s. on hospitals and charitable aid.
In the majority of the boroughs the rates are levied on the annual values of the rateable properties, and the returns only give those values; but in 13 boroughs the capital values only are the bases for rating purposes. The total annual value of properties in 74 of these boroughs was in March, 1891, £2,079,459, a decrease on the total value in 1890 of £2,879. The Act under which the valuation is made provides for a reduction from the renting value of 20 per cent. on houses and buildings, and 10 per cent. on land. The actual annual values of the properties will therefore be greater than the rating values by from 11 to 25 per cent.
The estimated capital value in the remaining 13 boroughs' was £2,643,750.
The total revenues of the boroughs for the past year amounted to £425,800 5s. 7d.; of this, the sum of £213,508 12s. 2d. was received from rates.
Of a total expenditure by the boroughs amounting to £443,361 4s. 7d., the sum of £166,548 16s. 3d. was spent on public works, £20,165 4s. 5d. on hospitals and charitable aid, and £44,950 16s. 9d. on management.
The indebtedness of the boroughs on account of outstanding loans was at the end of March, 1891, £2,540,390,a decrease of £1,063 on the similar indebtedness at the end of March, 1890.
The properties in the various town districts are not rated on a uniform system. In the majority of the districts the rate is levied on the total value of the property, in the others on the annual value; but in each of the road districts the rate is levied on the total value.
The estimated total value of properties in the first-mentioned town districts in March, 1891, was £1,377,562, and the annual value of the properties in the rest of the districts was £44,141. This shows a decrease on the values in the previous year of £150,853 on the total and of £7,659 on the annual value.
The total rateable value of properties in the road districts was £43,309,243, a decrease on the value in March, 1890, of £393,140. In each case the value of rateable Crown and Native lands are included. These amounted in March, 1891, to £2,469,865 of the total value of rateable properties in road districts; also to £32,539 of the total value and to £662 of the annual value of property in town districts.
Excluding the Crown and unoccupied Native lands, the values of the rateable properties in the colony in each of the years ending in March, 1889, 1890, and 1891 were as follows:—
| — | 31st March, 1889. Rated on | 31st March, 1890. Rated on | 31st March, 1891. Rated on | |||
|---|---|---|---|---|---|---|
| Total Value. | Annual Value. | Total Value. | Annual Value | Total Value. | Annual Value. | |
| £ | £ | £ | £ | £ | ||
| In counties not in road districts | 20,971,397 | ... | 20,632,140 | ... | 21,203,057 | ... |
| In road districts of counties | ... | 41,882,668 | ... | 41,075,208 | ... | 40,839,378 |
| In town districts | 1,540,183 | 49,594 | 1,491,758 | 49,251 | 1,345,023 | 43,479 |
| In boroughs | 2,123,294 | 2,279,491 | 2,082,338 | 2,311,694 | 2,643,750 | 2,079,453 |
| Totals | 66,517,542 | 2,329,085 | 65,341,444 | 2,360,945 | 66,031,208 | 2,122,938 |
Assuming that the capital value is worth sixteen times the stated annual value (it should be worth more, for, as has been previously remarked, the stated annual valueshould be increased from 11 to 25 per cent., according to whether the property consists of land or houses, in order to arrive at the full annual value), then the total value of all rateable property, excepting Crown and unoccupied rateable Native lands, in each of the five past years would be as follows:—
| Year. | Value of Properties rated on Basis of Total Value. | Annual Value of Properties rated on that Basis. | Annual Value capitalised by multiplying by 16. | Total Value of Rateable Property in Colony, except Crown and Native Lands. |
|---|---|---|---|---|
| £ | £ | £ | £ | |
| 1886-87 | 64,458,314 | 2,353,410 | 37,654,560 | 102,112,874 |
| 1887-88 | 66,784,806 | 2,223,950 | 35,583,200 | 102,368,006 |
| 1888-89 | 66,517,542 | 2,329,085 | 37,265,360 | 103,782,902 |
| 1889-90 | 65,341,444 | 2,360,945 | 37,775,120 | 103,116,564 |
| 1890-91 | 66,031,208 | 2,122,938 | 33,967,008 | 99,998,216 |
The total revenue of the Town Boards amounted to £14,751 11s. 9d., of which rates yielded £4,874 5s. 5d.
The total revenue of the Road Boards amounted to £127,104 0s. 8d., of which rates yielded £77,699 2s. 3d.
The total revenue of the River Boards, exclusive of the Inch-Clutha Board, which is also a Road Board, amounted to £8,598 6s. 9d., of which the receipts from rates amounted to £6,951 8s. 11d.
Of the total revenue of the Harbour Boards, amounting to £287,880 11s. 9d., rates yielded £20,621 10s. 6d. There is only one Drainage Board, that for the Christchurch district. The revenue for the past year amounted to £14,734 3s. 1d., chiefly from rates, which yielded £14,721 18s. 1d.
The amount of direct taxation imposed on the people by these local bodies in the form of rates amounted to £459,823 16s. 11d., to which may be added the rates received by 19 local bodies from which no returns were received, estimated (from former returns) to amount to £3,757 6s. 8d., making a total of £463,581 3s. 7d., equivalent to an average of 14s. 10d. per head of the population.
The New Zealand Permanent Militia Force is divided into two branches, the Artillery and Torpedo Corps.
The Artillery branch consisted at the end of 1890 of 6 commissioned and 15 non-commissioned officers, and 128 rank and file. The Torpedo branch consisted of 2 commissioned and 12 non-commissioned officers, and 41 rank and file. The Permanent Force thus consisted of 204 of all ranks, being 13 more than in the previous year.
The strength of the Police Force at the end of 1890 was 486 of all ranks, a decrease of 12 during the year. It is recruited from the Permanent Militia Force, and no persons who have not served in the Permanent Force are eligible for the Police so long as recruits from that Force can be obtained. During 1890 24 gunners were transferred from the Permanent to the Police Force. This practice would render the Police after a time a valuable reserve of artillerymen in case of emergency.
There was a decrease during the year of 13 in the number of Volunteer corps, and of 1,251 in the total strength of this force.
The following gives the total strength of all ranks of each class of Volunteer corps in each of the two past years:—
| Corps. | 1889. | 1890. | ||
|---|---|---|---|---|
| Corps. | Strength. | Corps. | Strength. | |
| Cavalry | 10 | 555 | 9 | 515 |
| Mounted infantry | 2 | 102 | 4 | 206 |
| Naval artillery | 17 | 1,318 | 17 | 1,192 |
| Artillery | 13 | 735 | 12 | 629 |
| Engineers | 3 | 171 | 3 | 156 |
| Rifles | 75 | 4,661 | 67 | 3,897 |
| Honorary | 3 | 177 | 2 | 105 |
| Cadets | 41 | 2,344 | 37 | 2,112 |
| Totals | 164 | 10,063 | 151 | 8,812 |
The number of fire brigades in 1890 was 67, with a total strength of 200 officers and 1,033 men. This, compared with the numbers in 1889, shows an increase of 1 in the number of the brigades and of 11 in the number of the officers, but a decrease of 18 in the number of the men.
There were 8 life assurance companies doing business in the colony in 1890, in addition to the Life Insurance Department of the New Zealand Government.
The total number of policies for life assurances and endowments issued in the colony during the year by these companies and the Government Insurance Department, inclusive of policies transferred to the colony, was 6,757, representing a total amount of £1,772,550. 4,809 policies were either discontinued or transferred from the colony during 1890; the amount represented being £1,323,434 10s. 4d.
The number of existing policies at the end of 1890 was 54,025, representing a gross amount insured of £15,582,650 7s. 10d., equivalent to an average of £288 8s. 8d. for each policy. The number of assured amounted to an average of 86 in every 1,000 persons living.
The total revenue from New Zealand life assurance business during the year was £658,985 5s. 9d., of which the sum of £50,991 2s. 11d. was received on account of new premiums, and £413,471 3s. 9d. on account of renewals. The interest credited to the revenue account amounted to £185,419 4s. 3d.
The total expenditure during the year in respect of New Zealand business amounted to £343,242 9s. 4d., of which the payments on account of claims amounted to £143,259 0s. 8d. The payments on account of surrenders amounted to £62,552 11. 11d., an increase of £7,109 17s. 6d. on the similar amount paid in 1889. This large amount indicates the continuance of the pressure of straightened circumstances upon a considerable section of the community.
The management expenses during the year amounted to £123,003 16s. 10d. The proportion of expenses to revenue varied greatly in the different companies. The following shows the proportion of expenses to revenue in respect of New Zealand business for the several insurance companies in the years 1889 and 1890:—
| Office. | Number of Years of Business in the Colony. | Revenue in 1890. | Expenses in 1890. | Percentage of Expenses to Revenue. | |||||
|---|---|---|---|---|---|---|---|---|---|
| £ | s. | d. | £ | s. | d. | 1889. | 1890. | ||
| Australian mutual provident society | 29 | 232,611 | 3 | 8 | 27,637 | 10 | 11 | 12.4 | 11.9 |
| Colonial mutual life assurance society (limited) | 7 | 25,175 | 12 | 1 | 10,720 | 14 | 2 | 59.5 | 42.6 |
| Equitable insurance association of New Zealand | 6 | 442 | 6 | 5 | 588 | 17 | 9 | 89.8 | 133.3 |
| Equitable life assurance society of the united states | 6 | 20,770 | 8 | 7 | 4,954 | 10 | 8 | 34.8 | 23.9 |
| Mutual assurance society of Victoria (limited) | 7 | 9,647 | 14 | 0 | 4,230 | 17 | 8 | 47.9 | 43.8 |
| Mutual life association of Australasia | 14 | 28,343 | 4 | 7 | 12,179 | 16 | 10 | 37.3 | 43.0 |
| National mutual life association of Australasia (limited) | 11 | 25,338 | 0 | 8 | 9,095 | 6 | 11 | 37.3 | 35.9 |
| New York insurance company | 4 | 3,231 | 5 | 6 | 1,986 | 19 | 6 | 45.8 | 61.5 |
| The life insurance department of the New Zealand government | 21 | 313,425 | 10 | 3 | 51,609 | 2 | 5 | 18.7 | 16.5 |
WM. R. E. BROWN,
Registrar-General.
DEC. 13, 1642.—Discovery of New Zealand by Abel Jansen Tasman.
Oct. 8, 1769.—Captain Cook landed at Poverty Bay on his first visit.
1814.—First arrival of Rev. Mr. Marsden at Bay of Islands, and introduction of Christianity. Horses, oxen, sheep, and poultry first brought to the colony.
1823, 1828.—Acts passed by the Imperial Parliament extending the jurisdiction of the Courts of justice in New South Wales to all British subjects in New Zealand.
1825.—First attempt at colonisation by an expedition under the command of Captain Herd, who bought two islands in the Hauraki Gulf.
1827.—Destruction of mission-station at Wangaroa by Hongi's forces.
1831.—Application of thirteen chiefs for the protection of King William the Fourth.
1833.—Mr. Busby appointed British Resident, to live at the Bay of Islands.
1835.—Declaration of independence of the whole of New Zealand as one nation, with the title of “The United Tribes of New Zealand.”
1838.—The Roman Catholic Bishop Pompallier, with several priests, arrived at Hokianga.
May 12, 1839.—Departure of the preliminary expedition of the New Zealand Company from England.
June, 1839.—Issue of Letters Patent authorising the Governor of New South Wales to include within the limits of that colony any territory that might be acquired in sovereignty by Her Majesty in New Zealand.
Sept. 16, 1839.—First body of New Zealand Company's emigrants sailed from Gravesend.
Sept. 20, 1839.—Arrival in Port Nicholson of the preliminary expedition of the New Zealand Company under Colonel Wakefield.
Jan. 22, 1840.—Arrival of first body of immigrants at Port Nicholson.
Jan. 29, 1840.—Captain Hobson, R.N., arrived at the Bay of Islands. On the following day (Jan. 30) he hoisted the Union flag, and read the commission, under the Great Sealof the United Kingdom, which extended the boundaries of the Colony of New South Wales so as to embrace and comprehend the Islands of New Zealand; also his own commission as Lieutenant-Governor over territory that might be acquired in sovereignty.
Feb. 5, 1840.—Date of Treaty of Waitangi.
May 21, 1840.—Date of Proclamations of sovereignty over the Islands of New Zealand.
June 17, 1840.—The Queen's sovereignty over the Middle Island formally proclaimed at Cloudy Bay, by Major Bunbury, H.M. 80th Regiment, and Captain Nias, R.N.
Aug. 11, 1840.—The British flag hoisted at Akaroa by Captain Stanley, R.N., and British authority established. The French frigate “L'Aube “ arrived there on the 13th August, and the vessel “Comte de Paris,” with 57 immigrants, on the 16th August, in order to establish a French colony.
Sept. 18, 1840.—The British flag hoisted at Auckland. The Lieutenant-Governor's residence established there.
1840.—Formation of Wanganui settlement under the name of “Petre.”
Feb. 12, 1841.—Issue of charter of incorporation to the New Zealand Company.
Mar. 31, 1841.—Arrival of first New Plymouth, settlers.
May 3, 1841.—New Zealand proclaimed to be independent of New South Wales.
Oct., 1841.—Selection of site for settlement at Nelson.
May 29, 1842.—Arrival of Bishop Selwyn in the colony.
Sept. 10, 1842.—Death of Governor Hobson. Lieutenant Shortland, R.N., Colonial Secretary, became Acting-Governor until the arrival of Captain Fitzroy.
June, 1843.—Affray with Natives at the Wairau, and massacre by Rangihaeata of Captain Wakefield, R.N., agent at Nelson of the New Zealand Company, and others, who had surrendered.
Dec. 1, 1843.—Arrival of Captain Fitzroy, R.N., as Governor.
July 8, 1844.—The Royal flagstaff at Kororareka cut down by Heke.
Mar. 10, 1845.—Attack on and destruction of Town of Kororareka by Heke.
Oct. 1, 1845.—Receipt of despatch notifying recall of Governor Fitzroy.
Nov. 14, 1845.—Arrival of Captain Grey, as Lieutenant-Governor of the colony, from South Australia.
Jan. 11, 1846.—Capture of pa at Ruapekapeka, Bay of Islands, and termination of Heke's war.
Mar. 3, 1846.—Commencement of Native hostilities in the Hutt Valley, near Wellington.
May 16, 1846.—Attack by Natives on a military outpost in the Hutt Valley.
July 23, 1846.—Capture of Te Rauparaha at Porirua, nearWellington; he was detained for a year as prisoner on board a ship of war.
Aug. 28, 1846.—The New Zealand Government Act passed by the Imperial Parliament, under which a charter was issued dividing the colony into two provinces, and granting representative institutions.
May 19, 1847.—Attack by Natives on settlement of Wanganui.
Jan. 1, 1848.—Captain Grey sworn in as Governor-in-Chief over the Islands of New Zealand, also as Governor of the Province of New Ulster and Governor of the Province of New Munster.
Jan. 3, 1848.—Major-General Pitt appointed by Governor Grey to be Lieutenant-Governor of the Province of New Ulster.
Jan. 28, 1848.—Assumption by Lieutenant-Governor E. J. Eyre, at Wellington, of the administration of the Government of the Province of New Munster.
Feb. 21, 1848.—Peace ratified at Wanganui.
Mar. 7, 1848.—Suspension by Imperial statute of that part of the New Zealand Government Act winch had conferred representative institutions.
Mar., 1848.—Otago founded by a Scotch company under the auspices of the Free Church of Scotland.
Oct., 1848.—Severe earthquake at Wellington.
July, 1850.—Surrender of the New Zealand Company's charter, all its interests in the colony reverting to the Imperial Government.
Dec., 1850.—Canterbury founded by the Canterbury Association in connection with the Church of England.
Jan. 8, 1851.—Death of Major-General Pitt, Lieutenant-Governor of the Province of New Ulster.
April 14, 1851.—Lieutenant-Colonel Wynyard appointed Lieutenant-Governor of the Province of New Ulster.
1852.—Discovery of gold at Coromandel by Mr. Charles Ring.
June 30, 1852.—The Constitution Act passed by the Imperial Parliament, granting representative institutions to the colony, and subdividing it into six provinces.
Jan., 1853.—Promulgation of the Constitution Act.
Mar. 7, 1853.—Assumption by Sir George Grey, K.C.B., of the duties of Governor of the colony in terms of the appointment after the passing of the New Zealand Constitution Act, and cessation of the duties of the Lieutenant-Governors of New Ulster and New Munster.
Dec. 31, 1853.—Departure of Governor Sir George Grey.
Jan. 3, 1854.—Lieutenant-Colonel Wynyard assumed the administration of the Government.
May 27, 1854.—Opening at Auckland of the first session of the General Assembly by Lieutenant-Colonel Wynyard, Administrator of the Government.
Jan., 1855.—Very severe earthquake on each side of Cook Strait.
Sept. 6, 1855.—Arrival of Governor Colonel T. Gore Browne, C.B.
May 7, 1856.—Appointment of the first Ministry under the system of Responsible Government, under Mr. Sewell, Colonial Secretary.
May 14, 1856.—Defeat of Mr. Sewell's Ministry.
May 20, 1856.—Appointment of a Ministry under presidency of Mr. W. Fox as Attorney-General.
May 28, 1856.—Defeat of Mr. Fox's Ministry, by a majority of one, on a direct vote of want of confidence.
June 2, 1856.—Appointment of a Ministry under the presidency of Mr. Stafford.
1857.—First payable goldfield in the colony opened at Collingwood, in the Nelson Province.
Nov. 1, 1858.—Establishment of the Province of Hawke's Bay.
March, 1859.—Te Teira offered land at Waitara for sale to the Government.
Nov. 1, 1859.—Establishment of the Province of Marlborough.
Mar., 1860.—Commencement of hostilities against Wiremu Kingi te Rangitake at Waitara.
Mar. 18, 1860.—Capture of Maori pa at Waitara.
Mar. 28, 1860.—Engagement at Waireka.
June 27, 1860.—Engagement of Puketakauere at Waitara.
Nov. 6, 1860.—Defeat at Mahoetahi, with heavy loss, of a force of Waikato Natives who had crossed the Waitara River to join Wiremu Kingi.
Dec. 31, 1860.—Capture of the Matarikoriko Pa and defeat of a large body of Waikato Natives.
Jan. 23, 1861.—The Natives made a determined attack on the redoubt at Huirangi occupied by Imperial troops, and were repulsed with heavy loss.
April 1, 1861.—Establishment of Province of Southland.
May 21, 1861.—A truce agreed to.
May, 1861.—Discovery of gold at Gabriel's Gully, Otago.
July 5, 1861.—Defeat of Mr. Stafford's Ministry, by a majority of one, on a vote of want of confidence.
July 12, 1861.—Appointment of a Ministry under the premiership of Mr. Fox.
July 29, 1861.—Incorporation of the Bank of New Zealand.
Sept. 26, 1861.—Arrival of Sir George Grey, K.C.B., at Auckland from the Cape Colony, to succeed Governor Gore Browne. Sir George Grey was sworn in as Governor on the 3rd October.
Oct. 2, 1861.—Departure of Governor Gore Browne.
June 28, 1862.—Coromandel proclaimed a goldfield.
July 28, 1862.—Defeat of Mr. Fox's Ministry by the casting-voteof the Speaker, on a proposed resolution in favour of placing the ordinary conduct of Native affairs under the administration of the Responsible Ministers.
Aug. 6, 1862.—Appointment of a Ministry under the leadership of Mr. Alfred Domett.
Feb. 7, 1863.—Wreck of H.M.S. “Orpheus” on Manukau Bar; 181 lives lost.
Feb. 26, 1863.—Definite relinquishment by the Imperial Government of control over administration of Native affairs.
May 4, 1863.—Treacherous assault near Tataraimaka by Natives on a military escort. Murder of Lieutenant Tragett, Dr. Hope, and five soldiers of the 57th Regiment.
June 4, 1863.—Defeat of Natives at Katikara by a force under Lieut.-General Cameron.
July 17, 1863.—Action at Koheroa, in the Auckland Province. Commencement of the Waikato war.
Oct. 27, 1863.—Resignation of the Domett Ministry in consequence of difficulties experienced in connection with arrangements for finding a fitting representative of the Government in the Legislative Council.
Oct. 30, 1863.—Appointment of the Ministry formed by Mr. Fox, under the premiership of Mr. F. Whitaker.
Nov., 1863.—Acceptance by the General Assembly of colonial responsibility in Native affairs.
Nov. 20, 1863.—Battle at Rangiriri. Defeat of Natives and unconditional surrender of 183.
Dec. 1, 1863.—The first railway in New Zealand opened for traffic by W. S. Moorhouse, Superintendent of Canterbury. The line was from Christchurch to Ferrymead Junction.
Dec. 3, 1863.—The New Zealand Settlements Act passed, giving the Governor power to confiscate the lands of insurgent Natives.
Dec. 8, 1863.—Occupation of Ngaruawahia. The British flag hoisted on the Maori King's flagstaff.
Feb. 11, 1864.—Engagement with Natives on Mangapiko River. Major (then Captain) Heaphy, of the New Zealand forces, won the Victoria Cross for distinguished bravery on this occasion.
Feb. 22, 1864.—Defeat of Natives at Rangiaohia.
April 2, 1864.—Attack on and capture of pa at Orakau, Waikato.
April 21, 1864.—Engagement near Maketu, Bay of Plenty. Tribes of the Rawhiti defeated by Arawa Natives under Captain McDonnell.
April 29, 1864.—Assault on Gate Pa, Tauranga, Bay of Plenty, and repulse of large British force by the Maoris. The pa was abandoned by the Natives during the following night.
April 30, 1864.—Repulse of attack by rebel Hauhau Natives on redoubt at Sentry Hill, Taranaki.
May 14, 1864.—Battle of Moutoa, an island in the WanganuiRiver, between friendly and rebel Hauhau Natives. Complete defeat of rebels.
June 21, 1864.—Engagement at Te Ranga, near Tauranga, by Lieut.-Colonel Greer, 68th Regiment. Severe defeat of the Natives.
1864.—Discovery of gold on the west coast of the Middle Island.
Sept. 10, 1864.—Escape of Maori prisoners from Kawau.
Nov. 24, 1864.—Appointment of a Ministry under the premiership of Mr. F. A. Weld, the Whitaker-Fox Ministry having resigned during the recess.
Dec. 17, 1864.—Confiscation of Native lands in Waikato by Sir George Grey.
Feb., 1865.—Removal of the seat of Government to Wellington.
Mar. 2, 1865.—Barbarous murder of the Rev. Mr. Volkner, a Church of England missionary at Opotiki, by Hauhau fanatics, under Kereopa.
June 8, 1865.—Submission of the Maori Chief Wiremu Tamihana te Waharoa (William Thompson).
June 17, 1865.—Murder of Mr. Fulloon, a Government officer, and his companions at Whakatane by Hauhau fanatics.
July 22, 1865.—Capture of the Wereroa Pa, near Wanganui.
Aug. 2, 1865.—Assault and capture of the Pa Kairomiromi, at Waiapu, by Colonial Forces under Captain Fraser, and Native Contingent under the chief Te Mokena. Eighty-seven rebels killed.
Sept. 2, 1865.—Proclamation of peace issued by Governor Sir George Grey, announcing that the war which commenced at Oakura was at an end.
Sept. 30, 1865.—Murder by Hauhaus, at Kakaramea, of Mr. Broughton, when sent as a friendly messenger to them by Brigadier-General Waddy.
Oct. 12, 1865.—Resignation of Mr. Weld's Ministry, on account of a resolution adverse to the Government policy having been defeated only by the casting-vote of the Speaker.
Oct. 16, 1865.—Appointment of a Ministry under the premiership of Mr. E. W. Stafford.
Dec. 25, 1865.—Defeat of rebel Natives at Wairoa, Hawke's Bay, by Colonial Forces and Native Contingent.
Jan. 4, 1866.—Defeat of Natives at Okotuku Pa, on the west coast of the North Island, by force under Major-General Chute.
Jan. 7, 1866.—Assault on and capture of Putahi Pa by force under Major-General Chute.
Jan. 13, 1866.—Assault on and capture of Otapawa Pa by force under Major-General Chute.
Jan. 17, 1866, to Jan. 25, 1866.— Period of Major-General Chute's march through the bush to New Plymouth.
Jan., 1866.—Escape of a large number of Native prisoners from the hulk at Wellington; many were drowned in trying to swim ashore.
Mar. 29, 1866.—Submission of the rebel chiefs Te Heuheu and Herekiekie, of Taupo District.
Mar., 1866.—A detachment of Maori prisoners sent to the Chatham Islands.
June 15, 1866.—Commencement of Panama steam mail-service.
Aug. 26, 1866.—The Cook Strait submarine telegraph cable laid.
Oct. 2, 1866.—Engagement with rebel Natives at Pungarehu, West Coast, by Colonial Forces, under Major McDonnell.
Oct. 8, 1866.—First Act passed to impose stamp duties.
Oct. 12, 1866.—Defeats of rebel Natives at Omaranui and at Petane, Hawke's Bay, by Colonial Forces.
Oct. 10, 1867.—An Act passed to establish an Institute for the Promotion of Science and Art in the colony.
Oct. 10, 1867.—An Act passed for the division of the colony into four Maori electorates, and the admission of four Maori members to the House of Representatives.
Jan., 1868.—Establishment of the County of Westland.
Feb. 5, 1868.—Arrival of Governor Sir George F. Bowen, G.C.M.G.
July 4, 1868. —Seizure by Maori prisoners, under the leadership of Te Kooti, of the schooner “Rifleman,” and their escape from the Chatham Islands.
July 12, 1868.—Night attack by Natives on redoubt at Turuturu Mokai. Sub-Inspector Boss and 7 Europeans killed. Natives driven off by the arrival of a force under Major Von Tempsky.
Aug. 8, 1868.—Pursuit by Lieut.-Colonel Whitmore of escaped Chatham Island prisoners, and indecisive engagement in the gorge of the Ruake Ture.
Aug. 21, 1868.—Attack on Ngutu-o-te-Manu by force under Lieut.-Colonel McDonnell. Defeat of Natives; 4 Europeans killed and 8 wounded.
Sept. 7, 1868.—Engagement in bush at Ngutu-o-te-Manu. Major Von Tempsky, Captains Buck and Palmer, Lieutenants Hunter and Hastings, and 14 men killed.
Nov. 7, 1868.—Attack on Moturoa. Repulse of Colonial Forces with severe loss.
Nov. 10, 1868.—Massacre of 32 Europeans at Poverty Bay by Te Kooti's band of Natives who had escaped from the Chatham Islands.
Nov. 24, 1868, Dec. 3, 1868, Dec. 5, 1868.—Engagements between friendly Natives and rebels under Te Kooti, at Patutahi, Poverty Bay District.
Jan. 5, 1869.—Assault on, and capture of, Ngatapa Pa, Poverty Bay District, after a siege of six days, by the ColonialForces of Europeans and friendly Natives. Dispersion and pursuit of Te Kooti's band. More than 136 rebel Natives were killed.
Feb. 13, 1869.—Treacherous murder of the Rev. John Whitely and 7 other Europeans at the White Cliffs, Taranaki.
Feb. 18, 1869.—Attack by rebel Natives on a foraging-party at Karaka Flat; 1 sergeant and 6 men killed.
Mar. 3, 1869.—Termination of Panama mail-service.
Mar. 13, 1869.—Attack on, and defeat of, Titokowaru's force at Otauto.
April 10, 1869.—Native pa at Mohaka taken by Te Kooti, who killed 40 friendly Natives and several Europeans in the neighbourhood.
April 12, 1869.—First arrival of H.R.H. the Duke of Edinburgh in Wellington, in H.M.S. “Galatea.”
May 6, 1869.—Surprise and capture of Ahikereru and Oamaru Teangi Pas, Waiwera country. Defeat of Te Kooti.
June 13, 1869.—Surrender to Major Noake and Mr. Booth, R.M., of the chief Tairua, with 122 men, women, and children of the Pakakohe Tribe, near Wanganui.
June 24, 1869.—Defeat of Mr. Stafford's Ministry on a want-of-confidence motion.
June 28, 1869.—Appointment of a Ministry under the premiership of Mr. W. Fox.
Oct., 1869.—74 prisoners from the bands of Te Kooti and Titokowaru sentenced to death after trial for treason. The sentences of 73 wore commuted to penal servitude for various terms.
Oct. 4, 1869.—Pourere Pa stormed and taken by Lieut.-Colonel McDonnell, with a mixed force of Europeans and Natives.
Jan., 1870.—300 friendly Natives under Topia, and 300 under Major Kepa (known as Kemp), started up the Wanganui River in pursuit of Te Kooti, who retreated into the Urewera country.
Jan. 25, 1870.—Capture of Tapapa Pa, occupied by Te Kooti.
Feb. 24, 1870.—The last detachment of the Imperial troops left the colony.
Mar. 25, 1870.—Major Kepa, with Native force, captured the position held by Te Kooti at Maraetahi, in Urewera country; 19 rebels killed and 73 of Te Kooti's men taken prisoners. Te Kooti escaped with 20 followers.
Mar. 26, 1870.—Commencement of San Francisco mail-service.
June 28, 1870.—Enunciation in the House of Representatives of the public-works policy by the Colonial Treasurer, Mr. Vogel.
July, 1870.—30 prisoners of Te Kooti's band sentenced to death. The sentences were commuted to penal servitude.
Aug. 27, 1870.—Arrival in Wellington of H.R.H. the Duke of Edinburgh, in H.M.S. “Galatea“—second visit.
Sept. 12, 1870.—An Act passed to establish the New Zealand University.
Sept. 12, 1870.—The Land Transfer Act passed, to simplify the title to land and dealings with real estates.
Oct. 6, 1870.—Southland Province reunited with Otago.
Dee. 5, 1870.—Honiani te Puni, the chief of the Ngatiawas, a staunch friend of the Europeans, died at Pitone, near Wellington, aged 90 years.
Mar., 1871.—Commencement of railway construction under the public-works policy.
Aug. 4, 1871.—Death of Tamati Waka Nene, the great Ngapuhi chief and friend of the Europeans.
Nov., 1871.—Capture of the notorious rebel Kereopa, the murderer of the Rev. Mr. Volkner, by the Ngatiporous.
Jan. 5, 1872.—Execution of Kereopa at Napier.
Jan., 1872.—Remission of sentences on 58 Native prisoners then undergoing imprisonment for rebellion.
Feb. 22, 1872.—Visit of William King, the Maori chief of Waitara, to New Plymouth, and resumption of amicable relations with the Europeans.
May 9, 1872.—A general thanksgiving-day for the recovery of H.R.H. the Prince of Wales.
Sept. 6, 1872. — Defeat and resignation of Mr. Fox's Ministry.
Sept. 10, 1872.—Appointment of a Ministry under the premiership of the Hon. E. W. Stafford.
Oct. 4, 1872.—Defeat of the Stafford Ministry on a vote of want of confidence moved by Mr. Vogel.
Oct. 11, 1872.—Appointment of a Ministry under the premiership of the Hon. G. M. Waterhouse, M.L.C.
Oct. 11, 1872.—First appointment of Maori chiefs (two) to be members of the Legislative Council.
Oct. 25, 1872.—The Public Trust Office Act passed.
Jan., 1873.—Establishment of the New Zealand Shipping Company.
Mar. 3, 1873.—The Hon. W. Fox appointed Premier on the resignation of that office by the Hon. G. M. Waterhouse; the other members of the Ministry being confirmed in their offices.
Mar. 19, 1873.—Departure of Governor Sir G. F. Bowen, G.C.M.G.
Mar. 21, 1873.—Assumption of the Government by Sir G. A. Arney, Chief Justice, as Administrator.
April 8, 1873.—Resignation of the premiership by the Hon. W. Fox on the return of the Hon. J. Vogel, C.M.G., from Australia. Appointment of Mr. Vogel as Premier; the other Ministers being confirmed in their offices.
June 14, 1873.—Arrival of Governor Sir J. Fergusson, P.C.
Aug. 22, 1874.—The Imprisonment for Debt Abolition Act passed.
Dec. 3, 1874.—Arrival of Governor the Marquis of Normanby, P.C.
1874.—31,774 immigrants were introduced this year under the immigration and public-works policy.
Jan. 3, 1875.—Visit of Sir Donald McLean to the Maori King; resumption of amicable relations.
July 6, 1875.—Resignation of the Ministry in consequence of the absence of Sir J. Vogel, K.C.M.G., in England, and his being unable to attend the session of Parliament. Reconstitution thereof under the premiership of the Hon. Dr. Pollen, M.L.C.
July, 1875.—Establishment of the Union Steam Shipping Company of New Zealand.
1875.—18,324 immigrants were introduced this year under the immigration and public-works policy.
Oct. 12, 1875.—The Abolition of Provinces Act passed.
Feb. 15, 1876.—Resignation of the Hon. Dr. Pollen's Ministry, and reconstitution under the premiership of Sir J. Vogel, K.C.M.G.
Feb. 18, 1876.—Completion of the work of laying the telegraph cable between New Zealand and New South Wales.
June, 1876.—Death of Dr. Isaac Earl Featherston while acting as Agent-General for the colony in England. He was the first to hold that office, and had previously been Superintendent of the Province of Wellington from the time of the first establishment of provincial representative institutions.
Sept. 1, 1876.—Resignation of Sir J. Vogel's Ministry in view of the appointment of Sir J. Vogel as Agent-General. Formation of a Ministry under the premiership of Major Atkinson.
Sept. 13, 1876.—Resignation of Major Atkinson's Ministry in consequence of doubts being entertained as to the constitutional position thereof. Reconstruction of the Ministry under the premiership of Major Atkinson.
Nov. 1, 1876.—“The Abolition of Provinces Act, 1875,” came into full operation. Complete abolition of provincial institutions. The colony subdivided into counties and municipal boroughs.
Oct. 8, 1877.—Defeat of the Atkinson Ministry on a vote of want of confidence moved by Mr. Larnach.
Oct. 15, 1877.—Appointment of a Ministry under the premiership of Sir George Grey, K.C.B.
Nov. 29, 1877.—The Education Act, providing for the free and compulsory education of children, passed.
Feb. 29, 1879.—Departure of Governor the Marquis of Normanby.
Mar., 1879.—Removal of surveyors from the Waimate Plains by Natives acting under Te Whiti's orders.
Mar. 27, 1879.—Arrival of Governor Sir Hercules G. R. Robinson, G.C.M.G.
May 25, 1879.—The Natives from Parihaka, by order of Te Whiti, began ploughing up lands occupied by Europeans.
June, 1879.—Arrest of 180 of these Natives for causing disturbances.
July 29, 1879.—Defeat of the Grey Ministry on an amendment to the address in reply moved by Sir W. Fox, followed by a dissolution of Parliament.
Oct. 3, 1879. — Defeat and subsequent resignation of Sir George Grey's Ministry.
Oct. 8, 1879.—Appointment of a Ministry under the premiership of the Hon. John Hall.
Dec. 19, 1879.—An Act passed to assess property for the purpose of taxation.
Dec. 19, 1879.—The Triennial Parliament Act passed.
Dec. 19, 1879.—An Act passed to qualify every resident male of 21 years of age and upwards to vote.
June, 1880.—First portion of the Maori prisoners released by the Government.
Sept. 8, 1880.—Departure of Governor Sir Hercules G. R. Robinson, G.C.M.G.
Oct., 1880.—Release of the last portion of the Maori prisoners.
Nov. 29, 1880.—Arrival of Governor Sir A. H. Gordon, G.C.M.G.
Nov. 5, 1881.—March of force of Constabulary and Volunteers on Parihaka, and arrest of Te Whiti and Tohu without bloodshed.
April 21, 1882.—Resignation (during the recess) of the Hon. J. Hall's Ministry, and its reconstruction under the premiership of the Hon. F. Whitaker, M.L.C.
June 23, 1882.—Departure of Governor Sir A. H. Gordon.
June 24, 1882.—Assumption of the Government by Sir J. Prendergast, Chief Justice.
1882.—Frozen meat first exported in this year.
Jan. 20, 1883.—Arrival of Governor Sir W. F. D. Jervois, G.C.M.G., C.B.
Jan. 26, 1883.—A direct line of steam communication between England and New Zealand inaugurated by the New Zealand Shipping Company.
Feb. 13, 1883.—Proclamation of amnesty to Maori political offenders.
Feb. 19, 1883.—Liberation of Te Whiti and Tohu.
Sept. 25, 1883.—Resignation of the office of Premier and his seat in the Ministry by the Hon. F. Whitaker, and the appointment of the Hon. Major H. A. Atkinson to be Premier; the members of Mr. Whitaker's Ministry being confirmed in their offices.
June 11, 1884.—Defeat of Major Atkinson's Government.
June 27, 1884.—Dissolution of the General Assembly.
Aug. 16, 1884.—Resignation of Major Atkinson's Ministry in consequence of the result of the general election. Formation of a Ministry under the premiership of Mr. Robert Stout.
Aug. 20, 1884.—Defeat of Mr. Stout's Ministry by an amendment, expressive of want of confidence, to the address in reply being carried.
Aug. 28, 1884.—Appointment of a Ministry under the premiership of Major Atkinson.
Aug. 29, 1884.—Defeat of Major Atkinson's Ministry on a vote of want of confidence.
Sept. 3, 1884.—Appointment of a Ministry under the premiership of Mr. Robert Stout.
Nov. 8, 1884.—An Act passed to enable certain loans of the New Zealand Government to be converted into inscribed stock and the accrued sinking funds released.
Aug. 1, 1885.—The New Zealand Industrial Exhibition opened at Wellington.
June 10, 1886.—Volcanic eruptions at Tarawera, and destruction of the famed Pink and White Terraces.
May 28, 1887.—Defeat of Sir Robert Stout's Ministry.
July 15, 1887.—Dissolution of the General Assembly after prorogation on the 10th June.
July 21, 1887.—A Proclamation issued declaring the Kermadec Islands to be annexed to, and form part of, the Colony of New Zealand.
Oct. 8, 1887.—Appointment of a Ministry under the premiership of Major H. A. Atkinson, Sir R. Stout's Ministry having resigned in consequence of the result of the election.
Dec. 19, 1887.—An Act passed to reduce the number of members of the House of Representatives, after the expiration of the General Assembly then sitting, to seventy-four, including four Maori representatives.
Dec. 23, 1887.—The Australian Naval Defence Act, being an Act to provide for the establishment of an additional naval force on the Australian station, at the joint charge of the Imperial and the several Colonial Governments, was passed by the New Zealand Legislature.
Mar. 22, 1889.—Departure of Governor Sir W. F. D. Jervois, G.C.M.G., C.B., from the colony.
May 2, 1889.—Assumption of the Government by the Earl of Onslow, G.C.M.G.
Sept. 2, 1889.—Electors prohibited by statute from voting in respect of more than one electorate at any election for the House of Representatives.
Dec. 5, 1890.—First election of members of the House of Representatives under a practical manhood suffrage, and on the one-man-one-vote principle.
Table of Contents
NOTE.—The word “iron,” where used in this Schedule or in Schedule B, includes steel, or steel and iron combined. The letters n.o.e mean “not otherwise enumerated.”
Names of Articles and Rates of Duty.
ACID, acetic, 1 1/2d. the lb.
Acid, tartaric, 1d. the lb.
Aërated and mineral waters and effervescing beverages, £20 per cent. ad valorem
Ale, porter, beer of all sorts, cider, and perry, the gallon, or for six reputed quart bottles, or twelve reputed pint bottles, 1s. 6d. the gallon
Almonds, in the shell, 2d. the lb.
Almonds, shelled, n.o.e., 3d. the lb.
Apothecaries' wares, £15 per cent. ad valorem
Apparel and ready-made clothing, and all articles n.o.e. made up wholly or in part from textile or other piece-goods, £25 per cent. ad valorem
BACON and hams, 2d. the lb.
Bags, flour, £20 per cent. ad valorem
Bags, calico, forfar, hessian, and linen, £20 per cent. ad valorem
Bagging and bags n.o.e., £15 per cent. ad valorem
Baking-powder, £15 per cent. ad valorem
Baskets and wickerware, £20 per cent. ad valorem
Bellows other than forge, £15 per cent. ad valorem
Bicycles, tricycles, and the like vehicles, £20 per cent. ad valorem
Biscuits, ships' plain and unsweetened, 3s. the cwt.
Biscuits, other kinds, 2d. the lb.
Bitters, in bottles, jars, or other vessels packed in cases or other packages, 16s. the liquid gallon
Bitters, in bulk, 15s. the liquid gallon
Blacking and boot-gloss, £20 per cent. ad valorem
Blacklead, £20 per cent. ad valorem
Blankets, £20 per cent. ad valorem
Blocks, wooden tackle, £20 per cent. ad valorem
Blue, 2d. the lb.
Boiled sugars, comfits, lozenges, Scotch mixtures, and sugar-candy, 2d. the lb., including internal packages
Boilers, land and marine, £20 per cent. ad valorem
Boots, shoes, slippers, goloshes, clogs, and pattens, n.o.e., £20 per cent. ad valorem
Boot and shoe vamps and uppers and laces, £20 per cent. ad valorem
Brass cocks, valves, unions, lubricators, and whistles, £20 per cent. ad valorem
Brass manufactures n.o.e., £20 per cent. ad valorem
Brooms and brushes n.o.e., £20 per cent. ad valorem
Brush ware n.o.e., £20 per cent. ad valorem
Buckets and tubs, of wood, £20 per cent. ad valorem
CANDIED peel, 5d. the lb.
Candles, 2d. the lb. or package of that reputed weight, and so in proportion for packages of greater or less reputed weight
Capers, £20 per cent. ad valorem
Caps, apparel, £20 per cent. ad valorem
Caps, percussion, 1s. the thousand
Cards, playing, 6d. the pack
Carpetbags, £20 per cent. ad valorem
Carpets, £15 per cent. ad valorem
Carraway seeds, £15 per cent. ad valorem
Carriages, carts, drays, wagons, and perambulators, and wheels for the same, £20 per cent. ad valorem
Carriage-shafts, spokes, felloes, and naves or hubs, bent wheel-rims, and other bent carriage-timber, n.o.e., £15 per cent. ad valorem
Cartridges and cartridge-cases, £15 per cent. ad valorem
Catsup, £20 per cent. ad valorem
Cement, 2s. the barrel
Chaff, £1 the ton
Chaff-cutters, corn-crushers, and corn-shellers, £20 per cent. ad valorem
Chicory, 3d. the lb.
China, porcelain, and parianware, £20 per cent. ad valorem
Chocolate, 3d. the lb.
Chocolate confectionery, and all preparations of chocolate or cocoa, 3d. the lb., including internal packages
Chutney, £20 per cent. ad valorem
Cigars and cigarettes, 7s. the lb.
Clocks, £20 per cent. ad valorem
Cocoa, 3d. the lb.
Coffee, raw, 3d. the lb.
Coffee, roasted, 5d. the lb.
Coffee, essence of, £15 per cent. ad valorem
Collars and cuffs, of paper or other material, £25 per cent. ad valorem
Composition piping, 3s. 6d. the cwt.
Confectionery n.o.e., 2d. the lb., including internal packages
Copper manufactures n.o.e., £20 per cent. ad valorem
Copying-presses, £15 per cent. ad valorem
Cordage and rope, n.o.e., £20 per cent. ad valorem
Cordials, in bottles, jars, or other vessels, packed in cases or other packages, 16s. the liquid gallon
Cordials, in bulk, 15s. the liquid gallon
Corks, bottling, £15 per cent. ad valorem
Cotton counterpanes, £20 per cent. ad valorem
Cotton piece-goods, n.o.e., £10 per cent. ad valorem
Crab-winches, cranes n.o.e., capstans, and windlasses, £20 per cent. ad valorem
Cream of tartar, 1d. the lb.
Curry powder and paste, £20 per cent. ad valorem
Cutlery, £20 per cent. ad valorem
DESKS, £20 per cent. ad valorem
Doors, plain, 2s. each
Doors, glazed with ornamental glass, 4s. each
Drainage pipes and tiles, £20 per cent. ad valorem
Drained peel, 3d. the lb.
Drapery n.o.e., £20 per cent. ad valorem
Drawings, £15 per cent. ad valorem
Dressing-cases, £20 per cent. ad valorem
Drugs and druggists' sundries, £15 per cent. ad valorem
Drugget, £15 per cent. ad valorem
EARTHENWARE, stoneware, and brown ware, £20 per cent. ad valorem
Earthen flooring and garden tiles, £20 per cent. ad valorem
Earthen gas-retorts, £20 per cent. ad valorem
Essences, flavouring, £15 per cent. ad valorem
FANCY goods, and toys, £20 per cent. ad valorem
Feathers, ornamental, including ostrich, £25 per cent. ad valorem
Filters, £20 per cent. ad valorem
Firearms: Fowling-pieces, rifles, and other kinds, £15 per cent. ad valorem
Firebricks n.o.e., fireclay ground, and fireclay goods, £20 per cent. ad valorem
Fireworks n.o.e., £20 per cent. ad valorem
Fish, dried, pickled, or salted, n.o.e., 10s. the cwt.
Fish, potted and preserved, 2d. the lb. or package of that reputed weight, and so in proportion for packages of greater or less reputed weight
Fish-paste, £20 per cent. ad, valorem
Floorcloth, £15 per cent. ad valorem
Fruit, fresh, namely, apples, pears, plums, cherries, peaches, nectarines, apricots, quinces, tomatoes, and lemons, 1/2d. the lb.
Fruits, dried, 2d. the lb.
Fruits, preserved in juice or syrup, £20 per cent. ad valorem
Fruit pulp and partially-preserved fruit n.o.e., 1 1/2d. the lb.
Fruit preserved by sulphurous acid, 1/2d. the lb.
Furniture and cabinetware n.o.e. and other than iron, £25 per cent. ad valorem
Furniture knife and plate powder and polish, £15 per cent. ad valorem
Furs, £25 per cent. ad valorem
GALVANISED-IRON manufactures n.o.e., £25 per cent. ad valorem
Gaspipes, iron, £5 per cent. ad valorem
Gelatine, £15 per cent. ad valorem
Glass, crown, sheet, and common window, 2s. the 100ft. superficial
Glass, plate, polished, coloured, and other kinds, n.o.e., £15 per cent. ad valorem
Glassware, £15 per cent. ad valorem
Globes and chimneys for lamps, £15 per cent. ad valorem
Glucose, 1d. the lb.
Glue and size, 1 1/2d. the lb.
Glycerine, refined, £15 per cent. ad valorem
Grain, namely, barley, 2s. the 100lb.
Grain and pulse of every kind n.o.e., 9d. the 100lb.
Grain and pulse of every kind, when ground or in any way manufactured, n.o.e., 1s. the 100lb.
Greenstone, cut and polished, £20 per cent. ad valorem
HABERDASHERY n.o.e., £20 per cent. ad valorem
Hair brushes and combs, £20 per cent. ad valorem
Hardware, ironmongery, and holloware, £20 per cent. ad valorem
Harness, £20 per cent. ad valorem
Harness oil and composition and leather-dressing, £15 per cent. ad valorem
Hats, £20 per cent. ad valorem
Honey, 2d. the lb.
Hops, 6d. the lb.
Hosiery n.o.e., £20 per cent. ad valorem
Handbills, programmes and circulars, playbills and printed posters, £20 per cent. ad valorem
INK, writing, £20 per cent. ad valorem
Iron bridges and iron material n.o.e., for the construction of bridges, wharves, jetties, or patent slips, £20 per cent. ad valorem
Iron fencing-wire, 1s. the cwt.
Iron barbed fencing-wire, 2s. the cwt.
Iron gates and gate-posts, staples, standards, straining posts and apparatus, £20 per cent. ad valorem
Iron columns for buildings, and other structural ironwork, £20 per cent. ad valorem
Iron doors for safes and vaults, £20 per cent. ad valorem
Iron galvanised tiles, ridging, guttering, and spouting, £20 per cent. ad valorem
Iron galvanised corrugated sheets, screws, and nails, 2s. the cwt.
Iron plain galvanised sheet and hoop, 1s. 6d. the cwt.
Iron nails, 2s. the cwt.
Iron pipes, and fittings for same, wrought, £5 per cent. ad valorem
Ironwork and wirework, £20 per cent. ad valorem
Iron tanks, 10s. each
Iron tanks of and under 200 gallons, 5s. each
Iron weighbridges for carts, £20 per cent. ad valorem
Isinglass, £15 per cent. ad valorem
JAMS, jellies, marmalade, and preserves, 2d. the lb. or package of that reputed weight, and so in proportion for packages of greater or less reputed weight 151 Japanned and lacquered metalware, £25 per cent. ad valorem
Jewellery, £20 per cent. ad valorem
LAMPS, lanterns, and lamp-wick, £15 per cent. ad valorem
Lawn-mowers, £20 per cent. ad valorem
Lead in sheets, 1s. 6d. the cwt.
Lead piping, 3s. 6d. the cwt.
Leather, chamois, £15 per cent. ad valorem
Leather—
Belting and belt, harness, bridle, legging, and bag leather, 6d. the lb.
Kip (other than East India kip), cordovan, kangaroo (tanned), levant cow and horse hides, 3d. the lb.
Buff, split, roans, persians, sheepskins or basils, lambskins and goatskins (dressed), 2d. the lb.
N.o.e., including sole-leather and East India kip, 1d. the lb.
Leather bags, £20 per cent. ad valorem
Leather cut into shapes, £20 per cent. ad valorem
Leather-cloth bags, £20 per cent. ad valorem
Leather leggings, £20 per cent. ad valorem
Leather manufactures n.o.e., £20 per cent. ad valorem
Liqueurs, in bottles jars, or other vessels, packed in cases or other packages, 16s. the liquid gallon
Liqueurs in bulk, 15s. the liquid gallon
Liquorice, £15 per cent. ad valorem
Looking-glasses, £15 per cent. ad valorem
Lime and lemon juice, sweetened or ærated, £20 per cent. ad valorem
MACHINERY n.o.e., £20 per cent. ad valorem
Magic-lanterns and dissolving-view apparatus and slides, £20 per cent. ad valorem
Maize, 9d. the 100lb.
Maizena and cornflour, 1/4d. the lb.
Malt, 2s. the bushel.
Mantelpieces, £20 per cent. ad valorem
Marble, granite, and other stone, sawn on not more than two sides, and not dressed or polished, £5 per cent. ad valorem
Marble, granite, and other stone dressed or polished, and articles made therefrom, £20 per cent. ad valorem
Matches—
Wooden: In boxes containing not more than 60 matches, 1s. the gross of boxes
In boxes containing over 60 and not more than 100 matches, 2s. the gross of boxes
In boxes containing more than 100 matches for every 100 matches or fraction thereof contained in one box, 2s. the gross of boxes
Wax: “Plaid vestas” in cardboard boxes containing under 100 matches, 1s. 4d. the gross of boxes
“Pocket vestas” in tin or other boxes containing under 100 matches, 2s. the gross of boxes
“Sportsman's,” “ovals,” and “No. 4 tins vestas” in boxes containing not more than 200 matches, 5s. 6d. the gross of boxes
Other kinds, for every 100 matches or fraction thereof contained in one box, 2s. 9d. the gross of boxes
Mats, £15 per cent. ad valorem
Matting, £15 per cent. ad valorem
Meats, potted or preserved, £20 per cent. ad valorem
Metal manufactures, namely, air-gratings, ash-pans, barrow-wheels, bill-files, brackets, bolts and nuts, blacksmiths' tongs, boat-hooks, copper boilers and furnaces, bolt-rings, lifting bottle-jacks, wrought-iron braces, copper and brass branch-pipes, brazed copper pipes, cake-rollers, camp-ovens and three-legged pots, cast iron of all sorts moulded (n.o.e.), castings of steel (n.o.e.), cast-iron cylinders, wrought-iron cisterns, coal scoops and scuttles, contractors' forgings, condensers for salt water and steam-engines, wire and steel cork-drawers, crowbars, blacklead crucibles, dampers and frames, doorknockers, porters and scrapers, drain grates and frames, drain gratings, dumb-bells, engine castings (n.o.e.), engineers' forgings (n.o.e.), fenders, fire-dogs, fire-guards, flower-stands, fittings for pumps engines and machinery (n.o.e.), garden reels rollers seats and syringes, grates, gridirons, grindstone fittings, gun-metal engine fittings, napping quartz and spalling hammers, hasps and staples, hat-stands, heel- and toe-plates, holdfasts, hook-and-eye hinges, horseshoes, hay-rakes and horse-rakes, horse-power gear, hydraulic mains, kitchen-ranges and colonial ovens, lamp-posts, leadenware, wrought-iron or steel letters and figures, forged levers, connecting or split links, hydraulic lifts, manger rings, mangles, marine engine-cranks and pillars, maul rings, meat-hooks, monkeys for pile-driving, ornamental gratings, painted and brass casings for engines, pepper malt bean and oat mills, picks and mattocks, pulley-blocks, quarry mauls and picks, quoits, railway chairs bolts fastenings and rail-dogs, connecting-rods, roller-skates, sack-trucks, iron safes and boxes, sash-weights, bright wrought-iron shafting, iron sluice-valves, soldering-irons, iron stands, stamped ironware n.o.e., stench-traps, troughs, truck wheels, cast tue-irons, wedges, wrought-iron wheelbarrows and wheels, £20 per cent. ad valorem
Milk, preserved, £20 per cent. ad valorem
Millinery, viz., trimmed hats, caps, and bonnets, £20 per cent. ad valorem
Millinery n.o.e:, £20 per cent. ad valorem
Musical instruments, namely, organs, harmoniums, and pianofortes, and parts of either (except action-work not made up), £20 per cent. ad valorem
Musical instruments n.o.e, £15 per cent. ad valorem
mustard, 2d. the lb.
NAILS n.o.e., 3s. the cwt.
Naphtha, 6d. the gallon
Nets and netting, £20 per cent. ad valorem
nuts of all kinds, except coconuts, 2d. the lb.
OIL mineral, 6d. the gallon
Oil olive, in bulk, 6d. the gallon
Oil perfumed, £25 per cent. ad valorem
Oil vegetable, in bulk, n.o.e., 6d. the gallon
Oil vegetable or other, in bottle, £15 per cent. ad valorem
Oil n.o.e., 6d. the gallon
Olives, £20 per cent. ad valorem
opium, £2 the lb.
Oysters, preserved, 2d. the lb. or package of that reputed weight, and so in proportion for packages of greater or less reputed weight
PAINTINGS, framed or unframed, £15 per cent. ad valorem
Paints and colours ground in oil, 2s. the cwt.
Paints and colours mixed ready for use, 4s. the cwt.
Paper bags, coarse, including sugar-bags, 7s. 6d. the cwt.
Paper bags n.o.e., £25 per cent. ad valorem
Paperhangings, £15 per cent. ad valorem
Paper, wrapping, brown, 4s. the cwt.
Paper, wrapping, other kinds, including cartridge, small hands, and sugar-paper, 5s. the cwt.
Paper, writing, n.o.e., £15 per cent. ad valorem
Papier-maché ware, £20 per cent. ad valorem
Patent and proprietary medicines, and medicinal and other preparations or compounds not otherwise enumerated, recommended to the public under any general name or title as specifics for any disease or affection whatever affecting the human or animal bodies, £25 per cent. ad valorem
Pearl barley, 1s. the cwt.
Peas, split, 2s. the cwt.
Pepper, cayenne, £15 per cent. ad valorem
Perfumery n.o.e., £25 per cent. ad valorem
Perfumed spirits and Cologne water, £1 1s. the gallon
Photographic chemicals n.o.e., £15 per cent. ad valorem
Photographic goods n.o.e., £20 per cent. ad valorem
Pickles, 2s. the dozen pints or reputed pints, and in the same proportion for larger or smaller reputed sizes
Pictorial calendars, show-cards, and other pictorial lithographs and prints on and after the 1st January, 1889, £25 per cent. ad valorem
Pictures and engravings, £15 per cent. ad valorem
Picture-frames, £15 per cent. ad valorem
Pipes, tobacco, £15 per cent. ad valorem
Plate, gold and silver, £20 per cent. ad valorem
Platedware, £20 per cent. ad valorem
Portmanteaus trunks (other than iron), and travelling-bags, £20 per cent. ad valorem
Powder, sporting, 6d. the lb.
Provisions, n.o.e., £20 per cent. ad valorem
Pumps and other apparatus for raising water n.o.e., £20 per cent. ad valorem
putty, 2s. the cwt.
RAILWAY and tramway plant and materials, n.o.e., £20 per cent. ad valorem
Raspberry vinegar, £20 per cent. ad valorem
Rice and rice flour, 6s. the cwt.
Rice, undressed and dressed in bond, 4s. the cwt.
Rice manufactured into starch in bond, 2s. the cwt.
Rugs, woollen, cotton, opossum, or other, £20 per cent. ad valorem
SACCHARINE, 5s. the ounce
Sacks, other than cornsacks, £15 per cent. ad valorem
Saddlery, £20 per cent. ad valorem
Sad-irons, £20 per cent. ad valorem
Salt, except rock salt, 10s. the ton
Sardines, 2d. the pound or package of that reputed weight, and so in proportion for packages of greater or less reputed weight
Sarsaparilla, £25 per cent. ad valorem
Sauces, 3s. the dozen pints or reputed pints, and in the same proportion for larger or smaller reputed sizes
Sausage-skins, £20 per cent. ad valorem
Sashes, plain, 2s. the pair
Sashes, glazed, with ornamental glass, 4s. the pair
Shawls, £20 per cent. ad valorem
Shot, 10s. the cwt.
Silks, satins, velvets, plushes, n.o.e., composed of silk mixed with any other material, in the piece, £25 per cent. ad valorem
Snuff, 7s. the lb.
Soap, common, 5s. the cwt.
Soap, scented and fancy, £25 per cent. ad valorem
Soap powder, extract of soap, dry soap, and soft soap, £20 per cent. ad valorem
Soda ash, 1s. the cwt.
Soda, carbonate and bicarbonate, 1s. the cwt.
Soda, crystals, 2s. the cwt.
Solid wort, 6d. the lb.
Spices, including pepper and pimento, unground, 2d. the lb.
Spices, including pepper and pimento, ground, 4d. the lb.
Spirits and strong waters, the strength of which can be ascertained by Sykes's hydrometer—
In bottles, jars, or other vessels, packed in cases or other packages, 16s. the proof gallon
In bulk, 15s. the proof gallon
(No allowance beyond 16.5 under proof shall be made for spirits or strong waters of a less hydrometer strength than 16.5 under proof)
Spirits and strong waters mixed with any ingredient in any proportion exceeding 33 per cent. of proof spirit, and although thereby coming under the designation of patent or proprietary medicines, or under any other designation excepting medicinal tinctures specified in the British Pharmacopœia—
In bottles, jars, or other vessels, packed in cases or other packages, 16s. the liquid gallon
In bulk, 15s. the liquid gallon
Spirits and strong waters, sweetened or mixed, when not exceeding the strength of proof—
In bottles, jars, or other vessels, packed in cases or other packages, 16s. the liquid gallon
In bulk, 15s. the liquid gallon
Spirits and strong waters in cases shall be charged as follows on and after the 1st December, 1888, namely:—
Two gallons and under, as two gallons; over two gallons and not exceeding three, as three gallons; over three gallons and not exceeding four, as four gallons; and so on for any greater quantity contained in any case
Spirits, methylated, 1s. the liquid gallon
Starch, 2d. the lb.
Stationery, manufactured, namely, account-books, billheads, cheques, labels, and other printed and ruled paper, blank and head-line copy-books, drawing-books, blotting-pads, sketch-books, manifold writers albums, diaries, plain and faint-lined ruled books, and other printed or lithographed stationery, £25 per cent. ad valorem
Stationery n.o.e., £15 per cent. ad valorem
Statues, statuettes, casts and bronzes, £20 per cent. ad valorem
Steam-engines and parts of steam-engines n.o.e., £20 per cent. ad valorem
Stearine, 1 1/2d. the lb.
Sugar, 1/2d. the lb.
Sulphur, 6d. the cwt.
Syrups, £20 per cent. ad valorem
TARPAULINS, tents, rick- and wagon-covers; aprons and elevators for reaping-and-binding machines, £15 per cent. ad valorem
Tea, 6d. the lb.
Textile piece-goods other than cotton or silk, £20 per cent. ad valorem
Timber, sawn, rough, 2s. the 100ft. superficial
Timber, sawn, dressed, 4s. the 100ft. superficial
Timber, shingles and laths, 2s. the thousand
Timber, palings, 2s. the hundred
Timber, posts, 8s. the hundred
Timber, rails, 4s. the hundred
Tinware, and tinsmiths' furniture n.o.e., £25 per cent. ad valorem
Tobacco, 3s. 6d. the lb.
Tobacco, unmanufactured, entered to be manufactured in the colony, at the time of removal from a bonded warehouse, or from any importing ship, to any licensed tobacco manufactory, for manufacturing purposes only into tobacco, cigars, cigarettes, or snuff, 2s. the lb. until the 31st December, 1891
By “The Customs and Excise Duties Act, 1891,” it is enacted that on and after the 1st day of January, 1892, and until the 31st day of December, 1893, the duty on unmanufactured tobacco shall be 1s. 6d. the lb.
And on and after the 1st day of January, 1894, until the 31st day of December, 1896, the duty on unmanufactured tobacco shall be 2s. the lb.
Toilet preparations n.o.e., £25 per cent. ad valorem
Treacle and molasses, 1/2d. the lb.
Turnery, £15 per cent. ad valorem
Turpentine, 6d. the gallon
Twine, binder, £15 per cent. ad valorem
Twine n.o.e., £20 per cent. ad valorem
UMBRELLAS, parasols, and sunshades, £20 per cent. ad valorem
Upholstery n.o.e., £25 per cent. ad valorem
VARNISH, 1s. 6d. the gallon
Vegetables, fresh, dried, or preserved, £20 per cent. ad valorem
vinegar, 6d. the gallon
WALKING-STICKS, £20 per cent. ad valorem
Washing-powder, £20 per cent. ad valorem
Watches, £20 per cent. ad valorem
Waterworks pipes, iron, £5 per cent. ad valorem
Wax, paraffin, mineral, vegetable, and Japanese, 1 1/2d. the lb.
Weighing-machines, £15 per cent. ad valorem
Whips, £15 per cent. ad valorem
Whiting and chalk, 1s. the cwt.
Wine, sparkling, 9s. the gallon
Wine, Australian, containing not more than 35 per cent of proof spirit verified by Sykes's hydrometer, the gallon, or for 6 reputed quart bottles, or 12 reputed pint bottles, 5s. the gallon
Wine, other than sparkling and Australian, containing less than 40 per cent. of proof spirit verified by Sykes's hydrometer, the gallon, or for 6 reputed quart bottles, or 12 reputed pint bottles, 6s. the gallon
Wire mattresses and webbing, £20 per cent. ad valorem
Woodenware n.o.e., £15 per cent. ad valorem
Woolpacks, 2s. 6d. the dozen
Woolpacks of the kind known as “woolpockets,” and not exceeding the measurement of 18 by 21 by 30 inches, 6d. the dozen
YARNS n.o.e., £20 per cent. ad valorem
ZINC tiles, ridging, guttering, piping, £20 per cent. ad valorem
Zinc manufactures n.o.e., £25 per cent. ad valorem.
Names of Articles.
ACCOUTREMENTS for military purposes; but excepting uniform clothing
acid, nitric and pyrogallic
almonds, barbary, Sicily, and French, used in confectioners' manufactures
alum
anchors
anchovies, salted, in casks
anvils
arsenic
arrowroot
artists' canvas, colours, brushes, and pallet-knives
ash timber, unwrought
axes and hatchets
axles, axle arms and boxes
BAGS, gunny
Bellows' nails
Blacksmiths' bellows
Blindwebbing and tape
Bookbinders' materials, viz., cloth, leather, thread, headbands, webbing, end-papers, tacketing-gut, marbling colours, marble paper, blue paste for ruling-ink, staple presses, wire staples, staple sticks
Boot-elastic
Boots, shoes, and slippers, viz., children's Nos. 0 to 3
Borax
Bottles of all kinds, empty
Brace-elastic and brace-mountings
Brass in pigs, bars, tubes, or sheets
Brass tubing and stamped work, in the rough for gasaliers and brackets
Brush woodware
Building materials n.o.e.
Bunting, suitable only for ships' flags
Butter- and cheese-cloth
Buttons, braids, tapes, wadding, pins, needles, and such minor articles required in the making-up of apparel, boots, shoes, hats, caps, saddlery, umbrellas, parasols, and sunshades, as may be enumerated in any Order of the Commissioner, and published in the Gazette
CALICO, white and grey, in the piece
Candlenuts and candlenut kernels
Candlewick
Card- or paste-board plain, of sizes not less than that known as “royal”
Cardboard boxes, materials for, namely, gold and silver paper plain and embossed, gelatine and coloured papers, known as “box papers”
Carriage- and cart-makers' materials, viz., springs, mountings, trimmings, brass hinges, bolts and nuts, tacks, tire-bolts, shackle-holders, and other iron fittings; rubber cloth, American cloth
carriage and cart-shafts, spokes and felloes in the rough; elm hubs; poles if unbent and unplaned
chains, iron
charts and maps
churns
cochineal
cocoa beans
cocoanuts
coir
copper, in pigs, bars, tubes, or sheets
copper and composition rod, bolts, sheathing, and nails
corduroy, cotton, in the piece
cork soles
corn riddles and sieves
cornsacks
cotton-waste
DUCK in the piece
dye-stuffs, and dyeing materials, crude
ENGINEERS' machine-tools
essential oils
FELT, sheathing
fire-engines
flour-mills, patent porcelain or steel roller
forfar, dowlas, and flax sheeting in the piece, the fair market value of which does not exceed sevenpence the yard
forges
GAS-ENGINES and hammers
gelatine dry-plates
glassmakers' moulds
glycerine, crude
goatskins, undressed
gold size
grindery, except heel- and toe-plates
groats, prepared
gum arabic and tragacanth
gum-boots
guttapercha, not being wearing apparel, and n.o.e.
HATMAKERS' materials, viz., silk plush, felt hoods, shellac, galloons, calicoes, spale-boards for hat-boxes
hessians
hickory, unwrought
hickory spokes and felloes
hogskins
hydraulic cranes
INK, printing
Iron, boiler-plate and end-plates for boilers
Iron, plain black sheet
Iron, plates, rivets, bolts, nuts, screws and castings for ships
Iron, rod, bolt, bar, hoop, and pig
Iron rolled girders
Iron and steel cordage
Iron wire n.o.e.
Iron wire netting402. KANGAROO-SKINS, undressed
LEAD, in pigs or bars
leather, morocco, japanned, and enamelled
leather-cloth
lignum-vitæ
locomotives
MACCARONI and vermicelli
machinery for agricultural purposes n.o.e., also materials for manufacturing the same, viz., reaper-knife sections, fingers, brass and steel springs and tilt-rakes, cost-cutting knives, set-screws, malleable castings, fittings for threshing-mills, discs for harrows, forgings for ploughs, mouldboard-plates and steel share-plates cut to pattern, and skeith-plates
machinery for dairying purposes
machinery, electric, and appliances
machinery for mining purposes, including dredges and dredging appliances
machinery for oil-refining and boring
machinery for refrigerating and preserving meat
machine saws
metal fittings for portmanteaus, travelling-bags, and leggings
metal frames for bags and satchels
metal sheaves for blocks
metallic capsules
mill-board
moleskin, cotton, in the piece
NITRATE of silver
OIL, candlenut
oil, cod-liver
oil, fish, whale, and seal, in bulk
oil, palm
oil, rhodium
PAINTINGS, statuary, and works of art, presented to or imported by any museum, public library, or other public institution for use therein, or for public exhibition
Paints, n.o.e.
Paper, for printing purposes only
Paper, hand-made or machine-made book, or writing, of sizes not less than the size known as “demy,” when in original wrappers, and with uncut edges as it leaves the mill
Paper, albumenised
Passengers' baggage and effects, including only wearing apparel, and other personal effects that have been worn or are in use by persons arriving in the colony; also implements, instruments, and tools of trade, occupation, or employment of such persons; and household effects not exceeding £100 in value used abroad for more than a year by the persons or families bringing them to the colony, and not intended for any other person or persons or for sale; also cabin furnishings belonging to such persons
Peanuts, for manufacture of oil
Pearlash
Potash and caustic potash
Perambulators, bicycles, tricycles, and the like vehicles, fittings for, n.o.e.
Phosphorus
Photographic cameras and lenses
Pitch and tar
Plaster of Paris
Ploughs and harrows
Powder, blasting
Portable and traction engines
Precious stones unset
Printed books, papers, and music, n.o.e.
Printing machinery, presses, type, and materials
rails for railways and tramways
ROSIN
rivets and washers of all kinds
SADDLERS' ironmongery, hames, and mounts for harness; straining surcingle brace girth and roller webs; collar-check, legging buckles
saddle-trees
saffron
sago and tapioca
sailcloth
salt rock
saltpetre
schoolbooks, slates, and apparatus
scrub-exterminator
scythes
sealskins, undressed
sewing, knitting, and kilting machines
sewing cottons, silks, and threads
shale waste or unrefined mineral oil
sheep-dip
ship-chandlery, n.o.e.
Ships' rockets, blue lights, and danger signals
shirtings, coloured cotton, in the piece
shirtings, union, in the piece, the fair market value of which does not exceed 7d. the yard
silica fire-bricks
silk, for flour-dressing
silk twist (shoemakers' and saddlers')
soda, caustic
soda, sulphate
soda-water machines
spades, shovels, and forks
spirits, after being rendered not potable by manufacture into perfumery or other articles, in the colony, in accordance with prescribed regulations
spirits of tar
staymakers' binding, eyelet-holes, corset-fasteners, jean, ticks, lasting, sateen, and cotell
steam-engines, non-condensing, the area of whose cylinder or cylinders exceeds 1,000 circular inches; and condensing engines, the area of whose cylinders exceeds 2,500 circular inches
steam boiler-tubes and bowling's expansion-rings
steel
stones, mill, grind, oil, and whet
strychnine
surveyors' steel bonds
swords
TACKS of all kinds
Tailors' trimmings, viz., Verona and Italian cloth, black and brown canvas, buckram, wadding, padding; silk, worsted, and cotton bindings, and braids; stay-binding; hessians, brown linen, silesias, union body linings, jeans, striped and checked drills, pocketings
Tailors' buckles
Tanning materials, crude
Tin, pig, bar, or sheet
Tinsmiths' fittings and planished furniture
tobacco for sheepwash, after being rendered unfit for human consumption, in accordance with prescribed regulations
tools, artificers'
treacle and molasses, when mixed with bone-black in such proportions and under such regulations as the commissioner may prescribe in that behalf
UMBRELLA-MAKERS' materials, namely, reversible and levantine silk-mixtures, of not less than 44in. in width; alpaca cloth, with border; zanella cloth, with border; sticks, runners, notches, caps, ferrules, cups, ribs, stretchers, tips, and rings for use in the making of umbrellas, parasols, and sunshades
upholsterers' webbing, hair-seating, imitation hair-seating, curled hair, gimp, tufts and studs
WATERPROOF material in the piece
wax, bottling
wire, brass, copper, and lead
yarn, coir, flax and hemp
ZINC, plain sheet
ARTICLES and materials (as may from time to time be specified, by the Commissioner) which are suited only for, and are to be used and applied solely in, the fabrication of goods within the colony. All decisions of the Commissioner in reference to articles so admitted free, to be published from time to time in the Gazette
And all articles not otherwise enumerated.
Names of Articles and Rates of Duty.
TOBACCO,* 1s. the lb.
Cigars, cigarettes, and snuff,* 1s. 6d. the lb.
From the 1st January, 1889, to the 31st December, 1891.
* By “The Customs and Excise Duties Act, 1891,” it is enacted that on and after the 1st day of January, 1892, and until the 31st day of December, 1896, the Excise duty on tobacco, and on cigars, cigarettes, and snuff, shall be—
Tobacco, 1s. the lb.
Cigars, cigarettes, and snuff, 1s. 6d. the lb.
Table of Contents
THE geographical position of the North Island of New Zealand will naturally suggest something of the character of its inland climate at an elevation of 1,000ft. Rotorua is some forty miles from the coast. Its elevation is 990ft. above the sea-level. The atmosphere is drier and more bracing than that of the coast—in winter considerably colder, and in summer perhaps somewhat hotter, but a dry pleasant heat, free from the moist oppressiveness which characterizes the summer heat of Auckland and other coast towns. The mean temperature of spring is 53°, of summer 66°, of autumn 57°, and of winter 45°. The relative moisture of the air for the four seasons (taking complete saturation at 100°) is—for spring, 74°; for summer, 66°; for autumn, 67°; and for winter, 74°. The steam which rises so abundantly and perpetually all over the district no doubt adds considerably to the moisture of the atmosphere. This was clearly shown in the month of June, 1886, when the great eruption of Tarawera took place. The relative moisture for that month was 10° in excess of the average, owing to the immense amount of vapour caused by the eruption. The rainfall for the year is about 50in., and the number of days on which rain falls about 140. Auckland has 18in. less rain, and thirteen more rainy days. The daily range of temperature is greatest in the summer and least in the winter. This condition maintains throughout the whole of New Zealand, and constitutes one of the greatest charms of its climate. No matter how hot a summer's day may be, the nights are invariably cool. The mean daily range of temperature for spring is 21°, for summer 28°, for autumn 23°, and for winter 20°. The most agreeable months of the year for an invalid to visit Rotorua are February, March, and April; the least areAugust, September, and October; but, as there is ample boarding-accommodation close to the baths, the invalid is virtually independent of the weather. Our climate, therefore, may be said to be mild, equable, and agreeable. By an equable climate I do not wish to imply one in which the same conditions prevail for long periods of the year, but rather one in which the different factors—temperature, moisture, light, electricity, wind, and atmospheric pressure—are subject to moderate variations. Our patients, it must be remembered, are a mixed class, consisting chiefly of fairly vigorous individuals, in whom it is necessary to maintain the energy of the different organs and functions, and the normal power of adaption and resistance to climatic conditions. Such a climate we enjoy at Rotorua.
The thermal-springs district of New Zealand comprises an area of upwards of 600,000 acres, or close on 1,000 square miles. The length of the district is some fifty miles, with an average breadth of twenty miles. Its altitude averages from 1,000ft. to 2,000ft. above sea-level. The general physical features of this region embrace extensive pumice-plains, intersected in various directions by high ranges of igneous formation, which are relieved here and there by enormous trachytic cones. Extensive forests of extraordinary luxuriance and beauty clothe the mountains and border the extensive plateaux, while hot lakes, boiling geysers, and thermal springs are dotted far and wide over the country. The thermal-springs district, however, as defined on the maps, by no means embraces the whole volcanic and hydrothermal activity of the island. Although the volcanic slopes of Ruapehu and Tongariro bound this region on the south, hot springs are found here and there for fully 250 miles beyond its western boundary—in fact, as far north as the Bay of Islands. Within the district it is no exaggeration to say that hundreds of hot springs exist, to say nothing of mud-volcanoes, solfataras, and fumeroles. These springs are of the most varied chemical character, and every degree of temperature from 60° to 212°. Not a twentieth part of them have as yet been submitted to analysis. Those which have, been examined in the laboratory of the Geological Survey Department in Wellington are divided by Sir James Hector into five classes: (1) Saline, containing chiefly chloride of sodium; (2) alkaline, containing carbonates and bicarbonates of soda and potash; (3) alkaline-siliceous, containing much silicic acid, but changing rapidly on exposure to the atmosphere, and becoming alkaline; (4) hepatic, or sulphurous, characterized by the presence of sulphuretted hydrogen and sulphurous acid; and (5) acidic waters, containing an excess of sulphuric or hydrochloric acid, or both. In addition to these we have saline waters, containing iodine, cold acidulous chalybeates, and saline acidulous chalybeates.These, however, are in situations at present inaccessible to the invalid, or, if not out of reach, at least destitute of the conveniences and comforts essential to the sick, but no doubt destined in the near future to attain a high medical reputation.
The Government of New Zealand has very wisely chosen the southern shore of Lake Rotorua as the basis of operations for opening up this wonderful district. Here are grouped together numerous examples of the five classes of springs I have enumerated, and here the Government have fixed their first sanatorium and bathing establishment, to which it is desired specially to direct attention. The sanatorium reserve at Rotorua comprises an area of some 50 acres, bounded on the north and east by the lake, and on the west and south by the Township of Rotorua. Ten years ago this was a howling wilderness, covered with tea-tree scrub, and diversified only by clouds of steam rising from the various hot springs. Here the adventurous invalid of that day had to pitch his tent, and be satisfied with a hole in the ground for a bath; and if the spring he wished to use happened to be too hot for his purpose he probably had to dig the hole for himself, and regulate the supply and temperature of the water to the best of his hydraulic ability. In many instances he immortalised himself by giving his name to the spring—names still retained. Thus we have “Cameron's Bath,” “McHugh's Bath,” “Mackenzie's Bath,” and “The Priest's Bath.” Other springs have received their names from some real or imaginary quality. Thus we have “Madame Rachel,” “The Pain-killer,” “The Coffee-pot,” and “The Blue Bath.” Now this area of desolation is completely transformed. Walks and. drives planted with evergreen trees traverse it from end to end, fountains and flower-gardens delight the eye, and commodious buildings for the accommodation and convenience of invalids are springing up on every side. The principal of these are the Sanatorium Hospital, the medical residence, the Priest's Pavilion, the Rachel Pavilion, the Blue Swimming-bath (to which is attached the-sulphur-vapour bath and the electrical department), and Brent's boarding-house. The Hospital, which was opened in 1886, was unfortunately destroyed by fire in November, 1888. A new and far more commodious building has just been erected by the Government. It is designed to accommodate twenty-one patients—twelve males and nine females. The stipulations made by the Government with regard to admission are that the patient shall be able to show that his case is one likely to be benefited by the use of the baths, and that he is unable to pay the usual hotel or boarding-house charges. The Government tariff has not yet been decided on, but it is not likely to exceed £1 or £1 5s. per head per week. A patient will be allowed to remain three months, but if atthe expiration of that time the Medical Officer is of opinion that a longer period is desirable a second three months will be granted; but in all cases six months will be the extreme limit. A low tariff of this kind will enable the Charitable Aid Boards of the country to send up for treatment a class of patients who would not otherwise be able to avail themselves of the springs, and at the same time will in no way interfere with the private enterprise of hotel and boarding-house proprietors.
We have no spring in the district that has obtained a higher reputation, or proved itself more generally useful, than that known as the Priest's Bath. The character of the water is sulphurous, aluminous, and strongly acid. Its temperature varies from 98° to 106°. This variation is due to the rise and fall of the lake and the direction of the wind. When the lake is high and the wind blowing in the direction of the baths the conditions are favourable to a high temperature, and vice versâ, the cold water of the lake affording a more efficient barrier to the escape of heat than the open pumice-gravel of which the shore is composed. The solid constituents of the water amount to 96 grains per gallon, consisting of sulphates and silica. Of these the sulphates of alumina and soda are the most abundant; but the most important constituents are—free sulphuric acid, 22gr., and free hydrochloric acid, 3gr. per gallon. A patient emerging from this bath looks like a boiled lobster, and I regard this determination of blood to the skin as a most important therapeutic factor: the vascular and nervous apparatus of the skin are powerfully stimulated by it, and internal congestions relieved. Our alkaline waters, on the other hand, which contain the chlorides and silicates of the alkalies, have a soothing and emollient effect on the skin, and are of great value in eczema and other cutaneous ailments. The water of the Priest's Spring is brilliantly clear when undisturbed, and pale-green in colour. A faint odour of sulphuretted-hydrogen pervades the vicinity, which gas, together with sulphurous-acid, is copiously evolved. Since the eruption of Tarawera this offensive odour has been much modified, owing, I believe, to an increased evolution of sulphurous-acid gas at that time. Fortunately for the nasal organs and general comfort of bathers, these gases effect a mutual decomposition, resulting in the formation of sulphur and water, thus—2H2S + SO2 = 3S + 2H2O; which means that two parts of sulphuretted-hydrogen, combining with one-part of sulphurous-acid, form three parts of sulphur and two of water. Wherever steam charged with these gases is able to penetrate, sulphur is deposited. This is the origin of all the sulphur in the district. It permeates readily the siliceous-sinter rock, forming beautiful needle-like crystals of sulphur in its interspaces. Sulphur being thus constantly transformedfrom the gaseous to the solid state in the water of this spring, it is very possible that, coming into contact with the skin in this nascent and impalpable form, its therapeutic power may be considerably enhanced: there can be no doubt about its absorption, for our patients tell us that their underclothing is redolent of sulphur for weeks after returning home. The Priest's Bathing-pavilion is a building 74ft. long by 44ft. wide, having a superficial area of 3,256 square feet. It is divided into male and female departments. Each department comprises two public piscinœ, 16ft. by 12ft., with two private baths for special cases, lounging-rooms, and comfortable dressing-rooms. Each bath is provided with a cold freshwater shower, and douches either hot or tepid, thus materially enhancing the hydropathic efficiency of this remarkable water.
Adjoining this structure is the Rachel Bathing-pavilion. Here we have a water diametrically opposite in character to the last described — an alkaline siliceous water, having a-temperature at its source of 180°. This source is a caldron of enormous depth, situated some 200 yards from the bathing-pavilion, and yielding 50,000 gallons daily. We have a simple system of cooling by which the water may be used at any desired temperature. Here also is a separate department for each sex, each containing a public piscina 16ft. square, four private baths, a lounging- or waiting-room kept at a constant temperature of 70° by hot-water pipes, and dressing-rooms. The solid constituents of this water amount to 116gr. per gallon, and consist of the chlorides of sodium and potassium, sulphate and carbonate of soda, silicates of soda lime and magnesia, oxides of iron and aluminium, and silica. Its reaction is alkaline, and it contains a small amount of sulphuretted hydrogen. The delicious sense of bien-être produced by bathing in this water, with the soft satiny feeling it communicates to the skin, must be felt to be appreciated. It is useful in all forms of skin-disease—indeed, in eczema it may be considered specific if continued long enough in conjunction with a suitable regimen. I frequently recommend the internal use of this water. Its taste is not unpleasant, and its action is mildly antilithic. Waters containing silicates are said to be useful in the uric-acid diathesis, and I certainly have found it suit gouty patients admirably.
The Blue Bath is a warm swimming-bath 62ft. long by 27ft. wide. It is built of stone and concrete, with a smooth surface of Portland cement. Its depth is from 4ft. 6in. to 3ft. It contains about 30,000 gallons of water, maintained at a temperature of 98°. This is the popular pleasure-bath of the Sanatorium, in which our rheumatic invalids are able to take exercise without undue fatigue. It was completed in 1885, and opened by Mr. George Augustus Sala. During the excavation necessary for its formation the workmen struck upon aremarkable sulphur-cavern, its roof and sides thickly coated with brilliant acicular crystals of sulphur, and at its base a hot spring yielding steam so strongly impregnated with sulphur-gases as to be quite irrespirable. This we have conducted to the surface, and employ as a sulphur-vapour bath, diluting it, as occasion requires, with steam of a milder character. In sciatica and all forms of rheumatism this is one of our most popular and efficacious remedies. In this building we have our electrical room, supplied with faradic and constant-current batteries, and a galvanic bath. No hospital at the present day is without its electrical apparatus, yet few hospital men, and still fewer busy general practitioners, have time to devote to the study it necessitates. It appears destined to become a specialty; and certainly there could be no wider field for its exercise than a sanatorium like that of Rotorua, where neurotic, rheumatic, and paralytic patients congregate, and where constant bathing modifies so favourably the normal resistance of the skin to the electrical current.
The selection of cases suitable for treatment at Rotorua is a most important matter. I am aware that a strong tendency; exists both with physician and patient to try anything as a dernier ressort. It is a serious matter, however, to put a patient to the trouble and expense, and possibly the pain, of making a long and weary journey, to rob him of the comforts of home and the society of his friends, without at least some reasonable hope that his labour will not be in vain. And yet this is constantly being done. Some six years ago, when I first took up my present position as Superintendent of the Sanatorium at Rotorua, I found that numbers of patients were being sent to the district who ought never to have left their homes. Advanced phthisis, chronic Bright's disease, spinal caries, and psoas abscess were a few of the ailments supposed to be curable by hot water. This state of things, fortunately, has been remedied to a certain extent by a pamphlet I wrote at the request of the Government, giving the medical men of New Zealand a few hints on the selection of cases suitable for treatment at the springs.
The two most important questions to be answered before deciding to send a case to Rotorua are—(1) Has the patient sufficient strength to bear the journey? and (2) is the case one likely to benefit by treatment? With regard to the first question, it must be remembered that the five hours' coaching from Oxford to Rotorua is rather a trying ordeal for an invalid, and will continue to be so until the railway now in course of construction is complete. A case otherwise suitable, however, need not be kept away because the journey may occasion considerable fatigue, or even increase of pain, provided there is sufficient vitality to render such inconvenience a mere matter of temporary concern. Nor need the partial or even totalloss of the patient's locomotive power prevent his coming. We have many instances on record of patients who on arrival required the aid of crutches, or to be actually carried to the bath, and yet went away enjoying the full use of their limbs. In considering the second question, medical men will not need to be reminded that where profound organic structural change exists very little benefit can be expected, so that considerable discrimination must be exercised in selecting cases of paralysis for treatment. Hot water has no regenerating power that I am aware of where nerve-elements are extensively destroyed. The same may be said of osteo-arthritis or chronic rheumatic arthritis, with structural change and great deformity of the joints. Such cases may improve in general health, gain weight, and lose pain, but there the improvement ends. Our treatment is contra-indicated in phthisis as long as active destructive change is going on in the lungs. Certain chronic poitrinaires, however, pay us periodical visits with advantage.
There is a form of incomplete paraplegia very common amongst old miners: the patient gets about a little with the help of a stick; his walk is shaky and tottering; his general health usually good; often the mind is somewhat crippled— a mild form of dementia; the bowels are generally torpid; there is often dribbling of urine, or, at best, very feeble control of the sphincter, the muscles are not atrophied, and respond normally to both the galvanic and faradic current. I consider such cases incurable. Hot baths are certainly useless. Their mental condition, however, is capable of great improvement by proper discipline and diet, and the bowels and bladder may be kept in a state of perfect comfort by galvanism intelligently applied. As they may enjoy this amount of benefit in any hospital, it is useless to send them to Rotorua. Cases of paraplegia in winch the muscles are extensively atrophied, and there is absolutely no response to either galvanism or faradism, are usually hopeless. In hemiplegia, on the other hand, presumably from cerebral embolism or from small hæmorrhages, as, for example, from rupture of the miliary aneurisms of Charcot, we have had some excellent results. Some time ago a man about forty years of age, in a state of delirium tremens, attempted to commit suicide with a pair of scissors. He gave himself four stabs with the pointed blade in the left side of the chest. One wound just touched the lung, and there was some extravasation of air into the cellular tissue. In ten days the wounds had healed, and I was about to discharge him, when he was suddenly seized with paralysis. He never lost consciousness, but was unable to articulate, and lost all motor power on the left side. I did not think it wise to commence electrical treatment or hot bathing for the first three weeks. At the end of that time the muscles of the arm and leg were flabby and wasted, and hotsulphur-baths, with faradism, were commenced. The muscles regained their normal condition in a marvellously short time, in a fortnight he was able to walk, and at the end of two months could speak quite intelligibly, and use both hand and arm very well.
Primary functional, paralysis, in which there is reason to believe that the nerve-centres have undergone no organic change—such paralysis, for example, as may be induced by depressing morbid influences, as malaria, influenza, sexual excesses, mental or physical fatigue, exposure to wet and cold, alcoholism, or hysteria, are likely to benefit by treatment at Rotorua. A lady, aged thirty-six, after a long attack of malarial fever, found herself completely paraplegic. After a time she was able to move on crutches, but had a tendency to fall backwards. Her condition improved up to a certain point, when she remained stationary for some months. Fearing she might be crippled for life, she determined to try the thermal springs of Rotorua, and I received her into my house as a private patient. I found her able to swing herself along on crutches, bearing her weight on the left leg, the right being perfectly powerless. Singularly enough, she could walk on her knees, which seemed to point to the fact that the lesion then existing must be below the spinal origin of the nerves supplying the psoas and iliacus muscles: this, together with the fact that she had tried the faradic current at home, and found it injurious, narrowed down the field for electrical treatment very considerably. I chose two large electrodes: the anode was placed on the right sacro-iliac synchondrosis, and the cathode on the calf of the right leg, and a continuous current from ten cells allowed to flow for fifteen minutes daily. In addition to this she had two hot sulphur baths every day. In three weeks she was perfectly well. Another more recent cure is even more remarkable. H. C., a bushman, aged twenty-three, had become completely paraplegic, presumably from exposure to wet and cold. He had been for many months dependant on a Charitable-aid Board, who sent him to Rotorua. For three weeks he was carried to his bath, at the end of which time he was able to stand alone. At the end of five weeks he could walk with two sticks, and ride on horseback. In three months he was as well as ever he had been in his life.
Rheumatism and skin-diseases form fully 75 per cent. of the cases we are called upon to treat, and these usually in a very chronic form. In rheumatism and rheumatic gout we have much success, especially where arthritic degeneration is not too pronounced. Hot acidic sulphur-baths at a temperature not exceeding 104°, or sulphur-vapour up to 115°, taken twice daily for a carefully-regulated time, according to individual tolerance—which we find to vary greatly—forms our routine treatment. These waters redden the skin, and cause sometingling sensation for an hour or two. Occasionally some irritation of the skin occurs, which is readily allayed by a few warm alkaline showers or douches. In those numerous and well-known cases of chronic hip-rheumatism, initiated frequently by injury, we find nothing so efficacious as the hot douche. The beneficial result is due partly to the quality of the water, and largely to its mechanical action: fortunately, our arrangements are so complete that we are able to vary the temperature and percussive power of the douche at will. We are able to quote several cases of cure even where a considerable amount of fibrous anchylosis has existed. If the rheumatic patient progresses favourably under the bath-treatment alone, neither medicines nor electricity are employed, but if after a few weeks his progress is not satisfactory, we find galvano-faradism a valuable adjunct. Usually thirty cells are put into circuit with a faradic machine, and the double current applied in the labile manner to the parts affected for fifteen minutes daily. We find this answer better than either current alone. In oases of muscular atrophy faradism is had recourse to from the commencement.
Two typical cases of cure, one of uncomplicated and the other of complicated rheumatism, will be sufficient to quote. Dr. MacGregor, the Government Inspector of Hospitals for New Zealand, quotes the following case in connection with our Sanatorium: “A.B., a young man, became affected with rheumatism while serving as a common sailor on the coast, and was reduced to helplessness. He had spent his all without gaining relief. When he had got half-way to Rotorua he found himself at a roadside hotel unable to go further, but a good Samaritan coming along conveyed him in his own carriage to Rotorua, and confided him to the care of Dr. Ginders. In less than a month he was discharged cured.” I think it is only due to the “good Samaritan” to state that his name was Sir Robert Stout, then Premier of New Zealand. The second case is a remarkable one: C.H., aged forty-nine, an innkeeper; height, 5ft. 11in.; greatest weight attained, 12st. 10lb., present weight, 10st. 6lb.; always temperate; family history good— no gout or rheumatism. Got his first attack twenty years ago —sub-acute rheumatism of the feet. Never had venereal disease in any form. The attacks recurred every winter, each being more severe than the last. The ankles, knees, elbows, and hands became affected. For the last nine years he has spent six months of each year in bed. On his arrival at Rotorua his appearance was that of a man of seventy—his hair white, his complexion pale and anæmic, his back bent, liver sluggish, bowels torpid, appetite bad, with slight enlargement of knees, elbows, and knuckles. He commenced taking two acid sulphur-baths daily, and during the first month improved wonderfully; when suddenly he got an acute exacerbation of pain, and hadto take to his bed, fully impressed that his annual hibernation had commenced. He was relieved, however, after a few days, and was able to leave his bed. Very soon serious costiveness set in. Having in vain tried other remedies, as a last resource I tried faradism. All serious symptoms at once disappeared. He rapidly gained strength, resumed his bathing, and after spending three months with us considered himself in better condition than he had been for ten years. “Very cold weather having set in, I sent him home, in appearance a new man, free from pain, his general health excellent, and with an addition of 7lb. to his weight.
Perhaps there is no class of diseases in which we meet with more uniform success than those affecting the skin. The solid and gaseous constituents of the waters are no doubt important, but I have more confidence in the influence of change and all that it implies in its effect on both mind and body, combined with the prolonged maceration of the cuticle, and the constant exposure of the skin to air and light which frequent bathing entails. General eczema, which may have resisted every form of treatment for years, is generally cured in a period varying from six to thirteen weeks if the patient is willing to submit himself to rigorous medical discipline. The same may be said of psoriasis—at least, as far as its disappearance for a longer or shorter period is concerned. It is rare, indeed, to see psoriasis completely eradicated. For ringworm and the impetiginous eczema of children the water of the Priest's Spring is specific. In sycosis epilation is necessary, after which our alkaline waters complete the cure. Neuralgias, as a rule, do remarkably well. Patients suffering from sciatica are a numerous class with us, most of them presenting a very chronic history. When the disease is not distinctly associated with the gouty or rheumatic diathesis, is not of long standing, and has been caused by exposure to cold, it is very quickly cured. A few baths relieve the pain, and there is rarely any stiffness or weakness remaining. Chronic cases are not so easily dealt with—they require great patience and perseverance on the part of both physician and patient. Our routine treatment consists of hot baths, sulphur-vapour, the douche, and galvanism. After six or eight weeks it frequently happens that nothing remains to remind the patient of his old enemy beyond some slight weakness or soreness of the limb, and I usually advise him to try a week's sea-bathing on his way home. In order to accomplish this he should arrive in Rotorua not earlier than September or later than February. We have had some good results in the treatment of cervico-brachial neuralgia. Some time ago a lady who had long suffered from neuralgia of the circumflex nerve came to Rotorua for treatment. She carried her arm in a sling, and dreaded the slightest movement. In spite of her suffering she had attained the terrific weight of17st. After two weeks' bathing, and the application of a very mild galvanic battery, she was able to use her arm, and in a month was completely cured.
There is a strong tendency on the part of patients not to believe in any form of electrical treatment unless the current is almost strong enough to lift them off their feet. The sooner they are disabused of this idea the better. Every week's experience convinces me more fully that for success in the treatment of neuralgias the galvanic current can scarcely be too weak, and in facial neuralgias, and paralysis especially, the greatest caution is requisite.
To enumerate every ailment in which our thermal springs have proved useful would prolong this paper indefinitely. Suffice it to say that in many cases their healing-power has been discovered accidentally. Many ladies bathing for rheumatism have found themselves cured of chronic metritis and leucorrhœa, and as a result of such cures have proved fruitful after years of sterility. Congestion of the liver, biliary catarrh with jaundice and hæmorrhoids, have been cured by the acid sulphur waters, which also prove useful as a topical application in ozæna and ulcerated throat. This class of water also tends to reduce plethora and corpulency without prostration, insures healthy action of the skin, and relieves torpor of the bowels.
Possibly doubt may still exist in some minds as to the safety of Rotorua as a place of residence—a doubt in some measure justified by the volcanic disturbances of 1886. There appear to me to be valid reasons for believing that such fears are groundless. In the North Island of New Zealand there exist two belts of volcanic and hydrothermal action. They run from north-west to south-east and from north-east to south-west respectively, and may be indicated on the map by two lines, one drawn in the first direction, from the extinct volcano Rangitoto, in Auckland Harbour, through the Tarawera Range to the coast; and the other in the second direction, from the active volcano, White Island, in the Bay of Plenty, to Tongariro, near Taupo. These two lines will be seen to cross each other in Lake Rotomahana, the site of the late gigantic explosion. It is therefore, I think, reasonable to suppose that such immense relief as was then given to the pent-up plutonic forces in the very centre of the volcanic area renders the recurrence of similar, phenomena in our time highly improbable.
The popularity of Rotorua as a health resort is steadily increasing, and all that is wanting to secure its permanent success is through railway-communication with Auckland. The number of tourists and invalids who passed through last year was 1,700, and the number of baths taken 10,486. With regard to the hotel and boarding-house accommodation provided forinvalids and tourists, we have, at a distance of one mile from the Sanatorium, three hotels, each possessing valuable thermal springs, with comfortable bath-houses, the use of which is free to visitors. The tariff varies from 8s. to 10s. per day, but for visitors who may wish to remain several weeks a lower charge may be arranged for. At present we have only one boarding-house, in close proximity to the Government baths: it is capable of accommodating about twenty visitors. The Medical Superintendent receives four resident patients in his house. Where privacy and home comfort, combined with constant medical supervision, are to be desired, this provision will be appreciated.
The most direct route for invalids from the Australian Colonies is from Sydney to Auckland, and thence by rail to Oxford, continuing the journey by coach to Rotorua. More vigorous individuals, who may wish to see something of the country, may take steamer from Melbourne to the Bluff, land at Wellington, and travel overland to Rotorua, a four days' journey, and most enjoyable in summer. Patients should be recommended to bring plain warm clothing, and substantial boots and shoes. Jewellery and valuable watches had better be left at home, as they are not improved by the vapours that hang about the baths.
By Authority: GEORGE DIDSBURY, Government Printer, Wellington.
| Year. | Population of European Descent (excluding the Military and their Families.)* | Trade. | Revenue and Expenditure. | |||||||
|---|---|---|---|---|---|---|---|---|---|---|
| Imports. | Exports. | Revenue from Customs. | Revenue from Land Sales and Crown Lands. | Revenue from Post Office, Fees, Fines, Licenses, and other Incidental Sources. | Total Revenue from Previous Sources. | Parliamentary Grant, or Receipts in aid of Revenue. | Appropriations from the Commissariat Chest for Military and Naval Expenditure.† | Total Expenditure. | ||
* The Maori population was estimated at 56,400 persons in the year 1853. † The data are drawn from several official sources, and the information is only approximate. † Raised by debentures at different issues. The following are particulars respecting the European population, their cultivations, and live stock for the year 1851:— Religious Denominations.—Church of England, 14,179 persons; Presbyterians, 4,124; Wesleyans, 2,529; Primitive Methodists, 226; Independents, 333; Baptists, 400; Unitarians, 74; Lutherans, 186; Quakers, 8; Protestants not specifically defined, 614; Roman Catholics, 3,473; Jews, 65; refused to state, 496. Education.—Could not read, 7,818 persons; read only, 4,353; read and write, 14,536. Land in Cultivation.—Acres—in wheat, 5,514; barley, 1,329; oats, 2,324; maize, 259; potatoes, 2,256; grass, 15,589; gardens or orchard, 1,188; other crops, 679: total under crop, 29,140. Acres fenced, 40,625. Live Stock.—Horses, 2,890; mules and asses, 60; cattle, 34,787; sheep, 233,043; goats, 12,121; pigs, 16,214. [The above table is compiled from information given in Dr. Thomson's work on New Zealand, which is stated by Sir George Grey to have been supplied from official sources when he was Governor.] | ||||||||||
| Persons. | £ | £ | £ | £ | £ | £ | £ | £ | £ | |
| 1840 | 2,050 | .. | .. | 926 | .. | .. | 926 | .. | .. | 926 |
| 1841 | 5,000 | 85,062 | 10,836 | 6,407 | 28,540 | 2,443 | 37,390 | 43,347 | 804 | 81,541 |
| 1842 | 10,992 | 166,783 | 18,670 | 18,568 | 11,723 | 2,298 | 32,589 | 17,494 | 1,426 | 51,509 |
| 1843 | 11,848 | 191,207 | 53,945 | 16,241 | 1,613 | 3,544 | 21,398 | 9,562 | 8,093 | 30,853 |
| 1844 | 12,447 | 111,619 | 49,647 | 11,099 | 405 | 2,445 | 13,949 | 30,815† | 9,782 | 54,546 |
| 1845 | 12,774 | 116,980 | 76,911 | 8,899 | 155 | 3,845 | 12,899 | .. | 200,000 | 212,899 |
| 1846 | 13,274 | 155,473 | 82,656 | 21,319 | 615 | 4,711 | 26,645 | 35,673‡ | 190,000 | 252,313 |
| 1847 | 14,477 | 202,355 | 45,485 | 36,472 | 835 | 5,958 | 43,265 | 37,752 | 153,038 | 234,055 |
| 1848 | 17,166 | 233,844 | 44,215 | 38,366 | 3,337 | 5,779 | 47,482 | 36,000 | 155,653 | 239,135 |
| 1849 | 19,543 | 254,679 | 133,662 | 41,931 | 3,600 | 4,877 | 50,408 | 20,000 | 151,455 | 221,863 |
| 1850 | 22,108 | .. | .. | 43,612 | 8,559 | 7,127 | 52,298 | 41,730 | 131,100 | 232,138 |
| 1851 | 26,707 | .. | .. | 49,208 | 12,261 | 5,580 | 67,049 | 20,000 | 110,600 | 197,649 |
| 1852 | 27,633 | .. | .. | 50,527 | 14,281 | 10,956 | 75,764 | 10,064 | 91,600 | 177,364 |
| STATISTICAL SUMMARY OF THE COLONY FROM 1853 TO 1890 INCLUSIVE | |||||||||||||||||||||||||||||||
|---|---|---|---|---|---|---|---|---|---|---|---|---|---|---|---|---|---|---|---|---|---|---|---|---|---|---|---|---|---|---|---|
| Year. | Population (exclusive of Maoris). | Births. | Deaths. | Marriages. | Immigration, excess over Emigration. | Crown Lands.* | Occupied and Cultivated Holdings over One Acre in extent. | Land (including Sown Grasses) under Cultivation. | Live Stock.† | Postal. | Electric Telegraph. | Miles of Railway. | Year. | ||||||||||||||||||
| Males. | Females. | Totals. | Waste Lands sold for Cash in each Year. | Cash realised. | Lands finally alienated under the Deferred-payment System. | Free Grants.* | Let on Perpetual Lease | Horses. | Horned Cattle. | Sheep. | Pigs. | Letters (received and despatched). | Newspapers (received and despatched). | Postal Revenue. | Number of Money Orders Issues. | Amount of Money Orders issued. | Miles of Line. | Number of Messages. | Cash and Cash Values. | Open for Traffic. | Under Construction. | Railway Receipts. | |||||||||
| Land taken up. | In Occupation on December 31st. | ||||||||||||||||||||||||||||||
* The waste or Crown lands sold in each year prior to 1856 cannot be accurately stated. The total gross quantity of land disposed of by Crown grants up to the end of 1890, including lands and lands disposed of without sale, was 19,666,916 statute acres. The figures under the head “Free Grants” represent in each year the total quantity of free grants to immigrants and naval and military settlers,grants for public purposes and Native reserves and old land claims; also, from the year 1872, grants to Natives under the provisions of the Native Land Acts. ‡ This information has been ascertained only for the years in which a census of the colony was taken. ‡ Corrected by means of results of census taken in April, 1891. The population of the colony (other than Maoris) according to the census of 5th April, 1891, was 626,658 persons at that date; the Maori population was 41,523. § Number in May, 1890, as returned by the Live Stock Branch of the Crown Lands department. || Including those owned by Maoris.¶ Government Railways; there are, besides, 114 miles of private lines. | |||||||||||||||||||||||||||||||
| . | Acres. | £ | Acres. | Acres. | Acres. | Acres. | Number. | Acres. | Number. | Number. | £ | Number. | £ | £ | £ | ||||||||||||||||
| 1853 | .. | .. | .. | .. | .. | .. | 1091 | .. | .. | .. | .. | .. | .. | .. | .. | .. | .. | .. | .. | 119,039 | 177,583 | .. | .. | .. | .. | .. | .. | .. | .. | .. | 1853 |
| 1854 | 17,914 | 14,640 | 32,554 | .. | .. | .. | 2,057 | .. | .. | .. | .. | .. | .. | .. | .. | .. | .. | .. | .. | 138,482 | 201,381 | .. | .. | .. | .. | .. | .. | .. | .. | .. | 1854 |
| 1855 | 20,781 | 16,411 | 37,192 | 1,460 | 470 | 406 | 3,937 | .. | .. | .. | .. | .. | .. | .. | .. | .. | .. | .. | .. | 171,407 | 238,522 | .. | .. | .. | .. | .. | .. | .. | .. | .. | 1855 |
| 1856 | 25,356 | 20,184 | 45,540 | 1,722 | 406 | 404 | 2,525 | 51,972 | 33,156 | .. | .. | .. | .. | .. | .. | .. | .. | .. | .. | 196,760 | 271,254 | .. | .. | .. | .. | .. | .. | .. | .. | .. | 1856 |
| 1857 | 27,606 | 22,196 | 49,802 | 1956 | 434 | 478 | 3,042 | 141,159 | 79,060 | .. | 6,169 | .. | .. | .. | 121,648 | .. | .. | .. | .. | 337,721 | 498,163 | .. | .. | .. | .. | .. | .. | .. | .. | .. | 1857 |
| 1858 | 33,679 | 25,734 | 59,413 | 2,272 | 582 | 534 | 6,130 | 239,128 | 150,839 | .. | 6,277 | .. | .. | .. | 141,007 | 14,912 | 137,204 | 1,523,324 | 40,734 | 482,856 | 684,348 | 6,024 | .. | .. | .. | .. | .. | .. | .. | .. | 1858 |
| 1859 | 41,107 | 30,486 | 71,593 | 2,647 | 704 | 603 | 8,637 | 477,023 | 222,885 | .. | 45,730 | .. | .. | .. | 156,940 | .. | .. | .. | .. | 707,870 | 839,385 | 7,812 | .. | .. | .. | .. | .. | .. | .. | .. | 1859 |
| 1860 | 45,394 | 34,317 | 79,711 | 3,146 | 1092 | 690 | 6,064 | 424,254 | 204,113 | .. | 47,016 | .. | .. | .. | .. | .. | .. | .. | .. | 822,369 | 1,029,350 | 10,068 | .. | .. | .. | .. | .. | .. | .. | .. | 1860 |
| 1861 | 61,062 | 37,959 | 99,021 | 3,441 | 1109 | 878 | 16,222 | 449,358 | 285,365 | .. | 18,834 | .. | .. | .. | 226,621 | 28,275 | 193,285 | 2,761,583 | 43,270 | 1,236,768 | 1,428,351 | 14,108 | .. | .. | .. | .. | .. | .. | .. | .. | 1861 |
| 1862 | 79,680 | 46,132 | 125,812 | 4,064 | 1,231 | 1091 | 20,991 | 658,337 | 506,657 | .. | 40,335 | .. | .. | .. | .. | .. | .. | .. | .. | 2,122,232 | 2,064,123 | 22,710 | 1,410 | 6,590 | .. | .. | .. | .. | .. | .. | 1862 |
| 1863 | 105,978 | 58,070 | 164,048 | 5,115 | 1983 | 1485 | 35,120 | 529,437 | 380,998 | .. | 66,853 | .. | .. | .. | .. | .. | .. | .. | .. | 3,403,248 | 3,397,669 | 32,329 | 11,586 | 55,703 | .. | .. | .. | .. | .. | .. | 1863 |
| 1864 | 106,580 | 65,578 | 172,158 | 6,501 | 2,921 | 1878 | 8,527 | 691,174 | 595,858 | .. | 47,198 | .. | .. | .. | 382,655 | 49,409 | 249,760 | 4,937,273 | 61,276 | 4,151,142 | 4,306,017 | 39,302 | 16,591 | 78,556 | .. | .. | .. | .. | .. | .. | 1864 |
| 1865 | 117,376 | 73,231 | 190,607 | 7,490 | 2,757 | 1908 | 12,309 | 503,112 | 341,094 | .. | 62,681 | .. | .. | .. | .. | .. | .. | .. | .. | 4,443,473 | 4,206,992 | 46,475 | 17,236 | 78,576 | .. | .. | .. | .. | .. | .. | 1865 |
| 1866 | 125,080 | 79,034 | 204,114 | 8,466 | 2,540 | 2,038 | 7,599 | 603,406 | 528,028 | .. | 55,975 | .. | .. | .. | .. | .. | .. | .. | .. | 4,758,644 | 4,373,039 | 49,598 | 22,710 | 108,779 | 699 | 48,231 | 9,114 | .. | .. | .. | 1866 |
| 1867 | 131,929 | 86,739 | 218,668 | 8,918 | 2,702 | 2,050 | 4,859 | 288,917 | 287,416 | .. | 76,743 | .. | .. | .. | 676,909 | 65,715 | 312,835 | 8,418,579 | 115,104 | 4,811,240 | 3,060,888 | 55,331 | 24,473 | 115,610 | 714 | 87,436 | 14,295 | .. | .. | .. | 1867 |
| 1868 | 134,621 | 91,997 | 226,618 | 9,391 | 2,662 | 2,085 | 860 | 199,309 | 182,065 | .. | 42,205 | .. | .. | 11,932 | 783,435 | .. | .. | .. | .. | 4,977,199 | 3,283,615 | 57,107 | 25,854 | 118,211 | 1,471 | 134,647 | 26,224 | .. | .. | .. | 1868 |
| 1869 | 140,112 | 97,137 | 237,249 | 9,718 | 2,721 | 1931 | 3,641 | 112,211 | 115,941 | .. | 145,449 | .. | .. | 13,476 | 997,477 | .. | .. | .. | .. | 5,016,595 | 3,563,147 | 58,007 | 28,427 | 127,218 | 1,011 | 173,746 | 32,649 | .. | .. | .. | 1869 |
| 1870 | 145,732 | 102,668 | 248,400 | 10,277 | 2,703 | 1851 | 3,577 | 76,766 | 88,419 | .. | 37,256 | .. | .. | 10,211 | 1,140,279 | .. | .. | .. | .. | 5,645,879 | 3,839,662 | 55,780 | 31,864 | 140,454 | 1887 | 238,195 | 27,422 | .. | .. | .. | 1870 |
| 1871 | 156,431 | 110,555 | 266,986 | 10,592 | 2,642 | 1864 | 4,786 | 92,642 | 110,973 | .. | 123,796 | .. | .. | 14,874 | 1,226,222 | 81,028 | 436,592 | 9,700,629 | 151,460 | 6,081,697 | 4,179,784 | 70,249 | 36,291 | 157,397 | 2,015 | 369,085 | 37,203 | .. | .. | .. | 1871 |
| 1872 | 162,404 | 117,156 | 279,560 | 10,795 | 3,194 | 1873 | 4,973 | 338,516 | 389,107 | .. | 183,673 | .. | .. | 15,304 | 1,416,933 | .. | .. | .. | .. | 6,958,543 | 4,411,091 | 94,733 | 44,660 | 191,009 | 2,312 | 491,205 | 44,669 | .. | .. | .. | 1872 |
| 1873 | 170,406 | 125,540 | 295,946 | 11,222 | 3,645 | 2,276 | 8,811 | 790,245 | 980,758 | .. | 484,541 | .. | .. | 15,883 | 1,651,712 | .. | .. | .. | .. | 7,315,985 | 5,269,195 | 94,706 | 52,351 | 219,258 | 2,389 | 637,941 | 55,195 | 145 | 434 | .. | 1873 |
| 1874 | 194,349 | 147,511 | 341,860 | 12,844 | 4,161 | 2,828 | 38,106 | 648,800 | 860,471 | .. | 238,581 | .. | .. | 16,092 | 1,943,653 | 99,261 | 494,113 | 11674863 | 123,741 | 9,058,456 | 6,306,692 | 104,371 | 62,712 | 263,164 | 2,632 | 844,301 | 62,322 | 209 | 621 | 21,198 | 1874 |
| 1875 | 213,294 | 162,562 | 375,856 | 14,438 | 5,712 | 3,209 | 25,270 | 318,682 | 448,697 | .. | 486,335 | .. | .. | 17,250 | 2,377,402 | .. | .. | .. | .. | 10427851 | 6,811,277 | 122,496 | 73,027 | 293,481 | 3,156 | 993,323 | 74,420 | 542 | 464 | 72,073 | 1875 |
| 1876 | 225,580 | 173,495 | 399,075 | 16,168 | 4,904 | 3,196 | 11,955 | 497,416 | 846,831 | .. | 31,145 | .. | .. | 18,750 | 2,940,711 | .. | .. | .. | .. | 11770737 | 7,962,748 | 129,263 | 80,255 | 310,268 | 3,170 | 1,100,599 | 80,841 | 718 | 427 | 469,051 | 1876 |
| 1877 | 227,681 | 180,937 | 408,618 | 16,856 | 4,685 | 3,114 | 6,376 | 777,862 | 1,314,480 | } 79,324 | 40,314 | .. | .. | 20,519 | 3,523,277 | .. | .. | .. | .. | 13054870 | 8,066,311 | 143,600 | 90,672 | 334,973 | 3,307 | 1,182,955 | 85,589 | 1,052 | 251 | 569,898 | 1877 |
| 1878 | 240,627 | 191,892 | 432,519 | 17,770 | 4,645 | 3,377 | 10,502 | 642,667 | 1,252,993 | 54,861 | 54,861 | .. | .. | 21,048 | 3,982,866 | 137,768 | 578,430 | 13069338 | 207,337 | 15524761 | 9,410,366 | 158,998 | 101,017 | 358,255 | 3,434 | 1,260,324 | 92,433 | 1089 | 142 | 758,096 | 1878 |
| 1879 | 257,894 | 205,835 | 463,729 | 18,070 | 5,583 | 3,352 | 18,723 | 79,575 | 146,733 | 37,953 | 37,953 | .. | .. | 23,129 | 4,506,889 | .. | .. | .. | .. | 20957818 | 10057944 | 141,448 | 117,999 | 428,673 | 3,512 | 1,448,943 | 112,351 | 1,171 | 284 | 762,572 | 1879 |
| 1880 | 268,364 | 216,500 | 484,864 | 19,341 | 5,437 | 3,181 | 7,231 | 131,798 | 184,488 | 18,978 | 41,972 | .. | .. | 24,147 | 4,768,192 | .. | .. | .. | .. | 22824468 | 10272917 | 149,517 | 135,648 | 465,405 | 3,758 | 1,304,712 | 100,023 | 1288 | 292 | 836,077 | 1880 |
| 1881 | 274,986 | 225,924 | 500,910 | 18,732 | 5,491 | 3,277 | 1,616 | 235,815 | 351,430 | 39,494 | 530,650 | .. | .. | 26,298 | 5,189,104 | 161,736 | 698,637 | 12985085 | 200,083 | 25557931 | 12248043 | 156,579 | 135,556 | 452,182 | 3,824 | 1,438,772 | 101,566 | 1,333 | 187 | 892,026 | 1881 |
| 1882 | 283,303 | 234,404 | 517,707 | 19,009 | 5,701 | 3,600 | 3,489 | 138,512 | 209,004 | 27,487 | 122,100 | .. | .. | 27,352 | 5,651,255 | .. | .. | .. | .. | 30525579 | 13313099 | 168,325 | 148,162 | 499,368 | 3,974 | 1,570,189 | 102,378 | 1 371 | 171 | 953,347 | 1882 |
| 1883 | 294,665 | 246,212 | 540,877 | 19,202 | 6,061 | 3,612 | 10,029 | 113,500 | 141,251 | 24,229 | 228,698 | 26,786 | 26,364 | 28,587 | 6,072,949 | .. | .. | .. | .. | 33588408 | 13030563 | 172,665 | 172,556 | 541,133 | 4,074 | 1,599,400 | 102,958 | 1,404 | 224 | 961,304 | 1883 |
| 1884 | 306,667 | 257,637 | 564,304 | 19,846 | 5,740 | 3,800 | 9,321 | 96,267 | 124,928 | 40,023 | 121,611 | 20,975 | 41,561 | 29,814 | 6,550,399 | .. | .. | .. | .. | 35257846 | 14093742 | 188,772 | 186,052 | 572,666 | 4,264 | 1,654,305 | 101,482 | 1479 | 158 | 1,045,712 | 1884 |
| 1885 | 312,125 | 263,101 | ‡575,226 | 19,693 | 6,081 | 3,813 | 4,504 | 59,613 | 84,282 | 34,637 | 456,080 | 24,441 | 51,367 | 31,763 | 6,668,920 | .. | .. | .. | .. | 35829855 | 14233878 | 197,456 | 188,622 | 581,395 | 4,463 | 1,774,273 | 112,778 | 1,613 | 179 | 1,047,418 | 1885 |
| 1886 | 317,646 | 271,740 | 589,386 | 19,299 | 6,135 | 3,488 | 1,064 | 39,964 | 43,836 | 29,292 | 185,764 | 46,367 | 93,868 | 33,332 | 6,845,177 | 187,382 | 853,358 | 16564595 | 277,901 | 38084592 | 14324047 | 206,029 | 155,680 | 547,755 | 4,546 | 1,836,266 | 115,666 | 1,721 | 171 | 998,768 | 1886 |
| 1887 | 324,558 | 278,803 | 603,361 | 19,135 | 6,137 | 3,563 | 977 | 21,154 | 25,330 | 18,496 | 316,488 | 64,595 | 150,218 | 34,743 | 7,284,752 | .. | .. | .. | .. | 39377774 | 15381323 | 213,355 | 159,579 | 555,744 | 4,646 | 1,835,394 | 116,211 | 1,753 | 169 | 994,843 | 1887 |
| 1888 | 324,948 | 282,432 | 607,380 | 18,902 | 5,708 | 3,617 | -9,175 Dec. | 64,898 | 52,379 | 23,630 | 142,351 | 178,138 | 312,495 | 35,747 | 7,670,167 | .. | .. | 15468860 | .. | 40398020 | 16202849 | 212,247 | 162,387 | 555,996 | 4,790 | 1,765,860 | 104,116 | 1,777 | 163 | 997,615 | 1888 |
| 1889 | 328,588 | 287,464 | 616,052‡ | 18,457 | 5,772 | 3,632 | 214 | 42,617 | 47,950 | 24,773 | 60,708 | 242,790 | 544,914 | 38,178 | 8,015,426 | .. | 895,461 | 15,503,263§ | .. | 42301233 | 16721016 | 222,978 | 172,076 | 589,545 | 4,874 | 1,802,987 | 106,462 | 1809 | 176 | 1,095,569 | 1889 |
| 1890 | 332,557 | 292,951 | 625,508‡ | 18,278 | 5,994 | 3,797 | - 1,782 Dec. | 98,479 | 108,959 | 46,808 | 135,763 | 271,736 | 798,571 | 38,083 | 8,462,495 | 211,040 | 831,831|| | 18,117,186|| | 314,644|| | 43917200 | 17912734 | 229,867 | 176,427 | 602,077 | 5,060 | 1,961,161 | 110,697 | 1,842¶ | 132 | 1,121,701 | 1890 |
| Year. | Shipping. | Exports (the Product of New Zealand). | Exports (the Product of New Zealand). | Imports. | Coal-mines, Output from. | Revenue. | Expenditure. | Public Debt (Debentures and Stock in Circulation). | Debt of Local Bodies. | Banks (Average of Four Quarters). | Savings Banks. | Friendly Societies registered. | Schools and Scholars. | Convictions in Superior Courts after Commitment. | Year. | ||||||||||||||||||||||||||||
|---|---|---|---|---|---|---|---|---|---|---|---|---|---|---|---|---|---|---|---|---|---|---|---|---|---|---|---|---|---|---|---|---|---|---|---|---|---|---|---|---|---|---|---|
| Inwards. | Outwards. | Registered Vessels belonging to the Colony. | Wool. | Grain. | Frozen Meat. | Flax (Phormium). | Gold. | Gum (Kauri). | Provisions, Tallow, Timber, &c. | ||||||||||||||||||||||||||||||||||
| Primary Schools | Private Schools. | ||||||||||||||||||||||||||||||||||||||||||
| Number of Vessels. | Tonnage. | Number of Vessels. | Tonnage. | Number of Vessels. | Tonnage. | Quantity. | Value. | Quantity. | Value. | Quantity. | Value. | Quantity. | Value. | Quantity. | Value. | Quantity. | Value. | Value. | Total Value. | Total Value. | Ordinary. | Territorial. | Total for Year. | Out of Revenue. | Out of Loan. | Deposits. | Assets. | Liabilities. | Number of Depositors. | Balance to credit on 31st Dec. | No. of Lodges, &c. | No. of Members. | Schools. | Scholars. | Schools. | Scholars. | |||||||
* Post Office Savings Banks were first opened in 1867. † Statistics of schools and scholars not being complete for years prior to 1874, no figures are entered. ‡ Exclusive of charges for sinking fund met be debentures issued to an equivalent amount. § Approximate. addition to these there were in December, 1890, 2,117 scholars at high schools and 2,496 children attending the Native schools, nearly all of which are maintained by Government, besides 718 at industrial schools and orphanages. || There was an accrued sinking fund amounting to £1,407,604 in December, 1890, leaving a net indebtedness of £37,394,746. | |||||||||||||||||||||||||||||||||||||||||||
| lb. | £ | Bushels. | £ | cwt. | £ | Tons. | £ | Oz. | £ | Tons. | £ | £ | £ | £ | Tons. | £ | £ | £ | £ | £ | £ | £ | £ | £ | £ | £ | |||||||||||||||||
| 1853 | 238 | 65,504 | 229 | 62,891 | .. | .. | 1,071,340 | 66,507 | 59,959 | 19,042 | .. | .. | .. | 1,046 | .. | .. | 829 | 15,971 | 200,706 | 303,282 | 597,827 | Prior to 1878, 703,413. | 83,069 | 66,751 | 149,820 | .. | .. | .. | .. | ... | ... | ... | ... | ... | ... | ... | ... | ... | ... | ... | .. | 1853 | |
| 1854 | 293 | 74,831 | 293 | 76,718 | .. | .. | 1,254,416 | 70,103 | 94,600 | 41,019 | .. | .. | .. | 1,563 | .. | .. | 1,660 | 28,864 | 179,341 | 320,390 | 891,201 | 111,214 | 180,826 | 292,040 | .. | .. | .. | .. | ... | ... | ... | ... | ... | ... | ... | ... | ... | ... | ... | .. | 1854 | ||
| 1855 | 378 | 88,614 | 341 | 79,825 | .. | .. | 1,772,344 | 93,104 | 150,352 | 82,302 | .. | .. | 150 | 4,674 | .. | .. | 355 | 4,514 | 181,273 | 365,867 | 813,460 | 113,596 | 62,300 | 175,896 | .. | .. | .. | .. | ... | ... | ... | ... | ... | ... | ... | ... | ... | ... | ... | .. | 1855 | ||
| 1856 | 326 | 85,748 | 323 | 82,991 | .. | .. | 2,559,618 | 146,070 | 66,150 | 24,132 | .. | .. | .. | 552 | .. | .. | 1,440 | 18,591 | 129,088 | 318,433 | 710,868 | 112,152 | 76,177 | 188,329 | .. | .. | .. | .. | ... | ... | ... | ... | ... | ... | ... | ... | ... | ... | ... | .. | 1856 | ||
| 1857 | 289 | 78,309 | 283 | 76,524 | 186 | 6,662 | 2,648,716 | 176,579 | 81,757 | 29,676 | .. | .. | .. | 710 | 10,436 | 40,442 | 2,521 | 35,250 | 86,737 | 369,394 | 992,994 | 157,064 | 91,193 | 248,257 | .. | .. | .. | .. | 343,316 | 419,860 | 432,494 | ... | ... | ... | ... | ... | ... | ... | ... | .. | 1857 | ||
| 1858 | 339 | 90,118 | 322 | 82,293 | 189 | 6,852 | 3,810,372 | 254,022 | 71,403 | 20,680 | .. | .. | .. | 1,516 | 13,533 | 52,443 | 1810 | 20,036 | 85,252 | 433,949 | 1,141,273 | 179,856 | 161,799 | 341,655 | .. | .. | .. | .. | 448,078 | 705,738 | 616,769 | 715 | 7,862 | ... | ... | ... | ... | ... | ... | .. | 1858 | ||
| 1859 | 438 | 136,580 | 398 | 120,392 | 213 | 7,883 | 5,096,751 | 339,779 | 118,740 | 39,016 | .. | .. | .. | 1593 | 7,336 | 28,427 | 2,010 | 20,776 | 91,717 | 521,308 | 1,551,030 | 217,767 | 241,882 | 459,649 | .. | .. | .. | .. | 541,213 | 1,003,584 | 678,474 | 802 | 7,996 | ... | ... | ... | ... | ... | ... | .. | 1859 | ||
| 1860 | 398 | 140,276 | 398 | 140,293 | 238 | 8,527 | 6,665,880 | 444,392 | 55,683 | 13,112 | .. | .. | .. | 1,240 | 4,538 | 17,585 | 1,046 | 9,851 | 62,953 | 549,133 | 1,548,333 | 248,978 | 215,760 | 464,739 | .. | .. | .. | .. | 644,521 | 992,082 | 801,588 | 1,104 | 12,450 | ... | ... | ... | ... | ... | ... | .. | 1860 | ||
| 1861 | 596 | 197,986 | 546 | 205,350 | 252 | 9,144 | 7,855,920 | 523,728 | 8,118 | 2,518 | .. | .. | 2 | .. | 194,234 | 752,657 | 856 | 9,888 | 50,407 | 1,339,241 | 2,493,811 | 344,110 | 347,354 | 691,464 | .. | .. | .. | .. | 882,754 | 1,235,952 | 1,097,162 | 1,144 | 2,921 | ... | ... | ... | ... | ... | ... | 100 | 1861 | ||
| 1862 | 813 | 301,365 | 783 | 288,647 | 287 | 10,825 | 9,839,265 | 674,226 | 6,602 | 1821 | .. | .. | .. | 261 | 410,862 | 1,591,389 | 1,103 | 11,107 | 79,216 | 2,358,020 | 4,626,082 | 579,179 | 606,830 | 1,186,009 | .. | .. | 836,000 | .. | 1,596,446 | 2,691,117 | 2,092,497 | 1496 | 29,768 | ... | ... | ... | ... | ... | ... | 145 | 1862 | ||
| 1863 | 1,154 | 419,935 | 1094 | 394,665 | 343 | 15,189 | 12585980 | 830,495 | 3,238 | 1,160 | .. | .. | .. | 251 | 628,450 | 2,431,723 | 1,400 | 27,027 | 52,235 | 3,342,891 | 7,024,674 | 856,432 | 524,404 | 1,380,836 | .. | .. | 1,289,750 | .. | 2,092,090 | 4,028,766 | 2,962,585 | 2,371 | 44,117 | ... | ... | ... | ... | ... | ... | 234 | 1863 | ||
| 1864 | 1,117 | 426,004 | 1089 | 433,253 | 423 | 22,573 | 16691666 | 1,070,997 | 3,580 | 722 | .. | .. | 7 | 170 | 480,171 | 1,857,847 | 2,228 | 60,590 | 60,308 | 3,050,634 | 7,000,655 | 894,071 | 714,770 | 1,608,841 | .. | .. | 2,219,450 | .. | 2,480,303 | 5,063,458 | 3,343,172 | 4,669 | 94,248 | ... | ... | ... | ... | ... | ... | 262 | 1864 | ||
| 1865 | 862 | 295,625 | 783 | 283,020 | 466 | 24,484 | 19180500 | 1,141,761 | 25,447 | 6,076 | .. | .. | 3 | .. | 574,574 | 2,226,474 | 1867 | 46,060 | 82,975 | 3,503,421 | 5,594,977 | 1,025,782 | 500,045 | 1,525,827 | .. | .. | 4,368,681 | .. | 2,638,414 | 5,455,289 | 3,522,146 | 4,304 | 87,400 | ... | ... | ... | ... | ... | ... | 332 | 1865 | ||
| 1866 | 1019 | 330,303 | 986 | 306,979 | 493 | 26,787 | 22810776 | 1,354,152 | 32,610 | 7,297 | .. | .. | .. | 996 | 735,376 | 2,844,517 | 2,535 | 70,572 | 118,556 | 4,396,100 | 5,894,863 | 1,202,282 | 776,429 | 1,978,711 | .. | .. | 5,435,728 | .. | 3,097,473 | 5,891,532 | 4,010,110 | 4,513 | 91,863 | ... | ... | ... | ... | ... | ... | 277 | 1866 | ||
| 1867 | 944 | 309,568 | 950 | 308,169 | 366 | 23,240 | 27152966 | 1,580,608 | 158,812 | 26,986 | .. | .. | 126 | 4,256 | 686,753 | 2,700,275 | 2,685 | 77,491 | 89,848 | 4,479,464 | 5,344,607 | 1,302,425 | 561,730 | 1,864,155 | .. | .. | 5,781,193 | .. | 2,904,594 | 5,947,160 | 3,737,695 | 6,579 | 156,855 | ... | ... | ... | ... | ... | ... | 240 | 1867 | ||
| 1868 | 851 | 277,105 | 873 | 287,710 | 372 | 24,539 | 28875163 | 1,516,548 | 633,676 | 114,468 | .. | .. | 534 | 8,137 | 637,474 | 2,504,326 | 2,690 | 72,493 | 52,790 | 4,268,762 | 4,985,748 | 1,195,512 | 425,323 | 1,620,835 | .. | .. | 7,182,743 | .. | 3,102,727 | 5,734,745 | 3,838,220 | 8,123 | 243,615 | ... | ... | ... | ... | ... | ... | 248 | 1868 | ||
| 1869 | 764 | 250,731 | 771 | 247,764 | 381 | 25,990 | 27765636 | 1,371,230 | 520,556 | 96,441 | .. | .. | 2,028 | 45,245 | 614,281 | 2,362,995 | 2,850 | 111,307 | 102,916 | 4,090,134 | 4,976,126 | 1,072,925 | 382,070 | 1,454,995 | .. | .. | 7,360,616 | .. | 3,174,831 | 6,231,416 | 3,863,006 | 10,103 | 320,383 | ... | ... | ... | ... | ... | ... | 277 | 1869 | ||
| 1870 | 756 | 273,151 | 766 | 265,407 | 384 | 26,743 | 37039763 | 1,703,944 | 854,897 | 141,135 | .. | .. | 5,471 | 132,578 | 544,880 | 2,157,585 | 4,391 | 175,074 | 234,366 | 4,544,682 | 4,639,015 | 1,057,050 | 327,589 | 1,384,639 | .. | .. | 7,841,891 | .. | 3,127,769 | 6,315,354 | 3,819,670 | 12,137 | 388,804 | ... | ... | ... | ... | ... | ... | 231 | 1870 | ||
| 1871 | 729 | 274,643 | 709 | 265,618 | 371 | 27,107 | 37793734 | 1,606,144 | 1,032,902 | 164,087 | .. | .. | 4,248 | 90,611 | 730,029 | 2,787,520 | 5,054 | 167,958 | 354,784 | 5,171,104 | 4,078,193 | 964,417 | 377,699 | 1,342,116 | .. | .. | 8,900,991 | .. | 3,334,672 | 5,871,888 | 3,988,400 | 14,275 | 454,966 | ... | ... | ... | ... | ... | ... | 180 | 1871 | ||
| 1872 | 775 | 300,302 | 743 | 285,366 | 364 | 23,963 | 41886997 | 2,537,919 | 1,058,480 | 178,886 | .. | .. | 3,985 | 99,405 | 445,370 | 1,730,992 | 4,811 | 154,167 | 405,817 | 5,107,186 | 5,142,951 | 1,056,044 | 618,772 | 1,674,816 | .. | .. | 9,985,386 | .. | 3,919,838 | 5,429,747 | 4,628,819 | 17,289 | 597,002 | ... | ... | ... | ... | ... | ... | 190 | 1872 | ||
| 1873 | 739 | 289,297 | 704 | 281,847 | 411 | 30,035 | 41535185 | 2,702,471 | 587,881 | 136,382 | .. | .. | 6,454 | 143,799 | 505,337 | 1,987,425 | 2,833 | 85,816 | 422,077 | 5,477,970 | 6,464,687 | 1,510,600 | 1,265,788 | 2,776,388 | .. | .. | 10913936 | .. | 4,713,806 | 7,267,720 | 5,538,030 | 21,807 | 812,144 | ... | ... | ... | ... | ... | ... | 189 | 1873 | ||
| 1874 | 856 | 399,290 | 822 | 385,533 | 471 | 38,935 | 46848735 | 2,834,695 | 1,162,782 | 291,103 | .. | .. | 2,038 | 37,690 | 376,388 | 1,505,331 | 2,568 | 79,986 | 403,338 | 5,152,143 | 8,121,812 | 1,917,712 | 1,150,900 | 3,068,612 | 2,960,710 | 2,725,893 | 13366936 | .. | 5,564,434 | 9,954,216 | 6,490,504 | 27,215 | 943,753 | ... | ... | 544 | 38,215 | 188 | 8,237 | 194 | 1874 | ||
| 1875 | 926 | 416,727 | 940 | 417,820 | 502 | 42,025 | 54401540 | 3,398,155 | 1,276,927 | 231,417 | .. | .. | 639 | 11,742 | 355,322 | 1,407,770 | 3,230 | 138,523 | 288,237 | 5,475,844 | 8,029,172 | 2,125,206 | 688,722 | 2,813,928 | 3,431,972 | 3,107,867 | 17400031 | .. | 5,967,205 | 10987178 | 6,987,318 | 30,310 | 897,326 | ... | ... | 599 | 45,562 | 182 | 7,316 | 257 | 1875 | ||
| 1876 | 878 | 393,180 | 866 | 393,334 | 538 | 44,401 | 59853454 | 3,395,816 | 2,172,098 | 337,878 | .. | .. | 897 | 18,285 | 318,367 | 1,268,559 | 2,888 | 109,234 | 359,129 | 5,488,901 | 6,905,171 | 2,430,672 | 1,149,622 | 3,580,294 | 4,305,337 | 2,066,104 | 18678111 | .. | 6,238,471 | 11776070 | 7,221,399 | 32,577 | 905,146 | ... | ... | 680 | 51,964 | 244 | 9,357 | 249 | 1876 | ||
| 1877 | 812 | 388,568 | 848 | 400,609 | 533 | 42,479 | 64481324 | 3,658,938 | 1,323,910 | 276,452 | .. | .. | 1,053 | 18,826 | 366,955 | 1,476,312 | 3,632 | 118,348 | 509,841 | 6,078,484 | 6,973,418 | 2,340,841 | 1,575,182 | 3,916,023 | 3,822,425 | 1,827,904 | 20691111 | .. | 7,185,106 | 12992104 | 8,152,230 | 35,709 | 964,430 | .. | 8,560 | 730 | 56,239 | 252 | 9,992 | 250 | 1877 | ||
| 1878 | 926 | 456,490 | 886 | 428,493 | 541 | 46,965 | 59270256 | 3,292,807 | 2,112,214 | 508,767 | .. | .. | 622 | 10,666 | 311,437 | 1,244,190 | 3,445 | 132,975 | 595,214 | 5,780,508 | 8,755,663 | 162,218 | 2,658,708 | 1,509,181 | 4,167,889 | 4,365,275 | 1,287,869 | 22608311 | .. | 8,960,369 | 15393630 | 10031009 | 39,926 | 1,043,204 | .. | 8,828 | 748 | 65,040 | 236 | 9,206 | 292 | 1878 | |
| 1879 | 894 | 473,940 | 908 | 475,752 | 563 | 64,457 | 62220810 | 3,126,439 | 3,470,344 | 660,557 | .. | .. | 445 | 7,874 | 284,100 | 1,134,641 | 3,228 | 147,535 | 486,409 | 5,563,455 | 8,374,585 | 231,218 | 2,816,244 | 318,661 | 3,134,905 | 3,845,035 | 1,973,239 | 23958311 | .. | 8,020,073 | 16054295 | 9,057,463 | 42,679 | 990,337 | 110 | 9,759 | 817 | 75,556 | 257 | 10,234 | 296 | 1879 | |
| 1880 | 730 | 395,675 | 786 | 424,041 | 559 | 66,316 | 66860156 | 3,169,300 | 5,540,445 | 898,997 | .. | .. | 894 | 15,617 | 303,215 | 1,220,263 | 4,725 | 242,817 | 555,306 | 6,102,400 | 6,162,011 | 299,923 | 2,895,128 | 389,914 | 3,285,042 | 4,019,850 | 2,228,990 | 28583231 | .. | 8,538,935 | 14220275 | 9,550,177 | 47,462 | 1,148,992 | 138 | 13,165 | 836 | 82,401 | 278 | 11,238 | 330 | 1880 | |
| 1881 | 765 | 420,134 | 762 | 413,487 | 572 | 72,387 | 59415940 | 2,909,760 | 5,815,960 | 986,072 | .. | .. | 1308 | 26,285 | 250,683 | 996,867 | 5,460 | 253,778 | 589,488 | 5,762,250 | 7,457,045 | 337,262 | 3,206,554 | 550,939 | 3,757,493 | 3,675,797 | 1,069,927 | 29659111 | 3,039,807 | 9,069,377 | 14863645 | 10083188 | 61,054 | 1,549,515 | 179 | 14,484 | 869 | 83,560 | 266 | 9,987 | 270 | 1881 | |
| 1882 | 795 | 461,285 | 769 | 438,551 | 584 | 76,196 | 65322707 | 3,118,554 | 4,310,984 | 907,961 | 15,244 | 19,339 | 2,040 | 41,955 | 230,893 | 921,664 | 5,533 | 260,369 | 983,508 | 6,253,350 | 8,609,270 | 378,272 | 3,408,351 | 508,809 | 3,917,160 | 3,824,735 | 821,976 | 30235711 | 3,277,584 | 8,945,346 | 17162234 | 10015273 | 68,358 | 1,832,047 | 272 | 18,634 | 911 | 87,179 | 262 | 10,002 | 265 | 1882 | |
| 1883 | 805 | 494,926 | 851 | 507,565 | 579 | 84,903 | 68149430 | 3,014,211 | 6,723,303 | 1,286,724 | 87,975 | 118,328 | 2,013 | 36,761 | 222,899 | 892,445 | 6,518 | 336,606 | 1,170,169 | 6,855,244 | 7,974,038 | 421,764 | 3,470,191 | 401,076 | 3,871,267 | 3,924,005 | 1,191,784 | 31385411 | 3,540,046 | 8,659,477 | 17794761 | 9,706,700 | 73,546 | 1,784,631 | 315 | 21,882 | 943 | 92,476 | 257 | 11,255 | 258 | 1883 | |
| 1884 | 852 | 529,188 | 872 | 534,242 | 583 | 92,696 | 81139028 | 3,267,527 | 5,361,167 | 743,807 | 254,069 | 345,000 | 1,525 | 23,475 | 246,392 | 988,953 | 6,393 | 342,151 | 1,231,483 | 6,942,486 | 7,663,888 | 480,831 | 3,280,115 | 427,373 | 3,707,488 | 3,853,618 | 1,565,748 | 32860982 | 3,962,330 | 9,643,214 | 18442139 | 10691599 | 79,314 | 1,926,759 | 323 | 23,107 | 987 | 97,238 | 265 | 12,203 | 287 | 1884 | |
| 1885 | 786 | 519,700 | 780 | 513,000 | 597 | 95,887 | 86507431 | 3,205,275 | 4,478,264 | 496,371 | 296,473 | 373,857 | 1,063 | 16,316 | 222,732 | 890,056 | 5,876 | 299,762 | 1,310,274 | 6,591,911 | 7,479,921 | 511,063 | 3,464,252 | 395,744 | 3,859,996 | 4,045,901 | 1,178,884 | 35790422 | 4,313,223 | 10083296 | 18811567 | 11130244 | 85,769 | 2,142,560 | 334 | 23,500§ | 1,021 | 102,407 | 280 | 11,989 | 266 | 1885 | |
| 1886 | 725 | 502,572 | 707 | 488,331 | 571 | 94,196 | 90853744 | 3,072,971 | 3,441,803 | 449,415 | 346,055 | 427,193 | 1,112 | 15,922 | 235,578 | 939,648 | 4,920 | 257,653 | 1,223,880 | 6,386,682 | 6,759,013 | 534,353 | 3,349,891 | 338,125 | 36880166 | 4,170,465 | 1,583,723 | 37587776 | 4,943,270 | 10579711 | 19041827 | 11603194 | 91,296 | 2,133,861 | 358 | 25,000§ | 1,054 | 106,328 | 288 | 12,497 | 286 | 1886 | |
| 1887 | 653 | 489,754 | 675 | 493,583 | 557 | 94,027 | 88824382 | 3,321,074 | 3,987,189 | 419,525 | 402,107 | 455,870 | 1578 | 25,094 | 187,938 | 747,878 | 6,790 | 362,434 | 1,219,206 | 6,551,081 | 6,245,515 | 558,620 | 3,141,573 | 321,922 | 3,163,495 | 3,954,290 | 1,572,786 | 38225537 | 5,620,747 | 11031614 | 18799847 | 11995495 | 97,406 | 2,407,776 | 372 | 25,300§ | 1093 | 110,919 | 299 | 13,417 | 347 | 1887 | |
| 1888 | 683 | 526,435 | 701 | 531,478 | 524 | 86,132 | 83225733 | 3,115,008 | 4,997,587 | 653,311 | 552,298 | 628,800 | 4,042 | 75,269 | 229,608 | 914,309 | 8,482 | 380,933 | 1,487,498 | 7,255,128 | 5,941,900 | 613,895 | 3,779,581 | 330,234 | 4,109,815 | 3,962,912 | 824,880 | 38325550 | 5,812,803 | 11155778 | 18709444 | 12108353 | 103,046 | 2,691,693 | 372 | 25,500§ | 1128 | 112,685 | 299 | 13,893 | 308 | 1888 | |
| 1839 | 781 | 602,634 | 762 | 593,252 | 520 | 87,411 | 102227354 | 3,976,375 | 6,027,201 | 970,695 | 656,822 | 783,374 | 17,084 | 361,182 | 197,492 | 785,490 | 7,519 | 329,590 | 1,835,302 | 9,042,008 | 6,308,863 | 586,445 | 3,635,768 | 356,151 | 3,991,919 | 3,981,721 | 515,058 | 38483250 | 5,892,050 | 11528424 | 17652915 | 12486717 | 110,566 | 2,858,644 | 387 | 26,200§ | 1,155 | 115,456 | 293 | 13,516 | 286 | 1889 | |
| 1890 | 744 | 662,769 | 745 | 649,705 | 521 | 98,907 | 102817077 | 4,150,599 | 7,999,139 | 1,074,354 | 898,894 | 1,087,617 | 21,158 | 381,789 | 187,641 | 751,360 | 7,438 | 378,563 | 1,604,479 | 9,428,761 | 6,260,525 | 637,397 | 3,843,862 | 364,166 | 4,208,028 | 4,081,566 | 398,817 | 38,802,350|| | 5,978,059 | 12368610 | 17735259 | 13356598 | 118,344 | 3,136,868 | 387 | 26,700§ | 1,200 | 117,912¶ | 298 | 13,626 | 301 | 1890 | |
| AUSTRALASIAN STATISTICS FOR THE YEAR 1890 | ||||||||||||||||||||||||||
|---|---|---|---|---|---|---|---|---|---|---|---|---|---|---|---|---|---|---|---|---|---|---|---|---|---|---|
| Colonies. | Population.(1) | Births. | Deaths. | Arrivals. | Departures. | Marriages. | Public Revenue. | |||||||||||||||||||
| On 31st December | Mean for Year. | Number. | Proportion to every 1,000 of Population. | Number. | Proportion to every 1,000 of Population. | From Taxation. | Railways. | Post and Telegraph. | Sales and Rents of Crown Lands. | Other Revenue. | Total Revenue. | |||||||||||||||
| Males. | Females. | Total. | Males. | Females. | Total. | Males. | Females. | Total. | Males. | Females. | Total. | Number. | Proportion to every 1,000 of Population. | Customs. | Other Taxes. | Total Taxation. | ||||||||||
| £ | £ | £ | £ | £ | £ | £ | £ | |||||||||||||||||||
| Queensland | 243,926 | 178,850 | 422,776 | 239,766 | 174,951 | 414,717 | 15,407 | 37.11 | 5,638 | 13.59 | (1)23334 | 9,671 | 33,005 | (1)19237 | 7,419 | 26,656 | 3,195 | 7.7 | 1,243,046 | 170,279 | 1,413,325 | 799,243 | 216,605 | 576,868 | 254,267 | 3,200,308 |
| New South Wales | (3)609990 | 511,740 | 1,121,732 | 600,764 | 501,578 | 1,102,342 | 38,964 | 35.35 | 14,217 | 12.9 | (1)98521 | 41,587 | 140,108 | (1)77721 | 33,076 | 110,797 | 7,876 | 7.14 | 1,888,321 | 860,018 | 2,748,339 | (2)3,013,921 | 629,894 | 2,243,039 | 863,427 | 9,498,620 |
| Victoria | (3)596064 | 537,202 | 1,133,266 | 589,310 | 529,190 | 1,118,500 | 37,578 | 33.6 | 18,012 | 16.1 | (4)52171 | 27,606 | 79,777 | (4)42740 | 21,080 | 63,820 | 9,187 | 8.21 | (5)2,658,010 | 972,804 | 3,630,814 | 3,134,066 | 526,400 | 57,976 | 648,103 | 8,519,159 |
| South Australia | 161,587 | 152,608 | 314,195 | 160,201 | 151,299 | 311,500 | 10,364 | 33.27 | 3,923 | 12.59 | 34,832 | 13,003 | 47,835 | 35,283 | 13,566 | 48,849 | 2,235 | 7.11 | 602,527 | 187,650 | 790,177 | 1,080,104 | 212,243 | 246,427 | 228,821 | 2,557,772 |
| Western Australia | 26,794 | 19,496 | 46,290 | 26,017 | 19,100 | 45,117 | 1,561 | 34.81 | 540 | 1197 | 2,815 | 752 | 3,567 | 1,502 | 494 | 1996 | 278 | 6.16 | 182,546 | 21,859 | 204,405 | 45,814 | 25,787 | 107,636 | 30,672 | 414,314 |
| Tasmania | 76,843 | 68,447 | 145,290 | 75,978 | 67,756 | 1,437,344 | 813 | 33.49 | 2,118 | 14.74 | 18,905 | 10,612 | 29,517 | 16,699 | 10,371 | 27,070 | 954 | 6.64 | 329,067 | 125,364 | 454,431 | 102,642 | 60,101 | 79,965 | 60,961 | 758,100 |
| New Zealand | (6)332557 | (7)292951 | (8)625508 | 330,573 | 290,207 | 620,780 | 18,278 | 29.44 | 5,994 | 9.66 | 9,753 | 5,275 | 15,028 | 10,809 | 6,001 | 16,810 | 3,797 | 6.12 | 1,535,868 | 637,297 | (9)2,173,165 | 1,143,989 | 340,563 | 326,600 | 223,711 | 4,208,028 |
| Colonies. | Taxation. | Public Expenditure. | Loan Expenditure. | Public Debt. | Trade. | |||||||||||||||||||||||||||||
|---|---|---|---|---|---|---|---|---|---|---|---|---|---|---|---|---|---|---|---|---|---|---|---|---|---|---|---|---|---|---|---|---|---|---|
| Rate per Head of Mean Population. | Not Including Loan Expenditure. | Railway Construction. | Roads and Bridges. | Other Expenditure. | Total Loan Expenditure. | Amount on 31st December. | Accrued Sinking Fund on 31st December. | Rate of net Indebtedness per Head of Population at End of Year. | Value of Imports from | Value of Imports per Head of Mean Population. | ||||||||||||||||||||||||
| Interest and Charges of Public Debt. | Railways. | Post and Telegraph. | Education. | Other Expenditure. | Total. | United Kingdom. | Australian Colonies. | Other British Possessions. | Foreign States. | Total. | ||||||||||||||||||||||||
| £ | s. | .. | £ | £ | £ | £ | £ | £ | £ | £ | £ | £ | £ | £ | £ | s. | d. | £ | £ | £ | £ | £ | £ | s. | d. | |||||||||
| Queensland | 3 | 8 | 2 | 1,139,035 | 631,246 | 318,951 | 245,971 | 1,410,014 | 3,745,217 | 1,026,665 | 8,825 | 442,779 | 1,478,269 | 28105684 | .. | .. | 9 | 7 | 2,120,071 | 2,504,692 | 167,620 | 214,317 | 5,066,700 | .. | 4 | 4 | ||||||||
| New South Wales | 2 | 9 | .. | 1,895,656 | (2)2,037,168 | 648,993 | 720,984 | 4,250,761 | 9,553,562 | (2)1,190,502 | 21,971 | 1,646,746 | 2,859,219 | 48425333 | .. | .. | 3 | 5 | 8,628,007 | 10981721 | 663,325 | 2,341,951 | 22615004 | .. | .. | 4 | ||||||||
| Victoria | 3 | 4 | .. | 1,548,145 | 2,599,694 | 709,328 | 710,477 | 4,078,093 | 9,645,737 | 2,933,087 | 820,918 | 820,918 | 3,754,005 | 41443216 | .. | .. | .. | 5 | 9,607,193 | 8,525,759 | 1,320,919 | 3,500,144 | 22954015 | .. | .. | 5 | ||||||||
| South Australia | 2 | 4 | 4 | 753,289 | 567,663 | 181,996 | 107,608 | 968,702 | 2,579,258 | 475,638 | 58,561 | 358,068 | 892,267 | 20401500 | .. | .. | .. | 8 | 2,483,416 | 4,803,876 | 315,298 | 660,083 | 8,262,673 | .. | .. | 6 | ||||||||
| Western Australia | 4 | .. | 7 | 71,775 | 62,270 | 36,609 | 11,494 | 219,589 | 401,737 | 5,153 | 858 | 70,255 | 76,266 | 1,367,444 | 85,106 | .. | .. | 1 | 415,149 | 361,839 | 79,164 | 18,295 | 874,447 | .. | 7 | 8 | ||||||||
| Tasmania | 3 | 3 | 3 | 223,652 | 110,227 | 67,754 | 41,458 | 279,655 | 722,746 | 1,394,483 | 161,285 | 72,513 | 1,628,281 | 6,432,800 | 124,804 | .. | 8 | 4 | 680,760 | 1,154,236 | 26,591 | 35,925 | 1,897,512 | .. | 4 | 0 | ||||||||
| New Zealand | 3 | .. | 0 | (10)1,640,289 | 725,332 | 257,685 | 397,885 | 1,060,375 | (10)4,081,566 | 187,228 | 71,371 | 140,218 | 398,817 | 38802350 | 1,407,604 | .. | .. | 4 | 4,221,270 | 1,087,593 | 397,941 | 553,721 | 6,260,525 | .. | 1 | 8 | ||||||||
| Colonies. | Trade-continued. | Shipping. | Railways. | Electric Telegraph. | Live Stock. | |||||||||||||||||||||||
|---|---|---|---|---|---|---|---|---|---|---|---|---|---|---|---|---|---|---|---|---|---|---|---|---|---|---|---|---|
| Value of Exports to | Value of Exports per Head of Mean Population. | Value of Exports the Produce and Manufacture of the Colony. | Inwards. | Outwards. | No. of Miles of Lines open on 31st December. | No. of Miles of Lines in Construction on 31st December. | No. of Miles of Line on 31st December. | No. of Miles of Wire on 31st December. | Horses. | Cattle. | Sheep. | Pigs. | ||||||||||||||||
| Sailing Vessels. | Steam Vessels. | Sailing Vessels. | Steam Vessels. | |||||||||||||||||||||||||
| United Kingdom. | Australian Colonies. | Other British Possessions. | Foreign States. | Total | No. | Tonnage. | No. | Tonnage. | No. | Tonnage. | No. | Tonnage. | Open. | Being Made. | Open. | Being Made. | ||||||||||||
| £ | £ | £ | £ | £ | £ | .. | .. | £ | ||||||||||||||||||||
| Queensland | 2,365,673 | 6,104,854 | 68,723 | 15,262 | 8,554,512 | .. | .. | 7 | 8,412,244 | 616 vessels, 468,607 tons. | 606 vessels, 442,172 tons. | 2,142 | (11)601 | 9,830 | .. | 17,437 | .. | 365,812 | 5,558,264 | 18007234 | 96,836 | |||||||
| New South Wales | 6,623,431 | 11284740 | 674,201 | 3,463,565 | 22045937 | .. | 0 | 0 | 17232725 | 770 | 580,995 | 2,119 | 1,832,252 | 748 | 526,063 | 2,029 | 1,822,562 | 2,263 | 151 | 11,231 | 266 | 23,698 | 501 | 444,163 | 1,909,009 | 55986431 | 284,453 | |
| Victoria | 6,850,014 | 4,064,106 | 817,704 | 1,534,398 | 13266222 | .. | .. | 3 | 10291821 | 594 | 391,851 | 1880 | 1,786,700 | 600 | 396,437 | 1859 | 1,788,353 | 2,688 | 212 | (12)6,958 | .. | (12)13,499 | .. | 436,459 | 1,782,978 | 12736143 | 282,457 | |
| South Australia | 4,296,647 | 3,532,341 | 719,937 | 278,453 | 8,827,378 | .. | 6 | 9 | 4,410,062 | 378 | 239,744 | 663 | 835,389 | 405 | 266,218 | 676 | 849,091 | 1,610 | .. | 5,623 | .. | 12,177 | 227 | 187,686 | 359,938 | 7,004,642 | 116,277 | |
| Western Australia | 335,162 | 188,433 | 89,753 | 58,464 | 671,812 | .. | .. | .. | 659,661 | .. | 34,655 | 204 | 449,879 | .. | 29,377 | 192 | 390,950 | 513 | 290 | 2,920 | 516 | 3,546 | 516 | 44,384 | 130,970 | 2,524,913 | 28,985 | |
| Tasmania | 323,239 | 1,163,193 | .. | 560 | 1,486,992 | .. | 6 | .. | 1,430,806 | 248 | 50,619 | 498 | 425,009 | 254 | 48,419 | 509 | 427,210 | 399 | .. | 2,004 | 120 | 3,060 | 120 | 31,165 | 162,440 | 1,619,256 | 81,716 | |
| New Zealand | 7,401,350 | 1,634,248 | 75,576 | 700,546 | 9,811,720 | .. | .. | 1 | 9,428,761 | 445 | 257,668 | 299 | 405,101 | 452 | 254,253 | 293 | 395,452 | 1842 | 132 | 5,060 | .. | 12,771 | .. | (13)211,040 | (13)831,831 | (13)18,117,186 | (13)314,644 | |
| Colonies. | Agriculture, 1890-91. | ||||||||||||||||||||||
|---|---|---|---|---|---|---|---|---|---|---|---|---|---|---|---|---|---|---|---|---|---|---|---|
| No. of Cultivated Holdings over one Acre in Extent. | Acreage of land in Crop. | Acreage of Land broken up but not under Crop. | Acreage of Land in Sown Grasses. | Total Acreage of Land in Cultivation. | Principal Crops. | ||||||||||||||||||
| In Wheat | In Oats. | In Barley. | In Maize. | In Hay. | In Potatoes. | ||||||||||||||||||
| Land. | Produce. | Yield per Acre. | Land. | Produce. | Yield per Acre. | Land. | Produce. | Yield Per Acre. | Land. | Produce. | Yield per Acre. | Land. | Produce. | Yield per Acre. | Land. | Produce. | Yield per Acre. | ||||||
* Where no information has been supplied asterisks have been inserted. (1) By sea or overland. (2) Includes tramways. (3) The aboriginal population of Victoria and New South Wales is included in the numbers given in the table. It was estimated at the time of the census (1881) that there were 781 abori colonies, for which the census returns of 1881 gave the following estimates of the native population: In Queensland, 20,585 persons; in South Australia, 6,346 in the settled districts. (4) By sea only. (5) The revenue and expenditure for Victoria are for the year ended the 30th June. (6) Exclusive of 22,633 Maoris. (7) Exclusive of 18,890 Maoris. (8) Exclusive of 41,523 Maoris. (9) This amount is not the true taxation for the year, on account of the property-tax being collected in the latter part of one calendar year and the beginning of another. The taxation for year's property-tax only. It is impossible to ascertain the exact amount of taxation on account of revenue from various sources being collected by means of one sort of stamp, and postage (10) Exclusive of charges for sinking fund, met by debentures issued to an equivalent amount. (11) Includes lines authorised. (12) Includes 2,958 miles of line and 4,779 miles of wire under control of Railway Department. (13) Figures taken from census returns of 1891. | |||||||||||||||||||||||
| Queensland | * | 224,993 | 14,625 | 22,252 | 261,870 | 10,390 | 207,990 | 20.02 | 411 | 8,967 | 21.82 | 584 | 12,673 | 21.7 | 99,400 | 2,873,803 | 28.91 | 31,106 | 50,116 | 1.61 | 8,994 | 28,810 | 3.20 |
| New South Wales | * | 872,344 | 260,627 | 385,504 | 1,518,475 | 333,233 | 3,649,216 | 10.95 | 14,103 | 256,659 | 18.2 | 4,937 | 81,383 | 16.48 | 191,152 | 5,713,205 | 29.89 | 175,242 | 213,034 | 1.22 | 19,406 | 52,791 | 2.72 |
| Victoria | 36,008 | 2,031,935 | 385,572 | 235,241 | 2,652,748 | 1,145,163 | 12751295 | 11.13 | 221,048 | 4,919,325 | 22.25 | 87,751 | 1,571,599 | 17.91 | 10,357 | 574,083 | 55.43 | 413,043 | 567,746 | 1.37 | 53,818 | 204,155 | 3.79 |
| South Australia | * | 2,093,515 | 534,152 | 21,431 | 2,649,098 | 1,673,573 | 9,399,389 | 5.62 | 12,475 | 116,229 | 9.32 | 14,472 | 175,583 | 12.13 | .. | .. | .. | 345,150 | 310,125 | 0.90 | 6,626 | 23,963 | 3.62 |
| Western Australia | * | 69,676 | 52,356 | 23,344 | 145,376 | 33,820 | 465,025 | 13.75 | 1,933 | 37,713 | 19.5 | 5,322 | 87,813 | 16.5 | 81 | 2,146 | 26.5 | 23,183 | 26,495 | 1.14 | 510 | 1,657 | 3.25 |
| Tasmania | * | 157,376 | 158,738 | 201,060 | 517,174 | 39,452 | 642,980 | 16.3 | 20,740 | 519,395 | 25.04 | 4,376 | 99,842 | 22.8 | .. | .. | .. | 45,381 | 52,021 | 1.15 | 20,133 | 73,158 | 3.63 |
| New Zealand | 38,083 | 1,285,768 | 210,509 | 6,966,218 | 8,462,495 | 301,460 | 5,723,610 | 18.99 | 346,224 | 9,947,036 | 28.73 | 32,740 | 758,833 | 23.18 | 5,759 | 238,864 | 41.48 | 44,045 | 662,901 | 1.43 | 32,691 | 178,121 | 5.45 |