Table of Contents
List of Tables
- XXI. Table XXI. Showing the Persons on Shipboard at the different Ports of the
Colony on 3rd April, 1881.
- XXIV. [Where a locality is a Highway District in itself, the letters H.D. are
affixed, T indicates Town.]
- XIV. Table XIV. Showing the Ages of Persons, Males, and Females (exclusive of
Maoris), in each County.
Table of Contents
TO
THE HONORABLE DANIEL POLLEN, COLONIAL SECRETARY.
Registrar-General's Office, Wellington, 13th November, 1882.
SIR,—
I have now the honour to submit the complete results of the Census taken for the night of the 3rd April, 1881.
It was alleged in the House of Representatives last session that there had been delay in the completion of the Census returns. This statement was made without a knowledge of the enormous amount of work involved in the compilation of a Census, as well as of the previous delays incident to the collection in the sparsely-populated portions of the colony.
Difficulty is experienced in the first instance in obtaining suitable persons to act as Sub-Enumerators in those parts; and, generally, persons will not neglect their ordinary employments to act as Sub-Enumerators unless the work is of some magnitude. Thus it is not exceptional for the distribution and collection in a sub-district to occupy over a month, the bulk of the time being required for the collection. After the collection is made, an examination of the schedules and Sub-Enumerators' books has to be made by the Enumerator, and errors or omissions, when discovered, have to be rectified by means of the Sub-Enumerator before the returns can be sent to the central office. This occupies time, and cannot be neglected without impairing the value of the results. The returns from the whole of the Enumerators do not therefore reach the central office for a considerable time after the Census day. Some of the returns for this last Census were not received until late in June, the Census having been taken for the night of the 3rd April; but, by using the telegraph, it was found possible to publish two tables, giving an approximate statement of the population in provincial districts, counties, and boroughs, on the 14th June, or a little over two months after the Census day. A table of population in electoral districts was published on the 21st July following, and on the 5th August a return showing the population in ridings and road districts was laid before Parliament, thus enabling the Legislature in 1881 to deal with the Representation Bill that subsequently became law. On the 10th November a series of seven tables, showing final results for population and dwellings, and in April, 1882, final summary tables of seven parts of the volume, were published. Parts I. and II., complete, were presented to Parliament on the 26th May, 1882, and the delay in the publication of the subsequent parts is attributable solely to the fact that the Government Printer was unable to continue the printing during the session, or even for some time afterwards.
The New Zealand household schedule contains more particulars of information than that in use in any other country, as, in addition to the particulars of population, information has to be given thereon as to lands occupied and unoccupied, the nature of tenure, the amount of fencing, the numbers and description of live stock and poultry, the annual produce of butter and cheese, and the number of threshing and reaping machines, steam ploughs, and harrows. The tabulation of all these several items adds immensely to the work, and renders the compilation in proportion to the population much heavier than it is elsewhere.
What the amount of that work is can only be well realized by those who have had a practical acquaintance with it. The mere statement of the number of persons (approaching half a million) in respect of each of whom various items of information had to be separately tabulated gives no idea of the measure of the work, unless the various processes necessarily adopted both in the compilation, examination, and subsequent tabulation are understood. The Census staff was, with the exception of the superintending clerk, composed of extra clerks who were specially engaged for the work. The time occupied during which the staff was diligently employed, partly on piece-, partly on day-work, was from the early part of May, 1881, until the end of September, 1882, hut not necessarily the same number throughout, as in the first process of laying out the work and the final closing thereof only a limited number could he employed. At one time 17 extra clerks were employed. As many were at all times employed as the nature of the work and the accommodation available permitted, and without special office accommodation for a very large staff it was simply impossible to make more rapid progress. Although funds were available, accommodation was not, for it was essential that the clerks employed should be under immediate departmental supervision; and, as it was, clerks were distributed away from the central office in various rooms in the buildings, at much inconvenience. The progress and character of the work, if fairly considered, will bear favourable comparison with the progress made in similar work elsewhere.
The system initiated by me in 1874, and again adopted in 1878, was continued for the Census of 1881. The alteration of the system in 1874 was the cause of a large reduction in the expense of collection, the cost having been thus reduced from a little over 9d. per head in 1871 to 7d. per head in 1874. The expenditure was further contracted in 1878 to about 5¾d. per head. In 1881 the expenditure amounted to 6d. per head. This expenditure includes the entire cost of collection and of compilation in the central office. The cost was slightly higher in 1881 than in 1878, owing to the heavier travelling expenses on account of constables, who were Sub-Enumerators, having to hire horses in 1881 in districts where Government horses were used in 1878; also the expenditure incurred by the Native Department in collecting the Native Census (included in the above cost) was greater in 1881 than in 1878.
Increase of Population.—The population of the colony (exclusive of Maoris) on the 3rd April, 1881, numbered 489,933, an increase since March, 1878, of 75,521 persons, or 18.22 per cent. The rates of increase during the intervals between the last four Censuses were as follow :—
Table V., p.2.
| Between February, 1871, and March, 1874 | 16.82 per cent. |
| Between 1st March, 1874, and 3rd March, 1878 | 38.36 per cent. |
| 3rd March, 1878, and 3rd April, 1881 | 18.22 per cent |
The increase for the ten years, February, 1871, to 3rd April, 1881, was equal to 91.09 per cent, of the population in 1871.
Of the increase, 75,521, between the 3rd March, 1878, and the 3rd April, 1881, the increase by excess of births over deaths amounted to 40,773, or at the rate of 9.84 per cent, for the period. The balance, 34,748, consists of the excess of immigration over emigration during the same period.
The rates of increase from all causes varied considerably in different parts of the colony.
Tables VII. VIII., pp. 4, 5.
The actual and rateable increase or decrease in each provincial district was as follows:—
| Percentage. | Numerical. | |
|---|---|---|
| Auckland, increase | 20.31 | 16,790 |
| Taranaki, increase | 57.01 | 5,395 |
| Wellington, increase | 20.17 | 10,302 |
| Hawke's Bay, increase | 15.66 | 2,352 |
| Marlborough increase | 23.06 | 1,743 |
| Nelson | 3.77 | 947 |
| Westland, decrease | 11.35 | 1,922 |
| Canterbury, increase | 22.04 | 20,260 |
| Otago, increase | 17.13 | 19,608 |
Proportion of the Sexes.—The males in 1881 numbered 209,605, the females 220,328. The Chinese are included in these numbers. Excluding the Chinese the numbers would be 264,610 males and 220,319 females, an excess of males of 41,291. In 1878 the excess of males (exclusive of Chinese) over females was 43,169. Including Chinese there were, on the 3rd April, 1881, 100 males to every 81.72 females, the proportions in 1878 having been 100 males to 79.40 females.
The following were the proportions of the sexes in the various provincial districts in the years 1878 and 1881:—
| 1878. | 1881. | |
|---|---|---|
| Females. | Females. | |
| In Auckland—to every 100 males | 84.51 | 83.79 |
| Taranaki—to every 100 males | 82.93 | 74.45 |
| Wellington—to every 100 males | 83.19 | 87.58 |
| Hawke's Bay—to every 100 males | 76.46 | 79.04 |
| Marlborough—to every 100 males | 76.44 | 77.18 |
| Nelson—to every 100 males | 74.68 | 76.18 |
| Westland—to every 100 males | 60.08 | 65.40 |
| Canterbury—to every 100 males | 82.30 | 85.15 |
| Otago—to every 100 males | 76.51 | 79.52 |
Table X., p.6.
The proportion of females to males was thus less in the Districts of Auckland and Taranaki in 1881 than in 1878—due not to a reduction in the number of females, but to a larger increase in the male than in the female population. In each of the other districts of the colony the proportion of females to males was greater in 1881 than in 1878. In Westland this increase in the proportion, amounting to 5.32 females per 100 males, is attributable not to an increase of females, for the actual number decreased from 6,355 to 5,935, but to a larger decrease of males than females, the males having numbered 10,577 in 1878, and 9,075 in 1881.
Table V., p.2.
In Nelson, Westland, and Otago the numbers of Chinese are sufficiently large to materially disturb these proportions. If, therefore, the Chinese are excluded from the calculations, the proportion of females to 100 males in 1878 and 1881 respectively would appear thus:—
| 1878. | 1881. | |
|---|---|---|
| Nelson—to every 100 males | 75.45 | 78.58 |
| Westland—to every 100 males | 65.19 | 71.34 |
| Otago—to every 100 males | 80.55 | 83.36 |
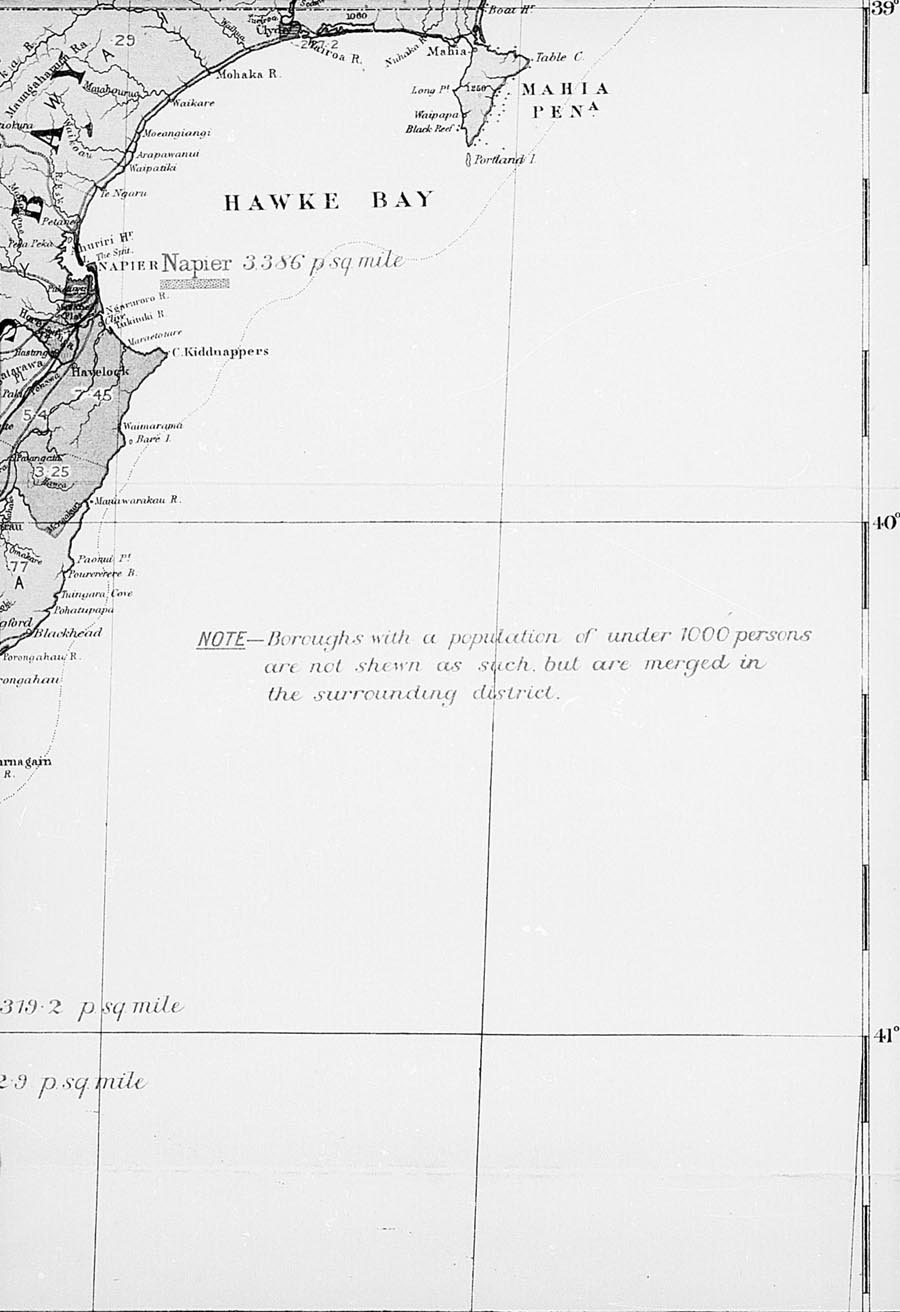
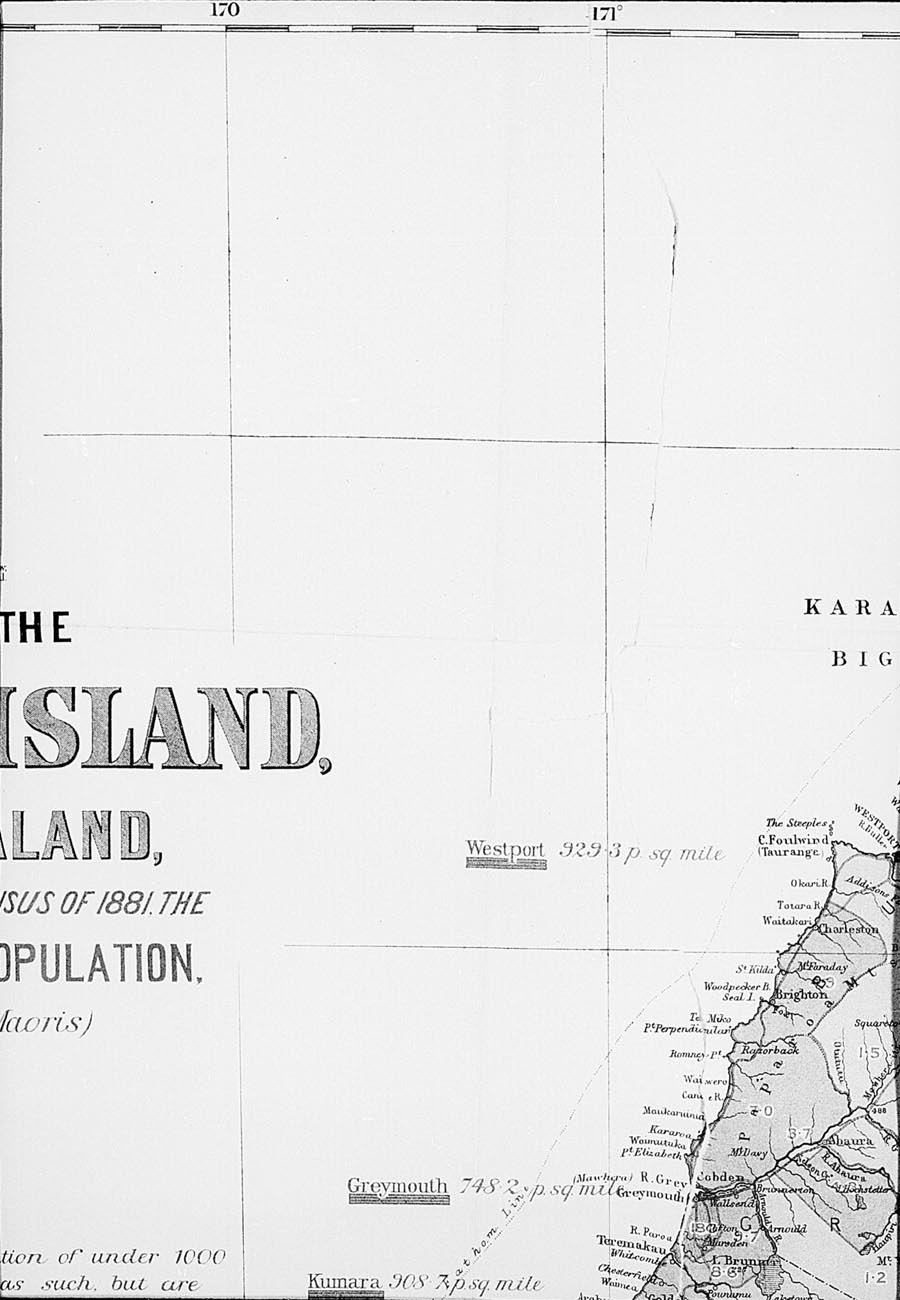
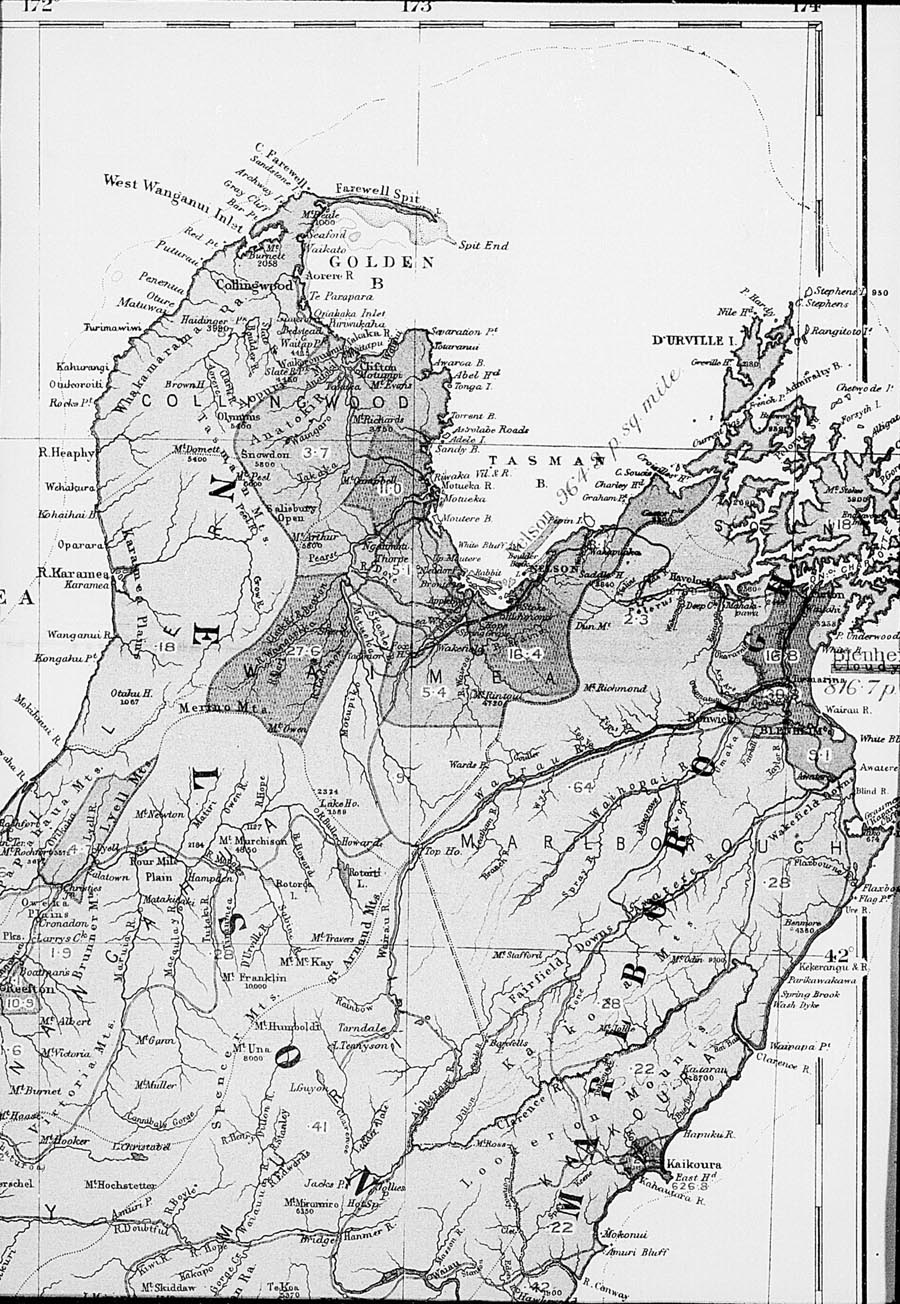
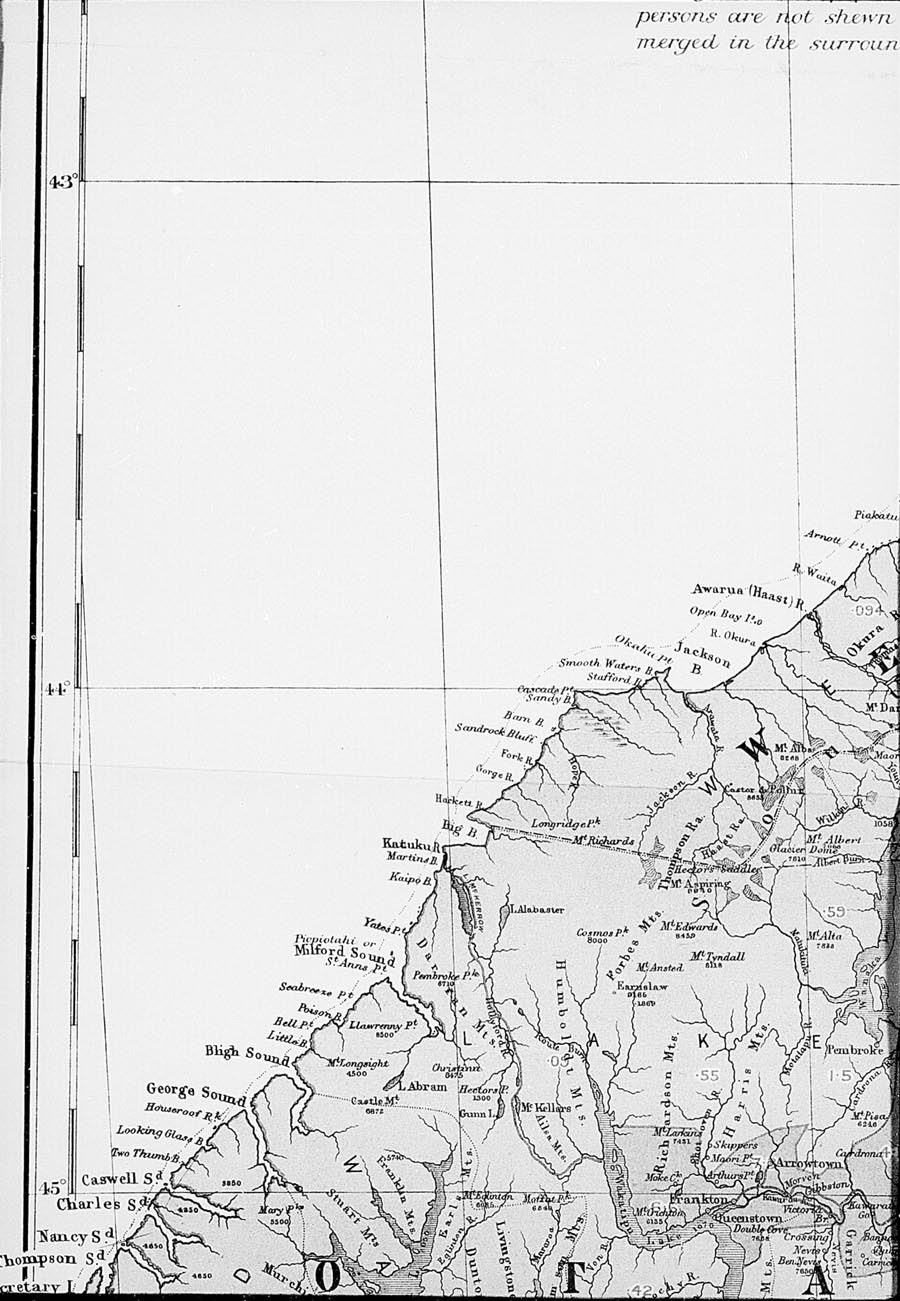
Density of Population.—The estimated number of the population was on an average 4.693 persons per square mile; but, as 187,439 persons dwelt in defined boroughs or towns having a population in excess of 1,000 persons, the total population residing outside such boroughs or towns gave an average of 2.89 persons to the square mile.
Table XI, p. 6.
The above number of 187,439 may therefore be defined as the urban population, and the rest of the population, or 302,494, being all those who do not reside in defined towns of over 1,000 inhabitants, as suburban. It cannot be doubted that some of the population residing in townships of less than 1,000, or in the suburbs of the larger towns, can hardly be classed as a rural population ; but, on account of the difficulty experienced in distinguishing between the urban and rural population in the smaller towns and in undefined suburbs, the limit of 1,000 of population has been taken.
The Commissioners for the Imperial Census have made a population of 3,000 a limit, and included the population of towns not having that number among the suburban population.
The average number of persons to an inhabited dwelling throughout the colony was 5.12 in 1881, against 5.02 in 1878, 4.88 in 1874, and 4.48 in 1871. While the total population of the boroughs in existence in 1878 has increased 19.59 per cent, the inhabited houses have only increased 17.10 per cent. Of the whole population of the colony (exclusive of Maoris and Chinese) the number who—
Table XIII., p. 7.
| In 1878. | In 1881. | |
|---|---|---|
| Resided in houses of good materials were | 377,380, or 92.05 per cent. | 450,586, or 92.92 per cent. |
| Resided in cob or sod houses, raupo and other huts, &c. | 23,887, or 5.83 per cent. | 25,495, or 5.25 per cent. |
| Resided in tents or dwellings with canvas roofs | 5,566, or 1.36 per cent. | 5,905, or 1.22 per cent. |
| Were on shipboard | 3,017, or 0.73 per cent. | 2,862, or 0.59 per cent. |
| Were camping out | 129, or 0.03 per cent. | 81, or 0.02 per cent. |
Table III., p. 1.
Dwellings: Number and Character.—The number of inhabited dwellings in 1881 was 95,750, against 82,588 in 1878, an increase of 13,162.
The following table will show the increase since 1878 in the various dwellings, classified according to the number of rooms they contain:—
Table XV., p.10.
| — | Number of Dwellings containing | |||||
|---|---|---|---|---|---|---|
| One Room, including Tents. | Two Rooms. | Three and Four Rooms | Five and Six Rooms. | More than Six Rooms | No. of Rooms not given. | |
| 1878 | 9,703 | 14,331 | 29,223 | 15,258 | 12,358 | 1,715 |
| 1881 | 10,077 | 14,758 | 35,061 | 19,338 | 15,314 | 1,169 |
| Increase | 374 | 427 | 5,841 | 4,080 | 2,986 | … |
| Decrease | … | … | … | … | … | 546 |
The largest increase was in houses having three and four rooms. The increase amounted to 42.61 per cent, of the total increase of the inhabited houses of which the number of rooms was specified; and the dwellings in that class amounted to 36.6 per cent, of the total inhabited dwellings, against 35 per cent, in 1878. Dwellings having five and six rooms amounted to 20.2 per cent, of the total dwellings in 1881, against 18.4 in 1878; and superior dwellings, having more than six rooms, were 16 per cent, of the whole number, against 14.9 in 1878.
The inhabited houses of brick, stone, or concrete amounted to 3,752, or 3.91 per cent, of the total dwellings, against 3,001, or 3.63 per cent., in 1878.
In Otago the dwellings of this character comprise 8.57 per cent, of the total dwellings, in Canterbury 4.39 per cent., and in the Auckland Provincial District 2.38 per cent. In the other districts the percentage was very small.
The number of inhabited tents and dwellings with canvas roofs was slightly less than in 1878, viz., 2,917 in 1881, and 2,931 in 1878. The percentage to the total dwellings was 304 in 1881, against 3.55 in 1878.
Uninhabited Dwellinghouses.—The number of uninhabited dwellinghouses was 6,737 in 1881, against 5,292 in 1878. The increase in the uninhabited dwellings was not due to the undue increase in the number of houses built, as there were only 20.92 inhabited and uninhabited dwellings and houses to the 100 of population in 1881, against 21.20 in 1878. It is thus evident that in numerous instances a larger number of persons lived in one house in 1881 than in 1878, due probably to the depression in trade then existing, more houses being thus left empty. This is also borne out by the fact that there were on an average 5.12 persons to the inhabited dwelling in 1881, against 5.02 in 1878.
Table XV., p. 10.
Dwellinghouses building.—It is noticeable that while there was actual numerical increase in the uninhabited dwellings in 1881 as compared with 1878, yet the number of dwelling-houses in course of erection should be 848 in 1881, or 71 per cent, more than they were (497) in 1878. The examination of the number of houses being built and those uninhabited in 1878 and 1881 respectively in each provincial district show varying evidences of progress during the interval. Thus, while in the Wellington District the houses building fell in number from 118 in 1878 to 67 in 1881, the number of uninhabited houses increased from 536 in 1878 to 1,069 in 1881; in Auckland, on the contrary, the number of houses building was nearly five times as great in 1881 as in 1878, yet the number of uninhabited houses remained stationary.
Table XV., p. 10.
| Provincial Districts. | Houses Building. | Houses Uninhabited. | ||
|---|---|---|---|---|
| 1878. | 1881. | 1878. | 1881. | |
| Auckland | 73 | 359 | 1,261 | 1,260 |
| Taranaki | 12 | 32 | 137 | 172 |
| Wellington | 118 | 67 | 536 | 1,069 |
| Hawke's Bay | 13 | 20 | 169 | 181 |
| Marlborough | 12 | 12 | 120 | 100 |
| Nelson | 21 | 36 | 466 | 414 |
| Westland | 15 | 9 | 383 | 458 |
| Canterbury | 101 | 154 | 835 | 1,391 |
| Otago | 129 | 159 | 1,385 | 1,659 |
| Chatham Islands | 3 | … | … | … |
| Total | 497 | 848 | 5,292 | 6,737 |
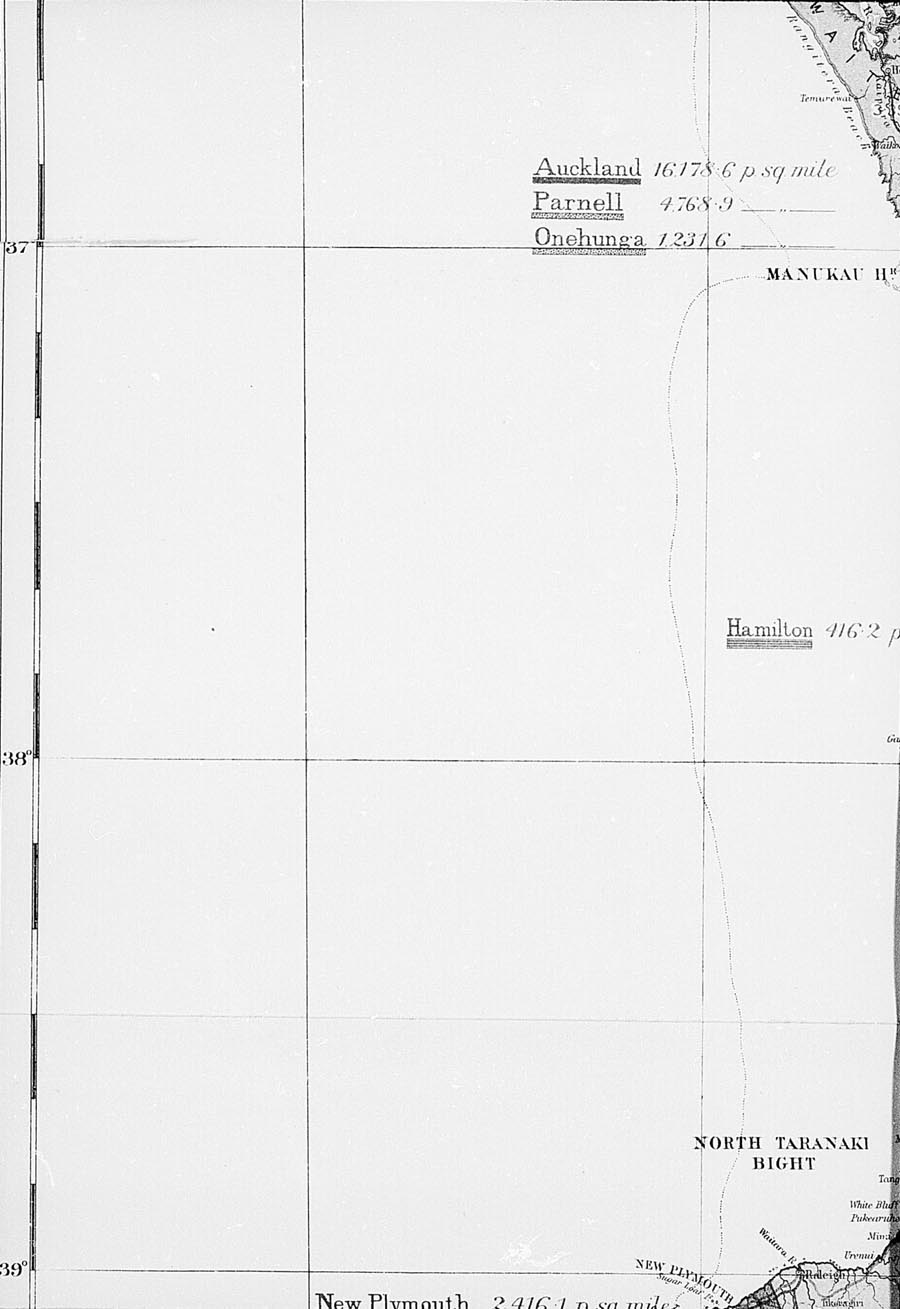
Boroughs and Towns.—The number of boroughs and towns amounted in 1881 to 169. Of these—
Table XIV., p.7.
| 75 had a population exceeding | 500 | persons. |
| Of these, 2 had a population exceeding | 20,000 | |
| 2 had a population between | 15,000 | and 20,000 |
| 4 had a population between | 5,000 | and 10,000 |
| 18 had a population between | 2,000 | and 5,000 |
| 20 had a population between | 1,000 | and 2,000 |
| 29 had a population between | 500 | and 1,000 |
The principal towns or boroughs were—
| In 1881. | In 1878. | |
|---|---|---|
| Dunedin | 24,372 | 22,525 |
| Wellington | 20,563 | 18,953 |
| Auckland | 16,664 | 13,758 |
| Christchurch | 15,213 | 13,425 |
The real relative importance of these boroughs as centres of population cannot be well compared unless the immediate suburban population be also taken into account. The suburbs of some of them constitute practically extensions of the central borough, although in some cases defined as separate boroughs.
The population of Auckland and the suburbs amounts to 30,952, as follows :—
| Auckland Borough | 16,064 |
| Archhill Road District | 1,011 |
| Newton-Richmond Road District | 204 |
| Ponsonby Road District | 4,011 |
| Eden Terrace Road District | 543 |
| Grafton Road District | 1,439 |
| Karangahape Road District | 3,551 |
| Parnell Borough | 3,529 |
| Total, Auckland and suburbs | 30,952 |
The suburbs of Christchurch consist of the adjoining Borough of Sydenham and that portion of the Electoral District of Christchurch not included in boroughs. The total population in 1881 amounted to 30,715:—
| Christchurch Borough | 15,213 |
| Sydenham Borough | 8,460 |
| Part of electoral district not in boroughs | 7,042 |
| Total | 30,715 |
The suburbs of Dunedin have been constituted as several distinct boroughs forming a group round the centre, Dunedin. The aggregate population amounted in 1881 to 42,794, distributed as follows:—
| Dunedin Borough | 24,372 |
| Caversham Borough | 3,989 |
| Roslyn Borough | 2,875 |
| Mornington Borough | 2,886 |
| Maori Hill Borough | 1,136 |
| St. Kilda Borough | 773 |
| South Dunedin Borough | 2,796 |
| West Harbour Borough | 1,213 |
| North-East Valley Borough | 2,754 |
| Total | 42,794 |
Of the 189,933 persons enumerated on the 3rd April, 1881, the ages of 488,601 were specified ; of these, 17,954, or 3.67 per cent., were under one year of age ; of these, 9,209 were males and 8,745 were females. The total number under 5 years amounted to 82,289, or 16.84 per cent; of these, 41,636 were males and 40,653 females. Thus, while there were 105.3 males to every 100 females under 1 year of age, the total numbers under 5 years of age averaged 102.4 males to 100 females. The numbers at the ages 5–15 were, males 63,180, females 62,357, a total of 125,537, or 25.69 per cent, of the whole population. 50,948 persons, viz., 25,225 males and 25,723 females, were between the ages of 15 and 21; 141,769 persons, of whom 82,349 were males and 59,420 were females, were between 21 and 40 years of age. Males predominated in number at all ages except at the period from 15 to 21, the number of females at those ages being slightly in excess of the number of males.
Table I., p.61.
The proportions of the sexes at each age-period under 21 at the Censuses of 1878 and 1881 are given herewith: —
| 1878. | 1881. | ||
|---|---|---|---|
| Males. | Females. | Females. | |
| Under 1 year | 100 | 95.93 | 94.96 |
| Under 5 years | 100 | 97.06 | 97.64 |
| 5–10 years | 100 | 99.74. | 97.97 |
| 10–15 years | 100 | 97.81 | 99.81 |
| 15–21 years | 100 | 100.73 | 101.97 |
The total population under 21, including 130 persons, evidently children, whose ages were not given, amounted to 258,774 persons, or 52.82 of the whole population, against a similar percentage of 51.94 in 1878, and 50.29 in 1874. The males under 21, including 72 male children of unspecified ages, amounted to 130,113, or 48.26 of the males living, against a similar percentage in 1878 of 46.91. The females under 21, including 58 children of unspecified ages, amounted to 128,791, or 58.45 per cent, of the females living, against a similar percentage of 58.27 in 1878. At the ages 21–40 there were 82,349 males to 59,420 females; at 40–55 years of age there were 43,624 males to 23,380 females; at the ages 55–05 there were 8,664 males to 5,495 females; at the higher ages, 3,957 males to 2,938 females.
The ages of 898 males and 304 females, who were evidently adults, were not given. The male population between 21 and 40 years of age increased from 75,759 in 1878 to 82,349 in 1881, or a numerical increase of 6,590 ; but in 1881 the males at these ages comprised 30.65 per cent, of the total males of specified ages, against 32.99 per cent, in 1878, or a decrease in the proportions at those ages of 2.31 per cent., while there was an increase in the proportions of males under 21 and over 40 years of age.
The females at the ages 21–40 were also proportionately more numerous in 1878 than in 1881. In the former year hey comprised 28.07 per cent, of the female population, in 1881 only 27.01 per cent. The females at the ages 21–40 numbered 59,420, the males 82,349 ; thus, at the ages 21–40, to every 100 males there were only 72.15 females. In 1878 the proportion was 100 males to 67.80 females.
Population at Supporting Ages.—e proportion of the population at the supporting ages, Viz., from 15–05, is gradually diminishing. The numerical increase of this part of the population since the Census of 1878 was 40,973; but this increase, although numerically greater, is proportionately less than the respective increases at the younger and older age-periods. The number of the population at the ages 15—65 has been abnormally high, owing to the large immigration of persons within that age-period.
Table I., p.61.
The following were the numbers per 10,000 of the population at each of the Census years 1874, 1878, and 1881 —
| Ages. | 1874. | 1878. | 1881. |
|---|---|---|---|
| Under 15 years | 4,150 | 4,222 | 4,244 |
| 15–65 years | 5,728 | 5,649 | 5,615 |
| 65 years and upwards | 122 | 129 | 141 |
| 10,000 | 10,000 | 10,000 |
The following table shows the numbers at each of the three age-periods at the Census of 1878 and 1881, and the numerical and centesimal increase. The adults of unspecified ages have all been included as between 15 and 65; the numbers therefore will not exactly agree with the numbers given for the specified ages in the tables given in Part II. of the volume:—
| Ages. | 1878. Numbers. | 1881. Numbers. | 1878–81. Numerical Increase. | 1878–81. Increase per Cent. |
|---|---|---|---|---|
| Under 15 years | 174,968 | 207,956 | 32,988 | 18.85 |
| 15–65 years | 234,109 | 275,082 | 40,973 | 17.50 |
| 65 years and upwards | 5,335 | 6,895 | 1,560 | 29.24 |
| All ages | 414,412 | 489,933 | 75,521 | 18.22 |
The Chinese numbered 5,004, of whom 9 were females. The ages of 4,920 of the males and of all the females were given. Of these, 12 males and 4 females were under 15 years of age, and 7 males were given as over 15 years of age.
Of the 264,106 males (exclusive of Maoris and Chinese) in the colony on the 3rd April, 1881, whose conditions were specified, 185,911, or 70.39 per cent., were unmarried. Of these, 125,818 were under 20 years of age, and 60,123 were over 20. The proportion of unmarried males (70.39) is somewhat greater than in 1878 (70.09), but this is owing to the larger proportion of mules under 20 to the total of males in 1881 than in 1878. In 1878 the males under 20 amounted to 46.25 per cent, of the males of specified ages, but in 1881 they amounted to 17.56 per cent. Of the 220,281 females whose ages were specified, 140,181, or 63.64 per cent., were unmarried; of these, 103,058 were under 15 years of age, and 37,126 were over 15. There were thus 00,123 bachelors over 20 years of age to 37,126 spinsters over 15 years of age, or 102 bachelors to 100 spinsters. In 1878 the proportion was 191 bachelors to 100 spinsters. Out of the 37,126 spinsters, 20,309 were from 15 to 20 years of age, 10,170 from 20 to 25 years of age, and 6,617 over 25 years of age.
Tables I. to IV., pp. 89–90.
In 1881 the husbands numbered 73,261 and the wives 72,804 ; the excess of husbands over wives being 157. In 1878 the number of husbands in excess of wives was 515.
The widows numbered 7,296, and the widowers 4,964 ; there having been 2,332 more widows than widowers. Widows were more numerous at every age-period, but the inequality in numbers was greatest at the younger age-periods. There was a progressive diminution in the proportional excess of widows from the ages 20–25 to the ages 45–50, when the numbers were most nearly equalized—viz., in the proportion of 117 widows to 100 widowers. After that age-period the excess of widows progressively increased to the age of 70 years, after which it again diminished. The proportion of widows to widowers was greater in 1881 than in 1878. The following were the proportions at the periods stated :—
| 1874. | 1878. | 1881. | |
|---|---|---|---|
| Ages. | Widowers. | Widowers. | Widowers. |
| Under 30 years, to every 100 widows | 39 | 45 | 43 |
| 30 to 50 years to every 100 widows | 95 | 78 | 69 |
| 50 years and upwards to every 100 widows | 78 | 73 | 69 |
In the twelve months ending the 30th September, 1881, there were 18,308 legitimate births. The number of married women on the 3rd April, 1881, who were not over 45 years of age, amounted to 57,467. This may, therefore, be taken as the mean number for the whole of the twelve months specified. The legitimate births thus were on an average 1 per annum to every 3.14 married woman, or, in other words, there is on an average 1 birth to every married woman every 3.14 years. The rate in England, based upon the Census numbers of 1871, was given as 1 birth for every 3.48 years. The married women between the ages of 15 and 45 are, on the average, younger than married women in the same age-period in England, although not so young as in former Census years, as shown by the following table: —
PROPORTION TO THE 100 MARRIED WOMEN AT THE AGES 15 TO 45.
| Ages. | England. | New Zealand. | ||
|---|---|---|---|---|
| 1871. | 1874. | 1878. | 1881. | |
| Under 20 years | 1.33 | 2.37 | 2.44 | 2.14 |
| 20–40 years | 80.01 | 83.70 | 82.39 | 81.10 |
| 40–45 years | 18.66 | 13.93 | 15.17 | 10.76 |
| 100.00 | 100.00 | 100.00 | 100.00 | |
Conjugal Condition of the Chinese.—70 Chinese males were returned as having wives in the colony, as the instructions in the household schedules were that Chinese were to be set down as unmarried, unless they had wives in the colony. As there were only 3 Chinese married females in the colony, it would appear that 67 Chinese are married to females other than those of their own nationality. The number of Chinese similarly returned as married in 1878 was 71, so that no progress has been apparently made in the interval towards the settlement of Chinese as part of the permanent population of the colony.
Information was required to be given on the Census schedule as to whether the person named therein could both read and write, could read only, or was not able to read. No information on tins subject was obtainable in respect of 2,225 persons out of a total of 484,929 persons, exclusive of Chinese.
Table III., p. 137.
The Chinese have not been included in the tables relating to education. The instruction in the Census schedules was that only those Chinese who could read or write English were to be returned as being able to read or write. Of the 5,004 Chinese in the colony at the time of the Census, 102 males and 2 females were returned, in accordance with those instructions, as being able to read and write, and 11 males and 1 female as being able to read only.
Of the whole population (exclusive of Chinese and Maoris) 23.05 per cent, could not read. This high percentage is caused by the number of children under 5 years of age, for the percentage of those above 5 years of age who cannot read was only 7.52. Of the children between 5 and 10 years of age, 20,818, or 30.83 per cent, of the total number at those ages, could not read; from 10 to 25 the proportions unable to read were lowest, viz., 10–15 years, T72 per cent.; 15–20 years, 1.31 per cent.; and 20–25 years, 1.78 percent. The percentage of those who could not read of those living at each quinquennial age-period increased regularly, until at the ages 60–65 it amounted to 6.22 per cent.
The largest proportion of persons able to read and write of those living at any specified age was of those between 15 and 20 years of age, the proportions having been 97.48 per cent. 97.00 per cent, of the males and 97.93 per cent, of the females living between the ages of 15 and 20 were able to read and write. After 20 years of age the proportion able to read and write decreased with age, although not at an even rate. The proportion of females able to read and write was, at each age under 20 years, higher than the similar proportion of males. After 20 years of age the proportion of males able to read and write was greater than the proportion of females, the difference increasing according to age: thus, at the ages 20–25, the proportions were—of males, 96.76 per cent.; of females, 90.74 per cent.; but at the ages 70–75 the proportions were—of males, 88.61, and of females, 80.51.
Of the male population over 5 years of age, 87.08 per cent, could read and write, and of the female population above 5 years of age, 84.61 per cent.
There is a considerable difference in the proportion of the population between 5 and 15 years of age able to read and write in the various provincial districts, although there is a close approximation in the proportion at all ages over 15.
Table VII., p. 141
| Provincial Districts. | Proportion per 100 of Children between 5 and 15 Years of Age able to Read and Write. | Proportion per 100 Persons over 15 Years of Age able to Read and Write. |
|---|---|---|
| Auckland | 69.78 | 93.30 |
| Taranaki | 67.28 | 93.55 |
| Wellington | 68.61 | 93.51 |
| Hawke's Bay | 65.80 | 92.88 |
| Marlborough | 61.94 | 93.54 |
| Nelson | 69.36 | 94.13 |
| Westland | 73.38 | 94.07 |
| Canterbury | 68.76 | 93.56 |
| Otago | 67.57 | 95.09 |
The urban population has a larger proportion of persons above the age of 5 years able to read and Write than has the suburban population.
The percentage of the borough population above the age of 5 years able to read and write was 87.94, and of that unable to read, 6.36. The similar percentages of the population outside the boroughs were respectively 84.66 and 8.30, showing a difference of 3.28 per cent, more in the boroughs able to read, and .1.94 per cent. fewer unable to read. The proportion of males able to read and write was in each case greater than that of the females ; but the difference was greater in the suburban than in the urban population. In the latter, 88.80 per cent, of the males and 87.06v per cent of the females over 5 years could read and write, but in the suburban population 80.07 per cent, of the males and only 82.69 per cent, of the females could read and write.
Table VI., p. 140.
Attendance at School.—In 1881, 87,811 children were returned as attending Government schools, against 62,866 in 1878; 13,538 as attending private schools in 1881, against 14,611 in 1878; and 78,891 attending Sunday schools in 1881, against 62,273 in 1878. Thus, while the numbers attending Government schools increased during the three years 39.68 per cent., the numbers attending private schools decreased 7.34 per cent.
Table VIII., p. 142.
The population between 5 and 15 years of age increased between the Census of 1878 and that of 1881 from 105,235 to 125,527, or at the rate of 19.27 per cent.; during the same period the number of children attending both Government and private schools has increased from 77,477 in 1878 to 101,319 in 1881, or at the rate of 30.81 per cent. The proportion of children attending school to the number of children from 5 to 15 years of age is much greater than in 1878. The progress in the education of the children, as evinced by that proportion, is more clearly shown if a comparison be made with the returns of 1874. In 1874 the number of children attending school was equal to 66.78 per cent, of the population between 5 and 15 years; in 1878 to 73.64 per cent.; and in 1881 to 80.76 per cent. The proportion varies in different parts of the colony: thus, while in Marlborough the proportion was only 65.70 per cent., in Westland it was 94.37 per cent, (the children there are, however, comparatively few in number), and in Canterbury, 82.04 per cent. The subjoined table gives these various heads of information for each provincial district:—
Table VIII., p.142.
| Provincial Districts. | Population 5–15. | Increase. | Numbers attending School. | Increase. | Proportion of Children attending School to Total Children, 5–15. | ||||||
|---|---|---|---|---|---|---|---|---|---|---|---|
| 1878. | 1831. | Numerical. | Centesimal. | 1878. | 1881. | Numerical. | Centesimal. | 1874. | 1878. | 1881. | |
| Total Provincial Districts | 105,208 | 125,489 | 20,281 | 19.28 | 77,477 | 101,349 | 23,872 | 30.81 | 66.78 | 73.64 | 80.76 |
| Auckland | 21,820 | 25,859 | 4,033 | 18.48 | 16,531 | 20,609 | 4,138 | 25.03 | 67.90 | 75.74 | 79.93 |
| Taranaki | 2,452 | 3,624 | 1,172 | 47.79 | 1,032 | 2,097 | 1,065 | 65.25 | 52.06 | 66.56 | 74.42 |
| Wellington | 12,495 | 15,476 | 2,981 | 23.85 | 8,912 | 12,210 | 3,298 | 37.00 | 66.93 | 71.32 | 78.89 |
| Hawke's Bay | 3,655 | 4,257 | 602 | 16.47 | 2,213 | 3,348 | 1,135 | 51.29 | 55.97 | 60.54 | 78.64 |
| Marlborough | 1,957 | 2,382 | 425 | 21.71 | 1,239 | 1,565 | 326 | 26.31 | 51.54 | 63.31 | 65.70 |
| Nelson | 6,163 | 6,663 | 500 | 8.11 | 4,508 | 5,363 | 855 | 18.96 | 71.23 | 73.15 | 80.49 |
| Westland | 3,652 | 3,731 | 79 | 2.16 | 3,328 | 3,521 | 193 | 5.80 | 67.58 | 91.13 | 94.37 |
| Canterbury | 23,611 | 28,914 | 5,303 | 22.46 | 18,064 | 23,722 | 5,658 | 31.32 | 68.82 | 70.51 | 82.04 |
| Otago | 29,397 | 34,583 | 5,186 | 17.64 | 21,050 | 28,254 | 7,204 | 34.22 | 66.33 | 71.01 | 81.70 |
The birthplaces were given of 489,100 persons, out of a total of 489,933. Of the 833 persons whose birthplaces were unspecified, 442 had British names and 24 had foreign names. The names of 367 were not given.
Allegiance.—The number of British subjects was 471,726, or 96.28 per cent, of the population. All persons born in British possessions, all naturalized British subjects, and persons having British names who were born at sea, or whose birthplaces were not given, have been included in the number of British subjects. The foreign subjects numbered 18,043, or 3.68 per cent, of the population, against 4.48 per cent, in 1878.
Table I., p.189
Number born in New Zealand.—The number of the population born in New Zealand amounted to 223,404, or 45.60 per cent., the percentage in 1878 having been 42.02 ; of these, 112,404 were males and 111,000 were females. In 1878 the number of New Zealand-born persons in the colony was 174,126. The increase between the 3rd March, 1878, and. the 3rd April, 1881, amounted to 49,278 persons, or at the rate of 28.30 per cent, on the New Zealand-born population.
Tables II.,III., pp.190–1.
Numbers born outside the Colony.—The Australian-born population increased from 16,091 in 1878 to 17,277 in 1881. The English-born increased in the three years from 106,493 to 119,224; the Scotch increased from 47,949 to 52,753; the Welsh from 1,702 to 1,963; the Irish from 43,758 to 49,363; the Germans from 4,649 to 4,819; the Danes, Swedes, and Norwegians from 4,600 to 4,734. The population born in America amounted to 3,545. Of these, 1,722 were returned as having been born in British North America, 841 in the United States, 53 in North America (but no State given), and 838 merely in America; 91 were born in various places in Central or South America.
The Chinese-born increased from 4,442 in 1878 to 5,033 in 1881.
Thus, of the total population in the colony, those Born in—
New Zealand amounted to 45.60 per cent.
England amounted to 24.33 per cent.
Scotland amounted to 10.77 per cent.
Ireland amounted to 10.08 per cent.
Wales amounted to 0.40 per cent.
Australia and Tasmania amounted to 3.53 per cent.
Other British Possessions amounted to 0.82 per cent.
Denmark, Sweden, and Norway amounted to 0.97 per cent.
Germany amounted to 0.98 per cent.
China amounted to 1.03 per cent.
Proportions have not been given in respect of the persons born in British America and the United States, as it is uncertain how the persons returned as being horn in “America” or “North America” should be distributed.
The numbers given as having been born in any country include the children of British parents who were born therein.
The number of persons who objected to state their religious belief amounted to 13,978, or 28.530 in every 1,000 persons. No entry was made in the column for religion in the household schedule opposite the names of 1,329 persons. The returns given in respect of 471,626 persons, out of a total population (exclusive of Maoris) of 489,933, have been tabulated.
Table I, p. 217.
The Protestants of all denominations amounted to 393,961; the Roman Catholics and the Greek Church (the latter numbering 55) to 68,984. Of the Protestant denominations, the members of the Church of England (including Protestants not otherwise defined) amounted to 203,333, or 41.50 per cent, of the population; the Presbyterians numbered 113,108, or 23.09 per cent; and the Methodists 16,657, or 9.52 per cent. The proportions of members of some of the principal denominations to the 100 of population at each of the three last Censuses were as follow :—
Table II., p.217.
| 1874. | 1878. | 1881. | |
|---|---|---|---|
| Church of England | 42.46 | 42.55 | 41.50 |
| Presbyterians | 24.20 | 22.95 | 23.09 |
| Roman Catholics and Greek Church | 13.48 | 14.21 | 14.08 |
| Methodists | 8.42 | 9.14 | 9.52 |
The Baptists increased from 2.21 per cent, of the population in 1878 to 2.34 per cent, in 1881, and the Congregationalists from 1.34 to 1.37. The proportion of Lutherans decreased from 1.36 to 1.18 per cent. The Hebrews amounted to .31 per cent, in 1881, against .34 in 1878. The number of persons who objected to state their belief was numerically and proportionately larger than in 1878, having increased from 10,564, or 2.55 per cent., in 1878 to 13,978, or 2.85 per cent., in 1881. Of persons belonging to no denomination, those styled Freethinkers increased from 490 in 1878 to 2,422 in 1881.
The occupations given on the household schedules have been classified so as to show, as nearly as possible, the principal occupation of each individual on the Census day. The instruction on the schedule was that “The occupation which each person is following and deriving income from at the time of the Census is the occupation that should be stated.”
Table I. to VI., pp. 243–270.
The importance of having the occupations of the people of a country properly classified is now receiving more extensive recognition. The tables not only throw light on the development of trade and industries, but are of use in connection with inquiries into many social problems. A classification according to age, taken in connection with the registration of the occupations of deceased persons, would also be advantageous in deciding on the question of occupation in relation to health, and in showing the measure and character of occupation of the juvenile portion of the community. It has not, however, been deemed necessary, in the present state of the colony, to elaborate the tables in this direction, although, no doubt, when the population shall be largely increased, such a classification will be deemed desirable. A step has been made in that direction, by exhibiting separately for this Census the occupations of persons who were under 20 and those over 20 years of age. Notwithstanding the detailed instructions given on the Census schedule, the information as to occupation has been, in very many cases, given in such general terms that it has been found impossible to determine the industries under which the occupations should be classified.
CLASS I. PROFESSIONAL.—This class is divided into 2 orders, viz., 1. Officers of the Government and local bodies, excepting those whose occupations are of a special character and require that they should be brought into other classes, and the Constabulary and Militia Forces; and 2. The learned professions, and persons engaged in literature, art, and science, with their immediate subordinates.
Order I. Government and Defence.—No attempt has been made to specify in this order the total number of persons employed by, the Government; such information can be obtained from other sources. As one object of the classification was to exhibit the number of persons employed in connection with any particular branch of trade, industry, or special service, all officers employed in exceptional services, as law-courts, railways, harbour, pilot and lighthouse services, telegraph services, &c, have been enumerated in the classes to which those occupations appertain. The total number in this order amounted to 2,963 persons ; of these, 457 were engaged on police duties, and 150 in penal establishments, 261 were officers of local governments, and 730 were persons classified under the sub-order “Defence,” in which the Constabulary were included.
Order II. Literature, Art, and Science.—The number of persons in this order amounted to 7,270; the corresponding number in 1878 having been 5,767.
The following were the numbers in certain specific occupations in each of the Census years 1878 and 1881:—
| 1878. | 1881. | |
|---|---|---|
| Clergymen | 458 | 556 |
| Lawyers | 285 | 362 |
| Medical Men | 273 | 317 |
| Civil Engineers (not Government) | 133 | 228 |
| Schoolmasters | 907 | 1,128 |
| Schoolmistresses | 1,000 | 1,255 |
CLASS II. DOMESTIC.—This class includes all wives, mothers, and others engaged in domestic duties (unless returned as having some other definite occupation), children including those attending school, relatives, and also those persons engaged in personal services to man. The total number of this class amounted to 316,514, of whom 106,972 were males and 209,572 were females.
Order III.—Domestic Duties, Children, &c.—The wives and widows not described as having any special occupation amounted to 70,311 ; the children, relatives, and visitors not otherwise described amounted to 120,(507; and children described as receiving tuition at home or attending school, but not having any other occupation specified, amounted to 105,658.
Order IV. Personal Offices.— The number of persons engaged in connection with providing board and lodging amounted to 3,196. Of these, 1,591 were returned as hotel-keepers, of whom 121 were females. Many persons returned as hotelkeepers should, from the actual nature of their operations, be classified in Order X., as dealing in drinks; but, as it is impossible to distinguish between those persons and legitimate hotelkeepers, they are retained in this order. In this order there are 680 males returned as cooks. It seems doubtful whether they should properly belong to this order, as they were chiefly persons acting as camp-cooks, such as to gangs of road-labourers, harvesters, in surveyors' camps, &c. The number of domestic servants, that is, servants living in households or families, as distinguished from servants in inns or eatinghouses, clubhouses, or institutions, amounted to 12,874, of whom 899 were males and 11,975 were females. Of these, 372 males and 6,279 females were under 20 years of age. The servants in inns, &c., clubs, and charitable institutions amounted to 2,745, of whom 1,492 were males and 1,253 were females. The aggregate of these two groups may be taken as representing the total number of the class of servants who were permanently employed in connection with household work, excepting the persons returned as housekeepers, who numbered 534.
CLASS III. COMMERCIAL.—This class comprises all persons engaged in buying or selling goods or lands, and all persons engaged in the conveyance of men, animals, goods, and messages, or in storage of goods. It embraced 21,022 persons, of whom 484 were females.
Order V. Mercantile.—It may be of interest to compare the growth in the numbers of certain members of this class since 1878.
| 1878. | 1881. | |
|---|---|---|
| Capitalists | 230 | 241 |
| Merchants | 535 | 618 |
| Auctioneers, Appraisers, Valuers | 143 | 188 |
| Commission Agents, Factors | 329 | 569 |
| Bank Officers, Clerks | 676 | 760 |
| Public Company Officers | 103 | 152 |
| Commercial Clerks | 2,576 | 3,428 |
Order VI. Carriers of Goods and Messages.—In this order are included all railway and telegraph officers employed by the Government. The numbers were as follow:—
| Railway Officers, Engine-drivers, Servants, &c. | 1,157 |
| Telegraph Employés | 580 |
CLASS IV. AGRICULTURAL.—This class includes not only those engaged in what are generally recognized as agricultural or pastoral pursuits, but also all persons engaged on or about lands, and about living animals and birds; fishermen are also included. The total number of persons in this class amounted to 54,447, of whom 678 were females. It must be understood that this number does not include the total number of persons who are immediately dependent on the prosecution of pursuits in this class, as the wives and families of the persons engaged have been classified in Class II. Domestic, except when a specified occupation of a wife or member of the family has been given, or that the son or daughter of a farmer, if above 15 years, is living at home.
The number of persons engaged about strictly agricultural pursuits was considerably larger than in 1878, while the number engaged about pastoral pursuits showed little difference.
| 1878. | 1881. | |
|---|---|---|
| Engaged in agricultural pursuits and farming undefined | 37,478 | 42,722 |
| Engaged in pastoral pursuits | 5,510 | 5,511 |
The number of persons classified as farmers and market-gardeners (male and female) increased from 16,181 in 1878 to 19,371 in 1881. There was a slight decrease in the number of farm- servants and labourers.
| 1878. | 1881. | |
|---|---|---|
| Servants and farm-labourers | 12,500 | 12,511 |
The persons classified as runholders, graziers, sheep- and cattle-dealers, amounted to 888 in 1881, against 807 in 1878. The station or grazing-farm servants and labourers increased from 3,818 in 1878 to 4,063 in 1881.
In sub-Order 4, “Engaged about Animals,” the rabbit-killers appear as amounting to 709; in 1878 they numbered 273. The fishermen increased from 257 in 1878 to 382 in 1881.
CLASS V. INDUSTRIAL.—The term “industrial class” is generally used to designate that section of the population that subsists by manual labour, as mechanics, artisans, labourers. The term, however, is used here in a far more comprehensive sense, and includes all persons working or dealing in art or mechanical productions, in textile fabrics and fibrous materials, in foods and drinks (with the exception of those that are engaged in board and lodging and inn-keeping, included in the domestic class), in animal and vegetable substances, and in metals and minerals. The total number of persons in this class in 1881 amounted to 64,177, viz., 58,250 males and 5,927 females.
Order VIII. Workers and Dealers in Art and Mechanical Productions.
Of persons working and dealing in bocks there were—
| 1878. | 1881. | |
|---|---|---|
| Booksellers, Stationers, Publishers | 196 | 246 |
| Bookbinders | 140 | 149 |
| Printers, Compositors | 1,005 | 1,270 |
| Newspaper Proprietors, Editors, Publishers | 165 | 212 |
There was a small decrease in number of makers and dealers in musical instruments; the number, however, having been small in each year, viz., 24 in 1878, and 21 in 1881. Lithographers only increased from 53 to 55. Watch- and clock-makers increased in the three years from 265 to 329.
Persons employed in making or dealing in machines and tools amounted to 750, against 585 in 1878. The ship- and boat-builders were 602 in number; the increase having been small since 1878, when the number was 582.
The Building Sub-order included 10,804 persons, or 7 per cent, of the male population over 18 years of age. Of these, 6,272 were carpenters and joiners.
Order IX. Persons Working and Dealing in Textile Fabrics, in Dress, and in Fibrous Materials.—The total number of persons in this class in 1881 amounted to 11,930, or 2.114 per cent, of the population, against 9,931, or 2.409 per cent., in 1878. The number of persons returned as engaged in woollen manufactures increased from 130 in 1878 to 297 in 1881. This number, however, is less than the actual number engaged in that industry, owing to the want of definiteness in the returns in the Census schedules, for the special returns of industries give the number occupied in woollen manufactories as 417. Similar remarks apply to many industries. The wanting numbers are included in the indefinite class. The milliners and dressmakers amounted to 3,658 females, of whom 1,592 were under 20 years of age. Of the 11,930 persons in this order, 5,541 were females; of these, 2,334 were under 20 years of age.
Order X. Persons Working and Dealing in Food and Drinks.—This order does not include all persons dealing in food and drinks, for those persons so dealing who are engaged in personal offices, as boardinghouse-keepers and innkeepers, have been enumerated in the domestic class (Order IV.) This classification must be especially borne in mind in attempting to arrive at the number of persons occupied in either the manufacture or sale of fermented liquors. The persons returned in this class as engaged in connection with the manufacture of stimulants amounts to 494, and 24 persons were returned as wine and spirit merchants. This number does not represent all engaged in that business, as many general merchants sell wines and spirits.
Order XI. Workers and Dealers in Animal and Vegetable Matters. — The persons enumerated in this order numbered 4,872. Of these, 298 were described as being engaged in fellmongering and wool-scouring, 146 tanning, and 98 currying; 1,784 were engaged in saw-mills, and 1,160 were digging gum; 4 only were returned as engaged in paper-making. These numbers are, however, evidently far smaller than they should be, caused, doubtless, by labourers in connection with these occupations not specifying the occupations on which they were respectively engaged, and thus, instead of being classified in the order containing the occupation that afforded them employment, they are enumerated in other orders, as bushmen among the workers on land, or labourers undefined in the indefinite class. A reference to the industrial tables given in this volume will show that the number employed in fellmongering, tanning, wool-scouring, &c., was really 859 instead of 512; the workers in or about saw-mills 4,238 instead of 1,784; also 10 persons in the paper-mill instead of 4. The cause of such imperfection is that many persons do not care to read the instructions on the household schedule, or, if reading them, do not attend to them as required, not realizing the importance of giving with exactness the information in the form required.
Order XII. Persons Working and Dealing in Minerals.—This is an important order, and contains the occupations of 22,710 persons. All miners are included herein, and, among others, dealers in coal, manufacturers of bricks and pottery, road and railway constructors and labourers, and dealers and workers in precious metals. The miners numbered 14,273, of whom 1,087 were returned as being engaged in coal-mining.
CLASS VI. INDEFINITE AND NONPRODUCTIVE.—This class comprises all labourers and other persons whose special branch of labour or employment is not defined so as to permit of their being placed in previous classes.
Order XIII. Labourers and Others (Branch undefined).—14,904 persons returned themselves only as labourers. As the majority of these must have been more or less occupied in connection with some special industry, they would, had their occupations been fully given, have been distributed in the previous classes. In 1878, 11,355 were similarly returned as labourers. 2,918 persons of various occupations, as mechanic, shopman, apprentice, engineer, contractor, &c., have been necessarily classified in this order on account of the want of exactness in completing the information on the schedule. 3,-170 persons appeared as being supported by the community. Of these, 751 belonged to the criminal classes. No information was given in respect of the occupation of 1,813 persons.
Occupations of Females.—It will be of interest to take a general glance at the occupations of females in the colony. The total female population in the colony on the 3rd April, 1881 (exclusive of Maoris) amounted to 220,328. Of these, 220,312 have been enumerated in the tables of occupations. No occupation was specified in respect of 16 females; and the returns did not admit of any classification. Order III. in the domestic class includes 191,538 females as having no specified occupations beyond household duties as wives, widows, children at home, and children attending school. Of the remaining 25,774 females, 398 were returned as wives assisting in their husbands' business, 230 females were assisting their parents on farms, 217 were capitalists or owners of property not having any specific occupation, 860 were supported by the public, and 101 were in confinement or in the criminal class, thus leaving 23,965 females as having defined occupations. Of these, the number in the professional class amounted to 2,530, or, excluding 86 religieuses, to 2,444; the number connected with education, including music-mistresses, having amounted to 2,246.
Table I. to V., pp. 243–69
In the domestic class there were 14,722 females having specified occupations (exclusive of members of families engaged in domestic duties in their own households or assisting their husbands). 13,808 of the above number were designated as cooks, housekeepers, or servants.
The commercial class provided occupations for 139 females (exclusive of 25 female capitalists and 20 wives assisting their husbands). The occupations were chiefly those of sales- and shop-women; 10 were described as clerks, and 22 were stewardesses.
The agricultural class afforded employment to 319, in addition to 33 females described as landowners, and to the females who assisted their husbands or relatives. 239 of the females were farming.
The occupations in the industrial class included those of 5,927 females, of whom 38, returned as houseowners, cannot be deemed as having special occupations. The actual occupations, therefore, amounted to 5,889. The majority of these occupations were those connected with working and dealing in textile fabrics. Of these, 136 were engaged in woollen manufactories, 416 were tailoresses, 3,658 milliners and dressmakers, 215 seamstresses, 298 sewing-machinists, and 177 were engaged in making or dealing in boots and shoes; also 493 were occupied about washing clothes. 36 female occupations were enumerated in the indefinite class. Of these, 30 were shop-women or apprentices, the branch of trade not being specified.
On reference to the tables of combined ages and conditions of the people, it will be observed that there were 117,255 females over 15 years of age; of these, 37,120 were unmarried. The wives and widows numbered 80,094; of these last, 70,739 were engaged as wives or widows in domestic duties, or assisting in their husbands' business.
Table III., p. 90.
If allowance be made for the above 70,739, and for 217 females described as having property and not having any specific occupation, 860 supported by the public, and 104 in the criminal class, it appears that, of the remaining 45,335 wives, widows, and unmarried females over 15 years, about 23,965 had specific occupations, for probably very few of the specified occupations were of females under 15 years of age. Of the residue over 15 not having specified occupations, about 2,000 were attending school, and a large proportion of the rest were doubtless actively employed in household duties.
The instruction given to householders on the Census schedule for filling in the particulars as to sickness and infirmity was as follows: “If unable to follow usual occupation by reason of illness or accident, write ‘sick’ or ‘accident,’ or if afflicted by any of the following infirmities, write ‘deaf-and-dumb,’ ‘blind,’ ‘lunatic,’ ‘idiot,’ or ‘epileptic’ as the case may be.”
Tables I. and II., pp.273–82.
The registers of death exhibit the mortality of the population and the immediate causes of death. Although they may be taken as fair index of the prevalence of certain diseases, yet they do not throw much light on the general health of the population. The Census returns give information as to the number of the population who by reason of sickness or accident are unable to follow their usual occupations, and the number who are suffering from specified infirmities. In the compilation of these returns particulars relating to children under 15 years of age have been ignored, as not only are they less reliable but of comparatively little value, as not affecting the wage-earning power of the community. The total number of persons over 15 returned only as sick amounted to 2,333, and the number given as suffering from specified complaints was 250. The specified complaints appear to be chiefly those of a chronic character, as rheumatism, asthma, consumption (phthisis), gout, cancer, leprosy, &c., although some, as measles, congestion of the lungs, neuralgia, and bronchitis, are apparently of an acute character ; but it is evident that no conclusion can be arrived at from the distinction drawn, as the deaths of persons over 15 from phthisis in 1881 amounted to 433, or almost approximating to double the number of sufferers from specified complaints. It is therefore evident that the term “sick” has been used to include chronic as well as acute cases of disease. The total number of persons over 15 incapacitated from work on account of sickness and disease amounted to 2,583, or 9 per 1,000 of the total population over 15. The proportion of each sex suffering from sickness and disease somewhat differs. It was 96 per 10,000 males and 85 per 10,000 females. 529 males and 48 females over 15 years were suffering from accident.
The following figures, being proportions per 10,000 persons over 15 years of age, show the relative prevalence of sickness and accidents for the years 1874, 1878, and 1881 :—
| Sickness and Specified Complaints. | Accident. | Total. | ||
|---|---|---|---|---|
| Persons | 1874 | 98.64 | 21.26 | 119.90 |
| 1878 | 84.45 | 20.17 | 104.02 | |
| 1881 | 91.56 | 20.45 | 112.01 | |
| Males | 1874 | 99.40 | 30.80 | 130.20 |
| 1878 | 87.03 | 31.19 | 118.22 | |
| 1881 | 96.19 | 32.10 | 128.29 | |
| Females | 1874 | 97.41 | 5.82 | 103.23 |
| 1878 | 80.63 | 3.93 | 84.56 | |
| 1881 | 85.07 | 4.09 | 89.16 |
There was a considerably larger proportion of sickness in both sexes in 1881 than in 1878, and a larger proportionate number of cases of accidents.
The proportions of sick (including those having specified complaints) per 10,000 living of the two sexes differed very materially at the different age-periods. Those of the females were generally higher at the younger years and to middle age, after which the proportion of sick among the males was much higher than among the females at each age-period up to 80 years.
The relative proportions will be better shown by the following table :—
Proportions Sick and having Specified Complaints per 10,000 living.
| Age. | Males. | Females |
|---|---|---|
| 15–20 | 41.79 | 46.87 |
| 20–25 | 58.88 | 51.33 |
| 25–30 | 52.86 | 69.59 |
| 30–35 | 59.90 | 69.48 |
| 35–40 | 80.23 | 80.79 |
| 40–45 | 84.08 | 90.90 |
| 45–50 | 122.38 | 103.13 |
| 50–55 | 159.11 | 123.75 |
| 55–60 | 236.87 | 205.73 |
| 60–65 | 317.67 | 233.21 |
| 65–70 | 441.73 | 229.12 |
| 70–75 | 553.19 | 427.63 |
| 75–80 | 585.20 | 462.29 |
| 80 and upwards | 869.57 | 992.37 |
Specified Infirmities.—The persons enumerated under this heading are those that were returned in the schedules as being deaf, deaf-and-dumb, lunatics, idiots, suffering from epilepsy or paralysis, or that were crippled or deformed in any way, or that were suffering from debility or infirmity. These particulars have been tabulated for all ages. The total number returned as suffering from these infirmities was 2,069.
Deaf-and-Dumb.—The number of persons deaf-and-dumb amounted to 111, inclusive of one adult person stated to be dumb, but presumably deaf-and-dumb. 5 were under 5 years of age, 50 between 5 and 15 years, and 17 between 15 and 20; tints a large proportion were at ages when benefit could he obtained by taking advantage of the facilities afforded for educating the deaf-and-dumb. 24 children (13 boys and 11 girls) were in attendance at the Deaf-and-Dumb Institution at Sumner at the end of 1881.
The definite occupations of the deaf-and-dumb amounted to 24. There were 4 deaf-and-dumb persons returned as married women.
Blind.—138 persons were stated to be blind. Of these, 79 were males and 59 females. 23 were under 20 years of age, 25 from 20 to 10, 36 from 40 to 60, and 54 above 60. There were 52 blind persons having distinct occupations.
Lunatics.—The persons stated to be lunatics were inmates of asylums. The number was 1,120. In 1878 the lunatics numbered 861; the increase in the interval has thus been 256, or at the rate of nearly 30 per cent.
Of the lunatics, 736 were males and 381 were females. 39 of the lunatics were under 20 years of age. Among the males the largest number were between the ages of 40 and 45; among females, between the same ages. There was one lunatic person to every 437 of the population, exclusive of Maoris. In 1878 the proportion was 1 to 180.
Idiots.—58 persons were returned as idiots or imbeciles. In 1878 the number was 70.
Epileptic. —112 males and 82 females were returned as suffering from this complaint. Of these, 79 were under 20 years of age.
Paralysis.—101 persons were returned as suffering from paralysis, of whom 55 were under 50 years of age.
Crippled and Deformed. —182 persons were stated to have been thus afflicted. The number includes those who have thus suffered by various accidents. In 1878 the number so returned was 171.
Occupied Lands. —The area of occupied lands, as given in the Census schedules, in holdings of over 1 acre in extent, amounted in April, 1881 (exclusive of the land occupied by Maoris), to 26,845,466 acres—about two-fifths of the whole area of the colony. Of this amount. 10,309,170 acres were the freehold properties of the occupiers, 1,544,455 acres were rented by them from private individuals, 563,124 acres were rented from local bodies, 2,266,164 acres were Native lands or Native reserves rented by the occupiers, and 12,162,553 acres were Crown lands, in occupation of which 11,638,569 acres were rented for pastoral purposes only.
Table I., p.285.
Unoccupied Holdings.—A place was set apart in the schedule to be filled in by a statement of unoccupied holdings. The returns made are considered far from complete, as many proprietors are absent from the colony, and it is believed that many in the colony have not been careful to give full information. The total area given in the returns amounted to 931,435 acres, in 3,187 holdings. Of these, 12 holdings were over 10,000 acres in size.
Table IV., p, 290.
Total Holdings. —The total number of holdings exceeding 1 acre in extent, occupied and unoccupied, amounted to 34,319, with an aggregate area of 27,770,901 acres.
The following were the returns for the two last Censuses :—
| No. of Holdings over 1 Acre. | Freehold Acres. | Leasehold and Crown Land rented for other that Pastoral Purposes. | Crown Land rented for Pastoral Purposes only. | |
|---|---|---|---|---|
| Acres. | Acres. | |||
| 1878 | 23,847 | 9,475,478 | 3,709,525 | 12,690,074 |
| 1881 | 34,319 | 11,240,605 | 4,897,727 | 11,638,569 |
Sizes of Occupied Holdings.—The total number of occupied holdings over 1 acre in extent amounted to 30,832; of these, 7,680 were over 1 acre and not exceeding 10 acres in extent, 6,498 over 10 and not exceeding 50 acres, and 4,462 over 50 and not exceeding 100 acres, 9,777 were over 100 and not exceeding 640 acres, and 828 over 610 and not exceeding 1,000 acres, 1,097 were from 1,000 to 5,000 acres, 185 from 5,000 to 10,000 acres, 169 from 10,000 to 20,000 acres, 111 from 20,000 to 50,000 acres, 18 from 50,000 to 100,000 acres, and 7 over 100,000 acres.
Table III., p.289.
Land Fenced.—The area of land given as having been fenced amounted to 16,193,574 acres, against 11,567,565 in 1878. The quantity given is less than the actual amounts returned, as large numbers of chains of fencing were given in some cases without any mention of area, in ethers in conjunction with area; but whether this was additional to the area given or on the same area could not he decided ; and where no area was given the mere statement of lineage was not sufficient to enable a calculation of area to be made. The figures returned as to length of fencing have thus no definite meaning, as neither showing the area nor the total fencing done, and have been omitted.
Table V., p. 291.
Live Stock. —The following numbers of live stock do not include those belonging to Maoris, who own considerable numbers of horses, sheep, cattle, and pigs.
Table V., VI., VII., pp. 291–95.
Horses: The total number in 1881 was 161,736, against 137,768 in 1878.
Cattle of all ages numbered 698,637, against 578,430. Of the cattle, 226,819 were returned as breeding-cows. Between 1878 and 1881 the cattle increased at the rate of 20–78 per cent. In the four years, 1874 to 1878, the increase had been at the rate of 16.87 per cent.
The sheep amounted to 12,985,085 head, against 13,069,338 in 1878, a decrease of 84,253. This decrease is apparently owing to the rapid growth in the number of rabbits, which have, in some localities, made runs valueless, at any rate for a time, for grazing purposes. As, however, more energetic steps have of late been taken to get rid of this rabbit-pest, the future may well be expected to exhibit a growing increase in the number of sheep in the colony. There was a slight falling-off in the number of pigs from 207,337 in 1878 to 200,083 in 1881.
Production of Butter and Cheese. The annual production of butter was returned as 8,453,815 lb., against 7,379,447 lb. in 1878. The quantity of cheese made annually was given at 3,178,694 lb. in 1881, and 2,701,908 lb. in 1878. These figures can only be accepted as very rough estimates, as dairymen and farmers do not generally keep any records of the production of these articles.
Table VIII., p. 295.
Agricultural Machines. Returns were obtained of the number of threshing machines, reaping machines, and steam-ploughs or harrows. The total number of threshing machines was 1,019, of which 493 were worked by steam and 68 by water-power. There were 6,595 reaping machines in use, 29 steam-ploughs, and 13 steam-harrows. The steam threshing machines increased 119 in number since 1878, and the reaping machines 1,766, but the steam-ploughs decreased from 34 to 29, and the steam-harrows from 32 to 13.
Table VIII., p. 295.
The progress made in the establishment of colonial industries between the Census-periods of 1878 and 1881 was marked and substantial. In 1878 the number of manufactories, works, and defined industries amounted to 1,271, employing 14,177 persons ; the aggregate approximate value of the lands and buildings having amounted to £1,761,094, and of the machinery and plant to £1,289,378. In 1881 the number was 1,643; the number of hands employed, 17,938; the value of land and buildings, £1,993,330; and the value of machinery and plant, £1,61,612,141 ; or an increase in the three years of 372 in the number of works, 3,761 in the number of hands, and £554,399 in the aggregate capital.
Tables I., II., pp. 298–300.
Some special industries are separately tabulated, and information given as to their annual produce.
Grain-mills.—The number of these mills for which returns were received amounted to 131, of which 49 were worked by steam-power and 11 by steam in combination with either wind or water. These mills employed 450 hands, and produced during 1880, 69,251 tons of Hour and 7,143 tons of meal. The increase as compared with the returns in 1878 was 29 in the number of mills, 125 in the number of hands, and 16,187 tons of annual produce of flour and meal. 39 of these mills were in Canterbury and 38 in Otago.
Table V., p. 301.
Breweries. —There were 99 breweries in operation in April. 1881, against 91 in 1878. 526 hands were employed in 1881 and 513 in 1878, but the quantity of beer made during the year 1880 was less than that produced in 1877, the quantities having been 4,874,754 gallons in 1880 and 5,682,170 gallons in 1877, a decrease in the annual produce of 807,416 gallons. To ascertain whether this decrease is caused by a less consumption it would be necessary to take into consideration the quantities imported in 1877 and 1880 respectively. In 1877 the local production of beer was 5,682,170 gallons, and the amount entered for Home consumption and ex warehouse amounted to 397,609 gallons, or a total of 6,079,779 gallons, equivalent to nearly 14.9 gallons per head of the mean population for the year. In 1880 the local production was 4,871,754 gallons, and the amount entered for Home consumption 450,226 gallons; a total of 5,324,980 gallons, equivalent to 11.2 gallons per head of mean population. The total consumption in 1880 would therefore appear to have been less than that in 1877 by 3.7 gallons per head of population.
Table VII., p.301.
Flax-mills. —The number of these mills increased from 31 in 1878 to 10 in 1881. 284 hands were employed in 1881, against 262 in 1878, and the annual produce increased from 1,190 tons to 1,382 tons.
Table IV., p.300.
Boiling-down and Meat-preserving Works. —The number in 1878 was 32, employing 443 hands; in 1881 the number was 40, employing 468 hands. The amount of produce cannot be compared, as no return of the produce was made in 1878.
Table VIII., p. 302.
Fellmongeries, Tanneries, &c. —The various works established for fellmongering, tanning, currying, and wool-scouring amounted to 119, an increase of 19 on the number in 1878. The hands employed in these works in 1881 numbered 859.
Table IX., p. 302.
Collieries. —An important and growing industry is represented under this head. The returns received gave 51 collieries in 1881, employing 992 hands, and with an output for 1880 of 277,918 tons of coal, against 40 collieries, employing 518 hands, in 1878. The output for 1877 was not given. It is, however, to be observed that these numbers do not include the small pits, from which lignite and inferior coal are extracted. The total number of mines known to the Mines Department for the purposes of inspection amounted in 1880 to 101, with an output of 299,923 tons. There thus appears to have been 50 pits or small mines, in addition to the 51 above given, having an aggregate annual output of 22,005 tons.
Table XI., p.303.
Table XIII., p. 303.
Quartz Mines. —According to the returns received, the number of quartz mines decreased from 103 in 1878 to 81 in 1881. The quantity of quartz crushed was only 98,460 tons in 1880, against 181,337 in 1877, and the quantity of gold produced 84,184 oz. in 1880, against 230,664 oz. in 1877. These figures cannot be cheeked by the Customs returns, as the latter include gold the produce of alluvial diggings.
The comparison of certain industries in 1878 and 1881 is herewith given:—
| 1878. | 1881. | |||
|---|---|---|---|---|
| No. | Hands Employed. | No. | Hands Employed. | |
| Printing Establishments | 77 | 1,268 | 106 | 1,779 |
| Agricultural Implement Manufactories | 8 | 208 | 23 | 315 |
| Furniture-making Manufactories | 12 | 96 | 45 | 466 |
| Woollen Mills | 3 | 78 | 4 | 417 |
| Boot Manufactories | 18 | 747 | 31 | 1,299 |
| Biscuit Manufactories | 6 | 52 | 18 | 148 |
| Soap and Candle Works | 13 | 70 | 15 | 108 |
| Saw-mills and Sash and Door Manufactories | 204 | 4,114 | 223 | 4,238 |
| Iron and Brass Foundries | 28 | 855 | 35 | 953 |
There was a decrease in ship-and boat-building works from 43, employing 322 hands, in 1878, to 25, employing 100 hands, in 1880.
Land and Building Societies.—The results of the returns from these societies for the years 1878 and 1881 can be more clearly shown in a tabulated form :—
Table XIV., p. 304.
| Year. | No. of societies. | No. of Shareholders. | Shares Realized. | Shares Unrealized. | Average Amount of Monthly Contributions. | ||
|---|---|---|---|---|---|---|---|
| 1878. | 48 | 9,492 | 27,752 | 55,522 | £30,437 | 2 | 8 |
| 1881. | 51 | 9,356 | 29,526¼ | 53,717¾ | 39,230 | 3 | 7 |
There has thus been practically no increase in societies of this class. Although the actual number is slightly greater, the number of shareholders is less by 136, and the number of shares by 30. The contributions are larger, owing to the larger proportion of realized shares, or, in other words, to the fact that the shareholders have themselves become more extensive borrowers from the funds of the societies.
Public Libraries, Mechanics' Institutes, and other Literary and Scientific Institutions.— There were 225 institutions of this sort in 1881, with a membership of 12,868, and having 198,520 volumes; an increase since 1878 of 38 institutions, 776 members, and 25,499 volumes.
Table XV., p.304.
5 of these institutions are free public libraries, having a total number of 22,718 books. They were situated respectively at—
| Christchurch, having | 14,533 volumes. |
| Auckland, having | 5,150 volumes. |
| Greytown, having | 2,100 volumes. |
| Palmerston North, having | 700 volumes. |
| Otokia, in Otago, having | 235 volumes. |
Places of Worship.—The total number of churches and chapels and other buildings used as places of worship amounted to 1,114, of which 834 were churches or chapels, 192 school-houses, and 88 other buildings. These buildings, in the aggregate, had accommodation for 189,155 persons, with an average attendance of 117,812 persons. Accommodation for public worship was thus provided for 15 per cent, of the population over 10 years of age, exclusive of the persons on shipboard and the Chinese.
Tables XVI., XVII., pp.304–5.
An attempt was again made in 1881 to obtain a correct enumeration of the Native population, but although the different officers of the Native Department who had the charge of the enumeration do not think that there are any material errors in the results obtained, yet they agree in stating that the numbers given are not correct, and in many instances only estimates. In some parts no access was permitted to those desirous of obtaining information. In parts the Natives showed a suspicion of the enumeration and a growing disinclination to have their numbers known, and information relating thereto was refused. Difficulty was also experienced, on account of the nomadic habits of portions of the tribes; and in some instances the Natives who were at a distance from their tribes were enumerated in loco, and given again by another officer among the number of their tribe. These causes were, however, in operation in 1878 as well as in 1881, and the results arrived at in 1881 may, on the whole, he considered as approximately correct as those arrived at in 1878—probably, on the whole, more so, as in one or two cases it has been discovered that there were considerable omissions in 1878; and, as the total number in 1881 is greater than that in 1878, while the reports of the Native officers generally point to a perceptible decrease in the population, this increase may be attributable to a better enumeration in 1881.
Tables I., II., pp. 309–13
In 1878 the returns made gave a total of 43,595 as the number of the Maori population; in 1881 the number returned was 44,097; an apparent increase of 502; hut, from the doubts cast upon the correctness of the numbers, this cannot be accepted as decisive evidence that there has been an increase or that there has not been an actual decrease since 1878. As the question of increase or decrease cannot be decided by a mere comparison of the numbers, it may be advantageous to refer to the reports of the Native officers who took the Maori Census for some light on the subject.
The Resident Magistrate at Whangarei stated thus : “The Kaipara, Whangarei, and Mongonui Districts show a slight increase in number; but in the Bay of Islands, no register having been kept, the increase or decrease could not be ascertained. Most probably a slight decrease has taken place in that district. The deaths in all these districts have been principally old people and young children, the former from old age, and the latter from exposure to the weather in winter. On the whole the mortality appears very small in comparison with the population, the cause of "which may be the almost total absence of epidemical disease, from which, save in a few instances of typhoid fever, the Natives appear to be perfectly free.”
The Native Agent at the Thames reports, “The Census returns now forwarded show an increase of 186 over that furnished by Mr. E. W. Puckey for the year 1878, but it must not be understood from that that the population of this district has increased to such an extent during the last three years, or that the births have outnumbered the deaths in such a proportion during that period. . . . I can therefore only account for the difference in numbers from the fact that Mr. Puckey had not at that time the material at his command from which to compile a strictly accurate return, and therefore, in several cases, the returns were given as estimated.” It is then stated that the mortality occurred “principally amongst the very young and aged, and not so much among those of middle age, the cause of which I attribute to the fact that drunkenness has not been so prevalent as in past years.”
The Resident Magistrate at Tauranga states that “the Census of the Ngaiterangi Tribe may be taken as correct; that of the others approximately so. The Ngaiterangi Census shows a total of 966, against 973 in 1878, or a decrease of 7. On the other hand there is an improvement shown in the percentage of young people to the whole population, which is 26.4 per cent., as against 22.4 in 1878. It may be observed that the percentage of the persons under 15 to the whole European population is nearly 43 per cent. The number of old people amongst this tribe is remarkable, those apparently over 60 numbering 108, or about 11.2 per cent.; the percentage amongst the European population of persons over 60 to whole number being only 2.42 per cent. The return of the Arawa Tribe (Maketu and Lakes) shows a total of 2,135 persons, as against 2,219 in 1878, a decrease of 84.” Exclusive of some 40 Natives not enumerated m 1878, this decrease is reduced to about 44.
The Resident Magistrate, at Opotiki, after explaining that an apparent increase in the Natives of his district was caused by an omission of a large body of Ureweras in the Census of 1878, observes thus: “The total of the other tribes in this district is 2,019, being a decrease of 21 since 1878. It will be observed on reference to the return that the Urewera is the only tribe where the children are as numerous as the adults ; in most of the other tribes the adults exceed the children. So far as my experience goes, the same is the lamentable fact amongst tribes in other parts of the Island. The Urewera appear to be the exception, and, for the want of a better reason, I can only attribute it to their keeping more aloof from civilization and its temptations than most other tribes.”
The Resident Magistrate at Taupo, in his report, stated, “When the last Census of the Maori population of this district was taken, it included, I think, only those immediately residing round the Lake, leaving out the comparatively populous centres of Tahua, Rotaira, and the country round Ruapehu and Tongariro, as well as the portions north of Uranui. A comparison therefore with the present numbers, to show the increase or decrease, is not possible; but a reference to the returns showing the number of adults (excluding those who are not permanently living in the district) and the proportion of the children will lead at once to the conclusion that a great decrease is taking place. Since my first arrival in the district in 1869 a very noticeable decrease in the population has taken place, principally among the children ; attributable, no doubt, to want of nourishing food, exposure, and neglect, and very probably also to congenital causes.”
The Native Officer at Gisborne considers that the population is at present almost at a standstill, but be states “the undoubted tendency is to decrease; and there is one very remarkable circumstance worthy of note: that in hapus further removed from civilization and European influences the proportion of children is much greater than when brought into contact with such influences.”
The Officer in the Wairoa District thought there had been a slight decrease in the numbers of the whole district.
The Native Agent in the Wairarapa District states that “some kaingas show a larger average of children than heretofore. The numbers since the last Census was taken have not decreased. The old men, with the exception of about ten, have died, leaving a healthy and robust population in existence.”
The Native Officer at Wanganui is of opinion that, owing to the great disparity between adults and children, nearly four to one, the tribes in that district must surely decrease more and more rapidly year by year. He finds that comparatively few children are born, and that of those few a great number die at one and two years of age.
The Resident Magistrate at Marton believes the population in his district to be just as it was three years ago. He states he believes the Maoris in his district “are healthier than they were, they are steadier in their habits, work hard, and are better clothed and fed.” He has noticed “an improvement in their dwellinghouses, and, being brought continually in contact with their European neighbours, they are to a great extent abandoning their Maori habits and customs and assuming those of the pakeha;” and that, “as a rule, those Natives who have to work hard for their money, and. so know its value, are not so ready to spend it for strong drink;” also he thinks that “the fact of the Maori parents being healthier has its good effect on the children who are born to them.”
In the Chatham Islands there appears to be a slight increase in the population. The Maoris are reported as being all in good circumstances, having good substantial European houses, and living in separate dwellings in different parts of the island, instead of together in a pah as formerly.
The opinions may be stated thus : In the district north of Auckland, having a Maori population of 8,617, there was a slight increase in parts. In three other districts, having a total number of 6,549 Maoris, the population had not decreased. In five districts, having a population, actual or estimated, of 12,746 Maoris, there was a decrease.
Although the numbers given cannot be deemed to be an accurate statement of the whole of the Maori population, yet the ages given may fairly represent the proportion of each sex at and over 15 years of age.
These proportions may well he examined to ascertain whether a conclusion can be arrived at from them as to the increase or decrease of the race.
In the North Island, where the bulk of the Maori population resides, out of 41,601 Maoris enumerated, the ages—-so far as whether they were under or over 15 years of age—-of 37,351 were given. Of these 37,351, 12,620 were under 15 years of age, equal to 33.78 per cent, of the total. The males numbered 20,547, of whom 6,884, or 33.49 per cent., were under 15; the females numbered 16,804, of whom 5,738, or 34'15 per cent., were under 15 years of age.
It will be found simpler to compare the results with those of the European portion of the population, if thrown into tabular form.
| Percentage of each Sex. | Percentage of Total Population whose Ages were given. | |||
|---|---|---|---|---|
| Males under 15. | Females under 15. | Males under 15. | Females under 15. | |
| England, 1871 | 37.15 | 35.13 | 18.09 | 18.03 |
| New-Zealand-European, 1878 | 37.72 | 47.89 | 21.26 | 20.91 |
| New-Zealand-European, 1881 | 39.71 | 46.83 | 21.61 | 21.24 |
| New-Zealand-Maori, 1878 | 31.70 | 31.88 | 17.59 | 14.39 |
| New-Zealand-Maori, 1881 | 33.19 | 34.15 | 18.43 | 15.35 |
The percentages on the Maori population are calculated for each year on the total numbers of all tribes in the North Island whose ages were stated. The much smaller proportion of females under 15 to the total population can only be regarded as evidence of the existence of too small a number of young females to lead to any hope of an increase in the total numbers. In a few tribes the proportion of young females is high; thus, in the Ngapuhi, 40.03 per cent, of the females were under 15; in the Rarawa, 41.12 per cent, were under 15; in the Urewera, 46.15 per cent, were under 15 ; but this is not necessarily a sign of increase, as the following figures will show:—
| Total No. 1878. | Total No. 1881. | Percentage of Females under 15 to total Females in 1881. | |
|---|---|---|---|
| Ngapuhi | 5,667 | 5,564 | 40.03 |
| Rarawa | 2,270 | 2,775 | 11.12 |
The Ngapuhi Tribe, with a high percentage, shows a decrease, and the Rarawa an increase at the rate of over 22 per cent.—a rate of increase in excess of that of the European portion of the population during the same period. The apparent increase is probably to a large extent, if not wholly, due to omissions in 1878 being accounted for in 1881. Although on the whole there can be no doubt that there has been a decrease in the Maori population during the last three years, and that such decrease will, at any rate for a time, continue, yet it is apparent that there is not of necessity a doom of extinction on the race, as in parts the population is stationary, and in other parts slightly increasing, thus leading to the hope that if similar causes could be brought to operate among the rest of the population the threatened further decrease might be stayed, even if new vigour be not imparted to the survivors. The words of the Resident Magistrate at Marton seem to indicate the causes that will most beneficially affect the race: not the possession of ample means from land revenues, which lead to idleness and dissipation, but habits of industry, which make them know the value of money, and produce the most beneficial results on their habits and health, and, as he states, “the fact of the Maori parents being healthier has its good effect on the children who are born to them.”
I have the honour to be,
Sir,
Your most obedient servant,
WM. R. E. BROWN,
REGISTRAR-GENERAL.
Table of Contents
Table I. Table I. Showing the Population of the Colony (exclusive of Maoris*) according to the Census taken on the 3rd April, 1881.
| Population. | Persons. | Males. | Females. |
|---|---|---|---|
| * The Maori population of the colony will be found in the Appendix to this volume. | |||
| Exclusive of Chinese | 484,939 | 264,610 | 220,319 |
| Chinese | 5,004 | 4,995 | 9 |
| Total | 489,933 | 269,605 | 220,328 |
Table II. Table II. Showing the Habitations in the Colony (exclusive of Maori Dwellings) according to the Census taken on the 3rd April, 1881.
| Total Number. | Description. | Materials. | Not Stated. | |||||||||
|---|---|---|---|---|---|---|---|---|---|---|---|---|
| Dwellings exclusive of Tents. | Tents and Dwellings with Canvas Roofs. | Brick, Stone, or Concrete. | Wood, lion, or Lath and Plaster | Cob or Sod. | Miscellaneous. | Huts or Sod, Clay, Wood. Stone, &c. | Raupo | Tents and Dwellings with Canvas Roofs. | ||||
| Occupied. | Unoccupied. | Building | ||||||||||
| 103,335 | 92,833 | 6,737 | 848 | 2,917 | 4,062 | 87,646 | 2,482 | 2,301 | 2,207 | 370 | 2,917 | 1,350 |
| Classification of Inhabited Dwellings according to Number of Rooms. | ||||||||||||
| Dwellings of One Room. | Dwellings of Two Rooms. | Dwellings of Three and Four Rooms. | Dwellings of Five and Six Rooms. | Dwellings containing more than Six Rooms. | Dwellings which the Number of Rooms was not Specified. | |||||||
| Brick, Stone,Wood, Iron, &c. | Cob, Raupo,&c, and Huts or Tents. | |||||||||||
| 4,039 | 6,038 | 14,758 | 35,064 | 19,338 | 15,344 | 1,169 | ||||||
Table III. Table III. Showing the Inhabitants and Dwellings in the Colony according to the Census taken on the 3rd April, 1881.
| Population. | Dwellers— | Travellers and Persons Sleeping under Drays, or Camping Out | Total | |||
|---|---|---|---|---|---|---|
| In Houses of Brick, Stone, Wood, Iron, or Lath and Plaster. | In Huts or Houses of Cob, Sod, Raupo, &c. | On Shipboard. | In Tents and Dwellings with Canvas Roofs. | |||
| Exclusive of Chinese | 450,586 | 25,495 | 2,862 | 5,905 | 81 | 484,929 |
| Chinese | 2,l6l | 2,278 | 54 | 411 | ... | 5,004 |
| Total | 452,847 | 27,773 | 2,916 | 6,316 | 81 | 489,933 |
NOTE.— In this table the dwellers in houses of which the materials were not stated have been included in the numbers given in the first column, except such as were Chinese. These last nave been regarded as more probably living in inferior houses, and thrown into the number in the second column.
Table IV. Table IV. Showing the Number of Females to 100 Males, and the Number of Persons to the Square Mile, at the period of each Enumeration, from December, 1858, to April, 1878; also the Number of Persons to the Inhabited House and of Inhabited Houses to the Square Mile (exclusive of Maoris and Maori Dwellings).
| Date of Enumeration. | Number of Females to 100 Males. | Number of Persons to the Square Mile. | Number of Persons to the Inhabited Dwelling. | Number of Inhabited Dwellings to the Square Mile. |
|---|---|---|---|---|
| December, 1858 | 76.41 | .566 | 4.64 | .122 |
| December, 1861 | 62.16 | .944 | 4.42 | .214 |
| December, 1864 | 61.53 | 1.641 | 4.53 | .362 |
| December, 1867 | 65.75 | 2.094 | 4.05 | .517 |
| February, 1871 | 7.52 | 2.456 | 4.48 | .548 |
| March, 1874 | 75.17 | 2.869 | 4.88 | .588 |
| March 1878 | 79.40 | 3.951 | 5.02 | .791 |
| April,1881 | 81.72 | 4.693 | 5.12 | .917 |
The estimated area of New Zealand is 104,403 square miles.
Table V. Table V. Showing the Population of the Colony (exclusive of Maoris) at the period of each Enumeration, from December, 1858, to April, 1881, and the Numerical and Centesimal Increase during the period between each Enumeration; also the Numerical and Centesimal Increase between February, 1871, and April, 1881.
| — | Population, December. 1858. | Increase from 1858 to 1861. | Population, December. 1861. | Increase from 1861 to 1864. | Population, December. 1864. | Increase from 1864 to 1867. | Population, December. 1867. | Increase from 1867 to 1871. | Population, February. 1871. | Increase from 1871 to 1874. | Population, March. 1874. | Increase from 1874 to 1878. | Population, March. 1878. | Increase from 1878 to 1881. | Population, March. 1881. | Increase from 1871 to 1881. | ||||||||
|---|---|---|---|---|---|---|---|---|---|---|---|---|---|---|---|---|---|---|---|---|---|---|---|---|
| Numerical. | Centesimal. | Numerical. | Centesimal. | Numerical. | Centesimal. | Numerical. | Centesimal. | Numerical. | Centesimal. | Numerical. | Centesimal. | Numerical. | Centesimal. | Numerical. | Centesimal. | |||||||||
| Males | 33,679 | 27,383 | 44.84 | 61,062 | 45,518 | 74.54 | 106,580 | 25,349 | 23.79 | 131,929 | 18,427 | 1,396 | 150,356 | 20,625 | 13.72 | 170,981 | 60,017 | 35.10 | 230,998 | 38,607 | 16.71 | 269,605 | 119,249 | 79.31 |
| Females | 25,734 | 12,225 | 32.20 | 37,989 | 27,619 | 72.76 | 65,578 | 21,l6l | 32.26 | 86,739 | 19,298 | 22.24 | 106,037 | 22,496 | 21.21 | 128,533 | 54,881 | 42.70 | 183,414 | 36,914 | 20.13 | 220,328 | 114,291 | 107.78 |
| Total | 59,413 | 39,608 | 39.99 | 99,021 | 73,137 | 73.86 | 172,158 | 46,510 | 27.01 | 218,668 | 37,725 | 17.25 | 256,393 | 43,121 | 16.82 | 299,514 | 114,898 | 38.36 | 414,412 | 75,521 | 18.22 | 489,933 | 233,540 | 91.09 |
Table VI. Table VI. Showing the Population of each Provincial District (exclusive of Maoris) in New Zealand at the last Eight Censuses.
| Provincial Districts. | Year of Census. | |||||||||||||||||||||||
|---|---|---|---|---|---|---|---|---|---|---|---|---|---|---|---|---|---|---|---|---|---|---|---|---|
| December, 1858. | December, 1861. | December, 1864 | December, 1867. | February, 1871. | March, 1874. | March, 1878. | March, 1881. | |||||||||||||||||
| Persons. | Males. | Females. | Persons. | Males. | Females. | Persons. | Males. | Females. | Persons. | Males. | Females | Persons. | Males. | Females. | Persons. | Males. | Females. | Persons. | Males. | Females. | Persons. | Males. | Females. | |
| Auckland | 18,177 | 10,2l8 | 7,959 | 24,420 | 13,494 | 10,926 | 42,132 | 25,686 | 16,446 | 48,321 | 27,063 | 21,258 | 62,335 | 35,502 | 26,833 | 67,451 | 37,106 | 30,345 | 82,661 | 44,800 | 37,86l | 99,451 | 54,111 | 45,340 |
| Taranaki | 2,650 | 1,414 | 1,236 | 2,044 | 1,169 | 875 | 4,374 | 2,872 | 1,502 | 4,359 | 2,528 | 1,831 | 4,480 | 2,572 | 1,908 | 5,465 | 3,043 | 2,422 | 9,463 | 5,173 | 4,290 | 14,858 | 8.517 | 6,341 |
| Wellington | 11,753 | 6,524 | 5,229 | 12,566 | 6,626 | 5.940 | 14,987 | 8,342 | 6,645 | 21,950 | 12,401 | 9,549 | 24,001 | 13,180 | 10,821 | 29,790 | 16,246 | 13,544 | 51,069 | 27,877 | 23,192 | 61,371 | 32,717 | 28,654 |
| Hawke's Bay | 1,514 | 1,063 | 451 | 2,611 | 1,667 | 944 | 3,770 | 2,457 | 1,313 | 5,283 | 3,197 | 2,086 | 6,059 | 3,596 | 2,463 | 9,228 | 5,416 | 3,812 | 15,015 | 8,509 | 6,506 | 17,367 | 9,700 | 7,667 |
| Marlborough | … | … | … | 2,299 | 1,503 | 796 | 5,519 | 4,032 | 1,487 | 4,371 | 2,736 | 1,635 | 5,235 | 3,235 | 2,000 | 6,145 | 3,659 | 2,486 | 7,557 | 4,283 | 3,274 | 9,300 | 5,249 | 4,051 |
| Nelson (including Marlborough territory in 1858) | 9,272 | 5,203 | 4,069 | 9,952 | 5,337 | 4,615 | 11,910 | 6,706 | 5,204 | 23,814 | 16,425 | 7,389 | 22,501 | 14,257 | 8,244 | 22,558 | 13,545 | 9,013 | 25,128 | 14,385 | 10,743 | 26,075 | 14,800 | 11,275 |
| Westland | … | … | … | … | … | … | … | … | … | 15,533 | 11,877 | 3,656 | 15,357 | 10,453 | 4,904 | 14,860 | 9,473 | 5,387 | 16,932 | 10,577 | 6,355 | 15,010 | 9,075 | 5,935 |
| Canterbury (including Westland territory in 1858–61–64) | 8,967 | 5,301 | 3,666 | 16,040 | 8,939 | 7,101 | 32,276 | l8,931 | 13,345 | 38,333 | 21,206 | 17,127 | 46,801 | 25,781 | 21,020 | 58,775 | 32,294 | 26,481 | 91,922 | 50,424 | 41,498 | 112,182 | 60,590 | 51,592 |
| Otago (including Southland territory in 1858) | 6,995 | 3,904 | 3,091 | 27,163 | 21,161 | 6,002 | 49,019 | 32,692 | 16,327 | 48,577 | 29,773 | 18,804 | 60,722 | 36,771 | 23,951 | … | … | … | … | … | … | … | … | … |
| Otago (as after reunion with Southland) | … | … | … | … | … | … | … | … | … | … | … | … | … | … | … | 85,113 | 50,121 | 34,992 | 114,469 | 64,850 | 49,619 | 134,077 | 74,685 | 59,392 |
| Southland | … | … | … | 1,876 | 1,139 | 737 | 8,085 | 4,806 | 3,279 | 7,943 | 4,600 | 3,343 | 8,769 | 4,920 | 3,849 | … | … | … | … | … | … | … | … | … |
| Chatham Islands | 85 | 52 | 33 | 50 | 27 | 23 | 86 | 56 | 30 | 184 | 123 | 61 | 133 | 89 | 44 | 129 | 78 | 51 | 196 | 120 | 76 | 242 | 161 | 81 |
| Total | 59,413 | 33,679 | 25,734 | 99,021 | 61,062 | 37,959 | 172,158 | 106,580 | 65,578 | 218,668 | 131,929 | 86,739 | 256,393 | 150,356 | 106,037 | 299,514 | 170,981 | 128,533 | 414,412 | 230,998 | 183,414 | 489,933 | 269,605 | 220,328 |
Table VII. Table VII. Showing the Numerical Increase or Diminution of the Population (exclusive of Maoris) of each Provincial District in New Zealand in the respective Periods, December, 1858, to December, 1861; December, 1861, to December, 1864; December, 1864, to December, 1867; December, 1867, to February, 1871; February, 1871, to March, 1874; March, 1874, to March, 1878; March, 1878, to April, 1881.
| Provincial Districts. | Numerical Increase or Diminution. | ||||||||||||||||||||
|---|---|---|---|---|---|---|---|---|---|---|---|---|---|---|---|---|---|---|---|---|---|
| 1858 to 1861. | 1861 to 1864. | 1864 to 1867. | 1867 to 1871. | 1871 to 1874. | 1874 to 1878, | 1878 to 1881, | |||||||||||||||
| Persons. | Males. | Females. | Persons. | Males. | Females. | Persons. | Males. | Females. | Persons. | Males. | Females. | Persons. | Males. | Females. | Persons. | Males. | Females. | Persons. | Males. | Females. | |
| Auckland | 6,243 | 3,276 | 2,967 | 17,712 | 12,192 | 5,520 | 6,189 | 1,377 | 4,812 | 14,014 | 8,439 | 5,575 | 5,116 | 1,604 | 3,512 | 15,210 | 7,694 | 7,516 | 16,790 | 9,3 | 7,479 |
| Taranaki | −606 | −245 | −361 | 2,330 | 1,703 | 627 | −15 | −344 | 329 | 121 | 44 | 77 | 985 | 471 | 514 | 3,998 | 2,130 | 1,868 | 5,395 | 3,344 | 2,051 |
| Wellington | 8l3 | 102 | 711 | 2,421 | 1,716 | 705 | 6,963 | 4,059 | 2,904 | 2,051 | 779 | 1,272 | 5,789 | 3,066 | 2,723 | 21,279 | 11,631 | 9,648 | 10,302 | 4,840 | 5,462 |
| Hawke's Bay | 1,097 | 604 | 493 | 1,159 | 790 | 369 | 1,513 | 740 | 773 | 776 | 399 | 377 | 3,169 | 1,820 | 1,349 | 5,787 | 3,093 | 2,694 | 2,352 | 1,191 | 1,161 |
| Marlborough | … | … | … | 3,220 | 2,529 | 691 | −1,148 | −1,296 | 148 | 864 | 499 | 365 | 910 | 424 | 486 | 1,412 | 624 | 788 | 1,743 | 966 | 777 |
| Nelson including Marlborough territory, 1858–61) | 2,979 | 1,637 | 1,342 | 1,958 | 1,369 | 589 | 11,904 | 9,719 | 2,185 | −1,313 | −2,168 | 855 | 57 | − 712 | 769 | 2,570 | 840 | 1,730 | 947 | 415 | 532 |
| Westland | … | … | … | … | … | … | … | … | … | −176 | −1,424 | 1,248 | −497 | −980 | 483 | 2,072 | 1,104 | 968 | −1,922 | −1,502 | −420 |
| Canterbury (including Westland territory, 1858–61–64–67) | 7,073 | 3,638 | 3,435 | 16,236 | 9,992 | 6,244 | 2l,590 | 14,152 | 7,438 | 8,468 | 4,575 | 3,893 | 11,974 | 6,513 | 5,461 | 33,147 | 18,130 | 15,017 | 20,160 | 10,166 | 10,094 |
| Otago (including Southland territory, 1858–61) | 22,044 | 18,396 | 3,648 | 21,856 | 11,531 | 10,325 | −442 | −2,919 | 2,477 | 12,145 | 6,998 | 5,147 | … | … | … | … | … | … | … | … | … |
| Otago (as after reunion with Southland) | … | … | … | … | … | … | … | … | … | … | … | … | 15,622 | 8,430 | 7,192 | 29,356 | 14,729 | 14,627 | 19,608 | 9,835 | 9,773 |
| Southland | … | … | … | 6,209 | 3,667 | 2,542 | −142 | −206 | 64 | 826 | 320 | 506 | … | … | … | … | … | … | … | … | … |
| Chatham Islands | −35 | −25 | −10 | 36 | 29 | 7 | 98 | 67 | 31 | −51 | −34 | −17 | −4 | −11 | 7 | 67 | 42 | 25 | 46 | 41 | 5 |
| Total | 39,608 | 27,383 | 12,225 | 73,137 | 45,518 | 27,619 | 46,510 | 25,349 | 21,161 | 37,725 | 18,427 | 19,298 | 43,121 | 20,625 | 22,496 | 114,898 | 60,017 | 54,881 | 75,521 | 38,607 | 36,914 |
NOTE.—In cases where a decrease has taken place the minus sign (—) is prefixed to the numerical decrease.
Table VIII. Table VIII. Showing the Centesimal Increase or Decrease of the Population, and of the Males and Females (exclusive of Maoris), in each Provincial District of New Zealand in the respective Periods, December, 1858, to December, 1861; December, 1861,to December, 1864; December, 1864, to December, 1867; December, 1867, to February, 1871; February, 1871, to March, 1874; March, 1874, to March, 1878; March. 1878, to April, 1881.
| Provincial Districts. | Percentage of Increase or Diminution. | ||||||||||||||||||||
|---|---|---|---|---|---|---|---|---|---|---|---|---|---|---|---|---|---|---|---|---|---|
| 1858 to 1861. | 1861 to 1864. | 1864 to 1867. | 1867 to 1871. | 1871 to 1874. | 1874 to 1878, | 1878 to 1881, | |||||||||||||||
| Persons. | Males. | Females. | Persons. | Males. | Females. | Persons. | Males. | Females. | Persons. | Males. | Females. | Persons. | Males. | Females. | Persons. | Males. | Females. | Persons. | Males. | Females. | |
| Auckland | 34.35 | 32.06 | 37.28 | 72.53 | 90.35 | 50.52 | 14.69 | 5.36 | 29.26 | 29.06 | 31.18 | 26.23 | 8.21 | 4.52 | 13.09 | 22.55 | 20.74 | 24.77 | 20.31 | 20.78 | 19.75 |
| Taranaki | −22.87 | −17.33 | −29.21 | 113.99 | 145.68 | 71.66 | −0.34 | −11.98 | 21.90 | 2.76 | 1.74 | 4.21 | 21.99 | 18.31 | 26.94 | 73.16 | 70.00 | 77.13 | 57.01 | 64.64 | 47.81 |
| Wellington | 6.92 | 1.56 | 13.59 | 19.27 | 25.90 | 11.87 | 46.46 | 48.66 | 43.70 | 9.34 | 6.28 | 13.32 | 24.12 | 23.26 | 25.16 | 71.43 | 71.59 | 71.23 | 20.17 | 17.36 | 23.55 |
| Hawke's Bay | 72.46 | 56.82 | 109.31 | 44.39 | 47.39 | 39.09 | 40.33 | 30.11 | 58.87 | 14.69 | 12.48 | 18.07 | 52.30 | 50.6l | 54.77 | 62.71 | 57.11 | 70.67 | 15.66 | 14.00 | 17.84 |
| Marlborough | … | … | … | 140.06 | 168.26 | 86.81 | −20.80 | −32.14 | 9.95 | 19.77 | 18.24 | 22.32 | 17.38 | 13.11 | 24.30 | 22.98 | 17.05 | 31.70 | 33.06 | 22.55 | 23.73 |
| Nelson (including Marlborough territory, 1858–61) | 32.13 | 31.46 | 32.98 | 19.67 | 25.64 | 12.76 | 99.95 | 144.93 | 41.99 | −5.51 | −13.20 | 11.57 | .25 | −4.99 | 9.33 | 11.39 | 6.20 | 19.19 | 3.77 | 2.88 | 4.95 |
| Westland | … | … | … | … | … | … | … | … | … | −1.13 | −11.99 | 34.14 | −3.24 | −9.37 | 9.85 | 13.94 | 11.65 | 17.97 | −11.35 | −14.20 | −6.60 |
| Canterbury (including Westland territory, 1858–61–64–67) | 78.88 | 68.63 | 93.70 | 101.22 | 111.78 | 87.93 | 66.89 | 74.76 | 55.74 | 22.09 | 21.57 | 22.73 | 25.58 | 25.26 | 25.98 | 56.40 | 56.14 | 56.71 | 22.04 | 20.16 | 24.32 |
| Otago (including Southland territory, 1858.61) | 315.14 | 471.21 | 118.02 | 80.46 | 54.49 | 172.03 | −0.90 | −8.93 | 15.17 | 25.00 | 23.50 | 27.37 | … | … | … | … | … | … | … | … | … |
| Otago (as after reunion with Southland) | … | … | … | … | … | … | … | … | … | … | … | … | 22.48 | 20.22 | 25.87 | 34.49 | 29.39 | 41.80 | 17.13 | 15.17 | 19.70 |
| Southland | … | … | … | 330.97 | 321.95 | 344.91 | −1.76 | −4.29 | 1.95 | 10.40 | 6.96 | 15.14 | … | … | … | … | … | … | … | … | … |
| Chatham Islands | −41.18 | −48.08 | −30.30 | 72.00 | 107.41 | 30.43 | 113.95 | 119.64 | 103.33 | −27.72 | −27.64 | −27.87 | −3.01 | −12.36 | 15.91 | 51.94 | 53.85 | 49.02 | 23.47 | 34.17 | 6.58 |
| Total | 66.67 | 81.31 | 47.51 | 73.86 | 74.54 | 72.76 | 27.02 | 23.78 | 32.27 | 17.25 | 13.97 | 22.25 | 16.82 | 13.72 | 21.22 | 38.36 | 35.10 | 42.70 | 18.22 | 16.71 | 20.13 |
Note.—In cases where a decrease has taken place the minus sign (-) is prefixed to the centesimal decrease.
These percentages are calculated upon the total number of persons, the total number of the males, and the total number of the females in the first year of each of the above periods, the numbers of which are given in Table VI.
Table IX. Table IX. Showing the Number of Dwellings (Inhabited) of all Descriptions in each Provincial District at the last Five Censuses, exclusive of the Dwellings of Maoris.
| Provincial Districts. | Number of Inhabited Dwellings. | |||||||||
|---|---|---|---|---|---|---|---|---|---|---|
| 1867. | 1871. | 1874. | 1878. | 1881. | ||||||
| Exclusive of Tents. | Including Tents. | Exclusive of Tents. | Including Tents. | Exclusive of Tents. | Including Tents. | Exclusive of Tents. | Including Tents. | Exclusive of Tents. | Including Tents. | |
| Auckland | 10,016 | 10,509 | 13,467 | 13,667 | 14,009 | 14,136 | 16,318 | 16,495 | 18,995 | 19,418 |
| Taranaki | 1,042 | 1,057 | 966 | 987 | 1,126 | 1,155 | 1,856 | 1,881 | 2,698 | 2,938 |
| Wellington | 7,297 | 7,354 | 4,779 | 4,779 | 5,310 | 5,411 | 9,202 | 9,418 | 1,332 | 11,518 |
| Hawke's Bay | 1,066 | 1,075 | 1,180 | 1,215 | 1,587 | 1,648 | 2,816 | 2,853 | 3,178 | 3,237 |
| Marlborough | 1,127 | 1,134 | 969 | 1,012 | 1,174 | 1,197 | 1,444 | 1,467 | 1,711 | 1,796 |
| Nelson | 4,961 | 6,648 | 5,228 | 5,819 | 5,292 | 5,70 | 5,405 | 5,772 | 5,718 | 5,960 |
| Westland | 4,084 | 5,098 | 5,049 | 5,457 | 4,281 | 4 589 | 4,527 | 4,988 | 4,171 | 4,345 |
| Canterbury | 7,706 | 7,759 | 8,707 | 8,747 | 10,564 | 10,466 | 16,195 | 16,864 | 19,681 | 20,350 |
| Otago | 12,064 | 13,324 | 14,397 | 15,463 | 16,212 | 17,020 | 21,857 | 22,813 | 25,309 | 26,148 |
| Chatham Islands | 57 | 57 | 36 | 36 | 34 | 34 | 37 | 37 | 40 | 40 |
| Total | 49,420 | 54,015 | 54,778 | 57,182 | 59,389 | 61,356 | 79,657 | 82,588 | 92,833 | 95,750 |
Table X. Table X. Showing the Number of Females to 100 Males in each Provincial District for the last Five Censuses, exclusive of Maoris.
| Provincial Districts. | Number of Females to 100 Males. | ||||
|---|---|---|---|---|---|
| 1867. | 1871. | 1874. | 1878. | 1881. | |
| Auckland | 78.55 | 75.58 | 81.78 | 84.51 | 83.79 |
| Taranaki | 72.43 | 74.18 | 79 59 | 82.93 | 74.45 |
| Wellington | 77.00 | 82.10 | 83.37 | 83.19 | 87.58 |
| Hawke's Bay | 65.24 | 68.49 | 70.38 | 76.46 | 79.04 |
| Marlborough | 59.76 | 61.82 | 67.94 | 76.44 | 77.18 |
| Nelson | 44.99 | 57.82 | 66.4 | 74 68 | 76.18 |
| Westland | 30.78 | 46.91 | 56.87 | 60.08 | 65.40 |
| Canterbury | 80.76 | 81.53 | 82.00 | 82.30 | 85.15 |
| Otago | 64.43 | 66.68 | 69.82 | 76.51 | 79.52 |
| Chatham Islands | 49.59 | 49.44 | 65.38 | 63.33 | 50.31 |
| Total | 65.75 | 70.52 | 75.17 | 79.40 | 81.72 |
Table XI. Table XI. Showing the Area of each Provincial District, and the Number of Persons to the Square Mile in each, at the last Five Censuses, exclusive of Maoris.
| Provincial Districts. | Area in Acres. | Area in Square Miles. | Persons to a Square Mile. | ||||
|---|---|---|---|---|---|---|---|
| 1867. | 1871. | 1874. | 1878. | 1881. | |||
| Auckland | 17,000,000 | 26,563 | 1.819 | 2.347 | 2.539 | 3.112 | 3.744 |
| Taranaki | 2,290,000 | 3,578 | 1.218 | 1.252 | 1.527 | 2.645 | 4.152 |
| Wellington | 7,000,000 | 10,937 | 2.007 | 2.194 | 2.724 | 4.669 | 5.611 |
| Hawke's Bay | 2,950,000 | 4,609 | 1.146 | 1.315 | 2.002 | 3.258 | 3.768 |
| Marlborough | 2,720,000 | 4,250 | 1.028 | 1.232 | 1.446 | 1.778 | 2.325 |
| Nelson | 7,000,000 | 10,937 | 2.177 | 2.057 | 2.063 | 2.298 | 2.384 |
| Westland | 3,045,760 | 4,759 | 3.264 | 3.227 | 3.123 | 3.558 | 3.154 |
| Canterbury | 8,690,000 | 1,13,579 | 2.823 | 3.447 | 4.328 | 6.769 | 8.259 |
| Otago | 16,038,400 | 25,060 | 2.255 | 3.773 | 3.396 | 4.568 | 5.350 |
| Chatham'Islands | 241,000 | 377 | .488 | .353 | .342 | .520 | .642 |
| Total | 66,818,160 | 104,403 | 2.094 | 2.456 | 2.869 | 3.969 | 4.693 |
Table XII. Table XII. Showing the Area of each Provincial District, and the Number of Inhabited Dwellings to the Square Mile in each, at the last Five Censuses (exclusive of Dwellings of Maoris).
| Provincial Districts. | Area in Acres. | Area in Square Miles | Inhabited Dwellings per Square Mile. | |||||||||
|---|---|---|---|---|---|---|---|---|---|---|---|---|
| 1867. | 1871. | 1874. | 1878. | 1881. | ||||||||
| Exclusive of Tents. | Including Tents. | Exclusive of Tents. | Including Tents. | Exclusive of Tents. | Including Tents. | Exclusive of Tents. | Including Tents. | Exclusive of Tents. | Including Tents. | |||
| Auckland | 17,000,000 | 26,563 | .377 | .366 | .507 | .515 | .527 | .532 | .614 | .621 | .715 | .731 |
| Taranaki | 2,290,000 | 3,578 | .291 | .295 | .270 | .276 | .315 | .323 | .519 | .526 | .754 | .821 |
| Wellington | 7,000,000 | 10,937 | .667 | .672 | .437 | .437 | .486 | .495 | .841 | .861 | 1.036 | 1.053 |
| Hawke's Bay | 2,950,000 | 4,609 | .231 | .233 | .256 | .264 | .344 | .358 | .611 | .619 | .689 | .702 |
| Marlborough | 2,560,000 | 4,000 | .280 | .283 | .241 | .253 | .293 | .299 | .361 | .367 | .428 | .449 |
| Nelson | 7,000,000 | 10,937 | .454 | .608 | .478 | .532 | .484 | .521 | .494 | .528 | .523 | .545 |
| Westland | 3,045,760 | 4,759 | .858 | 1.071 | 1.061 | 1.147 | .900 | .694 | .951 | 1.048 | .876 | .913 |
| Canterbury | 8,693,000 | 13,583 | .567 | .571 | .641 | .644 | .763 | .770 | 1.192 | 1.242 | 1.448 | 1.498 |
| Otago | 16,038,400 | 25,060 | .481 | .531 | .575 | .617 | .647 | .679 | .872 | .910 | 1.010 | 1.043 |
| Chatham Islands | 241,000 | 377 | .151 | .151 | .095 | .095 | .090 | .090 | .098 | .098 | .106 | .106 |
| Total | 66,818,160 | 104,403 | .473 | .517 | .525 | .548 | .569 | .588 | .763 | .791 | .889 | .917 |
Table XIII. Table XIII. Showing the Number of Persons to each Inhabited Dwelling at the last Five Censuses (exclusive of Maoris).
| Provincial Districts. | Persons to an Inhabited Dwelling. | ||||
|---|---|---|---|---|---|
| 1867. | 1871. | 1874. | 1878. | 1881. | |
| Calculated Including Tents. | Calculated Including Tents. | Calculated Including Tents. | Calculated Including Tents. | Calculated Including Tents. | |
| Auckland | 4.60 | 4.56 | 4.77 | 5.01 | 5.12 |
| Taranaki | 4.12 | 4.54 | 4.73 | 5.03 | 5.06 |
| Wellington | 2.98 | 5.02 | 5.51 | 5.42 | 5.33 |
| Hawke's Bay | 4.91 | 4.99 | 5.60 | 5.26 | S.37 |
| Marlborough | 3.85 | 5.87 | 5.13 | 5.15 | 5.18 |
| Nelson | 3.58 | 3.87 | 3.95 | 4.35 | 4.37 |
| Westland | 3.05 | 2.81 | 3.24 | 3.39 | 3.45 |
| Canterbury | 4.94 | 5.35 | 5.62 | 5.45 | 5.51 |
| Otago | 4.24 | 4.49 | 5.00 | 5.02 | 5.13 |
| Chatham Islands | 3.23 | 3.69 | 3.79 | 5.30 | 6.05 |
| Total | 4.05 | 4.48 | 4.88 | 5.02 | 5.12 |
Table XIV. Table XIV. Showing, according to the Censuses of 1878 and 1881, the Population (exclusive of Maoris) of certain Cities, Boroughs, and Townships.
| Cities, Boroughs, and Towns, arranged according to Provincial Districts. | 1878. | 1881. | ||||
|---|---|---|---|---|---|---|
| Persons. | Males. | Females. | Persons. | Males. | Females. | |
| AUCKLAND:— | ||||||
| Auckland | 13,758 | 6,986 | 6,772 | 16,664 | 8,651 | 8,013 |
| Mongonui | 123 | 67 | 56 | 102 | 56 | 46 |
| Kawakawa | 434 | 245 | 189 | 438 | 255 | 183 |
| Russell | 194 | 91 | 103 | 237 | 106 | 131 |
| Aratapu | 277 | 151 | 126 | 455 | 260 | 195 |
| Dargaville | 176 | 114 | 62 | 192 | 121 | 71 |
| Kopuru | 215 | 134 | 81 | 216 | 131 | 85 |
| Whangarei | 223 | 115 | 108 | 495 | 264 | 231 |
| Warkworth | 111 | 54 | 57 | 146 | 69 | 77 |
| Helensville | 243 | 150 | 93 | 326 | 194 | 132 |
| Riverhead | 105 | 67 | 38 | 106 | 68 | 38 |
| Hobsonville | 84 | 46 | 38 | 181 | 107 | 74 |
| Devonport | 993 | 471 | 522 | 1,319 | 625 | 694 |
| Parnell | 2,708 | 1,320 | 1,388 | 3,529 | 1,726 | 1,803 |
| Onehunga | 2,043 | 942 | 1,101 | 2,217 | 1,047 | 1,170 |
| Panmure | 312 | 156 | 156 | 421 | 201 | 220 |
| Howick | 211 | 91 | 120 | 237 | 106 | 131 |
| Otahuhu | 773 | 390 | 383 | 834 | 422 | 412 |
| Drury | No | informa- | tion. | 121 | 64 | 57 |
| Mercer | 165 | 89 | 76 | 118 | 58 | 60 |
| Rangiriri | 64 | 39 | 25 | 114 | 51 | 63 |
CITIES AND TOWNS, 1874 AND 1878.
Table XIV. Table XIV. Showing, according to the Censuses of 1878 and 1881, the Population (exclusive of Maoris) of certain Cities, Boroughs, and Townships—continued.
| Cities, Boroughs, and Towns, arranged according to Provincial Districts. | 1878. | 1881. | ||||
|---|---|---|---|---|---|---|
| Persons. | Males. | Females. | Persons. | Males. | Females. | |
| AUCKLAND:— continued | ||||||
| Huntly | 68 | 43 | 25 | 240 | 132 | 108 |
| Newcastle | 277 | 154 | 123 | 213 | 112 | 101 |
| Hamilton | 1,243 | 675 | 568 | 1,361 | 700 | 661 |
| Cambridge | 598 | 349 | 249 | 1,174 | 647 | 527 |
| Alexandra | 209 | 100 | 109 | 207 | 102 | 102 |
| Raglan | 68 | 36 | 32 | 70 | 41 | 39 |
| Coromandel | 1,086 | 599 | 487 | 687 | 379 | 308 |
| Thames | 5,424 | 2,855 | 2,569 | 4,563 | 2,538 | 2,325 |
| Hastings | 131 | 79 | 52 | 120 | 76 | 44 |
| Tauranga | 793 | 425 | 368 | 1,253 | 653 | 600 |
| Opotiki | 388 | 206 | 182 | 440 | 234 | 206 |
| Gisborne | 1,204 | 667 | 537 | 1,737 | 959 | 778 |
| Ormond | 187 | 120 | 67 | 292 | 166 | 126 |
| TARANAKI:— | ||||||
| New Plymouth | 3,680 | 1,318 | 1,362 | 3,310 | 1,673 | 1,637 |
| Raleigh | 185 | 93 | 92 | 361 | 191 | 170 |
| Tikorangi | 206 | 107 | 99 | 267 | 147 | 120 |
| Inglewood | 484 | 272 | 212 | 395 | 210 | 185 |
| Opunake | 38 | 16 | 22 | 111 | 61 | 50 |
| Normanby | 136 | 80 | 56 | 399 | 243 | 156 |
| Hawera | 377 | 225 | 152 | 913 | 539 | 404 |
| Manutahi | 101 | 56 | 45 | 89 | 54 | 35 |
| Kakaramea | 59 | 37 | 22 | 116 | 68 | 48 |
| Carlyle | 405 | 234 | 171 | 834 | 481 | 353 |
| WELLINGTON:— | ||||||
| Wellington | 18,953 | 9,760 | 9,193 | 20,563 | 10,226 | 10,337 |
| Waverley | 291 | 156 | 135 | 380 | 205 | 175 |
| Waitotara | 66 | 35 | 31 | 115 | 60 | 55 |
| Wanganui | 3,661 | 1,906 | 1,755 | 4,646 | 2,330 | 2,316 |
| Turakina (Lethbridge) | 304 | 159 | 145 | 314 | 164 | 150 |
| Marlon | 593 | 334 | 259 | 662 | 363 | 299 |
| Bull's | 611 | 326 | 285 | 642 | 324 | 318 |
| Halcombe | 532 | 307 | 225 | 574 | 297 | 277 |
| Feilding | 759 | 418 | 341 | 919 | 477 | 442 |
| Sandon | 396 | 235 | 161 | 343 | 193 | 150 |
| Palmerston North | 880 | 469 | 411 | 1,366 | 723 | 643 |
| Foxton | 563 | 300 | 263 | 728 | 404 | 324 |
| Otaki | 197 | 129 | 68 | 248 | 141 | 107 |
| Featherston | 494 | 280 | 214 | 485 | 273 | 212 |
| Greytown | 724 | 389 | 335 | 1,078 | 061 | 517 |
| Carterton | 446 | 242 | 204 | 660 | 348 | 312 |
| Masterton | 1,673 | 912 | 761 | 2,241 | 1,155 | 1,086 |
| HAWKE'S BAY:— | ||||||
| Napier | 5,415 | 2,776 | 2,639 | 5,756 | 2,896 | 2,860 |
| Clyde | 240 | 125 | 115 | 380 | 193 | 187 |
| Frasertown (Te Kapu) | 138 | 80 | 58 | 131 | 75 | 56 |
| Meanee | 308 | 181 | 127 | 275 | 153 | 122 |
| Taradale | 590 | 307 | 283 | 585 | 315 | 270 |
| Hastings | 391 | 220 | 171 | 617 | 334 | 283 |
| Waipawa | 496 | 259 | 237 | 390 | 216 | 174 |
| Porangahau | 62 | 34 | 28 | 118 | 68 | 53 |
| Waipukurau | 356 | 207 | 49 | 326 | 172 | 154 |
| MARLBOROUGH:— | ||||||
| Blenheim | 1,701 | 874 | 827 | 2,107 | 1,051 | 1,056 |
| Picton | 703 | 351 | 352 | 834 | 401 | 433 |
| Havelock | 324 | 168 | 156 | 344 | 185 | 159 |
| Renwick | 240 | 119 | 121 | 297 | 142 | 155 |
| Kaikoura | 184 | 101 | 83 | 257 | 139 | 318 |
| Redwood | 53 | 24 | 29 | 127 | 62 | 65 |
| Grovetown | 69 | 44 | 25 | 182 | 103 | 79 |
| NELSON:— | ||||||
| Nelson | 6,604 | 3,189 | 3,415 | 6,764 | 3,261 | 3,503 |
| Collingwood | 157 | 83 | 74 | 152 | 83 | 69 |
| Lyell | 126 | 83 | 43 | 160 | 106 | 54 |
| Westport | 1,166 | 638 | 528 | 1,013 | 538 | 475 |
| Charleston | 185 | 105 | 80 | 244 | 143 | 101 |
| Capelston | 127 | 93 | 34 | 123 | 77 | 46 |
| Ahaura | 209 | 122 | 87 | 205 | 116 | 89 |
| Reefton | 1,031 | 618 | 413 | 963 | 570 | 393 |
| Black's Point | 314 | 213 | 101 | 313 | 179 | 134 |
| Cobden | 170 | 92 | 78 | 154 | 77 | 77 |
| Dunganville | 104 | 62 | 42 | 158 | 109 | 49 |
| WESTLAND:— | ||||||
| Hokitika | 3,202 | 1,633 | 1,569 | 2,600 | 1,264 | 1,336 |
| Greymouth | 2,921 | 1,612 | 1,309 | 2,544 | 1,331 | 1,213 |
| Kanieri | 162 | 85 | 77 | 132 | 71 | 61 |
| Stafford | 178 | 101 | 77 | 161 | 80 | 71 |
| Goldsborough | 193 | 116 | 77 | 197 | 105 | 92 |
| Ross | 1,068 | 566 | 502 | 1,139 | 647 | 492 |
| Kumara | 1,275 | 744 | 531 | 1,145 | 622 | 523 |
Table XIV. Table XIV. Showing, according to the Censuses of 1878 and 1881, the Population (exclusive of Maoris) of certain Cities, Boroughs, and Townships—continued.
| Cities, Boroughs, and Towns, arranged according to Provincial Districts. | 1878. | 1881. | ||||
|---|---|---|---|---|---|---|
| Persons. | Males. | Females. | Persons. | Males. | Females. | |
| * These towns were constituted boroughs since 1878. The borough boundaries may not be the same as those taken for the towns in the earlier Census. | ||||||
| CANTERBURY:— | ||||||
| Christchurch | 13,425 | 6,904 | 6,521 | 15,213 | 7,734 | 7,479 |
| Sydenham | 6,510 | 3,339 | 3,171 | 8,460 | 4,290 | 4,170 |
| Lyttelton | 3,476 | 1,828 | 1,648 | 4,127 | 2,205 | 1,922 |
| Kaiapoi | 1,083 | 547 | 536 | 1,221 | 594 | 627 |
| Rangiora | 1,616 | 843 | 803 | 1,445* | 743 | 702 |
| Amberley (and vicinity) | 537 | 279 | 258 | 764 | 398 | 366 |
| Oxford | 1,429 | 750 | 679 | 1,469 | 793 | 676 |
| Akaroa | 642 | 307 | 335 | 611 | 296 | 315 |
| Sumner | 269 | 135 | 134 | 326 | 152 | 174 |
| Woolston | 544 | 204 | 250 | 891 | 483 | 408 |
| Lincoln | 334 | 186 | 148 | 429 | 227 | 203 |
| Leeston | 319 | 161 | 158 | 331 | 164 | 167 |
| Southbridge | 547 | 305 | 242 | 634 | 341 | 293 |
| Ashburton | 1,077 | 623 | 454 | 1,526* | 844 | 682 |
| Rakaia | 217 | 127 | 90 | 318 | 185 | 133 |
| Timaru | 3,389 | 1,764 | 1,625 | 3,917 | 2,117 | 1,800 |
| Geraldine | 498 | 271 | 227 | 734 | 391 | 343 |
| Arowhenua | 264 | 143 | 121 | 375 | 201 | 174 |
| Wallingford | 531 | 291 | 240 | 704 | 383 | 321 |
| Winchester | 238 | 128 | 110 | 377 | 201 | 176 |
| Waimate | 327 | 172 | 155 | 1,600* | 870 | 730 |
| OTAGO:— | ||||||
| Dunedin | 22,525 | 11,599 | 10,926 | 24,372 | 12,246 | 12,126 |
| Port Chalmers | 1,827 | 907 | 920 | 2,181 | 1,156 | 1,025 |
| Oamaru | 4,927 | 2,567 | 2,360 | 5,791 | 3,007 | 2,784 |
| Herbert | 249 | 146 | 103 | 354 | 189 | 165 |
| Hampden | 200 | 150 | 140 | 527 | 180 | 147 |
| St. Bathans | 173 | 94 | 79 | 190 | 94 | 96 |
| Naseby | 546 | 326 | 220 | 560 | 322 | 238 |
| Hamilton's | 123 | 91 | 32 | 19 | 10 | 9 |
| Hyde | 121 | 73 | 48 | 49 | 38 | 11 |
| Macrae's | 120 | 67 | 53 | 200 | 139 | 61 |
| Palmerston | 814 | 461 | 353 | 968 | 518 | 450 |
| West Hawkesbury | 468 | 242 | 226 | 415 | 206 | 209 |
| East Hawkesbury | 234 | 115 | 119 | 353 | 162 | 191 |
| Mansford | 286 | 139 | 147 | 305 | 152 | 153 |
| North-East Valley | 1,799 | 940 | 859 | 2,754 | 1,410 | 1,344 |
| West Harbour | 926 | 477 | 449 | 1,213 | 635 | 578 |
| Roslyn | 1,565 | 762 | 803 | 2,875 | 1,428 | 1,447 |
| Caversham | 3,425 | 1,772 | 1,653 | 3,989 | 2,061 | 1,928 |
| Mornington | 2,208 | 1,062 | 1,146 | 2,886 | 1,396 | 1,490 |
| Maori Hill | 344 | 186 | 158 | 1,136 | 605 | 531 |
| St. Kilda | 546 | 293 | 253 | 773 | 383 | 390 |
| Dunedin South | 1,690 | 820 | 870 | 2,796 | 1,431 | 1,365 |
| Green Island | 415 | 217 | 198 | 462 | 230 | 232 |
| Greytown | 237 | 135 | 102 | 262 | 147 | 115 |
| Mosgiel | 399 | 193 | 206 | 418 | 203 | 215 |
| Outram | 385 | 223 | 162 | 272 | 147 | 125 |
| Milton | 1,161 | 601 | 560 | 1,287 | 647 | 640 |
| Fairfax | 364 | 193 | 171 | 276 | 134 | 142 |
| Kaitangata | 135 | 74 | 61 | 394 | 204 | 190 |
| Balclutha | 819 | 445 | 374 | 820 | 439 | 381 |
| Clinton | 257 | 145 | 112 | 363 | 204 | 159 |
| Havelock | 384 | 233 | 151 | 428 | 280 | 148 |
| Lawrence | 855 | 454 | 401 | 1,009 | 510 | 499 |
| Tapanui | 335 | 188 | 147 | 592 | 304 | 288 |
| Roxburgh | 253 | 156 | 97 | 277 | 166 | 111 |
| Alexandra | 200 | 104 | 96 | 275 | 164 | 111 |
| Clyde | 312 | 169 | 143 | 340 | 185 | 155 |
| Cromwell | 424 | 249 | 175 | 429 | 228 | 201 |
| Queenstown | 574 | 301 | 273 | 735 | 440 | 295 |
| Arrowtown | 363 | 207 | 156 | 418 | 238 | 180 |
| Macetown | 169 | 138 | 31 | 135 | 102 | 33 |
| Invercargill | 3,761 | 1,923 | 1,838 | 4,596 | 2,373 | 2,223 |
| Invercargill South | 530 | 271 | 259 | 923 | 475 | 448 |
| Invercargill East | 619 | 301 | 318 | 785 | 411 | 374 |
| Invercargill North | 408 | 212 | 196 | 670 | 338 | 332 |
| Gladstone | 228 | 103 | 125 | 268 | 130 | 138 |
| Campbelltown | 197 | 96 | 101 | 351 | 177 | 174 |
| Avenal | 311 | 151 | 160 | 372 | 182 | 190 |
| Winton | 176 | 96 | 80 | 230 | 134 | 96 |
| West Gore | 187 | 116 | 71 | 374 | 217 | 157 |
| East Gore | 26 | 17 | 9 | 195 | 113 | 82 |
| Lumsden | 70 | 48 | 22 | 301 | 180 | 121 |
| Riverton | 867 | 455 | 412 | 1,187 | 679 | 508 |
Table XV. Table XV. Showing the Population (exclusive of Maoris) and Dwellings in the Colony of New Zealand on the 3rd April, 1881, as existing in Counties, Boroughs, Islands, and on Shipboard.
| — | Total (including Chinese and Half-castes). | Chinese. | Half-castes. | Dwellings. | * Europeans Living | Travellers and Persons Sleeping under Drays or Camping out | * Chinese Living | ||||||||||||||||||||||||||||||
|---|---|---|---|---|---|---|---|---|---|---|---|---|---|---|---|---|---|---|---|---|---|---|---|---|---|---|---|---|---|---|---|---|---|---|---|---|---|
| House and Huts | Tents and Dwellings with Canvas Roofs. | Inhabited. | Uninhabited and Building. | In Houses of Brick Stone,Wood, Iron, or lath and Plaster. | In Huts or Houses of Cob, Sod, Raupo, &c. and Habitations of Unstated Materials. | In Tents or Dwelling with Canvas Roofs. | |||||||||||||||||||||||||||||||
| Materials | Rooms | Materials | In Houses of Brick, Stone Wood, Iron, or Lath and Plaster. | In Huts or Houses of Cob, Sod, Raupo, &c. | In Habitations of unstated Materials | In Tents or Dwellings with Canvas Roofs | |||||||||||||||||||||||||||||||
| Persons. | Males | Females. | Males | Females. | Males | Females. | Inhabited. | Uninhabited. | Building. | Brick, Stone or Concrete | Wood, Iron, or Lath and Plaster. | Cob or Sod. | Miscellaneous | Huts of Sod, Clay, Wood, Stone, &c. | Raupo | Tents and Dwellings with Canvas Roofs | Not Stated | One | Two | Three and Four. | Five and Six. | Over Six. | Not Stated. | Brick or Stone. | Wood and Iron. | Other Materials, and Not Stated. | |||||||||||
| Brick, Stone, Wood, Iron,&c. | Cob, Raupo, &c. and Huts or Tents. | ||||||||||||||||||||||||||||||||||||
2,916 persons on shipboard are not included, 54 of whom are Chinese. † By “The Counties Act, 1876,” it is provided that boroughs shall not be included in counties. ‡These islands are not within the boundaries of the neighbouring Counties, but the inhabitants have been included in the population of the North Island. §This number differs from the number above by 46 persons on board ship. | |||||||||||||||||||||||||||||||||||||
| Counties† | 291,238 | 166,784 | 124,454 | 14,140 | … | 915 | 850 | 56,083 | 3,803 | 464 | 2,817 | 1,417 | 47,258 | 2,362 | 2,199 | 2,139 | 357 | 2,817 | 351 | 3,352 | 5,840 | 10,294 | 19,613 | 10,621 | 8,467 | 713 | 55 | 3,315 | 897 | 255,448 | 24,363 | 1,463 | 5,749 | 75 | 1,508 | 2,227 | 405 |
| Boroughs† | 194,981 | 99,605 | 95,376 | 799 | 9 | 105 | 135 | 36,580 | 2,922 | 384 | 88 | 2,333 | 33,940 | 120 | 74 | 65 | 1 | 88 | 47 | 683 | 163 | 4,442 | 15,397 | 8,685 | 6,849 | 449 | 255 | 3,003 | 48 | 192,787 | 1,002 | 237 | 141 | 6 | 751 | 51 | 6 |
| Islands adjacent to New Zealand‡ | 602 | 384 | 218 | … | … | 7 | 2 | 130 | 12 | … | 12 | 1 | 95 | … | 17 | 3 | 12 | 12 | 2 | 4 | 33 | 18 | 46 | 23 | 15 | 3 | … | 11 | 1 | 506 | 76 | 5 | 15 | … | … | … | … |
| Chatham Islands§ | 196 | 115 | 81 | 2 | … | 3 | 5 | 40 | … | … | … | 1 | 24 | … | 11 | … | … | … | 4 | … | 2 | 4 | 8 | 9 | 13 | 4 | … | … | … | 122 | 54 | 18 | … | … | 2 | … | … |
| On Shipboard | 2,916 | 2,717 | 199 | 54 | … | 22 | … | … | … | … | … | … | … | … | … | … | … | … | … | … | … | … | … | … | … | … | … | … | … | … | … | … | … | … | … | … | … |
| Total for colony | 489,933 | 269,605 | 220,328 | 4,995 | 9 | 1,052 | 992 | 92,833 | 6,737 | 848 | 2,917 | 3,752 | 81,317 | 2,482 | 2,301 | 2,207 | 370 | 2,917 | 404 | 4,039 | 6,038 | 14,758 | 35,064 | 19,338 | 15,344 | 1,169 | 310 | 6,329 | 946 | 448,863 | 25,495 | 1,723 | 5,905 | 81 | 2,261 | 2,278 | 411 |
| North Island | 193,047 | 105,045 | 88,002 | 209 | 3 | 769 | 744 | 36,203 | 2,685 | 478 | 908 | 541 | 34,267 | 16 | 774 | 153 | 360 | 908 | 92 | 1,131 | 1,677 | 4,824 | 13,884 | 8,310 | 6,865 | 420 | 49 | 2,899 | 215 | 184,843 | 3,944 | 322 | 2,155 | 30 | 156 | 2 | … |
| Middle Island | 296,349 | 164,235 | 132,114 | 4,783 | 6 | 221 | 189 | 56,528 | 4,041 | 370 | 2,007 | 3,210 | 46,967 | 2,466 | 1,516 | 2,052 | 10 | 2,007 | 307 | 2,906 | 4,355 | 9,911 | 21,143 | 11,016 | 8,461 | 743 | 26l | 3,419 | 731 | 263,621 | 21,490 | 1,378 | 3,745 | 51 | 2,102 | 2,276 | 411 |
| Stewart Island | 295 | 164 | 131 | 1 | 57 | 54 | 62 | 11 | … | 2 | … | … | 59 | … | … | 2 | … | 2 | 1 | 2 | 4 | 19 | 29 | 3 | 5 | 2 | … | 11 | … | 277 | … | 7 | 5 | 5 | … | 1 | … |
| Chatham Islands § | 242 | 161 | 81 | 2 | 5 | 5 | 40 | … | … | … | 1 | 24 | … | 11 | … | … | … | 4 | … | 2 | … | 4 | 8 | 9 | 13 | 4 | … | … | … | 122 | … | 54 | 18 | … | … | 2 | … |
| Total for colony | 489,933 | 269,605 | 220,328 | 4,995 | 9 | 1,052 | 992 | 92,833 | 6,737 | 848 | 2,917 | 3,752 | 81,317 | 2,482 | 2,301 | 2,207 | 370 | 2,917 | 404 | 4,039 | 6,038 | 14,758 | 35,064 | 19,338 | 15,344 | 1,169 | 310 | 6,329 | 946 | 448,863 | 25,495 | 1,723 | 5,905 | 81 | 2,261 | 2,278 | 411 |
| Counties*(Boroughs not included, see foot note) | Total (including Chinese and Half-castes). | Chinese. | Half-castes. | Dwellings. | (d) Europeans Living— | Travellers and Persons Sleeping under or Camping out | Chinese Living | ||||||||||||||||||||||||||||||
|---|---|---|---|---|---|---|---|---|---|---|---|---|---|---|---|---|---|---|---|---|---|---|---|---|---|---|---|---|---|---|---|---|---|---|---|---|---|
| House and Huts | Tents and Dwellings with Canvas Roofs. | Inhabited. | Uninhabited and Building. | In Houses of Brick Stone,Wood, Iron, or lath and Plaster. | In Huts of Houses of Cob, Sod, Raupo, &c.and Habitations of Unstated Materials. | In Tents or Dwelling with Canvas Roofs. | |||||||||||||||||||||||||||||||
| Materials | Rooms | Materials | In Houses of Brick, Stone Wood. Iron, or Lath and Plaster. | In Huts or Houses of Cob, Sod, Raupo, &c. | In Habitations of unstated Materials | In Tents or Dwellings with Canvas Roofs | |||||||||||||||||||||||||||||||
| Persons. | Males | Females. | Males | Females. | Males | Females. | Inhabited. | Uninhabited. | Building. | Brick, Stone or Concrete | Wood, Iron, or Lath and Plaster. | Cob or Sod. | Raupo | Huts of Sod, Clay, Wood, Stone, &c. | Tents and Dwellings with Canvas Roofs | Other Materials, or Not Stated, (c) | One | Two | Three and Four. | Five and Six. | Over Six. | Not Stated. | Brick or Stone. | Wood and Iron. | Other Materials, and Not Stated. | ||||||||||||
| Brick, Stone, Wood, Iron,&c. | Cob, Raupo, &c. and Huts or Tents. | Europeans. | Chinese. | ||||||||||||||||||||||||||||||||||
* The population of the ridings in the different counties will be found in Table XXIV., which also shows the distribution of the people within the ridings. The boroughs are not included in the counties. The population of the counties, together with that of the respective interior boroughs, is shown in Table XIX. | |||||||||||||||||||||||||||||||||||||
| Mongonui | 1,471 | 871 | 600 | … | … | 59 | 66 | 265 | 1 | 1 | 12 | 2 | 238 | … | 14 | 7 | 4 | 8 | 12 | 4 | 8 | 21 | 25 | 87 | 62 | 66 | 5 | … | 2 | … | 1,332 | 86 | 10 | 43 | … | … | … |
| Bay of Islands | 2,l84 | 1,258 | 926 | 1 | 31 | 35 | 442 | 21 | 1 | 6 | 4 | 370 | 1 | 40 | 3 | 12 | 6 | 2 | 25 | 43 | 96 | 140 | 49 | 82 | 13 | 19 | 4 | 1,944 | 165 | 57 | 17 | … | 1 | … | … | … | … |
| Hokianga | 587 | 367 | 220 | … | 45 | 64 | 118 | 0 | 1 | … | … | 98 | … | 8 | 1 | 9 | … | 2 | 8 | 17 | 24 | 33 | 19 | 16 | 1 | … | 3 | 1 | 490 | 79 | 18 | … | … | … | … | … | … |
| Hobson | … | 2,851 | 1,751 | 1,09 | … | 32 | 27 | 569 | 27 | 2 | 35 | … | 486 | 1 | 46 | 5 | 29 | 35 | 2 | 35 | 85 | 91 | 200 | 100 | 77 | 13 | … | 27 | 2 | 2,515 | 267 | 7 | 158 | 1 | … | … | … |
| Whangarei | … | 3,953 | 2,245 | 1,708 | … | 4 | 771 | 9 | 10 | 29 | 2 | 666 | 3 | 75 | 3 | 15 | 29 | 4 | 36 | 108 | 105 | 234 | 177 | 129 | 11 | … | 6 | 13 | 3,645 | 242 | 9 | 55 | 2 | … | … | … | … |
| Rodney | 3,287 | 1,802 | 1,485 | … | 3 | 1 | 628 | 14 | 5 | 24 | 2 | 586 | 1 | 23 | 4 | 12 | 24 | … | 22 | 35 | 83 | 197 | 179 | 116 | … | … | 110 | … | 3,655 | 91 | … | 41 | … | … | … | … | … |
| Waitemata | … | 4,522 | 2,608 | 1,914 | … | 7 | 10 | 993 | 73 | 20 | 37 | 9 | 780 | 1 | 16 | 3 | 36 | 37 | 3 | 35 | 76 | 160 | 268 | 198 | 187 | 6 | 83 | 3,997 | 446 | 110 | 63 | … | … | … | … | … | … |
| Eden | 17,593 | 8,785 | 8,808 | 27 | 5 | 16 | 3,160 | 178 | 113 | 11 | 78 | 3,077 | … | 3 | 1 | … | 2 | 1 | 21 | 4 | 119 | 1,207 | 997 | 805 | 91 | 266 | 24 | 17,548 | 115 | 1 | 2 | … | 27 | … | … | … | … |
| Manukau | 10,274 | 5,466 | 4,858 | … | 16 | 19 | 1,887 | 55 | 29 | 4 | 8 | 1,832 | 1 | 36 | 2 | 8 | 4 | … | 24 | 31 | 210 | 805 | 495 | 324 | 21 | 112 | 1 | 10,110 | 155 | … | 9 | … | ... | … | … | … | … |
| Coromandel | 2,153 | 1,355 | 798 | 32 | 20 | 489 | 63 | 2 | 23 | 1 | 413 | … | 5 | 17 | 3 | 23 | … | 51 | 46 | 103 | 178 | 75 | 52 | 3 | 57 | 8 | 2,043 | 60 | … | 49 | … | 1 | … | … | … | … | |
| Thames | 1,179 | 2,935 | 2,214 | 7 | 42 | 36 | 1,055 | 118 | 4 | 33 | 1 | 985 | 1 | 34 | 13 | 14 | 33 | 4 | 76 | 77 | 131 | 515 | 196 | 87 | 6 | … | 16 | 4,909 | 184 | 19 | 57 | 3 | 7 | … | … | … | … |
| Piako | 981 | 713 | 268 | … | 5 | 6 | 168 | 5 | 2 | 98 | … | 152 | … | 6 | 1 | 8 | 98 | 1 | 23 | 110 | 28 | 49 | 29 | 20 | 7 | … | 6 | 1 | 747 | 39 | 2 | 193 | … | … | … | … | … |
| Tauranga | 2,599 | 1,447 | 1,152 | 2 | 56 | 65 | 528 | 27 | 11 | 37 | 2 | 483 | … | 5 | 10 | 27 | 37 | 1 | 33 | 63 | 77 | 201 | 89 | 100 | 1 | 37 | … | 2,411 | 88 | 1 | 92 | 5 | 2 | … | … | … | … |
| Whakatane | 913 | 527 | 386 | … | 31 | 34 | 210 | 17 | 4 | 1 | … | 188 | 17 | 1 | 4 | 1 | … | 14 | 13 | 37 | 90 | 32 | 27 | 1 | … | 19 | 2 | 557 | 52 | … | 2 | 2 | … | … | … | … | … |
| Cook | 1,740 | 1,035 | 705 | 1 | 34 | 36 | 366 | 33 | … | 17 | 2 | 342 | 1 | 13 | 2 | 6 | 17 | … | 24 | 2S | 92 | 110 | 61 | 67 | 1 | … | 32 | 1 | 1,644 | 51 | … | 41 | 3 | 1 | … | … | … |
| Wairoa | 1,009 | 597 | 412 | … | 33 | 205 | 10 | 2 | 8 | … | 189 | … | 11 | 1 | 4 | 5 | 3 | 7 | 12 | 43 | 67 | 49 | 34 | 4 | … | 7 | 5 | 939 | 46 | 8 | 16 | … | … | … | … | … | … |
| East Taupo | 126 | 93 | 33 | … | 5 | 1 | 24 | 2 | … | 4 | … | 21 | … | … | … | 2 | 4 | 1 | 2 | 5 | 7 | 8 | … | 6 | … | … | 2 | … | 112 | 4 | 1 | 9 | … | … | … | … | … |
| West Taupo | 11 | 8 | 3 | … | 2 | … | 5 | … | … | … | … | 3 | … | … | 1 | 1 | … | … | … | 2 | 1 | 1 | 1 | … | … | … | … | … | 10 | 1 | … | … | … | … | … | … | … |
| Waipa | 3,097 | 1,685 | 1,412 | … | 18 | 17 | 588 | 55 | 3 | 13 | 2 | 560 | 1 | 5 | 4 | 14 | 13 | 2 | 15 | 23 | 90 | 242 | 121 | 106 | 1 | 1 | 51 | 6 | 2,989 | 90 | 2 | 16 | … | … | … | … | … |
| Waikato | 2,857 | 1,607 | 1,250 | … | 30 | 20 | 522 | 22 | … | 29 | 2 | 485 | 1 | 1 | 1 | 23 | 29 | 4 | 20 | 43 | 99 | 200 | 99 | 53 | 7 | … | 21 | 1 | 2,675 | 118 | 9 | 55 | … | … | … | … | … |
| Raglan | 776 | 460 | 316 | … | 34 | 21 | 170 | 16 | … | 5 | … | 151 | … | 4 | 1 | 13 | 5 | 1 | 4 | 13 | 37 | 55 | 34 | 30 | 2 | … | 12 | 4 | 716 | 52 | 1 | 6 | 1 | … | … | … | … |
| Kawhia | 108 | 59 | 49 | … | 46 | 42 | 22 | … | … | … | … | 11 | … | … | 4 | … | 7 | … | … | … | 1 | 14 | 9 | 1 | … | … | … | … | 47 | 57 | … | … | 4 | … | … | … | … |
| Taranaki | 6,820 | 3,930 | 2,890 | 16 | 1,205 | 167 | 7 | 184 | 2 | 1,094 | … | … | 40 | 6 | 45 | 184 | 18 | 55 | 120 | 286 | 443 | 228 | 110 | 127 | … | 69 | 5 | 5,946 | 354 | 166 | 453 | … | 1 | … | … | … | … |
| Patea | 3,490 | 2,299 | 2 | 4 | 14 | 1,073 | 88 | 22 | 163 | … | 1,052 | … | … | 24 | 2 | 15 | 163 | … | 85 | 186 | 266 | 352 | 151 | 9 | … | 67 | 43 | 5,347 | 113 | … | 326 | 1 | 2 | … | … | … | … |
| Wanganui | 3,450 | 1,935 | 3 | 8 | 14 | 630 | 33 | 3 | 21 | … | 182 | … | … | 31 | 5 | 2 | 21 | 7 | 23 | 44 | 79 | 207 | 8 | 175 | 6 | 1 | 34 | 1 | 3,233 | 172 | 9 | 39 | … | 3 | … | … | … |
| Rangitikei | 3,314 | 1,828 | 1,483 | 2 | 2 | 1 | 569 | 38 | … | 9 | 1 | 524 | … | … | 27 | 1 | 9 | 9 | 7 | 11 | 25 | 102 | 183 | 132 | 1 | 6 | … | 37 | 1 | 3,123 | 1 18 | 46 | 21 | 1 | 2 | … | … |
| Manawatu | 7,372 | 4,147 | 305 | 4 | 29 | 23 | 450 | 173 | 9 | 63 | … | 1,408 | … | … | 11 | 26 | 63 | 2 | 91 | 56 | 346 | 548 | 267 | 63 | 12 | 1 | 168 | 13 | 7,144 | 98 | 4 | 121 | 1 | 4 | … | … | … |
| Hutt | 7,585 | 4,200 | 3,658 | 35 | 4 | 4 | 1,432 | 51 | 4 | 21 | 110 | 1,391 | … | … | 2 | 7 | 5 | 21 | 1 | 30 | 25 | 206 | 524 | 373 | 282 | 13 | 1 | 40 | 14 | 7,629 | 147 | 3 | 44 | … | 35 | … | … |
| Wairarapa West | 5,759 | 3,667 | 2,592 | … | 2 | … | 1,070 | 161 | 12 | 34 | … | 1,052 | … | … | 7 | 6 | 1 | 34 | 4 | 47 | 37 | 186 | 334 | 249 | 243 | 5 | … | 157 | 6 | 5,644 | 33 | 8 | 74 | … | … | … | … |
| Wairarapa East | 1,475 | 1,046 | 429 | … | 3 | 1 | 241 | 15 | 2 | 27 | 1 | 205 | … | … | 3 | 1 | 1 | 27 | 1 | 11 | 4 | 41 | 56 | 51 | 65 | 2 | … | 13 | 4 | 1,251 | 153 | 4 | 67 | … | … | … | … |
| Waipawa | 5,560 | 3,411 | 2,450 | … | 14 | 1 | 1,131 | 69 | 8 | 27 | … | 1,079 | … | … | 40 | 8 | 2 | 27 | 116 | 119 | 55 | 281 | 437 | 135 | 130 | 1 | … | 752 | 513 | 173 | 7 | 71 | 3 | … | … | … | … |
| Hawke's Bay… | 4,879 | 2,557 | 2,022 | 4 | 122 | 5 | 844 | 27 | 4 | 26 | 2 | 5l8 | … | … | 9 | 5 | 6 | 26 | 1 | 28 | 38 | 190 | 345 | 128 | 142 | 3 | … | 20 | 4,651 | 96 | 1 | 15 | 3 | 4 | … | … | … |
| Countries*(Boroughs not included,see foot note) | Total (including Chinese and Half-castes). | Chinese. | Half-castes. | Dwellings. | (d) Europeans Living— | Travellers and Persons Sleeping under or Camping out | Chinese Living | ||||||||||||||||||||||||||||||
|---|---|---|---|---|---|---|---|---|---|---|---|---|---|---|---|---|---|---|---|---|---|---|---|---|---|---|---|---|---|---|---|---|---|---|---|---|---|
| House and Huts | Tents and Dwellings with Canvas Roofs. | Inhabited. | Uninhabited and Building. | In Houses of Brick Stone,Wood, Iron, or lath and Plaster. | In Huts of Houses of Cob, Sod, Raupo, &c. and Habitations of Unstated Materials. | In Tents or Dwelling with Canvas Roofs. | |||||||||||||||||||||||||||||||
| Materials | Rooms | Materials | In Houses of Brick, Stone Wood. Iron, or Lath and Plaster. | In Huts or Houses of Cob, Sod, Raupo, &c. | In Habitations of unstated Materials | In Tents or Dwellings with Canvas Roofs | |||||||||||||||||||||||||||||||
| Persons. | Males | Females. | Males | Females. | Males | Females. | Inhabited. | Uninhabited. | Building. | Brick,Stone or Concrete | Wood, Iron, or Lath and Plaster. | Cob or Sod. | Raupo | Huts of Sod, Clav, Wood, Stone, &c. | Tents and Dwellings with Canvas Roofs | Other Materials, or Not Stated, (c) | One | Two | Three and Four. | Five and Six. | Over Six. | Not Stated. | Brick or Stone. | Wood and Iron. | Other Materials, and Not Stated. | ||||||||||||
| Brick, Stone, Wood, Iron,&c. | Cob, Raupo, &c. and Huts or Tents. | Europeans. | Chinese. | ||||||||||||||||||||||||||||||||||
| Sounds | 605 | 364 | 241 | … | … | 20 | 12 | 127 | 2 | … | … | 120 | … | 6 | … | … | 7 | 1 | 19 | 7 | 35 | 38 | 17 | i18 | … | … | 2 | … | 561 | 211 | 6 | 17 | … | … | … | … | … |
| Marlborough | 4,680 | 2,767 | 1,913 | … | … | 7 | 1 | 874 | 51 | 2 | 68 | … | 739 | 36 | 74 | 24 | … | … | 68 | 1 | 64 | 11 | 147 | 275 | 195 | 152 | 8 | … | 50 | 23 | 3,920 | 641 | 1 | 118 | … | … | ... |
| Kaikoura | 1,10 | 671 | 4,34 | … | … | 11 | 5 | 200 | 12 | 5 | 116 | 172 | 7 | 13 | 1 | … | 1 | 10 | … | 12 | 19 | 41 | 54 | 39 | 44 | 1 | 2 | 8 | 7 | 991 | 51 | … | 33 | … | ... | ... | … |
| Waimea | 7,535 | 3,925 | 3,607 | 1 | … | … | ... | 1,266 | 45 | 6 | 11 | 25 | 1,066 | 18 | 118 | 16 | … | … | 11 | 111 | 7 | 27 | 74 | 289 | 412 | 432 | 36 | 1 | 36 | 22 | 6,571 | 527 | 112 | 24 | … | 1 | ... |
| Collingwood | 1,643 | 926 | 717 | ... | … | 1 | 1 | 368 | 9 | 13 | 13 | … | 339 | … | 6 | 22 | … | … | 13 | 1 | 45 | 38 | 53 | 94 | 57 | 54 | 7 | … | 12 | ... | 1,574 | 39 | 3 | 27 | … | ... | ... |
| Buller | 2,515 | 1,618 | 927 | 63 | … | 3 | … | 722 | 91 | 11 | 61 | ... | 633 | ... | 17 | 68 | … | … | 61 | 4 | 1,37 | 139 | 156 | 225 | 71 | 51 | 4 | … | 78 | 24 | 2,285 | 143 | l3 | 101 | … | 3 | … |
| Inangahua | 2,927 | 2,015 | 912 | 330 | … | ... | … | 840 | 95 | 2 | 91 | ... | 576 | 2 | 261 | … | 91 | 1 | 103 | 325 | 155 | 227 | 57 | 62 | … | 57 | 40 | 2,165 | 299 | 1,313 | … | 90 | 209 | 31 | … | … | |
| Grey | 4,959 | 3,405 | 1,534 | 445 | … | … | … | 1,649 | 109 | 92 | ... | 1,200 | ... | 5 | 435 | … | 92 | 9 | 363 | 482 | 371 | 344 | 91 | 86 | 4 | 92 | 22 | 3,775 | 568 | 25 | 114 | ... | 206 | 181 | 61 | … | … |
| Westland | 3,592 | 1,770 | 315 | … | 4 | 1 | 1,736 | 165 | 6 | 129 | 2 | 1,508 | ... | 6 | 220 | … | … | 129 | … | 521 | 329 | 388 | 427 | 111 | 86 | 0 | … | 141 | 30 | 4,606 | 265 | … | 1 | 157 | 40 | 18 | … |
| Amuri | 513 | 315 | … | … | … | … | 55 | 23 | 1 | 6 | 5 | 49 | 213 | 5 | 3 | … | … | 6 | … | 4 | 11 | 12 | 20 | 19 | 25 | … | 1 | 15 | S | 273 | 219 | … | 21 | … | … | … | … |
| Cheviot | 102 | 5 | 27 | … | … | … | … | 17 | 11 | … | 1 | ... | 10 | 4 | … | 2 | … | ... | 1 | 1 | … | 1 | 4 | 5 | 2 | 5 | 1 | … | 7 | 4 | 55 | 28 | 15 | 6 | … | … | ... |
| Ashley | 1,955 | 6,547 | 5,405 | 4 | … | 2 | 1 | 2,042 | 124 | 3 | 57 | 50 | 1,597 | 245 | 114 | 7 | … | … | 51 | 29 | 40 | 75 | 263 | 734 | 524 | 349 | 114 | 2 | 77 | 48 | 9,612 | 2,103 | 128 | 108 | … | 4 | … |
| Akaroa | 4,020 | 2,240 | 1,780 | 1 | … | 6 | 9 | 713 | 71 | 3 | 45 | 7 | 669 | 21 | 11 | 110 | … | … | 45 | 2 | 38 | 52 | 125 | 213 | 176 | 145 | 6 | 1 | 69 | 4 | 3,792 | 154 | 1 | 72 | 1 | … | ... |
| Selwyn | 323 | 15,145 | 16,175 | 50 | … | 2 | 1 | 5,941 | 400 | 55 | 125 | 171 | 5,180 | 428 | 123 | 20 | … | … | 125 | 19 | 104 | 181 | 851 | 2,506 | 1,364 | 1,026 | 34 | 7 | 391 | 60 | 30,797 | 3,087 | 79 | 309 | 1 | 41 | 9 |
| Ashburton | 7,615 | 4,397 | 2,768 | 7 | … | 1 | ... | 1,245 | 132 | 2 | 147 | 19 | 974 | 166 | 29 | 39 | 1 | 147 | 17 | 47 | 190 | 372 | 457 | 175 | 139 | 12 | … | 74 | 60 | 5,510 | 1,226 | 112 | 310 | … | 7 | ... | ... |
| Geraldine | 12,729 | 7,041 | 5,655 | 21 | … | 3 | 4 | 2,240 | 03 | 20 | 195 | 195 | 1,498 | 417 | 513 | 24 | 2 | 195 | 21 | 83 | 233 | 594 | 871 | 3,34 | 294 | 26 | 4 | 34 | 815 | 9,354 | 2,595 | 78 | 401 | 14 | 14 | … | 7 |
| Waimate | 3,438 | 2,118 | 1,320 | 110 | … | 6 | 596 | 71 | 5 | 93 | 22 | 477 | 65 | 3 | 25 | ... | 93 | 4 | 31 | 98 | 70 | 230 | 73 | 60 | 27 | … | 50 | 26 | 2,775 | 442 | .8 | 193 | ... | 10 | … | … | … |
| Waitaki | 6,955 | 4,142 | 2,553 | 28 | … | 4 | 12 | 1,151 | 34 | 3 | 128 | 127 | 910 | 39 | 30 | 25 | 6 | 128 | 11 | 42 | 145 | 265 | 414 | 204 | 179 | 27 | 1 | 50 | 6 | 6,650 | 501 | 50 | 294 | 2 | 11 | 17 | … |
| Waikouaiti | 6,061 | 3,776 | 2,555 | 1,861 | … | 40 | 37 | 1,228 | 96 | 5 | 76 | 46 | 954 | 136 | 52 | 34 | … | 76 | 6 | 50 | 165 | 254 | 451 | 225 | 128 | 18 | 3 | 13 | 15 | 5,583 | 650 | 23 | 217 | 2 | 18 | 166 | 2 |
| Peninsula | 2,425 | 1,300 | 1,025 | 19 | … | 3 | … | 429 | 33 | 5 | 5 | 55 | 329 | 16 | 22 | O | … | … | 5 | 5 | 16 | 6 | 68 | 149 | 118 | 66 | 11 | 4 | 31 | 3 | 2,21O | 6 | 18 | 12 | ... | 19 | … |
| Taieri | 7,416 | 4,230 | 3,246 | 100 | … | 3 | 1,288 | 147 | 2 | 130 | 103 | 986 | 24 | 117 | 50 | … | … | 130 | 8 | 48 | 153 | 319 | 458 | 234 | 68 | 8 | 7 | 84 | 58 | 6,231 | 858 | 47 | 259 | 1 | … | 158 | 54 |
| Bruce | 5,049 | 2,80, | 2,245 | 136 | … | … | 2 | 599 | 64 | 6 | 6 | 15 | 692 | 38 | 132 | 18 | … | … | 6 | 4 | 14 | 59 | 159 | 332 | 165 | 139 | 7 | … | 48 | 22 | 4,079 | 801 | 21 | 12 | … | 25 | 111 |
| Clutha | 4,205 | 2,464 | 1,745 | 12 | … | … | … | 743 | 27 | 1 | 29 | 9 | 645 | 17 | 29 | 40 | … | … | 29 | 3 | 27 | 52 | 136 | 270 | 165 | 120 | 2 | ... | 16 | 12 | 3,693 | 411 | 29 | 60 | ... | 5 | 4 |
| Tuapeka | 6,380 | 3,970 | 2,410 | 73 | … | ... | ... | 1,297 | 57 | 1 | 31 | 51 | 8ll | 224 | 73 | 134 | … | 31 | 4 | 96 | 141 | 282 | 451 | 167 | 88 | 11 | 2 | 40 | 16 | 4,467 | 1,149 | 9 | 51 | 1 | 156 | 530 | 17 |
| Maniototo | 2,454 | 1,555 | 899 | 247 | … | 3 | 1 | 556 | 22 | 3 | 62 | 85 | 213 | 159 | 92 | 37 | … | .. | 62 | … | 37 | 187 | 154 | 176 | 63 | 38 | 13 | 1 | 8 | 16 | 1,296 | 870 | … | … | 36 | 10 | 107 |
| Vincent | 3,565 | 431 | 54 | 473 | … | … | ... | 556 | 52 | 3 | 72 | 156 | 365 | 1,33 | 162 | 49 | … | 72 | 21 | 68 | 243 | 154 | 275 | 84 | 66 | 68 | 9 | 18 | 28 | 2,242 | 656 | 102 | 88 | 4 | 53 | 335 | 55 |
| Lake | 2,486 | 113 | 75 | 283 | … | … | 1 | 659 | 35 | 1 | 77 | 104 | 314 | … | 62 | 138 | … | 77 | 6 | 73 | 233 | 169 | 153 | 46 | 55 | 7 | 2 | 25 | 9 | 1,750 | 547 | 10 | 93 | 57 | 209 | … | … |
| Southland | 7,949 | 5,266 | 3,19 | … | 24 | 20 | 2,632 | 163 | 18 | 77 | 51 | 2,200 | 87 | 45 | 221 | … | … | 77 | 48 | 164 | 269 | 639 | 924 | 376 | 277 | 60 | … | 139 | 42 | 11,567 | 896 | 221 | 224 | 8 | 70 | 255 | 14 |
| Wallace | 3,66 | 2,406 | 1,210 | 354 | … | 27 | 724 | 44 | 2 | 79 | 6 | 612 | 8 | 17 | 68 | … | 79 | 13 | 110 | 134 | 169 | 190 | 103 | 83 | 14 | 1 | 38 | 7 | 2,864 | 217 | 48 | 119 | 299 | 33 | 22 | … | … |
| Fiord | 13 | 5 | 8 | … | … | 4 | … | ... | ... | ... | 4 | ... | … | … | … | … | … | … | 1 | … | 1 | 1 | 1 | ... | ... | … | … | … | 13 | … | … | … | … | … | … | … | … |
| Stewart Island | 295 | 1,311 | 1 | 57 | 54 | 1 | 62 | 11 | … | 2 | 59 | … | 2 | … | … | 2 | 1 | 2 | 4 | 19 | 29 | 3 | 5 | 2 | … | 11 | ... | 277 | 7 | 5 | 5 | … | 1 | … | … | … | … |
| 63 Counties Totals | 291,238 | 166,754 | 124,454 | 4,140 | 9,550 | 36,083 | 3,803 | 464 | 2,517 | 1,417 | 47,255 | 2,362 | 2,199 | 2,139 | 3 | 17 | 2,817 | 351 | 3,352 | 5,540 | 10,294 | 19,613 | 10,621 | 8,467 | 7l3 | 55 | 3,35 | 597 | 55.448 | 24.363 | 1,465 | 5.749 | 75 | 1,508 | 2,227 | 405 | … |
Table XVII. Table XVII. Showing the Population of the Boroughs (exclusive of Maoris), distinguishing Chinese and Half-castes, with the Number of Houses Inhabited, Uninhabited, and in Course of Erection, Classified according to Materials and Rooms. Also the Number of Europeans and Chinese in different Classes of Dwellings, and those Camping Out.
| Boroughs. | Total (including Chinese and Half-castes). | Chinese. | Half-castes. | Dwellings. | (d) Europeans Living— | Travellers and Persons Sleeping under or Camping out | Chinese Living | ||||||||||||||||||||||||||||||
|---|---|---|---|---|---|---|---|---|---|---|---|---|---|---|---|---|---|---|---|---|---|---|---|---|---|---|---|---|---|---|---|---|---|---|---|---|---|
| House and Huts | Tents and Dwellings with Canvas Roofs. | Inhabited. | Uninhabited and Building. | In Houses of Brick Stone,Wood, Iron, or lath and Plaster. | In Huts of Houses of Cob, Sod, Raupo, &c. and Habitations of Unstated Materials. | In Tents or Dwelling with Canvas Roofs. | |||||||||||||||||||||||||||||||
| Materials | Rooms | Materials | In Houses of Brick, Stone Wood. Iron, or Lath and Plaster. | In Huts or Houses of Cob, Sod, Raupo, &c. | In Habitations of unstated Materials | In Tents or Dwellings with Canvas Roofs | |||||||||||||||||||||||||||||||
| Persons. | Males | Females. | Males | Females. | Males | Females. | Inhabited. | Uninhabited. | Building. | Brick,Stone or Concrete | Wood, Iron, or Lath and Plaster. | Cob or Sod. | Miscellaneous | Huts of Sod, Clay, Wood, Stone, &c. | Tents and Dwellings with Canvas Roofs | Other Materials, or Not Stated, (c) | One | Two | Three and Four. | Five and Six. | Over Six. | Not Stated. | Brick or Stone. | Wood and Iron. | Other Materials, and Not Stated. | ||||||||||||
| Brick, Stone, Wood, Iron,&c. | Cob, Raupo, &c. and Huts or Tents. | Europeans. | Chinese. | ||||||||||||||||||||||||||||||||||
| Auckland | 16,664 | 8,651 | 8,013 | 19 | 3 | 15 | 21 | 3,148 | 203 | 133 | … | 306 | 2,840 | … | 2 | … | … | … | … | 15 | … | 1 | 248 | 1,266 | 902 | 708 | 8 | 32 | 301 | 3 | l6,640 | … | 2 | … | … | 22 | … |
| Parnell | 3,529 | 1,726 | 1,803 | 2 | 25 | 10 | 6l.3 | 36 | … | … | … | 6 | … | 20 | 591 | … | … | … | … | … | 2 | … | 1 | … | … | 26 | … | … | … | 231 | 65 | … | … | … | 187 | 3 | 1 |
| Onehunga | 3,217 | 1,047 | 1,170 | … | 1 | 3 | 454 | 37 | 11 | … | 2 | 452 | … | … | … | … | … | 1 | … | … | 39 | 190 | 142 | 82 | 1 | 47 | 2,217 | 40 | 1 | … | 3,523 | … | … | 4 | … | … | 2 |
| Thames | 4,863 | 2,538 | 2,328 | … | 2 | 4 | 1,028 | 167 | … | … | 1 | 1,027 | … | … | … | … | … | … | 42 | … | 96 | 518 | 213 | 158 | 1 | 2 | 165 | … | … | 4,863 | … | … | … | … | … | … | … |
| Gisborne | 1,737 | 959 | 778 | 1 | 10 | 15 | 344 | 4 | … | … | 1 | 343 | … | … | … | … | … | 10 | … | … | 63 | 132 | 65 | 60 | 14 | 4 | … | … | 1,736 | … | … | … | … | … | … | … | … |
| Hamilton | 1,361 | 700 | 661 | … | 6 | 8 | 252 | 32 | … | … | l6 | 235 | … | … | 1 | … | … | 3 | … | … | 54 | 130 | 42 | 41 | 2 | 30 | 2 | … | 1,356 | … | 5 | … | … | … | … | … | … |
| New Plymouth | 3,310 | 1,673 | 1,637 | 5 | 1 | 622 | 19 | 3 | … | 1 | 621 | … | … | … | … | … | … | 1 | … | … | 34 | 213 | 178 | 151 | 45 | 22 | … | … | 3,305 | … | … | … | … | … | … | … | 5 |
| Wanganui | 4,646 | 2,330 | 2,316 | 4 | 4 | 2 | 877 | 51 | 2 | 1 | 2 | 873 | … | 1 | 1 | … | 1 | … | 8 | … | 2 | 91 | 358 | 217 | 197 | 5 | 53 | … | … | 4,637 | … | 4 | … | … | 1 | … | 4 |
| Marton | 662 | 363 | 299 | … | … | 139 | 16 | 4 | … | … | … | 138 | … | … | 1 | … | … | 1 | 7 | … | … | … | 57 | 38 | … | … | … | 36 | … | 20 | … | … | … | … | 66l | 1 | … |
| Palmerston N. | 1,366 | 723 | 643 | 1 | … | 275 | 22 | 12 | 1 | 1 | 274 | … | … | … | … | 1 | … | 6 | … | … | 46 | 140 | 46 | 38 | … | 34 | … | … | 1,36l | … | … | 4 | … | … | … | 1 | … |
| Wellington | 20,563 | 10,226 | 10,337 | 26 | 4 | 5 | 3,784 | 423 | 19 | 1 | 55 | 3,726 | … | 3 | … | … | 1 | … | 27 | … | 1 | 306 | 1,461 | 989 | 881 | 120 | 5 | 429 | 8 | … | 20,525 | … | 11 | 1 | 26 | … | … |
| Masterton | 2,241 | 1,155 | 1,086 | 4 | … | 430 | 33 | … | 1 | 1 | 429 | … | … | … | … | 1 | … | 6 | … | 1 | 31 | 183 | 120 | 83 | 7 | 33 | … | … | 2,235 | … | … | 2 | … | 4 | … | … | … |
| Greytown | … | 1,078 | 561 | 517 | 3 | 1 | 201 | 51 | … | … | … | 201 | … | … | … | … | … | … | … | 1 | 10 | 76 | 52 | 46 | 16 | 51 | … | 1,075 | … | … | 3 | ||||||
| Napier | 5,756 | 2,806 | 2,860 | … | 3 | 23 | 1,072 | 78 | 6 | … | 7 | 1,065 | … | … | … | … | 19 | … | … | 123 | 532 | 198 | 188 | 12 | 1 | 83 | … | 575 | |||||||||
| Picton | 834 | 401 | 433 | … | 2 | 141 | 9 | 3 | … | … | … | 141 | … | … | … | … | … | 2 | … | … | 13 | 46 | 39 | 41 | … | 12 | 834 | … | … | … | … | … | … | … | … | … | … |
| Blenheim | 2,107 | 1,031 | 1,056 | 1 | … | 384 | 26 | 2 | … | 4 | 379 | … | 1 | … | … | 4 | … | … | 43 | 161 | 91 | 84 | 1 | 28 | … | … | 2,104 | … | 2 | … | 1 | … | … | … | … | … | … |
| Nelson | 6,764 | 3,261 | 3,503 | … | … | 1,252 | 59 | 10 | … | 32 | 1,190 | 22 | 7 | … | … | … | … | 5 | … | 1 | 48 | 413 | 372 | 399 | 14 | 69 | 6,627 | 135 | 2 | … | … | … | … | … | … | … | … |
| Westport | 1,013 | 538 | 475 | … | … | 246 | 49 | … | … | … | 241 | … | … | 5 | … | … | … | 13 | … | 4 | 47 | 101 | 44 | 137 | … | 49 | l,006 | 7 | … | … | … | … | … | … | … | … | … |
| Greymouth | 2,544 | 1,331 | 1,213 | 45 | 1 | 1 | 551 | 66 | … | … | 548 | … | … | 3 | … | 32 | … | 4 | 39 | 257 | 131 | 84 | 4 | 65 | 1 | … | 2,494 | … | 4 | … | 1 | … | 45 | … | … | … | … |
| Hokitika | 2,600 | 1,264 | 1,336 | 22 | 2 | 1 | 580 | 132 | 1 | … | … | 576 | … | … | 4 | … | … | … | 12 | … | 5 | 42 | 243 | 153 | 123 | 2 | 133 | 2,574 | … | 4 | … | 22 | … | … | … | … | … |
| Ross | 1,139 | 647 | 492 | 37 | … | 277 | 24 | 8 | … | … | 272 | … | … | 5 | … | 8 | … | 28 | … | 12 | 48 | 121 | 45 | 30 | 1 | 23 | 1 | … | 1,083 | … | 6 | … | … | 13 | 31 | 6 | … |
| Kumara | 1,145 | 622 | 523 | 6 | … | 285 | 21 | … | 4 | … | … | 273 | 12 | 4 | 41 | … | 16 | 46 | 106 | 39 | 39 | 2 | 21 | … | … | 1,118 | … | 14 | … | … | 7 | 6 | … | … | … | … | … |
| Ashburton | 1,526 | 844 | 6S2 | 1 | 1 | 272 | 10 | … | 1 | 8 | 263 | … | 1 | … | 1 | … | 16 | … | … | 41 | 1071 | 63 | 46 | … | 10 | 1,5l6 | … | 7 | … | 2 | … | 1 | … | … | … | … | … |
| Kaiapoi | 1,221 | 594 | 627 | … | … | 231 | 19 | 2 | … | 1 | 230 | … | … | … | 5 | … | … | 16 | 76 | 57 | 76 | 2 | 21 | … | 1,221 | … | … | … | … | … | … | … | … | … | … | … | … |
| Akaroa | 611 | 296 | 315 | 3 | … | 114 | 11 | … | … | 1 | 111 | … | 2 | … | … | … | … | 2 | … | … | 12 | 31 | 28 | 41 | … | 11 | … | … | 599 | … | 9 | 3 | … | … | … | … | … |
| Lyttelton | 4,127 | 2,205 | 1,922 | … | 3 | 5 | 707 | 31 | 7 | 4 | 23 | 677 | 4 | 1 | 1 | … | 4 | 1 | 9 | 5 | 93 | 351 | 144 | 104 | 5 | 3 | 33 | 2 | 4,097 | 23 | 2 | 5 | … | … | … | … | … |
| Christchurch | 15,213 | 7,734 | 7,470 | 26 | 2 | 2,674 | 207 | 32 | 1 | 160 | 2,506 | 6 | 1 | … | … | 1 | 1 | 26 | … | 1 | 207 | 1,063 | 716 | 645 | 17 | 20 | 210 | 9 | 15,147 | 33 | 6 | 1 | 2 | … | … | … | … |
| Sydenham | 8,460 | 4,290 | 4,170 | 7 | … | 1,616 | 136 | 14 | … | 46 | 1,545 | 23 | 3 | 1 | … | … | … | 14 | … | 251 | 952 | 297 | 100 | 2 | 6 | 144 | 8,305 | … | 148 | … | 7 | … | … | … | … | … | … |
| Timaru | 3,917 | 2,117 | 1,800 | 6 | 1 | 689 | 35 | 4 | … | 156 | 497 | 35 | 1 | … | … | … | … | 12 | … | 113 | 262 | 171 | 126 | 5 | 5 | 33 | 1 | … | 3,708 | … | 203 | … | … | 6 | … | … | … |
| Rangiora | 1,445 | 743 | 702 | … | … | 281 | 10 | 3 | … | 24 | 252 | 5 | … | … | … | … | … | 1 | … | 19 | 114 | 72 | 62 | 13 | 13 | … | … | 1,428 | … | 17 | … | … | … | … | … | … | … |
| Waimate | 1,600 | 870 | 730 | … | 2 | 311 | 29 | … | … | 11 | 297 | 1 | 1 | … | … | … | 1 | 13 | … | 88 | 131 | 45 | 31 | 3 | 3 | 25 | 1 | … | 1,587 | 9 | 4 | … | … | … | … | … | … |
| Oamaru | 5,791 | 3,007 | 2,784 | 2 | 1 | 1,096 | 80 | 5 | 9 | 183 | 907 | 1 | 1 | 4 | … | 9 | … | 38 | … | 13 | 235 | 456 | 203 | 129 | 31 | 15 | 70 | … | … | 5,751 | … | 18 | … | 17 | … | 3 | 2 |
Table XVII. Showing the Population of the Boroughs (exclusive of Maoris), distinguishing Chinese and Half-castes, with the Number of Houses Inhabited, Uninhabited, and in Course of Erection, Classified according to Materials and Rooms. Also the Number of Europeans and Chinese in different Classes of Dwellings, and those Camping Out.—contd.
| Boroughs | Total (including Chinese and Half-castes). | Chinese. | Half-castes. | Dwellings. | (d) Europeans Living— | Travellers and Persons Sleeping under or Camping out | Chinese Living | ||||||||||||||||||||||||||||||
|---|---|---|---|---|---|---|---|---|---|---|---|---|---|---|---|---|---|---|---|---|---|---|---|---|---|---|---|---|---|---|---|---|---|---|---|---|---|
| House and Huts | Tents and Dwellings with Canvas Roofs. | Inhabited. | Uninhabited and Building. | In Houses of Brick Stone,Wood, Iron, or lath and Plaster. | In Huts of Houses of Cob, Sod, Raupo, &c. and Habitations of Unstated Materials. | In Tents or Dwelling with Canvas Roofs. | |||||||||||||||||||||||||||||||
| Materials | Rooms | Materials | In Houses of Brick, Stone Wood. Iron, or Lath and Plaster. | In Huts or Houses of Cob, Sod, Raupo, &c. | In Habitations of unstated Materials | In Tents or Dwellings with Canvas Roofs | |||||||||||||||||||||||||||||||
| Persons. | Males | Females. | Males | Females. | Males | Females. | Inhabited. | Uninhabited. | Building. | Brick,Stone or Concrete | Wood, Iron, or Lath and Plaster. | Cob or Sod. | Raupo | Huts of Sod, Clav, Wood, Stone, &c. | Tents and Dwellings with Canvas Roofs | Other Materials, or Not Stated, (c) | One | Two | Three and Four. | Five and Six. | Over Six. | Not Stated. | Brick or Stone. | Wood and Iron. | Other Materials, and Not Stated. | ||||||||||||
| Brick, Stone, Wood, Iron,&c. | Cob, Raupo, &c. and Huts or Tents. | Europeans. | Chinese. | ||||||||||||||||||||||||||||||||||
| Hampden | 327 | 180 | 147 | … | 71 | 9 | 1 | … | 2 | 67 | … | 2 | … | … | 1 | 1 | 20 | 28 | 13 | 8 | 1 | 9 | … | 322 | 5 | … | … | … | … | … | … | … | … | … | … | … | … |
| Palmerston | 968 | 518 | 450 | 6 | … | 191 | 2 | 1 | 9 | 175 | 6 | 1 | … | 1 | … | … | 1 | 69 | 70 | 23 | 27 | 2 | 2 | … | 922 | 39 | … | 1 | … | … | 6 | … | … | … | … | … | … |
| Hawkesbury | 415 | 206 | 209 | … | 77 | 2 | … | 1 | 76 | … | … | … | … | … | 2 | … | 10 | 34 | 20 | 11 | … | 2 | … | 415 | … | … | … | … | … | … | … | … | … | … | … | … | … |
| Port Chalmers | 2,181 | 1,156 | 1,025 | 2 | … | 424 | 36 | 21 | 24 | 309 | … | 1 | … | 21 | … | 22 | 22 | 64 | 173 | 98 | 60 | 6 | 36 | … | 2,148 | 2 | … | 29 | … | … | 2 | … | … | … | … | … | |
| Dunedin | 24,372 | 12,246 | 12,126 | 147 | 6 | 2 | 1 | 4,410 | 362 | 42 | 1 | 739 | 3,663 | … | 2 | … | 1 | 6 | 108 | 4 | 632 | 1,788 | 1,049 | 803 | 27 | 104 | 295 | 5 | … | 24,190 | 8 | 18 | 3 | … | … | 153 | … |
| Roslyn | 2,875 | 1,428 | 1,447 | … | 1 | 2 | 492 | 30 | 9 | 6 | 37 | 455 | … | … | … | 6 | … | 5 | 6 | 71 | 199 | 128 | 89 | 2 | 37 | … | 2,871 | … | … | 4 | … | … | … | … | … | … | |
| Caversham | 3,989 | 2,061 | 1,928 | 20 | 1 | 688 | 45 | 16 | … | 73 | 615 | … | … | … | … | … | 7 | … | 99 | 394 | 112 | 72 | 4 | 14 | 47 | … | 3,969 | … | … | … | … | … | 20 | … | … | … | |
| Mornington | 2,886 | 1,396 | 1,490 | … | 511 | 33 | 4 | … | 45 | 464 | 1 | 1 | … | … | 7 | … | 72 | 224 | 139 | 66 | 3 | 6 | 31 | … | 2,879 | 7 | … | … | … | … | … | … | … | … | … | … | … |
| Maori Hill | 1,136 | 605 | 531 | … | 1 | 210 | 19 | 9 | 12 | 189 | … | 8 | 1 | … | 9 | … | 7 | 9 | 55 | 86 | 33 | 26 | 3 | 16 | 3 | … | 1,069 | 50 | … | 17 | … | … | … | … | … | … | |
| St. Kilda | 773 | 383 | 390 | … | 140 | 15 | … | 10 | 130 | … | … | … | … | … | 2 | 1 | 32 | 66 | 22 | 16 | 1 | 4 | 11 | … | 773 | … | … | … | … | … | … | … | … | … | … | ||
| South Dunedin | 2,796 | 1,431 | 1,365 | 23 | … | 562 | 21 | 3 | … | 44 | 518 | … | … | … | … | … | 8 | … | 151 | 294 | 90 | 11 | 8 | 1 | 23 | … | 2,773 | … | … | … | … | … | 23 | … | … | … | |
| North-East Valley | 2,754 | 1,410 | 1,344 | 8 | … | 506 | 24 | 9 | 3 | 36 | 462 | … | 6 | 2 | … | 3 | … | 9 | 5 | 112 | 225 | 111 | 45 | 2 | 33 | … | 2,687 | 56 | … | 3 | … | … | 8 | … | … | … | |
| West Harbour | 1,213 | 635 | 578 | 14 | … | 228 | 44 | 2 | 7 | 20 | 199 | … | 7 | 1 | … | 7 | 1 | 7 | 9 | 48 | 100 | 49 | 19 | 3 | 5 | 41 | … | 1,144 | 40 | 3 | 12 | … | … | 14 | … | … | |
| Green Island | 462 | 230 | 232 | … | 90 | 2 | 5 | 1 | 15 | 69 | … | … | … | 1 | 6 | 1 | 1 | 32 | 35 | 10 | 4 | 8 | 4 | 3 | … | 436 | … | 25 | 1 | … | … | … | … | … | … | … | … |
| Milton | 1,287 | 647 | 640 | 4 | … | 240 | 20 | … | 10 | 223 | 1 | 6 | … | … | … | 4 | … | 25 | 104 | 62 | 44 | 1 | 2 | 19 | 1 | … | 1,256 | 27 | … | … | … | … | 4 | … | … | … | … |
| Balclutha | 820 | 439 | 381 | 1 | … | 168 | 1 | … | 5 | 160 | … | 1 | … | 1 | 2 | 8 | 3 | 26 | 75 | 36 | 20 | 1 | 1 | … | 810 | 2 | 6 | 1 | … | … | 1 | … | … | … | … | … | … |
| Tapanui | 592 | 304 | 288 | 1 | … | 117 | 2 | … | … | 114 | … | 2 | … | … | 1 | 5 | 1 | 24 | 46 | 28 | 10 | 3 | 2 | … | 583 | 2 | 6 | … | … | … | 1 | … | 1 | … | … | … | … |
| Lawrence | 1,009 | 510 | 499 | 6 | … | 209 | 18 | 2 | … | 33 | 170 | 3 | 3 | … | … | … | … | 9 | 5 | 22 | 78 | 49 | 46 | 3 | 17 | … | 991 | 12 | … | … | … | … | 5 | … | … | … | … |
| Roxburgh | 277 | 166 | 111 | 32 | … | 65 | 2 | … | 30 | 28 | 3 | 4 | … | … | 7 | 4 | 11 | 22 | 9 | 12 | 1 | 1 | … | 242 | 3 | … | … | … | … | … | 32 | … | … | … | … | … | … |
| Naseby | 560 | 322 | 238 | 22 | … | 125 | 9 | 1 | 2 | 3 | 104 | 9 | 4 | 5 | … | 2 | … | 8 | 9 | 12 | 49 | 24 | 22 | 3 | 1 | 5 | 4 | … | 494 | 41 | … | 3 | … | … | 20 | … | 2 |
| Alexandra | 375 | 164 | 111 | 29 | … | 59 | … | 2 | 6 | 39 | … | 10 | 2 | … | 2 | 2 | 1 | 6 | 7 | 23 | 13 | 9 | 2 | … | … | 203 | 34 | 6 | 3 | … | … | 16 | 13 | … | … | … | … |
| Cromwell | 429 | 228 | 201 | 33 | … | 97 | 5 | … | 15 | 78 | … | … | … | … | 4 | 3 | … | 15 | 38 | 17 | 18 | 6 | 5 | … | 372 | … | 24 | … | … | … | 33 | … | … | … | … | … | … |
| Arrowtown | 418 | 238 | 183 | 18 | … | 86 | 9 | … | 23 | 53 | … | 1 | … | … | 9 | 2 | … | 12 | 38 | 13 | 11 | 10 | 2 | 7 | … | 337 | 1 | 62 | … | … | 18 | … | … | … | … | … | … |
| Queenstown | 735 | 440 | 295 | 75 | … | 141 | 10 | … | 18 | 123 | … | … | … | … | … | 7 | … | 17 | 56 | 37 | 24 | 2 | 8 | 660 | … | … | … | … | … | 75 | … | … | … | … | … | … | … |
| Invercargill | 4,596 | 2,373 | 2,223 | 24 | … | 834 | 25 | 6 | … | 46 | 783 | … | 1 | … | … | 4 | 6 | 1 | 85 | 319 | 215 | 198 | 10 | 9 | 21 | … | 4,549 | 1 | 22 | … | … | … | 23 | … | 1 | … | … |
| Invercargill S. | 923 | 475 | 448 | … | 172 | 10 | 2 | 3 | 168 | … | 1 | … | 2 | … | 4 | 3 | 43 | 11 | 35 | 11 | 1 | 10 | … | 914 | 2 | … | 7 | … | … | … | … | … | … | … | … | … | … |
| Invercargill E. | 785 | 411 | 374 | … | 139 | 12 | … | 2 | 137 | … | … | … | … | … | 1 | … | 21 | 51 | 41 | 25 | … | 11 | 1 | … | 785 | … | … | … | … | … | … | … | … | … | … | … | … |
| Invercargill N. | 670 | 338 | 332 | … | 1 | 131 | 13 | 1 | … | 1 | 129 | … | 1 | … | … | 4 | 1 | 41 | 60 | 22 | 2 | 1 | 12 | … | 666 | 4 | … | … | … | … | … | … | … | … | … | … | … |
| Campbelltown | 351 | 177 | 174 | … | l6 | 15 | 75 | 1 | … | 2 | 72 | … | 1 | … | … | 8 | … | 11 | 22 | 17 | 17 | … | 1 | … | 349 | 2 | … | … | … | … | … | … | … | … | … | … | … |
| Avenal | 372 | 182 | 190 | … | 1 | 65 | 4 | … | 1 | 57 | … | … | … | … | 7 | … | … | 8 | 24 | 17 | 9 | 7 | 4 | … | 323 | … | 49 | … | … | … | … | … | … | … | … | … | … |
| Gladstone | 268 | 130 | 138 | … | 49 | 2 | … | 4 | 45 | … | … | … | … | … | 2 | … | 7 | 16 | 10 | 14 | … | 2 | … | 268 | … | … | … | … | … | … | … | … | … | … | … | … | … |
| Winton | 230 | 134 | 96 | … | 1 | 44 | 1 | 1 | … | 2 | 40 | … | 2 | … | … | … | 1 | 7 | 17 | 11 | 7 | 1 | 1 | … | 228 | 2 | … | … | … | … | … | … | … | … | … | … | … |
| Riverton | 1,187 | 679 | 508 | 113 | 1 | 12 | 218 | 8 | 1 | 1 | … | 218 | … | … | … | 1 | … | 6 | 2 | 27 | 88 | 55 | 40 | 1 | 9 | … | 1,070 | … | … | 4 | … | … | 113 | … | … | … | … |
| 65 Boroughs—Total | 194,981 | 99,605 | 95,576 | 799 | 9 | 105 | 135 | 36,580 | 2,922 | 384 | 88 | 2,333 | 33,940 | 120 | 74 | 65 | 1 | 88 | 47 | 683 | 163 | 4,442 | 15,397 | 8,685 | 6,849 | 449 | 255 | 3,003 | 48 | 192,787 | 1,002 | 237 | 141 | 6 | 751 | 51 | 6 |
Table XVIII. Table XVIII. Showing the Population of the Wards or locally-known Divisions of the different Boroughs in the Colony.
| Wards, Divisions, or Localities of certain Boroughs. | Males. | Females. | Total. |
|---|---|---|---|
| BOROUGH OF AUCKLAND:— | |||
| City East, East Ward | 2,691 | 2,468 | 5,159 |
| City West, North Ward | 2,062 | 1,741 | 3,803 |
| City West, South Ward | 3,898 | 3,804 | 7,702 |
| BOROUGH OF THAMES:— | |||
| North Ward | 765 | 650 | 1,415 |
| Middle Ward | 996 | 894 | 1,890 |
| South Ward | 777 | 781 | 1,558 |
| BOROUGH OF HAMILTON:— | |||
| East (side of River) | 329 | 301 | 630 |
| West (side of River) | 371 | 360 | 731 |
| BOROUGH OF NEW PLYMOUTH:— | |||
| East Ward | 599 | 623 | 1,222 |
| Centre Ward | 679 | 618 | 1,297 |
| West Ward | 395 | 396 | 791 |
| BOROUGH OF WANGANUI— | |||
| Cook Ward | 724 | 700 | 1,424 |
| Queen's Ward | 673 | 675 | 1,348 |
| St. John's Ward | 933 | 941 | 1,874 |
| BOROUGH OF WELLINGTON:— | |||
| Thorndon Ward | 2,121 | 2,340 | 4,461 |
| Lambton Ward | 950 | 789 | 1,739 |
| Te Aro Ward | 3,124 | 3,114 | 6,238 |
| Cook Ward | 4,031 | 4,094 | 8,125 |
| BOROUGH OF MASTERTON:— | |||
| Block A | 69 | 62 | 131 |
| Block B | 742 | 704 | 1,446 |
| Block C | 344 | 320 | 664 |
| BOROUGH OF NAPIER:— | |||
| North Ward | 946 | 1,008 | 1,954 |
| Central Ward | 949 | 941 | 1,890 |
| South Ward | 1,001 | 911 | 1,912 |
| BOROUGH OF BLENHEIM:— | |||
| North Ward | 313 | 329 | 642 |
| East Ward | 454 | 433 | 887 |
| West Ward | 284 | 294 | 578 |
| BOROUGH OF NELSON:— | |||
| Block A1 | 485 | 474 | 959 |
| Block A2 | 395 | 450 | 845 |
| Block B | 435 | 430 | 865 |
| Block C | 700 | 840 | 1,540 |
| Block D | 386 | 393 | 779 |
| Block E | 136 | 124 | 260 |
| Block F | 224 | 263 | 487 |
| Block G | 500 | 529 | 1,029 |
| BOROUGH OF WESTPORT:— | |||
| North Ward | 258 | 246 | 504 |
| Middle Ward | 118 | 97 | 215 |
| South Ward | 162 | 132 | 294 |
| BOROUGH OF GREYMOUTH:— | |||
| East ward | 524 | 534 | 1,058 |
| Middle Ward | 459 | 420 | 879 |
| West ward | 348 | 259 | 607 |
| BOROUGH OF HOKITIKA:— | |||
| East | 447 | 514 | 961 |
| West | 597 | 576 | 1,173 |
| South | 220 | 246 | 466 |
| BOROUGH OF ROSS:— | |||
| North | 352 | 315 | 667 |
| South | 295 | 177 | 472 |
| BOROUGH OF KUMARA:— | |||
| East | 374 | 307 | 681 |
| West | 248 | 216 | 464 |
| BOROUGH OF CHRISTCHURCH:— | |||
| North-East Ward | 2,308 | 2,398 | 4,706 |
| North-West Ward | 1,668 | 1,697 | 3,365 |
| South-East Ward | 2,091 | 1,830 | 3,921 |
| South-West Ward | 1,667 | 1,554 | 3,221 |
| BOROUGH OF LYTTELTON:— | |||
| Eastern Division | 986 | 748 | 1,734 |
| Western Division | 1,219 | 1,174 | 2,393 |
| BOROUGH OF SYDENHAM:— | |||
| Block I. | 905 | 854 | 1,759 |
| Block II. | 1,477 | 1,439 | 2,916 |
| Block III. | 1,153 | 1,134 | 2,287 |
| Block IV. | 755 | 743 | 1,4998 |
| BOROUGH OF TIMARU:— | |||
| Government Town | 750 | 664 | 1,414 |
| Rhodes Town North | 625 | 466 | 1,091 |
| Rhodes Town South | 742 | 670 | 1,412 |
| BOROUGH OF OAMARU:— | |||
| Severn Ward | 1,116 | 1,075 | 2,191 |
| Jetty Ward | 531 | 427 | 958 |
| High Ward | 660 | 691 | 1,351 |
| Thames Ward | 700 | 591 | 1,291 |
| BOROUGH OF WEST HAWKESBURY:— | |||
| West Ward | 33 | 36 | 69 |
| Beach Ward | 28 | 31 | 59 |
| Manse Ward | 21 | 28 | 49 |
| Eastward | 124 | 114 | 238 |
| BOROUGH OF PALMERSTON SOUTH:— | |||
| North Ward | 177 | 168 | 345 |
| East Ward | 176 | 145 | 321 |
| West Ward | 165 | 137 | 302 |
| BOROUGH OF PORT CHALMERS:— | |||
| High Ward | 527 | 381 | 908 |
| Middle Ward | 231 | 229 | 460 |
| South Ward | 131 | 134 | 265 |
| Eastward | 267 | 281 | 548 |
| BOROUGH OF NORTH-EAST VALLEY:— | |||
| High Ward | 171 | 172 | 343 |
| East Ward | 637 | 638 | 1,275 |
| Westward | 602 | 534 | 1,136 |
| BOROUGH OF WEST HARBOUR:— | |||
| Sawyer's Bay Ward | 92 | 77 | 169 |
| St. Leonards Ward | 96 | 104 | 200 |
| Rothesay Ward | 248 | 216 | 464 |
| Ravensbourne Ward | 199 | 181 | 380 |
| BOROUGH OF DUNEDIN:— | |||
| South Ward | 1,891 | 1,703 | 3,594 |
| High Ward | 2,760 | 2,584 | 5,344 |
| Bell Ward | 3,560 | 3,488 | 7,048 |
| Leith Ward | 4,035 | 4,351 | 8,386 |
| BOROUGH OF ROSLYN:— | |||
| Kilgour | 280 | 294 | 574 |
| Sunnyside | 541 | 517 | 1,058 |
| Linden | 387 | 413 | 800 |
| Waverley | 220 | 223 | 443 |
| BOROUGH OF CAVERSHAM:— | |||
| North Ward | 724 | 667 | 1,391 |
| Middle Ward | 575 | 558 | 1,133 |
| South Ward | 417 | 394 | 811 |
| Kensington | 345 | 309 | 654 |
| BOROUGH OF MORNINGTON:— | |||
| First Ward | 492 | 516 | 1,008 |
| Second Ward | 606 | 672 | 1,278 |
| Third Ward | 298 | 302 | 600 |
| BOROUGH OF MAORI HILL:— | |||
| North Ward | 64 | 47 | 111 |
| South Ward | 307 | 290 | 597 |
| East Ward | 99 | 86 | 185 |
| Westward | 135 | 108 | 243 |
| BOROUGH OF ST. KILDA:— | |||
| Musselborough Ward | 110 | 126 | 236 |
| Park Ward | 273 | 264 | 537 |
| BOROUGH OF SOUTH DUNEDIN:— | |||
| North Ward | 669 | 609 | 1,278 |
| East Ward | 523 | 543 | 1,066 |
| South Ward | 239 | 213 | 452 |
| BOROUGH OF GREEN ISLAND:— | |||
| North Ward | 107 | 114 | 221 |
| South Ward | 123 | 118 | 241 |
| BOROUGH OF MILTON:— | |||
| West Ward | 297 | 285 | 582 |
| South Ward | 177 | 191 | 368 |
| East Ward | 173 | 164 | 337 |
| BOROUGH OF BALCLUTHA:— | |||
| North Ward | 138 | 98 | 236 |
| East Ward | 49 | 44 | 93 |
| Southward | 252 | 239 | 491 |
| BOROUGH OF LAWRENCE:— | |||
| Eastward | 321 | 326 | 647 |
| Middle Ward | 147 | 138 | 285 |
| West Ward | 42 | 35 | 77 |
| BOROUGH OF ROXBURGH:— | |||
| Northern Ward | 41 | 32 | 73 |
| Middle Ward | 65 | 41 | 106 |
| Southern Ward | 60 | 38 | 98 |
| BOROUGH OF TAPANUI:— | |||
| West Ward | 86 | 83 | 169 |
| Middle Ward | 150 | 146 | 296 |
| East Ward | 68 | 59 | 127 |
| BOROUGH OF NASEBY:— | |||
| Southward | 164 | 133 | 297 |
| Eastward | 72 | 44 | 116 |
| West Ward | 86 | 61 | 147 |
| BOROUGH OF CROMWELL:— | |||
| Bridge Ward | 64 | 58 | 122 |
| Kawarau Ward | 55 | 62 | 117 |
| Macandrew Ward | 109 | 81 | 190 |
| BOROUGH OF ALEXANDRA:— | |||
| Manuherikia Ward | 71 | 36 | 107 |
| Clutha Ward | 93 | 75 | 168 |
| BOROUGH OF ARROWTOWN:— | |||
| Arrow Ward | 72 | 49 | 121 |
| Bush Ward | 75 | 59 | 134 |
| Camp Ward | 91 | 72 | 163 |
| BOROUGH OF QUEENSTOWN:— | |||
| North Ward | 147 | 102 | 249 |
| Lake Ward | 142 | 98 | 240 |
| South Ward | 151 | 95 | 246 |
| BOROUGH OF INVERCARGILL:— | |||
| North Ward | 645 | 582 | 1,227 |
| Second Ward | 752 | 643 | 1,395 |
| Third Ward | 584 | 614 | 1,198 |
| South Ward | 392 | 384 | 776 |
| BOROUGH OF INVERCARGILL SOUTH:— | |||
| North Ward | 380 | 368 | 748 |
| Middle Ward | 43 | 32 | 75 |
| South Ward | 52 | 48 | 100 |
| BOROUGH OF INVERCARGILL EAST:— | |||
| North Ward | 123 | 115 | 238 |
| Eastward | 183 | 155 | 338 |
| West Ward | 105 | 104 | 209 |
| BOROUGH OF INVERCARGILL NORTH:— | |||
| North Ward | 15 | 25 | 40 |
| Middle Ward | 160 | 148 | 308 |
| South Ward | 163 | 159 | 322 |
| BOROUGH OF WINTON:— | |||
| North Ward | 40 | 32 | 72 |
| South Ward | 94 | 64 | 158 |
| BOROUGH OF RIVERTON:— | |||
| North Ward | 470 | 326 | 796 |
| South ward | 209 | 182 | 391 |
NOTE,—The suburbs of the City of Auckland may be said to consist of the Road Districts of Archhill, Newton, Ponsonby, Eden Terrace, Grafton, and Karangahape, the population of which will be found in Table XXIV.
The suburbs of the City of Christchurch, represented by that portion of the Electoral District of Christchurch lying outside the boundaries of the Boroughs of Christchurch and Sydenham, contain a population of 8,540.
The population suburban to Dunedin and surrounding boroughs lies in certain adjacent road districts, and will be found in Table XXIV.
Table XIX. Table XIX. Showing the Population of the different Counties (inclusive of that of their interior Boroughs), and their Shipping.
| Counties (including Boroughs) and Shipping. | Total (including Chinese). | ||
|---|---|---|---|
| Persons. | Males. | Females. | |
| Mongonui | 1,471 | 871 | 600 |
| Shipping | 2 | 2 | … |
| Bay of Islands | 2,184 | 1,258 | 926 |
| Shipping | 66 | 65 | 1 |
| Hokianga | 587 | 367 | 220 |
| Shipping | 25 | 25 | … |
| Hobson | 2,851 | 1,754 | 1,097 |
| Shipping | 67 | 67 | … |
| Whangarei | 3,953 | 2,245 | 1,708 |
| Shipping | 19 | 19 | … |
| Rodney | 3,287 | 1,802 | 1,485 |
| Shipping | 13 | 13 | … |
| Waitemata | 4,522 | 2,608 | 1,914 |
| Shipping | 10 | 10 | … |
| Eden, including Auckland, Parnell, and Onehunga | 40,003 | 20,209 | 19,794 |
| Shipping | 671 | 614 | 57 |
| Manukau | 10,274 | 5,416 | 4,858 |
| Coromandel | 2,153 | 1,355 | 798 |
| Shipping | 16 | 16 | … |
| Thames, including Borough of Thames | 10,042 | 5,473 | 4,569 |
| Shipping | 50 | 50 | … |
| Piako | 981 | 713 | 268 |
| Tauranga | 2,599 | 1,447 | 1,152 |
| Shipping | 47 | 47 | … |
| Whakatane | 913 | 527 | 386 |
| Shipping | 4 | 4 | … |
| Cook, including Gisborne | 3,477 | 1,994 | 1,483 |
| Shipping | 7 | 7 | … |
| Wairoa | 1,000 | 597 | 412 |
| East Taupo | 126 | 93 | 33 |
| West Taupo | 11 | 8 | 3 |
| Waipa, including part of Hamilton | 3,828 | 2,056 | 1,772 |
| Shipping | 1 | 1 | … |
| Waikato, including part of Hamilton | 3,487 | 1,936 | 1,551 |
| Shipping | 6 | 6 | … |
| Raglan | 776 | 460 | 316 |
| Kawhia | 108 | 59 | 49 |
| Taranaki, including New Plymouth | 10,130 | 5,603 | 4,527 |
| Shipping | 63 | 43 | 20 |
| Patea | 5,789 | 3,490 | 2,299 |
| Shipping | 4 | 4 | … |
| Wanganui, including Borough of Wanganui | 8,102 | 4,265 | 3,837 |
| Shipping | 70 | 67 | 3 |
| Rangitikei, including Marton | 3,973 | 2,191 | 1,782 |
| Manawatu, including Palmerston North | 8,738 | 4,870 | 3,868 |
| Shipping | 7 | 7 | … |
| Hutt, including Wellington | 28,421 | 14,426 | 13,995 |
| Shipping | 228 | 212 | 16 |
| Wairarapa West, including Greytown and Masterton | 9,078 | 4,883 | 4,195 |
| Wairarapa East | 1,475 | 1,046 | 429 |
| Waipawa | 5,867 | 3,411 | 2,456 |
| Hawke's Bay, including Napier | 10,635 | 5,753 | 4,882 |
| Shipping | 219 | 196 | 23 |
| Sounds | 605 | 364 | 241 |
| Shipping | 4 | 4 | … |
| Marlborough, including Picton and Blenheim | 7,621 | 4,219 | 3,402 |
| Shipping | 35 | 35 | … |
| Kaikoura | 1,105 | 671 | 434 |
| Waimea, including Nelson | 14,299 | 7,189 | 7,110 |
| Shipping | 39 | 39 | |
| Collingwood | 1,643 | 926 | 717 |
| Shipping | 2 | 2 | … |
| Buller, including Westport | 3,558 | 2,156 | 1,402 |
| Shipping | 86 | 76 | 10 |
| Inangahua | 2,927 | 2,015 | 912 |
| Grey, including Greymouth | 7,483 | 4,736 | 2,747 |
| Shipping | 91 | 89 | 2 |
| Westland, including Hokitika, Ross, and Kumara | 10,246 | 6,125 | 4,121 |
| Shipping | 26 | 25 | 1 |
| Amuri | 513 | 318 | 135 |
| Cheviot | 102 | 75 | 27 |
| Ashley, including Rangiora and Kaiapoi | 14,621 | 7,884 | 6,737 |
| Akaroa, including Borough of Akaroa | 4,631 | 2,536 | 2,095 |
| Shipping | 2 | 2 | … |
| Selwyn, including Christchurch, Lyttelton, and Sydenham | 62,123 | 32,377 | 29,746 |
| Shipping | 251 | 247 | 4 |
| Ashburton, including Borough of Ashburton | 8,691 | 5,241 | 3,450 |
| Geraldine, including Timaru | 16,646 | 9,158 | 7,488 |
| Shipping | 147 | 137 | 10 |
| Waimate, including Borough of Waimate | 5,038 | 2,988 | 2,050 |
| Waitaki, including Oamaru and Hampden | 13,073 | 7,329 | 5,744 |
| Shipping | 84 | 82 | 2 |
| Waikouaiti, including West Hawkesbury, Palmerston South, Port Chalmers, North-East Valley,and West Harbour | 14,192 | 7,701 | 6,491 |
| Shipping | 359 | 310 | 49 |
| Peninsula | 2,425 | 1,300 | 1,125 |
| Taieri, including Dunedin, Roslyn, Caver sham, Mornington, Maori Hill, St. Kilda, Dunedin South, and Green Island | 46,765 | 24,010 | 22,755 |
| Shipping | 64 | 63 | 1 |
| Bruce, including Milton | 6,336 | 3,448 | 2,888 |
| Clutha, including Balclutha | 5,025 | 2,903 | 2,122 |
| Tuapeka, including Lawrence, Roxburgh, and Tapanui | 8,258 | 4,950 | 3,308 |
| Maniototo, including Naseby | 3,014 | 1,877 | 1,137 |
| Vincent, including Cromwell and Alexandra | 4,269 | 2,823 | 1,446 |
| Lake, including Arrowtown and Queens town | 3,639 | 2,401 | 1,238 |
| Shipping | 10 | 10 | … |
| Southland, including Invercargill, Invercargill South, Invercargill East, Invercargill North, Campbelltown, Avenal, Gladstone, and Winton | 21,410 | 12,169 | 9,241 |
| Shipping | 33 | 33 | … |
| Wallace, including Riverton | 4,803 | 3,085 | 1,718 |
| Shipping | 4 | 4 | … |
| Fiord | 13 | 5 | 8 |
| Stewart Island | 295 | 164 | 151 |
| Shipping | 38 | 38 | … |
| Total | 489,089 | 269,060 | 220,029 |
Table XX. Table XX. Showing the Population of the different Islands adjacent to New Zealand, and the Dwellings of the People.
| Electoral Districts. | Islands. | Population. | Half-Castes. | Dwelling Houses. | |||||
|---|---|---|---|---|---|---|---|---|---|
| Persons. | Males. | Females. | Males. | Females. | inhabited. | Uninhabited. | Tents and Dwellings with Canvas Roofs. | ||
| Rodney | Tiritiri | 9 | 7 | 2 | … | … | 2 | … | … |
| Rodney | Kawau | 54 | 24 | 30 | … | … | 10 | 4 | … |
| Rodney | Great and Little Barrier | 281 | 190 | 91 | 3 | 2 | 62 | … | 10 |
| Franklin | Islands of Rakino, Motuihi, Brown's, Bean Rock, Ponui and Lighthouse | 48 | 33 | 15 | … | … | 10 | 4 | … |
| Franklin | Motutapu | 8 | 7 | 1 | … | … | 1 | … | … |
| Franklin | Waiheke | 192 | 113 | 79 | 3 | … | 42 | 4 | 2 |
| Thames | Slipper Island | 3 | 3 | … | … | … | 1 | … | … |
| East Coast | Motiti | 6 | 6 | … | … | … | 1 | … | … |
| Wellington Country | Mana | 1 | 1 | … | 1 | … | … | 1 | … |
| Chatham Islands | … | 196 | 115 | 81 | 3 | 5 | … | 40 | … |
| Totals | 798 | 499 | 299 | 10 | 7 | 170 | 12 | 12 | |
Table XXI. Table XXI. Showing the Persons on Shipboard at the different Ports of the Colony on 3rd April, 1881.
| — | Total (including Chinese). | Chinese. | |||
|---|---|---|---|---|---|
| Persons. | Males. | Females. | Males. | Females. | |
| * In addition to the shipping belonging to the Fort of Auckland, given above, there were on the Census night two British men-of-war and one Italian man-of-war lying in-the harbour, having on board an aggregate number of 227 persons. | |||||
| Mongonui | 2 | 2 | … | … | … |
| Bay of Islands— | |||||
| Russell | 62 | 61 | 1 | … | … |
| Wharoa | 4 | 4 | … | … | … |
| Hokianga | 25 | 25 | … | … | … |
| Whangarei | 19 | 19 | … | … | … |
| Kaipara (North Wairoa River) | 67 | 67 | … | … | … |
| Great Barrier | 2 | 2 | … | … | … |
| Helensville | 10 | 10 | … | … | … |
| Warkworth | 11 | 11 | … | … | … |
| Waitemata (Auckland)* | 633 | 577 | 56 | 53 | … |
| Onehunga | 38 | 37 | 1 | … | … |
| Waikato River | 2 | 2 | … | … | … |
| Ngaruawahia | 1 | 1 | … | … | … |
| Hamilton | 6 | 6 | … | … | … |
| Firth of Thames— | |||||
| Grahamstown | 20 | 20 | … | … | … |
| Turua | 7 | 7 | … | … | … |
| Tairua | 21 | 21 | … | … | … |
| Coromandel— | |||||
| Cabbage Bay | 2 | 2 | … | … | … |
| Coromandel | 3 | 3 | … | … | … |
| Mercury Bay | 11 | 11 | … | … | … |
| Tauranga | 46 | 46 | 1 | … | … |
| Maketu | 1 | 1 | … | … | |
| Waioeka | 4 | 4 | … | … | … |
| Gisborne | 7 | 7 | … | … | … |
| Hawke's Bay (Napier) | 219 | 196 | 23 | … | … |
| Port Nicholson (Wellington) | 228 | 212 | 16 | … | … |
| Manawatu— | |||||
| Foxton | 4 | 4 | … | … | … |
| Otaki | 3 | 3 | … | … | … |
| Wanganui | 7 | 67 | 3 | … | … |
| Carlyle | 4 | 4 | … | … | … |
| Waitara | 63 | 43 | 20 | … | … |
| Blenheim | 11 | 11 | … | … | … |
| Queen Charlotte Sound (Picton) | 17 | 17 | … | … | … |
| Pelorus Sound (Havelock) | 5 | 5 | … | … | … |
| Omaka | 2 | 2 | … | … | … |
| D'Urville Island | 4 | 4 | … | … | … |
| Nelson | 39 | 39 | … | … | … |
| Takaka | 2 | 2 | … | … | … |
| Westport | 86 | 76 | 10 | … | … |
| Greymouth | 91 | 89 | 2 | … | … |
| Hokitika | 17 | 16 | 1 | … | … |
| Okarito | 9 | 9 | … | … | … |
| Lyttelton | 247 | 243 | 4 | … | … |
| Heathcote | 4 | 4 | … | … | … |
| Akaroa | 2 | 2 | … | … | … |
| Timaru | 147 | 137 | 10 | … | … |
| Oamaru | 84 | 82 | 2 | … | … |
| Port Chalmers | 359 | 340 | 19 | … | … |
| Dunedin | 64 | 63 | 1 | … | … |
| Queenstown | 10 | 10 | … | … | … |
| Invercargill | 5 | 5 | … | … | … |
| Campbelltown | 28 | 28 | … | … | … |
| Riverton | 4 | 4 | … | … | … |
| Stewart Island | 38 | 38 | … | … | … |
| Chatham Islands | 46 | 46 | … | … | … |
| Totals | 2,916 | 2,717 | 199 | … | … |
Table XXII. Table XXII. Showing the Population of the Electoral Districts (exclusive of Maoris).
| Electoral Districts. | Population (inclusive of Chinese). | Population (exclusive of Chinese). | Chinese. | |||||
|---|---|---|---|---|---|---|---|---|
| Persons. | Males. | Females. | Persons. | Males. | Females. | Males. | Females. | |
| Mongonui and Bay of Islands | 4,453 | 2,641 | 1,8l2 | 4,452 | 2,640 | 1,8l2 | 1 | … |
| Marsden | 6,920 | 4,045 | 2,875 | 6,920 | 4,045 | 2,875 | … | … |
| Rodney | 3,615 | 2,026 | 1,589 | 3,615 | 2,026 | 1,589 | … | … |
| Waitemata | 4,211 | 2,414 | 1,797 | 4,211 | 2,414 | 1,797 | … | … |
| City of Auckland East | 5,159 | 2,691 | 2,468 | 5,140 | 2,674 | 2,466 | 17 | 2 |
| City of Auckland West | 11,505 | 5,960 | 5,545 | 11,502 | 5,958 | 5,544 | 2 | 1 |
| Parnell | 5,979 | 2,872 | 3,107 | 5,976 | 2,869 | 3,107 | 3 | … |
| Newton | 8,83 | 4,360 | 4,523 | 8,870 | 4,347 | 4,523 | 13 | … |
| Town of Onehunga | 2,217 | 1,047 | 1,170 | 2,217 | 1,047 | 1,170 | … | … |
| Eden | 6,260 | 3,279 | 2,981 | 6,247 | 3,266 | 2,981 | 13 | … |
| Franklin | 10,522 | 5,569 | 4,953 | 10,522 | 5,569 | 4,953 | … | … |
| Thames | 12,048 | 6,732 | 5,316 | 12,040 | 6,724 | 5,316 | 8 | … |
| East Coast | 7,190 | 4,098 | 3,092 | 7,186 | 4,094 | 3,092 | 4 | … |
| Waipa | 4,723 | 2,583 | 2,140 | 4,725 | 2,583 | 2,140 | … | … |
| Waikato | 4,762 | 2,848 | 1,914 | 4,762 | 2,848 | 1,914 | … | … |
| Town of New Plymouth | 3,310 | 1,673 | 1,637 | 3,305 | 1,668 | 1,637 | 5 | … |
| Grey and Bell | 5,092 | 2,756 | 2,336 | 5,091 | 2,755 | 2,336 | 1 | … |
| Egmont | 6,389 | 4,041 | 2,348 | 6,388 | 4,040 | 2,348 | 1 | … |
| Wanganui | 9,230 | 4,883 | 4,342 | 9,222 | 4,880 | 4,342 | 8 | … |
| Rangitikei | 4,004 | 2,220 | 1,784 | 4,002 | 2,218 | 1,784 | 2 | … |
| Manawatu | 8,885 | 4,992 | 3,893 | 8,880 | 4,987 | 3,893 | 5 | … |
| City of Wellington | 20,563 | 10,226 | 10,337 | 20,537 | 10,200 | 10,337 | 26 | … |
| Wellington Country | 4,152 | 2,183 | 1,969 | 4,147 | 2,178 | 1,969 | 5 | … |
| Hutt | 3,625 | 1,958 | 1,667 | 3,595 | 1,928 | 1,667 | 30 | … |
| Wairarapa | 10,607 | 5,964 | 4,643 | 10,600 | 5,957 | 4,643 | 7 | … |
| Clive | 7,664 | 4,411 | 3,253 | 7,664 | 4,411 | 3,253 | … | … |
| Napier | 9,484 | 5,093 | 4,391 | 9,480 | 5,089 | 4,391 | 4 | … |
| Picton | 3,679 | 2,050 | 1,629 | 3,679 | 2,050 | 1,629 | … | … |
| Wairau | 4,481 | 2,493 | 1,988 | 4,480 | 2,492 | 1,988 | 1 | … |
| Suburbs of Nelson | 2,154 | 1,065 | 1,089 | 2,154 | 1,065 | 1,089 | … | … |
| City of Nelson | 6,764 | 3,261 | 3,503 | 6,764 | 3,261 | 3,503 | … | … |
| Waimea | 2,837 | 1,646 | 1,191 | 2,813 | 1,622 | 1,191 | 24 | … |
| Motueka | 3,085 | 1,622 | 1,463 | 3,084 | 1,621 | 1,463 | 1 | … |
| Collingwood | 1,643 | 926 | 717 | 1,643 | 926 | 717 | … | … |
| Buller | 3,706 | 2,254 | 1,452 | 3,695 | 2,243 | 1,452 | 11 | … |
| Grey Valley | 9,787 | 6,288 | 3,499 | 8,996 | 5,497 | 3,499 | 791 | … |
| Hokitika | 7,902 | 4,624 | 3,278 | 7,635 | 4,357 | 3,278 | 267 | … |
| Totara | 2,344 | 1,501 | 843 | 2,231 | 1,388 | 843 | 113 | … |
| Cheviot | 2,449 | 1,607 | 842 | 2,449 | 1,607 | 842 | … | … |
| Ashley | 7,045 | 3,806 | 3,239 | 7,045 | 3,806 | 3,239 | … | … |
| Kaiapoi | 6,912 | 3,628 | 3,284 | 6,908 | 3,624 | 3,284 | 4 | … |
| Town of Lyttelton | 4,127 | 2,205 | 1,922 | 4,127 | 2,205 | 1,922 | … | … |
| City of Christchurch | 30,715 | 15,441 | 15,274 | 30,669 | 15,395 | 15,274 | 46 | … |
| Avon | 5,602 | 2,922 | 2,680 | 5,595 | 2,915 | 2,680 | 7 | … |
| Heathcote | 11,624 | 6,089 | 5,535 | 11,606 | 6,071 | 5,535 | 18 | … |
| Selwyn | 6,195 | 3,419 | 2,776 | 6,191 | 3,415 | 2,776 | 4 | … |
| Akaroa | 4,336 | 2,367 | 1,969 | 4,333 | 2,364 | 1,969 | 3 | … |
| Coleridge | 12,781 | 7,678 | 5,103 | 12,765 | 7,663 | 5,103 | 16 | … |
| Timaru | 9,722 | 5,180 | 4,542 | 9,705 | 5,163 | 4,542 | 17 | … |
| Geraldine | 4,447 | 2,446 | 2,001 | 4,440 | 2,439 | 2,001 | 7 | … |
| Gladstone | 7,547 | 4,540 | 3,007 | 7,534 | 4,527 | 3,007 | 13 | … |
| Waitaki | 13,073 | 7,329 | 5,744 | 13,043 | 7,299 | 5,744 | 30 | … |
| Waikouaiti | 5,390 | 3,019 | 2,371 | 5,275 | 2,904 | 2,371 | 115 | … |
| Port Chalmers | 4,955 | 2,644 | 2,311 | 4,928 | 2,617 | 2,311 | 27 | … |
| City of Dunedin | 24,372 | 12,246 | 12,126 | 24,219 | 12,099 | 12,120 | 147 | 6 |
| Roslyn | 11,626 | 5,873 | 5,753 | 11,615 | 5,862 | 5,753 | 11 | … |
| Caversham | 10,473 | 5,418 | 5,055 | 10,389 | 5,334 | 5,055 | 84 | … |
| Taieri | 6,256 | 3,582 | 2,674 | 6,178 | 3,504 | 2,674 | 78 | … |
| Bruce | 5,893 | 3,167 | 2,726 | 5,770 | 3,044 | 2,726 | 123 | … |
| Clutha | 4,558 | 2,637 | 1,921 | 4,556 | 2,635 | 1,921 | 2 | … |
| Tuapeka | 5,834 | 3,506 | 2,328 | 5,211 | 2,883 | 2,328 | 623 | … |
| Waikaia | 6,002 | 3,766 | 2,236 | 5,569 | 3,333 | 2,236 | 433 | … |
| Mount Ida | 3,368 | 2,137 | 1,231 | 3,036 | 1,805 | 1,231 | 332 | … |
| Dunstan | 3,901 | 2,560 | 1,341 | 3,421 | 2,080 | 1,341 | 480 | … |
| Wakatipu | 3,989 | 2,654 | 1,335 | 3,558 | 2,223 | 1,335 | 431 | … |
| Invercargill | 4,596 | 2,373 | 2,223 | 4,572 | 2,349 | 2,223 | 24 | … |
| Mataura | 9,870 | 5,389 | 4,481 | 9,848 | 5,367 | 4,481 | 22 | … |
| Riverton | 5,518 | 3,400 | 2,418 | 5,644 | 3,226 | 2,418 | 174 | … |
| Wallace | 3,511 | 2,445 | 1,066 | 3,206 | 2,140 | 1,066 | 305 | … |
| Total—69 districts | 486,821 | 266,773 | 220,048 | 481,873 | 261,834 | 220,039 | 4,939 | 9 |
Table XXIII. Table XXIII. Showing the Population of the Provincial Districts (exclusive of Maoris), distinguishing Chinese and Half-castes, with the Number of Houses Inhabited, Uninhabited, and in Course of Erection, Classified according to Materials and Rooms; also the Number of Europeans and Chinese in different Classes of Dwellings, and those Camping Out.
| — | Total (including Chinese and Half-castes). | Chinese. | Half-castes. | Dwellings. | (d) Europeans Living— | Travellers and Persons Sleeping under or Camping out | Chinese Living | ||||||||||||||||||||||||||||||||
|---|---|---|---|---|---|---|---|---|---|---|---|---|---|---|---|---|---|---|---|---|---|---|---|---|---|---|---|---|---|---|---|---|---|---|---|---|---|---|---|
| House and Huts | Tents and Dwellings with Canvas Roofs. | Inhabited. | Uninhabited and Building. | In Houses of Brick Stone,Wood, Iron, or lath and Plaster. | In Huts of Houses of Cob, Sod, Raupo, &c.and Habitations of Unstated Materials. | In Tents or Dwelling with Canvas Roofs. | |||||||||||||||||||||||||||||||||
| Materials | Rooms | Materials | In Houses of Brick, Stone Wood. Iron, or Lath and Plaster. | In Huts or Houses of Cob, Sod, Raupo, &c. | Inhabitations of unstated Materials | In Tents or Dwellings with Canvas Roofs | |||||||||||||||||||||||||||||||||
| Persons. | Males | Females. | Males | Females. | Males | Females. | Inhabited. | Uninhabited. | Building. | Brick,Stone or Concrete | Wood, Iron, or Lath and Plaster. | Cob or Sod. | Raupo | Huts of Sod, Clav, Wood, Stone, &c. | Tents and Dwellings with Canvas Roofs | Other Materials, or Not Stated, (c) | One | Two | Three and Four. | Five and Six. | Over Six. | Not Stated. | Brick or Stone. | Wood and Iron. | Other Materials, and Not Stated. | ||||||||||||||
| Brick, Stone, Wood, Iron,&c. | Cob, Raupo, &c. and Huts or Tents. | Europeans. | Chinese. | ||||||||||||||||||||||||||||||||||||
| Auckland | 99,451 | 54,11 | 45,340 | 115 | 3 | 613 | 602 | 18,995 | 1,260 | 359 | 423 | 462 | 17,605 | 16 | 517 | 80 | 269 | 423 | 46 | 557 | 1,003 | 2,158 | 7,36l | 4,577 | 3,638 | 124 | 40 | 1,478 | 101 | 94,936 | 2,437 | 166 | 823 | 21 | … | 62 | 2 | ||
| Taranaki | 14,858 | 8,517 | 6,341 | 7 | … | … | 31 | 2,698 | 172 | 32 | 240 | 3 | 2,553 | … | 58 | 8 | 58 | 240 | 18 | 136 | 292 | 551 | 963 | 541 | 379 | 76 | 156 | 48 | … | 13,504 | 448 | 66 | 765 | 1 | 7 | … | … | … | … |
| Wellington | 61,371 | 32,717 | 28,654 | 83 | 58 | 50 | 11,332 | 1,069 | 67 | 186 | 67 | 11,027 | … | 144 | 48 | 23 | 186 | 23 | 265 | 279 | 1,490 | 4,217 | 2,705 | 2,361 | 201 | 8 | 1,071 | 57 | … | 59,760 | … | 756 | 75 | 390 | 2 | 83 | … | ||
| Hawke's Bay | 17,367 | 9,700 | 7,667 | 4 | 80 | 61 | 3,178 | 184 | 20 | 59 | 9 | 3,083 | … | 55 | 17 | 10 | 59 | 5 | 173 | 103 | 625 | 1,343 | 487 | 487 | 19 | 1 | 194 | 9 | … | 16,643 | 303 | 15 | 177 | 6 | 4 | … | … | ||
| Marlborough | 9,300 | 5,249 | 4,051 | 1 | 40 | 18 | 1,711 | 100 | 12 | 85 | 10 | 1,536 | 43 | 94 | 25 | 1 | 85 | 2 | 101 | 127 | 271 | 567 | 381 | 339 | 10 | 2 | 80 | 30 | … | 8,340 | … | 745 | 7 | 168 | 1 | … | … | ||
| Nelson | 26,075 | 14,800 | 11,275 | 451 | 4 | 1 | 5,718 | 444 | 36 | 242 | 62 | 4,805 | 67 | 159 | 593 | … | 242 | 32 | 488 | 794 | 778 | 1,584 | 1,295 | 1,123 | 65 | 2 | 371 | 107 | 22,927 | 2,017 | 152 | 393 | 8 | 143 | 252 | 56 | … | ||
| Westland | 15,010 | 9,075 | 5,935 | 756 | 7 | 3 | 4,171 | 458 | 9 | 174 | 2 | 3,691 | … | 7 | 464 | … | 174 | 7 | 826 | 600 | 713 | 1,295 | 506 | 399 | 15 | 421 | 46 | … | 13,350 | 544 | 16 | 226 | 1 | 518 | … | 178 | 60 | ||
| Canterbury | 112,182 | 60,590 | 51,592 | 135 | 26 | 30 | 19,681 | 1,391 | 154 | 669 | 894 | 16,780 | 1,416 | 373 | 120 | 3 | 669 | 95 | 443 | 836 | 3,219 | 8,099 | 4,240 | 3,247 | 266 | 51 | 1,198 | 296 | 99,459 | 10,354 | 428 | 1,402 | 4 | 119 | 9 | 7 | … | ||
| Otago | 134,077 | 74,685 | 59,392 | 3,441 | 6 | 201 | 191 | 25,309 | 1,659 | 159 | 839 | 2,242 | 20,214 | 940 | 883 | 852 | 6 | 839 | 172 | 1,050 | 2,002 | 4,949 | 9,627 | 4,764 | 3,367 | 389 | 206 | 1,360 | 252 | 119,822 | 7,837 | 780 | 1,561 | 38 | 1,322 | 1,837 | 288 | ||
| Chatham Islands | 242 | 161 | 81 | 2 | 5 | 5 | 40 | … | … | … | 1 | 24 | … | 11 | … | … | … | 4 | … | 2 | 4 | 8 | 9 | 13 | 4 | 122 | … | 54 | 18 | … | … | 2 | … | … | … | … | … | ||
| Totals | 489,933 | 269,605 | 220,328 | 4,995 | 9 | 1,052 | 992 | 92,833 | 6,737 | 848 | 2,917 | 3,752 | 81,317 | 2,482 | 2,301 | 2,207 | 370 | 2,917 | 404 | 4,039 | 6,038 | 14.758 | 35,064 | 19,338 | 15,344 | 1,169 | 310 | 6,329 | 946 | 448,863 | 25,495 | 1,723 | 8,905 | 81 | 2,261 | 2,278 | 411 | ||
Table XXIV. Table XXIV. Showing the County Population (exclusive of Maoris) in Towns, Localities, and Road Districts, arranged so as to exhibit the places according to the Ridings in which they are situated.
| Country, Riding, Town, Locality, and Road District. | Total. | M. | F. | |||
|---|---|---|---|---|---|---|
| MONGONUI COUNTRY. | ||||||
| Riding of Kaitaia— | ||||||
| Ahipara | 41 | 20 | 21 | |||
| Awanui | 63 | 32 | 31 | |||
| Cape Maria Van Dieman | 3 | 3 | … | |||
| Kaio (part) | 9 | 7 | 2 | |||
| Kaitaia | 78 | 42 | 36 | |||
| Maungatete | 44 | 27 | 17 | |||
| Mongonui, T. | 102 | 56 | 46 | |||
| Muriwhenua | 8 | 5 | 3 | |||
| Muriwhenua South | 26 | 20 | 6 | |||
| Ohora | 30 | 17 | 13 | |||
| Oruaiti River (south of) | 25 | 14 | 11 | |||
| Oruaiti River (north of) | 47 | 29 | 18 | |||
| Oruru | 166 | 87 | 79 | |||
| Parengarenga | 5 | 3 | 2 | |||
| Pukepoto | 31 | 20 | 11 | |||
| Taipa | 27 | 24 | 3 | |||
| Victoria | 67 | 38 | 29 | |||
| Total Riding | 772 | 444 | 328 | |||
| Riding of Whangaroa— | ||||||
| Inumia | 15 | 12 | 3 | |||
| Kaio (part) | 176 | 88 | 88 | |||
| Kauri-Putete | 18 | 18 | … | |||
| Kukuparere | 43 | 26 | 17 | |||
| Mahinepua | 4 | 4 | … | |||
| Maturi | 2 | 1 | 1 | |||
| Ngaere | 6 | 5 | 1 | |||
| Orotere | 4 | 4 | … | |||
| Pupuke | 18 | 18 | … | |||
| Taita | 7 | 7 | … | |||
| Taraire | 18 | 11 | 7 | |||
| Taniwharawhara | 7 | 5 | 2 | |||
| Tauranga Valley | 11 | 10 | 1 | |||
| Upokarau | 12 | 9 | 3 | |||
| Waiari | 15 | 15 | … | |||
| Waikoura | 6 | 2 | 4 | |||
| Waitangi | 6 | 2 | 4 | |||
| Waitapu | 16 | 13 | 3 | |||
| Whakarara | 1 | 1 | … | |||
| Whangaroa Harbour, North | 203 | 111 | 92 | |||
| Whangaroa Harbour, Totara | 111 | 65 | 46 | |||
| Total Riding | 699 | 427 | 272 | |||
| Highway District:s— | Total | M | F | |||
| Ahipara | 257 | 141 | 116 | |||
| Kaio | 293 | 182 | 111 | |||
| Mongonui Township | 102 | 56 | 46 | |||
| Oruaiti | 72 | 43 | 29 | |||
| Oruru | 260 | 149 | 11 | |||
| Totara | 129 | 83 | 46 | |||
| Whangaroa North | 280 | 165 | 115 | |||
| Outlying | 78 | 52 | 26 | |||
| BAY OF ISLANDS COUNTY. | ||||||
| Riding of Waimate— | ||||||
| Kaikohe | 39 | 25 | 14 | |||
| Kerikeri and vicinity | 85 | 44 | 41 | |||
| Maungaparerua | 7 | 7 | … | |||
| Ohaeawai | 36 | 21 | 15 | |||
| Okaihau | 127 | 71 | 56 | |||
| Okokako | 32 | 19 | 13 | |||
| Omapere | 8 | 5 | 3 | |||
| Pakaraka | 31 | 15 | 16 | |||
| Paihia | 45 | 28 | 17 | |||
| Waikaraka | 9 | 9 | … | |||
| Waimate | 157 | 74 | 83 | |||
| Wharekupenga | 1 | 1 | … | |||
| Total Riding | 577 | 319 | 258 | |||
| Riding of Kawakawa— | ||||||
| Hukerenui | 106 | 96 | 10 | |||
| Kawakawa, T. | 438 | 255 | 183 | |||
| Opua to Kawakawa | 79 | 60 | 19 | |||
| Pakaru | 77 | 46 | 31 | |||
| Ruapekapeka | 50 | 30 | 20 | |||
| Taumarere | 73 | 50 | 23 | |||
| Tirohanga | 31 | 19 | 12 | |||
| Waiomio and vicinity | 173 | 92 | 81 | |||
| Whangai | 81 | 40 | 41 | |||
| Wharau | 94 | 54 | 40 | |||
| Total Riding | 1,202 | 742 | 460 | |||
| Riding of Russell— | ||||||
| Manganese Mines | 134 | 73 | 61 | |||
| Russell, T. | 237 | 106 | 131 | |||
| Whangaruru | 34 | 18 | 16 | |||
| Total Riding | 405 | 197 | 208 | |||
| HOKIANGA COUNTY. | ||||||
| Riding of Waihou— | ||||||
| Hokianga Road | 4 | 4 | … | |||
| Horeka | 18 | 9 | 9 | |||
| Kohukohu | 122 | 67 | 55 | |||
| Mangamuka | 20 | 11 | 9 | |||
| Manganui | 8 | 8 | … | |||
| Maungaropo | 2 | 2 | … | |||
| Motukaraka | 3 | 2 | 1 | |||
| Taheke | 6 | 5 | 1 | |||
| Waihou Upper | 58 | 34 | 24 | |||
| Waihou Lower | 2 | 1 | 1 | |||
| Wairere | 4 | 2 | 2 | |||
| Waitapu | 3 | 1 | 2 | |||
| Waiwai | 19 | 19 | … | |||
| Others | 17 | 11 | 6 | |||
| Total Riding | 286 | 176 | 110 | |||
| Riding of Waima— | ||||||
| Herd's Point, T., and vicinity | 135 | 81 | 54 | |||
| Hokianga Heads | 60 | 31 | 29 | |||
| Hokianga River | 8 | 7 | 1 | |||
| Mangakahia (part) | 29 | 20 | 9 | |||
| Omanaia | 17 | 13 | 4 | |||
| Onoke | 3 | 2 | 1 | |||
| Opara | 8 | 3 | 5 | |||
| Taumatawiwi | 8 | 5 | 3 | |||
| Waima Valley | 5 | 3 | 2 | |||
| Waipoua | 24 | 24 | … | |||
| Whirinake Valley | 4 | 2 | 2 | |||
| Total Riding | 301 | 191 | 110 | |||
| HOBSON COUNTY. | ||||||
| Riding of Paparoa— | ||||||
| Matakohe | 178 | 99 | 79 | |||
| Paparoa | 311 | 175 | 136 | |||
| Pukekaroro | 141 | 86 | 55 | |||
| Wairau | 224 | 126 | 98 | |||
| Total Riding | 854 | 486 | 368 | |||
| Riding of Wairoa— | ||||||
| Aoroa | 20 | 12 | 8 | |||
| Arapohue | 189 | 100 | 89 | |||
| Aratapu, T. | 455 | 260 | 195 | |||
| Awakino (Kauri Bush) | 27 | 22 | 5 | |||
| Awamutu | 19 | 10 | 9 | |||
| Dargaville, T. | 192 | 121 | 71 | |||
| Junction (Kauri Bush) | 33 | 24 | 9 | |||
| Kaihu Gum Fields | 127 | 97 | 30 | |||
| Kaipara Heads | 51 | 26 | 25 | |||
| Kopuru, T. | 216 | 131 | 85 | |||
| Maunganui Gum Field | 25 | 25 | … | |||
| Mangawhare | 124 | 71 | 53 | |||
| Okahu and outlying district | 200 | 156 | 44 | |||
| Pohoatua | 2 | 2 | … | |||
| Rae-o-Rahiri | 14 | 14 | … | |||
| Tangowhahine | 83 | 65 | 18 | |||
| Tatarariki | 109 | 79 | 30 | |||
| Tokatoka | 53 | 22 | 31 | |||
| Whakahara | 58 | 31 | 27 | |||
| Total Riding | 1,997 | 1,268 | 729 | |||
| Country, Riding, Town, Locality, and Road District. | Total. | M. | F. | ||||
|---|---|---|---|---|---|---|---|
| HOBSON COUNTY—continued. | |||||||
| Highway Districts— | Total | M. | F. | ||||
| Matakohe | 233 | 121 | 112 | ||||
| Okahu | 270 | 150 | 120 | ||||
| Paparoa | 311 | 175 | 136 | ||||
| Pukekaroro | 141 | 86 | 55 | ||||
| Wairau | 224 | 126 | 98 | ||||
| Outlying | 1,672 | 1,096 | 576 | ||||
| WHANGAREI COUNTY. | |||||||
| Riding of Ngunguru— | |||||||
| Ngunguru | 46 | 51 | 25 | ||||
| Opuawhanga | 81 | 54 | 27 | ||||
| Otongo | 72 | 49 | 23 | ||||
| Total Riding | 229 | 154 | 75 | ||||
| Riding of Hikurangi— | |||||||
| Apotu | 58 | 29 | 29 | ||||
| Hikurangi Gum Field | 87 | 52 | 25 | ||||
| Kaikahu | 25 | 12 | 13 | ||||
| Kaitara (part) | 57 | 30 | 27 | ||||
| Kamo, T., and vicinity | 220 | 125 | 95 | ||||
| Kaurihohore | 150 | 87 | 63 | ||||
| Kite Nikau | 30 | 14 | 16 | ||||
| Kopenui | 25 | 16 | 9 | ||||
| Mangakahia (part) | 10 | 10 | ... | ||||
| Mangere | 20 | 14 | 6 | ||||
| Maruata | 4 | 2 | 2 | ||||
| Maungatapere | 77 | 38 | 39 | ||||
| Moengawahine | 39 | 32 | 7 | ||||
| Omanene | 12 | 12 | ... | ||||
| Otaika Gum Field | 113 | 73 | 34 | ||||
| Poroti | 10 | 7 | 3 | ||||
| Ruatangata | 132 | 77 | 55 | ||||
| Tangihua | 11 | 9 | 2 | ||||
| Taruna | 26 | 15 | 11 | ||||
| Te Hiki | 8 | 4 | 4 | ||||
| Three-Mile Bush | 16 | 8 | 8 | ||||
| Tikorangi | 13 | 7 | 6 | ||||
| Tumahia | 56 | 27 | 29 | ||||
| Waipuna | 12 | 7 | 5 | ||||
| Whangarei | 197 | 100 | 231 | ||||
| Whangarei, T. | 495 | 264 | 231 | ||||
| Whareora | 97 | 53 | 44 | ||||
| Total Riding | 2,000 | 1,140 | 860 | ||||
| Riding of Manaia— | |||||||
| Owhiwa | 31 | 19 | 12 | ||||
| Parua Road | 213 | 121 | 92 | ||||
| Whangarei Heads | 162 | 90 | 72 | ||||
| Total Riding | 406 | 230 | 176 | ||||
| Riding of Mangapai— | |||||||
| Mareretu | 6 | 5 | 1 | ||||
| Maungakaramea | 204 | 111 | 93 | ||||
| Mangapai | 79 | 42 | 37 | ||||
| Ruarangi | 75 | 38 | 37 | ||||
| Waikiekie | 109 | 61 | 48 | ||||
| Total Riding | 473 | 257 | 216 | ||||
| Riding of Waipu— | |||||||
| Ruakaka | 69 | 52 | 17 | ||||
| Waipu North | 271 | 144 | 127 | ||||
| Waipu Middle | 289 | 150 | 139 | ||||
| Waipu South | 216 | 118 | 98 | ||||
| Total Riding | 845 | 464 | 381 | ||||
| Highway Districts— | Total | M | F | ||||
| Hikurangi | 87 | 62 | 25 | ||||
| Kaurihohore | 208 | 116 | 92 | ||||
| Manaia | 162 | 89 | 73 | ||||
| Mangapai | 79 | 42 | 37 | ||||
| Maungakaramea | 204 | 111 | 93 | ||||
| Maunu | 351 | 206 | 145 | ||||
| Parua Bay | 213 | 121 | 92 | ||||
| Ruarangi | 75 | 38 | 37 | ||||
| Ruatangata | 259 | 142 | 117 | ||||
| Waikiekie | 109 | 61 | 48 | ||||
| Waipu Central | 844 | 460 | 384 | ||||
| Waipu North | |||||||
| Waipu South | |||||||
| Whangarei | 417 | 225 | 192 | ||||
| Whangarei Township | 496 | 265 | 231 | ||||
| Whareora | 122 | 71 | 51 | ||||
| Outlying | 327 | 236 | 91 | ||||
| RODNEY COUNTRY. | |||||||
| Riding of Albert. | |||||||
| Arapaoa | 41 | 22 | 19 | ||||
| Batley | 19 | 11 | 8 | ||||
| North Albertland | 124 | 69 | 55 | ||||
| Otamatea Pahi | 33 | 14 | 19 | ||||
| Puketotara | 40 | 28 | 12 | ||||
| Port Albert, T. | 5 | 2 | 3 | ||||
| Settlement of Port Albert | 51 | 23 | 28 | ||||
| Te Opu | 9 | 6 | 3 | ||||
| Unuwhao | 14 | 7 | 7 | ||||
| Wellsford, T. | 76 | 37 | 39 | ||||
| Whakapau | 22 | 11 | 11 | ||||
| Others | 4 | 4 | … | ||||
| Total Riding | 641 | 354 | 287 | ||||
| Riding of Mangawai. | |||||||
| Mangawai | 189 | 109 | 80 | ||||
| Te Arai | 123 | 67 | 56 | ||||
| Total Riding | 312 | 176 | 136 | ||||
| Riding of Tauhoa— | |||||||
| Kaipara Flats | 19 | 10 | 9 | ||||
| Komokoriki | 104 | 72 | 32 | ||||
| Tauhoa | 206 | 105 | 101 | ||||
| Wharehine | 117 | 60 | 57 | ||||
| Total Riding | 446 | 247 | 199 | ||||
| Riding of Mahurangi— | |||||||
| Little Omaha | 198 | 105 | 93 | ||||
| Mahurangi East | 166 | 76 | 90 | ||||
| Matakana East | 93 | 65 | 28 | ||||
| Matakana West | 146 | 89 | 57 | ||||
| Helensville vicinity | 15 | 6 | 9 | ||||
| Upper Mahurangi | 370 | 200 | 170 | ||||
| Warkworth, T. | 146 | 69 | 77 | ||||
| Others | 7 | 5 | 2 | ||||
| Total Riding | 1,141 | 615 | 526 | ||||
| Riding of Puhoi— | |||||||
| Mahurangi Heads | 46 | 30 | 16 | ||||
| Mahurangi Lower | 62 | 35 | 27 | ||||
| Puhoi Settlement | 298 | 153 | 145 | ||||
| Wainui | 213 | 120 | 93 | ||||
| Waiwera | 128 | 72 | 56 | ||||
| Total Riding | 747 | 410 | 337 | ||||
| Highway Districts— | Total | M | F | ||||
| Albertland North | 115 | 63 | 53 | ||||
| Albertland South | 330 | 180 | 150 | ||||
| Arai | 123 | 67 | 56 | ||||
| Komokoriki | 104 | 71 | 33 | ||||
| Mangawai | 144 | 80 | 64 | ||||
| Mahurangi East | 166 | 76 | 90 | ||||
| Mahurangi Lower | 81 | 52 | 29 | ||||
| Mahurangi Upper | 555 | 383 | 373 | ||||
| Matakana East | 93 | 65 | 38 | ||||
| Matakana West | 146 | 89 | 57 | ||||
| Omaha | 198 | 109 | 89 | ||||
| Puhoi | 298 | 153 | 145 | ||||
| Tauhoa | 225 | 45 | 110 | ||||
| Wainui | 341 | 193 | 149 | ||||
| Whakapirau | 88 | 57 | 31 | ||||
| Wharehine | 117 | 60 | 57 | ||||
| Outlying | 163 | 9l | 71 | ||||
| Country, Riding, Town, Locality, and Road District. | Total. | M. | F. | ||||
|---|---|---|---|---|---|---|---|
| WAITEMATA COUNTY. | |||||||
| Riding of Ararimu— | |||||||
| Ararimu | 26 | 18 | 8 | ||||
| Helensville, T. | 326 | 194 | 132 | ||||
| Kaukapakapa (part) | 100 | 56 | 44 | ||||
| Kumeu | 95 | 61 | 34 | ||||
| Muriwai | 32 | 22 | 10 | ||||
| Paeroa | 39 | 24 | 15 | ||||
| Rewiti | 19 | 8 | 11 | ||||
| Riverhead, T. | 106 | 68 | 38 | ||||
| Waikaukau | 20 | 14 | 6 | ||||
| Waimauku | 8 | 6 | 2 | ||||
| West Coast, South Head | 43 | 31 | 12 | ||||
| Total Riding | 814 | 502 | 312 | ||||
| Riding of Kaukapakapa— | |||||||
| Kaukapakapa (part) | 211 | 138 | 73 | ||||
| Total Riding | 211 | 138 | 73 | ||||
| Riding of Weiti | |||||||
| Dairy Flat | 106 | 66 | 40 | ||||
| Kelly's Bush | 45 | 31 | 14 | ||||
| Lucas Creek (part) | 33 | 20 | 13 | ||||
| Okura River | 4 | 2 | 2 | ||||
| Wade, T., and vicinity | 126 | 70 | 56 | ||||
| Wade River | 6 | 4 | 2 | ||||
| Walsh's Bush | 11 | 9 | 2 | ||||
| Whangaparoa | 53 | 29 | 24 | ||||
| Total Riding | 384 | 231 | 153 | ||||
| Riding of Takapuna | |||||||
| Brown's Bay | 16 | 8 | 8 | ||||
| Duck Creek | 13 | 7 | 6 | ||||
| Hillyer's Creek | 23 | 16 | 7 | ||||
| Kauri Point | 16 | 9 | 7 | ||||
| Lake Takapuna | 202 | 98 | 104 | ||||
| Long Bay | 14 | 8 | 6 | ||||
| Lucas Creek (part) | 53 | 31 | 22 | ||||
| Manukau | 6 | 4 | 2 | ||||
| McKay's Bay | 3 | 2 | 1 | ||||
| North Shore (Devonport, T.) | 1,319 | 625 | 694 | ||||
| Rock Isle Bay | 5 | 2 | 3 | ||||
| Stokes Point | 251 | 131 | 120 | ||||
| Wood's Island | 3 | 2 | 1 | ||||
| Total Riding | 1,924 | 943 | 981 | ||||
| Riding of Waitakerei | |||||||
| Henderson's Mill | 40 | 25 | 15 | ||||
| Hobsonville, T. | 181 | 107 | 74 | ||||
| Waitakerei East | 109 | 86 | 23 | ||||
| Waitakerei West | 296 | 225 | 71 | ||||
| Total Riding | 626 | 443 | 183 | ||||
| Riding of Manukau— | |||||||
| Big Huia | 28 | 14 | 14 | ||||
| Cornwallis | 22 | 14 | 8 | ||||
| Hall's Road | 6 | 3 | 3 | ||||
| Lethart Bay | 17 | 8 | 9 | ||||
| Little Huia | 27 | 15 | 12 | ||||
| Pararaha | 28 | 16 | 12 | ||||
| Pararaha Creek | 8 | 5 | 3 | ||||
| Waikomiti Road | 9 | 4 | 5 | ||||
| Waitakerei Creek | 12 | 8 | 4 | ||||
| Waitakerei Hill | 4 | 3 | 1 | ||||
| Whatipu | 62 | 35 | 27 | ||||
| Whatipu Bush | 23 | 19 | 4 | ||||
| Others | 3 | 2 | 1 | ||||
| Total Riding | 249 | 146 | 103 | ||||
| Riding of Titirangi— | |||||||
| Titirangi | 139 | 93 | 46 | ||||
| Waikomiti | 175 | 112 | 63 | ||||
| Total Riding | 314 | 205 | 109 | ||||
| WAITEMATA COUNTY—continued. | |||||||
| Highway Districts— | Total | M | F | ||||
| Devonport | 1,316 | 623 | 693 | ||||
| Lake | 267 | 136 | 131 | ||||
| North Shore | 334 | 179 | 155 | ||||
| Kaukapakapa | 211 | 138 | 73 | ||||
| Manukau | 194 | 114 | 80 | ||||
| Pukeatua | 321 | 195 | 126 | ||||
| Titirangi | 140 | 95 | 45 | ||||
| Waikomiti | 174 | 110 | 64 | ||||
| Waitakerei East | 149 | 111 | 38 | ||||
| Waitakerei South | 61 | 36 | 23 | ||||
| Waitakerei West | 296 | 225 | 71 | ||||
| Whangaparoa | 63 | 36 | 27 | ||||
| Waipareira | 181 | 107 | 74 | ||||
| Outlying | 815 | 503 | 312 | ||||
| EDEN COUNTY. | |||||||
| Riding of Newton— | |||||||
| Archhill, H.D. | 1,011 | 514 | 497 | ||||
| Newton (Richmond), H.D. | 204 | 104 | 100 | ||||
| Ponsonby, H.D. | 4,011 | 1,925 | 2,086 | ||||
| Total Riding | 5,226 | 2,543 | 2,683 | ||||
| Riding of Grafton | |||||||
| Eden Terrace, H.D. | 543 | 262 | 281 | ||||
| Grafton, H.D. | 1,439 | 652 | 787 | ||||
| Karangahape, H.D. | 3,551 | 1,767 | 1,784 | ||||
| Total Riding | 5,533 | 2,681 | 2,852 | ||||
| Riding of Epsom— | |||||||
| Brown Street | 43 | 21 | 22 | ||||
| Darby Street | 11 | 7 | 4 | ||||
| Epsom | 43 | 22 | 21 | ||||
| Epsom Road | 321 | 152 | 169 | ||||
| Gaol Road | 196 | 149 | 47 | ||||
| Harp Road | 19 | 8 | 11 | ||||
| Kyber Pass (part) | 10 | 7 | 3 | ||||
| Mary Street | 42 | 18 | 24 | ||||
| Mountain Road | 94 | 45 | 49 | ||||
| Mount Eden | 12 | 5 | 7 | ||||
| Mount Eden Road (part) | 524 | 266 | 258 | ||||
| Mount Roskill Road (part) | 176 | 87 | 89 | ||||
| Mount Smart Road | 63 | 27 | 36 | ||||
| Mount St. John | 135 | 64 | 71 | ||||
| One-Tree Hill | 71 | 37 | 34 | ||||
| Owen's Road | 93 | 43 | 50 | ||||
| South Road | 73 | 39 | 34 | ||||
| Stonyhurst | 67 | 34 | 33 | ||||
| Valley Road | 94 | 47 | 47 | ||||
| View Road | 14 | 7 | 7 | ||||
| View Street | 28 | 13 | 15 | ||||
| Well Road | 20 | 8 | 12 | ||||
| Total Riding | 2,149 | 1,106 | 1,043 | ||||
| Riding of Parnell— | |||||||
| Arney Road | 44 | 19 | 25 | ||||
| Beach Road (part) | 42 | 19 | 23 | ||||
| Brighton Road | 54 | 21 | 33 | ||||
| Carlton Road (part) | 111 | 52 | 59 | ||||
| Carlton Gore Road | 38 | 18 | 20 | ||||
| Claremont Street | 70 | 32 | 38 | ||||
| Great South Road | 36 | 19 | 17 | ||||
| Green Lane | 35 | 19 | 16 | ||||
| Green Lane vicinity | 23 | 13 | 10 | ||||
| Hill Street | 77 | 40 | 37 | ||||
| Hobson Bay | 24 | 10 | 14 | ||||
| Hobson Road | 64 | 32 | 32 | ||||
| Hobson Bay Road | 13 | 9 | 4 | ||||
| Hospital Road | 35 | 18 | 17 | ||||
| Kyber Pass (part) | 41 | 27 | 14 | ||||
| Kyber Pass Road (part) | 112 | 65 | 47 | ||||
| Manukau Road (part) | 309 | 155 | 154 | ||||
| Market Road | 14 | 5 | 9 | ||||
| Newmarket Street | 67 | 35 | 32 | ||||
| Old Manukau Road | 46 | 24 | 22 | ||||
| Orakei Road | 263 | 128 | 135 | ||||
| Osborne Street | 13 | 8 | 5 | ||||
| Park Road (part) | 59 | 25 | 34 | ||||
| Portland Road | 11 | 5 | 6 | ||||
| EDEN COUNTY—continued. | |||||||
| Riding of Parnell—continued. | |||||||
| Remuera Road | 357 | 169 | 188 | ||||
| Sea View Road | 38 | 17 | 21 | ||||
| Short Street | 21 | 10 | 11 | ||||
| Victoria Avenue (part) | 96 | 43 | 53 | ||||
| Total Riding | 2,113 | 1,037 | 1,076 | ||||
| Riding of Tamaki. | |||||||
| Ellerslie | 39 | 22 | 17 | ||||
| Kohimarama (Training School) | 66 | 61 | 5 | ||||
| Mount Wellington | 232 | 121 | 111 | ||||
| Panmure, T. | 421 | 201 | 220 | ||||
| St. John's College Road | 15 | 6 | 9 | ||||
| Tamaki West | 211 | 105 | 106 | ||||
| Total Riding | 984 | 516 | 468 | ||||
| Riding of Whau. | |||||||
| Asylum Road | 12 | 6 | 6 | ||||
| Cabbage-Tree Road | 13 | 8 | 5 | ||||
| Epsom Road | 69 | 31 | 38 | ||||
| Great North Road (part) | 326 | 259 | 67 | ||||
| Manukau Road (part) | 66 | 35 | 31 | ||||
| Meadow Bank | 28 | 16 | 12 | ||||
| Meadow View | 14 | 9 | 5 | ||||
| Mount Albert | 642 | 326 | 316 | ||||
| Mount Roskill | 103 | 50 | 53 | ||||
| Mount Roskill Road (part) | 28 | 15 | 13 | ||||
| New North Road (part) | 16 | 10 | 6 | ||||
| Onehunga Road | 16 | 8 | 8 | ||||
| Pa Farm | 23 | 8 | 15 | ||||
| Point Chevalier Road | 43 | 26 | 17 | ||||
| Pollen's Road | 33 | 16 | 17 | ||||
| Riversdale (Whau) | 26 | 12 | 14 | ||||
| Three Kings | 47 | 27 | 20 | ||||
| Waterview | 34 | 20 | 14 | ||||
| Western Springs Road | 20 | 7 | 13 | ||||
| Whau | 6 | 2 | 4 | ||||
| Whau Flat | 4 | 1 | 3 | ||||
| Whau Creek | 19 | 10 | 9 | ||||
| Total Riding | 1,588 | 902 | 686 | ||||
| Highway District— | Total | M | F | ||||
| Archill | 1,011 | 514 | 497 | ||||
| Eden Terrace | 543 | 263 | 281 | ||||
| Epsom | 534 | 258 | 276 | ||||
| Grafton | 1,439 | 652 | 787 | ||||
| Karangahape | 3,551 | 1,767 | 1,784 | ||||
| Mount Albert | 649 | 331 | 318 | ||||
| Mount Eden | 1,135 | 617 | 518 | ||||
| Mount Roskill | 305 | 149 | 156 | ||||
| Mount Wellington | 359 | 185 | 174 | ||||
| Newmarket | 1,056 | 539 | 517 | ||||
| Newton-Richmond | 204 | 104 | 100 | ||||
| One-Tree Hill | 480 | 331 | 249 | ||||
| Panmure | 333 | 159 | 074 | ||||
| Point Chevalier | 307 | 246 | 61 | ||||
| Ponsonby | 4,011 | 1,925 | 2,086 | ||||
| Remuera | 1,057 | 498 | 559 | ||||
| West Tamaki | 293 | 173 | 120 | ||||
| Whau | 337 | 176 | 151 | ||||
| MANUKAU COUNTY. | |||||||
| Riding of Otahuhu. | |||||||
| Mangare | 568 | 298 | 270 | ||||
| Manurewa (Papakura vicinity) | 39 | 20 | 19 | ||||
| Manurewa (Weymouth) | 12 | 7 | 5 | ||||
| Otahuhu, T. | 834 | 422 | 412 | ||||
| Papatoitoi (part) | 138 | 67 | 71 | ||||
| Woodside | 80 | 45 | 35 | ||||
| Total Riding | 1,671 | 859 | 812 | ||||
| Riding of Howick— | |||||||
| Howick, T. | 237 | 106 | 131 | ||||
| Maraetai | 86 | 44 | 42 | ||||
| Paparoa | 97 | 48 | 49 | ||||
| Pakuranga | 364 | 191 | 173 | ||||
| Tamaki East | 591 | 310 | 281 | ||||
| Turanga | 222 | 121 | 101 | ||||
| Total Riding | 597 | 820 | 777 | ||||
| MANUKAU COUNTY—continued. | |||||||
| Riding of Papakura— | |||||||
| Drury, T. | 121 | 64 | 57 | ||||
| Hunua | 213 | 123 | 90 | ||||
| Kirikiri | 1l6 | 62 | 54 | ||||
| Ness Valley | 88 | 42 | 46 | ||||
| Papakura, T. | 98 | 55 | 43 | ||||
| Papakura | 51 | 30 | 21 | ||||
| Papakura Valley | 197 | 103 | 94 | ||||
| Papatoitoi (part) | 61 | 33 | 28 | ||||
| Wairoa | 582 | 300 | 282 | ||||
| Total Riding | 1,527 | 812 | 715 | ||||
| Riding of Maungatawhiri— | |||||||
| Ararimu | 172 | 89 | 83 | ||||
| Bombay | 103 | 163 | 140 | ||||
| Maketu | 203 | 104 | 99 | ||||
| Maungatawhiri | 2l6 | 109 | 107 | ||||
| Mercer, T. | 1l8 | 58 | 60 | ||||
| Miranda (part) | 69 | 46 | 23 | ||||
| Paparata | 99 | 53 | 46 | ||||
| Paparata Valley | 17 | 11 | 6 | ||||
| Pokeno | 400 | 216 | 184 | ||||
| Wairoa Lower | 46 | 25 | 21 | ||||
| Total Riding | 1,643 | 874 | 769 | ||||
| Riding of Pukekohe— | |||||||
| Karaka | 95 | 53 | 42 | ||||
| Mauku | 579 | 313 | 266 | ||||
| Pukekohe West | 899 | 455 | 444 | ||||
| Pukekohe East | 763 | 404 | 359 | ||||
| Total Riding | 2,336 | 1,225 | 1,111 | ||||
| Riding of Waiuku— | |||||||
| Awaruaiti | 10 | 4 | 6 | ||||
| Karioatahi | 68 | 36 | 32 | ||||
| Kohekohe | 121 | 69 | 52 | ||||
| Maioro | 99 | 50 | 49 | ||||
| Otana | 15 | 8 | 7 | ||||
| Parapara | 10 | 7 | 3 | ||||
| Taurangaruru | 16 | 11 | 5 | ||||
| Waipipi | 220 | 116 | 104 | ||||
| Waitangi | 50 | 25 | 25 | ||||
| Waiuku | 154 | 82 | 72 | ||||
| Waiuku East | 199 | 107 | 92 | ||||
| Waiuku West | 17 | 7 | 10 | ||||
| Whiriwhiri | 75 | 36 | 39 | ||||
| Others | 7 | 3 | 4 | ||||
| Total Riding | 1,061 | 561 | 500 | ||||
| Riding of Awhitu— | |||||||
| Pollock Settlement, H.D. | 439 | 265 | 174 | ||||
| Total Riding | 439 | 265 | 174 | ||||
| Highway Districts— | Total | M | F | ||||
| Awhitu | 326 | 205 | 121 | ||||
| Howick. Township | 237 | 106 | 131 | ||||
| Hunua and Papakura Township | 558 | 321 | 246 | ||||
| Karaka | 95 | 53 | 42 | ||||
| Mangere | 500 | 297 | 263 | ||||
| Manurewa | 124 | 68 | 56 | ||||
| Maraetai | 86 | 44 | 42 | ||||
| Mauku | 577 | 316 | 261 | ||||
| Maungatawhiri | 216 | 109 | 107 | ||||
| Mercer | 118 | 58 | 60 | ||||
| Opaheke | 438 | 229 | 309 | ||||
| Otahuhu | 834 | 422 | 412 | ||||
| Pakuranga | 364 | 191 | 173 | ||||
| Papakura | 299 | 158 | 141 | ||||
| Paparata | 402 | 216 | 186 | ||||
| Paparoa | 97 | 48 | 49 | ||||
| Papatoitoi | 154 | 73 | 81 | ||||
| Pokeno | 469 | 262 | 207 | ||||
| Pollock Settlement | 113 | 59 | 54 | ||||
| Pukekohe | 897 | 453 | 444 | ||||
| Pukekohe East | 765 | 404 | 361 | ||||
| Tamaki East | 591 | 310 | 281 | ||||
| Country, Riding, Town, Locality, and Road District. | Total. | M. | F. | |||
|---|---|---|---|---|---|---|
| MANUKAU COUNTY—continued. | ||||||
| Highway Districts—contd. | Total. | M. | F. | |||
| Turanga | 222 | 121 | 101 | |||
| Waipipi | 736 | 387 | 349 | |||
| Wairoa | 670 | 342 | 328 | |||
| Waiuku | 326 | 173 | 153 | |||
| COROMANDEL COUNTY. | ||||||
| Riding of Harataunga. | ||||||
| Awakanae | 8 | 7 | 1 | |||
| Cabbage Bay | 49 | 32 | 17 | |||
| Coromandel Harbour and Beach | 16 | 9 | 7 | |||
| Darkies Creek | 10 | 6 | 4 | |||
| Driving Creek | 276 | 149 | 127 | |||
| Jamieson's Creek | 10 | 6 | 4 | |||
| Kapanga, T. | 671 | 370 | 301 | |||
| Koputanaki | 8 | 5 | 3 | |||
| Kennedy's Bay | 21 | 9 | 12 | |||
| Kerita | 25 | 15 | 10 | |||
| Kikowhakarere | 27 | 16 | 11 | |||
| Manaia | 5 | 4 | 1 | |||
| Matawai Gully | 12 | 12 | … | |||
| Paul's Creek | 7 | 7 | … | |||
| Port Charles | 80 | 55 | 25 | |||
| Te Kouma | 12 | 10 | 2 | |||
| Tiki | 152 | 89 | 63 | |||
| Tiki Range | 42 | 40 | 2 | |||
| Tokatea | 17 | 11 | 6 | |||
| Tokatea Range. | 93 | 56 | 37 | |||
| Waikawau | 12 | 5 | 7 | |||
| Waimate Island | 3 | 1 | 2 | |||
| Whangapoua | 154 | 115 | 39 | |||
| Whanganui Island | 8 | 5 | 3 | |||
| Total Riding | 1,718 | 1,034 | 684 | |||
| Riding of Mercury Bay— | ||||||
| Gum Town | 76 | 71 | 5 | |||
| Hotwater Beach | 5 | 3 | 2 | |||
| Kaimarama | 3 | 3 | … | |||
| Kapawai Creek | 1 | 1 | … | |||
| Mercury Island | 1 | 1 | … | |||
| Mill Upper | 37 | 25 | 12 | |||
| Mill Lower | 102 | 61 | 41 | |||
| Onoka | 44 | 39 | 5 | |||
| Opito Bay | 6 | 4 | 2 | |||
| Purangi | 18 | 8 | 10 | |||
| Rangahau Creek | 12 | 12 | … | |||
| Stony Creek | 11 | 11 | … | |||
| Wade | 5 | 4 | 1 | |||
| Waitai | 7 | 6 | 1 | |||
| Waiwawa Creek | 22 | 22 | … | |||
| Wharekahu | 4 | 2 | 2 | |||
| Whenuakite | 22 | 14 | 8 | |||
| Whitianga | 59 | 34 | 25 | |||
| Total Riding | 435 | 321 | 114 | |||
| THAMES COUNTY. | ||||||
| Riding of Hastings— | ||||||
| Hastings, T. | 120 | 76 | 44 | |||
| Hastings Road | 53 | 32 | 21 | |||
| Hastings and Waikawau Road | 18 | 10 | 8 | |||
| Meta Creek | 6 | 2 | 4 | |||
| Tairua Mill | 301 | 182 | 119 | |||
| Tairua Bush (part) | 66 | 63 | 3 | |||
| Tairua Landing | 33 | 26 | 7 | |||
| Tararu Creek | 60 | 39 | 21 | |||
| Total Riding | 657 | 430 | 227 | |||
| Riding of Parawai (Extension of Town of Thames outside borough,see also Kauaeranga Riding) | 623 | 297 | 326 | |||
| Total Riding | 623 | 297 | 326 | |||
| THAMES COUNTY—continued. | ||||||
| Riding of Kauaeranga— | ||||||
| (Extension of Town of Thames outside borough,see also Parawai Riding) | 1,830 | 901 | 929 | |||
| Total Riding | 1,830 | 901 | 929 | |||
| Riding of Waiotahi.— | ||||||
| Eureka Flat | 75 | 42 | 33 | |||
| Gabriel's Gully | 5 | 4 | 1 | |||
| Irish Town | 89 | 48 | 41 | |||
| Karaka Creek | 34 | 17 | 17 | |||
| Karaka Tram-road | 52 | 29 | 23 | |||
| Lovers' Walk | 7 | 5 | 2 | |||
| Moanataiari Creek | 15 | 9 | 6 | |||
| Moanataiari Road | 30 | 18 | 12 | |||
| Punga Flat | 45 | 26 | 19 | |||
| Shellback Creek | 35 | 17 | 18 | |||
| Waiokaraka Creek | 12 | 8 | 4 | |||
| Waiotahi Creek | 33 | 18 | 15 | |||
| Waiotahi Dray-road | 12 | 6 | 6 | |||
| Waiotahi Road | 176 | 84 | 92 | |||
| Waiotahi Spur | 92 | 55 | 37 | |||
| Total Riding | 712 | 386 | 326 | |||
| Riding of Totara. | ||||||
| Hikutaia (part) | 73 | 48 | 25 | |||
| Kauaeranga Valley | 187 | 142 | 45 | |||
| Kirikiri | 43 | 24 | 19 | |||
| Miranda (part) | 25 | 15 | 10 | |||
| Puriri | 121 | 73 | 48 | |||
| Totara | 2 | 2 | … | |||
| Totara Point | 54 | 30 | 24 | |||
| Total Riding | 505 | 334 | 171 | |||
| Riding of Ohinemuri. | ||||||
| Hikutaia (part) | 19 | 13 | 6 | |||
| Hikutaia and Waihi vicinity | 7 | 6 | 1 | |||
| Mackay Town | 40 | 20 | 20 | |||
| Owharoa | 53 | 39 | 14 | |||
| Paeroa (part) | 244 | 136 | 108 | |||
| Rotokohu | 12 | 8 | 4 | |||
| Tairua Bush (part) | 99 | 99 | … | |||
| Te Aroha (part) | 11 | 6 | 5 | |||
| Te Puke (part) | 23 | 16 | 7 | |||
| Te Rapa | 45 | 31 | 14 | |||
| Trevesville | 23 | 19 | 4 | |||
| Turua | 94 | 57 | 37 | |||
| Waihou West | 23 | 17 | 6 | |||
| Waitawheta | 13 | 10 | 3 | |||
| Waitekauri | 91 | 60 | 31 | |||
| Waitete | 32 | 29 | 3 | |||
| Whangamata | 23 | 21 | 2 | |||
| Total Riding | 852 | 587 | 265 | |||
| Highway District— | Total. | M. | F. | |||
| Parawai | 575 | 275 | 300 | |||
| Outlying | 4,604 | 2,660 | 1,944 | |||
| PIAKO COUNTY. | ||||||
| Riding of Waitoa— | ||||||
| All Nations Mine | 2 | 2 | … | |||
| Fraterville | 5 | 5 | … | |||
| Katikati Road | 18 | 11 | 7 | |||
| Maungakawa | 33 | 24 | 9 | |||
| Morgan, T. | 160 | 112 | 48 | |||
| Piako | 169 | 112 | 57 | |||
| Prince of Wales Mine | 6 | 6 | … | |||
| Te Aroha (part) | 127 | 85 | 42 | |||
| Thames Valley | 21 | 16 | 5 | |||
| Tohuroa | 40 | 27 | 13 | |||
| Waitoa | 128 | 83 | 45 | |||
| Waitoa Landing | 4 | 3 | 1 | |||
| Total Riding | 713 | 486 | 227 | |||
| Country, Riding, Town, Locality, and Road District. | Total. | M. | F. | ||||
|---|---|---|---|---|---|---|---|
| PIAKO COUNTY—continued. | |||||||
| Riding of Matamata— | |||||||
| Firth's Estate | 62 | 57 | 5 | ||||
| Total Riding | 62 | 57 | 5 | ||||
| Riding of Taotaoroa— | |||||||
| Hinuwera Bush | 3 | 2 | 1 | ||||
| Morris Farm | 12 | 6 | 6 | ||||
| Taotaoroa | 28 | 11 | 17 | ||||
| Trevenneth | 11 | 9 | 2 | ||||
| Whitehall | 9 | 7 | 2 | ||||
| Total Riding | 63 | 35 | 28 | ||||
| Riding of Patetere— | |||||||
| Martin's Farm | 17 | 16 | 1 | ||||
| McLean's Farm | 41 | 37 | 4 | ||||
| Oxford | 7 | 7 | … | ||||
| Paeroa (part) | 22 | 22 | … | ||||
| Paparamu | 16 | 16 | … | ||||
| Patetere | 6 | 3 | 3 | ||||
| Tapapa | 7 | 7 | … | ||||
| Waihou | 27 | 27 | … | ||||
| Total Riding | 143 | 135 | 8 | ||||
| Highway Districts— | Total | M | F | ||||
| Matamata | 62 | 57 | 5 | ||||
| Taotaoroa | 63 | 35 | 28 | ||||
| Waitoa | 458 | 307 | 151 | ||||
| Outlying | 398 | 314 | 84 | ||||
| TAURANGA COUNTY. | |||||||
| Riding of Katihiti— | |||||||
| Aongatete River | 16 | 9 | 7 | ||||
| Bowen, T. | 27 | 15 | 12 | ||||
| Hikurangi Gorge | 10 | 6 | 4 | ||||
| Matahuia | 3 | 3 | … | ||||
| Metara River | 74 | 36 | 38 | ||||
| Rereatu Kahia | 8 | 5 | 3 | ||||
| Tahawai and River | 89 | 37 | 52 | ||||
| Taupiro River | 64 | 38 | 26 | ||||
| Te Mania | 28 | 16 | 12 | ||||
| Waitekohe River | 65 | 29 | 36 | ||||
| Waterford, T. | 58 | 37 | 21 | ||||
| Waterford vicinity | 61 | 33 | 28 | ||||
| Total Riding | 503 | 264 | 239 | ||||
| Riding of Waimapu— | |||||||
| Aongatete | 23 | 14 | 9 | ||||
| A.C. Station (Te Puke Road) | 15 | 15 | … | ||||
| Greerton | 54 | 28 | 26 | ||||
| Judea | 17 | 7 | 10 | ||||
| Matapihi | 2 | 1 | 1 | ||||
| Mount Maunganui Pilot-station | 9 | 6 | 3 | ||||
| Omanawa Road | 29 | 19 | 10 | ||||
| Oropi | 24 | 15 | 9 | ||||
| Otumoetai | 75 | 34 | 41 | ||||
| Taupo Road | 18 | 13 | 5 | ||||
| Tauranga T. | 1,253 | 653 | 600 | ||||
| Tauranga Harbour, east side | 37 | 22 | 15 | ||||
| Tauranga Suburbs | 78 | 40 | 38 | ||||
| Te Puna | 63 | 32 | 31 | ||||
| Te Ranga | 25 | 14 | 11 | ||||
| Te Wairoa (part) | 19 | 12 | 7 | ||||
| Wakamarama | 11 | 8 | 3 | ||||
| Total Riding | 1,752 | 933 | 819 | ||||
| Riding of Maketu— | |||||||
| Maketu | 52 | 27 | 25 | ||||
| Rotoiti Lake | 2 | 2 | … | ||||
| Rotorua Lake | 8 | 4 | 4 | ||||
| Te Puke (part) | 91 | 82 | 9 | ||||
| Total Riding | 153 | 115 | 38 | ||||
| TAURANGA COUNTY —continued. | |||||||
| Riding of Rotorua— | |||||||
| Cambridge Road | 4 | 4 | … | ||||
| Horohoro | 1 | 1 | … | ||||
| Ngongotaha | 1 | 1 | … | ||||
| Ohinemutu | 126 | 90 | 36 | ||||
| Te Awahou and vicinity | 17 | 11 | 6 | ||||
| Teketapu | 3 | 3 | … | ||||
| Te Ngae | 14 | 12 | 2 | ||||
| Te Wairoa (part), Tarawera Lake | 21 | 9 | 12 | ||||
| Tuhunatara | 1 | 1 | … | ||||
| Whakarewarewa | 3 | 3 | … | ||||
| Total Riding | 191 | 135 | 56 | ||||
| Highway Districts— | Total. | M. | F. | ||||
| Katikati | 503 | 264 | 239 | ||||
| Tauranga | 339 | 182 | 157 | ||||
| Tauranga North | 1,254 | 651 | 603 | ||||
| Te Puna | 97 | 54 | 43 | ||||
| Outlying | 406 | 296 | 110 | ||||
| WHAKATANE COUNTY. | |||||||
| Riding of Omataroa— | |||||||
| Gaiatea | 11 | 9 | 2 | ||||
| Ohiwa | 2 | 2 | … | ||||
| Richmond | 20 | 11 | 9 | ||||
| Te Teko | 3 | 1 | 2 | ||||
| Waitahi | 3 | 3 | … | ||||
| Whakatane, T. | 43 | 24 | 19 | ||||
| Whakatane Valley | 58 | 36 | 22 | ||||
| Total Riding | 140 | 86 | 54 | ||||
| Riding of Waioeka— | |||||||
| Opotiki, T. | 440 | 234 | 206 | ||||
| Otara | 129 | 79 | 50 | ||||
| Table-land and Road | 29 | 17 | 12 | ||||
| Waiau River Bank | 9 | 6 | 3 | ||||
| Waioeka River | 31 | 24 | 7 | ||||
| Waioeka Road | 76 | 43 | 33 | ||||
| Waiotahi River | 5 | 5 | … | ||||
| Total Riding | 719 | 408 | 311 | ||||
| Riding of Waikana— | |||||||
| Omaio | 13 | 10 | 3 | ||||
| Omarumutu | 9 | 4 | 5 | ||||
| Orete | 4 | 3 | 1 | ||||
| Raukokore | 1 | 1 | … | ||||
| Tekaha | 18 | 8 | 10 | ||||
| Torere | 7 | 5 | 2 | ||||
| Whangaparoa (Cape Runaway) | 2 | 2 | … | ||||
| Total Riding | 54 | 33 | 21 | ||||
| Highway Districts— | Total. | M. | F. | ||||
| Opotiki | 719 | 408 | 311 | ||||
| Whakatane | 140 | 86 | 54 | ||||
| Outlying | 54 | 33 | 21 | ||||
| COOK COUNTY. | |||||||
| Riding of Waiapu— | |||||||
| Akuaku | 14 | 7 | 7 | ||||
| Awatere | 1 | 1 | … | ||||
| Awanui | 15 | 10 | 5 | ||||
| Kawakawa | 5 | 3 | 2 | ||||
| Makarika | 7 | 7 | … | ||||
| Mangatu | 6 | 4 | 2 | ||||
| Matahia | 1 | 1 | … | ||||
| Omaewa | 1 | 1 | … | ||||
| Purehua | 3 | 3 | … | ||||
| Puretua | 1 | 1 | … | ||||
| Te Moro | 3 | 2 | 1 | ||||
| Te Rapa | 1 | 1 | … | ||||
| Tokomaru (part) | 7 | 5 | 2 | ||||
| Taumata | 1 | 1 | … | ||||
| Tuparoa | 1 | 1 | … | ||||
| Waiomatatini | 4 | 3 | 1 | ||||
| Waiapu | 7 | 2 | 5 | ||||
| Waiotaote | 8 | 6 | 2 | ||||
| Total Riding | 86 | 59 | 27 | ||||
| Country, Riding, Town, Locality, and Road District. | Total. | M. | F. | |||
|---|---|---|---|---|---|---|
| COOK COUNTY—continued. | ||||||
| Riding of Tolago Bay— | ||||||
| Anaura | 7 | 4 | 3 | |||
| Ferry | 5 | 3 | 2 | |||
| Mangaheia | 15 | 5 | 10 | |||
| Nini | 6 | 3 | 3 | |||
| Tokomaru (part) | 11 | 8 | 3 | |||
| Tolago Bay, T. | 36 | 25 | 11 | |||
| Tolago vicinity | 32 | 16 | 16 | |||
| Wharekaka | 9 | 5 | 4 | |||
| Total Riding | 121 | 69 | 52 | |||
| Riding of Waimata— | ||||||
| Kaiti | 18 | 8 | 10 | |||
| Mangatikapua | 12 | 5 | 7 | |||
| Motu | 25 | 19 | 6 | |||
| Ngakaroa | 18 | 11 | 7 | |||
| Potutu | 8 | 4 | 4 | |||
| Pouawa | 6 | 6 | … | |||
| Puatai | 7 | 5 | 2 | |||
| Rangatira | 7 | 3 | 4 | |||
| Ruatikotiko | 14 | 12 | 2 | |||
| Taruhaeru | 12 | 10 | 2 | |||
| Waihora | 2 | 2 | … | |||
| Waingaromia | 18 | 16 | 2 | |||
| Waitotara | 3 | 3 | … | |||
| Whangara | 10 | 6 | 4 | |||
| Whatatutu | 14 | 13 | 1 | |||
| Whataupoko | 26 | 17 | 9 | |||
| Total Riding | 200 | 140 | 60 | |||
| Riding of Gisborne— | ||||||
| Makaraka | 38 | 20 | 18 | |||
| Makauri | 97 | 58 | 39 | |||
| Matawhero | 37 | 21 | 16 | |||
| Mendlesham | 122 | 69 | 53 | |||
| Ormond, T. | 292 | 166 | 126 | |||
| Pouparae | 2 | 1 | 1 | |||
| Roseland | 132 | 76 | 56 | |||
| TeAwapuni | 2 | 2 | … | |||
| Te Kati | 1 | 1 | … | |||
| Toanga | 13 | 7 | 6 | |||
| Tutoko | 9 | 7 | 2 | |||
| Waikanae | 17 | 9 | 8 | |||
| Wairengahika | 95 | 51 | 44 | |||
| Whakawhitira | 6 | 2 | 4 | |||
| Wharaungi | 5 | 1 | 4 | |||
| Total Riding | 868 | 491 | 377 | |||
| Riding of Te Arai— | ||||||
| Muriwai | 8 | 6 | 2 | |||
| Okahuatiu | 4 | 3 | 1 | |||
| Pakirikiri | 34 | 21 | 13 | |||
| Patutahi, T. | 82 | 46 | 36 | |||
| Patutahi Flat | 10 | 5 | 5 | |||
| Patutahi Valley | 39 | 20 | 19 | |||
| Pukepapa | 29 | 18 | 11 | |||
| Repongarae | 25 | 17 | 8 | |||
| Runangarehu | 17 | 12 | 5 | |||
| Tangihanga | 12 | 3 | 9 | |||
| Tapatahi | 9 | 6 | 3 | |||
| Te Arai Flat | 86 | 45 | 41 | |||
| Te Aroha | 4 | 4 | ||||
| Te Karaka | 16 | 10 | 6 | |||
| Waikohu | 28 | 18 | 10 | |||
| Wairangakuri | 12 | 8 | 4 | |||
| Waraetaha | 50 | 34 | 16 | |||
| Total Riding | 465 | 276 | 189 | |||
| Highway Districts— | Total | M. | F. | |||
| Ormond | 292 | 166 | 126 | |||
| Patutahi | 147 | 83 | 64 | |||
| Poverty Bay | 187 | 112 | 75 | |||
| Te Aria | 203 | 124 | 79 | |||
| Turanganui | 577 | 325 | 252 | |||
| Waikohu | 131 | 81 | 50 | |||
| Outlying | 203 | 144 | 59 | |||
| WAIROA COUNTY. | ||||||
| Riding of Waikaremoana— | ||||||
| Mahia | 55 | 39 | 16 | |||
| Marumaru | 25 | 44 | 11 | |||
| North Clyde, T. | 42 | 22 | 20 | |||
| Nuhaka | 7 | 7 | … | |||
| Opoiti | 6 | 3 | 3 | |||
| Portland Island | 8 | 5 | 3 | |||
| Te Kapu, T. (Fraser, T.) | 131 | 75 | 56 | |||
| Wairoa | 17 | 10 | 7 | |||
| Wairoa (Mahia Road) | 3 | 3 | … | |||
| Whakaki | 2 | 2 | … | |||
| Others | 4 | 3 | 1 | |||
| Total Riding | 300 | 183 | 117 | |||
| Riding of Clyde— | ||||||
| Awamote | 10 | 9 | 1 | |||
| Clyde, T. | 380 | 193 | 187 | |||
| Nuramua | 7 | 3 | 4 | |||
| Onepoto | 5 | 5 | … | |||
| Turiroa | 60 | 40 | 20 | |||
| Waiau | 10 | 7 | 3 | |||
| Waihi | 3 | 3 | … | |||
| Waihua (part) | 7 | 6 | 1 | |||
| Wairua River | 2 | 2 | … | |||
| Total Riding | 484 | 268 | 216 | |||
| Riding of Mohaka— | ||||||
| Arapawanui | 10 | 7 | 3 | |||
| Kakariki | 2 | 2 | … | |||
| Kaiwaka | 4 | 4 | … | |||
| Maungaharuru | 4 | 4 | … | |||
| Moeangiangi | 15 | 10 | 5 | |||
| Mohaka | 67 | 36 | 31 | |||
| Petane vicinity | 2 | 2 | … | |||
| River Glen | 5 | 4 | 1 | |||
| Spring Hill | 11 | 2 | 9 | |||
| Tarawera | 28 | 15 | 13 | |||
| Titiokura | 10 | 10 | … | |||
| Tongoio | 27 | 19 | 8 | |||
| Tutira | 3 | 3 | … | |||
| Upper Mohaka Bridge | 5 | 3 | 2 | |||
| Waihua (part) | 4 | 4 | … | |||
| Waikere | 16 | 14 | 2 | |||
| Waipatiki | 6 | 6 | … | |||
| Wangirira | 6 | 1 | 5 | |||
| Total Riding | 225 | 146 | 79 | |||
| Highway Districts— | Total. | M. | F. | |||
| Mohaka (old district now merged in county) | 72 | 36 | 36 | |||
| Nuhaka (old district now merged in county) | 77 | 56 | 31 | |||
| Wairoa County (old district now merged in county) | 364 | 223 | 142 | |||
| Wairoa Town (old district now merged in county) | 380 | 292 | 188 | |||
| Outlying | 116 | 91 | 25 | |||
| EAST TAUPO COUNTY. (No Ridings.) | ||||||
| Opepe | 21 | 16 | 5 | |||
| Rangipo | 9 | 7 | 2 | |||
| Taupo | 96 | 70 | 26 | |||
| Total County | 126 | 93 | 33 | |||
| WEST TAUPO COUNTY. (No Ridings.) | ||||||
| Ngamako | 5 | 5 | … | |||
| Rakepuku | 1 | 1 | … | |||
| Waotu | 5 | 2 | 3 | |||
| Total County | 11 | 8 | 3 | |||
| Country, Riding, Town, Locality, and Road District. | Total. | M. | F. | |||
|---|---|---|---|---|---|---|
| WAIPA COUNTY. | ||||||
| Riding of Newcastle— | ||||||
| Corcoy's Gully | 10 | 7 | 3 | |||
| Cross Road | 18 | 10 | 8 | |||
| Hamilton Road (part) | 21 | 9 | 121 | |||
| Karakariki | 20 | 13 | 7 | |||
| Ngaruawahia, T. | 213 | 102 | 111 | |||
| Ngaruawahia suburbs | 15 | 9 | 6 | |||
| Ngaruawahia Road (part) | 27 | 19 | 8 | |||
| Pukete | 21 | 9 | 12 | |||
| Stone's Farm | 6 | 6 | … | |||
| Tuhikaramea (part) | 33 | 21 | 12 | |||
| Waipa River | 9 | 5 | 4 | |||
| Whatawhata (part) | 117 | 68 | 49 | |||
| Total Riding | 510 | 278 | 232 | |||
| Riding of Hamilton— | ||||||
| Frankton | 82 | 45 | 37 | |||
| Frankton West | 16 | 10 | 6 | |||
| Frankton Road | 10 | 6 | 4 | |||
| Narrow's Bridge Road | 6 | 4 | 2 | |||
| Ngaruawahia Road (part) | 29 | 13 | 16 | |||
| Ohaupo (part) | 26 | 16 | 10 | |||
| Ohaupo Road | 16 | 8 | 8 | |||
| Pukihia | 3 | 2 | 1 | |||
| Railway-line | 8 | 3 | 5 | |||
| Runnymead | 11 | 7 | 4 | |||
| Springbank | 4 | 2 | 2 | |||
| Waikato River | 28 | 14 | 14 | |||
| Whatawhata Road | 35 | 18 | 17 | |||
| Total Riding | 274 | 148 | 126 | |||
| Riding of Mangapikn— | ||||||
| Alexandra East, T. | 176 | 90 | 86 | |||
| Mangapiko | 282 | 159 | 123 | |||
| Ngaroto (part) | 202 | 101 | 101 | |||
| Tuhikaramea (part) | 81 | 54 | 27 | |||
| Total Riding | 741 | 404 | 337 | |||
| Riding of Rangiawhia— | ||||||
| Kihikihi and vicinity | 261 | 145 | 116 | |||
| Ngaroto (part) | 36 | 19 | 17 | |||
| Ohaupo and vicinity (part) | 218 | 112 | 106 | |||
| Orakau | 36 | 18 | 18 | |||
| Rangiawhia | 149 | 89 | 60 | |||
| Te Awamutu and vicinity | 262 | 140 | 122 | |||
| Te Raho | 112 | 61 | 51 | |||
| Total Riding | 1,074 | 584 | 490 | |||
| Riding of Pukekura— | ||||||
| Cambridge West, T. | 173 | 90 | 83 | |||
| Pukerimu | 179 | 87 | 92 | |||
| Pukekura | 116 | 79 | 37 | |||
| Te Rapa | 30 | 15 | 15 | |||
| Total Riding | 498 | 271 | 227 | |||
| Highway Districts— | Total. | M. | F. | |||
| Alexandra Township, part of (see Raglan) | 176 | 91 | 85 | |||
| Cambridge Town, part of (see Waikato) | 173 | 90 | 83 | |||
| Hamilton | 274 | 148 | 126 | |||
| Kihikihi, Town of | 262 | 145 | 117 | |||
| Mangapiko | 484 | 260 | 224 | |||
| Newcastle, part of (see Raglan) | 398 | 176 | 122 | |||
| Ngaruawahia, Town of | 214 | 103 | 111 | |||
| Pukekura | 325 | 181 | 144 | |||
| Rangiaohia | 810 | 437 | 373 | |||
| Tuhikaramea | 81 | 54 | 27 | |||
| WAIKATO COUNTY. | ||||||
| Riding of Cambridge— | ||||||
| Cambridge East, T. | 1,001 | 557 | 444 | |||
| Cambridge vicinity | 3 | 2 | 1 | |||
| Fen Court | 41 | 26 | 13 | |||
| Hamilton Road (part) | 93 | 44 | 49 | |||
| Hautapu | 177 | 102 | 75 | |||
| Karapero Road | 9 | 6 | 3 | |||
| Maungakawa | 30 | 18 | 12 | |||
| Tamahere Road | 45 | 24 | 21 | |||
| Taylor Farm | 2 | 2 | … | |||
| Thornton Road | 11 | 5 | 6 | |||
| Toatoaroa | 21 | 12 | 9 | |||
| Total Riding | 1,433 | 798 | 635 | |||
| Riding of Tamahere— | ||||||
| Tamahere | 119 | 68 | 51 | |||
| Victoria | 17 | 13 | 4 | |||
| Waill's Estate | 20 | 12 | 8 | |||
| Total Riding | 156 | 93 | 63 | |||
| Riding of Kirikiriroa— | ||||||
| Kirikiriroa | 295 | 161 | 134 | |||
| Komokarau | 313 | 181 | 132 | |||
| Mangawhara | 20 | 20 | … | |||
| Ngaruawahia | 73 | 38 | 35 | |||
| Taupiri (part) | 14 | 11 | 3 | |||
| Total Riding | 715 | 411 | 304 | |||
| Riding of Rangiriri— | ||||||
| Huntly, T. | 240 | 132 | 108 | |||
| Miranda (part) | 5 | 3 | 2 | |||
| Rangiriri, T. | 114 | 51 | 63 | |||
| Taupiri (part) | 48 | 33 | 15 | |||
| Wairangi | 81 | 50 | 31 | |||
| Whangamarino | 65 | 36 | 29 | |||
| Total Riding | 553 | 305 | 248 | |||
| Highway Districts— | Totals. | M. | F. | |||
| Cambridge | 411 | 229 | 182 | |||
| Cambridge Town, part of (see Waipa) | 1,003 | 561 | 442 | |||
| Kirikiriroa | 715 | 410 | 305 | |||
| Tamahere | 156 | 93 | 63 | |||
| Taotaoroa | 21 | 12 | 9 | |||
| Outlying | 551 | 302 | 249 | |||
| RAGLAN COUNTY. | ||||||
| Riding of Onewhero— | ||||||
| Pakau | 1 | 1 | … | |||
| Takaikai | 1 | 1 | … | |||
| Te Okaoka | 43 | 26 | 17 | |||
| Te Popopopo | 1 | 1 | … | |||
| Wharehau | 2 | 2 | … | |||
| Total Riding | 48 | 31 | 17 | |||
| Riding of Te Akau. | ||||||
| Horea | 4 | 4 | … | |||
| Mangati | 4 | 4 | … | |||
| Ohuka | 3 | 3 | … | |||
| Port Waikato | 14 | 11 | 3 | |||
| Tawatahi | 6 | 2 | 4 | |||
| Total Riding | 31 | 24 | 7 | |||
| Riding of Karioi. | ||||||
| Aotea Road | 16 | 11 | 5 | |||
| Kauroa | 10 | 7 | 3 | |||
| Pokorangi | 1 | 1 | … | |||
| Raglan, T. | 70 | 41 | 29 | |||
| Rangatahi | 1 | 1 | … | |||
| Ruapuke Road | 67 | 33 | 34 | |||
| Te Hatewai | 8 | 5 | 3 | |||
| Te Mata | 32 | 20 | 12 | |||
| Wainui | 17 | 10 | 7 | |||
| Waitetuna | 152 | 83 | 69 | |||
| Waitomotomo | 22 | 12 | 10 | |||
| Total Riding | 369 | 224 | 172 | |||
| Riding of Pirongia. | ||||||
| Alexandra West, T. | 28 | 12 | 16 | |||
| Harapipi | 47 | 29 | 18 | |||
| Country, Riding, Town, Locality, and Road District. | Total. | M. | F. | ||||
|---|---|---|---|---|---|---|---|
| RAGLAN COUNTY—continued. | |||||||
| Riding of Pirongia—continued. | |||||||
| Kaniwhaniwha | 39 | 22 | 17 | ||||
| Pirongia | 20 | 11 | 9 | ||||
| Whatawhata (part) | 12 | 8 | 4 | ||||
| Total Riding | 146 | 82 | 64 | ||||
| Riding of Whangape— | |||||||
| Churchill, T. | 46 | 37 | 9 | ||||
| Karikariki | 4 | 2 | 2 | ||||
| Kupakupa | 14 | 11 | 3 | ||||
| Newcastle | 39 | 18 | 21 | ||||
| Riverdale | 8 | 7 | 1 | ||||
| Taupiri (part) | 17 | 9 | 8 | ||||
| Waihi | 1 | 1 | … | ||||
| Whaingaroa | 26 | 14 | 12 | ||||
| Total Riding | 155 | 99 | 56 | ||||
| Highway Districts— | Total. | M. | F. | ||||
| Alexandra (part in Waipa) | 28 | 12 | 16 | ||||
| Karamu | 12 | 8 | 4 | ||||
| Karioi | 164 | 93 | 71 | ||||
| Newcastle (part in Waipa) | 39 | 17 | 22 | ||||
| Pirongia | 106 | 62 | 44 | ||||
| Raglan, Town of | 70 | 41 | 29 | ||||
| Whaingaroa | 188 | 104 | 84 | ||||
| Outlying | 169 | 123 | 40 | ||||
| KAWHIA COUNTY. (No Ridings.) | |||||||
| Kaipeha | 41 | 18 | 23 | ||||
| Kawhia | 5 | 5 | … | ||||
| Marawhini | 10 | 9 | 1 | ||||
| Otorohanga | 15 | 5 | 10 | ||||
| Te Kopua | 37 | 22 | 49 | ||||
| Total County | 108 | 59 | 49 | ||||
| TARANAKI COUNTY. | |||||||
| Riding of Omata— | |||||||
| Albert Road | 62 | 36 | 26 | ||||
| Avenue Road | 41 | 27 | 14 | ||||
| Barrett Road | 127 | 75 | 52 | ||||
| Cape Egmont | 61 | 61 | … | ||||
| Carrington Road | 122 | 63 | 59 | ||||
| Devon Street | 58 | 26 | 32 | ||||
| Devon Line | 9 | 4 | 5 | ||||
| Dover Road | 14 | 6 | 8 | ||||
| Elliott Road | 97 | 47 | 50 | ||||
| Fitzroy, T. | 140 | 73 | 67 | ||||
| Frankly Road | 101 | 50 | 51 | ||||
| Hampton Road | 7 | 3 | 4 | ||||
| Harbour Works | 13 | 13 | … | ||||
| Hospital Road | 88 | 41 | 47 | ||||
| Hurford Road | 22 | 14 | 8 | ||||
| Hurford Upper | 25 | 10 | 15 | ||||
| Junction Road | 121 | 66 | 55 | ||||
| Kaihihi Road | 9 | 6 | 3 | ||||
| Kent Road | 91 | 43 | 48 | ||||
| Korita Road | 21 | 15 | 6 | ||||
| Koru Road | 60 | 31 | 29 | ||||
| Leith Road | 12 | 9 | 3 | ||||
| Mangorei Road | 137 | 74 | 63 | ||||
| Oakura, T. | 23 | 10 | 13 | ||||
| Okato, T. | 55 | 29 | 26 | ||||
| Old Coast Road | 44 | 28 | 16 | ||||
| Opunake, T. | 111 | 61 | 50 | ||||
| Opunake Station | 53 | 53 | … | ||||
| Opunake South Road | 9 | 9 | … | ||||
| Oxford Road | 48 | 33 | 15 | ||||
| Perth Road | 19 | 11 | 8 | ||||
| Pitone Road | 57 | 32 | 25 | ||||
| Plymouth Road | 30 | 17 | 13 | ||||
| Pungarehu Camp | 132 | 132 | … | ||||
| Rahotu Camp | 154 | 150 | 4 | ||||
| Rahotu South Road | 39 | 39 | … | ||||
| Sealey Road | 28 | 12 | 16 | ||||
| South Road | 422 | 241 | 181 | ||||
| Surrey Road | 10 | 6 | 4 | ||||
| Te Henui | 70 | 39 | 31 | ||||
| Timaru Road | 27 | 16 | 11 | ||||
| Veale Road | 37 | 23 | 14 | ||||
| West Town, T. | 39 | 21 | 18 | ||||
| Others | 10 | 10 | … | ||||
| Total Riding | 2,855 | 1,765 | 1,090 | ||||
| Riding of Moa— | |||||||
| Beaconsfield Road | 12 | 10 | 2 | ||||
| Bedford Road | 9 | 4 | 5 | ||||
| Bristol Road | 54 | 29 | 25 | ||||
| Croydon Road | 18 | 13 | 5 | ||||
| Denbigh Road | 18 | 8 | 10 | ||||
| Devon Road | 45 | 21 | 24 | ||||
| Dorset Road | 31 | 19 | 12 | ||||
| Dudley Road | 21 | 12 | 9 | ||||
| Durham Road | 68 | 41 | 27 | ||||
| Egmont Road | 132 | 67 | 65 | ||||
| Henwood Road | 65 | 36 | 29 | ||||
| Hua | 62 | 28 | 34 | ||||
| Inglewood, T. | 395 | 210 | 185 | ||||
| Junction Road | 60 | 32 | 28 | ||||
| Kaipi Road | 6 | 4 | 2 | ||||
| King Road | 11 | 6 | 5 | ||||
| Lepper Road | 17 | 7 | 10 | ||||
| Lincoln Road | 35 | 16 | 19 | ||||
| Midhurst, T. | 52 | 31 | 21 | ||||
| Monmouth Road | 12 | 6 | 6 | ||||
| Mountain Road | 203 | 119 | 84 | ||||
| Norfolk Road | 123 | 66 | 57 | ||||
| Pariti Road | 74 | 43 | 31 | ||||
| Pembroke Road | 20 | 14 | 6 | ||||
| Radnor Road | 34 | 18 | 16 | ||||
| Richmond Road | 35 | 17 | 18 | ||||
| Ross Road | 13 | 8 | 5 | ||||
| Rugby Road | 32 | 19 | 13 | ||||
| Rutland Road | 25 | 14 | 11 | ||||
| Smart Road | 83 | 45 | 38 | ||||
| Stratford, T. (part) | 97 | 56 | 41 | ||||
| Surrey Road | 43 | 22 | 21 | ||||
| Taraki Road | 7 | 5 | 2 | ||||
| Upland Road | 59 | 35 | 24 | ||||
| Waipuku | 22 | 12 | 10 | ||||
| Willis Road | 55 | 28 | 27 | ||||
| Windsor Road | 12 | 6 | 6 | ||||
| Wortley Road | 75 | 41 | 34 | ||||
| York Road | 84 | 48 | 36 | ||||
| Total Riding | 2,219 | 1,216 | 1,003 | ||||
| Riding of Waitara— | |||||||
| Corbett Road | 49 | 27 | 22 | ||||
| Cross Road | 31 | 19 | 12 | ||||
| Devon Road | 79 | 39 | 40 | ||||
| Huirangi | 93 | 50 | 43 | ||||
| Kainga Mei | 9 | 4 | 5 | ||||
| Karaka | 13 | 7 | 6 | ||||
| Keipikari Road | 23 | 14 | 9 | ||||
| Kelly Road | 44 | 19 | 25 | ||||
| Lepper Road | 54 | 32 | 22 | ||||
| Manganui | 12 | 7 | 5 | ||||
| Mangaraka | 15 | 7 | 8 | ||||
| Manutahi, T. | 103 | 50 | 53 | ||||
| Mataitawa | 21 | 8 | 13 | ||||
| Mimi River | 5 | 3 | 2 | ||||
| Mokou River | 11 | 7 | 4 | ||||
| Mountain Road | 46 | 29 | 17 | ||||
| Ngatimaru Road | 66 | 36 | 30 | ||||
| Pukearuhe | 95 | 60 | 35 | ||||
| Raleigh, T. | 361 | 191 | 170 | ||||
| Richmond Road | 39 | 18 | 21 | ||||
| Sentry Hill | 68 | 37 | 31 | ||||
| Tariki Road | 21 | 12 | 9 | ||||
| Te Arei Road | 13 | 9 | 4 | ||||
| Tikorangi, T. | 267 | 147 | 120 | ||||
| Urenui, T. | 99 | 57 | 42 | ||||
| Wortley Road | 63 | 38 | 25 | ||||
| Country, Riding, Town, Locality, and Road District. | Total. | M. | F. | |||
|---|---|---|---|---|---|---|
| TARANAKI COUNTY—continued. | ||||||
| Riding of Wailara—continued. | ||||||
| York Road | 10 | 8 | 2 | |||
| Others | 36 | 14 | 22 | |||
| Total Riding | 1,746 | 949 | 797 | |||
| Highway Districts— | Total. | M. | F. | |||
| Barrett | 293 | 169 | 124 | |||
| Carrington | 115 | 59 | 56 | |||
| Clifton | 233 | 141 | 92 | |||
| Egmont | 559 | 295 | 264 | |||
| Elliott | 136 | 68 | 68 | |||
| Frankley | 138 | 73 | 65 | |||
| Henui | 307 | 157 | 150 | |||
| Hurford Upper | 25 | 10 | 15 | |||
| Inglewood | 395 | 210 | 185 | |||
| Manganui | 208 | 159 | 109 | |||
| Mangorei | 178 | 101 | 77 | |||
| Moa | 1,030 | 572 | 458 | |||
| Oakura | 258 | 136 | 122 | |||
| Okato | 182 | 111 | 71 | |||
| Omata | 199 | 107 | 92 | |||
| Raleigh | 301 | 191 | 170 | |||
| Tataraimaka | 137 | 83 | 54 | |||
| Waitara East | 308 | 199 | 169 | |||
| Waitara West | 763 | 406 | 357 | |||
| Waiwakaiho | 262 | 140 | 122 | |||
| Outlying | 613 | 543 | 70 | |||
| PATEA COUNTY. | ||||||
| Riding of Hawera— | ||||||
| A. C. Station (Waimate Plains) | 76 | 67 | 9 | |||
| Finnerty Road | 11 | 8 | 3 | |||
| Great South Road | 154 | 93 | 61 | |||
| Hawera, T. | 943 | 539 | 404 | |||
| Hawera vicinity | 49 | 35 | 14 | |||
| Kateonetea | 39 | 23 | 16 | |||
| Ketemarae | 117 | 70 | 47 | |||
| Manaia, T. | 55 | 42 | 13 | |||
| Manaia Road (Waimate Plains) | 60 | 50 | 10 | |||
| Manawapou Road | 35 | 15 | 20 | |||
| Mountain Road | 234 | 156 | 78 | |||
| Normanby, T. | 399 | 243 | 156 | |||
| Normanby vicinity | 27 | 19 | 8 | |||
| Normanby Road (Waimate Plains) | 40 | 38 | 2 | |||
| Oeo | 22 | 15 | 7 | |||
| Railway-line | 58 | 52 | 6 | |||
| Stratford, T. (part) | 26 | 11 | 15 | |||
| Taiporohenui | 65 | 45 | 20 | |||
| Waihi | 59 | 35 | 24 | |||
| Waimate Plains | 103 | 89 | 14 | |||
| Whakamara | 84 | 43 | 41 | |||
| Others | 44 | 30 | 14 | |||
| Total Riding | 2,700 | 1,718 | 982 | |||
| Riding of Otoia— | ||||||
| Ball Road | 89 | 58 | 31 | |||
| Carlyle, T. | 834 | 481 | 353 | |||
| Hursthouse Road | 32 | 21 | 11 | |||
| Kakaramea, T | 116 | 08 | 48 | |||
| Manutahi, T. | 89 | 54 | 35 | |||
| Patea Extension | 75 | 53 | 23 | |||
| Taranaki Road | 397 | 216 | 181 | |||
| Whenuakura (part) | 227 | 141 | 86 | |||
| Woodviilc Road | 58 | 34 | 24 | |||
| Total Riding | 1,917 | 1,125 | 792 | |||
| Riding of Waverley— | ||||||
| Kohi Gorge | 72 | 39 | 33 | |||
| Momahaki | 43 | 27 | 16 | |||
| Old Coast Road | 72 | 43 | 29 | |||
| Putahi | 44 | 24 | 23 | |||
| Waitotara, T. | 115 | 60 | 55 | |||
| Waitotara vicinity | 46 | 24 | 22 | |||
| Waverley, T. | 380 | 205 | 175 | |||
| Waverley vicinity | 316 | 177 | 139 | |||
| Whenuakura and vicinity (part) | 84 | 48 | 36 | |||
| Total Riding | 1,172 | 647 | 525 | |||
| PATEA COUNTY—continued. | ||||||
| Highway Districts— | Total. | M. | F. | |||
| Carlyle, T. | 855 | 481 | 334 | |||
| Hawera | 1,219 | 765 | 454 | |||
| Hawera, T. | 942 | 539 | 403 | |||
| Patea East | 346 | 217 | 129 | |||
| Patea West | 781 | 451 | 330 | |||
| Wairoa | 748 | 418 | 330 | |||
| Waverley, T. | 380 | 205 | 175 | |||
| Outlying | 538 | 414 | 124 | |||
| WANGANUI COUNTY. | ||||||
| Riding of Waitotara— | ||||||
| Kai Iwi (part) | 89 | 54 | 35 | |||
| Maxwell, T. | 58 | 37 | 21 | |||
| Maxwell | 85 | 40 | 45 | |||
| Nukumaru | 68 | 41 | 27 | |||
| Okehu | 53 | 22 | 31 | |||
| Waitotara East | 60 | 37 | 23 | |||
| Total Riding | 413 | 231 | 182 | |||
| Riding of Westmere— | ||||||
| Kai Iwi (part) | 71 | 40 | 31 | |||
| Mosstown | 98 | 54 | 44 | |||
| Pilot-station | 19 | 13 | 6 | |||
| River Bank | 21 | 10 | 11 | |||
| Seafield | 53 | 31 | 22 | |||
| Spring Vale | 127 | 61 | 66 | |||
| St. John's Hill | 52 | 27 | 25 | |||
| Westmere | 37 | 28 | 9 | |||
| Total Riding | 478 | 264 | 214 | |||
| Riding of Brunswick— | ||||||
| Aramoho, T. | 150 | 77 | 73 | |||
| Aramoho vicinity | 128 | 64 | 64 | |||
| Brunswick Road | 129 | 73 | 56 | |||
| Bryce's Road | 43 | 25 | 18 | |||
| Goat Valley | 29 | 14 | 15 | |||
| Goat Valley Tunnel | 13 | 8 | 5 | |||
| Great Northern Road | 7 | 4 | 3 | |||
| Kai Iwi (part) | 16 | 9 | 7 | |||
| Kaikokopu Road | 58 | 40 | 18 | |||
| Missionary Line | 4 | 4 | … | |||
| Porirui Road | 14 | 6 | 8 | |||
| Russell Vale | 39 | 17 | 22 | |||
| Upokongaro | 49 | 35 | 14 | |||
| Western Line | 36 | 21 | 15 | |||
| Total Riding | 715 | 397 | 318 | |||
| Riding of Warrengate— | ||||||
| Campbelltown | 79 | 43 | 36 | |||
| Churchill | 10 | 5 | 5 | |||
| Concord Line | 21 | 9 | 12 | |||
| Durie Town | 71 | 41 | 30 | |||
| Grassmere | 13 | 5 | 8 | |||
| Kaitoki | 16 | 8 | 8 | |||
| Lamb Hill | 18 | 7 | 11 | |||
| Marengo | 18 | 14 | 4 | |||
| No. 1 Line | 73 | 38 | 35 | |||
| No. 2 Line (part) | 56 | 32 | 24 | |||
| One-Tree Hill | 11 | 5 | 06 | |||
| Putiki | 144 | 77 | 67 | |||
| Union Line (part) | 29 | 13 | 16 | |||
| Warrengate Line | 25 | 19 | 6 | |||
| Wiritoa | 6 | 3 | 3 | |||
| Others | 45 | 29 | 16 | |||
| Total Riding | 635 | 348 | 287 | |||
| Riding of Waipakura— | ||||||
| Eastown | 130 | 62 | 68 | |||
| Kennedy's, T. | 29 | 16 | 13 | |||
| Kukuta Road | 19 | 10 | 9 | |||
| Long-Acre Valley (part) | 9 | 5 | 4 | |||
| Makirikiri Valley | 14 | 9 | 5 | |||
| Maramaratotara | 26 | 17 | 9 | |||
| No. 2 Line (part) | 88 | 38 | 50 | |||
| No. 3 Line (part) | 107 | 60 | 47 | |||
| Okoia | 23 | 10 | 13 | |||
| Country, Riding, Town, Locality, and Road District. | Total. | M. | F. | ||||
|---|---|---|---|---|---|---|---|
| WANGANUI COUNTY—continued. | |||||||
| Riding of Waipakura—continued. | |||||||
| Pikopiko No. 1 | 28 | 18 | 10 | ||||
| River Bank Road | 41 | 19 | 22 | ||||
| Upokongaro Valley | 19 | 9 | 10 | ||||
| Others | 12 | 8 | 4 | ||||
| Total Riding | 545 | 281 | 264 | ||||
| Riding of Makirikiri— | |||||||
| Denlair Road | 66 | 35 | 31 | ||||
| Long-Acre Valley (part) | 22 | 16 | 6 | ||||
| Makirikiri Road (part) | 24 | 18 | 6 | ||||
| Matarawa Road | 65 | 39 | 26 | ||||
| No. 2 Line (part) | 181 | 98 | 83 | ||||
| No. 3 Line (part) | 60 | 36 | 24 | ||||
| Union Line (part) | 11 | 7 | 4 | ||||
| Waikupa Road | 42 | 28 | 14 | ||||
| Total Riding | 471 | 277 | 194 | ||||
| Riding of Mangawhero— | |||||||
| Hales Track | 13 | 8 | 5 | ||||
| Makirikiri Road (part) | 92 | 53 | 39 | ||||
| Ruinini Station | 12 | 8 | 4 | ||||
| Upokongaro Road | 40 | 30 | 10 | ||||
| Waipuna | 14 | 14 | … | ||||
| Waponga | 14 | 12 | 2 | ||||
| Others | 14 | 12 | 2 | ||||
| Total Riding | 199 | 137 | 62 | ||||
| Highway District— | Total. | M. | F. | ||||
| Wangaehu | 1,850 | 1,043 | 807 | ||||
| Wanganui-Waitotara | 1,606 | 893 | 714 | ||||
| RANGITIKEI COUNTY. | |||||||
| Riding of Rangitoto— | |||||||
| Ferry | 17 | 11 | 6 | ||||
| Holdgate's Hill | 8 | 6 | 2 | ||||
| Parawanui | 30 | 17 | 13 | ||||
| Pointyfield | 17 | 9 | 8 | ||||
| Raumai | 60 | 56 | 24 | ||||
| Round Bush | 30 | 15 | 15 | ||||
| Sandridge | 14 | 5 | 9 | ||||
| The Hoe | 9 | 4 | 5 | ||||
| Waitatapia | 26 | 11 | 15 | ||||
| Total Riding | 211 | 114 | 97 | ||||
| Riding of Otakapu— | |||||||
| Ashley | 14 | 7 | 7 | ||||
| Delvey | 14 | 9 | 5 | ||||
| Dry Creek Farm | 6 | 6 | … | ||||
| Ettrickdale | 3 | 3 | … | ||||
| Flowerburn | 6 | 5 | 1 | ||||
| Franklin Vale | 9 | 3 | 6 | ||||
| Green Bank | 4 | 3 | 1 | ||||
| Heaton Park | 13 | 5 | 8 | ||||
| Lake Farm | 6 | 5 | 1 | ||||
| Makirikiri | 22 | 15 | 7 | ||||
| Otakapu Station | 36 | 26 | 10 | ||||
| Native Reserve | 5 | 5 | … | ||||
| Spring Grove | 5 | 4 | 1 | ||||
| Tullochgorum | 6 | 4 | 2 | ||||
| Turakina | 4 | 4 | … | ||||
| Westover | 4 | 2 | 2 | ||||
| Others | 6 | 3 | 3 | ||||
| Total Riding | 163 | 109 | 54 | ||||
| Riding of Clifton— | |||||||
| Brandon Hall | 8 | 5 | 3 | ||||
| Bull's, T., Local Board | 642 | 324 | 318 | ||||
| Bull's Road | 24 | 12 | 12 | ||||
| Bull's, Greatford Road | 43 | 25 | 18 | ||||
| Cliff Line (part) | 10 | 7 | 3 | ||||
| Cliff Road | 8 | 3 | 5 | ||||
| Greatford | 10 | 4 | 6 | ||||
| Highland Home | 5 | 2 | 3 | ||||
| Kilkern | 22 | 15 | 7 | ||||
| Lily Bank | 5 | 3 | 2 | ||||
| Marten Road | 15 | 5 | 10 | ||||
| McHardie's Line | 36 | 18 | 18 | ||||
| North Street | 7 | 4 | 3 | ||||
| Parewanui Road | 31 | 20 | 11 | ||||
| Turakina Road | 26 | 10 | 16 | ||||
| Total Riding | 892 | 457 | 435 | ||||
| Riding of Porewa— | |||||||
| Bonny Glen | 35 | 18 | 17 | ||||
| Crawford's Road | 21 | 12 | 9 | ||||
| Crofton, T. | 119 | 63 | 56 | ||||
| Fern Flat Road | 11 | 7 | 4 | ||||
| Greatford, T. | 148 | 70 | 78 | ||||
| Hare's Road | 9 | 4 | 5 | ||||
| Makirikiri | 12 | 7 | 5 | ||||
| Makirikiri Road | 11 | 6 | 5 | ||||
| Pukepapa Road | 80 | 54 | 26 | ||||
| Railway-line | 10 | 2 | 8 | ||||
| Tutaenui River | 32 | 16 | 16 | ||||
| Tutaenui Road | 6 | 2 | 4 | ||||
| Wanganui Road | 37 | 23 | 14 | ||||
| Wellington Road | 20 | 10 | 10 | ||||
| Total Riding | 551 | 294 | 257 | ||||
| Riding of Wangaehu— | |||||||
| Bonny Glen and Road | 23 | 15 | 8 | ||||
| Lethbridge Local Board | 314 | 164 | 150 | ||||
| Turakina Bridge | 6 | 4 | 2 | ||||
| Turakina Valley (part) | 39 | 23 | 16 | ||||
| Waipu | 25 | 14 | 11 | ||||
| Wangaehu | 14 | 9 | 5 | ||||
| Wangaehu vicinity | 14 | 11 | 3 | ||||
| Total Riding | 447 | 249 | 198 | ||||
| Riding of Paraekaretu— | |||||||
| Cliff Line (part) | 99 | 50 | 49 | ||||
| Fern Flats (part) | 55 | 31 | 24 | ||||
| Hammond's | 65 | 39 | 26 | ||||
| Jefferson's Line | 24 | 11 | 13 | ||||
| Leedstown | 26 | 14 | 12 | ||||
| Marshall's | 101 | 57 | 44 | ||||
| Mount View Road | 45 | 28 | 17 | ||||
| Paraekaretu | 8 | 3 | 5 | ||||
| Paraekaretu Road | 62 | 37 | 23 | ||||
| Rangitikei River | 38 | 23 | 15 | ||||
| Upper Paraekaretu | 119 | 76 | 43 | ||||
| Upper Tutaenui | 136 | 96 | 60 | ||||
| Others | 16 | 9 | 7 | ||||
| Total Riding | 814 | 474 | 340 | ||||
| Riding of Makahau— | |||||||
| Fern Flats (part) | 58 | 31 | 27 | ||||
| Turakina Valley (part) | 137 | 75 | 62 | ||||
| Wangaehu Valley | 38 | 25 | 13 | ||||
| Total Riding | 233 | 131 | 102 | ||||
| Highway Districts— | Total. | M. | F. | ||||
| Bull's Local Board | 642 | 324 | 318 | ||||
| Lethbridge Local Board | 314 | 164 | 150 | ||||
| Rangitikei | 2,355 | 1,340 | 1,015 | ||||
| MANAWATU COUNTY. | |||||||
| Riding of Kiwitea— | |||||||
| Kimbolton Road (part) | 92 | 58 | 34 | ||||
| Kiwitea | 21 | 14 | 7 | ||||
| Kiwitea Road | 59 | 32 | 27 | ||||
| McBeth's Line | 11 | 10 | 1 | ||||
| Oroua Road | 2 | 2 | |||||
| Perry's Line | 16 | 9 | 7 | ||||
| Total Riding | 201 | 125 | 76 | ||||
| Country, Riding, Town, Locality, and Road District. | Total. | M. | F. | |||
|---|---|---|---|---|---|---|
| MANAWATU COUNTY—continued. | ||||||
| Riding of Manchester— | ||||||
| Ashurst, T. | 191 | 113 | 78 | |||
| Ashurst vicinity | 25 | 13 | 12 | |||
| Bunnythorpe | 16 | 8 | 8 | |||
| Bunnythorpe Road | 59 | 30 | 29 | |||
| Feilding, T. | 919 | 477 | 442 | |||
| Feilding vicinity | 285 | 138 | 147 | |||
| Feilding Road | 4 | 4 | … | |||
| Halcombe, T. | 183 | 94 | 89 | |||
| Halcombe vicinity | 109 | 58 | 51 | |||
| Halcombe Local Board District | 282 | 145 | 137 | |||
| Junction Road | 17 | 13 | 4 | |||
| Kakariki | 83 | 47 | 36 | |||
| Kimbolton Road (part) | 49 | 31 | 18 | |||
| Makino Road | 313 | 181 | 132 | |||
| Mangaone Road | 7 | 4 | 3 | |||
| Mangaone Stream | 16 | 10 | 6 | |||
| Napier Road | 85 | 48 | 37 | |||
| Railway-line | 14 | 7 | 7 | |||
| Stanway Road | 94 | 56 | 38 | |||
| Taonui (part) | 98 | 55 | 43 | |||
| Tokorangi Bridge | 19 | 14 | 5 | |||
| Total Riding | 2,868 | 2,546 | 1,322 | |||
| Riding of Orcua— | ||||||
| Awahuri | 77 | 50 | 27 | |||
| Awahuri and Feilding Road | 75 | 37 | 38 | |||
| Bailey's Line | 19 | 10 | 9 | |||
| Bull's Mill | 12 | 8 | 4 | |||
| Fagan's Line | 36 | 21 | 15 | |||
| Foxton Line | 41 | 23 | 18 | |||
| Palmerston and Sandon Road, Awahuri | 63 | 32 | 31 | |||
| Sandon, T. | 343 | 193 | 150 | |||
| Te Pakehu (Sandon) | 18 | 9 | 9 | |||
| Wilson's Line | 24 | 10 | 14 | |||
| Others | 5 | 4 | 1 | |||
| Total Riding | 713 | 397 | 316 | |||
| Riding of Taonui— | ||||||
| Awapuni | 24 | 12 | 12 | |||
| Bunnythorpe | 71 | 42 | 29 | |||
| Fitzherbert | 87 | 59 | 28 | |||
| Foxton Road | 78 | 38 | 40 | |||
| Jackeytown | 27 | 18 | 9 | |||
| Kairanga | 31 | 31 | … | |||
| Karere | 240 | 120 | 99 | |||
| Napier Road | 229 | 120 | 109 | |||
| Oroua River | 52 | 29 | 23 | |||
| Rangitikei Line | 297 | 169 | 128 | |||
| Taonui (part) | 113 | 64 | 49 | |||
| Total Riding | 1,249 | 723 | 526 | |||
| Riding of Kawakawa— | ||||||
| Awahuri | 62 | 31 | 31 | |||
| Campbelltown | 46 | 32 | 14 | |||
| Carnarvon | 45 | 27 | 18 | |||
| Flaxmoor | 13 | 7 | 6 | |||
| Foxton Road | 78 | 40 | 38 | |||
| Hickford's Line | 163 | 97 | 66 | |||
| Jones's Line | 95 | 52 | 43 | |||
| Matahiwi | 29 | 15 | 14 | |||
| Mount Stewart | 89 | 45 | 44 | |||
| Oroua Bridge | 20 | 12 | 8 | |||
| Oroua Downs | 49 | 32 | 17 | |||
| Palmerston Railway | 14 | 9 | 5 | |||
| Penny's Line | 31 | 21 | 10 | |||
| Ponsbourne | 10 | 6 | 4 | |||
| Rosina Line | 69 | 43 | 26 | |||
| Taikoria | 41 | 22 | 10 | |||
| Taipo | 63 | 33 | 30 | |||
| Total Riding | 917 | 524 | 393 | |||
| Riding of Awahou— | ||||||
| Avenue Road | 9 | 5 | 4 | |||
| Foxton, T. | 728 | 404 | 324 | |||
| Heads, Manawatu River | 15 | 7 | 8 | |||
| Moutoa | 40 | 27 | 13 | |||
| Moutoa Lower | 53 | 29 | 24 | |||
| Moutoa Road and vicinity | 26 | 16 | 10 | |||
| Moutoa Swamp and vicinity | 43 | 28 | 15 | |||
| No. 2 Line (part) | 70 | 43 | 27 | |||
| Sandon Road | 10 | 6 | 4 | |||
| Waiokino vicinity | 12 | 5 | 7 | |||
| Total Riding | 1,007 | 571 | 436 | |||
| Riding of Horowhenua— | ||||||
| Hautere | 5 | 4 | 1 | |||
| Horowhenua | 16 | 8 | 8 | |||
| Ketemaringi | 10 | 6 | 4 | |||
| Kurukohatu | 11 | 5 | 6 | |||
| Makahuri | 10 | 10 | ||||
| Netley | 6 | 2 | 4 | |||
| Opiki | 9 | 6 | 3 | |||
| Otaki, T. | 248 | 141 | 107 | |||
| Piaika | 23 | 16 | 7 | |||
| Purakau | 6 | 4 | 2 | |||
| Rauwawa | 14 | 12 | 2 | |||
| Te Horo | 5 | 4 | 1 | |||
| Waikawa | 5 | 5 | … | |||
| Wairarapa | 9 | 6 | 3 | |||
| Whirokino | 5 | 4 | 1 | |||
| Others | 35 | 28 | 7 | |||
| Total Riding | 417 | 261 | 156 | |||
| Highway Districts— | Total | M. | F. | |||
| Foxton | 279 | 167 | 112 | |||
| Foxton Local Board | 728 | 404 | 314 | |||
| Manawatu | 1,450 | 848 | 602 | |||
| Manchester | 2,868 | 1,546 | 1,322 | |||
| Otaki | 417 | 261 | 156 | |||
| Sandon and Carnarvon | 1,630 | 921 | 709 | |||
| HUTT COUNTY. | ||||||
| Riding of Karori— | ||||||
| Creswick | 33 | 15 | 18 | |||
| Evans Bay | 30 | 15 | 18 | |||
| Island Bay | 19 | 10 | 9 | |||
| Karori | 665 | 335 | 330 | |||
| Kilbirnie | 166 | 85 | 81 | |||
| Lyall's Bay | 2 | 2 | … | |||
| Makara | 212 | 112 | 100 | |||
| Mitchell Town | 157 | 82 | 75 | |||
| Ohau | 11 | 5 | 6 | |||
| Ohiro | 157 | 104 | 53 | |||
| Orangipaupapa | 53 | 22 | 31 | |||
| Oteronga | 6 | 6 | … | |||
| Pilot-station | 12 | 5 | 7 | |||
| Taitville | 60 | 29 | 31 | |||
| Terawhiti | 19 | 12 | 7 | |||
| Upland | 15 | 7 | 8 | |||
| Vogel Town | 45 | 21 | 24 | |||
| Watts Peninsula | 7 | 5 | 2 | |||
| Worser's Bay | 7 | 7 | … | |||
| Others | 14 | 8 | 6 | |||
| Total Riding | 1,690 | 891 | 799 | |||
| Riding of Porirua— | ||||||
| Horokiwi Road | 90 | 37 | 53 | |||
| Hutt Road | 62 | 34 | 28 | |||
| Johnsonville Local Board | 203 | 110 | 93 | |||
| Kaiwara Local Board | 323 | 159 | 164 | |||
| Kaiwara Upper | 40 | 23 | 17 | |||
| Ngahauranga Road | 90 | 45 | 45 | |||
| Ohariu Road | 19 | 15 | 4 | |||
| Ohariu Valley | 289 | 153 | 136 | |||
| Old Ohariu Road | 10 | 7 | 3 | |||
| Old Porirua Road | 61 | 29 | 32 | |||
| Otari | 15 | 8 | 7 | |||
| Porirua Bay and Ferry | 323 | 167 | 156 | |||
| Country, Riding, Town, Locality, and Road District. | Total. | M. | F. | |||
|---|---|---|---|---|---|---|
| HUTT COUNTY—continued. | ||||||
| Riding of Porirua—continued. | ||||||
| Porirua Road | 232 | 135 | 97 | |||
| Takapu | 58 | 32 | 26 | |||
| Tawa Flat | 136 | 77 | 59 | |||
| Wadestown | 143 | 67 | 76 | |||
| Total Riding; | 2,094 | 1,098 | 996 | |||
| Riding of Horokiwi— | ||||||
| Horokiwi Valley | 182 | 99 | 83 | |||
| Pahautanui Small Farms | 185 | 64 | 91 | |||
| Paikakariki to Waikanae | 82 | 60 | 22 | |||
| Total Riding | 449 | 253 | 196 | |||
| Riding of Epuni— | ||||||
| Alice Town | 34 | 20 | 14 | |||
| Belmont | 110 | 60 | 50 | |||
| Gracefield | 21 | 9 | 12 | |||
| Hayward's | 41 | 24 | 17 | |||
| Korokoro | 41 | 24 | 19 | |||
| Lower Hutt | 752 | 309 | 353 | |||
| Naenae | 132 | 83 | 49 | |||
| Petone | 348 | 171 | 177 | |||
| Somes Island | 723 | 399 | 353 | |||
| Taita | 302 | 148 | 154 | |||
| Waiwetu | 227 | 132 | 95 | |||
| Western Hutt | 139 | 65 | 74 | |||
| Total Riding | 2,155 | 1,136 | 1,019 | |||
| Riding of Wainuiomata— | ||||||
| Day's Bay | 5 | 3 | 2 | |||
| Gollan's Valley | 15 | 8 | 7 | |||
| Lowry Bay | 5 | 2 | 3 | |||
| Moore's Valley | 18 | 8 | 10 | |||
| Okiwi Bay | 1 | 1 | … | |||
| Orongorongo | 10 | 10 | … | |||
| Pencarrow Lighthouse | 7 | 5 | 2 | |||
| Wainuiomata | 228 | 127 | 101 | |||
| York Bay | 2 | 1 | 1 | |||
| Total Riding | 291 | 165 | 126 | |||
| Riding of Mungaroa— | ||||||
| Ebden Town | 77 | 38 | 39 | |||
| Hayward's, Western Hutt | 17 | 8 | 9 | |||
| Kaitoke | 53 | 35 | 18 | |||
| Mungaroa and Valley | 190 | 115 | 75 | |||
| Pakuratahi | 37 | 22 | 15 | |||
| Silverstream | 80 | 46 | 34 | |||
| Stokes Valley | 69 | 40 | 29 | |||
| Summit | 10 | 6 | 4 | |||
| Upper Hutt | 554 | 296 | 258 | |||
| Whiteman's Valley | 92 | 51 | 41 | |||
| Total Riding | 1,179 | 657 | 522 | |||
| Highway Districts— | Total. | M. | F. | |||
| Johnsonville Local Board | 203 | 110 | 93 | |||
| Kaiwarawara Local Board | 323 | 159 | 164 | |||
| Karori-Makara | 1,010 | 515 | 495 | |||
| Kilbirnie | 650 | 375 | 305 | |||
| Lower Hutt Local Board | 929 | 506 | 423 | |||
| Wellington | 4,706 | 2,533 | 2,173 | |||
| Outlying | 7 | 2 | 5 | |||
| WAIRARAPA WEST COUNTY. | ||||||
| Riding of Alfredton— | ||||||
| Alfred ton | 30 | 22 | 8 | |||
| Bideford (part) | 22 | 9 | 13 | |||
| Eketahuna | 165 | 63 | 72 | |||
| Mauriceville (part) | 69 | 40 | 23 | |||
| Moroa | 10 | 8 | 2 | |||
| Pahiatua | 19 | 17 | 2 | |||
| Spring Yale | 8 | 8 | … | |||
| Others | 23 | 20 | 3 | |||
| Total Riding | 346 | 223 | 123 | |||
| WAIRARAPA WEST COUNTY— continued. | ||||||
| Riding of Masterton— | ||||||
| Manaia | 66 | 30 | 36 | |||
| Masterton vicinity | 43 | 18 | 25 | |||
| Matahiwi | 35 | 27 | 8 | |||
| Mauriceville (part) | 248 | 127 | 121 | |||
| Mikimiki | 27 | 13 | 14 | |||
| Opaki | 326 | 180 | 146 | |||
| Otahua | 16 | 10 | 6 | |||
| Rangitumau | 120 | 74 | 46 | |||
| Taueru Road | 22 | 9 | 13 | |||
| Te Oreore | 58 | 39 | 19 | |||
| Tewhiti | 38 | 24 | 14 | |||
| Upper Plain | 236 | 118 | 118 | |||
| Wangaehu | 13 | 8 | 5 | |||
| Woodlands | 18 | 7 | 11 | |||
| Total Riding | 1,266 | 684 | 582 | |||
| Riding of Carterton— | ||||||
| Anderson's Line | 40 | 22 | 18 | |||
| Belvedere Road | 227 | 118 | 109 | |||
| Booth's | 11 | 7 | 4 | |||
| Brooklyn Road | 21 | 12 | 9 | |||
| Carterton Local Board, T. | 660 | 348 | 312 | |||
| Carterton vicinity | 35 | 18 | 17 | |||
| Carterton Road | 117 | 59 | 58 | |||
| Cemetery Road | 107 | 56 | 51 | |||
| Clareville | 99 | 50 | 49 | |||
| Dalefield Road | 106 | 52 | 54 | |||
| France's Line | 31 | 16 | 15 | |||
| Hilton Road | 25 | 13 | 12 | |||
| Hurinui Orangi | 14 | 3 | 11 | |||
| Kokotou | 27 | 12 | 15 | |||
| Main Road | 173 | 94 | 79 | |||
| Matarawa | 148 | 75 | 73 | |||
| Morton Road | 44 | 19 | 25 | |||
| Musk Farm | 19 | 14 | 5 | |||
| Park Vale and Road | 61 | 31 | 30 | |||
| Taratahi | 144 | 88 | 56 | |||
| Taratahi West | 117 | 65 | 52 | |||
| Waihakeke | 97 | 54 | 43 | |||
| White's Line | 51 | 28 | 23 | |||
| Others | 15 | 7 | 8 | |||
| Total Riding | 2,389 | 1,261 | 1,128 | |||
| Riding of Greytown— | ||||||
| Hupenui | 18 | 12 | 6 | |||
| Kauhautara | 20 | 13 | 7 | |||
| Kaiwaiwai | 116 | 64 | 52 | |||
| Moroa Plains | 53 | 27 | 26 | |||
| Morrison's Bush | 79 | 37 | 42 | |||
| Morrison's Run | 8 | 3 | 5 | |||
| Pihautea | 19 | 11 | 8 | |||
| Tauherenikau | 81 | 43 | 38 | |||
| Waihenga | 19 | 15 | 4 | |||
| Ward's Line | 40 | 17 | 23 | |||
| Woodside | 27 | 13 | 14 | |||
| Others | 15 | 9 | 6 | |||
| Total Riding | 495 | 264 | 231 | |||
| Riding of Featherston— | ||||||
| Cross's Creek | 65 | 36 | 29 | |||
| Donald Road | 20 | 10 | 10 | |||
| Featherston, T. | 485 | 273 | 212 | |||
| Featherston South | 125 | 73 | 52 | |||
| Hill Road vicinity | 68 | 39 | 29 | |||
| Murphy's Line | 47 | 27 | 20 | |||
| Sea-coast | 17 | 12 | 5 | |||
| Summit | 10 | 6 | 4 | |||
| The Gully | 39 | 22 | 17 | |||
| Western Lake | 60 | 33 | 27 | |||
| Total Riding | 936 | 531 | 405 | |||
| Country, Riding, Town, Locality, and Road District. | Total. | M. | F. | |||
|---|---|---|---|---|---|---|
| WAIRARAPA WEST COUNTY—continued | ||||||
| Riding of Otaraia— | ||||||
| Burnside | 4 | 3 | 1 | |||
| Dry River | 23 | 18 | 5 | |||
| Mangaimoana | 50 | 30 | 20 | |||
| Martinborough | 36 | 20 | 16 | |||
| Otaraia | 21 | 19 | 2 | |||
| Pirinoa | 24 | 14 | 10 | |||
| Tauanui | 18 | 12 | 6 | |||
| Tuhitarata | 15 | 11 | 4 | |||
| Waihenga | 116 | 63 | 53 | |||
| Wantwood | 20 | 14 | 6 | |||
| Total Riding | 327 | 204 | 123 | |||
| Highway Districts— | Total. | M. | F. | |||
| Carterton Local Board | 660 | 345 | 313 | |||
| Featherston Local Board | 483 | 273 | 212 | |||
| Featherston (part in Wairarapa East) | 1,459 | 883 | 577 | |||
| Masterton (part in Wairarapa East) | 2,219 | 1,338 | 881 | |||
| Taratahi-Carterton | 1,729 | 913 | 816 | |||
| WAIRARAPA EAST COUNTY | ||||||
| Riding of Castlepoint— | ||||||
| Akiteo | 55 | 33 | 22 | |||
| Bideford (part) | 8 | 4 | 4 | |||
| Blairlogie | 19 | 19 | … | |||
| Bowlands | 26 | 15 | 11 | |||
| Castlepoint | 26 | 17 | 9 | |||
| Kaumingi (part) | 12 | 7 | 5 | |||
| Langdale | 31 | 27 | 4 | |||
| Lower Whareama | 70 | 43 | 27 | |||
| Mangapakeha | 9 | 5 | 4 | |||
| Mataikuna | 27 | 26 | 1 | |||
| Meldrum | 11 | 5 | 6 | |||
| Ohongo | 36 | 26 | 10 | |||
| Tinui | 140 | 92 | 48 | |||
| Tiraumea | 49 | 30 | 19 | |||
| Upper Whareama | 103 | 72 | 31 | |||
| Whakataki | 40 | 23 | 15 | |||
| Others | 20 | 13 | 7 | |||
| Total Riding | 682 | 459 | 223 | |||
| Riding of Wainuioru— | ||||||
| Ahiaruhi | 22 | 13 | 9 | |||
| Brancepeth | 71 | 53 | 18 | |||
| Burrow's Station | 21 | 21 | … | |||
| Fernyhurst | 10 | 9 | 1 | |||
| Flat Point | 19 | 13 | 6 | |||
| Gladstone | 79 | 46 | 33 | |||
| Glenburn | 19 | 13 | 6 | |||
| Huangarua | 31 | 27 | 4 | |||
| Kaiwhata | 18 | 11 | 7 | |||
| Kaumingi (part) | 17 | 13 | 4 | |||
| Kohiwai | 8 | 5 | 3 | |||
| Kummerstein | 13 | 4 | 9 | |||
| Morrison's | 15 | 11 | 4 | |||
| Mount Adams | 5 | 4 | 1 | |||
| Nokomu | 11 | 8 | 3 | |||
| Pahaoa River | 8 | 8 | 1 | |||
| Riversdale | 28 | 28 | … | |||
| Taueru | 60 | 30 | 30 | |||
| Tupurapura | 37 | 25 | 9 | |||
| Upper Pahaoa | 26 | 17 | 9 | |||
| Waikaraka | 12 | 9 | 3 | |||
| Wainuioru | 21 | 19 | 2 | |||
| Waiorongo | 13 | 8 | 5 | |||
| Wildfell | 9 | 5 | 4 | |||
| Others | 34 | 28 | 6 | |||
| Total Riding | 607 | 431 | 176 | |||
| Riding of Awhea— | ||||||
| Bush Gully | 5 | 4 | 1 | |||
| Hyde Park | 3 | 3 | … | |||
| Kaikuri | 12 | 5 | 7 | |||
| Pahaoa | 28 | 21 | 7 | |||
| Pukeatua | 6 | 6 | … | |||
| Rocky Creek | 11 | 6 | 5 | |||
| Stony Creek | 13 | 13 | … | |||
| Table-land | 21 | 20 | 1 | |||
| Te Auaiti | 43 | 37 | 6 | |||
| Wakapuni | 12 | 9 | 3 | |||
| Whatarangi | 8 | 8 | … | |||
| White Rock | 24 | 24 | … | |||
| Total Riding | 186 | 156 | 30 | |||
| Highway District— | Total. | M. | F. | |||
| Castlepoint (also parts of Featherston and Masterton, see Wairarapa West) | 682 | 459 | 223 | |||
| WAIPAWA COUNTY. | ||||||
| Riding of Eparaima— | ||||||
| Green Hills | 20 | 15 | 5 | |||
| Mototoria Station | 10 | 9 | 1 | |||
| Oakbourne | 18 | 17 | 1 | |||
| Ormond's Station | 22 | 19 | 3 | |||
| Porangahau Station | 30 | 24 | 6 | |||
| Purimu | 12 | 7 | 5 | |||
| The Lakes | 18 | 9 | 9 | |||
| Wallingford Bridge | 62 | 39 | 23 | |||
| Wanstead | 43 | 32 | 11 | |||
| Others | 8 | 8 | … | |||
| Total Riding | 243 | 179 | 64 | |||
| Riding of Porangahau— | ||||||
| Cape Turnagain | 14 | 13 | 1 | |||
| Mangamairo | 7 | 5 | 2 | |||
| Porangahau, T. | 118 | 65 | 53 | |||
| Springfield | 5 | 5 | … | |||
| Springhill | 8 | 3 | 5 | |||
| Tauputi | 8 | 7 | 1 | |||
| Waimata | 8 | 4 | 4 | |||
| Wainui | 16 | 10 | 6 | |||
| Wainui River | 88 | 44 | 44 | |||
| Whangaihau Station | 24 | 16 | 8 | |||
| Total Riding | 296 | 172 | 124 | |||
| Riding of Patangata— | ||||||
| Edenham | 44 | 32 | 12 | |||
| Elms Hill Station | 5 | 4 | 1 | |||
| Elsthorpe Station | 25 | 22 | 3 | |||
| Great North Road, Kaikora | 9 | 5 | 4 | |||
| Homewood | 60 | 37 | 23 | |||
| Kaikora East | 166 | 86 | 80 | |||
| Mangakuri | 24 | 22 | 2 | |||
| Oero Bush | 6 | 4 | 2 | |||
| Patangata | 46 | 29 | 17 | |||
| Railway-line, Te Aute | 23 | 12 | 11 | |||
| Te Apiti Station | 13 | 12 | 1 | |||
| Te Kopanga | 41 | 30 | 11 | |||
| Tukuru Bush | 6 | 4 | 2 | |||
| Wautakai | 10 | 8 | 2 | |||
| Total Riding | 478 | 307 | 171 | |||
| Riding of Tamumu— | ||||||
| Blackhead | 21 | 16 | 5 | |||
| Po^terere Station | 52 | 35 | 17 | |||
| Tamumu | 45 | 31 | 14 | |||
| Tarawera | 32 | 21 | 11 | |||
| Tarawera Bush | 3 | 3 | … | |||
| Total Riding | 153 | 106 | 47 | |||
| Riding of Waipawa— | ||||||
| Abbotsford Station | 6 | 4 | 2 | |||
| Great North Road | 97 | 43 | 54 | |||
| Gwavas | 15 | 7 | 8 | |||
| Hampden | 178 | 97 | 81 | |||
| Hampden Bush | 32 | 11 | 21 | |||
| Kararau | 5 | 4 | 1 | |||
| Country, Riding, Town, Locality, and Road District. | Total. | M. | F. | |||
|---|---|---|---|---|---|---|
| WAIPAWA COUNTY—continued. | ||||||
| Riding of Waipawa—continued. | ||||||
| Milbourne Gully | 20 | 14 | 6 | |||
| Railway-line | 17 | 11 | 6 | |||
| Richmond Park | 124 | 66 | 58 | |||
| Ruataniwha Road | 25 | 14 | 11 | |||
| Sedgwick | 84 | 42 | 42 | |||
| Smith's Road | 12 | 6 | 6 | |||
| Te Aute College | 65 | 45 | 20 | |||
| Tikokino | 54 | 35 | 19 | |||
| Waipawa, T. | 390 | 216 | 174 | |||
| Waipawa Bush | 139 | 63 | 76 | |||
| Others | 16 | 11 | 5 | |||
| Total Riding | 1,279 | 689 | 590 | |||
| Riding of Waipukurau— | ||||||
| Arlington | 17 | 13 | 4 | |||
| Mangatarata | 23 | 23 | 2 | |||
| Mount Herbert | 35 | 21 | 14 | |||
| Mount Vernon | 28 | 17 | 11 | |||
| Newlands | 11 | 6 | 5 | |||
| Pine Grove | 5 | 4 | 1 | |||
| St. Vincent Farm | 6 | 3 | 3 | |||
| Tarewa Bush | 14 | 9 | 5 | |||
| Waipukurau, T., and vicinity | 326 | 172 | 154 | |||
| Woburn | 15 | 10 | 5 | |||
| Others | 19 | 13 | 6 | |||
| Total Riding | 501 | 291 | 210 | |||
| Riding of Ruataniwha— | ||||||
| Ashcott | 24 | 14 | 10 | |||
| Ashley-Clinton | 36 | 21 | 15 | |||
| Brookside | 11 | 8 | 3 | |||
| Burnside | 25 | 17 | 8 | |||
| Fairfield | 13 | 13 | 2 | |||
| Forest Gate | 20 | 11 | 9 | |||
| Greenhill | 9 | 5 | 4 | |||
| Heavy Tree | 16 | 9 | 7 | |||
| Lambertford | 7 | 6 | 1 | |||
| Makaretu | 449 | 244 | 205 | |||
| Ongaonga | 41 | 22 | 19 | |||
| Oruawhara | 51 | 33 | 18 | |||
| Railway-line | 29 | 12 | 17 | |||
| Sherwood | 9 | 4 | 5 | |||
| Springhill | 5 | 4 | 1 | |||
| Stockade | 11 | 6 | 5 | |||
| Takapau | 29 | 15 | 14 | |||
| Others | 19 | 11 | 8 | |||
| Total Riding | 806 | 455 | 351 | |||
| Riding of Norsewood— | ||||||
| Friberg Road | 83 | 44 | 39 | |||
| German Settlement | 103 | 53 | 50 | |||
| Kopua, T. | 110 | 67 | 43 | |||
| Makatoku (Railway-line) | 57 | 34 | 23 | |||
| Norsewood | 308 | 171 | 137 | |||
| Norsewood West | 131 | 79 | 72 | |||
| Ormondville, T. | 294 | 166 | 128 | |||
| Ormondville Road | 149 | 83 | 66 | |||
| Takapau, T. | 85 | 49 | 36 | |||
| Total Riding | 1,340 | 746 | 594 | |||
| Riding of Woodville— | ||||||
| Danevirk, T. | 128 | 74 | 54 | |||
| Heretaunga Block | 39 | 30 | 9 | |||
| Kaitoki Station | 12 | 10 | 2 | |||
| Kumeroa | 24 | 16 | 8 | |||
| Mangapuaka Station | 5 | 5 | … | |||
| Mangatoro Station | 29 | 24 | 5 | |||
| Oringi | 22 | 14 | 8 | |||
| Tahoraite | 18 | 11 | 7 | |||
| Victoria Block | 41 | 25 | 16 | |||
| Woodville, T. | 70 | 39 | 31 | |||
| Woodville vicinity | 166 | 104 | 62 | |||
| Woodville (Small-Farm Association) | 217 | 114 | 103 | |||
| Total Riding | 771 | 466 | 305 | |||
| Highway Districts— | Total. | M. | F. | |||
| Danevirk | 253 | 168 | 85 | |||
| Makaretu | 452 | 245 | 207 | |||
| Norsewood | 1,046 | 550 | 466 | |||
| Oero | 158 | 126 | 32 | |||
| Ormondville | 294 | 166 | 128 | |||
| Patangata | 674 | 358 | 316 | |||
| Porangahau | 296 | 172 | 124 | |||
| Ruataniwha North | 486 | 270 | 216 | |||
| Ruataniwha | 168 | 103 | 66 | |||
| Takapau | 186 | 102 | 78 | |||
| Tamumu | 153 | 106 | 47 | |||
| Waipawa | 439 | 242 | 197 | |||
| Waipukurau | 501 | 291 | 210 | |||
| Wallingford | 190 | 138 | 52 | |||
| Wanstead | 53 | 41 | 12 | |||
| Woodville | 518 | 298 | 220 | |||
| HAWKE'S BAY COUNTY. | ||||||
| Riding of Petane— | ||||||
| Glengary | 12 | 8 | … | |||
| Loch Iver Station | 9 | 4 | 5 | |||
| Petane | 191 | 113 | 78 | |||
| Pohui | 36 | 25 | 11 | |||
| Runanga | 7 | 7 | … | |||
| Tarawera | 7 | 4 | 3 | |||
| Te Horoto | 2 | 1 | 1 | |||
| Western Spit | 32 | 16 | 16 | |||
| Others | 10 | 8 | 2 | |||
| Total Riding | 306 | 186 | 120 | |||
| Riding of Meanee— | ||||||
| Meanee, T. | 273 | 153 | 122 | |||
| Meanee | 90 | 49 | 41 | |||
| Taradale, T. | 385 | 315 | 270 | |||
| Total Riding | 930 | 317 | 433 | |||
| Riding of Heretaunga— | ||||||
| Awatoto | 56 | 25 | 31 | |||
| Hastings, T. | 617 | 334 | 283 | |||
| Hastings vicinity | 241 | 137 | 84 | |||
| Home Station | 8 | 4 | 4 | |||
| Little Bush | 11 | 11 | … | |||
| Papakura | 128 | 83 | 43 | |||
| Total Riding | 1,061 | 614 | 447 | |||
| Riding of Puketupu— | ||||||
| Koropiki | 6 | 5 | 1 | |||
| Mangawhare Station | 29 | 28 | 1 | |||
| Moteo | 9 | 7 | 2 | |||
| Mount Alexander | 25 | 25 | … | |||
| Okawa | 26 | 23 | 3 | |||
| Okawa Station | 9 | 2 | 7 | |||
| Omahu | 5 | 4 | 1 | |||
| Omarunui | 16 | 10 | 6 | |||
| Omatua Station | 13 | 6 | 7 | |||
| Patoka | 28 | 23 | 5 | |||
| Puketapu | 89 | 48 | 41 | |||
| Pukititiri | 27 | 20 | 7 | |||
| Redclyffe | 27 | 20 | 7 | |||
| Rissington Station | 32 | 21 | 11 | |||
| Rotowhenua | 13 | 8 | 5 | |||
| Tunanui Station | 19 | 15 | 4 | |||
| Waikonini Hotel | 22 | 15 | 7 | |||
| Wharerangi | 22 | 10 | 12 | |||
| Woodthorpe | 11 | 4 | 7 | |||
| Others | 33 | 16 | 17 | |||
| Total Riding | 461 | 310 | 151 | |||
| Riding of Maraekakaho— | ||||||
| Aorangi | 14 | 3 | 11 | |||
| Erewhon | 14 | 14 | … | |||
| Glenross | 28 | 18 | 10 | |||
| Kereru | 41 | 32 | 9 | |||
| Kereru Bush | 18 | 10 | 8 | |||
| Kuripapanga | 11 | 11 | … | |||
| Maraekakaho | 53 | 39 | 14 | |||
| Matapiro | 23 | 14 | 9 | |||
| Country, Riding, Town, Locality, and Road District. | Total. | M. | F. | |||
|---|---|---|---|---|---|---|
| HAWKE'S BAY COUNTY—contd. | ||||||
| Riding of Maraekakaho—continued. | ||||||
| Ohauko | 45 | 45 | … | |||
| Ohinewairau | 12 | 11 | 1 | |||
| Olrig | 12 | 9 | 3 | |||
| Onipo | 8 | 2 | 6 | |||
| Pakipaki | 22 | 13 | 9 | |||
| Pakipaki Pa | 3 | 3 | … | |||
| Paukawa | 12 | 12 | … | |||
| Poporangi Creek | 1 | 1 | … | |||
| Raukawa | 13 | 8 | 5 | |||
| Rupuanga Pa | 5 | 4 | 1 | |||
| Taruarau | 5 | 5 | … | |||
| Te Aute | 177 | 97 | 80 | |||
| Te Awa-o-te-Atua | 36 | 20 | 16 | |||
| Te Tehake | 5 | 4 | 1 | |||
| Tikitiki | 15 | 12 | 3 | |||
| Whakarara | 6 | 4 | 2 | |||
| Whanawhana | 7 | 7 | … | |||
| Total Riding | 586 | 398 | 188 | |||
| Riding of Clive— | ||||||
| Clifton Station | 7 | 6 | 1 | |||
| East Clive, T. | 147 | 73 | 74 | |||
| Farndon | 44 | 27 | 17 | |||
| Havelock Road | 47 | 25 | 22 | |||
| Nelson House | 7 | 3 | 4 | |||
| Nelson Station | 4 | 4 | … | |||
| Pakowhai Pa | 6 | 4 | 2 | |||
| Pakowhai Road | 9 | 5 | 4 | |||
| Riverslea | 11 | 4 | 7 | |||
| Tukituki Station | 19 | 12 | 7 | |||
| Waimarama | 27 | 18 | 9 | |||
| Waitangi | 26 | 18 | 8 | |||
| West Clive, T. | 637 | 348 | 289 | |||
| Total Riding | 991 | 547 | 444 | |||
| Riding of Havelock— | ||||||
| Havelock, T. | 101 | 60 | 41 | |||
| Havelock vicinity | 228 | 116 | 112 | |||
| Kohinurakau | 21 | 19 | 2 | |||
| Poukawa | 8 | 4 | 4 | |||
| Pukahu | 114 | 54 | 60 | |||
| Te Mahanga | 31 | 17 | 14 | |||
| Te Mata | 21 | 15 | 6 | |||
| Total Riding | 524 | 285 | 239 | |||
| Highway Districts— | Total | M. | F. | |||
| Awatoto and Omaranui | 56 | 25 | 31 | |||
| Clive | 784 | 421 | 363 | |||
| Havelock | 275 | 154 | 121 | |||
| Heretaunga | 858 | 491 | 367 | |||
| Kakiraawa | 114 | 62 | 52 | |||
| Kereru and Aorangi | 92 | 59 | 33 | |||
| Maraekakaho | 122 | 89 | 33 | |||
| Meanee | 950 | 517 | 433 | |||
| Okawa | 278 | 207 | 68 | |||
| Pakowhai | 85 | 54 | 31 | |||
| Papakura | 147 | 98 | 49 | |||
| Petane | 306 | 186 | 120 | |||
| Pukahu | 114 | 54 | 60 | |||
| Puketapu | 159 | 83 | 76 | |||
| Raukawa | 276 | 159 | 117 | |||
| Redclyffe | 27 | 20 | 7 | |||
| Te Mata | 143 | 87 | 56 | |||
| Outlying | 96 | 91 | 5 | |||
| SOUNDS COUNTY. | ||||||
| (No Ridings.) | ||||||
| Croixelles— | ||||||
| Admiralty Bay | 21 | 12 | 9 | |||
| Current Basin | 5 | 4 | 1 | |||
| D'Urville Island | 8 | 5 | 3 | |||
| Pelorus Sound | 32 | 19 | 13 | |||
| Total | 66 | 40 | 26 | |||
| Pelorus Sound— | ||||||
| Akaloa Bay | 6 | 4 | 2 | |||
| Black Point | 14 | 11 | 3 | |||
| Cluva Bay | 39 | 18 | 21 | |||
| Ely Bay | 5 | 3 | 2 | |||
| Forsyth Island | 1 | 1 | … | |||
| Four-Fathom Bay | 8 | 5 | 3 | |||
| Green Point | 10 | 4 | 6 | |||
| Homewood | 5 | 3 | 2 | |||
| Hopai | 14 | 7 | 7 | |||
| Kenepuru Sound | 113 | 68 | 45 | |||
| Ketu Bay | 12 | 6 | 6 | |||
| Nydia Bay | 31 | 18 | 13 | |||
| Wet Inlet | 42 | 33 | 9 | |||
| Total | 300 | 181 | 119 | |||
| Queen Charlotte Sound— | ||||||
| Arapawa Island | 15 | 6 | 9 | |||
| Boat Cove | 14 | 10 | 4 | |||
| Bowden's Bay | 10 | 5 | 5 | |||
| Brothers, Cook Strait | 3 | 3 | … | |||
| Endeavour Inlet | 7 | 1 | 6 | |||
| Golden Point | 23 | 17 | 6 | |||
| Jackson's Bay | 9 | 3 | 6 | |||
| Jackson Head | 38 | 27 | 11 | |||
| Loch Mara | 1 | 1 | ... | |||
| Okukari Bay | 3 | 2 | 1 | |||
| Ravenscliff | 4 | 2 | 2 | |||
| Ship Cove | 10 | 4 | 6 | |||
| The Rocks | 7 | 4 | 3 | |||
| Tory Channel | 8 | 5 | 3 | |||
| Turner's Bay | 13 | 5 | 8 | |||
| Total | 165 | 95 | 70 | |||
| Port Underwood— | ||||||
| Akaoka Bay | 1 | 1 | … | |||
| Hakahaka Bay | 7 | 5 | 2 | |||
| Jordon's Bay | 6 | 3 | 3 | |||
| Kakapo Bay | 4 | 2 | 2 | |||
| Ngakuta Bay | 7 | 7 | … | |||
| Ocean Bay | 4 | 4 | … | |||
| Opihi Bay | 8 | 5 | 3 | |||
| Oyster Bay | 6 | 3 | 3 | |||
| Robin Hood's Bay | 6 | 3 | 3 | |||
| Starmount House | 3 | 3 | … | |||
| Wangakoko Bay | 5 | 4 | 1 | |||
| Wangatawia Bay | 9 | 4 | 5 | |||
| White Bay | 8 | 4 | 4 | |||
| Total | 74 | 48 | 26 | |||
| MARLBOROUGH COUNTY. | ||||||
| Riding of Awatere— | ||||||
| Altimarloch | 8 | 6 | 2 | |||
| Awatere Crossing | 24 | 17 | 7 | |||
| Blairich | 18 | 14 | 4 | |||
| Blind River | 13 | 8 | 5 | |||
| Burtergill | 6 | 1 | 5 | |||
| Cape Campbell | 6 | 3 | 3 | |||
| Dumgree | 14 | 11 | 3 | |||
| Fairfield | 10 | 7 | 3 | |||
| Flaxbourne | 46 | 34 | 12 | |||
| Kekerangi | 66 | 44 | 22 | |||
| Langridge | 5 | 5 | … | |||
| Marathon | 10 | 6 | 4 | |||
| Middlehurst | 14 | 14 | … | |||
| Molesworth | 13 | 13 | … | |||
| Mount Gladstone | 3 | 3 | … | |||
| Richmond Brook | 9 | 7 | 2 | |||
| Shades Station | 6 | 5 | 1 | |||
| Starborough | 30 | 28 | 2 | |||
| Taylor's Pass | 4 | 4 | … | |||
| Upcott | 20 | 20 | … | |||
| Upton Downs | 22 | 20 | 2 | |||
| Weld's Hill | 15 | 14 | 1 | |||
| Woodbank | 11 | 7 | 4 | |||
| Others | 6 | 2 | 4 | |||
| Total Riding | 379 | 293 | 86 | |||
| Country, Riding, Town, Locality, and Road District. | Total. | M. | F. | |||
|---|---|---|---|---|---|---|
| MARLBOROUGH COUNTY—continued. | ||||||
| Riding of Wairau— | ||||||
| Avondale | 10 | 7 | 3 | |||
| Bankhouse | 6 | 5 | 1 | |||
| Bartlett's Creek | 24 | 14 | 10 | |||
| Benopai | 17 | 13 | 4 | |||
| Birch Hill | 27 | 23 | 4 | |||
| Blythfield | 8 | 5 | 3 | |||
| Brookby | 4 | 4 | … | |||
| Cowslip Valley | 14 | 8 | 6 | |||
| Delta | 34 | 18 | 16 | |||
| Fairhall | 7 | 4 | 3 | |||
| Glazebrook | 12 | 12 | … | |||
| Hawkesbury | 9 | 9 | … | |||
| Hillsden | 27 | 22 | 5 | |||
| Langly Dale | 14 | 9 | 5 | |||
| Langsdown | 11 | 6 | 5 | |||
| Leefield | 23 | 15 | 8 | |||
| Manuka Island | 5 | 3 | 1 | |||
| Mount Patriarch | 41 | 39 | 2 | |||
| Onamalutu | 89 | 58 | 31 | |||
| Pipe's Valley | 13 | 11 | 2 | |||
| Renwick New Road | 158 | 80 | 78 | |||
| Te Arowhenua | 5 | 4 | 1 | |||
| Tentersfield | 5 | 1 | 4 | |||
| Timms Valley | 4 | 3 | 1 | |||
| Top Valley | 21 | 21 | … | |||
| Valley Field | 20 | 13 | 7 | |||
| Wairau Valley | 99 | 57 | 42 | |||
| Woodbourne | 13 | 10 | 3 | |||
| Others | 15 | 9 | 6 | |||
| Total Riding | 735 | 483 | 252 | |||
| Riding of Spring Creek— | ||||||
| Grove Town, T. | 182 | 103 | 79 | |||
| Lower Spring Creek | 238 | 144 | 94 | |||
| Marlborough, T. | 70 | 35 | 35 | |||
| Upper Spring Creek | 176 | 110 | 66 | |||
| Total Riding | 666 | 392 | 274 | |||
| Riding of Omaka— | ||||||
| Barleyman's Section | 16 | 8 | 8 | |||
| Beatson's Road | 12 | 8 | 4 | |||
| Boulder Bank, Dillon's Point Road | 55 | 35 | 20 | |||
| Dashwood Pass Road | 85 | 54 | 31 | |||
| Kaituna Road | 11 | 5 | 6 | |||
| Middle Renwick Road | 89 | 54 | 35 | |||
| Old Renwick Road | 113 | 64 | 49 | |||
| Redwood, T. | 127 | 62 | 65 | |||
| Renwick, T. | 297 | 742 | 155 | |||
| Total Riding | 805 | 432 | 373 | |||
| Riding of Picton— | ||||||
| Cloudy Bay | 89 | 47 | 42 | |||
| Elevation, Wairau Road | 34 | 16 | 18 | |||
| Koromiko | 175 | 95 | 80 | |||
| Mount Pleasant | 122 | 61 | 61 | |||
| Para | 115 | 66 | 49 | |||
| Shakespeare Bay | 19 | 8 | 11 | |||
| Tuamarina | 234 | 130 | 104 | |||
| Waikawa | 10 | 5 | 5 | |||
| Total Riding | 798 | 428 | 370 | |||
| Riding of Havelock— | ||||||
| Havelock, T. | 344 | 185 | 159 | |||
| Total Riding | 344 | 185 | 159 | |||
| Riding of Pelorus— | ||||||
| Anikiwa | 42 | 26 | 16 | |||
| Kaituna | 73 | 35 | 38 | |||
| Kaituna Valley | 348 | 193 | 155 | |||
| Mahakipawa | 70 | 41 | 29 | |||
| Mahau Sound | 6 | 4 | 2 | |||
| Pelorus Valley | 200 | 120 | 80 | |||
| Wairau, North Bank | 99 | 43 | 56 | |||
| Wakamarina | 115 | 92 | 23 | |||
| Total Riding | 953 | 554 | 399 | |||
| Road Districts— | Total | M. | F. | |||
| Awatere | 379 | 293 | 86 | |||
| Havelock Town | 344 | 185 | 159 | |||
| Omaka | 805 | 432 | 373 | |||
| Pelorus | 953 | 554 | 399 | |||
| Picton | 708 | 428 | 370 | |||
| Spring Creek | 666 | 392 | 274 | |||
| Wairau | 735 | 483 | 252 | |||
| KAIKOURA COUNTY. | ||||||
| Riding of Kaikoura— | ||||||
| Kaikoura, T. | 257 | 139 | 118 | |||
| Total Riding | 257 | 139 | 118 | |||
| Riding of Clarence— | ||||||
| Amuri | 12 | 12 | … | |||
| Boat Harbour | 12 | 9 | 3 | |||
| Clarence Ferry | 8 | 6 | 2 | |||
| Claverley | 1 | 5 | 2 | |||
| Conway Hills | 7 | 5 | 2 | |||
| Fernyhurst | 7 | 4 | 3 | |||
| Green Hills | 35 | 30 | 5 | |||
| Hapuka Saw-mills | 13 | 13 | … | |||
| Kawhara Reserve | 16 | 14 | 2 | |||
| Waipapa | 29 | 24 | 5 | |||
| Others | 5 | 4 | 1 | |||
| Total Riding | 151 | 126 | 25 | |||
| Riding of Kowhai— | ||||||
| Kaikoura Suburban District | 697 | 406 | 291 | |||
| Total Riding | 697 | 406 | 291 | |||
| Road District— | Total. | M. | F. | |||
| Kaikoura | 1,105 | 671 | 434 | |||
| WAIMEA COUNTY. | ||||||
| Riding of Wangamoa— | ||||||
| Brook Street Valley | 14 | 6 | 8 | |||
| Cable Bay | 19 | 13 | 6 | |||
| Croixelles | 3 | 3 | … | |||
| Happy Valley | 81 | 46 | 35 | |||
| Maitai Valley | 28 | 19 | 9 | |||
| Maori Pa | 4 | 3 | 1 | |||
| Pepin's Island | 1 | 1 | … | |||
| Suburban North | 313 | 148 | 165 | |||
| Teal Valley | 20 | 10 | 10 | |||
| Wangamoa | 11 | 4 | 7 | |||
| Total Riding | 494 | 253 | 241 | |||
| Riding of Stoke— | ||||||
| Stoke | 430 | 203 | 227 | |||
| Waimea East (including Richmond) | 1,164 | 569 | 595 | |||
| Waimea West | 405 | 234 | 171 | |||
| Total Riding | 1,999 | 1,006 | 993 | |||
| Riding of Motueka— | ||||||
| Beach Road | 97 | 48 | 49 | |||
| Brookland Valley | 192 | 100 | 92 | |||
| Lower Moutere | 9 | 5 | 4 | |||
| Motueka | 313 | 148 | 165 | |||
| Moutere Road | 97 | 52 | 45 | |||
| Pangatotara Road | 147 | 69 | 78 | |||
| Pa Road | 98 | 53 | 45 | |||
| Pokororo River | 3 | 3 | … | |||
| Riwaka | 340 | 174 | 166 | |||
| Swan Road | 66 | 37 | 29 | |||
| Country, Riding, Town, Locality, and Road District. | Total. | M. | F. | |||
|---|---|---|---|---|---|---|
| WAIMEA COUNTY—continued. | ||||||
| Riding of Motueka—continued. | ||||||
| Sandy Bay | 69 | 36 | 33 | |||
| Slab Road | 35 | 14 | 21 | |||
| Waiwero Road | 150 | 87 | 63 | |||
| Woodland Road | 4 | 1 | 3 | |||
| Total Riding | 1,620 | 827 | 793 | |||
| Riding of Wangapeka— | ||||||
| Baton | 56 | 35 | 21 | |||
| Sherry | 59 | 34 | 25 | |||
| Tadmor | 110 | 57 | 53 | |||
| Wangapeka | 51 | 34 | 17 | |||
| Total Riding | 276 | 160 | 116 | |||
| Riding of Wai-iti— | ||||||
| Bellgrove | 37 | 24 | 13 | |||
| Brightwater | 255 | 131 | 124 | |||
| Dovedale | 180 | 93 | 87 | |||
| Eighty-Eight Valley | 93 | 53 | 40 | |||
| Foxhill | 231 | 128 | 103 | |||
| Pigeon Valley | 95 | 53 | 42 | |||
| Quail Valley | 47 | 31 | 16 | |||
| River Terrace | 26 | 13 | 13 | |||
| Spring Grove | 422 | 214 | 208 | |||
| Thorpe | 34 | 16 | 18 | |||
| Upper Wakefield | 18 | 9 | 9 | |||
| Wai-iti Valley | 26 | 13 | 13 | |||
| Wairoa Valley | 56 | 33 | 23 | |||
| Wakefield | 527 | 276 | 251 | |||
| Total Riding | 2,047 | 1,087 | 960 | |||
| Riding of Motupiko— | ||||||
| Big Bush | 22 | 12 | 10 | |||
| Motueka Valley | 61 | 35 | 26 | |||
| Motupiko | 125 | 77 | 48 | |||
| Stanley Brook | 83 | 42 | 41 | |||
| Total Riding | 291 | 166 | 125 | |||
| Riding of Moutere— | ||||||
| Graham District | 30 | 18 | 12 | |||
| Lower Moutere | 183 | 91 | 92 | |||
| Oronoco | 114 | 57 | 57 | |||
| Oronoco to Baton River | 59 | 34 | 25 | |||
| Table-land | 5 | 5 | … | |||
| Upper Moutere | 417 | 224 | 193 | |||
| Total Riding | 808 | 429 | 379 | |||
| Road Districts— | Total. | M. | F. | |||
| Motueka | 2,428 | 1,256 | 1,172 | |||
| Motueka Upper | 567 | 326 | 241 | |||
| Suburban North | 494 | 253 | 241 | |||
| Wai-iti | 134 | 79 | 55 | |||
| Waimea | 3,912 | 2,014 | 1,898 | |||
| COLLINGWOOD COUNTY. | ||||||
| Riding of Rangiora— | ||||||
| Adelaide Mill | 3 | 1 | 2 | |||
| Appos | 14 | 10 | 4 | |||
| Bedstead Gully | 6 | 5 | 1 | |||
| Bedstead Hill | 2 | 1 | 1 | |||
| Blue Creek | 3 | 3 | … | |||
| Coles Creek | 7 | 3 | 4 | |||
| Coles Gully | 4 | 3 | 1 | |||
| Collins Town | 10 | 6 | 4 | |||
| Doctor's Creek | 8 | 6 | 2 | |||
| Fern Town | 55 | 31 | 24 | |||
| Gibbs Town and Collingwood | 152 | 83 | 69 | |||
| Glengyle | 2 | 2 | … | |||
| Golden Ridge | 9 | 9 | … | |||
| Kaitaha | 2 | 1 | 1 | |||
| Kaituna | 16 | 10 | 6 | |||
| Kaituna Road | 26 | 15 | 11 | |||
| Kowatu | 4 | 2 | 2 | |||
| Lightband's | 12 | 10 | 2 | |||
| Malone's Gully | 3 | 3 | … | |||
| Moonlight Flat | 3 | 3 | … | |||
| Onakaka | 10 | 6 | 4 | |||
| Pakawau | 61 | 28 | 33 | |||
| Parapara | 19 | 10 | 9 | |||
| Purauaukau | 10 | 4 | 6 | |||
| Quartz Ranges | 17 | 11 | 6 | |||
| Red Hill | 7 | 5 | 2 | |||
| River Bank | 10 | 4 | 6 | |||
| Riverdale | 24 | 15 | 9 | |||
| River Road | 4 | 2 | 2 | |||
| Rockville | 21 | 13 | 8 | |||
| Rocky River | 14 | 14 | … | |||
| Sandspit Lighthouse | 14 | 7 | 7 | |||
| Seaford | 32 | 16 | 16 | |||
| Slate River | 12 | 11 | 1 | |||
| Suburban | 21 | 12 | 9 | |||
| Taupata | 13 | 6 | 7 | |||
| Tukurua | 7 | 4 | 3 | |||
| Wakefield Gully | 1 | 1 | … | |||
| Total Riding | 638 | 376 | 262 | |||
| Riding of Takaka— | ||||||
| Anatoki | 13 | 13 | … | |||
| Awaroa | 37 | 21 | 16 | |||
| Clifton | 84 | 44 | 40 | |||
| East Takaka | 137 | 73 | 64 | |||
| Long Plain | 86 | 44 | 42 | |||
| Lower Takaka | 306 | 173 | 133 | |||
| Motupipi | 120 | 58 | 62 | |||
| Punamahoia | 51 | 21 | 30 | |||
| Upper Takaka | 87 | 50 | 37 | |||
| Waikaramumu | 27 | 21 | 6 | |||
| Waingaro | 57 | 32 | 25 | |||
| Total Riding | 1,005 | 550 | 455 | |||
| Road Districts— | Total. | M. | F. | |||
| Collingwood | 419 | 263 | 156 | |||
| Takaka | 968 | 530 | 438 | |||
| Outlying | 256 | 133 | 123 | |||
| BULLER COUNTY. | ||||||
| Riding of Karamea— | ||||||
| Coal Mine, Mokihinui | 3 | 3 | … | |||
| Government Island | 39 | 21 | 18 | |||
| Karamea Gorge | 3 | 3 | … | |||
| Land of Promise | 25 | 11 | 14 | |||
| Mokihinui Village | 17 | 7 | 10 | |||
| North Beach | 7 | 5 | 2 | |||
| North Terrace | 20 | 12 | 8 | |||
| Pakihis | 7 | 3 | 4 | |||
| Promised Land | 33 | 17 | 16 | |||
| Rough-and-Tumble | 3 | 3 | … | |||
| South Beach, Mokihinui | 11 | 5 | 6 | |||
| Wanganui Beach | 23 | 14 | 9 | |||
| Total Riding | 191 | 104 | 87 | |||
| Riding of Lyell— | ||||||
| Christie's Road | 34 | 25 | 9 | |||
| Lyell, T. | 160 | 106 | 54 | |||
| Lyell Creek | 95 | 77 | 18 | |||
| Nelson Road | 25 | 18 | 7 | |||
| New Creek | 9 | 9 | … | |||
| Welchman's Terrace | 21 | 19 | 2 | |||
| Zala Town | 77 | 67 | 10 | |||
| Total Riding | 421 | 321 | 100 | |||
| Riding of Wareatea— | ||||||
| Addison's, T. | 86 | 45 | 41 | |||
| Big Swamp | 21 | 13 | 8 | |||
| Buller Bank | 21 | 13 | 8 | |||
| Buller Lagoon | 2 | 2 | … | |||
| Buller River (North Bank) | 24 | 18 | 6 | |||
| Buller Road | 41 | 32 | 9 | |||
| Bush Road (Cape Foulwind) | 23 | 15 | 8 | |||
| Country, Riding, Town, Locality, and Road District. | Total. | M. | F. | |||
|---|---|---|---|---|---|---|
| BULLER COUNTY—continued. | ||||||
| Riding of Wareatea—continued. | ||||||
| Caledonian Creek | 18 | 11 | 7 | |||
| Carmody's Creek | 22 | 9 | 13 | |||
| Deadman's Creek | 8 | 8 | … | |||
| Fairdown | 9 | 7 | 2 | |||
| Fourteen-Mile Railway | 11 | 5 | 6 | |||
| German Creek | 4 | 4 | … | |||
| German Terrace | 11 | 11 | … | |||
| Giles Terrace | 17 | 15 | 2 | |||
| Granity Creek | 15 | 6 | 9 | |||
| Hatter's Terrace | 35 | 24 | 11 | |||
| Junction | 26 | 14 | 12 | |||
| Kuranui Coal Mine, Waimangaroa | 6 | 6 | … | |||
| Martin's Island | 10 | 5 | 5 | |||
| Mountain Creek | 35 | 13 | 22 | |||
| Ngakawau | 12 | 7 | 5 | |||
| Nine-Mile Road | 27 | 17 | 10 | |||
| North Beach | 28 | 26 | 2 | |||
| Orawaiti and Road | 87 | 42 | 45 | |||
| Packer's Point | 5 | 2 | 3 | |||
| Rochfort Terrace | 6 | 2 | 4 | |||
| Sergeant's Hill | 16 | 11 | 5 | |||
| Shamrock Lead | 6 | 5 | 1 | |||
| South Beach | 8 | 5 | 3 | |||
| South Spit | 30 | 15 | 15 | |||
| The Cave Diggings | 3 | 3 | … | |||
| Totara Lagoon | 10 | 6 | 4 | |||
| Virgin Flat | 3 | 3 | … | |||
| Waimangaroa | 193 | 116 | 77 | |||
| Waite's-Pakihis | 60 | 41 | 19 | |||
| Westport Colliery Coal Mine | 91 | 78 | 13 | |||
| Wilson's Lead | 9 | 5 | 4 | |||
| Total Riding | 1,039 | 660 | 379 | |||
| Riding of Charleston— | ||||||
| Argyle Terrace | 8 | 7 | 1 | |||
| Back Lead | 57 | 40 | 17 | |||
| Ballarat Creek | 16 | 10 | 6 | |||
| Ballarat Terrace | 8 | 7 | 1 | |||
| Brighton, T. | 37 | 16 | 21 | |||
| Brighton Flat | 9 | 5 | 4 | |||
| Buller Road | 52 | 27 | 25 | |||
| Candlelight | 79 | 42 | 37 | |||
| Charleston, T. | 244 | 143 | 101 | |||
| Charleston Flat | 70 | 32 | 38 | |||
| Croninville | 39 | 33 | 6 | |||
| Darkies' Terrace, Charleston Flat | 28 | 14 | 14 | |||
| Dawson's Terrace, Six-Mile | 24 | 15 | 9 | |||
| Daylesford Terrace | 11 | 9 | 2 | |||
| Fenian Flat | 5 | 3 | 2 | |||
| Four-Mile | 9 | 7 | 2 | |||
| Hope Terrace | 2 | 2 | … | |||
| Nile Beach | 24 | 15 | 9 | |||
| Nile Valley | 17 | 8 | 9 | |||
| Nine-Mile Beach | 88 | 52 | 36 | |||
| Red Jacket Flat | 15 | 7 | 8 | |||
| Sardine Terrace | 4 | 2 | 1 | |||
| Second Bay | 12 | 10 | 2 | |||
| St. Kilda Flat | 11 | 8 | 3 | |||
| Welshman's Terrace | 5 | 5 | … | |||
| Whiskey Terrace | 2 | 2 | … | |||
| White Horse and Charleston Road | 16 | 10 | 6 | |||
| Woodpecker | 2 | 2 | … | |||
| Total Riding | 894 | 533 | 361 | |||
| INANGAHUA COUNTY. | ||||||
| Riding of Hampden— | ||||||
| Central Buller | 146 | 106 | 40 | |||
| Four-River Plain | 26 | 15 | 11 | |||
| Hampden | 35 | 24 | 11 | |||
| Hope River | 7 | 5 | 2 | |||
| Longford | 13 | 6 | 7 | |||
| Mangle's River | 2 | 2 | … | |||
| Maruia | 42 | 38 | 4 | |||
| Matakitaki | 100 | 79 | 21 | |||
| Matakitaki River | 16 | 15 | 1 | |||
| Matiri | 55 | 48 | 7 | |||
| Owen River | 7 | 5 | 2 | |||
| Taramea Station | 2 | 2 | … | |||
| Toi Patch | 8 | 8 | … | |||
| Tutaki | 1 | 1 | … | |||
| Upper Buller | 15 | 11 | 4 | |||
| Total Riding | 475 | 365 | 110 | |||
| Riding of Boatman's— | ||||||
| Boatman's Creek | 28 | 22 | 6 | |||
| Capelston, T. | 123 | 77 | 46 | |||
| Clinton Creek | 11 | 10 | 1 | |||
| Coal Creek | 5 | 5 | … | |||
| Cronadon | 59 | 30 | 29 | |||
| Fiery Cross Gully | 61 | 39 | 22 | |||
| Flowers Gully | 21 | 21 | … | |||
| Hopeful Hill | 12 | 12 | … | |||
| Italian Gully | 23 | 23 | … | |||
| Junction of Buller | 28 | 20 | 8 | |||
| Just-in-Time Hill | 11 | 11 | … | |||
| Landing- Creek | 45 | 33 | 12 | |||
| Redman's Creek | 15 | 15 | … | |||
| Specimen Hill | 3 | 3 | … | |||
| Total Riding | 445 | 321 | 124 | |||
| Riding of Reefton— | ||||||
| Anderson's Creek | 2 | 2 | … | |||
| Buller Road | 9 | 5 | 4 | |||
| Burk's Creek | 2 | 2 | … | |||
| Deadman's Creek | 10 | 7 | 3 | |||
| Devil's Creek | 9 | 9 | … | |||
| Fern Flat | 12 | 8 | 4 | |||
| Inangahua River | 33 | 20 | 13 | |||
| Reefton, T. | 963 | 570 | 393 | |||
| Ross, T. | 24 | 13 | 11 | |||
| Soldier's Gully Town | 13 | 10 | 3 | |||
| Waitaki River | 13 | 11 | 2 | |||
| Total Riding | 1,090 | 657 | 433 | |||
| Riding of Murray— | ||||||
| Ajax Hill Quartz Reef | 39 | 35 | 4 | |||
| Black's Point. T. | 313 | 179 | 134 | |||
| Cement Town, Murray Creek | 14 | 12 | 2 | |||
| Energetic Quartz Reef | 17 | 16 | 1 | |||
| Total Riding | 383 | 242 | 141 | |||
| Riding of Crushington— | ||||||
| Crushington, T. | 76 | 48 | 28 | |||
| Lank's Gully | 10 | 10 | … | |||
| Merry Jig Creek | 37 | 37 | … | |||
| Rainy Creek | 1 | 1 | … | |||
| Upper Inangahua | 21 | 14 | 7 | |||
| Total Riding | 145 | 110 | 35 | |||
| Riding of Antonio's— | ||||||
| Adamstown | 3 | 3 | … | |||
| Antonio's Flat | 64 | 46 | 18 | |||
| Blackwater | 85 | 78 | 7 | |||
| Brown's Creek | 2 | 2 | … | |||
| Cariboo Village | 18 | 13 | 5 | |||
| Grey Road | 98 | 61 | 37 | |||
| Maori Gully | 18 | 18 | … | |||
| Murphy's Creek | 4 | 4 | … | |||
| Otututu | 5 | 3 | 2 | |||
| Red Jack's | 25 | 25 | … | |||
| Slab Hut Creek | 52 | 52 | … | |||
| Snowy Creek | 4 | 4 | … | |||
| Others | 11 | 11 | … | |||
| Total Riding | 389 | 320 | 69 | |||
| Country, Riding, Town, Locality, and Road District. | Total. | M. | F. | |||
|---|---|---|---|---|---|---|
| GREY COUNTY. | ||||||
| Riding of Waipuna— | ||||||
| Ahaura, T. | 205 | 116 | 89 | |||
| Amuri Road | 17 | 11 | 6 | |||
| Brandy Jack's | 8 | 7 | 1 | |||
| Duffer's'Creek | 26 | 18 | 8 | |||
| Grey Road | 22 | 11 | 11 | |||
| Granville | 7 | 5 | 2 | |||
| Half-Ounce | 20 | 16 | 4 | |||
| Haupiri Flat | 25 | 10 | 6 | |||
| Noble's Creek | 16 | 16 | … | |||
| Orwell Creek | 162 | 113 | 49 | |||
| Pike's Plains | 9 | 6 | 3 | |||
| Totara Flat | 115 | 71 | 44 | |||
| Waipuna | 30 | 21 | 9 | |||
| Total Riding | 662 | 43 | 232 | |||
| Riding of Nelson Creek— | ||||||
| Callaghan's Creek | 46 | 34 | 12 | |||
| Cornish Creek | 4 | 4 | … | |||
| German Gully | 36 | 31 | 5 | |||
| Hatter's, T. | 185 | 104 | 81 | |||
| Irishman's Creek | 1 | 1 | … | |||
| Kangaroo Ranges | 17 | 15 | 2 | |||
| Lake Hochstetter | 2 | 2 | … | |||
| Main Grey Valley Road | 34 | 24 | 10 | |||
| No. 1 Creek | 6 | 4 | 2 | |||
| No. 2 Creek | 18 | 12 | 6 | |||
| No. 3 Creek | 15 | 8 | 7 | |||
| Owen's Look-out | 19 | 19 | … | |||
| Right-Hand Branch | 20 | 16 | 4 | |||
| Riverview | 4 | 4 | … | |||
| Sullivan's Gully | 21 | 16 | 5 | |||
| Try-Again Terrace | 95 | 67 | 28 | |||
| Total Riding | 523 | 361 | 162 | |||
| Riding of Red Jack's— | ||||||
| Abe's Gully | 17 | 13 | 4 | |||
| Arnold Bridge | 14 | 6 | 8 | |||
| Bell Hill | 7 | 6 | 1 | |||
| Bell's Gully | 3 | 3 | … | |||
| Blackwater | 4 | 2 | 2 | |||
| Camptown | 6 | 4 | 2 | |||
| Candlelight | 12 | 6 | 6 | |||
| Cockney Terrace | 6 | 6 | … | |||
| Deadman's Gully | 23 | 19 | 4 | |||
| Deep Creek | 13 | 13 | ... | |||
| German Gully No. 2 | 1 | 1 | … | |||
| Irishtown | 13 | 12 | 1 | |||
| Lake Brunner | 9 | 7 | 2 | |||
| Maori Gully No. 2 | 5 | 5 | ... | |||
| Notown | 87 | 51 | 36 | |||
| Notown Road | 62 | 51 | 11 | |||
| Paddy's Gully | 11 | 10 | 1 | |||
| Portague Gully | 5 | 3 | 2 | |||
| Red Jack's Creek | 71 | 48 | 23 | |||
| Sunday Creek | 2 | 2 | … | |||
| Twelve-Mile Township | 33 | 17 | 16 | |||
| Total Riding | 404 | 285 | 119 | |||
| Riding of Brunnerton— | ||||||
| Baxter's Creek | 28 | 28 | … | |||
| Blackball | 55 | 48 | 7 | |||
| Brunnerton | 183 | 101 | 82 | |||
| Caledonian Creek | 7 | 7 | … | |||
| Coal Reserve | 222 | 129 | 93 | |||
| Grey River, West Bank | 3 | 3 | … | |||
| Langdon and Jones's Flat | 41 | 22 | 19 | |||
| Moonlight | 53 | 45 | 8 | |||
| Slaty Creek | 11 | 11 | … | |||
| Taylorville | 210 | 108 | 102 | |||
| Total Riding | 813 | 502 | 311 | |||
| Riding of Cobden— | ||||||
| Barrytown | 124 | 87 | 37 | |||
| Canoe Creek | 15 | 10 | 5 | |||
| Coal Creek | 80 | 46 | 34 | |||
| Cobden, T. | 154 | 77 | 77 | |||
| Darkies' Terrace | 2 | 2 | … | |||
| Fagan's Creek | 2 | 2 | … | |||
| Herbert's Terrace | 3 | 3 | … | |||
| North Beach | 25 | 223 | 3 | |||
| North Lead | 76 | 69 | 7 | |||
| Seven-Mile Beach | 6 | 3 | 3 | |||
| Seven-Mile Creek | 2 | 2 | … | |||
| Seventeen-Mile Beach | 82 | 51 | 31 | |||
| South Lead | 31 | 29 | 2 | |||
| Ten-Mile Creek Diggings | 24 | 20 | 4 | |||
| Terrace near Razorback | 10 | 10 | … | |||
| Twelve-Mile Beach | 5 | 5 | … | |||
| Twenty-two-Mile Creek (near Razorback) | 15 | 13 | 2 | |||
| Total Riding | 656 | 451 | 205 | |||
| Riding of Maori Creek— | ||||||
| Arnold, T. | 157 | 95 | 62 | |||
| Brown's Gully | 4 | 4 | … | |||
| Dunganville, T. | 158 | 109 | 49 | |||
| German Gully | 16 | 12 | 4 | |||
| Italian Gully | 28 | 23 | 5 | |||
| Liverpool's | 8 | 8 | … | |||
| Maori Creek | 14 | 14 | … | |||
| Maori Gully | 12 | 11 | 1 | |||
| New River | 75 | 59 | 16 | |||
| Patterson's Creek | 20 | 15 | 5 | |||
| Stillwater Creek | 35 | 27 | 8 | |||
| Waimea Creek | 42 | 34 | 8 | |||
| Wood's Creek | 18 | 17 | 1 | |||
| Total Riding | 587 | 428 | 159 | |||
| Riding of Paroa— | ||||||
| Grey and Marsden Road | 8 | 3 | 5 | |||
| Grey and Reefton Road | 27 | 13 | 14 | |||
| Kaiata Flat | 66 | 36 | 30 | |||
| Limestone Terrace | 15 | 15 | … | |||
| Manuka Flat | 88 | 86 | 2 | |||
| Old Tramway (Marsden Road) | 10 | 7 | 3 | |||
| Rutherglen | 81 | 56 | 25 | |||
| South Beach | 190 | 104 | 86 | |||
| Tramway to Teremakau | 36 | 18 | 18 | |||
| Welshman's Terrace and Flat | 120 | 100 | 20 | |||
| Total Riding | 641 | 438 | 203 | |||
| Riding of Marsden— | ||||||
| Blackwater | 10 | 9 | 1 | |||
| Cameron's Track | 26 | 26 | … | |||
| Cape Terrace | 76 | 60 | 16 | |||
| Cariboo | 1 | 1 | … | |||
| Cockaballa | 24 | 24 | … | |||
| Cockeye | 15 | 8 | 7 | |||
| Dolly Varden | 2 | 2 | … | |||
| Eight-Mile Creek | 28 | 28 | … | |||
| German Terrace | 5 | 5 | … | |||
| Greenstone and Marsden Road | 2 | 2 | … | |||
| Irishman's Town | 12 | 12 | … | |||
| Manuka Flat | 7 | 7 | … | |||
| Marsden, T. | 46 | 24 | 22 | |||
| Mosquito Creek | 12 | 12 | … | |||
| Nemona | 20 | 12 | 8 | |||
| New River | 6 | 6 | … | |||
| Niagara | 16 | 16 | … | |||
| Scotch Jock's | 3 | 3 | … | |||
| Total Riding | 311 | 257 | 54 | |||
| Riding of Hohonu— | ||||||
| Biggs | 20 | 17 | 3 | |||
| Duke of Edinburgh Town | 9 | 6 | 3 | |||
| Greenstone Creek | 22 | 22 | … | |||
| Greenstone Road | 15 | 8 | 7 | |||
| Greenstone Township | 66 | 36 | 30 | |||
| Hay's Terrace | 33 | 29 | 4 | |||
| Houlahan's | 21 | 16 | 5 | |||
| Country, Riding, Town, Locality, and Road District. | Total. | M. | F. | |||
|---|---|---|---|---|---|---|
| GREY COUNTY—continued. | ||||||
| Riding of Hohonu—continued. | ||||||
| Inch Bonnie Station | 6 | 2 | 4 | |||
| Lake Brunner | 6 | 4 | 2 | |||
| Lake Paroa | 9 | 7 | 2 | |||
| Maori Point | 6 | 5 | 1 | |||
| Pain's Gully | 5 | 5 | … | |||
| Quinn's Terrace | 3 | 3 | … | |||
| Special Settlement and Road | 14 | 13 | 1 | |||
| Teremakau Bridge | 11 | 6 | 5 | |||
| Three-Mile Creek | 20 | 19 | 1 | |||
| Westbrook | 76 | 55 | 21 | |||
| Total Riding | 342 | 253 | 89 | |||
| WESTLAND COUNTY. | ||||||
| Riding of Arahura— | ||||||
| Arahura River | 15 | 7 | 8 | |||
| Back Lead | 8 | 6 | 2 | |||
| Ballarat Hill | 25 | 18 | 7 | |||
| Beal's Road, Auckland Beach | 27 | 24 | 3 | |||
| Big Dam | 13 | 9 | 4 | |||
| Blake's Terrace | 15 | 11 | 4 | |||
| Callaghan's | 39 | 23 | 14 | |||
| Callaghan's Falls | 3 | 3 | … | |||
| Cardigan | 7 | 5 | 2 | |||
| Chapel Terrace and Arahura Road | 51 | 34 | 17 | |||
| Chesterfield Road | 20 | 16 | 4 | |||
| Chickahominy Terrace | 27 | 18 | 9 | |||
| Christchurch Road | 178 | 126 | 52 | |||
| Dillman's, T. | 137 | 89 | 48 | |||
| Diilman's Road | 41 | 29 | 12 | |||
| Dillman's Town Lead | 32 | 27 | 5 | |||
| Drake's Terrace | 7 | 7 | … | |||
| Duffer's Gully | 5 | 4 | 1 | |||
| Dunedin Flat | 107 | 68 | 39 | |||
| Fox's | 35 | 28 | 7 | |||
| German Gully | 31 | 31 | … | |||
| Goldsborough, T. | 197 | 105 | 92 | |||
| Goldsborough Road | 99 | 71 | 28 | |||
| Greeks No. 1 | 3 | 3 | … | |||
| Greeks No. 2 | 16 | 13 | 3 | |||
| Greenstone Road | 74 | 52 | 22 | |||
| Hatter's Gully | 16 | 16 | … | |||
| Hokitika and Greymouth Road | 8 | 4 | 4 | |||
| Humpy's Terrace | 31 | 31 | … | |||
| Italian Flat | 8 | 8 | … | |||
| Italian Gully | 18 | 12 | 6 | |||
| Kapitea Creek | 12 | 6 | 6 | |||
| Lamplough, and Fourth, Fifth, and Sixth Terraces | 25 | 19 | 6 | |||
| Larrikins | 545 | 397 | 148 | |||
| Left Branch | 12 | 11 | 1 | |||
| Liverpool Bill's Gully | 37 | 29 | 8 | |||
| Maori Creek | 28 | 22 | 6 | |||
| Middle Branch, Waimea | 7 | 7 | … | |||
| Municipal Boundary | 67 | 30 | 37 | |||
| Old Greenstone Road | 60 | 31 | 29 | |||
| Old John's Road | 153 | 81 | 72 | |||
| Piper's Flat | 83 | 52 | 31 | |||
| Pretty Woman's Gully | 39 | 28 | 11 | |||
| Scandinavian Hill | 52 | 40 | 12 | |||
| Shallow Lead | 31 | 22 | 9 | |||
| Shamrock Terrace | 6 | 6 | … | |||
| Stafford, T. | 161 | 80 | 71 | |||
| Stewart's Terrace | 10 | 8 | 2 | |||
| Stoney Lead | 26 | 19 | 7 | |||
| Taipo Road | 7 | 7 | … | |||
| Teramakau Ferry | 13 | 7 | 6 | |||
| Toker's Terrace | 18 | 16 | 2 | |||
| Tunnel Terrace | 72 | 51 | 21 | |||
| Waimea Creek | 34 | 20 | 14 | |||
| Total Riding | 2,791 | 1,899 | 892 | |||
| Riding of Kanieri— | ||||||
| Arahura Road | 334 | 206 | 128 | |||
| Arch Creek | 7 | 7 | … | |||
| Arthur's Town | 94 | 58 | 36 | |||
| Back Creek | 12 | 9 | 3 | |||
| Big Paddock | 16 | 11 | 5 | |||
| Blue Spur Road | 106 | 65 | 41 | |||
| Blue Spur Track | 9 | 5 | 4 | |||
| Boucher's Gully | 11 | 11 | … | |||
| Brennan's Creek | 4 | 4 | … | |||
| Cement Hill | 5 | 2 | 3 | |||
| Christchurch Road | 97 | 51 | 46 | |||
| Duck Creek | 10 | 6 | 4 | |||
| German Gully | 5 | 5 | … | |||
| Greek's Gully | 11 | 11 | … | |||
| Hauhau | 58 | 33 | 25 | |||
| Hauhau to Brunner Creek | 6 | 6 | … | |||
| Homestead Block | 11 | 5 | 6 | |||
| Humphrey's Gully | 31 | 23 | 8 | |||
| Kanieri, T. | 132 | 71 | 61 | |||
| Kanieri Forks | 51 | 43 | 8 | |||
| Kanieri Road | 96 | 53 | 43 | |||
| Kanieri Tramway | 108 | 57 | 51 | |||
| Kokatahi Road | 95 | 45 | 50 | |||
| Macdonald's Gully | 3 | 3 | … | |||
| Mclntyre's Creek | 32 | 22 | 10 | |||
| One-Mile Road | 5 | 5 | … | |||
| Ross Road | 12 | 7 | 5 | |||
| South Beach | 11 | 6 | 5 | |||
| South Kokatahi River | 6 | 6 | … | |||
| Tucker's Flat Road | 29 | 22 | 7 | |||
| Upper Crossing, Arahura River | 43 | 31 | 12 | |||
| Upper Kokatahi | 41 | 26 | 15 | |||
| Woodstock, T. | 183 | 123 | 63 | |||
| Others | 12 | 12 | 2 | |||
| Total Riding | 1,691 | 1,050 | 641 | |||
| Riding of Totara— | ||||||
| Aylmer Lead | 11 | 10 | 1 | |||
| Bowen Road and Bowen | 61 | 33 | 28 | |||
| Branfield's Creek, Totara | 6 | 6 | … | |||
| Constitution Creek | 6 | 6 | … | |||
| Duffer's and Franklin's Creeks | 66 | 66 | … | |||
| Hatter's Creek, Totara | 8 | 7 | 1 | |||
| Head of Wanganui River | 4 | 4 | … | |||
| Hokitika Road, Totara River | 11 | 5 | 6 | |||
| Mikonui Beach | 12 | 7 | 5 | |||
| Ross Road | 7 | 4 | 3 | |||
| Sea-beach | 15 | 9 | 6 | |||
| Stoney Creek | 6 | 4 | 2 | |||
| Waitaha Beach | 9 | 6 | 3 | |||
| Wanganui Bluff | 2 | 2 | … | |||
| Woolhouse Road | 29 | 18 | 11 | |||
| Others | 13 | 13 | … | |||
| Total Riding | 266 | 200 | 66 | |||
| Riding of Okarito— | ||||||
| Abbey Rock | 2 | 2 | … | |||
| Blue River | 22 | 22 | … | |||
| Bruce Bay | 7 | 5 | 2 | |||
| Cook's River | 11 | 8 | 3 | |||
| Five-Mile Beach | 7 | 7 | … | |||
| Gillespie's Beach | 80 | 41 | 39 | |||
| Hunt's Beach | 15 | 13 | 2 | |||
| Karangaroa River | 3 | 2 | 1 | |||
| Mapourika Lake | 69 | 61 | 8 | |||
| Okarito | 61 | 40 | 21 | |||
| Okarito Flat | 13 | 8 | 5 | |||
| Okarito Forks | 18 | 18 | … | |||
| Paringa | 32 | 28 | 4 | |||
| Saltwater | 1 | 1 | … | |||
| Three-Mile Beach | 7 | 5 | 2 | |||
| Waiho River | 19 | 19 | … | |||
| Waikukupa River | 11 | 7 | 4 | |||
| Waitangi | 31 | 16 | 15 | |||
| Wanganui | 22 | 14 | 8 | |||
| Wataroa | 23 | 21 | 2 | |||
| Total Riding | 454 | 338 | 116 | |||
| Country, Riding, Town, Locality, and Road District. | Total. | M. | F. | |||
|---|---|---|---|---|---|---|
| WESTLAND COUNTY—continued. | ||||||
| Riding of Jackson's Bay— | ||||||
| Arawata | 20 | 8 | 12 | |||
| Arawata Flat | 59 | 35 | 24 | |||
| Arawata River | 2 | 2 | … | |||
| Big Bay | 4 | 4 | … | |||
| Bullock's Creek | 9 | 9 | … | |||
| Gorge River | 3 | 3 | … | |||
| Haast | 4 | 4 | … | |||
| Haast Beach | 17 | 14 | 3 | |||
| Maori River | 7 | 7 | … | |||
| Okuru River | 18 | 10 | 8 | |||
| Waitoto Settlement | 17 | 9 | 8 | |||
| Total Riding | 160 | 105 | 55 | |||
| Road District— | Total. | M. | F. | |||
| Kanieri | 1,364 | 836 | 528 | |||
| Outlying | 3,998 | 2,756 | 1,242 | |||
| AMURI COUNTY. | ||||||
| Riding of Tennyson— | ||||||
| Clarence | 27 | 24 | 3 | |||
| Five-Mile Flat | 7 | 5 | 2 | |||
| Highfield | 31 | 21 | 10 | |||
| Hopefield Station | 8 | 8 | … | |||
| Hanmer Plains | 11 | 9 | 2 | |||
| Leslie Station | 9 | 6 | 3 | |||
| Lyndon Station | 19 | 18 | 1 | |||
| Rogersou Valley | 7 | 3 | 4 | |||
| Sherwood | 2 | 2 | … | |||
| St. Helens | 30 | 24 | 6 | |||
| St. James | 17 | 15 | 2 | |||
| Stanley Vale | 18 | 9 | 9 | |||
| Tarndale | 27 | 25 | 2 | |||
| Upper Waiau (part) | 4 | 4 | … | |||
| Waiau, T. | 80 | 48 | 32 | |||
| Woodbank Station | 7 | 6 | 1 | |||
| Total Riding | 304 | 227 | 77 | |||
| Riding of Te Koa— | ||||||
| Achray | 20 | 13 | 7 | |||
| Balmoral | 14 | 12 | 2 | |||
| Calvadere Station | 23 | 16 | 7 | |||
| Hurunui | 28 | 21 | 7 | |||
| Montrose | 19 | 14 | 5 | |||
| Mount Pahau | 2 | 2 | … | |||
| Pahau | 22 | 17 | 5 | |||
| Rotherham | 31 | 19 | 12 | |||
| South Cape | 6 | 4 | 2 | |||
| St. Leonards | 14 | 12 | 2 | |||
| Te Koa | 16 | 9 | 7 | |||
| Upper Waiau (part) | 14 | 12 | 2 | |||
| Total Riding | 209 | 151 | 58 | |||
| Road District— | Total. | M. | F. | |||
| Amuri | 513 | 378 | 135 | |||
| CHEVIOT COUNTY. | ||||||
| Riding of Benmore— | ||||||
| Cheviot Hills | 50 | 34 | 16 | |||
| Total Riding | 50 | 34 | 16 | |||
| Riding of Hawkewood— | ||||||
| Hawkewood | 10 | 6 | 4 | |||
| Hawkewood District | 6 | 6 | … | |||
| Mendip Hills | 17 | 13 | 4 | |||
| Mount Prarnassus | 19 | 16 | 3 | |||
| Total Riding | 52 | 41 | 11 | |||
| Road District— | Total. | M. | F. | |||
| Cheviot | 102 | 75 | 27 | |||
| ASHLEY COUNTY. | ||||||
| Riding of Waipara— | ||||||
| Allendale | 8 | 4 | 4 | |||
| Cabbage Tree Flat | 30 | 25 | 5 | |||
| ASHLEY COUNTY—continued | ||||||
| Riding of Waipara—continued. | ||||||
| Derby | 5 | 3 | 2 | |||
| Esk Head Station | 4 | 4 | … | |||
| Foxdown | 15 | 9 | 6 | |||
| Glen Allen | 4 | 1 | 3 | |||
| Glenmark | 32 | 27 | 5 | |||
| Greta Peaks | 20 | 8 | 12 | |||
| Heathstock | 7 | 3 | 4 | |||
| Horsley Downs | 35 | 26 | 9 | |||
| Hurunui | 72 | 43 | 29 | |||
| Karaka Creek | 4 | 2 | 2 | |||
| Lake Station | 1 | 1 | … | |||
| Lake Sumner | 3 | 3 | … | |||
| Manuka | 26 | 9 | 17 | |||
| Mason's Flat | 68 | 41 | 27 | |||
| Motanau | 5 | 4 | 1 | |||
| Motanau River | 5 | 5 | … | |||
| Mount Serrat | 4 | 3 | 1 | |||
| Pendall Hill | 6 | 2 | 4 | |||
| Pyramid Valley | 16 | 8 | 8 | |||
| Stonyhurst | 8 | 7 | 1 | |||
| Teviotdale | 11 | 10 | 1 | |||
| Waikari | 173 | 118 | 55 | |||
| Waikari Valley | 60 | 37 | 23 | |||
| Waipara | 41 | 27 | 14 | |||
| Waitoki Gorge | 16 | 16 | … | |||
| Weka Pass | 33 | 20 | 13 | |||
| Total Riding | 712 | 466 | 246 | |||
| Riding of Mount Thomas— | ||||||
| Ashley Downs | 97 | 55 | 42 | |||
| Ashley Main Road | 64 | 38 | 26 | |||
| Ashley River-bed | 23 | 15 | 8 | |||
| Ashley, T. (part) | 21 | 12 | 9 | |||
| Brody's Road | 12 | 5 | 7 | |||
| Burker's Road | 27 | 15 | 12 | |||
| Can's Road | 17 | 9 | 8 | |||
| Erville Road | 5 | 3 | 2 | |||
| Fletcher Road | 5 | 3 | 2 | |||
| Glentui | 15 | 12 | 3 | |||
| Grey Valley | 7 | 6 | 1 | |||
| Hayland's | 25 | 17 | 8 | |||
| Hill's Bush | 7 | 5 | 2 | |||
| Kuku Pass | 22 | 22 | … | |||
| Loburn | 107 | 57 | 50 | |||
| Loburn North | 58 | 35 | 23 | |||
| Loburn Road | 11 | 6 | 5 | |||
| Makirikiri | 18 | 10 | 8 | |||
| Mount Thomas | 36 | 21 | 15 | |||
| Okuku | 20 | 13 | 7 | |||
| Okuku River-bed | 11 | 8 | 3 | |||
| Okuku Road | 24 | 13 | 11 | |||
| Raithby Road | 19 | 14 | 5 | |||
| River Grey | 26 | 14 | 12 | |||
| Roundhill | 55 | 9 | 16 | |||
| Sinclair Road | 6 | 1 | 5 | |||
| Wharfdale | 15 | 3 | 2 | |||
| White Rock Road | 21 | 11 | 10 | |||
| Others | 18 | 16 | 2 | |||
| Total Riding | 762 | 458 | 304 | |||
| Riding of Kowai— | ||||||
| Amberley, T., and vicinity | 764 | 398 | 366 | |||
| Ashley, T. (part) | 107 | 59 | 48 | |||
| Ashley Bank | 9 | 4 | 5 | |||
| Balcairn, T., and vicinity | 168 | 97 | 71 | |||
| Bloomfield Road | 30 | 16 | 14 | |||
| Braken Creek | 8 | 4 | 4 | |||
| Brakenfield | 13 | 10 | 3 | |||
| Broomfield | 26 | 12 | 14 | |||
| Brown's Bridge | 83 | 39 | 44 | |||
| Brumden | 22 | 13 | 9 | |||
| Douglas Road | 35 | 12 | 23 | |||
| Greney Road | 15 | 7 | 8 | |||
| Grey Road | 23 | 13 | 10 | |||
| Kowai | 37 | 18 | 19 | |||
| Kowai Forks | 12 | 5 | 7 | |||
| Leithfield, T. | 144 | 74 | 70 | |||
| Country, Riding, Town, Locality, and Road District. | Total. | M. | F. | |||
|---|---|---|---|---|---|---|
| ASHLEY COUNTY—continued. | ||||||
| Riding of Kowai—continued. | ||||||
| Marchman's Road | 72 | 36 | 36 | |||
| Mount Brown | 26 | 18 | 8 | |||
| Mount Grey | 73 | 48 | 25 | |||
| Mount Grey Downs | 257 | 140 | 117 | |||
| Mount Grey Road | 125 | 64 | 61 | |||
| Rangiora Road | 5 | 4 | 1 | |||
| Saltwater Creek | 69 | 37 | 32 | |||
| Sefton, T., and vicinity | 263 | 141 | 124 | |||
| Sefton Road | 123 | 69 | 54 | |||
| Springfield | 63 | 43 | 20 | |||
| Stony Creek | 10 | 5 | 5 | |||
| Terrace Road | 123 | 63 | 60 | |||
| Thistle Valley | 6 | 2 | 4 | |||
| Waipara Flat | 43 | 26 | 17 | |||
| Ward's Creek | 16 | 8 | 8 | |||
| Others | 8 | 4 | 4 | |||
| Total Riding | 2,780 | 1,489 | 1,291 | |||
| Riding of Cust— | ||||||
| Ashley | 64 | 35 | 29 | |||
| Boundary | 25 | 12 | 13 | |||
| Catherwood | 53 | 31 | 22 | |||
| Collier's | 9 | 5 | 4 | |||
| Cust, T. | 215 | 110 | 105 | |||
| Early's Road | 12 | 6 | 6 | |||
| McCullough's | 21 | 12 | 9 | |||
| Mill Row | 57 | 30 | 27 | |||
| Oxford (part) | 133 | 70 | 63 | |||
| Stoke Road | 22 | 10 | 12 | |||
| Terrace | 113 | 63 | 52 | |||
| Tramway | 12 | 5 | 7 | |||
| Wotherspon's | 61 | 33 | 28 | |||
| Others | 24 | 11 | 13 | |||
| Total Riding | 823 | 433 | 390 | |||
| Riding of West Eyreton— | ||||||
| Bennett's | 27 | 12 | 15 | |||
| Early's Road | 30 | 18 | 12 | |||
| Eyre Road South | 32 | 23 | 9 | |||
| Eyrewell | 24 | 14 | 10 | |||
| Horrellsville | 89 | 46 | 43 | |||
| Warlingham | 5 | 2 | 3 | |||
| West Eyreton | 178 | 88 | 90 | |||
| Total Riding | 385 | 203 | 182 | |||
| Riding of Eyreton— | ||||||
| Ashen's Road | 19 | 10 | 9 | |||
| Ashworth Road | 11 | 7 | 4 | |||
| Bailey's Road | 20 | 11 | 9 | |||
| Barker's Road | 14 | 8 | 6 | |||
| Bradley Road | 31 | 17 | 14 | |||
| Burgess Road | 17 | 10 | 7 | |||
| Cust Road | 9 | 3 | 6 | |||
| Drain Road | 43 | 24 | 19 | |||
| Eyreton, T. | 223 | 125 | 98 | |||
| Jackson's Road | 38 | 29 | 29 | |||
| Jeff's Drain Road | 60 | 35 | 25 | |||
| Kaiapoi and Ohoka Road | 21 | 15 | 6 | |||
| Kaiapoi Island | 428 | 249 | 79 | |||
| Laing's Island | 11 | 8 | 3 | |||
| McHugh's Road | 16 | 11 | 5 | |||
| Mill Road | 70 | 39 | 31 | |||
| Moody's Road | 10 | 8 | 2 | |||
| North Eyre Road | 59 | 34 | 25 | |||
| Ohoka Road | 41 | 23 | 18 | |||
| Oxford and Ohoka Road | 162 | 81 | 81 | |||
| Rangiora and Oxford Road | 12 | 6 | 6 | |||
| Smith's Road | 11 | 8 | 3 | |||
| Sneyd's Street | 143 | 69 | 74 | |||
| Thirkeld's Road | 13 | 8 | 5 | |||
| Tram-road | 54 | 29 | 25 | |||
| Two-Chain Road | 38 | 21 | 17 | |||
| White's Road | 32 | 20 | 12 | |||
| Others | 14 | 7 | 7 | |||
| Total Riding | 1,640 | 915 | 725 | |||
| Riding of Mandeville and Rangiora— | ||||||
| Ashley Bank | 10 | 6 | 4 | |||
| Beach Road | 38 | 20 | 18 | |||
| Cam Mill | 67 | 29 | 38 | |||
| Cam Road | 5 | 4 | 1 | |||
| Camside | 101 | 54 | 47 | |||
| Church Bush | 39 | 21 | 18 | |||
| Close Road | 5 | 2 | 3 | |||
| Coldstream | 34 | 17 | 17 | |||
| Dalziell's Road | 27 | 15 | 12 | |||
| Fernside, T. | 293 | 187 | 136 | |||
| Flaxton | 199 | 108 | 91 | |||
| Harrison Bridge | 11 | 6 | 5 | |||
| Kaiapoi and Ashley Road | 24 | 8 | 16 | |||
| Maori Run | 74 | 35 | 39 | |||
| Mount Thomas Road | 27 | 18 | 9 | |||
| Northbrook | 32 | 16 | 16 | |||
| North Road | 79 | 40 | 39 | |||
| Oxford Road | 129 | 74 | 55 | |||
| Rangiora | 163 | 78 | 85 | |||
| Rangiora (West Belt) | 10 | 3 | 7 | |||
| Revell's Road | 16 | 8 | 8 | |||
| Southbrook, T. | 352 | 193 | 159 | |||
| Southbrook Road | 38 | 22 | 16 | |||
| Stoke Grange | 77 | 41 | 36 | |||
| Swamp | 45 | 26 | 19 | |||
| Waimakariri Bar | 6 | 5 | 1 | |||
| Waikuku | 142 | 78 | 64 | |||
| Woodend, T. | 547 | 283 | 264 | |||
| Woodend Road | 16 | 10 | 6 | |||
| Others | 30 | 15 | 15 | |||
| Total Riding | 2,636 | 1,392 | 1,244 | |||
| Riding of Oxford— | ||||||
| Bush Road | 259 | 135 | 124 | |||
| Carleton Village | 162 | 82 | 80 | |||
| Oxford and Rangiora Main Road | 284 | 149 | 135 | |||
| Oxford, T., and part vicinity | 1,469 | 793 | 676 | |||
| Upper Waimakariri | 17 | 17 | … | |||
| Waimakariri Gorge | 26 | 15 | 11 | |||
| Total Riding | 2,217 | 1,191 | 1,026 | |||
| Road District— | Total. | M. | F. | |||
| Ashley | 762 | 460 | 302 | |||
| Cust | 823 | 433 | 390 | |||
| Eyreton | 1,640 | 915 | 725 | |||
| Eyreton West | 383 | 203 | 182 | |||
| Kowai | 2,780 | 1,489 | 1,291 | |||
| Mandeville and Rangiora | 2,636 | 1,393 | 1,243 | |||
| Oxford | 2,200 | 1,170 | 1,030 | |||
| Upper Waimakariri, part of (see Selwyn) | 17 | 17 | … | |||
| Waipara | 712 | 467 | 245 | |||
| AKAROA COUNTY. | ||||||
| Riding of Port Victoria— | ||||||
| Charters Bay | 47 | 24 | 23 | |||
| Church Gully | 16 | 11 | 5 | |||
| Governor's Bay | 184 | 95 | 89 | |||
| Head of the Bay | 104 | 57 | 47 | |||
| Quail Island | 3 | 1 | 2 | |||
| Total Riding | 354 | 188 | 166 | |||
| Riding of Port Levy— | ||||||
| Church Gully | 3 | 1 | 2 | |||
| Dawson's Valley | 58 | 38 | 20 | |||
| Diamond Harbour | 19 | 11 | 8 | |||
| Flemming's Valley | 22 | 14 | 8 | |||
| Glen Albert Valley | 20 | 12 | 8 | |||
| Monument Hill | 8 | 5 | 3 | |||
| Pilot-station | 9 | 5 | 4 | |||
| Purau | 36 | 21 | 15 | |||
| Ripa Island | 2 | 2 | … | |||
| Wild Cattle Hill | 12 | 7 | 5 | |||
| Total Riding | 189 | 116 | 73 | |||
| Country, Riding, Town, Locality, and Road District. | Total. | M. | F. | |||
|---|---|---|---|---|---|---|
| AKAROA COUNTY—continual. | ||||||
| Riding of Pigeon Bay— | ||||||
| Holmes Valley and West Pigeon Bay Heads | 61 | 34 | 27 | |||
| Kay's Valley | 38 | 19 | 19 | |||
| Mackintosh Bay and East Pigeon Bay Heads | 27 | 16 | 11 | |||
| Main Valley | 214 | 115 | 99 | |||
| Total Riding | 340 | 184 | 156 | |||
| Riding of Wainui— | ||||||
| Barry Bay Valley | 111 | 59 | 52 | |||
| Bossu | 22 | 10 | 12 | |||
| French Farm Valley | 82 | 51 | 31 | |||
| Little River (part) | 21 | 13 | 8 | |||
| Little River Road | 26 | 16 | 10 | |||
| Old French Farm | 40 | 24 | 10 | |||
| Old Pigeon Bay | 7 | 5 | 2 | |||
| Wainui Road | 28 | 15 | 13 | |||
| Wainui Valley | 114 | 54 | 60 | |||
| Total Riding | 451 | 247 | 204 | |||
| Riding of Berard— | ||||||
| Aylmer's Valley | 34 | 17 | 17 | |||
| Balgurie | 15 | 8 | 7 | |||
| Bell's | 10 | 5 | 5 | |||
| Duvauchelle's Bay | 111 | 64 | 47 | |||
| East Head | 23 | 13 | 10 | |||
| Flea Bay | 23 | 19 | 4 | |||
| German Bay and Akaroa | 51 | 26 | 25 | |||
| German Bay Valley | 41 | 19 | 22 | |||
| Grehan Valley | 104 | 55 | 49 | |||
| Haylock's | 4 | 4 | … | |||
| Le Bon's | 27 | 14 | 13 | |||
| Long Bay | 91 | 48 | 43 | |||
| Okain's | 14 | 9 | 5 | |||
| Okain's Road | 12 | 8 | 4 | |||
| Old Okain's | 8 | 5 | 3 | |||
| Onuku | 85 | 42 | 43 | |||
| Pawson's Valley | 63 | 29 | 34 | |||
| Pigeon Bay | 28 | 13 | 15 | |||
| Piper's Valley | 41 | 25 | 16 | |||
| Purple Peak | 17 | 9 | 8 | |||
| Robinson's Bay | 37 | 25 | 12 | |||
| Robinson's Valley | 82 | 41 | 41 | |||
| Stoney Bay | 6 | 1 | 5 | |||
| Waikerakakira | 62 | 44 | 18 | |||
| Woodhills | 24 | 13 | 11 | |||
| Others | 14 | 7 | 7 | |||
| Total Riding | 1,027 | 563 | 464 | |||
| Riding of Le Bon's— | ||||||
| Lavcrick Bay | 21 | 13 | 8 | |||
| Le Bon's Bay, T. | 224 | 119 | 105 | |||
| Okain's Bay, T. | 143 | 79 | 64 | |||
| Total Riding | 388 | 211 | 177 | |||
| Riding of Okain's Bay— | ||||||
| Little Akaloa | 229 | 121 | 108 | |||
| Okain's. Bay | 104 | 58 | 46 | |||
| Total Riding | 333 | 179 | 154 | |||
| Riding of Little River— | ||||||
| Kaituna | 75 | 50 | 25 | |||
| Little River (part) | 414 | 246 | 168 | |||
| Total Riding | 489 | 296 | 193 | |||
| Riding of Tai Tapu— | ||||||
| Big Bay | 8 | 8 | … | |||
| Gebbie's Valley | 101 | 57 | 44 | |||
| McQuin's Bay | 45 | 22 | 23 | |||
| Tai Tapu (part) | 295 | 169 | 126 | |||
| Total Riding | 449 | 256 | 193 | |||
| Road Districts— | Total. | M. | F. | |||
| Akaroa and Wainui | 1,478 | 810 | 668 | |||
| Little River | 938 | 552 | 386 | |||
| Okain's Bay | 721 | 390 | 331 | |||
| Pigeon Bay | 340 | 184 | 156 | |||
| Port Levy | 189 | 116 | 73 | |||
| Port Victoria | 354 | 158 | 166 | |||
| SELWYN COUNTY. | ||||||
| Riding of Avon— | ||||||
| Addington (part) | 438 | 228 | 210 | |||
| Aikman's Road | 97 | 52 | 45 | |||
| Avonside (part) | 105 | 44 | 61 | |||
| Barker Street | 50 | 26 | 24 | |||
| Bealey Road | 22 | 15 | 7 | |||
| Berry Street | 84 | 44 | 40 | |||
| Bingsland | 1,174 | 578 | 596 | |||
| Blyth's Road | 11 | 6 | 5 | |||
| Bottle Lake | 12 | 8 | 4 | |||
| Bottle Lake Road | 50 | 27 | 23 | |||
| Buchanan's Road | 47 | 30 | 17 | |||
| Caledonian Road | 299 | 150 | 149 | |||
| Canal Reserve (part) | 33 | 13 | 20 | |||
| Carleton | 340 | 161 | 179 | |||
| Carleton Place | 91 | 47 | 44 | |||
| Cemetery Reserve vicinity | 5 | 3 | 2 | |||
| Cemetery Road | 7 | 1 | 6 | |||
| Church Road | 51 | 27 | 24 | |||
| Clare Road | 126 | 65 | 61 | |||
| Colombo Street | 216 | 102 | 114 | |||
| Crescent Road | 340 | 170 | 170 | |||
| Dawson's Road | 9 | 7 | 2 | |||
| Dudley Creek Road | 38 | 2 | 16 | |||
| Edgeware Road | 101 | 53 | 48 | |||
| Factory Road | 15 | 6 | 9 | |||
| Fendalton | 342 | 166 | 176 | |||
| Fendalton Road | 20 | 9 | 11 | |||
| Fisher's Road | 51 | 22 | 29 | |||
| Free Road | 16 | 11 | 5 | |||
| Gallikey's Road | 10 | 6 | 4 | |||
| Gilberthorpe's | 26 | 2 | 14 | |||
| Gray's Road | 9 | 4 | 5 | |||
| Great South Road | 15 | 7 | 8 | |||
| Harewood Road | 528 | 292 | 236 | |||
| Haskett's Road | 24 | 11 | 13 | |||
| Hawkins Road | 15 | 9 | 6 | |||
| Hawthorne Road | 8 | 4 | 4 | |||
| High Street | 196 | 91 | 105 | |||
| Hill's Road | 174 | 89 | 85 | |||
| Holly Road | 39 | 20 | 19 | |||
| Hornby | 27 | 15 | 12 | |||
| Horseshoe Lake Farm | 5 | 4 | 1 | |||
| Innes Road | 32 | 15 | 17 | |||
| Jeff's Road | 21 | 11 | 10 | |||
| Junction Road | 63 | 40 | 23 | |||
| Leinster Road | 78 | 45 | 33 | |||
| Lincoln Road (part) | 323 | 194 | 131 | |||
| Maddison's Road | 37 | 20 | 17 | |||
| Merivale | 302 | 141 | 161 | |||
| Middle Park | 14 | 6 | 8 | |||
| New Brighton Road (part) | 88 | 58 | 30 | |||
| Norman Road and vicinity | 53 | 24 | 29 | |||
| North Belt | 121 | 58 | 63 | |||
| North Road (Papanui) | 508 | 266 | 242 | |||
| North Street | 277 | 142 | 135 | |||
| Office Road | 84 | 40 | 44 | |||
| Papanui | 667 | 344 | 323 | |||
| Papanui Road | 449 | 202 | 247 | |||
| Papanui vicinity | 118 | 61 | 57 | |||
| Park Road | 26 | 61 | 57 | |||
| Pilot Station | 8 | 3 | 5 | |||
| Pound Road | 64 | 32 | 32 | |||
| Racecourse Road | 33 | 22 | 11 | |||
| Rhodes Swamp | 55 | 32 | 23 | |||
| Riccarton | 655 | 314 | 341 | |||
| Riccarton Road | 23 | 14 | 9 | |||
| Riccarton Upper | 269 | 134 | 135 | |||
| Rickman's Road | 6 | 4 | 2 | |||
| Riverbed | 35 | 20 | 15 | |||
| Country, Riding, Town, Locality, and Road District. | Total. | M. | F. | |||
|---|---|---|---|---|---|---|
| SELWYN COUNTY—continued. | ||||||
| Riding of Avon—continued. | ||||||
| Sandhills (Waimakiriri) | 64 | 31 | 33 | |||
| School Road | 9 | 3 | 6 | |||
| Shirley Road | 52 | 31 | 21 | |||
| Shirley Village | 394 | 203 | 191 | |||
| Sinclair's Road | 3 | 3 | … | |||
| South Road | 16 | 9 | 7 | |||
| Spit | 9 | 5 | 4 | |||
| Spreydon (part) | 273 | 142 | 131 | |||
| Springfield Road | 245 | 120 | 125 | |||
| St. Albans | 500 | 242 | 258 | |||
| Styx | 37 | 20 | 17 | |||
| Styx River | 31 | 16 | 15 | |||
| Templeton | 92 | 47 | 45 | |||
| Waimakiriri Estuary | 3 | 4 | 1 | |||
| West Coast Road | 92 | 57 | 35 | |||
| Yaldhurst | 76 | 44 | 32 | |||
| Total Riding | 1,575 | 5,888 | 5,687 | |||
| Riding of Heathcote— | ||||||
| Addington (part) | 633 | 308 | 325 | |||
| Armagh Street East | 77 | 30 | 47 | |||
| Ashbourne | 572 | 300 | 272 | |||
| Avonside (part) | 202 | 106 | 96 | |||
| Avonville, T. | 401 | 201 | 200 | |||
| Buckley's Road | 11 | 4 | 7 | |||
| Canal Reserve (part) | 88 | 51 | 37 | |||
| Canal Road | 13 | 7 | 6 | |||
| Cashel Street East | 187 | 85 | 102 | |||
| Cashmere | 68 | 42 | 26 | |||
| Colombo Road | 9 | 3 | 6 | |||
| Duncan Road | 43 | 20 | 23 | |||
| East Belt | 124 | 66 | 58 | |||
| Estuary | 54 | 33 | 21 | |||
| Ferry Road | 52 | 23 | 29 | |||
| Foot of Hills | 69 | 37 | 32 | |||
| Gloucester Street East | 183 | 91 | 92 | |||
| Glover's Road | 8 | 5 | 3 | |||
| Godley Head | 10 | 6 | 4 | |||
| Gordon Street | 186 | 80 | 106 | |||
| Halswell | 337 | 184 | 153 | |||
| Heathcote Valley | 329 | 175 | 154 | |||
| Hereford Street | 188 | 92 | 96 | |||
| Hill Road | 5 | 3 | 2 | |||
| Hillsborough | 324 | 163 | 161 | |||
| Hoon Hay | 25 | 16 | 9 | |||
| Lansdown | 30 | 15 | 15 | |||
| Lincoln Road (part) | 326 | 168 | 158 | |||
| Linwood, T. | 316 | 153 | 163 | |||
| Low Flat Road | 41 | 27 | 14 | |||
| Matheson's Road | 124 | 64 | 60 | |||
| Mount Pleasant | 10 | 5 | 5 | |||
| New Brighton Road (part) | 75 | 36 | 39 | |||
| New Cambridge Town | 266 | 138 | 128 | |||
| Nursery Road | 62 | 31 | 31 | |||
| Ollivier Road | 49 | 24 | 25 | |||
| Opawa | 427 | 213 | 214 | |||
| Opawa North | 436 | 201 | 235 | |||
| Percy Street | 25 | 14 | 11 | |||
| Philipstown | 969 | 470 | 499 | |||
| Quarry Road | 58 | 33 | 25 | |||
| Rosengrave's Gully | 6 | 5 | 1 | |||
| Sandhills | 93 | 55 | 38 | |||
| School Road | 11 | 3 | 8 | |||
| Slaughterhouse Road | 49 | 23 | 26 | |||
| Spreydon (part) | 214 | 118 | 96 | |||
| St. Martins | 254 | 133 | 121 | |||
| Stanmore Road South | 136 | 69 | 67 | |||
| Strickland Street | 70 | 35 | 35 | |||
| Sumner Township | 326 | 152 | 174 | |||
| Sutherland's Road | 24 | 13 | 11 | |||
| Tai Tapu (part) | 9 | 5 | 4 | |||
| Tram-road | 8 | 3 | 5 | |||
| Woolston Village | 891 | 483 | 408 | |||
| Worcester Street East | 126 | 57 | 69 | |||
| Others | 12 | 4 | 8 | |||
| Total Riding | 9,641 | 4,881 | 4,760 | |||
| Riding of Lincoln— | ||||||
| Bethel's Road | 27 | 12 | 15 | |||
| Broad Fields | 31 | 16 | 15 | |||
| Burnham | 24 | 17 | 7 | |||
| Church Road | 59 | 29 | 30 | |||
| Coal Tram-road | 25 | 11 | 14 | |||
| Corbett's Road | 21 | 11 | 10 | |||
| Dunford Road | 23 | 14 | 9 | |||
| Ellesmere Road | 118 | 70 | 48 | |||
| Ellesmere Road Station | 10 | 4 | 6 | |||
| Elston Road | 3 | 2 | 1 | |||
| Gould's Road | 54 | 27 | 27 | |||
| Great South Road | 19 | 9 | 10 | |||
| Greenpark | 285 | 152 | 133 | |||
| Halswell Road | 42 | 20 | 22 | |||
| Kimes Road | 27 | 14 | 13 | |||
| Leeston Road | 83 | 43 | 40 | |||
| Leigh's Road | 12 | 6 | 6 | |||
| Lincoln, T. | 429 | 227 | 202 | |||
| Maddison's Road | 49 | 22 | 27 | |||
| Marshall's Road | 6 | 3 | 3 | |||
| Old Selwyn Road | 19 | 12 | 7 | |||
| Prebbleton | 306 | 157 | 149 | |||
| Prebbleton and Halswell Road | 68 | 37 | 31 | |||
| Prebbleton and Lincoln Road | 106 | 59 | 47 | |||
| Rolleston | 62 | 38 | 24 | |||
| Saunders Road | 80 | 46 | 34 | |||
| Selwyn (part) | 21 | 12 | 9 | |||
| Shand's Road | 244 | 143 | 101 | |||
| South Road | 139 | 70 | 69 | |||
| Springs Road | 94 | 52 | 42 | |||
| Springston | 349 | 175 | 174 | |||
| Swamp Road | 20 | 11 | 9 | |||
| Tai Tapu (part) | 14 | 9 | 5 | |||
| Tancred Road | 11 | 4 | 7 | |||
| Templeton and Halswell Road | 18 | 10 | 8 | |||
| Tramway-road | 150 | 81 | 69 | |||
| Waterhole Road | 133 | 78 | 55 | |||
| Weedon and Ellesmere Road | 42 | 22 | 20 | |||
| Others | 38 | 23 | 15 | |||
| Total Riding | 3,261 | 1,748 | 1,513 | |||
| Riding of Ellesmere— | ||||||
| Adams Road | 19 | 10 | 9 | |||
| Beetham's Road | 8 | 3 | 5 | |||
| Black's Road | 32 | 20 | 12 | |||
| Boag's Road | 59 | 32 | 27 | |||
| Branch Drain Road | 12 | 7 | 5 | |||
| Brookside | 145 | 70 | 75 | |||
| Cant's Road | 12 | 6 | 6 | |||
| Carroll's Road | 43 | 24 | 19 | |||
| Cooper's Road (Killinchy) | 14 | 11 | 3 | |||
| Cree's Road (Leeston) | 36 | 18 | 18 | |||
| Cryer's Road | 84 | 39 | 45 | |||
| Doyleston | 199 | 105 | 94 | |||
| Drain Road | 177 | 104 | 73 | |||
| Dunsandel | 98 | 61 | 37 | |||
| Dunsandel vicinity | 53 | 30 | 23 | |||
| Dunsandel Road | 25 | 13 | 12 | |||
| Fereday's Road | 69 | 45 | 24 | |||
| Harman's Road | 180 | 94 | 86 | |||
| Hart's Road | 14 | 5 | 9 | |||
| Hill's Road | 8 | 6 | 2 | |||
| Inwood's Road | 48 | 32 | 16 | |||
| Irwell | 109 | 67 | 42 | |||
| Irwell Road | 47 | 24 | 23 | |||
| Jollie's Road | 119 | 59 | 60 | |||
| Killinchy | 211 | 121 | 90 | |||
| Killinchy Upper | 127 | 70 | 57 | |||
| Killinchy Road | 107 | 56 | 51 | |||
| Lake Flat | 67 | 42 | 25 | |||
| Lake Road | 49 | 30 | 19 | |||
| Leeston, T. | 331 | 164 | 167 | |||
| Leeston Road | 43 | 25 | 18 | |||
| Leeston and Southbridge Road | 18 | 9 | 9 | |||
| Little Rakaia | 104 | 47 | 57 | |||
| Lockhead's Road | 30 | 17 | 13 | |||
| Lower Lake Road | 114 | 60 | 54 | |||
| Country, Riding, Town, Locality, and Road District. | Total. | M. | F. | |||
|---|---|---|---|---|---|---|
| SELWYN COUNTY—continued. | ||||||
| Riding of Ellesmere—continued. | ||||||
| Main Road (Leeston) | 55 | 27 | 28 | |||
| McConnell's Road | 18 | 9 | 9 | |||
| North Rakaia Road | 55 | 27 | 28 | |||
| Rakaia Road | 49 | 26 | 23 | |||
| Ridge Road | 102 | 55 | 47 | |||
| Selwyn (part) | 66 | 39 | 27 | |||
| Selwyn and Bealey Road | 3 | 1 | 2 | |||
| Selwyn and Lake Road | 113 | 61 | 52 | |||
| Selwyn and Rakaia Road | 56 | 28 | 28 | |||
| South Road | 11 | 8 | 3 | |||
| Southbridge, T. | 634 | 341 | 293 | |||
| Stony Gully | 21 | 11 | 10 | |||
| Tabling's Road | 39 | 21 | 18 | |||
| Taumutu | 13 | 7 | 6 | |||
| Taumutu Road | 130 | 75 | 55 | |||
| Tramway | 138 | 73 | 65 | |||
| Total Riding | 4,314 | 2,335 | 1,979 | |||
| Riding of Courtenay— | ||||||
| Aylesbury | 81 | 48 | 33 | |||
| Bealey Road (part) | 3 | 2 | 1 | |||
| Bleakhouse Road | 7 | 4 | 3 | |||
| Burnham | 251 | 166 | 85 | |||
| Cheyne's Road | 29 | 18 | 11 | |||
| Courtenay | 195 | 110 | 85 | |||
| Darfield | 60 | 40 | 20 | |||
| Essenden Road | 19 | 12 | 7 | |||
| Greendale | 352 | 212 | 140 | |||
| Halkett | 167 | 98 | 69 | |||
| Hawkins | 56 | 37 | 19 | |||
| Hawkins Road | 12 | 8 | 4 | |||
| Homebush Road (part) | 16 | 11 | 5 | |||
| Kimberley | 119 | 66 | 53 | |||
| Kirwee and vicinity | 165 | 95 | 70 | |||
| Kirwee Road | 60 | 35 | 25 | |||
| Racecourse Hill | 47 | 31 | 10 | |||
| Rolleston (part) | 111 | 69 | 42 | |||
| Selwyn (part) | 22 | 15 | 7 | |||
| Tramway Road | 38 | 20 | 18 | |||
| Waireka | 13 | 10 | 3 | |||
| Weedon | 137 | 80 | 57 | |||
| West Coast Road (part) | 41 | 27 | 14 | |||
| West Melton | 294 | 167 | 127 | |||
| Total Riding | 2,295 | 1,381 | 914 | |||
| Riding of Malvern— | ||||||
| Ayers Road | 12 | 6 | 6 | |||
| Bryden's Road | 7 | 4 | 3 | |||
| Butterfield Road | 11 | 4 | 7 | |||
| Canterbury Colliery Road | 4 | 3 | 1 | |||
| Chapel Road | 12 | 9 | 3 | |||
| Coalgate, T. | 40 | 20 | 20 | |||
| Dalethorpe and Kowai Road | 31 | 20 | 11 | |||
| Dalethorpe Road | 90 | 48 | 42 | |||
| Glentunnel | 116 | 62 | 54 | |||
| Homebush Road (part) | 45 | 30 | 15 | |||
| Kowai Bush Road | 82 | 51 | 31 | |||
| Kowai Pass | 144 | 77 | 67 | |||
| Lower Bush Road | 20 | 13 | 7 | |||
| McCann's Road | 43 | 24 | 19 | |||
| Pig-Saddle Road | 51 | 22 | 29 | |||
| Popple's Road | 17 | 7 | 10 | |||
| Racecourse Hill Road | 58 | 31 | 27 | |||
| Roecombe Road | 13 | 8 | 5 | |||
| Rolleston Road | 15 | 12 | 3 | |||
| Rubicon Road | 14 | 5 | 9 | |||
| Sear's Road | 19 | 11 | 8 | |||
| Selwyn Valley Road | 22 | 13 | 9 | |||
| Sheffield, T. | 152 | 91 | 61 | |||
| South Malvern Hills Road | 37 | 22 | 15 | |||
| Springfield | 480 | 276 | 204 | |||
| Springfield Road | 24 | 11 | 13 | |||
| Waddington | 146 | 80 | 66 | |||
| Waimakiriri Road | 12 | 9 | 3 | |||
| Wallace's Road | 21 | 11 | 10 | |||
| West Coast Road (part) | 163 | 86 | 77 | |||
| White Cliffs | 187 | 109 | 78 | |||
| Total Riding | 2,088 | 1,175 | 913 | |||
| Riding of Coleridge— | ||||||
| Copper Creek | 5 | 5 | … | |||
| Dunsandel (part) | 56 | 37 | 19 | |||
| Dunsandel vicinity (part) | 187 | 106 | 81 | |||
| Glenthorne | 8 | 2 | 6 | |||
| High Peak | 6 | 4 | 2 | |||
| Hororata | 231 | 134 | 97 | |||
| Hororata Downs | 124 | 70 | 54 | |||
| Lake Coleridge | 19 | 15 | 4 | |||
| Lake Lyndon (part) | 11 | 11 | … | |||
| Lake Selfe | 12 | 12 | … | |||
| Lower Ferry | 12 | 6 | 6 | |||
| Mount Algiers | 18 | 16 | 2 | |||
| North Rakaia Plains | 87 | 57 | 30 | |||
| Rakaia Terrace | 39 | 25 | 14 | |||
| Rockwood | 7 | 5 | 2 | |||
| Selwyn (part) | 30 | 15 | 15 | |||
| Selwyn Forks | 35 | 20 | 15 | |||
| Snowdon | 30 | 24 | 6 | |||
| The Point | 7 | 3 | 4 | |||
| Wairiri Valley | 32 | 16 | 16 | |||
| White Cliffs vicinity | 20 | 19 | 1 | |||
| Windwhistle | 18 | 17 | 1 | |||
| Woolshed Hill | 38 | 30 | 8 | |||
| Others | 11 | 10 | 1 | |||
| Total Riding | 1,043 | 659 | 384 | |||
| Riding of Upper Waimakiriri— | ||||||
| Bealey | 45 | 31 | 14 | |||
| Cass | 24 | 20 | 4 | |||
| Castlehill | 16 | 11 | 5 | |||
| Craigieburn | 17 | 15 | 2 | |||
| Lake Lyndon (part) | 4 | 4 | … | |||
| Total Riding | 106 | 81 | 25 | |||
| Road Districts— | Total. | M. | F. | |||
| Avon | 7,689 | 3,835 | 3,854 | |||
| Courtenay | 3,295 | 1,381 | 914 | |||
| Ellesmere | 4,304 | 2,335 | 1,979 | |||
| Halswell | 407 | 225 | 182 | |||
| Heathcote | 7,864 | 3,954 | 3,910 | |||
| Lake Coleridge | 241 | 185 | 56 | |||
| Lincoln | 1,557 | 851 | 706 | |||
| Malvern | 1,094 | 607 | 487 | |||
| Malvern East | 553 | 315 | 238 | |||
| Malvern South | 441 | 253 | 188 | |||
| Rakaia | 802 | 474 | 338 | |||
| Riccarton | 3,687 | 1,395 | 1,293 | |||
| Spreydon | 1,639 | 835 | 803 | |||
| Springs | 1,704 | 891 | 807 | |||
| Templeton | 930 | 524 | 406 | |||
| Upper Waimakariri, part of (see Ashley) | 106 | 81 | 25 | |||
| ASHBURTON COUNTY. | ||||||
| Riding of Lower Ashburton— | ||||||
| Beach Road | 162 | 94 | 68 | |||
| Bell's Road | 61 | 43 | 18 | |||
| Boundary Road | 56 | 37 | 19 | |||
| Bruce's Road | 68 | 35 | 33 | |||
| Butterick's Road | 22 | 16 | 6 | |||
| Cambridge | 7 | 5 | 2 | |||
| Chatmoss Road | 25 | 13 | 12 | |||
| Christie's Road | 9 | 5 | 4 | |||
| Cochrane's Road | 61 | 36 | 25 | |||
| Coldstream | 28 | 27 | 1 | |||
| Crow's Road | 12 | 6 | 6 | |||
| Dawson's Road | 43 | 24 | 19 | |||
| Denshire Road | 10 | 5 | 5 | |||
| Dromore (part) | 32 | 24 | 8 | |||
| Dromore Road | 16 | 12 | 4 | |||
| Dundas | 16 | 8 | 8 | |||
| Fitzgerald's Road | 23 | 14 | 9 | |||
| Ford's Road | 200 | 101 | 99 | |||
| Country, Riding, Town, Locality, and Road District. | Total. | M. | F. | |||
|---|---|---|---|---|---|---|
| ASHBURTON COUNTY—continued. | ||||||
| Riding of Lower Ashburton—continued. | ||||||
| Gibson's Road | 53 | 26 | 27 | |||
| Graham's Road | 129 | 83 | 46 | |||
| Great South Road | 12 | 7 | 5 | |||
| Hampstead | 68 | 34 | 34 | |||
| Hindhope | 63 | 38 | 25 | |||
| Innes Road | 8 | 4 | 4 | |||
| Islesworth Station | 10 | 10 | … | |||
| Ledley's Road | 48 | 27 | 21 | |||
| Longbeach Road | 65 | 34 | 31 | |||
| Longbeach Station | 93 | 54 | 39 | |||
| Lowcliff Station | 19 | 18 | 1 | |||
| Lower Beach Road | 112 | 59 | 53 | |||
| Newland's | 37 | 18 | 19 | |||
| Pioneer Road | 7 | 5 | 2 | |||
| Princes Street | 51 | 28 | 23 | |||
| Rangitata (part) | 28 | 21 | 7 | |||
| River Road | 24 | 13 | 11 | |||
| Seafield | 73 | 47 | 28 | |||
| Seafield Road | 33 | 16 | 17 | |||
| Smithfield Road | 17 | 7 | 10 | |||
| Tinwald, T. (part) | 241 | 111 | 130 | |||
| Town Belt East | 219 | 98 | 121 | |||
| Town Belt North-East | 95 | 46 | 49 | |||
| Treverton | 218 | 101 | 117 | |||
| Wakanui Creek | 12 | 8 | 4 | |||
| Wakanui Road | 146 | 77 | 69 | |||
| Waterton Road | 22 | 12 | 10 | |||
| Waterton, T. | 89 | 42 | 47 | |||
| Wheatstone, T. | 54 | 33 | 21 | |||
| Wilson's Road | 27 | 13 | 14 | |||
| Windermere | 27 | 16 | 11 | |||
| Winslow (part) | 53 | 29 | 24 | |||
| Winter's Road (part) | 33 | 21 | 12 | |||
| Wix Road | 20 | 11 | 9 | |||
| Others | 19 | 12 | 7 | |||
| Total Riding | 3,078 | 1,684 | 1,394 | |||
| Riding of South Rakaia— | ||||||
| Alford Forest Road (part) | 6 | 5 | 1 | |||
| Barrhill, T. | 83 | 42 | 41 | |||
| Barrhill vicinity | 71 | 63 | 8 | |||
| Baxter Road | 7 | 4 | 3 | |||
| Belmont | 14 | 11 | 3 | |||
| Boundary Road | 30 | 37 | 13 | |||
| Bridge Road | 11 | 9 | 2 | |||
| Bushey Park Road | 47 | 34 | 13 | |||
| Cairnbrae | 39 | 28 | 11 | |||
| Chertsey, T. | 63 | 44 | 19 | |||
| Chertsey vicinity | 42 | 37 | 5 | |||
| Corwar | 9 | 5 | 4 | |||
| Drayton | 7 | 4 | 3 | |||
| Duncan's Road | 14 | 8 | 6 | |||
| Edwards Road | 19 | 17 | 2 | |||
| Great South Road | 32 | 15 | 17 | |||
| Highbank Road | 7 | 7 | … | |||
| Kyle and vicinity | 82 | 61 | 21 | |||
| Kyle Road | 45 | 34 | 11 | |||
| Lambie's Road vicinity | 6 | 3 | 3 | |||
| Lauriston | 34 | 31 | 3 | |||
| Lavington | 35 | 25 | 10 | |||
| Lyndhurst | 99 | 76 | 23 | |||
| Main Rakaia Road | 16 | 9 | 7 | |||
| Mainwaring Road | 22 | 17 | 5 | |||
| Methven, T. | 119 | 70 | 49 | |||
| Methven vicinity (part) | 94 | 82 | 12 | |||
| Mitcham | 61 | 47 | 14 | |||
| Mount Harding | 11 | 10 | 1 | |||
| Mount Hutt | 6 | 5 | 1 | |||
| Rakaia Gorge | 15 | 15 | … | |||
| Rakaia Island | 11 | 7 | 4 | |||
| Rakaia South, T. | 318 | 185 | 133 | |||
| River Road | 38 | 26 | 12 | |||
| Sea-beach vicinity | 31 | 23 | 8 | |||
| Sherwood | 10 | 9 | 1 | |||
| Sherwood vicinity | 39 | 33 | 6 | |||
| Thompson's Track | 21 | 14 | 7 | |||
| Under Terrace | 56 | 24 | 32 | |||
| Urrall | 12 | 9 | 3 | |||
| Village Settlement | 173 | 92 | 81 | |||
| Winchmore (part) | 14 | 9 | 5 | |||
| Others | 14 | 12 | 2 | |||
| Total Riding | 1,903 | 1,298 | 605 | |||
| Riding of Mount Somers— | ||||||
| Alford Forest | 335 | 196 | 139 | |||
| Anama | 23 | 14 | 9 | |||
| Ashburton Gorge | 59 | 41 | 18 | |||
| Buccleugh | 16 | 16 | … | |||
| Lake Heron | 17 | 15 | 2 | |||
| Mayfield | 56 | 38 | 18 | |||
| Mesopotamia | 10 | 10 | … | |||
| Methven vicinity (part) | 15 | 15 | … | |||
| Mount Somers | 150 | 97 | 53 | |||
| Mount Somers Station | 28 | 15 | 13 | |||
| North Hinds | 5 | 3 | 2 | |||
| Rangitata (part) | 27 | 22 | 5 | |||
| Rangitata Station | 5 | … | 5 | |||
| Spread Eagle | 94 | 70 | 24 | |||
| Springfield | 108 | 94 | 14 | |||
| Valletta | 42 | 30 | 12 | |||
| Others | 6 | 5 | 1 | |||
| Total Riding | 996 | 681 | 315 | |||
| Riding of Upper Ashburton— | ||||||
| Alford Forest Road (part) | 228 | 112 | 116 | |||
| Ashburton Belt outside | 161 | 78 | 83 | |||
| Ashburton Forks | 22 | 13 | 9 | |||
| Ashburton River-bed | 2 | 2 | … | |||
| Bennson's Road | 7 | 4 | 3 | |||
| Bland's Island | 10 | 7 | 3 | |||
| Cox Street (Tancred's Estate) | 18 | 11 | 7 | |||
| Cross Street | 2 | 2 | … | |||
| Digby's Bridge Road | 13 | 9 | 4 | |||
| Domain Road, Ashburton | 33 | 21 | 12 | |||
| Dromore (part) | 26 | 19 | 7 | |||
| Great South Road | 67 | 42 | 25 | |||
| Green's Road | 32 | 20 | 12 | |||
| Hart's Run | 24 | 23 | 1 | |||
| Hind's North | 27 | 24 | 3 | |||
| Hind's River | 23 | 19 | 4 | |||
| Hind's South | 45 | 34 | 11 | |||
| Lagmohr Estate | 33 | 28 | 5 | |||
| Lagmohr Road | 28 | 19 | 9 | |||
| Maronau and Anama Road | 11 | 11 | … | |||
| Maronau Station | 26 | 19 | 7 | |||
| Rangitata (part) | 103 | 71 | 32 | |||
| Rimmington's Road | 6 | 6 | … | |||
| Tinwald (part) | 22 | 13 | 9 | |||
| Westerfield | 72 | 47 | 25 | |||
| Winchmore and Road (part) | 82 | 58 | 24 | |||
| Winslow (part) | 51 | 22 | 29 | |||
| Winter's Road (part) | 14 | 8 | 6 | |||
| Total Riding | 1,188 | 734 | 454 | |||
| Road Districts— | Total. | M. | F. | |||
| Ashburton Upper | 1,88 | 734 | 454 | |||
| Longbeach | 1,394 | 782 | 612 | |||
| Mount Hutt | 685 | 510 | 175 | |||
| Mount Somers | 996 | 681 | 315 | |||
| South Rakaia | 1,6894 | 788 | 430 | |||
| Wakanui | 1,684 | 902 | 783 | |||
| GERALD1NE COUNTY. | ||||||
| Riding of Mount Peel— | ||||||
| Allandale | 32 | 26 | 6 | |||
| Clayton Estate (West of Four Peaks) | 13 | 9 | 4 | |||
| Mount Peel | 35 | 21 | 14 | |||
| Orari Gorge | 65 | 43 | 22 | |||
| Peel Forest | 2 | 1 | 1 | |||
| Raincliff | 72 | 62 | 10 | |||
| Scotsburn | 42 | 20 | 22 | |||
| Scotsburn Flat | 106 | 54 | 5l | |||
| Sherwood Downs | 33 | 27 | 6 | |||
| Total Riding | 400 | 263 | 137 | |||
| Country, Riding, Town, Locality, and Road District. | Total. | M. | F. | |||
|---|---|---|---|---|---|---|
| GERALDINE COUNTY—continued. | ||||||
| Riding of Raukapuka— | ||||||
| Beautiful Valley | 18 | 15 | 3 | |||
| Geraldine, T. | 734 | 391 | 343 | |||
| Geraldine and Waihi Bush Road | 113 | 64 | 49 | |||
| Gapes Valley | 19 | 7 | 12 | |||
| Geraldine Downs and Flat | 116 | 63 | 53 | |||
| Jones's Road | 30 | 21 | 9 | |||
| Kakahu (part) | 333 | 190 | 143 | |||
| Orari and Orari Reserve | 368 | 213 | 155 | |||
| Pleasant Valley | 70 | 35 | 35 | |||
| Rangitata and Peel Forest Road | 98 | 53 | 40 | |||
| Smithfield | 70 | 42 | 28 | |||
| Waihi Bush | 261 | 147 | 114 | |||
| Waitohi Flat | 45 | 25 | 20 | |||
| Wigly's Station | 14 | 12 | 2 | |||
| Woodbury, T. | 125 | 62 | 63 | |||
| Woodside | 25 | 11 | 14 | |||
| Others | 97 | 46 | 51 | |||
| Total Riding | 2,536 | 1,402 | 1,134 | |||
| Riding of Temuka— | ||||||
| Arowhenua, T. | 375 | 201 | 174 | |||
| Epworth | 74 | 35 | 39 | |||
| Georgetown | 48 | 26 | 22 | |||
| Kakahu (part) | 53 | 29 | 24 | |||
| Maori Reserve | 38 | 29 | 9 | |||
| Orari, T. | 132 | 74 | 58 | |||
| Rangitata Island | 107 | 55 | 52 | |||
| Rhodes Island and Milford | 382 | 210 | 172 | |||
| Temuka Langridge | 25 | 13 | 12 | |||
| Waitohi | 414 | 232 | 182 | |||
| Wallingford, T. | 704 | 383 | 321 | |||
| Winchester, T. | 377 | 201 | 176 | |||
| Woodbridge | 66 | 43 | 23 | |||
| Vicinity of Grant's Island and Orari Station | 64 | 40 | 24 | |||
| Total Riding | 2,859 | 1,571 | 1,288 | |||
| Riding of Levels— | ||||||
| Anaiti | 16 | 8 | 8 | |||
| Arthur Street | 76 | 34 | 42 | |||
| Babington Street | 40 | 23 | 17 | |||
| Brothers Road | 34 | 23 | 11 | |||
| Buchanan's Street | 141 | 75 | 66 | |||
| Burley Hill (Opihi) | 9 | 3 | 6 | |||
| Church Street | 169 | 95 | 74 | |||
| College Road | 29 | 13 | 16 | |||
| Elizabeth Street | 41 | 18 | 23 | |||
| Fordlands | 19 | 11 | 8 | |||
| Island | 1 | 1 | … | |||
| Kensington | 66 | 33 | 33 | |||
| Kingsdown, Pareora Flat | 9 | 5 | 4 | |||
| Kingsdown, Pareora Terrace Road | 51 | 31 | 20 | |||
| Kingsdown, South Road | 111 | 65 | 46 | |||
| Kingsdown, Upper Pareora Road | 31 | 19 | 12 | |||
| Le Cren Street | 58 | 31 | 27 | |||
| Levels Downs, Albury Road-line | 12 | 6 | 6 | |||
| Levels Downs, Anderson's Road | 19 | 11 | 8 | |||
| Levels Downs, Cave | 26 | 16 | 10 | |||
| Levels Downs, Driscoll's Road | 48 | 24 | 24 | |||
| Levels Downs, McKenzie Country Road | 29 | 15 | 14 | |||
| Levels Downs, Tiko Flat | 22 | 9 | 13 | |||
| Levels Downs, Timaru and Point Road | 106 | 74 | 32 | |||
| Levels Plains, Arowhenua to Levels Road | 59 | 24 | 35 | |||
| Levels Plains, Connell's Road | 31 | 17 | 14 | |||
| Levels Plains, Cross Road from Temuka to Point Road | 32 | 17 | 15 | |||
| Levels Plains, Opihi River | 11 | 9 | 2 | |||
| Levels Plains, Point to Temuka Road | 100 | 49 | 51 | |||
| Levels Plains, Seadown | 185 | 158 | 27 | |||
| Levels Plains, Stonyer's Road | 12 | 8 | 4 | |||
| Levels Plains, Timaru Road and Point Road | 74 | 36 | 38 | |||
| Levels Plains, Timaru and Temuka | 138 | 72 | 66 | |||
| Levels Plains, Waitui Road | 79 | 41 | 38 | |||
| Levels Valley | 21 | 16 | 5 | |||
| Main North Road | 253 | 121 | 132 | |||
| Main South Road | 41 | 23 | 18 | |||
| Maori Hill | 20 | 9 | 11 | |||
| Mount Gay | 6 | 3 | 3 | |||
| North Street | 113 | 53 | 60 | |||
| Opihi | 74 | 40 | 34 | |||
| Opihi Gorge | 9 | 5 | 4 | |||
| Pareora | 13 | 10 | 3 | |||
| Pareora, Beaconsfield | 49 | 21 | 28 | |||
| Pareora, Briggs Gully | 15 | 13 | 2 | |||
| Pareora, Claremont | 16 | 10 | 6 | |||
| Pareora Downs | 69 | 38 | 31 | |||
| Pareora Upper | 53 | 31 | 22 | |||
| Pareora, Upper Pareora Road | 24 | 12 | 12 | |||
| Patiti Point | 7 | 2 | 5 | |||
| Peeresstown | 178 | 86 | 92 | |||
| Pleasant Point, McKenzie Country Road | 113 | 56 | 57 | |||
| Pleasant Point, Piko | 86 | 41 | 45 | |||
| Pleasant Point, Tengawai Road | 80 | 46 | 34 | |||
| Pleasant Point, Timaru and Point Road | 42 | 21 | 21 | |||
| Pleasant Point to Waitui | 35 | 17 | 18 | |||
| Rock Pool (Opihi) | 17 | 16 | 1 | |||
| Salt-water Creek | 116 | 68 | 48 | |||
| Sandietown | 1,009 | 491 | 518 | |||
| Tengawai | 12 | 8 | 4 | |||
| Tengawai Flat, McKenzie Country Road | 81 | 45 | 36 | |||
| Tengawai Flat Road | 60 | 36 | 24 | |||
| Timaru Downs, Archer's Road | 51 | 28 | 23 | |||
| Timaru Downs, Coonor | 60 | 31 | 29 | |||
| Timaru Downs, Coonor Road | 31 | 23 | 8 | |||
| Timaru Downs, Hall's Road | 93 | 47 | 46 | |||
| Timaru Downs, Mount Horrible Road | 131 | 73 | 58 | |||
| Timaru Downs, Otipua Creek | 66 | 35 | 31 | |||
| Timaru Downs, Otipua Road | 35 | 21 | 14 | |||
| Timaru Downs, Page's Road | 33 | 12 | 21 | |||
| Timaru Downs, Landsborough Road | 7 | 2 | 5 | |||
| Timaru Downs, Wai-iti | 76 | 37 | 39 | |||
| Timaru Downs, Wai-iti Road | 107 | 58 | 49 | |||
| Timaru Downs, Wai-iti and Mount Horrible Road | 14 | 6 | 8 | |||
| Timaru Downs, Washdyke Gorge | 16 | 9 | 7 | |||
| Timaru Town Belt | 9 | 3 | 6 | |||
| Totara Valley | 75 | 45 | 30 | |||
| Wai-iti Road | 43 | 19 | 24 | |||
| Waimataitai | 124 | 62 | 62 | |||
| Washdyke | 40 | 21 | 19 | |||
| Washdyke Flat, North Road | 73 | 46 | 27 | |||
| Washdyke Flat, Timaru to Point Road | 50 | 30 | 20 | |||
| West Town Belt | 289 | 129 | 160 | |||
| White Rocks | 7 | 5 | 2 | |||
| York Street | 158 | 77 | 81 | |||
| Total Riding | 6,084 | 3,231 | 2,853 | |||
| Riding of Mount Cook— | ||||||
| Albury | 62 | 49 | 13 | |||
| Albury Downs | 48 | 32 | 16 | |||
| Ashwick Flat | 27 | 19 | 8 | |||
| Ashwick Road | 13 | 13 | … | |||
| Balmoral | 7 | 6 | 1 | |||
| Ben Ohou | 14 | 9 | 5 | |||
| Black Forest | 4 | 3 | 1 | |||
| Braemar | 9 | 6 | 3 | |||
| Burke's Pass | 65 | 38 | 27 | |||
| Cave | 9 | 8 | 1 | |||
| Clayton Road | 3 | 2 | 1 | |||
| Coal Gully | 19 | 10 | 9 | |||
| Fairlie Creek | 181 | 110 | 71 | |||
| Country, Riding, Town, Locality, and Road District. | Total. | M. | F. | |||
|---|---|---|---|---|---|---|
| GERALDINE COUNTY—continued. | ||||||
| Riding of Mount Cook—continued. | ||||||
| Glenmore | 9 | 4 | 5 | |||
| Glentanner | 5 | 5 | … | |||
| Grampian Station | 16 | 15 | 1 | |||
| Haldon Station | 9 | 8 | 1 | |||
| Lake Tekapo | 9 | 5 | 4 | |||
| Mistake Station | 6 | 3 | 3 | |||
| Mount Nessing | 66 | 48 | 18 | |||
| Opawa | 67 | 42 | 25 | |||
| Pareora | 4 | 4 | … | |||
| Pukaki Ferry | 6 | 5 | 1 | |||
| Richmond | 5 | 4 | 1 | |||
| Rollesby | 14 | 8 | 6 | |||
| Silverstream | 102 | 71 | 31 | |||
| Simons Pass Station | 4 | 3 | 1 | |||
| Strath Cavan | 8 | 2 | 6 | |||
| Tekapo Ferry Hotel | 19 | 14 | 5 | |||
| The Wolds | 12 | 11 | 2 | |||
| Whale's Back | 7 | 5 | 2 | |||
| Others | 20 | 12 | 8 | |||
| Total Riding | 830 | 574 | 276 | |||
| Road Districts— | Total. | M. | F. | |||
| Geraldine | 2,536 | 1,402 | 1,134 | |||
| Levels | 6,084 | 3,231 | 2,853 | |||
| Mount Cook | 850 | 574 | 270 | |||
| Mount Peel | 400 | 203 | 137 | |||
| Temuka | 2,859 | 1,571 | 1,288 | |||
| WAIMATE COUNTY. | ||||||
| Riding of Pareora— | ||||||
| Blue Cliffs Road and Otaio Flat | 13 | 8 | 5 | |||
| Carrington | 26 | 17 | 9 | |||
| Craigmore | 18 | 18 | … | |||
| Holme Station | 35 | 23 | 12 | |||
| Pareora Bush | 25 | 17 | 8 | |||
| Pareora Estate | 31 | 26 | 3 | |||
| Pareora Flat Road | 37 | 30 | 7 | |||
| Pareora Gorge | 14 | 7 | 7 | |||
| St. Andrew, T. | 59 | 33 | 26 | |||
| White Rocks | 14 | 10 | 4 | |||
| Others | 18 | 12 | 6 | |||
| Total Riding | 290 | 201 | 89 | |||
| Riding of Otaio— | ||||||
| Blue Cliffs | 49 | 42 | 7 | |||
| Esk Valley Road | 24 | 14 | 10 | |||
| Horseshoe Bend | 19 | 14 | 5 | |||
| Hunter (part) | 47 | 33 | 14 | |||
| Makikihi | 8 | 5 | 3 | |||
| Marshall's Road | 15 | 8 | 7 | |||
| Otaio | 125 | 81 | 44 | |||
| Riverside | 90 | 54 | 36 | |||
| Scotston | 69 | 30 | 19 | |||
| Tavistock | 18 | 12 | 6 | |||
| Others | 5 | 5 | … | |||
| Total Riding | 469 | 318 | 151 | |||
| Riding of Makikihi— | ||||||
| Deep Creek (part) | 32 | 26 | 6 | |||
| Hook Lower | 138 | 89 | 69 | |||
| Hook Upper | 98 | 64 | 34 | |||
| Hunter (part) | 55 | 37 | 18 | |||
| Makikihi, T. | 72 | 39 | 33 | |||
| Makikihi Downs | 43 | 30 | 13 | |||
| Total Riding | 458 | 285 | 173 | |||
| Riding of Deep Creek— | ||||||
| Ballyhode | 31 | 20 | 11 | |||
| Bush | 327 | 189 | 138 | |||
| Bush Town | 396 | 216 | 180 | |||
| Deep Creek (part) | 187 | 100 | 87 | |||
| Downlands | 21 | 8 | 13 | |||
| North Road, Waimate vicinity | 179 | 86 | 93 | |||
| Painstown | 113 | 61 | 52 | |||
| Parsonage Road | 97 | 35 | 42 | |||
| South Road | 86 | 42 | 44 | |||
| Studholme Junction | 50 | 37 | 13 | |||
| Waihao (part) | 34 | 25 | 9 | |||
| Waihao Road (part) | 39 | 25 | 14 | |||
| Willow Bridge | 29 | 24 | 5 | |||
| Total Riding | 1,589 | 888 | 701 | |||
| Riding of North Waihao— | ||||||
| Chesnoll | 18 | 15 | … | |||
| Elephant Hill | 10 | 7 | 3 | |||
| Merino Downs | 3 | 2 | 1 | |||
| Mount Nimrod | 19 | 16 | 3 | |||
| Redcliff | 17 | 12 | 5 | |||
| Station Peak | 24 | 17 | 7 | |||
| Tabletop | 16 | 14 | 2 | |||
| Waihao (part) | 278 | 183 | 95 | |||
| Waihao Forks | 14 | 8 | 6 | |||
| Waihao North | 33 | 20 | 13 | |||
| Waihaorunga | 26 | 16 | 10 | |||
| Waihao Flat | 10 | 5 | 5 | |||
| Waihao Road (part) | 6 | 3 | 3 | |||
| Waitaki | 12 | 8 | 4 | |||
| Waitaki Road | 25 | 15 | 10 | |||
| Total Riding | 511 | 341 | 170 | |||
| Riding of Hakateramea— | ||||||
| Mount Cook | 121 | 85 | 36 | |||
| Total Riding | 121 | 85 | 36 | |||
| WAITAKI COUNTY. | ||||||
| Riding of Ohau— | ||||||
| Benmore | 35 | 24 | 11 | |||
| Birchwood | 10 | 8 | 2 | |||
| Longslip | 12 | 12 | … | |||
| Mailburn | 5 | 2 | 3 | |||
| Ohau | 14 | 13 | 1 | |||
| Total Riding | 76 | 59 | 17 | |||
| Riding of Otamatakau— | ||||||
| Oamarama | 30 | 23 | 7 | |||
| Otamatakau (part) | 8 | 4 | 4 | |||
| Total Riding | 38 | 27 | 11 | |||
| Riding of Otakaike— | ||||||
| Kurow, T., and vicinity | 140 | 88 | 52 | |||
| Livingstone, T | 230 | 147 | 83 | |||
| Otakaike | 45 | 35 | 10 | |||
| Otamatakau (part) | 15 | 12 | 3 | |||
| Rugged Ridges | 20 | 14 | 6 | |||
| Wharekuri | 16 | 12 | 4 | |||
| Total Riding | 466 | 308 | 158 | |||
| Riding of Awamoko— | ||||||
| Awamoko East | 69 | 38 | 31 | |||
| Awamoko West | 18 | 10 | 8 | |||
| Black's Point | 21 | 14 | 7 | |||
| Duntroon, T. | 142 | 84 | 58 | |||
| Georgetown | 56 | 29 | 27 | |||
| Marawhenua | 19 | 14 | 5 | |||
| Marawhenua Tables | 263 | 204 | 59 | |||
| Marawhenua West | 20 | 11 | 9 | |||
| Total Riding | 608 | 404 | 204 | |||
| Riding of Papakaio— | ||||||
| Boundary Creek | 15 | 9 | 6 | |||
| North Belt | 34 | 15 | 19 | |||
| North Boundary | 10 | 5 | 5 | |||
| North Road | 122 | 63 | 59 | |||
| Papakaio | 1,093 | 601 | 492 | |||
| Peebles | 21 | 13 | 8 | |||
| Country, Riding, Town, Locality, and Road District. | Total. | M. | F. | |||
|---|---|---|---|---|---|---|
| WAITAKI COUNTY—continued. | ||||||
| Riding of Papakaio—continued. | ||||||
| Redcastle | 12 | 8 | 4 | |||
| Richmond | 14 | 8 | 6 | |||
| Waitaki South | 26 | 12 | 14 | |||
| Total Riding | 1,347 | 734 | 613 | |||
| Riding of Waiareka— | ||||||
| Airdale | 5 | 4 | 1 | |||
| Awamoko | 30 | 28 | 2 | |||
| Big Hill | 24 | 18 | 6 | |||
| Bobbin Creek | 26 | 22 | 4 | |||
| Carrodale | 40 | 33 | 7 | |||
| Coal-pits | 22 | 12 | 10 | |||
| Dunedin Road | 70 | 44 | 26 | |||
| Kakanui Road | 41 | 33 | 8 | |||
| Phoenix Mills | 10 | 6 | 4 | |||
| Teneraki, T. (part) | 66 | 34 | 32 | |||
| Town Boundary | 62 | 34 | 28 | |||
| Waiareka | 14 | 9 | 5 | |||
| Waiartka Junction | 46 | 23 | 23 | |||
| Weston, T. | 188 | 103 | 85 | |||
| Weston Road | 42 | 27 | 15 | |||
| White Rocks | 22 | 12 | 10 | |||
| Whitestone (part) | 76 | 31 | 25 | |||
| Windsor Park | 41 | 32 | 9 | |||
| Total Riding | 825 | 525 | 300 | |||
| Riding of Kakanui— | ||||||
| Alma | 45 | 20 | 25 | |||
| Clifton Falls | 14 | 8 | 6 | |||
| Deborah | 76 | 40 | 36 | |||
| Elderslie | 53 | 37 | 16 | |||
| Island Stream | 123 | 78 | 45 | |||
| Kakanui | 279 | 180 | 99 | |||
| Ngapara, T. | 296 | 202 | 94 | |||
| Oamaru South | 388 | 198 | 190 | |||
| Reidstown, T. | 105 | 56 | 49 | |||
| Teneraki, T. (part) | 184 | 101 | 83 | |||
| Totara | 72 | 56 | 16 | |||
| Whitestone (part) | 37 | 33 | 24 | |||
| Windsor | 91 | 69 | 22 | |||
| Total Riding | 1,783 | 1,078 | 705 | |||
| Riding of Otepopo— | ||||||
| Allday Bay or Chelsea | 313 | 178 | 135 | |||
| Copenhurst | 86 | 45 | 41 | |||
| Kakanui South and Maheno | 316 | 170 | 136 | |||
| Otepopo (or Herbert), T. | 354 | 189 | 165 | |||
| Sydney | 206 | 129 | 77 | |||
| Waiauakarua | 9 | 3 | 6 | |||
| Total Riding | 1,274 | 714 | 560 | |||
| Riding of Moeraki— | ||||||
| Bagdad | 60 | 31 | 29 | |||
| Chalgrove | 130 | 68 | 62 | |||
| Kartigi | 132 | 87 | 65 | |||
| Moeraki | 196 | 107 | 89 | |||
| Total Riding | 538 | 293 | 245 | |||
| Road Districts— | Total. | M. | F. | |||
| Hampden | 538 | 293 | 245 | |||
| Kakanui | 1,084 | 628 | 456 | |||
| Otepopo | 1,273 | 710 | 562 | |||
| Waiareka | 1,519 | 984 | 535 | |||
| Waitaki | 1,346 | 733 | 613 | |||
| Outlying | 1,196 | 794 | 402 | |||
| WAIKOUAITI COUNTY. | ||||||
| Riding of Waihemo— | ||||||
| Deepdell | 55 | 51 | 4 | |||
| Fullarton | 71 | 58 | 13 | |||
| Macrae's, T. | 200 | 139 | 61 | |||
| Moonlight | 88 | 53 | 35 | |||
| Total Riding | 414 | 301 | 113 | |||
| Riding of Dunback— | ||||||
| Coal Creek | 44 | 25 | 19 | |||
| Dunback | 155 | 109 | 46 | |||
| Green Valley | 86 | 58 | 28 | |||
| Waihemo | 103 | 75 | 28 | |||
| Total Riding | 388 | 267 | 121 | |||
| Riding of Palmerston— | ||||||
| Blue Mountains | 24 | 12 | 12 | |||
| Buckland's | 33 | 21 | 12 | |||
| Bushey | 15 | 9 | 6 | |||
| Bushey Park | 11 | 3 | 8 | |||
| Goodwood | 172 | 88 | 84 | |||
| Horserange | 68 | 31 | 37 | |||
| Inch Valley | 10 | 8 | 2 | |||
| Long Bush | 22 | 12 | 10 | |||
| Mount Pleasant | 45 | 22 | 23 | |||
| Neilstown | 22 | 9 | 13 | |||
| Palmerston | 66 | 43 | 23 | |||
| Pleasant Valley (part) | 73 | 48 | 25 | |||
| Shag Point Coal Mine | 442 | 258 | 184 | |||
| Shag Valley | 403 | 219 | 184 | |||
| Youngtown | 14 | 8 | 6 | |||
| Total Riding | 1,420 | 791 | 629 | |||
| Riding of Hawkesbury— | ||||||
| Flagswamp | 128 | 71 | 57 | |||
| Hawkesbury, T., East | 353 | 162 | 191 | |||
| Hawkesbury Bush | 196 | 97 | 99 | |||
| Island Farm | 7 | 5 | 2 | |||
| Main North Road | 149 | 83 | 66 | |||
| Matanaka | 17 | 8 | 9 | |||
| Mount Darden | 1 | 1 | … | |||
| Mount Watkins | 12 | 7 | 5 | |||
| Pleasant Valley (part) | 54 | 25 | 29 | |||
| Riverview | 63 | 32 | 31 | |||
| Springbank | 8 | 5 | 3 | |||
| Tumai | 37 | 22 | 15 | |||
| Total Riding | 1,025 | 518 | 507 | |||
| Riding of Merton— | ||||||
| Beaconsfield | 104 | 60 | 44 | |||
| Beaconsfield Main North Road | 57 | 26 | 31 | |||
| Cherry Farm | 32 | 22 | 10 | |||
| Merton | 215 | 120 | 95 | |||
| Merton Main North Road | 91 | 49 | 42 | |||
| Native Reserve | 72 | 40 | 32 | |||
| Seacliff | 245 | 177 | 68 | |||
| Warrington | 158 | 86 | 72 | |||
| Total Riding | 974 | 580 | 394 | |||
| Riding of Blueskin— | ||||||
| Beach Road, Otago Lower Harbour | 147 | 81 | 66 | |||
| Blueskin, T. | 205 | 108 | 97 | |||
| Blueskin and Water of Leith Road, Waitati | 24 | 14 | 10 | |||
| Double Hill | 68 | 39 | 29 | |||
| Evandale and Carey's Creek | 58 | 27 | 31 | |||
| Mansford, T. | 305 | 152 | 153 | |||
| Merchiston, T. | 92 | 49 | 43 | |||
| Mihiwaka and Port Chalmers Road | 185 | 101 | 84 | |||
| Orokonui | 92 | 57 | 35 | |||
| Purakanui | 270 | 154 | 116 | |||
| Reynolds, T., Deborah Bay | 61 | 34 | 27 | |||
| Woodfield, Deborah Bay | 243 | 132 | 111 | |||
| Total Riding | 1,750 | 948 | 802 | |||
| Riding of North-East Valley— | ||||||
| Blueskin and Pine Hill Road | 264 | 145 | 119 | |||
| Sawyer's Bay | 426 | 226 | 200 | |||
| Total Riding | 690 | 371 | 319 | |||
| Country, Riding, Town, Locality, and Road District. | Total. | M. | F. | |||
|---|---|---|---|---|---|---|
| WAIKOUAITI COUNTY— continued. | ||||||
| Road Districts— | Total. | M. | F. | |||
| Blueskin | 1,943 | 1,055 | 888 | |||
| Deepdell | 88 | 53 | 35 | |||
| Dunback | 206 | 142 | 64 | |||
| Hawkesbury | 1,019 | 512 | 370 | |||
| North-East Valley | 568 | 300 | 268 | |||
| Palmerston | 93 | 539 | 446 | |||
| Waikouaiti | 912 | 542 | 370 | |||
| Waihemo | 138 | 100 | 38 | |||
| Outlying | 802 | 533 | 269 | |||
| PENINSULA COUNTY. | ||||||
| Riding of Anderson's Bay— | ||||||
| Anderson's Bay | 401 | 203 | 198 | |||
| Anderson's Bay Road | 123 | 63 | 60 | |||
| Ocean Beach | 40 | 24 | 16 | |||
| Portobello Road (part) | 89 | 50 | 39 | |||
| Shiel Hill | 24 | 14 | 10 | |||
| Vauxhall | 32 | 15 | 17 | |||
| Total Riding | 709 | 309 | 340 | |||
| Riding of Tomahawk— | ||||||
| Portobello Road (part) | 43 | 25 | 18 | |||
| Tomahawk | 199 | 111 | 88 | |||
| Total Riding | 242 | 136 | 106 | |||
| Riding of North-East Harbour— | ||||||
| Beach Road | 96 | 48 | 48 | |||
| Main Road | 46 | 26 | 20 | |||
| North-East Harbour | 101 | 60 | 41 | |||
| Total Riding | 243 | 134 | 109 | |||
| Riding of Highcliff— | ||||||
| Highcliff Road | 51 | 33 | 18 | |||
| Main Road | 38 | 19 | 19 | |||
| Sandfly Bay (part) | 18 | 7 | 11 | |||
| Sandfly Road | 30 | 13 | 15 | |||
| Total Riding | 137 | 74 | 63 | |||
| Riding of Portobello— | ||||||
| Arthur's Seat | 37 | 21 | 16 | |||
| Hooper s Inlet (part) | 155 | 80 | 75 | |||
| Papanui | 90 | 43 | 47 | |||
| Total Riding | 282 | 144 | 138 | |||
| Riding of Sandymount— | ||||||
| Hooper's Inlet (part) | 38 | 25 | 13 | |||
| Main Road | 42 | 17 | 25 | |||
| Sandymount Road | 82 | 43 | 39 | |||
| Sandfly Bay (part) | 14 | 8 | 6 | |||
| Seal Point Road | 79 | 48 | 31 | |||
| Total Riding | 255 | 141 | 114 | |||
| Riding of Broad Bay— | ||||||
| Beach Road | 159 | 81 | 78 | |||
| Hooper s Inlet (part) | 34 | 16 | 18 | |||
| Hooper's Inlet Road | 5 | 3 | 2 | |||
| Larnach's Camp | 13 | 9 | 4 | |||
| Larnach's Road | 48 | 27 | 21 | |||
| Leith Walk | 17 | 9 | 8 | |||
| Main Road | 138 | 73 | 65 | |||
| Total Riding | 414 | 218 | 196 | |||
| Outside Ridings— | ||||||
| Native Reserve | 107 | 62 | 45 | |||
| Pilot-station, and Lighthouse, Tairoa Heads | 36 | 22 | 14 | |||
| Total | 143 | 84 | 59 | |||
| Road Districts— | Total | M. | F. | |||
| Peninsula | 1,331 | 714 | 617 | |||
| Portobello | 1,088 | 584 | 504 | |||
| Outlying | 6 | 2 | 4 | |||
| TAIERI COUNTY. | ||||||
| Riding of Wakari— | ||||||
| Flagstaff | 10 | 4 | 6 | |||
| Whare Flat | 131 | 76 | 55 | |||
| Total Riding | 141 | 80 | 61 | |||
| Riding of Kaikorai— | ||||||
| Abbotsford, T. | 213 | 102 | 113 | |||
| Abbot's Hill | 78 | 43 | 35 | |||
| Fairfield | 230 | 132 | 98 | |||
| Green Island | 523 | 275 | 250 | |||
| Kaikorai Valley | 80 | 41 | 39 | |||
| Lower Kaikorai | 203 | 111 | 94 | |||
| Total Riding | 1,333 | 704 | 629 | |||
| Riding of Otokia— | ||||||
| Brighton and Boat Harbour | 330 | 185 | 145 | |||
| Coal-pit Road | 26 | 16 | 10 | |||
| Fairfield, T. | 169 | 87 | 82 | |||
| Greytown, T. | 262 | 147 | 115 | |||
| Henley, T. | 65 | 35 | 30 | |||
| Kuri Bush | 81 | 43 | 38 | |||
| Main South Road | 212 | 121 | 91 | |||
| Otokia, T. | 18 | 59 | 59 | |||
| Riccarton, T. | 75 | 35 | 40 | |||
| Saddle Hill East | 305 | 160 | 145 | |||
| Scroggs Hill | 18 | 10 | 8 | |||
| Total Riding | 1,661 | 898 | 763 | |||
| Riding of North Taieri— | ||||||
| Mosgiel, T. | 498 | 203 | 215 | |||
| Mosgiel District | 269 | 147 | 122 | |||
| Mullocky Gully Road | 30 | 22 | 8 | |||
| North Taieri | 120 | 71 | 49 | |||
| Salisbury | 177 | 129 | 48 | |||
| Wingatui | 75 | 49 | 26 | |||
| Total Riding | 1,089 | 621 | 468 | |||
| Riding of East Taieri— | ||||||
| East Taieri | 538 | 273 | 265 | |||
| East Taieri North | 241 | 137 | 104 | |||
| Mosgiel West | 233 | 129 | 124 | |||
| Total Riding | 1,032 | 539 | 493 | |||
| Riding of Outram— | ||||||
| Henley West | 60 | 36 | 24 | |||
| Outram, T. | 272 | 147 | 125 | |||
| West Taieri | 602 | 378 | 224 | |||
| Total Riding | 934 | 561 | 373 | |||
| Riding of Maungatua— | ||||||
| Berwick, T. | 84 | 49 | 35 | |||
| Lake Waipori | 104 | 67 | 37 | |||
| Maungatua | 442 | 245 | 197 | |||
| Maungatua vicinity | 94 | 46 | 48 | |||
| Traquair | 41 | 21 | 20 | |||
| Total Riding | 765 | 428 | 337 | |||
| Riding of Deep Stream— | ||||||
| Deep Stream | 100 | 80 | 20 | |||
| Hindon | 158 | 135 | 23 | |||
| Mount Allan | 112 | 77 | 35 | |||
| Mount Stoker | 20 | 16 | 4 | |||
| Straith Taieri | 131 | 91 | 40 | |||
| Total Riding | 521 | 399 | 122 | |||
| Road Districts— | Total. | M. | F. | |||
| Grey | 783 | 418 | 365 | |||
| Halfway Bush | 141 | 80 | 61 | |||
| Kaikorai | 761 | 404 | 357 | |||
| Kuri Bush | 429 | 223 | 206 | |||
| Outram | 934 | 560 | 374 | |||
| Seaside | 449 | 255 | 194 | |||
| Suburban | 573 | 302 | 271 | |||
| Taieri East | 961 | 499 | 462 | |||
| Taieri North | 1,089 | 620 | 469 | |||
| Waipori, part of (see Bruce) | 765 | 427 | 338 | |||
| Outlying | 591 | 442 | 149 | |||
| Country, Riding, Town, Locality, and Road District. | Total. | M. | F. | ||||
|---|---|---|---|---|---|---|---|
| BRUCE COUNTY. | |||||||
| Riding of Balmoral— | |||||||
| Begg's Station | 37 | 32 | 5 | ||||
| Greenfield Station | 73 | 66 | 9 | ||||
| Hillend East | 94 | 49 | 45 | ||||
| Hillend North | 49 | 23 | 26 | ||||
| Tuapeka Mouth District | 150 | 88 | 62 | ||||
| Total Riding | 405 | 238 | 147 | ||||
| Riding of Mount Stuart— | |||||||
| Adams Flat | 144 | 111 | 33 | ||||
| Canada | 123 | 61 | 62 | ||||
| Glenore | 22 | 17 | 5 | ||||
| Hillend (part) | 17 | 5 | 12 | ||||
| Lovell's Flat | 59 | 35 | 24 | ||||
| Manuka Creek | 136 | 72 | 64 | ||||
| Mount Stuart | 90 | 62 | 28 | ||||
| North Branch | 5 | 2 | 3 | ||||
| Rotten Valley | 13 | 7 | 6 | ||||
| Round Hill | 22 | 15 | 7 | ||||
| Table Hill | 8 | 4 | 4 | ||||
| Tokomairiro South | 55 | 30 | 25 | ||||
| Woolshed | 94 | 62 | 32 | ||||
| Total Riding | 788 | 483 | 305 | ||||
| Riding of Clarendon— | |||||||
| Berwick vicinity | 26 | 15 | 11 | ||||
| Circle Hill vicinity | 13 | 7 | 6 | ||||
| Clarendon | 34 | 17 | 17 | ||||
| Horseshoe Bush and vicinity | 4 | 21 | 20 | ||||
| Main South Road | 11 | 6 | 5 | ||||
| Mary Hill | 11 | 4 | 7 | ||||
| Meggatburn | 7 | 6 | 1 | ||||
| Terrace Range | 9 | 4 | 5 | ||||
| Waihola | 68 | 34 | 34 | ||||
| Waihola Lake and Peninsula | 27 | 13 | 14 | ||||
| Total Riding | 247 | 127 | 120 | ||||
| Riding of Waihola— | |||||||
| Hull, T. | 63 | 34 | 29 | ||||
| Kapiti, T. | 70 | 38 | 32 | ||||
| Taieri Beach | 169 | 99 | 70 | ||||
| Taieri Ferry | 106 | 50 | 56 | ||||
| Waihola, T. | 175 | 88 | 87 | ||||
| Waihola vicinity | 21 | 11 | 10 | ||||
| Waihola Gorge (part) | 109 | 60 | 49 | ||||
| Total Riding | 713 | 380 | 333 | ||||
| Riding of Tokomairiro— | |||||||
| Akatore (part) | 83 | 46 | 37 | ||||
| Berkinshaw | 20 | 12 | 8 | ||||
| Brooklands | 19 | 10 | 9 | ||||
| Candle, T. | 73 | 39 | 34 | ||||
| Clarksville | 40 | 28 | 12 | ||||
| Fairfax, T. | 276 | 134 | 142 | ||||
| Gorge Road | 81 | 36 | 45 | ||||
| Grove | 15 | 7 | 8 | ||||
| Helensbrook | 89 | 42 | 47 | ||||
| Milbourn | 17 | 9 | 8 | ||||
| North Branch | 38 | 22 | 16 | ||||
| Salmon's Creek | 10 | 5 | 5 | ||||
| Southbridge | 66 | 44 | 22 | ||||
| Springfield | 13 | 8 | 5 | ||||
| Table Hill | 60 | 37 | 23 | ||||
| Tokomairiro South | 180 | 101 | 79 | ||||
| Waihola Gorge (part) | 77 | 45 | 32 | ||||
| Others | 30 | 14 | 16 | ||||
| Total Riding | 1,187 | 639 | 548 | ||||
| Riding of Glenledi— | |||||||
| Akatore (part) | 233 | 131 | 102 | ||||
| Total Riding— | 233 | 131 | 102 | ||||
| Riding of Kaitangata— | |||||||
| Coomb Hay | 37 | 24 | 13 | ||||
| Kaitangata,T. | 394 | 204 | 190 | ||||
| Molyneux North | 93 | 44 | 49 | ||||
| Riverside | 9 | 5 | 4 | ||||
| Wangaloa | 157 | 86 | 71 | ||||
| Total Riding | 690 | 363 | 327 | ||||
| Riding of Crichton— | |||||||
| Hillend (part) | 67 | 37 | 30 | ||||
| Tuakitoto North | 163 | 88 | 75 | ||||
| Tuakitoto South | 68 | 33 | 35 | ||||
| Total Riding | 298 | 158 | 140 | ||||
| Riding of Matau— | |||||||
| Granton, T. | 82 | 43 | 39 | ||||
| Hillend (part) | 98 | 57 | 41 | ||||
| Molyneux North | 96 | 55 | 41 | ||||
| Newington, T. | 61 | 33 | 28 | ||||
| Stirling, T. | 151 | 74 | 77 | ||||
| Total Riding | 488 | 262 | 226 | ||||
| Road Districts— | Total. | M. | F. | ||||
| Balmoral | 405 | 258 | 147 | ||||
| Crichton | 299 | 159 | 140 | ||||
| Glenledie | 233 | 130 | 103 | ||||
| Kaitangata | 690 | 363 | 327 | ||||
| Matau | 492 | 264 | 228 | ||||
| Mount Stuart | 784 | 478 | 306 | ||||
| Tokomairiro | 1,186 | 641 | 545 | ||||
| Waihola | 713 | 381 | 332 | ||||
| Waipori, part of (see Taieri) | 247 | 127 | 120 | ||||
| CLUTHA COUNTY. | |||||||
| Riding of Waipahi— | |||||||
| Glenkenich (part) | 324 | 200 | 124 | ||||
| Greenvale (part) | 26 | 12 | 14 | ||||
| Kelso (part) | 34 | 15 | 14 | ||||
| Waipahi (part) | 161 | 106 | 60 | ||||
| Total Riding | 545 | 333 | 212 | ||||
| Riding of Pomahaka— | |||||||
| Clydevale (part) | 3 | 1 | 2 | ||||
| Kaihiku (part) | 12 | 9 | 3 | ||||
| Te Houka | 193 | 109 | 84 | ||||
| Waiwera (part) | 64 | 40 | 24 | ||||
| Total Riding | 272 | 159 | 113 | ||||
| Riding of Clinton— | |||||||
| Clinton, T. | 363 | 204 | 159 | ||||
| Kaihiku (part) | 166 | 89 | 77 | ||||
| Waiwera (part) | 230 | 133 | 97 | ||||
| Total Riding | 759 | 426 | 333 | ||||
| Riding of Richardson— | |||||||
| Finnegan | 50 | 26 | 24 | ||||
| Island of Inch Clutha | 298 | 202 | 96 | ||||
| Waitepeka | 223 | 127 | 96 | ||||
| Warepa | 339 | 180 | 159 | ||||
| Total Riding | 910 | 535 | 375 | ||||
| Riding of South Molyneux— | |||||||
| Ahuriri | 114 | 62 | 52 | ||||
| Catlin's River | 181 | 109 | 72 | ||||
| Glenomaru | 34 | 24 | 10 | ||||
| Owake | 268 | 150 | 118 | ||||
| Owake Upper | 99 | 56 | 43 | ||||
| Port Molyneux | 200 | 120 | 80 | ||||
| Puerua | 242 | 123 | 119 | ||||
| The Nuggets and vicinity | 11 | 5 | 6 | ||||
| Total Riding | 1,149 | 649 | 500 | ||||
| Country, Riding, Town, Locality, and Road District. | Total. | M. | F. | |||
|---|---|---|---|---|---|---|
| CLUTHA COUNTY—continued. | ||||||
| Riding of Clydevale— | ||||||
| Clydevale (part) | 74 | 66 | 8 | |||
| Waiwera (part) | 33 | 21 | 12 | |||
| Total Riding | 107 | 87 | 20 | |||
| Riding of Wairuna— | ||||||
| Kuriwo District | 20 | 12 | 8 | |||
| Popotuna Gorge | 94 | 61 | 33 | |||
| Waipahi (part) | 156 | 89 | 67 | |||
| Waipahi Station | 11 | 10 | 1 | |||
| Wairuna | 182 | 103 | 79 | |||
| Total Riding | 463 | 275 | 188 | |||
| Road Districts— | Total. | M. | F. | |||
| Clinton | 770 | 433 | 337 | |||
| Clutha | 613 | 333 | 280 | |||
| Clydevale | 77 | 67 | 10 | |||
| Inch Clutha | 304 | 205 | 99 | |||
| Pomahaka | 291 | 173 | 118 | |||
| South Molyneux | 1,138 | 643 | 493 | |||
| Outlying | 1,013 | 610 | 402 | |||
| TUAPEKA COUNTY. | ||||||
| Riding of Teviot— | ||||||
| Allan's Gully | 10 | 10 | … | |||
| Benger Flat | 97 | 54 | 43 | |||
| Coal Creek Flat | 75 | 45 | 30 | |||
| Crossan's Gully | 12 | 6 | 6 | |||
| Dumbarton Rock | 26 | 15 | 11 | |||
| Elbow Creek | 11 | 11 | … | |||
| Hercules Flat | 24 | 9 | 15 | |||
| Horseshoe Bend | 15 | 9 | 6 | |||
| Island | 21 | 13 | 8 | |||
| Long Valley | 13 | 9 | 4 | |||
| Miller's Flat | 152 | 92 | 60 | |||
| Moa Flat (part) | 28 | 25 | 3 | |||
| Pomahaka | 51 | 43 | 8 | |||
| Shingle Creek | 26 | 13 | 13 | |||
| Teviot Flat | 174 | 112 | 62 | |||
| Total Riding | 733 | 466 | 269 | |||
| Riding of James— | ||||||
| Crookston (part) | 376 | 230 | 146 | |||
| Ettrick, T. | 48 | 30 | 18 | |||
| Greenvale (part) | 127 | 77 | 50 | |||
| Moa Flat (part) | 108 | 60 | 48 | |||
| Moa Flat Station, Spylaw | 43 | 41 | 2 | |||
| Spylaw | 74 | 40 | 34 | |||
| Total Riding | 776 | 478 | 298 | |||
| Riding of Beaumont— | ||||||
| Beaumont | 48 | 41 | 7 | |||
| Clifton | 23 | 14 | 9 | |||
| Crookston (part) | 32 | 20 | 12 | |||
| Dunkeld, T. | 87 | 45 | 42 | |||
| Junction, Lawrence to Switzer's | 6 | 4 | 2 | |||
| Junction, Teviot to Switzer's | 8 | 6 | 2 | |||
| Lawrence to Teviot | 46 | 30 | 16 | |||
| Switzer's Road | 11 | 3 | 8 | |||
| Tuapeka River (part) | 7 | 3 | 4 | |||
| Others | 7 | 1 | 11 | |||
| Total Riding | 275 | 173 | 102 | |||
| Riding of Tapanui— | ||||||
| Ardmore | 19 | 15 | 4 | |||
| Brooksdale Station | 63 | 50 | 13 | |||
| Crookston Road | 16 | 11 | 5 | |||
| Glenkenich (part) | 247 | 144 | 103 | |||
| Kelso, T. (part) | 97 | 51 | 46 | |||
| Rankleburn | 12 | 6 | 6 | |||
| Others | 40 | 28 | 12 | |||
| Total Riding | 494 | 305 | 189 | |||
| Riding of Brown's— | ||||||
| Beaumont Road | 1 | 1 | … | |||
| Bellamy's Station | 10 | 3 | 7 | |||
| Crowley's Gully | 13 | 6 | 7 | |||
| Dalhousie's Road | 3 | 3 | … | |||
| Duffy's Gully | 8 | 4 | 4 | |||
| Evans Flat | 74 | 38 | 36 | |||
| Lawrence to Breakneck | 5 | 3 | 2 | |||
| Lawrence to Evans Flat | 66 | 36 | 30 | |||
| Lawrence to Tuapeka Mouth | 12 | 6 | 6 | |||
| Ross Gully | 22 | 16 | 6 | |||
| Roughan's Gully | 19 | 13 | 6 | |||
| Tuapeka East (part) | 6 | 5 | 1 | |||
| Tuapeka Flat (part) | 79 | 45 | 34 | |||
| Tuapeka River (part) | 184 | 159 | 25 | |||
| Tuapeka Road | 18 | 8 | 10 | |||
| Tuapeka West | 226 | 134 | 92 | |||
| Watson's Bush | 5 | 5 | … | |||
| Total Riding | 751 | 485 | 266 | |||
| Riding of Gabriel's— | ||||||
| Bluespur | 391 | 198 | 193 | |||
| Chinese Camp | 104 | 86 | 18 | |||
| Evans Flat | 33 | 15 | 18 | |||
| Gabriel's Gully | 321 | 193 | 128 | |||
| Munro's Gully | 120 | 66 | 54 | |||
| Tuapeka Basin | 1 | 1 | … | |||
| Tuapeka Creek | 10 | 5 | 5 | |||
| Tuapeka East (part) | 38 | 19 | 19 | |||
| Tuapeka Flat (part) | 45 | 29 | 16 | |||
| Tuapeka River (part) | 8 | 8 | … | |||
| Waitahuna Road | 10 | 4 | 6 | |||
| Weatherstone | 166 | 92 | 74 | |||
| Weatherstone Flat | 271 | 165 | 106 | |||
| Total Riding | 1,518 | 881 | 637 | |||
| Riding of Waipori— | ||||||
| Commonage Creek | 33 | 26 | 7 | |||
| Jetland Flat | 87 | 61 | 26 | |||
| Lammerlaw East | 11 | 11 | … | |||
| Lammerlaw West | 28 | 28 | … | |||
| Lee Flat Station | 18 | 16 | 2 | |||
| Mitchell's Flat | 35 | 34 | 1 | |||
| Verterburn | 4 | 4 | … | |||
| Waipori, T. | 116 | 80 | 36 | |||
| Waipori Flat East | 66 | 45 | 21 | |||
| Waipori Flat West | 61 | 40 | 21 | |||
| Total Riding | 459 | 345 | 114 | |||
| Riding of Clark's— | ||||||
| Clark's Flat | 36 | 27 | 9 | |||
| Forsyth | 12 | 7 | 5 | |||
| German Flat | 38 | 20 | 18 | |||
| Hospital Flat | 18 | 10 | 8 | |||
| Newton | 15 | 9 | 6 | |||
| Paddy's Point | 47 | 28 | 19 | |||
| Tuapeka East (part) | 17 | 7 | 10 | |||
| Waitahuna | 46 | 24 | 22 | |||
| Waitahuna Gully (part) | 13 | 10 | 3 | |||
| Waitahuna West | 42 | 24 | 18 | |||
| Others | 15 | 6 | 9 | |||
| Total Riding | 299 | 172 | 127 | |||
| Riding of Waitahuna— | ||||||
| Havelock, T. | 428 | 280 | 148 | |||
| Reidy Creek | 5 | 5 | … | |||
| Waitahuna East | 259 | 145 | 114 | |||
| Waitahuna Gully (part) | 381 | 235 | 146 | |||
| Total Riding | 1,073 | 665 | 408 | |||
| Road Districts— | Total. | M. | F. | |||
| Tuapeka | 2,116 | 1,274 | 843 | |||
| Waitahuna | 1,157 | 715 | 442 | |||
| Outlying | 3,107 | 1,981 | 1,126 | |||
| Country, Riding, Town, Locality, and Road District. | Total. | M. | F. | |||
|---|---|---|---|---|---|---|
| MANIOTOTO COUNTY. | ||||||
| Riding of St. Bathans— | ||||||
| Beck's | 68 | 39 | 29 | |||
| Cambrian's | 115 | 66 | 49 | |||
| Downs | 22 | 18 | 4 | |||
| Muddy Creek | 70 | 42 | 28 | |||
| St. Bathans, T. | 190 | 94 | 96 | |||
| Vinegar Hill | 76 | 56 | 20 | |||
| Others | 4 | 4 | … | |||
| Total Riding | 545 | 319 | 226 | |||
| Riding of Idaburn— | ||||||
| Blackstone Hill Station | 20 | 15 | 5 | |||
| Clyde Road | 39 | 23 | 16 | |||
| Hawkdun Range | 13 | 12 | 1 | |||
| Hill's Creek | 41 | 23 | 18 | |||
| Peg-leg Gully | 19 | 14 | 5 | |||
| Rough Ridge | 39 | 23 | 16 | |||
| Woolshed Road | 40 | 24 | 16 | |||
| Total Riding | 211 | 134 | 77 | |||
| Riding of Mount Ida— | ||||||
| Brown's Gully | 8 | 8 | … | |||
| Butcher's Gully | 12 | 1 | … | |||
| Cemetery Road | 8 | 5 | 3 | |||
| Clarke's | 19 | 19 | … | |||
| Coalpit Gully | 19 | 9 | 10 | |||
| Dead Level | 5 | 2 | 3 | |||
| Eilen Creek | 4 | 3 | 1 | |||
| Enterprise | 69 | 40 | 29 | |||
| Eweburn | 106 | 68 | 38 | |||
| Garibaldi | 11 | 5 | 6 | |||
| Hamilton Road | 19 | 10 | 9 | |||
| Highfield | 8 | 4 | 4 | |||
| Hogburn Creek | 16 | 7 | 9 | |||
| Home Gully | 155 | 81 | 74 | |||
| Hospital and Road | 14 | 9 | 5 | |||
| Kyeburn Station | 22 | 15 | 7 | |||
| Main Gully | 78 | 52 | 26 | |||
| Maniototo Station | 18 | 10 | 8 | |||
| Ringfence Farm | 11 | 8 | 3 | |||
| Spec Gully | 49 | 43 | 4 | |||
| Swineburn (part) | 23 | 18 | 5 | |||
| Wetherburn | 17 | 12 | 5 | |||
| Whet Gully | 47 | 29 | 18 | |||
| Others | 15 | 10 | 5 | |||
| Total Riding | 753 | 478 | 275 | |||
| Riding of Kyeburn— | ||||||
| Kyeburn Diggings | 261 | 189 | 72 | |||
| Kyeburn Hundred | 31 | 20 | 11 | |||
| Swineburn (part) | 53 | 31 | 22 | |||
| Total Riding | 343 | 240 | 105 | |||
| Riding of Hyde— | ||||||
| Hyde, T. | 49 | 33 | 11 | |||
| Main Road to Naseby | 64 | 36 | 28 | |||
| Maungatua | 40 | 22 | 18 | |||
| Strath Taieri Road | 83 | 54 | 29 | |||
| Total Riding | 236 | 150 | 86 | |||
| Riding of Puketoi— | ||||||
| Gorge Farm | 5 | 3 | 2 | |||
| Hamilton, T. | 19 | 10 | 9 | |||
| Hamilton vicinity | 45 | 34 | 11 | |||
| Hamilton Station | 8 | 7 | 1 | |||
| Pateroa Station | 16 | 11 | 5 | |||
| Shepherd's Hut | 64 | 35 | 29 | |||
| Sherman's Station | 17 | 13 | 4 | |||
| Sowburn Creek | 97 | 53 | 44 | |||
| Three-Mile | 8 | 5 | 3 | |||
| Total Riding | 279 | 171 | 108 | |||
| Riding of Serpentine— | ||||||
| Black Ball | 6 | 1 | 4 | |||
| Bond's Creek | 12 | 11 | 1 | |||
| Deep Creek | 2 | 2 | … | |||
| German Jack's | 6 | 6 | … | |||
| Lammerlaw | 2 | 2 | … | |||
| Linburn | 16 | 11 | 5 | |||
| Serpentine | 22 | 16 | 6 | |||
| Styx Creek | 14 | 9 | 5 | |||
| Upper Taieri | 5 | 4 | 1 | |||
| Total Riding | 83 | 63 | 22 | |||
| VINCENT COUNTY. | ||||||
| Riding of Hawea— | ||||||
| Cluden | 13 | 10 | 3 | |||
| Hawea | 70 | 47 | 23 | |||
| Hunter's River | 6 | 6 | … | |||
| Lake Hawea | 33 | 25 | 18 | |||
| Lindis | 62 | 44 | 18 | |||
| Long Valley | 9 | 9 | … | |||
| Makaroa | 26 | 14 | 12 | |||
| Tanas | 33 | 24 | 9 | |||
| Wilkin | 6 | 6 | … | |||
| Total Riding | 258 | 185 | 73 | |||
| Riding of Kawarau— | ||||||
| Adams Gully | 11 | 11 | … | |||
| Bannockburn | 273 | 182 | 9l | |||
| Carrick Range | 4 | 4 | … | |||
| Doctor's Flat | 69 | 43 | 26 | |||
| Duffer's Gully | 6 | 3 | 3 | |||
| Forkburn | 10 | 6 | 4 | |||
| Kawarau Flat | 4 | 4 | … | |||
| Kawarau Station | 16 | 15 | 1 | |||
| Quartz Vale | 28 | 16 | 12 | |||
| Shepherd's Creek | 35 | 19 | 16 | |||
| Smith's Creek | 18 | 17 | 1 | |||
| Others | 8 | 8 | … | |||
| Total Riding | 482 | 328 | 154 | |||
| Riding of Nevis— | ||||||
| Lower Nevis | 129 | 116 | 13 | |||
| Nevis Crossing | 41 | 29 | 12 | |||
| Scotchman's Gully | 15 | 9 | 6 | |||
| Upper Nevis Flat | 23 | 18 | 5 | |||
| Others | 11 | 11 | … | |||
| Total Riding | 219 | 183 | 36 | |||
| Riding of Eanscleugh— | ||||||
| Bald Hill | 85 | 52 | 33 | |||
| Butcher's Gully | 43 | 36 | 7 | |||
| Conroy's Gully | 42 | 34 | 8 | |||
| Earnscleugh Station | 25 | 17 | 8 | |||
| Hawksburn Station | 38 | 35 | 3 | |||
| O'Brien's Gorge | 10 | 9 | 1 | |||
| Poverty Beach | 40 | 26 | 14 | |||
| Sandy Point | 18 | 12 | 6 | |||
| Twelve-Mile Beach | 23 | 23 | … | |||
| Others | 12 | 9 | 3 | |||
| Total Riding | 336 | 253 | 83 | |||
| Riding of Manuherikia— | ||||||
| Black's, T. | 242 | 154 | 88 | |||
| German Hill | 14 | 12 | 2 | |||
| Ida Valley | 130 | 92 | 38 | |||
| Long Valley Creek | 9 | 8 | 1 | |||
| Maori Gully | 27 | 24 | 3 | |||
| Total Riding | 422 | 290 | 132 | |||
| Riding of Lindis— | ||||||
| Ardgour Station | 13 | 9 | 4 | |||
| Bendigo Gully | 8 | 7 | 1 | |||
| Clutha Valley | 7 | 5 | 2 | |||
| Country, Riding, Town, Locality, and Road District. | Total. | M. | F. | |||
|---|---|---|---|---|---|---|
| VINCENT COUNTY—continued. | ||||||
| Riding of Lindis—continued. | ||||||
| Dunstan Road (part) | 20 | 14 | 6 | |||
| Leaning Rock | 4 | 4 | … | |||
| Logantown | 25 | 14 | 11 | |||
| Molyneux River, west side | 9 | 9 | … | |||
| Quartz-Reef Point | 42 | 25 | 17 | |||
| Rise and Shine | 15 | 11 | 4 | |||
| Rocky Point | 7 | 4 | 3 | |||
| Wakefield | 23 | 11 | 12 | |||
| Welshtown, T. | 77 | 57 | 20 | |||
| Total Riding | 250 | 170 | 80 | |||
| Riding of Dunstan— | ||||||
| Butcher's Point | 7 | 7 | … | |||
| Chatto Creek | 6 | 3 | 3 | |||
| Clyde, T. | 340 | 185 | 155 | |||
| Disputed Spur | 9 | 4 | 5 | |||
| Doctor's Point Road | 36 | 36 | … | |||
| Dunstan Common | 59 | 35 | 24 | |||
| Dunstan Flat | 9 | 7 | 2 | |||
| Dunstan Road (part) | 32 | 24 | 8 | |||
| Galloway Station | 41 | 30 | 11 | |||
| Little Valley | 9 | 5 | 4 | |||
| Manorburn Creek | 38 | 38 | … | |||
| Manuherikia Road | 83 | 46 | 37 | |||
| Molyneux River | 33 | 19 | 14 | |||
| Moutrie | 21 | 13 | 8 | |||
| Spring Vale | 13 | 9 | 4 | |||
| Young Hill Creek | 10 | 7 | 3 | |||
| Others | 6 | 5 | 1 | |||
| Total Riding | 752 | 473 | 279 | |||
| Riding of Clutha— | ||||||
| Burnt Cottage Road | 9 | 4 | 5 | |||
| Cardrona Scrub | 12 | 6 | 6 | |||
| Cardrona Tarras | 18 | 12 | 6 | |||
| Cornishtown | 45 | 27 | 18 | |||
| Cromwell Flat | 70 | 50 | 20 | |||
| Five-Mile Creek | 6 | 6 | … | |||
| Kaiwaru Gorge | 84 | 47 | 37 | |||
| Lowburn | 50 | 36 | 14 | |||
| Luggateburn | 38 | 36 | 2 | |||
| Mount Pisa Station and River | 35 | 26 | 9 | |||
| Newcastle, T. | 37 | 22 | 15 | |||
| Poison Creek | 24 | 15 | 9 | |||
| Wanaka | 5 | 4 | 1 | |||
| Others | 5 | 5 | … | |||
| Total Riding | 438 | 296 | 142 | |||
| Riding of Matakanui— | ||||||
| Devonshire Gully | 20 | 11 | 9 | |||
| Drybread | 86 | 52 | 34 | |||
| Lauder Creek | 5 | 2 | 3 | |||
| Matakanui | 8 | 5 | 3 | |||
| Thompson's | 11 | 11 | … | |||
| Tiger Hill | 100 | 63 | 37 | |||
| Tinker's | 178 | 109 | 69 | |||
| Total Riding | 408 | 253 | 155 | |||
| LAKE COUNTY. | ||||||
| Riding of Arrow— | ||||||
| Arrow Flat | 93 | 41 | 52 | |||
| Arrow Junction | 61 | 39 | 22 | |||
| Arrow River (part) | 21 | 19 | 2 | |||
| Bracken's Gully | 16 | 16 | … | |||
| Bush Creek | 12 | 8 | 4 | |||
| Crown Terrace | 59 | 40 | 19 | |||
| Gentle Annie | 6 | 6 | … | |||
| Hayes Creek | 36 | 24 | 12 | |||
| Hogan's Gully | 6 | 3 | 3 | |||
| Kawarau, T. | 121 | 78 | 43 | |||
| Lake Hayes | 63 | 34 | 29 | |||
| Lower Shotover | 81 | 48 | 33 | |||
| Miller's Flat (part) | 70 | 41 | 29 | |||
| Speargrass Flat | 20 | 13 | 7 | |||
| Whitechapel Flat | 13 | 9 | 4 | |||
| Others | 20 | 18 | 2 | |||
| Total Riding | 698 | 437 | 261 | |||
| Riding of Cardrona— | ||||||
| Branch Creek | 23 | 14 | 9 | |||
| Cardrona, T. | 38 | 29 | 9 | |||
| Cardrona Valley | 164 | 118 | 46 | |||
| Matatapu | 8 | 8 | … | |||
| Mount Barker | 25 | 15 | 10 | |||
| Pembroke, T. | 52 | 30 | 22 | |||
| Wanaka Station | 24 | 16 | 8 | |||
| Total Riding | 334 | 230 | 104 | |||
| Riding of Matukituki— | ||||||
| Advance Peak | 2 | 2 | … | |||
| Arrow River (part) | 5 | 5 | … | |||
| Macetown, T. | 135 | 102 | 33 | |||
| Matatapu Valley | 36 | 36 | … | |||
| Matukituki Valley | 34 | 26 | 8 | |||
| Sawyer's Gully | 32 | 32 | … | |||
| Scanlan's Gully | 37 | 35 | 2 | |||
| Wanaka | 11 | 9 | 2 | |||
| Total Riding | 292 | 247 | 45 | |||
| Riding of Shotover— | ||||||
| Berrill's Terrace | 22 | 12 | 10 | |||
| Branches | 23 | 21 | 2 | |||
| Deep Creek | 6 | 5 | 1 | |||
| Glenorchy | 37 | 29 | 8 | |||
| Londonderry Terrace | 11 | 7 | 4 | |||
| Long Gully | 7 | 4 | 3 | |||
| Maori Point | 16 | 12 | 4 | |||
| Nugget Reefs | 13 | 11 | 2 | |||
| Pleasant Terrace Creek | 17 | 10 | 7 | |||
| Sandhills | 40 | 33 | 7 | |||
| Skipper's Creek | 18 | 14 | 4 | |||
| Skipper's Point | 30 | 18 | 12 | |||
| Skipper's Reefs | 23 | 24 | 1 | |||
| Stony Creek | 38 | 34 | 4 | |||
| Total Riding | 303 | 234 | 69 | |||
| Riding of Queenstown— | ||||||
| Arthur's Point | 64 | 45 | 19 | |||
| Boye's Station | 32 | 21 | 11 | |||
| Frankton and vicinity | 130 | 76 | 54 | |||
| Island on Lake Wakatipu | 1 | 1 | … | |||
| Lower Shotover | 22 | 15 | 7 | |||
| Miller's Flat (part) | 91 | 54 | 37 | |||
| Moke Creek | 58 | 44 | 14 | |||
| Moonlight | 40 | 39 | 1 | |||
| Seven-Mile Creek | 10 | 6 | 4 | |||
| Twelve-Mile Creek | 22 | 21 | 1 | |||
| Twenty-Five Mile Creek | 11 | 9 | 2 | |||
| Vicinity of Queenstown | 18 | 10 | 8 | |||
| Total Riding | 499 | 341 | 158 | |||
| Riding of Kingston— | ||||||
| Beach Bay | 23 | 10 | 13 | |||
| Bob's Bay | 18 | 13 | 5 | |||
| Fairlight Crossing | 10 | 7 | 3 | |||
| Fern Mill | 6 | 5 | 1 | |||
| Halfway Bay | 17 | 12 | 5 | |||
| Kingston, T. | 26 | 18 | 8 | |||
| Kingston vicinity | 28 | 15 | 13 | |||
| Mount Nicholas | 12 | 10 | 2 | |||
| Naylor's Crossing | 11 | 10 | 1 | |||
| Ten-Mile Railway Crossing | 74 | 47 | 27 | |||
| Total Riding | 225 | 147 | 78 | |||
| Country, Riding, Town, Locality, and Road District. | Total. | M. | F. | |||
|---|---|---|---|---|---|---|
| LAKE COUNTY—continued. | ||||||
| Riding of Greenstone— | ||||||
| Dart River | 16 | 14 | 2 | |||
| Earnslaw | 6 | 3 | 3 | |||
| Greenstone | 3 | 3 | … | |||
| Greenstone Bush | 23 | 13 | 10 | |||
| Greenstone Valley | 2 | 2 | … | |||
| Highburn Creek | 2 | 2 | … | |||
| Hollyford Valley | 5 | 5 | … | |||
| Kinloch | 37 | 20 | 17 | |||
| Longbush | 13 | 9 | 4 | |||
| Martin's Bay | 20 | 8 | 12 | |||
| Milford Sound | 2 | 2 | … | |||
| Paradise Flat | 4 | 4 | … | |||
| Pass Creek | 2 | 2 | … | |||
| Total Riding | 135 | 87 | 48 | |||
| SOUTHLAND COUNTY. | ||||||
| Riding of Awarua— | ||||||
| Bay Road, Grassmere | 134 | 64 | 70 | |||
| Bluff Road | 72 | 36 | 36 | |||
| Bushey Point | 11 | 11 | … | |||
| Clarendon | 100 | 54 | 46 | |||
| Colyer's Island | 7 | 4 | 3 | |||
| Dog Island Lighthouse | 8 | 3 | 5 | |||
| Elles Road | 22 | 14 | 8 | |||
| Greenhills District, Bluff Road | 117 | 68 | 49 | |||
| Harewood District, Bluff Road | 35 | 17 | 18 | |||
| Hawthorne | 23 | 11 | 12 | |||
| Makarewa Bush | 22 | 10 | 12 | |||
| Makarewa, T. | 208 | 119 | 89 | |||
| Mill Road | 18 | 12 | 6 | |||
| Mokomoko | 7 | 5 | 2 | |||
| Moore's Road | 39 | 22 | 17 | |||
| Myross Bush, Mclvor's Road (part) | 35 | 17 | 18 | |||
| New River | 16 | 13 | 3 | |||
| New River Ferry | 17 | 9 | 8 | |||
| North Road | 22 | 9 | 13 | |||
| Ototara Bush | 113 | 59 | 54 | |||
| Rosedale | 11 | 6 | 5 | |||
| Sandy Point | 21 | 15 | 6 | |||
| Stanley | 6 | 3 | 3 | |||
| Tewai Point | 9 | 5 | 4 | |||
| Waikiwi District | 24 | 12 | 12 | |||
| Waikiwi East | 63 | 33 | 30 | |||
| Waikiwi North Road | 346 | 195 | 151 | |||
| West Plains and Road | 212 | 112 | 100 | |||
| Willowdale | 8 | 4 | 4 | |||
| Woodend, T. | 31 | 30 | 21 | |||
| Others | 45 | 29 | 16 | |||
| Total Riding | 1,822 | 1,001 | 821 | |||
| Riding of Wallacetown— | ||||||
| Ryal Bush | 196 | 100 | 96 | |||
| Spar Bush (part) | 219 | 137 | 82 | |||
| Waianiwa | 202 | 104 | 98 | |||
| Waimatuku (part) | 140 | 91 | 49 | |||
| Wallacetown, T. | 190 | 96 | 94 | |||
| Wallacetown Plain | 55 | 38 | 17 | |||
| Total Riding | 1,002 | 566 | 436 | |||
| Riding of Winton— | ||||||
| Benmore | 95 | 61 | 34 | |||
| Centre Bush | 135 | 84 | 51 | |||
| Dipton | 189 | 109 | 80 | |||
| Dunsdale | 21 | 13 | 8 | |||
| East Dipton | 23 | 10 | 13 | |||
| East Winton | 63 | 35 | 28 | |||
| Elderslie | 8 | 5 | 3 | |||
| Fern Bush | 23 | 12 | 11 | |||
| Forest Hill | 138 | 89 | 69 | |||
| Gap Road | 152 | 85 | 67 | |||
| Harrington's Crossing | 10 | 3 | 7 | |||
| Hedgehope (part) | 40 | 24 | 16 | |||
| Hokonui (part) | 21 | 15 | 6 | |||
| Lady Barclay | 40 | 18 | 22 | |||
| Lime Hills, T. | 48 | 24 | 24 | |||
| Lime Hills | 31 | 20 | 11 | |||
| Lora | 25 | 19 | 6 | |||
| Lora Flat | 17 | 12 | 5 | |||
| Lora Gorge | 6 | 5 | 1 | |||
| Makarewa (part) | 41 | 24 | 17 | |||
| Oreti (part) | 20 | 12 | 8 | |||
| Otapiri (part) | 89 | 46 | 43 | |||
| Spar Bush (part) | 47 | 37 | 10 | |||
| Waimatuku (part) | 30 | 27 | 23 | |||
| Wallacetown (part) | 87 | 56 | 31 | |||
| Winton | 339 | 179 | 160 | |||
| Winton Hill | 19 | 13 | 6 | |||
| Others | 18 | 12 | 6 | |||
| Total Riding | 1,815 | 1,049 | 766 | |||
| Riding of Waihopai— | ||||||
| Bridge Inn | 23 | 15 | 8 | |||
| Brunswick | 65 | 34 | 31 | |||
| Chatsworth | 36 | 16 | 20 | |||
| Dunedin Road | 36 | 22 | 14 | |||
| East Road | 77 | 39 | 38 | |||
| Edendale Plains | 9 | 4 | 5 | |||
| Flemington | 14 | 8 | 6 | |||
| Grove Bush | 38 | 21 | 17 | |||
| Inglewood | 25 | 13 | 12 | |||
| Kensington | 17 | 10 | 7 | |||
| Longbush, T. | 211 | 115 | 96 | |||
| Longbush | 42 | 24 | 18 | |||
| Mabel Bush | 154 | 85 | 69 | |||
| Mavis Bush | 47 | 25 | 22 | |||
| Mona Bush | 27 | 18 | 9 | |||
| Morton Mains | 27 | 18 | 9 | |||
| Myross Bush (part) | 66 | 36 | 30 | |||
| One-Tree Point | 54 | 31 | 23 | |||
| Oteramika | 240 | 135 | 105 | |||
| Puni Bush | 23 | 14 | 9 | |||
| Rakahouka | 32 | 18 | 14 | |||
| Richmond Grove | 93 | 43 | 50 | |||
| Roslyn Bush | 108 | 56 | 52 | |||
| Seaward Bush | 173 | 94 | 79 | |||
| The Gorge | 63 | 33 | 30 | |||
| Woodlands | 61 | 34 | 27 | |||
| Others | 48 | 28 | 20 | |||
| Total Riding | 1,809 | 989 | 820 | |||
| Riding of Fortrose— | ||||||
| Bushy Point | 11 | 11 | … | |||
| Fortification | 3 | 3 | … | |||
| Fortrose, T. | 34 | 19 | 15 | |||
| Otara | 6 | 6 | … | |||
| Pine Bush | 65 | 43 | 22 | |||
| Toitois | 230 | 144 | 86 | |||
| Tokonui | 6 | 4 | 2 | |||
| Waikawa Beach | 13 | 7 | 6 | |||
| Waikawa Gorge | 3 | 2 | 1 | |||
| Waikawa Harbour | 18 | 10 | 8 | |||
| Waimahaka | 15 | 11 | 4 | |||
| Waipapa | 7 | 6 | 1 | |||
| Yellow Bluff | 2 | 1 | 1 | |||
| Total Riding | 413 | 267 | 146 | |||
| Riding of Wyndham— | ||||||
| Edendale, T. | 139 | 63 | 76 | |||
| Edendale | 45 | 34 | 11 | |||
| Island | 19 | 14 | 5 | |||
| Kaiwera (part) | 42 | 31 | 11 | |||
| Marairua | 249 | 145 | 104 | |||
| Mataura River | 62 | 43 | 19 | |||
| Menzies Ferry | 10 | 7 | 3 | |||
| Mokareta | 16 | 9 | 7 | |||
| Otaraia (part) | 35 | 22 | 13 | |||
| Country, Riding, Town, Locality, and Road District. | Total. | M. | F. | |||
|---|---|---|---|---|---|---|
| SOUTHLAND COUNTY—contd. | ||||||
| Riding of Wyndham—continued. | ||||||
| Oware | 213 | 120 | 93 | |||
| Redan | 53 | 35 | 18 | |||
| South Wyndham | 165 | 109 | 56 | |||
| Waikana (part) | 46 | 26 | … | |||
| Wairikiki | 64 | 39 | 25 | |||
| Wyndham, T. | 233 | 136 | 97 | |||
| Total Riding | 1,391 | 833 | 558 | |||
| Riding of Gore— | ||||||
| Bushy Park | 9 | 5 | 4 | |||
| Charlton and Creek | 9 | 9 | … | |||
| Chatton | 138 | 80 | 58 | |||
| Croydon Eush | 17 | 12 | 5 | |||
| Croydon Main Road | 46 | 28 | 18 | |||
| Croydon vicinity | 36 | 28 | 8 | |||
| Edendale Station | 9 | 7 | … | |||
| Glen-Duo Station | 7 | 5 | 2 | |||
| Gore East, T. | 195 | 113 | 82 | |||
| Gore West, T. | 374 | 217 | 157 | |||
| Gore vicinity | 47 | 29 | 18 | |||
| Hedgehope (part) | 6 | 2 | 4 | |||
| Hokonui (part) | 137 | 88 | 49 | |||
| Hokonui Bush Station | 8 | 5 | 3 | |||
| Hokonui Range | 30 | 24 | 6 | |||
| Kaiwera (part) | 49 | 27 | 22 | |||
| Main Road | 31 | 21 | 10 | |||
| Mandeville, T. | 12 | 7 | 5 | |||
| Mataura, T. | 410 | 214 | 196 | |||
| Otama | 352 | 214 | 138 | |||
| Otaraia (part) | 48 | 33 | 15 | |||
| Otuia | 140 | 92 | 48 | |||
| Pukerau | 155 | 100 | 55 | |||
| Pukerau, T. | 25 | 12 | 13 | |||
| Pyramids | 13 | 11 | 2 | |||
| Raby Station | 12 | 6 | 6 | |||
| Railway-line | 18 | 13 | 5 | |||
| Riversdale, T. | 29 | 21 | 8 | |||
| Waikaka | 461 | 270 | 191 | |||
| Waikaka, T. | 75 | 57 | 18 | |||
| Waikana (part) | 172 | 105 | 67 | |||
| Waimea Plains | 73 | 68 | 5 | |||
| Waimea Station | 47 | 41 | 6 | |||
| Wantwood | 5 | 3 | 2 | |||
| Wantwood Station | 12 | 10 | 2 | |||
| Others | 36 | 29 | 7 | |||
| Total Riding | 3,243 | 2,006 | 1,237 | |||
| Riding of Waikaia— | ||||||
| Gow's Creek | 8 | 8 | … | |||
| Hidehome Run | 63 | 44 | 19 | |||
| Nokomai, T. | 86 | 73 | 13 | |||
| North Waikaia Valley | 68 | 53 | 15 | |||
| Waikaia, T. | 199 | 117 | 82 | |||
| Waikaia Valley | 190 | 129 | 61 | |||
| Welshman's Gully | 59 | 59 | … | |||
| Whitecombe | 147 | 139 | 8 | |||
| Winding Creek | 97 | 80 | 17 | |||
| Total Riding | 917 | 702 | 215 | |||
| Riding of Oreti— | ||||||
| Ardlussa | 10 | 7 | 3 | |||
| Athol, T. | 126 | 78 | 48 | |||
| Caroline | 36 | 22 | 14 | |||
| Castlerock | 122 | 100 | 22 | |||
| Dome | 18 | 16 | 2 | |||
| Dunrobin Station | 2 | 2 | … | |||
| Eyre Creek | 6 | 4 | 2 | |||
| Five Rivers | 33 | 27 | 6 | |||
| Glenure | 13 | 11 | … | |||
| Longridge | 73 | 51 | 22 | |||
| Lowther | 19 | 12 | 7 | |||
| Lumsden, T. | 301 | 180 | 121 | |||
| Oreti (part) | 38 | 22 | 16 | |||
| Otapiri (part) | 6 | 4 | 2 | |||
| Total Riding | 803 | 536 | 267 | |||
| Southland and Wallace Road Districts. | Total. | M. | F. | |||
| Aparima | 2,473 | 1,496 | 977 | |||
| Invercargill | 889 | 470 | 419 | |||
| Knapdale | 1,226 | 739 | 487 | |||
| Lyndhurst | 1,107 | 624 | 483 | |||
| Makarewa | 3,827 | 1,564 | 1,263 | |||
| Oreti | 3,029 | 2,051 | 978 | |||
| Otaraia | 498 | 317 | 181 | |||
| Oteramika | 1,007 | 583 | 424 | |||
| Riverton | 916 | 647 | 269 | |||
| Toitois | 350 | 221 | 129 | |||
| Tuturau | 778 | 441 | 337 | |||
| Waikaia | 919 | 706 | 213 | |||
| Wyndham | 499 | 291 | 208 | |||
| Wyndham South | 165 | 108 | 57 | |||
| Outlying | 148 | 97 | 51 | |||
| WALLACE COUNTY. | ||||||
| Riding of Aparima— | ||||||
| Blackwater | 22 | 14 | 8 | |||
| Boatswain's Bush | 21 | 9 | 12 | |||
| Danielstown | 11 | 7 | 4 | |||
| Endall | 22 | 18 | 4 | |||
| Fairfax | 11 | 6 | 5 | |||
| Flint's Bush, T | 14 | 9 | 5 | |||
| Flint's Bush District | 46 | 25 | 21 | |||
| Groper's Bush District | 160 | 91 | 69 | |||
| Gummie's Bush District | 65 | 35 | 30 | |||
| Invercargill and Riverton Road | 28 | 16 | 12 | |||
| Invercargill and Yellow Road | 15 | 12 | 3 | |||
| Jacob's River Flat | 148 | 88 | 60 | |||
| Limestone Plains | 30 | 22 | 8 | |||
| Native Reserve | 159 | 114 | 45 | |||
| Otaitai Bush | 75 | 38 | 37 | |||
| Riverton and Invercargill Railway-line | 17 | 10 | 7 | |||
| Riverton and Otautau Railway-line | 6 | 4 | 2 | |||
| Riverton and Otautau Road | 15 | 8 | 7 | |||
| Riverton and Yellow Bluff Road | 43 | 24 | 19 | |||
| Riverton Highlands | 4 | 2 | … | |||
| Stevens Bush | 8 | 3 | 5 | |||
| Thornbury | 108 | 58 | 50 | |||
| Waimatuku, T. | 10 | 5 | 5 | |||
| Waimatuku Flat | 66 | 42 | 24 | |||
| Westwood | 18 | 12 | 6 | |||
| Wild Bush | 28 | 15 | 13 | |||
| Total Riding | 1,150 | 687 | 463 | |||
| Riding of Otautau— | ||||||
| Bayswater | 57 | 55 | 2 | |||
| Calcium, T. | 12 | 7 | 5 | |||
| Gladfield | 48 | 44 | 4 | |||
| Heddon Bush (part) | 13 | 7 | 6 | |||
| Kingsway | 30 | 21 | 9 | |||
| Limestone Plains | 83 | 50 | 33 | |||
| Mount Pleasant | 11 | 7 | 4 | |||
| Oreti Flat | 12 | 10 | 2 | |||
| Oreti Plain | 121 | 63 | 58 | |||
| Otautau, T | 185 | 102 | 83 | |||
| Raymond's Gap (part) | 16 | 6 | 10 | |||
| Scot's Gap | 13 | 5 | 8 | |||
| Strathmore | 48 | 30 | 18 | |||
| Strathvale | 9 | 8 | 1 | |||
| Waicolo Plain | 23 | 8 | 15 | |||
| Total Riding | 681 | 423 | 258 | |||
| Riding of Orepuki— | ||||||
| Colac Bay | 4 | 1 | 3 | |||
| Howell's Point | 11 | 7 | 4 | |||
| Lake George | 19 | 19 | … | |||
| Longwood | 34 | 1 | 10 | |||
| Orepuki | 303 | 174 | 129 | |||
| Orepuki Railway-line | 29 | 23 | 6 | |||
| Purakino, T. | 10 | 6 | 4 | |||
| Purakino vicinity | 27 | 17 | 10 | |||
| Pahia | 20 | 16 | 4 | |||
| Round Hill | 294 | 287 | 7 | |||
| Country, Riding, Town, Locality, and Road District. | Total. | M. | F. | |||
|---|---|---|---|---|---|---|
| WALLACE COUNTY—continued. | ||||||
| Riding of Orepuki—continued. | ||||||
| South Riverton, T. | 157 | 76 | 81 | |||
| Wakaputu | 10 | 5 | 5 | |||
| Total Riding | 918 | 655 | 263 | |||
| Riding of Wairio— | ||||||
| Annandale, Wrey's Bush | 70 | 38 | 32 | |||
| Avondale | 14 | 14 | … | |||
| Beaumont | 22 | 14 | 8 | |||
| Birchwood | 33 | 24 | 9 | |||
| Castlebank | 2 | 2 | … | |||
| Coal-pit, Nightcaps | 34 | 25 | 9 | |||
| Dunrobin | 11 | 11 | … | |||
| Etal | 4 | 2 | 2 | |||
| Fairburn | 17 | 9 | 8 | |||
| Glenroy | 24 | 16 | 8 | |||
| Heddon Bush (part) | 16 | 14 | 2 | |||
| Mount Linton | 23 | 21 | 2 | |||
| Springfield | 14 | 8 | 6 | |||
| Waicolo | 36 | 27 | 9 | |||
| Wash | 4 | 3 | 1 | |||
| Westfield | 96 | 60 | 36 | |||
| Woodburn | 3 | 3 | … | |||
| Total Riding | 423 | 291 | 132 | |||
| Riding of Waiau— | ||||||
| Belmont | 16 | 12 | 4 | |||
| Black Mount | 9 | 6 | 3 | |||
| Clifden | 14 | 10 | 4 | |||
| Eastern Bush | 14 | 10 | 4 | |||
| Fenham | 9 | 5 | 4 | |||
| Grassy Creek | 6 | 3 | 3 | |||
| Merivale | 56 | 50 | 6 | |||
| Otahu | 18 | 11 | 7 | |||
| Raymond's Gap (part) | 12 | 4 | 8 | |||
| Redcliff | 7 | 4 | 3 | |||
| Sunnyside | 6 | 2 | 4 | |||
| Taylor's Flat | 18 | 10 | 8 | |||
| Others | 27 | 25 | 2 | |||
| Total Riding | 212 | 152 | 60 | |||
| Riding of Mararoa— | ||||||
| Bold Hill | 5 | 4 | 1 | |||
| Burwood | 29 | 24 | 5 | |||
| Castlerock | 2 | 2 | … | |||
| Centre Hill | 38 | 30 | 8 | |||
| Cheviot Hills | 9 | 6 | 3 | |||
| Clayton's Flat | 6 | 6 | … | |||
| Eglington | 4 | 4 | … | |||
| Hamilton's Burn | 18 | 16 | 2 | |||
| Haycock's | 2 | 2 | … | |||
| Lake Te Anau, west side | 1 | 1 | … | |||
| Lynwood Station | 20 | 16 | 4 | |||
| Manipori Lake | 2 | 2 | … | |||
| Manipori Station | 11 | 10 | 1 | |||
| Mararoa Plains | 21 | 20 | 1 | |||
| Mararoa Station | 21 | 20 | 1 | |||
| Mavora Lake | 12 | 11 | 1 | |||
| McKellar's Flat | 5 | 5 | … | |||
| Princhester Creek | 5 | 5 | … | |||
| Roundhill | 19 | 12 | 7 | |||
| Takitimo | 2 | 2 | … | |||
| Total Riding | 232 | 198 | 34 | |||
| (For Road Districts, see Southland.) | ||||||
| FJORD COUNTY. | ||||||
| (No Ridings.) | ||||||
| Dusky Sound | 1 | 1 | … | |||
| Puysegur Point | 12 | 4 | 8 | |||
| Total | 13 | 5 | 8 | |||
| STEWART ISLAND COUNTY. | ||||||
| Half-moon Bay | 83 | 45 | 38 | |||
| Horseshoe Bay | 26 | 26 | … | |||
| Muttonbird Islands | 7 | 2 | 5 | |||
| Paterson's Inlet | 33 | 19 | 14 | |||
| Port William | 22 | 16 | 6 | |||
| The Neck | 77 | 45 | 32 | |||
| West Extremity | 3 | 3 | … | |||
| Centre Island | 15 | 7 | 8 | |||
| Ruapuke Island | 3 | 1 | 2 | |||
| Total | 295 | 164 | 131 | |||
Table XXV. Table XXV. Showing the Population (exclusive of Maoris), the Number of Dwellinghouses Inhabited, and the Materials of which Constructed, according to the Census of 3rd April, 1881.
| Gold Fields. | Total Number of Persons. | Total (including Chinese). | Chinese | Inhabited Dwellings. | ||||||||
|---|---|---|---|---|---|---|---|---|---|---|---|---|
| Males. | Females. | Males. | Females. | Totals, Inhabited Houses and Tents. | Materials. | |||||||
| Brick or Stone. | Wood and Iron. | Cob, Sod, &c. | Raupo. | Huts of Sod, Clay, Wood, or Stone. | Tents and Dwellings with Canvas Roofs. | |||||||
| * Including Wangapeka. | ||||||||||||
| Hauraki | 11,618 | 6,418 | 5,200 | 8 | … | 2,495 | 3 | 2,355 | 39 | 19 | 29 | 50 |
| Te Aroha | 255 | 179 | 76 | … | … | 102 | … | 50 | 4 | 6 | 1 | 41 |
| Queen Charlotte Sound | 95 | 56 | 39 | … | … | 27 | … | 24 | … | … | … | 3 |
| Wairau and Pelorus | 326 | 250 | 76 | … | … | 129 | … | 57 | 11 | … | 20 | 41 |
| West Wanganui | 11 | 11 | … | … | … | 9 | … | 5 | … | … | 4 | … |
| Collingwood | 1,151 | 655 | 496 | … | … | 282 | … | 245 | 6 | … | 18 | 13 |
| Nelson South-West* | 8,584 | 5,693 | 2,891 | 450 | … | 3,422 | … | 2,390 | 37 | … | 734 | 261 |
| Westland | 9,749 | 6,366 | 3,383 | 689 | … | 3,214 | 2 | 2,567 | 14 | … | 457 | 174 |
| Otago | 20,953 | 13,504 | 7,449 | 2,472 | … | 5,155 | 575 | 2,445 | 1,278 | … | 515 | 342 |
| Orepuki and Longwood | 561 | 413 | 148 | 185 | … | 126 | … | 102 | 5 | … | 8 | 11 |
| Totals | 53,303 | 33,545 | 19,758 | 3,804 | … | 14,961 | 580 | 10,240 | 1,394 | 25 | 1,786 | 936 |
Table of Contents
Table I. Table I. Showing the Increase of Persons of Both Sexes, Males, and Females (exclusive of Maoris), at different Ages, in the Intervals between the various Censuses, from December, 1864, to April, 1881.
| Both Sexes. | ||||||||||||||||
|---|---|---|---|---|---|---|---|---|---|---|---|---|---|---|---|---|
| Ages. | Numbers, December, 1864. | 1864 to 1867. | Numbers, December, 1867. | 1867 to 1871. | Numbers, February, 1871. | 1871 to 1874. | Numbers, March, 1874. | 1874 to 1878. | Numbers, March, 1878. | 1878 to 1881. | Numbers, April, 1881. | |||||
| Numerical | Centesimal | Numerical | Centesimal | Numerical | Centesimal | Numerical | Centesimal | Numerical | Centesimal | |||||||
| NOTE.—Where a decrease has taken place a minus sign (−) is prefixed to the numerical or centesimal decrease. The periods of ages shown in this table are not, perhaps, the best that could be selected ; but, being those used in the Censuses prior to 1874, they are the only ones possible in a comparative table, including several Census-periods. | ||||||||||||||||
| Under 5 years | 26,632 | 10,760 | 40.40 | 37,392 | 9,l86 | 24.57 | 46,578 | 5,310 | 11.40 | 51,888 | 17,836 | 34.37 | 69,724 | 12,565 | 18.02 | 82,289 |
| 5 years and under 10 years | 18,557 | 6,133 | 33.05 | 24,690 | 7,962 | 32.25 | 32,652 | 10,651 | 32.62 | 43,303 | 16,287 | 37.61 | 59,590 | 8,325 | 13.97 | 67,915 |
| 10 years and under 15 years | 13,180 | 3,923 | 29.76 | 17,103 | 5,0l6 | 29.33 | 22,119 | 6,725 | 30.40 | 28,844 | l6,8l0 | 58.28 | 45,654 | 11,968 | 26.21 | 57,612. |
| 15 years and under 21 years | 15,148 | 2,314 | 15.28 | 17,459 | 2,729 | 15.63 | 20,l88 | 6,089 | 30.16 | 26,277 | 13,993 | 53.25 | 40,270 | 10,678 | 26.52 | 50,948 |
| 21 years and under 40 years | 76,318 | 16,502 | 21.62 | 92,817 | 4,893 | 51.27 | 97,710 | 1,410 | 11.44 | 99,120 | 28,000 | 28.25 | 127,120 | 14,649 | 11.52 | 141,769 |
| 40 years and under 55 years | 16,726 | 4,868 | 29.10 | 21,594 | 6,246 | 28.92 | 27,840 | 10,076 | 36.19 | 37,916 | 15,898 | 41.93 | 53,814 | 13,190 | 24.51 | 67,004 |
| 55 years and under 65 years | 3,757 | 1,003 | 26.70 | 4,760 | 1,499 | 31.49 | 6,259 | 1,659 | 26.51 | 7,918 | 3,196 | 40.36 | 11,114 | 3,045 | 27.40 | 14,159 |
| 65 years and upwards | 1,078 | 791 | 73.58 | 1,866 | 899 | 48.18 | 2,765 | 886 | 32.04 | 3,651 | 1,684 | 46.12 | 5,335 | 1,560 | 29.24 | 6,895 |
| Unspecified | 771 | 216 | 28.02 | 987 | −705 | 71.43 | 282 | 315 | 11.170 | 597 | 1,194 | 200.00 | 1,791 | −459 | −25.63 | 1,332 |
| All ages | 172,158 | 46,510 | 27.02 | 218,668 | 37,725 | 17.25 | 256,393 | 43,521 | 16.82 | 299,514 | 114,898 | 38.36 | 414,412 | 75,521 | 18.22 | 489,933 |
| Males. | ||||||||||||||||
| Under 5 years | 13.531 | 5,438 | 40.19 | 18,969 | 4,400 | 23.20 | 23,369 | 2,742 | 11.73 | 26,111 | 9,271 | 35.71 | 35,382 | 6,254 | 17.68 | 41,636 |
| 5 years and under 10 years | 9,474 | 3,033 | 32.01 | 12,507 | 3,921 | 31.35 | 16,428 | 5,367 | 32.67 | 21,795 | 8,039 | 36.88 | 29,834 | 4 471 | 14.99 | 34,305 |
| 10 years and under 15 years | 6,802 | 2,067 | 30.39 | 8,869 | 2,520 | 28.41 | 11,389 | 3,219 | 28.44 | 14,628 | 1,452 | 57.78 | 23,080 | 5,795 | 25.11 | 28,875 |
| 15 years and under 21 years | 8,108 | 655 | 8.08 | 8,763 | 1,375 | 15.69 | 10,118 | 3,213 | 31.69 | 13,351 | 6,711 | 50.27 | 20,062 | 5,163 | 25.74 | 25,225 |
| 21 years and under 40 years | 53,919 | 9,627 | 17.85 | 63,546 | 1,040 | 1.64 | 64,586 | −2,719 | −4.21 | 61,867 | 13,892 | 22.45 | 75,759 | 6,590 | 8.70 | 82,349 |
| 40 years and under 55 years | 11,023 | 3,332 | 30.23 | 14,355 | 4,395 | 30.62 | 18,750 | 7,017 | 37.42 | 25,767 | 9,846 | 38.60 | 35,613 | 8,011 | 24.29 | 43,624 |
| 55 years and under 65 years | 2,409 | 494 | 20.51 | 2,903 | 906 | 31.21 | 3,809 | 1,007 | 26.44 | 4,816 | 1,988 | 41.28 | 6,804 | 1,860 | 27.34 | 8,664 |
| 65 years and upwards | 657 | 471 | 71.69 | 1,128 | 535 | 47.43 | 1,663 | 508 | 30.55 | 2,171 | 932 | 42.93 | 3,103 | 854 | 27.52 | 3,957 |
| Unspecified | 657 | 232 | 35.31 | 889 | −665 | −74.8o | 224 | 251 | 112.05 | 475 | 886 | 18.653 | 1,361 | −391 | −28.73 | 970 |
| All ages | 106,580 | 25,349 | 23.78 | 131,929 | 18,427 | 13.97 | 150,356 | 20,625 | 13.72 | 170,981 | 60,017 | 35.10 | 230,998 | 38,607 | 16.71 | 269,605 |
| Females. | ||||||||||||||||
| Under 5 years | 13,101 | 5,322 | 40.621 | 18,423 | 4,786 | 25.98 | 23,209 | 2,565 | 11.06 | 25,777 | 8,565 | 33.23 | 34,342 | 6,311 | 18.38 | 40,653 |
| 5 years and under 10 years | 9,083 | 3,100 | 34.13 | 12,183 | 4,041 | 33.17 | l6,224 | 5,284 | 32.57 | 21,508 | 8,248 | 38.35 | 29,756 | 3,854 | 12.95 | 33,610 |
| 10 years and under 15 years | 6,378 | 1,856 | 29.10 | 8,234 | 2,496 | 30.31 | 10,730 | 3,486 | 32.49 | 14,216 | 8,358 | 58.79 | 22,574 | 6,173 | 27.35 | 28,747 |
| 15 years and under 21 years | 7,037 | 1,659 | 23.58 | 8,696 | 1,354 | 15.57 | 10,050 | 2,876 | 28.62 | 12,926 | 7,282 | 56.34 | 20,208 | 51,515 | 27.29 | 15,723 |
| 21 years and under 40 years | 22,396 | 6,875 | 30.69 | 29,271 | 3,853 | 13.16 | 33,124 | 4,129 | 12.47 | 37,253 | 14,108 | 37.87 | 51,361 | 8,059 | 15.69 | 19,420 |
| 40 years and under 55 years | 5,703 | 1,536 | 26.93 | 7,239 | 1,851 | 25.57 | 9,090 | 3,059 | 33.65 | 12,149 | 6,052 | 49.81 | l8,201 | 51,179 | 28.45 | 23,38o |
| 55 years and under 65 years | 1,348 | 509 | 37.76 | 1,857 | 593 | 31.93 | 2,450 | 652 | 26.61 | 3,102 | 1,208 | 38.94 | 4,310 | 1,185 | 27.49 | 5,495 |
| 65 years and upwards | 418 | 320 | 76.56 | 738 | 364 | 49.32 | 1,102 | 378 | 34.30 | 1,480 | 752 | 50.81 | 2,232 | 06 | 31.63 | 2,938 |
| Unspecified | 114 | −16 | −14.04 | 98 | −40 | −40.82 | 55 | 64 | 11.034 | 122 | 308 | 252.46 | 430 | −68 | −15.81 | 362 |
| All ages | 65,578 | 21,161 | 32.27 | 86,739 | 19,298 | 22.25 | 106,037 | 22,496 | 21.22 | 128,533 | 54,881 | 42.70 | 183,414 | 361,114 | 20.13 | 220,328 |
Table II. Table II. Showing (exclusive of Maoris) the Proportions per Cent, of the Persons, Males, and Females at each Age-Period to the Total of all Ages at the last Six Censuses.
| Census-Periods. | Proportions per Cent, of each Age to the Total of all Ages. | |||||||
|---|---|---|---|---|---|---|---|---|
| Under 5 Years. | 5 and Under 10. | 10 and Under 15. | 15 and Under 21. | 21 and Under 40. | 40 and Under 55. | 55 and Under 65. | 65 and upwards. | |
NOTE.—In consequence of the ages of the Chinese population not having; been separately shown at the Censuses of 1864, 1867, and 1871, it has been found impossible to distinguish them in this and the following comparative table. The totals of all specified ages have been used as a basis in working certain tables of calculations in this division of the book. The fact of the number of the unspecified as to age being very insignificant rendered it unnecessary to make a special mention of them throughout, and the proportions given by the above system are more nearly absolutely correct than if the calculations had been based on the total number, including the unspecified. | ||||||||
| December, 1864:— | ||||||||
| Persons | 15.54 | 10.83 | 7.69 | 8.83 | 44.53 | 9.76 | 2.19 | .63 |
| Males | 12.78 | 8.94 | 6.42 | 7.66 | 50.90 | 10.41 | 2.27 | .62 |
| Females | 20.01 | 13.88 | 9.74 | 10.75 | 34.21 | 8.71 | 2.06 | .64 |
| December, 1867: — | ||||||||
| Persons | 17.18 | 11.34 | 7.86 | 8.02 | 42.64 | 9.92 | 2.18 | .86 |
| Males | 14.48 | 9.54 | 6.77 | 6.69 | 48.49 | 10.95 | 2.22 | .86 |
| Females | 21.26 | 14.06 | 9.50 | 10.04 | 33.79 | 8.36 | 2.14 | .85 |
| February, 1871:— | ||||||||
| Persons | 18.19 | 12.75 | 8.64 | 7.88 | 38.15 | 10.87 | 2.44 | 1.08 |
| Males | 15.56 | 10.94 | 7.59 | 6.75 | 43.02 | 12.49 | 2.54 | 1.11 |
| Females | 21.90 | 15.31 | 10.12 | 9.48 | 31.26 | 8.58 | 2.31 | 1.04 |
| March, 1874:— | ||||||||
| Persons | 17.36 | 14.49 | 9.65 | 8.79 | 33.16 | 12.68 | 2.65 | 1.22 |
| Males | 15.31 | 12.78 | 8.58 | 7.83 | 36.29 | 15.11 | 2.83 | 1.27 |
| Females | 20.07 | 16.75 | 11.07 | 10.07 | 29.01 | 9.46 | 2.42 | 1.15 |
| March, 1878:— | ||||||||
| Persons | 16.90 | 14.44 | 11.07 | 9.76 | 30.81 | 13.04 | 2.69 | 1.29 |
| Males | 15.41 | 12.99 | 10.05 | 8.74 | 32.99 | 15.51 | 2.96 | 2.35 |
| Females | 18.77 | 16.26 | 12.34 | 11.04 | 28.07 | 99.5 | 2.35 | 1.22 |
| April, 1881:— | ||||||||
| Persons | 16.84 | 13.90 | 11.79 | 10.43 | 29.02 | 13.71 | 2.90 | 1.41 |
| Males | 15.50 | 12.78 | 10.74 | 9.39 | 30.65 | 16.24 | 3.22 | 1.48 |
| Females | 18.49 | 15.28 | 13.06 | 11.70 | 27.01 | 10.63 | 2.50 | 1.33 |
Table III. Table III. Showing (exclusive of Maoris) the Proportions of Males and Females in every 100 of the Population at each Age-Period as returned at the last Six Censuses.
| Census-Periods. | Proportions of the Sexes in every too Persons living at each Age-Period. | ||||||||
|---|---|---|---|---|---|---|---|---|---|
| All Ages. | Under 5 Years. | 5 and Under 10. | 10 and Under 15. | 15 and Under 21. | 21 and Under 40. | 40 and Under 55. | 55 and Under 65. | 65 and upwards. | |
| December, 1864:— | |||||||||
| Males | 61.80 | 50.8l | 51.05 | 51.6l | 53.54 | 70.65 | 65.90 | 64.12 | 6l.12 |
| Females | 38.20 | 49.19 | 48.95 | 48.39 | 46.46 | 29.35 | 34.10 | 35.88 | 38.88 |
| December, 1867:— | |||||||||
| Males | 60.20 | 50.73 | 50.66 | 51.86 | 50.19 | 68.46 | 66.48 | 60.99 | 60.45 |
| Females | 39.80 | 49.27 | 49.34 | 48.14 | 49.81 | 31.54 | 33.52 | 39.01 | 39.55 |
| February, 1871:— | |||||||||
| Males | 58.62 | 50.17 | 50.31 | 51.49 | 50.22 | 66.10 | 67.35 | 60.86 | 60.14 |
| Females | 41.38 | 49.83 | 49.69 | 48.51 | 49.78 | 33.90 | 32.65 | 39.14 | 39.86 |
| March, 1874:— | |||||||||
| Males | 57.04 | 50.32 | 50.33 | 50.71 | 50.81 | 62.42 | 67.96 | 60.82 | 59.46 |
| Females | 42.96 | 49.68 | 49.67 | 49.29 | 49.19 | 37.58 | 32.04 | 39.18 | 40.54 |
| March, 1878:— | |||||||||
| Males | 55.74 | 50.75 | 50.07 | 50.55 | 49.82 | 59.60 | 66.18 | 61.22 | 58.16 |
| Females | 44.26 | 49.25 | 49.93 | 49.45 | 50.18 | 40.40 | 33.82 | 38.78 | 41.84 |
| April, 1881:— | |||||||||
| Males | 54.98 | 50.60 | 50.51 | 50.11 | 49.51 | 58.09 | 65.11 | 6l.19 | 57.39 |
| Females | 45.02 | 49.40 | 49.49 | 49.89 | 50.49 | 41.91 | 34.89 | 38.81 | 42.61 |
Table IV. Table IV. Showing (exclusive of Chinese and Maoris) the Proportions per Cent, of the Persons, Males, and Females at each Quinquennial Period of Age to the Total of all Ages, on the 3rd April, 1881.
| Ages. | Proportions per Cent of each Age to the Total of all Ages. | ||
|---|---|---|---|
| Persons. | Males. | Females. | |
| NOTE.—It will be noticed that the Chinese are excluded from this and the following table. | |||
| All ages | 100.00 | 100.00 | 100.00 |
| Under 5 years | 17.01 | 15.79 | 18.49 |
| 5 years to 10 years | 14.05 | 13.00 | 15.28 |
| 10 years to 15 years | 11.91 | 10.95 | 13.06 |
| 15 years to 20 years | 8.79 | 7.95 | 9.80 |
| 20 years to 25 years | 8.44 | 8.18 | 8.77 |
| 25 years to 30 years | 8.17 | 8.67 | 7.88 |
| 30 years to 35 years | 6.91 | 7.21 | 6.54 |
| 35 years to 40 years | 6.76 | 7.38 | 6.02 |
| 40 years to 45 years | 6.29 | 7.30 | 5.00 |
| 45 years to 50 years | 4.36 | 5.19 | 3.35 |
| 50 years to 55 years | 2.98 | 3.57 | 2.28 |
| 55 years to 60 | 1.61 | 1.82 | 1.35 |
| 60 years to 65 years | 1.30 | 1.43 | 1.15 |
| 65 years to 70 years | .67 | .71 | .61 |
| 70 years to 75 years | .43 | .45 | .41 |
| 75 years to 80 years | .20 | .22 | .19 |
| 80 years to and upwards | .12 | .12 | .12 |
Table V. Table V. Showing (exclusive of Chinese and Maoris) the Proportions of Males and Females in every 100 of the Population at each Quinquennial Period of Age, on the 3rd April, 1881.
| Ages. | Proportions of Sexes in every 100 Persons Living at each Age-Period. | |
|---|---|---|
| Males. | Females. | |
| All ages | 54.52 | 45.48 |
| Under 5 years | 50.60 | 49.40 |
| 5 years to 10 years | 50.51 | 49.49 |
| 10 years to 15 years | 50.11 | 49.89 |
| 15 years to 20 years | 49.33 | 50.67 |
| 20 years to 25 years | 52.78 | 47.22 |
| 25 years to 30 years | 57.84 | 42.16 |
| 30 years to 35 years | 56.92 | 43.08 |
| 35 years to 40 years | 59.50 | 40.50 |
| 40 years to 45 years | 63.82 | 36.18 |
| 45 years to 50 years | 65.02 | 34.98 |
| 50 years to 55 years | 65.24 | 34.76 |
| 55 years to 60 years | 61.87 | 38.13 |
| 60 years to 55 years | 59.92 | 40.08 |
| 65 years to 70 years | 58.05 | 41.95 |
| 70 years to 75 years | 55.30 | 43.70 |
| 75 years to 80 years | 58.57 | 41.43 |
| 80 years and upwards | 55.14 | 44.86 |
Table VI. Table VI. Showing the Number of Persons, Males and Females (exclusive of Maoris), living at each Period of Age, inclusive and exclusive of Chinese, according to the Census of 1881.
| Ages. | Numbers. | ||||||||
|---|---|---|---|---|---|---|---|---|---|
| Inclusive of Chinese. | Chinese. | Exclusive of Chinese. | |||||||
| Persons. | Males. | Females. | Persons. | Males. | Females. | Persons. | Males. | Females. | |
| All ages | 489,933 | 269,605 | 220,328 | 5,004 | 4,995 | 9 | 484,929 | 264,610 | 220,319 |
| Specified ages | 488,601 | 268,635 | 219,966 | 4,920 | 4,911 | 9 | 483,681 | 263,724 | 219,957 |
| Under 1 year | 17,954 | 9,209 | 8,745 | … | … | … | 17,954 | 9,209 | 8,745 |
| 1 year to 2 years | 14,888 | 7,484 | 7,404 | 2 | 1 | 1 | 14,886 | 7,483 | 7,403 |
| 2 years to 3 years | 16,854 | 8,525 | 8,329 | … | … | … | 16,854 | 8,525 | 8,329 |
| 3 years to 4 years | 16,548 | 8,280 | 8,268 | 3 | 2 | 1 | 16,545 | 8,278 | 8,267 |
| 4 years to 5 years | 16,045 | 8,138 | 7,907 | 1 | … | 1 | 16,044 | 8,138 | 7,906 |
| 5 years to 6 years | 15,188 | 7,757 | 7,401 | 4 | 3 | 1 | 15,l84 | 7,784 | 7,400 |
| 6 years to 7 years | 14,107 | 7,065 | 7,042 | … | … | … | 14,107 | 7,065 | 7,042 |
| 7 years to 8 years | 13,346 | 6,757 | 6,589 | … | … | … | 13,346 | 6,757 | 6,589 |
| 8 years to 9 years | 12,722 | 6,385 | 6,337 | … | … | … | 12,722 | 6,385 | 6,337 |
| 9 years to 10 years | 12,552 | 6,311 | 6,241 | … | … | … | 12,552 | 6,311 | 6,241 |
| 10 years to 11 years | 12,808 | 6,352 | 6,456 | … | … | … | 12,808 | 6,352 | 6,456 |
| 11 years to 12 years | 11,532 | 5,810 | 5,722 | … | … | … | 11,532 | 5,810 | 5,722 |
| 12 years to 13 years | 11,840 | 5,928 | 5,912 | … | … | … | 11,840 | 5,928 | 5,912 |
| 13 years to 14 years | 10,708 | 5,360 | 5,348 | 1 | 1 | … | 10,707 | 5,359 | 5,348 |
| 14 years to 15 years | 10,734 | 5,425 | 5,309 | 5 | 5 | … | 10,729 | 5,420 | 5,309 |
| 15 years to 20 years | 42,609 | 21,060 | 21,549 | 85 | 83 | 2 | 42,524 | 20,977 | 21,547 |
| 20 years to 21 years | 8,339 | 4,165 | 4,174 | 113 | 113 | … | 8,226 | 4,052 | 4,174 |
| 21 years to 25 years | 33,026 | 17,913 | 15,113 | 409 | 407 | 2 | 32,617 | 17,506 | 15,111 |
| 25 years to 30 years | 40,586 | 23,916 | 16,670 | 1,052 | 1,051 | 1 | 39,534 | 22,865 | 16,669 |
| 30 years to 35 years | 34,595 | 20,202 | 14,393 | 1,187 | 1,187 | … | 33,408 | 19,015 | 14,393 |
| 35 years to 40 years | 33,562 | 20,318 | 13,244 | 860 | 860 | … | 32,702 | 19,458 | 13,244 |
| 40 years to 45 years | 31,100 | 20,099 | 11,001 | 696 | 696 | … | 30,404 | 19,403 | 11,001 |
| 45 years to 50 years | 21,341 | 13,972 | 7,369 | 274 | 274 | … | 21,067 | 13,698 | 7,369 |
| 50 years to 55 years | 14,563 | 9,553 | 5,010 | 151 | 151 | … | 14,412 | 9,402 | 5,010 |
| 55 years to 60 years | 7,820 | 4,855 | 2,965 | 43 | 43 | … | 7,777 | 4,812 | 2,965 |
| 60 years to 65 years | 6,339 | 3,809 | 2,530 | 27 | 27 | … | 6,312 | 3,782 | 2,530 |
| 65 years to 70 years | 3,232 | 1,879 | 1,353 | 7 | 7 | … | 3,225 | 1,872 | 1,353 |
| 70 years to 75 years | 2,087 | 1,175 | 912 | … | … | … | 2,087 | 1,175 | 912 |
| 75 years to 80 years | 992 | 581 | 411 | … | … | … | 992 | 581 | 411 |
| 80 years to 81 years | 190 | 115 | 75 | … | … | … | 190 | 115 | 75 |
| 81 years to 82 years | 108 | 62 | 46 | … | … | … | 108 | 02 | 46 |
| 82 years to 83 years | 77 | 37 | 40 | … | … | … | 77 | 37 | 40 |
| 83 years to 84 years | 45 | 26 | 19 | … | … | … | 45 | 26 | 19 |
| 84 years to 85 years | 35 | 20 | 15 | … | … | … | 35 | 20 | 15 |
| 85 years to 86 years | 38 | 23 | 15 | … | … | … | 38 | 23 | 15 |
| 86 years to 87 years | 23 | 9 | 14 | … | … | … | 23 | 9 | 14 |
| 87 years to 88 years | 9 | 6 | 3 | … | … | … | 9 | 6 | 3 |
| 88 years to 89 years | 12 | 4 | 8 | … | … | … | 12 | 4 | 8 |
| 89 years to 90 years | 7 | 4 | 3 | … | … | … | 7 | 4 | 3 |
| 90 years to 91 years | 17 | 7 | 10 | … | … | … | 17 | 7 | 10 |
| 91 years to 92 years | 8 | 3 | 5 | … | … | … | 8 | 3 | 5 |
| 92 years to 93 years | 3 | 2 | 1 | … | … | … | 3 | 2 | 1 |
| 93 years to 94 years | 2 | … | 2 | … | … | … | 2 | … | 2 |
| 94 years to 95 years | 4 | 1 | 3 | … | … | … | 4 | 1 | 3 |
| 95 years to 96 years | 5 | 2 | 3 | … | … | … | 5 | 2 | 3 |
| 96 years to 97 years | 1 | 1 | … | … | … | … | 1 | 1 | … |
| Unspecified ages | 1,332 | 970 | 362 | 84 | 84 | … | 1,248 | 886 | 362 |
Table VII. Table VII. Showing the Proportions per Cent, of Persons, Males, and Females, living at each Period of Age to the Total at all Ages in regard to the Population, inclusive and exclusive, of Chinese, and exclusive of Maoris; also Proportions for the Chinese.
| Ages. | Proportions per Cent. | ||||||||
|---|---|---|---|---|---|---|---|---|---|
| Inclusive of Chinese. | Chinese. | Exclusive of Chinese. | |||||||
| Persons. | Males. | Females. | Persons. | Males. | Females. | Persons. | Males. | Females. | |
| All ages | 100.00 | 100.00 | 100.00 | 100.00 | 100.00 | 100.00 | 100.00 | 100.00 | 100.00 |
| Under 1 year | 3.67 | 3.43 | 3.98 | … | … | … | 3.71 | 3.49 | 3.98 |
| 1 year to 2 years | 3.05 | 3.79 | 3.37 | .04 | .02 | 11.11 | 3.08 | 2.84 | 3.37 |
| 2 years to 3 years | 3.45 | 3.17 | 3.79 | … | … | … | 3.48 | 3.23 | 3.79 |
| 3 years to 4 years | 3.39 | 3.08 | 3.76 | .06 | .04 | 11.11 | 3.43 | 3.14 | 3.76 |
| 4 years to 5 years | 3.28 | 3.03 | 3.59 | .02 | … | 11.11 | 3.32 | 3.09 | 3.59 |
| 5 years to 6 years | 3.11 | 2.90 | 3.36 | .08 | .06 | 11.11 | 3.14 | 2.95 | 3.36 |
| 6 years to 7 years | 2.89 | 2.63 | 3.20 | … | … | … | 2.92 | 2.68 | 3.20 |
| 7 years to 8 years | 2.73 | 2.53 | 3.00 | … | … | … | 2.76 | 2.56 | 3.00 |
| 8 years to 9 years | 2.60 | 2.38 | 2.88 | … | … | … | 2.63 | 2.42 | 2.88 |
| 9 years to 10 years | 2.57 | 2.35 | 2.84 | … | … | … | 2.60 | 2.39 | 2.84 |
| 10 years to 11 years | 2.62 | 2.36 | 2.93 | … | … | … | 2.65 | 2.41 | 2.93 |
| 11 years to 12 years | 2.36 | 2.l6 | 2.60 | … | … | … | 2.38 | 2.20 | 2.60 |
| 12 years to 13 years | 2.42 | 2.21 | 2.09 | … | … | … | 3.45 | 2.25 | 2.69 |
| 13 years to 14 years | 2.19 | 1.99 | 2.43 | .02 | .02 | … | 2.21 | 2.03 | 2.43 |
| 14 years to 15 years | 2.20 | 2.02 | 2.41 | .10 | .10 | … | 2.22 | 2.06 | 2.41 |
| 15 years to 20 years | 8.72 | 7.84 | 9.80 | 1.73 | 1.69 | 22.22 | 8.79 | 7.95 | 9.80 |
| 20 years to 21 years | 2.71 | 1.55 | 1.90 | 2.30 | 3.30 | … | 1.70 | 1.54 | 1.90 |
| 21 years to 25 years | 6.76 | 6.67 | 6.87 | 8.31 | 8.29 | 22.23 | 6.74 | 6.64 | 6.87 |
| 25 years to 30 years | 8.31 | 8.90 | 7.58 | 21.38 | 2.40 | 11.11 | 8.17 | 8.67 | 7.58 |
| 30 years to 35 years | 7.08 | 7.52 | 6.54 | 34.13 | 24.17 | … | 6.91 | 7.21 | 6.54 |
| 35 years to 40 | 6.87 | 7.56 | 6.02 | 17.48 | 17.51 | … | 6.76 | 7.38 | 6.02 |
| 40 years to 45 | 6.36 | 7.45 | 5.00 | 14.15 | 14.17 | … | 6.29 | 7.36 | 8.00 |
| 45 years to 50 | 4.37 | 5.20 | 3.35 | 5.57 | 5.58 | … | 4.36 | 5.19 | 3.35 |
| 50 years to 55 | 2.98 | 3.56 | 2.28 | 3.07 | 3.08 | … | 2.98 | 3.57 | 2.28 |
| 55 years to 60 | 1.60 | 1.81 | 1.35 | .87 | .88 | … | 1.61 | 1.82 | 1.35 |
| 60 years to 65 | 1.30 | 1.41 | 1.155 | .55 | .55 | … | 1.30 | 1.43 | 1.15 |
| 65 years to 70 | .66 | .70 | .61 | .14 | .14 | … | .67 | .71 | .61 |
| 70 years to 75 | .43 | .44 | .41 | … | … | … | .43 | .45 | .41 |
| 75 years to 80 | .20 | .22 | .19 | … | … | … | .20 | .22 | .19 |
| 80 and upwards | .12 | .12 | .12 | … | … | … | .12 | .12 | .12 |
Table VIII. Table VIII. Showing the relative Proportions of Males and Females in every 100 Persons living at each Age in regard to the Population, inclusive and exclusive of Chinese, and exclusive of Maoris; also Proportions for the Chinese.
| Ages. | Proportion of the Sexes in every 100 Persons living. | |||||
|---|---|---|---|---|---|---|
| Inclusive of Chinese. | Chinese. | Exclusive of Chinese. | ||||
| Males. | Females. | Males. | Females. | Males. | Females. | |
| All Ages | 54.98 | 45.02 | 99.82 | .18 | 54.52 | 45.48 |
| Under 1 year | 51.29 | 48.71 | … | … | 51.29 | 48.71 |
| 1 year to 2 years | 50.27 | 49.73 | 50.00 | 50.00 | 50.27 | 49.73 |
| 2 years to 3 years | 50.58 | 49.42 | … | … | 50.58 | 49.42 |
| 3 years to 4 years | 50.04 | 49.96 | 66.67 | 33.33 | 50.03 | 49.97 |
| 4 years to 5 years | 50.72 | 49.28 | … | 100.00 | 50.72 | 49.28 |
| 5 years to 6 years | 51.27 | 48.73 | 75.00 | 25.00 | 51.26 | 48.74 |
| 6 years to 7 years | 50.08 | 49.92 | … | … | 50.08 | 49.92 |
| 7 years to 8 years | 50.63 | 49.37 | … | … | 50.63 | 49.37 |
| 8 years to 9 years | 50.19 | 49.81 | … | … | 50.19 | 49.81 |
| 9 years to 10 years | 50.28 | 49.72 | … | … | 50.28 | 49.72 |
| 10 years to 11 years | 49.59 | 50.41 | … | … | 49.59 | 50.41 |
| 11 years to 12 years | 50.38 | 49.62 | … | … | 50.38 | 49.62 |
| 12 years to 13 years | 50.07 | 49.93 | … | … | 50.07 | 49.93 |
| 13 years to 14 years | 50.06 | 49.94 | 100.00 | … | 50.05 | 49.95 |
| 14 years to 15 years | 50.54 | 49.46 | 100.00 | … | 50.52 | 49.48 |
| 15 years to 20 years | 49.43 | 50.57 | 97.65 | 2.35 | 49.33 | 50.67 |
| 20 years to 21 years | 49.95 | 50.57 | 100.00 | … | 49.26 | 50.74 |
| 2l years to 25 years | 54.24 | 45.76 | 99.51 | .49 | 53.67 | 46.33 |
| 25 years to 30 years | 58.93 | 41.07 | 99.90 | .10 | 57.84 | 42.16 |
| 30 years to 35 years | 58.40 | 41.60 | 100.00 | … | 56.92 | 43.08 |
| 35 years to 40 years | 60.54 | 39.46 | 100.00 | … | 59.50 | 40.50 |
| 40 years to 45 years | 64.63 | 35.37 | 100.00 | … | 03.82 | 36.18 |
| 45 years to 50 years | 65.47 | 34.53 | 100.00 | … | 65.02 | 34.76 |
| 50 years to 55 years | 65.60 | 34.40 | 100.00 | … | 65.24 | 34.76 |
| 55 years to 60 years | 62.08 | 37.92 | 100.00 | … | 61.87 | 38.13 |
| 60 years to 65 years | 60.09 | 39.91 | 100.00 | … | 59.92 | 40.08 |
| 65 years to 70 years | 58.14 | 41.86 | 100.00 | … | 58.05 | 41.95 |
| 70 years to 75 years | 56.30 | 43.70 | … | … | 56.30 | 43.70 |
| 75 years to 80 years | 58.57 | 41.43 | … | … | 58.57 | 41.43 |
| 80 and upwards | 55.14 | 44.86 | … | … | 55.14 | 44.86 |
Table IX. Table IX. Showing the Number of Persons, Males, and Females (exclusive of Maoris) at each Quinquennial Period of Age living in the Colony of New Zealand, in the Boroughs and Outside.
| Ages. | Numbers living in— | ||||||||
|---|---|---|---|---|---|---|---|---|---|
| The Colony. | Boroughs. | Outside. | |||||||
| Persons. | Males. | Females. | Persons. | Males. | Females. | Persons. | Males. | Females. | |
| NOTE.—Details of the population of the counties and boroughs will be found in Tables XIV. and XV. | |||||||||
| All ages | 489,933 | 269,605 | 220,328 | 194,981 | 99,605 | 95,376 | 294,952 | 170,000 | 124,952 |
| Specified ages | 488,601 | 268,635 | 219,966 | 194,527 | 99,335 | 95,192 | 294,074 | 169,300 | 124,774 |
| Under 5 years | 82,289 | 41,636 | 40,653 | 32,807 | 16,645 | 16,162 | 49,482 | 24,991 | 24,491 |
| 5 years to 10 years | 67,915 | 34,305 | 33,610 | 26,875 | 13,408 | 13,467 | 41,040 | 20,897 | 20,143 |
| 10 years to 15 years | 57,622 | 28,875 | 28,747 | 23,695 | 11,639 | 12,056 | 33,927 | 17,236 | 16,691 |
| 15 years to 20 years | 42,609 | 21,060 | 21,549 | 18,352 | 8,258 | 10,094 | 24,257 | 12,802 | 11,455 |
| 20 years to 25 years | 41,365 | 22,078 | 19,287 | 16,859 | 7,616 | 9,243 | 24,506 | 14,462 | 10,044 |
| 25 years to 30 years | 40,586 | 23,916 | 16,670 | 15,910 | 8,334 | 7,576 | 24,676 | 15,582 | 9,094 |
| 30 years to 35 years | 34,595 | 20,202 | 14,393 | 13,363 | 7,009 | 6,354 | 21,232 | 13,193 | 8,039 |
| 33 years to 40 years | 33,562 | 20,318 | 13,244 | 12,785 | 6,352 | 5,933 | 20,777 | 13,466 | 7,311 |
| 40 years to 45 years | 31,100 | 20,099 | 11,001 | 11,576 | 6,691 | 4,885 | 19,524 | 13,408 | 6,116 |
| 43 years to 50 years | 21,341 | 13,972 | 7,369 | 8,279 | 4,884 | 3,395 | 13,062 | 9,088 | 3,974 |
| 50 years to 55 years | 14,563 | 9,553 | 5,010 | 5,609 | 3,432 | 2,267 | 8,864 | 6,121 | 2,743 |
| 55 years to 60 years | 7,820 | 4,855 | 2,965 | 3,051 | 1,741 | 1,310 | 4,769 | 3,114 | 1,655 |
| 60 years to 65 years | 6,339 | 3,809 | 2,530 | 2,541 | 1,390 | 1,151 | 3,798 | 2,419 | 1,379 |
| 65 years to 70 years | 3,232 | 1,879 | 1,353 | 1,236 | 645 | 591 | 1,996 | 1,234 | 762 |
| 70 years to 75 years | 2,087 | 1,175 | 912 | 873 | 468 | 405 | 1,214 | 707 | 507 |
| 75 years to 80 years | 992 | 581 | 411 | 398 | 211 | 187 | 594 | 370 | 224 |
| 80 years and upwards | 584 | 322 | 262 | 228 | 112 | 116 | 356 | 210 | 146 |
| Unspecified | 1,332 | 970 | 362 | 454 | 270 | 184 | 878 | 700 | 178 |
Table X. Showing (exclusive of Maoris) the Proportions per Cent, of Persons, Males, and Females at each Quinquennial Period of Age to the Total at all Ages living in the Colony of New Zealand, in Boroughs and Outside.
| Ages. | Proportions per Cent, of those living in— | ||||||||
|---|---|---|---|---|---|---|---|---|---|
| The Colony. | Boroughs. | Outside. | |||||||
| Persons. | Males. | Females. | Persons. | Males. | Females. | Persons. | Males. | Females. | |
| All ages | 100.00 | 100.00 | 100.00 | 100.00 | 100.00 | 100.00 | 100.00 | 100.00 | 100.00 |
| Under 5 years. | 16.84 | 15.50 | 18.49 | 16.86 | 16.76 | 16.98 | 16.83 | 14.76 | 19.63 |
| 5 years to 10 years | 13.90 | 12.78 | 15.28 | 13.82 | 13.50 | 14.15 | 13.96 | 12.34 | 16.14 |
| 10 years to 15 years | 11.79 | 10.74 | 13.06 | 12.18 | 11.72 | 12.66 | 11.54 | 10.18 | 13.38 |
| 15 years to 20 years | 8.72 | 7.84 | 9.80 | 9.43 | 8.31 | 10.60 | 8.25 | 7.56 | 9.18 |
| 20 years to 25 years | 8.47 | 8.22 | 5.77 | 8.67 | 7.67 | 9.71 | 8.33 | 8.54 | 8.05 |
| 25 years to 30 years | 8.31 | 8.90 | 7.58 | 8.18 | 8.39 | 7.96 | 8.39 | 9.20 | 7.29 |
| 30 years to 35 years | 7.08 | 7.52 | 6.54 | 6.87 | 7.06 | 6.67 | 7.22 | 7.79 | 6.44 |
| 35 years to 40 years | 6.87 | 7.56 | 6.02 | 6.57 | 6.90 | 6.23 | 7.07 | 7.95 | 5.86 |
| 40 years to 45 years | 6.36 | 7.48 | 5.00 | 5.95 | 6.73 | 5.13 | 6.64 | 7.92 | 4.90 |
| 45 years to 50 years | 4.37 | 5.20 | 3.35 | 4.26 | 4.92 | 3.57 | 4.44 | 5.37 | 3.18 |
| 50 years to 55 years | 2.98 | 3.56 | 2.28 | 2.93 | 3.45 | 2.38 | 3.01 | 3.62 | 2.20 |
| 55 years to 60 years | 1.60 | 1.81 | 1.35 | 1.57 | 1.75 | 1.38 | 1.62 | 1.84 | 1.33 |
| 60 years to 65 years | 1.30 | 1.41 | 1.15 | 1.31 | 1.40 | 1.21 | 1.29 | 1.43 | 1.10 |
| 65 years to 70 years | .66 | .70 | .61 | .63 | .65 | .62 | .68 | .73 | .61 |
| 70 years to 75 years | .43 | .44 | .41 | .45 | .47 | .43 | .41 | .42 | .41 |
| 75 years to 80 years | .20 | .22 | .19 | .20 | .21 | .20 | .20 | .22 | .18 |
| 80 years to and upwards | .12 | .12 | .12 | .12 | .11 | .12 | .12 | .13 | .12 |
Table XI. Table XI. Showing (exclusive of Maoris) the Relative Proportions of Males and Females in every 100 Persons of Both Sexes, at Quinquennial Periods of Age, living in the Colony of New Zealand, in the Boroughs and Outside.
| Ages. | Proportion of the Sexes in every 100 Persons living in— | |||||
|---|---|---|---|---|---|---|
| The Colony. | Boroughs. | Outside. | ||||
| Males. | Females. | Males. | Females. | Males. | Females. | |
| All Ages | 54.98 | 45.02 | 51.06 | 48.94 | 57.57 | 42.43 |
| Under 5 years | 50.60 | 49.40 | 50.74 | 49.26 | 50.51 | 49.49 |
| 5 years to 10 years | 50.51 | 49.49 | 49.89 | 50.11 | 50.92 | 49.08 |
| 10 years to 15 years | 50.11 | 49.89 | 49.12 | 50.88 | 50.80 | 49.20 |
| 15 years to 20 years | 49.43 | 50.57 | 45.00 | 55.00 | 52.78 | 47.22 |
| 20 years to 25 years | 53.37 | 46.63 | 45.27 | 54.83 | 59.01 | 40.99 |
| 25 years to 30 years | 58.93 | 41.07 | 52.38 | 47.62 | 63.15 | 36.85 |
| 30 years to 35 years | 58.40 | 41.60 | 52.45 | 47.54 | 62.14 | 37.86 |
| 35 years to 40 years | 60.54 | 39.46 | 53.59 | 46.41 | 64.81 | 33.19 |
| 40 years to 45 years | 64.63 | 35.37 | 57.80 | 42.20 | 68.67 | 31.33 |
| 45 years to 50 years | 65.47 | 34.53 | 58.99 | 41.01 | 69.58 | 30.42 |
| 50 years to 55 years | 65.60 | 34.40 | 60.22 | 39.78 | 69.05 | 30.95 |
| 55 years to 60 years | 62.08 | 37.92 | 57.06 | 42.94 | 65.30 | 34.70 |
| 60 years to 65 years | 60.09 | 39.91 | 54.70 | 45.30 | 63.69 | 36.31 |
| 65 years to 70 years | 58.14 | 41.86 | 52.l8 | 52.82 | 61.82 | 38.18 |
| 70 years to 75 years | 56.30 | 43.70 | 53.6l | 46.39 | 58.24 | 41.76 |
| 75 years to 80 years | 58.57 | 41.43 | 53.02 | 46.98 | 62.29 | 37.71 |
| 80 years to and upwards | 55.14 | 44.86 | 49.12 | 50.88 | 58.99 | 41.01 |
Table XII. Table XII. Showing, in each Electoral District, the Number of Representatives, the Number of European Electors, the Total Population at all Ages, the Male Population (exclusive of Chinese) at all Ages and over 21 Years of Age; also the Number of Males over 21 Years of Age to a Representative and to an Elector.
| Electoral Districts. | Number of Representatives. | Number of Electors (exclusive of Maoris) 1880–81 | Total Population (exclusive of Chinese) at all Ages. | Male Population (exclusive of Chinese) at all Ages. | Male Population (exclusive of Chinese) over 21 Years of Age | Males (exclusive of Chinese) over 21 Years of Age to | |
|---|---|---|---|---|---|---|---|
| A Representative. | An Elector. | ||||||
| NOTE.—In this table the totals of 21 years and upwards include such of those entered as of “unspecified” age in Table VI. as were adults. | |||||||
| Mongonui and Bay of Islands | 1 | 776 | 4,451 | 2,640 | 1,378 | 1,378.0 | 1.78 |
| Marsden | 1 | 1,293 | 6,920 | 4,045 | 2,193 | 2,193.0 | 1.70 |
| Rodney | 1 | 959 | 3,615 | 2,026 | 1,022 | 1,022.0 | 1.07 |
| Waitemata | 1 | 1,403 | 4,211 | 2,414 | 1,366 | 1,366.0 | 0.97 |
| Auckland City East | 1 | 789 | 5,140 | 2,674 | 1,411 | 1,411.0 | 1.79 |
| Auckland City West | 2 | 1,673 | 11,502 | 5,958 | 2,918 | 1,459.0 | 1.74 |
| Parnell | 1 | 924 | 5,976 | 2,869 | 1,277 | 1,277.0 | 1.38 |
| Newton | 1 | 1,665 | 8,870 | 4,347 | 1,894 | 1,894.0 | 1.14 |
| Town of Onehunga | 1 | 608 | 2,217 | 1,047 | 469 | 469.0 | 1.77 |
| Eden | 1 | 938 | 6,247 | 3,266 | 1,623 | 1,623.0 | 1.73 |
| Franklin | 2 | 2,105 | 10,522 | 5,569 | 2,499 | 2,499.0 | 1.14 |
| Thames | 2 | 2,609 | 12,040 | 6,724 | 3,495 | 3,495.0 | 1.34 |
| East Coast | 1 | 1,328 | 7,186 | 4,094 | 2,271 | 2,271.0 | 1.71 |
| Waipa | 1 | 1,113 | 4,723 | 2,583 | 1,265 | 1,265.0 | 1.14 |
| Waikato | 1 | 729 | 4,762 | 2,848 | 1,638 | 1,638.0 | 2.25 |
| Town of New Plymouth | 1 | 426 | 3,305 | 1,668 | 819 | 819.0 | 1.92 |
| Grey and Bell | 1 | 777 | 5,091 | 2,755 | 1,218 | 1,2l8.0 | 1.57 |
| Egmont | 1 | 960 | 6,388 | 4,040 | 2,542 | 2,542.0 | 2.65 |
| Wanganui | 2 | 2,010 | 9,222 | 4,880 | 2,434 | 1,217.0 | 1.21 |
| Rangitikei | 1 | 630 | 4,002 | 2,218 | 1,114 | 1,114.0 | 1.77 |
| Manawatu | 1 | 1,858 | 8,880 | 4,987 | 2,500 | 2,500.0 | 1.35 |
| City of Wellington | 2 | 3,071 | 20,537 | 10,200 | 4,926 | 2,463.0 | 1.60 |
| Wellington Country | 1 | 691 | 4,147 | 2,178 | 999 | 999.0 | 1.45 |
| Hutt | 1 | 598 | 3,595 | 1,928 | 930 | 930.0 | 1.56 |
| Wairarapa | 2 | 1,673 | 10,600 | 5,957 | 3,070 | 1,535.0 | 1.83 |
| Clive | 1 | 1,087 | 7,664 | 4,411 | 2,329 | 2,329.0 | 2.14 |
| Napier | 2 | 1,373 | 9,480 | 5,089 | 2,628 | 1,314.0 | 1.91 |
| Picton | 1 | 811 | 3,679 | 2,050 | 1,066 | 1,066.0 | 1.31 |
| Wairau | 1 | 897 | 4,480 | 2,492 | 1,231 | 1,231.0 | 1.37 |
| Suburbs of Nelson | 1 | 374 | 2,154 | 1,065 | 483 | 483.0 | 1.29 |
| City of Nelson | 2 | 1,210 | 6,764 | 3,261 | 1,381 | 690.5 | 1.14 |
| Waimea | 1 | 434 | 2,813 | 1,622 | 817 | 817.0 | 1.88 |
| Motueka | 1 | 688 | 3,084 | 1,621 | 705 | 705.0 | 1.02 |
| Collingwood | 2 | 495 | 1,643 | 926 | 474 | 474.0 | 0.96 |
| Buller | 1 | 1,038 | 3,695 | 2,243 | 1,322 | 1,322.0 | 1.27 |
| Grey Valley | 2 | 2,865 | 8,996 | 5,497 | 3,505 | 1,752.5 | 1.22 |
| Hokitika | 2 | 2,363 | 7,635 | 4,357 | 2,563 | 1,281.5 | 1.08 |
| Totara | 1 | 517 | 2,231 | 1,388 | 877 | 877.0 | 1.69 |
| Cheviot | 1 | 493 | 2,449 | 1,607 | 1,016 | 1,016.0 | 2.06 |
| Ashley | 1 | 1,246 | 7,045 | 3,806 | 1,700 | 1,700.0 | 1.36 |
| Kaiapoi | 1 | 930 | 6,908 | 3,624 | 1,614 | 1,614.0 | 1.72 |
| Town of Lyttleton | 1 | 628 | 4,127 | 2,205 | 1,113 | 1,113.0 | 1.77 |
| City of Christchurch | 3 | 4,899 | 30,669 | 15,395 | 7,335 | 2,445.0 | 1.50 |
| Avon | 1 | 719 | 5,595 | 2,915 | 1,286 | 1,286.0 | 1.79 |
| Heathcote | 1 | 1,885 | 11,606 | 6,071 | 2,690 | 2,690.0 | 1.43 |
| Selwyn | 1 | 800 | 6,191 | 3,415 | 1,598 | 1,598.0 | 2.00 |
| Akaroa | 1 | 667 | 4,333 | 2,364 | 1,093 | 1,093.0 | 1.64 |
| Coleridge | 1 | 1,593 | 12,765 | 7,662 | 4,327 | 4,327.0 | 2.72 |
| Timaru | 1 | 924 | 9,705 | 5,163 | 2,682 | 2,682.0 | 2.90 |
| Geraldine | 1 | 672 | 4,440 | 2,439 | 1,142 | 1,142.0 | 1.70 |
| Gladstone | 1 | 1,124 | 7,534 | 4,527 | 2,665 | 2,665.0 | 2.37 |
| Waitaki | 2 | 2,410 | 13,043 | 7,299 | 3,887 | 1,943.5 | 1.61 |
| Waikouaiti | 1 | 808 | 5,275 | 2,904 | 1,408 | 1,408.0 | 1.74 |
| Port Chalmers | 1 | 1,044 | 4,928 | 2,617 | 1,227 | 1,227.0 | 1.17 |
| City of Dunedin | 3 | 2,333 | 24,219 | 12,099 | 6,116 | 2,038.7 | 2.62 |
| Roslyn | 1 | 1,161 | 11,615 | 5,862 | 2,361 | 2,361.0 | 2.93 |
| Caversham | 1 | 944 | 10,389 | 5,334 | 2,255 | 2,255.0 | 2.39 |
| Taieri | 1 | 749 | 6,178 | 3,504 | 1,745 | 1,745.0 | 2.33 |
| Bruce | 1 | 1,079 | 5,770 | 3,044 | 1,397 | 1,397.0 | 1.29 |
| Clutha | 1 | 769 | 4,556 | 2,635 | 1,379 | 1,379.0 | 1.79 |
| Tuapeka | 1 | 929 | 5,211 | 2,883 | 1,376 | 1,376.0 | 1.48 |
| Waikaia | 1 | 900 | 5,569 | 3,333 | 1,910 | 1,910.0 | 2.12 |
| Mount Ida | 1 | 634 | 3,036 | 1,805 | 1,019 | 1,019.0 | 1.61 |
| Dunstan | 1 | 834 | 3,421 | 2,080 | 1,225 | 1,225.0 | 1.47 |
| Wakatipu | 1 | 958 | 3,558 | 2,223 | 1,418 | 1,418.0 | 1.48 |
| Invercargill | 1 | 1,137 | 4,572 | 2,349 | 1,162 | 1,162.0 | 1.2 |
| Mataura | 1 | 2,137 | 9,848 | 5,367 | 2,559 | 2,559.0 | 1.20 |
| Riverton | 1 | 1,190 | 5,644 | 3,226 | 1,621 | 1,621.0 | 1.36 |
| Wallace | 1 | 661 | 3,206 | 2,140 | 1,369 | 1,369.0 | 2.07 |
| Total (exclusive of population on shipboard) | 84 | 83,021 | 481,873 | 261,834 | 132,347 | 1,575.5 | 1.59 |
Table XIII. Table XIII. Showing the Number of Persons, Males, and Females (exclusive of Maoris), in each Provincial District.
| Provincial Districts. | All Ages. | Under 5. | 5 and Under 10. | 10 and under 15. | 15 and under 21. | 21 and under. 40. | 40 and Under 60. | 60 and under 80. | 80 and upwards. | Unspecified. | ||||||||||||||||||||||
|---|---|---|---|---|---|---|---|---|---|---|---|---|---|---|---|---|---|---|---|---|---|---|---|---|---|---|---|---|---|---|---|---|
| Under 1 Year. | 1–2. | 2–3. | 3–4. | 4–5. | 5–6. | 6–7. | 7–8. | 8–9. | 9–10. | 10–11. | 11–12. | 12–13. | 13–14. | 14–15. | 15–20. | 20–21 | 21–25. | 25–30. | 30–35. | 35–40. | 40–45. | 45–50. | 50–55. | 55–60. | 60–65. | 65–70. | 70–75 | 75–80. | ||||
| Total of New Zealand,— | ||||||||||||||||||||||||||||||||
| Males | 269,605 | 9,209 | 7,484 | 8,525 | 8,280 | 8,138 | 7,787 | 7,065 | 6,757 | 6,385 | 6,311 | 6,352 | 5,810 | 5,928 | 5,360 | 5,425 | 21,060 | 4,165 | 17,913 | 23,916 | 20,202 | 20,318 | 20,099 | 13,972 | 9,553 | 4,855 | 3,809 | 1,879 | 1,175 | 581 | 322 | 970 |
| Females | 220,328 | 8,745 | 7,404 | 8,329 | 8,268 | 7,907 | 7,401 | 7,042 | 6,589 | 6,337 | 6,241 | 6,456 | 5,722 | 5,912 | 5,348 | 5,309 | 21,549 | 4,174 | 15,113 | 16,670 | 14,393 | 13,244 | 11,001 | 7,369 | 5,010 | 2,965 | 2,530 | 1,353 | 912 | 411 | 262 | 362 |
| Total | 480,933 | 17,954 | 14,888 | 16,854 | 16,548 | 16,045 | 15,188 | 14,107 | 13,346 | 12,722 | 12,552 | 12,808 | 11,532 | 11,840 | 10,708 | 10,734 | 42,609 | 8,339 | 33,026 | 40,586 | 34,595 | 33,562 | 31,100 | 21,341 | 14,563 | 7,820 | 6,339 | 3,232 | 2,087 | 992 | 584 | 1,332 |
| Auckland,— | ||||||||||||||||||||||||||||||||
| Males | 54,111 | 1,720 | 1,377 | 1,578 | 1,621 | 1,603 | 1,545 | 1,380 | 1,43 | 1,337 | 1,322 | 1,337 | 1,214 | 1,237 | 1,169 | 1,223 | 4,568 | 885 | 3,642 | 4,443 | 3,726 | 3,942 | 3,798 | 2,547 | 2,067 | 1,141 | 992 | 493 | 362 | 193 | 110 | 126 |
| Females | 45,340 | 1,645 | 1,366 | 1,599 | 1,584 | 1,512 | 1,425 | 1,398 | 1,278 | 1,288 | 1,252 | 1,381 | 1,178 | 1,239 | 1,121 | 1,123 | 4,638 | 864 | 3,108 | 3,328 | 2,898 | 2,667 | 2,293 | 1,586 | 1,224 | 765 | 717 | 377 | 249 | 99 | 83 | 55 |
| Total | 99,451 | 3,365 | 2,743 | 3,177 | 3,205 | 3,115 | 2,970 | 2,778 | 2,691 | 2,625 | 2,574 | 2,718 | 2,392 | 2,476 | 2,290 | 2,346 | 9,206 | 1,749 | 6,750 | 7,771 | 6,624 | 6,609 | 6,091 | 4,133 | 3,291 | 1,906 | 1,709 | 870 | 611 | 292 | 193 | 181 |
| Taranaki,— | ||||||||||||||||||||||||||||||||
| Males | 8,517 | 308 | 236 | 283 | 269 | 245 | 233 | 201 | 215 | 200 | 171 | 197 | 159 | 178 | 157 | 154 | 571 | 116 | 685 | 917 | 690 | 657 | 603 | 376 | 258 | 150 | 108 | 64 | 33 | 15 | 10 | 58 |
| Females | 6,341 | 288 | 267 | 255 | 263 | 253 | 243 | 214 | 199 | 157 | 178 | 187 | 138 | 163 | 127 | 153 | 537 | 123 | 423 | 520 | 455 | 333 | 276 | 199 | 117 | 83 | 62 | 49 | 34 | 16 | 11 | 18 |
| Total | 14,858 | 596 | 503 | 538 | 532 | 498 | 476 | 415 | 414 | 357 | 349 | 384 | 297 | 341 | 284 | 307 | 1,108 | 239 | 1,108 | 1,437 | 1,145 | 990 | 879 | 575 | 375 | 233 | 170 | 113 | 67 | 31 | 21 | 76 |
| Wellington,— | ||||||||||||||||||||||||||||||||
| Males | 32,717 | 1,253 | 1,015 | 1,160 | 1,102 | 1,118 | 961 | 925 | 798 | 760 | 779 | 779 | 709 | 674 | 645 | 636 | 2,604 | 465 | 2,248 | 3,057 | 2,566 | 2,318 | 2,095 | 1,397 | 980 | 579 | 430 | 222 | 150 | 71 | 40 | 181 |
| Females | 28,654 | 1,164 | 1,052 | 1,129 | 1,109 | 1,066 | 1,044 | 935 | 823 | 764 | 780 | 700 | 733 | 685 | 633 | 714 | 2,759 | 545 | 2,222 | 2,352 | 1,934 | 1,638 | 1,234 | 842 | 653 | 351 | 321 | 175 | 120 | 59 | 26 | 92 |
| Total | 61,371 | 2,417 | 2,067 | 2,289 | 2,211 | 2,184 | 2,005 | 1,860 | 1,621 | 1,524 | 1,559 | 1,479 | 1,442 | 1,359 | 1,278 | 1,350 | 5,363 | 1,010 | 4,470 | 5,409 | 4,500 | 3,956 | 3,329 | 2,239 | 1,633 | 930 | 751 | 397 | 270 | 130 | 66 | 273 |
| Hawke's Bay,— | ||||||||||||||||||||||||||||||||
| Males | 9,700 | 343 | 273 | 360 | 294 | 274 | 286 | 237 | 249 | 227 | 212 | 194 | 204 | 192 | 164 | 175 | 721 | 153 | 685 | 982 | 855 | 777 | 692 | 427 | 280 | 137 | 114 | 63 | 29 | 12 | 9 | 80 |
| Females | 7,667 | 346 | 289 | 314 | 278 | 314 | 250 | 260 | 227 | 189 | 232 | 225 | 186 | 191 | 186 | 171 | 723 | 160 | 480 | 634 | 560 | 457 | 368 | 241 | 163 | 83 | 56 | 31 | 23 | 9 | 6 | 25 |
| Total | 17,367 | 689 | 562 | 674 | 572 | 578 | 536 | 497 | 476 | 416 | 444 | 419 | 390 | 383 | 350 | 346 | 1,444 | 313 | 1,165 | 1,616 | 1,415 | 1,234 | 1,060 | 668 | 443 | 220 | 170 | 94 | 52 | 21 | 15 | 105 |
| Marlborough,— | ||||||||||||||||||||||||||||||||
| Males | 5,249 | 195 | 153 | 185 | 142 | 169 | 159 | 141 | 134 | 122 | 129 | 106 | 116 | 128 | 80 | 86 | 425 | 90 | 397 | 478 | 357 | 378 | 343 | 274 | 191 | 86 | 94 | 35 | 30 | 11 | 7 | 8 |
| Females | 4,051 | 217 | 147 | 180 | 188 | 163 | 134 | 150 | 113 | 122 | 130 | 110 | 119 | 109 | 105 | 89 | 378 | 85 | 285 | 305 | 253 | 197 | 151 | 107 | 66 | 55 | 43 | 24 | 12 | 4 | 5 | 5 |
| Total | 9,300 | 412 | 300 | 365 | 330 | 332 | 293 | 291 | 247 | 244 | 259 | 216 | 235 | 237 | 185 | 175 | 803 | 175 | 682 | 783 | 610 | 575 | 494 | 381 | 257 | 141 | 137 | 59 | 42 | 15 | 12 | 13 |
| Nelson,— | ||||||||||||||||||||||||||||||||
| Males | 14,800 | 442 | 349 | 417 | 427 | 394 | 373 | 366 | 336 | 368 | 326 | 345 | 352 | 337 | 297 | 281 | 1,091 | 210 | 756 | 976 | 935 | 1,376 | 1,376 | 1,043 | 711 | 334 | 269 | 152 | 89 | 62 | 20 | 53 |
| Females | 11,275 | 423 | 358 | 414 | 386 | 383 | 360 | 385 | 381 | 321 | 345 | 348 | 314 | 314 | 285 | 230 | 1,171 | 217 | 725 | 746 | 681 | 652 | 525 | 406 | 272 | 195 | 145 | 105 | 81 | 52 | 37 | 18 |
| Total | 26,075 | 865 | 707 | 831 | 813 | 777 | 733 | 751 | 717 | 689 | 671 | 693 | 666 | 651 | 582 | 511 | 2,262 | 427 | 1,481 | 1,722 | 1,616 | 1,965 | 1,901 | 1,449 | 985 | 529 | 414 | 257 | 170 | 114 | 57 | 71 |
| Westland,— | ||||||||||||||||||||||||||||||||
| Males | 9,075 | 221 | 179 | 227 | 214 | 225 | 217 | 196 | 208 | 184 | 201 | 188 | 164 | 180 | 123 | 119 | 429 | 80 | 345 | 570 | 639 | 1,008 | 1,266 | 924 | 516 | 225 | 124 | 53 | 15 | 6 | 5 | 24 |
| Females | 5,935 | 231 | 190 | 225 | 235 | 214 | 202 | 219 | 243 | 228 | 200 | 221 | 187 | 172 | 153 | 128 | 433 | 100 | 262 | 333 | 418 | 494 | 391 | 223 | 117 | 41 | 31 | 16 | 14 | 4 | 2 | 8 |
| Total | 15,010 | 452 | 369 | 452 | 449 | 439 | 419 | 415 | 451 | 412 | 401 | 409 | 351 | 352 | 276 | 247 | 862 | 180 | 607 | 903 | 1,057 | 1,502 | 1,657 | 1,147 | 633 | 266 | 155 | 69 | 29 | 10 | 7 | 32 |
| Canterbury,— | ||||||||||||||||||||||||||||||||
| Males | 60,590 | 2,285 | 1,848 | 2,073 | 1,947 | 1,922 | 1,844 | 1,706 | 1,550 | 1,448 | 1,450 | 1,472 | 1,338 | 1,352 | 1,209 | 1,240 | 4,858 | 1,017 | 4,273 | 5,781 | 4,617 | 4,235 | 4,163 | 2,710 | 1,740 | 897 | 708 | 383 | 195 | 99 | 54 | 179 |
| Females | 59,592 | 2,119 | 1,821 | 2,011 | 2,001 | 1,891 | 1,702 | 1,634 | 1,520 | 1,461 | 1,411 | 1,471 | 1,288 | 1,367 | 1,278 | 1,178 | 5,004 | 1,012 | 3,701 | 4,110 | 3,371 | 3,094 | 2,595 | 1,724 | 1,076 | 628 | 529 | 282 | 167 | 63 | 35 | 48 |
| Total | 112,182 | 4,404 | 3,669 | 4,084 | 3,948 | 3,813 | 3,546 | 3,340 | 3,070 | 2,909 | 2,861 | 2,943 | 2,623 | 2,719 | 2,487 | 2,418 | 9,862 | 2,029 | 7,974 | 9,891 | 7,988 | 7,329 | 6,758 | 4,434 | 2,816 | 1,525 | 1,237 | 665 | 362 | 162 | 89 | 227 |
| Otago,— | ||||||||||||||||||||||||||||||||
| Males | 74,685 | 2,440 | 2,049 | 2,240 | 2,259 | 2,186 | 2,166 | 1,911 | 1,852 | 1,735 | 1,720 | 1,733 | 1,556 | 1,650 | 1,516 | 1,509 | 5,783 | 1,143 | 4,854 | 6,692 | 5,803 | 5,682 | 5,744 | 4,264 | 2,804 | 1,303 | 967 | 413 | 272 | 112 | 67 | 260 |
| Females | 59,392 | 2,307 | 1,914 | 2,200 | 2,222 | 2,118 | 2,039 | 1,844 | 1,801 | 1,805 | 1,711 | 1,811 | 1,576 | 1,671 | 1,459 | 1,521 | 5,898 | 1,067 | 3,902 | 4,338 | 3,817 | 3,706 | 3,161 | 2,040 | 1,319 | 762 | 623 | 294 | 212 | 105 | 57 | 92 |
| Total | 134,077 | 4,747 | 3,963 | 4,440 | 4,481 | 4,304 | 4,205 | 3,755 | 3,653 | 3,540 | 3,431 | 3,544 | 3,132 | 3,321 | 2,975 | 3,030 | 11,681 | 2,210 | 8,756 | 11,030 | 9,620 | 9,388 | 8,905 | 6,304 | 4,123 | 2,065 | 1,590 | 707 | 484 | 217 | 124 | 352 |
| Chatham Islands.— | ||||||||||||||||||||||||||||||||
| Males | 161 | 2 | 5 | 2 | 5 | 2 | 3 | 2 | 2 | 4 | 1 | 1 | 1 | … | … | 2 | 10 | 6 | 28 | 20 | 14 | 8 | 19 | 10 | 6 | 3 | 3 | 1 | … | … | … | 1 |
| Females | 81 | 5 | … | 2 | 2 | 3 | 2 | 3 | 4 | 2 | 2 | 2 | 3 | 1 | 1 | 2 | 8 | 1 | 5 | 4 | 6 | 6 | 7 | 1 | 3 | 2 | 3 | … | … | … | … | 1 |
| Total | 242 | 7 | 5 | 4 | 7 | 5 | 5 | 5 | 6 | 6 | 3 | 3 | 4 | 1 | 1 | 4 | 18 | 7 | 33 | 24 | 20 | 14 | 26 | 11 | 9 | 5 | 6 | 1 | … | … | … | 2 |
Table XIV. Table XIV. Showing the Ages of Persons, Males, and Females (exclusive of Maoris), in each County.
| Counties. | All Ages. | Under 5. | 5 and Under 10. | 10 and under 15. | 15 and under 21. | 21 and under 40. | 40 and Under 60. | 60 and under 80. | 80 and upwards. | Unspecified. | ||||||||||||||||||||||
|---|---|---|---|---|---|---|---|---|---|---|---|---|---|---|---|---|---|---|---|---|---|---|---|---|---|---|---|---|---|---|---|---|
| Under 1 Year. | 1–2. | 2–3. | 3–4. | 4–5. | 5–6. | 6–7. | 7–8. | 8–9. | 9–10. | 10–11. | 11–12. | 12–13. | 13–14. | 14–15. | 15–20. | 20–21 | 21–25. | 25–30. | 30–35. | 35–40. | 40–45. | 45–50. | 50–55. | 55–60. | 60–65. | 65–70. | 70–75. | 75–80. | ||||
| Total of Counties,— | ||||||||||||||||||||||||||||||||
| Males | 166,784. | 5,3751 | 4,484 | 5,150 | 4,970 | 4,917 | 4,689 | 4,340 | 4,084 | 3,870 | 3,846 | 3,753 | 3,462 | 3,542 | 3,189 | 3,216 | 12,557 | 2,578 | 11,287 | 14,909 | 12,700 | 13,128 | 13,146 | 8,927 | 6,025 | 3,081 | 2,390 | 1,223 | 703 | 369 | 208 | 666 |
| Females | 124,454 | 5,264 | 4,404 | 5,009 | 4,926 | 4,812 | 4,409 | 4,295 | 3,972 | 3,755 | 3,650 | 3,789 | 3,347 | 3,417 | 3,099 | 2,991 | 11,410 | 2,137 | 7,850 | 9,041 | 7,998 | 7,273 | 6,087 | 3,961 | 2,730 | 1,645 | 1,370 | 760 | 506 | 224 | 146 | 177 |
| Total | 291,238 | 10,639 | 8,888 | 10,159 | 9,896 | 9,729 | 9,098 | 8,635 | 8,056 | 7,625 | 7,496 | 7,542 | 6,809 | 6,959 | 6,288 | 6,207 | 23,967 | 4,715 | 19,137 | 23,950 | 20,698 | 20,401 | 19,233 | 12,888 | 8,755 | 4,726 | 3,760 | 1,983 | 1,209 | 593 | 354 | 843 |
| Mongonui,— | ||||||||||||||||||||||||||||||||
| Males | 871 | 29 | 30 | 26 | 25 | 39 | 22 | 23 | 25 | 33 | 19 | 20 | 17 | 28 | 19 | 24 | 81 | 13 | 52 | 63 | 66 | 49 | 61 | 32 | 25 | 10 | 17 | 5 | 8 | 2 | 6 | 2 |
| Females | 600 | 27 | 13 | 37 | 23 | 23 | 20 | 36 | 20 | 23 | 14 | 23 | 15 | 14 | 15 | 14 | 66 | 9 | 36 | 32 | 34 | 37 | 23 | 15 | 8 | 7 | 8 | 3 | 1 | 2 | 1 | 1 |
| Total | 1,471 | 56 | 43 | 65 | 48 | 62 | 42 | 59 | 45 | 56 | 33 | 43 | 32 | 42 | 34 | 38 | 147 | 22 | 88 | 95 | 100 | 86 | 84 | 47 | 33 | 17 | 25 | 8 | 9 | 4 | 7 | 3 |
| Bay of Islands,— | ||||||||||||||||||||||||||||||||
| Males | 1,258 | 43 | 33 | 32 | 34 | 36 | 27 | 28 | 33 | 32 | 28 | 34 | 19 | 24 | 19 | 27 | 95 | 27 | 94 | 137 | 98 | 90 | 87 | 57 | 47 | 31 | 17 | 5 | 7 | 2 | 2 | 13 |
| Females | 926 | 42 | 33 | 40 | 36 | 35 | 25 | 36 | 21 | 26 | 19 | 22 | 23 | 26 | 23 | 24 | 87 | 13 | 58 | 81 | 59 | 61 | 41 | 29 | 27 | 17 | 8 | 4 | 2 | 3 | 3 | 2 |
| Total | 2,184 | 85 | 66 | 72 | 70 | 71 | 64 | 54 | 58 | 58 | 47 | 56 | 42 | 50 | 42 | 51 | 182 | 40 | 152 | 218 | 157 | 151 | 128 | 86 | 74 | 48 | 25 | 9 | 9 | 5 | 5 | 15 |
| Hokianga,— | ||||||||||||||||||||||||||||||||
| Males | 367 | 16 | 10 | 10 | 10 | 11 | 8 | 7 | 12 | 12 | 4 | 7 | 4 | 5 | 2 | 5 | 30 | 8 | 38 | 37 | 33 | 22 | 27 | 20 | 10 | 3 | 8 | 1 | 2 | 1 | 4 | … |
| Females | 220 | 8 | 9 | 15 | 3 | 11 | 7 | 12 | 7 | 5 | 8 | 9 | 6 | 7 | 6 | 9 | 19 | … | 17 | 14 | 16 | 7 | 10 | 6 | 6 | 1 | 2 | … | … | … | … | … |
| Total | 587 | 24 | 19 | 25 | 13 | 22 | 15 | 19 | 19 | 17 | 12 | 16 | 10 | 12 | 8 | 14 | 49 | 8 | 55 | 51 | 49 | 29 | 37 | 26 | 16 | 4 | 10 | 1 | 2 | 1 | 4 | … |
| Hobson,— | ||||||||||||||||||||||||||||||||
| Males | 1,754 | 47 | 43 | 50 | 51 | 46 | 36 | 37 | 33 | 34 | 38 | 35 | 29 | 40 | 24 | 31 | 140 | 31 | 162 | 211 | 145 | 149 | 114 | 76 | 63 | 30 | 19 | 7 | 9 | 3 | 5 | 16 |
| Females | 1,097 | 63 | 37 | 43 | 37 | 38 | 38 | 49 | 26 | 30 | 25 | 28 | 28 | 26 | 19 | 25 | 108 | 20 | 86 | 91 | 71 | 52 | 50 | 31 | 24 | 19 | 13 | 12 | 2 | … | 1 | 5 |
| Total | 2,851 | 110 | 80 | 93 | 88 | 84 | 74 | 86 | 59 | 64 | 63 | 63 | 57 | 66 | 43 | 56 | 248 | 51 | 248 | 302 | 216 | 201 | 164 | 107 | 87 | 49 | 32 | 19 | 11 | 3 | 6 | 21 |
| Whangarei,— | ||||||||||||||||||||||||||||||||
| Males | 2,245 | 68 | 45 | 60 | 73 | 51 | 59 | 52 | 66 | 51 | 49 | 50 | 41 | 54 | 67 | 50 | 191 | 50 | 155 | 174 | 174 | 153 | 156 | 106 | 91 | 66 | 50 | 19 | 17 | 11 | 17 | 11 |
| Females | 1,708 | 73 | 36 | 64 | 52 | 56 | 56 | 53 | 41 | 52 | 52 | 45 | 58 | 47 | 38 | 37 | 192 | 37 | 100 | 92 | 87 | 99 | 103 | 71 | 51 | 42 | 22 | 17 | 11 | 5 | 11 | 2 |
| Total | 3,953 | 141 | 81 | 124 | 125 | 107 | 115 | 105 | 107 | 103 | 101 | 95 | 99 | 101 | 105 | 93 | 383 | 87 | 255 | 266 | 229 | 252 | 259 | 177 | 142 | 108 | 72 | 36 | 28 | 16 | 28 | 13 |
| Rodney,— | ||||||||||||||||||||||||||||||||
| Males | 1,802 | 60 | 43 | 46 | 63 | 48 | 48 | 45 | 49 | 49 | 47 | 41 | 50 | 39 | 37 | 44 | 194 | 27 | 126 | 114 | 105 | 118 | 109 | 96 | 70 | 47 | 40 | 19 | 18 | 6 | 2 | 2 |
| Females | 1,485 | 49 | 51 | 52 | 47 | 41 | 64 | 45 | 40 | 40 | 51 | 49 | 48 | 45 | 42 | 42 | 138 | 24 | 91 | 100 | 81 | 67 | 70 | 64 | 40 | 32 | 30 | 15 | 11 | 1 | 5 | … |
| Total | 3,287 | 109 | 94 | 98 | 110 | 89 | 112 | 90 | 99 | 89 | 98 | 90 | 98 | 84 | 79 | 86 | 332 | 51 | 217 | 214 | 186 | 185 | 179 | 160 | 110 | 79 | 70 | 34 | 29 | 7 | 7 | 2 |
Table XIV. Table XIV. Showing the Ages of Persons, Males, and Females (exclusive of Maoris), in each County. continued.
| Counties. | All Ages. | Under 5. | 5 and Under 10. | 10 and under 15. | 15 and under 21. | 21 and under. 40. | 40 and Under 60. | 60 and under 80. | 80 and upwards. | Unspecified. | ||||||||||||||||||||||
|---|---|---|---|---|---|---|---|---|---|---|---|---|---|---|---|---|---|---|---|---|---|---|---|---|---|---|---|---|---|---|---|---|
| Under 1 Year. | 1–2. | 2–3. | 3–4. | 4–5. | 5–6. | 6–7. | 7–8. | 8–9. | 9–10. | 10–11. | 11–12. | 12–13. | 13–14. | 14–15. | 15–20. | 20–21 | 21–25. | 25–30. | 30–35. | 35–40. | 40–45. | 45–50. | 50–55. | 55–60. | 60–65. | 65–70. | 70–75 | 75–80. | ||||
| Waitemata,— | ||||||||||||||||||||||||||||||||
| Males | 2,608 | 51 | 65 | 57 | 75 | 52 | 63 | 59 | 66 | 54 | 56 | 51 | 65 | 50 | 54 | 40 | 231 | 32 | 149 | 241 | 189 | 217 | 187 | 148 | 124 | 64 | 66 | 28 | 21 | 18 | 6 | 2 |
| Females | 1,914 | 71 | 58 | 61 | 60 | 63 | 66 | 62 | 55 | 49 | 37 | 64 | 41 | 54 | 50 | 41 | 197 | 34 | 130 | 139 | 120 | 101 | 115 | 61 | 58 | 47 | 33 | 20 | 17 | 7 | 3 | … |
| Total | 4,522 | 122 | 123 | 118 | 135 | 115 | 129 | 121 | 121 | 103 | 93 | 115 | 106 | 104 | 104 | 81 | 428 | 66 | 306 | 380 | 309 | 318 | 302 | 209 | 182 | 111 | 99 | 48 | 38 | 25 | 9 | 1 |
| Eden,— | ||||||||||||||||||||||||||||||||
| Males | 3,785 | 290 | 222 | 265 | 286 | 288 | 256 | 251 | 223 | 251 | 241 | 256 | 254 | 256 | 232 | 217 | 838 | 131 | 477 | 585 | 537 | 573 | 575 | 385 | 323 | 188 | 173 | 98 | 56 | 29 | 21 | 8 |
| Females | 8,808 | 299 | 237 | 283 | 280 | 281 | 289 | 237 | 242 | 227 | 223 | 259 | 237 | 225 | 240 | 237 | 980 | 183 | 666 | 618 | 587 | 536 | 428 | 312 | 262 | 143 | 143 | 80 | 57 | 25 | 15 | 7 |
| Total | 17,593 | 389 | 459 | 548 | 566 | 569 | 515 | 488 | 465 | 478 | 464 | 515 | 491 | 481 | 472 | 454 | 1,818 | 314 | 1,143 | 1,203 | 1,124 | 1,109 | 1,003 | 697 | 585 | 316 | 178 | 178 | 113 | 54 | 36 | 15 |
| Manukau,— | ||||||||||||||||||||||||||||||||
| Males | 5,416 | 167 | 145 | 173 | 190 | 168 | 194 | 145 | 182 | 148 | 158 | 159 | 146 | 165 | 143 | 163 | 479 | 73 | 261 | 274 | 253 | 363 | 389 | 253 | 208 | 135 | 112 | 70 | 45 | 43 | 8 | 4 |
| Females | 4,858 | 165 | 144 | 166 | 163 | 168 | 154 | 161 | 163 | 191 | 162 | 196 | 150 | 151 | 145 | 140 | 428 | 74 | 237 | 252 | 251 | 282 | 273 | 175 | 148 | 88 | 107 | 54 | 38 | 17 | 11 | 2 |
| Total | 10,274 | 332 | 289 | 339 | 355 | 336 | 348 | 306 | 345 | 339 | 320 | 355 | 296 | 316 | 288 | 303 | 907 | 147 | 498 | 526 | 504 | 645 | 662 | 428 | 356 | 223 | 219 | 124 | 83 | 60 | 19 | 6 |
| Coromandel,— | ||||||||||||||||||||||||||||||||
| Males | 1,355 | 45 | 33 | 43 | 26 | 34 | 42 | 30 | 28 | 28 | 23 | 25 | 25 | 23 | 10 | 22 | 60 | 14 | 79 | 132 | 142 | 141 | 127 | 94 | 62 | 30 | 18 | 7 | 7 | 2 | 1 | 2 |
| Females | 798 | 39 | 27 | 31 | 43 | 22 | 26 | 29 | 26 | 25 | 21 | 21 | 15 | 19 | 22 | 17 | 69 | 18 | 52 | 67 | 56 | 52 | 44 | 23 | 11 | 9 | 8 | 3 | 1 | … | 2 | … |
| Total | 2,153 | 84 | 60 | 74 | 69 | 56 | 68 | 59 | 54 | 53 | 44 | 46 | 40 | 42 | 32 | 39 | 129 | 32 | 131 | 199 | 198 | 193 | 171 | 117 | 73 | 39 | 26 | 10 | 8 | 2 | 3 | 2 |
| Thames,— | ||||||||||||||||||||||||||||||||
| Males | 2,935 | 84 | 82 | 98 | 87 | 78 | 102 | 90 | 76 | 80 | 71 | 76 | 51 | 54 | 60 | 58 | 215 | 41 | 205 | 218 | 182 | 260 | 262 | 154 | 113 | 47 | 43 | 28 | 8 | 2 | … | 10 |
| Females | 2,244 | 90 | 98 | 93 | 94 | 94 | 76 | 76 | 84 | 61 | 82 | 66 | 66 | 60 | 52 | 50 | 210 | 22 | 124 | 162 | 124 | 146 | 108 | 69 | 56 | 30 | 28 | 12 | 5 | 3 | … | 3 |
| Total | 5,179 | 174 | 180 | 191 | 181 | 172 | 178 | 166 | 160 | 141 | 153 | 142 | 117 | 114 | 112 | 108 | 425 | 63 | 329 | 380 | 306 | 406 | 370 | 223 | 169 | 77 | 71 | 40 | 13 | 5 | … | 13 |
| Piako,— | ||||||||||||||||||||||||||||||||
| Males | 713 | 15 | 12 | 11 | 10 | 13 | 10 | 14 | 12 | 9 | 11 | 4 | 8 | 6 | 6 | 14 | 52 | 30 | 107 | 110 | 71 | 69 | 38 | 34 | 24 | 11 | 7 | 2 | … | … | … | 3 |
| Females | 268 | 7 | 17 | 10 | 10 | 15 | 9 | 9 | 3 | 3 | 6 | 8 | 10 | 6 | 4 | 9 | 23 | 6 | 22 | 26 | 19 | 11 | 19 | 6 | 4 | 2 | … | 1 | … | … | … | 3 |
| Total | 981 | 22 | 29 | 21 | 20 | 28 | 19 | 23 | 15 | 12 | 17 | 12 | 18 | 12 | 10 | 23 | 75 | 36 | 129 | 136 | 90 | 80 | 57 | 40 | 28 | 13 | 7 | 3 | … | … | … | 6 |
| Tauranga,— | ||||||||||||||||||||||||||||||||
| Males | 1,447 | 52 | 43 | 22 | 45 | 27 | 45 | 32 | 31 | 31 | 36 | 21 | 18 | 32 | 21 | 24 | 127 | 40 | 128 | 150 | 103 | 112 | 81 | 81 | 60 | 33 | 24 | 11 | 5 | 1 | 2 | 9 |
| Females | 1,152 | 36 | 42 | 43 | 36 | 32 | 34 | 38 | 32 | 41 | 33 | 34 | 22 | 26 | 32 | 29 | 117 | 18 | 103 | 98 | 71 | 54 | 63 | 45 | 26 | 18 | 11 | 5 | 6 | 1 | 1 | 5 |
| Total | 2,599 | 88 | 85 | 65 | 81 | 59 | 79 | 70 | 63 | 72 | 69 | 55 | 40 | 58 | 53 | 53 | 244 | 58 | 231 | 248 | 174 | 166 | 144 | 126 | 86 | 51 | 35 | 16 | 11 | 2 | 3 | 14 |
| Whakatane | ||||||||||||||||||||||||||||||||
| Males | 527 | 25 | 15 | 20 | 16 | 16 | 13 | 16 | 20 | 9 | 10 | 12 | 14 | 9 | 13 | 8 | 37 | 8 | 28 | 29 | 48 | 41 | 40 | 22 | 20 | 9 | 16 | 5 | 3 | 2 | … | 3 |
| Females | 386 | 18 | 17 | 16 | 14 | 15 | 20 | 12 | 11 | 15 | 17 | 10 | 9 | 12 | 4 | 13 | 27 | 9 | 21 | 31 | 34 | 17 | 13 | 11 | 8 | 6 | 4 | 1 | … | … | … | 1 |
| Total | 913 | 43 | 32 | 36 | 30 | 31 | 33 | 28 | 31 | 24 | 27 | 22 | 23 | 21 | 17 | 21 | 64 | 17 | 49 | 60 | 82 | 58 | 53 | 33 | 28 | 15 | 20 | 6 | 4 | 2 | … | 3 |
| Cook,— | ||||||||||||||||||||||||||||||||
| Males | 1,035 | 37 | 24 | 28 | 16 | 28 | 38 | 18 | 24 | 12 | 15 | 11 | 14 | 15 | 15 | 17 | 56 | 14 | 92 | 128 | 114 | 109 | 38 | 41 | 32 | 17 | 12 | 7 | 1 | 4 | 2 | 2 |
| Females | 705 | 50 | 31 | 38 | 45 | 31 | 20 | 21 | 21 | 18 | 20 | 25 | 11 | 20 | 14 | 8 | 41 | 15 | 49 | 77 | 56 | 32 | 27 | 12 | 8 | 6 | 3 | 1 | 2 | 1 | 1 | 1 |
| Total | 1,740 | 87 | 55 | 66 | 61 | 59 | 58 | 39 | 45 | 30 | 35 | 36 | 25 | 35 | 29 | 25 | 97 | 29 | 141 | 205 | 170 | 141 | 119 | 53 | 40 | 23 | 15 | 8 | 3 | 5 | 3 | 3 |
Table XIV. Table XIV. Showing the Ages of Persons, Males, and Females (exclusive of Maoris), in each County—continued.
| Counties. | All Ages. | Under 5. | 5 and Under 10. | 10 and under 15. | 15 and under 21. | 21 and under. 40. | 40 and Under 60. | 60 and under 80. | 80 and upwards. | Unspecified. | ||||||||||||||||||||||
|---|---|---|---|---|---|---|---|---|---|---|---|---|---|---|---|---|---|---|---|---|---|---|---|---|---|---|---|---|---|---|---|---|
| Under 1 Year. | 1–2. | 2–3. | 3–4. | 4–5. | 5–6. | 6–7. | 7–8. | 8–9. | 9–10. | 10–11. | 11–12. | 12–13. | 13–14. | 14–15. | 15–20. | 20–21 | 21–25. | 25–30. | 30–35. | 35–40. | 40–45. | 45–50. | 50–55. | 55–60. | 60–65. | 65–70. | 70–75 | 75–80. | ||||
| Wairoa,— | ||||||||||||||||||||||||||||||||
| Males | 597 | 16 | 11 | 22 | 15 | 17 | 10 | 17 | 12 | 17 | 16 | 14 | 8 | 13 | 11 | 14 | 43 | 12 | 41 | 54 | 47 | 53 | 55 | 30 | 18 | 10 | 8 | 7 | 1 | 2 | … | 3 |
| Females | 412 | 15 | 20 | 23 | 18 | 12 | 11 | 14 | 21 | 12 | 9 | 14 | 13 | 10 | 11 | 15 | 41 | 4 | 26 | 29 | 32 | 18 | 21 | 12 | 6 | 4 | … | 1 | … | … | … | … |
| Total | 1,009 | 31 | 31 | 45 | 33 | 29 | 21 | 31 | 33 | 29 | 25 | 28 | 21 | 23 | 22 | 29 | 84 | 16 | 67 | 89 | 79 | 71 | 76 | 42 | 24 | 14 | 8 | 8 | 1 | 2 | … | 3 |
| East Taupo,— | ||||||||||||||||||||||||||||||||
| Males | 93 | 2 | 1 | 1 | 1 | 1 | 1 | 1 | … | … | … | … | … | … | … | 1 | 3 | 2 | 6 | 15 | 16 | 11 | 12 | 6 | 4 | 3 | 2 | 2 | … | … | … | 2 |
| Females | 33 | 2 | … | 3 | 2 | … | 1 | … | 2 | 1 | … | … | … | … | 4 | 1 | 7 | 3 | 1 | 4 | … | 1 | … | … | … | … | … | … | … | … | ||
| Total | 126 | 4 | 1 | 4 | 3 | 1 | 2 | 1 | 2 | 1 | … | … | … | … | 1 | 1 | 7 | 3 | 13 | 18 | 17 | 15 | 12 | 7 | 4 | 3 | 2 | 2 | … | … | … | 2 |
| West Taupo,— | ||||||||||||||||||||||||||||||||
| Males | 8 | … | … | … | … | … | … | … | … | … | … | … | … | … | 1 | … | … | … | 1 | … | 1 | … | 1 | … | 4 | … | … | … | … | … | … | … |
| Females | 3 | … | … | … | … | … | … | 1 | … | … | 1 | … | 1 | … | … | … | … | … | … | … | … | … | … | … | … | … | … | … | … | … | … | … |
| Total | 11 | … | … | … | … | … | … | 1 | … | … | 1 | … | 1 | … | 1 | … | … | … | 1 | … | 1 | … | 1 | … | 4 | … | … | … | … | … | … | … |
| Waipa,— | ||||||||||||||||||||||||||||||||
| Males | 1,685 | 64 | 59 | 51 | 49 | 57 | 60 | 33 | 42 | 38 | 43 | 47 | 39 | 40 | 27 | 43 | 132 | 25 | 112 | 132 | 117 | 114 | 127 | 70 | 61 | 43 | 20 | 10 | 16 | 4 | … | 5 |
| Females | 1,412 | 57 | 47 | 60 | 67 | 52 | 48 | 53 | 50 | 49 | 49 | 39 | 36 | 30 | 38 | 36 | 129 | 16 | 90 | 100 | 100 | 88 | 68 | 38 | 22 | 14 | 17 | 7 | 7 | 2 | 1 | 2 |
| Total | 3,097 | 121 | 106 | 111 | 116 | 109 | 108 | 86 | 92 | 87 | 92 | 86 | 75 | 70 | 65 | 79 | 261 | 41 | 200 | 232 | 217 | 202 | 195 | 108 | 83 | 62 | 37 | 17 | 23 | 6 | 1 | 7 |
| Waikato,— | ||||||||||||||||||||||||||||||||
| Males | 1,607 | 57 | 47 | 64 | 52 | 54 | 46 | 35 | 34 | 34 | 39 | 25 | 30 | 35 | 25 | 23 | 112 | 30 | 150 | 172 | 141 | 113 | 96 | 67 | 62 | 23 | 16 | 16 | 5 | 2 | … | 2 |
| Females | 1,250 | 56 | 44 | 51 | 54 | 57 | 37 | 43 | 36 | 33 | 37 | 41 | 28 | 28 | 28 | 25 | 110 | 27 | 108 | 126 | 77 | 62 | 50 | 39 | 22 | 14 | 12 | 1 | 2 | … | … | 2 |
| Total | 2,857 | 113 | 91 | 115 | 106 | 111 | 83 | 78 | 70 | 67 | 76 | 66 | 58 | 63 | 53 | 48 | 222 | 57 | 258 | 298 | 218 | 175 | 146 | 106 | 84 | 37 | 28 | 17 | 7 | 2 | … | 4 |
| Raglan,— | ||||||||||||||||||||||||||||||||
| Males | 460 | 9 | 9 | 15 | 18 | 14 | 14 | 18 | 15 | 14 | 10 | 11 | 15 | 9 | 8 | 11 | 35 | 11 | 33 | 26 | 29 | 22 | 37 | 23 | 23 | 8 | 9 | 5 | 3 | 3 | 1 | 1 |
| Females | 316 | 16 | 10 | 13 | 12 | 12 | 12 | 6 | 13 | 6 | 15 | 8 | 7 | 9 | 10 | 9 | 35 | 4 | 15 | 23 | 22 | 18 | 21 | 7 | 5 | 1 | 2 | 2 | 3 | … | … | … |
| Total | 776 | 25 | 19 | 28 | 30 | 26 | 26 | 24 | 28 | 20 | 25 | 19 | 22 | 18 | 18 | 20 | 70 | 15 | 48 | 49 | 51 | 40 | 58 | 31 | 28 | 9 | 11 | 7 | 6 | 3 | 1 | 1 |
| Kawhia,— | ||||||||||||||||||||||||||||||||
| Males | 59 | 2 | … | 2 | … | 7 | 1 | 5 | 2 | 1 | 4 | 2 | … | 1 | 2 | … | … | … | 3 | 6 | 3 | 5 | 4 | 4 | 2 | … | 1 | 2 | … | … | … | … |
| Females | 49 | 3 | 4 | 5 | 1 | 2 | 4 | 1 | 4 | 1 | 2 | 2 | … | 2 | … | 3 | 4 | … | 2 | 4 | 1 | … | … | 2 | 2 | … | … | … | … | … | … | … |
| Total | 108 | 5 | 4 | 7 | 1 | 9 | 5 | 6 | 6 | 2 | 6 | 4 | … | 3 | 2 | 3 | 4 | … | 5 | 10 | 4 | 5 | 4 | 6 | 4 | … | 1 | 2 | … | … | … | … |
Table XIV. Table XIV. Showing the Ages of Persons, Males, and Females (exclusive of Maoris), in each County. continued.
| Counties. | All Ages. | Under 5. | 5 and Under 10. | 10 and under 15. | 15 and under 21. | 21 and under. 40. | 40 and Under 60. | 60 and under 80. | 80 and upwards. | Unspecified. | ||||||||||||||||||||||
|---|---|---|---|---|---|---|---|---|---|---|---|---|---|---|---|---|---|---|---|---|---|---|---|---|---|---|---|---|---|---|---|---|
| Under 1 Year. | 1–2. | 2–3. | 3–4. | 4–5. | 5–6. | 6–7. | 7–8. | 8–9. | 9–10. | 10–11. | 11–12. | 12–13. | 13–14. | 14–15. | 15–20. | 20–21 | 21–25. | 25–30. | 30–35. | 35–40. | 40–45. | 45–50. | 50–55. | 55–60. | 60–65. | 65–70. | 70–75 | 75–80. | ||||
| Taranaki,— | ||||||||||||||||||||||||||||||||
| Males | 3,930 | 142 | 122 | 133 | 128 | 125 | 112 | 101 | 99 | 105 | 92 | 101 | 88 | 93 | 84 | 79 | 273 | 47 | 334 | 402 | 280 | 248 | 263 | 192 | 104 | 65 | 49 | 30 | 11 | 7 | 5 | 16 |
| Females | 2,890 | 129 | 124 | 115 | 122 | 117 | 116 | 107 | 104 | 68 | 90 | 104 | 79 | 86 | 74 | 64 | 227 | 52 | 157 | 201 | 196 | 158 | 139 | 104 | 56 | 28 | 23 | 20 | 14 | 7 | 2 | 7 |
| Total | 6,820 | 271 | 246 | 348 | 250 | 242 | 228 | 208 | 203 | 173 | 182 | 205 | 167 | 179 | 158 | 143 | 500 | 99 | 491 | 603 | 476 | 406 | 402 | 296 | 160 | 93 | 72 | 50 | 25 | 14 | 7 | 23 |
| Patea,— | ||||||||||||||||||||||||||||||||
| Males | 3,490 | 131 | 82 | 109 | 108 | 83 | 91 | 66 | 80 | 58 | 61 | 71 | 48 | 61 | 47 | 47 | 206 | 57 | 270 | 425 | 341 | 356 | 293 | 144 | 102 | 55 | 33 | 19 | 9 | 6 | 2 | 29 |
| Females | 2,299 | 115 | 110 | 102 | 106 | 100 | 102 | 80 | 70 | 68 | 63 | 54 | 40 | 45 | 31 | 46 | 168 | 42 | 176 | 246 | 169 | 135 | 90 | 39 | 37 | 33 | 9 | 8 | 10 | … | … | 5 |
| Total | 5,789 | 246 | 192 | 211 | 214 | 183 | 193 | 146 | 150 | 126 | 124 | 125 | 88 | 106 | 78 | 93 | 364 | 99 | 446 | 671 | 510 | 491 | 383 | 183 | 139 | 88 | 42 | 27 | 19 | 6 | 2 | 54 |
| Wanganui,— | ||||||||||||||||||||||||||||||||
| Males | 1,935 | 53 | 51 | 57 | 55 | 61 | 56 | 47 | 50 | 44 | 46 | 45 | 39 | 43 | 36 | 40 | 166 | 45 | 146 | 177 | 161 | 119 | 129 | 93 | 72 | 36 | 34 | 15 | 7 | 4 | 1 | 7 |
| Females | 1,521 | 55 | 43 | 61 | 55 | 54 | 57 | 60 | 43 | 38 | 42 | 40 | 46 | 43 | 29 | 42 | 153 | 35 | 112 | 119 | 98 | 76 | 69 | 54 | 38 | 14 | 27 | 8 | 3 | 5 | 1 | 1 |
| Total | 3,456 | 108 | 94 | 118 | 110 | 115 | 113 | 107 | 93 | 82 | 88 | 85 | 85 | 86 | 65 | 82 | 319 | 80 | 258 | 296 | 259 | 195 | 198 | 147 | 110 | 50 | 61 | 23 | 10 | 9 | 2 | 8 |
| Rangitikei,— | ||||||||||||||||||||||||||||||||
| Males | 1,828 | 71 | 35 | 62 | 64 | 71 | 47 | 58 | 44 | 37 | 51 | 50 | 35 | 44 | 30 | 39 | 154 | 32 | 133 | 163 | 124 | 106 | 134 | 82 | 55 | 34 | 30 | 19 | 8 | 8 | 5 | 3 |
| Females | 1,483 | 53 | 59 | 62 | 48 | 64 | 57 | 60 | 48 | 36 | 44 | 44 | 41 | 30 | 40 | 42 | 177 | 25 | 98 | 108 | 72 | 80 | 66 | 39 | 33 | 21 | 21 | 6 | 6 | 2 | … | 1 |
| Total | 3,311 | 124 | 94 | 124 | 112 | 135 | 104 | 118 | 92 | 73 | 95 | 94 | 76 | 74 | 7o | 81 | 331 | 57 | 231 | 271 | 196 | 186 | 200 | 121 | 88 | 55 | 51 | 25 | 14 | 10 | 5 | 4 |
| Manawatu,— | ||||||||||||||||||||||||||||||||
| Males | 4,147 | 170 | 132 | 184 | 149 | 167 | 123 | 109 | 105 | 97 | 94 | 91 | 91 | 66 | 76 | 79 | 297 | 62 | 270 | 399 | 328 | 332 | 264 | 180 | 123 | 64 | 42 | 19 | 11 | 6 | 3 | 14 |
| Females | 3,225 | 147 | 148 | 148 | 140 | 144 | 143 | 119 | 111 | 85 | 103 | 88 | 92 | 81 | 76 | 84 | 243 | 42 | 200 | 266 | 220 | 181 | 136 | 85 | 59 | 31 | 24 | 9 | 7 | 7 | 5 | 1 |
| Total | 7,372 | 317 | 280 | 332 | 289 | 311 | 266 | 228 | 216 | 182 | 197 | 179 | 183 | 147 | 152 | 163 | 540 | 104 | 470 | 665 | 548 | 513 | 400 | 265 | 182 | 95 | 66 | 28 | 18 | 13 | 8 | 15 |
| Hutt,— | ||||||||||||||||||||||||||||||||
| Males | 4,200 | 164 | 153 | 132 | 138 | 147 | 128 | 132 | 101 | 95 | 110 | 99 | 107 | 87 | 103 | 92 | 350 | 50 | 50 | 378 | 281 | 242 | 228 | 147 | 117 | 101 | 55 | 35 | 38 | 19 | 15 | 61 |
| Females | 3,658 | 150 | 119 | 163 | 39 | 161 | 129 | 114 | 109 | 114 | 105 | 74 | 98 | 82 | 88 | 95 | 367 | 56 | 269 | 271 | 214 | 198 | 154 | 90 | 93 | 67 | 43 | 34 | 27 | 14 | 4 | 7 |
| Total | 7,858 | 314 | 272 | 295 | 277 | 308 | 257 | 246 | 210 | 209 | 215 | 173 | 205 | 169 | 191 | 187 | 717 | 106 | 564 | 649 | 495 | 440 | 382 | 237 | 210 | 168 | 98 | 69 | 4 | 33 | 19 | 78 |
| Wairarapa West,— | ||||||||||||||||||||||||||||||||
| Males | 3,167 | 126 | 102 | 117 | 116 | 103 | 93 | 100 | 79 | 95 | 78 | 84 | 68 | 74 | 70 | 50 | 254 | 31 | 196 | 272 | 259 | 227 | 196 | 135 | 101 | 58 | 40 | 21 | 11 | 3 | 2 | 6 |
| Females | 2,592 | 108 | 111 | 108 | 122 | 107 | 117 | 95 | 81 | 68 | 75 | 61 | 70 | 68 | 62 | 67 | 235 | 44 | l63 | 200 | 175 | 131 | 110 | 71 | 49 | 28 | 30 | 21 | 5 | 3 | 2 | 5 |
| Total | 5,759 | 234 | 213 | 225 | 238 | 210 | 210 | 195 | 160 | 163 | 153 | 145 | 138 | 142 | 132 | 117 | 489 | 75 | 359 | 472 | 434 | 358 | 306 | 206 | 150 | 86 | 70 | 42 | 16 | 6 | 4 | 11 |
| Wairarapa East,— | ||||||||||||||||||||||||||||||||
| Males | 1,046 | 21 | 16 | 18 | 21 | 18 | 22 | 16 | 21 | 11 | 15 | 13 | 7 | 14 | 8 | 10 | 79 | 12 | 129 | 174 | 113 | 101 | 87 | 54 | 25 | 16 | 12 | 5 | 4 | 1 | … | 3 |
| Females | 429 | 15 | 17 | 13 | 23 | 14 | 12 | 16 | 14 | 13 | 9 | 9 | 15 | 11 | 12 | 9 | 45 | 12 | 35 | 33 | 34 | 25 | 14 | 15 | 7 | 2 | … | 2 | 1 | 1 | … | 1 |
| Total | 1,475 | 36 | 33 | 31 | 44 | 32 | 34 | 32 | 35 | 24 | 24 | 22 | 22 | 25 | 20 | 19 | 124 | 24 | 164 | 207 | 147 | 126 | 101 | 69 | 32 | 18 | 12 | 7 | 5 | 1 | 1 | 4 |
| Waipawa,— | ||||||||||||||||||||||||||||||||
| Males | 3,411 | 124 | 99 | 138 | 107 | 103 | 103 | 90 | 84 | 75 | 86 | 71 | 73 | 68 | 55 | 65 | 234 | 53 | 226 | 339 | 294 | 282 | 249 | 162 | 88 | 50 | 40 | 16 | 4 | 2 | 3 | 28 |
| Females | 2,456 | 108 | 105 | 108 | 103 | 116 | 96 | 91 | 79 | 65 | 72 | 74 | 55 | 56 | 58 | 57 | 205 | 37 | 119 | 181 | 192 | 152 | 118 | 83 | 62 | 27 | 13 | 4 | 7 | 1 | … | 12 |
| Total | 5,867 | 232 | 204 | 246 | 210 | 219 | 199 | 181 | 163 | 140 | 158 | 145 | 128 | 124 | 113 | 122 | 439 | 90 | 345 | 520 | 486 | 434 | 367 | 245 | 150 | 77 | 53 | 20 | 11 | 3 | 3 | 40 |
Table XIV. Table XIV. Showing the Ages of Persons, Males, and Females (exclusive of Maoris), in each County. continued.
| Counties. | All Ages. | Under 5. | 5 and Under 10. | 10 and under 15. | 15 and under 21. | 21 and under. 40. | 40 and Under 60. | 60 and under 80. | 80 and upwards. | Unspecified. | ||||||||||||||||||||||
|---|---|---|---|---|---|---|---|---|---|---|---|---|---|---|---|---|---|---|---|---|---|---|---|---|---|---|---|---|---|---|---|---|
| Under 1 Year. | 1–2. | 2–3. | 3–4. | 4–5. | 5–6. | 6–7. | 7–8. | 8–9. | 9–10. | 10–11. | 11–12. | 12–13. | 13–14. | 14–15. | 15–20. | 20–21 | 21–25. | 25–30. | 30–35. | 35–40. | 40–45. | 45–50. | 50–55. | 55–60. | 60–65. | 65–70. | 70–75 | 75–80. | ||||
| Hawke's Bay,— | ||||||||||||||||||||||||||||||||
| Males | 2,857 | 74 | 73 | 92 | 87 | 76 | 93 | 66 | 73 | 54 | 60 | 46 | 49 | 45 | 39 | 42 | 214 | 48 | 247 | 306 | 282 | 248 | 207 | 115 | 87 | 32 | 30 | 21 | 14 | 1 | 4 | 32 |
| Females | 2,022 | 103 | 86 | 82 | 81 | 80 | 56 | 57 | 65 | 42 | 67 | 55 | 51 | 48 | 47 | 39 | 185 | 45 | 140 | 192 | 145 | 118 | 78 | 55 | 30 | 19 | 20 | 16 | 6 | 3 | 3 | 2 |
| Total | 4,875 | 183 | 159 | 174 | 168 | 156 | 149 | 123 | 138 | 96 | 127 | 101 | 100 | 93 | 86 | 81 | 399 | 93 | 387 | 498 | 427 | 366 | 285 | 170 | 117 | 51 | 50 | 37 | 20 | 4 | 7 | 34 |
| Sounds,— | ||||||||||||||||||||||||||||||||
| Males | 364 | 10 | 18 | 10 | 10 | 12 | 15 | 9 | 8 | 9 | 10 | 6 | 9 | 6 | 2 | 6 | 35 | 2 | 29 | 33 | 26 | 30 | 20 | 22 | 10 | 4 | 7 | 3 | 2 | 1 | … | … |
| Females | 243 | 15 | 8 | 14 | 13 | 7 | 5 | 11 | 8 | 9 | 5 | 9 | 6 | 7 | 9 | 6 | 26 | 2 | 13 | 18 | 17 | 10 | 9 | 7 | 3 | 2 | 1 | … | 1 | … | … | … |
| Total | 605 | 25 | 26 | 24 | 23 | 19 | 20 | 20 | 16 | 18 | 15 | 15 | 15 | 13 | 11 | 12 | 61 | 4 | 42 | 51 | 43 | 40 | 29 | 29 | 13 | 6 | 8 | 3 | 3 | 1 | … | … |
| Marlborough,— | ||||||||||||||||||||||||||||||||
| Males | 2,767 | 101 | 68 | 85 | 64 | 78 | 74 | 77 | 66 | 66 | 63 | 48 | 42 | 53 | 46 | 48 | 236 | 53 | 223 | 265 | 193 | 217 | 197 | 143 | 110 | 47 | 52 | 20 | 14 | 6 | 6 | 6 |
| Females | l,913 | 93 | 77 | 91 | 85 | 80 | 61 | 76 | 44 | 60 | 61 | 48 | 62 | 64 | 44 | 48 | 155 | 38 | 126 | 147 | 115 | 99 | 70 | 55 | 28 | 32 | 27 | 14 | 6 | 2 | 2 | 3 |
| Total | 4,680 | 194 | 145 | 176 | 149 | 158 | 135 | 153 | 110 | 126 | 124 | 96 | 104 | 117 | 90 | 96 | 391 | 91 | 349 | 412 | 308 | 316 | 267 | 198 | 138 | 79 | 79 | 34 | 20 | 8 | 8 | 9 |
| Kaikoura,— | ||||||||||||||||||||||||||||||||
| Males | 671 | 27 | 15 | 28 | 18 | 21 | 19 | 14 | 15 | 14 | 16 | 13 | 12 | 23 | 7 | 9 | 42 | 14 | 44 | 74 | 55 | 55 | 51 | 34 | 22 | 12 | 9 | 5 | 2 | … | 1 | … |
| Females | 434 | 24 | 17 | 17 | 22 | 21 | 18 | 16 | 13 | 9 | 17 | 10 | 14 | 4 | 10 | 4 | 48 | 10 | 36 | 34 | 29 | 19 | 18 | 8 | 8 | 5 | 1 | … | 1 | … | 1 | … |
| Total | 1,105 | 51 | 32 | 45 | 40 | 42 | 37 | 30 | 28 | 23 | 33 | 23 | 26 | 27 | 17 | 13 | 90 | 24 | 80 | 108 | 84 | 74 | 69 | 42 | 30 | 17 | 10 | 5 | 3 | … | 2 | … |
| Waimea,— | ||||||||||||||||||||||||||||||||
| Males | 3,928 | 151 | 120 | 120 | 124 | 139 | 114 | 110 | 105 | 120 | 96 | 120 | 122 | 113 | 94 | 108 | 393 | 63 | 224 | 229 | 199 | 219 | 183 | 168 | 144 | 85 | 97 | 69 | 44 | 31 | 11 | 13 |
| Females | 3,607 | 130 | 103 | 122 | 120 | 127 | 114 | 123 | 119 | 106 | 129 | 120 | 111 | 121 | 103 | 85 | 390 | 73 | 205 | 208 | 202 | 160 | 114 | 115 | 111 | 85 | 50 | 51 | 35 | 25 | 20 | 10 |
| Total | 7,535 | 281 | 223 | 242 | 244 | 266 | 228 | 233 | 224 | 226 | 225 | 240 | 233 | 234 | 197 | 193 | 783 | 136 | 429 | 437 | 401 | 379 | 317 | 283 | 255 | 170 | 147 | 120 | 79 | 56 | 31 | 23 |
| Collingwood,— | ||||||||||||||||||||||||||||||||
| Males | 926 | 21 | 23 | 27 | 32 | 33 | 25 | 31 | 21 | 21 | 32 | 23 | 21 | 27 | 11 | 19 | 75 | 10 | 54 | 55 | 50 | 68 | 63 | 59 | 54 | 17 | 21 | 13 | 7 | 4 | 2 | 7 |
| Females | 717 | 44 | 22 | 30 | 27 | 19 | 21 | 23 | 23 | 24 | 24 | 20 | 26 | 21 | 19 | 16 | 67 | 19 | 54 | 49 | 40 | 29 | 29 | 22 | 13 | 7 | 15 | 5 | 4 | 1 | 1 | 3 |
| Total | 1,643 | 65 | 45 | 57 | 59 | 52 | 46 | 54 | 44 | 45 | 56 | 43 | 47 | 48 | 30 | 35 | 142 | 29 | 108 | 104 | 90 | 97 | 92 | 81 | 67 | 24 | 36 | 18 | 11 | 5 | 3 | 10 |
| Buller,— | ||||||||||||||||||||||||||||||||
| Males | 1,618 | 50 | 33 | 37 | 51 | 45 | 38 | 43 | 30 | 39 | 35 | 28 | 32 | 27 | 24 | 15 | 76 | 11 | 51 | 85 | 95 | 94 | 235 | 168 | 96 | 37 | 28 | 6 | 2 | 3 | … | 4 |
| Females | 927 | 41 | 45 | 45 | 41 | 37 | 46 | 42 | 39 | 30 | 31 | 25 | 36 | 21 | 22 | 12 | 60 | 12 | 38 | 55 | 36 | 82 | 53 | 27 | 15 | 6 | 6 | 2 | 1 | 1 | … | … |
| Total | 2,545 | 91 | 78 | 82 | 92 | 82 | 84 | 85 | 69 | 69 | 66 | 53 | 68 | 48 | 46 | 27 | 136 | 23 | 89 | 140 | 151 | 276 | 278 | 195 | 111 | 43 | 34 | 8 | 3 | 4 | … | 4 |
Table XIV. Table XIV. Showing the Ages of Persons, Males, and Females (exclusive of Maoris), in each County. continued.
| Counties. | All Ages. | Under 5. | 5 and Under 10. | 10 and under 15. | 15 and under 21. | 21 and under. 40. | 40 and Under 60. | 60 and under 80. | 80 and upwards. | Unspecified. | ||||||||||||||||||||||
|---|---|---|---|---|---|---|---|---|---|---|---|---|---|---|---|---|---|---|---|---|---|---|---|---|---|---|---|---|---|---|---|---|
| Under 1 Year. | 1–2. | 2–3. | 3–4. | 4–5. | 5–6. | 6–7. | 7–8. | 8–9. | 9–10. | 10–11. | 11–12. | 12–13. | 13–14. | 14–15. | 15–20. | 20–21 | 21–25. | 25–30. | 30–35. | 35–40. | 40–45. | 45–50. | 50–55. | 55–60. | 60–65. | 65–70. | 70–75 | 75–80. | ||||
| Inangahua,— | ||||||||||||||||||||||||||||||||
| Males | 2,015 | 38 | 40 | 40 | 52 | 36 | 39 | 31 | 32 | 34 | 26 | 29 | 24 | 15 | 23 | 15 | 60 | 28 | 87 | 206 | 212 | 274 | 319 | 186 | 104 | 31 | 18 | 4 | 2 | 2 | … | 8 |
| Females | 912 | 44 | 39 | 52 | 42 | 39 | 37 | 45 | 27 | 27 | 17 | 22 | 17 | 15 | 21 | 15 | 59 | 12 | 50 | 89 | 79 | 68 | 46 | 26 | 12 | 7 | … | 3 | 1 | … | 1 | … |
| Total | 2,927 | 82 | 79 | 92 | 94 | 75 | 76 | 76 | 59 | 61 | 43 | 51 | 41 | 30 | 44 | 30 | 119 | 40 | 137 | 295 | 291 | 342 | 365 | 212 | 116 | 38 | 18 | 7 | 3 | 2 | 1 | 8 |
| Grey— | ||||||||||||||||||||||||||||||||
| Males | 3,405 | 75 | 52 | 72 | 59 | 61 | 67 | 55 | 50 | 49 | 50 | 35 | 49 | 40 | 30 | 19 | 102 | 45 | 153 | 257 | 325 | 472 | 546 | 379 | 199 | 81 | 49 | 20 | 5 | … | 3 | 6 |
| Females | 1,534 | 72 | 55 | 84 | 68 | 58 | 65 | 63 | 74 | 48 | 52 | 49 | 38 | 26 | 30 | 27 | 88 | 22 | 84 | 108 | 124 | 127 | 80 | 49 | 21 | 10 | 7 | 1 | 2 | 2 | … | … |
| Total | 4,939 | 147 | 107 | 156 | 127 | 119 | 132 | 118 | 124 | 97 | 102 | 84 | 87 | 66 | 60 | 46 | 190 | 67 | 237 | 365 | 449 | 599 | 626 | 428 | 220 | 91 | 56 | 21 | 7 | 2 | 3 | 6 |
| Westland,— | ||||||||||||||||||||||||||||||||
| Males | 3,592 | 75 | 64 | 69 | 78 | 74 | 82 | 63 | 74 | 60 | 60 | 59 | 41 | 52 | 29 | 31 | 121 | 29 | 126 | 230 | 236 | 466 | 579 | 437 | 250 | 107 | 53 | 24 | 5 | 3 | 2 | 13 |
| Females | 1,770 | 74 | 58 | 71 | 79 | 76 | 64 | 82 | 70 | 80 | 51 | 82 | 50 | 53 | 46 | 37 | 90 | 27 | 57 | 104 | 129 | 136 | 116 | 74 | 39 | 8 | 7 | 2 | 5 | … | … | 3 |
| Total | 5,362 | 149 | 122 | 140 | 157 | 150 | 146 | 145 | 144 | 140 | 111 | 141 | 91 | 105 | 75 | 68 | 211 | 56 | 183 | 334 | 365 | 602 | 695 | 511 | 289 | 115 | 60 | 26 | 10 | 13 | 2 | 16 |
| Amuri,— | ||||||||||||||||||||||||||||||||
| Males | 378 | 8 | 6 | 8 | 9 | 5 | 6 | 6 | 5 | 8 | 1 | 1 | 3 | … | 4 | 2 | 28 | 14 | 43 | 46 | 34 | 56 | 34 | 26 | 11 | 7 | 5 | 1 | 1 | … | … | … |
| Females | 135 | 6 | 7 | 5 | 5 | 8 | 3 | 2 | 4 | 2 | 3 | 5 | 3 | 3 | 2 | 1 | 11 | 4 | 15 | 14 | 12 | 11 | 6 | … | … | 1 | 1 | 1 | … | … | … | … |
| Total | 513 | 14 | 13 | 13 | 14 | 13 | 9 | 8 | 9 | 10 | 4 | 6 | 6 | 3 | 6 | 3 | 39 | 18 | 58 | 60 | 46 | 67 | 40 | 26 | 11 | 8 | 6 | 2 | 1 | … | … | … |
| Cheviot— | ||||||||||||||||||||||||||||||||
| Males | 75 | 1 | 1 | 1 | … | 1 | 1 | … | … | … | … | … | … | … | … | … | 5 | … | 13 | 7 | 8 | 11 | 6 | 5 | 4 | 2 | 1 | 2 | … | … | … | 6 |
| Females | 27 | 1 | … | 1 | 2 | 1 | 1 | … | 1 | … | … | … | … | … | … | … | … | 1 | 6 | 4 | 4 | 2 | … | 2 | … | … | 1 | … | … | … | … | … |
| Total | 102 | 2 | 1 | 2 | 2 | 2 | 2 | … | 1 | … | … | … | … | … | … | … | 5 | 1 | 19 | 11 | 12 | 13 | 6 | 7 | 4 | 2 | 2 | 2 | … | … | … | 6 |
| Ashley,— | ||||||||||||||||||||||||||||||||
| Males | 6,547 | 190 | 231 | 216 | 205 | 199 | 208 | 222 | 215 | 177 | 169 | 178 | 165 | 162 | 154 | 152 | 579 | 222 | 412 | 486 | 382 | 399 | 468 | 331 | 200 | 124 | 94 | 53 | 28 | 10 | 10 | 16 |
| Females | 5,408 | 206 | 197 | 199 | 223 | 198 | 182 | 183 | 170 | 170 | 171 | 195 | 152 | 182 | 148 | 133 | 519 | 99 | 329 | 322 | 285 | 322 | 290 | 200 | 134 | 71 | 54 | 41 | 17 | 5 | 4 | 7 |
| Total | 11,955 | 396 | 418 | 415 | 428 | 397 | 390 | 405 | 385 | 347 | 340 | 373 | 317 | 344 | 302 | 285 | 1,098 | 221 | 741 | 808 | 667 | 721 | 758 | 531 | 334 | 195 | 148 | 94 | 45 | 15 | 14 | 23 |
| Akaroa,— | ||||||||||||||||||||||||||||||||
| Males | 2,240 | 92 | 66 | 77 | 68 | 75 | 88 | 57 | 64 | 57 | 51 | 62 | 47 | 58 | 51 | 63 | 190 | 39 | 166 | 185 | 135 | 140 | 143 | 97 | 59 | 45 | 33 | 15 | 8 | 5 | 2 | 2 |
| Females | 1,780 | 90 | 53 | 66 | 85 | 67 | 57 | 60 | 56 | 47 | 58 | 57 | 50 | 49 | 50 | 56 | 183 | 29 | 127 | 123 | 99 | 103 | 71 | 60 | 32 | 16 | 19 | 9 | 4 | 2 | 2 | … |
| Total | 4,020 | l82 | 119 | 143 | 153 | 142 | 145 | 117 | 120 | 104 | 109 | 119 | 97 | 107 | 101 | 119 | 373 | 68 | 293 | 308 | 234 | 243 | 214 | 157 | 91 | 61 | 52 | 24 | 12 | 7 | 4 | 2 |
| Selwyn,— | ||||||||||||||||||||||||||||||||
| Males | 18,148 | 723 | 570 | 651 | 606 | 608 | 569 | 536 | 478 | 475 | 486 | 487 | 446 | 440 | 415 | 414 | 1,572 | 298 | 1,162 | 1,484 | 1,220 | 1,115 | 1,239 | 802 | 538 | 290 | 236 | 126 | 71 | 39 | 19 | 36 |
| Females | 16,175 | 648 | 556 | 634 | 596 | 636 | 553 | 525 | 502 | 477 | 429 | 465 | 414 | 450 | 412 | 361 | 1,589 | 291 | 1,059 | 1,222 | 1,034 | 933 | 845 | 573 | 378 | 224 | 184 | 90 | 57 | 22 | 9 | 7 |
| Total | 34,323 | 1,371 | 1,126 | 1,285 | 1,202 | 1,244 | 1,122 | 1,061 | 980 | 952 | 915 | 952 | 860 | 890 | 827 | 775 | 3,161 | 589 | 2,221 | 2,706 | 2,254 | 2,048 | 2,084 | 1,375 | 916 | 514 | 420 | 216 | 128 | 61 | 25 | 43 |
| Ashburton,— | ||||||||||||||||||||||||||||||||
| Males | 4,397 | 141 | 111 | 139 | 124 | 122 | 126 | 120 | 88 | 86 | 72 | 79 | 81 | 68 | 66 | 68 | 268 | 88 | 451 | 554 | 441 | 385 | 330 | 160 | 115 | 34 | 35 | 14 | 5 | 2 | 1 | 23 |
| Females | 2,768 | 142 | 134 | 128 | 138 | 115 | 96 | 94 | 89 | 80 | 94 | 72 | 68 | 71 | 61 | 44 | 201 | 45 | 182 | 250 | 198 | 178 | 111 | 82 | 42 | 21 | 12 | 8 | 3 | 3 | … | 6 |
| Total | 7,165 | 283 | 245 | 267 | 262 | 237 | 222 | 214 | 177 | 166 | 166 | 151 | 149 | 139 | 127 | 112 | 469 | 133 | 633 | 804 | 639 | 563 | 441 | 242 | 157 | 55 | 47 | 22 | 8 | 5 | 1 | 29 |
Table XIV. Table XIV. Showing the Ages of Persons, Males, and Females (exclusive of Maoris), in each County. continued.
| Counties. | All Ages. | Under 5. | 5 and Under 10. | 10 and under 15. | 15 and under 21. | 21 and under. 40. | 40 and Under 60. | 60 and under 80. | 80 and upwards. | Unspecified. | ||||||||||||||||||||||
|---|---|---|---|---|---|---|---|---|---|---|---|---|---|---|---|---|---|---|---|---|---|---|---|---|---|---|---|---|---|---|---|---|
| Under 1 Year. | 1–2. | 2–3. | 3–4. | 4–5. | 5–6. | 6–7. | 7–8. | 8–9. | 9–10. | 10–11. | 11–12. | 12–13. | 13–14. | 14–15. | 15–20. | 20–21 | 21–25. | 25–30. | 30–35. | 35–40. | 40–45. | 45–50. | 50–55. | 55–60. | 60–65. | 65–70. | 70–75 | 75–80. | ||||
| Geraldine,— | ||||||||||||||||||||||||||||||||
| Males | 7,041 | 260 | 236 | 267 | 247 | 227 | 208 | 206 | 165 | 152 | 168 | 150 | 156 | 133 | 122 | 124 | 490 | 104 | 504 | 753 | 575 | 553 | 499 | 310 | 169 | 81 | 57 | 42 | 15 | 4 | 4 | 60 |
| Females | 5,688 | 262 | 231 | 256 | 233 | 243 | 218 | 186 | 176 | 160 | 151 | 146 | 153 | 136 | 142 | 126 | 459 | 127 | 402 | 455 | 417 | 352 | 255 | 161 | 86 | 52 | 38 | 28 | 13 | 6 | 3 | 15 |
| Total | 12,729 | 522 | 467 | 523 | 480 | 470 | 426 | 392 | 341 | 312 | 319 | 296 | 309 | 269 | 264 | 250 | 949 | 231 | 906 | 1,208 | 992 | 905 | 754 | 471 | 255 | 133 | 95 | 70 | 28 | 10 | 7 | 75 |
| Waimate,— | ||||||||||||||||||||||||||||||||
| Males | 2,118 | 67 | 56 | 72 | 70 | 55 | 48 | 36 | 43 | 30 | 36 | 37 | 31 | 34 | 22 | 27 | 137 | 26 | 218 | 291 | 206 | l74 | 171 | 103 | 60 | 34 | 17 | 7 | 4 | 3 | … | 3 |
| Females | 1,320 | 79 | 47 | 62 | 61 | 46 | 46 | 47 | 42 | 45 | 31 | 37 | 20 | 41 | 34 | 26 | 97 | 30 | 91 | 108 | 99 | 74 | 79 | 28 | 22 | 8 | 8 | 4 | 5 | … | 3 | … |
| Total | 3,438 | 146 | 103 | 134 | 131 | 101 | 94 | 83 | 85 | 75 | 67 | 74 | 51 | 75 | 56 | 53 | 234 | 56 | 309 | 399 | 305 | 248 | 250 | 131 | 82 | 42 | 25 | 11 | 9 | 3 | 3 | 3 |
| Waitaki,— | ||||||||||||||||||||||||||||||||
| Males | 4,142 | 121 | 103 | 134 | 125 | 117 | 111 | 104 | 85 | 90 | 85 | 76 | 73 | 75 | 72 | 61 | 312 | 67 | 330 | 453 | 385 | 326 | 351 | 202 | 139 | 50 | 40 | 30 | 12 | 6 | … | 7 |
| Females | 2,813 | 157 | 109 | 119 | 117 | 117 | 104 | 100 | 98 | 76 | 76 | 83 | 69 | 63 | 56 | 54 | 258 | 48 | 183 | 223 | 195 | 179 | 129 | 76 | 39 | 35 | 23 | 16 | 7 | 1 | 1 | 2 |
| Total | 6,955 | 278 | 212 | 253 | 242 | 234 | 215 | 204 | 133 | 166 | 161 | 159 | 142 | 138 | 128 | 115 | 570 | 115 | 513 | 676 | 580 | 505 | 480 | 278 | 178 | 85 | 63 | 46 | 19 | 7 | 1 | 9 |
| Waikouaiti,— | ||||||||||||||||||||||||||||||||
| Males | 3,776 | 115 | 100 | 122 | 105 | 120 | 128 | 103 | 102 | 110 | 89 | 111 | 92 | 97 | 95 | 92 | 257 | 47 | 199 | 242 | 257 | 283 | 290 | 242 | 158 | 85 | 53 | 34 | 21 | 11 | 3 | 13 |
| Females | 2,885 | 113 | 96 | 112 | 121 | 110 | 99 | 96 | 102 | 110 | 91 | 93 | 80 | 98 | 72 | 72 | 245 | 40 | 140 | 194 | 184 | 173 | 177 | 104 | 56 | 38 | 32 | 14 | 6 | 8 | 2 | 7 |
| Total | 6,661 | 228 | 196 | 234 | 226 | 230 | 227 | 199 | 204 | 220 | 180 | 204 | 172 | 195 | 167 | 164 | 502 | 87 | 339 | 436 | 441 | 456 | 467 | 346 | 214 | 123 | 85 | 48 | 27 | 19 | 5 | 20 |
| Peninsula,— | ||||||||||||||||||||||||||||||||
| Males | 1,300 | 49 | 44 | 39 | 35 | 50 | 41 | 47 | 45 | 36 | 37 | 41 | 29 | 43 | 32 | 34 | 137 | 19 | 63 | 74 | 69 | 67 | 82 | 61 | 50 | 25 | 22 | 14 | 7 | 2 | 3 | 3 |
| Females | 1,125 | 41 | 26 | 31 | 42 | 38 | 34 | 29 | 33 | 27 | 32 | 35 | 25 | 40 | 45 | 32 | 135 | 14 | 73 | 67 | 64 | 68 | 52 | 43 | 33 | 18 | 25 | 9 | 3 | 3 | 3 | 5 |
| Total | 2,425 | 90 | 70 | 70 | 77 | 88 | 75 | 76 | 78 | 63 | 69 | 76 | 54 | 83 | 77 | 66 | 272 | 33 | 136 | 141 | 133 | 135 | 134 | 104 | 83 | 43 | 47 | 23 | 10 | 5 | 6 | 8 |
| Taieri,— | ||||||||||||||||||||||||||||||||
| Males | 4,230 | 114 | 95 | 117 | 121 | 139 | 120 | 135 | 116 | 113 | 107 | 103 | 86 | 105 | 99 | 102 | 392 | 72 | 296 | 344 | 279 | 299 | 292 | 190 | 157 | 93 | 70 | 23 | 20 | 12 | 7 | 12 |
| Females | 3,246 | 105 | 106 | 136 | 114 | 112 | 103 | 101 | 97 | 103 | 100 | 105 | 89 | 82 | 81 | 81 | 346 | 61 | 215 | 229 | 195 | 165 | 171 | 116 | 74 | 52 | 46 | 25 | 23 | 5 | 6 | 2 |
| Total | 7,476 | 219 | 201 | 253 | 235 | 251 | 223 | 236 | 213 | 216 | 207 | 208 | 175 | 187 | 180 | 183 | 738 | 133 | 51 | 573 | 474 | 464 | 463 | 306 | 231 | 145 | 116 | 48 | 43 | 17 | 13 | 14 |
| Bruce,— | ||||||||||||||||||||||||||||||||
| Males | 2,801 | 81 | 70 | 101 | 93 | 80 | 89 | 77 | 81 | 66 | 69 | 90 | 56 | 74 | 62 | 58 | 206 | 47 | 175 | 221 | 214 | 179 | 210 | 144 | 94 | 54 | 57 | 25 | 12 | 9 | 5 | 2 |
| Females | 2,248 | 91 | 70 | 83 | 92 | 94 | 89 | 84 | 82 | 86 | 66 | 79 | 72 | 74 | 58 | 69 | 180 | 27 | 111 | 140 | 126 | 147 | 124 | 57 | 47 | 29 | 29 | 18 | 16 | 3 | 3 | 2 |
| Total | 5,049 | 172 | 140 | 184 | 185 | 174 | 178 | 161 | 163 | 152 | 135 | 169 | 128 | 148 | 120 | 127 | 386 | 74 | 286 | 361 | 340 | 326 | 334 | 201 | 141 | 83 | 86 | 43 | 28 | 12 | 8 | 4 |
Table XIV. Table XIV. Showing the Ages of Persons, Males, and Females (exclusive of Maoris), in each County. continued.
| Counties. | All Ages. | Under 5. | 5 and Under 10. | 10 and under 15. | 15 and under 21. | 21 and under. 40. | 40 and Under 60. | 60 and under 80. | 80 and upwards. | Unspecified. | ||||||||||||||||||||||
|---|---|---|---|---|---|---|---|---|---|---|---|---|---|---|---|---|---|---|---|---|---|---|---|---|---|---|---|---|---|---|---|---|
| Under 1 Year. | 1–2. | 2–3. | 3–4. | 4–5. | 5–6. | 6–7. | 7–8. | 8–9. | 9–10. | 10–11. | 11–12. | 12–13. | 13–14. | 14–15. | 15–20. | 20–21 | 21–25. | 25–30. | 30–35. | 35–40. | 40–45. | 45–50. | 50–55. | 55–60. | 60–65. | 65–70. | 70–75 | 75–80. | ||||
| Clutha,— | ||||||||||||||||||||||||||||||||
| Males | 2,464 | 69 | 73 | 51 | 60 | 60 | 64 | 62 | 67 | 55 | 63 | 51 | 52 | 52 | 60 | 59 | 217 | 48 | 183 | 224 | 186 | 192 | 173 | 127 | 79 | 53 | 40 | 27 | 12 | 2 | 2 | 1 |
| Females | 1,741 | 68 | 57 | 66 | 78 | 56 | 61 | 61 | 50 | 54 | 54 | 49 | 53 | 47 | 43 | 52 | 157 | 35 | 113 | 93 | 117 | 105 | 84 | 64 | 44 | 27 | 18 | 10 | 15 | 6 | 2 | 2 |
| Total | 4,205 | 137 | 130 | 117 | 138 | 116 | 125 | 123 | 117 | 109 | 117 | 100 | 105 | 99 | 103 | 111 | 374 | 83 | 296 | 317 | 303 | 297 | 257 | 191 | 123 | 70 | 58 | 37 | 27 | 8 | 4 | 3 |
| Tuapeka,— | ||||||||||||||||||||||||||||||||
| Males | 3,970 | 90 | 83 | 99 | 98 | 93 | 101 | 97 | 87 | 99 | 83 | 83 | 85 | 92 | 78 | 68 | 231 | 46 | 190 | 378 | 336 | 378 | 393 | 317 | 189 | 59 | 55 | 16 | 7 | 2 | 2 | 35 |
| Females | 2,410 | 105 | 73 | 88 | 102 | 103 | 97 | 94 | 77 | 109 | 82 | 108 | 72 | 86 | 59 | 67 | 214 | 27 | 100 | 125 | 147 | 153 | 136 | 75 | 58 | 15 | 20 | 4 | 5 | 3 | 3 | 3 |
| Total | 6,380 | 195 | 156 | 187 | 200 | 196 | 198 | 191 | 164 | 208 | 165 | 191 | 157 | 178 | 137 | 135 | 445 | 73 | 290 | 503 | 483 | 531 | 529 | 392 | 247 | 74 | 75 | 20 | 12 | 5 | 5 | 38 |
| Maniototo,— | ||||||||||||||||||||||||||||||||
| Males | 1,555 | 37 | 33 | 53 | 42 | 32 | 32 | 31 | 33 | 27 | 31 | 24 | 24 | 20 | 22 | 19 | 72 | 16 | 69 | 151 | 146 | 145 | 212 | 137 | 81 | 32 | 14 | 4 | 2 | 1 | … | 13 |
| Females | 899 | 44 | 34 | 25 | 37 | 42 | 43 | 27 | 35 | 32 | 25 | 28 | 28 | 32 | 20 | 25 | 64 | 7 | 51 | 57 | 73 | 64 | 45 | 27 | 14 | 8 | 4 | 2 | 3 | 2 | … | 1 |
| Total | 2,454 | 81 | 67 | 78 | 79 | 74 | 75 | 58 | 68 | 59 | 56 | 52 | 52 | 52 | 42 | 44 | 136 | 23 | 120 | 208 | 219 | 209 | 257 | 164 | 95 | 40 | 18 | 6 | 5 | 3 | … | 14 |
| Vincent,— | ||||||||||||||||||||||||||||||||
| Males | 2,431 | 47 | 45 | 43 | 48 | 43 | 41 | 48 | 46 | 48 | 32 | 48 | 32 | 45 | 37 | 31 | 114 | 26 | 141 | 225 | 222 | 246 | 307 | 229 | 157 | 64 | 32 | 6 | 4 | 2 | 1 | 21 |
| Females | 1,134 | 45 | 32 | 44 | 44 | 49 | 49 | 43 | 42 | 41 | 39 | 44 | 33 | 34 | 22 | 28 | 100 | 46 | 59 | 73 | 83 | 84 | 39 | 39 | 19 | 11 | 6 | 3 | … | 2 | 2 | 2 |
| Total | 3,565 | 92 | 77 | 94 | 92 | 87 | 90 | 91 | 88 | 89 | 71 | 92 | 65 | 79 | 59 | 59 | 214 | 40 | 187 | 284 | 295 | 329 | 391 | 268 | 176 | 75 | 38 | 9 | 4 | 4 | 3 | 23 |
| Lake,— | ||||||||||||||||||||||||||||||||
| Males | 1,723 | 22 | 42 | 25 | 35 | 27 | 29 | 26 | 29 | 20 | 33 | 14 | 21 | 16 | 18 | 17 | 69 | 23 | 96 | 177 | 197 | 192 | 222 | 191 | 104 | 42 | 19 | 6 | 3 | 1 | 1 | 6 |
| Females | 763 | 42 | 18 | 32 | 47 | 36 | 28 | 38 | 25 | 28 | 27 | 26 | 21 | 29 | 13 | 15 | 41 | 6 | 41 | 54 | 56 | 46 | 39 | 20 | 16 | 8 | 7 | 1 | 3 | … | … | … |
| Total | 2,486 | 64 | 60 | 57 | 82 | 63 | 57 | 64 | 54 | 48 | 60 | 40 | 42 | 45 | 31 | 32 | 110 | 29 | 137 | 231 | 253 | 238 | 261 | 211 | 120 | 50 | 26 | 7 | 6 | 1 | 1 | 6 |
| Southland,— | ||||||||||||||||||||||||||||||||
| Males | 7,949 | 273 | 212 | 252 | 216 | 256 | 188 | 209 | 170 | 160 | 185 | 154 | 147 | 143 | 139 | 134 | 580 | 109 | 578 | 819 | 683 | 709 | 582 | 418 | 264 | 124 | 102 | 49 | 31 | 11 | 6 | 46 |
| Females | 5,266 | 246 | 188 | 233 | 195 | 211 | 184 | 199 | 170 | 170 | 147 | 161 | 135 | 156 | 142 | 138 | 470 | 77 | 313 | 399 | 320 | 332 | 238 | 152 | 110 | 63 | 60 | 28 | 16 | 9 | 6 | 8 |
| Total | 13,215 | 519 | 400 | 485 | 411 | 467 | 372 | 408 | 340 | 330 | 332 | 315 | 282 | 299 | 281 | 272 | 1,050 | 186 | 891 | 1,218 | 1,003 | 1,041 | 820 | 570 | 374 | 187 | 162 | 77 | 47 | 20 | 12 | 54 |
| Wallace,— | ||||||||||||||||||||||||||||||||
| Males | 2,406 | 64 | 39 | 53 | 53 | 58 | 49 | 4 | 40 | 38 | 46 | 28 | 29 | 31 | 30 | 36 | 167 | 55 | 232 | 310 | 273 | 228 | 211 | 125 | 84 | 33 | 28 | 9 | 8 | 3 | 2 | 3 |
| Females | 1,210 | 54 | 44 | 42 | 51 | 47 | 54 | 42 | 49 | 36 | 30 | 45 | 34 | 39 | 21 | 23 | 116 | 13 | 80 | 98 | 87 | 59 | 63 | 33 | 20 | 15 | 7 | 3 | 2 | 2 | … | 1 |
| Total | 3,616 | 118 | 83 | 95 | 104 | 105 | 103 | 83 | 89 | 74 | 76 | 73 | 63 | 70 | 51 | 59 | 283 | 68 | 312 | 408 | 360 | 287 | 274 | 158 | 104 | 48 | 35 | 12 | 10 | 5 | 2 | 4 |
| Fiord,— | ||||||||||||||||||||||||||||||||
| Males | 5 | … | … | 1 | … | … | … | … | … | … | … | … | … | … | … | … | … | … | … | 1 | 2 | … | … | 1 | … | … | … | … | … | … | … | … |
| Females | 8 | 1 | … | 1 | 1 | 1 | … | 1 | … | … | … | … | … | … | … | … | 1 | … | … | 2 | … | … | … | … | … | … | … | … | … | … | … | … |
| Total | 13 | 1 | … | 2 | 1 | 1 | … | 1 | … | … | … | … | … | … | … | … | 1 | … | … | 3 | 2 | … | … | 1 | … | … | … | … | … | … | … | … |
| Stewart Island,— | ||||||||||||||||||||||||||||||||
| Males | 164 | 8 | 8 | 3 | 7 | 12 | 6 | 3 | 3 | 3 | 4 | 3 | 3 | 5 | 1 | 6 | 16 | 1 | 3 | 7 | 14 | 11 | 11 | 9 | 4 | 5 | 3 | 2 | … | 1 | … | 2 |
| Females | 131 | 5 | 5 | 4 | 7 | 6 | 5 | 9 | 3 | 4 | 4 | 5 | 5 | 6 | 3 | 4 | 12 | 3 | 1 | 9 | 8 | 6 | 10 | 2 | … | 1 | 1 | 1 | … | 1 | … | 1 |
| Total | 295 | 13 | 13 | 7 | 14 | 18 | 11 | 12 | 6 | 7 | 8 | 8 | 8 | 11 | 4 | 10 | 18 | 4 | 4 | 16 | 22 | 17 | 21 | 11 | 4 | 6 | 4 | 3 | … | 2 | … | 3 |
Table XV. Table XV. Showing the Ages of Persons, Males, and Females (exclusive of Maoris), in each Borough.
| Boroughs. | All Ages. | Under 5. | 5 and Under 10. | 10 and under 15. | 15 and under 21. | 21 and under. 40. | 40 and Under 60. | 60 and under 80. | 80 and upwards. | Unspecified. | ||||||||||||||||||||||
|---|---|---|---|---|---|---|---|---|---|---|---|---|---|---|---|---|---|---|---|---|---|---|---|---|---|---|---|---|---|---|---|---|
| Under 1 Year. | 1–2. | 2–3. | 3–4. | 4–5. | 5–6. | 6–7. | 7–8. | 8–9. | 9–10. | 10–11. | 11–12. | 12–13. | 13–14. | 14–15. | 15–20. | 20–21 | 21–25. | 25–30. | 30–35. | 35–40. | 40–45. | 45–50. | 50–55. | 55–60. | 60–65. | 65–70. | 70–75 | 75–80. | ||||
| Auckland,— | ||||||||||||||||||||||||||||||||
| Males | 8,651 | 294 | 191 | 249 | 251 | 271 | 230 | 212 | 238 | 209 | 224 | 232 | 180 | 188 | 195 | 203 | 800 | 141 | 613 | 774 | 589 | 567 | 559 | 381 | 323 | 166 | 187 | 73 | 64 | 21 | 19 | 7 |
| Females | 8,013 | 223 | 205 | 237 | 272 | 245 | 215 | 201 | 169 | 195 | 189 | 221 | 184 | 227 | 176 | 174 | 956 | 189 | 643 | 635 | 543 | 500 | 430 | 318 | 235 | 143 | 150 | 63 | 40 | 16 | 17 | 2 |
| Total | 16,664 | 517 | 396 | 486 | 523 | 5l6 | 445 | 413 | 407 | 404 | 413 | 453 | 364 | 415 | 371 | 377 | 1,756 | 330 | 1,256 | 1,409 | 1,132 | 1,067 | 989 | 699 | 558 | 309 | 33 | 136 | 104 | 37 | 36 | 9 |
| Parnell,— | ||||||||||||||||||||||||||||||||
| Males | 1,726 | 64 | 52 | 53 | 50 | 53 | 47 | 55 | 43 | 49 | 44 | 56 | 50 | 36 | 58 | 41 | 152 | 29 | 93 | 112 | 87 | 90 | 104 | 79 | 63 | 50 | 38 | 26 | 26 | 15 | 10 | 1 |
| Females | 1,803 | 54 | 32 | 44 | 56 | 49 | 53 | 53 | 45 | 52 | 42 | 46 | 52 | 40 | 37 | 38 | 204 | 37 | 119 | 152 | 120 | 112 | 87 | 77 | 58 | 42 | 39 | 33 | 19 | 6 | 4 | 1 |
| Total | 3,529 | 118 | 84 | 97 | 106 | 102 | 100 | 108 | 88 | 101 | 86 | 102 | 102 | 76 | 95 | 79 | 356 | 66 | 212 | 264 | 207 | 202 | 191 | 156 | 121 | 92 | 77 | 59 | 45 | 21 | 14 | 2 |
| Onehunga,— | ||||||||||||||||||||||||||||||||
| Males | 1,047 | 28 | 34 | 40 | 36 | 43 | 30 | 33 | 36 | 23 | 23 | 30 | 26 | 29 | 32 | 31 | 91 | 13 | 49 | 61 | 53 | 52 | 59 | 40 | 46 | 31 | 26 | 14 | 24 | 12 | 2 | … |
| Females | 1,170 | 33 | 32 | 35 | 29 | 22 | 37 | 33 | 36 | 29 | 46 | 33 | 35 | 39 | 26 | 33 | 132 | 26 | 57 | 68 | 74 | 66 | 49 | 40 | 49 | 30 | 34 | 22 | 14 | 6 | 4 | 1 |
| Total | 2,217 | 61 | 66 | 75 | 65 | 65 | 67 | 66 | 72 | 52 | 69 | 63 | 61 | 68 | 58 | 64 | 223 | 39 | 106 | 129 | 127 | 118 | 108 | 80 | 95 | 61 | 60 | 36 | 38 | 18 | 6 | 1 |
| Thames,— | ||||||||||||||||||||||||||||||||
| Males | 2,533 | 92 | 66 | 94 | 35 | 88 | 96 | 88 | 77 | 67 | 73 | 78 | 71 | 51 | 52 | 57 | 178 | 37 | 119 | 136 | 138 | 210 | 233 | 128 | 101 | 45 | 34 | 16 | 12 | 8 | … | 8 |
| Females | 2,325 | 92 | 78 | 94 | 85 | 93 | 83 | 69 | 72 | 70 | 61 | 74 | 51 | 77 | 50 | 58 | 215 | 46 | 125 | 159 | 157 | 157 | 131 | 79 | 53 | 32 | 24 | 18 | 6 | 4 | 2 | 10 |
| Total | 4,863 | 184 | 144 | 188 | 170 | 181 | 179 | 157 | 149 | 137 | 134 | 152 | 122 | 128 | 102 | 115 | 393 | 83 | 244 | 295 | 295 | 367 | 364 | 207 | 154 | 77 | 58 | 34 | 18 | 12 | 2 | 18 |
| Gisborne,— | ||||||||||||||||||||||||||||||||
| Males | 959 | 36 | 38 | 36 | 37 | 29 | 21 | 27 | 21 | 31 | 20 | 24 | 20 | 23 | 19 | 21 | 61 | 10 | 52 | 88 | 73 | 96 | 73 | 46 | 25 | 13 | 7 | 6 | 1 | 1 | … | 4 |
| Females | 778 | 41 | 25 | 30 | 20 | 25 | 28 | 29 | 16 | 20 | 15 | 24 | 20 | 18 | 21 | 18 | 64 | 15 | 32 | 89 | 68 | 51 | 35 | 18 | 11 | 6 | 6 | … | 2 | … | 1 | 4 |
| Total | 1,737 | 77 | 63 | 66 | 57 | 54 | 49 | 56 | 37 | 51 | 35 | 48 | 40 | 41 | 40 | 39 | 125 | 25 | 110 | 177 | 141 | 147 | 108 | 64 | 36 | 19 | 13 | 6 | 3 | 1 | 1 | 8 |
| Hamilton,— | ||||||||||||||||||||||||||||||||
| Males | 700 | 25 | 17 | 21 | 25 | 28 | 23 | 16 | 19 | 22 | 24 | 18 | 17 | 14 | 22 | 23 | 55 | 8 | 41 | 57 | 43 | 46 | 44 | 23 | 32 | 16 | 12 | 4 | 3 | 1 | … | 1 |
| Females | 661 | 22 | 27 | 24 | 26 | 24 | 19 | 24 | 20 | 18 | 19 | 21 | 19 | 20 | 22 | 17 | 49 | 14 | 56 | 57 | 41 | 39 | 18 | 25 | 21 | 7 | 8 | 1 | 1 | … | … | 2 |
| Total | 1,361 | 47 | 44 | 45 | 51 | 52 | 42 | 40 | 39 | 40 | 43 | 39 | 36 | 34 | 44 | 40 | 104 | 22 | 97 | 114 | 84 | 85 | 62 | 48 | 53 | 23 | 20 | 5 | 4 | 1 | … | 3 |
| New Plymouth,— | ||||||||||||||||||||||||||||||||
| Males | 1,673 | 63 | 51 | 66 | 58 | 55 | 47 | 44 | 51 | 43 | 37 | 36 | 36 | 39 | 36 | 35 | 128 | 24 | 100 | 151 | 116 | 97 | 95 | 68 | 68 | 36 | 34 | 20 | 15 | 5 | 4 | 15 |
| Females | 1,637 | 66 | 54 | 63 | 55 | 55 | 44 | 45 | 39 | 36 | 38 | 38 | 32 | 44 | 28 | 55 | 178 | 40 | 127 | 129 | 117 | 69 | 66 | 63 | 34 | 31 | 31 | 22 | 13 | 9 | 9 | 7 |
| Total | 3,310 | 129 | 105 | 129 | 113 | 110 | 91 | 89 | 90 | 79 | 75 | 74 | 68 | 83 | 64 | 90 | 306 | 64 | 227 | 280 | 233 | 166 | 161 | 131 | 102 | 67 | 65 | 42 | 28 | 14 | 13 | 22 |
Table XV. Table XV. Showing the Ages of Persons, Males, and Females (exclusive of Maoris), in each Borough.continued.
| Boroughs. | All Ages. | Under 5. | 5 and Under 10. | 10 and under 15. | 15 and under 21. | 21 and under. 40. | 40 and Under 60. | 60 and under 80. | 80 and upwards. | Unspecified. | ||||||||||||||||||||||
|---|---|---|---|---|---|---|---|---|---|---|---|---|---|---|---|---|---|---|---|---|---|---|---|---|---|---|---|---|---|---|---|---|
| Under 1 Year. | 1–2. | 2–3. | 3–4. | 4–5. | 5–6. | 6–7. | 7–8. | 8–9. | 9–10. | 10–11. | 11–12. | 12–13. | 13–14. | 14–15. | 15–20. | 20–21 | 21–25. | 25–30. | 30–35. | 35–40. | 40–45. | 45–50. | 50–55. | 55–60. | 60–65. | 65–70. | 70–75 | 75–80. | ||||
| Wanganui,— | ||||||||||||||||||||||||||||||||
| Males | 2,330 | 94 | 87 | 87 | 77 | 77 | 63 | 65 | 64 | 54 | 48 | 54 | 43 | 63 | 48 | 47 | 206 | 35 | 143 | 203 | 157 | 163 | 145 | 116 | 76 | 41 | 32 | 16 | 7 | 7 | 1 | 6 |
| Females | 2,316 | 107 | 57 | 90 | 77 | 70 | 82 | 71 | 61 | 71 | 55 | 58 | 66 | 55 | 46 | 62 | 225 | 44 | 206 | 196 | 158 | 129 | 101 | 76 | 63 | 34 | 31 | 10 | 7 | 4 | 3 | 3 |
| Total | 4,646 | 201 | 145 | 177 | 154 | 147 | 145 | 14c | 125 | 125 | 101 | 112 | 109 | 118 | 94 | 109 | 431 | 71 | 349 | 399 | 315 | 292 | 246 | 192 | 139 | 75 | 63 | 26 | 14 | 11 | 4 | 9 |
| Marton,— | ||||||||||||||||||||||||||||||||
| Males | 363 | 11 | 12 | 13 | 7 | 13 | 4 | 7 | 5 | 10 | 9 | 12 | 11 | 6 | 7 | 8 | 38 | 5 | 20 | 29 | 35 | 25 | 21 | 23 | 15 | 7 | 7 | 1 | … | … | … | 2 |
| Females | 299 | 14 | 14 | 13 | 13 | 14 | 15 | 9 | 5 | 4 | 11 | 6 | 9 | 7 | 5 | 6 | 29 | 2 | 23 | 26 | 20 | 15 | 13 | 10 | 9 | 5 | … | 1 | … | 1 | … | … |
| Total | 662 | 25 | 26 | 26 | 20 | 27 | 19 | 16 | 10 | 10 | 20 | 18 | 20 | 13 | 12 | 14 | 67 | 7 | 43 | 55 | 55 | 40 | 34 | 33 | 24 | 12 | 7 | 2 | … | 1 | … | 2 |
| Palmerston North,— | ||||||||||||||||||||||||||||||||
| Males | 723 | 27 | 28 | 25 | 29 | 31 | 25 | 22 | 11 | 22 | 17 | 18 | 11 | 14 | 8 | 15 | 46 | 13 | 38 | 60 | 78 | 67 | 51 | 25 | 19 | 7 | 10 | 3 | … | 1 | … | 2 |
| Females | 643 | 32 | 30 | 26 | 34 | 23 | 22 | 30 | 17 | 23 | 12 | 25 | 15 | 12 | 8 | 11 | 55 | 9 | 35 | 49 | 63 | 44 | 24 | 16 | 8 | 5 | 10 | 4 | 1 | … | … | … |
| Total | 1,366 | 59 | 58 | 51 | 63 | 54 | 47 | 52 | 28 | 45 | 29 | 43 | 26 | 26 | 16 | 26 | 101 | 22 | 73 | 109 | 141 | 111 | 75 | 41 | 27 | 12 | 20 | 7 | 1 | 1 | … | 2 |
| Wellington,— | ||||||||||||||||||||||||||||||||
| Males | 10,226 | 409 | 315 | 365 | 353 | 335 | 322 | 290 | 251 | 243 | 248 | 257 | 240 | 224 | 213 | 212 | 846 | 140 | 682 | 918 | 758 | 723 | 635 | 429 | 293 | 187 | 141 | 64 | 50 | 18 | 9 | 56 |
| Females | 10,337 | 392 | 355 | 335 | 364 | 337 | 338 | 293 | 263 | 262 | 268 | 237 | 237 | 234 | 222 | 243 | 1,049 | 232 | 929 | 885 | 721 | 637 | 465 | 337 | 250 | 121 | 122 | 67 | 53 | 19 | 10 | 60 |
| Total | 20,563 | 801 | 670 | 700 | 717 | 672 | 660 | 583 | 514 | 505 | 516 | 494 | 477 | 458 | 435 | 455 | 1,895 | 372 | 1,611 | 1,803 | 1,479 | 1,360 | 1,100 | 766 | 543 | 308 | 263 | 131 | 103 | 37 | 9 | 116 |
| Masterton,— | ||||||||||||||||||||||||||||||||
| Males | 1,155 | 57 | 49 | 48 | 51 | 57 | 42 | 35 | 30 | 34 | 24 | 24 | 26 | 12 | 22 | 20 | 52 | 14 | 66 | 110 | 110 | 80 | 83 | 35 | 33 | 14 | 10 | 12 | 3 | 1 | 1 | … |
| Females | 1,086 | 46 | 55 | 62 | 55 | 37 | 33 | 33 | 34 | 23 | 30 | 28 | 19 | 27 | 21 | 24 | 91 | 16 | 73 | 106 | 98 | 60 | 36 | 24 | 28 | 9 | 7 | 6 | 2 | 1 | 1 | 1 |
| Total | 2,241 | 103 | 104 | 110 | 106 | 94 | 75 | 68 | 64 | 57 | 54 | 52 | 45 | 39 | 43 | 44 | 143 | 30 | 139 | 216 | 208 | 140 | 119 | 59 | 61 | 23 | 17 | 18 | 5 | 2 | 2 | 1 |
| Greytown,— | ||||||||||||||||||||||||||||||||
| Males | 561 | 21 | 14 | 22 | 15 | 19 | 18 | 27 | 21 | 11 | 20 | 20 | 17 | 11 | 12 | 15 | 48 | 7 | 31 | 40 | 42 | 34 | 27 | 22 | 18 | 6 | 7 | 5 | 9 | 1 | 1 | … |
| Females | 517 | 20 | 21 | 20 | 17 | 19 | 18 | 15 | 20 | 12 | 11 | 18 | 12 | 23 | 18 | 16 | 51 | 13 | 36 | 28 | 29 | 30 | 26 | 15 | 6 | 5 | 4 | 6 | 5 | 2 | … | 1 |
| Total | 1,078 | 41 | 35 | 42 | 32 | 38 | 36 | 42 | 41 | 23 | 31 | 38 | 29 | 34 | 30 | 31 | 99 | 20 | 67 | 68 | 71 | 64 | 53 | 37 | 24 | 11 | 11 | 11 | 14 | 3 | 1 | 1 |
| Napier,— | ||||||||||||||||||||||||||||||||
| Males | 2,896 | 133 | 90 | 113 | 88 | 86 | 82 | 67 | 80 | 85 | 55 | 64 | 74 | 67 | 64 | 60 | 242 | 39 | 169 | 260 | 234 | 207 | 186 | 128 | 90 | 44 | 34 | 19 | 10 | 7 | 2 | 17 |
| Females | 2,860 | 119 | 83 | 104 | 81 | 96 | 90 | 101 | 69 | 72 | 86 | 89 | 69 | 89 | 72 | 63 | 298 | 77 | 204 | 234 | 195 | 167 | 153 | 96 | 66 | 34 | 23 | 10 | 10 | 5 | 3 | 11 |
| Total | 5,746 | 252 | 173 | 217 | 169 | 182 | 172 | 168 | 149 | 157 | 141 | 153 | 143 | 147 | 136 | 123 | 540 | 116 | 373 | 494 | 429 | 374 | 339 | 224 | 156 | 78 | 57 | 29 | 20 | 12 | 5 | 28 |
| Picton,— | ||||||||||||||||||||||||||||||||
| Males | 401 | 18 | 15 | 22 | 12 | 15 | 14 | 7 | 15 | 7 | 17 | 11 | 21 | 12 | 5 | 10 | 30 | 5 | 23 | 21 | 16 | 21 | 18 | 21 | 16 | 10 | 7 | 3 | 6 | 3 | … | … |
| Females | 433 | 17 | 10 | 13 | 17 | 16 | 19 | 14 | 15 | 13 | 15 | 15 | 16 | 14 | 20 | 9 | 45 | 8 | 26 | 26 | 25 | 27 | 16 | 13 | 11 | 4 | 3 | 2 | 2 | 1 | … | 1 |
| Total | 834 | 35 | 25 | 35 | 29 | 31 | 33 | 21 | 30 | 20 | 32 | 26 | 37 | 26 | 25 | 19 | 75 | 13 | 49 | 47 | 41 | 48 | 34 | 34 | 27 | 14 | 10 | 5 | 7 | 4 | … | 1 |
| Blenheim,— | ||||||||||||||||||||||||||||||||
| Males | 1,051 | 40 | 39 | 41 | 40 | 44 | 38 | 35 | 30 | 27 | 23 | 29 | 33 | 34 | 20 | 13 | 80 | 14 | 75 | 861 | 66 | 55 | 57 | 53 | 32 | 13 | 20 | 5 | 6 | 1 | … | 2 |
| Females | 1,056 | 72 | 36 | 48 | 52 | 41 | 32 | 34 | 33 | 31 | 32 | 29 | 21 | 20 | 22 | 23 | 107 | 27 | 86 | 82 | 68 | 44 | 39 | 24 | 16 | 12 | 11 | 8 | 2 | 1 | 2 | 1 |
| Total | 2,107 | 112 | 75 | 89 | 92 | 85 | 70 | 69 | 63 | 58 | 55 | 58 | 54 | 54 | 42 | 36 | 187 | 41 | 161 | 168 | 134 | 99 | 96 | 77 | 48 | 25 | 31 | 13 | 8 | 2 | 2 | 3 |
Table XV. Table XV. Showing the Ages of Persons, Males, and Females (exclusive of Maoris), in each Borough.continued.
| Boroughs. | All Ages. | Under 5. | 5 and Under 10. | 10 and under 15. | 15 and under 21. | 21 and under. 40. | 40 and Under 60. | 60 and under 80. | 80 and upwards. | Unspecified. | ||||||||||||||||||||||
|---|---|---|---|---|---|---|---|---|---|---|---|---|---|---|---|---|---|---|---|---|---|---|---|---|---|---|---|---|---|---|---|---|
| Under 1 Year. | 1–2. | 2–3. | 3–4. | 4–5. | 5–6. | 6–7. | 7–8. | 8–9. | 9–10. | 10–11. | 11–12. | 12–13. | 13–14. | 14–15. | 15–20. | 20–21 | 21–25. | 25–30. | 30–35. | 35–40. | 40–45. | 45–50. | 50–55. | 55–60. | 60–65. | 65–70. | 70–75 | 75–80. | ||||
| Nelson,— | ||||||||||||||||||||||||||||||||
| Males | 3,261 | 106 | 79 | 117 | 100 | 86 | 90 | 93 | 86 | 100 | 83 | 105 | 102 | 111 | 110 | 96 | 360 | 56 | 180 | 164 | 139 | 175 | 169 | 155 | 135 | 94 | 65 | 45 | 25 | 22 | 5 | 8 |
| Females | 3,503 | 88 | 92 | 85 | 99 | 102 | 84 | 94 | 110 | 90 | 94 | 108 | 85 | 101 | 91 | 72 | 474 | 76 | 273 | 218 | 184 | 184 | 178 | 155 | 100 | 80 | 65 | 43 | 37 | 21 | 15 | 5 |
| Total | 6,764 | 194 | 171 | 202 | 199 | 188 | 174 | 187 | 196 | 190 | 177 | 213 | 187 | 212 | 201 | 168 | 834 | 132 | 453 | 382 | 323 | 359 | 347 | 310 | 235 | 174 | 130 | 88 | 62 | 43 | 20 | 13 |
| Westport,— | ||||||||||||||||||||||||||||||||
| Males | 538 | 21 | 12 | 27 | 22 | 15 | 17 | 19 | 26 | 18 | 20 | 15 | 17 | 13 | 10 | 10 | 22 | 3 | 12 | 17 | 29 | 45 | 52 | 46 | 32 | 6 | 5 | 1 | 4 | … | … | 2 |
| Females | 475 | 21 | 18 | 20 | 15 | 13 | 19 | 14 | 16 | 13 | 16 | 14 | 11 | 15 | 7 | 10 | 43 | 8 | 27 | 34 | 33 | 39 | 28 | 22 | 9 | 3 | 3 | … | 2 | 2 | … | … |
| Total | 1,013 | 42 | 30 | 47 | 37 | 28 | 36 | 33 | 42 | 31 | 36 | 29 | 28 | 28 | 17 | 20 | 65 | 11 | 39 | 51 | 62 | 84 | 80 | 68 | 41 | 9 | 8 | 1 | 6 | 2 | … | 2 |
| Greymouth,— | ||||||||||||||||||||||||||||||||
| Males | 1,331 | 36 | 32 | 44 | 39 | 43 | 40 | 38 | 35 | 34 | 49 | 38 | 32 | 40 | 22 | 31 | 102 | 11 | 42 | 74 | 89 | 105 | 140 | 102 | 54 | 27 | 16 | 8 | 3 | 1 | … | 4 |
| Females | 1,213 | 51 | 27 | 48 | 44 | 44 | 34 | 39 | 50 | 41 | 33 | 35 | 43 | 33 | 24 | 27 | 98 | 32 | 71 | 80 | 82 | 99 | 86 | 53 | 15 | 8 | 5 | 3 | 3 | 2 | 1 | 2 |
| Total | 2,544 | 87 | 59 | 92 | 83 | 87 | 74 | 77 | 85 | 75 | 82 | 73 | 75 | 73 | 46 | 58 | 200 | 43 | 113 | 154 | 171 | 204 | 226 | 155 | 69 | 35 | 21 | 11 | 6 | 3 | 1 | 6 |
| Hokitika,— | ||||||||||||||||||||||||||||||||
| Males | 1,264 | 42 | 38 | 42 | 42 | 46 | 30 | 35 | 36 | 32 | 33 | 48 | 42 | 39 | 35 | 37 | 118 | 6 | 40 | 40 | 42 | 83 | 124 | 102 | 69 | 31 | 18 | 6 | 4 | 2 | 2 | … |
| Females | 1,331 | 34 | 39 | 38 | 42 | 35 | 39 | 42 | 45 | 44 | 57 | 53 | 44 | 51 | 44 | 32 | 136 | 17 | 67 | 67 | 73 | 112 | 99 | 54 | 38 | 11 | 8 | 7 | 4 | 2 | 1 | 1 |
| Total | 2,600 | 76 | 77 | 80 | 84 | 81 | 69 | 77 | 81 | 76 | 90 | 101 | 86 | 90 | 79 | 69 | 254 | 23 | 107 | 107 | 115 | 195 | 223 | 156 | 107 | 42 | 26 | 13 | 8 | 4 | 3 | 1 |
| Ross,— | ||||||||||||||||||||||||||||||||
| Males | 647 | 20 | 11 | 21 | 16 | 11 | 20 | 16 | 22 | 24 | 22 | 24 | 13 | 25 | 11 | 8 | 28 | 1 | 20 | 31 | 36 | 62 | 78 | 65 | 36 | 15 | 7 | 2 | 2 | … | … | … |
| Females | 492 | 20 | 17 | 18 | 17 | 24 | 21 | 21 | 25 | 16 | 21 | 22 | 21 | 16 | 15 | 15 | 26 | 2 | 15 | 13 | 36 | 41 | 33 | 22 | 7 | 4 | 3 | 1 | … | … | … | … |
| Total | 1,139 | 40 | 28 | 39 | 33 | 35 | 41 | 37 | 47 | 40 | 43 | 46 | 34 | 41 | 26 | 23 | 54 | 3 | 35 | 44 | 72 | 103 | 111 | 87 | 43 | 19 | 10 | 3 | 2 | … | … | … |
| Kumara,— | ||||||||||||||||||||||||||||||||
| Males | 622 | 17 | 15 | 18 | 15 | 23 | 18 | 21 | 21 | 12 | 20 | 7 | 17 | 13 | 17 | 8 | 21 | 3 | 23 | 36 | 39 | 55 | 86 | 52 | 33 | 16 | 9 | 3 | … | … | … | 4 |
| Females | 523 | 23 | 24 | 17 | 19 | 12 | 13 | 13 | 21 | 28 | 17 | 12 | 16 | 10 | 14 | 8 | 57 | 11 | 23 | 31 | 43 | 52 | 26 | 8 | 9 | 6 | 5 | 2 | 1 | … | … | 2 |
| Total | 1,145 | 40 | 39 | 35 | 34 | 35 | 31 | 34 | 42 | 40 | 37 | 19 | 33 | 23 | 31 | 16 | 78 | 14 | 46 | 67 | 82 | 107 | 112 | 60 | 42 | 22 | 14 | 5 | 1 | … | … | 6 |
| Ashburton,— | ||||||||||||||||||||||||||||||||
| Males | 844 | 33 | 27 | 25 | 27 | 24 | 23 | 15 | 18 | 21 | 15 | 16 | 19 | 19 | 9 | 8 | 60 | 12 | 61 | 104 | 78 | 77 | 39 | 46 | 23 | 8 | 12 | 7 | 5 | 5 | 2 | 6 |
| Females | 682 | 29 | 23 | 25 | 27 | 30 | 14 | 21 | 18 | 24 | 16 | 13 | 19 | 12 | 24 | 12 | 79 | 15 | 61 | 62 | 46 | 40 | 27 | 21 | 10 | 3 | 3 | 6 | … | … | … | 2 |
| Total | 1,526 | 62 | 50 | 50 | 54 | 54 | 37 | 36 | 36 | 45 | 31 | 29 | 38 | 31 | 33 | 20 | 139 | 27 | 122 | 166 | 124 | 117 | 66 | 67 | 33 | 11 | 15 | 13 | 5 | 5 | 2 | 8 |
Table XV. Table XV. Showing the Ages of Persons, Males, and Females (exclusive of Maoris), in each Borough.continued.
| Boroughs. | All Ages. | Under 5. | 5 and Under 10. | 10 and under 15. | 15 and under 21. | 21 and under. 40. | 40 and Under 60. | 60 and under 80. | 80 and upwards. | Unspecified. | ||||||||||||||||||||||
|---|---|---|---|---|---|---|---|---|---|---|---|---|---|---|---|---|---|---|---|---|---|---|---|---|---|---|---|---|---|---|---|---|
| Under 1 Year. | 1–2. | 2–3. | 3–4. | 4–5. | 5–6. | 6–7. | 7–8. | 8–9. | 9–10. | 10–11. | 11–12. | 12–13. | 13–14. | 14–15. | 15–20. | 20–21 | 21–25. | 25–30. | 30–35. | 35–40. | 40–45. | 45–50. | 50–55. | 55–60. | 60–65. | 65–70. | 70–75 | 75–80. | ||||
| Kaiapoi,— | ||||||||||||||||||||||||||||||||
| Males | 594 | 22 | 18 | 22 | 22 | 25 | 17 | 17 | 21 | 14 | 16 | 16 | 13 | 17 | 8 | 14 | 57 | 11 | 37 | 40 | 39 | 39 | 34 | 26 | 13 | 12 | 13 | 4 | 4 | 2 | 1 | … |
| Females | 627 | 22 | 18 | 20 | 20 | 23 | 15 | 22 | 20 | 15 | 18 | 18 | 11 | 20 | 21 | 19 | 73 | 11 | 38 | 54 | 32 | 32 | 22 | 28 | 17 | 14 | 10 | 8 | 3 | 2 | 1 | … |
| Total | 1,221 | 44 | 36 | 42 | 42 | 48 | 32 | 39 | 41 | 29 | 34 | 34 | 24 | 37 | 29 | 33 | 130 | 22 | 75 | 94 | 71 | 71 | 56 | 54 | 30 | 26 | 23 | 12 | 7 | 4 | 2 | … |
| Akaroa,— | ||||||||||||||||||||||||||||||||
| Males | 296 | 12 | 14 | 4 | 11 | 7 | 5 | 9 | 7 | 4 | 3 | 8 | 6 | 7 | 5 | 12 | 27 | 6 | 19 | 25 | 21 | 23 | 16 | 17 | 9 | 7 | 3 | 2 | 3 | 2 | 2 | … |
| Females | 315 | 6 | 12 | 11 | 9 | 12 | 7 | 8 | 6 | 5 | 11 | 7 | 10 | 11 | 9 | 6 | 45 | 5 | 30 | 24 | 17 | 18 | 11 | 13 | 9 | 4 | 4 | 1 | 3 | … | 1 | … |
| Total | 611 | 18 | 26 | 15 | 20 | 19 | 12 | 17 | 13 | 9 | 14 | 15 | 16 | 18 | 14 | 18 | 72 | 11 | 49 | 49 | 38 | 41 | 27 | 30 | 18 | 11 | 7 | 3 | 6 | 2 | 3 | … |
| Lyttelton,— | ||||||||||||||||||||||||||||||||
| Males | 2,205 | 92 | 71 | 75 | 82 | 73 | 70 | 58 | 57 | 65 | 50 | 56 | 41 | 55 | 33 | 35 | 146 | 33 | 122 | 231 | 186 | 186 | 148 | 110 | 63 | 33 | 28 | 14 | 4 | 2 | 3 | 3 |
| Females | 1,922 | 78 | 74 | 82 | 69 | 67 | 75 | 65 | 52 | 62 | 55 | 58 | 47 | 63 | 46 | 49 | 161 | 42 | 149 | 155 | 110 | 130 | 88 | 54 | 24 | 20 | 24 | 9 | 5 | 6 | 2 | 1 |
| Total | 4,127 | 170 | 145 | 157 | 151 | 140 | 145 | 125 | 109 | 127 | 105 | 114 | 88 | 118 | 79 | 84 | 307 | 75 | 271 | 386 | 296 | 296 | 236 | 164 | 87 | 53 | 52 | 23 | 9 | 8 | 5 | 4 |
| Christchurch,— | ||||||||||||||||||||||||||||||||
| Males | 7,734 | 308 | 199 | 218 | 213 | 225 | 210 | 184 | 195 | 170 | 173 | 182 | 158 | 176 | 164 | 158 | 670 | 141 | 572 | 808 | 609 | 524 | 522 | 362 | 249 | 126 | 93 | 59 | 26 | 11 | 6 | 23 |
| Females | 7,479 | 240 | 206 | 231 | 248 | 199 | 181 | 173 | 176 | 187 | 169 | 197 | 166 | 161 | 165 | 178 | 926 | 196 | 695 | 702 | 505 | 441 | 405 | 256 | 169 | 108 | 102 | 42 | 33 | 9 | 7 | 6 |
| Total | 15,213 | 548 | 405 | 449 | 461 | 424 | 391 | 357 | 371 | 357 | 342 | 379 | 324 | 337 | 329 | 336 | 1,596 | 337 | 1,267 | 1,510 | 1,114 | 965 | 927 | 618 | 418 | 234 | 195 | 101 | 59 | 20 | 13 | 29 |
| Sydenham,— | ||||||||||||||||||||||||||||||||
| Males | 4,290 | 199 | 139 | 185 | 165 | 176 | 151 | 139 | 124 | 116 | 124 | 119 | 95 | 93 | 95 | 86 | 359 | 61 | 217 | 338 | 313 | 296 | 273 | 174 | 124 | 52 | 39 | 19 | 9 | 6 | 4 | … |
| Females | 4,170 | 186 | 150 | 186 | 156 | 160 | 160 | 148 | 121 | 110 | 125 | 111 | 106 | 100 | 90 | 99 | 333 | 54 | 261 | 355 | 317 | 262 | 225 | 144 | 76 | 53 | 44 | 19 | 13 | 4 | 2 | … |
| Total | 8,460 | 385 | 289 | 371 | 321 | 336 | 311 | 287 | 245 | 226 | 249 | 230 | 201 | 193 | 185 | 185 | 692 | 115 | 478 | 693 | 630 | 558 | 498 | 318 | 200 | 105 | 83 | 38 | 22 | 10 | 6 | … |
| Timaru,— | ||||||||||||||||||||||||||||||||
| Males | 2,117 | 73 | 56 | 67 | 54 | 51 | 63 | 60 | 38 | 42 | 49 | 45 | 39 | 49 | 25 | 44 | 149 | 42 | 172 | 260 | 192 | 179 | 147 | 93 | 59 | 25 | 18 | 13 | 5 | 4 | 2 | 2 |
| Females | 1,800 | 70 | 62 | 59 | 66 | 50 | 49 | 58 | 51 | 41 | 41 | 52 | 38 | 33 | 42 | 37 | 206 | 41 | 177 | 161 | 112 | 119 | 85 | 57 | 38 | 17 | 18 | 8 | 6 | 2 | 1 | 3 |
| Total | 3,917 | 143 | 118 | 126 | 120 | 101 | 112 | 118 | 89 | 81 | 90 | 97 | 77 | 82 | 67 | 81 | 355 | 83 | 349 | 421 | 304 | 298 | 232 | 150 | 97 | 42 | 36 | 21 | 11 | 6 | 3 | 5 |
| Rangiora,— | ||||||||||||||||||||||||||||||||
| Males | 743 | 37 | 16 | 18 | 28 | 21 | 37 | 16 | 21 | 17 | 16 | 20 | 21 | 18 | 21 | 18 | 71 | 10 | 51 | 58 | 47 | 51 | 40 | 30 | 22 | 12 | 18 | 6 | 7 | 2 | … | 3 |
| Females | 702 | 25 | 28 | 24 | 31 | 21 | 21 | 21 | 23 | 16 | 17 | 16 | 17 | 16 | 18 | 17 | 64 | 21 | 52 | 49 | 44 | 43 | 34 | 32 | 23 | 12 | 5 | 7 | 2 | 2 | … | 1 |
| Total | 1,445 | 62 | 44 | 42 | 59 | 42 | 48 | 37 | 44 | 33 | 33 | 36 | 38 | 34 | 39 | 35 | 135 | 31 | 103 | 107 | 91 | 94 | 74 | 62 | 45 | 24 | 23 | 13 | 9 | 4 | … | 4 |
| Waimate,— | ||||||||||||||||||||||||||||||||
| Males | 870 | 35 | 47 | 37 | 25 | 33 | 31 | 31 | 16 | 22 | 22 | 17 | 17 | 23 | 18 | 15 | 47 | 11 | 45 | 88 | 78 | 69 | 58 | 33 | 27 | 10 | 9 | 2 | … | 1 | 1 | 2 |
| Females | 730 | 36 | 28 | 27 | 36 | 23 | 26 | 21 | 18 | 21 | 24 | 27 | 16 | 22 | 15 | 15 | 69 | 6 | 45 | 63 | 54 | 47 | 46 | 15 | 16 | 5 | 4 | 2 | 3 | … | … | … |
| Total | 1,600 | 71 | 75 | 64 | 61 | 56 | 57 | 52 | 34 | 43 | 46 | 44 | 33 | 45 | 33 | 30 | 116 | 17 | 90 | 151 | 132 | 116 | 104 | 48 | 43 | 15 | 13 | 4 | 3 | 1 | 1 | 2 |
| Oamaru,— | ||||||||||||||||||||||||||||||||
| Males | 3,007 | 148 | 83 | 106 | 114 | 92 | 113 | 74 | 75 | 63 | 66 | 74 | 57 | 78 | 57 | 53 | 200 | 53 | 186 | 328 | 226 | 233 | 227 | 143 | 66 | 23 | 30 | 18 | 9 | 4 | 1 | 7 |
| Females | 2,784 | 114 | 104 | 111 | 110 | 92 | 102 | 75 | 80 | 86 | 85 | 79 | 74 | 59 | 57 | 62 | 265 | 50 | 220 | 236 | 206 | 186 | 155 | 60 | 44 | 31 | 19 | 10 | 7 | 2 | … | 3 |
| Total | 5,791 | 262 | 187 | 217 | 224 | 184 | 215 | 149 | 155 | 149 | 155 | 153 | 131 | 137 | 114 | 115 | 465 | 103 | 406 | 564 | 432 | 419 | 382 | 203 | 110 | 54 | 49 | 28 | 16 | 6 | 1 | 10 |
Table XV. Table XV. Showing the Ages of Persons, Males, and Females (exclusive of Maoris), in each Borough.continued.
| Boroughs. | All Ages. | Under 5. | 5 and Under 10. | 10 and under 15. | 15 and under 21. | 21 and under. 40. | 40 and Under 60. | 60 and under 80. | 80 and upwards. | Unspecified. | ||||||||||||||||||||||
|---|---|---|---|---|---|---|---|---|---|---|---|---|---|---|---|---|---|---|---|---|---|---|---|---|---|---|---|---|---|---|---|---|
| Under 1 Year. | 1–2. | 2–3. | 3–4. | 4–5. | 5–6. | 6–7. | 7–8. | 8–9. | 9–10. | 10–11. | 11–12. | 12–13. | 13–14. | 14–15. | 15–20. | 20–21 | 21–25. | 25–30. | 30–35. | 35–40. | 40–45. | 45–50. | 50–55. | 55–60. | 60–65. | 65–70. | 70–75 | 75–80. | ||||
| Hampden,— | ||||||||||||||||||||||||||||||||
| Males | 180 | 10 | 4 | 10 | 7 | 11 | 11 | 3 | 4 | 4 | 1 | 4 | 7 | 2 | 4 | 5 | 12 | 9 | 13 | 11 | 8 | 17 | 4 | 6 | 5 | 3 | 3 | 2 | … | … | … | |
| Females | 147 | 10 | 5 | 5 | 8 | 2 | 4 | 5 | 3 | 7 | 5 | 5 | 3 | 5 | 3 | 2 | 11 | 2 | 9 | 15 | 13 | 8 | 3 | 6 | 4 | 2 | … | 1 | 1 | … | … | … |
| Total | 327 | 20 | 9 | 15 | 15 | 13 | 15 | 8 | 7 | 11 | 6 | 9 | 10 | 7 | 7 | 7 | 23 | 2 | 18 | 28 | 24 | 16 | 20 | 10 | 10 | 7 | 3 | 4 | 3 | … | … | … |
| Palmerston,— | ||||||||||||||||||||||||||||||||
| Males | 518 | 21 | 18 | 15 | 10 | 16 | 20 | 15 | 17 | 15 | 15 | 11 | 9 | 18 | 10 | 7 | 34 | 4 | 37 | 51 | 36 | 39 | 43 | 22 | 15 | 9 | 4 | … | 1 | 1 | 2 | 3 |
| Females | 450 | 13 | 18 | 17 | 24 | 10 | 14 | 8 | 11 | 10 | 8 | 12 | 14 | 20 | 9 | 20 | 47 | 9 | 36 | 46 | 26 | 19 | 19 | 19 | 6 | 6 | 6 | … | 3 | … | … | … |
| Total | 968 | 34 | 36 | 32 | 34 | 26 | 34 | 23 | 28 | 25 | 23 | 23 | 23 | 38 | 19 | 27 | 81 | 13 | 73 | 97 | 62 | 58 | 62 | 41 | 21 | 15 | 10 | … | 4 | 1 | 2 | 3 |
| Hawkesbury,— | ||||||||||||||||||||||||||||||||
| Males | 206 | 4 | 8 | 10 | 1 | 7 | 5 | 7 | 6 | 10 | 3 | 11 | 6 | 6 | 7 | 11 | 17 | 1 | 10 | 8 | 8 | 16 | 15 | 7 | 9 | 6 | 3 | 1 | 1 | … | … | … |
| Females | 209 | 6 | 7 | 6 | 7 | 11 | 8 | 8 | 10 | 6 | 3 | 8 | 6 | 6 | 5 | 6 | 16 | 5 | 10 | 10 | 10 | 11 | 18 | 11 | 5 | 3 | 3 | 1 | 1 | 1 | 1 | … |
| Total | 415 | 10 | 15 | 16 | 8 | 18 | 13 | 15 | 16 | 16 | 6 | 19 | 12 | 14 | 12 | 17 | 33 | 6 | 20 | 18 | 18 | 27 | 33 | 18 | 14 | 9 | 6 | 2 | 2 | 1 | 1 | … |
| Port Chalmers,— | ||||||||||||||||||||||||||||||||
| Males | 1,156 | 50 | 32 | 39 | 33 | 37 | 35 | 32 | 33 | 26 | 23 | 38 | 22 | 21 | 15 | 21 | 91 | 15 | 74 | 120 | 87 | 79 | 77 | 61 | 53 | 11 | 16 | 6 | 4 | 1 | 1 | 3 |
| Females | 1,025 | 44 | 25 | 33 | 42 | 42 | 43 | 20 | 35 | 29 | 30 | 26 | 23 | 35 | 27 | 27 | 105 | 22 | 68 | 72 | 72 | 66 | 42 | 36 | 18 | 21 | 9 | 5 | 5 | 1 | 1 | 1 |
| Total | 2,181 | 94 | 57 | 72 | 75 | 79 | 78 | 52 | 68 | 55 | 53 | 64 | 45 | 56 | 42 | 48 | 196 | 37 | 142 | 192 | 159 | 145 | 119 | 97 | 71 | 32 | 25 | 11 | 9 | 2 | 2 | 4 |
| Dunedin,— | ||||||||||||||||||||||||||||||||
| Males | 12,246 | 376 | 339 | 336 | 357 | 344 | 335 | 307 | 307 | 261 | 283 | 280 | 277 | 272 | 266 | 275 | 1,155 | 235 | 927 | 1,074 | 883 | 883 | 828 | 701 | 488 | 233 | 168 | 59 | 46 | 15 | 13 | 30 |
| Females | 12,126 | 367 | 293 | 362 | 323 | 347 | 333 | 310 | 293 | 317 | 322 | 298 | 297 | 306 | 280 | 323 | 1,475 | 297 | 1,026 | 970 | 752 | 771 | 692 | 494 | 336 | 193 | 164 | 70 | 44 | 30 | 15 | 26 |
| Total | 24,372 | 743 | 632 | 698 | 680 | 691 | 668 | 617 | 579 | 578 | 605 | 578 | 574 | 578 | 546 | 598 | 2,630 | 532 | 1,953 | 2,044 | 1,635 | 1,568 | 1,520 | 1,195 | 824 | 426 | 332 | 129 | 90 | 45 | 28 | 56 |
| Roslyn,— | ||||||||||||||||||||||||||||||||
| Males | 1,428 | 45 | 49 | 53 | 51 | 39 | 42 | 40 | 42 | 44 | 39 | 47 | 43 | 52 | 37 | 50 | 150 | 22 | 75 | 89 | 78 | 74 | 91 | 81 | 39 | 23 | 18 | 4 | 5 | 4 | 2 | … |
| Females | 1,447 | 54 | 47 | 40 | 56 | 45 | 46 | 39 | 46 | 33 | 53 | 37 | 34 | 49 | 38 | 40 | 112 | 39 | 96 | 104 | 77 | 90 | 88 | 60 | 27 | 14 | 16 | 7 | 4 | 2 | 3 | 1 |
| Total | 2,875 | 99 | 96 | 93 | 107 | 84 | 88 | 79 | 88 | 77 | 92 | 84 | 77 | 101 | 75 | 90 | 262 | 61 | 171 | 193 | 155 | 164 | 179 | 141 | 66 | 37 | 34 | 11 | 9 | 6 | 5 | 1 |
| Caversham,— | ||||||||||||||||||||||||||||||||
| Males | 2,061 | 83 | 57 | 71 | 91 | 74 | 83 | 69 | 81 | 71 | 66 | 75 | 75 | 66 | 64 | 55 | 164 | 26 | 111 | 111 | 118 | 111 | 92 | 85 | 66 | 42 | 21 | 16 | 17 | 7 | 2 | 12 |
| Females | 1,928 | 69 | 75 | 64 | 74 | 65 | 75 | 58 | 62 | 62 | 62 | 68 | 57 | 56 | 60 | 48 | 164 | 26 | 127 | 129 | 123 | 124 | 101 | 64 | 44 | 27 | 12 | 12 | 8 | 2 | 2 | 8 |
| Total | 3,989 | 152 | 132 | 135 | 165 | 139 | 158 | 127 | 143 | 133 | 128 | 143 | 111 | 122 | 124 | 103 | 328 | 52 | 238 | 240 | 241 | 235 | 193 | 149 | 110 | 69 | 33 | 28 | 25 | 9 | 4 | 20 |
Table XV. Table XV. Showing the Ages of Persons, Males, and Females (exclusive of Maoris), in each Borough.continued.
| Boroughs. | All Ages. | Under 5. | 5 and Under 10. | 10 and under 15. | 15 and under 21. | 21 and under. 40. | 40 and Under 60. | 60 and under 80. | 80 and upwards. | Unspecified. | ||||||||||||||||||||||
|---|---|---|---|---|---|---|---|---|---|---|---|---|---|---|---|---|---|---|---|---|---|---|---|---|---|---|---|---|---|---|---|---|
| Under 1 Year. | 1–2. | 2–3. | 3–4. | 4–5. | 5–6. | 6–7. | 7–8. | 8–9. | 9–10. | 10–11. | 11–12. | 12–13. | 13–14. | 14–15. | 15–20. | 20–21 | 21–25. | 25–30. | 30–35. | 35–40. | 40–45. | 45–50. | 50–55. | 55–60. | 60–65. | 65–70. | 70–75 | 75–80. | ||||
| Mornington,— | ||||||||||||||||||||||||||||||||
| Males | 1,369 | 60 | 46 | 58 | 55 | 40 | 63 | 38 | 38 | 41 | 30 | 43 | 49 | 45 | 36 | 33 | 138 | 19 | 70 | 87 | 80 | 92 | 87 | 70 | 36 | 22 | 9 | 4 | 1 | 2 | … | 4 |
| Females | 1,490 | 67 | 51 | 51 | 65 | 48 | 55 | 46 | 39 | 45 | 46 | 52 | 38 | 41 | 43 | 50 | 150 | 24 | 80 | 87 | 97 | 107 | 89 | 49 | 28 | 11 | 17 | 3 | 4 | 5 | … | 2 |
| Total | 2,886 | 127 | 97 | 109 | 120 | 88 | 118 | 84 | 77 | 86 | 76 | 95 | 87 | 86 | 79 | 83 | 288 | 43 | 150 | 174 | 177 | 199 | 176 | 119 | 64 | 33 | 26 | 7 | 5 | 7 | … | 6 |
| Maori Hill,— | ||||||||||||||||||||||||||||||||
| Males | 605 | 20 | 25 | 20 | 25 | 23 | 17 | 18 | 16 | 11 | 17 | 17 | 7 | 16 | 16 | 18 | 58 | 8 | 31 | 43 | 46 | 35 | 31 | 31 | 24 | 8 | 9 | 5 | 1 | 1 | … | 8 |
| Females | 531 | 22 | 19 | 19 | 18 | 20 | 16 | 10 | 18 | 18 | 14 | 13 | 12 | 15 | 12 | 14 | 46 | 8 | 30 | 42 | 32 | 37 | 34 | 18 | 22 | 5 | 5 | 3 | 4 | 1 | 1 | 3 |
| Total | 1,136 | 42 | 44 | 39 | 43 | 43 | 33 | 28 | 34 | 29 | 31 | 30 | 19 | 31 | 28 | 32 | 104 | 16 | 61 | 85 | 78 | 72 | 65 | 49 | 46 | 3 | 14 | 8 | 5 | 2 | 1 | 11 |
| St. Kilda,— | ||||||||||||||||||||||||||||||||
| Males | 383 | 17 | 12 | 14 | 22 | 16 | 11 | 14 | 11 | 12 | 7 | 8 | 9 | 6 | 8 | 9 | 29 | 7 | 19 | 28 | 22 | 28 | 18 | 17 | 13 | 5 | 4 | 3 | 1 | … | … | 3 |
| Females | 390 | 17 | 17 | 22 | 12 | 19 | 17 | 10 | 11 | 11 | 12 | 10 | 5 | 11 | 8 | 6 | 39 | 9 | 21 | 31 | 29 | 17 | 20 | 15 | 9 | 5 | … | 3 | … | 2 | … | 2 |
| Total | 773 | 34 | 29 | 36 | 34 | 35 | 28 | 24 | 22 | 23 | 19 | 18 | 14 | 17 | 16 | 15 | 68 | 16 | 40 | 59 | 61 | 45 | 38 | 32 | 22 | 10 | 4 | 6 | 1 | 2 | … | 5 |
| South Dunedin,— | ||||||||||||||||||||||||||||||||
| Males | 1,431 | 62 | 62 | 61 | 70 | 49 | 61 | 27 | 41 | 38 | 39 | 35 | 36 | 27 | 31 | 32 | 108 | 19 | 66 | 125 | 113 | 102 | 80 | 55 | 48 | 25 | 14 | 3 | 1 | … | … | 1 |
| Females | 1,365 | 68 | 58 | 51 | 51 | 60 | 53 | 46 | 44 | 44 | 28 | 48 | 35 | 31 | 27 | 30 | 106 | 21 | 77 | 122 | 124 | 80 | 56 | 41 | 34 | 12 | 12 | 3 | 2 | 1 | … | … |
| Total | 2,796 | 130 | 120 | 112 | 121 | 109 | 114 | 73 | 85 | 82 | 67 | 831 | 71 | 58 | 58 | 62 | 214 | 40 | 143 | 247 | 237 | 182 | 136 | 96 | 82 | 37 | 26 | 6 | 3 | 1 | … | 1 |
| North-East Valley— | ||||||||||||||||||||||||||||||||
| Males | 1,410 | 70 | 62 | 61 | 66 | 51 | 58 | 33 | 49 | 41 | 35 | 39 | 39 | 32 | 28 | 32 | 106 | 16 | 65 | 89 | 110 | 94 | 78 | 60 | 32 | 19 | 26 | 6 | 4 | 4 | 2 | 3 |
| Females | 1,344 | 52 | 46 | 67 | 59 | 48 | 54 | 43 | 41 | 34 | 43 | 37 | 36 | 39 | 40 | 24 | 125 | 20 | 72 | 112 | 91 | 91 | 56 | 35 | 32 | 18 | 7 | 7 | 8 | 2 | 1 | 4 |
| Total | 2,754 | 122 | 108 | 128 | 125 | 99 | 112 | 76 | 90 | 75 | 78 | 76 | 75 | 71 | 68 | 56 | 231 | 36 | 137 | 201 | 201 | 185 | 134 | 95 | 64 | 37 | 33 | 13 | 12 | 6 | 3 | 7 |
| West Harbour,— | ||||||||||||||||||||||||||||||||
| Males | 635 | 31 | 30 | 28 | 25 | 23 | 24 | 17 | 25 | 20 | 16 | 18 | 20 | 21 | 2 | 22 | 35 | 5 | 21 | 37 | 45 | 57 | 48 | 26 | 17 | 13 | 6 | … | 3 | … | … | … |
| Females | 578 | 18 | 18 | 28 | 21 | 24 | 24 | 21 | 19 | 27 | 9 | 21 | 14 | 18 | 16 | 14 | 39 | 7 | 30 | 35 | 46 | 50 | 23 | 22 | 15 | 10 | 6 | 3 | … | … | … | … |
| Total | 1,213 | 49 | 48 | 56 | 46 | 47 | 48 | 38 | 44 | 47 | 25 | 39 | 34 | 39 | 18 | 36 | 74 | 12 | 51 | 72 | 91 | 107 | 71 | 48 | 32 | 23 | 12 | 3 | 3 | … | … | … |
| Green Island,— | ||||||||||||||||||||||||||||||||
| Males | 230 | 14 | 6 | 6 | 11 | 8 | 10 | 6 | 9 | 6 | 4 | 3 | 7 | 5 | 5 | 5 | 20 | 3 | 13 | 19 | 15 | 21 | 12 | 11 | 3 | 1 | 2 | 1 | 1 | … | 2 | 1 |
| Females | 232 | 5 | 13 | 8 | 17 | 8 | 8 | 13 | 8 | 4 | 7 | 9 | 8 | 5 | 5 | 4 | 11 | 4 | 15 | 18 | 14 | 19 | 9 | 7 | 4 | 4 | 2 | 2 | … | 1 | … | … |
| Total | 462 | 19 | 19 | 14 | 28 | 16 | 18 | 19 | 17 | 10 | 11 | 12 | 15 | 10 | 10 | 9 | 31 | 7 | 28 | 37 | 29 | 40 | 21 | 18 | 7 | 5 | 4 | 3 | 1 | 1 | 2 | 1 |
| Milton,— | ||||||||||||||||||||||||||||||||
| Males | 647 | 30 | 24 | 16 | 30 | 27 | 22 | 19 | 21 | 19 | 20 | 15 | 16 | 14 | 18 | 12 | 60 | 6 | 31 | 29 | 34 | 47 | 44 | 43 | 19 | 13 | 7 | 3 | 5 | 1 | 2 | … |
| Females | 640 | 18 | 24 | 30 | 30 | 22 | 24 | 19 | 20 | 20 | 13 | 29 | 25 | 18 | 22 | 12 | 62 | 9 | 37 | 31 | 39 | 44 | 31 | 22 | 22 | 5 | 7 | 3 | 1 | … | 1 | … |
| Total | 1,287 | 48 | 48 | 46 | 60 | 49 | 46 | 38 | 41 | 39 | 33 | 44 | 41 | 32 | 40 | 24 | 122 | 15 | 68 | 60 | 73 | 91 | 75 | 65 | 41 | 18 | 14 | 6 | 6 | 1 | 3 | … |
| Balclutha,— | ||||||||||||||||||||||||||||||||
| Males | 439 | 21 | 15 | 12 | 13 | 15 | 14 | 15 | 9 | 15 | 10 | 9 | 12 | 6 | 9 | 6 | 35 | 9 | 27 | 42 | 34 | 31 | 26 | 21 | 16 | 6 | 4 | … | 2 | … | 1 | 4 |
| Females | 381 | 10 | 15 | 18 | 14 | 15 | 18 | 10 | 12 | 10 | 12 | 5 | 6 | 10 | 13 | 11 | 33 | 7 | 23 | 40 | 26 | 20 | 15 | 19 | 7 | 5 | 2 | 3 | 1 | … | … | 1 |
| Total | 820 | 31 | 30 | 30 | 27 | 30 | 32 | 25 | 21 | 25 | 22 | 14 | 18 | 16 | 22 | 17 | 68 | 16 | 50 | 82 | 60 | 51 | 41 | 40 | 23 | 11 | 6 | 3 | 3 | … | 1 | 5 |
Table XV. Table XV. Showing the Ages of Persons, Males, and Females (exclusive of Maoris), in each Borough.continued.
| Boroughs. | All Ages. | Under 5. | 5 and Under 10. | 10 and under 15. | 15 and under 21. | 21 and under. 40. | 40 and Under 60. | 60 and under 80. | 80 and upwards. | Unspecified. | ||||||||||||||||||||||
|---|---|---|---|---|---|---|---|---|---|---|---|---|---|---|---|---|---|---|---|---|---|---|---|---|---|---|---|---|---|---|---|---|
| Under 1 Year. | 1–2. | 2–3. | 3–4. | 4–5. | 5–6. | 6–7. | 7–8. | 8–9. | 9–10. | 10–11. | 11–12. | 12–13. | 13–14. | 14–15. | 15–20. | 20–21 | 21–25. | 25–30. | 30–35. | 35–40. | 40–45. | 45–50. | 50–55. | 55–60. | 60–65. | 65–70. | 70–75 | 75–80. | ||||
| Tapanui,— | ||||||||||||||||||||||||||||||||
| Males | 304 | 10 | 9 | 12 | 14 | 11 | 11 | 5 | 4 | 9 | 4 | 9 | 3 | 7 | 1 | 7 | 23 | 5 | 17 | 39 | 17 | 31 | 22 | 12 | 9 | 7 | 1 | 2 | … | … | … | 3 |
| Females | 288 | 16 | 11 | 13 | 9 | 10 | 8 | 9 | 10 | 7 | 11 | 7 | 5 | 15 | 6 | 10 | 24 | 3 | 27 | 18 | 17 | 15 | 15 | 10 | 2 | 3 | 1 | 1 | 2 | 2 | … | 1 |
| Total | 592 | 26 | 20 | 25 | 23 | 21 | 19 | 14 | 14 | 16 | 15 | 16 | 8 | 22 | 7 | 17 | 47 | 8 | 44 | 57 | 34 | 46 | 37 | 22 | 11 | 10 | 2 | 3 | 2 | 2 | … | 4 |
| Lawrence,— | ||||||||||||||||||||||||||||||||
| Males | 510 | 17 | 16 | 13 | 20 | 15 | 18 | 13 | 16 | 13 | 16 | 14 | 9 | 13 | 12 | 9 | 36 | 11 | 27 | 41 | 32 | 24 | 25 | 50 | 23 | 13 | 8 | 2 | 1 | … | … | 3 |
| Females | 499 | 18 | 24 | 17 | 15 | 21 | 14 | 12 | 18 | 10 | 15 | 9 | 11 | 14 | 16 | 12 | 57 | 12 | 30 | 46 | 28 | 27 | 24 | 23 | 11 | 7 | 5 | 2 | 1 | … | … | … |
| Total | 1,009 | 35 | 40 | 30 | 35 | 36 | 32 | 25 | 34 | 23 | 31 | 23 | 20 | 27 | 28 | 21 | 93 | 23 | 57 | 87 | 60 | 51 | 49 | 73 | 34 | 20 | 13 | 4 | 2 | … | … | 3 |
| Roxburgh,— | ||||||||||||||||||||||||||||||||
| Males | 166 | 2 | 4 | 2 | 7 | 2 | 3 | 5 | 4 | … | 3 | 4 | 6 | 1 | 4 | 1 | 12 | … | 8 | 12 | 18 | 18 | 22 | 13 | 3 | 4 | 3 | … | 3 | 1 | … | 1 |
| Females | 111 | 5 | 6 | 3 | 1 | 4 | 4 | 1 | 4 | 4 | 6 | 1 | 1 | 1 | 2 | 2 | 12 | 2 | 10 | 12 | 8 | 8 | 4 | 1 | 3 | 3 | 1 | … | … | 1 | … | 1 |
| Total | 277 | 7 | 10 | 5 | 8 | 6 | 7 | 6 | 8 | 4 | 9 | 5 | 7 | 2 | 6 | 3 | 24 | 2 | 18 | 24 | 26 | 26 | 26 | 14 | 6 | 7 | 4 | … | 3 | 2 | … | 2 |
| Naseby,— | ||||||||||||||||||||||||||||||||
| Males | 322 | 16 | 7 | 11 | 14 | 11 | 10 | 16 | 12 | 9 | 7 | 10 | 8 | 6 | 7 | 7 | 17 | 3 | 7 | 22 | 7 | 34 | 24 | 23 | 21 | 5 | 7 | … | … | … | 1 | … |
| Females | 238 | 10 | 9 | 11 | 8 | 7 | 10 | 3 | 7 | 8 | 10 | 3 | 6 | 6 | 9 | 4 | 27 | 4 | 9 | 15 | 13 | 21 | 14 | 16 | 3 | 1 | 2 | … | … | … | … | 1 |
| Total | 560 | 26 | 16 | 22 | 22 | 18 | 20 | 19 | 19 | 17 | 17 | 13 | 14 | 12 | 16 | 11 | 44 | 8 | 16 | 37 | 20 | 55 | 38 | 39 | 24 | 6 | 9 | 1 | … | … | … | 1 |
| Alexandra,— | ||||||||||||||||||||||||||||||||
| Males | 164 | 5 | 2 | 4 | 5 | 7 | 3 | 2 | 3 | 4 | 1 | 7 | 5 | 6 | 5 | 4 | 6 | 2 | 8 | 16 | 8 | 15 | 17 | 13 | 10 | 1 | 1 | 3 | 1 | … | … | … |
| Females | 111 | 7 | 4 | 5 | 3 | 4 | 6 | 3 | 4 | 4 | 5 | 1 | 3 | 3 | 1 | 1 | 14 | 2 | 5 | 5 | 10 | 5 | 4 | 3 | 5 | 1 | 1 | 1 | … | … | 1 | … |
| Total | 275 | 12 | 6 | 9 | 8 | 11 | 9 | 5 | 7 | 8 | 6 | 8 | 8 | 9 | 6 | 5 | 20 | 4 | 13 | 21 | 18 | 20 | 21 | 16 | 15 | 2 | 2 | 4 | 1 | … | 1 | … |
| Cromwell,— | ||||||||||||||||||||||||||||||||
| Males | 228 | 7 | 6 | 2 | 7 | 3 | 5 | 6 | 5 | 6 | 8 | 5 | 5 | 3 | 2 | 1 | 12 | 3 | 14 | 14 | 12 | 25 | 33 | 12 | 13 | 7 | 7 | 2 | 1 | 1 | … | … |
| Females | 201 | 5 | 9 | 5 | 9 | 8 | 4 | 10 | 8 | 4 | 5 | 6 | 12 | 2 | 8 | 4 | 27 | 2 | 11 | 7 | 11 | 14 | 9 | 11 | 3 | 2 | 4 | … | 1 | … | … | … |
| Total | 429 | 12 | 15 | 7 | 16 | 11 | 9 | 16 | 13 | 10 | 13 | 12 | 17 | 5 | 10 | 5 | 39 | 5 | 25 | 21 | 23 | 39 | 42 | 23 | 16 | 9 | 11 | 2 | 2 | 1 | … | … |
| Arrowtown,— | ||||||||||||||||||||||||||||||||
| Males | 238 | 13 | 6 | 7 | 8 | 6 | 6 | 10 | 7 | 9 | 9 | 4 | 4 | 3 | 5 | 4 | 10 | 2 | 13 | 13 | 24 | 19 | 28 | 11 | 13 | 2 | 2 | … | … | … | … | … |
| Females | 180 | 5 | 8 | 9 | 6 | 9 | 6 | 9 | 5 | 6 | 5 | 5 | 8 | 5 | 3 | 7 | 14 | 4 | 13 | 12 | 12 | 10 | 9 | 4 | 3 | … | … | 2 | 1 | … | … | … |
| Total | 418 | 18 | 14 | 16 | 14 | 15 | 12 | 19 | 12 | 15 | 14 | 9 | 12 | 8 | 8 | 11 | 24 | 6 | 26 | 25 | 36 | 29 | 37 | 15 | 16 | 2 | 2 | … | 2 | 1 | … | … |
Table XV. Table XV. Showing the Ages of Persons, Males, and Females (exclusive of Maoris), in each Borough.continued.
| Boroughs. | All Ages. | Under 5. | 5 and Under 10. | 10 and under 15. | 15 and under 21. | 21 and under. 40. | 40 and Under 60. | 60 and under 80. | 80 and upwards. | Unspecified. | ||||||||||||||||||||||
|---|---|---|---|---|---|---|---|---|---|---|---|---|---|---|---|---|---|---|---|---|---|---|---|---|---|---|---|---|---|---|---|---|
| Under 1 Year. | 1–2. | 2–3. | 3–4. | 4–5. | 5–6. | 6–7. | 7–8. | 8–9. | 9–10. | 10–11. | 11–12. | 12–13. | 13–14. | 14–15. | 15–20. | 20–21 | 21–25. | 25–30. | 30–35. | 35–40. | 40–45. | 45–50. | 50–55. | 55–60. | 60–65. | 65–70. | 70–75 | 75–80. | ||||
| NOTE.—For totals of Boroughs, see Table IX. | ||||||||||||||||||||||||||||||||
| Queenstown,— | ||||||||||||||||||||||||||||||||
| Males | 440 | 3 | 10 | 9 | 11 | 6 | 15 | 11 | 8 | 8 | 8 | 9 | 13 | 13 | 7 | 11 | 22 | 7 | 32 | 36 | 54 | 37 | 36 | 27 | 24 | 9 | 4 | 3 | 1 | 1 | 1 | 1 |
| Females | 295 | 10 | 10 | 12 | 7 | 14 | 10 | 4 | 9 | 1 | 7 | 9 | 6 | 9 | 10 | 10 | 20 | 7 | 27 | 25 | 17 | 17 | 20 | 12 | 13 | 2 | 2 | … | 2 | 2 | … | 1 |
| Total | 735 | 13 | 20 | 21 | 18 | 20 | 28 | 15 | 17 | 9 | 15 | 18 | 19 | 22 | 17 | 21 | 42 | 14 | 59 | 61 | 71 | 54 | 56 | 39 | 37 | 11 | 6 | 3 | 3 | 3 | 1 | 2 |
| Invercargill,— | ||||||||||||||||||||||||||||||||
| Males | 2,373 | 97 | 76 | 81 | 78 | 76 | 79 | 52 | 53 | 55 | 54 | 49 | 50 | 59 | 48 | 53 | 205 | 22 | 177 | 233 | 174 | 135 | 165 | 124 | 94 | 34 | 22 | 11 | 8 | 2 | 3 | 4 |
| Females | 2,223 | 66 | 58 | 76 | 77 | 70 | 57 | 70 | 61 | 55 | 54 | 70 | 45 | 47 | 57 | 61 | 290 | 58 | 176 | 195 | 130 | 125 | 120 | 97 | 35 | 26 | 22 | 12 | 8 | 1 | 2 | 1 |
| Total | 4,596 | 163 | 134 | 157 | 155 | 146 | 137 | 122 | 114 | 110 | 108 | 119 | 95 | 106 | 105 | 114 | 495 | 80 | 353 | 428 | 304 | 260 | 285 | 221 | 129 | 60 | 44 | 23 | 16 | 3 | 5 | 5 |
| Invercargill South,— | ||||||||||||||||||||||||||||||||
| Males | 475 | 22 | 17 | 19 | 21 | 16 | 17 | 14 | 16 | 16 | 14 | 8 | 8 | 12 | 15 | 12 | 41 | 7 | 17 | 40 | 37 | 23 | 41 | 17 | 11 | 3 | 7 | 2 | 1 | 1 | … | … |
| Females | 448 | 18 | 27 | 18 | 19 | 17 | 20 | 16 | 11 | 12 | 19 | 19 | 17 | 8 | 7 | 10 | 30 | 7 | 22 | 32 | 35 | 26 | 31 | 9 | 10 | 5 | 2 | 1 | … | … | … | … |
| Total | 923 | 40 | 44 | 37 | 40 | 33 | 37 | 30 | 27 | 28 | 33 | 27 | 25 | 20 | 22 | 22 | 71 | 14 | 39 | 72 | 72 | 49 | 72 | 26 | 21 | 8 | 9 | 3 | 1 | 1 | … | … |
| Invercargill East,— | ||||||||||||||||||||||||||||||||
| Males | 411 | 18 | 11 | 12 | 10 | 14 | 19 | 12 | 7 | 9 | 14 | 10 | 12 | 8 | 12 | 10 | 52 | 9 | 24 | 26 | 20 | 12 | 27 | 26 | 15 | 4 | 6 | 4 | 6 | 2 | … | … |
| Females | 374 | 18 | 4 | 11 | 15 | 8 | 11 | 7 | 12 | 12 | 13 | 12 | 9 | 16 | 8 | 11 | 40 | 12 | 23 | 17 | 24 | 19 | 20 | 20 | 14 | 6 | 10 | 1 | 1 | … | … | … |
| Total | 785 | 36 | 15 | 23 | 25 | 22 | 30 | 19 | 19 | 21 | 27 | 22 | 21 | 24 | 20 | 21 | 92 | 21 | 47 | 43 | 44 | 31 | 47 | 46 | 28 | 10 | 16 | 5 | 7 | 2 | … | … |
| Invercargill North,— | ||||||||||||||||||||||||||||||||
| Males | 338 | 16 | 20 | 9 | 4 | 16 | 15 | 11 | 8 | 7 | 15 | 10 | 6 | 7 | 11 | 7 | 27 | 7 | 13 | 29 | 22 | 17 | 20 | 21 | 7 | 5 | 4 | 1 | … | 1 | 1 | 1 |
| Females | 332 | 16 | 16 | 18 | 26 | 7 | 10 | 7 | 12 | 10 | 5 | 11 | 20 | 9 | 6 | 3 | 21 | 4 | 16 | 24 | 24 | 19 | 22 | 13 | 7 | 2 | 1 | 2 | 1 | … | … | … |
| Total | 670 | 32 | 36 | 27 | 30 | 23 | 25 | 18 | 20 | 17 | 20 | 21 | 26 | 16 | 17 | 10 | 48 | 11 | 29 | 53 | 46 | 36 | 42 | 34 | 14 | 7 | 5 | 3 | 1 | 1 | 1 | 1 |
| Campbelltown,— | ||||||||||||||||||||||||||||||||
| Males | 177 | 3 | 6 | 6 | 10 | 7 | 9 | 3 | 7 | 1 | 6 | 6 | 6 | 2 | 3 | 3 | 14 | 3 | 7 | 12 | 12 | 11 | 12 | 8 | 8 | 8 | 2 | 1 | … | … | 1 | … |
| Females | 174 | 7 | 6 | 9 | 8 | 5 | 4 | 6 | 2 | 8 | 2 | 9 | 2 | 3 | 6 | 3 | 24 | 2 | 20 | 10 | 4 | 12 | 8 | 6 | 3 | 3 | … | … | … | 1 | 1 | … |
| Total | 351 | 10 | 12 | 15 | 18 | 12 | 13 | 9 | 9 | 9 | 8 | 15 | 8 | 5 | 9 | 6 | 38 | 5 | 27 | 22 | 16 | 23 | 20 | 14 | 11 | 11 | 2 | 1 | … | 1 | 2 | … |
| Avenal,— | ||||||||||||||||||||||||||||||||
| Males | 182 | 7 | 6 | 8 | 4 | 7 | 6 | 8 | 9 | 4 | 4 | 7 | 3 | 7 | 3 | 5 | 15 | 3 | 6 | 12 | 11 | 9 | 11 | 12 | 6 | 6 | 1 | 1 | 1 | … | … | … |
| Females | 190 | 5 | 6 | 6 | 10 | 5 | 4 | 4 | 5 | 4 | 9 | 7 | 6 | 7 | 5 | 7 | 18 | 4 | 11 | 13 | 12 | 14 | 10 | 6 | 5 | 3 | 2 | 1 | … | 1 | … | … |
| Total | 372 | 12 | 12 | 14 | 14 | 12 | 10 | 12 | 14 | 8 | 13 | 14 | 9 | 14 | 8 | 12 | 33 | 7 | 17 | 25 | 23 | 23 | 21 | 18 | 11 | 9 | 3 | 2 | 1 | 1 | … | … |
| Gladstone,— | ||||||||||||||||||||||||||||||||
| Males | 130 | 9 | 4 | 5 | 3 | 3 | 5 | 3 | 4 | 2 | 2 | 2 | 6 | 1 | 4 | 4 | 15 | 4 | 5 | 6 | 5 | 10 | 6 | 10 | 6 | 3 | 3 | … | … | … | … | … |
| Females | 138 | 3 | 4 | 6 | 7 | 2 | 5 | 2 | 3 | 6 | 3 | 7 | 4 | 3 | 4 | 5 | 19 | 5 | 4 | 13 | 4 | 8 | 7 | 6 | 3 | 2 | 2 | … | 1 | … | … | … |
| Total | 268 | 12 | 8 | 11 | 10 | 5 | 10 | 5 | 7 | 8 | 5 | 9 | 10 | 4 | 8 | 9 | 34 | 9 | 9 | 19 | 9 | 18 | 13 | 16 | 9 | 5 | 5 | … | 1 | … | … | … |
| Winton,— | ||||||||||||||||||||||||||||||||
| Males | 134 | 8 | 7 | 7 | 4 | 4 | 2 | 4 | 3 | 3 | 4 | 3 | 1 | 5 | 4 | 2 | 12 | 1 | 5 | 14 | 8 | 8 | 10 | 7 | 6 | 1 | 1 | … | … | … | … | … |
| Females | 96 | 3 | 4 | 4 | 4 | 7 | 5 | 1 | 2 | 3 | 3 | 2 | 3 | 1 | 1 | 4 | 10 | 1 | 5 | 7 | 9 | 8 | 4 | 3 | 2 | … | … | … | … | … | … | … |
| Total | 230 | 11 | 11 | 11 | 8 | 11 | 7 | 5 | 5 | 6 | 7 | 5 | 4 | 6 | 5 | 6 | 22 | 2 | 10 | 21 | 17 | 16 | 14 | 10 | 8 | 1 | 1 | … | … | … | … | … |
| Riverton,— | ||||||||||||||||||||||||||||||||
| Males | 679 | 34 | 23 | 21 | 19 | 23 | 16 | 19 | 18 | 18 | 11 | 21 | 11 | 9 | 14 | 5 | 37 | 10 | 49 | 56 | 60 | 78 | 62 | 30 | 15 | 5 | 8 | 3 | 4 | … | … | … |
| Females | 508 | 19 | 15 | 20 | 19 | 24 | 17 | 15 | 12 | 12 | 15 | 14 | 14 | 12 | 10 | 14 | 53 | 6 | 43 | 36 | 34 | 39 | 31 | 12 | 10 | 4 | 3 | 3 | 1 | 1 | … | … |
| Total | 1,187 | 53 | 38 | 41 | 38 | 47 | 33 | 34 | 30 | 30 | 26 | 35 | 25 | 21 | 24 | 19 | 90 | 16 | 92 | 92 | 94 | 117 | 93 | 42 | 25 | 9 | 11 | 6 | 5 | 1 | … | … |
Table of Contents
Table I. Table I. Showing (exclusive of Chinese and Maoris) the Proportions of the Married, Unmarried, and Widowed, in every 100 Persons, Males and Females of all Ages, living in New Zealand at the last Four Census Periods.
| Census Periods. | Persons. | Males. | Females. | ||||||
|---|---|---|---|---|---|---|---|---|---|
| Married. | Unmarried. | Widowed. | Married. | Unmarried. | Widowed. | Married. | Unmarried. | Widowed. | |
| February, 1871 | 30.69 | 66.91 | 2.40 | 26.86 | 71.22 | 1.92 | 36.06 | 60.89 | 3.05 |
| March, 1874 | 30.58 | 66.95 | 2.47 | 27.37 | 70.66 | 1.97 | 34.73 | 62.17 | 3.10 |
| March, 1878 | 30.87 | 66.72 | 2.41 | 28.06 | 70.09 | 1.85 | 34.32 | 62.59 | 3°9 |
| April, 1881 | 30.15 | 67.32 | 2.53 | 27.73 | 70.39 | 1.88 | 33.05 | 63.64 | 3.31 |
Table II. Table II. Showing (exclusive of Chinese and Maoris) the Number of Unmarried Persons, distinguishing Males under and over 20, and Females under and over 15 Years of Age; the Number of Husbands and Wives, Widowers and Widows, of all Ages, with the Proportions per Cent. of the Unmarried, Married, and Widowed in every 100 Persons living, according to the Census of the 3rd April, 1881.
| — | Total of all Conditions. | Unmarried. | Husbands and Wives of all Ages. | Widowers and Widows of all Ages. | Condition Not Stated. | Proportion to every 100 Persons. | ||||
|---|---|---|---|---|---|---|---|---|---|---|
| All Ages. | Males under 20, Females under 15. | Males over 20, Females over 15. | Unmarried. | Husbands and Wives. | Widowers and Widows. | |||||
| NOTE.—The totals of all specified conditions have been used as a basis in working calculations in this and the following table. The fact of the number of the unspecified as to condition being very insignificant, caused the proportions given by the above system to be more nearly absolutely correct than if the calculations had been based on the total number, including the unspecified. | ||||||||||
| Males | 264,610 | 185,941 | 125,818 | 60,123 | 73,261 | 4,964 | 444 | 70.39 | 27.73 | 1.88 |
| Females | 220,319 | 140,184 | 103,058 | 37,126 | 72,804 | 7,296 | 35 | 63.64 | 33.05 | 3.31 |
Table III. Table III. Showing (exclusive of Chinese and Maoris) the Numbers and the Proportions per Cent, of Unmarried, Married, and Widowed, Males and Females, for each Quinquennial Period of Age, as shown by the Census of the 3rd April, 1881.
| Ages. | Numbers. | Proportions to every 100 Living at each Age. | ||||||||||||||
|---|---|---|---|---|---|---|---|---|---|---|---|---|---|---|---|---|
| Males. | Females. | Males. | Females. | |||||||||||||
| Total. | Unmarried. | Husbands. | Widowers. | Not Stated. | Total. | Unmarried. | Wives. | Widows. | Not Stated. | Unmarried. | Husbands. | Widowers. | Unmarried. | Wives. | Widows. | |
| * Children of unspecified age (males 72, females 58) have been included in the numbers for under 15 years. | ||||||||||||||||
| All ages | 264,610 | 185,941 | 73,261 | 4,964 | 444 | 220,319 | 140,184 | 72,804 | 7,296 | 35 | 70.39 | 27.73 | 1.38 | 63.64 | 33.05 | 3.31 |
| 15 years and upwards | 159,734 | 81,067 | 73,261 | 4,964 | 442 | 117,255 | 37,126 | 72,798 | 7,296 | 35 | 50.89 | 45.99 | 3.12 | 31.67 | 62.10 | 6.23 |
| Under 15 years* | 104,876 | 104,874 | … | … | 2 | 103,064 | 103,058 | 6 | … | … | 100.00 | … | … | 99.99 | .01 | … |
| 15 years to 20 years | 20,977 | 20,944 | 27 | 1 | 5 | 21,547 | 20,307 | 1,233 | 7 | … | 99.82 | .13 | .05 | 94.25 | 5.72 | .03 |
| 20 years to 25 years | 21,558 | 19,156 | 2,330 | 28 | 44 | 19,285 | 10,170 | 8,996 | 114 | 5 | 89.04 | 10.83 | .13 | 52.75 | 46.66 | .59 |
| 25 years to 30 years | 22,865 | 13,558 | 9,094 | 154 | 59 | 16,669 | 3,230 | 13,133 | 301 | 5 | 59.45 | 39.88 | .67 | 19.38 | 78.81 | 1.81 |
| 30 years to 35 years | 19,015 | 7,530 | 11,176 | 266 | 43 | 14.393 | 1,251 | 12,656 | 484 | 2 | 39.69 | 58.91 | 1.40 | 8.69 | 87.95 | 3.36 |
| 35 years to 40 years | 19,458 | 6,090 | 12,917 | 412 | 39 | 13,244 | 751 | 11,811 | 677 | 5 | 31.36 | 66.52 | 2.12 | 5.67 | 89.22 | 5.11 |
| 40 years to 45 years | 19,403 | 5,416 | 13,347 | 604 | 36 | 11,001 | 498 | 9,629 | 869 | 5 | 27.96 | 68.92 | 3.12 | 4.53 | 87.57 | 7.90 |
| 45 years to 50 years | 13,698 | 3,551 | 9,426 | 701 | 20 | 7,369 | 273 | 6,274 | 821 | 1 | 25.96 | 68.91 | 5.13 | 3.71 | 85.15 | 11.14 |
| 50 years to 55 years | 9,402 | 2,258 | 6,413 | 717 | 14 | 5,010 | 219 | 3,938 | 853 | … | 24.05 | 68.31 | 7.64 | 4.37 | 78.60 | 17.03 |
| 55 years to 60 years | 4,812 | 972 | 3,348 | 479 | 13 | 2,965 | 136 | 2,146 | 682 | 1 | 20.25 | 69.77 | 9.98 | 4.59 | 72.40 | 23.01 |
| 60 years to 65 years | 3,782 | 680 | 2,560 | 539 | 3 | 2,530 | 107 | 1,527 | 889 | 7 | 18.00 | 67.74 | 14.26 | 4.24 | 60.52 | 35.24 |
| 65 years to 70 years | 1,872 | 265 | 1,263 | 341 | 3 | 1,353 | 50 | 729 | 574 | … | 14.18 | 67.58 | 18.24 | 3.70 | 53.88 | 42.42 |
| 70 years to 75 years | 1,175 | 149 | 688 | 334 | 4 | 912 | 28 | 360 | 523 | 1 | 12.73 | 58.75 | 28.52 | 3.07 | 39.52 | 57.41 |
| 75 years to 80 years | 581 | 54 | 332 | 194 | 1 | 411 | 16 | 128 | 267 | … | 931 | 57.24 | 33.45 | 3.89 | 31.15 | 64.96 |
| 80 years to and upwards | 322 | 34 | 126 | 161 | 1 | 262 | 11 | 48 | 203 | … | 10.59 | 39.25 | 50.16 | 4.20 | 18.32 | 77.48 |
| Unspecified adults | 814 | 410 | 214 | 33 | 157 | 304 | 79 | 190 | 32 | 3 | 62.41 | 32.57 | 5.02 | 26.25 | 63.12 | 10.63 |
Table IV. Table IV. Showing (exclusive of Chinese and Maoris) the Number of Bachelors of 20 Years old and upwards, and the Number of Spinsters of 15 Years old and upwards; the Excess of the former over the latter; the Number of Bachelors to every 100 Spinsters; also showing the Number of Husbands and Wives, the Excess of the former over the latter, or the contrary; and the Number of Husbands to every 100 Wives, in each Provincial District and the entire Colony, at the Census of the 3rd April, 1881.
| Provincial Districts. | Bachelors and Spinsters. | Husbands and Wives. | |||||||
|---|---|---|---|---|---|---|---|---|---|
| Number of Bachelors aged 20 Years and upwards. | Number of Spinsters aged 15 Years and upwards. | Excess of Bachelors over Spinsters. | Number of Bachelors to every 100 Spinsters. | Number of Husbands. | Number of Wives. | Excess of Husbands over Wives. | Excess of Wives over Husbands. | Number of Husbands to every 100 Wives. | |
| Total | 60,123 | 37,126 | 22,997 | 162 | 73,261 | 72,804 | 642 | 185 | 101 |
| Auckland | 11,952 | 8,146 | 3,806 | 147 | 15,232 | 14,974 | 258 | … | 102 |
| Taranaki | 2,218 | 879 | 1,339 | 252 | 2,332 | 2,193 | 139 | … | 106 |
| Wellington | 6,617 | 4,782 | 1,835 | 138 | 9,428 | 9,569 | … | 141 | 99 |
| Hawke's Bay | 2,424 | 1,132 | 1,292 | 214 | 2,681 | 2,654 | 27 | … | 101 |
| Marlborough | 1,299 | 541 | 758 | 240 | 1,372 | 1,336 | 36 | … | 103 |
| Nelson | 3,786 | 1,983 | 1,803 | 191 | 3,698 | 3,594 | 104 | … | 103 |
| Westland | 2,785 | 703 | 2,082 | 396 | 2,061 | 2,004 | 57 | … | 103 |
| Canterbury | 12,642 | 8,801 | 3,841 | 144 | 17,172 | 17,163 | 9 | … | 100 |
| Otago | 16,327 | 10,144 | 6,183 | 161 | 19,243 | 19,287 | … | 44 | 100 |
| Chatham Islands | 73 | 15 | 58 | 487 | 42 | 30 | 12 | … | 140 |
Table V. Table V. Showing at various Periods of Age the Number of Unmarried, Married, and Widowed, Males and Females, in the Population (inclusive and exclusive of Chinese), and in the Chinese living in New Zealand, at the Census of the 3rd April, 1881.
| MALES. | |||||||||||||||
|---|---|---|---|---|---|---|---|---|---|---|---|---|---|---|---|
| Ages. | Inclusive of Chinese. | Chinese. | Exclusive of Chinese. | ||||||||||||
| Total. | Unmarried. | Married. | Widowed. | Condition Unknown. | Total. | Unmarried | Married. | Widowed. | Condition Unknown. | Total. | Unmarried. | Married. | Widowed. | Condition Unknown. | |
| All ages | 269,605 | 190,864 | 73,331 | 4,965 | 445 | 4,995 | 4,923 | 70 | 1 | 1 | 264,610 | 185,941 | 73,261 | 4,964 | 444 |
| 14 years and upwards | 170,142 | 91,403 | 73,331 | 4,965 | 443 | 4,988 | 4,916 | 70 | 1 | 1 | 165,154 | 86,487 | 73,261 | 4,964 | 442 |
| Under 14 years | 99,463 | 99,461 | … | … | 2 | 7 | 7 | … | … | … | 99,456 | 99,454 | … | … | 2 |
| 14 years to 15 years | 5,425 | 5,425 | … | … | … | 5 | 5 | … | … | … | 5,420 | 5,420 | … | … | … |
| 15 years to 20 years | 21,060 | 21,027 | 27 | 1 | 5 | 83 | 83 | … | … | … | 20,977 | 20,944 | 27 | 1 | 5 |
| 20 years to 25 years | 22,078 | 19,672 | 2,334 | 28 | 44 | 520 | 516 | 4 | … | … | 21,558 | 19,156 | 2,330 | 28 | 44 |
| 25 years to 30 years | 23,916 | 14,604 | 9,098 | 154 | 60 | 1,051 | 1,046 | 4 | … | 1 | 22,865 | 13,558 | 9,094 | 154 | 59 |
| 30 years to 35 years | 20,202 | 8,703 | 11,190 | 266 | 43 | 1,1871 | 1,173 | 14 | … | … | 19,015 | 7,530 | 11,176 | 266 | 43 |
| 35 years to 40 years | 20,318 | 6,931 | 12,936 | 412 | 39 | 860 | 841 | 19 | … | … | 19,458 | 6,090 | 12,917 | 412 | 39 |
| 40 years to 45 years | 20,099 | 6,098 | 13,361 | 604 | 36 | 696 | 682 | 14 | … | … | 19,403 | 5,416 | 13.347 | 604 | 36 |
| 45 years to 50 years | 13,972 | 3,816 | 9,435 | 701 | 20 | 274 | 265 | 9 | … | … | 13,698 | 3,551 | 9,426 | 701 | 20 |
| 50 years to 55 years | 9,553 | 2,405 | 6,146 | 718 | 14 | 151 | 147 | 3 | 1 | … | 9,402 | 2,258 | 6,413 | 717 | 14 |
| 55 years to 60 years | 4,855 | 1,013 | 3,350 | 479 | 13 | 43 | 41 | 2 | … | … | 4,812 | 972 | 3,348 | 479 | 13 |
| 60 years to 65 years | 3,809 | 706 | 2,561 | 539 | 3 | 27 | 26 | 1 | … | … | 3,782 | 680 | 2,560 | 539 | 3 |
| 65 years to 70 years | 1,879 | 272 | 1,263 | 341 | 3 | 7 | 7 | … | … | … | 1,872 | 265 | 1,263 | 341 | 3 |
| 70 years to 75 years | 1,175 | 149 | 688 | 334 | 4 | … | … | … | … | … | 1,175 | 149 | 688 | 334 | 4 |
| 75 years to 80 years | 581 | 54 | 332 | 194 | 1 | … | … | … | … | … | 581 | 54 | 332 | 194 | 1 |
| 80 years and upwards | 322 | 34 | 126 | 161 | 1 | … | … | … | … | … | 322 | 34 | 126 | 161 | 1 |
| Unspecified | 898 | 494 | 214 | 33 | 157 | 84 | 84 | … | … | … | 814 | 410 | 214 | 33 | 157 |
| FEMALES. | |||||||||||||||
| All ages | 220,328 | 140,190 | 72,807 | 7,296 | 35 | 9 | 6 | 3 | … | … | 220,319 | 140,184 | 72,804 | 7,296 | 35 |
| 14 years and upwards | 122,569 | 42,431 | 72,807 | 7,296 | 35 | 5 | 2 | 3 | … | … | 122,564 | 42,429 | 72,804 | 7,296 | 35 |
| Under 14 years | 97,759 | 97,759 | … | … | … | 4 | 4 | … | … | … | 97,755 | 97,755 | … | … | … |
| 14 years to 15 years | 5,309 | 5,303 | 6 | … | … | … | … | … | … | … | 5,309 | 5,303 | 6 | … | … |
| 15 years to 20 years | 21,549 | 20,309 | 1,233 | 7 | … | 2 | 2 | … | … | … | 21,547 | 20,307 | 1,233 | 7 | … |
| 20 years to 25 years | 19,287 | 10,170 | 8,998 | 114 | 5 | 2 | … | 2 | … | … | 19,285 | 10,170 | 8,996 | 114 | 5 |
| 25 years to 30 years | 16,670 | 3,230 | 13,134 | 301 | 5 | 1 | … | 1 | … | … | 16,669 | 3,230 | 13,133 | 301 | 5 |
| 30 years to 35 years | 14,393 | 1,251 | 12,656 | 484 | 2 | … | … | … | … | … | 14,393 | 1,251 | 12,656 | 484 | 2 |
| 35 years to 40 years | 13,244 | 751 | 11,811 | 677 | 5 | … | … | … | … | … | 13,244 | 751 | 11,811 | 677 | 5 |
| 40 years to 45 years | 11,001 | 498 | 9,629 | 869 | 5 | … | … | … | … | … | 11,001 | 498 | 9,629 | 869 | 5 |
| 45 years to 50 years | 7,369 | 273 | 6,274 | 821 | 1 | … | … | … | … | … | 7,369 | 273 | 6,274 | 821 | 1 |
| 50 years to 55 years | 5,010 | 219 | 3,938 | 853 | … | … | … | … | … | … | 5,010 | 219 | 3,938 | 853 | … |
| 55 years to 60 years | 2,965 | 136 | 2,146 | 682 | 1 | … | … | … | … | … | 2,965 | 136 | 2,146 | 682 | 1 |
| 60 years to 65 years | 2,530 | 107 | 1,527 | 889 | 7 | … | … | … | … | … | 2,530 | 107 | 1,527 | 889 | 7 |
| 65 years to 70 years | 1,353 | 50 | 729 | 574 | … | … | … | … | … | … | 1,353 | 50 | 729 | 574 | … |
| 70 years to 75 years | 912 | 28 | 360 | 523 | 1 | … | … | … | … | … | 912 | 28 | 360 | 523 | 1 |
| 75 years to 80 years | 411 | 16 | 128 | 267 | … | … | … | … | … | … | 411 | 16 | 128 | 267 | … |
| 80 years and upwards | 262 | 11 | 48 | 203 | … | … | … | … | … | … | 262 | 11 | 48 | 203 | … |
| Unspecified | 304 | 79 | 190 | 32 | 3 | … | … | … | … | … | 304 | 79 | 190 | 32 | 3 |
Table VI. Table VI. Showing the Number of Males and Females Unmarried, Married, and Widowed, living in the Colony, in Boroughs and outside Boroughs, at each Quinquennial Period of Life.
| NUMBERS.—MALES. | ||||||||||||
|---|---|---|---|---|---|---|---|---|---|---|---|---|
| Ages. | The Colony.* | Boroughs.† | Outside. | |||||||||
| Unmarried. | Husbands. | Widowers. | Not Stated. | Unmarried. | Husbands. | Widowers. | Not Stated. | Unmarried. | Husbands. | Widowers. | Not Stated. | |
* The numbers for “The Colony” are the addition of the “Boroughs” and “Outside” populations. † Details of the population of the boroughs will be found in Table IX. | ||||||||||||
| All ages | 190,864 | 73,331 | 4,965 | 445 | 67,921 | 29,708 | 1,9 0 | 71 | 122,943 | 43,623 | 3,060 | 374 |
| 15 years and upwards | 85,978 | 73,331 | 4,965 | 443 | 26,192 | 29,708 | 1,905 | 71 | 59,786 | 43,623 | 3,060 | 372 |
| 20 years and upwards | 64,951 | 73,304 | 4,964 | 438 | 17,953 | 29,691 | 1,905 | 69 | 46,998 | 43,613 | 3,059 | 369 |
| Under 14 years | 99,461 | … | … | 2 | 39,547 | … | … | … | 59,914 | … | … | 2 |
| 14 years to 15 years | 5,425 | … | … | … | 2,182 | … | … | … | 3,243 | … | … | … |
| 15 years to 20 years | 21,027 | 27 | 1 | 5 | 8,239 | 17 | … | 17 | 12,788 | 10 | 1 | 3 |
| 20 years to 25 years | 19,672 | 2,334 | 28 | 44 | 6,560 | 1,037 | 12 | 7 | 13,112 | 1,297 | 16 | 37 |
| 25 years to 30 years | 14,604 | 9,098 | 154 | 60 | 4,273 | 3,994 | 60 | 7 | 10,331 | 5,104 | 94 | 53 |
| 30 years to 35 years | 8,703 | 11,190 | 266 | 43 | 2,248 | 4,659 | 98 | 4 | 6,455 | 6,531 | 168 | 39 |
| 35 years to 40 years | 6,931 | 12,936 | 412 | 39 | 5,579 | 5,105 | 158 | 10 | 5,352 | 7,831 | 254 | 29 |
| 40 years to 45 years | 6,098 | 13,361 | 604 | 36 | 1,268 | 5,200 | 215 | 8 | 4,830 | 8,161 | 389 | 28 |
| 45 years to 50 years | 3,816 | 9,435 | 701 | 20 | 786 | 3,824 | 271 | 3 | 3,030 | 5,611 | 430 | 17 |
| 50 years to 55 years | 2,405 | 6,416 | 718 | 14 | 519 | 2,628 | 281 | 4 | 1,886 | 3,788 | 437 | 10 |
| 55 years to 60 years | 1,013 | 3,350 | 479 | 13 | 259 | 1,312 | 168 | 2 | 754 | 2,038 | 311 | 11 |
| 60 years to 65 years | 706 | 2,561 | 539 | 3 | 180 | 991 | 218 | 1 | 526 | 1,570 | 321 | 2 |
| 65 years to 70 years | 272 | 1,263 | 341 | 3 | 72 | 450 | 122 | 1 | 200 | 813 | 219 | 2 |
| 70 years to 75 years | 149 | 688 | 334 | 4 | 57 | 252 | 155 | 4 | 92 | 436 | 179 | … |
| 75 years to 80 years | 54 | 332 | 194 | 1 | 18 | 118 | 75 | … | 36 | 214 | 119 | 1 |
| 80 years to and upwards | 34 | 126 | 161 | 1 | 16 | 34 | 62 | … | 18 | 92 | 99 | 1 |
| Unspecified | 494 | 214 | 33 | 157 | 118 | 87 | 10 | 18 | 376 | 127 | 23 | 139 |
| NUMBERS.—FEMALES. | ||||||||||||
| Ages. | The Colony.* | Boroughs.† | Outside. | |||||||||
| Unmarried. | Wives. | Widows. | Not Stated. | Unmarried. | Wives. | Widows. | Not Stated. | Unmarried. | Wives. | Widows. | Not Stated. | |
| All ages | 140,190 | 72,807 | 7,296 | 35 | 60,101 | 31,213 | 4,037 | 25 | 80,089 | 41,594 | 3,259 | 10 |
| 15 years and upwards | 37,128 | 72,801 | 7,296 | 35 | 18,392 | 31,211 | 4,037 | 25 | 18,736 | 41,590 | 3,259 | 10 |
| 20 years and upwards | 16,819 | 71,568 | 7,289 | 35 | 8,803 | 30,707 | 4,036 | 25 | 8,016 | 40,861 | 3,253 | 10 |
| Under 14 years | 97,759 | … | … | … | 39,404 | … | … | … | 58,355 | … | … | … |
| 14 years to 15 years | 5,303 | 6 | … | … | 2,305 | 2 | … | … | 2,998 | 4 | … | … |
| 15 years to 20 years | 20,309 | 1,233 | 7 | … | 9,589 | 504 | 1 | … | 10,720 | 729 | 6 | … |
| 20 years to 25 years | 10,170 | 8,998 | 114 | 5 | 5,278 | 3,895 | 66 | 4 | 4,892 | 5,103 | 48 | 1 |
| 25 years to 30 years | 3,230 | 13,134 | 301 | 5 | 1,702 | 5,703 | 167 | 4 | 1,528 | 7,431 | 134 | 1 |
| 30 years to 35 years | 1,251 | 12,656 | 484 | 2 | 649 | 5,428 | 276 | 1 | 602 | 7,228 | 208 | 1 |
| 35 years to 40 years | 751 | 11,811 | 677 | 5 | 397 | 5,144 | 390 | 2 | 354 | 6,667 | 287 | 3 |
| 40 years to 45 years | 498 | 9,629 | 869 | 5 | 269 | 4,097 | 514 | 5 | 229 | 5,532 | 355 | … |
| 45 years to 50 years | 273 | 6,274 | 821 | 1 | 152 | 2,746 | 496 | 1 | 121 | 3,528 | 325 | … |
| 50 years to 55 years | 219 | 3,938 | 853 | … | 116 | 1,671 | 480 | … | 103 | 2,267 | 373 | … |
| 55 years to 60 years | 136 | 2,146 | 682 | 1 | 78 | 855 | 376 | 1 | 58 | 1,291 | 306 | … |
| 60 years to 65 years | 107 | 1,527 | 889 | 7 | 53 | 613 | 481 | 4 | 54 | 914 | 408 | 3 |
| 65 years to 70 years | 50 | 729 | 574 | … | 31 | 262 | 298 | … | 19 | 467 | 276 | … |
| 70 years to 75 years | 28 | 360 | 523 | 1 | 16 | 136 | 253 | … | 12 | 224 | 270 | 1 |
| 75 years to 80 years | 16 | 128 | 267 | … | 7 | 50 | 130 | … | 9 | 78 | 137 | … |
| 80 years to and upwards | 11 | 48 | 203 | … | 7 | 16 | 93 | … | 4 | 32 | 110 | … |
| Unspecified | 79 | 190 | 32 | 3 | 48 | 91 | 16 | 3 | 31 | 99 | 16 | … |
Table VII. Table VII. Showing the Numbers and Ages of the Unmarried, Married, Widowed, and Unspecified, Males and Females (exclusive of Maoris), in each Provincial District.
| Provincial Districts. | All Ages. | Under 14 years. | 14–15. | 15 and under 21. | 21 and under 40. | 40 and under 60. | 60 and under 80. | 80 and upwards. | Unspecified Children. | Unspecified Adults and altogether. | |||||||||||
|---|---|---|---|---|---|---|---|---|---|---|---|---|---|---|---|---|---|---|---|---|---|
| 15–20. | 20–21. | 21–25. | 25–30. | 30–35. | 35–40. | 40–45 | 45–50. | 50–55. | 55–60. | 60–65. | 65–70. | 70–75. | 75–80. | ||||||||
| Total of New Zealand— | |||||||||||||||||||||
| Unmarried | Males | 190,864 | 99,391 | 5,425 | 21,027 | 4,088 | 15,584 | 14,604 | 8,703 | 6,931 | 6,098 | 3,816 | 2,405 | 1,013 | 706 | 272 | 149 | 54 | 34 | 70 | 494 |
| Females | 140,190 | 97,701 | 5,303 | 20,309 | 3,027 | 7,143 | 3,230 | 1,251 | 751 | 498 | 273 | 219 | 136 | 107 | 50 | 28 | 16 | 11 | 58 | 79 | |
| Married | Males | 73,331 | … | … | 27 | 70 | 2,264 | 9,098 | 11,190 | 12,936 | 13,361 | 9,435 | 6,416 | 3,350 | 2,561 | 1,263 | 688 | 332 | 126 | … | 214 |
| Females | 72,807 | … | 6 | 1,233 | 1,135 | 7,863 | 13,134 | 12,656 | 11,811 | 9,629 | 6,274 | 3,938 | 2,146 | 1,527 | 729 | 360 | 128 | 48 | … | 190 | |
| Widowed | Males | 4,965 | … | … | 1 | 2 | 26 | 154 | 266 | 412 | 604 | 701 | 718 | 479 | 539 | 341 | 334 | 194 | 161 | … | 33 |
| Females | 7,296 | … | … | 7 | 11 | 103 | 301 | 484 | 677 | 869 | 821 | 853 | 682 | 889 | 574 | 523 | 267 | 203 | … | 32 | |
| Unspecified | Males | 445 | … | … | 5 | 5 | 39 | 60 | 43 | 39 | 36 | 20 | 14 | 13 | 3 | 3 | 4 | 1 | 1 | 2 | 157 |
| Females | 35 | … | … | … | 1 | 4 | 5 | 2 | 5 | 5 | 1 | … | 1 | 7 | … | 1 | … | … | … | 3 | |
| Total | Males | 269,605 | 99,391 | 5,425 | 21,060 | 4,165 | 17,913 | 23,916 | 20,202 | 20,318 | 20,099 | 13,972 | 9,553 | 4,855 | 3,809 | 1,879 | 1,175 | 581 | 322 | 72 | 898 |
| Females | 220,328 | 97,701 | 5,309 | 21,549 | 4,174 | 15,113 | 16,670 | 14,393 | 13,244 | 11,001 | 7,369 | 5,010 | 2,965 | 2,530 | 1,353 | 912 | 411 | 262 | 58 | 304 | |
| Auckland— | |||||||||||||||||||||
| Unmarried | Males | 37,690 | 19,353 | 1,223 | 4,561 | 864 | 3,199 | 2,746 | 1,558 | 1,204 | 893 | 578 | 457 | 200 | 157 | 59 | 44 | 19 | 18 | 6 | 60 |
| Females | 28,546 | 19,266 | 1,123 | 4,400 | 642 | 1,559 | 751 | 297 | 165 | 113 | 68 | 51 | 35 | 26 | 16 | 8 | 7 | … | 10 | 6 | |
| Married | Males | 15,236 | … | … | 7 | 20 | 434 | 1,657 | 2,100 | 2,642 | 2,768 | 1,830 | 1,462 | 835 | 706 | 344 | 222 | 125 | 45 | … | 39 |
| Females | 14,975 | … | … | 235 | 218 | 1,529 | 2,495 | 2,501 | 2,362 | 2,004 | 1,317 | 948 | 552 | 425 | 198 | 107 | 35 | 16 | … | 33 | |
| Widowed | Males | 1,137 | … | … | … | 1 | 5 | 33 | 64 | 93 | 131 | 139 | 148 | 106 | 127 | 90 | 96 | 49 | 47 | … | 8 |
| Females | 1,818 | … | … | 3 | 4 | 20 | 82 | 100 | 137 | 176 | 201 | 225 | 178 | 265 | 163 | 134 | 57 | 67 | … | 6 | |
| Unspecified | Males | 39 | … | … | … | … | 4 | 7 | 4 | 3 | 6 | … | … | … | 2 | … | … | … | … | 2 | 11 |
| Females | 1 | … | … | … | … | … | … | … | … | … | … | … | … | 1 | … | … | … | … | … | … | |
| Total | Males | 54,111 | 19,853 | 1,223 | 4,568 | 885 | 3,642 | 4,443 | 3,726 | 3,942 | 3,798 | 2,547 | 2,067 | 1,141 | 992 | 493 | 362 | 193 | 110 | 8 | 118 |
| Females | 45,340 | 19,266 | 1,123 | 4,638 | 864 | 3,108 | 3,328 | 2,898 | 2,667 | 2,293 | 1,586 | 1,224 | 765 | 717 | 377 | 249 | 99 | 83 | 10 | 45 | |
| Taranaki— | |||||||||||||||||||||
| Unmarried | Males | 6,005 | 3,052 | 154 | 571 | 115 | 601 | 593 | 311 | 213 | 160 | 94 | 58 | 20 | 14 | 6 | 3 | 1 | 1 | 4 | 34 |
| Females | 3,968 | 2,932 | 152 | 500 | 73 | 150 | 78 | 29 | 17 | 11 | 9 | 3 | 5 | 1 | 2 | … | … | 1 | 5 | … | |
| Married | Males | 2,333 | … | … | … | 1 | 81 | 317 | 371 | 434 | 423 | 260 | 174 | 107 | 79 | 45 | 18 | 8 | 3 | … | 12 |
| Females | 2,193 | … | 1 | 36 | 49 | 272 | 435 | 416 | 305 | 251 | 168 | 99 | 62 | 37 | 27 | 17 | 8 | 1 | … | 9 | |
| Widowed | Males | 169 | … | … | … | … | … | 6 | 8 | 10 | 19 | 22 | 26 | 23 | 15 | 13 | 12 | 6 | 6 | … | 3 |
| Females | 179 | … | … | 1 | 1 | 1 | 7 | 10 | 11 | 13 | 22 | 15 | 16 | 24 | 20 | 17 | 8 | 9 | … | 4 | |
| Unspecified | Males | 10 | … | … | … | … | 3 | 1 | … | … | 1 | … | … | … | … | … | … | … | … | … | 5 |
| Females | 1 | … | … | … | … | … | … | … | … | 1 | … | … | … | … | … | … | … | … | … | … | |
| Total | Males | 8,517 | 3,052 | 154 | 571 | 116 | 685 | 917 | 690 | 657 | 603 | 376 | 258 | 150 | 108 | 64 | 33 | 15 | 10 | 4 | 54 |
| Females | 6,341 | 2,932 | 153 | 537 | 123 | 423 | 520 | 455 | 333 | 270 | 199 | 117 | 83 | 62 | 49 | 34 | 16 | 11 | 5 | 13 | |
| Wellington— | |||||||||||||||||||||
| Unmarried | Males | 22,632 | 12,678 | 636 | 2,600 | 456 | 1,861 | 1,635 | 880 | 591 | 465 | 303 | 204 | 79 | 64 | 29 | 20 | 4 | 4 | 25 | 98 |
| Females | 18,130 | 12,617 | 713 | 2,550 | 394 | 1,012 | 387 | 161 | 108 | 60 | 29 | 21 | 12 | 9 | 7 | 6 | 4 | … | 18 | 22 | |
| Married | Males | 9,431 | … | … | 3 | 8 | 373 | 1,394 | 1,648 | 1,672 | 1,557 | 1,012 | 685 | 444 | 297 | 149 | 86 | 42 | 17 | … | 44 |
| Females | 9,569 | … | 1 | 209 | 150 | 1,189 | 1,927 | 1,702 | 1,450 | 1,071 | 716 | 504 | 258 | 193 | 92 | 46 | 15 | 5 | … | 41 | |
Table VII. Table VII. Showing the Numbers and Ages of the Unmarried, Married, Widowed, and Unspecified, Males and Females (exclusive of Maoris), in each Provincial District—continued.
| Provincial Districts. | All Ages. | Under 14 years. | 14–15. | 15 and under 21. | 21 and under 40. | 40 and under 60. | 60 and under 80. | 80 and upwards. | Unspecified Children. | Unspecified Adult and altogether. | |||||||||||
|---|---|---|---|---|---|---|---|---|---|---|---|---|---|---|---|---|---|---|---|---|---|
| 15–20. | 20–21. | 21–25. | 25–30. | 30–35. | 35–40. | 40–45 | 45–50. | 50–55. | 55–60. | 60–65. | 65–70. | 70–75. | 75–80. | ||||||||
| Wellington—continued. | |||||||||||||||||||||
| Widowed | Males | 603 | … | … | … | … | 4 | 21 | 32 | 53 | 69 | 80 | 87 | 54 | 68 | 44 | 43 | 24 | 19 | … | 5 |
| Females | 949 | … | … | … | 1 | 21 | 36 | 71 | 80 | 102 | 96 | 128 | 81 | 118 | 76 | 68 | 40 | 21 | … | 10 | |
| Unspecified | Males | 51 | … | … | 1 | 1 | 10 | 7 | 6 | 2 | 4 | 2 | 4 | 2 | 1 | … | 1 | 1 | … | … | 9 |
| Females | 6 | … | … | … | … | … | 2 | … | … | 1 | 1 | … | … | 1 | … | … | … | … | … | 1 | |
| Total | Males | 32,717 | 12,678 | 636 | 2,604 | 465 | 2,248 | 3,057 | 2,566 | 2,318 | 2,095 | 1,397 | 980 | 579 | 430 | 222 | 150 | 71 | 40 | 25 | 156 |
| Females | 28,654 | 12,617 | 714 | 2,759 | 545 | 2,222 | 2,352 | 1,934 | 1,638 | 1,234 | 842 | 653 | 351 | 321 | 175 | 120 | 59 | 26 | 18 | 74 | |
| Hawke's Bay— | |||||||||||||||||||||
| Unmarried | Males | 6,846 | 3,509 | 175 | 721 | 151 | 593 | 600 | 325 | 248 | 226 | 94 | 68 | 34 | 23 | 15 | 7 | 3 | 1 | 14 | 39 |
| Females | 4,786 | 3,477 | 171 | 659 | 104 | 184 | 84 | 40 | 20 | 15 | 10 | 4 | 5 | 2 | … | … | … | … | 6 | 5 | |
| Married | Males | 2,682 | … | … | … | 2 | 91 | 372 | 514 | 513 | 445 | 308 | 200 | 88 | 77 | 38 | 15 | 4 | 5 | … | 10 |
| Females | 2,654 | … | … | 64 | 56 | 291 | 541 | 497 | 408 | 328 | 203 | 133 | 59 | 30 | 17 | 10 | 1 | 2 | … | 14 | |
| Widowed | Males | 147 | … | … | … | … | … | 6 | 14 | 15 | 21 | 24 | 12 | 14 | 14 | 10 | 7 | 5 | 3 | … | 2 |
| Females | 225 | … | … | … | … | 5 | 9 | 23 | 28 | 25 | 28 | 26 | 19 | 23 | 14 | 13 | 8 | 4 | … | … | |
| Unspecified | Males | 25 | … | … | … | … | 1 | 4 | 2 | 1 | … | 1 | … | 1 | … | … | … | … | … | … | 15 |
| Females | 2 | … | … | … | … | … | … | … | 1 | … | … | … | … | 1 | … | … | … | … | … | … | |
| Total | Males | 9,700 | 3,509 | 175 | 721 | 153 | 685 | 982 | 855 | 777 | 692 | 427 | 280 | 137 | 114 | 63 | 29 | 12 | 9 | 14 | 66 |
| Females | 7,667 | 3,477 | 171 | 723 | 160 | 480 | 634 | 560 | 457 | 368 | 241 | 163 | 83 | 56 | 31 | 23 | 9 | 6 | 6 | 19 | |
| Marlborough— | |||||||||||||||||||||
| Unmarried | Males | 3,768 | 1,959 | 86 | 424 | 90 | 333 | 277 | 151 | 140 | 112 | 83 | 45 | 21 | 29 | 10 | 4 | 1 | 1 | … | 2 |
| Females | 2,617 | 1,987 | 89 | 346 | 52 | 94 | 28 | 7 | 4 | 3 | 2 | 2 | 1 | … | … | … | … | 1 | … | 1 | |
| Married | Males | 1,373 | … | … | 1 | … | 62 | 198 | 200 | 227 | 221 | 177 | 128 | 56 | 50 | 21 | 19 | 8 | 2 | … | 3 |
| Females | 1,336 | … | … | 32 | 33 | 188 | 270 | 238 | 183 | 137 | 93 | 58 | 43 | 30 | 14 | 10 | 2 | 1 | … | 4 | |
| Widowed | Males | 100 | … | … | … | … | … | 2 | 6 | 11 | 10 | 14 | 17 | 8 | 15 | 4 | 7 | 2 | 4 | … | … |
| Females | 98 | … | … | … | … | 3 | 7 | 8 | 10 | 11 | 12 | 6 | 11 | 13 | 10 | 2 | 2 | 3 | … | … | |
| Unspecified | Males | 8 | … | … | … | … | 2 | 1 | … | … | … | … | 1 | 1 | … | … | … | … | … | … | 3 |
| Females | … | … | … | … | … | … | … | … | … | … | … | … | … | … | … | … | … | … | … | … | |
| Total | Males | 5,249 | 1,959 | 86 | 425 | 90 | 397 | 478 | 357 | 378 | 343 | 274 | 191 | 86 | 94 | 35 | 30 | 11 | 7 | … | 8 |
| Females | 4,051 | 1,987 | 89 | 378 | 85 | 285 | 305 | 253 | 197 | 151 | 107 | 66 | 55 | 43 | 24 | 12 | 4 | 5 | … | 5 | |
| Nelson— | |||||||||||||||||||||
| Unmarried | Males | 10,720 | 5,129 | 281 | 1,089 | 207 | 664 | 632 | 473 | 613 | 689 | 454 | 259 | 106 | 62 | 19 | 10 | 2 | … | 1 | 30 |
| Females | 7,233 | 5,017 | 230 | 1,104 | 162 | 369 | 148 | 69 | 40 | 37 | 12 | 15 | 6 | 6 | 6 | 2 | … | 3 | 3 | 4 | |
| Married | Males | 3,703 | … | … | 2 | 3 | 89 | 334 | 448 | 677 | 646 | 534 | 395 | 191 | 169 | 104 | 54 | 34 | 12 | … | 11 |
| Females | 3,594 | … | … | 67 | 54 | 351 | 583 | 586 | 570 | 433 | 352 | 217 | 146 | 102 | 62 | 36 | 16 | 9 | … | 10 | |
| Widowed | Males | 348 | … | … | … | … | 2 | 6 | 12 | 22 | 39 | 51 | 55 | 34 | 38 | 29 | 24 | 26 | 7 | … | 3 |
| Females | 444 | … | … | … | 1 | 5 | 15 | 26 | 42 | 54 | 42 | 40 | 43 | 35 | 37 | 42 | 36 | 25 | … | 1 | |
Table VII. Table VII. Showing the Numbers and Ages of the Unmarried, Married, Widowed, and Unspecified, Males and Females (exclusive of Maoris), in each Provincial District—continued.
| Provincial Districts. | All Ages. | Under 14 years. | 14–15. | 15 and under 21. | 21 and under 40. | 40 and under 60. | 60 and under 80. | 80 and upwards. | Unspecified Children. | Unspecified Adult and altogether. | |||||||||||
|---|---|---|---|---|---|---|---|---|---|---|---|---|---|---|---|---|---|---|---|---|---|
| 15–20. | 20–21. | 21–25. | 25–30. | 30–35. | 35–40. | 40–45 | 45–50. | 50–55. | 55–60. | 60–65. | 65–70. | 70–75. | 75–80. | ||||||||
| Unspecified | Males | 29 | … | … | … | … | 1 | 4 | 2 | 1 | 2 | 4 | 2 | 3 | … | … | 1 | … | 1 | … | 8 |
| Females | 4 | … | … | … | … | … | … | … | … | 1 | … | … | … | 2 | … | 1 | … | … | … | … | |
| Total | Males | 14,800 | 5,129 | 281 | 1,091 | 210 | 756 | 976 | 935 | 1,313 | 1,376 | 1,043 | 711 | 334 | 269 | 152 | 89 | 62 | 20 | 1 | 52 |
| Females | 11,275 | 5,017 | 230 | 1,171 | 217 | 725 | 746 | 681 | 652 | 525 | 406 | 272 | 195 | 145 | 105 | 81 | 52 | 37 | 3 | 15 | |
| Westland— | |||||||||||||||||||||
| Unmarried | Males | 6,788 | 2,727 | 119 | 429 | 79 | 317 | 448 | 451 | 570 | 682 | 485 | 264 | 119 | 55 | 23 | 3 | … | … | 1 | 16 |
| Females | 3,752 | 2,920 | 128 | 399 | 68 | 93 | 63 | 28 | 21 | 17 | 7 | 2 | … | 2 | … | 2 | … | … | 1 | 1 | |
| Married | Males | 2,070 | … | … | … | 1 | 28 | 119 | 181 | 415 | 553 | 396 | 212 | 79 | 50 | 21 | 5 | 3 | 2 | … | 5 |
| Females | 2,004 | … | … | 34 | 32 | 167 | 262 | 376 | 435 | 339 | 198 | 92 | 30 | 18 | 6 | 7 | 2 | … | … | 6 | |
| Widowed | Males | 199 | … | … | … | … | … | 2 | 5 | 21 | 26 | 41 | 37 | 27 | 19 | 9 | 6 | 3 | 3 | … | … |
| Females | 179 | … | … | … | … | 2 | 8 | 14 | 38 | 35 | 18 | 23 | 11 | 11 | 10 | 5 | 2 | 2 | … | … | |
| Unspecified | Males | 18 | … | … | … | … | … | 1 | 2 | 2 | 5 | 2 | 3 | … | … | … | 1 | … | … | … | 2 |
| Females | … | … | … | … | … | … | … | … | … | … | … | … | … | … | … | … | … | … | … | … | |
| Total | Males | 9,075 | 2,727 | 119 | 429 | 80 | 345 | 570 | 639 | 1,008 | 1,266 | 924 | 516 | 225 | 124 | 53 | 15 | 6 | 5 | 1 | 23 |
| Females | 5,935 | 2,920 | 128 | 433 | 100 | 262 | 333 | 418 | 494 | 391 | 223 | 117 | 41 | 31 | 16 | 14 | 4 | 2 | 1 | 7 | |
| Canterbury— | |||||||||||||||||||||
| Unmarried | Males | 42,301 | 23,441 | 1,240 | 4,851 | 997 | 3,650 | 3,372 | 1,696 | 1,078 | 876 | 484 | 277 | 95 | 83 | 49 | 21 | 13 | 5 | 5 | 68 |
| Females | 32,955 | 22,975 | 1,176 | 4,741 | 763 | 1,783 | 792 | 274 | 163 | 102 | 52 | 50 | 24 | 30 | 8 | 1 | 1 | … | 3 | 17 | |
| Married | Males | 17,177 | … | … | 5 | 17 | 602 | 2,346 | 2,846 | 3,054 | 3,155 | 2,095 | 1,326 | 716 | 533 | 264 | 116 | 52 | 16 | … | 34 |
| Females | 17,163 | … | 2 | 263 | 245 | 1,898 | 3,255 | 2,993 | 2,802 | 2,276 | 1,516 | 865 | 459 | 316 | 168 | 60 | 19 | 5 | … | 21 | |
| Widowed | Males | 957 | … | … | … | … | 10 | 44 | 59 | 89 | 119 | 127 | 135 | 85 | 92 | 69 | 57 | 34 | 33 | … | 4 |
| Females | 1,469 | … | … | … | 4 | 19 | 61 | 104 | 129 | 217 | 156 | 161 | 144 | 183 | 106 | 106 | 43 | 30 | … | 6 | |
| Unspecified | Males | 155 | … | … | 2 | 3 | 11 | 19 | 16 | 14 | 13 | 4 | 2 | 1 | … | 1 | 1 | … | … | … | 68 |
| Females | 5 | … | … | … | … | 1 | 2 | … | … | … | … | … | 1 | … | … | … | … | … | … | 1 | |
| Total | Males | 60,590 | 23,441 | 1,240 | 4,858 | 1,017 | 4,273 | 5,781 | 4,617 | 4,235 | 4,163 | 2,710 | 1,740 | 897 | 708 | 383 | 195 | 99 | 54 | 5 | 174 |
| Females | 51,592 | 22,975 | 1,178 | 5,004 | 1,012 | 3,701 | 4,110 | 3,371 | 3,094 | 2,595 | 1,724 | 1,076 | 628 | 529 | 282 | 167 | 63 | 35 | 3 | 45 | |
| Otago— | |||||||||||||||||||||
| Unmarried | Males | 53,988 | 27,013 | 1,509 | 5,771 | 1,123 | 4,341 | 4,284 | 2,849 | 2,269 | 1,990 | 1,239 | 771 | 338 | 217 | 61 | 37 | 11 | 4 | 14 | 147 |
| Females | 38,154 | 26,478 | 1,519 | 5,605 | 768 | 1,897 | 897 | 344 | 209 | 138 | 84 | 71 | 48 | 31 | 11 | 9 | 4 | 6 | 12 | 23 | |
| Married | Males | 19,284 | … | … | 9 | 18 | 501 | 2,359 | 2,877 | 3,300 | 3,579 | 2,815 | 1,830 | 832 | 599 | 277 | 153 | 56 | 24 | … | 55 |
| Females | 19,289 | … | 2 | 290 | 298 | 1,975 | 3,364 | 3,343 | 3,291 | 2,785 | 1,710 | 1,020 | 535 | 374 | 145 | 67 | 30 | 9 | … | 51 | |
| Widowed | Males | 1,303 | … | … | 1 | 1 | 5 | 33 | 66 | 97 | 170 | 203 | 201 | 128 | 151 | 73 | 82 | 45 | 39 | … | 8 |
| Females | 1,933 | … | … | 3 | … | 27 | 76 | 128 | 202 | 236 | 246 | 228 | 179 | 216 | 138 | 136 | 71 | 42 | … | 5 | |
| Unspecified | Males | 110 | … | … | 2 | 1 | 7 | 16 | 11 | 16 | 5 | 7 | 2 | 5 | … | 2 | … | … | … | … | 36 |
| Females | 16 | … | … | … | 1 | 3 | 1 | 2 | 4 | 2 | … | … | … | 2 | … | … | … | … | … | 1 | |
| Total | Males | 74,685 | 27,013 | 1,509 | 5,783 | 1,143 | 4,854 | 6,692 | 5,803 | 5,682 | 5,744 | 4,264 | 2,804 | 1,303 | 967 | 413 | 272 | 112 | 67 | 14 | 246 |
| Females | 59,392 | 26,478 | 1,521 | 5,898 | 1,067 | 3,902 | 4,338 | 3,817 | 3,706 | 3,161 | 2,040 | 1,319 | 762 | 623 | 294 | 212 | 105 | 57 | 12 | 80 | |
| Chatham Islands— | |||||||||||||||||||||
| Unmarried | Males | 117 | 30 | 2 | 10 | 6 | 25 | 17 | 9 | 5 | 5 | 2 | 2 | 1 | 2 | 1 | … | … | … | … | … |
| Females | 49 | 32 | 2 | 5 | 1 | 2 | 2 | 2 | 1 | 2 | … | … | … | … | … | … | … | … | … | … | |
| Married | Males | 42 | … | … | … | … | 3 | 2 | 5 | 2 | 14 | 8 | 4 | 2 | 1 | … | … | … | … | … | 1 |
| Females | 30 | … | … | 3 | … | 3 | 2 | 4 | 5 | 5 | 1 | 2 | 2 | 2 | … | … | … | … | … | 1 | |
| Widowed | Males | 2 | … | … | … | … | … | 1 | … | 1 | … | … | … | … | … | … | … | … | … | … | … |
| Females | 2 | … | … | … | … | … | … | … | … | … | … | 1 | … | 1 | … | … | … | … | … | … | |
| Unspecified | Males | … | … | … | … | … | … | … | … | … | … | … | … | … | … | … | … | … | … | … | … |
| Females | … | … | … | … | … | … | … | … | … | … | … | … | … | … | … | … | … | … | … | … | |
| Total | Males | 161 | 30 | 2 | 10 | 6 | 28 | 20 | 14 | 8 | 19 | 10 | 6 | 3 | 3 | 1 | … | … | … | … | 1 |
| Females | 81 | 32 | 2 | 8 | 1 | 5 | 4 | 6 | 6 | 7 | 1 | 3 | 2 | 3 | … | … | … | … | … | 1 | |
Table VIII. Table VIII. Showing the Numbers and Ages of the Unmarried, Married, Widowed, and Unspecified, Males and Females (exclusive of Maoris), in each County.
| Counties. | All Ages. | Under 14 years. | 14–15. | 15 and under 21. | 21 and under 40. | 40 and under 60. | 60 and under 80. | 80 and upwards. | Unspecified Children. | Unspecified Adults. | |||||||||||
|---|---|---|---|---|---|---|---|---|---|---|---|---|---|---|---|---|---|---|---|---|---|
| 15–20. | 20–21. | 21–25. | 25–30. | 30–35. | 35–40. | 40–45 | 45–50. | 50–55. | 55–60. | 60–65. | 65–70. | 70–75. | 75–80. | ||||||||
| Mongonui— | |||||||||||||||||||||
| Unmarried | Males | 645 | 355 | 24 | 81 | 13 | 47 | 41 | 28 | 13 | 19 | 8 | 6 | 2 | 4 | … | 2 | … | 1 | … | 1 |
| Females | 400 | 303 | 14 | 57 | 2 | 15 | 2 | 1 | 1 | 1 | 1 | 2 | 1 | … | … | … | … | … | … | … | |
| Married | Males | 212 | … | … | … | … | 4 | 22 | 38 | 35 | 36 | 23 | 18 | 8 | 12 | 5 | 5 | 2 | 3 | … | 1 |
| Females | 184 | … | … | 9 | 7 | 21 | 28 | 33 | 31 | 20 | 14 | 5 | 4 | 7 | 1 | 1 | 2 | … | … | 1 | |
| Widowed | Males | 14 | … | … | … | … | 1 | … | … | 1 | 6 | 1 | 1 | … | 1 | … | 1 | … | 2 | … | … |
| Females | 16 | … | … | … | … | … | 2 | … | 5 | 2 | … | 1 | 2 | 1 | 2 | … | … | 1 | … | … | |
| Unspecified | Males | … | … | … | … | … | … | … | … | … | … | … | … | … | … | … | … | … | … | … | … |
| Females | … | … | … | … | … | … | … | … | … | … | … | … | … | … | … | … | … | … | … | … | |
| Total | Males | 871 | 355 | 24 | 81 | 13 | 52 | 63 | 66 | 49 | 61 | 32 | 25 | 10 | 17 | 5 | 8 | 2 | 6 | … | 2 |
| Females | 600 | 303 | 14 | 66 | 9 | 36 | 32 | 34 | 37 | 23 | 15 | 8 | 7 | 8 | 3 | 1 | 2 | 1 | … | 1 | |
| Bay of Islands— | |||||||||||||||||||||
| Unmarried | Males | 880 | 422 | 27 | 95 | 26 | 70 | 82 | 48 | 29 | 23 | 15 | 10 | 8 | 2 | 1 | 3 | … | 1 | … | 10 |
| Females | 570 | 407 | 24 | 75 | 9 | 19 | 14 | 5 | 7 | 3 | 2 | 3 | 1 | … | … | … | … | … | 1 | … | |
| Married | Males | 360 | … | … | … | 1 | 16 | 54 | 49 | 61 | 60 | 41 | 35 | 21 | 13 | 4 | 3 | 1 | … | … | 1 |
| Females | 332 | … | … | 12 | 4 | 39 | 67 | 53 | 54 | 36 | 27 | 22 | 11 | 4 | 1 | … | 1 | … | … | 1 | |
| Widowed | Males | 16 | … | … | … | … | … | … | 1 | … | 4 | 1 | 2 | 2 | 1 | … | 1 | 1 | 1 | … | 2 |
| Females | 24 | … | … | … | … | … | … | 1 | … | 2 | … | 2 | 5 | 4 | 3 | 2 | 2 | 3 | … | … | |
| Unspecified | Males | 2 | … | … | … | … | … | 1 | … | … | … | … | … | … | 1 | … | … | … | … | … | … |
| Females | … | … | … | … | … | … | … | … | … | … | … | … | … | … | … | … | … | … | … | … | |
| Total | Males | 1,258 | 422 | 27 | 95 | 27 | 94 | 137 | 98 | 90 | 87 | 57 | 47 | 31 | 17 | 5 | 7 | 2 | 2 | … | 13 |
| Females | 926 | 407 | 24 | 87 | 13 | 58 | 81 | 59 | 61 | 41 | 29 | 27 | 17 | 8 | 4 | 2 | 3 | 3 | 1 | 1 | |
| Hokianga— | |||||||||||||||||||||
| Unmarried | Males | 267 | 118 | 5 | 30 | 8 | 32 | 28 | 14 | 10 | 11 | 7 | 2 | … | … | … | 1 | … | 1 | … | … |
| Females | 150 | 113 | 9 | 18 | … | 4 | 5 | 1 | … | … | … | … | … | … | … | … | … | … | … | … | |
| Married | Males | 87 | … | … | … | … | 5 | 9 | 18 | 12 | 13 | 12 | 6 | 3 | 7 | 1 | 1 | … | … | … | … |
| Females | 68 | … | … | 1 | … | 13 | 9 | 15 | 7 | 9 | 5 | 6 | 1 | 2 | … | … | … | … | … | … | |
| Widowed | Males | 13 | … | … | … | … | 1 | … | 1 | … | 3 | 1 | 2 | … | 1 | … | … | 1 | 3 | … | … |
| Females | 2 | … | … | … | … | … | … | … | … | 1 | 1 | … | … | … | … | … | … | … | … | … | |
| Unspecified | Males | … | … | … | … | … | … | … | … | … | … | … | … | … | … | … | … | … | … | … | … |
| Females | … | … | … | … | … | … | … | … | … | … | … | … | … | … | … | … | … | … | … | … | |
| Total | Males | 367 | 118 | 5 | 30 | 8 | 38 | 37 | 33 | 22 | 27 | 20 | 10 | 3 | 8 | 1 | 2 | 1 | 4 | … | … |
| Females | 220 | 113 | 9 | 19 | … | 17 | 14 | 16 | 7 | 10 | 6 | 6 | 1 | 2 | … | … | … | … | … | … | |
| Hobson— | |||||||||||||||||||||
| Unmarried | Males | 1,288 | 543 | 31 | 140 | 31 | 140 | 146 | 77 | 62 | 37 | 31 | 19 | 9 | 7 | … | 1 | … | 1 | … | 13 |
| Females | 678 | 487 | 25 | 91 | 12 | 40 | 10 | 6 | 3 | 3 | … | … | … | … | … | … | … | … | … | 1 | |
Table VIII. Table VIII. Showing the Numbers and Ages of the Unmarried, Married, Widowed, and Unspecified, Males and Females (exclusive of Maoris), in each County—continued.
| Counties. | All Ages. | Under 14 years. | 14–15. | 15 and under 21. | 21 and under 40. | 40 and under 60. | 60 and under 80. | 80 and upwards. | Unspecified Children. | Unspecified Adults. | |||||||||||
|---|---|---|---|---|---|---|---|---|---|---|---|---|---|---|---|---|---|---|---|---|---|
| 15–20. | 20–21. | 21–25. | 25–30. | 30–35. | 35–40. | 40–45 | 45–50. | 50–55. | 55–60. | 60–65. | 65–70. | 70–75. | 75–80. | ||||||||
| Married | Males | 424 | … | … | … | … | 22 | 62 | 63 | 81 | 71 | 41 | 36 | 16 | 10 | 7 | 7 | 3 | 2 | … | 3 |
| Females | 393 | … | … | 17 | 8 | 46 | 78 | 64 | 49 | 44 | 28 | 23 | 15 | 6 | 8 | 2 | … | 1 | … | 4 | |
| Widowed | Males | 37 | … | … | … | … | … | 1 | 4 | 6 | 4 | 4 | 8 | 5 | 2 | … | 1 | … | 2 | … | … |
| Females | 26 | … | … | … | … | … | 3 | 1 | … | 3 | 3 | 1 | 4 | 7 | 4 | … | … | … | … | … | |
| Unspecified | Males | 5 | … | … | … | … | … | 2 | 1 | … | 2 | … | … | … | … | … | … | … | … | … | … |
| Females | … | … | … | … | … | … | … | … | … | … | … | … | … | … | … | … | … | … | … | … | |
| Total | Males | 1,754 | 543 | 31 | 140 | 31 | 162 | 211 | 145 | 149 | 114 | 76 | 63 | 30 | 19 | 7 | 9 | 3 | 5 | … | 16 |
| Females | 1,097 | 487 | 25 | 108 | 20 | 86 | 91 | 71 | 52 | 50 | 31 | 24 | 19 | 13 | 12 | 2 | … | 1 | … | 5 | |
| Whangarei— | |||||||||||||||||||||
| Unmarried | Males | 1,608 | 786 | 50 | 191 | 47 | 143 | 117 | 79 | 64 | 48 | 28 | 27 | 16 | 4 | 2 | 1 | 1 | … | … | 4 |
| Females | 1,095 | 723 | 43 | 184 | 32 | 46 | 24 | 13 | 9 | 5 | 5 | 3 | 4 | 2 | 1 | … | … | … | … | 1 | |
| Married | Males | 573 | … | … | … | 3 | 12 | 57 | 59 | 86 | 104 | 74 | 59 | 44 | 37 | 11 | 8 | 7 | 11 | … | 1 |
| Females | 541 | … | … | 8 | 5 | 54 | 67 | 71 | 83 | 92 | 57 | 36 | 31 | 14 | 10 | 6 | 3 | 3 | … | 1 | |
| Widowed | Males | 57 | … | … | … | … | … | … | 4 | 2 | 4 | 4 | 5 | 6 | 9 | 6 | 8 | 3 | 6 | … | … |
| Females | 72 | … | … | … | … | … | 1 | 3 | 7 | 6 | 9 | 12 | 7 | 6 | 6 | 5 | 2 | 8 | … | … | |
| Unspecified | Males | 7 | … | … | … | … | … | … | … | 1 | … | … | … | … | … | … | … | … | … | … | 6 |
| Females | … | … | … | … | … | … | … | … | … | … | … | … | … | … | … | … | … | … | … | … | |
| Total | Males | 2,245 | 786 | 50 | 191 | 50 | 155 | 174 | 142 | 153 | 156 | 106 | 91 | 66 | 50 | 19 | 17 | 11 | 17 | … | 11 |
| Females | 1,708 | 723 | 43 | 192 | 37 | 100 | 92 | 87 | 99 | 103 | 71 | 51 | 42 | 22 | 17 | 11 | 5 | 11 | … | 2 | |
| Rodney— | |||||||||||||||||||||
| Unmarried | Males | 1,301 | 665 | 44 | 194 | 26 | 117 | 83 | 54 | 37 | 29 | 21 | 19 | 4 | 6 | … | … | … | … | … | 2 |
| Females | 975 | 674 | 42 | 130 | 19 | 63 | 24 | 8 | 7 | 2 | 1 | 1 | 1 | 1 | … | 2 | … | … | … | … | |
| Married | Males | 464 | … | … | … | 1 | 8 | 31 | 49 | 76 | 77 | 70 | 48 | 36 | 30 | 16 | 15 | 5 | 2 | … | … |
| Females | 468 | … | … | 8 | 5 | 28 | 75 | 71 | 57 | 62 | 56 | 36 | 25 | 24 | 12 | 6 | 1 | 2 | … | … | |
| Widowed | Males | 36 | … | … | … | … | 1 | … | 1 | 5 | 3 | 5 | 3 | 7 | 4 | 3 | 3 | 1 | … | … | … |
| Females | 42 | … | … | … | … | … | 1 | 2 | 3 | 6 | 7 | 3 | 6 | 5 | 3 | 3 | … | 3 | … | … | |
| Unspecified | Males | 1 | … | … | … | … | … | … | 1 | … | … | … | … | … | … | … | … | … | … | … | … |
| Females | … | … | … | … | … | … | … | … | … | … | … | … | … | … | … | … | … | … | … | … | |
| Total | Males | 1,802 | 665 | 44 | 194 | 27 | 126 | 114 | 105 | 118 | 109 | 96 | 70 | 47 | 40 | 19 | 18 | 6 | 2 | … | 2 |
| Females | 1,485 | 674 | 42 | 138 | 24 | 91 | 100 | 81 | 67 | 70 | 64 | 40 | 32 | 30 | 15 | 11 | 1 | 5 | … | … | |
| Waitemata — | |||||||||||||||||||||
| Unmarried | Males | 1,843 | 818 | 40 | 231 | 32 | 154 | 174 | 100 | 89 | 68 | 48 | 43 | 18 | 19 | 4 | 2 | 2 | … | … | 1 |
| Females | 1,178 | 791 | 41 | 188 | 23 | 57 | 45 | 9 | 8 | 5 | 1 | 5 | 3 | 1 | … | … | 1 | … | … | … | |
| Married | Males | 701 | … | … | … | … | 22 | 64 | 87 | 119 | 113 | 89 | 73 | 41 | 44 | 19 | 15 | 13 | 2 | … | … |
| Females | 660 | … | … | 9 | 11 | 72 | 90 | 107 | 88 | 100 | 57 | 42 | 35 | 23 | 13 | 8 | 3 | 2 | … | … | |
| Widowed | Males | 64 | … | … | … | … | … | 3 | 2 | 9 | 6 | 11 | 8 | 5 | 3 | 5 | 4 | 3 | 4 | … | 1 |
| Females | 76 | … | … | … | … | 1 | 4 | 4 | 5 | 10 | 3 | 11 | 9 | 9 | 7 | 9 | 3 | 1 | … | … | |
| Unspecified | Males | … | … | … | … | … | … | … | … | … | … | … | … | … | … | … | … | … | … | … | … |
| … | |||||||||||||||||||||
| Females | … | … | … | … | … | … | … | … | … | … | … | … | … | … | … | … | … | … | … | … | |
| Total | Males | 2,608 | 818 | 40 | 231 | 32 | 176 | 241 | 189 | 217 | 187 | 148 | 124 | 64 | 66 | 28 | 21 | 18 | 6 | … | 2 |
| Females | 1,914 | 791 | 41 | 197 | 34 | 130 | 139 | 120 | 101 | 115 | 61 | 58 | 47 | 33 | 20 | 17 | 7 | 3 | … | … | |
| Eden— | |||||||||||||||||||||
| Unmarried | Males | 5,934 | 3,571 | 217 | 837 | 126 | 396 | 274 | 145 | 116 | 87 | 55 | 40 | 29 | 22 | 7 | 4 | 3 | 3 | … | 2 |
| Females | 5,611 | 3,529 | 237 | 946 | 149 | 390 | 169 | 74 | 44 | 24 | 16 | 12 | 10 | 3 | 5 | 1 | 1 | … | 1 | … | |
Table VIII. Table VIII. Showing the Numbers and Ages of the Unmarried, Married, Widowed, and Unspecified, Males and Females (exclusive of Maoris), in each County—continued.
| Counties. | All Ages. | Under 14 years. | 14–15. | 15 and under 21. | 21 and under 40. | 40 and under 60. | 60 and under 80. | 80 and upwards. | Unspecified Children. | Unspecified Adults. | |||||||||||
|---|---|---|---|---|---|---|---|---|---|---|---|---|---|---|---|---|---|---|---|---|---|
| 15–20. | 20–21. | 21–25. | 25–30. | 30–35. | 35–40. | 40–45 | 45–50. | 50–55. | 55–60. | 60–65. | 65–70. | 70–75. | 75–80. | ||||||||
| Eden—continued. | |||||||||||||||||||||
| Married | Males | 2,703 | … | … | 1 | 5 | 81 | 307 | 384 | 450 | 473 | 312 | 261 | 141 | 134 | 76 | 44 | 18 | 10 | … | 6 |
| Females | 2,829 | … | … | 33 | 33 | 274 | 438 | 496 | 466 | 368 | 262 | 190 | 100 | 88 | 46 | 20 | 5 | 5 | … | 5 | |
| Widowed | Males | 148 | … | … | … | … | … | 4 | 8 | 7 | 15 | 18 | 22 | 18 | 17 | 15 | 8 | 8 | 8 | … | … |
| Females | 368 | … | … | 1 | 1 | 2 | 11 | 17 | 26 | 36 | 34 | 60 | 33 | 52 | 29 | 36 | 19 | 10 | … | 1 | |
| Unspecified | Males | … | … | … | … | … | … | … | … | … | … | … | … | … | … | … | … | … | … | … | … |
| Females | … | … | … | … | … | … | … | … | … | … | … | … | … | … | … | … | … | … | … | … | |
| Total | Males | 8,785 | 3,571 | 217 | 838 | 131 | 477 | 585 | 537 | 573 | 575 | 385 | 323 | 188 | 173 | 98 | 56 | 29 | 21 | … | 8 |
| Females. | 8,808 | 3,529 | 237 | 980 | 183 | 666 | 618 | 587 | 536 | 428 | 312 | 262 | 143 | 143 | 80 | 57 | 25 | 15 | 1 | 6 | |
| Manukau— | |||||||||||||||||||||
| Unmarried | Males | 3,787 | 2,283 | 163 | 479 | 71 | 235 | 162 | 100 | 99 | 70 | 43 | 36 | 12 | 14 | 9 | 5 | 3 | … | … | 3 |
| Females | 3,129 | 2,281 | 140 | 405 | 48 | 127 | 59 | 30 | 12 | 11 | 5 | 2 | 2 | 6 | … | 1 | … | … | … | … | |
| Married | Males | 1,518 | … | … | … | 1 | 26 | 108 | 146 | 256 | 308 | 195 | 163 | 112 | 79 | 52 | 32 | 34 | 5 | … | 1 |
| Females | 1,539 | … | … | 22 | 25 | 109 | 188 | 209 | 260 | 251 | 151 | 119 | 74 | 66 | 35 | 20 | 8 | 1 | … | 1 | |
| Widowed | Males | 110 | … | … | … | 1 | … | 4 | 6 | 8 | 11 | 15 | 9 | 11 | 19 | 9 | 8 | 6 | 3 | … | … |
| Females | 190 | … | … | 1 | 1 | 1 | 5 | 12 | 10 | 11 | 19 | 27 | 12 | 35 | 19 | 17 | 9 | 10 | … | 1 | |
| Unspecified | Males | 1 | … | … | … | … | … | … | 1 | … | … | … | … | … | … | … | … | … | … | … | … |
| Females | … | … | … | … | … | … | … | … | … | … | … | … | … | … | … | … | … | … | … | … | |
| Total | Males | 5,416 | 2,283 | 163 | 479 | 73 | 261 | 274 | 253 | 363 | 389 | 253 | 208 | 135 | 112 | 70 | 45 | 43 | 8 | … | 4 |
| Females | 4,858 | 2,281 | 140 | 428 | 74 | 237 | 252 | 251 | 282 | 273 | 175 | 148 | 88 | 107 | 54 | 38 | 17 | 11 | … | 2 | |
| Coromandel— | |||||||||||||||||||||
| Unmarried | Males | 991 | 415 | 22 | 60 | 14 | 69 | 106 | 78 | 78 | 58 | 42 | 24 | 12 | 6 | 2 | 3 | … | … | … | 2 |
| Females | 480 | 366 | 17 | 62 | 14 | 9 | 7 | 1 | … | 1 | 1 | … | 2 | … | … | … | … | … | … | … | |
| Married | Males | 340 | … | … | … | … | 10 | 25 | 64 | 62 | 67 | 47 | 33 | 15 | 8 | 5 | 2 | 1 | 1 | … | … |
| Females | 299 | … | … | 7 | 4 | 43 | 58 | 53 | 49 | 43 | 19 | 8 | 7 | 6 | 2 | … | … | … | … | … | |
| Widowed | Males | 24 | … | … | … | … | … | 1 | … | 1 | 2 | 5 | 5 | 3 | 4 | … | 2 | 1 | … | … | … |
| Females | 19 | … | … | … | … | … | 2 | 2 | 3 | … | 3 | 3 | … | 2 | 1 | 1 | … | 2 | … | … | |
| Unspecified | Males | … | … | … | … | … | … | … | … | … | … | … | … | … | … | … | … | … | … | … | … |
| Females | … | … | … | … | … | … | … | … | … | … | … | … | … | … | … | … | … | … | … | … | |
| Total | Males | 1,355 | 415 | 22 | 60 | 14 | 79 | 132 | 142 | 141 | 127 | 94 | 62 | 30 | 18 | 7 | 7 | 2 | 1 | … | 2 |
| Females | 798 | 366 | 17 | 69 | 18 | 52 | 67 | 56 | 52 | 44 | 23 | 11 | 9 | 8 | 3 | 1 | … | 2 | … | … | |
| Thames— | |||||||||||||||||||||
| Unmarried | Males | 2,073 | 1,089 | 58 | 215 | 41 | 185 | 132 | 78 | 93 | 67 | 54 | 34 | 10 | 8 | 5 | … | … | … | 1 | 3 |
| Females | 1,417 | 1,092 | 50 | 198 | 15 | 36 | 14 | 2 | 4 | 3 | 1 | … | … | … | 1 | … | … | … | … | 1 | |
| Married | Males | 816 | … | … | … | … | 19 | 84 | 104 | 165 | 186 | 90 | 72 | 311 | 30 | 18 | 6 | 2 | … | … | 4 |
| Females | 766 | … | … | 12 | 7 | 87 | 145 | 117 | 137 | 99 | 62 | 50 | 23 | 17 | 7 | 1 | 1 | … | … | 1 | |
Table VIII. Table VIII. Showing the Numbers and Ages of the Unmarried, Married, Widowed, and Unspecified, Males and Females (exclusive of Maoris), in each County—continued.
| Counties. | All Ages. | Under 14 years. | 14–15. | 15 and under 21. | 21 and under 40. | 40 and under 60. | 60 and under 80. | 80 and upwards. | Unspecified Children. | Unspecified Adults. | |||||||||||
|---|---|---|---|---|---|---|---|---|---|---|---|---|---|---|---|---|---|---|---|---|---|
| 15–20. | 20–21. | 21–25. | 25–30. | 30–35. | 35–40. | 40–45 | 45–50. | 50–55. | 55–60. | 60–65. | 65–70. | 70–75. | 75–80. | ||||||||
| Widowed | Males | 45 | … | … | … | … | 1 | 2 | … | 1 | 9 | 10 | 7 | 1 | 5 | 5 | 2 | … | … | … | 2 |
| Females | 60 | … | … | … | … | 1 | 3 | 5 | 5 | 6 | 6 | 6 | 7 | 10 | 4 | 4 | 2 | … | … | 1 | |
| Unspecified | Males | 1 | … | … | … | … | … | … | … | 1 | … | … | … | … | … | … | … | … | … | … | … |
| Females | 1 | … | … | … | … | … | … | … | … | … | … | … | … | 1 | … | … | … | … | … | … | |
| Total | Males | 2,935 | 1,089 | 58 | 215 | 41 | 205 | 218 | 182 | 260 | 262 | 154 | 113 | 47 | 43 | 28 | 8 | 2 | … | 1 | 9 |
| Females | 2,244 | 1,092 | 50 | 210 | 22 | 124 | 162 | 124 | 146 | 108 | 69 | 56 | 30 | 28 | 12 | 5 | 3 | … | … | 3 | |
| Piako— | |||||||||||||||||||||
| Unmarried | Males | 531 | 141 | 14 | 52 | 29 | 96 | 84 | 36 | 37 | 14 | 15 | 6 | 4 | 2 | … | … | … | … | … | 1 |
| Females | 160 | 117 | 9 | 21 | 2 | 5 | 4 | … | 1 | 1 | … | … | … | … | … | … | … | … | … | … | |
| Married | Males | 161 | … | … | … | 1 | 9 | 24 | 33 | 30 | 21 | 15 | 14 | 7 | 4 | 1 | … | … | … | … | 2 |
| Females | 105 | … | … | 2 | 4 | 16 | 22 | 18 | 9 | 18 | 6 | 4 | 2 | … | 1 | … | … | … | … | 3 | |
| Widowed | Males | 15 | … | … | … | … | … | … | 1 | 2 | 2 | 4 | 4 | … | 1 | 1 | … | … | … | … | … |
| Females | 3 | … | … | … | … | 1 | … | 1 | 1 | … | … | … | … | … | … | … | … | … | … | … | |
| Unspecified | Males | 6 | … | … | … | … | 2 | 2 | 1 | … | 1 | … | … | … | … | … | … | … | … | … | … |
| Females | … | … | … | … | … | … | … | … | … | … | … | … | … | … | … | … | … | … | … | … | |
| Total | Males | 713 | 141 | 14 | 52 | 30 | 107 | 110 | 71 | 69 | 38 | 34 | 24 | 11 | 7 | 2 | … | … | … | … | 3 |
| Females | 268 | 117 | 9 | 23 | 6 | 22 | 26 | 19 | 11 | 19 | 6 | 4 | 2 | … | 1 | … | … | … | … | 3 | |
| Tauranga— | |||||||||||||||||||||
| Unmarried | Males | 1,023 | 456 | 24 | 127 | 40 | 114 | 105 | 47 | 38 | 18 | 20 | 18 | 5 | 5 | 2 | … | … | 1 | … | 3 |
| Females | 743 | 481 | 29 | 111 | 13 | 58 | 21 | 9 | 8 | 6 | 2 | 1 | … | 1 | … | … | 1 | … | 2 | … | |
| Married | Males | 398 | … | … | … | … | 14 | 44 | 55 | 73 | 61 | 58 | 36 | 26 | 16 | 6 | 4 | 1 | 1 | … | 3 |
| Females | 373 | … | … | 6 | 5 | 45 | 75 | 61 | 45 | 54 | 37 | 20 | 13 | 4 | 2 | 3 | … | … | … | 3 | |
| Widowed | Males | 23 | … | … | … | … | … | 1 | 1 | 1 | 2 | 3 | 6 | 2 | 3 | 3 | 1 | … | … | … | … |
| Females | 36 | … | … | … | … | … | 2 | 1 | 1 | 3 | 6 | 5 | 5 | 6 | 3 | 3 | … | 1 | … | … | |
| Unspecified | Males | 3 | … | … | … | … | … | … | … | … | … | … | … | … | … | … | … | … | … | 2 | 1 |
| Females | … | … | … | … | … | … | … | … | … | … | … | … | … | … | … | … | … | … | … | … | |
| Total | Males | 1,447 | 456 | 24 | 127 | 40 | 128 | 150 | 103 | 112 | 81 | 81 | 60 | 33 | 24 | 11 | 5 | 1 | 2 | 2 | 7 |
| Females | 1,152 | 481 | 29 | 117 | 18 | 103 | 98 | 71 | 54 | 63 | 45 | 26 | 18 | 11 | 5 | 6 | 1 | 1 | 2 | 3 | |
| Whakatane— | |||||||||||||||||||||
| Unmarried | Males | 370 | 208 | 8 | 36 | 8 | 24 | 23 | 19 | 16 | 14 | 5 | 5 | 1 | 1 | … | 1 | … | … | … | 1 |
| Females | 246 | 190 | 13 | 24 | 4 | 7 | 5 | 3 | … | … | … | … | … | … | … | … | … | … | … | … | |
| Married | Males | 137 | … | … | 1 | … | 4 | 6 | 28 | 24 | 25 | 15 | 10 | 7 | 11 | 4 | 1 | 1 | … | … | … |
| Females | 129 | … | … | 3 | 5 | 14 | 25 | 30 | 16 | 13 | 9 | 6 | 3 | 4 | 1 | … | … | … | … | … | |
| Widowed | Males | 19 | … | … | … | … | … | … | 1 | 1 | 1 | 2 | 5 | 1 | 4 | 1 | 1 | 1 | … | … | 1 |
| Females | 11 | … | … | … | … | … | 1 | 1 | 1 | … | 2 | 2 | 3 | … | … | 1 | … | … | … | … | |
| Unspecified | Males | 1 | … | … | … | … | … | … | … | … | … | … | … | … | … | … | … | … | … | … | 1 |
| Females | … | … | … | … | … | … | … | … | … | … | … | … | … | … | … | … | … | … | … | … | |
| Total | Males | 527 | 208 | 8 | 37 | 8 | 28 | 29 | 48 | 41 | 40 | 22 | 20 | 9 | 16 | 5 | 3 | 2 | … | … | 3 |
| Females | 386 | 190 | 13 | 27 | 9 | 21 | 31 | 34 | 17 | 13 | 11 | 8 | 6 | 4 | 1 | 1 | … | … | … | … | |
| Cook— | |||||||||||||||||||||
| Unmarried | Males | 712 | 295 | 17 | 56 | 14 | 83 | 79 | 51 | 38 | 36 | 15 | 15 | 6 | 4 | … | … | 2 | … | … | 1 |
| Females | 446 | 365 | 8 | 36 | 9 | 14 | 10 | 2 | … | 1 | 1 | … | … | … | … | … | … | … | … | … | |
| Married | Males | 296 | … | … | … | … | 8 | 49 | 61 | 66 | 50 | 24 | 15 | 10 | 6 | 5 | … | 1 | … | … | … |
| Females | 247 | … | … | 5 | 6 | 35 | 67 | 53 | 32 | 26 | 11 | 7 | 3 | … | 1 | 1 | … | … | … | … | |
Table VIII. Table VIII. Showing the Numbers and Ages of the Unmarried, Married, Widowed, and Unspecified, Males and Females (exclusive of Maoris), in each County—continued.
| Counties. | All Ages. | Under 14 years. | 14–15. | 15 and under 21. | 21 and under 40. | 40 and under 60. | 60 and under 80. | 80 and upwards. | Unspecified Children. | Unspecified Adults. | |||||||||||
|---|---|---|---|---|---|---|---|---|---|---|---|---|---|---|---|---|---|---|---|---|---|
| 15–20. | 20–21. | 21–25. | 25–30. | 30–35. | 35–40. | 40–45 | 45–50. | 50–55. | 55–60. | 60–65. | 65–70. | 70–75. | 75–80. | ||||||||
| Cook—continued. | |||||||||||||||||||||
| Widowed | Males | 25 | … | … | … | … | … | … | 2 | 5 | 5 | 2 | 2 | 1 | 2 | 2 | 1 | 1 | 2 | … | … |
| Females | 12 | … | … | … | … | … | … | 1 | … | … | … | 1 | 3 | 3 | … | 1 | 1 | 1 | … | 1 | |
| Unspecified | Males | 2 | … | … | … | … | 1 | … | … | … | … | … | … | … | … | … | … | … | … | … | 1 |
| Females | … | … | … | … | … | … | … | … | … | … | … | … | … | … | … | … | … | … | … | … | |
| Total | Males | 1,035 | 295 | 17 | 56 | 14 | 92 | 128 | 114 | 109 | 92 | 41 | 32 | 17 | 12 | 7 | 1 | 4 | 2 | … | 2 |
| Females | 705 | 365 | 8 | 41 | 15 | 49 | 77 | 56 | 32 | 27 | 12 | 8 | 6 | 3 | 1 | 2 | 1 | 1 | … | 1 | |
| Wairoa— | |||||||||||||||||||||
| Unmarried | Males | 438 | 199 | 14 | 43 | 12 | 36 | 40 | 21 | 20 | 28 | 11 | 6 | 1 | 4 | 2 | … | … | … | 1 | … |
| Females | 270 | 203 | 15 | 37 | … | 10 | … | 1 | 1 | 1 | 2 | … | … | … | … | … | … | … | … | … | |
| Married | Males | 141 | … | … | … | … | 5 | 13 | 23 | 32 | 24 | 16 | 12 | 6 | 4 | 4 | 1 | … | … | … | 1 |
| Females | 127 | … | … | 4 | 4 | 15 | 23 | 28 | 27 | 16 | 8 | 6 | 4 | … | … | … | … | … | … | … | |
| Widowed | Males | 18 | … | … | … | … | … | 1 | 3 | 1 | 3 | 3 | … | 3 | … | 1 | … | 2 | … | … | 1 |
| Females | 15 | … | … | … | 1 | 3 | 4 | … | … | 4 | 2 | … | … | … | 1 | … | … | … | … | … | |
| Unspecified | Males | … | … | … | … | … | … | … | … | … | … | … | … | … | … | … | … | … | … | … | … |
| Females | … | … | … | … | … | … | … | … | … | … | … | … | … | … | … | … | … | … | … | … | |
| Total | Males | 597 | 199 | 14 | 43 | 12 | 41 | 54 | 47 | 53 | 55 | 30 | 18 | 10 | 8 | 7 | 1 | 2 | … | 1 | 2 |
| Females | 412 | 203 | 15 | 41 | 5 | 28 | 29 | 29 | 18 | 21 | 12 | 6 | 4 | … | 1 | … | … | … | … | … | |
| East Taupo— | |||||||||||||||||||||
| Unmarried | Males | 68 | 8 | 1 | 3 | 2 | 6 | 12 | 9 | 8 | 8 | 4 | 3 | 1 | 1 | … | … | … | … | … | 2 |
| Females | 19 | 12 | … | 4 | 1 | 1 | 1 | … | … | … | … | … | … | … | … | … | … | … | … | … | |
| Married | Males | 22 | … | … | … | … | … | 3 | 6 | 2 | 4 | 2 | 1 | 2 | 1 | 1 | … | … | … | … | … |
| Females | 14 | … | … | … | … | 6 | 2 | 1 | 4 | … | 1 | … | … | … | … | … | … | … | … | … | |
| Widowed | Males | 3 | … | … | … | … | … | … | 1 | 1 | … | … | … | … | … | 1 | … | … | … | … | … |
| Females | … | … | … | … | … | … | … | … | … | … | … | … | … | … | … | … | … | … | … | … | |
| Unspecified | Males | … | … | … | … | … | … | … | … | … | … | … | … | … | … | … | … | … | … | … | … |
| Females | … | … | … | … | … | … | … | … | … | … | … | … | … | … | … | … | … | … | … | … | |
| Total | Males | 93 | 8 | 1 | 3 | 2 | 6 | 15 | 16 | 11 | 12 | 6 | 4 | 3 | 2 | 2 | … | … | … | … | 2 |
| Females | 33 | 12 | … | 4 | 1 | 7 | 3 | 1 | 4 | … | 1 | … | … | … | … | … | … | … | … | … | |
| West Taupo— | |||||||||||||||||||||
| Unmarried | Males | 7 | 1 | … | … | … | 1 | … | 1 | … | … | … | 4 | … | … | … | … | … | … | … | … |
| Females | 3 | 3 | … | … | … | … | … | … | … | … | … | … | … | … | … | … | … | … | … | … | |
| Married | Males | 1 | … | … | … | … | … | … | … | … | 1 | … | … | … | … | … | … | … | … | … | … |
| Females | … | … | … | … | … | … | … | … | … | … | … | … | … | … | … | … | … | … | … | … | |
| Widowed | Males | … | … | … | … | … | … | … | … | … | … | … | … | … | … | … | … | … | … | … | … |
| Females | … | … | … | … | … | … | … | … | … | … | … | … | … | … | … | … | … | … | … | … | |
Table VIII. Table VIII. Showing the Numbers and Ages of the Unmarried, Married, Widowed, and Unspecified, Males and Females (exclusive of Maoris), in each County—continued.
| Counties. | All Ages. | Under 14 years. | 14–15. | 15 and under 21. | 21 and under 40. | 40 and under 60. | 60 and under 80. | 80 and upwards. | Unspecified Children. | Unspecified Adults. | |||||||||||
|---|---|---|---|---|---|---|---|---|---|---|---|---|---|---|---|---|---|---|---|---|---|
| 15–20. | 20–21. | 21–25. | 25–30. | 30–35. | 35–40. | 40–45 | 45–50. | 50–55. | 55–60. | 60–65. | 65–70. | 70–75. | 75–80. | ||||||||
| Unspecified | Males | … | … | … | … | … | … | … | … | … | … | … | … | … | … | … | … | … | … | … | … |
| Females | … | … | … | … | … | … | … | … | … | … | … | … | … | … | … | … | … | … | … | … | |
| Total | Males | 8 | 1 | … | … | … | 1 | … | 1 | … | 1 | … | 4 | … | … | … | … | … | … | … | … |
| Females | 3 | 3 | … | … | … | … | … | … | … | … | … | … | … | … | … | … | … | … | … | … | |
| Waipa— | |||||||||||||||||||||
| Unmarried | Males | 1,181 | 649 | 43 | 132 | 23 | 106 | 81 | 49 | 23 | 27 | 13 | 12 | 12 | 2 | 2 | 2 | … | … | 3 | 2 |
| Females | 912 | 675 | 36 | 119 | 11 | 40 | 15 | 5 | 2 | 2 | 2 | 1 | … | 1 | … | … | 1 | … | 1 | 1 | |
| Married | Males | 480 | … | … | … | 2 | 6 | 51 | 67 | 89 | 98 | 54 | 45 | 35 | 17 | 4 | 9 | 3 | … | … | … |
| Females | 468 | … | … | 10 | 5 | 48 | 81 | 95 | 84 | 64 | 32 | 21 | 13 | 10 | 2 | 2 | 1 | … | … | … | |
| Widowed | Males | 24 | … | … | … | … | … | … | 1 | 2 | 2 | 3 | 4 | 1 | 1 | 4 | 5 | 1 | … | … | … |
| Females | 32 | … | … | … | … | 2 | 4 | … | 2 | 2 | 4 | … | 1 | 6 | 5 | 5 | … | 1 | … | … | |
| Unspecified | Males | … | … | … | … | … | … | … | … | … | … | … | … | … | … | … | … | … | … | … | … |
| Females | … | … | … | … | … | … | … | … | … | … | … | … | … | … | … | … | … | … | … | … | |
| Total | Males | 1,685 | 649 | 43 | 132 | 25 | 112 | 132 | 117 | 114 | 127 | 70 | 61 | 48 | 20 | 10 | 16 | 4 | … | 3 | 2 |
| Females | 1,412 | 675 | 36 | 129 | 16 | 90 | 100 | 100 | 88 | 68 | 38 | 22 | 14 | 17 | 7 | 7 | 2 | 1 | 1 | 1 | |
| Waikato— | |||||||||||||||||||||
| Unmarried | Males | 1,106 | 577 | 23 | 112 | 29 | 131 | 99 | 50 | 28 | 22 | 13 | 11 | 5 | 2 | 3 | 1 | … | … | … | … |
| Females | 808 | 573 | 25 | 108 | 20 | 50 | 19 | 4 | 3 | 4 | 1 | 1 | … | … | … | … | … | … | … | … | |
| Married | Males | 482 | … | … | … | 1 | 19 | 72 | 88 | 85 | 72 | 52 | 48 | 15 | 12 | 12 | 4 | … | … | … | 2 |
| Females | 418 | … | … | 2 | 7 | 57 | 107 | 71 | 56 | 44 | 35 | 18 | 9 | 9 | 1 | … | … | … | … | 2 | |
| Widowed | Males | 19 | … | … | … | … | … | 1 | 3 | … | 2 | 2 | 3 | 3 | 2 | 1 | … | 2 | … | … | … |
| Females | 24 | … | … | … | … | 1 | … | 2 | 3 | 2 | 3 | 3 | 5 | 3 | … | 2 | … | … | … | … | |
| Unspecified | Males | … | … | … | … | … | … | … | … | … | … | … | … | … | … | … | … | … | … | … | … |
| Females | … | … | … | … | … | … | … | … | … | … | … | … | … | … | … | … | … | … | … | … | |
| Total | Males | 1,607 | 577 | 23 | 112 | 30 | 150 | 172 | 141 | 113 | 96 | 67 | 62 | 23 | 16 | 16 | 5 | 2 | … | … | 2 |
| Females | 1,250 | 573 | 25 | 110 | 27 | 108 | 126 | 77 | 62 | 50 | 39 | 22 | 14 | 12 | 1 | 2 | … | … | … | 2 | |
| Raglan— | |||||||||||||||||||||
| Unmarried | Males | 337 | 179 | 11 | 35 | 11 | 31 | 14 | 16 | 9 | 8 | 11 | 7 | 2 | 2 | … | … | 1 | … | … | … |
| Females | 208 | 149 | 9 | 32 | 4 | 6 | 5 | 3 | … | … | … | … | … | … | … | … | … | … | … | … | |
| Married | Males | 105 | … | … | … | … | 2 | 11 | 11 | 11 | 26 | 12 | 14 | 5 | 5 | 3 | 2 | 1 | 1 | … | 1 |
| Females | 97 | … | … | 3 | … | 7 | 17 | 19 | 17 | 19 | 6 | 3 | 1 | 2 | 1 | 2 | … | … | … | … | |
| Widowed | Males | 18 | … | … | … | … | … | 1 | 2 | 2 | 3 | 1 | 2 | 1 | 2 | 2 | 1 | 1 | … | … | … |
| Females | 11 | … | … | … | … | 2 | 1 | … | 1 | 2 | 1 | 2 | … | … | 1 | 1 | … | … | … | … | |
| Unspecified | Males | … | … | … | … | … | … | … | … | … | … | … | … | … | … | … | … | … | … | … | … |
| Females | … | … | … | … | … | … | … | … | … | … | … | … | … | … | … | … | … | … | … | … | |
| Total | Males | 460 | 179 | 11 | 35 | 11 | 33 | 26 | 29 | 22 | 37 | 24 | 23 | 8 | 9 | 5 | 3 | 3 | 1 | … | 1 |
| Females | 316 | 149 | 9 | 35 | 4 | 15 | 23 | 22 | 18 | 21 | 7 | 5 | 1 | 2 | 2 | 3 | … | … | … | … | |
| Kawhia— | |||||||||||||||||||||
| Unmarried | Males | 36 | 29 | … | … | … | 3 | … | 1 | … | 1 | … | 1 | … | … | 1 | … | … | … | … | … |
| Females | 39 | 31 | 3 | 4 | … | … | 1 | … | … | … | … | … | … | … | … | … | … | … | … | … | |
| Married | Males | 19 | … | … | … | … | … | 6 | 1 | 5 | 1 | 4 | 1 | … | … | 1 | … | … | … | … | … |
| Females | 10 | … | … | … | … | 2 | 3 | 1 | … | 2 | 2 | … | … | … | … | … | … | … | … | … | |
| Widowed | Males | 2 | … | … | … | … | … | … | 1 | … | 1 | … | … | … | … | … | … | … | … | … | … |
| Females | … | … | … | … | … | … | … | … | … | … | … | … | … | … | … | … | … | … | … | … | |
Table VIII. Table VIII. Showing the Numbers and Ages of the Unmarried, Married, Widowed, and Unspecified, Males and Females (exclusive of Maoris), in each County—continued.
| Counties. | All Ages. | Under 14 years. | 14–15. | 15 and under 21. | 21 and under 40. | 40 and under 60. | 60 and under 80. | 80 and upwards. | Unspecified Children. | Unspecified Adults. | |||||||||||
|---|---|---|---|---|---|---|---|---|---|---|---|---|---|---|---|---|---|---|---|---|---|
| 15–20. | 20–21. | 21–25. | 25–30. | 30–35. | 35–40. | 40–45 | 45–50. | 50–55. | 55–60. | 60–65. | 65–70. | 70–75. | 75–80. | ||||||||
| Kawhia—continued. | |||||||||||||||||||||
| Unspecified | Males | 2 | … | … | … | … | … | … | … | … | 1 | … | … | … | 1 | … | … | … | … | … | … |
| Females | … | … | … | … | … | … | … | … | … | … | … | … | … | … | … | … | … | … | … | … | |
| Total | Males | 59 | 29 | … | … | … | 3 | 6 | 3 | 5 | 4 | 4 | 2 | … | 1 | 2 | … | … | … | … | … |
| Females | 49 | 31 | 3 | 4 | … | 3 | 3 | 1 | … | 2 | 2 | … | … | … | … | … | … | … | … | … | |
| Taranaki— | |||||||||||||||||||||
| Unmarried | Males | 2,832 | 1,525 | 79 | 273 | 47 | 297 | 264 | 127 | 78 | 48 | 44 | 20 | 5 | 9 | 3 | … | 1 | 1 | 1 | 10 |
| Females | 1,832 | 1,435 | 64 | 208 | 25 | 49 | 26 | 6 | 5 | 3 | 4 | 2 | … | … | 1 | … | … | … | 4 | … | |
| Married | Males | 1,032 | … | … | … | … | 37 | 135 | 152 | 168 | 207 | 139 | 71 | 55 | 34 | 21 | 5 | 5 | 1 | … | 2 |
| Females | 1,002 | … | … | 18 | 27 | 108 | 171 | 189 | 149 | 132 | 93 | 50 | 24 | 17 | 9 | 7 | 6 | … | … | 2 | |
| Widowed | Males | 65 | … | … | … | … | … | 3 | 1 | 2 | 8 | 9 | 13 | 5 | 6 | 6 | 6 | 1 | 3 | … | 2 |
| Females | 56 | … | … | 1 | … | … | 4 | 1 | 4 | 4 | 7 | 4 | 4 | 6 | 10 | 7 | 1 | 2 | … | 1 | |
| Unspecified | Males | 1 | … | … | … | … | … | … | … | … | … | … | … | … | … | … | … | … | … | … | 1 |
| Females | … | … | … | … | … | … | … | … | … | … | … | … | … | … | … | … | … | … | … | … | |
| Total | Males | 3,930 | 1,525 | 79 | 273 | 47 | 334 | 402 | 280 | 248 | 263 | 192 | 104 | 65 | 49 | 30 | 11 | 7 | 5 | 1 | 15 |
| Females | 2,890 | 1,435 | 64 | 227 | 52 | 157 | 201 | 196 | 158 | 139 | 104 | 56 | 28 | 23 | 20 | 14 | 7 | 2 | 4 | 3 | |
| Patea— | |||||||||||||||||||||
| Unmarried | Males | 2,467 | 1,096 | 47 | 206 | 56 | 242 | 294 | 162 | 133 | 101 | 52 | 36 | 10 | 7 | 4 | 1 | … | … | 1 | 19 |
| Females | 1,441 | 1,086 | 45 | 156 | 26 | 70 | 33 | 10 | 7 | 4 | 2 | 1 | 1 | … | … | … | … | … | … | … | |
| Married | Males | 941 | … | … | … | 1 | 26 | 129 | 174 | 213 | 182 | 80 | 59 | 31 | 22 | 11 | 4 | 3 | … | … | 6 |
| Females | 812 | … | 1 | 12 | 16 | 106 | 212 | 157 | 121 | 80 | 35 | 31 | 27 | 2 | 4 | 3 | … | … | … | 5 | |
| Widowed | Males | 77 | … | … | … | … | … | 1 | 5 | 10 | 10 | 12 | 7 | 14 | 4 | 4 | 4 | 3 | 2 | … | 1 |
| Females | 46 | … | … | … | … | … | 1 | 2 | 7 | 6 | 2 | 5 | 5 | 7 | 4 | 7 | … | … | … | … | |
| Unspecified | Males | 5 | … | … | … | … | 2 | 1 | … | … | … | … | … | … | … | … | … | … | … | … | 2 |
| Females | … | … | … | … | … | … | … | … | … | … | … | … | … | … | … | … | … | … | … | … | |
| Total | Males | 3,490 | 1,096 | 47 | 206 | 57 | 270 | 425 | 341 | 356 | 293 | 144 | 102 | 55 | 33 | 19 | 9 | 6 | 2 | 1 | 28 |
| Females | 2,299 | 1,086 | 46 | 168 | 42 | 176 | 246 | 169 | 135 | 90 | 39 | 37 | 33 | 9 | 8 | 10 | … | … | … | 5 | |
| Wanganui— | |||||||||||||||||||||
| Unmarried | Males | 1,396 | 683 | 40 | 166 | 43 | 125 | 114 | 71 | 43 | 33 | 27 | 22 | 10 | 10 | 1 | 4 | … | … | … | 4 |
| Females | 983 | 666 | 42 | 140 | 29 | 55 | 24 | 11 | 7 | 2 | 3 | 2 | 1 | … | … | … | 1 | … | … | … | |
| Married | Males | 493 | … | … | … | 1 | 21 | 60 | 86 | 72 | 90 | 59 | 40 | 24 | 22 | 12 | 2 | 2 | 1 | … | 1 |
| Females | 496 | … | … | 13 | 6 | 57 | 91 | 85 | 64 | 64 | 48 | 29 | 9 | 22 | 5 | 1 | … | 1 | … | 1 | |
| Widowed | Males | 37 | … | … | … | … | … | … | 2 | 4 | 6 | 6 | 10 | 2 | 2 | 2 | 1 | 2 | … | … | … |
| Females | 42 | … | … | … | … | … | 4 | 2 | 5 | 3 | 3 | 7 | 4 | 5 | 3 | 2 | 4 | … | … | … | |
Table VIII. Table VIII. Showing the Numbers and Ages of the Unmarried, Married, Widowed, and Unspecified, Males and Females (exclusive of Maoris), in each County—continued.
| Counties. | All Ages. | Under 14 years. | 14–15. | 15 and under 21. | 21 and under 40. | 40 and under 60. | 60 and under 80. | 80 and upwards. | Unspecified Children. | Unspecified Adults. | |||||||||||
|---|---|---|---|---|---|---|---|---|---|---|---|---|---|---|---|---|---|---|---|---|---|
| 15–20. | 20–21. | 21–25. | 25–30. | 30–35. | 35–40. | 40–45 | 45–50. | 50–55. | 55–60. | 60–65. | 65–70. | 70–75. | 75–80. | ||||||||
| Unspecified | Males | 9 | … | … | … | 1 | … | 3 | 2 | … | … | 1 | … | … | … | … | … | … | … | … | 2 |
| Females | … | … | … | … | … | … | … | … | … | … | … | … | … | … | … | … | … | … | … | … | |
| Total | Males | 1,935 | 683 | 40 | 166 | 45 | 146 | 177 | 161 | 119 | 129 | 93 | 72 | 36 | 34 | 15 | 7 | 4 | 1 | … | 7 |
| Females | 1,521 | 666 | 42 | 153 | 35 | 112 | 119 | 98 | 76 | 69 | 54 | 38 | 14 | 27 | 8 | 3 | 5 | 1 | … | 1 | |
| Rangitikei— | |||||||||||||||||||||
| Unmarried | Males | 1,322 | 699 | 39 | 154 | 32 | 117 | 104 | 49 | 30 | 40 | 28 | 9 | 5 | 5 | 4 | 3 | 2 | 1 | … | 1 |
| Females | 994 | 686 | 42 | 165 | 22 | 40 | 19 | 8 | 3 | 4 | 2 | … | 1 | 2 | … | … | … | … | … | … | |
| Married | Males | 469 | … | … | … | … | 15 | 57 | 75 | 75 | 92 | 50 | 40 | 25 | 22 | 10 | 2 | 3 | 1 | … | 2 |
| Females | 446 | … | … | 12 | 3 | 57 | 89 | 61 | 72 | 56 | 35 | 29 | 13 | 13 | 5 | 1 | … | … | … | … | |
| Widowed | Males | 37 | … | … | … | … | 1 | 2 | … | 1 | 2 | 4 | 6 | 4 | 3 | 5 | 3 | 3 | 3 | … | … |
| Females | 43 | … | … | … | … | 1 | … | 3 | 5 | 6 | 2 | 4 | 7 | 6 | 1 | 5 | 2 | … | … | 1 | |
| Unspecified | Males | … | … | … | … | … | … | … | … | … | … | … | … | … | … | … | … | … | … | … | … |
| Females | … | … | … | … | … | … | … | … | … | … | … | … | … | … | … | … | … | … | … | … | |
| Total | Males | 1,828 | 699 | 39 | 154 | 32 | 133 | 163 | 124 | 106 | 134 | 82 | 55 | 34 | 30 | 19 | 8 | 8 | 5 | … | 3 |
| Females | 1,483 | 686 | 42 | 177 | 25 | 98 | 108 | 72 | 80 | 66 | 39 | 33 | 21 | 21 | 6 | 6 | 2 | … | … | 1 | |
| Manawatu— | |||||||||||||||||||||
| Unmarried | Males | 2,912 | 1,654 | 79 | 296 | 60 | 232 | 215 | 116 | 81 | 68 | 48 | 32 | 10 | 4 | 6 | 1 | 1 | … | … | 9 |
| Females | 2,050 | 1,625 | 84 | 212 | 24 | 61 | 26 | 8 | 6 | 3 | … | … | 1 | … | … | … | … | … | … | … | |
| Married | Males | 1,157 | … | … | 1 | 2 | 38 | 181 | 208 | 239 | 186 | 126 | 79 | 46 | 29 | 7 | 7 | 3 | 3 | … | 2 |
| Females | 1,117 | … | … | 31 | 18 | 138 | 237 | 210 | 170 | 128 | 80 | 50 | 26 | 17 | 6 | 2 | 3 | … | … | 1 | |
| Widowed | Males | 75 | … | … | … | … | … | 3 | 4 | 12 | 9 | 6 | 12 | 8 | 9 | 6 | 3 | 2 | … | … | 1 |
| Females | 58 | … | … | … | … | 1 | 3 | 2 | 5 | 5 | 5 | 9 | 4 | 7 | 3 | 5 | 4 | 5 | … | … | |
| Unspecified | Males | 3 | … | … | … | … | … | … | … | … | 1 | … | … | … | … | … | … | … | … | … | 2 |
| Females | … | … | … | … | … | … | … | … | … | … | … | … | … | … | … | … | … | … | … | … | |
| Total | Males | 4,147 | 1,654 | 79 | 297 | 62 | 270 | 399 | 328 | 332 | 264 | 180 | 123 | 64 | 42 | 19 | 11 | 6 | 3 | … | 14 |
| Females | 3,225 | 1,625 | 84 | 243 | 42 | 200 | 266 | 220 | 181 | 136 | 85 | 59 | 31 | 24 | 9 | 7 | 7 | 5 | … | 1 | |
| Hutt— | |||||||||||||||||||||
| Unmarried | Males | 2,892 | 1,696 | 92 | 349 | 48 | 240 | 185 | 72 | 58 | 45 | 29 | 13 | 7 | 7 | 2 | 2 | … | 1 | 9 | 37 |
| Females | 2,328 | 1,645 | 95 | 335 | 39 | 119 | 35 | 22 | 13 | 8 | … | 3 | 1 | 1 | … | 3 | 2 | … | 6 | 1 | |
| Married | Males | 1,213 | … | … | … | 2 | 51 | 192 | 203 | 178 | 173 | 111 | 93 | 84 | 40 | 27 | 27 | 14 | 8 | … | 10 |
| Females | 1,220 | … | … | 32 | 17 | 149 | 235 | 181 | 176 | 136 | 82 | 75 | 53 | 32 | 29 | 10 | 3 | 2 | … | 8 | |
| Widowed | Males | 80 | … | … | … | … | 1 | … | 4 | 6 | 9 | 7 | 9 | 10 | 8 | 6 | 9 | 4 | 6 | … | 1 |
| Females | 110 | … | … | … | … | 1 | 1 | 11 | 9 | 10 | 8 | 15 | 13 | 10 | 5 | 14 | 9 | 2 | … | 2 | |
| Unspecified | Males | 15 | … | … | 1 | … | 3 | 1 | 2 | … | 1 | … | 2 | … | … | … | … | 1 | … | … | 4 |
| Females | … | … | … | … | … | … | … | … | … | … | … | … | … | … | … | … | … | … | … | … | |
| Total | Males | 4,200 | 1,696 | 92 | 350 | 50 | 295 | 378 | 281 | 242 | 228 | 147 | 117 | 101 | 55 | 35 | 38 | 19 | 15 | 9 | 52 |
| Females | 3,658 | 1,645 | 95 | 367 | 56 | 269 | 271 | 214 | 198 | 154 | 90 | 93 | 67 | 43 | 34 | 27 | 14 | 4 | 6 | 11 | |
| Wairarapa West— | |||||||||||||||||||||
| Unmarried | Males | 2,203 | 1,305 | 50 | 254 | 31 | 163 | 145 | 95 | 52 | 41 | 25 | 26 | 6 | 5 | 2 | … | 1 | … | … | 2 |
| Females | 1,669 | 1,253 | 66 | 224 | 24 | 62 | 24 | 5 | 4 | 1 | … | 1 | … | 1 | 2 | … | … | … | … | … | |
| Married | Males | 883 | … | … | … | … | 30 | 121 | 158 | 167 | 149 | 98 | 62 | 44 | 27 | 16 | 7 | 1 | … | … | 3 |
| Females | 872 | … | 1 | 11 | 20 | 100 | 173 | 165 | 125 | 106 | 66 | 42 | 24 | 20 | 12 | 3 | 1 | … | … | 3 | |
| Widowed | Males | 73 | … | … | … | … | 1 | 5 | 5 | 7 | 6 | 12 | 12 | 7 | 8 | 3 | 4 | 1 | 2 | … | … |
| Females | 51 | … | … | … | … | 1 | 3 | 5 | 2 | 3 | 5 | 6 | 4 | 9 | 7 | 2 | 2 | 2 | … | … | |
Table VIII. Table VIII. Showing the Numbers and Ages of the Unmarried, Married, Widowed, and Unspecified, Males and Females (exclusive of Maoris), in each County—continued.
| Counties. | All Ages. | Under 14 years. | 14–15. | 15 and under 21. | 21 and under 40. | 40 and under 60. | 60 and under 80. | 80 and upwards. | Unspecified Children. | Unspecified Adults. | |||||||||||
|---|---|---|---|---|---|---|---|---|---|---|---|---|---|---|---|---|---|---|---|---|---|
| 15–20. | 20–21. | 21–25. | 25–30. | 30–35. | 35–40. | 40–45 | 45–50. | 50–55. | 55–60. | 60–65. | 65–70. | 70–75. | 75–80. | ||||||||
| Wairarapa West—continued. | |||||||||||||||||||||
| Unspecified | Males | 8 | … | … | … | … | 2 | 1 | 1 | 1 | … | … | 1 | 1 | … | … | … | … | … | … | 1 |
| Females | … | … | … | … | … | … | … | … | … | … | … | … | … | … | … | … | … | … | … | … | |
| Total | Males | 3,167 | 1,305 | 50 | 254 | 31 | 196 | 272 | 259 | 227 | 196 | 135 | 101 | 58 | 40 | 21 | 11 | 3 | 2 | … | 6 |
| Females | 2,592 | 1,253 | 67 | 235 | 44 | 163 | 200 | 175 | 131 | 110 | 71 | 49 | 28 | 30 | 21 | 5 | 3 | 2 | … | 5 | |
| Wairarapa East— | |||||||||||||||||||||
| Unmarried | Males | 822 | 221 | 10 | 78 | 12 | 123 | 143 | 76 | 55 | 51 | 29 | 12 | 5 | 3 | 2 | 1 | … | … | … | 1 |
| Females | 274 | 193 | 9 | 41 | 7 | 16 | 4 | 2 | 1 | 1 | … | … | … | … | … | … | … | … | … | … | |
| Married | Males | 192 | … | … | 1 | … | 6 | 28 | 33 | 46 | 28 | 21 | 11 | 8 | 6 | 1 | 1 | … | … | … | 2 |
| Females | 147 | … | … | 4 | 5 | 19 | 29 | 30 | 22 | 12 | 14 | 7 | 2 | … | 1 | … | 1 | … | … | 1 | |
| Widowed | Males | 32 | … | … | … | … | … | 3 | 4 | … | 8 | 4 | 2 | 3 | 3 | 2 | 2 | … | 1 | … | … |
| Females | 8 | … | … | … | … | … | … | 2 | 2 | 1 | 1 | … | … | … | 1 | 1 | … | … | … | … | |
| Unspecified | Males | … | … | … | … | … | … | … | … | … | … | … | … | … | … | … | … | … | … | … | … |
| Females | … | … | … | … | … | … | … | … | … | … | … | … | … | … | … | … | … | … | … | … | |
| Total | Males | 1,046 | 221 | 10 | 79 | 12 | 129 | 174 | 113 | 101 | 87 | 54 | 25 | 16 | 12 | 5 | 4 | … | 1 | … | 3 |
| Females | 429 | 193 | 9 | 45 | 12 | 35 | 33 | 34 | 25 | 114 | 15 | 7 | 2 | … | 2 | 1 | 1 | … | … | 1 | |
| Waipawa— | |||||||||||||||||||||
| Unmarried | Males | 2,440 | 1,276 | 65 | 234 | 51 | 194 | 217 | 123 | 96 | 85 | 35 | 21 | 12 | 10 | 3 | 2 | … | … | 7 | 9 |
| Females | 1,503 | 1,186 | 57 | 176 | 19 | 30 | 17 | 6 | 3 | 1 | 1 | … | … | … | … | … | … | … | 3 | 4 | |
| Married | Males | 919 | … | … | … | 2 | 31 | 117 | 166 | 182 | 160 | 122 | 63 | 32 | 27 | 10 | … | 1 | 2 | … | 4 |
| Females | 908 | … | … | 29 | 18 | 88 | 161 | 181 | 144 | 115 | 76 | 57 | 21 | 8 | 3 | 2 | … | … | … | 5 | |
| Widowed | Males | 41 | … | … | … | … | … | 4 | 4 | 4 | 4 | 5 | 4 | 5 | 3 | 3 | 2 | 1 | 1 | … | 1 |
| Females | 45 | … | … | … | … | 1 | 3 | 5 | 5 | 2 | 6 | 5 | 6 | 5 | 1 | 5 | 1 | … | … | … | |
| Unspecified | Males | 11 | … | … | … | … | 1 | 1 | 1 | … | … | … | … | 1 | … | … | … | … | … | … | 7 |
| Females | … | … | … | … | … | … | … | … | … | … | … | … | … | … | … | … | … | … | … | … | |
| Total | Males | 3,411 | 1,276 | 65 | 234 | 53 | 226 | 339 | 294 | 282 | 249 | 162 | 88 | 50 | 40 | 16 | 4 | 2 | 3 | 7 | 21 |
| Females | 2,456 | 1,186 | 57 | 205 | 37 | 119 | 181 | 192 | 152 | 118 | 83 | 62 | 27 | 13 | 4 | 7 | 1 | … | 3 | 9 | |
| Hawke's Bay— | |||||||||||||||||||||
| Unmarried | Males | 2,090 | 927 | 42 | 214 | 48 | 222 | 207 | 134 | 98 | 85 | 36 | 26 | 10 | 6 | 5 | 3 | … | 1 | … | 26 |
| Females | 1,275 | 926 | 39 | 172 | 28 | 57 | 28 | 11 | 3 | 4 | 1 | 3 | 2 | 1 | … | … | … | … | … | … | |
| Married | Males | 712 | … | … | … | … | 25 | 97 | 143 | 146 | 113 | 69 | 56 | 18 | 22 | 10 | 8 | … | 2 | … | 3 |
| Females | 690 | … | … | 13 | 17 | 83 | 164 | 127 | 107 | 69 | 49 | 20 | 15 | 11 | 8 | 4 | … | 1 | … | 2 | |
| Widowed | Males | 51 | … | … | … | … | … | 1 | 5 | 4 | 9 | 10 | 5 | 4 | 2 | 6 | 3 | 1 | 1 | … | … |
| Females | 57 | … | … | … | … | … | … | 7 | 8 | 5 | 5 | 7 | 2 | 8 | 8 | 2 | 3 | 2 | … | … | |
Table VIII. Table VIII. Showing the Numbers and Ages of the Unmarried, Married, Widowed, and Unspecified, Males and Females (exclusive of Maoris), in each County—continued.
| Counties. | All Ages. | Under 14 years. | 14–15. | 15 and under 21. | 21 and under 40. | 40 and under 60. | 60 and under 80. | 80 and upwards. | Unspecified Children. | Unspecified Adults. | |||||||||||
|---|---|---|---|---|---|---|---|---|---|---|---|---|---|---|---|---|---|---|---|---|---|
| 15–20. | 20–21. | 21–25. | 25–30. | 30–35. | 35–40. | 40–45 | 45–50. | 50–55. | 55–60. | 60–65. | 65–70. | 70–75. | 75–80. | ||||||||
| Unspecified | Males | 4 | … | … | … | … | … | 1 | … | … | … | … | … | … | … | … | … | … | … | … | 3 |
| Females | … | … | … | … | … | … | … | … | … | … | … | … | … | … | … | … | … | … | … | … | |
| Total | Males | 2,857 | 927 | 42 | 214 | 48 | 247 | 306 | 282 | 248 | 207 | 115 | 87 | 32 | 30 | 21 | 14 | 1 | 4 | … | 32 |
| Females | 2,022 | 926 | 39 | 185 | 45 | 140 | 192 | 145 | 118 | 78 | 55 | 30 | 19 | 20 | 16 | 6 | 3 | 3 | … | 2 | |
| Sounds— | |||||||||||||||||||||
| Unmarried | Males | 262 | 134 | 6 | 35 | 2 | 25 | 17 | 10 | 9 | 6 | 9 | 3 | 3 | 1 | 2 | … | … | … | … | … |
| Females | 158 | 126 | 6 | 21 | 1 | 3 | … | 1 | … | … | … | … | … | … | … | … | … | … | … | … | |
| Married | Males | 92 | … | … | … | … | 3 | 15 | 15 | 19 | 14 | 12 | 5 | 1 | 4 | 1 | 2 | 1 | … | … | … |
| Females | 82 | … | … | 5 | 1 | 10 | 18 | 16 | 10 | 9 | 7 | 3 | 1 | 1 | … | 1 | … | … | … | … | |
| Widowed | Males | 10 | … | … | … | … | 1 | 1 | 1 | 2 | … | 1 | 2 | … | 2 | … | … | … | … | … | … |
| Females | 1 | … | … | … | … | … | … | … | … | … | … | … | 1 | … | … | … | … | … | … | … | |
| Unspecified | Males | … | … | … | … | … | … | … | … | … | … | … | … | … | … | … | … | … | … | … | … |
| Females | … | … | … | … | … | … | … | … | … | … | … | … | … | … | … | … | … | … | … | … | |
| Total | Males | 364 | 134 | 6 | 35 | 2 | 29 | 33 | 26 | 30 | 20 | 22 | 10 | 4 | 7 | 3 | 2 | 1 | … | … | … |
| Females | 241 | 126 | 6 | 26 | 2 | 13 | 18 | 17 | 10 | 9 | 7 | 3 | 2 | 1 | … | 1 | … | … | … | … | |
| Marlborough— | |||||||||||||||||||||
| Unmarried | Males | 2,018 | 931 | 48 | 236 | 53 | 197 | 164 | 95 | 88 | 77 | 51 | 33 | 13 | 20 | 6 | 3 | 1 | 1 | … | 1 |
| Females | 1,208 | 946 | 48 | 137 | 21 | 36 | 13 | 3 | 1 | … | 1 | 1 | … | … | … | … | … | 1 | … | … | |
| Married | Males | 685 | … | … | … | … | 24 | 99 | 94 | 123 | 112 | 87 | 66 | 29 | 24 | 12 | 8 | 3 | 2 | … | 2 |
| Females | 655 | … | … | 18 | 17 | 88 | 133 | 109 | 91 | 65 | 49 | 24 | 26 | 16 | 9 | 5 | 1 | 1 | … | 3 | |
| Widowed | Males | 58 | … | … | … | … | … | 1 | 4 | 6 | 8 | 5 | 11 | 5 | 8 | 2 | 3 | 2 | 3 | … | … |
| Females | 50 | … | … | … | … | 2 | 1 | 3 | 7 | 5 | 5 | 3 | 6 | 11 | 5 | 1 | 1 | … | … | … | |
| Unspecified | Males | 6 | … | … | … | … | 2 | 1 | … | … | … | … | … | … | … | … | … | … | … | … | 3 |
| Females | … | … | … | … | … | … | … | … | … | … | … | … | … | … | … | … | … | … | … | … | |
| Total | Males | 2,767 | 931 | 48 | 236 | 53 | 223 | 265 | 193 | 217 | 197 | 143 | 110 | 47 | 52 | 20 | 14 | 6 | 6 | … | 6 |
| Females | 1,913 | 946 | 48 | 155 | 38 | 126 | 147 | 115 | 99 | 70 | 55 | 28 | 32 | 27 | 14 | 6 | 2 | 2 | … | 3 | |
| Kaikoura— | |||||||||||||||||||||
| Unmarried | Males | 499 | 242 | 9 | 42 | 14 | 38 | 49 | 31 | 27 | 19 | 13 | 6 | 2 | 4 | 2 | 1 | … | … | … | … |
| Females | 280 | 212 | 4 | 43 | 5 | 12 | 1 | 1 | … | … | 1 | … | 1 | … | … | … | … | … | … | … | |
| Married | Males | 158 | … | … | … | … | 6 | 25 | 24 | 27 | 31 | 20 | 11 | 8 | 4 | 2 | … | … | … | … | … |
| Females | 145 | … | … | 5 | 5 | 23 | 31 | 26 | 19 | 16 | 6 | 8 | 4 | 1 | … | 1 | … | … | … | … | |
| Widowed | Males | 12 | … | … | … | … | … | … | … | 1 | 1 | 1 | 4 | 1 | 1 | 1 | 1 | … | 1 | … | … |
| Females | 9 | … | … | … | … | 1 | 2 | 2 | … | 2 | 1 | … | … | … | … | … | … | 1 | … | … | |
| Unspecified | Males | 2 | … | … | … | … | … | … | … | … | … | … | 1 | 1 | … | … | … | … | … | … | … |
| Females | … | … | … | … | … | … | … | … | … | … | … | … | … | … | … | … | … | … | … | … | |
| Total | Males | 671 | 242 | 9 | 42 | 14 | 44 | 74 | 55 | 55 | 51 | 34 | 22 | 12 | 9 | 5 | 2 | … | 1 | … | … |
| Females | 434 | 212 | 4 | 48 | 10 | 36 | 34 | 29 | 19 | 18 | 8 | 8 | 5 | 1 | … | 1 | … | 1 | … | … | |
| Waimea— | |||||||||||||||||||||
| Unmarried | Males | 2,735 | 1,648 | 108 | 393 | 63 | 198 | 117 | 57 | 40 | 40 | 32 | 12 | 9 | 4 | 5 | 2 | … | … | 1 | 6 |
| Females | 2,387 | 1,648 | 85 | 376 | 55 | 104 | 51 | 25 | 15 | 10 | 5 | 4 | 1 | 1 | 2 | … | … | 1 | 3 | 1 | |
| Married | Males | 1,095 | … | … | … | … | 26 | 111 | 139 | 172 | 142 | 127 | 117 | 65 | 81 | 54 | 31 | 18 | 8 | … | 4 |
| Females | 1,098 | … | … | 14 | 18 | 99 | 151 | 174 | 139 | 117 | 104 | 93 | 75 | 38 | 33 | 22 | 10 | 6 | … | 5 | |
| Widowed | Males | 98 | … | … | … | … | … | 1 | 3 | 7 | 1 | 9 | 15 | 11 | 12 | 10 | 11 | 13 | 3 | … | 2 |
| Females | 120 | … | … | … | … | 2 | 6 | 3 | 6 | 7 | 6 | 14 | 9 | 10 | 16 | 12 | 15 | 13 | … | 1 | |
Table VIII. Table VIII. Showing the Numbers and Ages of the Unmarried, Married, Widowed, and Unspecified, Males and Females (exclusive of Maoris), in each County—continued.
| Counties. | All Ages. | Under 14 years. | 14–15. | 15 and under 21. | 21 and under 40. | 40 and under 60. | 60 and under 80. | 80 and upwards. | Unspecified Children. | Unspecified Adults. | |||||||||||
|---|---|---|---|---|---|---|---|---|---|---|---|---|---|---|---|---|---|---|---|---|---|
| 15–20. | 20–21. | 21–25. | 25–30. | 30–35. | 35–40. | 40–45 | 45–50. | 50–55. | 55–60. | 60–65. | 65–70. | 70–75. | 75–80. | ||||||||
| Waimea—continued. | |||||||||||||||||||||
| Unspecified | Males | … | … | … | … | … | … | … | … | … | … | … | … | … | … | … | … | … | … | … | … |
| Females | 2 | … | … | … | … | … | … | … | … | … | … | … | … | 1 | … | 1 | … | … | … | … | |
| Total | Males | 3,928 | 1,648 | 108 | 393 | 63 | 224 | 229 | 199 | 219 | 183 | 168 | 144 | 85 | 97 | 69 | 44 | 31 | 11 | 1 | 12 |
| Females | 3,607 | 1,648 | 85 | 390 | 73 | 205 | 208 | 202 | 160 | 134 | 115 | 111 | 85 | 50 | 51 | 35 | 25 | 20 | 3 | 7 | |
| Collingwood— | |||||||||||||||||||||
| Unmarried | Males | 647 | 348 | 19 | 75 | 9 | 44 | 27 | 16 | 25 | 27 | 21 | 15 | 6 | 8 | 1 | … | … | … | … | 6 |
| Females | 470 | 343 | 16 | 60 | 11 | 24 | 7 | 4 | 1 | … | … | 1 | … | 1 | … | … | … | … | … | 2 | |
| Married | Males | 254 | … | … | … | 1 | 10 | 28 | 32 | 43 | 35 | 36 | 34 | 10 | 9 | 6 | 5 | 2 | 2 | … | 1 |
| Females | 233 | … | … | 7 | 8 | 30 | 42 | 36 | 28 | 26 | 21 | 10 | 5 | 12 | 3 | 3 | … | 1 | … | 1 | |
| Widowed | Males | 25 | … | … | … | … | … | … | 2 | … | 1 | 2 | 5 | 1 | 4 | 6 | 2 | 2 | … | … | … |
| Females | 14 | … | … | … | … | … | … | … | … | 3 | 1 | 2 | 2 | 2 | 2 | 1 | 1 | … | … | … | |
| Unspecified | Males | … | … | … | … | … | … | … | … | … | … | … | … | … | … | … | … | … | … | … | … |
| Females | … | … | … | … | … | … | … | … | … | … | … | … | … | … | … | … | … | … | … | … | |
| Total | Males | 926 | 348 | 19 | 75 | 10 | 54 | 55 | 50 | 68 | 63 | 59 | 54 | 17 | 21 | 13 | 7 | 4 | 2 | … | 7 |
| Females | 717 | 343 | 16 | 67 | 19 | 54 | 49 | 40 | 29 | 29 | 22 | 13 | 7 | 15 | 5 | 4 | 1 | 1 | … | 3 | |
| Buller— | |||||||||||||||||||||
| Unmarried | Males | 1,188 | 512 | 15 | 76 | 11 | 44 | 58 | 49 | 100 | 137 | 91 | 50 | 23 | 12 | 4 | … | 2 | … | … | 4 |
| Females | 587 | 501 | 12 | 52 | 6 | 5 | 3 | 2 | 1 | 4 | … | … | … | 1 | … | … | … | … | … | … | |
| Married | Males | 390 | … | … | … | … | 7 | 26 | 45 | 87 | 88 | 70 | 41 | 11 | 11 | 2 | 1 | 1 | … | … | … |
| Females | 326 | … | … | 8 | 5 | 32 | 52 | 53 | 78 | 49 | 26 | 12 | 5 | 4 | 2 | … | … | … | … | … | |
| Widowed | Males | 39 | … | … | … | … | … | 1 | 1 | 7 | 10 | 7 | 4 | 3 | 5 | … | 1 | … | … | … | … |
| Females | 14 | … | … | … | 1 | 1 | … | 1 | 3 | … | 1 | 3 | 1 | 1 | … | 1 | 1 | … | … | … | |
| Unspecified | Males | 1 | … | … | … | … | … | … | … | … | … | … | 1 | … | … | … | … | … | … | … | … |
| Females | … | … | … | … | … | … | … | … | … | … | … | … | … | … | … | … | … | … | … | … | |
| Total | Males | 1,618 | 512 | 15 | 76 | 11 | 51 | 85 | 95 | 194 | 235 | 168 | 96 | 37 | 28 | 6 | 2 | 3 | … | … | 4 |
| Females | 927 | 501 | 12 | 60 | 12 | 38 | 55 | 56 | 82 | 53 | 27 | 15 | 6 | 6 | 2 | 1 | 1 | … | … | … | |
| Inangahua— | |||||||||||||||||||||
| Unmarried | Males | 1,607 | 459 | 15 | 60 | 28 | 84 | 176 | 162 | 177 | 219 | 116 | 69 | 18 | 12 | 2 | 2 | … | … | … | 8 |
| Females | 556 | 444 | 15 | 51 | 7 | 15 | 15 | 5 | … | 1 | 2 | 1 | … | … | … | … | … | … | … | … | |
| Married | Males | 375 | … | … | … | … | 2 | 28 | 48 | 96 | 95 | 63 | 26 | 11 | 4 | 1 | … | 1 | … | … | … |
| Females | 335 | … | … | 8 | 5 | 35 | 73 | 71 | 65 | 43 | 20 | 8 | 6 | … | 1 | … | … | … | … | … | |
| Widowed | Males | 32 | … | … | … | … | … | 2 | 2 | 1 | 5 | 7 | 9 | 2 | 2 | 1 | … | 1 | … | … | … |
| Females | 21 | … | … | … | … | … | 1 | 3 | 3 | 2 | 4 | 3 | 1 | … | 2 | 1 | … | 1 | … | … | |
Table VIII. Table VIII. Showing the Numbers and Ages of the Unmarried, Married, Widowed, and Unspecified, Males and Females (exclusive of Maoris), in each County—continued.
| Counties. | All Ages. | Under 14 years. | 14–15. | 15 and under 21. | 21 and under 40. | 40 and under 60. | 60 and under 80. | 80 and upwards. | Unspecified Children. | Unspecified Adults. | |||||||||||
|---|---|---|---|---|---|---|---|---|---|---|---|---|---|---|---|---|---|---|---|---|---|
| 15–20. | 20–21. | 21–25. | 25–30. | 30–35. | 35–40. | 40–45 | 45–50. | 50–55. | 55–60. | 60–65. | 65–70. | 70–75. | 75–80. | ||||||||
| Unspecified | Males | 1 | … | … | … | … | 1 | … | … | … | … | … | … | … | … | … | … | … | … | … | … |
| Females | … | … | … | … | … | … | … | … | … | … | … | … | … | … | … | … | … | … | … | … | |
| Total | Males | 2,015 | 459 | 15 | 60 | 28 | 87 | 206 | 212 | 274 | 319 | 186 | 104 | 31 | 18 | 4 | 2 | 2 | … | … | 8 |
| Females | 912 | 444 | 15 | 59 | 12 | 50 | 89 | 79 | 68 | 46 | 26 | 12 | 7 | … | 3 | 1 | … | 1 | … | … | |
| Grey— | |||||||||||||||||||||
| Unmarried | Males | 2,701 | 744 | 19 | 102 | 45 | 145 | 224 | 237 | 320 | 386 | 251 | 127 | 50 | 34 | 10 | 2 | … | … | … | 5 |
| Females | 934 | 782 | 27 | 72 | 13 | 22 | 7 | 5 | 2 | 3 | 1 | … | … | … | … | … | … | … | … | … | |
| Married | Males | 618 | … | … | … | … | 8 | 28 | 84 | 147 | 146 | 106 | 61 | 17 | 12 | 5 | 2 | … | 1 | … | 1 |
| Females | 562 | … | … | 16 | 9 | 62 | 100 | 113 | 113 | 68 | 46 | 20 | 7 | 7 | … | 1 | … | … | … | … | |
| Widowed | Males | 64 | … | … | … | … | … | 1 | 1 | 4 | 11 | 17 | 9 | 11 | 3 | 5 | 1 | … | 1 | … | … |
| Females | 38 | … | … | … | … | … | 1 | 6 | 12 | 9 | 2 | 1 | 3 | … | 1 | 1 | 2 | … | … | … | |
| Unspecified | Males | 22 | … | … | … | … | … | 4 | 3 | 1 | 3 | 5 | 2 | 3 | … | … | … | … | 1 | … | … |
| Females | … | … | … | … | … | … | … | … | … | … | … | … | … | … | … | … | … | … | … | … | |
| Total | Males | 3,405 | 744 | 19 | 102 | 45 | 153 | 257 | 325 | 472 | 546 | 379 | 199 | 81 | 49 | 20 | 5 | … | 3 | … | 6 |
| Females | 1,534 | 782 | 27 | 88 | 22 | 84 | 108 | 124 | 127 | 80 | 49 | 21 | 10 | 7 | 1 | 2 | 2 | … | … | … | |
| Westland— | |||||||||||||||||||||
| Unmarried | Males | 2,789 | 880 | 31 | 121 | 28 | 120 | 195 | 193 | 309 | 359 | 276 | 157 | 72 | 23 | 14 | 2 | … | … | 1 | 8 |
| Females | 1,102 | 936 | 37 | 76 | 15 | 12 | 6 | 7 | 2 | 6 | 3 | 1 | … | … | … | … | … | … | 1 | … | |
| Married | Males | 724 | … | … | … | 1 | 6 | 34 | 43 | 146 | 208 | 146 | 82 | 23 | 22 | 8 | 1 | 2 | … | … | 2 |
| Females | 645 | … | … | 14 | 12 | 45 | 96 | 120 | 130 | 106 | 66 | 35 | 7 | 6 | 1 | 5 | … | … | … | 2 | |
| Widowed | Males | 74 | … | … | … | … | … | 1 | … | 11 | 10 | 15 | 10 | 12 | 8 | 2 | 2 | 1 | 2 | … | … |
| Females | 23 | … | … | … | … | … | 2 | 2 | 4 | 4 | 5 | 3 | 1 | 1 | 1 | … | … | … | … | … | |
| Unspecified | Males | 5 | … | … | … | … | … | … | … | … | 2 | … | 1 | … | … | … | … | … | … | … | 3 |
| Females | … | … | … | … | … | … | … | … | … | … | … | … | … | … | … | … | … | … | … | … | |
| Total | Males | 3,592 | 880 | 31 | 121 | 29 | 126 | 230 | 236 | 466 | 579 | 437 | 250 | 107 | 53 | 24 | 5 | 3 | 2 | 1 | 12 |
| Females | 1,770 | 936 | 37 | 90 | 27 | 57 | 104 | 129 | 136 | 116 | 74 | 39 | 8 | 7 | 2 | 5 | … | … | 1 | 2 | |
| Amuri— | |||||||||||||||||||||
| Unmarried | Males | 311 | 70 | 2 | 28 | 14 | 42 | 41 | 24 | 37 | 23 | 15 | 8 | 5 | 2 | … | … | … | … | … | … |
| Females | 82 | 58 | 1 | 10 | 4 | 7 | 1 | 1 | … | … | … | … | … | … | … | … | … | … | … | … | |
| Married | Males | 59 | … | … | … | … | 1 | 5 | 10 | 18 | 9 | 7 | 3 | 2 | 2 | 1 | 1 | … | … | … | … |
| Females | 48 | … | … | 1 | … | 8 | 12 | 9 | 10 | 6 | … | … | 1 | 1 | … | … | … | … | … | … | |
| Widowed | Males | 8 | … | … | … | … | … | … | … | 1 | 2 | 4 | … | … | 1 | … | … | … | … | … | … |
| Females | 5 | … | … | … | … | … | 1 | 2 | 1 | … | … | … | … | … | 1 | … | … | … | … | … | |
| Unspecified | Males | … | … | … | … | … | … | … | … | … | … | … | … | … | … | … | … | … | … | … | … |
| Females | … | … | … | … | … | … | … | … | … | … | … | … | … | … | … | … | … | … | … | … | |
| Total | Males | 378 | 70 | 2 | 28 | 14 | 43 | 46 | 34 | 56 | 34 | 26 | 11 | 7 | 5 | 1 | 1 | … | … | … | … |
| Females | 135 | 58 | 1 | 11 | 4 | 15 | 14 | 12 | 11 | 6 | … | … | 1 | 1 | 1 | … | … | … | … | … | |
| Cheviot— | |||||||||||||||||||||
| Unmarried | Males | 48 | 5 | … | 5 | … | 12 | 4 | 5 | 6 | 3 | 4 | 2 | … | 1 | 1 | … | … | … | … | … |
| Females | 15 | 7 | … | … | 1 | 2 | 4 | 1 | … | … | … | … | … | … | … | … | … | … | … | … | |
| Married | Males | 19 | … | … | … | … | 1 | 3 | 3 | 5 | 2 | 1 | 2 | 2 | … | … | … | … | … | … | … |
| Females | 10 | … | … | … | … | 4 | … | 3 | 2 | … | 1 | … | … | … | … | … | … | … | … | … | |
| Widowed | Males | 2 | … | … | … | … | … | … | … | … | 1 | … | … | … | … | 1 | … | … | … | … | … |
| Females | 2 | … | … | … | … | … | … | … | … | … | 1 | … | … | 1 | … | … | … | … | … | … | |
Table VIII. Table VIII. Showing the Numbers and Ages of the Unmarried, Married, Widowed, and Unspecified, Males and Females (exclusive of Maoris), in each County—continued.
| Counties. | All Ages. | Under 14 years. | 14–15. | 15 and under 21. | 21 and under 40. | 40 and under 60. | 60 and under 80. | 80 and upwards. | Unspecified Children. | Unspecified Adults. | |||||||||||
|---|---|---|---|---|---|---|---|---|---|---|---|---|---|---|---|---|---|---|---|---|---|
| 15–20. | 20–21. | 21–25. | 25–30. | 30–35. | 35–40. | 40–45 | 45–50. | 50–55. | 55–60. | 60–65. | 65–70. | 70–75. | 75–80. | ||||||||
| Cheviot—continued. | |||||||||||||||||||||
| Unspecified | Males | 6 | … | … | … | … | … | … | … | … | … | … | … | … | … | … | … | … | … | … | 6 |
| Females | … | … | … | … | … | … | … | … | … | … | … | … | … | … | … | … | … | … | … | … | |
| Total | Males | 75 | 5 | … | 5 | … | 13 | 7 | 8 | 11 | 6 | 5 | 4 | 2 | 1 | 2 | … | … | … | … | 6 |
| Females | 27 | 7 | … | … | 1 | 6 | 4 | 4 | 2 | … | 2 | … | … | 1 | … | … | … | … | … | … | |
| Ashley— | |||||||||||||||||||||
| Unmarried | Males | 4,683 | 2,681 | 152 | 579 | 118 | 362 | 300 | 146 | 109 | 102 | 52 | 35 | 12 | 16 | 4 | 2 | 2 | … | … | 11 |
| Females | 3,546 | 2,576 | 133 | 493 | 75 | 163 | 49 | 25 | 11 | 7 | 5 | 2 | … | 2 | 2 | … | … | … | 1 | 2 | |
| Married | Males | 1,758 | … | … | … | 4 | 50 | 185 | 231 | 286 | 353 | 261 | 156 | 97 | 66 | 38 | 20 | 3 | 3 | … | 5 |
| Females | 1,751 | … | … | 26 | 24 | 164 | 270 | 253 | 295 | 266 | 183 | 122 | 64 | 42 | 28 | 8 | 2 | 1 | … | 3 | |
| Widowed | Males | 104 | … | … | … | … | … | 1 | 5 | 4 | 13 | 17 | 9 | 15 | 12 | 10 | 6 | 5 | 7 | … | … |
| Females | 111 | … | … | … | … | 2 | 3 | 7 | 16 | 17 | 12 | 10 | 7 | 10 | 11 | 9 | 3 | 3 | … | 1 | |
| Unspecified | Males | 2 | … | … | … | … | … | … | … | … | … | 1 | … | … | … | 1 | … | … | … | … | … |
| Females | … | … | … | … | … | … | … | … | … | … | … | … | … | … | … | … | … | … | … | … | |
| Total | Males | 6,547 | 2,681 | 152 | 579 | 122 | 412 | 486 | 382 | 399 | 468 | 331 | 200 | 124 | 94 | 53 | 28 | 10 | 10 | … | 16 |
| Females | 5,408 | 2,576 | 133 | 519 | 99 | 329 | 322 | 285 | 322 | 290 | 200 | 134 | 71 | 54 | 40 | 17 | 5 | 4 | 1 | 6 | |
| Akaroa— | |||||||||||||||||||||
| Unmarried | Males | 1,588 | 913 | 63 | 190 | 37 | 136 | 105 | 37 | 37 | 28 | 23 | 7 | 4 | 3 | 2 | 3 | … | … | … | … |
| Females | 1,170 | 845 | 56 | 173 | 17 | 41 | 24 | 6 | 2 | 3 | … | 2 | 1 | … | … | … | … | … | … | … | |
| Married | Males | 593 | … | … | … | 1 | 29 | 76 | 94 | 94 | 106 | 68 | 45 | 35 | 25 | 11 | 4 | 3 | 1 | … | 1 |
| Females | 581 | … | … | 10 | 12 | 84 | 99 | 93 | 99 | 62 | 58 | 27 | 13 | 16 | 5 | 3 | … | … | … | … | |
| Widowed | Males | 40 | … | … | … | … | … | … | 1 | 2 | 7 | 5 | 7 | 6 | 5 | 2 | 1 | 2 | 1 | … | 1 |
| Females | 29 | … | … | … | … | 2 | … | … | 2 | 6 | 2 | 3 | 2 | 3 | 4 | 1 | 2 | 2 | … | … | |
| Unspecified | Males | 19 | … | … | … | 1 | 1 | 4 | 3 | 7 | 2 | 1 | … | … | … | … | … | … | … | … | … |
| Females | … | … | … | … | … | … | … | … | … | … | … | … | … | … | … | … | … | … | … | … | |
| Total | Males | 2,240 | 913 | 63 | 190 | 39 | 166 | 185 | 135 | 140 | 143 | 97 | 59 | 45 | 33 | 15 | 8 | 5 | 2 | … | 2 |
| Females | 1,780 | 845 | 56 | 183 | 29 | 127 | 123 | 99 | 103 | 71 | 60 | 32 | 16 | 19 | 9 | 4 | 2 | 2 | … | … | |
| Selwyn— | |||||||||||||||||||||
| Unmarried | Males | 12,616 | 7,490 | 414 | 1,570 | 293 | 987 | 779 | 375 | 225 | 210 | 124 | 67 | 27 | 21 | 13 | 4 | 4 | … | … | 13 |
| Females | 10,414 | 7,297 | 361 | 1,520 | 233 | 537 | 236 | 71 | 63 | 40 | 18 | 15 | 6 | 10 | 1 | 1 | 1 | … | … | 4 | |
| Married | Males | 5,234 | … | … | 2 | 5 | 171 | 695 | 829 | 868 | 993 | 643 | 436 | 240 | 187 | 92 | 43 | 21 | 6 | … | 3 |
| Females | 5,319 | … | … | 69 | 58 | 517 | 964 | 933 | 840 | 739 | 509 | 309 | 174 | 115 | 59 | 22 | 8 | 1 | … | 2 | |
| Widowed | Males | 270 | … | … | … | … | 2 | 10 | 16 | 21 | 32 | 34 | 35 | 22 | 28 | 21 | 24 | 14 | 10 | … | 1 |
| Females | 441 | … | … | … | … | 5 | 21 | 30 | 30 | 66 | 46 | 54 | 44 | 59 | 30 | 34 | 13 | 8 | … | 1 | |
Table VIII. Table VIII. Showing the Numbers and Ages of the Unmarried, Married, Widowed, and Unspecified, Males and Females (exclusive of Maoris), in each County—continued.
| Counties. | All Ages. | Under 14 years. | 14–15. | 15 and under 21. | 21 and under 40. | 40 and under 60. | 60 and under 80. | 80 and upwards. | Unspecified Children. | Unspecified Adults. | |||||||||||
|---|---|---|---|---|---|---|---|---|---|---|---|---|---|---|---|---|---|---|---|---|---|
| 15–20. | 20–21. | 21–25. | 25–30. | 30–35. | 35–40. | 40–45 | 45–50. | 50–55. | 55–60. | 60–65. | 65–70. | 70–75. | 75–80. | ||||||||
| Unspecified | Males | 28 | … | … | … | … | 2 | … | … | 1 | 4 | 1 | … | 1 | … | … | … | … | … | … | 19 |
| Females | 1 | … | … | … | … | … | 1 | … | … | … | … | … | … | … | … | … | … | … | … | … | |
| Total | Males | 18,148 | 7,490 | 414 | 1,572 | 298 | 1,162 | 1,484 | 1,220 | 1,115 | 1,239 | 802 | 538 | 290 | 236 | 126 | 71 | 39 | 16 | … | 36 |
| Females | 16,175 | 7,297 | 361 | 1,589 | 291 | 1,059 | 1,222 | 1,034 | 933 | 845 | 573 | 378 | 224 | 184 | 90 | 57 | 22 | 9 | … | 7 | |
| Ashburton | |||||||||||||||||||||
| Unmarried | Males | 3,263 | 1,423 | 68 | 268 | 88 | 403 | 397 | 220 | 156 | 128 | 53 | 34 | 6 | 7 | 4 | … | 1 | 1 | 1 | 5 |
| Females | 1,740 | 1,382 | 44 | 182 | 21 | 58 | 30 | 6 | 6 | 2 | 4 | 1 | 2 | … | … | … | … | … | … | 2 | |
| Married | Males | 1,058 | … | … | … | … | 43 | 151 | 213 | 220 | 189 | 102 | 77 | 24 | 23 | 7 | 3 | 1 | … | … | 5 |
| Females | 992 | … | … | 19 | 23 | 124 | 217 | 189 | 168 | 105 | 76 | 35 | 15 | 9 | 7 | 2 | … | … | … | 3 | |
| Widowed | Males | 52 | … | … | … | … | 1 | 5 | 6 | 8 | 10 | 4 | 3 | 4 | 5 | 3 | 2 | … | … | … | 1 |
| Females | 36 | … | … | … | 1 | … | 3 | 3 | 4 | 4 | 2 | 6 | 4 | 3 | 1 | 1 | 3 | … | … | 1 | |
| Unspecified | Males | 24 | … | … | … | … | 4 | 1 | 2 | 1 | 3 | 1 | 1 | … | … | … | … | … | … | … | 11 |
| Females | … | … | … | … | … | … | … | … | … | … | … | … | … | … | … | … | … | … | … | … | |
| Total | Males | 4,397 | 1,423 | 68 | 268 | 88 | 451 | 554 | 441 | 385 | 330 | 160 | 115 | 34 | 35 | 14 | 5 | 2 | 1 | 1 | 22 |
| Females | 2,768 | 1,382 | 44 | 201 | 45 | 182 | 250 | 198 | 178 | 111 | 82 | 42 | 21 | 12 | 8 | 3 | 3 | … | … | 6 | |
| Geraldine— | |||||||||||||||||||||
| Unmarried | Males | 4,924 | 2,697 | 124 | 488 | 100 | 433 | 446 | 223 | 154 | 106 | 63 | 38 | 13 | 9 | 8 | 2 | 2 | … | 3 | 15 |
| Females | 3,637 | 2,693 | 125 | 428 | 84 | 155 | 65 | 40 | 18 | 4 | 6 | 7 | 2 | 5 | … | … | … | … | 2 | 3 | |
| Married | Males | 1,953 | … | … | … | 2 | 67 | 290 | 337 | 387 | 376 | 229 | 115 | 63 | 40 | 26 | 7 | 1 | 2 | … | 11 |
| Females | 1,939 | … | 1 | 31 | 43 | 246 | 386 | 366 | 325 | 234 | 141 | 74 | 41 | 21 | 14 | 6 | 2 | … | … | 8 | |
| Widowed | Males | 103 | … | … | … | … | 1 | 6 | 7 | 10 | 15 | 18 | 16 | 5 | 8 | 8 | 6 | 1 | 2 | … | … |
| Females | 112 | … | … | … | … | 1 | 4 | 11 | 9 | 17 | 14 | 5 | 9 | 12 | 14 | 7 | 4 | 3 | … | 2 | |
| Unspecified | Males | 61 | … | … | 2 | 2 | 3 | 11 | 8 | 2 | 2 | … | … | … | … | … | … | … | … | … | 31 |
| Females | … | … | … | … | … | … | … | … | … | … | … | … | … | … | … | … | … | … | … | … | |
| Total | Males | 7,041 | 2,697 | 124 | 490 | 104 | 504 | 753 | 575 | 553 | 499 | 310 | 169 | 81 | 57 | 42 | 15 | 4 | 4 | 3 | 57 |
| Females | 5,688 | 2,693 | 126 | 459 | 127 | 402 | 455 | 417 | 352 | 255 | 161 | 86 | 52 | 38 | 28 | 13 | 6 | 3 | 2 | 13 | |
| Waimate— | |||||||||||||||||||||
| Unmarried | Males | 1,574 | 637 | 27 | 137 | 26 | 198 | 217 | 104 | 75 | 76 | 34 | 25 | 9 | 2 | 2 | 2 | … | … | … | 3 |
| Females | 833 | 638 | 26 | 87 | 21 | 31 | 19 | 6 | 1 | 2 | … | 1 | … | 1 | … | … | … | … | … | … | |
| Married | Males | 506 | … | … | … | … | 20 | 72 | 98 | 94 | 88 | 65 | 28 | 22 | 13 | 3 | 2 | 1 | … | … | … |
| Females | 458 | … | … | 10 | 9 | 60 | 89 | 92 | 69 | 72 | 25 | 20 | 6 | 4 | 1 | 1 | … | … | … | … | |
| Widowed | Males | 36 | … | … | … | … | … | 2 | 3 | 4 | 7 | 4 | 7 | 3 | 2 | 2 | … | 2 | … | … | … |
| Females | 29 | … | … | … | … | … | … | 1 | 4 | 5 | 3 | 1 | 2 | 3 | 3 | 4 | … | 3 | … | … | |
| Unspecified | Males | 2 | … | … | … | … | … | … | 1 | 1 | … | … | … | … | … | … | … | … | … | … | … |
| Females | … | … | … | … | … | … | … | … | … | … | … | … | … | … | … | … | … | … | … | … | |
| Total | Males | 2,118 | 637 | 27 | 137 | 26 | 218 | 291 | 206 | 174 | 171 | 103 | 60 | 34 | 17 | 7 | 4 | 3 | … | … | 3 |
| Females | 1,320 | 638 | 26 | 97 | 30 | 91 | 108 | 99 | 74 | 79 | 28 | 22 | 8 | 8 | 4 | 5 | … | 3 | … | … | |
| Waitaki— | |||||||||||||||||||||
| Unmarried | Males | 3,093 | 1,371 | 61 | 312 | 66 | 305 | 315 | 228 | 142 | 150 | 60 | 40 | 19 | 8 | 7 | 2 | 2 | … | … | 5 |
| Females | 1,833 | 1,344 | 54 | 250 | 34 | 77 | 44 | 7 | 7 | 6 | 3 | 2 | 3 | 2 | … | … | … | … | … | … | |
| Married | Males | 986 | … | … | … | 1 | 22 | 133 | 153 | 181 | 195 | 132 | 91 | 26 | 23 | 17 | 7 | 1 | … | … | 1 |
| Females | 915 | … | … | 8 | 14 | 106 | 175 | 183 | 167 | 115 | 63 | 31 | 22 | 15 | 11 | 3 | … | … | … | 2 | |
| Widowed | Males | 59 | … | … | … | … | … | 3 | 4 | 1 | 6 | 10 | 8 | 5 | 9 | 6 | 3 | 3 | … | … | 1 |
| Females | 65 | … | … | … | … | … | 4 | 5 | 5 | 8 | 10 | 6 | 10 | 6 | 5 | 4 | 1 | 1 | … | … | |
Table VIII. Table VIII. Showing the Numbers and Ages of the Unmarried, Married, Widowed, and Unspecified, Males and Females (exclusive of Maoris), in each County—continued.
| Counties. | All Ages. | Under 14 years. | 14–15. | 15 and under 21. | 21 and under 40. | 40 and under 60. | 60 and under 80. | 80 and upwards. | Unspecified Children. | Unspecified Adults. | |||||||||||
|---|---|---|---|---|---|---|---|---|---|---|---|---|---|---|---|---|---|---|---|---|---|
| 15–20. | 20–21. | 21–25. | 25–30. | 30–35. | 35–40. | 40–45 | 45–50. | 50–55. | 55–60. | 60–65. | 65–70. | 70–75. | 75–80. | ||||||||
| Waitaki—continued. | |||||||||||||||||||||
| Unspecified | Males | 4 | … | … | … | … | … | 2 | … | 2 | … | … | … | … | … | … | … | … | … | … | … |
| Females | … | … | … | … | … | … | … | … | … | … | … | … | … | … | … | … | … | … | … | … | |
| Total | Males | 4,142 | 1,371 | 61 | 312 | 67 | 330 | 453 | 385 | 326 | 351 | 202 | 139 | 50 | 40 | 30 | 12 | 6 | … | … | 7 |
| Females | 2,813 | 1,344 | 54 | 258 | 48 | 183 | 223 | 195 | 179 | 129 | 76 | 39 | 35 | 23 | 16 | 7 | 1 | 1 | … | 2 | |
| Waikouaiti— | |||||||||||||||||||||
| Unmarried | Males | 2,710 | 1,489 | 92 | 256 | 46 | 183 | 149 | 126 | 109 | 100 | 56 | 46 | 24 | 19 | 5 | 3 | 2 | … | 1 | 4 |
| Females | 1,859 | 1,393 | 72 | 240 | 22 | 72 | 23 | 14 | 7 | 3 | 1 | 3 | 2 | 4 | … | … | … | … | 2 | 1 | |
| Married | Males. | 999 | … | … | 1 | 1 | 15 | 93 | 128 | 168 | 183 | 181 | 102 | 54 | 26 | 23 | 16 | 3 | 1 | … | 4 |
| Females | 964 | … | … | 5 | 18 | 67 | 170 | 166 | 158 | 168 | 96 | 46 | 30 | 18 | 11 | 4 | 3 | … | … | 4 | |
| Widowed | Males | 63 | … | … | … | … | 1 | … | 3 | 6 | 7 | 5 | 10 | 7 | 8 | 6 | 2 | 6 | 2 | … | … |
| Females | 62 | … | … | … | … | 1 | 1 | 4 | 8 | 6 | 7 | 7 | 6 | 10 | 3 | 2 | 5 | 2 | … | … | |
| Unspecified | Males | 4 | … | … | … | … | … | … | … | … | … | … | … | … | … | … | … | … | … | … | 4 |
| Females | … | … | … | … | … | … | … | … | … | … | … | … | … | … | … | … | … | … | … | … | |
| Total | Males | 3,776 | 1,489 | 92 | 257 | 47 | 199 | 242 | 257 | 283 | 290 | 242 | 158 | 85 | 53 | 34 | 21 | 11 | 3 | 1 | 12 |
| Females | 2,885 | 1,393 | 72 | 245 | 40 | 140 | 194 | 184 | 173 | 177 | 104 | 56 | 38 | 32 | 14 | 6 | 8 | 2 | 2 | 5 | |
| Peninsula— | |||||||||||||||||||||
| Unmarried | Males | 924 | 568 | 34 | 136 | 19 | 56 | 43 | 17 | 12 | 16 | 7 | 9 | 3 | 2 | … | … | … | … | … | 2 |
| Females | 735 | 478 | 32 | 132 | 10 | 42 | 25 | 6 | 4 | 2 | 1 | … | 1 | … | … | … | … | … | 2 | … | |
| Married | Males | 356 | … | … | 1 | … | 7 | 30 | 50 | 54 | 63 | 51 | 38 | 20 | 17 | 14 | 6 | 1 | 3 | … | 1 |
| Females | 347 | … | … | 3 | 4 | 30 | 42 | 56 | 59 | 48 | 39 | 27 | 13 | 16 | 4 | … | 1 | 2 | … | 3 | |
| Widowed | Males | 19 | … | … | … | … | … | … | 2 | 1 | 3 | 3 | 3 | 2 | 3 | … | 1 | 1 | … | … | … |
| Females | 43 | … | … | … | … | 1 | … | 2 | 5 | 2 | 3 | 6 | 4 | 9 | 5 | 3 | 2 | 1 | … | … | |
| Unspecified | Males | 1 | … | … | … | … | … | 1 | … | … | … | … | … | … | … | … | … | … | … | … | … |
| Females | … | … | … | … | … | … | … | … | … | … | … | … | … | … | … | … | … | … | … | … | |
| Total | Males | 1,300 | 568 | 34 | 137 | 19 | 63 | 74 | 69 | 67 | 82 | 61 | 50 | 25 | 22 | 14 | 7 | 2 | 3 | … | 3 |
| Females | 1,125 | 478 | 32 | 135 | 14 | 73 | 67 | 64 | 68 | 52 | 43 | 33 | 18 | 25 | 9 | 3 | 3 | 3 | 2 | 3 | |
| Taieri— | |||||||||||||||||||||
| Unmarried | Males | 3,098 | 1,570 | 102 | 391 | 71 | 266 | 233 | 137 | 124 | 86 | 50 | 30 | 17 | 10 | … | 3 | 1 | 1 | 1 | 5 |
| Females | 2,125 | 1,434 | 81 | 338 | 44 | 114 | 58 | 21 | 11 | 7 | 5 | 2 | 3 | 3 | 1 | 2 | … | 1 | … | … | |
| Married | Males | 1,033 | … | … | 1 | 1 | 29 | 110 | 138 | 167 | 189 | 128 | 112 | 64 | 47 | 22 | 14 | 9 | … | … | 2 |
| Females | 1,025 | … | … | 8 | 17 | 99 | 167 | 165 | 146 | 156 | 102 | 62 | 39 | 34 | 16 | 10 | 2 | … | … | 2 | |
| Widowed | Males | 89 | … | … | … | … | 1 | 1 | 3 | 7 | 14 | 11 | 14 | 12 | 13 | 1 | 3 | 2 | 6 | … | 1 |
| Females | 93 | … | … | … | … | 1 | 4 | 8 | 7 | 8 | 9 | 10 | 10 | 9 | 8 | 11 | 3 | 5 | … | … | |
Table VIII. Table VIII. Showing the Numbers and Ages of the Unmarried, Married, Widowed, and Unspecified, Males and Females (exclusive of Maoris), in each County—continued.
| Counties. | All Ages. | Under 14 years. | 14–15. | 15 and under 21. | 21 and under 40. | 40 and under 60. | 60 and under 80. | 80 and upwards. | Unspecified Children. | Unspecified Adults. | |||||||||||
|---|---|---|---|---|---|---|---|---|---|---|---|---|---|---|---|---|---|---|---|---|---|
| 15–20. | 20–21. | 21–25. | 25–30. | 30–35. | 35–40. | 40–45 | 45–50. | 50–55. | 55–60. | 60–65. | 65–70. | 70–75. | 75–80. | ||||||||
| Unspecified | Males | 10 | … | … | … | … | … | … | 1 | 1 | 3 | 1 | 1 | … | … | … | … | … | … | … | 3 |
| Females | 3 | … | … | … | … | 1 | … | 1 | 1 | … | … | … | … | … | … | … | … | … | … | … | |
| Total | Males | 4,230 | 1,570 | 102 | 392 | 72 | 296 | 344 | 279 | 299 | 292 | 190 | 157 | 93 | 70 | 23 | 20 | 12 | 7 | 1 | 11 |
| Females | 3,246 | 1,434 | 81 | 346 | 61 | 215 | 229 | 195 | 165 | 171 | 116 | 74 | 52 | 46 | 25 | 23 | 5 | 6 | … | 2 | |
| Bruce— | |||||||||||||||||||||
| Unmarried | Males | 2,055 | 1,089 | 58 | 206 | 46 | 160 | 156 | 101 | 70 | 65 | 37 | 27 | 12 | 19 | 5 | 3 | … | … | … | 1 |
| Females | 1,491 | 1,120 | 69 | 171 | 23 | 50 | 24 | 13 | 6 | 7 | 3 | 1 | 2 | … | 1 | … | … | … | … | 1 | |
| Married | Males | 689 | … | … | … | 1 | 15 | 61 | 111 | 105 | 138 | 100 | 61 | 38 | 29 | 15 | 6 | 8 | … | … | 1 |
| Females | 679 | … | … | 8 | 4 | 59 | 114 | 110 | 132 | 106 | 47 | 42 | 21 | 19 | 8 | 6 | 1 | 1 | … | 1 | |
| Widowed | Males | 51 | … | … | … | … | … | 3 | 1 | 3 | 7 | 6 | 6 | 2 | 9 | 5 | 3 | 1 | 5 | … | … |
| Females | 78 | … | … | 1 | … | 2 | 2 | 3 | 9 | 11 | 7 | 4 | 6 | 10 | 9 | 10 | 2 | 2 | … | … | |
| Unspecified | Males | 6 | … | … | … | … | … | 1 | 1 | 1 | … | 1 | … | 2 | … | … | … | … | … | … | … |
| Females | 1 | … | … | … | … | … | … | … | … | … | … | … | … | … | … | … | … | … | … | … | |
| Total | Males | 3,801 | 1,089 | 58 | 206 | 47 | 175 | 221 | 214 | 179 | 210 | 144 | 94 | 54 | 57 | 25 | 12 | 9 | 5 | … | 2 |
| Females | 2,248 | 1,120 | 69 | 180 | 27 | 111 | 140 | 126 | 147 | 124 | 57 | 47 | 29 | 29 | 18 | 16 | 3 | 3 | … | 2 | |
| Clutha— | |||||||||||||||||||||
| Unmarried | Males | 1,802 | 839 | 59 | 217 | 48 | 174 | 160 | 104 | 87 | 43 | 31 | 19 | 5 | 9 | 5 | 2 | … | … | … | … |
| Females | 1,124 | 797 | 52 | 153 | 29 | 51 | 21 | 5 | 6 | 3 | … | 2 | 1 | 1 | 1 | 2 | … | … | … | … | |
| Married | Males | 614 | … | … | … | … | 9 | 63 | 80 | 100 | 123 | 91 | 57 | 43 | 22 | 15 | 7 | 1 | 2 | … | 1 |
| Females | 572 | … | … | 4 | 6 | 61 | 72 | 110 | 97 | 75 | 59 | 40 | 22 | 11 | 5 | 5 | 3 | … | … | 2 | |
| Widowed | Males | 48 | … | … | … | … | … | 1 | 2 | 5 | 7 | 5 | 3 | 5 | 9 | 7 | 3 | 1 | … | … | … |
| Females | 45 | … | … | … | … | 1 | … | 2 | 2 | 6 | 5 | 2 | 4 | 6 | 4 | 8 | 3 | 2 | … | … | |
| Unspecified | Males | … | … | … | … | … | … | … | … | … | … | … | … | … | … | … | … | … | … | … | … |
| Females | … | … | … | … | … | … | … | … | … | … | … | … | … | … | … | … | … | … | … | … | |
| Total | Males | 2,464 | 839 | 59 | 217 | 48 | 183 | 224 | 186 | 192 | 173 | 127 | 79 | 53 | 40 | 27 | 12 | 2 | 2 | … | 1 |
| Females | 1,741 | 797 | 52 | 157 | 35 | 113 | 93 | 117 | 105 | 84 | 64 | 44 | 27 | 18 | 10 | 15 | 6 | 2 | … | 2 | |
| Tuapeka— | |||||||||||||||||||||
| Unmarried | Males | 3,145 | 1,268 | 68 | 230 | 46 | 185 | 322 | 247 | 234 | 204 | 151 | 95 | 26 | 29 | 5 | 1 | … | … | … | 34 |
| Females | 1,620 | 1,255 | 67 | 206 | 16 | 48 | 13 | 7 | 3 | … | … | 2 | 1 | … | … | … | … | … | 2 | … | |
| Married | Males | 751 | … | … | 1 | … | 5 | 52 | 86 | 137 | 180 | 157 | 77 | 25 | 20 | 7 | 3 | … | 1 | … | … |
| Females | 737 | … | … | 8 | 11 | 52 | 109 | 140 | 147 | 127 | 65 | 47 | 10 | 15 | 1 | 3 | … | 1 | … | 1 | |
| Widowed | Males | 71 | … | … | … | … | … | 4 | 3 | 5 | 9 | 9 | 17 | 8 | 6 | 4 | 3 | 2 | 1 | … | … |
| Females | 53 | … | … | … | … | … | 3 | … | 3 | 9 | 10 | 9 | 4 | 5 | 3 | 2 | 3 | 2 | … | … | |
| Unspecified | Males | 3 | … | … | … | … | … | … | … | 2 | … | … | … | … | … | … | … | … | … | … | 1 |
| Females | … | … | … | … | … | … | … | … | … | … | … | … | … | … | … | … | … | … | … | … | |
| Total | Males | 3,970 | 1,268 | 68 | 231 | 46 | 190 | 378 | 336 | 378 | 393 | 317 | 189 | 59 | 55 | 16 | 7 | 2 | 2 | … | 35 |
| Females | 2,410 | 1,255 | 67 | 214 | 27 | 100 | 125 | 147 | 153 | 136 | 75 | 58 | 15 | 20 | 4 | 5 | 3 | 3 | 2 | 1 | |
| Maniototo— | |||||||||||||||||||||
| Unmarried | Males | 1,207 | 441 | 19 | 72 | 16 | 62 | 121 | 106 | 87 | 122 | 73 | 49 | 22 | 6 | 2 | 1 | … | … | … | 8 |
| Females | 578 | 452 | 25 | 59 | 3 | 17 | 11 | 7 | 2 | 1 | … | 1 | … | … | … | … | … | … | … | … | |
| Married | Males | 319 | … | … | … | … | 7 | 28 | 37 | 56 | 88 | 57 | 27 | 7 | 7 | 2 | … | … | … | … | 3 |
| Females | 299 | … | … | 5 | 4 | 34 | 45 | 65 | 59 | 41 | 26 | 10 | 4 | 4 | 1 | … | … | … | … | 1 | |
| Widowed | Males | 20 | … | … | … | … | … | … | 1 | 2 | 1 | 5 | 5 | 2 | 1 | … | 1 | 1 | … | … | 1 |
| Females | 21 | … | … | … | … | … | 1 | 1 | 2 | 3 | 1 | 3 | 4 | … | 1 | 3 | 2 | … | … | … | |
Table VIII. Table VIII. Showing the Numbers and Ages of the Unmarried, Married, Widowed, and Unspecified, Males and Females (exclusive of Maoris), in each County—continued.
| Counties. | All Ages. | Under 14 years. | 14–15. | 15 and under 21. | 21 and under 40. | 40 and under 60. | 60 and under 80. | 80 and upwards. | Unspecified Children. | Unspecified Adults. | |||||||||||
|---|---|---|---|---|---|---|---|---|---|---|---|---|---|---|---|---|---|---|---|---|---|
| 15–20. | 20–21. | 21–25. | 25–30. | 30–35. | 35–40. | 40–45 | 45–50. | 50–55. | 55–60. | 60–65. | 65–70. | 70–75. | 75–80. | ||||||||
| Maniototo—continued. | |||||||||||||||||||||
| Unspecified | Males | 9 | … | … | … | … | … | 2 | 2 | … | 1 | 2 | … | 1 | … | … | … | … | … | … | 1 |
| Females | 1 | … | … | … | … | … | … | … | 1 | … | … | … | … | … | … | … | … | … | … | … | |
| Total | Males | 1,555 | 441 | 19 | 72 | 16 | 69 | 151 | 146 | 145 | 212 | 137 | 81 | 32 | 14 | 4 | 2 | 1 | … | … | 13 |
| Females | 899 | 452 | 25 | 64 | 7 | 51 | 57 | 73 | 64 | 45 | 27 | 14 | 8 | 4 | 2 | 3 | 2 | … | … | 1 | |
| Vincent— | |||||||||||||||||||||
| Unmarried | Males | 1,951 | 603 | 31 | 114 | 26 | 137 | 195 | 177 | 176 | 196 | 131 | 89 | 37 | 16 | 2 | 2 | … | 1 | … | 18 |
| Females | 721 | 563 | 28 | 93 | 8 | 16 | 4 | 6 | 1 | 2 | … | … | … | … | … | … | … | … | … | … | |
| Married | Males | 431 | … | … | … | … | 4 | 30 | 43 | 67 | 104 | 90 | 54 | 21 | 12 | 1 | 2 | 1 | … | … | 2 |
| Females | 388 | … | … | 7 | 6 | 29 | 55 | 65 | 77 | 78 | 36 | 18 | 9 | 4 | 1 | … | 2 | … | … | 1 | |
| Widowed | Males | 49 | … | … | … | … | … | … | 2 | 3 | 7 | 8 | 14 | 6 | 4 | 3 | … | 1 | … | … | 1 |
| Females | 25 | … | … | … | … | 1 | … | 2 | 5 | 4 | 3 | 1 | 2 | 2 | 2 | … | … | 2 | … | 1 | |
| Unspecified | Males | … | … | … | … | … | … | … | … | … | … | … | … | … | … | … | … | … | … | … | … |
| Females | … | … | … | … | … | … | … | … | … | … | … | … | … | … | … | … | … | … | … | … | |
| Total | Males | 2,431 | 603 | 31 | 114 | 26 | 141 | 225 | 222 | 246 | 307 | 229 | 157 | 64 | 32 | 6 | 4 | 2 | 1 | … | 21 |
| Females | 1,134 | 563 | 28 | 100 | 14 | 46 | 59 | 73 | 83 | 84 | 39 | 19 | 11 | 6 | 3 | … | 2 | 2 | … | 2 | |
| Lake— | |||||||||||||||||||||
| Unmarried | Males | 1,383 | 357 | 17 | 69 | 23 | 91 | 158 | 164 | 137 | 147 | 111 | 68 | 23 | 11 | 2 | 1 | … | … | … | 4 |
| Females | 495 | 410 | 15 | 37 | 4 | 12 | 8 | 3 | 2 | 1 | … | 3 | … | … | … | … | … | … | … | … | |
| Married | Males | 302 | … | … | … | … | 5 | 19 | 31 | 52 | 72 | 72 | 29 | 12 | 5 | 2 | 1 | … | … | … | 2 |
| Females | 252 | … | … | 4 | 2 | 29 | 44 | 51 | 42 | 36 | 18 | 12 | 8 | 6 | … | … | … | … | … | … | |
| Widowed | Males | 37 | … | … | … | … | … | … | 2 | 3 | 3 | 8 | 7 | 7 | 3 | 1 | 1 | 1 | 1 | … | … |
| Females | 16 | … | … | … | … | … | 2 | 2 | 2 | 2 | 2 | 1 | … | 1 | 1 | 3 | … | … | … | … | |
| Unspecified | Males | 1 | … | … | … | … | … | … | … | … | … | … | … | … | … | 1 | … | … | … | … | … |
| Females | … | … | … | … | … | … | … | … | … | … | … | … | … | … | … | … | … | … | … | … | |
| Total | Males | 1,723 | 357 | 17 | 69 | 23 | 96 | 177 | 197 | 192 | 222 | 191 | 104 | 42 | 19 | 6 | 3 | 1 | 1 | … | 6 |
| Females | 763 | 410 | 15 | 41 | 6 | 41 | 54 | 56 | 46 | 39 | 20 | 16 | 8 | 7 | 1 | 3 | … | … | … | … | |
| Southland— | |||||||||||||||||||||
| Unmarried | Males | 5,891 | 2,704 | 134 | 579 | 106 | 527 | 575 | 380 | 328 | 230 | 165 | 82 | 35 | 19 | 8 | 4 | … | … | 1 | 14 |
| Females | 3,359 | 2,537 | 137 | 427 | 45 | 95 | 46 | 28 | 13 | 7 | 6 | 8 | 1 | 2 | 1 | … | … | 1 | 1 | 4 | |
| Married | Males | 1,876 | … | … | … | 2 | 45 | 233 | 286 | 365 | 334 | 230 | 164 | 75 | 74 | 34 | 19 | 5 | 3 | … | 7 |
| Females | 1,800 | … | 1 | 41 | 32 | 214 | 348 | 288 | 296 | 228 | 135 | 92 | 53 | 43 | 17 | 6 | 4 | … | … | 2 | |
| Widowed | Males | 130 | … | … | 1 | … | 1 | 3 | 10 | 10 | 18 | 22 | 18 | 13 | 9 | 7 | 8 | 6 | 3 | … | 1 |
| Females | 107 | … | … | 2 | … | 4 | 5 | 4 | 13 | 3 | 11 | 10 | 9 | 15 | 10 | 10 | 5 | 5 | … | 1 | |
Table VIII. Table VIII. Showing the Numbers and Ages of the Unmarried, Married, Widowed, and Unspecified, Males and Females (exclusive of Maoris), in each County—continued.
| Counties. | All Ages. | Under 14 years. | 14–15. | 15 and under 21. | 21 and under 40. | 40 and under 60. | 60 and under 80. | 80 and upwards. | Unspecified Children. | Unspecified Adults. | |||||||||||
|---|---|---|---|---|---|---|---|---|---|---|---|---|---|---|---|---|---|---|---|---|---|
| 15–20. | 20–21. | 21–25. | 25–30. | 30–35. | 35–40. | 40–45 | 45–50. | 50–55. | 55–60. | 60–65. | 65–70. | 70–75. | 75–80. | ||||||||
| Unspecified | Males | 52 | … | … | … | 1 | 5 | 8 | 7 | 6 | … | 1 | … | 1 | … | … | … | … | … | … | 23 |
| Females | … | … | … | … | … | … | … | … | … | … | … | … | … | … | … | … | … | … | … | … | |
| Total | Males | 7,949 | 2,794 | 134 | 580 | 109 | 578 | 819 | 683 | 709 | 582 | 418 | 264 | 124 | 102 | 49 | 31 | 11 | 6 | 1 | 45 |
| Females | 5,266 | 2,537 | 138 | 470 | 77 | 313 | 399 | 320 | 322 | 238 | 152 | 110 | 63 | 60 | 28 | 16 | 9 | 6 | 1 | 7 | |
| Wallace— | |||||||||||||||||||||
| Unmarried | Males | 1,890 | 599 | 36 | 167 | 54 | 223 | 243 | 196 | 134 | 111 | 56 | 43 | 10 | 8 | 5 | 2 | 1 | 1 | … | 1 |
| Females | 769 | 588 | 23 | 105 | 9 | 22 | 14 | 2 | 3 | … | 2 | … | … | … | … | … | 1 | … | … | … | |
| Married | Males | 471 | … | … | … | 1 | 9 | 63 | 73 | 92 | 92 | 62 | 39 | 19 | 15 | 3 | 1 | 1 | 1 | … | … |
| Females | 417 | … | … | 11 | 4 | 58 | 82 | 83 | 56 | 58 | 29 | 17 | 12 | 3 | 2 | 1 | … | … | … | 1 | |
| Widowed | Males | 42 | … | … | … | … | … | 3 | 4 | 2 | 8 | 7 | 2 | 4 | 5 | 1 | 5 | 1 | … | … | … |
| Females | 24 | … | … | … | … | … | 2 | 2 | … | 5 | 2 | 3 | 3 | 4 | 1 | 1 | 1 | … | … | … | |
| Unspecified | Males | 3 | … | … | … | … | … | 1 | … | … | … | … | … | … | … | … | … | … | … | … | 2 |
| Females | … | … | … | … | … | … | … | … | … | … | … | … | … | … | … | … | … | … | … | … | |
| Total | Males | 2,406 | 599 | 36 | 167 | 55 | 232 | 310 | 273 | 228 | 211 | 125 | 84 | 33 | 28 | 9 | 8 | 3 | 2 | … | 3 |
| Females | 1,210 | 588 | 23 | 116 | 13 | 80 | 98 | 87 | 59 | 63 | 33 | 20 | 15 | 7 | 3 | 2 | 2 | … | … | 1 | |
| Fiord— | |||||||||||||||||||||
| Unmarried | Males | 2 | 1 | … | … | … | … | … | … | … | … | 1 | … | … | … | … | … | … | … | … | … |
| Females | 5 | 5 | … | … | … | … | … | … | … | … | … | … | … | … | … | … | … | … | … | … | |
| Married | Males | 3 | … | … | … | … | … | 1 | 2 | … | … | … | … | … | … | … | … | … | … | … | … |
| Females | 3 | … | … | 1 | … | … | 2 | … | … | … | … | … | … | … | … | … | … | … | … | … | |
| Widowed | Males | … | … | … | … | … | … | … | … | … | … | … | … | … | … | … | … | … | … | … | … |
| Females | … | … | … | … | … | … | … | … | … | … | … | … | … | … | … | … | … | … | … | … | |
| Unspecified | Males | … | … | … | … | … | … | … | … | … | … | … | … | … | … | … | … | … | … | … | … |
| Females | … | … | … | … | … | … | … | … | … | … | … | … | … | … | … | … | … | … | … | … | |
| Total | Males | 5 | 1 | … | … | … | … | 1 | 2 | … | … | 1 | … | … | … | … | … | … | … | … | … |
| Females | 8 | 5 | … | 1 | … | … | 2 | … | … | … | … | … | … | … | … | … | … | … | … | … | |
| Stewart Island— | |||||||||||||||||||||
| Unmarried | Males | 115 | 69 | 6 | 16 | 1 | 3 | 3 | 4 | 2 | 4 | 2 | … | 2 | 1 | 1 | … | … | … | … | 1 |
| Females | 85 | 71 | 4 | 10 | … | … | … | … | … | … | … | … | … | … | … | … | … | … | … | … | |
| Married | Males | 41 | … | … | … | … | … | 4 | 10 | 8 | 6 | 4 | 2 | 2 | 2 | 1 | … | 1 | … | … | 1 |
| Females | 41 | … | … | 2 | 3 | 1 | 8 | 6 | 6 | 10 | 1 | … | 1 | 1 | 1 | … | … | … | … | 1 | |
| Widowed | Males | 8 | … | … | … | … | … | … | … | 1 | 1 | 3 | 2 | 1 | … | … | … | … | … | … | … |
| Females | 5 | … | … | … | … | … | 1 | 2 | … | … | 1 | … | … | … | … | … | 1 | … | … | … | |
| Unspecified | Males | … | … | … | … | … | … | … | … | … | … | … | … | … | … | … | … | … | … | … | … |
| Females | … | … | … | … | … | … | … | … | … | … | … | … | … | … | … | … | … | … | … | … | |
| Total | Males | 164 | 69 | 6 | 16 | 1 | 3 | 7 | 14 | 11 | 11 | 9 | 4 | 5 | 3 | 2 | … | 1 | … | … | 2 |
| Females | 131 | 71 | 4 | 12 | 3 | 1 | 9 | 8 | 6 | 10 | 2 | … | 1 | 1 | 1 | … | 1 | … | … | 1 | |
Table IX. Table IX. Showing the Numbers and Ages of the Unmarried, Married, Widowed, and Unspecified, Males and Females (exclusive of Maoris), in each Borough.
| Boroughs. | All Ages. | Under 14 years. | 14–15. | 15 and under 21. | 21 and under 40. | 40 and under 60. | 60 and under 80. | 80 and upwards. | Unspecified Children. | Unspecified Adults. | |||||||||||
|---|---|---|---|---|---|---|---|---|---|---|---|---|---|---|---|---|---|---|---|---|---|
| 15–20. | 20–21. | 21–25. | 25–30. | 30–35. | 35–40. | 40–45 | 45–50. | 50–55. | 55–60. | 60–65. | 65–70. | 70–75. | 75–80. | ||||||||
| Auckland— | |||||||||||||||||||||
| Unmarried | Males | 5,907 | 3,164 | 203 | 797 | 138 | 530 | 452 | 206 | 139 | 98 | 52 | 55 | 19 | 25 | 14 | 8 | 1 | 3 | … | 3 |
| Females | 4,886 | 2,959 | 174 | 917 | 150 | 354 | 159 | 75 | 26 | 22 | 13 | 15 | 5 | 6 | 7 | 2 | 2 | … | … | … | |
| Married | Males | 2,530 | … | … | 3 | 3 | 82 | 316 | 373 | 413 | 435 | 307 | 240 | 130 | 132 | 47 | 29 | 12 | 6 | … | 2 |
| Females | 2,667 | … | … | 38 | 37 | 283 | 456 | 438 | 434 | 357 | 233 | 172 | 97 | 76 | 24 | 14 | 5 | 1 | … | 2 | |
| Widowed | Males | 214 | … | … | … | … | 1 | 6 | 10 | 15 | 26 | 22 | 28 | 17 | 30 | 12 | 27 | 8 | 10 | … | 2 |
| Females | 460 | … | … | 1 | 2 | 6 | 20 | 30 | 40 | 51 | 72 | 48 | 41 | 68 | 32 | 24 | 9 | 16 | … | … | |
| Unspecified | Males | … | … | … | … | … | … | … | … | … | … | … | … | … | … | … | … | … | … | … | … |
| Females | … | … | … | … | … | … | … | … | … | … | … | … | … | … | … | … | … | … | … | … | |
| Total | Males | 8,651 | 3,164 | 203 | 800 | 141 | 613 | 774 | 589 | 567 | 559 | 381 | 323 | 166 | 187 | 73 | 64 | 21 | 19 | … | 7 |
| Females | 8,013 | 2,959 | 174 | 956 | 189 | 643 | 635 | 543 | 500 | 430 | 318 | 235 | 143 | 150 | 63 | 40 | 16 | 17 | … | 2 | |
| Parnell— | |||||||||||||||||||||
| Unmarried | Males | 1,194 | 710 | 41 | 152 | 28 | 80 | 61 | 22 | 16 | 17 | 12 | 13 | 9 | 7 | 5 | 8 | 6 | 6 | … | 1 |
| Females | 1,125 | 655 | 38 | 199 | 32 | 79 | 60 | 15 | 14 | 13 | 6 | 4 | 3 | 1 | 2 | 2 | 1 | … | 1 | … | |
| Married | Males | 477 | … | … | … | 1 | 13 | 50 | 62 | 72 | 81 | 58 | 49 | 34 | 29 | 14 | 6 | 7 | 1 | … | … |
| Females | 558 | … | … | 5 | 5 | 40 | 87 | 101 | 90 | 65 | 61 | 38 | 23 | 20 | 12 | 7 | 3 | 1 | … | … | |
| Widowed | Males | 55 | … | … | … | … | … | 1 | 3 | 2 | 6 | 9 | 1 | 7 | 2 | 7 | 12 | 2 | 3 | … | … |
| Females | 120 | … | … | … | … | … | 5 | 4 | 8 | 9 | 10 | 16 | 16 | 18 | 19 | 10 | 2 | 3 | … | … | |
| Unspecified | Males | … | … | … | … | … | … | … | … | … | … | … | … | … | … | … | … | … | … | … | … |
| Females | … | … | … | … | … | … | … | … | … | … | … | … | … | … | … | … | … | … | … | … | |
| Total | Males | 1,726 | 710 | 41 | 152 | 29 | 93 | 112 | 87 | 90 | 104 | 79 | 63 | 50 | 38 | 26 | 26 | 15 | 10 | … | 1 |
| Females | 1,803 | 655 | 38 | 204 | 37 | 119 | 152 | 120 | 112 | 87 | 77 | 58 | 42 | 39 | 33 | 19 | 6 | 4 | 1 | … | |
| Onehunga— | |||||||||||||||||||||
| Unmarried | Males | 698 | 443 | 31 | 90 | 13 | 38 | 33 | 16 | 7 | 6 | 5 | 6 | 5 | 3 | 1 | 1 | … | … | … | … |
| Females | 712 | 465 | 33 | 125 | 18 | 27 | 18 | 12 | 7 | 1 | 4 | … | 1 | 1 | … | … | … | … | … | … | |
| Married | Males | 333 | … | … | 1 | … | 11 | 28 | 36 | 44 | 51 | 33 | 39 | 26 | 23 | 12 | 19 | 10 | … | … | … |
| Females | 379 | … | … | 7 | 8 | 28 | 46 | 57 | 58 | 43 | 29 | 41 | 22 | 18 | 11 | 9 | 1 | … | … | 1 | |
| Widowed | Males | 16 | … | … | … | … | … | … | 1 | 1 | 2 | 2 | 1 | … | … | 1 | 4 | 2 | 2 | … | … |
| Females | 79 | … | … | … | … | 2 | 4 | 5 | 1 | 5 | 7 | 8 | 7 | 15 | 11 | 5 | 5 | 4 | … | … | |
| Unspecified | Males | … | … | … | … | … | … | … | … | … | … | … | … | … | … | … | … | … | … | … | … |
| Females | … | … | … | … | … | … | … | … | … | … | … | … | … | … | … | … | … | … | … | … | |
| Total | Males | 1,047 | 443 | 31 | 91 | 13 | 49 | 61 | 53 | 52 | 59 | 40 | 46 | 31 | 26 | 14 | 24 | 12 | 2 | … | … |
| Females | 1,170 | 465 | 33 | 132 | 26 | 57 | 68 | 74 | 66 | 49 | 40 | 49 | 30 | 34 | 22 | 14 | 6 | 4 | … | 1 | |
| Thames— | |||||||||||||||||||||
| Unmarried | Males | 1,692 | 1,078 | 57 | 177 | 37 | 100 | 68 | 43 | 42 | 41 | 20 | 18 | 5 | 3 | 1 | … | … | … | 2 | … |
| Females | 1,442 | 1,049 | 58 | 206 | 30 | 52 | 20 | 8 | 5 | 1 | 4 | 1 | 2 | 2 | … | … | … | … | 4 | … | |
Table IX. Table IX. Showing the Numbers and Ages of the Unmarried, Married, Widowed, and Unspecified, Males and Females (exclusive of Maoris), in each Borough—continued.
| Boroughs. | All Ages. | Under 14 years. | 14–15. | 15 and under 21. | 21 and under 40. | 40 and under 60. | 60 and under 80. | 80 and upwards. | Unspecified Children. | Unspecified Adults. | |||||||||||
|---|---|---|---|---|---|---|---|---|---|---|---|---|---|---|---|---|---|---|---|---|---|
| 15–20. | 20–21. | 21–25. | 25–30. | 30–35. | 35–40. | 40–45 | 45–50. | 50–55. | 55–60. | 60–65. | 65–70. | 70–75. | 75–80. | ||||||||
| Married | Males | 784 | … | … | 1 | … | 19 | 66 | 91 | 162 | 185 | 102 | 74 | 34 | 25 | 8 | 8 | 3 | … | … | 6 |
| Females | 799 | … | … | 9 | 16 | 73 | 135 | 145 | 142 | 116 | 67 | 41 | 23 | 16 | 6 | 4 | 1 | … | … | 5 | |
| Widowed | Males | 62 | … | … | … | … | … | 2 | 4 | 6 | 7 | 6 | 9 | 6 | 6 | 7 | 4 | 5 | … | … | … |
| Females | 84 | … | … | … | … | … | 4 | 4 | 10 | 14 | 8 | 11 | 7 | 6 | 12 | 2 | 3 | 2 | … | 1 | |
| Unspecified | Males | … | … | … | … | … | … | … | … | … | … | … | … | … | … | … | … | … | … | … | … |
| Females | … | … | … | … | … | … | … | … | … | … | … | … | … | … | … | … | … | … | … | … | |
| Total | Males | 2,538 | 1,078 | 57 | 178 | 37 | 119 | 136 | 138 | 210 | 233 | 128 | 101 | 45 | 34 | 16 | 12 | 8 | … | 2 | 6 |
| Females | 2,325 | 1,049 | 58 | 215 | 46 | 125 | 159 | 157 | 157 | 131 | 79 | 53 | 32 | 24 | 18 | 6 | 4 | 2 | 4 | 6 | |
| Gisborne— | |||||||||||||||||||||
| Unmarried | Males | 644 | 382 | 21 | 61 | 10 | 48 | 48 | 21 | 24 | 14 | 9 | 2 | … | 3 | … | … | … | … | … | 1 |
| Females | 476 | 332 | 18 | 60 | 12 | 25 | 16 | 5 | 4 | 2 | 1 | … | … | … | … | … | … | … | … | 1 | |
| Married | Males | 286 | … | … | … | … | 4 | 39 | 50 | 65 | 57 | 33 | 17 | 10 | 3 | 4 | 1 | … | … | … | 3 |
| Females | 274 | … | … | 4 | 3 | 32 | 68 | 61 | 43 | 29 | 15 | 10 | 5 | 2 | … | … | … | … | … | 2 | |
| Widowed | Males | 29 | … | … | … | … | … | 1 | 2 | 7 | 2 | 4 | 6 | 3 | 1 | 2 | … | 1 | … | … | … |
| Females | 28 | … | … | … | … | 1 | 5 | 2 | 4 | 4 | 2 | 1 | 1 | 4 | … | 2 | … | 1 | … | 1 | |
| Unspecified | Males | … | … | … | … | … | … | … | … | … | … | … | … | … | … | … | … | … | … | … | … |
| Females | … | … | … | … | … | … | … | … | … | … | … | … | … | … | … | … | … | … | … | … | |
| Total | Males | 959 | 382 | 21 | 61 | 10 | 52 | 88 | 73 | 96 | 73 | 46 | 25 | 13 | 7 | 6 | 1 | 1 | … | … | 4 |
| Females | 778 | 332 | 18 | 64 | 15 | 58 | 89 | 68 | 51 | 35 | 18 | 11 | 6 | 6 | … | 2 | … | 1 | … | 4 | |
| Hamilton— | |||||||||||||||||||||
| Unmarried | Males | 478 | 291 | 23 | 55 | 7 | 34 | 25 | 13 | 8 | 8 | 5 | 4 | 3 | 1 | … | 1 | … | … | … | … |
| Females | 422 | 305 | 17 | 46 | 9 | 22 | 15 | 4 | 1 | 1 | 1 | … | … | … | … | … | … | … | … | 1 | |
| Married | Males | 205 | … | … | … | 1 | 7 | 30 | 28 | 37 | 35 | 18 | 25 | 11 | 10 | 1 | 1 | … | … | … | 1 |
| Females | 226 | … | … | 3 | 5 | 34 | 39 | 36 | 37 | 17 | 24 | 20 | 4 | 5 | 1 | … | … | … | … | 1 | |
| Widowed | Males | 17 | … | … | … | … | … | 2 | 2 | 1 | 1 | … | 3 | 2 | 1 | 3 | 1 | 1 | … | … | … |
| Females | 13 | … | … | … | … | … | 3 | 1 | 1 | … | … | 1 | 3 | 3 | … | 1 | … | … | … | … | |
| Unspecified | Males | … | … | … | … | … | … | … | … | … | … | … | … | … | … | … | … | … | … | … | … |
| Females | … | … | … | … | … | … | … | … | … | … | … | … | … | … | … | … | … | … | … | … | |
| Total | Males | 700 | 291 | 23 | 55 | 8 | 41 | 57 | 43 | 46 | 44 | 23 | 32 | 16 | 12 | 4 | 3 | 1 | … | … | 1 |
| Females | 661 | 305 | 17 | 49 | 14 | 56 | 57 | 41 | 39 | 18 | 25 | 21 | 7 | 8 | 1 | 1 | … | … | … | 2 | |
| New Plymouth— | |||||||||||||||||||||
| Unmarried | Males | 1,103 | 662 | 35 | 128 | 24 | 82 | 71 | 36 | 16 | 19 | 4 | 8 | 5 | 1 | 1 | 2 | … | … | 2 | 7 |
| Females | 1,004 | 637 | 55 | 171 | 28 | 47 | 28 | 12 | 8 | 5 | 4 | 1 | 4 | 1 | 1 | … | … | 1 | 1 | … | |
| Married | Males | 530 | … | … | … | … | 17 | 78 | 77 | 81 | 73 | 61 | 54 | 27 | 28 | 15 | 11 | 2 | 2 | … | 4 |
| Females | 546 | … | … | 7 | 11 | 79 | 99 | 97 | 59 | 55 | 46 | 27 | 19 | 19 | 14 | 8 | 2 | 1 | … | 3 | |
| Widowed | Males | 36 | … | … | … | … | … | 2 | 3 | … | 2 | 3 | 6 | 4 | 5 | 4 | 2 | 3 | 2 | … | … |
| Females | 86 | … | … | … | 1 | 1 | 2 | 8 | 2 | 5 | 13 | 6 | 8 | 11 | 7 | 5 | 7 | 7 | … | 3 | |
| Unspecified | Males | 4 | … | … | … | … | 1 | … | … | … | 1 | … | … | … | … | … | … | … | … | … | 2 |
| Females | 1 | … | … | … | … | … | … | … | … | 1 | … | … | … | … | … | … | … | … | … | … | |
| Total | Males | 1,673 | 662 | 35 | 128 | 24 | 100 | 151 | 116 | 97 | 95 | 68 | 68 | 36 | 34 | 20 | 15 | 5 | 4 | 2 | 13 |
| Females | 1,637 | 637 | 55 | 178 | 40 | 127 | 129 | 117 | 69 | 66 | 63 | 34 | 31 | 31 | 22 | 13 | 9 | 9 | 1 | 6 | |
| Wanganui— | |||||||||||||||||||||
| Unmarried | Males | 1,597 | 929 | 47 | 206 | 34 | 116 | 105 | 51 | 36 | 22 | 16 | 16 | 7 | 5 | 3 | 1 | … | … | … | 3 |
| Females | 1,439 | 964 | 62 | 210 | 32 | 108 | 40 | 11 | 4 | 3 | 1 | 1 | 1 | 1 | … | … | … | … | … | 1 | |
Table IX. Table IX. Showing the Numbers and Ages of the Unmarried, Married, Widowed, and Unspecified, Males and Females (exclusive of Maoris), in each Borough—continued.
| Boroughs. | All Ages. | Under 14 years. | 14–15. | 15 and under 21. | 21 and under 40. | 40 and under 60. | 60 and under 80. | 80 and upwards. | Unspecified Children. | Unspecified Adults. | |||||||||||
|---|---|---|---|---|---|---|---|---|---|---|---|---|---|---|---|---|---|---|---|---|---|
| 15–20. | 20–21. | 21–25. | 25–30. | 30–35. | 35–40. | 40–45 | 45–50. | 50–55. | 55–60. | 60–65. | 65–70. | 70–75. | 75–80. | ||||||||
| Wanganui—continued. | |||||||||||||||||||||
| Married | Males | 699 | … | … | … | 1 | 27 | 97 | 105 | 125 | 121 | 94 | 53 | 33 | 22 | 9 | 5 | 4 | 1 | … | 2 |
| Females | 782 | … | … | 15 | 12 | 93 | 152 | 139 | 118 | 90 | 63 | 48 | 24 | 17 | 4 | 4 | … | 1 | … | 2 | |
| Widowed | Males | 34 | … | … | … | … | … | 1 | 1 | 2 | 2 | 6 | 7 | 1 | 5 | 4 | 1 | 3 | … | … | 1 |
| Females | 95 | … | … | … | … | 5 | 4 | 8 | 7 | 8 | 12 | 14 | 9 | 13 | 6 | 3 | 4 | 2 | … | … | |
| Unspecified | Males | … | … | … | … | … | … | … | … | … | … | … | … | … | … | … | … | … | … | … | … |
| Females | … | … | … | … | … | … | … | … | … | … | … | … | … | … | … | … | … | … | … | … | |
| Total | Males | 2,330 | 929 | 47 | 206 | 35 | 143 | 203 | 157 | 163 | 145 | 116 | 76 | 41 | 32 | 16 | 7 | 7 | 1 | … | 6 |
| Females | 2,316 | 964 | 62 | 225 | 44 | 206 | 196 | 158 | 129 | 101 | 76 | 63 | 34 | 31 | 10 | 7 | 4 | 3 | … | 3 | |
| Marton— | |||||||||||||||||||||
| Unmarried | Males | 248 | 127 | 8 | 38 | 5 | 18 | 18 | 14 | 4 | 4 | 3 | 2 | 4 | 1 | … | … | … | … | … | 2 |
| Females | 189 | 139 | 6 | 26 | 2 | 7 | 4 | 3 | … | 1 | … | … | … | … | 1 | … | … | … | … | … | |
| Married | Males | 109 | … | … | … | … | 2 | 11 | 21 | 20 | 15 | 20 | 12 | 3 | 4 | 1 | … | … | … | … | … |
| Females | 102 | … | … | 3 | … | 16 | 22 | 16 | 15 | 10 | 9 | 7 | 4 | … | … | … | … | … | … | … | |
| Widowed | Males | 6 | … | … | … | … | … | … | … | 1 | 2 | … | 1 | … | 2 | … | … | … | … | … | … |
| Females | 8 | … | … | … | … | … | … | 1 | … | 2 | 1 | 2 | 1 | … | … | … | 1 | … | … | … | |
| Unspecified | Males | … | … | … | … | … | … | … | … | … | … | … | … | … | … | … | … | … | … | … | … |
| Females | … | … | … | … | … | … | … | … | … | … | … | … | … | … | … | … | … | … | … | … | |
| Total | Males | 363 | 127 | 8 | 38 | 5 | 20 | 29 | 35 | 25 | 21 | 23 | 15 | 7 | 7 | 1 | … | … | … | … | 2 |
| Females | 299 | 139 | 6 | 29 | 2 | 23 | 26 | 20 | 15 | 13 | 10 | 9 | 5 | … | 1 | … | 1 | … | … | … | |
| Palmerston North— | |||||||||||||||||||||
| Unmarried | Males | 477 | 288 | 15 | 46 | 13 | 31 | 32 | 20 | 13 | 10 | 4 | 2 | 1 | 1 | … | … | … | … | 1 | … |
| Females | 387 | 309 | 11 | 48 | 3 | 8 | 3 | 1 | 1 | 1 | … | 1 | 1 | … | … | … | … | … | … | … | |
| Married | Males | 243 | … | … | … | … | 7 | 28 | 57 | 54 | 41 | 21 | 17 | 4 | 9 | 3 | … | 1 | … | … | 1 |
| Females | 242 | … | … | 7 | 6 | 27 | 45 | 61 | 41 | 23 | 14 | 7 | 4 | 5 | 2 | … | … | … | … | … | |
| Widowed | Males | 2 | … | … | … | … | … | … | 1 | … | … | … | … | 1 | … | … | … | … | … | … | … |
| Females | 14 | … | … | … | … | … | 1 | 1 | 2 | … | 2 | … | … | 5 | 2 | 1 | … | … | … | … | |
| Unspecified | Males | 1 | … | … | … | … | … | … | … | … | … | … | … | 1 | … | … | … | … | … | … | … |
| Females | … | … | … | … | … | … | … | … | … | … | … | … | … | … | … | … | … | … | … | … | |
| Total | Males | 723 | 288 | 15 | 46 | 13 | 38 | 60 | 78 | 67 | 51 | 25 | 19 | 7 | 10 | 3 | … | 1 | … | 1 | 1 |
| Females | 643 | 309 | 11 | 55 | 9 | 35 | 49 | 63 | 44 | 24 | 16 | 8 | 5 | 10 | 4 | 1 | … | … | … | … | |
| Wellington— | |||||||||||||||||||||
| Unmarried | Males | 6,902 | 4,065 | 212 | 845 | 139 | 533 | 417 | 225 | 156 | 106 | 65 | 48 | 24 | 19 | 7 | 6 | … | 2 | 14 | 20 |
| Females | 6,477 | 4,137 | 243 | 985 | 184 | 432 | 187 | 85 | 61 | 34 | 21 | 12 | 6 | 4 | 3 | 3 | 1 | … | 11 | 18 | |
| Married | Males | 3,135 | … | … | 1 | 1 | 146 | 492 | 524 | 551 | 506 | 338 | 222 | 145 | 100 | 49 | 27 | 12 | 1 | … | 20 |
| Females | 3,391 | … | … | 64 | 47 | 435 | 679 | 605 | 539 | 374 | 265 | 173 | 81 | 58 | 21 | 19 | 6 | 1 | … | 24 | |
Table IX. Table IX. Showing the Numbers and Ages of the Unmarried, Married, Widowed, and Unspecified, Males and Females (exclusive of Maoris), in each Borough—continued.
| Boroughs. | All Ages. | Under 14 years. | 14–15. | 15 and under 21. | 21 and under 40. | 40 and under 60. | 60 and under 80. | 80 and upwards. | Unspecified Children. | Unspecified Adults. | |||||||||||
|---|---|---|---|---|---|---|---|---|---|---|---|---|---|---|---|---|---|---|---|---|---|
| 15–20. | 20–21. | 21–25. | 25–30. | 30–35. | 35–40. | 40–45 | 45–50. | 50–55. | 55–60. | 60–65. | 65–70. | 70–75. | 75–80. | ||||||||
| Widowed | Males | 177 | … | … | … | … | 1 | 7 | 8 | 15 | 21 | 26 | 22 | 18 | 21 | 8 | 16 | 6 | 6 | … | 2 |
| Females | 463 | … | … | … | 1 | 12 | 17 | 31 | 37 | 56 | 50 | 65 | 34 | 59 | 43 | 31 | 12 | 9 | … | 6 | |
| Unspecified | Males | 12 | … | … | … | … | 3 | 2 | 1 | 1 | 2 | … | 1 | … | 1 | … | 1 | … | … | … | … |
| Females | 6 | … | … | … | … | … | 2 | … | … | 1 | 1 | … | … | 1 | … | … | … | … | … | 1 | |
| Total | Males | 10,226 | 4,065 | 212 | 846 | 140 | 682 | 918 | 758 | 723 | 635 | 429 | 293 | 187 | 141 | 64 | 50 | 18 | 9 | 14 | 42 |
| Females | 10,337 | 4,137 | 243 | 1,049 | 232 | 929 | 885 | 721 | 637 | 465 | 337 | 250 | 121 | 122 | 67 | 53 | 19 | 10 | 11 | 49 | |
| Masterton— | |||||||||||||||||||||
| Unmarried | Males | 745 | 511 | 20 | 52 | 13 | 48 | 42 | 24 | 11 | 12 | 8 | 3 | … | … | … | 1 | … | … | … | … |
| Females | 659 | 503 | 24 | 79 | 8 | 26 | 8 | 3 | 4 | 1 | 1 | … | … | … | 1 | … | … | … | 1 | … | |
| Married | Males | 385 | … | … | … | 1 | 18 | 68 | 85 | 67 | 68 | 25 | 27 | 14 | 4 | 6 | 1 | … | 1 | … | … |
| Females | 398 | … | … | 12 | 8 | 47 | 97 | 92 | 54 | 31 | 20 | 23 | 6 | 3 | 3 | 1 | 1 | … | … | … | |
| Widowed | Males | 25 | … | … | … | … | … | … | 1 | 2 | 3 | 2 | 3 | … | 6 | 6 | 1 | 1 | … | … | … |
| Females | 29 | … | … | … | … | … | 1 | 3 | 2 | 4 | 3 | 5 | 3 | 4 | 2 | 1 | … | 1 | … | … | |
| Unspecified | Males | … | … | … | … | … | … | … | … | … | … | … | … | … | … | … | … | … | … | … | … |
| Females | … | … | … | … | … | … | … | … | … | … | … | … | … | … | … | … | … | … | … | … | |
| Total | Males | 1,055 | 511 | 20 | 52 | 14 | 66 | 110 | 110 | 80 | 83 | 35 | 33 | 14 | 10 | 12 | 3 | 1 | 1 | … | … |
| Females | 1,086 | 503 | 24 | 91 | 16 | 73 | 106 | 98 | 60 | 36 | 24 | 28 | 9 | 7 | 6 | 2 | 1 | 1 | 1 | … | |
| Greytown— | |||||||||||||||||||||
| Unmarried | Males | 384 | 248 | 15 | 48 | 7 | 24 | 19 | 6 | 7 | 2 | 3 | 4 | … | … | … | 1 | … | … | … | … |
| Females | 333 | 244 | 16 | 47 | 11 | 11 | 2 | 2 | … | … | … | … | … | … | … | … | … | … | … | … | |
| Married | Males | 167 | … | … | … | … | 7 | 21 | 36 | 27 | 25 | 17 | 11 | 6 | 6 | 5 | 5 | … | 1 | … | … |
| Females | 168 | … | … | 4 | 2 | 25 | 25 | 26 | 28 | 24 | 13 | 5 | 4 | 4 | 4 | 4 | … | … | … | … | |
| Widowed | Males | 10 | … | … | … | … | … | … | … | … | … | 2 | 3 | … | 1 | … | 3 | 1 | … | … | … |
| Females | 16 | … | … | … | … | … | 1 | 1 | 2 | 2 | 2 | 1 | 1 | … | 2 | 1 | 2 | … | … | 1 | |
| Unspecified | Males | … | … | … | … | … | … | … | … | … | … | … | … | … | … | … | … | … | … | … | … |
| Females | … | … | … | … | … | … | … | … | … | … | … | … | … | … | … | … | … | … | … | … | |
| Total | Males | 561 | 248 | 15 | 48 | 7 | 31 | 40 | 42 | 34 | 27 | 22 | 18 | 6 | 7 | 5 | 9 | 1 | 1 | … | … |
| Females | 517 | 244 | 16 | 51 | 13 | 36 | 28 | 29 | 30 | 26 | 15 | 6 | 5 | 4 | 6 | 5 | 2 | … | … | 1 | |
| Napier— | |||||||||||||||||||||
| Unmarried | Males | 1,939 | 1,148 | 60 | 242 | 39 | 141 | 120 | 51 | 41 | 30 | 17 | 18 | 9 | 3 | 5 | 2 | 3 | … | 6 | 4 |
| Females | 1,797 | 1,211 | 63 | 282 | 58 | 87 | 39 | 20 | 13 | 9 | 6 | 1 | 3 | 1 | … | … | … | … | 3 | 1 | |
| Married | Males | 908 | … | … | … | … | 28 | 139 | 180 | 158 | 151 | 103 | 69 | 32 | 22 | 14 | 6 | 3 | 1 | … | 2 |
| Females | 951 | … | … | 16 | 19 | 114 | 192 | 167 | 139 | 129 | 73 | 51 | 20 | 12 | 6 | 4 | 1 | 1 | … | 7 | |
| Widowed | Males | 43 | … | … | … | … | … | 1 | 3 | 7 | 5 | 8 | 3 | 3 | 9 | … | 2 | 1 | 1 | … | … |
| Females | 112 | … | … | … | … | 3 | 3 | 8 | 15 | 15 | 17 | 14 | 11 | 10 | 4 | 6 | 4 | 2 | … | … | |
| Unspecified | Males | 6 | … | … | … | … | … | … | … | 1 | … | … | … | … | … | … | … | … | … | … | 5 |
| Females | … | … | … | … | … | … | … | … | … | … | … | … | … | … | … | … | … | … | … | … | |
| Total | Males | 2,896 | 1,148 | 60 | 242 | 39 | 169 | 260 | 234 | 207 | 186 | 128 | 90 | 44 | 34 | 19 | 10 | 7 | 2 | 6 | 11 |
| Females | 2,860 | 1,211 | 63 | 298 | 77 | 204 | 234 | 195 | 167 | 153 | 96 | 66 | 34 | 23 | 10 | 10 | 5 | 3 | 3 | 8 | |
| Picton— | |||||||||||||||||||||
| Unmarried | Males | 281 | 191 | 10 | 30 | 5 | 20 | 12 | 2 | 3 | 1 | 4 | … | 1 | 1 | 1 | … | … | … | … | … |
| Females | 299 | 214 | 9 | 44 | 6 | 15 | 6 | … | 2 | 1 | … | 1 | … | … | … | … | … | … | … | 1 | |
| Married | Males | 112 | … | … | … | … | 3 | 8 | 14 | 17 | 17 | 13 | 16 | 9 | 6 | 1 | 5 | 3 | … | … | … |
| Females | 121 | … | … | 1 | 2 | 11 | 18 | 24 | 24 | 13 | 12 | 10 | 2 | 2 | … | 1 | 1 | … | … | … | |
Table IX. Table IX. Showing the Numbers and Ages of the Unmarried, Married, Widowed, and Unspecified, Males and Females (exclusive of Maoris), in each Borough—continued.
| Boroughs. | All Ages. | Under 14 years. | 14–15. | 15 and under 21. | 21 and under 40. | 40 and under 60. | 60 and under 80. | 80 and upwards. | Unspecified Children. | Unspecified Adults. | |||||||||||
|---|---|---|---|---|---|---|---|---|---|---|---|---|---|---|---|---|---|---|---|---|---|
| 15–20. | 20–21. | 21–25. | 25–30. | 30–35. | 35–40. | 40–45 | 45–50. | 50–55. | 55–60. | 60–65. | 65–70. | 70–75. | 75–80. | ||||||||
| Picton—continued. | |||||||||||||||||||||
| Widowed | Males | 8 | … | … | … | … | … | 1 | … | 1 | … | 4 | … | … | … | 1 | 1 | … | … | … | … |
| Females | 13 | … | … | … | … | … | 2 | 1 | 1 | 2 | 1 | … | 2 | 1 | 2 | 1 | … | … | … | … | |
| Unspecified | Males | … | … | … | … | … | … | … | … | … | … | … | … | … | … | … | … | … | … | … | … |
| Females | … | … | … | … | … | … | … | … | … | … | … | … | … | … | … | … | … | … | … | … | |
| Total | Males | 401 | 191 | 10 | 30 | 5 | 23 | 21 | 16 | 21 | 18 | 21 | 16 | 10 | 7 | 3 | 6 | 3 | … | … | … |
| Females | 433 | 214 | 9 | 45 | 8 | 26 | 26 | 25 | 27 | 16 | 13 | 11 | 4 | 3 | 2 | 2 | 1 | … | … | 1 | |
| Blenheim— | |||||||||||||||||||||
| Unmarried | Males | 712 | 473 | 13 | 79 | 14 | 50 | 33 | 12 | 14 | 7 | 7 | 3 | 2 | 4 | … | … | … | … | … | 1 |
| Females | 690 | 503 | 23 | 104 | 19 | 28 | 8 | 2 | 1 | 2 | … | … | … | … | … | … | … | … | … | … | |
| Married | Males | 325 | … | … | 1 | … | 25 | 53 | 53 | 40 | 49 | 43 | 29 | 9 | 12 | 5 | 4 | 1 | … | … | 1 |
| Females | 341 | … | … | 3 | 8 | 58 | 72 | 64 | 41 | 35 | 19 | 13 | 10 | 10 | 5 | 2 | … | … | … | 1 | |
| Widowed | Males | 14 | … | … | … | … | … | 1 | 1 | 1 | 1 | 3 | … | 2 | 4 | … | 2 | … | … | … | … |
| Females | 25 | … | … | … | … | … | 2 | 2 | 2 | 2 | 5 | 3 | 2 | 1 | 3 | … | 1 | 2 | … | … | |
| Unspecified | Males | … | … | … | … | … | … | … | … | … | … | … | … | … | … | … | … | … | … | … | … |
| Females | … | … | … | … | … | … | … | … | … | … | … | … | … | … | … | … | … | … | … | … | |
| Total | Males | 1,051 | 473 | 13 | 80 | 14 | 75 | 86 | 66 | 55 | 57 | 53 | 32 | 13 | 20 | 5 | 6 | 1 | … | … | 2 |
| Females | 1,056 | 503 | 23 | 107 | 27 | 86 | 82 | 68 | 44 | 39 | 24 | 16 | 12 | 11 | 8 | 2 | 1 | 2 | … | 1 | |
| Nelson— | |||||||||||||||||||||
| Unmarried | Males | 2,245 | 1,368 | 96 | 358 | 54 | 145 | 70 | 38 | 37 | 26 | 15 | 19 | 10 | 4 | 1 | 3 | … | … | … | 1 |
| Females | 2,250 | 1,323 | 72 | 462 | 68 | 179 | 53 | 28 | 21 | 17 | 4 | 7 | 5 | 2 | 4 | 2 | … | 2 | … | 1 | |
| Married | Males | 934 | … | … | 2 | 2 | 34 | 93 | 98 | 133 | 137 | 134 | 105 | 75 | 50 | 37 | 15 | 12 | 2 | … | 5 |
| Females | 1,030 | … | … | 12 | 8 | 92 | 159 | 144 | 147 | 128 | 128 | 75 | 50 | 42 | 23 | 10 | 6 | 2 | … | 4 | |
| Widowed | Males | 79 | … | … | … | … | 1 | 1 | 3 | 5 | 6 | 6 | 11 | 9 | 11 | 7 | 6 | 10 | 3 | … | … |
| Females | 221 | … | … | … | … | 2 | 6 | 12 | 16 | 32 | 23 | 18 | 25 | 20 | 16 | 25 | 15 | 11 | … | … | |
| Unspecified | Males | 3 | … | … | … | … | … | … | … | … | … | … | … | … | … | … | 1 | … | … | … | 2 |
| Females | 2 | … | … | … | … | … | … | … | … | 1 | … | … | … | 1 | … | … | … | … | … | … | |
| Total | Males | 3,261 | 1,368 | 96 | 360 | 56 | 180 | 164 | 139 | 175 | 169 | 155 | 135 | 94 | 65 | 45 | 25 | 22 | 5 | … | 8 |
| Females | 3,503 | 1,323 | 72 | 474 | 76 | 273 | 218 | 184 | 184 | 178 | 155 | 100 | 80 | 65 | 43 | 37 | 21 | 15 | … | 5 | |
| Westport— | |||||||||||||||||||||
| Unmarried | Males | 372 | 252 | 10 | 22 | 3 | 9 | 8 | 11 | 17 | 9 | 15 | 10 | 3 | 1 | … | 1 | … | … | … | 1 |
| Females | 295 | 212 | 10 | 38 | 5 | 14 | 7 | 2 | 1 | 3 | … | 2 | … | 1 | … | … | … | … | … | … | |
| Married | Males | 155 | … | … | … | … | 3 | 9 | 18 | 28 | 40 | 29 | 20 | 3 | 4 | 1 | … | … | … | … | … |
| Females | 162 | … | … | 5 | 3 | 13 | 27 | 30 | 35 | 21 | 18 | 7 | 1 | 1 | … | 1 | … | … | … | … | |
| Widowed | Males | 11 | … | … | … | … | … | … | … | … | 3 | 2 | 2 | … | … | … | 3 | … | … | … | 1 |
| Females | 18 | … | … | … | … | … | … | 1 | 3 | 4 | 4 | … | 2 | 1 | … | 1 | 2 | … | … | … | |
Table IX. Table IX. Showing the Numbers and Ages of the Unmarried, Married, Widowed, and Unspecified, Males and Females (exclusive of Maoris), in each Borough—continued.
| Boroughs. | All Ages. | Under 14 years. | 14–15. | 15 and under 21. | 21 and under 40. | 40 and under 60. | 60 and under 80. | 80 and upwards. | Unspecified Children. | Unspecified Adults. | |||||||||||
|---|---|---|---|---|---|---|---|---|---|---|---|---|---|---|---|---|---|---|---|---|---|
| 15–20. | 20–21. | 21–25. | 25–30. | 30–35. | 35–40. | 40–45 | 45–50. | 50–55. | 55–60. | 60–65. | 65–70. | 70–75. | 75–80. | ||||||||
| Unspecified | Males | … | … | … | … | … | … | … | … | … | … | … | … | … | … | … | … | … | … | … | … |
| Females | … | … | … | … | … | … | … | … | … | … | … | … | … | … | … | … | … | … | … | … | |
| Total | Males | 538 | 252 | 10 | 22 | 3 | 12 | 17 | 29 | 45 | 52 | 46 | 32 | 6 | 5 | 1 | 4 | … | … | … | 2 |
| Females | 475 | 212 | 10 | 43 | 8 | 27 | 34 | 33 | 39 | 28 | 22 | 9 | 3 | 3 | … | 2 | 2 | … | … | … | |
| Greymouth— | |||||||||||||||||||||
| Unmarried | Males | 905 | 522 | 31 | 102 | 11 | 36 | 4 | 33 | 38 | 38 | 21 | 14 | 5 | 5 | 1 | 1 | … | … | … | 3 |
| Females | 773 | 546 | 27 | 94 | 25 | 30 | 26 | 9 | 7 | 4 | 3 | … | … | … | … | 1 | … | … | … | 1 | |
| Married | Males | 383 | … | … | … | … | 6 | 30 | 54 | 65 | 98 | 71 | 32 | 18 | 6 | 2 | … | … | … | … | 1 |
| Females | 387 | … | … | 4 | 7 | 41 | 52 | 69 | 81 | 70 | 46 | 7 | 6 | 2 | … | … | 1 | … | … | 1 | |
| Widowed | Males | 42 | … | … | … | … | … | … | 2 | 2 | 4 | 10 | 8 | 4 | 5 | 5 | 1 | 1 | … | … | … |
| Females | 53 | … | … | … | … | … | 2 | 4 | 11 | 12 | 4 | 8 | 2 | 3 | 3 | 2 | 1 | 1 | … | … | |
| Unspecified | Males | 1 | … | … | … | … | … | … | … | … | … | … | … | … | … | … | 1 | … | … | … | … |
| Females | … | … | … | … | … | … | … | … | … | … | … | … | … | … | … | … | … | … | … | … | |
| Total | Males | 1,331 | 522 | 31 | 102 | 11 | 42 | 74 | 89 | 105 | 140 | 102 | 54 | 27 | 16 | 8 | 3 | 1 | … | … | 4 |
| Females | 1,213 | 546 | 27 | 98 | 32 | 71 | 80 | 82 | 99 | 86 | 53 | 15 | 8 | 5 | 3 | 3 | 2 | 1 | … | 2 | |
| Hokitika— | |||||||||||||||||||||
| Unmarried | Males | 863 | 540 | 37 | 118 | 6 | 33 | 18 | 20 | 18 | 28 | 20 | 11 | 10 | 3 | 1 | … | … | … | … | … |
| Females | 861 | 607 | 32 | 130 | 12 | 38 | 20 | 6 | 7 | 4 | 1 | 1 | … | 2 | … | 1 | … | … | … | … | |
| Married | Males | 368 | … | … | … | … | 7 | 22 | 20 | 63 | 92 | 75 | 52 | 18 | 10 | 5 | 2 | 1 | 1 | … | … |
| Females | 416 | … | … | 6 | 5 | 27 | 45 | 64 | 93 | 81 | 50 | 29 | 7 | 3 | 3 | 1 | 1 | … | … | 1 | |
| Widowed | Males | 33 | … | … | … | … | … | … | 2 | 2 | 4 | 7 | 6 | 3 | 5 | … | 2 | 1 | 1 | … | … |
| Females | 59 | … | … | … | … | 2 | 2 | 3 | 12 | 14 | 3 | 8 | 4 | 3 | 4 | 2 | 1 | 1 | … | … | |
| Unspecified | Males | … | … | … | … | … | … | … | … | … | … | … | … | … | … | … | … | … | … | … | … |
| Females | … | … | … | … | … | … | … | … | … | … | … | … | … | … | … | … | … | … | … | … | |
| Total | Males | 1,264 | 540 | 37 | 118 | 6 | 40 | 40 | 42 | 83 | 124 | 102 | 69 | 31 | 18 | 6 | 4 | 2 | 2 | … | … |
| Females | 1,336 | 607 | 32 | 136 | 17 | 67 | 67 | 73 | 112 | 99 | 54 | 38 | 11 | 8 | 7 | 4 | 2 | 1 | … | 1 | |
| Ross— | |||||||||||||||||||||
| Unmarried | Males | 478 | 256 | 8 | 28 | 1 | 19 | 25 | 24 | 28 | 30 | 34 | 15 | 6 | 4 | … | … | … | … | … | … |
| Females | 325 | 274 | 15 | 26 | 2 | 3 | 3 | 1 | 1 | … | … | … | … | … | … | … | … | … | … | … | |
| Married | Males | 151 | … | … | … | … | 1 | 5 | 11 | 32 | 44 | 29 | 17 | 7 | 2 | 2 | 1 | … | … | … | … |
| Females | 156 | … | … | … | … | 12 | 10 | 35 | 38 | 32 | 17 | 7 | 2 | 2 | 1 | … | … | … | … | … | |
| Widowed | Males | 12 | … | … | … | … | … | … | … | 1 | 2 | 1 | 4 | 2 | 1 | … | 1 | … | … | … | … |
| Females | 11 | … | … | … | … | … | … | … | 2 | 1 | 5 | … | 2 | 1 | … | … | … | … | … | … | |
| Unspecified | Males | 6 | … | … | … | … | … | 1 | 1 | 1 | 2 | 1 | … | … | … | … | … | … | … | … | … |
| Females | … | … | … | … | … | … | … | … | … | … | … | … | … | … | … | … | … | … | … | … | |
| Total | Males | 647 | 256 | 8 | 28 | 1 | 20 | 31 | 36 | 62 | 78 | 65 | 36 | 15 | 7 | 2 | 2 | … | … | … | … |
| Females | 492 | 274 | 15 | 26 | 2 | 15 | 13 | 36 | 41 | 33 | 22 | 7 | 4 | 3 | 1 | … | … | … | … | … | |
| Kumara— | |||||||||||||||||||||
| Unmarried | Males | 426 | 234 | 8 | 21 | 3 | 19 | 20 | 24 | 18 | 35 | 21 | 11 | 6 | 3 | 1 | … | … | … | … | 2 |
| Females | 323 | 239 | 8 | 51 | 6 | 7 | 6 | 1 | 3 | 2 | … | … | … | … | … | … | … | … | … | … | |
| Married | Males | 174 | … | … | … | … | 4 | 16 | 14 | 35 | 48 | 28 | 13 | 7 | 6 | 1 | … | … | … | … | 2 |
| Females | 176 | … | … | 6 | 5 | 16 | 23 | 39 | 42 | 23 | 7 | 6 | 4 | 2 | 1 | … | … | … | … | 2 | |
| Widowed | Males | 20 | … | … | … | … | … | … | 1 | 1 | 3 | 3 | 8 | 3 | … | 1 | … | … | … | … | … |
| Females | 24 | … | … | … | … | … | 2 | 3 | 7 | 1 | 1 | 3 | 2 | 3 | 1 | 1 | … | … | … | … | |
Table IX. Table IX. Showing the Numbers and Ages of the Unmarried, Married, Widowed, and Unspecified, Males and Females (exclusive of Maoris), in each Borough—continued.
| Boroughs. | All Ages. | Under 14 years. | 14–15. | 15 and under 21. | 21 and under 40. | 40 and under 60. | 60 and under 80. | 80 and upwards. | Unspecified Children. | Unspecified Adults. | |||||||||||
|---|---|---|---|---|---|---|---|---|---|---|---|---|---|---|---|---|---|---|---|---|---|
| 15–20. | 20–21. | 21–25. | 25–30. | 30–35. | 35–40. | 40–45 | 45–50. | 50–55. | 55–60. | 60–65. | 65–70. | 70–75. | 75–80. | ||||||||
| Kumara—continued— | |||||||||||||||||||||
| Unspecified | Males | 2 | … | … | … | … | … | … | … | 1 | … | … | 1 | … | … | … | … | … | … | … | … |
| Females | … | … | … | … | … | … | … | … | … | … | … | … | … | … | … | … | … | … | … | … | |
| Total | Males | 622 | 234 | 8 | 21 | 3 | 23 | 36 | 39 | 55 | 86 | 52 | 33 | 16 | 9 | 3 | … | … | … | … | 4 |
| Females | 523 | 239 | 8 | 57 | 11 | 23 | 31 | 43 | 52 | 26 | 8 | 9 | 6 | 5 | 2 | 1 | … | … | … | 2 | |
| Ashburton— | |||||||||||||||||||||
| Unmarried | Males | 580 | 291 | 8 | 59 | 12 | 52 | 58 | 33 | 21 | 10 | 12 | 6 | … | 6 | 4 | 2 | 3 | 1 | 1 | 1 |
| Females | 440 | 295 | 12 | 75 | 9 | 27 | 10 | 6 | … | 2 | 1 | 1 | 1 | … | … | … | … | … | … | 1 | |
| Married | Males | 241 | … | … | 1 | … | 8 | 43 | 45 | 50 | 29 | 32 | 13 | 6 | 6 | 3 | 1 | 1 | … | … | 3 |
| Females | 227 | … | … | 4 | 6 | 33 | 52 | 40 | 39 | 21 | 17 | 8 | 2 | 1 | 3 | … | … | … | … | 1 | |
| Widowed | Males | 23 | … | … | … | … | 1 | 3 | … | 6 | … | 2 | 4 | 2 | … | … | 2 | 1 | 1 | … | 1 |
| Females | 14 | … | … | … | … | … | … | … | 1 | 4 | 3 | 1 | … | 2 | 3 | … | … | … | … | … | |
| Unspecified | Males | … | … | … | … | … | … | … | … | … | … | … | … | … | … | … | … | … | … | … | … |
| Females | 1 | … | … | … | … | 1 | … | … | … | … | … | … | … | … | … | … | … | … | … | … | |
| Total | Males | 844 | 291 | 8 | 60 | 12 | 61 | 104 | 78 | 77 | 39 | 46 | 23 | 8 | 12 | 7 | 5 | 5 | 2 | 1 | 5 |
| Females | 682 | 295 | 12 | 79 | 15 | 61 | 62 | 46 | 40 | 27 | 21 | 10 | 3 | 3 | 6 | … | … | … | … | 2 | |
| Kaiapoi— | |||||||||||||||||||||
| Unmarried | Males | 389 | 248 | 14 | 57 | 11 | 29 | 14 | 6 | 5 | 2 | 2 | 1 | … | … | … | … | … | … | … | … |
| Females | 401 | 263 | 19 | 71 | 9 | 20 | 11 | 3 | … | 2 | 1 | 1 | … | … | 1 | … | … | … | … | … | |
| Married | Males | 186 | … | … | … | … | 6 | 23 | 31 | 32 | 30 | 23 | 11 | 11 | 11 | 3 | 4 | 1 | … | … | … |
| Females | 200 | … | … | 2 | 2 | 18 | 41 | 26 | 30 | 19 | 25 | 13 | 11 | 6 | 5 | 1 | … | 1 | … | … | |
| Widowed | Males | 18 | … | … | … | … | 1 | 3 | 2 | 2 | 2 | 1 | 1 | 1 | 2 | 1 | … | 1 | 1 | … | … |
| Females | 26 | … | … | … | … | … | 2 | 3 | 2 | 1 | 2 | 3 | 3 | 4 | 2 | 2 | 2 | … | … | … | |
| Unspecified | Males | 1 | … | … | … | … | 1 | … | … | … | … | … | … | … | … | … | … | … | … | … | … |
| Females | … | … | … | … | … | … | … | … | … | … | … | … | … | … | … | … | … | … | … | … | |
| Total | Males | 594 | 248 | 14 | 57 | 11 | 37 | 40 | 39 | 39 | 34 | 26 | 13 | 12 | 13 | 4 | 4 | 2 | 1 | … | … |
| Females | 627 | 263 | 19 | 73 | 11 | 38 | 54 | 32 | 32 | 22 | 28 | 17 | 14 | 10 | 8 | 3 | 2 | 1 | … | … | |
| Akaroa— | |||||||||||||||||||||
| Unmarried | Males | 189 | 102 | 12 | 26 | 6 | 16 | 13 | 4 | 4 | 2 | 1 | … | 2 | … | … | 1 | … | … | … | … |
| Females | 206 | 124 | 6 | 43 | 4 | 19 | 4 | 2 | 2 | … | … | 1 | … | 1 | … | … | … | … | … | … | |
| Married | Males | 99 | … | … | 1 | … | 3 | 11 | 16 | 19 | 14 | 15 | 9 | 5 | 2 | 2 | 1 | 1 | … | … | … |
| Females | 97 | … | … | 2 | 1 | 11 | 20 | 13 | 16 | 9 | 13 | 6 | 3 | 2 | 1 | … | … | … | … | … | |
| Widowed | Males | 8 | … | … | … | … | … | 1 | 1 | … | … | 1 | … | … | 1 | … | 1 | 1 | 2 | … | … |
| Females | 12 | … | … | … | … | … | … | 2 | … | 2 | … | 2 | 1 | 1 | … | 3 | … | 1 | … | … | |
Table IX. Table IX. Showing the Numbers and Ages of the Unmarried, Married, Widowed, and Unspecified, Males and Females (exclusive of Maoris), in each Borough—continued.
| Boroughs. | All Ages. | Under 14 years. | 14–15. | 15 and under 21. | 21 and under 40. | 40 and under 60. | 60 and under 80. | 80 and upwards. | Unspecified Children. | Unspecified Adults. | |||||||||||
|---|---|---|---|---|---|---|---|---|---|---|---|---|---|---|---|---|---|---|---|---|---|
| 15–20. | 20–21. | 21–25. | 25–30. | 30–35. | 35–40. | 40–45 | 45–50. | 50–55. | 55–60. | 60–65. | 65–70. | 70–75. | 75–80. | ||||||||
| Unspecified | Males | … | … | … | … | … | … | … | … | … | … | … | … | … | … | … | … | … | … | … | … |
| Females | … | … | … | … | … | … | … | … | … | … | … | … | … | … | … | … | … | … | … | … | |
| Total | Males | 296 | 102 | 12 | 27 | 6 | 19 | 25 | 21 | 23 | 16 | 17 | 9 | 7 | 3 | 2 | 3 | 2 | 2 | … | … |
| Females | 315 | 124 | 6 | 45 | 5 | 30 | 24 | 17 | 18 | 11 | 13 | 9 | 4 | 4 | 1 | 3 | … | 1 | … | … | |
| Lyttelton— | |||||||||||||||||||||
| Unmarried | Males | 1,508 | 878 | 35 | 146 | 33 | 105 | 138 | 78 | 32 | 29 | 15 | 5 | 5 | 4 | 3 | … | … | 1 | … | 1 |
| Females | 1,222 | 893 | 49 | 150 | 32 | 62 | 21 | 8 | 4 | … | 2 | 1 | … | … | … | … | … | … | … | … | |
| Married | Males | 655 | … | … | … | … | 17 | 91 | 103 | 133 | 112 | 89 | 51 | 22 | 21 | 10 | 2 | 1 | 1 | … | 2 |
| Females | 641 | … | … | 11 | 10 | 86 | 132 | 100 | 118 | 81 | 47 | 20 | 11 | 15 | 5 | 3 | 1 | … | … | 1 | |
| Widowed | Males | 42 | … | … | … | … | … | 2 | 5 | 1 | 7 | 6 | 7 | 6 | 3 | 1 | 2 | 1 | 1 | … | … |
| Females | 59 | … | … | … | … | 1 | 2 | 2 | 8 | 7 | 5 | 3 | 9 | 9 | 4 | 2 | 5 | 2 | … | … | |
| Unspecified | Males | … | … | … | … | … | … | … | … | … | … | … | … | … | … | … | … | … | … | … | … |
| Females | … | … | … | … | … | … | … | … | … | … | … | … | … | … | … | … | … | … | … | … | |
| Total | Males | 2,205 | 878 | 35 | 146 | 33 | 122 | 231 | 186 | 166 | 148 | 110 | 63 | 33 | 28 | 14 | 4 | 2 | 3 | … | 3 |
| Females | 1,922 | 893 | 49 | 161 | 42 | 149 | 155 | 110 | 130 | 88 | 54 | 24 | 20 | 24 | 9 | 5 | 6 | 2 | … | 1 | |
| Christchurch— | |||||||||||||||||||||
| Unmarried | Males | 5,311 | 2,775 | 158 | 670 | 140 | 493 | 487 | 230 | 135 | 91 | 60 | 34 | 8 | 9 | 3 | 3 | … | … | … | 15 |
| Females | 4,792 | 2,699 | 178 | 894 | 163 | 435 | 236 | 72 | 38 | 30 | 10 | 14 | 10 | 7 | 4 | … | … | … | … | 2 | |
| Married | Males | 2,276 | … | … | … | 1 | 77 | 313 | 372 | 370 | 418 | 287 | 189 | 109 | 71 | 41 | 15 | 10 | 2 | … | 1 |
| Females | 2,331 | … | … | 32 | 30 | 255 | 449 | 402 | 372 | 320 | 202 | 116 | 62 | 53 | 22 | 9 | 4 | 1 | … | 2 | |
| Widowed | Males | 131 | … | … | … | … | 2 | 5 | 5 | 17 | 11 | 15 | 26 | 9 | 13 | 15 | 8 | 1 | 4 | … | … |
| Females | 354 | … | … | … | 3 | 5 | 16 | 31 | 31 | 55 | 44 | 39 | 36 | 42 | 16 | 24 | 5 | 6 | … | 1 | |
| Unspecified | Males | 16 | … | … | … | … | … | 3 | 2 | 2 | 2 | … | … | … | … | … | … | … | … | … | 7 |
| Females | 2 | … | … | … | … | … | 1 | … | … | … | … | … | … | … | … | … | … | … | … | 1 | |
| Total | Males | 7,734 | 2,775 | 158 | 670 | 141 | 572 | 808 | 609 | 524 | 522 | 362 | 249 | 126 | 93 | 59 | 26 | 11 | 6 | … | 23 |
| Females | 7,479 | 2,699 | 178 | 926 | 196 | 695 | 702 | 505 | 441 | 405 | 256 | 169 | 108 | 102 | 42 | 33 | 9 | 7 | … | 6 | |
| Sydenham— | |||||||||||||||||||||
| Unmarried | Males | 2,788 | 1,920 | 86 | 358 | 59 | 151 | 102 | 48 | 22 | 22 | 7 | 7 | 3 | … | 2 | 1 | … | … | … | … |
| Females | 2,529 | 1,909 | 98 | 312 | 40 | 94 | 43 | 13 | 10 | 4 | 1 | 1 | 1 | 3 | … | … | … | … | … | … | |
| Married | Males | 1,440 | … | … | 1 | 2 | 64 | 233 | 263 | 269 | 241 | 155 | 111 | 42 | 33 | 14 | 7 | 4 | 1 | … | … |
| Females | 1,503 | … | 1 | 21 | 14 | 166 | 306 | 298 | 244 | 198 | 128 | 61 | 32 | 20 | 9 | 4 | 1 | … | … | … | |
| Widowed | Males | 62 | … | … | … | … | 2 | 3 | 2 | 5 | 10 | 12 | 6 | 7 | 6 | 3 | 1 | 2 | 3 | … | … |
| Females | 138 | … | … | … | … | 1 | 6 | 6 | 8 | 23 | 15 | 14 | 20 | 21 | 10 | 9 | 3 | 2 | … | … | |
| Unspecified | Males | … | … | … | … | … | … | … | … | … | … | … | … | … | … | … | … | … | … | … | … |
| Females | … | … | … | … | … | … | … | … | … | … | … | … | … | … | … | … | … | … | … | … | |
| Total | Males | 4,290 | 1,920 | 86 | 359 | 61 | 217 | 338 | 313 | 296 | 273 | 174 | 124 | 52 | 39 | 19 | 9 | 6 | 4 | … | … |
| Females | 4,170 | 1,909 | 99 | 333 | 54 | 261 | 355 | 317 | 262 | 225 | 144 | 76 | 53 | 44 | 19 | 13 | 4 | 2 | … | … | |
| Timaru — | |||||||||||||||||||||
| Unmarried | Males | 1,452 | 711 | 44 | 149 | 41 | 145 | 163 | 82 | 46 | 34 | 16 | 9 | 3 | 3 | 3 | 1 | … | 1 | … | 1 |
| Females | 1,130 | 712 | 37 | 196 | 35 | 92 | 30 | 12 | 7 | 3 | 3 | … | … | 1 | … | … | … | … | … | 2 | |
| Married | Males | 625 | … | … | … | 1 | 27 | 95 | 107 | 126 | 109 | 73 | 42 | 19 | 12 | 8 | 3 | 2 | … | … | 1 |
| Females | 606 | … | … | 10 | 6 | 83 | 130 | 93 | 103 | 79 | 48 | 28 | 12 | 7 | 4 | … | 1 | 1 | … | 1 | |
| Widowed | Males | 39 | … | … | … | … | … | 2 | 3 | 7 | 4 | 4 | 8 | 3 | 3 | 2 | … | 2 | 1 | … | … |
| Females | 64 | … | … | … | … | 2 | 1 | 7 | 9 | 3 | 6 | 10 | 5 | 10 | 4 | 6 | 1 | … | … | … | |
Table IX. Table IX. Showing the Numbers and Ages of the Unmarried, Married, Widowed, and Unspecified, Males and Females (exclusive of Maoris), in each Borough—continued.
| Boroughs. | All Ages. | Under 14 years. | 14–15. | 15 and under 21. | 21 and under 40. | 40 and under 60. | 60 and under 80. | 80 and upwards. | Unspecified Children. | Unspecified Adults. | |||||||||||
|---|---|---|---|---|---|---|---|---|---|---|---|---|---|---|---|---|---|---|---|---|---|
| 15–20. | 20–21. | 21–25. | 25–30. | 30–35. | 35–40. | 40–45 | 45–50. | 50–55. | 55–60. | 60–65. | 65–70. | 70–75. | 75–80. | ||||||||
| Timaru—continued. | |||||||||||||||||||||
| Unspecified | Males | 1 | … | … | … | … | … | … | … | … | … | … | … | … | … | … | 1 | … | … | … | … |
| Females | … | … | … | … | … | … | … | … | … | … | … | … | … | … | … | … | … | … | … | … | |
| Total | Males | 2,117 | 711 | 44 | 149 | 42 | 172 | 260 | 192 | 179 | 147 | 93 | 59 | 25 | 18 | 13 | 5 | 4 | 2 | … | 2 |
| Females | 1,800 | 712 | 37 | 206 | 41 | 177 | 161 | 112 | 119 | 85 | 57 | 38 | 17 | 18 | 8 | 6 | 2 | 1 | … | 3 | |
| Rangiora— | |||||||||||||||||||||
| Unmarried | Males | 494 | 297 | 18 | 71 | 10 | 43 | 31 | 7 | 8 | 3 | 3 | … | 1 | … | … | … | … | … | … | 2 |
| Females | 436 | 294 | 17 | 58 | 17 | 31 | 9 | 2 | 1 | 2 | … | 3 | 1 | … | … | … | … | … | … | 1 | |
| Married | Males | 234 | … | … | … | … | 8 | 27 | 39 | 42 | 37 | 25 | 19 | 10 | 15 | 5 | 4 | 2 | … | … | 1 |
| Females | 240 | … | … | 6 | 4 | 21 | 39 | 41 | 38 | 30 | 31 | 13 | 9 | 3 | 5 | … | … | … | … | … | |
| Widowed | Males | 14 | … | … | … | … | … | … | 1 | 1 | … | 2 | 2 | 1 | 3 | 1 | 3 | … | … | … | … |
| Females | 25 | … | … | … | … | … | 1 | 1 | 4 | 2 | 1 | 7 | 1 | 2 | 2 | 2 | 2 | … | … | … | |
| Unspecified | Males | 1 | … | … | … | … | … | … | … | … | … | … | 1 | … | … | … | … | … | … | … | … |
| Females | 1 | … | … | … | … | … | … | … | … | … | … | … | 1 | … | … | … | … | … | … | … | |
| Total | Males | 743 | 297 | 18 | 71 | 10 | 51 | 58 | 47 | 51 | 40 | 30 | 22 | 12 | 18 | 6 | 7 | 2 | … | … | 3 |
| Females | 702 | 294 | 17 | 64 | 21 | 52 | 49 | 44 | 43 | 34 | 32 | 23 | 12 | 5 | 7 | 2 | 2 | … | … | 1 | |
| Waimate— | |||||||||||||||||||||
| Unmarried | Males | 602 | 374 | 15 | 47 | 11 | 36 | 52 | 23 | 16 | 11 | 7 | 5 | 1 | 1 | 1 | … | … | 1 | … | 1 |
| Females | 441 | 340 | 15 | 59 | 3 | 17 | 5 | 1 | … | … | 1 | … | … | … | … | … | … | … | … | … | |
| Married | Males | 256 | … | … | … | … | 9 | 35 | 53 | 52 | 47 | 24 | 19 | 8 | 7 | 1 | … | … | … | … | 1 |
| Females | 270 | … | … | 10 | 3 | 28 | 56 | 53 | 46 | 41 | 13 | 13 | 4 | 2 | … | 1 | … | … | … | … | |
| Widowed | Males | 12 | … | … | … | … | … | 1 | 2 | 1 | … | 2 | 3 | 1 | 1 | … | … | 1 | … | … | … |
| Females | 19 | … | … | … | … | … | 2 | … | 1 | 5 | 1 | 3 | 1 | 2 | 2 | 2 | … | … | … | … | |
| Unspecified | Males | … | … | … | … | … | … | … | … | … | … | … | … | … | … | … | … | … | … | … | … |
| Females | … | … | … | … | … | … | … | … | … | … | … | … | … | … | … | … | … | … | … | … | |
| Total | Males | 870 | 374 | 15 | 47 | 11 | 45 | 88 | 78 | 69 | 58 | 33 | 27 | 10 | 9 | 2 | … | 1 | 1 | … | 2 |
| Females | 730 | 340 | 15 | 69 | 6 | 45 | 63 | 54 | 47 | 46 | 15 | 16 | 5 | 4 | 2 | 3 | … | … | … | … | |
| Oamaru— | |||||||||||||||||||||
| Unmarried | Males | 2,050 | 1,200 | 53 | 198 | 50 | 159 | 164 | 71 | 52 | 39 | 35 | 8 | 5 | 6 | 3 | … | 1 | … | 2 | 4 |
| Females | 1,758 | 1,228 | 62 | 253 | 33 | 97 | 44 | 12 | 9 | 10 | 4 | 3 | 2 | … | … | … | … | … | … | 1 | |
| Married | Males | 905 | … | … | … | 3 | 27 | 163 | 154 | 172 | 181 | 101 | 52 | 14 | 19 | 10 | 6 | 1 | 1 | … | 1 |
| Females | 933 | … | … | 12 | 17 | 121 | 186 | 182 | 162 | 129 | 47 | 32 | 21 | 14 | 5 | 2 | 1 | … | … | 2 | |
| Widowed | Males | 47 | … | … | … | … | … | 1 | 1 | 8 | 7 | 7 | 5 | 3 | 5 | 5 | 3 | 2 | … | … | … |
| Females | 89 | … | … | … | … | … | 6 | 11 | 14 | 16 | 9 | 9 | 8 | 5 | 5 | 5 | 1 | … | … | … | |
Table IX. Table IX. Showing the Numbers and Ages of the Unmarried, Married, Widowed, and Unspecified, Males and Females (exclusive of Maoris), in each Borough—continued.
| Boroughs. | All Ages. | Under 14 years. | 14–15. | 15 and under 21. | 21 and under 40. | 40 and under 60. | 60 and under 80. | 80 and upwards. | Unspecified Children. | Unspecified Adults. | |||||||||||
|---|---|---|---|---|---|---|---|---|---|---|---|---|---|---|---|---|---|---|---|---|---|
| 15–20. | 20–21. | 21–25. | 25–30. | 30–35. | 35–40. | 40–45 | 45–50. | 50–55. | 55–60. | 60–65. | 65–70. | 70–75. | 75–80. | ||||||||
| Unspecified | Males | 5 | … | … | 2 | … | … | … | … | 1 | … | … | 1 | 1 | … | … | … | … | … | … | … |
| Females | 4 | … | … | … | … | 2 | … | 1 | 1 | … | … | … | … | … | … | … | … | … | … | … | |
| Total | Males | 3,007 | 1,200 | 53 | 200 | 53 | 186 | 328 | 226 | 233 | 227 | 143 | 66 | 23 | 30 | 18 | 9 | 4 | 1 | 2 | 5 |
| Females | 2,784 | 1,228 | 62 | 265 | 50 | 220 | 236 | 206 | 186 | 155 | 60 | 44 | 31 | 19 | 10 | 7 | 2 | … | … | 3 | |
| Hampden— | |||||||||||||||||||||
| Unmarried | Males | 121 | 82 | 5 | 12 | … | 9 | 3 | 1 | 3 | 2 | 1 | 1 | 1 | … | 1 | … | … | … | … | … |
| Females | 88 | 70 | 2 | 11 | 1 | 3 | … | … | 1 | … | … | … | … | … | … | … | … | … | … | … | |
| Married | Males | 51 | … | … | … | … | … | 9 | 10 | 5 | 14 | 2 | 4 | 3 | 3 | … | 1 | … | … | … | … |
| Females | 56 | … | … | … | 1 | 6 | 15 | 11 | 7 | 3 | 6 | 4 | 2 | … | … | 1 | … | … | … | … | |
| Widowed | Males | 8 | … | … | … | … | … | 1 | … | … | 1 | 1 | 1 | 1 | … | 2 | 1 | … | … | … | … |
| Females | 3 | … | … | … | … | … | … | 2 | … | … | … | … | … | … | 1 | … | … | … | … | … | |
| Unspecified | Males | … | … | … | … | … | … | … | … | … | … | … | … | … | … | … | … | … | … | … | … |
| Females | … | … | … | … | … | … | … | … | … | … | … | … | … | … | … | … | … | … | … | … | |
| Total | Males | 180 | 82 | 5 | 12 | … | 9 | 13 | 11 | 8 | 17 | 4 | 6 | 5 | 3 | 3 | 2 | … | … | … | … |
| Females | 147 | 70 | 2 | 11 | 2 | 9 | 15 | 13 | 8 | 3 | 6 | 4 | 2 | … | 1 | 1 | … | … | … | … | |
| Palmerston South— | |||||||||||||||||||||
| Unmarried | Males | 370 | 210 | 7 | 34 | 4 | 32 | 26 | 17 | 12 | 11 | 6 | 3 | 3 | 1 | … | … | … | 1 | … | 3 |
| Females | 283 | 188 | 20 | 44 | 6 | 18 | 5 | … | … | 1 | … | … | … | … | … | 1 | … | … | … | … | |
| Married | Males | 141 | … | … | … | … | 5 | 25 | 19 | 25 | 32 | 16 | 10 | 6 | 2 | … | 1 | … | … | … | … |
| Females | 150 | … | … | 3 | 3 | 18 | 39 | 26 | 19 | 17 | 17 | 3 | 3 | 2 | … | … | … | … | … | … | |
| Widowed | Males | 6 | … | … | … | … | … | … | … | 1 | … | … | 2 | … | 1 | … | … | 1 | 1 | … | … |
| Females | 17 | … | … | … | … | … | 2 | … | … | 1 | 2 | 3 | 3 | 4 | … | 2 | … | … | … | … | |
| Unspecified | Males | 1 | … | … | … | … | … | … | … | 1 | … | … | … | … | … | … | … | … | … | … | … |
| Females | … | … | … | … | … | … | … | … | … | … | … | … | … | … | … | … | … | … | … | … | |
| Total | Males | 518 | 210 | 7 | 34 | 4 | 37 | 51 | 36 | 39 | 43 | 22 | 15 | 9 | 4 | … | 1 | 1 | 2 | … | 3 |
| Females | 450 | 188 | 20 | 47 | 9 | 36 | 46 | 26 | 19 | 19 | 19 | 6 | 6 | 6 | … | 3 | … | … | … | … | |
| Hawkesbury West— | |||||||||||||||||||||
| Unmarried | Males | 149 | 93 | 11 | 17 | 1 | 10 | 4 | 5 | 7 | … | … | … | … | … | 1 | … | … | … | … | … |
| Females | 136 | 97 | 6 | 15 | 5 | 5 | 5 | 1 | 1 | 1 | … | … | … | … | … | … | … | … | … | … | |
| Married | Males | 52 | … | … | … | … | … | 4 | 3 | 9 | 14 | 7 | 7 | 6 | 2 | … | … | … | … | … | … |
| Females | 63 | … | … | 1 | … | 5 | 5 | 8 | 10 | 15 | 11 | 3 | 3 | 1 | 1 | … | … | … | … | … | |
| Widowed | Males | 5 | … | … | … | … | … | … | … | … | 1 | … | 2 | … | 1 | … | 1 | … | … | … | … |
| Females | 10 | … | … | … | … | … | … | 1 | … | 2 | … | 2 | … | 2 | … | 1 | 1 | 1 | … | … | |
| Unspecified | Males | … | … | … | … | … | … | … | … | … | … | … | … | … | … | … | … | … | … | … | … |
| Females | … | … | … | … | … | … | … | … | … | … | … | … | … | … | … | … | … | … | … | … | |
| Total | Males | 206 | 93 | 11 | 17 | 1 | 10 | 8 | 8 | 16 | 15 | 7 | 9 | 6 | 3 | 1 | 1 | … | … | … | … |
| Females | 209 | 97 | 6 | 16 | 5 | 10 | 10 | 10 | 11 | 18 | 11 | 5 | 3 | 3 | 1 | 1 | 1 | 1 | … | … | |
| Port Chalmers— | |||||||||||||||||||||
| Unmarried | Males | 806 | 436 | 21 | 91 | 15 | 60 | 73 | 33 | 23 | 25 | 13 | 8 | 3 | 3 | … | … | … | … | 1 | 1 |
| Females | 645 | 454 | 27 | 97 | 15 | 28 | 12 | 5 | 2 | 2 | … | 2 | … | 1 | … | … | … | … | … | … | |
| Married | Males | 332 | … | … | … | … | 14 | 45 | 54 | 52 | 52 | 43 | 44 | 7 | 13 | 4 | 3 | … | … | … | 1 |
| Females | 344 | … | … | 8 | 7 | 38 | 58 | 66 | 58 | 36 | 32 | 13 | 18 | 4 | 4 | … | 1 | … | … | 1 | |
| Widowed | Males | 17 | … | … | … | … | … | 2 | … | 4 | … | 4 | 1 | 1 | … | 2 | 1 | 1 | 1 | … | … |
| Females | 35 | … | … | … | … | 2 | 2 | 1 | 6 | 3 | 4 | 3 | 3 | 4 | 1 | 5 | … | 1 | … | … | |
Table IX. Table IX. Showing the Numbers and Ages of the Unmarried, Married, Widowed, and Unspecified, Males and Females (exclusive of Maoris), in each Borough—continued.
| Boroughs. | All Ages. | Under 14 years. | 14–15. | 15 and under 21. | 21 and under 40. | 40 and under 60. | 60 and under 80. | 80 and upwards. | Unspecified Children. | Unspecified Adults. | |||||||||||
|---|---|---|---|---|---|---|---|---|---|---|---|---|---|---|---|---|---|---|---|---|---|
| 15–20. | 20–21. | 21–25. | 25–30. | 30–35. | 35–40. | 40–45 | 45–50. | 50–55. | 55–60. | 60–65. | 65–70. | 70–75. | 75–80. | ||||||||
| Port Chalmers—continued. | |||||||||||||||||||||
| Unspecified | Males | 1 | … | … | … | … | … | … | … | … | … | 1 | … | … | … | … | … | … | … | … | … |
| Females | 1 | … | … | … | … | … | … | … | … | 1 | … | … | … | … | … | … | … | … | … | … | |
| Total | Males | 1,156 | 436 | 21 | 91 | 15 | 74 | 120 | 87 | 79 | 77 | 61 | 53 | 11 | 16 | 6 | 4 | 1 | 1 | 1 | 2 |
| Females | 1,025 | 454 | 27 | 105 | 22 | 68 | 72 | 72 | 66 | 42 | 36 | 18 | 21 | 9 | 5 | 5 | 1 | 1 | … | 1 | |
| Dunedin— | |||||||||||||||||||||
| Unmarried | Males | 8,491 | 4,319 | 275 | 1,154 | 230 | 821 | 626 | 342 | 234 | 201 | 129 | 76 | 42 | 20 | 2 | 2 | 1 | … | 2 | 15 |
| Females | 7,769 | 4,448 | 523 | 1,421 | 242 | 639 | 317 | 128 | 86 | 52 | 38 | 27 | 16 | 14 | 3 | 3 | 2 | 2 | … | 8 | |
| Married | Males | 3,502 | … | … | 1 | 4 | 106 | 444 | 528 | 543 | 589 | 533 | 370 | 166 | 119 | 45 | 28 | 12 | 4 | … | 10 |
| Females | 3,747 | … | … | 54 | 55 | 382 | 632 | 579 | 628 | 557 | 371 | 228 | 117 | 81 | 23 | 113 | 9 | 1 | … | 17 | |
| Widowed | Males | 252 | … | … | … | 1 | … | 4 | 13 | 20 | 37 | 39 | 42 | 25 | 29 | 12 | 16 | 2 | 9 | … | 3 |
| Females | 608 | … | … | … | … | 5 | 21 | 45 | 57 | 83 | 85 | 81 | 60 | 68 | 44 | 28 | 19 | 12 | … | … | |
| Unspecified | Males | 1 | … | … | … | … | … | … | … | … | 1 | … | … | … | … | … | … | … | … | … | … |
| Females | 2 | … | … | … | … | … | … | … | … | … | … | … | … | 1 | … | … | … | … | … | 1 | |
| Total | Males | 12,246 | 4,319 | 275 | 1,155 | 235 | 927 | 1,074 | 883 | 797 | 828 | 701 | 488 | 233 | 168 | 59 | 46 | 15 | 13 | 2 | 28 |
| Females | 12,126 | 4,448 | 323 | 1,475 | 297 | 1,026 | 970 | 752 | 771 | 692 | 494 | 336 | 193 | 164 | 70 | 44 | 30 | 15 | … | 26 | |
| Roslyn— | |||||||||||||||||||||
| Unmarried | Males | 976 | 623 | 50 | 150 | 22 | 62 | 28 | 11 | 8 | 7 | 5 | 2 | 4 | 3 | … | 1 | … | … | … | … |
| Females | 949 | 617 | 40 | 156 | 33 | 53 | 27 | 9 | 6 | … | 1 | 2 | 2 | 1 | … | … | … | 1 | … | 1 | |
| Married | Males | 434 | … | … | … | … | 12 | 61 | 65 | 65 | 82 | 73 | 36 | 17 | 14 | 4 | 2 | 2 | 1 | … | … |
| Females | 456 | … | … | 6 | 6 | 42 | 75 | 67 | 77 | 84 | 54 | 22 | 11 | 6 | 4 | … | … | 2 | … | … | |
| Widowed | Males | 18 | … | … | … | … | 1 | … | 2 | 1 | 2 | 3 | 1 | 2 | 1 | … | 2 | 2 | 1 | … | … |
| Females | 42 | … | … | … | … | 1 | 2 | 1 | 7 | 4 | 5 | 3 | 1 | 9 | 3 | 4 | 2 | … | … | … | |
| Unspecified | Males | … | … | … | … | … | … | … | … | … | … | … | … | … | … | … | … | … | … | … | … |
| Females | … | … | … | … | … | … | … | … | … | … | … | … | … | … | … | … | … | … | … | … | |
| Total | Males | 1,428 | 623 | 50 | 150 | 22 | 75 | 89 | 78 | 74 | 91 | 81 | 39 | 23 | 18 | 4 | 5 | 4 | 2 | … | … |
| Females | 1,447 | 617 | 40 | 162 | 39 | 96 | 104 | 77 | 90 | 88 | 60 | 27 | 14 | 16 | 7 | 4 | 2 | 3 | … | 1 | |
| Caversham— | |||||||||||||||||||||
| Unmarried | Males | 1,437 | 1,005 | 55 | 164 | 26 | 83 | 37 | 15 | 10 | 3 | 7 | 2 | 4 | 4 | 3 | 7 | 2 | … | 4 | 6 |
| Females | 1,246 | 907 | 48 | 155 | 17 | 56 | 29 | 11 | 4 | 4 | 1 | 1 | 4 | 2 | 1 | … | … | 1 | 5 | … | |
| Married | Males | 585 | … | … | … | … | 28 | 72 | 101 | 97 | 86 | 77 | 59 | 34 | 13 | 9 | 4 | 2 | 1 | … | 2 |
| Females | 611 | … | … | 9 | 8 | 67 | 97 | 108 | 112 | 84 | 60 | 33 | 18 | 4 | 6 | 1 | 1 | … | … | 3 | |
| Widowed | Males | 38 | … | … | … | … | … | 2 | 2 | 3 | 3 | 1 | 5 | 4 | 4 | 4 | 6 | 3 | 1 | … | … |
| Females | 68 | … | … | … | … | 4 | 2 | 4 | 8 | 12 | 3 | 10 | 5 | 6 | 5 | 7 | 1 | 1 | … | … | |
Table IX. Table IX. Showing the Numbers and Ages of the Unmarried, Married, Widowed, and Unspecified, Males and Females (exclusive of Maoris), in each Borough—continued.
| Boroughs. | All Ages. | Under 14 years. | 14–15. | 15 and under 21. | 21 and under 40. | 40 and under 60. | 60 and under 80. | 80 and upwards. | Unspecified Children. | Unspecified Adults. | |||||||||||
|---|---|---|---|---|---|---|---|---|---|---|---|---|---|---|---|---|---|---|---|---|---|
| 15–20. | 20–21. | 21–25. | 25–30. | 30–35. | 35–40. | 40–45 | 45–50. | 50–55. | 55–60. | 60–65. | 65–70. | 70–75. | 75–80. | ||||||||
| Unspecified | Males | 1 | … | … | … | … | … | … | … | 1 | … | … | … | … | … | … | … | … | … | … | … |
| Females | 3 | … | … | … | 1 | … | 1 | … | … | 1 | … | … | … | … | … | … | … | … | … | … | |
| Total | Males | 2,061 | 1,005 | 55 | 164 | 26 | 111 | 111 | 118 | 111 | 92 | 85 | 66 | 42 | 21 | 16 | 17 | 7 | 2 | 4 | 8 |
| Females | 1,928 | 907 | 48 | 164 | 26 | 127 | 129 | 123 | 124 | 101 | 64 | 44 | 27 | 12 | 12 | 8 | 2 | 2 | 5 | 3 | |
| Mornington— | |||||||||||||||||||||
| Unmarried | Males | 942 | 642 | 33 | 137 | 19 | 55 | 28 | 12 | 5 | 1 | 2 | 4 | 2 | … | … | … | … | … | 1 | 1 |
| Females | 971 | 687 | 49 | 145 | 16 | 36 | 18 | 11 | 3 | 1 | 2 | 1 | 2 | … | … | … | … | … | … | … | |
| Married | Males | 441 | … | … | 1 | … | 13 | 59 | 68 | 83 | 85 | 67 | 31 | 18 | 7 | 4 | 1 | 2 | … | … | 2 |
| Females | 469 | … | 1 | 5 | 8 | 44 | 65 | 85 | 99 | 81 | 40 | 23 | 6 | 9 | 2 | … | … | … | … | 1 | |
| Widowed | Males | 12 | … | … | … | … | 1 | … | … | 4 | 1 | 1 | 1 | 2 | 2 | … | … | … | … | … | … |
| Females | 49 | … | … | … | … | … | 4 | 1 | 4 | 7 | 7 | 4 | 3 | 8 | 1 | 4 | 5 | … | … | 1 | |
| Unspecified | Males | 1 | … | … | … | … | 1 | … | … | … | … | … | … | … | … | … | … | … | … | … | … |
| Females | 1 | … | … | … | … | … | … | … | 1 | … | … | … | … | … | … | … | … | … | … | … | |
| Total | Males | 1,396 | 642 | 33 | 138 | 19 | 70 | 87 | 80 | 92 | 87 | 70 | 36 | 22 | 9 | 4 | 1 | 2 | … | 1 | 3 |
| Females | 1,490 | 687 | 50 | 150 | 24 | 80 | 87 | 97 | 107 | 89 | 49 | 28 | 11 | 17 | 3 | 4 | 5 | … | … | 2 | |
| Maori Hill— | |||||||||||||||||||||
| Unmarried | Males | 420 | 248 | 18 | 57 | 8 | 25 | 20 | 18 | 8 | 5 | 5 | 2 | 1 | … | … | … | … | … | … | 5 |
| Females | 327 | 226 | 14 | 44 | 6 | 12 | 11 | 2 | 4 | 3 | 1 | 2 | … | … | … | … | … | … | … | 2 | |
| Married | Males | 173 | … | … | 1 | … | 5 | 23 | 27 | 26 | 25 | 25 | 20 | 7 | 7 | 5 | 1 | … | … | … | 1 |
| Females | 187 | … | … | 2 | 2 | 18 | 31 | 28 | 31 | 30 | 15 | 18 | 4 | 4 | 1 | 2 | … | … | … | 1 | |
| Widowed | Males | 8 | … | … | … | … | … | … | 1 | … | 1 | 1 | 2 | … | 2 | … | … | 1 | … | … | … |
| Females | 17 | … | … | … | … | … | … | 2 | 2 | 1 | 2 | 2 | 1 | 1 | 2 | 2 | 1 | 1 | … | … | |
| Unspecified | Males | 4 | … | … | … | … | 1 | … | … | 1 | … | … | … | … | … | … | … | … | … | … | 2 |
| Females | … | … | … | … | … | … | … | … | … | … | … | … | … | … | … | … | … | … | … | … | |
| Total | Males | 605 | 248 | 18 | 58 | 8 | 31 | 43 | 46 | 35 | 31 | 31 | 24 | 8 | 9 | 5 | 1 | 1 | … | … | 8 |
| Females | 531 | 226 | 14 | 46 | 8 | 30 | 42 | 32 | 37 | 34 | 18 | 22 | 5 | 5 | 3 | 4 | 1 | 1 | … | 3 | |
| St. Kilda— | |||||||||||||||||||||
| Unmarried | Males | 255 | 167 | 9 | 28 | 7 | 18 | 8 | 5 | 5 | 4 | 1 | … | … | … | … | … | … | … | … | 3 |
| Females | 250 | 182 | 6 | 38 | 7 | 9 | 4 | 1 | 1 | 1 | … | … | … | … | … | … | … | … | … | 1 | |
| Married | Males | 125 | … | … | 1 | … | 1 | 20 | 27 | 23 | 14 | 14 | 13 | 5 | 4 | 3 | … | … | … | … | … |
| Females | 129 | … | … | 1 | 2 | 11 | 27 | 28 | 15 | 18 | 15 | 7 | 4 | … | … | … | 1 | … | … | … | |
| Widowed | Males | 3 | … | … | … | … | … | … | … | … | … | 2 | … | … | … | … | 1 | … | … | … | … |
| Females | 11 | … | … | … | … | 1 | … | … | 1 | 1 | … | 2 | 1 | … | 3 | … | 1 | … | … | 1 | |
| Unspecified | Males | … | … | … | … | … | … | … | … | … | … | … | … | … | … | … | … | … | … | … | … |
| Females | … | … | … | … | … | … | … | … | … | … | … | … | … | … | … | … | … | … | … | … | |
| Total | Males | 383 | 167 | 9 | 29 | 7 | 19 | 28 | 32 | 28 | 18 | 17 | 13 | 5 | 4 | 3 | 1 | … | … | … | 3 |
| Females | 390 | 182 | 6 | 39 | 9 | 21 | 31 | 29 | 17 | 20 | 15 | 9 | 5 | … | 3 | … | 2 | … | … | 2 | |
| Dunedin South— | |||||||||||||||||||||
| Unmarried | Males | 928 | 639 | 32 | 108 | 19 | 49 | 37 | 15 | 10 | 9 | 3 | 5 | 1 | 1 | … | … | … | … | … | … |
| Females | 819 | 644 | 30 | 95 | 10 | 24 | 8 | 8 | … | … | … | … | … | … | … | … | … | … | … | … | |
| Married | Males | 491 | … | … | … | … | 17 | 88 | 97 | 92 | 70 | 48 | 40 | 24 | 11 | 3 | … | … | … | … | 1 |
| Females | 510 | … | … | 11 | 11 | 53 | 113 | 113 | 77 | 52 | 33 | 30 | 10 | 6 | 1 | … | … | … | … | … | |
| Widowed | Males | 12 | … | … | … | … | … | … | 1 | … | 1 | 4 | 3 | … | 2 | … | 1 | … | … | … | … |
| Females | 35 | … | … | … | … | … | 1 | 3 | 3 | 4 | 8 | 4 | 2 | 5 | 2 | 2 | 1 | … | … | … | |
Table IX. Table IX. Showing the Numbers and Ages of the Unmarried, Married, Widowed, and Unspecified, Males and Females (exclusive of Maoris), in each Borough—continued.
| Boroughs. | All Ages. | Under 14 years. | 14–15. | 15 and under 21. | 21 and under 40. | 40 and under 60. | 60 and under 80. | 80 and upwards. | Unspecified Children. | Unspecified Adults. | |||||||||||
|---|---|---|---|---|---|---|---|---|---|---|---|---|---|---|---|---|---|---|---|---|---|
| 15–20. | 20–21. | 21–25. | 25–30. | 30–35. | 35–40. | 40–45 | 45–50. | 50–55. | 55–60. | 60–65. | 65–70. | 70–75. | 75–80. | ||||||||
| Dunedin South—continued. | |||||||||||||||||||||
| Unspecified | Males | … | … | … | … | … | … | … | … | … | … | … | … | … | … | … | … | … | … | … | … |
| Females | 1 | … | … | … | … | … | … | … | … | … | … | … | … | 1 | … | … | … | … | … | … | |
| Total | Males | 1,431 | 639 | 32 | 108 | 19 | 66 | 125 | 113 | 102 | 80 | 55 | 48 | 25 | 14 | 3 | 1 | … | … | … | 1 |
| Females | 1,365 | 644 | 30 | 106 | 21 | 77 | 122 | 124 | 80 | 56 | 41 | 34 | 12 | 12 | 3 | 2 | 1 | … | … | … | |
| North-East Valley— | |||||||||||||||||||||
| Unmarried | Males | 950 | 664 | 32 | 105 | 16 | 55 | 32 | 13 | 10 | 6 | 5 | 5 | … | 4 | … | 1 | … | … | 1 | 1 |
| Females | 858 | 639 | 24 | 120 | 14 | 31 | 15 | 3 | 4 | 1 | 2 | … | 2 | … | … | … | … | … | … | 3 | |
| Married | Males | 445 | … | … | 1 | … | 10 | 57 | 96 | 83 | 71 | 51 | 25 | 18 | 20 | 5 | 2 | 4 | 1 | … | 1 |
| Females | 454 | … | … | 5 | 6 | 41 | 96 | 85 | 83 | 52 | 28 | 30 | 12 | 5 | 6 | 3 | … | 1 | … | 1 | |
| Widowed | Males | 15 | … | … | … | … | … | … | 1 | 1 | 1 | 4 | 2 | 1 | 2 | 1 | 1 | … | 1 | … | … |
| Females | 32 | … | … | … | … | … | 1 | 3 | 4 | 3 | 5 | 2 | 4 | 2 | 1 | 5 | 2 | … | … | … | |
| Unspecified | Males | … | … | … | … | … | … | … | … | … | … | … | … | … | … | … | … | … | … | … | … |
| Females | … | … | … | … | … | … | … | … | … | … | … | … | … | … | … | … | … | … | … | … | |
| Total | Males | 1,410 | 664 | 32 | 106 | 16 | 65 | 89 | 110 | 94 | 78 | 60 | 32 | 19 | 26 | 6 | 4 | 4 | 2 | 1 | 2 |
| Females | 1,344 | 639 | 24 | 125 | 20 | 72 | 112 | 91 | 91 | 56 | 35 | 32 | 18 | 7 | 7 | 8 | 2 | 1 | … | 4 | |
| West Harbour— | |||||||||||||||||||||
| Unmarried | Males | 434 | 300 | 22 | 35 | 5 | 17 | 17 | 19 | 5 | 10 | 1 | 1 | 1 | … | … | 1 | … | … | … | … |
| Females | 358 | 278 | 14 | 36 | 6 | 15 | 3 | … | 3 | 1 | … | 1 | … | … | 1 | … | … | … | … | … | |
| Married | Males | 194 | … | … | … | … | 4 | 20 | 26 | 52 | 37 | 23 | 16 | 10 | 4 | … | 2 | … | … | … | … |
| Females | 203 | … | … | 3 | 1 | 15 | 31 | 46 | 46 | 21 | 19 | 10 | 7 | 4 | … | … | … | … | … | … | |
| Widowed | Males | 7 | … | … | … | … | … | … | … | … | 1 | 2 | … | 2 | 2 | … | … | … | … | … | … |
| Females | 17 | … | … | … | … | … | 1 | … | 1 | 1 | 3 | 4 | 3 | 2 | 2 | … | … | … | … | … | |
| Unspecified | Males | … | … | … | … | … | … | … | … | … | … | … | … | … | … | … | … | … | … | … | … |
| Females | … | … | … | … | … | … | … | … | … | … | … | … | … | … | … | … | … | … | … | … | |
| Total | Males | 635 | 300 | 22 | 35 | 5 | 21 | 37 | 45 | 57 | 48 | 26 | 17 | 13 | 6 | … | 3 | … | … | … | … |
| Females | 578 | 278 | 14 | 39 | 7 | 30 | 35 | 46 | 50 | 23 | 22 | 15 | 10 | 6 | 3 | … | … | … | … | … | |
| Green Island— | |||||||||||||||||||||
| Unmarried | Males | 151 | 100 | 5 | 20 | 3 | 11 | 4 | 3 | 3 | … | 1 | … | … | … | … | … | … | … | … | 1 |
| Females | 144 | 118 | 4 | 10 | 4 | 5 | 2 | … | … | … | … | … | … | 1 | … | … | … | … | … | … | |
| Married | Males | 72 | … | … | … | … | 2 | 14 | 12 | 18 | 11 | 9 | 3 | 1 | 1 | … | … | … | 1 | … | … |
| Females | 78 | … | … | 1 | … | 10 | 16 | 14 | 16 | 9 | 6 | 2 | 3 | … | 1 | … | … | … | … | … | |
| Widowed | Males | 4 | … | … | … | … | … | … | … | … | 1 | … | … | … | 1 | … | 1 | … | 1 | … | … |
| Females | 10 | … | … | … | … | … | … | … | 3 | … | 1 | 2 | 1 | 1 | 1 | … | 1 | … | … | … | |
Table IX. Table IX. Showing the Numbers and Ages of the Unmarried, Married, Widowed, and Unspecified, Males and Females (exclusive of Maoris), in each Borough—continued.
| Boroughs. | All Ages. | Under 14 years. | 14–15. | 15 and under 21. | 21 and under 40. | 40 and under 60. | 60 and under 80. | 80 and upwards. | Unspecified Children. | Unspecified Adults. | |||||||||||
|---|---|---|---|---|---|---|---|---|---|---|---|---|---|---|---|---|---|---|---|---|---|
| 15–20. | 20–21. | 21–25. | 25–30. | 30–35. | 35–40. | 40–45 | 45–50. | 50–55. | 55–60. | 60–65. | 65–70. | 70–75. | 75–80. | ||||||||
| Unspecified | Males | 3 | … | … | … | … | … | 1 | … | … | … | 1 | … | … | … | 1 | … | … | … | … | … |
| Females | … | … | … | … | … | … | … | … | … | … | … | … | … | … | … | … | … | … | … | … | |
| Total | Males | 230 | 100 | 5 | 20 | 3 | 13 | 19 | 15 | 21 | 12 | 11 | 3 | 1 | 2 | 1 | 1 | … | 2 | … | 1 |
| Females | 232 | 118 | 4 | 11 | 4 | 15 | 18 | 14 | 19 | 9 | 7 | 4 | 4 | 2 | 2 | … | 1 | … | … | … | |
| Milton— | |||||||||||||||||||||
| Unmarried | Males | 448 | 291 | 12 | 60 | 6 | 27 | 13 | 10 | 11 | 1 | 6 | 2 | 6 | 2 | … | 1 | … | … | … | … |
| Females | 418 | 314 | 12 | 62 | 5 | 17 | … | 3 | 1 | … | 1 | 2 | 1 | … | … | … | … | … | … | … | |
| Married | Males | 187 | … | … | … | … | 4 | 16 | 22 | 36 | 42 | 33 | 15 | 7 | 4 | 3 | 4 | 1 | … | … | … |
| Females | 201 | … | … | … | 4 | 19 | 30 | 36 | 39 | 28 | 19 | 17 | 2 | 5 | 2 | … | … | … | … | … | |
| Widowed | Males | 12 | … | … | … | … | … | … | 2 | … | 1 | 4 | 2 | … | 1 | … | … | … | 2 | … | … |
| Females | 21 | … | … | … | … | 1 | 1 | … | 4 | 3 | 2 | 3 | 2 | 2 | 1 | 1 | … | 1 | … | … | |
| Unspecified | Males | … | … | … | … | … | … | … | … | … | … | … | … | … | … | … | … | … | … | … | … |
| Females | … | … | … | … | … | … | … | … | … | … | … | … | … | … | … | … | … | … | … | … | |
| Total | Males | 647 | 291 | 12 | 60 | 6 | 31 | 29 | 34 | 47 | 44 | 43 | 19 | 13 | 7 | 3 | 5 | 1 | 2 | … | … |
| Females | 640 | 314 | 12 | 62 | 9 | 37 | 31 | 39 | 44 | 31 | 22 | 22 | 5 | 7 | 3 | 1 | … | 1 | … | … | |
| Balclutha— | |||||||||||||||||||||
| Unmarried | Males | 303 | 175 | 6 | 35 | 9 | 23 | 22 | 10 | 9 | 6 | 1 | 4 | … | 1 | … | … | … | … | … | 2 |
| Females | 237 | 168 | 11 | 31 | 3 | 11 | 7 | … | 2 | 1 | 1 | 1 | … | … | 1 | … | … | … | … | … | |
| Married | Males | 132 | … | … | … | … | 4 | 20 | 24 | 22 | 20 | 18 | 12 | 6 | 2 | … | 1 | … | 1 | … | 2 |
| Females | 130 | … | … | 2 | 4 | 12 | 31 | 25 | 15 | 12 | 18 | 3 | 4 | 1 | 2 | 1 | … | … | … | … | |
| Widowed | Males | 4 | … | … | … | … | … | … | … | … | … | 2 | … | … | 1 | … | 1 | … | … | … | … |
| Females | 14 | … | … | … | … | … | 2 | 1 | 3 | 2 | … | 3 | 1 | 1 | … | … | … | … | … | 1 | |
| Unspecified | Males | … | … | … | … | … | … | … | … | … | … | … | … | … | … | … | … | … | … | … | … |
| Females | … | … | … | … | … | … | … | … | … | … | … | … | … | … | … | … | … | … | … | … | |
| Total | Males | 439 | 175 | 6 | 35 | 9 | 27 | 42 | 34 | 31 | 26 | 21 | 16 | 6 | 4 | … | 2 | … | 1 | … | 4 |
| Females | 381 | 168 | 11 | 33 | 7 | 23 | 40 | 26 | 20 | 15 | 19 | 7 | 5 | 2 | 3 | 1 | … | … | … | 1 | |
| Tapanui— | |||||||||||||||||||||
| Unmarried | Males | 212 | 109 | 7 | 23 | 5 | 15 | 26 | 5 | 8 | 8 | 2 | … | 2 | … | … | … | … | … | … | 2 |
| Females | 191 | 137 | 10 | 23 | 2 | 12 | 1 | 1 | 3 | 2 | … | … | … | … | … | … | … | … | … | … | |
| Married | Males | 88 | … | … | … | … | 2 | 13 | 12 | 23 | 12 | 10 | 7 | 5 | 1 | 2 | … | … | … | … | 1 |
| Females | 87 | … | … | 1 | 1 | 15 | 17 | 15 | 11 | 13 | 10 | 2 | … | … | 1 | … | … | … | … | 1 | |
| Widowed | Males | 4 | … | … | … | … | … | … | … | … | 2 | … | 2 | … | … | … | … | … | … | … | … |
| Females | 10 | … | … | … | … | … | … | 1 | 1 | … | … | … | 3 | 1 | … | 2 | 2 | … | … | … | |
| Unspecified | Males | … | … | … | … | … | … | … | … | … | … | … | … | … | … | … | … | … | … | … | … |
| Females | … | … | … | … | … | … | … | … | … | … | … | … | … | … | … | … | … | … | … | … | |
| Total | Males | 304 | 109 | 7 | 23 | 5 | 17 | 39 | 17 | 31 | 22 | 12 | 9 | 7 | 1 | 2 | … | … | … | … | 3 |
| Females | 288 | 137 | 10 | 24 | 3 | 27 | 18 | 17 | 15 | 15 | 10 | 2 | 3 | 1 | 1 | 2 | 2 | … | … | 1 | |
| Lawrence— | |||||||||||||||||||||
| Unmarried | Males | 347 | 205 | 9 | 36 | 11 | 22 | 21 | 11 | 5 | 7 | 9 | 5 | 2 | 1 | 1 | … | … | … | … | 2 |
| Females | 319 | 214 | 12 | 54 | 11 | 14 | 8 | 2 | … | 2 | 2 | … | … | … | … | … | … | … | … | … | |
| Married | Males | 150 | … | … | … | … | 5 | 18 | 21 | 18 | 17 | 35 | 18 | 9 | 7 | 1 | … | … | … | … | 1 |
| Females | 163 | … | … | 3 | 1 | 16 | 37 | 24 | 25 | 20 | 17 | 10 | 6 | 3 | 1 | … | … | … | … | … | |
| Widowed | Males | 13 | … | … | … | … | … | 2 | … | 1 | 1 | 6 | … | 2 | … | … | 1 | … | … | … | … |
| Females | 17 | … | … | … | … | … | 1 | 2 | 2 | 2 | 4 | 1 | 1 | 2 | 1 | 1 | … | … | … | … | |
Table IX. Table IX. Showing the Numbers and Ages of the Unmarried, Married, Widowed, and Unspecified, Males and Females (exclusive of Maoris), in each Borough—continued.
| Boroughs. | All Ages. | Under 14 years. | 14–15. | 15 and under 21. | 21 and under 40. | 40 and under 60. | 60 and under 80. | 80 and upwards. | Unspecified Children. | Unspecified Adults. | |||||||||||
|---|---|---|---|---|---|---|---|---|---|---|---|---|---|---|---|---|---|---|---|---|---|
| 15–20. | 20–21. | 21–25. | 25–30. | 30–35. | 35–40. | 40–45 | 45–50. | 50–55. | 55–60. | 60–65. | 65–70. | 70–75. | 75–80. | ||||||||
| Lawrence—continued. | |||||||||||||||||||||
| Unspecified | Males | … | … | … | … | … | … | … | … | … | … | … | … | … | … | … | … | … | … | … | … |
| Females | … | … | … | … | … | … | … | … | … | … | … | … | … | … | … | … | … | … | … | … | |
| Total | Males | 510 | 205 | 9 | 36 | 11 | 27 | 41 | 32 | 24 | 25 | 50 | 23 | 13 | 8 | 2 | 1 | … | … | … | 3 |
| Females | 499 | 214 | 12 | 57 | 12 | 30 | 46 | 28 | 27 | 24 | 23 | 11 | 7 | 5 | 2 | 1 | … | … | … | … | |
| Roxburgh— | |||||||||||||||||||||
| Unmarried | Males | 118 | 47 | 1 | 12 | … | 7 | 5 | 14 | 8 | 11 | 7 | 1 | 4 | 1 | … | … | … | … | … | … |
| Females | 71 | 43 | 2 | 11 | 1 | 7 | 4 | … | … | 2 | … | … | 1 | … | … | … | … | … | … | … | |
| Married | Males | 42 | … | … | … | … | 1 | 7 | 4 | 10 | 10 | 4 | 2 | … | 1 | … | 2 | … | … | … | 1 |
| Females | 36 | … | … | 1 | 1 | 3 | 8 | 6 | 7 | 2 | 1 | 3 | 1 | 1 | … | … | 1 | … | … | 1 | |
| Widowed | Males | 6 | … | … | … | … | … | … | … | … | 1 | 2 | … | … | 1 | … | 1 | 1 | … | … | … |
| Females | 4 | … | … | … | … | … | … | 2 | 1 | … | … | … | 1 | … | … | … | … | … | … | … | |
| Unspecified | Males | … | … | … | … | … | … | … | … | … | … | … | … | … | … | … | … | … | … | … | … |
| Females | … | … | … | … | … | … | … | … | … | … | … | … | … | … | … | … | … | … | … | … | |
| Total | Males | 166 | 47 | 1 | 12 | … | 8 | 12 | 18 | 18 | 22 | 13 | 3 | 4 | 3 | … | 3 | 1 | … | … | 1 |
| Females | 111 | 43 | 2 | 12 | 2 | 10 | 12 | 8 | 8 | 4 | 1 | 3 | 3 | 1 | … | … | 1 | … | … | 1 | |
| Naseby— | |||||||||||||||||||||
| Unmarried | Males | 229 | 144 | 7 | 17 | 3 | 7 | 11 | 2 | 10 | 10 | 7 | 5 | 3 | 3 | … | … | … | … | … | … |
| Females | 148 | 107 | 4 | 25 | 3 | 4 | 2 | 1 | … | … | 1 | … | … | … | … | … | … | … | … | 1 | |
| Married | Males | 86 | … | … | … | … | … | 11 | 5 | 24 | 13 | 16 | 13 | 1 | 3 | … | … | … | … | … | … |
| Females | 83 | … | … | 2 | 2 | 5 | 12 | 12 | 21 | 13 | 13 | 1 | 1 | 1 | … | … | … | … | … | … | |
| Widowed | Males | 7 | … | … | … | … | … | … | … | … | 1 | … | 3 | 1 | 1 | … | … | … | 1 | … | … |
| Females | 7 | … | … | … | … | … | 1 | … | … | 1 | 2 | 2 | … | 1 | … | … | … | … | … | … | |
| Unspecified | Males | … | … | … | … | … | … | … | … | … | … | … | … | … | … | … | … | … | … | … | … |
| Females | … | … | … | … | … | … | … | … | … | … | … | … | … | … | … | … | … | … | … | … | |
| Total | Males | 322 | 144 | 7 | 17 | 3 | 7 | 22 | 7 | 34 | 24 | 23 | 21 | 5 | 7 | … | … | … | 1 | … | … |
| Females | 238 | 107 | 4 | 27 | 5 | 9 | 15 | 13 | 21 | 14 | 16 | 3 | 1 | 2 | … | … | … | … | … | 1 | |
| Alexandra— | |||||||||||||||||||||
| Unmarried | Males | 126 | 59 | 4 | 6 | 2 | 7 | 14 | 5 | 9 | 9 | 6 | 3 | … | 1 | 1 | … | … | … | … | … |
| Females | 72 | 53 | 1 | 14 | … | 2 | 1 | 1 | … | … | … | … | … | … | … | … | … | … | … | … | |
| Married | Males | 36 | … | … | … | … | 1 | 2 | 3 | 6 | 8 | 7 | 6 | 1 | … | 1 | 1 | … | … | … | … |
| Females | 33 | … | … | … | 2 | 3 | 4 | 9 | 3 | 4 | 3 | 3 | 1 | … | 1 | … | … | … | … | … | |
| Widowed | Males | 2 | … | … | … | … | … | … | … | … | … | … | 1 | … | … | 1 | … | … | … | … | … |
| Females | 6 | … | … | … | … | … | … | … | 2 | … | … | 2 | … | 1 | … | … | … | 1 | … | … | |
Table IX. Table IX. Showing the Numbers and Ages of the Unmarried, Married, Widowed, and Unspecified, Males and Females (exclusive of Maoris), in each Borough—continued.
| Boroughs. | All Ages. | Under 14 years. | 14–15. | 15 and under 21. | 21 and under 40. | 40 and under 60. | 60 and under 80. | 80 and upwards. | Unspecified Children. | Unspecified Adults. | |||||||||||
|---|---|---|---|---|---|---|---|---|---|---|---|---|---|---|---|---|---|---|---|---|---|
| 15–20. | 20–21. | 21–25. | 25–30. | 30–35. | 35–40. | 40–45 | 45–50. | 50–55. | 55–60. | 60–65. | 65–70. | 70–75. | 75–80. | ||||||||
| Unspecified | Males | … | … | … | … | … | … | … | … | … | … | … | … | … | … | … | … | … | … | … | … |
| Females | … | … | … | … | … | … | … | … | … | … | … | … | … | … | … | … | … | … | … | … | |
| Total | Males | 164 | 59 | 4 | 6 | 2 | 8 | 16 | 8 | 15 | 17 | 13 | 10 | 1 | 1 | 3 | 1 | … | … | … | … |
| Females | 111 | 53 | 1 | 14 | 2 | 5 | 5 | 10 | 5 | 4 | 3 | 5 | 1 | 1 | 1 | … | … | 1 | … | … | |
| Cromwell— | |||||||||||||||||||||
| Unmarried | Males | 173 | 71 | 1 | 12 | 3 | 13 | 9 | 9 | 17 | 20 | 7 | 4 | 6 | … | 1 | … | … | … | … | … |
| Females | 137 | 95 | 4 | 26 | 1 | 6 | 1 | 2 | 1 | … | 1 | … | … | … | … | … | … | … | … | … | |
| Married | Males | 50 | … | … | … | … | 1 | 5 | 3 | 8 | 12 | 5 | 8 | 1 | 4 | 1 | 1 | 1 | … | … | … |
| Females | 57 | … | … | 1 | 1 | 5 | 6 | 8 | 13 | 7 | 7 | 3 | 2 | 3 | … | 1 | … | … | … | … | |
| Widowed | Males | 5 | … | … | … | … | … | … | … | … | 1 | … | 1 | … | 3 | … | … | … | … | … | … |
| Females | 7 | … | … | … | … | … | … | 1 | … | 2 | 3 | … | … | 1 | … | … | … | … | … | … | |
| Unspecified | Males | … | … | … | … | … | … | … | … | … | … | … | … | … | … | … | … | … | … | … | … |
| Females | … | … | … | … | … | … | … | … | … | … | … | … | … | … | … | … | … | … | … | … | |
| Total | Males | 228 | 71 | 1 | 12 | 3 | 14 | 14 | 12 | 25 | 33 | 12 | 13 | 7 | 7 | 2 | 1 | 1 | … | … | … |
| Females | 201 | 95 | 4 | 27 | 2 | 11 | 7 | 11 | 14 | 9 | 11 | 3 | 2 | 4 | … | 1 | … | … | … | … | |
| Arrowtown— | |||||||||||||||||||||
| Unmarried | Males | 174 | 97 | 4 | 10 | 2 | 12 | 9 | 14 | 4 | 14 | 5 | 2 | … | 1 | … | … | … | … | … | … |
| Females | 118 | 89 | 7 | 12 | 1 | 5 | … | 1 | 1 | 1 | … | … | … | … | … | 1 | … | … | … | … | |
| Married | Males | 60 | … | … | … | … | 1 | 4 | 10 | 15 | 12 | 6 | 9 | 2 | 1 | … | … | … | … | … | … |
| Females | 57 | … | … | 2 | 3 | 8 | 12 | 11 | 8 | 8 | 3 | 2 | … | … | … | … | … | … | … | … | |
| Widowed | Males | 4 | … | … | … | … | … | … | … | … | 2 | … | 2 | … | … | … | … | … | … | … | … |
| Females | 5 | … | … | … | … | … | … | … | 1 | … | 1 | 1 | … | … | … | 1 | 1 | … | … | … | |
| Unspecified | Males | … | … | … | … | … | … | … | … | … | … | … | … | … | … | … | … | … | … | … | … |
| Females | … | … | … | … | … | … | … | … | … | … | … | … | … | … | … | … | … | … | … | … | |
| Total | Males | 238 | 97 | 4 | 10 | 2 | 13 | 13 | 24 | 19 | 28 | 11 | 13 | 2 | 2 | … | … | … | … | … | … |
| Females | 180 | 89 | 7 | 14 | 4 | 13 | 12 | 12 | 10 | 9 | 4 | 3 | … | … | … | 2 | 1 | … | … | … | |
| Queenstown— | |||||||||||||||||||||
| Unmarried | Males | 331 | 134 | 11 | 22 | 7 | 29 | 26 | 39 | 24 | 22 | 8 | 3 | 4 | … | 1 | … | … | … | … | 1 |
| Females | 176 | 118 | 10 | 19 | 7 | 15 | 3 | 1 | 1 | 1 | … | … | 1 | … | … | … | … | … | … | … | |
| Married | Males | 103 | … | … | … | … | 3 | 10 | 15 | 13 | 14 | 18 | 19 | 5 | 2 | 2 | 1 | … | 1 | … | … |
| Females | 102 | … | … | 1 | … | 11 | 22 | 15 | 14 | 17 | 9 | 11 | … | 1 | … | … | … | … | … | 1 | |
| Widowed | Males | 6 | … | … | … | … | … | … | … | … | … | 1 | 2 | … | 2 | … | … | 1 | … | … | … |
| Females | 17 | … | … | … | … | 1 | … | 1 | 2 | 2 | 3 | 2 | 1 | 1 | … | 2 | 2 | … | … | … | |
| Unspecified | Males | … | … | … | … | … | … | … | … | … | … | … | … | … | … | … | … | … | … | … | … |
| Females | … | … | … | … | … | … | … | … | … | … | … | … | … | … | … | … | … | … | … | … | |
| Total | Males | 440 | 134 | 11 | 22 | 7 | 32 | 36 | 54 | 37 | 36 | 27 | 24 | 9 | 4 | 3 | 1 | 1 | 1 | … | 1 |
| Females | 295 | 118 | 10 | 20 | 7 | 27 | 25 | 17 | 17 | 20 | 12 | 13 | 2 | 2 | … | 2 | 2 | … | … | 1 | |
| Invercargill— | |||||||||||||||||||||
| Unmarried | Males | 1,629 | 907 | 53 | 205 | 21 | 144 | 116 | 61 | 41 | 35 | 18 | 18 | 5 | 4 | … | … | … | … | … | 1 |
| Females | 1,427 | 864 | 61 | 272 | 46 | 94 | 53 | 10 | 8 | 9 | 5 | 3 | 1 | … | 1 | … | … | … | … | … | |
| Married | Males | 698 | … | … | … | 1 | 33 | 116 | 109 | 91 | 125 | 96 | 71 | 25 | 14 | 9 | 4 | … | 1 | … | 3 |
| Females | 715 | … | … | 18 | 12 | 81 | 140 | 116 | 107 | 99 | 75 | 26 | 16 | 17 | 3 | 4 | … | … | … | 1 | |
| Widowed | Males | 46 | … | … | … | … | … | 1 | 4 | 3 | 5 | 10 | 5 | 4 | 4 | 2 | 4 | 2 | 2 | … | … |
| Females | 81 | … | … | … | … | 1 | 2 | 4 | 10 | 12 | 17 | 6 | 9 | 5 | 8 | 4 | 1 | 2 | … | … | |
Table IX. Table IX. Showing the Numbers and Ages of the Unmarried, Married, Widowed, and Unspecified, Males and Females (exclusive of Maoris), in each Borough—continued.
| Boroughs. | All Ages. | Under 14 years. | 14–15. | 15 and under 21. | 21 and under 40. | 40 and under 60. | 60 and under 80. | 80 and upwards. | Unspecified Children. | Unspecified Adults. | |||||||||||
|---|---|---|---|---|---|---|---|---|---|---|---|---|---|---|---|---|---|---|---|---|---|
| 15–20. | 20–21. | 21–25. | 25–30. | 30–35. | 35–40. | 40–45 | 45–50. | 50–55. | 55–60. | 60–65. | 65–70. | 70–75. | 75–80. | ||||||||
| Invercargill—continued. | |||||||||||||||||||||
| Unspecified | Males | … | … | … | … | … | … | … | … | … | … | … | … | … | … | … | … | … | … | … | … |
| Females | … | … | … | … | … | … | … | … | … | … | … | … | … | … | … | … | … | … | … | … | |
| Total | Males | 2,373 | 907 | 53 | 205 | 22 | 177 | 233 | 174 | 135 | 165 | 124 | 94 | 34 | 22 | 11 | 8 | 2 | 3 | … | 4 |
| Females | 2,223 | 864 | 61 | 290 | 58 | 176 | 195 | 130 | 125 | 120 | 97 | 35 | 26 | 22 | 12 | 8 | 1 | 2 | … | 1 | |
| Invercargill South— | |||||||||||||||||||||
| Unmarried | Males | 315 | 215 | 12 | 41 | 6 | 11 | 15 | 9 | 3 | 3 | … | … | … | … | … | … | … | … | … | … |
| Females | 289 | 228 | 10 | 25 | 4 | 12 | 4 | 2 | … | 1 | 1 | 1 | 1 | … | … | … | … | … | … | … | |
| Married | Males | 148 | … | … | … | 1 | 6 | 23 | 28 | 20 | 36 | 16 | 10 | 1 | 5 | 2 | … | … | … | … | … |
| Females | 151 | … | … | 5 | 3 | 10 | 28 | 33 | 26 | 30 | 7 | 5 | 2 | 1 | 1 | … | … | … | … | … | |
| Widowed | Males | 12 | … | … | … | … | … | 2 | … | … | 2 | 1 | 1 | 2 | 2 | … | 1 | 1 | … | … | … |
| Females | 8 | … | … | … | … | … | … | … | … | … | 1 | 4 | 2 | 1 | … | … | … | … | … | … | |
| Unspecified | Males | … | … | … | … | … | … | … | … | … | … | … | … | … | … | … | … | … | … | … | … |
| Females | … | … | … | … | … | … | … | … | … | … | … | … | … | … | … | … | … | … | … | … | |
| Total | Males | 475 | 215 | 12 | 41 | 7 | 17 | 40 | 37 | 23 | 41 | 17 | 11 | 3 | 7 | 2 | 1 | 1 | … | … | … |
| Females | 448 | 228 | 10 | 30 | 7 | 22 | 33 | 35 | 26 | 31 | 9 | 10 | 5 | 2 | 1 | … | … | … | … | … | |
| Invercargill East— | |||||||||||||||||||||
| Unmarried | Males | 293 | 168 | 10 | 52 | 9 | 22 | 12 | 7 | 3 | 4 | 2 | 1 | 1 | 1 | … | … | 1 | … | … | … |
| Females | 242 | 156 | 11 | 38 | 11 | 14 | 5 | 5 | … | … | 1 | … | 1 | … | … | … | … | … | … | … | |
| Married | Males | 109 | … | … | … | … | 2 | 14 | 13 | 9 | 22 | 33 | 12 | 3 | 5 | 3 | 3 | … | … | … | … |
| Females | 112 | … | … | 2 | 1 | 9 | 12 | 16 | 17 | 18 | 16 | 8 | 4 | 7 | 1 | 1 | … | … | … | … | |
| Widowed | Males | 9 | … | … | … | … | … | … | … | … | 1 | 1 | 2 | … | … | 1 | 3 | 1 | … | … | … |
| Females | 20 | … | … | … | … | … | … | 3 | 2 | 2 | 3 | 6 | 1 | 3 | … | … | … | … | … | … | |
| Unspecified | Males | … | … | … | … | … | … | … | … | … | … | … | … | … | … | … | … | … | … | … | … |
| Females | … | … | … | … | … | … | … | … | … | … | … | … | … | … | … | … | … | … | … | … | |
| Total | Males | 411 | 168 | 10 | 52 | 9 | 24 | 26 | 20 | 12 | 27 | 26 | 15 | 4 | 6 | 4 | 6 | 2 | … | … | … |
| Females | 374 | 156 | 11 | 40 | 12 | 23 | 17 | 24 | 19 | 20 | 20 | 14 | 6 | 10 | 1 | 1 | … | … | … | … | |
| Invercargill North— | |||||||||||||||||||||
| Unmarried | Males | 221 | 155 | 7 | 27 | 7 | 8 | 9 | 3 | 2 | 1 | 1 | … | 1 | … | … | … | … | … | … | … |
| Females | 204 | 173 | 3 | 18 | … | 4 | 2 | 2 | 1 | 1 | … | … | … | … | … | … | … | … | … | … | |
| Married | Males | 112 | … | … | … | … | 5 | 20 | 18 | 15 | 18 | 19 | 7 | 4 | 4 | 1 | … | … | … | … | 1 |
| Females | 122 | … | … | 3 | 4 | 12 | 22 | 22 | 18 | 20 | 13 | 5 | … | … | 1 | … | … | … | … | … | |
| Widowed | Males | 5 | … | … | … | … | … | … | 1 | … | 1 | 1 | … | … | … | … | … | 1 | 1 | … | … |
| Females | 6 | … | … | … | … | … | … | … | … | 1 | … | 2 | … | 1 | 1 | 1 | … | … | … | … | |
Table IX. Table IX. Showing the Numbers and Ages of the Unmarried, Married, Widowed, and Unspecified, Males and Females (exclusive of Maoris), in each Borough—continued.
| Boroughs. | All Ages. | Under 14 years. | 14–15. | 15 and under 21. | 21 and under 40. | 40 and under 60. | 60 and under 80. | 80 and upwards. | Unspecified Children. | Unspecified Adults. | |||||||||||
|---|---|---|---|---|---|---|---|---|---|---|---|---|---|---|---|---|---|---|---|---|---|
| 15–20. | 20–21. | 21–25. | 25–30. | 30–35. | 35–40. | 40–45 | 45–50. | 50–55. | 55–60. | 60–65. | 65–70. | 70–75. | 75–80. | ||||||||
| Unspecified | Males | … | … | … | … | … | … | … | … | … | … | … | … | … | … | … | … | … | … | … | … |
| Females | … | … | … | … | … | … | … | … | … | … | … | … | … | … | … | … | … | … | … | … | |
| Total | Males | 338 | 155 | 7 | 27 | 7 | 13 | 29 | 22 | 17 | 20 | 21 | 7 | 5 | 4 | 1 | … | 1 | 1 | … | 1 |
| Females | 332 | 173 | 3 | 21 | 4 | 16 | 24 | 24 | 19 | 22 | 13 | 7 | 2 | 1 | 2 | 1 | … | … | … | … | |
| Campbelltown— | |||||||||||||||||||||
| Unmarried | Males | 112 | 75 | 3 | 14 | 3 | 5 | 4 | 5 | … | 2 | 1 | … | … | … | … | … | … | … | … | … |
| Females | 114 | 77 | 3 | 22 | 1 | 7 | 3 | 1 | … | … | … | … | … | … | … | … | … | … | … | … | |
| Married | Males | 58 | … | … | … | … | 2 | 8 | 7 | 11 | 9 | 7 | 7 | 5 | 1 | … | … | … | 1 | … | … |
| Females | 57 | … | … | 2 | 1 | 13 | 7 | 3 | 12 | 8 | 6 | 1 | 3 | … | … | … | … | 1 | … | … | |
| Widowed | Males | 7 | … | … | … | … | … | … | … | … | 1 | … | 1 | 3 | 1 | 1 | … | … | … | … | … |
| Females | 3 | … | … | … | … | … | … | … | … | … | … | 2 | … | … | … | … | 1 | … | … | … | |
| Unspecified | Males | … | … | … | … | … | … | … | … | … | … | … | … | … | … | … | … | … | … | … | … |
| Females | … | … | … | … | … | … | … | … | … | … | … | … | … | … | … | … | … | … | … | … | |
| Total | Males | 177 | 75 | 3 | 14 | 3 | 7 | 12 | 12 | 11 | 12 | 8 | 8 | 8 | 2 | 1 | … | … | 1 | … | … |
| Females | 174 | 77 | 3 | 24 | 2 | 20 | 10 | 4 | 12 | 8 | 6 | 3 | 3 | … | … | … | 1 | 1 | … | … | |
| Avenal— | |||||||||||||||||||||
| Unmarried | Males | 125 | 83 | 5 | 15 | 3 | 5 | 6 | 4 | 2 | 1 | … | 1 | … | … | … | … | … | … | … | … |
| Females | 123 | 83 | 7 | 16 | 3 | 5 | 5 | 1 | 1 | … | 1 | … | … | … | … | … | 1 | … | … | … | |
| Married | Males | 54 | … | … | … | … | 1 | 6 | 7 | 7 | 10 | 11 | 4 | 6 | 1 | 1 | … | … | … | … | … |
| Females | 59 | … | … | 2 | 1 | 6 | 7 | 10 | 11 | 8 | 4 | 5 | 3 | 2 | … | … | … | … | … | … | |
| Widowed | Males | 3 | … | … | … | … | … | … | … | … | … | 1 | 1 | … | … | … | 1 | … | … | … | … |
| Females | 8 | … | … | … | … | … | 1 | 1 | 2 | 2 | 1 | … | … | … | 1 | … | … | … | … | … | |
| Unspecified | Males | … | … | … | … | … | … | … | … | … | … | … | … | … | … | … | … | … | … | … | … |
| Females | … | … | … | … | … | … | … | … | … | … | … | … | … | … | … | … | … | … | … | … | |
| Total | Males | 182 | 83 | 5 | 15 | 3 | 6 | 12 | 11 | 9 | 11 | 12 | 6 | 6 | 1 | 1 | 1 | … | … | … | … |
| Females | 190 | 83 | 7 | 18 | 4 | 11 | 13 | 12 | 14 | 10 | 6 | 5 | 3 | 2 | 1 | … | 1 | … | … | … | |
| Gladstone— | |||||||||||||||||||||
| Unmarried | Males | 91 | 53 | 4 | 15 | 4 | 4 | 5 | 2 | 1 | 1 | 1 | … | 1 | … | … | … | … | … | … | … |
| Females | 92 | 59 | 5 | 17 | 3 | 3 | 4 | … | … | 1 | … | … | … | … | … | … | … | … | … | … | |
| Married | Males | 38 | … | … | … | … | 1 | 1 | 3 | 9 | 5 | 8 | 6 | 2 | 3 | … | … | … | … | … | … |
| Females | 42 | … | … | 2 | 2 | 1 | 8 | 4 | 8 | 6 | 5 | 3 | 2 | 1 | … | … | … | … | … | … | |
| Widowed | Males | 1 | … | … | … | … | … | … | … | … | … | 1 | … | … | … | … | … | … | … | … | … |
| Females | 4 | … | … | … | … | … | 1 | … | … | … | 1 | … | … | 1 | … | 1 | … | … | … | … | |
| Unspecified | Males | … | … | … | … | … | … | … | … | … | … | … | … | … | … | … | … | … | … | … | … |
| Females | … | … | … | … | … | … | … | … | … | … | … | … | … | … | … | … | … | … | … | … | |
| Total | Males | 130 | 53 | 4 | 15 | 4 | 5 | 6 | 5 | 10 | 6 | 10 | 6 | 3 | 3 | … | … | … | … | … | … |
| Females | 138 | 59 | 5 | 19 | 5 | 4 | 13 | 4 | 8 | 7 | 6 | 3 | 2 | 2 | … | 1 | … | … | … | … | |
| Winton— | |||||||||||||||||||||
| Unmarried | Males | 96 | 59 | 2 | 12 | 1 | 4 | 10 | 1 | 1 | 2 | 1 | 2 | … | 1 | … | … | … | … | … | … |
| Females | 60 | 43 | 4 | 9 | 1 | 2 | … | 1 | … | … | … | … | … | … | … | … | … | … | … | … | |
| Married | Males | 36 | … | … | … | … | 1 | 4 | 6 | 7 | 8 | 6 | 3 | 1 | … | … | … | … | … | … | … |
| Females | 34 | … | … | 1 | … | 3 | 7 | 8 | 8 | 2 | 3 | 2 | … | … | … | … | … | … | … | … | |
| Widowed | Males | 2 | … | … | … | … | … | … | 1 | … | … | … | 1 | … | … | … | … | … | … | … | … |
| Females | 2 | … | … | … | … | … | … | … | … | 2 | … | … | … | … | … | … | … | … | … | … | |
Table IX. Table IX. Showing the Numbers and Ages of the Unmarried, Married, Widowed, and Unspecified, Males and Females (exclusive of Maoris), in each Borough—continued.
| Boroughs. | All Ages. | Under 14 years. | 14–15. | 15 and under 21. | 21 and under 40. | 40 and under 60. | 60 and under 80. | 80 and upwards. | Unspecified Children. | Unspecified Adults. | |||||||||||
|---|---|---|---|---|---|---|---|---|---|---|---|---|---|---|---|---|---|---|---|---|---|
| 15–20. | 20–21. | 21–25. | 25–30. | 30–35. | 35–40. | 40–45 | 45–50. | 50–55. | 55–60. | 60–65. | 65–70. | 70–75. | 75–80. | ||||||||
| NOTE.—For totals of Boroughs see Table VI. | |||||||||||||||||||||
| Winton—continued. | |||||||||||||||||||||
| Unspecified | Males | … | … | … | … | … | … | … | … | … | … | … | … | … | … | … | … | … | … | … | … |
| Females | … | … | … | … | … | … | … | … | … | … | … | … | … | … | … | … | … | … | … | … | |
| Total | Males | 134 | 59 | 2 | 12 | 1 | 5 | 14 | 8 | 8 | 10 | 7 | 6 | 1 | 1 | … | … | … | … | … | … |
| Females | 96 | 43 | 4 | 10 | 1 | 5 | 7 | 9 | 8 | 4 | 3 | 2 | … | … | … | … | … | … | … | … | |
| Riverton— | |||||||||||||||||||||
| Unmarried | Males | 495 | 257 | 5 | 37 | 10 | 42 | 34 | 34 | 44 | 21 | 7 | 2 | … | 2 | … | … | … | … | … | … |
| Females | 301 | 218 | 14 | 47 | 3 | 14 | 2 | … | 1 | 1 | … | 1 | … | … | … | … | … | … | … | … | |
| Married | Males | 173 | … | … | … | … | 7 | 22 | 26 | 34 | 38 | 22 | 12 | 5 | 3 | 3 | 1 | … | … | … | … |
| Females | 195 | … | … | 6 | 3 | 29 | 34 | 33 | 37 | 30 | 10 | 8 | 3 | 2 | … | … | … | … | … | … | |
| Widowed | Males | 11 | … | … | … | … | … | … | … | … | 3 | 1 | 1 | … | 3 | … | 3 | … | … | … | … |
| Females | 12 | … | … | … | … | … | … | 1 | 1 | … | 2 | 1 | 1 | 1 | 3 | 1 | 1 | … | … | … | |
| Unspecified | Males | … | … | … | … | … | … | … | … | … | … | … | … | … | … | … | … | … | … | … | … |
| Females | … | … | … | … | … | … | … | … | … | … | … | … | … | … | … | … | … | … | … | … | |
| Total | Males | 679 | 257 | 5 | 37 | 10 | 49 | 56 | 60 | 78 | 62 | 30 | 15 | 5 | 8 | 3 | 4 | … | … | … | … |
| Females | 508 | 218 | 14 | 53 | 6 | 43 | 36 | 34 | 39 | 31 | 12 | 10 | 4 | 3 | 3 | 1 | 1 | … | … | … | |
Table of Contents
Table I. Table I. Showing (exclusive of Maoris and Chinese) the Proportions per Cent, of the Educated, the Partially Educated, and the Uneducated, to the Total Numbers living at the last Eight Census Periods.
| Census Periods. | Read and Write. | Read only. | Cannot Read. | |
|---|---|---|---|---|
| December, 1858 | Persons | 63.51 | 11.30 | 25.9 |
| Males | 66.86 | 9.59 | 23.55 | |
| Females | 59.13 | 13.53 | 27.34 | |
| December, 1861 | Persons | 68.67 | 9.01 | 22.32 |
| Males | 73.45 | 7.12 | 19.43 | |
| Females | 61.36 | 11.89 | 26.75 | |
| December, 1864 | Person | 72.70 | 7.17 | 20.13 |
| Males | 77.27 | 5.64 | 17.09 | |
| Females | 65.27 | 9.65 | 25.08 | |
| December, 1867 | Persons | 71.35 | 7.25 | 21.40 |
| Males | 75.62 | 5.95 | 18.43 | |
| Females | 64.86 | 9.24 | 25.90 | |
| February, 1871 | Persons | 69.20 | 7.50 | 23.30 |
| Males | 73.10 | 6.36 | 20.54 | |
| Females | 63.75 | 9.10 | 27.15 | |
| March, 1874 | Persons | 68.15 | 8.09 | 23.76 |
| Males | 71.40 | 6.96 | 21.64 | |
| Females | 63.94 | 9.56 | 26.50 | |
| March, 1878 | Persons | 69.52 | 6.76 | 23.72 |
| Males | 72.11 | 5.91 | 21.98 | |
| Females | 66.33 | 7.80 | 25.87 | |
| April, 1881 | Persons | 71.32 | 5.63 | 23.05 |
| Males | 73.31 | 5.01 | 21.68 | |
| Females | 68.94 | 6.39 | 24.67 | |
NOTE—The totals of all specified as to education have been used as a basis in working tables of calculations in this division of the book. The fact of the number of the unspecified as to education being small rendered it unnecessary to make a special mention of them throughout, and the proportions given by the above system arc more nearly absolutely correct than if the calculations had been based on the total number including the unspecified. This statement as to the number of unspecified applies to the years 1874, 1878, and 1881 in previous Census years the number is said to have qualified the proportions given considerably.
Table II. Table II. Showing, for the Years 1871, 1874, 1878, and 1881 respectively, the Population in New Zealand (exclusive of Maoris and Chinese), Classified according to the different Degrees of Education, and the Proportion per Cent, of each Degree of Education to the Total Population of the several Provincial Districts in the respective Years.
| Provincial Districts. | Population. | Proportions per Cent, of each Degree of Education to the General Totals of Population in the respective Years. | ||||||||||||||||||||||
|---|---|---|---|---|---|---|---|---|---|---|---|---|---|---|---|---|---|---|---|---|---|---|---|---|
| February, 1871. | March, 1874. | March, 1878. | April, 1881. | February, 1871. | March, 1874. | March, 1878. | April, 1881. | |||||||||||||||||
| Read and Write. | Read only. | Cannot Read. | Read and Write. | Read only. | Cannot Read. | Read and Write. | Read only. | Cannot Read. | Read and Write. | Read only. | Cannot Read. | Read and Write. | Read only. | Cannot Read. | Read and Write. | Read only. | Cannot Read. | Read and Write. | Read only. | Cannot Read. | Read and Write. | Read only. | Cannot Read. | |
| Auckland | 42,240 | 4,766 | 14,822 | 45,200 | 5,646 | 16,194 | 57,351 | 6,252 | 18,802 | 71,873 | 5,649 | 21,636 | 68.32 | 7.71 | 23.97 | 67.42 | 8.42 | 24.16 | 69.59 | 7.59 | 22.82 | 72.48 | 5.70 | 21.82 |
| Taranaki | 3,152 | 323 | 997 | 3,732 | 465 | 1,2l6 | 6,318 | 607 | 2,478 | 10,399 | 746 | 3,653 | 70.48 | 7.22 | 22.30 | 68.95 | 8.59 | 22.46 | 67.19 | 6.46 | 26.35 | 70.27 | 5.04 | 24.69 |
| Wellington | 15,930 | 1,963 | 5,942 | 20,113 | 2,334 | 7,093 | 34,842 | 2,952 | 12,563 | 42,632 | 3,120 | 15,120 | 66.83 | 8.24 | 24.93 | 68.09 | 7.90 | 24.01 | 69.19 | 5.86 | 74.95 | 70.03 | 5.13 | 24.84 |
| Hawke's Bay | 4,178 | 390 | 1,434 | 6,181 | 739 | 2,113 | 10,179 | 992 | 3,631 | 12,011 | 893 | 4,348 | 69.61 | 6.50 | 23.89 | 68.43 | 8.18 | 23.39 | 68.77 | 6.70 | 24.53 | 69.62 | 5.18 | 25.20 |
| Marlborough | 3,406 | 405 | 1,144 | 4,050 | 456 | 1,583 | 5,035 | 509 | 1,963 | 6,271 | 511 | 2,460 | 68.74 | 8.17 | 23.09 | 66.51 | 71.49 | 26.00 | 67.07 | 6.78 | 26.15 | 67.85 | 5.53 | 26.62 |
| Nelson | 16,296 | 1,520 | 4,061 | 15,524 | 1,692 | 4,642 | 17,627 | 1,704 | 5,329 | 18,580 | 1,559 | 5,342 | 74.49 | 6.95 | 18.56 | 71.02 | 7.74 | 21.24 | 71.48 | 6.91 | 21.61 | 72.92 | 6.12 | 20.96 |
| Westland | 11,745 | 742 | 2,714 | 9,686 | 1,005 | 3,125 | 11,316 | 1,086 | 3,601 | 10,524 | 754 | 2,888 | 77.27 | 4.88 | 17.85 | 70.11 | 7.27 | 22.62 | 70.71 | 6.79 | 22.50 | 74.29 | 5.32 | 20.39 |
| Canterbury | 30,406 | 3,454 | 11,565 | 39,203 | 4,553 | 14,502 | 63,400 | 5,599 | 22,428 | 78,607 | 6,258 | 26,723 | 66.94 | 7.60 | 25.46 | 67.29 | 7.82 | 24.89 | 69.33 | 6.12 | 24.53 | 70.44 | 5.61 | 23.95 |
| Otago | 46,004 | 5,242 | 15,696 | 55,509 | 6,780 | 18,992 | 76,782 | 7,795 | 25,694 | 93,206 | 7,690 | 29,011 | 68.72 | 7.83 | 23.45 | 68.29 | 8.34 | 23.37 | 69.63 | 7.07 | 23.30 | 71.75 | 5.92 | 22.33 |
| Chatham Islands | 102 | 5 | 26 | 96 | 3 | 28 | 125 | 10 | 56 | 164 | 18 | 58 | 76.69 | 3.76 | 19.55 | 75.59 | 2.36 | 22.05 | 65.44 | 5.24 | 29.32 | 68.33 | 7.50 | 24.17 |
| Totals and Averages for the Colony | 173,459 | 18,810 | 58,401 | 199,294 | 23,673 | 69,488 | 282,975 | 27,506 | 96,545 | 344,267 | 27,198 | 111,239 | 69.20 | 7.50 | 23.30 | 68.15 | 8.09 | 23.76 | 69.52 | 6.76 | 23.72 | 71.32 | 5.63 | 23.05 |
NOTE—The totals of all specified as to education have been used as a basis in working tables of calculations in this division of the book. The fact of the number of the unspecified as to education being small rendered it unnecessary to make a special mention of them throughout, and the proportions given by the above system are more nearly absolutely correct than if the calculations had been based on the total number, including the unspecified.
Table III. Table III. Showing (exclusive of Maoris and Chinese) the Number of the Population, Persons, Males and Females, at the various Quinquennial Periods of Age, able to Read and Write, Read only, or unable to Read: and the Proportions for every 100 of the Population; according to the Census of the 3rd April, 1881.
| Ages | Numbers (excluding Chinese). | Proportions to every 100 at each Quinquennial Period | |||||||||||||||||||
|---|---|---|---|---|---|---|---|---|---|---|---|---|---|---|---|---|---|---|---|---|---|
| Persons | Males | Females | Persons | Males | Females | ||||||||||||||||
| Read and Write. | Read only. | Cannot Read. | Education Unknown. | Read and Write. | Read only. | Cannot Read. | Education Unknown. | Read and Write. | Read only. | Cannot Read. | Education Unknown. | Read and Write. | Read only. | Cannot Read. | Read and Write. | Read only. | Cannot Read. | Read and Write. | Read only. | Cannot Read. | |
| All ages | 344,267 | 27,198 | 111,239 | 2,225 | 192,979 | 13,180 | 57,088 | 1,363 | 151,288 | 14,018 | 54,151 | 862 | 71.32 | 5.63 | 23.05 | 73.31 | 5.01 | 21.68 | 68.94 | 6.39 | 24.67 |
| All ages above 5 years | 344,267 | 26,042 | 30,112 | 2,225 | 192,979 | 12,664 | 15,971 | 1,363 | 151,288 | 13,378 | 14,141 | 862 | 85.98 | 6.50 | 7.52 | 87.08 | 5.71 | 7.21 | 84.61 | 7.48 | 7.91 |
| Under 5 years | … | 1,156 | 81,127 | … | … | 516 | 41,117 | … | … | 640 | 40,010 | … | … | 1.40 | 98.60 | … | 1.24 | 98.76 | … | 1.57 | 98.43 |
| 5 years to 10 years | 30,960 | 15,821 | 20,848 | 282 | 15,369 | 8,063 | 10,721 | 149 | 15,591 | 7,758 | 10,127 | 133 | 45.78 | 23.39 | 30.83 | 45.00 | 23.61 | 31.39 | 46.57 | 23.18 | 30.25 |
| 10 years to 15 years | 54,705 | 1,716 | 987 | 205 | 27,304 | 894 | 561 | 110 | 27,404 | 822 | 426 | 95 | 95.29 | 2.99 | 1.72 | 94.94 | 3.11 | 1.95 | 95.64 | 2.87 | 1.49 |
| 15 years to 20 years | 41,271 | 514 | 555 | 184 | 20,202 | 298 | 328 | 89 | 21,009 | 216 | 227 | 95 | 97.48 | 1.21 | 1.31 | 97.00 | 1.43 | 1.57 | 97.93 | 1'01 | 1.06 |
| 20 years to 25 years | 39,333 | 600 | 722 | 188 | 20,751 | 303 | 393 | 111 | 18,582 | 297 | 329 | 77 | 96.75 | 1.47 | 1.78 | 96.76 | 1.41 | 1.83 | 96.74 | 1.55 | 1.71 |
| 25 years to 30 years | 37,500 | 858 | 977 | 199 | 21,817 | 378 | 537 | 133 | 15,683 | 480 | 440 | 66 | 95.34 | 2.18 | 2.48 | 95.98 | 1.66 | 2.36 | 94.46 | 2.89 | 2.65 |
| 30 years to 35 years | 31,189 | 985 | 1,015 | 219 | 17,930 | 409 | 536 | 140 | 13,259 | 576 | 479 | 79 | 93.97 | 2.97 | 3.06 | 94.99 | 2.17 | 2.84 | 92.63 | 4.02 | 3.35 |
| 35 years to 40 years | 30,149 | 1,163 | 1,162 | 228 | 18,203 | 469 | 645 | 141 | 11,946 | 694 | 517 | 87 | 92.84 | 3.58 | 3.58 | 94.23 | 2.43 | 3.34 | 90.80 | 5.27 | 3.93 |
| 40 years to 45 years | 27,877 | 1,257 | 1,097 | 173 | 18,093 | 565 | 628 | 117 | 9,784 | 692 | 469 | 56 | 92.21 | 4.16 | 3.63 | 93.81 | 2.93 | 3.26 | 89.39 | 6.32 | 4.29 |
| 45 years to 50 years | 19,181 | 965 | 798 | 123 | 12,723 | 427 | 477 | 71 | 6,458 | 538 | 321 | 52 | 91.58 | 4.61 | 3.81 | 93.37 | 3.13 | 3.50 | 88.26 | 7.35 | 4.39 |
| 50 years to 55 years | 12,979 | 682 | 664 | 87 | 8,679 | 277 | 389 | 57 | 4,300 | 405 | 275 | 30 | 90.60 | 4.76 | 4.64 | 92.87 | 2.97 | 4.16 | 86.35 | 8.13 | 5.52 |
| 55 years to 60 years | 6,938 | 437 | 363 | 39 | 4,371 | 184 | 233 | 24 | 2,567 | 253 | 130 | 15 | 89.66 | 5.65 | 4.69 | 91.20 | 3.84 | 4.87 | 87.02 | 8.57 | 4.41 |
| 60 years to 65 years | 5,479 | 397 | 390 | 46 | 3,382 | 155 | 225 | 20 | 2,097 | 242 | 165 | 26 | 87.44 | 6.34 | 6.22 | 89.90 | 4.12 | 5.98 | 83.75 | 9.66 | 6.59 |
| 65 years to 70 years | 2,756 | 270 | 169 | 30 | 1,663 | 99 | 92 | 18 | 1,093 | 171 | 77 | 12 | 86.26 | 8.45 | 5.29 | 89.70 | 5.34 | 4.96 | 81.51 | 12.75 | 5.74 |
| 70 years to 75 years | 1,761 | 172 | 137 | 17 | 1,034 | 59 | 74 | 8 | 727 | 113 | 63 | 9 | 85.07 | 8.31 | 6.62 | 88.61 | 5.05 | 6.34 | 80.51 | 12.51 | 6.98 |
| 75 years to 80 years | 826 | 93 | 64 | 9 | 511 | 21 | 25 | 4 | 315 | 62 | 29 | 5 | 84.03 | 9.46 | 6.51 | 88.56 | 5.37 | 6.07 | 77.59 | 15.27 | 7.14 |
| 80 and upwards | 450 | 70 | 58 | 5 | 264 | 28 | 30 | … | 186 | 43 | 28 | 5 | 77.72 | 12.26 | 10.02 | 81.99 | 8.69 | 9.32 | 72.37 | 10.73 | 10.90 |
| Unspecified | 910 | 41 | 106 | 191 | 623 | 25 | 67 | 171 | 287 | 16 | 39 | 20 | 86.09 | 3.88 | 10.03 | 87.13 | 3.50 | 9.37 | 83.92 | 4.68 | 11.40 |
Table IV. Table IV. Showing the Number of Persons, Males, and Females (exclusive of Chinese and Maoris), at each Quinquennial Period of Age, living in Boroughs, able to Read and Write, able to Read only, unable to Read, or of whom the Education was not returned.
| Ages. | Persons. | Males. | Females. | ||||||||||||
|---|---|---|---|---|---|---|---|---|---|---|---|---|---|---|---|
| Total. | Able to Read and Write. | Able to Read only. | Unable to Read. | Education Unknown. | Total. | Able to Read and Write. | Able to Read only. | Unable to Read. | Education Unknown. | Total. | Able to Read and Write. | Able to Read only. | Unable to Read. | Education Unknown. | |
| All ages | 194,173 | 141,081 | 9,613 | 42,528 | 951 | 98,806 | 72,571 | 4,334 | 21,463 | 438 | 95,367 | 68,510 | 5,279 | 21,065 | 513 |
| 5 years and upwards | 161,372 | 141,081 | 9,141 | 10,199 | 951 | 82,164 | 72,571 | 4,133 | 5,022 | 438 | 79,208 | 68,510 | 5,008 | 5,177 | 513 |
| Under 5 years | 32,801 | … | 472 | 32,329 | … | 16,642 | … | 201 | 16,441 | … | 16,159 | … | 271 | 15,888 | … |
| 5 years to 10 years | 26,872 | 13,368 | 5,915 | 7,466 | 123 | 13,406 | 6,596 | 2,967 | 3,781 | 62 | 13,466 | 6,772 | 2,948 | 3,685 | 61 |
| 10 years to 15 years | 23,694 | 22,827 | 498 | 263 | 106 | 11,638 | 11,215 | 240 | 131 | 52 | 12,056 | 11,612 | 258 | 132 | 54 |
| 15 years to 20 years | 18,336 | 17,945 | 141 | 165 | 85 | 8,244 | 8,072 | 69 | 73 | 30 | 10,092 | 9,873 | 72 | 92 | 55 |
| 20 years to 25 years | 16,776 | 16,313 | 201 | 190 | 72 | 7,535 | 7,363 | 73 | 74 | 25 | 9,241 | 8,950 | 128 | 116 | 47 |
| 25 years to 30 years | 15,765 | 15,133 | 268 | 283 | 81 | 8,190 | 7,945 | 85 | 119 | 41 | 7,575 | 7,188 | 183 | 164 | 40 |
| 30 years to 35 years | 13,163 | 12,475 | 307 | 285 | 96 | 6,809 | 6,520 | 110 | 136 | 43 | 6,354 | 5,955 | 197 | 149 | 53 |
| 35 years to 40 years | 12,646 | 11,819 | 381 | 349 | 97 | 6,713 | 6,389 | 123 | 155 | 46 | 5,933 | 5,430 | 258 | 194 | 51 |
| 40 years to 45 years | 11,453 | 10,661 | 391 | 329 | 72 | 6,568 | 6,246 | 138 | 143 | 41 | 4,885 | 4,415 | 253 | 186 | 31 |
| 45 years to 50 years | 8,238 | 7,655 | 303 | 223 | 57 | 4,843 | 4,623 | 96 | 102 | 22 | 3,395 | 3,032 | 207 | 121 | 35 |
| 50 years to 55 years | 5,672 | 5,211 | 211 | 202 | 48 | 3,405 | 3,229 | 67 | 82 | 27 | 2,267 | 1,982 | 144 | 120 | 21 |
| 55 years to 60 years | 3,036 | 2,754 | 151 | 117 | 14 | 1,726 | 1,607 | 51 | 63 | 5 | 1,310 | 1,147 | 100 | 54 | 9 |
| 60 years to 65 years to | 2,536 | 2,231 | 147 | 137 | 21 | 1,385 | 1,270 | 43 | 67 | 5 | 1,151 | 961 | 104 | 70 | 16 |
| 65 years to 70 years | 1,236 | 1,057 | 103 | 61 | 15 | 645 | 581 | 30 | 29 | 5 | 591 | 476 | 73 | 32 | 10 |
| 70 years to 75 years | 873 | 756 | 57 | 48 | 12 | 468 | 422 | 17 | 25 | 4 | 405 | 334 | 40 | 23 | 8 |
| 75 years to 80 years | 398 | 334 | 35 | 23 | 6 | 211 | 189 | 10 | 10 | 2 | 187 | 145 | 25 | 13 | 4 |
| 80 and upwards | 228 | 181 | 19 | 24 | 4 | 112 | 93 | 7 | 12 | … | 116 | 88 | 12 | 12 | 4 |
| Unspecified | 450 | 361 | 13 | 34 | 42 | 266 | 211 | 7 | 20 | 28 | 184 | 150 | 6 | 14 | 14 |
Table V. Table V. Showing the Number of Persons, Males, and Females (exclusive of Chinese and Maoris), at each Quinquennial Period of Age, living outside Boroughs, able to Read and Write, able to Read only, unable to Read, or of whom the Education was not returned.
| Ages. | Persons. | Males. | Females. | ||||||||||||
|---|---|---|---|---|---|---|---|---|---|---|---|---|---|---|---|
| Total. | Able to Read and Write. | Able to Read only. | Unable to Read. | Education Unknown. | Total. | Able to Read and Write. | Able to Read only. | Unable to Read. | Education Unknown. | Total. | Able to Read and Write. | Able to Read only. | Unable to Read. | Education Unknown. | |
| All ages | 290,756 | 203,186 | 17,585 | 68,711 | 1,274 | 165,804 | 120,408 | 8,846 | 35,625 | 925 | 124,952 | 82,778 | 8,739 | 33,086 | 349 |
| 5 years and upwards | 241,274 | 203,186 | 16,901 | 19,913 | 1,274 | 140,813 | 120,408 | 8,531 | 10,949 | 925 | 100,461 | 82,778 | 8,370 | 8,964 | 349 |
| Under 5 years | 49,482 | … | 684 | 48,798 | … | 24,991 | … | 315 | 24,676 | … | 24,491 | … | 369 | 24,122 | … |
| 5 years to 10 years | 41,039 | 17,592 | 9,906 | 13,382 | 159 | 20,896 | 8,773 | 5,096 | 6,940 | 87 | 20,143 | 8,819 | 4,810 | 6,442 | 72 |
| 10 years to 15 years | 33,922 | 31,881 | 1,218 | 724 | 99 | 17,251 | 16,089 | 654 | 430 | 58 | 16,691 | 15,792 | 564 | 294 | 41 |
| 15 years to 20 years | 24,188 | 23,326 | 373 | 390 | 99 | 12,733 | 12,190 | 229 | 255 | 59 | 11,455 | 11,136 | 144 | 135 | 40 |
| 20 years to 25 years | 24,067 | 23,020 | 399 | 532 | 116 | 14,023 | 13,388 | 230 | 319 | 86 | 10,044 | 9,632 | 169 | 213 | 30 |
| 25 years to 30 years | 23,769 | 22,367 | 590 | 694 | 118 | 14,675 | 13,872 | 293 | 418 | 92 | 9,094 | 8,495 | 297 | 276 | 26 |
| 30 years to 35 years | 20,245 | 18,714 | 678 | 730 | 123 | 12,206 | 11,410 | 299 | 400 | 97 | 8,039 | 7,304 | 379 | 330 | 26 |
| 35 years 40 years | 20,056 | 18,330 | 782 | 813 | 131 | 12,745 | 11,814 | 346 | 490 | 95 | 7,311 | 6,516 | 436 | 323 | 36 |
| 40 years to 45 years | 18,951 | 17,216 | 866 | 768 | 101 | 12,835 | 11,847 | 427 | 485 | 76 | 6,116 | 5,369 | 439 | 283 | 25 |
| 45 years to 50 years | 12,829 | 11,526 | 662 | 575 | 66 | 8,855 | 8,100 | 331 | 375 | 49 | 3,974 | 3,426 | 331 | 200 | 17 |
| 50 years to 55 years | 8,740 | 7,768 | 471 | 462 | 39 | 5,997 | 5,450 | 210 | 307 | 30 | 2,743 | 2,318 | 261 | 155 | 9 |
| 55 years to 60 years | 4,741 | 4,184 | 286 | 246 | 25 | 3,086 | 2,764 | 133 | 170 | 19 | 1,655 | 1,420 | 153 | 76 | 6 |
| 60 years to 65 years | 3,776 | 3,248 | 250 | 253 | 25 | 2,397 | 2,112 | 112 | 158 | 15 | 1,379 | 1,136 | 138 | 95 | 10 |
| 65 years to 70 years | 1,989 | 1,699 | 167 | 108 | 15 | 1,227 | 1,082 | 69 | 63 | 13 | 762 | 617 | 98 | 45 | 2 |
| 70 years to 75 years | 1,214 | 1,005 | 115 | 89 | 5 | 707 | 612 | 42 | 49 | 4 | 507 | 393 | 73 | 40 | 1 |
| 75 years to 80 years | 594 | 492 | 58 | 41 | 3 | 370 | 322 | 21 | 25 | 2 | 224 | 170 | 37 | 16 | 1 |
| 80 and upwards | 356 | 269 | 52 | 34 | 1 | 210 | 171 | 21 | 18 | … | 146 | 98 | 31 | 16 | 1 |
| Unspecified | 798 | 549 | 28 | 72 | 149 | 620 | 412 | 18 | 47 | 143 | 178 | 137 | 10 | 25 | 6 |
Table VI. Table VI. Showing the Percentage of Persons, Males, and Females (exclusive of Chinese and Maoris), at each Quinquennial Period of Age, living in Boroughs or outside such Boroughs, able to Read and Write, Read only, or unable to Read.
| Ages. | Persons. | Males. | Females. | ||||||
|---|---|---|---|---|---|---|---|---|---|
| Able to Read and Write. | Able to Read only. | Unable to Read. | Able to Read and Write. | Able to Read only. | Unable to Read. | Able to Read and Write. | Able to Read only. | Unable to Read. | |
| All ages | 73.01 | 4.98 | 22.01 | 73.77 | 4.41 | 21.82 | 72.23 | 5.56 | 22.21 |
| 5 years and upwards | 87.94 | 5.70 | 6.36 | 88.80 | 5.06 | 6.14 | 87.06 | 6.36 | 6.58 |
| Under 5 years | … | 1.44 | 98.56 | … | 1.21 | 98.79 | … | 1.68 | 98.32 |
| 5 years to 10 years | 49.98 | 22'11 | 27.91 | 49.43 | 22.23 | 28.34 | 50.52 | 21.99 | 27.49 |
| 10 years to 15 years | 96.77 | 2.11 | 1.12 | 96.80 | 2.07 | 1.13 | 96.75 | 2.15 | 1.10 |
| 15 years to 20 years | 98.32 | .77 | .91 | 98.27 | .84 | .89 | 98.36 | .72 | .92 |
| 20 years to 25 years | 97.66 | 1.20 | 1.14 | 98.04 | .97 | .99 | 97.35 | 1.39 | 1.26 |
| 25 years to 30 years. | 96.49 | 1.71 | 1.80 | 97.50 | 1.04 | 1.46 | 95.39 | 2.43 | 2.l8 |
| 30 years to 35 years | 95.47 | 2.35 | 2.18 | 96.36 | 1.63 | 2.01 | 94.51 | 3.13 | 2.36 |
| 35 years to 40 years | 94.18 | 3.04 | 2.78 | 95.83 | 1.85 | 2.32 | 92.31 | 4.39 | 3.30 |
| 40 years to 45 years | 93.67 | 3.44 | 2.89 | 95.70 | 2.11 | 2.19 | 90.96 | 5.21 | 3.83 |
| 45 years to 50 years | 93.57 | 3.70 | 2.73 | 95.89 | 1.99 | 2.12 | 90.24 | 6.16 | 3.60 |
| 50 years to 55 years | 92.66 | 3.75 | 3.59 | 95.59 | 1.98 | 2.43 | 88.25 | 6.41 | 5.34 |
| 55 years to 60 years | 91.13 | 5.00 | 3.87 | 93.38 | 2.96 | 3.66 | 88.16 | 7.69 | 4.15 |
| 60 years to 65 years | 88.71 | 5.84 | 5.45 | 92.03 | 3.12 | 4.85 | 84.67 | 9.16 | 6.17 |
| 65 years to 70 years | 86.57 | 8.43 | 5.00 | 90.78 | 4.69 | 4.53 | 81.93 | 12.56 | 5.51 |
| 70 years to 75 years | 87.80 | 6.62 | 5.58 | 90.95 | 3.66 | 5.39 | 84.13 | 10.08 | 5.79 |
| 75 years to 80 years | 85.20 | 8.93 | 5.87 | 90.43 | 4.79 | 4.78 | 79.24 | 13.66 | 7.10 |
| 80 years to and upwards | 80.80 | 8.48 | 10.72 | 83.04 | 6.25 | 10.71 | 78.57 | 10.71 | 10.72 |
| Unspecified | 88.48 | 3.19 | 8.33 | 88.66 | 2.94 | 8.40 | 88.23 | 3.53 | 8.24 |
| OUTSIDE BOROUGHS. | |||||||||
| All ages | 70.19 | 6.07 | 23.74 | 73.03 | 5.36 | 21.61 | 66.43 | 7.02 | 26.55 |
| 5 years and upwards | 84.66 | 7.04 | 8.30 | 86.07 | 6.10 | 7.83 | 82.69 | 8.36 | 8.95 |
| Under 5 years | … | 1.38 | 98.62 | … | 1.26 | 98.74 | … | 1.51 | 98.49 |
| 5 years to 10 years | 43.03 | 24.23 | 32.74 | 42.l6 | 24.49 | 33.35 | 43.94 | 23.96 | 32.10 |
| 10 years to 15 years | 94.26 | 3.60 | 2.14 | 93.69 | 3.81 | 2.50 | 94.85 | 3.39 | 1.76 |
| 15 years to 20 years | 96.83 | 1.55 | 1.62 | 96.18 | 1.81 | 2.01 | 97.56 | 1.06 | 1.18 |
| 20 years to 25 years | 96.11 | 1.67 | 2.22 | 96.06 | 1.65 | 2.29 | 96.18 | 1.69 | 2.13 |
| 25 years to 30 years | 94.57 | 2.50 | 2.93 | 95.12 | 2.01 | 2.87 | 93.68 | 3.28 | 3.04 |
| 30 years to 35 years | 93.00 | 3.37 | 3.63 | 94.23 | 2.47 | 3.30 | 91.15 | 4.73 | 4.12 |
| 35 years to 40 years | 92.00 | 3.92 | 4.08 | 93.39 | 2.74 | 3.87 | 89.57 | 5.99 | 4.44 |
| 40 years to 45 years | 91.33 | 4.59 | 4.08 | 92.85 | 3.35 | 3.80 | 88.15 | 7.21 | 4.64 |
| 45 years to 50 years | 90.31 | 5.19 | 4.50 | 91.98 | 3.76 | 4.26 | 86.58 | 8.37 | 5.05 |
| 50 years to 55 years | 89.28 | 5.41 | 5.31 | 91.34 | 3.52 | 5.14 | 84.78 | 9.55 | 5.67 |
| 55 years to 60 years | 88.72 | 6.06 | 5.22 | 90.12 | 4.34 | 5.54 | 86.11 | 9.28 | 4.61 |
| 60 years to 65 years | 86.59 | 6.67 | 6.74 | 88.67 | 4.70 | 6.63 | 82.98 | 10.08 | 6.94 |
| 65 years to 70 years | 86.07 | 8.46 | 5.47 | 89.13 | 5.68 | 5.19 | 81.18 | 12.90 | 5.92 |
| 70 years to 75 years | 83.13 | 9.51 | 7.36 | 87.06 | 5.97 | 6.97 | 77.67 | 14.43 | 7.90 |
| 75 years to 80 years | 83.25 | 9.81 | 6.94 | 87.50 | 5.71 | 6.79 | 76.23 | 16.59 | 7.18 |
| 80 years to and upwards | 75.77 | 14.65 | 9.58 | 81.43 | 10.00 | 8.57 | 67.59 | 21.38 | 11.03 |
| Unspecified | 84.59 | 4.32 | 11.09 | 86.37 | 3.78 | 9.85 | 79.65 | 5.81 | 14.54 |
Table VII. Table VII. Showing the Number of Persons, Males, and Females (exclusive of Maoris and Chinese), in the Colony and each Provincial District, between 5 and 15 Years of Age, and 15 Years of Age and upwards, who were returned as being able to Read and Write, able to Read only, or unable to Read; also the Proportions per Cent. of those of each Degree of Education to the Total Numbers at each Age Period.
| Provincial Districts. | Population between 5 and 15 Years. | Population aged 15 Years and upwards. | |||||||||||
|---|---|---|---|---|---|---|---|---|---|---|---|---|---|
| Numbers. | Proportions per Cent. | Numbers. | Proportions per Cent. | ||||||||||
| Able to Read and Write. | Able to Read only. | Unable to Read. | Able to Read and Write. | Able to Read only. | Unable to Read. | Able to Read and Write. | Able to Read only. | Unable to Read. | Able to Read and Write. | Able to Read only. | Unable to Read. | ||
| Total of New Zealand | Persons | 85,668 | 17,537 | 21,835 | 68.51 | 14.03 | 17.46 | 258,533 | 8,498 | 8,231 | 93.92 | 3.09 | 2.99 |
| Males | 42,673 | 8,957 | 11,282 | 67.83 | 14.24 | 17.93 | 150,271 | 3,703 | 4,662 | 94.73 | 2.33 | 2.94 | |
| Females | 42,995 | 8,580 | 10,553 | 69.20 | 13.81 | 16.99 | 108,262 | 4,795 | 3,569 | 92.83 | 4.11 | 3.06 | |
| Auckland | Persons | 18,028 | 3,418 | 4,393 | 69.78 | 13.22 | 17.00 | 53,835 | 2,018 | 1,849 | 93.30 | 3.50 | 3.20 |
| Males | 9,052 | 1,761 | 2,348 | 68.78 | 13.38 | 17.84 | 30,876 | 877 | 1,057 | 94.11 | 2.67 | 3.22 | |
| Females | 8,976 | 1,657 | 2,045 | 70.80 | 13.07 | 16.13 | 22,959 | 1,141 | 792 | 92.24 | 4.58 | 3.8 | |
| Taranaki | Persons | 2,420 | 451 | 726 | 67.28 | 12.54 | 20.18 | 7,975 | 239 | 311 | 93.55 | 2.80 | 3.65 |
| Males | 1,235 | 242 | 369 | 66.90 | 13.11 | 19.99 | 4,975 | 120 | 190 | 94.13 | 2.27 | 3.60 | |
| Females | 1,183 | 209 | 357 | 67.67 | 11.94 | 20.39 | 3,000 | 119 | 121 | 92.59 | 3.67 | 3.74 | |
| Wellington | Persons | 10,563 | 1,912 | 2,921 | 68.61 | 12.42 | 18.97 | 32,043 | 1,020 | 1,203 | 93.51 | 2.98 | 3.51 |
| Males | 5,232 | 917 | 1,477 | 68.61 | 12.02 | 19.37 | 18,031 | 432 | 658 | 94.30 | 2.26 | 3.44 | |
| Females | 5,331 | 995 | 1,444 | 68.61 | 12.81 | 18.58 | 14,012 | 588 | 545 | 92.52 | 3.88 | 3.60 | |
| Hawke's Bay | Persons | 2,790 | 515 | 935 | 65.80 | 12.15 | 22.05 | 9,213 | 345 | 361 | 92.88 | 3.48 | 3.64 |
| Males | 1,387 | 259 | 482 | 65.18 | 12.17 | 22.65 | 5,563 | 157 | 217 | 93.70 | 2.64 | 3.66 | |
| Females | 1,403 | 256 | 453 | 66.43 | 12.12 | 21.45 | 3,650 | 188 | 144 | 91.66 | 4.72 | 3.62 | |
| Marlborough | Persons | 1,465 | 337 | 563 | 61.94 | 14.25 | 23.81 | 4,806 | 157 | 175 | 93.34 | 3.05 | 3.41 |
| Males | 705 | 183 | 297 | 59.50 | 15.44 | 25.06 | 3,003 | 79 | 94 | 94.55 | 2.49 | 2.96 | |
| Females | 760 | 154 | 266 | 64.41 | 13.05 | 22.54 | 1,803 | 78 | 81 | 91.90 | 3.97 | 4.13 | |
| Nelson | Persons | 4,608 | 969 | 1,066 | 60.36 | 14.59 | 16.05 | 13,970 | 521 | 350 | 94'13 | 3.51 | 2.36 |
| Males | 2,317 | 505 | 549 | 68.73 | 14.98 | 16.29 | 8,375 | 263 | 213 | 94.62 | 2.97 | 2.41 | |
| Females | 2,291 | 464 | 517 | 70.02 | 14.18 | 15.80 | 5,595 | 258 | 137 | 93.40 | 4.31 | 2.29 | |
| Westland | Persons | 2,729 | 485 | 505 | 73.38 | 13.04 | 13.58 | 7,794 | 224 | 267 | 94.07 | 2.71 | 3.22 |
| Males | 1,285 | 225 | 263 | 72.48 | 12.69 | 14.83 | 5,124 | 120 | 182 | 94.43 | 2.21 | 3.36 | |
| Females | 1,444 | 260 | 242 | 74.20 | 13.36 | 12.44 | 2,670 | 104 | 85 | 93.39 | 3.64 | 2.97 | |
| Canterbury | Persons | 19,827 | 3,919 | 5,090 | 68.76 | 13.59 | 17.65 | 58,778 | 2,066 | 1,982 | 93.56 | 3.29 | 3.15 |
| Males | 9,882 | 2,039 | 2,648 | 67.83 | 13.99 | 18.18 | 33,484 | 890 | 1,119 | 94.34 | 2.51 | 3.15 | |
| Females | 9,945 | 1,880 | 2,442 | 69.70 | 13.18 | 17.12 | 25,294 | 1,176 | 863 | 92.54 | 4.30 | 3.16 | |
| Otago | Persons | 23,222 | 5,518 | 5,627 | 67.57 | 16'06 | 16.37 | 69,971 | 1,904 | 1,711 | 95.09 | 2.59 | 2.32 |
| Males | 11,574 | 2,818 | 2,845 | 67.15 | 16.35 | 16.50 | 40,735 | 763 | 912 | 96.05 | 1.80 | 2.15 | |
| Females | 11,648 | 2,700 | 2,782 | 68.00 | 15.76 | 16.24 | 29,236 | 1,141 | 799 | 93.78 | 3.66 | 2.56 | |
| Chatham Islands | Persons | 16 | 13 | 9 | 42.11 | 34.21 | 23.68 | 148 | 4 | 22 | 85.06 | 2.30 | 12.64 |
| Males | 4 | 8 | 4 | 25.00 | 50.00 | 25.00 | 105 | 2 | 20 | 82.68 | 1.57 | 15.75 | |
| Females | 12 | 5 | 5 | 54.54 | 22.73 | 22.73 | 43 | 2 | 2 | 91.49 | 4.26 | 4.25 | |
Table VIII. Table VIII. Showing the Numbers of the Population, Persons, Males, and Females (exclusive of Maoris), attending Schools, and Receiving Tuition at Home, in the Colony and in each Provincial District, in 1871, 1874, 1878, and 1881.
| Provincial Districts. | At Public (Government) or Aided Schools. | At Private Schools, or Schools not receiving Government Aid. | Attending Sunday Schools. | Receiving Tuition St Home.* | Population (exclusive of Chinese) from 5 to 15 Years.* | |||||||||||
|---|---|---|---|---|---|---|---|---|---|---|---|---|---|---|---|---|
| Total. | Males. | Females. | Total. | Males. | Females. | Total. | Males. | Females. | Total. | Males. | Females. | Total. | Males. | Females. | ||
* Particulars for Chatham Islands not given, to save space. † No account of home tuition was obtained at the Census of 1871. | ||||||||||||||||
| Total | February, 1871 | 14,953 | 8,199 | 6,754 | 16,757 | 8,237 | 8,520 | 28,601 | 14,297 | 14,304 | † | … | … | 54,771 | 27,817 | 26,954 |
| March, 1874 | 34,407 | 18,420 | 15,987 | 13,752 | 6,331 | 7,421 | 38,081 | 18,902 | 19,179 | 8,368 | 3,802 | 4,566 | 72,134 | 36,410 | 35,724 | |
| March, 1878 | 62,866 | 33,048 | 29,818 | 14,61 | 6,375 | 8,236 | 62,273 | 30,707 | 31,566 | 9,706 | 4,271 | 5,435 | 105,235 | 52,907 | 52,328 | |
| April, 1881 | 87,811 | 45,585 | 42,226 | 13,538 | 5,862 | 7,676 | 78,891 | 38,450 | 40,441 | 7,348 | 3,205 | 4,143 | 125,527 | 63,171 | 62,556 | |
| Auckland | February, 1871 | 1,349 | 759 | 590 | 6,146 | 3,151 | 2,995 | 7,162 | 3,609 | 3,553 | … | … | … | 14,045 | 7,206 | 6,839 |
| March, 1874 | 7,112 | 3,870 | 3,242 | 4,252 | 1,932 | 2,320 | 9,296 | 4,598 | 4,698 | 2,l81 | 1,011 | 1,170 | 16,737 | 8,525 | 8,212 | |
| March, 1878 | 11,932 | 6,474 | 5,458 | 4,599 | 1,968 | 2,631 | 13,646 | 6,778 | 6,868 | 2,295 | 1,043 | 1,252 | 21,826 | 11,065 | 10,761 | |
| April, 1881 | 17,357 | 9,101 | 8,256 | 3,312 | 1,380 | 1,932 | 17,301 | 8,462 | 8,839 | 1,833 | 857 | 976 | 25,859 | 13,176 | 12,683 | |
| Taranaki | February, 1871 | 163 | 82 | 81 | 391 | 194 | 197 | 599 | 295 | 304 | … | … | … | 1,018 | 536 | 482 |
| March, 1874 | 285 | 144 | 141 | 421 | 205 | 216 | 571 | 273 | 298 | 304 | 150 | 154 | 1,356 | 699 | 657 | |
| March, 1878 | 1,261 | 697 | 564 | 371 | 192 | 179 | 1,404 | 708 | 696 | 326 | 134 | 192 | 2,452 | 1,282 | 1,170 | |
| April, 1881 | 2,279 | 1,193 | 1,086 | 418 | 196 | 222 | 1,803 | 867 | 936 | 205 | 102 | 103 | 3,624 | 1,865 | 1,759 | |
| Wellington | February, 1871 | 888 | 469 | 419 | 2,307 | 1,158 | 1,149 | 2,803 | 1,366 | 1,437 | … | … | … | 6,002 | 2,973 | 3,029 |
| March, 1874 | 3,196 | 1,771 | 1,425 | 1,841 | 791 | 1,050 | 3,478 | 1,740 | 1,738 | 879 | 397 | 482 | 7,526 | 3,747 | 3,779 | |
| March, 1878 | 6,454 | 3,526 | 2,928 | 2,458 | 1,001 | 1,457 | 7,007 | 3,495 | 3,512 | 1,393 | 589 | 804 | 12,495 | 6,290 | 6,205 | |
| April, 1881 | 10,472 | 5,490 | 4,982 | 1,738 | 719 | 1,019 | 9,350 | 4,572 | 4,778 | 1,042 | 420 | 622 | 15,476 | 7,665 | 7,811 | |
| Hawke's Bay | February, 1871 | 405 | 213 | 192 | 376 | 174 | 202 | 525 | 264 | 261 | … | … | … | 1,302 | 650 | 652 |
| March, 1874 | 818 | 452 | 366 | 358 | 161 | 197 | 787 | 401 | 386 | 272 | 128 | 144 | 2,101 | 1,045 | 1,056 | |
| March, 1878 | 1,403 | 763 | 640 | 810 | 369 | 441 | 1,487 | 731 | 756 | 423 | 172 | 251 | 3,655 | 1,811 | 1,844 | |
| April, 1881 | 2,716 | 1,453 | 1,263 | 632 | 326 | 306 | 2,049 | 1,013 | 1,036 | 267 | 116 | 151 | 4,257 | 2,140 | 2,117 | |
| Marlborough | February, 1871 | 232 | 116 | 116 | 182 | 97 | 85 | 428 | 200 | 228 | … | … | … | 1,115 | 586 | 529 |
| March, 1874 | 519 | 271 | 248 | 267 | 135 | 132 | 594 | 286 | 308 | 245 | 120 | 125 | 1,525 | 796 | 729 | |
| March, 1878 | 1,007 | 554 | 453 | 232 | 90 | 142 | 815 | 396 | 419 | 203 | 90 | 113 | 1,957 | 993 | 964 | |
| April, 1881 | 1,338 | 710 | 628 | 227 | 98 | 129 | 1,079 | 503 | 576 | 223 | 101 | 122 | 2,382 | 1,201 | 1,181 | |
| Nelson | February, 1871 | 2,371 | 1,234 | 1,137 | 560 | 241 | 319 | 2,549 | 1,271 | 1,278 | … | … | … | 4,300 | 2,144 | 2,156 |
| March, 1874 | 3,020 | 1,586 | 1,434 | 552 | 236 | 316 | 2,797 | 1,358 | 1,439 | 531 | 264 | 267 | 5,015 | 2,497 | 2,518 | |
| March, 1878 | 3,905 | 2,060 | 1,845 | 603 | 267 | 336 | 3,653 | 1,775 | 1,878 | 795 | 385 | 410 | 6,163 | 3,148 | 3,015 | |
| April, 1881 | 4,546 | 2,350 | 2,196 | 817 | 384 | 433 | 4,363 | 2,141 | 2,222 | 549 | 246 | 303 | 6,663 | 3,380 | 3,283 | |
| Westland | February, 1871 | 291 | 155 | 136 | 943 | 462 | 481 | 1,387 | 700 | 687 | … | … | … | 1,803 | 909 | 894 |
| March, 1874 | 978 | 534 | 444 | 700 | 347 | 353 | 1,603 | 802 | 801 | 442 | 201 | 241 | 2,483 | 1,230 | 1,253 | |
| March, 1878 | 2,926 | 1,487 | 1,439 | 402 | 160 | 242 | 2,436 | 1,191 | 1,245 | 216 | 97 | 119 | 3,652 | 1,797 | 1,855 | |
| April, 1881 | 2,730 | 1,332 | 1,398 | 791 | 351 | 440 | 2,751 | 1,278 | 1,473 | 116 | 64 | 52 | 3,731 | 1,778 | 1,953 | |
| Canterbury | February, 1871 | 2,796 | 1,625 | 1,171 | 2,773 | 1,294 | 1,479 | 5,638 | 2,852 | 2,786 | … | … | … | 11,011 | 5,574 | 5,437 |
| March, 1874 | 8,341 | 4,423 | 3,918 | 2,143 | 993 | 1,148 | 8,703 | 4,340 | 4,363 | 1,335 | 541 | 794 | 15,233 | 7,633 | 7,600 | |
| March, 1878 | 15,803 | 8,069 | 7,734 | 2,261 | 1,035 | 1,226 | 15,011 | 7,401 | 7,610 | 1,521 | 651 | 870 | 23,611 | 11,776 | 11,835 | |
| April, 1881 | 20,666 | 10,766 | 9,900 | 3,056 | 1,379 | 1,677 | 19,001 | 9,318 | 9,683 | 1,450 | 581 | 869 | 28,914 | 14,604 | 14,310 | |
| Otago | February, 1871 | 6,458 | 3,546 | 2,912 | 3,079 | 1,466 | 1,613 | 7,510 | 3,740 | 3,770 | … | … | … | 14,145 | 7,223 | 6,922 |
| March, 1874 | 10,138 | 5,369 | 4,769 | 3,218 | 1,529 | 1,689 | 10,252 | 5,104 | 5,148 | 2,179 | 990 | 1,189 | 20,137 | 10,226 | 9,911 | |
| March, 1878 | 18,175 | 9,418 | 8,757 | 2,875 | 1,293 | 1,582 | 16,814 | 8,232 | 8,582 | 2,512 | 1,097 | 1,415 | 29,397 | 14,730 | 14,667 | |
| April, 1881 | 25,707 | 13,190 | 12,517 | 2,547 | 1,029 | 1,518 | 21,194 | 10,296 | 10,898 | 1,626 | 703 | 923 | 34,583 | 17,346 | 17,237 | |
Table IX. Table IX. Showing the Numbers of the Population, Persons, Males, and Females, of the Colony and of the Provincial Districts, attending Aided and Private Schools in 1878 and 1881, with the Numerical and Centesimal Increases or Decreases during the Period between those Years.
| Provincial Districts. | At Day Schools, Public (Government), or Aided. | At Private Schools or Schools not receiving Government Aid. | ||||||||||||||||||||||
|---|---|---|---|---|---|---|---|---|---|---|---|---|---|---|---|---|---|---|---|---|---|---|---|---|
| 1878. | 1881. | Increase from 1878 to 1881. | 1878 | 1881 | Increase or Decrease from 1878 to 1881. | |||||||||||||||||||
| Numerical. | Centesimal. | Numerical. | Centesimal. | |||||||||||||||||||||
| Total. | Males. | Females. | Total. | Males. | Females. | Total. | Males. | Females. | Total. | Males. | Females. | Total. | Males. | Females. | Total. | Males. | Females. | Total. | Males. | Females. | Total. | Males. | Females. | |
| Total | 62,866 | 33,048 | 29,818 | 87,811 | 45,585 | 42,226 | 24,945 | 12,537 | 12,408 | 39.68 | 37.94 | 41.62 | 14,6ll | 1,375 | 8,236 | 13,538 | 5,862 | 7,676 | −1,073 | −5,13 | −560 | −7.34 | −8.05 | −6.80 |
| Auckland | 1,932 | 6,474 | 5,458 | 17,357 | 9,101 | S,256 | 5,425 | 2,627 | 2,798 | 45.47 | 40.58 | 51.26 | 4,591 | 1,968 | 2,631 | 3,312 | 1,380 | 1,932 | −1,287 | −585 | −699 | −27.98 | −29.88 | −26.57 |
| Taranak1 | 1,261 | 697 | 564 | 2,279 | −1,193 | 1,086 | 1,018 | 496 | 522 | 80.73 | 71.16 | 92.55 | 371 | 192 | 179 | 418 | 196 | 222 | 47 | 4 | 43 | 12.67 | 2.08 | 24.02 |
| Wellington | 6,454 | 3,526 | 2,928 | 10,472 | 5,490 | 4,982 | 4,015 | 1,964 | 2,054 | 62.26 | 55.70 | 70.15 | 2,458 | 1,001 | 1,457 | 1,738 | 719 | 1,019 | −120 | −282 | −438 | −29.29 | −28.17 | −30.06 |
| Hawke's Bay | 1,403 | 763 | 640 | 2,716 | 1,453 | 1,203 | 1,313 | 690 | 623 | 93.59 | 90.43 | 97.34 | 810 | 369 | 441 | 632 | 326 | 306 | − 178 | − 43 | − 135 | −21.98 | − 11.65 | − 30 61 |
| Marlborough | 1,007 | 554 | 453 | 1,338 | 710 | 628 | 331 | 156 | 175 | 32.87 | 25.16 | 38.63 | 232 | 90 | 142 | 227 | 98 | 129 | −5 | 8 | −13 | −216 | 8.89 | −9.15 |
| Nelson | 3,905 | 2,060 | 1,845 | 4,546 | 2,350 | 2,196 | 641 | 290 | 351 | 16.41 | 14.08 | 19.02 | 603 | 267 | 336 | 817 | 384 | 433 | 214 | 117 | 97 | 35.49 | 43.82 | 28.87 |
| Westland | 2,926 | 1,487 | 1,439 | 2,730 | 1,332 | 1,398 | −196 | −155 | −41 | − 6.70 | − 10.42 | −2.84 | 402 | 160 | 242 | 791 | 351 | 440 | 389 | 191 | 198 | 96.77 | 119.38 | 81.82 |
| Canterbury | 15,803 | 8,069 | 7,734 | 20,666 | 10,766 | 9,900 | 4,863 | 2,697 | 2,166 | 30.77 | 33.42 | 28.01 | 2,261 | 1,035 | 1,226 | 3,056 | 1,379 | 1,677 | 795 | 344 | 451 | 35.16 | 33.24 | 36.79 |
| Otago | 18,175 | 9,418 | 8,757 | 25,707 | 13,190 | 12,517 | 7,532 | 3,772 | 3,760 | 41.44 | 40.05 | 42.94 | 2,875 | 1,293 | 1,382 | 2,547 | 1,029 | 1,518 | −328 | −264 | −64 | − 11.41 | − 20.42 | −4.04 |
| Chatham Islands | … | … | … | … | … | … | … | … | … | … | … | … | … | … | … | … | … | … | … | … | … | … | … | … |
NOTE—Where a decrease has taken place, a minus sign (−) is prefixed to the numerical or centesimal decrease.
Table X. Table X. Showing the Numbers of the Population, Persons, Males, and Females (exclusive of Maoris), attending Schools, and receiving Tuition at Home, in the Colony Boroughs, and Outside Boroughs.
| — | The Colony. | Boroughs. | Outside Boroughs. | ||||||
|---|---|---|---|---|---|---|---|---|---|
| Total. | Males. | Females. | Total. | Males. | Females. | Total. | Males. | Females. | |
| At Day Schools, Public (Government) or Aided | 87,811 | 45.585 | 42,226 | 35,768 | 18,349 | 17,419 | 52,043 | 27,236 | 24,807 |
| At Private Schools or Schools not receiving Government Aid | 13,538 | 5,862 | 7,676 | 8,632 | 3,692 | 4,940 | 4,906 | 2,170 | 2,736 |
| At Sunday Schools | 79,491 | 39,050 | 40,441 | 39,945 | 19,205 | 20,740 | 39,546 | 19,845 | 19,701 |
| Receiving Tuition at Home | 7,311 | 3,190 | 4,121 | 1,812 | 703 | 1,109 | 5,499 | 2,487 | 3,012 |
Table XI. Table XI. Showing the Numbers of the Population, Persons, Males, and Females (exclusive of Maoris), attending Schools, and receiving Tuition at Home, in each County.
| Counties. | At Day Schools, Public (Government) or Aided. | At Private Schools, or Schools not receiving Government Aid, | At Sunday Schools. | Receiving Tuition at Home. | Population (exclusive of Chinese) 5 to 15 | ||||||||||
|---|---|---|---|---|---|---|---|---|---|---|---|---|---|---|---|
| Total | Males | Females | Total | Males | Females | Total | Males | Females | Total | Males | Females | Total | Males | Females | |
| Total | 52,019 | 27,222 | 21,797 | 4,901 | 12,169 | 2,732 | 38,942 | 19,245 | 19,697 | 5,416 | 2,442 | 2,974 | 74,708 | 37,987 | 36,721 |
| Mongonui | 258 | 148 | 140 | … | … | … | 150 | 63 | 67 | 85 | 52 | 33 | 424 | 230 | 194 |
| Bay of Islands | 266 | 139 | 127 | 30 | 15 | 15 | 266 | 147 | 119 | 80 | 38 | 42 | 516 | 271 | 245 |
| Hokianga | 83 | 45 | 38 | 16 | 6 | 10 | 59 | 27 | 32 | 9 | 6 | 3 | 142 | 66 | 76 |
| Hobson | 451 | 248 | 203 | 16 | 4 | 12 | 390 | 215 | 175 | 55 | 31 | 24 | 63 | 337 | 294 |
| Whangarei | 725 | 393 | 332 | 48 | 22 | 26 | 340 | 172 | 165 | 37 | 4 | 33 | 1,024 | 539 | 485 |
| Rodney | 705 | 343 | 362 | 15 | 3 | 12 | 329 | 159 | 170 | 111 | 51 | 60 | 925 | 449 | 476 |
| Waitemata | 658 | 357 | 301 | 88 | 28 | 60 | 557 | 286 | 271 | 129 | 68 | 61 | 1,077 | 558 | 519 |
| Eden | 3.340 | 1,809 | 1,540 | 756 | 253 | 533 | 4,180 | 2,042 | 2,138 | 246 | 115 | 131 | 4,823 | 2,437 | 2,386 |
| Manukau | 2,308 | 1,153 | 1,155 | 195 | 92 | 103 | 1,788 | 840 | 948 | 185 | 81 | 104 | 3,216 | 1,603 | 1,613 |
| Coromandel | 333 | 188 | 145 | 9 | 2 | 7 | 262 | 133 | 129 | 51 | 23 | 28 | 477 | 256 | 221 |
| Thames | 1,040 | 539 | 501 | 159 | 73 | 86 | 1,097 | 532 | 565 | 69 | 33 | 34 | 1,391 | 718 | 673 |
| Piako | 30 | 16 | 14 | 6 | 5 | 1 | 30 | 12 | 18 | 35 | 16 | 19 | 161 | 94 | 67 |
| Tauranga | 321 | 159 | 162 | 103 | 41 | 62 | 216 | 98 | 118 | 105 | 48 | 57 | 612 | 291 | 321 |
| Whakatane | 166 | 95 | 71 | 14 | 3 | 11 | 132 | 72 | 60 | 26 | 13 | 13 | 247 | 124 | 123 |
| Cook | 196 | 109 | 87 | 16 | 10 | 6 | 83 | 45 | 38 | 73 | 34 | 39 | 357 | 179 | 178 |
| Wairoa | 136 | 72 | 64 | 25 | 12 | 13 | 121 | 66 | 55 | 24 | 10 | 14 | 262 | 132 | 130 |
| East Taupo | 2 | … | 2 | … | … | … | … | … | … | 1 | … | 1 | 8 | 3 | 5 |
| West Taupo | … | … | … | … | … | … | … | … | … | … | … | … | … | … | … |
| Waipa | 627 | 313 | 314 | 22 | 9 | 13 | 436 | 205 | 231 | 82 | 41 | 41 | 840 | 412 | 428 |
| Waikato | 445 | 225 | 217 | 34 | 9 | 25 | 323 | 166 | 157 | 57 | 24 | 33 | 662 | 326 | 336 |
| Raglan | 122 | 68 | 54 | 2 | … | 2 | 50 | 29 | 21 | 55 | 33 | 22 | 220 | 125 | 95 |
| Kawhia | … | … | … | … | … | … | … | … | … | … | … | … | 37 | 18 | 19 |
| Taranaki | 1,202 | 612 | 590 | 110 | 56 | 54 | 725 | 556 | 369 | 93 | 47 | 46 | 1,846 | 954 | 892 |
| Patea | 852 | 448 | 404 | 83 | 35 | 48 | 642 | 315 | 327 | 57 | 44 | 43 | 1,229 | 630 | 599 |
| Wanganui | 620 | 342 | 278 | 73 | 30 | 45 | 371 | 178 | 193 | 90 | 39 | 51 | 886 | 446 | 440 |
| Rangitikei | 655 | 339 | 316 | 41 | 19 | 22 | 400 | 183 | 217 | 70 | 19 | 51 | 877 | 435 | 442 |
| Manawatu | 1,258 | 643 | 615 | 75 | 27 | 48 | 922 | 453 | 469 | 211 | 86 | 125 | 1,913 | 931 | 982 |
| Hutt | 1,364 | 721 | 643 | 137 | 52 | 85 | 1,037 | 525 | 512 | 169 | 77 | 92 | 2,062 | 1,054 | 1,008 |
| Wairarapa West | 1,037 | 578 | 459 | 21 | 9 | 12 | 561 | 284 | 277 | 150 | 72 | 78 | 1,555 | 791 | 764 |
| Wairarapa East | 63 | 35 | 281 | 3 | 2 | 1 | 80 | 38 | 42 | 3 | … | 3 | 257 | 137 | 120 |
| Waipawa | 1,058 | 600 | 458 | 81 | 60 | 21 | 591 | 317 | 274 | 114 | 48 | 66 | 1,473 | 770 | 703 |
| Hawke's Bay | 674 | 377 | 297 | 120 | 61 | 59 | 348 | 181 | 167 | 70 | 30 | 40 | 1,094 | 567 | 527 |
| Sounds | 19 | 12 | 7 | … | … | … | … | … | … | 56 | 29 | 27 | 155 | 80 | 75 |
| Marlborough | 646 | 330 | 316 | 72 | 37 | 35 | 352 | 147 | 205 | 90 | 41 | 49 | 1,151 | 583 | 568 |
| Kaikoura | 153 | 88 | 65 | 6 | 3 | 3 | 124 | 64 | 60 | 36 | 16 | 20 | 257 | 142 | 115 |
| Waimea | 1,642 | 809 | 833 | 82 | 46 | 36 | 1,512 | 705 | 807 | 156 | 76 | 80 | 2,233 | 1,102 | 1,131 |
| Collingwood | 259 | 143 | 116 | 5 | 1 | 4 | 193 | 105 | 55 | 67 | 26 | 41 | 448 | 231 | 217 |
| Buller | 472 | 233 | 239 | 2 | 2 | … | 207 | 103 | 104 | 82 | 40 | 42 | 615 | 311 | 304 |
| Inangahua | 25S | 143 | 115 | 921 | 49 | 43 | 326 | 180 | 146 | 88 | 34 | 54 | 511 | 268 | 243 |
| Grey | 749 | 358 | 391 | 96 | 57 | 39 | 421 | 207 | 214 | 58 | 32 | 26 | 914 | 442 | 472 |
| Westland | 870 | 408 | 462 | 135 | 63 | 72 | 611 | 294 | 317 | 64 | 40 | 24 | 1,165 | 550 | 615 |
| Amuri | 20 | 13 | 1 | 3 | 1 | 2 | 26 | 14 | 12 | 19 | 11 | 8 | 64 | 36 | 28 |
| Cheviot | … | … | … | … | … | … | … | … | … | 1 | … | 1 | 3 | … | 2 |
| Ashley | 2,638 | 1,414 | 1,224 | 100 | 33 | 1,167 | 2,257 | 1,103 | 1,154 | 136 | 51 | 85 | 3,488 | 1,802 | 1,686 |
| Akaroa | 761 | 413 | 348 | 44 | 25 | 19 | 354 | 186 | 168 | 82 | 31 | 51 | 1,138 | 598 | 540 |
| Selwyn | 6,842 | 3,582 | 3,260 | 983 | 501 | 482 | 6,140 | 3,042 | 3,098 | 470 | 177 | 293 | 9,334 | 4,746 | 4,583 |
| Ashburton | 1,009 | 529 | 480 | 41 | 18 | 23 | 459 | 291 | 228 | 128 | 57 | 71 | 1,623 | 854 | 769 |
| Geraldine | 2,209 | 1,141 | 1,068 | 246 | 113 | 133 | 1,754 | 876 | 878 | 223 | 100 | 123 | 3,178 | 1,584 | 1,594 |
| Waimate | 465 | 230 | 235 | 48 | 19 | 29 | 333 | 163 | 170 | 62 | 30 | 32 | 713 | 344 | 369 |
| Waitaki | 1,148 | 601 | 547 | 55 | 25 | 30 | 776 | 400 | 376 | 107 | 47 | 60 | 1,611 | 832 | 779 |
| Waikouaiti | 1,518 | 782 | 736 | 43 | 26 | 17 | 813 | 390 | 417 | 86 | 37 | 49 | 1,932 | 1,019 | 913 |
| Peninsula | 549 | 311 | 238 | 20 | 11 | 9 | 432 | 223 | 209 | 37 | 18 | 19 | 717 | 385 | 332 |
| Taieri | 1,654 | 917 | 737 | 24 | 9 | 15 | 1,942 | 542 | 500 | 37 | 13 | 24 | 2,028 | 1,086 | 942 |
| Bruce | 1,144 | 583 | 561 | 73 | 34 | 39 | 773 | 396 | 377 | 46 | 14 | 32 | 1,481 | 722 | 759 |
| Clutha | 835 | 455 | 380 | 27 | 6 | 21 | 542 | 278 | 264 | 52 | 23 | 29 | 1,109 | 585 | 524 |
| Tuapeka | 1,348 | 680 | 668 | 119 | 52 | 67 | 1,031 | 511 | 520 | 83 | 41 | 42 | 1,724 | 873 | 851 |
| Maniototo | 343 | 170 | 173 | 89 | 33 | 56 | 218 | 92 | 126 | 37 | 18 | 19 | 558 | 263 | 295 |
| Vincent | 555 | 289 | 266 | 38 | 18 | 20 | 253 | 128 | 125 | 45 | 21 | 24 | 783 | 408 | 375 |
| Lake | 285 | 149 | 136 | 18 | 3 | 15 | 144 | 59 | 85 | 115 | 55 | 60 | 473 | 223 | 250 |
| Southland | 2,096 | 1,070 | 1,026 | 104 | 41 | 63 | 1,017 | 473 | 544 | 286 | 142 | 144 | 3,231 | 1,629 | 1,602 |
| Wallace | 439 | 225 | 214 | 8 | 5 | 3 | 309 | 161 | 148 | 80 | 33 | 47 | 741 | 368 | 373 |
| Fiord | … | … | … | … | … | … | … | … | … | 3 | 1 | 2 | 1 | … | 1 |
| Stewart Island | 59 | 27 | 32 | … | … | … | 57 | 27 | 30 | 12 | 3 | 9 | 85 | 37 | 48 |
Table XII. Table XII. Showing the Numbers of the Population, Persons. Males, and Females (exclusive of Maoris), attending Schools, and receiving Tuition at Home, in Boroughs.
| Boroughs. | At Day Schools, Public (Government) or Aided. | At Private Schools, or Schools not receiving Government Aid. | At Sunday Schools. | Receiving Tuition at Home. | Population (exclusive of Chinese 5 to 15. | ||||||||||
|---|---|---|---|---|---|---|---|---|---|---|---|---|---|---|---|
| Total | Males | Females | Total | Males | Females | Total | Males | Females | Total | Males | Females | Total | Males | Females | |
| Total | 35,768 | 18,349 | 17,419 | 8,632 | 3,692 | 4,940 | 39,945 | 19,205 | 20,740 | 1,812 | 703 | 1,109 | 50,566 | 25,044 | 25,522 |
| Auckland | 2,638 | 1,390 | 1,248 | 959 | 463 | 496 | 3,324 | 1,6o0 | 1,724 | 114 | 34 | 80 | 4,061 | 2,110 | 1,951 |
| Parnell | 533 | 307 | 226 | 297 | 117 | 180 | 805 | 409 | 396 | 60 | 24 | 36 | 937 | 479 | 458 |
| Onehunga | 354 | 154 | 200 | 185 | 93 | 92 | 513 | 225 | 288 | 31 | 12 | 19 | 640 | 293 | 347 |
| Thames | 1,071 | 559 | 512 | 198 | 73 | 125 | 1,350 | 664 | 686 | 23 | 13 | 10 | 1,375 | 710 | 665 |
| Gisborne | 317 | 170 | 147 | 71 | 41 | 30 | 287 | 152 | 135 | 20 | 10 | 10 | 436 | 227 | 209 |
| Hamilton | 305 | 157 | 148 | 39 | 17 | 22 | 351 | 169 | 182 | 11 | 6 | 5 | 397 | 198 | 199 |
| New Plymouth | 428 | 235 | 193 | 230 | 107 | 123 | 554 | 254 | 300 | 31 | 12 | 19 | 803 | 404 | 399 |
| Wanganui | 871 | 406 | 465 | 239 | 105 | 134 | 916 | 415 | 501 | 35 | 14 | 21 | 1,178 | 553 | 625 |
| Marton | 99 | 53 | 46 | 33 | 20 | 13 | 134 | 67 | 67 | 14 | 3 | 11 | 156 | 79 | 77 |
| Palmerston North | 241 | 122 | 119 | 20 | 5 | 15 | 269 | 126 | 143 | 19 | 6 | 13 | 338 | 163 | 175 |
| Wellington | 3,399 | 1,791 | 1,608 | 1,052 | 441 | 611 | 3,881 | 1,915 | 1,966 | 240 | 91 | 149 | 5,096 | 2,499 | 2,597 |
| Masterton | 408 | 218 | 190 | 25 | 3 | 221 | 414 | 206 | 208 | 20 | 8 | 12 | 541 | 269 | 272 |
| Greytown | 254 | 140 | 114 | 14 | 4 | 10 | 247 | 124 | 123 | 15 | 4 | 11 | 335 | 172 | 163 |
| Napier | 848 | 404 | 444 | 406 | 193 | 213 | 989 | 449 | 540 | 29 | 28 | 31 | 1,489 | 698 | 791 |
| Picton | 187 | 98 | 89 | 43 | 15 | 28 | 199 | 89 | 110 | 20 | 3 | 17 | 269 | 119 | 150 |
| Blenheim | 333 | 182 | 151 | 106 | 43 | 63 | 404 | 203 | 201 | 21 | 12 | 9 | 559 | 282 | 277 |
| Nelson | 1,191 | 633 | 558 | 535 | 230 | 305 | 1,560 | 756 | 804 | 85 | 34 | 51 | 1,905 | 976 | 929 |
| Westport | 248 | 146 | 102 | 23 | 8 | 15 | 243 | 133 | 110 | 7 | 3 | 4 | 300 | 165 | 135 |
| Greymouth | 526 | 265 | 261 | 207 | 94 | 113 | 685 | 316 | 369 | 9 | 6 | 3 | 718 | 359 | 359 |
| Hokitika | 510 | 259 | 251 | 271 | 105 | 163 | 710 | 303 | 407 | 27 | 8 | 19 | 818 | 367 | 451 |
| Ross | 306 | 151 | 155 | 79 | 37 | 42 | 358 | 170 | 188 | 1 | … | 1 | 378 | 185 | 193 |
| Kumara | 225 | 121 | 104 | 78 | 39 | 39 | 262 | 133 | 129 | 1 | … | 1 | 306 | 154 | 152 |
| Ashburton | 216 | 100 | 116 | 69 | 36 | 33 | 275 | 132 | 143 | 12 | 5 | 7 | 336 | 163 | 173 |
| Kaiapoi | 282 | 146 | 136 | 18 | 2 | 16 | 338 | 161 | 177 | 8 | 3 | 5 | 332 | 153 | 179 |
| Akaroa | 108 | 58 | 50 | 25 | 4 | 21 | 123 | 59 | 64 | 3 | … | 3 | 146 | 66 | 80 |
| Lyttelton | 810 | 416 | 404 | 121 | 47 | 74 | 799 | 366 | 433 | 30 | 16 | 14 | 1,092 | 520 | 572 |
| Christchurch | 2,396 | 1,253 | 1,143 | 824 | 368 | 456 | 2,619 | 1,274 | 1,415 | 165 | 58 | 107 | 3,523 | 1,770 | 1,753 |
| Sydenham | 1,649 | 816 | 833 | 366 | 162 | 204 | 2,029 | 1,005 | 1,024 | 58 | 26 | 32 | 2,312 | 1,142 | 1,170 |
| Timaru | 663 | 354 | 309 | 109 | 36 | 73 | 739 | 364 | 375 | 46 | 14 | 32 | 896 | 454 | 442 |
| Rangiora | 283 | 146 | 137 | 27 | 8 | 19 | 320 | 160 | 160 | 11 | 4 | 7 | 377 | 195 | 182 |
| Waimate | 325 | 168 | 157 | 34 | 7 | 27 | 391 | 196 | 195 | 16 | 9 | 7 | 417 | 212 | 205 |
| Oamaru | 1,130 | 557 | 573 | 179 | 84 | 95 | 1,222 | 581 | 641 | 55 | 24 | 31 | 1,469 | 710 | 759 |
| Hampden | 70 | 37 | 33 | … | … | … | 37 | 16 | 21 | 5 | 2 | 3 | 87 | 45 | 42 |
| Palmerston | 199 | 108 | 91 | 5 | … | 5 | 157 | 76 | 81 | 2 | … | 2 | 263 | 137 | 126 |
| Hawkesbury | 112 | 55 | 57 | 8 | 6 | 2 | 105 | 50 | 55 | 7 | 4 | 3 | 140 | 74 | 66 |
| Port Chalmers | 406 | 212 | 194 | 77 | 20 | 57 | 465 | 215 | 247 | 19 | 9 | 10 | 561 | 266 | 295 |
| Dunedin | 4,184 | 2,052 | 2,132 | 844 | 332 | 512 | 4,521 | 2,120 | 2,401 | 202 | 73 | 129 | 5,919 | 2,841 | 3,078 |
| Roslyn | 612 | 331 | 281 | 99 | 40 | 59 | 682 | 348 | 334 | 25 | 8 | 17 | 851 | 436 | 415 |
| Caversham | 1,069 | 567 | 502 | 94 | 41 | 53 | 899 | 406 | 493 | 55 | 21 | 34 | 1,292 | 684 | 608 |
| Mornington | 621 | 315 | 306 | 55 | 23 | 32 | 606 | 302 | 304 | 37 | 11 | 26 | 871 | 416 | 455 |
| Maori Hill | 180 | 94 | 86 | 19 | 13 | 6 | 165 | 85 | 80 | 23 | 8 | 15 | 295 | 153 | 142 |
| St. Kilda | 142 | 74 | 68 | 20 | 7 | 13 | 143 | 66 | 77 | 19 | 8 | 11 | 196 | 95 | 101 |
| South Dunedin | 542 | 264 | 278 | 84 | 37 | 47 | 590 | 233 | 307 | 15 | 8 | 7 | 753 | 367 | 386 |
| North-East Valley | 601 | 305 | 296 | 56 | 18 | 38 | 461 | 220 | 241 | 15 | 5 | 10 | 777 | 386 | 391 |
| West Harbour | 289 | 146 | 143 | 22 | 4 | 18 | 197 | 111 | 86 | 19 | 10 | 9 | 368 | 185 | 183 |
| Green Island | 101 | 45 | 56 | 4 | … | 4 | 96 | 38 | 58 | 2 | 2 | … | 131 | 60 | 71 |
| Milton | 331 | 156 | 175 | 29 | 17 | 12 | 304 | 144 | 160 | 3 | 2 | 1 | 378 | 176 | 202 |
| Balclutha | 174 | 92 | 82 | 11 | 2 | 9 | 148 | 74 | 74 | 7 | 4 | 3 | 212 | 105 | 107 |
| Tapanui | 139 | 57 | 82 | 2 | … | 2 | 134 | 57 | 77 | 5 | 1 | 4 | 148 | 60 | 88 |
| Lawrence | 220 | 115 | 105 | 25 | 11 | 14 | 230 | 114 | 116 | 9 | 1 | 8 | 264 | 133 | 131 |
| Roxburgh | 56 | 30 | 26 | … | … | … | 52 | 27 | 25 | 1 | … | 1 | 57 | 31 | 26 |
| Naseby | 140 | 82 | 58 | 13 | 7 | 6 | 143 | 80 | 63 | 2 | 1 | 1 | 158 | 92 | 66 |
| Alexandra | 71 | 39 | 32 | … | … | … | 62 | 34 | 28 | 1 | … | 1 | 71 | 40 | 31 |
| Cromwell | 77 | 33 | 44 | 33 | 14 | 19 | 102 | 42 | 60 | 3 | 1 | 2 | 110 | 47 | 63 |
| Arrowtown | 89 | 45 | 44 | 28 | 14 | 14 | 88 | 40 | 48 | 1 | 1 | … | 120 | 61 | 59 |
| Queenstown | 171 | 101 | 70 | 15 | 6 | 9 | 161 | 89 | 72 | 3 | 1 | 2 | 181 | 106 | 75 |
| Invercargill | 925 | 470 | 455 | 121 | 41 | 80 | 929 | 446 | 483 | 27 | 13 | 14 | 1,130 | 552 | 578 |
| Invercargill South | 217 | 105 | 112 | 25 | 12 | 13 | 215 | 106 | 109 | 10 | 1 | 7 | 271 | 132 | 139 |
| Invercargill East | 166 | 85 | 81 | 32 | 10 | 22 | 186 | 94 | 92 | 7 | 2 | 5 | 224 | 113 | 111 |
| Invercargill North | 176 | 86 | 90 | 3 | … | 3 | 149 | 75 | 74 | 4 | 4 | … | 190 | 97 | 93 |
| Campbelltown | 69 | 37 | 32 | 10 | 1 | 9 | 72 | 34 | 38 | 6 | 4 | 2 | 91 | 46 | 45 |
| Avenal | 89 | 44 | 45 | 9 | 5 | 4 | 106 | 52 | 54 | 2 | 1 | 1 | 114 | 56 | 58 |
| Gladstone | 65 | 31 | 34 | 6 | … | 6 | 71 | 34 | 37 | 1 | … | 1 | 75 | 33 | 42 |
| Winton | 44 | 24 | 20 | 1 | 1 | … | 42 | 26 | 16 | 3 | 2 | 1 | 56 | 31 | 25 |
| Riverton | 257 | 137 | 120 | … | … | … | 247 | 122 | 125 | 5 | 3 | 2 | 277 | 142 | 135 |
Table XIII. Table XIII. Showing the Education of Persons, Males, and Females (exclusive of Maoris and Chinese), in each Provincial District.
| Provincial Districts. | All Ages | Under 5. | 5 and under 10. | 10 and under 15. | 15 and under 21. | 21 and under 40. | 40 and under 60. | 60 and under 80. | 80 and upwards | Unspecified children | Unspecified adults | |||||||||||||||||||||||
|---|---|---|---|---|---|---|---|---|---|---|---|---|---|---|---|---|---|---|---|---|---|---|---|---|---|---|---|---|---|---|---|---|---|---|
| Under 1 year. | 1–2 | 2–3 | 3–4 | 4–5 | 5–6 | 6–7 | 7–8 | 8–9 | 9–10 | 10–11 | 11–12 | 12–13 | 13–14 | 14–15 | 15–20 | 20–21 | 21–25 | 25–30 | 30–35 | 35–40 | 40–45 | 45–50 | 50–55 | 55–60 | 60–65 | 65–70 | 70–75 | 75–80 | ||||||
| Total of Provincial Districts— | ||||||||||||||||||||||||||||||||||
| Read and Write | Males | 192,979 | … | … | … | … | … | 522 | 1,766 | 3,334 | 4,468 | 5,279 | 5,748 | 5,492 | 5,659 | 5,166 | 5,239 | 23,262 | 3,903 | 16,848 | 21,817 | 17,930 | 18,203 | 18,093 | 12,723 | 8,27 | 4 371 | 3,382 | 1,663 | 1,054 | 511 | 264 | 35 | 588 |
| Females | 151,288 | … | … | … | … | … | 563 | 1,801 | 3,443 | 4,502 | 5,282 | 5,910 | 5,435 | 5,690 | 5,197 | 5,172 | 21,009 | 4,055 | 14,547 | 15,683 | 13,259 | 11,946 | 9,784 | 6,458 | 4,353 | 2,567 | 2,097 | 1,093 | 727 | 315 | 186 | 51 | 256 | |
| Read only | Males | 13,180 | … | … | … | 54 | 462 | 1,472 | 2,363 | 2,170 | 1,528 | 750 | 389 | 182 | 146 | 99 | 78 | 298 | 45 | 258 | 378 | 409 | 469 | 565 | 427 | 277 | 184 | 155 | 99 | 59 | 51 | 28 | 4 | 21 |
| Females | 14,018 | … | … | … | 63 | 577 | 1,498 | 2,361 | 1,954 | 1,271 | 674 | 363 | 185 | 13 | 88 | 55 | 216 | 56 | 241 | 480 | 576 | 694 | 692 | 558 | 405 | 253 | 242 | 171 | 115 | 62 | 43 | 5 | 13 | |
| Cannot Read | Males | 57,088 | 9,209 | 7,483 | 8,525 | 8,224 | 7,676 | 5,774 | 2,897 | 1,217 | 557 | 276 | 181 | 114 | 100 | 82 | 84 | 328 | 85 | 308 | 537 | 556 | 645 | 628 | 477 | 389 | 233 | 233 | 92 | 74 | 35 | 50 | 27 | 40 |
| Females | 54,151 | 8,745 | 7,403 | 8,329 | 8,204 | 7,529 | 5,328 | 2,843 | 1,156 | 538 | 362 | 157 | 83 | 74 | 50 | 62 | 227 | 66 | 263 | 440 | 479 | 517 | 469 | 321 | 275 | 130 | 165 | 77 | 63 | 29 | 28 | 19 | 20 | |
| Education unknown | Males | 1,563 | … | … | … | … | … | 16 | 39 | 36 | 32 | 26 | 34 | 22 | 23 | 12 | 19 | 89 | 19 | 92 | 135 | 140 | 141 | 117 | 71 | 87 | 24 | 20 | 18 | 8 | 4 | … | 6 | 165 |
| Females | 862 | … | … | … | … | … | 11 | 37 | 56 | 26 | 25 | 26 | 19 | 117 | 15 | 20 | 95 | 17 | 60 | 66 | 79 | 87 | 56 | 52 | … | 15 | 26 | 12 | 9 | 5 | 5 | 5 | 15 | |
| Total | Males | 264,610 | 9,209 | 7,483 | 8,525 | 8,278 | 8,138 | 7,784 | 7,065 | 6,757 | 6,385 | 6,311 | 6,352 | 5,810 | 5,928 | 5,359 | 5,420 | 20,977 | 4,052 | 17,506 | 22,865 | 19,015 | 19,458 | 19,405 | 13,698 | 9,402 | 4,812 | 3,782 | 1,872 | 1,175 | 581 | 322 | 72 | 814 |
| Females | 220,319 | 8,745 | 7,403 | 8,329 | 8,267 | 7,906 | 7,400 | 7,042 | 6,589 | 6,337 | 6,241 | 6,456 | 5,722 | 5,912 | 5,548 | 5,309 | 21,547 | 4,174 | 15,111 | 16,669 | 14,393 | 13,244 | 11,001 | 7,369 | 5,010 | 2,965 | 2,530 | 1,353 | 912 | 411 | 262 | 58 | 304 | |
| Auckland— | ||||||||||||||||||||||||||||||||||
| Read and Write | Males | 39,934 | … | … | … | … | … | 85 | 347 | 696 | 970 | 1,107 | 1,219 | 1,149 | 1,175 | 1,127 | 1,177 | 4,416 | 854 | 3,493 | 4,218 | 5,481 | 3,647 | 3,517 | 2,348 | 1,892 | 1,047 | 889 | 451 | 507 | 165 | 87 | 6 | 84 |
| Females | 31,939 | … | … | … | … | … | 121 | 589 | 705 | 916 | 1,072 | 1,270 | 1,118 | 1,197 | 1,089 | 1,099 | 4,528 | 843 | 2,993 | 3,140 | 2,691 | 2,598 | 2,012 | 1,399 | 1,044 | 656 | 581 | 299 | 197 | 74 | 57 | 4 | 38 | |
| Read only | Males | 2,737 | … | … | … | 10 | 89 | 289 | 455 | 436 | 245 | 154 | 70 | 33 | 33 | 20 | 22 | 70 | 12 | 64 | 86 | 95 | 118 | 123 | 83 | 62 | 41 | 41 | 19 | 23 | 14 | 15 | … | 6 |
| Females | 2,912 | … | … | … | … | 107 | 293 | 469 | 354 | 243 | 122 | 74 | 42 | 30 | 23 | 10 | 54 | 8 | 54 | 105 | 110 | 158 | 179 | 109 | 102 | 76 | 79 | 51 | 29 | 15 | 13 | … | 1 | |
| Cannot Read | Males | 11,204 | 1,720 | 1,377 | 1,578 | 1,610 | 1,514 | 1,168 | 576 | 281 | 124 | 58 | 46 | 28 | 28 | 16 | 23 | 70 | 24 | 63 | 102 | 117 | 141 | 134 | 108 | 103 | 51 | 59 | 18 | 31 | 13 | 10 | … | 13 |
| Females | 10,132 | 1,645 | 1,365 | 1,599 | 1,577 | 1,405 | 1,014 | 539 | 219 | 128 | 58 | 36 | 17 | 12 | 9 | 13 | 48 | 13 | 55 | 73 | 91 | 103 | 99 | 74 | 33 | 54 | 27 | 22 | … | 9 | 12 | 4 | 15 | |
| Education unknown | Males | 121 | … | … | … | … | … | … | 2 | … | … | 3 | 2 | 4 | 1 | … | 1 | 7 | 3 | 11 | 8 | 11 | 13 | 12 | 5 | 8 | 2 | 3 | 5 | 1 | 1 | … | 2 | 14 |
| Females | 54 | … | … | … | … | … | … | 1 | … | 1 | … | 1 | 1 | … | … | 1 | 7 | … | 5 | 3 | 6 | 8 | 3 | 4 | 4 | … | 3 | … | 1 | 1 | 1 | 2 | 1 | |
| Total | Males | 53,996 | 1,720 | 1,377 | 1,578 | 1,620 | 1,603 | 1,544 | 1,580 | 1,413 | 1,357 | 1,322 | 1,537 | 1,214 | 1,257 | 1,169 | 1,223 | 4,563 | 880 | 3,631 | 4,414 | 3,704 | 3,919 | 3,786 | 2,544 | 2,065 | 1,141 | 992 | 493 | 362 | 195 | 110 | 8 | 117 |
| Females | 45,337 | 1,645 | 1,365 | 1,599 | 1,584 | 1,512 | 1,425 | 1,398 | 1,278 | 1,288 | 1,252 | 1,381 | 1,178 | 1,239 | 1,121 | 1,123 | 4,637 | 864 | 5,107 | 3,328 | 2,898 | 2,667 | 2,293 | 1,580 | 1,224 | 765 | 717 | 377 | 249 | 99 | 83 | 10 | 45 | |
| Taranaki— | ||||||||||||||||||||||||||||||||||
| Read and Write | Males | 6,211 | … | … | … | … | … | 19 | 55 | 99 | 140 | 141 | 173 | 145 | 167 | 149 | 147 | 543 | 114 | 656 | 882 | 650 | 616 | 567 | 339 | 251 | 152 | 91 | 58 | 28 | 15 | 8 | 1 | 45 |
| Females | 4,188 | … | … | … | … | … | 22 | 62 | 116 | 119 | 150 | 165 | 130 | 154 | 118 | 149 | 523 | 120 | 399 | 496 | 417 | 300 | 249 | 169 | 101 | 71 | 54 | 41 | 51 | 13 | 7 | 3 | 9 | |
| Read only | Males | 385 | … | … | … | 4 | 19 | 40 | 68 | 63 | 50 | 17 | 6 | 8 | 6 | 3 | 1 | 17 | … | 16 | 9 | 8 | 11 | 11 | 18 | 7 | 6 | 6 | 3 | 5 | … | 2 | … | 3 |
| Females | 361 | … | … | … | 4 | 27 | 43 | 63 | 57 | 22 | 18 | 11 | 5 | 5 | 4 | 1 | 5 | 1 | 7 | 13 | 15 | 14 | 10 | 16 | 10 | 5 | 5 | 4 | 2 | 3 | 1 | 2 | 2 | |
| Cannot Read | Males | 1,880 | 308 | 236 | 285 | 265 | 226 | 174 | 72 | 49 | 26 | 13 | 15 | 5 | 4 | 5 | 6 | 10 | 1 | 8 | 23 | 30 | 28 | 22 | 10 | 20 | 11 | 11 | 3 | 2 | … | … | 3 | 2 |
| Females | 1,773 | 288 | 267 | 255 | 259 | 226 | 178 | 87 | 44 | 15 | 10 | 11 | 1 | 4 | 4 | 3 | 7 | 1 | 16 | 11 | 21 | 18 | 10 | 13 | 6 | 7 | 3 | 3 | 1 | … | 3 | … | 1 | |
| Education unknown | Males | 34 | … | … | … | … | … | … | 6 | 4 | 4 | … | 3 | 1 | 1 | … | … | 1 | 1 | 4 | 2 | 1 | 1 | 1 | … | … | 1 | … | … | … | … | … | … | 3 |
| Females | 19 | … | … | … | … | … | … | 2 | 2 | 1 | … | … | 2 | … | 1 | … | … | 1 | 1 | … | 2 | 1 | 1 | 1 | … | … | … | 1 | … | … | … | … | 1 | |
| Total | Males | 8,510 | 308 | 236 | 283 | 269 | 245 | 253 | 201 | 215 | 200 | 171 | 197 | 159 | 178 | 157 | 154 | 571 | 116 | 684 | 916 | 689 | 656 | 601 | 376 | 258 | 130 | 108 | 64 | 53 | 15 | 10 | 4 | 53 |
| Females | 6,341 | 288 | 267 | 255 | 263 | 253 | 243 | 214 | 199 | 157 | 178 | 187 | 138 | 163 | 127 | 155 | 537 | 123 | 423 | 520 | 455 | 333 | 276 | 199 | 117 | 83 | 62 | 49 | 34 | 16 | 11 | 5 | 13 | |
| Wellington— | ||||||||||||||||||||||||||||||||||
| Read and Write | Males | … | … | … | … | … | … | 88 | 282 | 455 | 551 | 655 | 697 | 675 | 636 | 612 | 603 | 2,489 | 448 | 2,149 | 2,889 | 2,379 | 2,159 | 1,932 | 1,280 | 897 | 519 | 372 | 182 | 134 | 62 | 33 | 15 | 107 |
| Females | 19,354 | … | … | … | … | … | 96 | 277 | 462 | 557 | 666 | 635 | 688 | 646 | 616 | 688 | 2,676 | 325 | 2,129 | 2,201 | 1,767 | 1,472 | 1,069 | 707 | 544 | 306 | 258 | 136 | 92 | 45 | 21 | 11 | 64 | |
| Read only | Males | 1,435 | … | … | … | 11 | 73 | 156 | 254 | 199 | 129 | 83 | 51 | 18 | 21 | 15 | 11 | 29 | 3 | 32 | 49 | 62 | 53 | 65 | 45 | 28 | 18 | 15 | 20 | 6 | 3 | 2 | 2 | 2 |
| Females | 1,685 | … | … | … | 12 | 90 | 189 | 289 | 192 | 154 | 781 | 44 | 33 | 18 | 6 | 12 | 25 | 7 | 29 | 61 | 74 | 83 | 78 | 69 | 57 | 27 | 25 | 26 | 17 | 7 | 1 | … | 2 | |
Table XIII. Table XIII. Showing the Education of Persons, Males, and Females (exclusive of Maoris and Chinese), in each Provincial District.—continued
| Provincial Districts. | All Ages | Under 5. | 5 and under 10. | 10 and under 15. | 15 and under 21. | 21 and under 40. | 40 and under 60. | 60 and under 80. | 80 and upwards | Unspecified children | Unspecified adults | |||||||||||||||||||||||
|---|---|---|---|---|---|---|---|---|---|---|---|---|---|---|---|---|---|---|---|---|---|---|---|---|---|---|---|---|---|---|---|---|---|---|
| Under 1 year. | 1–2 | 2–3 | 3–4 | 4–5 | 5–6 | 6–7 | 7–8 | 8–9 | 9–10 | 10–11 | 11–12 | 12–13 | 13–14 | 14–15 | 15–20 | 20–21 | 21–25 | 25–30 | 35–40 | 40–45 | 45–50 | 50–55 | 55–60 | 60–65 | 65–70 | 70–75 | 75–80 | |||||||
| Cannot Read | Males | 7,701 | 1,253 | 1,015 | 1,160 | 1,091 | 1,045 | 717 | 401 | 160 | 76 | 35 | 26 | 14 | 14 | 18 | 16 | 66 | 9 | 47 | 85 | 75 | 74 | 72 | 60 | 44 | 40 | 42 | 19 | 9 | 5 | 5 | 8 | 6 |
| Females | 7,413 | 1,l64 | 1.052 | 1,129 | 1,097 | 976 | 757 | 364 | 163 | 71 | 29 | 15 | 11 | 15 | 8 | 11 | 40 | 9 | 40 | 74 | 74 | 62 | 76 | 47 | 40 | 18 | 30 | 12 | 8 | 5 | 4 | 6 | 6 | |
| Education unknown | Males | 214 | … | … | … | … | … | … | 8 | 6 | 4 | 6 | 5 | 2 | 3 | … | 5 | 17 | 4 | 16 | 23 | 32 | 28 | 17 | 11 | 11 | 2 | … | 1 | 1 | 1 | … | … | 11 |
| Females | 202 | … | … | … | … | … | 2 | 5 | 6 | 2 | 7 | 6 | 1 | 6 | 3 | 3 | 18 | 4 | 24 | 16 | 19 | 21 | 11 | 19 | 12 | … | 8 | 1 | 3 | 2 | … | 1 | 2 | |
| Total | Males | 32,634 | 1,253 | 1.015 | 1,160 | 1,102 | 1,118 | 961 | 925 | 798 | 760 | 779 | 779 | 709 | 674 | 645 | 635 | 2,601 | 464 | 2,244 | 3,046 | 2,548 | 2,314 | 2,086 | 1,396 | 980 | 579 | 429 | 222 | 150 | 71 | 40 | 25 | 126 |
| Females | 28,654 | 1,l64 | 1,052 | 1,129 | 1,109 | 1,066 | 1,044 | 935 | 823 | 764 | 780 | 700 | 733 | 685 | 633 | 714 | 2,759 | 545 | 2,222 | 2,352 | 1,934 | 1,638 | 1,234 | 842 | 653 | 351 | 321 | 175 | 120 | 59 | 26 | 18 | 74 | |
| Hawke's Bay —. | ||||||||||||||||||||||||||||||||||
| Read and Write | Males | 6,957 | … | … | … | … | … | 18 | 40 | 127 | 167 | 173 | 168 | 185 | 175 | 156 | 169 | 687 | 142 | 650 | 928 | 811 | 717 | 636 | 385 | 241 | 117 | 99 | 59 | 26 | 11 | 8 | 7 | 46 |
| Females | 5,054 | … | … | … | … | … | 11 | 69 | 103 | 133 | 181 | 198 | 181 | 179 | 179 | 169 | 693 | 155 | 457 | 595 | 516 | 399 | 325 | 200 | 129 | 71 | 38 | 25 | 19 | 8 | 3 | 1 | 17 | |
| Read only | Males | 437 | … | … | … | 6 | 13 | 44 | 54 | 69 | 34 | 21 | 13 | 11 | 9 | 1 | 3 | 13 | 2 | 9 | 12 | 19 | 20 | 24 | 16 | 18 | 10 | 8 | 4 | … | … | 1 | 2 | 1 |
| Females | 456 | … | … | … | … | 12 | 35 | 72 | 52 | 33 | 31 | 17 | 2 | 8 | 4 | … | 13 | 3 | 11 | 11 | 24 | 31 | 25 | 21 | 21 | 6 | 11 | 5 | 2 | 1 | 2 | … | 1 | |
| Cannot Read | Males | 2,228 | 343 | 273 | 360 | 288 | 261 | 223 | 133 | 53 | 23 | 18 | 12 | 6 | 4 | 7 | 3 | 18 | 8 | 24 | 32 | 20 | 28 | 25 | 21 | 19 | 10 | 7 | … | 3 | … | … | 4 | 1 |
| Females | 2,120 | 346 | 289 | 314 | 278 | 292 | 204 | 117 | 71 | 21 | 20 | 9 | 2 | 4 | 3 | 2 | 11 | 1 | 7 | 23 | 17 | 25 | 15 | 19 | 12 | 5 | 5 | 1 | … | … | 1 | 4 | … | |
| Education unknown | Males | 74 | … | … | … | … | … | 1 | 1 | … | 3 | … | 1 | 2 | 4 | … | … | 3 | 1 | 1 | 10 | 3 | 10 | 7 | 5 | 2 | … | … | … | … | … | … | 1 | 18 |
| Females | 37 | … | … | … | … | … | … | 2 | 1 | … | … | 1 | 1 | … | … | … | 6 | 1 | 5 | 5 | 3 | 2 | 3 | 1 | 1 | 1 | 2 | … | … | … | … | 1 | 1 | |
| Total | Males | 9,696 | 343 | 273 | 360 | 294 | 274 | 286 | 237 | 249 | 227 | 212 | 194 | 204 | 192 | 164 | 175 | 721 | 153 | 685 | 982 | 853 | 775 | 692 | 417 | 280 | 137 | 114 | 63 | 29 | 12 | 9 | 14 | 66 |
| Females | 7,667 | 346 | 289 | 314 | 278 | 304 | 250 | 260 | 227 | 189 | 232 | 225 | 186 | 191 | 186 | 171 | 723 | 160 | 480 | 614 | 560 | 457 | 363 | 241 | 163 | 83 | 56 | 31 | 23 | 9 | 6 | 6 | 19 | |
| Marlborough | ||||||||||||||||||||||||||||||||||
| Read and Write | Males | 3,708 | … | … | … | … | … | 6 | 23 | 59 | 69 | 91 | 86 | 98 | 115 | 79 | 79 | 396 | 86 | 373 | 455 | 346 | 353 | 323 | 256 | 171 | 80 | 84 | 33 | 28 | 10 | 5 | … | 4 |
| Females | 2,563 | … | … | … | … | … | 6 | 29 | 54 | 11 | 103 | 90 | 109 | 100 | 101 | 85 | 362 | 82 | 276 | 284 | 233 | 175 | 132 | 90 | 55 | 44 | 36 | 19 | 8 | 2 | 2 | … | 5 | |
| Read only | Males | 271 | … | … | … | … | 9 | 22 | 37 | 29 | 40 | 16 | 14 | 12 | 8 | 1 | 4 | 14 | … | 10 | 8 | 5 | 6 | 8 | 11 | 4 | 4 | 6 | … | 1 | … | 1 | … | 1 |
| Females | 240 | … | … | … | 1 | 7 | 24 | 33 | 33 | 24 | 15 | 9 | 7 | 6 | 3 | … | 8 | … | 4 | 12 | 1 | 7 | 7 | 10 | 6 | 6 | 2 | 3 | 3 | 1 | 2 | … | … | |
| Cannot Read | Males | 1,226 | 195 | 153 | 185 | 142 | 160 | 127 | 77 | 44 | 12 | 19 | 5 | 6 | 4 | … | 3 | 12 | 4 | 12 | 11 | 4 | 11 | 10 | 6 | 11 | 2 | 4 | 1 | 1 | 1 | 1 | … | … |
| Females | 1,234 | 217 | 147 | 180 | 187 | 156 | 104 | 88 | 25 | 21 | 12 | 5 | 3 | 3 | 1 | 4 | 5 | 2 | 5 | 9 | 11 | 11 | 12 | 7 | 5 | 4 | 5 | 2 | 1 | 1 | 1 | … | … | |
| Education unknown | Males | 43 | … | … | … | … | … | 4 | 4 | 2 | 1 | 3 | 1 | … | 1 | … | … | 3 | … | 2 | 4 | 2 | 7 | 2 | 1 | 2 | … | … | 1 | … | … | … | … | 3 |
| Females | 14 | … | … | … | … | … | … | … | 1 | … | … | … | … | … | … | … | 3 | 1 | … | … | 2 | 6 | … | … | … | 1 | … | … | … | … | … | … | … | |
| Total | Males | 5,248 | 195 | 153 | 185 | 142 | 169 | 159 | 141 | 134 | 122 | 129 | 106 | 116 | 128 | 80 | 86 | 425 | 90 | 397 | 478 | 357 | 377 | 343 | 274 | 191 | 86 | 94 | 35 | 30 | 11 | 7 | … | 8 |
| Females | 4,051 | 217 | 147 | 180 | 188 | 163 | 134 | 150 | 113 | 122 | 130 | 110 | 119 | 109 | 105 | 89 | 378 | 85 | 285 | 305 | 253 | 197 | 151 | 107 | 66 | 55 | 43 | 24 | 12 | 4 | 5 | … | 5 | |
| Nelson— | ||||||||||||||||||||||||||||||||||
| Read and Write | Males | 10,692 | … | … | … | … | … | 23 | 84 | 167 | 258 | 265 | 317 | 332 | 316 | 283 | 272 | 1,048 | 191 | 680 | 817 | 764 | 1,178 | 1,242 | 962 | 653 | 295 | 234 | 132 | 77 | 51 | 16 | … | 35 |
| Females | 7,888 | … | … | … | … | … | 18 | 111 | 209 | 236 | 291 | 315 | 300 | 302 | 282 | 227 | 1,154 | 213 | 708 | 724 | 637 | 607 | 465 | 354 | 229 | 168 | 117 | 82 | 60 | 39 | 25 | 2 | 13 | |
| Read only | Males | 795 | … | … | … | 1 | 26 | 80 | 131 | 123 | 76 | 46 | 20 | 11 | 10 | 6 | 2 | 14 | 4 | 13 | 21 | 17 | 32 | 42 | 36 | 23 | 20 | 14 | 9 | 9 | 6 | 3 | … | … |
| Females | 764 | … | … | … | 6 | 36 | 87 | 131 | 113 | 56 | 38 | 19 | 8 | 9 | 1 | 2 | 7 | 1 | 4 | 13 | 26 | 28 | 33 | 35 | 25 | 19 | 16 | 13 | 17 | 7 | 7 | … | 1 | |
| Cannot Read | Males | 2,765 | 442 | 319 | 417 | 426 | 368 | 269 | 151 | 46 | 30 | 15 | 7 | 8 | 9 | 8 | 6 | 15 | 5 | 7 | 14 | 16 | 33 | 33 | 25 | 22 | 14 | 13 | 8 | 1 | 4 | 1 | 1 | 2 |
| Females | 2,577 | 423 | 358 | 414 | 380 | 347 | 255 | 140 | 58 | 29 | 10 | 10 | 4 | 3 | 2 | … | 6 | 2 | 10 | 7 | 17 | 13 | 19 | 16 | 11 | 7 | 9 | 7 | 4 | 5 | 3 | 1 | 1 | |
| Education unknown | Males | 97 | … | … | … | … | … | 1 | … | … | 4 | … | 1 | 1 | 2 | … | … | 4 | … | 9 | 8 | 18 | 6 | 4 | 9 | 5 | 5 | 5 | 3 | 2 | 1 | … | … | 9 |
| Females | 46 | … | … | … | … | … | … | 3 | 1 | … | … | 4 | 2 | … | … | 1 | 4 | 1 | 3 | 2 | 1 | 4 | 8 | 1 | 1 | 1 | 3 | 3 | … | 1 | 2 | … | … | |
| Total | Males | 14,349 | 442 | 349 | 417 | 427 | 394 | 373 | 366 | 336 | 368 | 326 | 345 | 352 | 337 | 297 | 280 | 1,081 | 200 | 709 | 860 | 815 | 1,249 | 1,321 | 1,032 | 703 | 334 | 266 | 152 | 89 | 62 | 20 | 1 | 46 |
| Females | 11,275 | 423 | 358 | 414 | 386 | 313 | 360 | 385 | 381 | 321 | 345 | 348 | 314 | 314 | 285 | 230 | 1,171 | 217 | 725 | 746 | 681 | 652 | 525 | 406 | 272 | 195 | 145 | 105 | 81 | 52 | 37 | 3 | 15 | |
| Westland— | ||||||||||||||||||||||||||||||||||
| Read and Write | Males | 6,409 | … | … | … | … | … | 22 | 57 | 120 | 148 | 185 | 179 | 160 | 179 | 120 | 115 | 405 | 51 | 267 | 373 | 414 | 842 | 1,080 | 834 | 468 | 199 | 107 | 44 | 13 | 6 | 3 | … | 18 |
| Females | 4,115 | … | … | … | … | … | 22 | 70 | 146 | 183 | 184 | 212 | 186 | 167 | 149 | 125 | 423 | 99 | 252 | 314 | 390 | 458 | 345 | 194 | 99 | 35 | 23 | 13 | 13 | 4 | 2 | 1 | 6 | |
| Read only | Males | 364 | … | … | … | 2 | 17 | 54 | 67 | 58 | 27 | 10 | 6 | 1 | … | 1 | 1 | 1 | 1 | 2 | 5 | 5 | 24 | 35 | 20 | 11 | 9 | 4 | 2 | … | … | 1 | … | … |
| Females | 390 | … | … | … | 2 | 24 | 55 | 81 | 69 | 33 | 9 | 6 | 1 | 3 | 2 | 1 | 1 | … | 5 | 7 | 15 | 14 | 29 | 15 | 9 | 1 | 4 | 2 | 1 | … | … | … | 1 | |
| Cannot Read | Males | 1,492 | 221 | 179 | 227 | 212 | 208 | 140 | 71 | 27 | 9 | 6 | 3 | 3 | 1 | 2 | 1 | 1 | … | 2 | 15 | 18 | 22 | 42 | 29 | 17 | 12 | 12 | 6 | 1 | … | 1 | … | 2 |
| Females | 1,396 | 231 | 90 | 225 | 233 | 190 | 125 | 68 | 27 | 11 | 5 | 2 | … | 2 | 1 | 1 | 2 | … | 3 | 9 | 11 | 18 | 16 | 12 | 7 | 3 | 3 | 1 | … | … | … | … | … | |
Table XIII. Table XIII. Showing the Education of Persons, Males, and Females (exclusive of Maoris and Chinese), in each Provincial District.—continued
| Provincial Districts. | All Ages | Under 5. | 5 and under 10. | 10 and under 15. | 15 and under 21. | 21 and under 40. | 40 and under 60. | 60 and under 80. | 80 and upwards | Unspecified children | Unspecified adults | |||||||||||||||||||||||
|---|---|---|---|---|---|---|---|---|---|---|---|---|---|---|---|---|---|---|---|---|---|---|---|---|---|---|---|---|---|---|---|---|---|---|
| Under 1 year. | 1–2 | 2–3 | 3–4 | 4–5 | 5–6 | 6–7 | 7–8 | 8–9 | 9–10 | 10–11 | 11–12 | 12–13 | 13–14 | 14–15 | 15–20 | 20–21 | 21–25 | 25–30 | 30–35 | 35–40 | 40–45 | 45–50 | 50–55 | 55–60 | 60–65 | 65–70 | 70–75 | 75–80 | ||||||
| Westland—continued. | ||||||||||||||||||||||||||||||||||
| Education unknown | Males | 54 | … | … | … | … | … | 1 | 1 | 3 | … | … | … | … | … | … | … | 3 | … | 3 | 5 | 5 | 6 | 14 | 4 | 5 | 1 | 1 | … | … | … | … | 1 | 1 |
| Females | 34 | … | … | … | … | … | … | … | 1 | 1 | 1 | 1 | … | … | 1 | 1 | 7 | 1 | 2 | 3 | 2 | 4 | 1 | 2 | 2 | 1 | 1 | … | … | … | … | … | … | |
| Total | Males | 8,319 | 221 | 179 | 227 | 214 | 225 | 217 | 196 | 208 | 184 | 201 | 188 | 164 | 180 | 123 | 117 | 411 | 52 | 274 | 398 | 442 | 894 | 1,171 | 887 | 501 | 221 | 124 | 52 | 15 | 6 | 5 | 1 | 21 |
| Females | 5,935 | 231 | 190 | 225 | 235 | 214 | 202 | 219 | 243 | 228 | 200 | 221 | 187 | 172 | 153 | 128 | 433 | 100 | 262 | 333 | 418 | 494 | 391 | 223 | 117 | 41 | 31 | 16 | 14 | 4 | 2 | 1 | 7 | |
| Canterbury— | ||||||||||||||||||||||||||||||||||
| Read and Write | Males | 43,367 | … | … | … | … | … | 139 | 437 | 702 | 1,015 | 1,237 | 1,327 | 1,266 | 1,297 | 1,169 | 1,203 | 4,674 | 974 | 4,089 | 5,465 | 4,318 | 3,921 | 3,830 | 2,461 | 1,604 | 791 | 632 | 329 | 175 | 86 | 46 | 1 | 89 |
| Females | 35,240 | … | … | … | … | … | 153 | 426 | 805 | 1,052 | 1,203 | 1,367 | 1,220 | 1,326 | 1,239 | 1,148 | 4,876 | 964 | 3,558 | 3,842 | 3,092 | 2,752 | 2,312 | 1,517 | 929 | 532 | 444 | 225 | 136 | 50 | 27 | 1 | 38 | |
| Read only | Males | 3,057 | … | … | … | 12 | 116 | 351 | 565 | 469 | 302 | 146 | 99 | 35 | 32 | 23 | 17 | 73 | 12 | 64 | 117 | 107 | 98 | 131 | 108 | 50 | 48 | 31 | 31 | 9 | 6 | 1 | … | 4 |
| Females | 3,201 | … | … | … | 15 | 130 | 356 | 514 | 435 | 273 | 143 | 67 | 30 | 25 | 20 | 11 | 59 | 20 | 67 | 134 | 146 | 184 | 164 | 131 | 87 | 14 | 52 | 34 | 18 | 10 | 5 | … | 1 | |
| Cannot Read | Males | 13,718 | 2,285 | 1,848 | 2,073 | 1,935 | 1,806 | 1,353 | 701 | 286 | 129 | 62 | 38 | 30 | 21 | 12 | 10 | 79 | 23 | 81 | 147 | 137 | 162 | 152 | 116 | 77 | 55 | 44 | 20 | 10 | 6 | 7 | 4 | 3 |
| Females | 13,005 | 2,119 | 1,821 | 2,011 | 1,980 | 1,761 | 1,191 | 689 | 270 | 129 | 61 | 35 | 22 | 12 | 16 | 17 | 53 | 24 | 67 | 121 | 117 | 143 | 113 | 71 | 58 | 27 | 32 | 19 | 11 | 3 | 2 | 2 | 2 | |
| Education unknown | Males | 313 | … | … | … | … | … | … | 3 | 3 | 2 | 5 | 8 | 4 | 2 | 4 | 4 | 26 | 6 | 21 | 30 | 35 | 35 | 23 | 15 | 8 | 3 | 1 | 3 | 1 | 1 | … | … | 70 |
| Females | 146 | … | … | … | … | … | 2 | 5 | 10 | 7 | 4 | 2 | 4 | 4 | 3 | 2 | 16 | 4 | 9 | 13 | 26 | 15 | 6 | 5 | 2 | 5 | 1 | 4 | 2 | … | 1 | … | 4 | |
| Total | Males | 60,455 | 2,285 | 1,848 | 2,073 | 1,947 | 1,922 | 1,843 | 1,706 | 1,550 | 1,44s | 1,450 | 1,472 | 1,335 | 1,352 | 1,208 | 1,240 | 4,852 | 1,015 | 4,255 | 5,759 | 4,597 | 4,216 | 4,106 | 2,700 | 1.739 | 897 | 708 | 383 | 195 | 99 | 54 | 5 | 166 |
| Females | 51,592 | 2,119 | 1,821 | 2,011 | 2,001 | 1,891 | 3,702 | 1,634 | 1,520 | 1,461 | 1,411 | 1,471 | 1,288 | 1,367 | 1,278 | 1,178 | 5,004 | 1,012 | 3,701 | 4,110 | 3,371 | 3,094 | 2,595 | 1,724 | 1,076 | 628 | 529 | 282 | 107 | 63 | 35 | 3 | 45 | |
| Otago | ||||||||||||||||||||||||||||||||||
| Read and Write | Males | 52,314 | … | … | … | … | … | 122 | 432 | 541 | 1,148 | 1,424 | 1,582 | 1,482 | 1,599 | 1,471 | 1,473 | 5,594 | 1,060 | 4,468 | 5,776 | 4,757 | 4,763 | 4,948 | 3,850 | 2,517 | 1,188 | 872 | 374 | 246 | 105 | 58 | 5 | 159 |
| Females | 40,892 | … | … | … | … | … | 114 | 368 | 841 | 1,228 | 1,430 | 1,651 | 1,494 | 1,618 | 11,423 | 1,481 | 5,767 | 1,033 | 3,771 | 4,074 | 3,511 | 3,381 | 2,868 | 1,827 | 1,167 | 682 | 544 | 253 | 171 | 80 | 42 | 8 | 65 | |
| Read only | Males | 3,689 | 8 | 100 | 435 | 445 | 237 | 109 | 53 | 27 | 23 | 16 | 67 | 4 | 48 | 70 | 90 | 107 | 126 | 90 | 74 | 28 | 30 | 11 | 8 | 2 | 4 | … | 4 | |||||
| Females | 4,001 | … | … | … | 16 | 143 | 418 | 708 | 667 | 451 | 220 | 115 | 51 | 27 | 25 | 18 | 44 | 16 | 60 | 126 | 158 | 175 | 161 | 132 | 82 | 49 | 47 | 33 | 24 | 18 | 12 | 1 | 4 | |
| Cannot Read | Males | 14,828 | 2,440 | 2,048 | 2,240 | 2,250 | 2,086 | 1,001 | 714 | 271 | 128 | 50 | 29 | 13 | 128 | 14 | 10 | 56 | 8 | 61 | 103 | 116 | 145 | 137 | 91 | 72 | 38 | 32 | 17 | 15 | 5 | 5 | 7 | 11 |
| Females | 14,183 | 2,307 | 1,914 | 2,200 | 2,205 | 1,974 | 1,499 | 749 | 279 | 112 | 51 | 34 | 23 | 19 | 6 | 10 | 54 | 14 | 59 | 113 | 120 | 124 | 109 | 02 | 62 | 26 | 24 | 5 | 14 | 6 | 2 | 2 | 5 | |
| Education unknown | Males | 413 | … | … | … | … | … | 7 | 14 | 18 | 14 | 9 | 13 | 8 | 9 | 8 | 9 | 25 | 4 | 24 | 43 | 33 | 35 | 37 | 21 | 16 | 10 | 10 | 5 | 3 | … | … | 2 | 36 |
| Females | 310 | … | … | … | … | … | 7 | 19 | 14 | 14 | 10 | 11 | 8 | 7 | 5 | 12 | 32 | 4 | 11 | 24 | 28 | 26 | 23 | 19 | 8 | 5 | 8 | 3 | 3 | 1 | 1 | 1 | 6 | |
| Total | Males | 71,244 | 2,440 | 2,045 | 2,240 | 2,200 | 2,186 | 2,165 | 1,911 | 1,852 | 1,735 | 1,720 | 1,733 | 1,556 | 1,650 | 1,516 | 1,508 | 5,742 | 1,076 | 4,601 | 5,992 | 4,996 | 5,050 | 5,248 | 4,052 | 2,679 | 1,264 | 944 | 407 | 272 | 112 | 67 | 14 | 210 |
| Females | 59,386 | 12,307 | 1,914 | 2,200 | 2,221 | 2,117 | 2,038 | 1,844 | 1,801 | 1,805 | 1,711 | 1,811 | 1.570 | 1,671 | 1,459 | 1,521 | 5,897 | 1,067 | 3,901 | 4,337 | 3,817 | 3,706 | 3,161 | 2,040 | 1,319 | 762 | 623 | 294 | 212 | 105 | 57 | 12 | 80 | |
| Chatham Islands— | ||||||||||||||||||||||||||||||||||
| Read and Write | Males | 109 | … | … | … | … | … | … | … | … | 2 | 1 | … | … | … | … | 1 | 10 | 3 | 23 | 14 | 10 | 7 | 18 | 8 | 5 | 3 | 2 | 1 | … | … | … | … | 1 |
| Females | 55 | … | … | … | … | … | … | … | 2 | 1 | 2 | 1 | 3 | 1 | 1 | 1 | 7 | 1 | 4 | 4 | 5 | 6 | 7 | 1 | 3 | 2 | 2 | … | … | … | … | … | 1 | |
| Read only | Males | 10 | … | … | … | … | … | 1 | 1 | 2 | 2 | … | 1 | … | … | … | 1 | … | … | … | 1 | 1 | … | … | … | … | … | … | … | … | … | … | … | … |
| Females | 8 | … | … | … | … | 1 | 1 | 1 | 2 | … | … | 1 | … | … | … | … | … | … | … | … | 1 | … | … | … | … | … | 1 | … | … | … | … | … | … | |
| Cannot Read | Males | 40 | 2 | 5 | 2 | 5 | 2 | 2 | 1 | … | … | … | … | 1 | … | … | … | … | 3 | 3 | 5 | 3 | 1 | 1 | 2 | 1 | … | 1 | … | … | … | … | … | … |
| Females | 18 | 5 | … | 2 | 0 | 2 | 1 | 2 | … | 1 | … | … | … | … | … | 1 | 1 | … | 1 | … | … | … | … | … | … | … | … | … | … | … | … | … | … | |
| Education unknown | Males | … | … | … | … | … | … | … | … | … | … | … | … | … | … | … | ||||||||||||||||||
| Females | … | … | … | … | … | … | … | … | … | … | … | … | … | … | … | |||||||||||||||||||
| Total | Males | 159 | 1 | 5 | 2 | 5 | 2 | 3 | 2 | 2 | 4 | 1 | 1 | 1 | … | … | 2 | 10 | 6 | 26 | 20 | 14 | 8 | 19 | 10 | 6 | 3 | 3 | 1 | … | … | … | … | 1 |
| Females | 81 | 5 | … | 2 | 2 | 3 | 2 | 3 | 4 | 2 | 2 | 2 | 3 | 1 | 1 | 2 | 8 | 1 | 5 | 4 | 6 | 6 | 7 | 1 | 3 | 2 | 3 | … | … | … | … | … | 1 | |
Table XIV. Table XIV. Showing the Education of Persons, Males, and Females (exclusive of Maoris and Chinese), in each County.
| Countries | All Ages | Under 5. | 5 and under 10. | 10 and under 15. | 15 and under 21. | 21 and under 40. | 40 and under 60. | 60 and under 80. | 80 and upwards | Unspecified children | Unspecified adults | |||||||||||||||||||||||
|---|---|---|---|---|---|---|---|---|---|---|---|---|---|---|---|---|---|---|---|---|---|---|---|---|---|---|---|---|---|---|---|---|---|---|
| Under 1 year. | 1–2 | 2–3 | 3–4 | 4–5 | 5–6 | 6–7 | 7–8 | 8–9 | 9–10 | 10–11 | 11–12 | 12–13 | 13–14 | 14–15 | 15–20 | 20–21 | 21–25 | 25–30 | 30–35 | 35–40 | 40–45 | 45–50 | 50–55 | 55–60 | 60–65 | 65–70 | 70–75 | 75–80 | ||||||
| Mongonui— | ||||||||||||||||||||||||||||||||||
| Read and Write | Males | 603 | … | … | … | … | … | … | 6 | 7 | 19 | 12 | 18 | 15 | 28 | 18 | 23 | 75 | 13 | 48 | 59 | 65 | 46 | 56 | 29 | 21 | 10 | 15 | 5 | 6 | 2 | 5 | … | 2 |
| Females | 378 | … | … | … | … | … | … | 5 | 10 | 13 | 11 | 20 | 13 | 14 | 15 | 13 | 63 | 9 | 34 | 30 | 31 | 35 | 21 | 13 | 8 | 6 | 7 | 2 | 1 | 2 | 1 | … | 1 | |
| Read only | Males | 45 | … | … | … | … | 1 | 2 | 9 | 8 | 8 | 5 | … | 1 | … | 1 | 1 | 4 | … | 1 | … | … | … | 1 | … | 1 | … | … | … | 2 | … | … | … | … |
| Females | 58 | … | … | … | … | 2 | 6 | 9 | 8 | 8 | 1 | 2 | 2 | … | … | … | 2 | … | … | … | 1 | 2 | 2 | 1 | … | 1 | 1 | 1 | … | … | … | … | … | |
| Cannot Read | Males | 223 | 29 | 30 | 26 | 25 | 38 | 20 | 8 | 10 | 6 | 2 | 2 | 1 | … | … | … | 2 | … | 3 | 4 | 1 | 3 | 4 | 3 | 3 | … | 2 | … | … | … | 1 | … | … |
| Females | 164 | 27 | 13 | 37 | 23 | 21 | 14 | 12 | 3 | 2 | 2 | 1 | … | … | … | 1 | 1 | … | 2 | 2 | 2 | … | … | 1 | … | … | … | … | … | … | … | … | … | |
| Education unknown | Males | … | … | … | … | … | … | … | … | … | … | … | … | … | … | … | ||||||||||||||||||
| Females | … | … | … | … | … | … | … | … | … | … | … | … | … | … | … | |||||||||||||||||||
| Total | Males | 871 | 29 | 30 | 26 | 25 | 39 | 22 | 23 | 25 | 33 | 19 | 20 | 17 | 28 | 19 | 24 | 81 | 13 | 52 | 63 | 66 | 49 | 61 | 32 | 25 | 10 | 17 | 5 | 8 | 2 | 6 | … | 2 |
| Females | 600 | 27 | 13 | 37 | 23 | 23 | 20 | 36 | 20 | 23 | 14 | 23 | 15 | 14 | 15 | 14 | 66 | 9 | 36 | 32 | 34 | 37 | 23 | 15 | 8 | 7 | 8 | 3 | 1 | 2 | 1 | … | 1 | |
| Bay of Islands — | ||||||||||||||||||||||||||||||||||
| Read and Write | Males | 916 | … | … | … | … | … | 2 | 5 | 13 | 17 | 22 | 29 | 19 | 23 | 16 | 26 | 91 | 24 | 93 | 131 | 89 | 80 | 81 | 54 | 43 | 25 | 14 | 5 | 4 | 2 | 1 | … | 7 |
| Females | 613 | … | … | … | … | … | 3 | 7 | 10 | 19 | 15 | 20 | 19 | 25 | 22 | 23 | 85 | 12 | 55 | 74 | 53 | 57 | 33 | 24 | 22 | 16 | 7 | 3 | 2 | 3 | 3 | … | 1 | |
| Read only | Males | 69 | … | … | … | … | 4 | 4 | 11 | 10 | 7 | 3 | 4 | … | 2 | … | … | … | … | 1 | 6 | 4 | 3 | 1 | 1 | 1 | 2 | … | 2 | … | … | … | 3 | |
| Females | 63 | … | … | … | … | 4 | 3 | 13 | 8 | 5 | 3 | 2 | 3 | … | 1 | … | … | … | 1 | 3 | 5 | 2 | 4 | 3 | 1 | … | 1 | 1 | … | … | … | … | … | |
| Cannot Read | Males | 268 | 43 | 33 | 32 | 34 | 32 | 21 | 12 | 10 | 8 | 3 | 1 | … | 1 | 1 | 4 | 2 | … | 4 | 2 | 5 | 3 | 2 | 3 | … | 1 | … | 1 | … | … | 3 | ||
| Females | 249 | 42 | 33 | 40 | 36 | 31 | 19 | 16 | 3 | 2 | 1 | … | 1 | 1 | … | 1 | 2 | 1 | 2 | 3 | 1 | 2 | 4 | … | 4 | 1 | … | … | … | … | … | 1 | … | |
| Education unknown | Males | 4 | … | … | … | … | … | … | … | … | … | … | … | … | … | … | … | … | 1 | 1 | 1 | 1 | … | … | … | … | … | … | … | … | … | … | … | |
| Females | 1 | … | … | … | … | … | … | … | … | … | … | … | … | … | … | … | … | … | … | 1 | … | … | … | … | … | … | … | … | … | … | … | … | … | |
| Total | Males | 1,257 | 43 | 33 | 32 | 34 | 36 | 27 | 28 | 33 | 32 | 28 | 34 | 19 | 24 | 19 | 27 | 95 | 26 | 94 | 137 | 98 | 90 | 87 | 57 | 47 | 31 | 17 | 5 | 7 | 2 | 2 | … | 13 |
| Females | 926 | 42 | 33 | 40 | 36 | 35 | 25 | 36 | 21 | 26 | 19 | 22 | 23 | 26 | 23 | 24 | 87 | 13 | 58 | 81 | 59 | 61 | 41 | 29 | 27 | 17 | 8 | 4 | 2 | 3 | 3 | 1 | 1 | |
| Hokianga— | ||||||||||||||||||||||||||||||||||
| Read and Write | Males | 261 | … | … | … | … | … | … | 3 | 6 | 9 | 3 | 6 | 2 | 5 | 2 | … | 28 | … | 31 | 32 | 32 | 22 | 23 | 17 | 10 | 3 | 8 | 1 | 1 | 1 | 4 | … | … |
| Females | 133 | … | … | … | … | … | … | 2 | 3 | 4 | 5 | 7 | 5 | 5 | 4 | 9 | 16 | … | 17 | 13 | 16 | 7 | 8 | 4 | 6 | 1 | 1 | … | … | … | … | … | … | |
| Read only | Males | 13 | … | … | … | … | 1 | … | 2 | 1 | 2 | … | 1 | … | … | … | … | 2 | 1 | 1 | 1 | … | … | 1 | … | … | … | … | … | … | … | … | … | |
| Females | 13 | … | … | … | … | … | 1 | 1 | 3 | … | 1 | … | … | 2 | 1 | … | 1 | … | … | 1 | … | … | 1 | … | … | … | 1 | … | … | … | … | … | … | |
| Cannot Read | Males | 93 | 16 | 10 | 10 | 10 | 10 | 8 | 2 | 5 | 1 | 1 | … | 2 | … | … | … | … | … | 6 | 4 | 1 | … | 4 | … | … | … | … | … | 1 | … | … | … | … |
| Females | 74 | 8 | 9 | 15 | 3 | 11 | 6 | 9 | 1 | 1 | 2 | 2 | 1 | … | 1 | … | 2 | … | … | … | … | … | 1 | 2 | … | … | … | … | … | … | … | … | … | |
| Education unknown | Males | … | … | … | … | … | … | … | … | … | … | … | … | … | … | … | … | … | … | … | … | … | … | … | … | … | … | … | … | … | … | … | … | … |
| Females | … | … | … | … | … | … | … | … | … | … | … | … | … | … | … | … | … | … | … | … | … | … | … | … | … | … | … | … | … | … | … | … | … | |
| Total | Males | 367 | 16 | 10 | 10 | 10 | 11 | 8 | 7 | 12 | 12 | 4 | 7 | 4 | 5 | 2 | 5 | 30 | 8 | 38 | 37 | 33 | 22 | 27 | 20 | 10 | 3 | 8 | 1 | 2 | 1 | 4 | … | … |
| Females | 220 | 8 | 9 | 15 | 3 | 11 | 7 | 12 | 7 | 5 | 8 | 9 | 6 | 7 | 6 | 9 | 19 | … | 17 | 14 | 16 | 7 | 10 | 6 | 6 | 1 | 2 | … | … | … | — | … | … | |
| Hobson— | ||||||||||||||||||||||||||||||||||
| Read and Write | Males | 1,344 | … | … | … | … | … | 1 | 8 | 16 | 20 | 34 | 33 | 28 | 39 | 21 | 30 | 134 | 29 | 158 | 206 | 138 | 137 | 104 | 72 | 56 | 29 | 18 | 7 | 5 | 3 | 5 | … | 13 |
| Females | 727 | … | … | … | … | … | 6 | 9 | 13 | 18 | 21 | 24 | 26 | 25 | 18 | 24 | 104 | 19 | 83 | 85 | 65 | 46 | 47 | 39 | 21 | 17 | 12 | 9 | 1 | … | 1 | … | 4 | |
Table XIV. Table XIV. Showing the Education of Persons, Males, and Females (exclusive of Maoris and Chinese), in each County.—continued
| Countries | All Ages | Under 5. | 5 and under 10. | 10 and under 15. | 15 and under 21. | 21 and under 40. | 40 and under 60. | 60 and under 80. | 80 and upwards | Unspecified children | Unspecified adults | |||||||||||||||||||||||
|---|---|---|---|---|---|---|---|---|---|---|---|---|---|---|---|---|---|---|---|---|---|---|---|---|---|---|---|---|---|---|---|---|---|---|
| Under 1 year. | 1–2 | 2–3 | 3–4 | 4–5 | 5–6 | 6–7 | 7–8 | 8–9 | 9–10 | 10–11 | 11–12 | 12–13 | 13–14 | 14–15 | 15–20 | 20–21 | 21–25 | 25–30 | 30–35 | 35–40 | 40–45 | 45–50 | 50–55 | 55–60 | 60–65 | 65–70 | 70–75 | 75–80 | ||||||
| Hobson—continued. | ||||||||||||||||||||||||||||||||||
| Read only | Males | 71 | … | … | … | … | 1 | 5 | 15 | 9 | 9 | 2 | 1 | 1 | … | … | … | 2 | 1 | 1 | 3 | 3 | 5 | 5 | 3 | 2 | 1 | … | … | 3 | … | … | … | … |
| Females | 74 | … | … | … | … | … | 2 | 6 | 14 | 10 | 7 | 3 | 4 | 1 | 1 | … | 1 | 1 | … | 2 | 3 | 4 | 4 | 3 | 1 | 2 | 1 | … | 3 | 1 | … | … | … | |
| Cannot Read | Males | 327 | 47 | 43 | 50 | 51 | 45 | 30 | 14 | 8 | 5 | 2 | … | … | … | 3 | 1 | 3 | 1 | 2 | 1 | 3 | 6 | 3 | 2 | 4 | … | 1 | … | 1 | … | … | … | … |
| Females | 295 | 63 | 37 | 43 | 37 | 36 | 26 | 26 | 3 | 5 | 1 | … | 1 | … | 1 | … | 2 | 1 | 1 | 3 | 2 | 2 | … | 1 | 1 | 1 | 1 | … | … | … | … | … | 1 | |
| Education unknown | Males | 12 | … | … | … | … | … | … | … | … | … | … | 1 | … | … | … | … | 1 | … | 1 | 1 | 1 | 1 | 2 | … | 1 | … | … | … | … | … | … | … | 3 |
| Females | 1 | … | … | … | … | … | … | … | … | … | … | … | … | … | … | … | 1 | … | … | … | … | … | … | … | … | … | … | … | … | … | … | … | … | |
| Total | Males | 1,754 | 47 | 43 | 50 | 51 | 46 | 36 | 37 | 33 | 34 | 38 | 35 | 29 | 40 | 24 | 31 | 140 | 31 | 162 | 211 | 145 | 149 | 114 | 76 | 63 | 30 | 19 | 7 | 9 | 3 | 5 | … | 16 |
| Females | 1,097 | 63 | 37 | 43 | 37 | 38 | 38 | 49 | 20 | 30 | 25 | 28 | 28 | 26 | 19 | 25 | 108 | 20 | 86 | 91 | 71 | 52 | 50 | 51 | 24 | 19 | 15 | 12 | 2 | … | 1 | … | 5 | |
| Whangarei— | ||||||||||||||||||||||||||||||||||
| Read and Write | Males | 1,092 | … | … | … | … | … | 3 | 16 | 29 | 56 | 41 | 49 | 41 | 49 | 67 | 48 | 184 | 47 | 147 | 163 | 155 | 147 | 147 | 93 | 87 | 59 | 48 | 17 | 14 | 9 | 13 | … | 4 |
| Females | 1,186 | … | … | … | … | … | 2 | 13 | 18 | 35 | 41 | 42 | 56 | 46 | 38 | 42 | 188 | 37 | 98 | 87 | 83 | 88 | 95 | 63 | 58 | 34 | 19 | 11 | 7 | 2 | 1 | … | … | |
| Read only | Males | 111 | … | … | … | … | 3 | 12 | 13 | 25 | 11 | 6 | … | … | 1 | … | 2 | 3 | 1 | 3 | 3 | 2 | 1 | 4 | 8 | 1 | 2 | 1 | … | 5 | … | 4 | … | … |
| Females | 134 | … | … | … | … | 6 | 12 | 15 | 16 | 11 | 10 | 1 | 2 | 1 | … | … | 3 | … | 1 | 1 | 1 | 7 | 7 | 7 | 7 | 5 | 1 | 5 | 1 | 2 | … | … | … | |
| Cannot Read | Males | 431 | 68 | 45 | 60 | 73 | 48 | 45 | 23 | 12 | 4 | 2 | … | … | 4 | … | … | 3 | 2 | 11 | 7 | 5 | 3 | 5 | 5 | 3 | 5 | 1 | … | … | 1 | … | … | 1 |
| Females | 384 | 73 | 36 | 64 | 52 | 50 | 42 | 25 | 7 | 6 | 1 | … | … | … | … | 1 | 1 | … | 1 | 4 | 3 | 4 | 1 | 1 | 5 | … | 1 | 1 | 1 | 1 | 2 | … | … | |
| Education unknown | Males | 11 | … | … | … | … | … | … | … | … | … | … | … | … | … | … | … | 1 | … | … | 1 | … | 2 | … | … | … | … | … | … | … | 1 | … | … | 6 |
| Females | 4 | … | … | … | … | … | … | … | … | … | … | 1 | … | … | … | … | … | … | … | … | … | … | … | … | 1 | … | 1 | … | … | … | 1 | … | 1 | |
| Total | Males | 2,245 | 68 | 45 | 60 | 73 | 51 | 59 | 52 | 66 | 51 | 49 | 50 | 41 | 54 | 67 | 50 | 191 | 50 | 155 | 174 | 142 | 153 | 156 | 106 | 91 | 66 | 50 | 10 | 17 | 11 | 17 | … | 11 |
| Females | 1,708 | 73 | 36 | 64 | 52 | 56 | 56 | 53 | 41 | 52 | 52 | 45 | 58 | 47 | 38 | 43 | 192 | 57 | 100 | 92 | 87 | 99 | 103 | 71 | 51 | 42 | 22 | 17 | 11 | 5 | 11 | … | 2 | |
| Rodney— | ||||||||||||||||||||||||||||||||||
| Read and Write | Males | 1,372 | … | … | … | … | … | 4 | 14 | 27 | 35 | 40 | 40 | 49 | 37 | 36 | 43 | 189 | 27 | 124 | 109 | 105 | 112 | 104 | 91 | 61 | 45 | 39 | 18 | 16 | 6 | 2 | … | 1 |
| Females | 1,074 | … | … | … | … | … | 5 | 12 | 41 | 31 | 45 | 48 | 45 | 43 | 42 | 41 | 137 | 24 | 19 | 93 | 78 | 60 | 114 | 57 | 37 | 30 | 24 | 13 | 9 | 1 | 5 | … | … | |
| Read only | Males | 78 | … | … | … | … | 3 | 9 | 18 | 16 | 9 | 6 | … | … | 1 | … | … | 1 | … | … | 2 | 1 | 1 | 4 | … | 1 | 4 | 1 | … | … | … | … | … | |
| Females | 98 | … | … | … | 1 | 3 | 22 | 16 | 8 | 7 | 3 | 1 | 2 | 2 | … | 1 | 1 | … | 2 | 3 | 1 | 5 | 6 | 6 | 1 | 1 | 4 | 1 | 1 | … | … | … | … | |
| Cannot Read | Males | 351 | 60 | 43 | 40 | 13 | 45 | 35 | 13 | 6 | 5 | 1 | 1 | 1 | 1 | 1 | 1 | 4 | … | 1 | 3 | 1 | 2 | 5 | 4 | 4 | 1 | 1 | … | 2 | … | … | … | 1 |
| Females | 313 | 40 | 51 | 52 | 46 | 38 | 37 | 17 | 1 | 2 | 3 | … | 1 | … | … | … | … | … | … | 4 | 2 | 2 | … | 1 | 2 | 1 | 2 | 1 | 1 | … | … | … | … | |
| Education unknown | Males | 1 | … | … | … | … | … | … | … | … | … | … | … | … | … | … | … | … | … | … | … | … | … | … | … | … | … | … | … | … | … | … | … | … |
| Females | … | … | … | … | … | … | … | … | … | … | … | … | … | … | … | … | … | … | … | … | … | … | … | … | … | … | … | … | … | … | … | … | … | |
| Total | Males | 1,802 | 60 | 43 | 46 | 63 | 48 | 48 | 45 | 49 | 49 | 47 | 41 | 50 | 39 | 37 | 44 | 194 | 27 | 126 | 114 | 105 | 118 | 109 | 96 | 70 | 47 | 40 | 19 | 18 | 6 | 2 | … | 2 |
| Females | 1,485 | 49 | 51 | 52 | 47 | 41 | 64 | 45 | 50 | 40 | 51 | 49 | 48 | 45 | 42 | 42 | 138 | 24 | 91 | 100 | 81 | 67 | 70 | 64 | 40 | 32 | 30 | 15 | 11 | 1 | 5 | … | … | |
| Waitemata— | ||||||||||||||||||||||||||||||||||
| Read and Write | Males | 1,950 | … | … | … | … | … | 4 | 14 | 27 | 39 | 39 | 45 | 60 | 48 | 51 | 38 | 216 | 28 | 168 | 215 | 166 | 196 | "3 | 133 | 114 | 39 | 36 | 26 | 20 | 17 | 6 | … | 2 |
| Females | 1,341 | … | … | … | … | … | 6 | 21 | 21 | 32 | 34 | 59 | 37 | 52 | 48 | 39 | 192 | 32 | 125 | 128 | 103 | 94 | 107 | 53 | 51 | 43 | 25 | 17 | 15 | 4 | 3 | … | … | |
| Read only | Males | 159 | … | … | … | … | 1 | 13 | 20 | 26 | 10 | 13 | 3 | 2 | 1 | … | … | 4 | 3 | 2 | 12 | 11 | 8 | 14 | 4 | 5 | 2 | 3 | 1 | 1 | … | … | … | … |
| Females | 142 | … | … | … | … | 8 | 16 | 24 | 20 | 10 | 2 | 4 | 2 | 1 | 1 | 1 | 3 | 1 | 2 | 7 | 6 | 2 | 6 | 4 | 6 | 4 | 6 | 3 | 1 | 2 | … | … | … | |
Table XIV. Table XIV. Showing the Education of Persons, Males, and Females (exclusive of Maoris and Chinese), in each County.—continued
| Countries | All Ages | Under 5. | 5 and under 10. | 10 and under 15. | 15 and under 21. | 21 and under 40. | 40 and under 60. | 60 and under 80. | 80 and upwards | Unspecified children | Unspecified adults | |||||||||||||||||||||||
|---|---|---|---|---|---|---|---|---|---|---|---|---|---|---|---|---|---|---|---|---|---|---|---|---|---|---|---|---|---|---|---|---|---|---|
| Under 1 year. | 1–2 | 2–3 | 3–4 | 4–5 | 5–6 | 6–7 | 7–8 | 8–9 | 9–10 | 10–11 | 11–12 | 12–13 | 13–14 | 14–15 | 15–20 | 20–21 | 21–25 | 25–30 | 30–35 | 35–40 | 40–45 | 45–50 | 50–55 | 55–60 | 60–65 | 65–70 | 70–75 | 75–80 | ||||||
| Cannot Read | Males | 498 | 51 | 65 | 57 | 75 | 51 | 46 | 25 | 13 | 5 | 4 | 3 | 3 | 1 | 3 | 2 | 11 | 1 | 6 | 14 | 11 | 13 | 10 | 11 | 5 | 3 | 7 | 1 | … | 1 | … | … | … |
| Females | 431 | 71 | 58 | 61 | 60 | 55 | 44 | 17 | 14 | 7 | 1 | 1 | 2 | 1 | 1 | 1 | 2 | 1 | 3 | 4 | 11 | 5 | 2 | 4 | 1 | … | 2 | … | 1 | 1 | … | … | … | |
| Education unknown | Males | 1 | … | … | … | … | … | … | … | … | … | … | … | … | … | … | … | … | … | … | … | 1 | … | … | … | … | … | … | … | … | … | … | … | … |
| Females | … | … | … | … | … | … | … | … | … | … | … | … | … | … | … | |||||||||||||||||||
| Total | Males | 2,608 | 51 | 65 | 57 | 75 | 52 | 63 | 59 | 66 | 54 | 56 | 51 | 65 | 50 | 54 | 40 | 231 | 32 | 176 | 241 | 189 | 217 | 187 | 148 | 124 | 64 | 66 | 28 | 21 | 18 | 6 | … | 2 |
| Females | 1,914 | 71 | 58 | 61 | 60 | 63 | 66 | 62 | 55 | 49 | 37 | 64 | 41 | 54 | 50 | 41 | 197 | 34 | 130 | 139 | 120 | 101 | 115 | 61 | 58 | 47 | 33 | 20 | 17 | 7 | 3 | … | … | |
| Eden— | ||||||||||||||||||||||||||||||||||
| Read and Write | Males | 6,469 | … | … | … | … | … | 19 | 63 | 111 | 192 | 207 | 235 | 248 | 248 | 228 | 209 | 821 | 128 | 457 | 557 | 511 | 528 | 540 | 351 | 294 | 176 | 159 | 91 | 49 | 23 | 16 | … | 8 |
| Females | 6,525 | … | … | … | … | … | 25 | 66 | 140 | 173 | 197 | 244 | 228 | 218 | 234 | 236 | 960 | 181 | 652 | 600 | 553 | 494 | 391 | 282 | 239 | 130 | 123 | 70 | 49 | 22 | 12 | … | 6 | |
| Read only | Males | 437 | … | … | … | 5 | 15 | 46 | 73 | 72 | 47 | 24 | 12 | 3 | 3 | 4 | 3 | 7 | 3 | 8 | 14 | 6 | 23 | 18 | 15 | 14 | 6 | 6 | 1 | 2 | 3 | 3 | … | … |
| Females | 462 | … | … | … | 3 | 22 | 52 | 75 | 74 | 34 | 20 | 11 | 7 | 5 | 5 | … | 9 | 1 | 6 | 11 | 19 | 28 | 21 | 17 | 12 | 9 | 9 | 4 | 6 | 1 | 1 | … | … | |
| Cannot Read | Males | 1,826 | 290 | 222 | 265 | 281 | 273 | 191 | 114 | 40 | 12 | 9 | 5 | 3 | 5 | … | 4 | 7 | … | 7 | 7 | 16 | 13 | 7 | 14 | 14 | 5 | 7 | 3 | 4 | 3 | 2 | … | … |
| Females | 1,815 | 299 | 237 | 283 | 277 | 259 | 182 | 96 | 28 | 19 | 6 | 4 | 2 | 2 | 1 | 1 | 10 | 1 | 8 | 7 | 15 | 13 | 14 | 13 | 11 | 4 | 11 | 4 | 2 | 1 | 2 | 1 | 10 | |
| Education unknown | Males | 26 | … | … | … | … | … | … | 1 | … | … | 1 | 1 | … | … | … | 1 | 2 | … | 1 | 1 | 2 | 5 | 4 | 1 | 1 | 1 | 1 | 2 | 1 | … | … | … | … |
| Females | 6 | … | … | … | … | … | … | … | … | 1 | … | … | … | … | … | … | 1 | … | … | … | … | 1 | 2 | … | … | … | … | … | … | 1 | … | … | … | |
| Total | Males | 8,758 | 290 | 222 | 265 | 286 | 288 | 256 | 251 | 223 | 251 | 241 | 256 | 254 | 256 | 232 | 217 | 837 | 131 | 473 | 579 | 535 | 569 | 569 | 381 | 323 | 188 | 173 | 98 | 56 | 29 | 21 | … | 8 |
| Females | 8,808 | 299 | 237 | 283 | 280 | 281 | 259 | 237 | 242 | 227 | 223 | 259 | 237 | 225 | 240 | 237 | 980 | 183 | 666 | 618 | 587 | 536 | 428 | 312 | 262 | 143 | 143 | 80 | 57 | 25 | 15 | 1 | 6 | |
| Manukau— | ||||||||||||||||||||||||||||||||||
| Read and Write | Males | 3,834 | … | … | … | … | … | 6 | 34 | 87 | 114 | 133 | 144 | 135 | 143 | 135 | 162 | 468 | 68 | 249 | 260 | 231 | 332 | 347 | 232 | 190 | 120 | 95 | 58 | 38 | 34 | 5 | … | 4 |
| Females | 3,345 | … | … | … | … | … | 11 | 37 | 91 | 143 | 147 | 191 | 144 | 148 | 137 | 138 | 418 | 71 | 230 | 240 | 229 | 239 | 222 | 151 | 116 | 75 | 81 | 46 | 21 | 11 | 7 | … | 1 | |
| Read only | Males | 349 | … | … | … | 1 | 8 | 38 | 49 | 61 | 26 | 22 | 11 | 8 | 9 | 6 | … | 6 | 2 | 11 | 9 | 7 | 12 | 20 | 9 | 9 | 5 | 6 | 4 | 1 | 5 | 2 | … | … |
| Females | 375 | … | … | … | 1 | 2 | 22 | 62 | 47 | 30 | 13 | 3 | 6 | 3 | 7 | 2 | 5 | 1 | 3 | 8 | 17 | 27 | 33 | 18 | 19 | 10 | 15 | 4 | 9 | 5 | 3 | … | … | |
| Cannot Read | Males | 1,229 | 167 | 145 | 173 | 189 | 160 | 150 | 62 | 34 | 8 | 3 | 4 | 3 | 3 | 2 | 1 | 5 | 3 | 1 | 5 | 14 | 19 | 22 | 11 | 9 | 9 | 11 | 7 | 4 | 4 | 1 | … | … |
| Females | 1,137 | 165 | 144 | 166 | 164 | 166 | 121 | 62 | 25 | 18 | 2 | 2 | … | … | 1 | … | 5 | 2 | 4 | 4 | 4 | 16 | 18 | 6 | 13 | 3 | 11 | 4 | 8 | 1 | 1 | … | 1 | |
| Education unknown | Males | 4 | … | … | … | … | … | … | … | … | … | … | … | … | … | … | … | … | … | … | … | 1 | … | … | 1 | … | 1 | … | 1 | … | … | … | … | … |
| Females | 1 | … | … | … | … | … | … | … | … | … | … | … | … | … | … | … | … | … | … | … | 1 | … | … | … | … | … | … | … | … | … | … | … | … | |
| Total | Males | 5,416 | 167 | 145 | 173 | 190 | 168 | 194 | 145 | 182 | 148 | 158 | 159 | 146 | 165 | 143 | 163 | 479 | 73 | 261 | 274 | 253 | 363 | 389 | 253 | 208 | 135 | 112 | 70 | 45 | 43 | 8 | … | 4 |
| Females | 4,858 | 165 | 144 | 166 | 165 | 168 | 154 | 161 | 163 | 191 | 162 | 196 | 150 | 151 | 145 | 140 | 428 | 74 | 237 | 252 | 251 | 282 | 273 | 175 | 148 | 88 | 107 | 54 | 38 | 11 | 11 | … | 2 | |
| Coromandel— | ||||||||||||||||||||||||||||||||||
| Read and Write | Males | 1,007 | … | … | … | … | … | 3 | 5 | 15 | 19 | 19 | 21 | 23 | 22 | 10 | 19 | 60 | 12 | 77 | 125 | 134 | 131 | 117 | 83 | 57 | 26 | 14 | 5 | 6 | 2 | 1 | … | 1 |
| Females | 536 | … | … | … | … | … | 2 | 7 | 12 | 16 | 16 | 20 | 13 | 19 | 20 | 16 | 68 | 18 | 49 | 61 | 54 | 51 | 40 | 21 | 10 | 9 | 8 | 3 | 1 | … | … | … | … | |
| Read only | Males | 71 | … | … | … | … | 2 | 9 | 15 | 6 | 6 | 2 | 3 | 1 | 1 | … | 3 | … | 1 | … | 1 | 5 | 5 | 4 | 2 | 1 | 2 | 1 | 1 | … | … | … | … | … |
| Females | 49 | … | … | … | … | … | 3 | 14 | 7 | 6 | 3 | … | 2 | … | 2 | 1 | 1 | … | 1 | 3 | 1 | 1 | 2 | 2 | … | … | … | … | … | … | … | … | … | |
| Cannot Read | Males | 274 | 45 | 33 | 43 | 26 | 32 | 30 | 10 | 7 | 3 | 1 | 1 | 1 | … | … | … | … | 1 | 1 | 5 | 3 | 5 | 6 | 9 | 4 | 2 | 3 | 1 | 1 | … | … | … | … |
| Females | 213 | 39 | 27 | 31 | 43 | 22 | 21 | 8 | 7 | 3 | 2 | 1 | … | … | … | … | … | … | 2 | 3 | 1 | … | 2 | … | 1 | … | … | … | … | … | … | … | … | |
| Education unknown | Males | 2 | … | … | … | … | … | … | … | … | … | … | … | … | … | … | … | … | … | 1 | 1 | … | … | … | … | … | … | … | … | … | … | … | … | … |
| Females | … | … | … | … | … | … | … | … | … | … | … | … | … | … | … | … | … | … | … | … | … | … | … | … | … | … | … | … | … | … | … | … | … | |
| Total | Males | 1,554 | 45 | 33 | 43 | 26 | 34 | 42 | 30 | 28 | 28 | 23 | 25 | 25 | 23 | 10 | 22 | 60 | 14 | 79 | 132 | 142 | 171 | 127 | 94 | 62 | 30 | 18 | 7 | 7 | 2 | 1 | … | 1 |
| Females | 798 | 39 | 27 | 31 | 43 | 22 | 26 | 29 | 26 | 25 | 21 | 21 | 15 | 19 | 22 | 17 | 691 | 18 | 52 | 67 | 56 | 52 | 44 | 23 | 11 | 9 | 8 | 3 | 1 | — | 2 | … | … | |
| Thames— | ||||||||||||||||||||||||||||||||||
| Read and Write | Males | 2,124 | … | … | … | … | … | 6 | 26 | 40 | 58 | 60 | 71 | 48 | 52 | 57 | 57 | 206 | 39 | 198 | 209 | 168 | 237 | 232 | 136 | 102 | 42 | 38 | 25 | 6 | 2 | … | 1 | 8 |
| Females | 1,450 | … | … | … | … | … | 6 | 17 | 53 | 41 | 72 | 61 | 64 | 59 | 51 | 49 | 201 | 20 | 117 | 153 | 115 | 120 | 92 | 54 | 43 | 23 | 21 | 8 | 5 | 3 | … | … | 2 | |
| Read only | Males | 173 | … | … | … | 1 | 4 | 25 | 27 | 16 | 16 | 6 | 5 | 1 | 2 | 3 | … | 2 | 1 | 4 | 3 | 8 | 9 | 16 | 12 | 4 | 4 | 1 | 2 | … | … | … | … | 1 |
| Females | 179 | … | … | … | … | 7 | 9 | 25 | 17 | 17 | 8 | 4 | 2 | 1 | 1 | … | 7 | 2 | 4 | 8 | 7 | 16 | 12 | 8 | 9 | 5 | 6 | 4 | … | … | … | … | … | |
Table XIV. Table XIV. Showing the Education of Persons, Males, and Females (exclusive of Maoris and Chinese), in each County.—continued
| Countries | All Ages | Under 5. | 5 and under 10. | 10 and under 15. | 15 and under 21. | 21 and under 40. | 40 and under 60. | 60 and under 80. | 80 and upwards | Unspecified children | Unspecified adults | |||||||||||||||||||||||
|---|---|---|---|---|---|---|---|---|---|---|---|---|---|---|---|---|---|---|---|---|---|---|---|---|---|---|---|---|---|---|---|---|---|---|
| Under 1 year. | 1–2 | 2–3 | 3–4 | 4–5 | 5–6 | 6–7 | 7–8 | 8–9 | 9–10 | 10–11 | 11–12 | 12–13 | 13–14 | 14–15 | 15–20 | 20–21 | 21–25 | 25–30 | 30–35 | 35–40 | 40–45 | 45–50 | 50–55 | 55–60 | 60–65 | 65–70 | 70–75 | 75–80 | ||||||
| Thames:—continued | ||||||||||||||||||||||||||||||||||
| Cannot Read | Males | 620 | 84 | 82 | 98 | 86 | 74 | 70 | 37 | 20 | 6 | 5 | … | 1 | … | … | 1 | 3 | … | 3 | 5 | 4 | 12 | 11 | 6 | 6 | 1 | 3 | … | 2 | … | … | … | … |
| Females | 610 | g0 | 98 | 93 | 94 | 87 | 61 | 34 | 14 | 3 | 1 | £ | … | … | … | … | … | … | 3 | 1 | 2 | 10 | 4 | 6 | 3 | 2 | 1 | … | … | … | … | … | 1 | |
| Education unknown | Males | 11 | … | … | … | … | … | 1 | … | … | … | … | … | 1 | … | … | … | 1 | 1 | … | 1 | 1 | … | 2 | … | 1 | … | 1 | 1 | … | … | … | … | … |
| Females | 5 | … | … | … | … | … | … | … | … | … | … | … | … | … | … | 1 | 2 | … | … | … | … | … | … | 1 | 1 | … | … | … | … | … | … | … | … | |
| Total | Males | 2,928 | 84 | 82 | 98 | 87 | 78 | 102 | 90 | 76 | 80 | 71 | 76 | 51 | 54 | 60 | 58 | 212 | 41 | 205 | 218 | 181 | 258 | 261 | 154 | 113 | 47 | 43 | 28 | 8 | 2 | … | 1 | 9 |
| Females | 3,244 | 90 | 98 | 93 | 94 | 94 | 76 | 76 | 84 | 61 | 82 | 66 | 66 | 60 | 52 | 50 | 210 | 22 | 124 | 162 | 124 | 146 | 108 | 69 | 56 | 30 | 28 | 12 | 5 | 3 | … | … | 3 | |
| Piako— | ||||||||||||||||||||||||||||||||||
| Read and Write | Males | 592 | … | … | … | … | … | … | 2 | 3 | 5 | 8 | 3 | 8 | 6 | 6 | 13 | 50 | 29 | 103 | 109 | 69 | 67 | 37 | 311 | 23 | 10 | 6 | 2 | … | … | … | … | … |
| Females | 181 | … | … | … | … | … | 2 | 1 | 1 | 3 | 5 | 7 | 9 | 6 | 4 | 8 | 22 | 5 | 22 | 26 | 18 | 10 | 17 | 6 | 3 | 2 | … | 1 | … | … | … | … | 3 | |
| Read only | Males | 30 | … | … | … | … | 1 | 2 | 7 | 7 | 2 | 3 | 1 | … | … | … | … | 1 | 1 | 2 | … | … | 1 | … | … | 1 | … | 1 | … | … | … | … | … | … |
| Females | 14 | … | … | … | 1 | 1 | 1 | 3 | 1 | … | … | 1 | … | … | … | … | 1 | … | … | … | 1 | 1 | 2 | … | 1 | … | … | … | … | … | … | … | … | |
| Cannot Read | Males | 88 | 15 | 12 | 11 | 10 | 12 | 8 | 5 | 2 | 2 | … | … | … | … | … | 1 | 1 | … | 1 | 1 | 1 | … | 1 | 3 | … | 1 | … | … | … | … | … | … | 1 |
| Females | 73 | 7 | 17 | 10 | 9 | 14 | 6 | 5 | 1 | … | 1 | … | 1 | … | … | 1 | … | 1 | … | … | … | … | … | … | … | … | … | … | … | … | … | … | … | |
| Education unknown | Males | … | … | … | … | … | … | … | … | … | … | … | … | … | … | … | … | … | … | 1 | … | 1 | 1 | … | … | … | … | … | … | … | … | … | … | … |
| Females | … | … | … | … | … | … | … | … | … | … | … | … | … | … | … | |||||||||||||||||||
| Total | Males | 713 | 15 | 12 | 11 | 10 | 13 | 10 | 14 | 12 | 9 | 11 | 4 | 8 | 6 | 6 | 14 | 52 | 30 | 107 | 110 | 71 | 69 | 38 | 34 | 24 | 11 | 7 | 2 | … | … | … | … | 3 |
| Females | 268 | 7 | 17 | 10 | 10 | 15 | 9 | 9 | 3 | 3 | 6 | 8 | 10 | 6 | 4 | 9 | 23 | 6 | 22 | 26 | 19 | 11 | 19 | 6 | 4 | 2 | … | 1 | … | … | … | … | 3 | |
| Tauranga— | ||||||||||||||||||||||||||||||||||
| Read and Write | Males | 1,124 | … | … | … | … | … | 1 | 9 | 17 | 22 | 34 | 20 | 17 | 31 | 21 | 22 | 122 | 39 | 128 | 147 | 101 | 106 | 79 | 78 | 53 | 33 | 24 | 9 | 5 | 1 | 2 | … | 3 |
| Females | 836 | … | … | … | … | … | 5 | 10 | 20 | 53 | 29 | 31 | 20 | 24 | 32 | 26 | 113 | 17 | 97 | 95 | 69 | 52 | 55 | 40 | 25 | 17 | 11 | 5 | 6 | 1 | 1 | … | 2 | |
| Read only | Males | 46 | … | … | … | 1 | 4 | 7 | 7 | 7 | 5 | 2 | 1 | … | … | … | … | 4 | … | … | 1 | 2 | 2 | … | 2 | … | … | … | … | … | … | … | … | 1 |
| Females | 56 | … | … | … | … | 3 | 7 | 15 | 6 | 5 | 3 | 2 | 2 | … | … | 1 | 2 | … | 2 | 1 | … | 2 | 4 | 1 | … | … | … | … | … | … | … | … | … | |
| Cannot Read | Males | 267 | 52 | 43 | 22 | 44 | 23 | 37 | 16 | 7 | 4 | … | … | … | 1 | … | 2 | 1 | 1 | … | 2 | … | 2 | 1 | … | 6 | … | … | 1 | … | … | … | … | 2 |
| Females | 255 | 36 | 42 | 43 | 36 | 29 | 22 | 13 | 6 | 3 | 1 | 1 | … | 2 | … | 2 | 2 | 1 | 4 | 2 | 1 | … | 3 | … | 1 | 1 | … | … | … | … | … | … | … | |
| Education unknown | Males | 8 | … | … | … | … | … | … | … | … | … | … | … | 1 | … | … | … | … | … | … | … | … | 1 | 1 | 1 | … | … | … | 1 | … | … | … | 2 | 1 |
| Females | 5 | … | … | … | … | … | … | … | … | … | … | … | … | … | … | … | … | … | … | … | … | … | 1 | 1 | … | … | … | … | … | … | … | 2 | 1 | |
| Total | Males | 1,445 | 52 | 43 | 22 | 45 | 27 | 45 | 32 | 31 | 31 | 36 | 21 | 18 | 32 | 21 | 24 | 127 | 40 | 128 | 150 | 103 | 111 | 81 | 81 | 59 | 33 | 24 | 11 | 5 | 1 | 2 | 2 | 7 |
| Females | 1,152 | 36 | 42 | 43 | 30 | 32 | 34 | 38 | 32 | 41 | 33 | 34 | 22 | 26 | 32 | 29 | 117 | 18 | 103 | 98 | 71 | 54 | 63 | 45 | 26 | 18 | 11 | 5 | 6 | 1 | 1 | 2 | 3 | |
| Whakatane— | ||||||||||||||||||||||||||||||||||
| Read and Write | Mates | 366 | … | … | … | … | … | 2 | 8 | 7 | 7 | 10 | 10 | 9 | 13 | 7 | 35 | 8 | 28 | 29 | 46 | 38 | 32 | 21 | 18 | 8 | 16 | 5 | 3 | 2 | … | … | 2 | |
| Females | 248 | … | … | … | … | … | … | 4 | 7 | 7 | 15 | 7 | 9 | 10 | 4 | 12 | 27 | 9 | 20 | 29 | 32 | 16 | 12 | 9 | 8 | 6 | 4 | 1 | … | … | … | … | … | |
| Read only | Males | 33 | … | … | … | … | 1 | 1 | 8 | 8 | 1 | 2 | … | 1 | … | … | 1 | 2 | … | … | … | 1 | 3 | 2 | 1 | … | 1 | … | … | … | … | … | … | … |
| Females | 24 | … | … | … | … | … | 4 | 2 | 2 | 3 | 1 | 1 | … | 2 | … | … | … | … | 1 | 1 | 2 | 1 | 1 | 2 | … | … | … | … | 1 | … | … | … | … | |
| Cannot Read | Males | 124 | 25 | 15 | 20 | 16 | 15 | 10 | 6 | 4 | 1 | … | 2 | 2 | … | … | … | … | … | … | … | 1 | … | 5 | … | 2 | … | … | … | … | … | … | … | … |
| Females | 114 | 18 | 17 | 16 | 14 | 15 | 16 | 6 | 2 | 5 | 1 | 2 | … | … | … | 1 | … | … | … | 1 | … | … | … | … | … | … | … | … | … | … | … | … | … | |
Table XIV. Table XIV. Showing the Education of Persons, Males, and Females (exclusive of Maoris and Chinese), in each County.—continued
| Countries | All Ages | Under 5. | 5 and under 10. | 10 and under 15. | 15 and under 21. | 21 and under 40. | 40 and under 60. | 60 and under 80. | 80 and upwards | Unspecified children | Unspecified adults | |||||||||||||||||||||||
|---|---|---|---|---|---|---|---|---|---|---|---|---|---|---|---|---|---|---|---|---|---|---|---|---|---|---|---|---|---|---|---|---|---|---|
| Under 1 year. | 1–2 | 2–3 | 3–4 | 4–5 | 5–6 | 6–7 | 7–8 | 8–9 | 9–10 | 10–11 | 11–12 | 12–13 | 13–14 | 14–15 | 15–20 | 20–21 | 21–25 | 25–30 | 30–35 | 35–40 | 40–45 | 45–50 | 50–55 | 55–60 | 60–65 | 65–70 | 70–75 | 75–80 | ||||||
| Education unknown | Males | 4 | … | … | … | … | … | … | … | … | … | 1 | … | 1 | … | … | … | … | … | … | … | … | … | 1 | … | … | … | … | … | … | … | … | … | 1 |
| Females | … | … | … | … | … | … | … | … | … | … | … | … | … | … | … | … | … | … | … | … | … | … | … | … | … | … | … | … | … | … | … | … | … | |
| Total | Males | 527 | 25 | 15 | 20 | 16 | 16 | 13 | 16 | 20 | 9 | 10 | 12 | 14 | 9 | 13 | 8 | 37 | 8 | 28 | 29 | 48 | 41 | 40 | 22 | 20 | 9 | 16 | 5 | 3 | 2 | … | … | 3 |
| Females | 386 | 18 | 17 | 16 | 14 | 15 | 20 | 12 | 11 | 15 | 17 | 10 | 9 | 12 | 4 | 13 | 27 | 9 | 21 | 31 | 34 | 17 | 13 | 11 | 8 | 6 | 4 | 1 | 1 | … | … | … | … | |
| Cook— | ||||||||||||||||||||||||||||||||||
| Read and Write | Males | 749 | … | … | … | … | … | … | 2 | 8 | 5 | 14 | 9 | 11 | 14 | 12 | 16 | 51 | 12 | 87 | 119 | 104 | 101 | 86 | 36 | 27 | 13 | 9 | 7 | 1 | 3 | 2 | … | … |
| Females | 418 | … | … | … | … | … | 3 | 6 | 9 | 12 | 11 | 20 | 10 | 18 | 14 | 7 | 38 | 15 | 47 | 73 | 53 | 26 | 25 | 11 | 7 | 5 | 2 | 1 | 2 | 1 | 1 | … | 1 | |
| Read only | Males | 52 | … | … | … | … | 2 | 5 | 3 | 11 | 3 | … | … | 1 | … | 1 | … | 2 | … | 3 | 5 | 3 | 4 | 2 | 2 | 1 | 2 | 2 | … | … | … | … | … | … |
| Females | 40 | … | … | … | … | 2 | 4 | 7 | 3 | … | 4 | 1 | 1 | 2 | … | … | 1 | … | 2 | 3 | 1 | 5 | 2 | 1 | … | … | 1 | … | … | … | … | … | … | |
| Cannot Read | Males | 230 | 37 | 24 | 28 | 16 | 26 | 33 | 13 | 5 | 4 | 1 | 2 | 2 | 1 | 2 | 1 | 3 | 1 | 2 | 4 | 7 | 4 | 4 | 2 | 3 | 2 | 1 | … | … | 1 | … | … | 1 |
| Females | 247 | 50 | 31 | 38 | 45 | 29 | 13 | 8 | 9 | 6 | 5 | 4 | … | … | … | 1 | 2 | … | … | 1 | 2 | 1 | … | … | 1 | 1 | … | … | … | … | … | … | … | |
| Education unknown | Males | 3 | … | … | … | … | … | … | … | … | … | … | … | … | … | … | … | … | … | … | … | … | … | … | 1 | 1 | … | … | … | … | … | … | … | 1 |
| Females | … | … | … | … | … | … | … | … | … | … | … | … | … | … | … | … | … | … | … | … | … | … | … | … | … | … | … | … | … | … | … | … | … | |
| Total | Males | 1,034 | 37 | 24 | 28 | 16 | 28 | 38 | 18 | 24 | 12 | 15 | 11 | 14 | 15 | 15 | 17 | 56 | 13 | 92 | 128 | 114 | 109 | 92 | 41 | 32 | 17 | 12 | 7 | 1 | 4 | 2 | … | 2 |
| Females | 705 | 80 | 31 | 38 | 45 | 31 | 20 | 21 | 21 | 18 | 20 | 25 | 11 | 20 | 14 | 8 | 41 | 15 | 49 | 77 | 56 | 32 | 27 | 12 | 8 | 6 | 3 | 1 | 2 | 1 | 1 | … | 1 | |
| Wairoa— | ||||||||||||||||||||||||||||||||||
| Read and Write | Males | 447 | … | … | … | … | … | 1 | 7 | 3 | 11 | 13 | 10 | 7 | 12 | 11 | 13 | 43 | 11 | 41 | 52 | 43 | 50 | 49 | 27 | 16 | 9 | 7 | 7 | … | 2 | … | … | 2 |
| Females | 254 | … | … | … | … | … | 1 | … | 13 | 9 | 5 | 12 | 12 | 9 | 8 | 15 | 41 | 4 | 23 | 23 | 23 | 18 | 18 | 12 | 4 | 3 | … | 1 | … | … | … | … | … | |
| Read only | Males | 27 | … | … | … | 1 | 2 | 2 | 3 | 3 | 2 | 2 | 2 | … | 1 | … | 1 | … | 1 | … | 1 | 1 | 1 | 3 | … | 1 | … | … | … | … | … | … | … | … |
| Females | 36 | … | … | … | … | … | 4 | 9 | 5 | 2 | 1 | 1 | 1 | … | 2 | … | … | … | 1 | 1 | 5 | … | 2 | … | 2 | … | … | … | … | … | … | … | … | |
| Cannot Read | Males | 122 | 16 | 11 | 22 | 14 | 15 | 7 | 7 | 6 | 4 | 1 | 2 | 1 | … | … | … | … | … | … | 1 | 2 | 2 | 3 | 3 | 1 | 1 | 1 | … | 1 | … | … | 1 | … |
| Females | 121 | 15 | 20 | 23 | 18 | 12 | 6 | 5 | 3 | 1 | 3 | 1 | … | 1 | 1 | … | … | … | 2 | 4 | 4 | … | 1 | … | … | 1 | … | … | … | … | … | … | … | |
| Education unknown | Males | 1 | … | … | … | … | … | … | … | … | … | … | … | … | … | … | … | … | … | … | … | 1 | … | … | … | … | … | … | … | … | … | … | … | … |
| Females | 1 | … | … | … | … | … | … | … | … | … | … | … | … | … | … | … | … | … | … | 1 | … | … | … | … | … | … | … | … | … | … | … | … | … | |
| Total | Males | 597 | 16 | 11 | 22 | 15 | 17 | 10 | 17 | 12 | 17 | 16 | 14 | 8 | 13 | 11 | 14 | 43 | 12 | 41 | 54 | 47 | 53 | 55 | 30 | 18 | 10 | 8 | 7 | 1 | 2 | … | 1 | 2 |
| Females | 412 | 15 | 20 | 23 | 18 | 12 | 11 | 14 | 21 | 12 | 9 | 14 | 13 | 10 | 11 | 15 | 41 | 4 | 26 | 29 | 32 | 18 | 21 | 12 | 6 | 4 | … | 1 | … | … | … | … | … | |
| East Taupo — | ||||||||||||||||||||||||||||||||||
| Read and Write | Males | 82 | … | … | … | … | … | … | … | … | … | … | … | … | … | … | 1 | 3 | 2 | 6 | 15 | 16 | 10 | 12 | 6 | 4 | 3 | 2 | 2 | … | … | … | … | … |
| Females | 22 | … | … | … | … | … | … | … | … | 1 | … | … | … | … | 1 | … | 4 | 1 | 7 | 3 | 1 | 4 | … | … | … | … | … | … | … | … | … | … | … | |
| Read only | Males | … | … | … | … | … | … | … | … | … | … | … | … | … | … | … | … | … | … | … | … | … | … | … | … | … | … | … | … | … | … | … | … | … |
| Females | 2 | … | … | … | … | … | … | … | 2 | … | … | … | … | … | … | … | … | … | … | … | … | … | … | … | … | … | … | … | … | … | … | … | … | |
| Cannot Read | Males | 11 | 2 | 1 | 1 | 1 | 1 | 1 | 1 | … | … | … | … | … | … | … | … | … | … | … | … | … | 1 | … | … | … | … | … | … | … | … | … | … | 2 |
| Females | 8 | 2 | … | 3 | 2 | … | 1 | … | … | … | … | … | … | … | … | … | … | … | … | … | … | … | … | … | … | … | … | … | … | … | … | … | … | |
| Education unknown | Males | … | … | … | … | … | … | … | … | … | … | … | … | … | … | … | … | … | … | … | … | … | … | … | … | … | … | … | … | … | … | … | … | … |
| Females | 1 | … | … | … | … | … | … | … | … | … | … | … | … | … | … | … | … | … | … | … | … | … | … | 1 | … | … | … | … | … | … | … | … | … | |
| Total | Males | 93 | 2 | 1 | 1 | 1 | 1 | 1 | 1 | … | … | … | … | … | … | … | 1 | 3 | 2 | 6 | 15 | 16 | 11 | 12 | 6 | 4 | 3 | 2 | 2 | … | … | … | … | 2 |
| Females | 33 | 2 | … | 3 | 2 | … | 1 | … | 2 | 1 | … | … | … | … | 1 | … | 4 | 1 | 7 | 3 | 1 | 4 | … | 1 | … | … | … | … | … | … | … | … | … | |
| West Taupo— | ||||||||||||||||||||||||||||||||||
| Read and Write | Males | 7 | … | … | … | … | … | … | … | … | … | … | … | … | … | 1 | … | … | … | 1 | … | 1 | … | 1 | … | 3 | … | … | … | … | … | … | … | … |
| Females | … | … | … | … | … | … | … | … | … | … | … | … | … | … | … | … | … | … | … | … | … | … | … | … | … | … | … | … | … | … | … | … | … | |
| Read only | Males | … | … | … | … | … | … | … | … | … | … | … | … | … | … | … | … | … | … | … | … | … | … | … | … | … | … | … | … | … | … | … | … | … |
| Females | 3 | … | … | … | … | … | … | 1 | … | … | 1 | … | 1 | … | … | … | … | … | … | … | … | … | … | … | … | … | … | … | … | … | … | … | … | |
Table XIV. Table XIV. Showing the Education of Persons, Males, and Females (exclusive of Maoris and Chinese), in each County.—continued
| Countries | All Ages | Under 5. | 5 and under 10. | 10 and under 15. | 15 and under 21. | 21 and under 40. | 40 and under 60. | 60 and under 80. | 80 and upwards | Unspecified children | Unspecified adults | |||||||||||||||||||||||
|---|---|---|---|---|---|---|---|---|---|---|---|---|---|---|---|---|---|---|---|---|---|---|---|---|---|---|---|---|---|---|---|---|---|---|
| Under 1 year. | 1–2 | 2–3 | 3–4 | 4–5 | 5–6 | 6–7 | 7–8 | 8–9 | 9–10 | 10–11 | 11–12 | 12–13 | 13–14 | 14–15 | 15–20 | 20–21 | 21–25 | 25–30 | 30–35 | 35–40 | 40–45 | 45–50 | 50–55 | 55–60 | 60–65 | 65–70 | 70–75 | 75–80 | ||||||
| West Taupo—continued. | ||||||||||||||||||||||||||||||||||
| Cannot Read | Males | 1 | … | … | … | … | … | … | … | … | … | … | … | … | … | … | … | … | … | … | … | … | … | … | … | 1 | … | … | … | … | … | … | … | … |
| Females | … | … | … | … | … | … | … | … | … | … | … | … | … | … | … | … | … | … | … | … | … | … | … | … | … | … | … | … | … | … | … | … | … | |
| Education unknown | Males | … | … | … | … | … | … | … | … | … | … | … | … | … | … | … | … | … | … | … | … | … | … | … | … | … | … | … | … | … | … | … | … | … |
| Females | … | … | … | … | … | … | … | … | … | … | … | … | … | … | … | … | … | … | … | … | … | … | … | … | … | … | … | … | … | … | … | … | … | |
| Total | Males | 8 | … | … | … | … | … | … | … | … | … | … | … | … | … | 1 | … | … | … | 1 | … | 1 | … | 1 | … | 4 | … | … | … | … | … | … | … | … |
| Females | 3 | … | … | … | … | … | … | 1 | … | … | 1 | … | 1 | … | … | … | … | … | … | … | … | … | … | … | … | … | … | … | … | … | … | … | … | |
| Waipa— | ||||||||||||||||||||||||||||||||||
| Read and Write | Males | 1,224 | … | … | … | … | … | 5 | 7 | 22 | 26 | 37 | 45 | 37 | 38 | 27 | 42 | 123 | 25 | 108 | 130 | 110 | 108 | 120 | 65 | 55 | 42 | 20 | 9 | 14 | 4 | … | 3 | 2 |
| Females | 971 | … | … | … | … | … | 4 | 21 | 32 | 37 | 41 | 36 | 35 | 28 | 37 | 36 | 126 | 15 | 86 | 97 | 93 | 81 | 113 | 34 | 20 | 14 | 17 | 7 | 7 | 1 | 1 | 1 | 1 | |
| Read only | Males | 73 | … | … | … | … | 4 | 13 | 7 | 11 | 4 | 5 | 2 | 1 | 1 | … | 1 | 5 | … | 2 | 1 | 3 | 4 | 2 | 1 | 2 | 3 | … | 1 | … | … | … | … | … |
| Females | 76 | … | … | … | … | 5 | 10 | 15 | 11 | 9 | 4 | 3 | 1 | 2 | 1 | … | 2 | … | … | … | 5 | 1 | 2 | 2 | 2 | … | … | … | … | 1 | … | … | … | |
| Cannot Read | Males | 388 | 64 | 59 | 51 | 49 | 53 | 42 | 19 | 9 | 8 | 1 | … | 1 | 1 | … | … | 4 | … | 2 | 1 | 4 | 2 | 5 | 4 | 4 | 3 | … | … | 2 | … | … | … | … |
| Females | 365 | 57 | 47 | 60 | 67 | 47 | 34 | 17 | 7 | 3 | 4 | … | … | … | … | … | 1 | 1 | 4 | 3 | 2 | 6 | 3 | … | … | … | … | … | … | … | … | … | … | |
| Education unknown | Males | … | … | … | … | … | … | … | … | … | … | … | … | … | … | … | … | … | … | … | … | … | … | … | … | … | … | … | … | … | … | … | … | … |
| Females | … | … | … | … | … | … | … | … | … | … | … | … | … | … | … | … | … | … | … | … | … | … | … | … | … | … | … | … | … | … | … | … | … | |
| Total | Males | 1,685 | 64 | 59 | 51 | 49 | 57 | 60 | 33 | 42 | 38 | 43 | 47 | 39 | 40 | 27 | 43 | 132 | 25 | 112 | 132 | 117 | 114 | 127 | 71 | 61 | 48 | 20 | 10 | 16 | 4 | … | 3 | 2 |
| Females | 1,412 | 57 | 47 | 60 | 67 | 52 | 48 | 53 | 50 | 49 | 49 | 39 | 36 | 30 | 38 | 36 | 129 | 16 | 90 | 100 | 100 | 88 | 68 | 38 | 22 | 14 | 17 | 7 | 7 | 2 | 1 | 1 | 1 | |
| Waikato— | ||||||||||||||||||||||||||||||||||
| Read and Write | Males | 1,163 | … | … | … | … | … | 4 | 7 | 20 | 25 | 31 | 17 | 28 | 31 | 23 | 22 | 108 | 27 | 143 | 162 | 132 | 111 | 92 | 64 | 53 | 23 | 16 | 16 | 5 | 2 | … | … | 1 |
| Females | 812 | … | … | … | … | … | 1 | 12 | 16 | 10 | 25 | 32 | 26 | 28 | 26 | 25 | 100 | 27 | 104 | 116 | 69 | 55 | 42 | 35 | 20 | 13 | 8 | 1 | 2 | … | … | … | 1 | |
| Read only | Males | 68 | … | … | … | 2 | 2 | 5 | 9 | 8 | 6 | 6 | 5 | 2 | 2 | 2 | 1 | … | … | 1 | 3 | 3 | 1 | 3 | 2 | 5 | … | … | … | … | … | … | … | … |
| Females | 77 | … | … | … | … | 7 | 5 | 12 | 8 | 6 | 6 | 7 | … | … | 1 | … | … | … | … | 6 | 3 | 4 | 4 | 31 | 1 | … | … | … | … | … | … | … | 1 | |
| Cannot Read | Males | 363 | 57 | 47 | 14 | 50 | 52 | 37 | 19 | 6 | 3 | 2 | 3 | … | 1 | … | … | 2 | 1 | 3 | 5 | 4 | 1 | 1 | 1 | 3 | … | … | … | … | … | … | … | 1 |
| Females | 358 | 56 | 44 | 51 | 54 | 50 | 31 | 19 | 12 | 8 | 6 | 2 | 2 | … | 1 | … | 1 | … | 4 | 3 | 5 | 1 | 4 | 1 | … | 1 | 1 | … | … | … | … | … | 1 | |
| Education unknown | Males | 13 | … | … | … | … | … | … | … | … | … | … | … | … | 1 | … | … | 2 | 2 | 3 | 2 | 2 | … | … | … | 1 | … | … | … | … | … | … | … | … |
| Females | 3 | … | … | … | … | … | … | … | … | … | … | … | … | … | … | … | … | … | … | 1 | … | 2 | … | … | … | … | … | … | … | … | … | … | … | |
| Total | Males | 1,607 | 57 | 47 | 64 | 52 | 54 | 46 | 30 | 34 | 34 | 39 | 25 | 30 | 35 | 25 | 23 | 112 | 30 | 150 | 172 | 141 | 113 | 96 | 67 | 62 | 23 | 16 | 16 | 5 | 2 | … | … | 2 |
| Females | 1,250 | 56 | 44 | 51 | 54 | 57 | 37 | 43 | 36 | 33 | 37 | 41 | 28 | 28 | 28 | 25 | 110 | 27 | 108 | 12c | 77 | 62 | 50 | 39 | 22 | 14 | 12 | 1 | 2 | … | … | … | 2 | |
| Raglan— | ||||||||||||||||||||||||||||||||||
| Read and Write | Males | 320 | … | … | … | … | … | 2 | 1 | 6 | 10 | 7 | 8 | 13 | 7 | 8 | 10 | 34 | 11 | 32 | 21 | 27 | 22 | 34 | 23 | 21 | 5 | 8 | 5 | 2 | 2 | … | … | 1 |
| Females | 220 | … | … | … | … | … | 2 | 3 | 6 | 5 | 13 | 8 | 6 | 9 | 9 | 9 | 34 | 4 | 15 | 22 | 20 | 17 | 20 | 6 | 5 | 1 | 2 | 1 | 3 | … | … | … | … | |
| Read only | Males | 31 | … | … | … | … | 2 | … | 5 | 7 | 3 | 3 | 2 | 1 | 2 | … | 1 | … | … | … | … | … | … | 2 | … | … | 2 | … | … | … | … | 1 | … | … |
| Females | 15 | … | … | … | … | … | 5 | … | 4 | … | 1 | … | … | … | … | … | … | … | … | … | 2 | 1 | … | 1 | … | … | … | 1 | … | … | … | … | … | |
| Cannot Read | Males | 108 | 9 | 9 | 15 | 18 | 12 | 12 | 12 | 2 | 1 | … | 1 | 1 | … | … | … | 1 | … | … | 5 | 2 | … | 1 | 1 | 2 | 1 | 1 | … | 1 | 1 | … | … | … |
| Females | 80 | 16 | 10 | 13 | 12 | 12 | 5 | 3 | 3 | 1 | 1 | … | … | … | 1 | … | 1 | … | … | 1 | … | … | 1 | … | … | … | … | … | … | … | … | … | … | |
Table XIV. Table XIV. Showing the Education of Persons, Males, and Females (exclusive of Maoris and Chinese), in each County.—continued
| Countries | All Ages | Under 5. | 5 and under 10. | 10 and under 15. | 15 and under 21. | 21 and under 40. | 40 and under 60. | 60 and under 80. | 80 and upwards | Unspecified children | Unspecified adults | |||||||||||||||||||||||
|---|---|---|---|---|---|---|---|---|---|---|---|---|---|---|---|---|---|---|---|---|---|---|---|---|---|---|---|---|---|---|---|---|---|---|
| Under 1 year. | 1–2 | 2–3 | 3–4 | 4–5 | 5–6 | 6–7 | 7–8 | 8–9 | 9–10 | 10–11 | 11–12 | 12–13 | 13–14 | 14–15 | 15–20 | 20–21 | 21–25 | 25–30 | 30–35 | 35–40 | 40–45 | 45–50 | 50–55 | 55–60 | 60–65 | 65–70 | 70–75 | 75–80 | ||||||
| Education unknown | Males | 1 | … | … | … | … | … | … | … | … | … | … | … | … | … | … | … | … | … | 1 | … | … | … | … | … | … | … | … | … | … | … | … | … | … |
| Females | 1 | … | … | … | … | … | … | … | … | … | … | … | 1 | … | … | … | … | … | … | … | … | … | … | … | … | … | … | … | … | … | … | … | … | |
| Total | Males | 460 | 9 | 9 | 15 | 18 | 14 | 14 | 18 | 15 | 14 | 10 | 11 | 15 | 9 | 8 | 11 | 35 | 11 | 33 | 26 | 29 | 22 | 37 | 24 | 23 | 8 | 9 | 5 | 3 | 3 | 1 | … | 1 |
| Females | 316 | 16 | 10 | 13 | 12 | 12 | 12 | 6 | 13 | 6 | 15 | 8 | 7 | 9 | 10 | 9 | 35 | 4 | 15 | 23 | 22 | 18 | 21 | 7 | 5 | 1 | 2 | 2 | 3 | … | … | … | … | |
| Kawhia— | ||||||||||||||||||||||||||||||||||
| Read and Write | Males | 28 | … | … | … | … | … | … | … | … | … | … | … | … | … | 1 | … | … | … | 2 | 6 | 3 | 3 | 4 | 4 | 2 | … | 1 | 2 | … | … | … | … | … |
| Females | 13 | … | … | … | … | … | … | … | … | … | … | … | … | 1 | … | 2 | 1 | … | 2 | 3 | 1 | … | 1 | 2 | … | … | … | … | … | … | … | … | … | |
| Read only | Males | … | … | … | … | … | … | … | … | … | … | … | … | … | … | … | … | … | … | … | … | … | … | … | … | … | … | … | … | … | … | … | … | … |
| Females | 1 | … | … | … | … | … | … | … | … | … | … | … | … | … | … | … | … | … | … | … | … | … | … | … | … | … | … | … | … | … | … | … | … | |
| Cannot Read | Males | 31 | 2 | … | 2 | … | 7 | 1 | 5 | 2 | 1 | 4 | 2 | … | 1 | 1 | … | … | … | 1 | … | … | 1 | … | … | 2 | … | … | … | … | … | … | … | … |
| Females | 35 | 3 | 4 | 3 | 1 | 1 | 4 | … | 4 | 1 | 2 | 2 | … | 1 | … | 1 | 3 | … | … | 1 | … | … | 1 | … | … | … | … | … | … | … | … | … | … | |
| Education unknown | Males | … | … | … | … | … | … | … | … | … | … | … | … | … | … | … | … | … | … | … | … | … | … | … | … | … | … | … | … | … | … | … | … | … |
| Females | … | … | … | … | … | … | … | … | … | … | … | … | … | … | … | … | … | … | … | … | … | … | … | … | … | … | … | … | … | … | … | … | … | |
| Total | Males | 59 | 2 | … | 2 | … | 7 | 1 | 5 | 2 | 1 | 4 | 2 | … | 1 | 2 | … | … | … | 3 | 6 | 3 | 5 | 4 | 4 | 2 | … | 1 | 2 | … | … | … | … | … |
| Females | 49 | 3 | 4 | 5 | 1 | 2 | 4 | 1 | 4 | 1 | 2 | 2 | … | 2 | … | 3 | 4 | … | 2 | 4 | 1 | … | 2 | 2 | … | … | … | … | … | … | … | … | … | |
| Taranaki— | ||||||||||||||||||||||||||||||||||
| Read and Write | Males | 2,756 | … | … | … | … | … | 6 | 25 | 38 | 67 | 71 | 85 | 80 | 85 | 78 | 76 | 259 | 45 | 319 | 383 | 263 | 227 | 241 | 171 | 88 | 50 | 41 | 26 | 8 | 7 | 3 | 1 | 13 |
| Females | 1,816 | … | … | … | … | … | 8 | 23 | 57 | 45 | 80 | 87 | 73 | 81 | 67 | 62 | 216 | 50 | 144 | 1S3 | 172 | 137 | 121 | 88 | 48 | 20 | 18 | 15 | 12 | 6 | … | 2 | 1 | |
| Read only | Males | 205 | … | … | … | 4 | 11 | 18 | 35 | 28 | 16 | 11 | 3 | 4 | 6 | 2 | … | 11 | … | 8 | 6 | 4 | 4 | 9 | 7 | 3 | 4 | 3 | 3 | 2 | … | 2 | … | 1 |
| Females | 188 | … | … | … | 3 | 7 | 21 | 33 | 17 | 14 | 5 | 9 | 3 | 2 | 3 | 1 | 5 | … | 3 | 9 | 9 | 8 | 10 | 8 | 6 | 3 | 3 | 1 | 1 | 1 | … | … | 1 | |
| Cannot Read | Males | 949 | 142 | 122 | 133 | 124 | 114 | 88 | 38 | 30 | 19 | 10 | 11 | 3 | 1 | 4 | 3 | 2 | 1 | 5 | 12 | 13 | 17 | 12 | 14 | 13 | 10 | 5 | 1 | 1 | … | … | … | 1 |
| Females | 871 | 129 | 124 | 115 | 119 | 110 | 87 | 51 | 28 | 9 | 5 | 8 | 1 | 3 | 3 | 1 | 4 | 1 | 9 | 9 | 13 | 12 | 7 | 7 | 1 | 5 | 2 | 3 | 1 | … | 2 | … | 1 | |
| Education unknown | Males | 19 | … | … | … | … | … | … | … | … | … | … | 2 | 1 | 1 | … | … | 1 | 1 | 1 | 1 | … | … | 1 | … | … | 1 | … | … | … | … | … | … | … |
| Females | 15 | … | … | … | … | … | … | … | 2 | … | … | … | 2 | … | 1 | 2 | 1 | 1 | … | … | … | 1 | … | … | … | … | … | |||||||
| Total | Males | 3,929 | 144 | 122 | 133 | 128 | 125 | 112 | 101 | 99 | 105 | 92 | 101 | 88 | 93 | 84 | 79 | 273 | 47 | 333 | 401 | 280 | 248 | 263 | 192 | 104 | 65 | 49 | 30 | 11 | 7 | 5 | 1 | 15 |
| Females | 2,890 | 129 | 124 | 115 | 122 | 117 | 116 | 107 | 104 | 68 | 90 | 104 | 79 | 86 | 74 | 64 | 227 | 52 | 157 | 201 | 196 | 158 | 139 | 104 | 56 | 28 | 23 | 20 | 14 | 7 | 2 | 4 | 3 | |
| Patea— | ||||||||||||||||||||||||||||||||||
| Read and Write | Males | 2,637 | … | … | … | … | … | 4 | 15 | 37 | 41 | 52 | 66 | 46 | 59 | 46 | 43 | 196 | 56 | 257 | 411 | 324 | 337 | 280 | 132 | 94 | 53 | 29 | 19 | 8 | 6 | 2 | … | 24 |
| Females | 1,497 | … | … | … | … | … | 8 | 31 | 44 | 55 | 50 | 48 | 39 | 44 | 30 | 45 | 163 | 41 | 167 | 238 | 158 | 124 | 85 | 34 | 31 | 31 | 8 | 7 | 10 | … | … | … | 4 | |
| Read only | Males | 137 | … | … | … | … | 3 | 18 | 22 | 31 | 10 | 6 | 1 | 1 | … | 1 | 1 | 5 | … | 7 | 3 | 2 | 8 | 2 | 7 | 4 | 1 | 2 | … | … | … | … | … | 2 |
| Females | 127 | … | … | … | 1 | 10 | 24 | 23 | 12 | 9 | 10 | 3 | 1 | … | … | … | … | 1 | 4 | 5 | 5 | 5 | 3 | 3 | 4 | 2 | 1 | … | … | … | … | … | 1 | |
| Cannot Read | Males | 706 | 131 | 82 | 109 | 108 | 80 | 69 | 29 | 12 | 7 | 3 | 4 | 1 | 2 | … | 3 | 5 | 1 | 3 | 9 | 14 | 9 | 11 | 5 | 3 | 1 | 2 | … | 1 | … | … | 1 | 1 |
| Females | 674 | 115 | 110 | 102 | 105 | 90 | 70 | 26 | 14 | 4 | 3 | 3 | … | 1 | 1 | 1 | 3 | … | 5 | 3 | 6 | 3 | 2 | 2 | 2 | … | … | 1 | … | … | … | … | … | |
| Education unknown | Males | 8 | … | … | … | … | … | … | … | … | … | … | … | … | … | … | … | … | … | 3 | 1 | … | 2 | … | … | 1 | … | … | … | … | … | … | … | 1 |
| Females | 1 | … | … | … | … | … | … | … | … | … | … | … | … | … | … | … | … | … | … | … | … | 1 | … | … | … | … | … | … | … | … | … | … | … | |
| Total | Males | 3,488 | 131 | 82 | 109 | 108 | 83 | 91 | 66 | 80 | 58 | 61 | 71 | 48 | 61 | 47 | 47 | 206 | 57 | 270 | 425 | 340 | 356 | 293 | 144 | 102 | 55 | 33 | 19 | 9 | 6 | 2 | 1 | 28 |
| Females | 2,299 | 115 | 110 | 102 | 106 | 100 | 102 | 80 | 70 | 68 | 63 | 54 | 40 | 45 | 31 | 46 | 16S | 42 | 176 | 246 | 169 | 135 | 90 | 39 | 37 | 33 | 9 | 8 | 10 | … | … | … | 5 | |
| Wanganui— | ||||||||||||||||||||||||||||||||||
| Read and Write | Males | 1,417 | … | … | … | … | … | 3 | 11 | 23 | 28 | 41 | 40 | 38 | 41 | 35 | 39 | 262 | 43 | 138 | 166 | 151 | 107 | 115 | 83 | 68 | 30 | 17 | 12 | 6 | 4 | 1 | … | 5 |
| Females | 1,059 | … | … | … | … | … | 3 | 18 | 26 | 32 | 35 | 37 | 43 | 42 | 28 | 42 | 151 | 35 | 109 | 109 | 86 | 69 | 65 | 46 | 33 | 12 | 22 | 7 | 2 | 5 | 1 | … | 1 | |
| Read only | Males | 116 | … | … | … | 1 | 5 | 10 | 19 | 16 | 10 | 3 | 5 | … | 2 | 1 | 1 | 2 | 1 | 4 | 5 | 8 | 3 | 6 | 4 | 2 | 3 | 1 | 3 | 1 | … | … | … | … |
| Females | 97 | … | … | … | 1 | 5 | 10 | 22 | 8 | 5 | 5 | 1 | 3 | … | … | … | … | … | 1 | 7 | 8 | 5 | 2 | 5 | 4 | 1 | 2 | 1 | 1 | … | … | … | … | |
| Cannot Read | Males | 396 | 53 | 51 | 57 | 54 | 56 | 43 | 17 | 11 | 6 | 2 | … | 1 | … | … | … | 2 | … | 4 | 4 | 2 | 9 | 8 | 5 | 2 | 3 | 6 | … | … | … | … | … | … |
| Females | 365 | 55 | 43 | 61 | 54 | 49 | 44 | 20 | 9 | 1 | 2 | 2 | … | 1 | 1 | … | 2 | … | 2 | 3 | 4 | 2 | 2 | 3 | 1 | 1 | 3 | … | … | … | … | … | … | |
Table XIV. Table XIV. Showing the Education of Persons, Males, and Females (exclusive of Maoris and Chinese), in each County.—continued
| Counties. | All ages. | Under 5. | 5 and under 10. | 10 and under 15. | 15 and under 21. | 21 and under 40. | 40 and under 60. | 60 and under 80. | 80 and Upward. | Unspecified Children. | Unspecified Adults. | |||||||||||||||||||||||
|---|---|---|---|---|---|---|---|---|---|---|---|---|---|---|---|---|---|---|---|---|---|---|---|---|---|---|---|---|---|---|---|---|---|---|
| Under 1 year. | 1–2. | 2–3. | 3–4. | 4–5. | 5–6. | 6–7. | 7–8. | 8–9. | 9–10. | 10–11. | 11–12. | 12–13. | 13–14. | 14–15. | 15–20. | 20–21. | 21–25. | 25–30. | 30–35. | 35–40. | 40–45. | 45–50. | 50–55. | 55–60. | 60–65. | 65–70. | 50–75. | 75–80. | ||||||
| Wanganui— | ||||||||||||||||||||||||||||||||||
| Education unknown | Males | 3 | … | … | … | … | … | … | … | … | … | … | … | … | … | … | … | … | … | … | … | … | … | … | 1 | … | … | … | … | … | … | … | … | 2 |
| Females | … | … | … | … | … | … | … | … | … | … | … | … | … | … | … | … | … | … | … | … | … | … | … | … | … | … | … | … | … | … | … | … | … | |
| Total | Males | 1,932 | 53 | 51 | 57 | 55 | 61 | 56 | 47 | 50 | 44 | 46 | 45 | 39 | 43 | 36 | 40 | 166 | 46 | 146 | 175 | 161 | 119 | 129 | 93 | 72 | 36 | 34 | 15 | 7 | 4 | 1 | … | 7 |
| Females | 1,521 | 55 | 43 | 61 | 55 | 54 | 57 | 60 | 43 | 38 | 42 | 40 | 46 | 43 | 29 | 42 | 153 | 35 | 112 | 119 | 98 | 76 | 69 | 54 | 38 | 14 | 27 | 8 | 3 | 5 | 1 | … | 1 | |
| Rangitikei— | ||||||||||||||||||||||||||||||||||
| Read and Write | Males | 1,349 | … | … | … | … | … | 2 | 18 | 31 | 29 | 48 | 49 | 34 | 43 | 30 | 38 | 153 | 32 | 129 | 157 | 121 | 99 | 128 | 72 | 50 | 30 | 24 | 13 | 7 | 5 | 5 | … | 2 |
| Females | 1,023 | … | … | … | … | … | 5 | 19 | 28 | 31 | 39 | 39 | 41 | 29 | 40 | 40 | 175 | 25 | 96 | 103 | 69 | 74 | 58 | 35 | 26 | 20 | 18 | 5 | 5 | 2 | … | … | 1 | |
| Read only | Males | 71 | … | … | … | … | 3 | 9 | 18 | 3 | 6 | 2 | … | … | … | … | … | 1 | … | … | 2 | 2 | 3 | 4 | 8 | 3 | … | 2 | 2 | 1 | 2 | … | … | … |
| Females | 91 | … | … | … | … | 8 | 14 | 18 | 13 | 2 | 4 | 3 | … | 1 | … | … | 1 | … | 2 | 2 | 1 | 3 | 7 | 3 | 6 | … | 1 | 1 | 1 | … | … | … | … | |
| Cannot Read | Males | 405 | 71 | 35 | 62 | 64 | 68 | 36 | 22 | 10 | 2 | 1 | 1 | 1 | … | … | 1 | … | … | 4 | 3 | … | 4 | 2 | 2 | 2 | 4 | 4 | 4 | … | 1 | … | … | 1 |
| Females | 367 | 53 | 59 | 02 | 48 | 56 | 38 | 22 | 7 | 3 | 1 | 2 | … | … | … | 2 | 1 | … | … | 3 | 1 | 3 | 1 | 1 | 1 | 1 | 2 | … | … | … | … | … | … | |
| Education unknown | Males | 1 | … | … | … | … | … | … | … | … | … | … | … | … | 1 | … | … | … | … | … | … | … | … | … | … | … | … | … | … | … | … | … | … | … |
| Females | 2 | … | … | … | … | … | … | 1 | … | … | … | … | … | … | … | … | … | … | … | … | 1 | … | … | … | … | … | … | … | … | … | … | … | … | |
| Total | Males | 1,826 | 71 | 35 | 62 | 64 | 71 | 47 | 58 | 44 | 37 | 51 | 50 | 35 | 44 | 30 | 39 | 154 | 32 | 133 | 162 | 123 | 106 | 134 | 82 | 55 | 34 | 30 | 19 | 8 | 8 | 5 | … | 3 |
| Females | 1,483 | 55 | 59 | 62 | 45 | 64 | 57 | 60 | 48 | 36 | 44 | 44 | 41 | 30 | 40 | 42 | 177 | 25 | 98 | 108 | 72 | 50 | 66 | 39 | 33 | 21 | 21 | 6 | 6 | 2 | … | … | 1 | |
| Manawatu— | ||||||||||||||||||||||||||||||||||
| Read and Write | Males | 2,781 | … | … | … | … | … | 6 | 20 | 46 | 66 | 67 | 78 | 84 | 59 | 71 | 72 | 279 | 60 | 254 | 376 | 293 | 303 | 238 | 160 | 110 | 59 | 37 | 13 | 10 | 6 | 3 | … | 11 |
| Females | 1,935 | … | … | … | … | … | 6 | 30 | 51 | 51 | 75 | 79 | 83 | 72 | 73 | 77 | 230 | 41 | 187 | 239 | 191 | 157 | 112 | 73 | 47 | 23 | 19 | 5 | 4 | 6 | 4 | … | … | |
| Read only | Males | 217 | … | … | … | … | 1 | 14 | 32 | 34 | 22 | 17 | 8 | 4 | 5 | 2 | … | 2 | … | 5 | 9 | 12 | 15 | 14 | 5 | 6 | 3 | 3 | 4 | … | … | … | … | … |
| Females | 232 | … | … | … | 1 | 11 | 26 | 32 | 31 | 23 | 18 | 8 | 8 | 2 | 1 | 4 | 4 | … | 2 | 6 | 12 | 14 | 9 | 4 | 3 | 6 | 3 | 2 | 2 | … | … | … | … | |
| Cannot Read | Males | 1,124 | 170 | 132 | 184 | 149 | 166 | 103 | 57 | 24 | 9 | 10 | 5 | 3 | 2 | 3 | 5 | 12 | … | 8 | 13 | 17 | 12 | 11 | 14 | 7 | 2 | 2 | 2 | 1 | … | … | … | … |
| Females | 1,041 | 147 | 148 | 148 | 139 | 133 | 111 | 57 | 29 | 10 | 10 | 1 | 1 | 5 | … | 3 | 7 | 1 | 4 | 20 | 17 | 10 | 15 | 9 | 7 | 2 | 2 | 2 | 1 | 1 | 1 | … | … | |
| Education unknown | Males | 21 | … | … | … | … | … | … | … | 1 | … | … | … | … | … | … | 2 | 3 | 2 | 2 | 1 | 4 | 2 | 1 | 1 | … | … | … | … | … | … | … | … | 2 |
| females | 17 | … | … | … | … | … | … | … | … | 1 | … | … | … | 2 | 2 | … | 2 | … | 7 | 1 | … | … | … | … | 2 | … | … | … | … | … | … | … | … | |
| Total | Males | 4,143 | 170 | 132 | 184 | 149 | 167 | 123 | 109 | 105 | 97 | 94 | 91 | 91 | 66 | 76 | 79 | 296 | 62 | 269 | 399 | 326 | 332 | 264 | 180 | 123 | 64 | 42 | 19 | 11 | 6 | 3 | … | 14 |
| females | 3,225 | 147 | 148 | 148 | 140 | 144 | 143 | 119 | 111 | 85 | 103 | 88 | 92 | 81 | 76 | 54 | 243 | 42 | 200 | 266 | 220 | 151 | 136 | 85 | 59 | 31 | 24 | 9 | 7 | 7 | 5 | … | 1 | |
| Hutt— | ||||||||||||||||||||||||||||||||||
| Read and Write | Males | 2,876 | … | … | … | … | … | 16 | 44 | 51 | 67 | 92 | 80 | 101 | 79 | 93 | 88 | 323 | 45 | 277 | 348 | 257 | 226 | 211 | 126 | 104 | 90 | 46 | 28 | 32 | 15 | 14 | 5 | 18 |
| Females | 2,412 | … | … | … | … | … | 14 | 34 | 66 | 74 | 90 | 64 | 93 | 76 | 87 | 94 | 352 | 52 | 255 | 249 | 196 | 183 | 129 | 76 | 74 | 55 | 34 | 23 | 17 | 9 | 2 | 4 | 10 | |
| Read only | Males | 196 | … | … | … | 5 | 9 | 22 | 26 | 26 | 14 | 12 | 14 | 4 | 5 | 2 | 1 | 6 | 1 | 5 | 9 | 7 | 5 | 6 | 3 | 5 | 3 | … | 3 | 1 | 1 | 1 | … | … |
| Females | 245 | … | … | … | 3 | 18 | 26 | 36 | 24 | 24 | 11 | 5 | 2 | 4 | … | … | 5 | 1 | 4 | 12 | 7 | 8 | 8 | 7 | 12 | 7 | 4 | 6 | 6 | 4 | 1 | … | … | |
| Cannot Read | Males | 1,076 | 164 | 153 | 132 | 133 | 138 | 90 | 61 | 24 | 12 | 5 | 4 | 2 | 3 | 8 | 3 | 21 | 3 | 11 | 20 | 13 | 8 | 8 | 18 | 8 | 8 | 9 | 4 | 5 | 3 | … | 4 | 1 |
| Females | 991 | 150 | 119 | 163 | 136 | 143 | 88 | 44 | 18 | 16 | 4 | 4 | 3 | 2 | 1 | 1 | 10 | 3 | 10 | 8 | 11 | 7 | 15 | 6 | 6 | 5 | 4 | 5 | 4 | 1 | 1 | 2 | 1 | |
Table XIV. Table XIV. Showing the Education of Persons, Males, and Females (exclusive of Maoris and Chinese), in each County.—continued
| Counties. | All ages. | Under 5. | 5 and under 10. | 10 and under 15. | 15 and under 21. | 21 and under 40. | 40 and under 60. | 60 and under 80. | 80 and Upward. | Unspecified Children. | Unspecified Adults. | |||||||||||||||||||||||
|---|---|---|---|---|---|---|---|---|---|---|---|---|---|---|---|---|---|---|---|---|---|---|---|---|---|---|---|---|---|---|---|---|---|---|
| Under 1 year. | 1–2. | 2–3. | 3–4. | 4–5. | 5–6. | 6–7. | 7–8. | 8–9. | 9–10. | 10–11. | 11–12. | 12–13. | 13–14. | 14–15. | 15–20. | 20–21. | 21–25. | 25–30. | 30–35. | 35–40. | 40–45. | 45–50. | 50–55. | 55–60. | 60–65. | 65–70. | 50–75. | 75–80. | ||||||
| Education unknown | Males | 17 | … | … | … | … | … | … | 1 | … | 2 | 1 | 1 | … | … | … | … | … | 1 | 2 | … | 4 | 2 | … | … | … | … | … | … | … | … | … | … | 3 |
| Females | 10 | … | … | … | … | … | 1 | … | 1 | … | … | 1 | … | … | … | … | … | … | … | 2 | … | … | 2 | 1 | 1 | … | 1 | … | … | … | … | … | … | |
| Total | Males | 4,165 | 164 | 153 | 132 | 138 | 147 | 128 | 132 | 101 | 95 | 110 | 99 | 107 | 87 | 103 | 92 | 350 | 50 | 295 | 377 | 281 | 241 | 225 | 147 | 117 | 101 | 55 | 35 | 38 | 19 | 15 | 9 | 22 |
| Females | 3,658 | 150 | 119 | 163 | 139 | 161 | 129 | 114 | 109 | 114 | 105 | 74 | 98 | 82 | 88 | 95 | 367 | 56 | 269 | 271 | 214 | 198 | 154 | 90 | 93 | 67 | 43 | 34 | 27 | 14 | 4 | 6 | 11 | |
| Wairarapa West— | ||||||||||||||||||||||||||||||||||
| Read and Write | Males | 2,127 | … | … | … | … | … | 5 | 20 | 30 | 58 | 61 | 65 | 61 | 69 | 64 | 48 | 234 | 31 | 183 | 259 | 238 | 206 | 171 | 120 | 87 | 48 | 32 | 18 | 11 | 2 | … | … | 5 |
| Females | 1,570 | … | … | … | … | … | 8 | 19 | 34 | 44 | 57 | 47 | 59 | 62 | 60 | 66 | 226 | 42 | 155 | 184 | 152 | 107 | 86 | 55 | 38 | 22 | 19 | 17 | 4 | 2 | 1 | … | 4 | |
| Read only | Males | 179 | … | … | … | … | 6 | 10 | 25 | 28 | 20 | 12 | 10 | 6 | 2 | 4 | … | 4 | … | 8 | 1 | 6 | 9 | 8 | 9 | 5 | … | 3 | 2 | … | … | 1 | … | … |
| Females | 200 | … | … | … | … | 7 | 14 | 22 | 24 | 16 | 14 | 9 | 8 | 4 | 1 | 1 | 3 | 1 | 3 | 6 | 11 | 13 | 14 | 10 | 6 | 5 | 4 | 3 | 1 | … | … | … | … | |
| Cannot Read | Males | 838 | 126 | 102 | 117 | 116 | 97 | 78 | 53 | 21 | 17 | 5 | 8 | 1 | 2 | 2 | 2 | 12 | … | 4 | 12 | 11 | 9 | 13 | 5 | 8 | 10 | 5 | 1 | … | … | 1 | … | … |
| Females | 804 | 108 | 111 | 108 | 122 | 100 | 95 | 53 | 23 | 8 | 3 | 3 | 3 | … | 1 | … | 3 | 1 | 3 | 10 | 10 | 9 | 8 | 6 | 3 | 1 | 6 | 1 | … | 1 | 1 | … | 1 | |
| Education unknown | Males | 23 | … | … | … | … | … | … | 2 | … | … | … | 1 | … | 1 | … | … | 4 | … | 1 | … | 4 | 3 | 4 | 1 | 1 | … | … | … | … | … | … | … | 1 |
| Females | 18 | … | … | … | … | … | … | 1 | … | … | 1 | 2 | … | 2 | … | … | 3 | … | 2 | … | 2 | 2 | 2 | … | … | … | 1 | … | … | … | … | … | … | |
| Total | Males | 3,l67 | 126 | 102 | 117 | 116 | 103 | 93 | 100 | 79 | 95 | 78 | 84 | 68 | 74 | 70 | 50 | 254 | 31 | 196 | 272 | 259 | 227 | 196 | 135 | 101 | 58 | 40 | 21 | 11 | 3 | 2 | … | 6 |
| Females | 2,592 | 108 | 111 | 108 | 122 | 107 | 117 | 95 | 81 | 68 | 75 | 61 | 70 | 68 | 62 | 67 | 235 | 44 | 163 | 200 | 175 | 131 | 110 | 71 | 49 | 28 | 20 | 21 | 5 | 3 | 2 | … | 5 | |
| Wairarapa East— | ||||||||||||||||||||||||||||||||||
| Read and Write | Males | 832 | … | … | … | … | … | 3 | 4 | 5 | 5 | 9 | 12 | 5 | 13 | 7 | 9 | 75 | 12 | 125 | 157 | 108 | 94 | 83 | 48 | 23 | 14 | 12 | 3 | 4 | … | 1 | … | 1 |
| Females | 292 | … | … | … | … | … | 1 | 5 | 4 | 7 | 7 | 7 | 13 | 10 | 12 | 9 | 44 | 12 | 34 | 32 | 31 | 24 | 13 | 15 | 5 | 2 | … | 2 | 1 | 1 | … | … | 1 | |
| Read only | Males | 43 | … | … | … | … | … | 1 | 3 | 8 | 2 | 4 | 1 | … | 1 | … | … | 1 | … | 1 | 8 | 1 | 3 | 3 | 4 | … | 1 | … | 1 | … | … | … | … | … |
| Females | 26 | … | … | … | … | 2 | 2 | 4 | 3 | 3 | 2 | 3 | 1 | 1 | … | … | 1 | … | … | 1 | 2 | … | 1 | … | … | … | … | … | … | … | … | … | … | |
| Cannot Read | Males | 170 | 21 | 16 | 18 | 21 | 18 | 18 | 9 | 8 | 4 | 2 | … | 2 | … | 1 | 1 | 3 | … | 3 | 8 | 4 | 4 | 1 | 2 | 2 | 1 | … | 1 | … | … | … | … | 2 |
| Females | 111 | 15 | 17 | 13 | 23 | 12 | 9 | 7 | 7 | 5 | … | … | 1 | … | … | … | … | … | 1 | … | 1 | 1 | … | … | 1 | … | … | … | … | … | … | … | … | |
| Education unknown | Males | 1 | … | … | … | … | … | … | … | … | … | … | … | … | … | … | … | 1 | … | … | … | … | … | … | … | … | … | … | … | … | … | … | … | … |
| Females | … | … | … | … | … | … | … | … | … | … | … | … | … | … | … | … | … | … | … | … | … | … | … | … | … | … | … | … | … | … | … | … | … | |
| Total | Males | 1,046 | 21 | 16 | 18 | 21 | 18 | 22 | 16 | 21 | 11 | 15 | 13 | 7 | 14 | 8 | 10 | 79 | 12 | 129 | 174 | 113 | 101 | 87 | 54 | 25 | 16 | 12 | 5 | 4 | … | 1 | … | 3 |
| Females | 429 | 15 | 17 | 13 | 23 | 14 | 12 | 16 | 14 | 13 | 9 | 9 | 15 | 11 | 12 | 9 | 45 | 12 | 35 | 33 | 34 | 25 | 14 | 15 | 7 | 2 | … | 2 | 1 | 1 | … | … | 1 | |
| Waipawa — | ||||||||||||||||||||||||||||||||||
| Read and Write | Males | 2,322 | … | … | … | … | … | 7 | 16 | 44 | 50 | 63 | 60 | 59 | 58 | 50 | 63 | 221 | 46 | 209 | 314 | 267 | 250 | 226 | 140 | 71 | 42 | 31 | 14 | 4 | 2 | 3 | 4 | 10 |
| Females | 1,471 | … | … | … | … | … | 5 | 17 | 28 | 36 | 55 | 59 | 54 | 48 | 57 | 56 | 191 | 35 | 114 | 164 | 176 | 124 | 103 | 58 | 44 | 21 | 8 | 3 | 6 | 1 | … | … | 9 | |
| Read only | Males | 206 | … | … | … | 3 | 3 | 19 | 21 | 26 | 14 | 14 | 6 | 8 | 5 | 1 | 2 | 4 | 1 | 4 | 6 | 15 | 10 | 11 | 9 | 9 | 5 | 5 | 2 | … | … | … | 1 | 1 |
| Females | 187 | … | … | … | … | 4 | 13 | 34 | 22 | 18 | 9 | 8 | … | 6 | … | … | 8 | 1 | 1 | 6 | 6 | 13 | 7 | 14 | 10 | 1 | 4 | 1 | … | … | … | … | … | |
| Cannot Read | Males | 848 | 124 | 99 | 138 | 104 | 100 | 77 | 53 | 14 | 9 | 9 | 5 | 4 | 1 | 4 | … | 7 | 6 | 12 | 17 | 11 | 17 | 10 | 10 | 7 | 3 | 4 | … | … | … | … | 2 | … |
| Females | 786 | 108 | 105 | 108 | 103 | 112 | 78 | 39 | 29 | 11 | 8 | 6 | 1 | 2 | 1 | 1 | 5 | 1 | 2 | 10 | 10 | 15 | 5 | 10 | 7 | 4 | … | … | 1 | … | … | 3 | … | |
| Education unknown | Males | 35 | … | … | … | … | … | … | … | … | 2 | … | … | 2 | 4 | … | … | 2 | … | 1 | 2 | 1 | 5 | 2 | 3 | 1 | … | … | … | … | … | … | … | … |
| Females | 12 | … | … | … | … | … | … | 1 | … | … | … | 1 | … | … | … | … | 1 | … | 2 | 1 | … | … | 3 | 1 | 1 | … | 1 | … | … | … | … | … | … | |
| Total | Males | 3,411 | 124 | 99 | 138 | 107 | 103 | 103 | 90 | 84 | 75 | 86 | 71 | 73 | 68 | 55 | 65 | 234 | 53 | 226 | 339 | 294 | 282 | 249 | 162 | 88 | 50 | 40 | 16 | 4 | 2 | 3 | 7 | 21 |
| Females | 2,456 | 108 | 105 | 108 | 103 | 116 | 96 | 91 | 79 | 65 | 72 | 74 | 55 | 56 | 58 | 57 | 205 | 37 | 119 | 181 | 192 | 152 | 118 | 83 | 62 | 27 | 13 | 4 | 7 | 1 | … | 3 | 9 | |
| Hawke's Bay— | ||||||||||||||||||||||||||||||||||
| Read and Write | Males | 2,090 | … | … | … | … | … | 10 | 15 | 36 | 37 | 53 | 40 | 48 | 39 | 37 | 40 | 198 | 44 | 230 | 285 | 269 | 228 | 187 | 104 | 71 | 24 | 28 | 21 | 13 | 1 | 3 | … | 20 |
| Females | 1,319 | … | … | … | … | … | 2 | 16 | 32 | 33 | 49 | 50 | 49 | 47 | 44 | 38 | 173 | 43 | 130 | 151 | 135 | 104 | 67 | 47 | 26 | 17 | 13 | 12 | 5 | 2 | 2 | … | 2 | |
| Read only | Males | 115 | … | … | … | 1 | 3 | 13 | 13 | 17 | 10 | 2 | 3 | … | 3 | … | … | 7 | … | 4 | 5 | 3 | 7 | 9 | 5 | 5 | 3 | 1 | … | … | … | 1 | … | … |
| Females | 112 | … | … | … | … | 1 | 7 | 13 | 14 | 5 | 11 | 3 | 1 | … | 2 | … | 3 | 2 | 6 | 3 | 7 | 8 | 6 | 4 | 4 | 1 | 5 | 4 | … | 1 | 1 | … | … | |
| Cannot Read | Males | 625 | 74 | 73 | 92 | 86 | 73 | 69 | 38 | 20 | 7 | 5 | 3 | 1 | 3 | 2 | 2 | 9 | 3 | 12 | 11 | 7 | 6 | 6 | 5 | 11 | 5 | 1 | … | 1 | … | … | … | … |
| Females | 579 | 109 | 86 | 82 | 81 | 79 | 47 | 28 | 18 | 4 | 7 | 2 | 1 | 1 | 1 | 1 | 4 | … | 2 | 6 | 2 | 6 | 5 | 4 | … | … | 2 | … | 1 | … | … | … | … | |
Table XIV. Table XIV. Showing the Education of Persons, Males, and Females (exclusive of Maoris and Chinese), in each County.—continued
| Counties. | All ages. | Under 5. | 5 and under 10. | 10 and under 15. | 15 and under 21. | 21 and under 40. | 40 and under 60. | 60 and under 80. | 80 and Upward. | Unspecified Children. | Unspecified Adults. | |||||||||||||||||||||||
|---|---|---|---|---|---|---|---|---|---|---|---|---|---|---|---|---|---|---|---|---|---|---|---|---|---|---|---|---|---|---|---|---|---|---|
| Under 1 year. | 1–2. | 2–3. | 3–4. | 4–5. | 5–6. | 6–7. | 7–8. | 8–9. | 9–10. | 10–11. | 11–12. | 12–13. | 13–14. | 14–15. | 15–20. | 20–21. | 21–25. | 25–30. | 30–35. | 35–40. | 40–45. | 45–50. | 50–55. | 55–60. | 60–65. | 65–70. | 50–75. | 75–80. | ||||||
| Hawke's Bay— | ||||||||||||||||||||||||||||||||||
| Education unknown | Males | 23 | … | … | … | … | … | 1 | … | … | … | … | … | … | … | … | … | … | 1 | 1 | 5 | 1 | 5 | 5 | 1 | … | … | … | … | … | … | … | … | 3 |
| Females | 12 | … | … | … | … | … | … | … | 1 | … | … | … | … | … | … | … | 5 | … | 2 | 2 | 1 | … | … | … | … | 1 | … | … | … | … | … | … | … | |
| Total | Males | 2,853 | 74 | 73 | 92 | 87 | 76 | 93 | 66 | 73 | 54 | 60 | 46 | 49 | 45 | 39 | 42 | 214 | 48 | 247 | 306 | 280 | 246 | 207 | 115 | 87 | 32 | 30 | 31 | 14 | 1 | 4 | … | 32 |
| Females | 2,022 | 109 | 86 | 82 | 81 | 80 | 56 | 57 | 55 | 42 | 67 | 55 | 51 | 48 | 47 | 39 | 185 | 45 | 140 | 192 | 145 | 118 | 78 | 55 | 30 | 19 | 20 | 16 | 6 | 3 | 3 | … | 2 | |
| Sounds— | ||||||||||||||||||||||||||||||||||
| Read and Write | Males | 219 | … | … | … | … | … | … | … | 2 | 3 | 2 | 3 | 5 | 4 | 2 | 4 | 25 | 1 | 25 | 32 | 22 | 27 | 16 | 22 | 9 | 4 | 5 | 3 | 2 | 1 | … | … | … |
| Females | 133 | … | … | … | … | … | … | 1 | … | … | 4 | 3 | 5 | 6 | 8 | 6 | 25 | 2 | 13 | 17 | 15 | 10 | 8 | 6 | 1 | 2 | 1 | … | … | … | … | … | … | |
| Read only | Males | 31 | … | … | … | … | … | 2 | 3 | 2 | 6 | 3 | 2 | 1 | 1 | … | 2 | 2 | … | 2 | … | 1 | … | 2 | … | … | … | 2 | … | … | … | … | … | … |
| Females | 12 | … | … | … | … | … | … | … | 1 | … | … | … | … | … | … | … | 5 | … | 2 | 2 | 1 | … | … | … | … | 1 | … | … | … | … | … | … | … | |
| Cannot Read | Males | 113 | 10 | 18 | 10 | 10 | 12 | 13 | 6 | 4 | … | 5 | 1 | 3 | 1 | … | … | 7 | 1 | 2 | 1 | 3 | 3 | 2 | … | 1 | … | … | … | … | … | … | … | … |
| Females | 82 | 15 | 8 | 14 | 13 | 7 | 5 | 8 | 2 | 4 | … | 2 | … | … | … | … | … | … | … | 1 | 1 | … | 1 | … | 1 | … | … | … | … | … | … | … | … | |
| Education unknown | Males | 1 | … | … | … | … | … | … | … | … | … | … | … | … | … | … | … | 1 | … | … | … | … | … | … | … | … | … | … | … | … | … | … | … | … |
| Females | 1 | … | … | … | … | … | … | … | … | … | … | … | … | … | … | … | 1 | … | … | … | … | … | … | … | … | … | … | … | … | … | … | … | … | |
| Total | Males | 364 | 10 | 18 | 10 | 10 | 12 | 15 | 9 | 8 | 9 | 10 | 6 | 9 | 6 | 2 | 6 | 35 | 2 | 29 | 33 | 26 | 30 | 20 | 22 | 10 | 4 | 7 | 3 | 2 | 1 | … | … | … |
| Females | 241 | 15 | 8 | 14 | 13 | 7 | 5 | 11 | 8 | 9 | 5 | 9 | 6 | 7 | 9 | 6 | 26 | 2 | 13 | 19 | 16 | 10 | 10 | 7 | 2 | 2 | 1 | … | 1 | … | … | … | … | |
| Marlborough— | ||||||||||||||||||||||||||||||||||
| Read and Write | Males | 1,985 | … | … | … | … | … | … | 10 | 30 | 35 | 42 | 36 | 35 | 46 | 46 | 44 | 221 | 51 | 212 | 250 | 187 | 201 | 185 | 128 | 95 | 43 | 45 | 18 | 13 | 5 | 5 | … | 2 |
| Females | 1,185 | … | … | … | … | … | 3 | 15 | 21 | 37 | 45 | 41 | 53 | 57 | 41 | 44 | 150 | 36 | 124 | 139 | 103 | 85 | 56 | 45 | 22 | 27 | 22 | 12 | 3 | … | 1 | … | 3 | |
| Read only | Males | 159 | … | … | … | … | 2 | 13 | 24 | 15 | 22 | 10 | 8 | 5 | 4 | … | 1 | 11 | … | 4 | 5 | 3 | 5 | 4 | 9 | 4 | 3 | 4 | … | 1 | … | 1 | … | 1 |
| Females | 116 | … | … | … | 1 | 1 | 12 | 16 | 12 | 13 | 7 | 4 | 6 | 5 | 2 | … | 4 | … | … | 4 | 3 | 5 | 6 | 5 | 2 | 2 | 1 | 1 | 2 | 1 | 1 | … | … | |
| Cannot Read | Males | 594 | 101 | 65 | 85 | 64 | 76 | 58 | 39 | 19 | 8 | 8 | 4 | 2 | 3 | … | 3 | 4 | 2 | 7 | 7 | 2 | 6 | 7 | 5 | 10 | 1 | 3 | 1 | … | 1 | … | … | … |
| Females | 607 | 93 | 77 | 91 | 84 | 79 | 46 | 45 | 11 | 10 | 9 | 3 | 3 | 2 | 1 | 4 | 1 | 2 | 2 | 4 | 8 | 5 | 8 | 5 | 4 | 3 | 4 | 1 | 1 | 1 | … | … | … | |
| Education unknown | Males | 29 | … | … | … | … | … | 3 | 4 | 2 | 1 | 3 | … | … | … | … | … | … | … | … | 3 | 1 | 5 | 1 | 1 | 1 | … | … | 1 | … | … | … | … | 3 |
| Females | 5 | … | … | … | … | … | … | … | … | … | … | … | … | … | … | … | … | … | … | … | 1 | 4 | … | … | … | … | … | … | … | … | … | … | … | |
| Total | Males | 2,767 | 101 | 68 | 85 | 64 | 78 | 74 | 77 | 66 | 66 | 63 | 48 | 42 | 53 | 46 | 48 | 236 | 53 | 223 | 265 | 193 | 217 | 197 | 143 | 110 | 47 | 52 | 20 | 14 | 6 | 6 | … | 6 |
| Females | 1,913 | 93 | 77 | 91 | 85 | 80 | 61 | 76 | 44 | 60 | 61 | 48 | 62 | 64 | 44 | 48 | 155 | 38 | 126 | 147 | 115 | 99 | 70 | 55 | 28 | 32 | 27 | 14 | 6 | 2 | 2 | … | 3 | |
| Kaikoura— | ||||||||||||||||||||||||||||||||||
| Read and Write | Males | 491 | … | … | … | … | … | … | 5 | 8 | 8 | 14 | 10 | 10 | 21 | 7 | 9 | 40 | 13 | 40 | 73 | 53 | 51 | 49 | 33 | 19 | 12 | 9 | 5 | 2 | … | … | … | … |
| Females | 273 | … | … | … | … | … | 1 | 6 | 5 | 7 | 12 | 9 | 14 | 4 | 10 | 4 | 45 | 10 | 32 | 34 | 29 | 15 | 17 | 7 | 8 | 2 | 1 | … | 1 | … | … | … | … | |
| Read only | Males | 23 | … | … | … | … | 3 | 3 | 3 | 2 | 4 | 2 | 2 | 2 | 1 | … | … | … | … | … | … | 1 | … | … | … | … | … | … | … | … | … | … | … | … |
| Females | 31 | … | … | … | … | 3 | 6 | 3 | 4 | 1 | 5 | 1 | … | … | … | … | 1 | … | 2 | … | … | 1 | … | 1 | … | 2 | … | … | … | … | 1 | … | … | |
| Cannot Read | Males | 147 | 27 | 15 | 28 | 18 | 18 | 15 | 6 | 5 | 2 | … | … | … | … | … | … | 1 | 1 | 3 | 1 | … | 2 | 1 | 1 | 2 | … | … | … | … | … | 1 | … | … |
| Females | 124 | 24 | 17 | 17 | 22 | 18 | 11 | 7 | 3 | 1 | … | … | … | … | … | … | … | … | 2 | … | … | 1 | 1 | … | … | … | … | … | … | … | … | … | … | |
Table XIV. Table XIV. Showing the Education of Persons, Males, and Females (exclusive of Maoris and Chinese), in each County.—continued
| Counties. | All ages. | Under 5. | 5 and under 10. | 10 and under 15. | 15 and under 21. | 21 and under 40. | 40 and under 60. | 60 and under 80. | 80 and Upward. | Unspecified Children. | Unspecified Adults. | |||||||||||||||||||||||
|---|---|---|---|---|---|---|---|---|---|---|---|---|---|---|---|---|---|---|---|---|---|---|---|---|---|---|---|---|---|---|---|---|---|---|
| Under 1 year. | 1–2. | 2–3. | 3–4. | 4–5. | 5–6. | 6–7. | 7–8. | 8–9. | 9–10. | 10–11. | 11–12. | 12–13. | 13–14. | 14–15. | 15–20. | 20–21. | 21–25. | 25–30. | 30–35. | 35–40. | 40–45. | 45–50. | 50–55. | 55–60. | 60–65. | 65–70. | 50–75. | 75–80. | ||||||
| Education unknown | Males | 10 | … | … | … | … | … | 1 | … | … | … | … | 1 | … | 1 | … | … | 1 | … | 1 | … | 1 | 2 | 1 | … | 1 | … | … | … | … | … | … | … | … |
| Females | 6 | … | … | … | … | … | … | … | 1 | … | … | … | … | … | … | … | 2 | … | … | … | … | 2 | … | … | … | 1 | … | … | … | … | … | … | … | |
| Total | Males | 671 | 27 | 15 | 28 | 18 | 21 | 19 | 14 | 15 | 14 | 16 | 13 | 12 | 23 | 7 | 9 | 42 | 14 | 44 | 74 | 55 | 55 | 51 | 34 | 22 | 12 | 9 | 5 | 2 | … | 1 | … | … |
| Females | 434 | 24 | 17 | 17 | 22 | 21 | 18 | 16 | 13 | 9 | 17 | 10 | 14 | 4 | 10 | 4 | 48 | 10 | 36 | 34 | 29 | 19 | 18 | 8 | 8 | 5 | 1 | … | 1 | … | 1 | … | … | |
| Waimea— | ||||||||||||||||||||||||||||||||||
| Read and Write | Males | 2,754 | … | … | … | … | … | 10 | 14 | 53 | 83 | 77 | 111 | 115 | 102 | 89 | 104 | 376 | 57 | 214 | 216 | 189 | 201 | 169 | 151 | 134 | 72 | 80 | 56 | 37 | 24 | 9 | … | 11 |
| Females | 2,527 | … | … | … | … | … | 4 | 39 | 67 | 75 | 113 | 110 | 106 | 115 | 102 | 85 | 381 | 70 | 201 | 202 | 191 | 148 | 116 | 97 | 93 | 69 | 39 | 40 | 24 | 18 | 14 | 2 | 6 | |
| Read only | Males | 228 | … | … | … | 1 | 2 | 21 | 43 | 37 | 23 | 13 | 5 | 4 | 6 | 1 | 1 | 5 | 2 | 2 | 4 | 2 | 5 | 5 | 12 | 5 | 6 | 6 | 6 | 6 | 4 | 1 | … | … |
| Females | 265 | … | … | … | 3 | 7 | 29 | 14 | 42 | 19 | 11 | 4 | 2 | 4 | … | … | 3 | 1 | … | 3 | 6 | 6 | 11 | 13 | 15 | 12 | 7 | 6 | 9 | 4 | 3 | … | 1 | |
| Cannot Read | Males | 916 | 151 | 120 | 120 | 123 | 137 | 83 | 53 | 15 | 12 | 6 | 3 | 3 | 3 | 4 | 3 | 10 | 4 | 4 | 7 | 6 | 11 | 7 | 4 | 5 | 5 | 7 | 4 | 1 | 2 | 1 | 1 | 1 |
| Females | 806 | 130 | 103 | 122 | 117 | 120 | 81 | 40 | 10 | 12 | 5 | 5 | 3 | 2 | 1 | … | 5 | 1 | 4 | 2 | 5 | 5 | 5 | 5 | 3 | 3 | 3 | 5 | 2 | 3 | 3 | 2 | … | |
| Education unknown | Males | 29 | … | … | … | … | … | … | … | … | 2 | … | 1 | … | 2 | … | … | 2 | … | 4 | 2 | 2 | 2 | 2 | 1 | … | 2 | 3 | 3 | … | 1 | … | … | … |
| Females | 9 | … | … | … | … | … | … | … | … | … | … | 1 | … | … | … | … | 1 | 1 | … | 1 | … | 1 | 2 | … | … | 1 | 1 | … | … | … | … | … | … | |
| Total | Males | 3,927 | 151 | 120 | 120 | 124 | 139 | 114 | 110 | 105 | 120 | 96 | 120 | 122 | 113 | 94 | 108 | 393 | 63 | 224 | 229 | 199 | 219 | 183 | 168 | 144 | 85 | 97 | 69 | 44 | 31 | 11 | … | 12 |
| Females | 3,607 | 130 | 103 | 122 | 120 | 127 | 114 | 123 | 110 | 106 | 129 | 120 | 111 | 121 | 103 | 85 | 390 | 73 | 205 | 208 | 202 | 160 | 134 | 115 | 111 | 85 | 50 | 51 | 35 | 25 | 20 | 6 | 7 | |
| Collingwood— | ||||||||||||||||||||||||||||||||||
| Read and Write | Males | 671 | … | … | … | … | … | 2 | 6 | 9 | 12 | 24 | 18 | 19 | 26 | 10 | 18 | 71 | 10 | 53 | 53 | 49 | 54 | 62 | 53 | 51 | 16 | 16 | 12 | 5 | 4 | 1 | … | 7 |
| Females | 489 | … | … | … | … | … | … | 3 | 12 | 16 | 20 | 16 | 25 | 21 | 17 | 16 | 66 | 19 | 53 | 48 | 39 | 27 | 27 | 21 | 12 | 7 | 14 | 4 | 3 | 1 | … | … | 2 | |
| Read only | Males | 64 | … | … | … | … | 1 | 6 | 11 | 9 | 6 | 8 | 4 | 1 | … | 1 | … | 3 | … | 1 | 1 | … | 1 | 1 | 3 | 2 | 1 | 2 | … | 1 | … | 1 | … | … |
| Females | 52 | … | … | … | … | 4 | 7 | 8 | 11 | 5 | 2 | 4 | 1 | … | 1 | … | 1 | … | … | 1 | … | 1 | 2 | … | 1 | … | … | 1 | 1 | … | 1 | … | … | |
| Cannot Read | Males | 186 | 21 | 23 | 27 | 32 | 32 | 16 | 14 | 3 | 3 | … | 1 | 1 | 1 | … | 1 | 1 | … | … | … | … | 3 | … | 3 | 1 | … | 2 | 1 | … | … | … | … | … |
| Females | 174 | 44 | 22 | 30 | 27 | 15 | 14 | 12 | … | 3 | 2 | … | … | … | 1 | … | … | … | … | … | 1 | 1 | … | … | … | … | 1 | … | … | … | … | … | 1 | |
| Education unknown | Males | 5 | … | … | … | … | … | 1 | … | … | … | … | … | … | … | … | … | … | … | … | 1 | 1 | … | … | … | … | … | 1 | … | 1 | … | … | … | … |
| Females | 2 | … | … | … | … | … | … | … | … | … | … | … | … | … | … | … | … | … | 1 | … | … | … | … | 1 | … | … | … | … | … | … | … | … | … | |
| Total | Males | 926 | 21 | 23 | 27 | 32 | 33 | 25 | 31 | 21 | 21 | 32 | 23 | 21 | 27 | 11 | 19 | 75 | 10 | 54 | 55 | 50 | 68 | 63 | 59 | 54 | 11 | 21 | 13 | 7 | 4 | 2 | … | 7 |
| Females | 717 | 44 | 22 | 30 | 27 | 19 | 21 | 23 | 23 | 24 | 24 | 20 | 26 | 21 | 19 | 16 | 67 | 19 | 54 | 49 | 40 | 29 | 29 | 22 | 13 | 7 | 15 | 5 | 4 | 1 | 1 | … | 3 | |
| Buller— | ||||||||||||||||||||||||||||||||||
| Read and Write | Males | 1,189 | … | … | … | … | 1 | 2 | 3 | 9 | 20 | 22 | 24 | 27 | 25 | 23 | 15 | 75 | 11 | 49 | 80 | 84 | 180 | 219 | 160 | 89 | 32 | 25 | 6 | 2 | 2 | … | … | 4 |
| Females | 552 | … | … | … | … | 1 | 2 | 6 | 18 | 19 | 19 | 18 | 36 | 17 | 22 | 11 | 60 | 12 | 37 | 52 | 46 | 80 | 48 | 21 | 11 | 6 | 6 | 2 | 1 | 1 | … | … | … | |
| Read only | Males | 120 | … | … | … | … | 4 | 7 | 19 | 15 | 11 | 12 | 3 | 5 | 1 | 1 | … | 1 | … | 1 | 4 | 5 | 8 | 11 | 4 | 4 | 4 | … | … | … | … | … | … | … |
| Females | 93 | … | … | … | … | 3 | 15 | 13 | 15 | 9 | 9 | 5 | … | 3 | … | 1 | … | … | 1 | 2 | 6 | 3 | 4 | 4 | 1 | … | … | … | … | … | … | … | … | |
| Cannot Read | Males | 300 | 50 | 33 | 37 | 51 | 40 | 29 | 21 | 6 | 8 | 1 | 1 | … | 1 | … | … | … | … | … | 1 | 1 | 5 | 4 | 4 | 2 | 1 | 3 | … | … | 1 | … | … | … |
| Females | 281 | 45 | 45 | 45 | 41 | 33 | 29 | 23 | 6 | 2 | 3 | 2 | … | 1 | … | … | … | … | … | 1 | 4 | … | 1 | 2 | 2 | … | … | … | … | … | … | … | … | |
| Education unknown | Males | 6 | … | … | … | … | … | … | … | … | … | … | … | … | … | … | … | … | … | 1 | … | 4 | … | … | … | 1 | … | … | … | … | … | … | … | … |
| Females | 1 | … | … | … | … | … | … | … | … | … | … | … | … | … | … | … | … | … | … | … | … | … | … | … | 1 | … | … | … | … | … | … | … | … | |
| Total | Males | 1,615 | 50 | 33 | 37 | 51 | 45 | 38 | 43 | 30 | 39 | 35 | 28 | 32 | 27 | 24 | 15 | 76 | 11 | 51 | 85 | 94 | 193 | 234 | 168 | 96 | 37 | 28 | 6 | 2 | 3 | … | … | 4 |
| Females | 927 | 41 | 45 | 45 | 41 | 37 | 46 | 42 | 39 | 30 | 31 | 25 | 36 | 21 | 22 | 12 | 60 | 12 | 38 | 53 | 56 | 83 | 53 | 27 | 15 | 6 | 6 | 2 | 1 | 1 | … | … | … | |
| Inangahua— | ||||||||||||||||||||||||||||||||||
| Read and Write | Males | 1,327 | … | … | … | … | … | 1 | 9 | 16 | 25 | 21 | 26 | 23 | 14 | 22 | 15 | 50 | 17 | 49 | 119 | 110 | 228 | 267 | 173 | 90 | 27 | 15 | 4 | 2 | 2 | … | … | 2 |
| Females | 570 | … | … | … | … | … | … | 14 | 14 | 20 | 11 | 20 | 15 | 15 | 21 | 15 | 59 | 12 | 50 | 86 | 71 | 64 | 40 | 25 | 9 | 4 | … | 3 | 1 | … | 1 | … | … | |
| Read only | Males | 75 | … | … | … | … | 3 | 8 | 13 | 11 | 7 | 3 | 3 | … | … | … | … | 2 | 2 | 3 | 2 | 3 | 2 | 3 | 5 | 2 | 2 | 1 | … | … | … | … | … | … |
| Females | 67 | … | … | … | 1 | 4 | 7 | 19 | 7 | 6 | 5 | 1 | 2 | … | … | … | … | … | … | 2 | 5 | 3 | 2 | … | 1 | 2 | … | … | … | … | … | … | … | |
| Cannot Read | Males | 283 | 38 | 40 | 40 | 52 | 33 | 30 | 9 | 5 | 2 | 2 | … | 1 | 1 | 1 | … | 1 | 1 | 1 | 1 | 2 | 5 | 9 | 3 | 4 | 2 | … | … | … | … | … | … | … |
| Females | 275 | 44 | 39 | 52 | 44 | 35 | 30 | 12 | 6 | 1 | 1 | 1 | … | … | … | … | … | … | … | 1 | 3 | 1 | 4 | 1 | 2 | 1 | … | … | … | … | … | … | … | |
Table XIV. Table XIV. Showing the Education of Persons, Males, and Females (exclusive of Maoris and Chinese), in each County.—continued
| Counties. | All ages. | Under 5. | 5 and under 10. | 10 and under 15. | 15 and under 21. | 21 and under 40. | 40 and under 60. | 60 and under 80. | 80 and Upward. | Unspecified Children. | Unspecified Adults. | |||||||||||||||||||||||
|---|---|---|---|---|---|---|---|---|---|---|---|---|---|---|---|---|---|---|---|---|---|---|---|---|---|---|---|---|---|---|---|---|---|---|
| Under 1 year. | 1–2. | 2–3. | 3–4. | 4–5. | 5–6. | 6–7. | 7–8. | 8–9. | 9–10. | 10–11. | 11–12. | 12–13. | 13–14. | 14–15. | 15–20. | 20–21. | 21–25. | 25–30. | 30–35. | 35–40. | 40–45. | 45–50. | 50–55. | 55–60. | 60–65. | 65–70. | 50–75. | 75–80. | ||||||
| Inangahua— continued | ||||||||||||||||||||||||||||||||||
| Education unknown | Males | … | … | … | … | … | … | … | … | … | … | … | … | … | … | … | … | … | … | … | … | … | … | … | … | … | … | … | … | … | … | … | … | … |
| Females | … | … | … | … | … | … | … | … | … | … | … | … | … | … | … | … | … | … | … | … | … | … | … | … | … | … | … | … | … | … | … | … | … | |
| Total | Males | 1,685 | 38 | 40 | 40 | 52 | 36 | 39 | 31 | 32 | 34 | 26 | 29 | 24 | 15 | 23 | 15 | 53 | 20 | 53 | 122 | 115 | 235 | 279 | 81 | 96 | 31 | 16 | 4 | 2 | 2 | … | … | 2 |
| Females | 912 | 44 | 39 | 52 | 42 | 39 | 37 | 45 | 27 | 27 | 17 | 22 | 17 | 15 | 21 | 15 | 59 | 12 | 50 | 89 | 79 | 68 | 46 | 26 | 12 | 7 | … | 3 | 1 | … | 1 | … | … | |
| Grey— | ||||||||||||||||||||||||||||||||||
| Read and Write | Males | 2,294 | … | … | … | … | … | 7 | 11 | 25 | 31 | 42 | 30 | 45 | 36 | 29 | 17 | 92 | 26 | 98 | 148 | 191 | 380 | 449 | 327 | 174 | 66 | 42 | 15 | 5 | … | 3 | … | 5 |
| Females | 958 | … | … | … | … | … | 4 | 17 | 28 | 34 | 48 | 45 | 37 | 25 | 30 | 27 | 88 | 21 | 77 | 97 | 117 | 115 | 71 | 41 | 17 | 8 | 6 | 1 | 2 | 2 | … | … | … | |
| Read only | Males | 155 | … | … | … | … | 10 | 18 | 18 | 17 | 11 | 4 | 3 | 2 | 3 | … | … | … | … | 4 | 5 | 1 | 14 | 20 | 8 | 7 | 5 | 3 | 2 | … | … | … | … | … |
| Females | 123 | … | … | … | … | 7 | 11 | 24 | 28 | 9 | 1 | 4 | 1 | 1 | … | … | … | … | 4 | 6 | 5 | 9 | 7 | 3 | 2 | … | 1 | … | … | … | … | … | … | |
| Cannot Read | Males | 472 | 75 | 52 | 72 | 59 | 51 | 42 | 26 | 8 | 7 | 4 | 2 | 2 | 1 | 1 | … | … | … | … | 3 | 3 | 10 | 15 | 18 | 7 | 7 | 4 | 2 | … | … | … | … | 1 |
| Females | 448 | 72 | 55 | 84 | 68 | 51 | 50 | 22 | 18 | 5 | 3 | … | … | … | … | … | … | … | 2 | 3 | 2 | 3 | 2 | 5 | 2 | 1 | … | … | … | … | … | … | … | |
| Education unknown | Males | 36 | … | … | … | … | … | … | … | … | … | … | … | … | … | … | … | … | … | 1 | 4 | 9 | 3 | 3 | 8 | 5 | 3 | … | … | … | … | … | … | … |
| Females | 5 | … | … | … | … | … | … | … | … | … | … | … | … | … | … | … | … | 1 | 1 | 2 | … | … | … | … | … | 1 | … | … | … | … | … | … | … | |
| Total | Males | 2,957 | 75 | 52 | 72 | 59 | 61 | 67 | 55 | 50 | 49 | 50 | 35 | 49 | 5 | 30 | 17 | 92 | 26 | 103 | 160 | 204 | 407 | 487 | 361 | 193 | 81 | 49 | 19 | 5 | … | 3 | … | 6 |
| Females | 1,534 | 72 | 55 | 84 | 68 | 58 | 64 | 63 | 74 | 48 | 52 | 49 | 38 | 26 | 30 | 27 | 88 | 22 | 84 | 108 | 124 | 127 | 80 | 49 | 21 | 10 | 7 | 1 | 2 | 2 | … | … | … | |
| Westland— | ||||||||||||||||||||||||||||||||||
| Read and Write | Males | 2,547 | … | … | … | … | … | 9 | 19 | 41 | 47 | 57 | 56 | 40 | 52 | 28 | 29 | 108 | 20 | 93 | 134 | 153 | 386 | 495 | 385 | 222 | 93 | 43 | 20 | 5 | 3 | 1 | … | 8 |
| Females | 1,143 | … | … | … | … | … | 5 | 23 | 44 | 61 | 45 | 75 | 50 | 53 | 45 | 37 | 85 | 27 | 53 | 97 | 112 | 125 | 95 | 61 | 31 | 6 | 5 | 2 | 4 | … | … | 1 | 1 | |
| Read only | Males | 148 | … | … | … | 2 | 4 | 25 | 21 | 18 | 11 | 3 | 1 | … | … | … | 1 | 1 | 1 | … | 2 | 3 | 9 | 18 | 14 | 6 | 5 | 3 | … | … | … | … | … | … |
| Females | 140 | … | … | … | 1 | 7 | 16 | 53 | 18 | 14 | 3 | 5 | … | … | … | … | 1 | … | 2 | 1 | 8 | 3 | 13 | 7 | 5 | 1 | … | … | 1 | … | … | … | 1 | |
| Cannot Read | Males | 557 | 75 | 64 | 69 | 76 | 70 | 47 | 22 | 12 | 2 | … | 2 | 1 | … | 1 | … | … | … | 2 | 10 | 16 | 14 | 26 | 17 | 14 | 5 | 6 | 4 | … | … | 1 | … | 1 |
| Females | 475 | 74 | 58 | 71 | 78 | 69 | 43 | 26 | 8 | 4 | 2 | 1 | … | … | 1 | … | 1 | … | 2 | 5 | 9 | 6 | 8 | 5 | 2 | 1 | 1 | … | … | … | … | … | … | |
| Education unknown | Males | 25 | … | … | … | … | … | 1 | 1 | 3 | … | … | … | … | … | … | … | 3 | … | 1 | 1 | 1 | 2 | 5 | 2 | 2 | … | 1 | … | … | … | … | 1 | 1 |
| Females | 12 | … | … | … | … | … | … | … | … | 1 | 1 | 1 | … | … | … | … | 3 | … | … | 1 | … | 2 | … | 1 | 1 | … | 1 | … | … | … | … | … | … | |
| Total | Males | 3,277 | 75 | 64 | 69 | 78 | 74 | 82 | 63 | 74 | 60 | 60 | 59 | 41 | 52 | 29 | 30 | 112 | 21 | 96 | 147 | 173 | 411 | 544 | 418 | 244 | 103 | 53 | 24 | 5 | 3 | 2 | 1 | 10 |
| Females | 1,770 | 74 | 58 | 71 | 79 | 76 | 64 | 82 | 70 | 80 | 51 | 82 | 50 | 53 | 46 | 37 | 90 | 27 | 57 | 104 | 129 | 136 | 116 | 74 | 39 | 8 | 7 | 2 | 5 | … | … | 1 | 2 | |
| Amuri— | ||||||||||||||||||||||||||||||||||
| Read and Write | Males | 304 | … | … | … | … | … | … | 3 | 1 | 3 | 1 | 1 | 2 | … | 3 | 1 | 28 | 14 | 43 | 44 | 29 | 54 | 29 | 25 | 10 | 6 | 5 | 1 | 1 | … | … | … | … |
| Females | 89 | … | … | … | … | … | … | … | 3 | 2 | 2 | 4 | 2 | 3 | 2 | 1 | 11 | 3 | 13 | 14 | 11 | 10 | 5 | … | … | 1 | 1 | 1 | … | … | … | … | … | |
| Read only | Males | 20 | … | … | … | … | 1 | 2 | 1 | 1 | 4 | … | … | … | … | 1 | 1 | … | … | … | 1 | 3 | 1 | 2 | … | 1 | 1 | … | … | … | … | … | … | … |
| Females | 4 | … | … | … | 1 | … | … | 1 | … | … | … | … | … | … | … | … | … | … | … | … | … | 1 | 1 | … | … | … | … | … | … | … | … | … | … | |
| Cannot Read | Males | 53 | 8 | 6 | 8 | 9 | 4 | 4 | 2 | 3 | … | … | … | 1 | … | … | … | … | … | … | 1 | 2 | 1 | 3 | 1 | … | … | … | … | … | … | … | … | … |
| Females | 39 | 6 | 7 | 5 | 4 | 8 | 3 | … | … | … | 1 | 1 | 1 | … | … | … | … | 1 | 1 | … | 1 | … | … | … | … | … | … | … | … | … | … | … | … | |
Table XIV. Showing the Education of Persons, Males, and Females (exclusive of Maoris and Chinese), in each County.—continued
| Counties. | All ages. | Under 5. | 5 and under 10. | 10 and under 15. | 15 and under 21. | 21 and under 40. | 40 and under 60. | 60 and under 80. | 80 and Upward. | Unspecified Children. | Unspecified Adults. | |||||||||||||||||||||||
|---|---|---|---|---|---|---|---|---|---|---|---|---|---|---|---|---|---|---|---|---|---|---|---|---|---|---|---|---|---|---|---|---|---|---|
| Under 1 year. | 1–2. | 2–3. | 3–4. | 4–5. | 5–6. | 6–7. | 7–8. | 8–9. | 9–10. | 10–11. | 11–12. | 12–13. | 13–14. | 14–15. | 15–20. | 20–21. | 21–25. | 25–30. | 30–35. | 35–40. | 40–45. | 45–50. | 50–55. | 55–60. | 60–65. | 65–70. | 50–75. | 75–80. | ||||||
| Education unknown | Males | 1 | … | … | … | … | … | … | … | … | 1 | … | … | … | … | … | … | … | … | … | … | … | … | … | … | … | … | … | … | … | … | … | … | … |
| Females | 3 | … | … | … | … | … | … | 1 | 1 | … | … | … | … | … | … | … | … | … | 1 | … | … | … | … | … | … | … | … | … | … | … | … | … | … | |
| Total | Males | 378 | 8 | 6 | 8 | 9 | 5 | 6 | 6 | 5 | 8 | 1 | 1 | 3 | … | 4 | 2 | 28 | 14 | 43 | 46 | 34 | 56 | 34 | 26 | 11 | 7 | 5 | 1 | 1 | … | … | … | … |
| Females | 135 | 6 | 7 | 5 | 4 | 8 | 3 | 2 | 4 | 2 | 3 | 5 | 3 | 3 | 2 | 1 | 11 | 4 | 15 | 14 | 12 | 11 | 6 | … | … | 1 | 1 | 1 | … | … | … | … | … | |
| Cheviot— | ||||||||||||||||||||||||||||||||||
| Read and Write | Males | 61 | … | … | … | … | … | … | … | … | … | … | … | … | … | … | … | 5 | … | 13 | 6 | 8 | 10 | 6 | 5 | 3 | 2 | 1 | 2 | … | … | … | … | … |
| Females | 19 | … | … | … | … | … | … | … | … | … | … | … | … | … | … | … | … | 1 | 6 | 4 | 4 | 2 | … | 1 | … | … | 1 | … | … | … | … | … | … | |
| Read only | Males | 3 | … | … | … | … | … | … | … | … | … | … | … | … | … | … | … | … | … | … | 1 | … | 1 | … | … | 1 | … | … | … | … | … | … | … | … |
| Females | 2 | … | … | … | … | … | … | … | 1 | … | … | … | … | … | … | … | … | … | … | … | … | … | … | 1 | … | … | … | … | … | … | … | … | … | |
| Cannot Read | Males | 5 | 1 | 1 | 1 | … | 1 | 1 | … | … | … | … | … | … | … | … | … | … | … | … | … | … | … | … | … | … | … | … | … | … | … | … | … | … |
| Females | 6 | 1 | … | 1 | 2 | 1 | 1 | … | … | … | … | … | … | … | … | … | … | … | … | … | … | … | … | … | … | … | … | … | … | … | … | … | … | |
| Education unknown | Males | 6 | … | … | … | … | … | … | … | … | … | … | … | … | … | … | … | … | … | … | … | … | … | … | … | … | … | … | … | … | … | … | … | 6 |
| Females | … | … | … | … | … | … | … | … | … | … | … | … | … | … | … | … | … | … | … | … | … | … | … | … | … | … | … | … | … | … | … | … | … | |
| Total | Males | 75 | 1 | 1 | 1 | … | 1 | 1 | … | … | … | … | … | … | … | … | … | 5 | … | 13 | 7 | 8 | 11 | 6 | 5 | 4 | 2 | 1 | 2 | … | … | … | … | 6 |
| Females | 27 | 1 | … | 1 | 2 | 1 | 1 | … | 1 | … | … | … | … | … | … | … | … | 1 | 6 | 4 | 4 | 2 | … | 2 | … | … | 1 | … | … | … | … | … | … | |
| Ashley— | ||||||||||||||||||||||||||||||||||
| Read and Write | Males | 4,659 | … | … | … | … | … | 13 | 53 | 108 | 133 | 150 | 159 | 161 | 160 | 149 | 147 | 552 | 114 | 394 | 453 | 348 | 359 | 435 | 302 | 170 | 105 | 83 | 19 | 23 | 10 | 8 | … | 15 |
| Females | 3,646 | … | … | … | … | … | 17 | 46 | 94 | 115 | 150 | 182 | 143 | 178 | 142 | 129 | 505 | 97 | 315 | 305 | 259 | 274 | 257 | 167 | 113 | 58 | 43 | 11 | 15 | 4 | 1 | 1 | 5 | |
| Read only | Males | 385 | … | … | … | 2 | 19 | 35 | 70 | 63 | 33 | 10 | 14 | 3 | 2 | 4 | 3 | 13 | 2 | 12 | 18 | 18 | 13 | 12 | 16 | 5 | 8 | 7 | … | 2 | … | 1 | … | … |
| Females | 370 | … | … | … | … | 9 | 36 | 52 | 42 | 39 | 15 | 6 | 6 | 1 | 4 | 1 | 11 | 1 | 6 | 9 | 13 | 24 | 26 | 25 | 11 | 10 | 6 | 7 | 2 | 1 | 3 | … | … | |
| Cannot Read | Males | 1,488 | 190 | 221 | 216 | 203 | 180 | 160 | 99 | 44 | 11 | 9 | 3 | 1 | … | 1 | 2 | 11 | 5 | 6 | 15 | 14 | 25 | 18 | 13 | 18 | 10 | 4 | 4 | 3 | … | 1 | … | 1 |
| Females | 1,377 | 206 | 197 | 199 | 223 | 189 | 129 | 84 | 31 | 13 | 5 | 5 | 1 | 2 | 2 | 2 | 3 | 1 | 8 | 8 | 11 | 22 | 7 | 7 | 10 | 3 | 5 | 3 | … | … | … | … | 1 | |
| Education unknown | Males | 11 | … | … | … | … | … | … | … | … | … | … | 2 | … | … | … | … | 3 | 1 | … | … | 1 | … | 2 | … | 1 | 1 | … | … | … | … | … | … | … |
| Females | 15 | … | … | … | … | … | … | 1 | 3 | 3 | 1 | … | … | 1 | … | 1 | … | … | … | … | 2 | 2 | … | 1 | … | … | … | … | … | … | … | … | … | |
| Total | Males | 6,543 | 190 | 221 | 216 | 205 | 199 | 208 | 222 | 215 | 177 | 169 | 178 | 165 | 162 | 154 | 152 | 579 | 122 | 412 | 486 | 381 | 397 | 467 | 331 | 200 | 124 | 94 | 53 | 28 | 10 | 10 | … | 16 |
| Females | 5,4o8 | 206 | 197 | 199 | 223 | 198 | 182 | 183 | 170 | 170 | 171 | 195 | 152 | 182 | 148 | 133 | 519 | 99 | 329 | 322 | 285 | 322 | 290 | 200 | 134 | 71 | 54 | 41 | 17 | 5 | 4 | 1 | 6 | |
| Akaroa— | ||||||||||||||||||||||||||||||||||
| Read and Write | Males | 1,310 | … | … | … | … | … | 3 | 6 | 25 | 33 | 42 | 53 | 45 | 55 | 50 | 61 | 179 | 06 | 157 | 169 | 125 | 116 | 130 | 79 | 54 | 39 | 27 | 11 | 8 | 4 | 1 | … | 2 |
| Females | 1,136 | … | … | … | … | … | … | 13 | 21 | 32 | 47 | 54 | 47 | 48 | 49 | 54 | 174 | 27 | 120 | 112 | 83 | 85 | 58 | 44 | 25 | 15 | 17 | 5 | 3 | 1 | 2 | … | … | |
| Read only | Males | 146 | … | … | … | … | 1 | 21 | 23 | 21 | 18 | 6 | 8 | … | 1 | … | 1 | 8 | 1 | 2 | 6 | 1 | 8 | 2 | 6 | 2 | 2 | 3 | 4 | … | 1 | … | … | … |
| Females | 143 | … | … | … | … | 5 | 12 | 20 | 18 | 10 | 7 | 3 | 2 | … | 1 | 1 | 4 | … | 3 | 6 | 9 | 9 | 9 | 11 | 6 | 1 | 1 | 3 | 1 | 1 | … | … | … | |
| Cannot Read | Males | 559 | 92 | 66 | 77 | 68 | 74 | 64 | 28 | 18 | 6 | 3 | 1 | 2 | 2 | 1 | … | 2 | 1 | 5 | 6 | 5 | 9 | 9 | 10 | 2 | 4 | 3 | … | … | … | 1 | … | … |
| Females | 198 | 90 | 53 | 66 | 85 | 62 | 45 | 27 | 17 | 4 | 3 | … | 1 | 1 | … | 1 | 5 | 2 | 4 | 5 | 7 | 8 | 4 | 5 | 1 | … | 1 | 1 | … | … | … | … | … | |
| Education unknown | Males | 25 | … | … | … | … | … | … | … | … | … | … | … | … | … | … | 1 | 1 | 1 | 2 | 4 | 4 | 7 | 2 | 2 | 1 | … | … | … | … | … | … | … | … |
| Females | 3 | … | … | … | … | … | … | … | … | 1 | 1 | … | … | … | … | … | … | … | … | … | … | 1 | … | … | … | … | … | … | … | … | … | … | … | |
| Total | Males | 2,240 | 92 | 66 | 77 | 68 | 75 | 88 | 57 | 64 | 57 | 51 | 62 | 47 | 58 | 51 | 63 | 190 | 39 | 166 | 185 | 135 | 140 | 143 | 97 | 59 | 45 | 33 | 15 | 8 | 5 | 2 | … | 2 |
| Females | 1,780 | 90 | 53 | 66 | 85 | 67 | 57 | 60 | 56 | 47 | 58 | 57 | 50 | 49 | 50 | 56 | 183 | 29 | 127 | 123 | 99 | 103 | 71 | 60 | 32 | 16 | 19 | 9 | 4 | 2 | 2 | … | … | |
| Selwyn— | ||||||||||||||||||||||||||||||||||
| Read and Write | Males | 12,687 | … | … | … | … | … | 39 | 131 | 240 | 325 | 420 | 430 | 424 | 418 | 398 | 397 | 1,505 | 282 | 1,111 | 1,397 | 1,122 | 1,017 | 115 | 721 | 495 | 261 | 205 | 109 | 64 | 36 | 14 | … | 11 |
| Females | 11,008 | … | … | … | … | … | 54 | 118 | 263 | 348 | 366 | 431 | 395 | 436 | 405 | 351 | 1,546 | 277 | 1,015 | 1,141 | 946 | 831 | 754 | 512 | 323 | 186 | 151 | 75 | 48 | 21 | 8 | … | 7 | |
| Read only | Males | 991 | … | … | … | 2 | 34 | 96 | 173 | 162 | 107 | 39 | 36 | 9 | 13 | 8 | 9 | 24 | 6 | 13 | 35 | 38 | 31 | 59 | 35 | 20 | 13 | 11 | 10 | 5 | 1 | … | … | 2 |
| Females | 990 | … | … | … | 3 | 34 | 102 | 169 | 145 | 813 | 43 | 17 | 8 | 9 | 4 | 3 | 18 | 4 | 24 | 43 | 45 | 50 | 51 | 36 | 35 | 26 | 21 | 9 | 6 | 1 | 1 | … | … | |
| Cannot read | Males | 4,348 | 723 | 570 | 651 | 604 | 574 | 434 | 229 | 73 | 41 | 24 | 19 | 11 | 9 | 6 | 7 | 35 | 8 | 29 | 43 | 51 | 49 | 50 | 39 | 22 | 15 | 19 | 7 | 2 | 2 | 2 | … | … |
| Females | 4,138 | 648 | 556 | 634 | 593 | 602 | 395 | 238 | 91 | 44 | 19 | 17 | 8 | 4 | 2 | 7 | 21 | 9 | 19 | 35 | 39 | 45 | 36 | 25 | 19 | 11 | 12 | 6 | 3 | … | … | … | … | |
Table XIV. Table XIV. Showing the Education of Persons, Males, and Females (exclusive of Maoris and Chinese), in each County.—continued
| Counties. | All ages. | Under 5. | 5 and under 10. | 10 and under 15. | 15 and under 21. | 21 and under 40. | 40 and under 60. | 60 and under 80. | 80 and Upward. | Unspecified Children. | Unspecified Adults. | |||||||||||||||||||||||
|---|---|---|---|---|---|---|---|---|---|---|---|---|---|---|---|---|---|---|---|---|---|---|---|---|---|---|---|---|---|---|---|---|---|---|
| Under 1 year. | 1–2. | 2–3. | 3–4. | 4–5. | 5–6. | 6–7. | 7–8. | 8–9. | 9–10. | 10–11. | 11–12. | 12–13. | 13–14. | 14–15. | 15–20. | 20–21. | 21–25. | 25–30. | 30–35. | 35–40. | 40–45. | 45–50. | 50–55. | 55–60. | 60–65. | 65–70. | 50–75. | 75–80. | ||||||
| Selwyn— continued | ||||||||||||||||||||||||||||||||||
| Education unknown | Males | 72 | … | … | … | … | … | … | 3 | 3 | 2 | 3 | 2 | 2 | … | 3 | 1 | 4 | 1 | 2 | 1 | 2 | 11 | 6 | 4 | 1 | 1 | 1 | … | … | … | … | … | 19 |
| Females | 39 | … | … | … | … | … | 2 | … | 3 | 2 | 1 | … | 3 | 1 | 1 | … | 4 | 1 | 1 | 3 | 4 | 7 | 4 | … | 1 | 1 | … | … | … | … | … | … | … | |
| Total | Males | 18,098 | 723 | 570 | 651 | 606 | 608 | 569 | 536 | 478 | 475 | 487 | 487 | 446 | 440 | 415 | 414 | 1,568 | 297 | 1,155 | 1,476 | 1,213 | 1,108 | 1,230 | 799 | 538 | 290 | 236 | 126 | 71 | 39 | 16 | … | 32 |
| Females | 16,175 | 648 | 556 | 634 | 596 | 536 | 553 | 525 | 502 | 477 | 429 | 463 | 414 | 450 | 412 | 361 | 1,589 | 291 | 1,059 | 1,222 | 1,034 | 933 | 845 | 573 | 378 | 224 | 184 | 90 | 57 | 22 | 9 | … | 7 | |
| Ashburton— | ||||||||||||||||||||||||||||||||||
| Head and Write | Males | 3,235 | … | … | … | … | … | 10 | 24 | 36 | 50 | 53 | 67 | 71 | 64 | 64 | 66 | 259 | 86 | 436 | 525 | 422 | 359 | 303 | 147 | 103 | 30 | 32 | 12 | 5 | 1 | … | … | 10 |
| Females | 1,690 | … | … | … | … | … | 4 | 17 | 37 | 51 | 71 | 68 | 57 | 65 | 60 | 43 | 197 | 43 | 179 | 231 | 174 | 162 | 87 | 68 | 32 | 20 | 8 | 5 | 3 | 2 | … | … | 6 | |
| Read only | Males | 221 | … | … | … | 1 | 7 | 16 | 37 | 30 | 19 | 14 | 9 | 6 | 3 | 2 | 1 | 7 | … | 6 | 11 | 9 | 8 | 16 | 9 | 2 | 2 | 3 | 2 | … | 1 | … | … | … |
| Females | 199 | … | … | … | 1 | 8 | 11 | 24 | 27 | 21 | 16 | 2 | 8 | 4 | 1 | 1 | 2 | … | 1 | 9 | 16 | 11 | 15 | 9 | 7 | … | 3 | 2 | … | … | … | … | … | |
| Cannot Read | Males | 919 | 141 | 111 | 139 | 123 | 115 | 100 | 59 | 22 | 17 | 5 | 2 | 4 | 1 | … | 1 | 2 | 1 | 7 | 16 | 9 | 17 | 9 | 4 | 10 | 2 | … | … | … | … | 1 | 1 | … |
| Females | 877 | 142 | 134 | 128 | 137 | 107 | 81 | 53 | 24 | 8 | 7 | 2 | 3 | 1 | … | … | 2 | 2 | 2 | 10 | 8 | 5 | 9 | 5 | 3 | 1 | 1 | 1 | … | 1 | … | … | … | |
| Education unknown | Males | 15 | … | … | … | … | … | … | … | … | … | … | 1 | … | … | … | … | … | … | 1 | … | … | … | 1 | … | … | … | … | … | … | … | … | … | 12 |
| Females | 2 | … | … | … | … | … | … | … | 1 | … | … | … | … | 1 | … | … | … | … | … | … | … | … | … | … | … | … | … | … | … | … | … | … | … | |
| Total | Males | 4,390 | 141 | 111 | 139 | 124 | 122 | 126 | 120 | 88 | 86 | 72 | 79 | 81 | 68 | 66 | 68 | 267 | 88 | 450 | 552 | 440 | 384 | 329 | 160 | 115 | 34 | 35 | 14 | 5 | 2 | 1 | 1 | 22 |
| Females | 2,768 | 142 | 134 | 128 | 138 | 115 | 96 | 94 | 89 | 80 | 94 | 72 | 68 | 71 | 61 | 44 | 201 | 45 | 182 | 250 | 198 | 178 | 111 | 82 | 42 | 21 | 12 | 8 | 3 | 3 | … | … | 6 | |
| Geraldine— | ||||||||||||||||||||||||||||||||||
| Read and Write | Males | 4,819 | … | … | … | … | … | 13 | 39 | 73 | 100 | 124 | 132 | 148 | 124 | 118 | 120 | 465 | 101 | 473 | 695 | 534 | 504 | 439 | 277 | 155 | 67 | 50 | 33 | 12 | 3 | 3 | … | 19 |
| Females | 3,613 | … | … | … | … | … | 17 | 45 | 81 | 99 | 119 | 129 | 142 | 129 | 135 | 123 | 444 | 116 | 382 | 419 | 377 | 300 | 221 | 136 | 72 | 44 | 34 | 22 | 11 | 4 | 2 | … | 10 | |
| Read only | Males | 369 | … | … | … | 2 | 12 | 37 | 69 | 49 | 31 | 32 | 12 | 4 | 5 | 3 | 2 | 6 | … | 10 | 22 | 10 | 13 | 17 | 11 | 4 | 9 | 2 | 5 | … | 1 | … | … | 1 |
| Females | 417 | … | … | … | 3 | 17 | 44 | 68 | 56 | 37 | 23 | 13 | 5 | 5 | 3 | 2 | 11 | 7 | 7 | 15 | 18 | 32 | 20 | 12 | 7 | 5 | 2 | 3 | … | 2 | … | … | … | |
| Cannot Read | Males | 1,728 | 260 | 236 | 267 | 245 | 215 | 154 | 98 | 43 | 21 | 10 | 6 | 3 | 3 | … | 1 | 8 | 1 | 10 | 25 | 14 | 25 | 33 | 18 | 8 | 4 | 5 | 4 | 3 | … | 1 | 3 | 1 |
| Females | 1,635 | 262 | 231 | 256 | 230 | 226 | 157 | 72 | 37 | 24 | 8 | 3 | 5 | 1 | 4 | … | 1 | 4 | 12 | 20 | 15 | 20 | 12 | 12 | 7 | 3 | 2 | 2 | 2 | … | 1 | 2 | … | |
| Education unknown | Males | 104 | … | … | … | … | … | … | … | … | … | 2 | … | 1 | 1 | … | 1 | 10 | 2 | 10 | 12 | 15 | 9 | 4 | 3 | 1 | 1 | … | … | … | … | … | … | 32 |
| Females | 23 | … | … | … | … | … | … | 1 | 2 | … | 1 | 1 | 1 | 1 | … | 1 | 3 | … | 1 | 1 | 3 | … | 2 | 1 | … | … | … | 1 | … | … | … | … | 3 | |
| Total | Males | 7,020 | 260 | 236 | 267 | 247 | 227 | 207 | 206 | 165 | 152 | 168 | 150 | 156 | 133 | 121 | 124 | 489 | 104 | 503 | 752 | 573 | 551 | 493 | 309 | 168 | 81 | 57 | 42 | 15 | 4 | 4 | 3 | 53 |
| Females | 5,688 | 262 | 231 | 256 | 233 | 243 | 218 | 186 | 176 | 160 | 151 | 146 | 153 | 136 | 142 | 126 | 459 | 127 | 402 | 455 | 417 | 352 | 255 | 161 | 86 | 52 | 38 | 28 | 13 | 6 | 3 | 2 | 13 | |
| Waimate— | ||||||||||||||||||||||||||||||||||
| Read and Write | Males | 1,560 | … | … | … | … | … | 5 | 11 | 22 | 19 | 25 | 29 | 28 | 31 | 19 | 25 | 128 | 25 | 205 | 269 | 194 | 159 | 157 | 96 | 55 | 27 | 16 | 6 | 4 | 2 | … | … | 3 |
| Females | 782 | … | … | … | … | … | 2 | 8 | 14 | 28 | 20 | 33 | 20 | 38 | 32 | 25 | 90 | 27 | 78 | 91 | 80 | 63 | 70 | 21 | 21 | 6 | 6 | 3 | 3 | … | 3 | … | … | |
| Read only | Males | 105 | … | … | … | 1 | 2 | 8 | 13 | 10 | 11 | 9 | 5 | 2 | 3 | 3 | … | 6 | … | 2 | 5 | 5 | 5 | 3 | 6 | 2 | 3 | 1 | … | … | … | … | … | … |
| Females | 125 | … | … | … | … | 3 | 11 | 17 | 19 | 12 | 8 | 4 | … | 3 | 2 | … | 2 | 2 | 5 | 10 | 8 | 5 | 4 | 5 | … | 1 | 2 | 1 | 1 | … | … | … | … | |
| Cannot Read | Males | 439 | 67 | 56 | 72 | 69 | 53 | 35 | 12 | 11 | … | 2 | 3 | 1 | … | … | 2 | 3 | 1 | 8 | 13 | 6 | 7 | 9 | … | 3 | 4 | … | 1 | … | 1 | … | … | … |
| Females | 411 | 79 | 47 | 62 | 61 | 43 | 33 | 22 | 9 | 5 | 3 | … | … | … | … | 1 | 4 | 1 | 8 | 7 | 11 | 6 | 5 | 2 | 1 | 1 | … | … | … | … | … | … | … | |
Table XIV. Table XIV. Showing the Education of Persons, Males, and Females (exclusive of Maoris and Chinese), in each County.—continued
| Counties. | All ages. | Under 5. | 5 and under 10. | 10 and under 15. | 15 and under 21. | 21 and under 40. | 40 and under 60. | 60 and under 80. | 80 and Upward. | Unspecified Children. | Unspecified Adults. | |||||||||||||||||||||||
|---|---|---|---|---|---|---|---|---|---|---|---|---|---|---|---|---|---|---|---|---|---|---|---|---|---|---|---|---|---|---|---|---|---|---|
| Under 1 year. | 1–3. | 3–3. | 3–4. | 4–5. | 5–6. | 6–7. | 7–8. | 8–9. | 9–10. | 10–11. | 11–12. | 12–13. | 13–14. | 14–15. | 15–20. | 20–21. | 21–25. | 25–30. | 30–35. | 35–40. | 40–45. | 45–50. | 50–55. | 55–60. | 60–65. | 65–70. | 50–75. | 75–80. | ||||||
| Education unknown | Males | 4 | … | … | … | … | … | … | … | … | … | … | … | … | … | … | … | … | … | … | 1 | … | 2 | … | 1 | … | … | … | … | … | … | … | … | … |
| Females | 2 | … | … | … | … | … | … | … | … | … | … | … | … | … | … | … | 1 | … | … | … | … | … | … | … | … | … | … | … | 1 | … | … | … | … | |
| Total | Males | 2,108 | 67 | 56 | 72 | 70 | 55 | 48 | 36 | 43 | 30 | 36 | 37 | 31 | 34 | 22 | 27 | 137 | 26 | 215 | 288 | 205 | 173 | 169 | 103 | 67 | 34 | 17 | 7 | 4 | 3 | … | … | 3 |
| Females | 1,320 | 79 | 47 | 62 | 61 | 46 | 46 | 47 | 42 | 45 | 31 | 37 | 20 | 41 | 34 | 26 | 97 | 30 | 91 | 108 | 99 | 74 | 79 | 28 | 22 | 8 | 8 | 4 | 5 | … | 3 | … | … | |
| Waitaki— | ||||||||||||||||||||||||||||||||||
| Read and Write | Males | 3,048 | … | … | … | … | … | 6 | 19 | 23 | 49 | 67 | 69 | 70 | 74 | 72 | 60 | 294 | 62 | 313 | 427 | 366 | 305 | 322 | 188 | 130 | 48 | 35 | 29 | 11 | 6 | … | … | 3 |
| Females | 1,800 | … | … | … | … | … | 8 | 8 | 40 | 53 | 64 | 79 | 65 | 62 | 55 | 51 | 251 | 45 | 179 | 210 | 178 | 162 | 117 | 69 | 32 | 29 | 21 | 13 | 6 | … | 1 | … | 2 | |
| Read only | Males | 203 | … | … | … | 2 | 3 | 16 | 35 | 41 | 32 | 15 | 4 | 1 | … | … | … | 7 | … | 10 | 6 | 1 | 7 | 10 | 3 | 4 | … | 3 | 1 | 1 | … | … | … | 1 |
| Female | 189 | … | … | … | 2 | 6 | 11 | 37 | 35 | 20 | 10 | 2 | 4 | … | … | 1 | 5 | 3 | 4 | 6 | 11 | 9 | 8 | 4 | 3 | 5 | … | 3 | … | … | … | … | … | |
| Cannot Read | Males | 837 | 121 | 103 | 134 | 123 | 114 | 89 | 50 | 21 | 9 | 3 | 3 | 2 | 1 | … | 1 | 4 | 2 | 5 | 6 | 10 | 10 | 10 | 8 | 3 | 2 | 2 | … | … | … | … | … | 1 |
| Females | 815 | 157 | 109 | 119 | 115 | 111 | 85 | 55 | 23 | 3 | 2 | 1 | … | … | 1 | … | 2 | … | … | 5 | 6 | 7 | 4 | 1 | 4 | 1 | 2 | … | 1 | 1 | … | … | … | |
| Education unknown | Males | 26 | … | … | … | … | … | … | … | … | … | … | … | … | … | … | … | 3 | 1 | 1 | 10 | 4 | 1 | 2 | 1 | 2 | … | … | … | … | … | … | … | 1 |
| Females | 9 | … | … | … | … | … | … | … | … | … | … | 1 | … | 1 | … | 2 | … | … | … | 2 | … | 1 | … | 2 | … | … | … | … | … | … | … | … | … | |
| Total | Males | 4,114 | 121 | 103 | 134 | 125 | 117 | 111 | 104 | 85 | 90 | 85 | 76 | 73 | 75 | 72 | 61 | 308 | 65 | 329 | 449 | 381 | 323 | 344 | 200 | 139 | 50 | 40 | 30 | 12 | 6 | … | … | 6 |
| Females | 2,813 | 157 | 109 | 119 | 117 | 117 | 104 | 100 | 98 | 76 | 76 | 83 | 69 | 63 | 56 | 54 | 258 | 48 | 183 | 223 | 195 | 179 | 129 | 76 | 39 | 35 | 23 | 16 | 7 | 1 | 1 | … | 2 | |
| Waikouaiti— | ||||||||||||||||||||||||||||||||||
| Read and Write | Males | 2,540 | … | … | … | … | … | 3 | 17 | 30 | 74 | 76 | 102 | 84 | 93 | 93 | 87 | 24 | 41 | 181 | 203 | 199 | 221 | 248 | 218 | 133 | 80 | 45 | 31 | 18 | 10 | 2 | … | 6 |
| Females | 1,903 | … | … | … | … | … | 3 | 25 | 47 | 72 | 77 | 82 | 79 | 91 | 69 | 72 | 244 | 37 | 134 | 176 | 163 | 152 | 156 | 95 | 44 | 33 | 26 | 11 | 4 | 6 | 1 | … | 4 | |
| Read only | Males | 200 | … | … | … | … | 3 | 24 | 33 | 49 | 26 | 8 | 6 | 5 | 3 | 1 | 1 | 1 | … | 1 | 3 | 9 | 1 | 5 | 7 | 9 | 2 | 2 | 3 | 1 | 2 | 1 | … | … |
| Females | 231 | … | … | … | 1 | 7 | 15 | 29 | 40 | 32 | 13 | 9 | 1 | 3 | 2 | … | … | 1 | 2 | 12 | 13 | 11 | 11 | 7 | 9 | 3 | 3 | 3 | 1 | 2 | 1 | … | … | |
| Cannot Read | Males | 726 | 115 | 100 | 122 | 105 | 117 | 101 | 53 | 22 | 10 | 4 | 2 | 3 | 1 | … | 3 | 6 | … | 7 | 2 | 7 | 14 | 8 | 8 | 6 | 3 | 3 | … | 2 | 1 | … | 1 | … |
| Females | 749 | 113 | 96 | 112 | 120 | 103 | 81 | 42 | 15 | 6 | 1 | 2 | … | 4 | 1 | … | 1 | 2 | 3 | 6 | 8 | 10 | 10 | 2 | 3 | 2 | 2 | … | 1 | … | … | 2 | 1 | |
| Education unknown | Males | 24 | … | … | … | … | … | … | … | 1 | … | 1 | 1 | … | … | 1 | 1 | 1 | 2 | 1 | 1 | 1 | … | … | 1 | 2 | … | 2 | 1 | 1 | … | … | … | 6 |
| Females | 2 | … | … | … | … | … | … | … | … | … | … | … | … | … | … | … | … | … | 1 | … | … | … | … | … | … | … | 1 | … | … | … | … | … | … | |
| Total | Males | 3,590 | 115 | 100 | 122 | 105 | 120 | 128 | 103 | 102 | 110 | 89 | 111 | 92 | 97 | 95 | 92 | 253 | 43 | 190 | 209 | 216 | 236 | 261 | 234 | 150 | 85 | 52 | 32 | 21 | 11 | 3 | 1 | 12 |
| Females | 2,885 | 113 | 96 | 112 | 121 | 110 | 99 | 96 | 102 | 110 | 91 | 93 | 80 | 98 | 72 | 72 | 245 | 40 | 140 | 194 | 184 | 173 | 177 | 104 | 56 | 38 | 32 | 14 | 6 | 8 | 2 | 2 | 5 | |
| Peninsula— | ||||||||||||||||||||||||||||||||||
| Read and Write | Males | 912 | … | … | … | … | … | … | 7 | 32 | 24 | 29 | 39 | 29 | 42 | 32 | 34 | 127 | 16 | 58 | 67 | 63 | 62 | 75 | 57 | 48 | 24 | 22 | 13 | 6 | 1 | 2 | … | 3 |
| Females | 821 | … | … | … | … | … | 3 | 5 | 13 | 19 | 24 | 33 | 24 | 39 | 44 | 32 | 135 | 14 | 71 | 66 | 60 | 65 | 49 | 37 | 17 | 17 | 24 | 9 | 2 | 2 | 2 | 2 | 3 | |
| Read only | Males | 74 | … | … | … | 1 | 3 | 9 | 24 | 7 | 8 | 5 | 1 | … | 1 | … | … | 4 | … | 1 | 1 | 1 | 1 | 3 | 1 | 1 | 1 | … | … | … | 1 | … | … | … |
| Females | 64 | … | … | … | 1 | 2 | 4 | 8 | 14 | 5 | 6 | 2 | 1 | … | … | … | … | … | … | … | 1 | 2 | 3 | 6 | 4 | 1 | 1 | … | … | 1 | 1 | … | … | |
| Cannot Read | Males | 293 | 49 | 44 | 39 | 34 | 47 | 32 | 16 | 6 | 4 | 3 | 1 | … | … | … | … | 4 | … | … | 2 | 1 | 2 | 3 | 2 | 1 | … | … | 1 | 1 | … | 1 | … | … |
| Females | 237 | 41 | 26 | 31 | 41 | 36 | 27 | 16 | 6 | 3 | 2 | … | … | 1 | 1 | … | … | … | … | 1 | 2 | … | … | … | 2 | … | … | … | 1 | … | … | … | … | |
| Education unknown | Males | 2 | … | … | … | … | … | … | … | … | … | … | … | … | … | … | … | … | … | … | … | 1 | … | … | 1 | … | … | … | … | … | … | … | … | … |
| Females | 3 | … | … | … | … | … | … | … | … | … | … | … | … | … | … | … | … | … | 1 | … | 1 | 1 | … | … | … | … | … | … | … | … | … | … | … | |
| Total | Males | 1,281 | 49 | 44 | 39 | 35 | 50 | 41 | 47 | 45 | 36 | 37 | 41 | 29 | 43 | 32 | 34 | 135 | 16 | 59 | 70 | 66 | 65 | 81 | 61 | 50 | 25 | 22 | 14 | 7 | 2 | 3 | … | 3 |
| Females | 1,125 | 41 | 26 | 31 | 42 | 38 | 34 | 29 | 23 | 27 | 32 | 35 | 25 | 40 | 45 | 32 | 135 | 14 | 73 | 67 | 64 | 68 | 52 | 43 | 33 | 18 | 25 | 9 | 3 | 3 | 3 | 2 | 3 | |
| Taieri— | ||||||||||||||||||||||||||||||||||
| Read and Write | Males | 3,043 | … | … | … | … | … | 6 | 19 | 48 | 70 | 88 | 90 | 83 | 101 | 96 | 100 | 386 | 69 | 276 | 310 | 239 | 259 | 261 | 170 | 150 | 90 | 66 | 22 | 18 | 12 | 7 | … | 7 |
| Females | 2,227 | … | … | … | … | … | 4 | 13 | 35 | 70 | 80 | 93 | 89 | 80 | 81 | 81 | 341 | 60 | 206 | 211 | 175 | 156 | 150 | 100 | 65 | 46 | 41 | 21 | 17 | 5 | 5 | … | 2 | |
| Read only | Males | 260 | … | … | … | … | 3 | 27 | 62 | 56 | 33 | 16 | 13 | 2 | … | … | 1 | 4 | 1 | 4 | 2 | 6 | 8 | 8 | 9 | 2 | … | 1 | … | 1 | … | … | … | 1 |
| Females | 239 | … | … | … | 1 | 5 | 24 | 37 | 46 | 24 | 18 | 9 | … | 1 | … | … | 2 | … | 2 | 7 | 2 | 6 | 11 | 12 | 6 | 5 | 2 | 4 | 5 | … | 1 | … | … | |
| Cannot Read | Males | 799 | 114 | 95 | 117 | 121 | 136 | 87 | 52 | 11 | 6 | 2 | … | … | 4 | 2 | 1 | 2 | … | 3 | 7 | 7 | 10 | 7 | 5 | 5 | 1 | 1 | 1 | 1 | … | … | 1 | … |
| Females | 740 | 105 | 106 | 136 | 113 | 107 | 74 | 45 | 11 | 5 | … | … | … | 1 | … | … | … | … | 7 | 7 | 5 | 3 | 6 | 3 | 3 | … | 2 | … | 1 | … | … | … | … | |
Table XIV. Table XIV. Showing the Education of Persons, Males, and Females (exclusive of Maoris and Chinese), in each County.—continued
| Counties. | All ages. | Under 5. | 5 and under 10. | 10 and under 15. | 15 and under 21. | 21 and under 40. | 40 and under 60. | 60 and under 80. | 80 and Upward. | Unspecified Children. | Unspecified Adults. | |||||||||||||||||||||||
|---|---|---|---|---|---|---|---|---|---|---|---|---|---|---|---|---|---|---|---|---|---|---|---|---|---|---|---|---|---|---|---|---|---|---|
| Under 1 year. | 1–3. | 3–3. | 3–4. | 4–5. | 5–6. | 6–7. | 7–8. | 8–9. | 9–10. | 10–11. | 11–12. | 12–13. | 13–14. | 14–15. | 15–20. | 20–21. | 21–25. | 25–30. | 30–35. | 35–40. | 40–45. | 45–50. | 50–55. | 55–60. | 60–65. | 65–70. | 50–75. | 75–80. | ||||||
| Taieri— continued | ||||||||||||||||||||||||||||||||||
| Education unknown | Males | 28 | … | … | … | … | … | … | 2 | 1 | 4 | 1 | … | 1 | … | 1 | … | … | … | … | 2 | 2 | 2 | 4 | 1 | … | 2 | 2 | … | … | … | … | … | 3 |
| Females | 40 | … | … | … | … | … | 1 | 6 | 5 | 4 | 2 | 3 | … | … | … | … | 3 | 1 | … | 4 | 4 | … | 4 | 1 | … | 1 | 1 | … | … | … | … | … | … | |
| Total | Males | 4,130 | 114 | 95 | 117 | 121 | 139 | 120 | 135 | 116 | 113 | 107 | 103 | 86 | 105 | 99 | 102 | 392 | 70 | 183 | 321 | 254 | 279 | 280 | 185 | 157 | 93 | 70 | 23 | 20 | 12 | 7 | 1 | 11 |
| Females | 3,246 | 105 | 106 | 136 | 114 | 112 | 103 | 101 | 97 | 103 | 100 | 105 | 89 | 82 | 81 | 81 | 346 | 61 | 215 | 229 | 195 | 165 | 171 | 116 | 74 | 52 | 46 | 25 | 23 | 5 | 6 | … | 2 | |
| Bruce— | ||||||||||||||||||||||||||||||||||
| Read and Write | Males | 1,860 | … | … | … | … | … | 1 | 8 | 25 | 39 | 52 | 77 | 53 | 71 | 62 | 57 | 197 | 45 | 147 | 178 | 181 | 139 | 179 | 126 | 83 | 46 | 47 | 22 | 10 | 9 | 5 | … | 1 |
| Females | 1,404 | … | … | … | … | … | … | 10 | 26 | 50 | 51 | 72 | 68 | 72 | 56 | 69 | 174 | 26 | 107 | 122 | 102 | 123 | 104 | 47 | 41 | 26 | 24 | 17 | 11 | 3 | 2 | … | 1 | |
| Read only | Males | 206 | … | … | … | 1 | 2 | 21 | 45 | 43 | 26 | 16 | 12 | 1 | 3 | … | 1 | 3 | … | 2 | 6 | 3 | 8 | 3 | 2 | 2 | … | 4 | 2 | … | … | … | … | … |
| Females | 235 | … | … | … | 1 | 9 | 20 | 42 | 41 | 28 | 13 | 6 | 2 | 1 | 2 | … | 2 | 1 | 1 | 13 | 11 | 11 | 13 | 6 | 4 | 1 | 2 | 1 | 3 | … | 1 | … | … | |
| Cannot Read | Males | 585 | 81 | 70 | 101 | 92 | 78 | 67 | 24 | 13 | 1 | 1 | 1 | 2 | … | … | … | 4 | 1 | 3 | 4 | 6 | 7 | 13 | 6 | 5 | 3 | 1 | 1 | 2 | … | … | … | 1 |
| Females | 604 | 91 | 70 | 83 | 91 | 15 | 69 | 32 | 15 | 8 | 1 | 1 | 2 | … | … | … | 2 | … | 3 | 5 | 13 | 13 | 7 | 3 | 2 | 2 | 3 | … | 2 | … | … | … | 1 | |
| Education unknown | Males | 11 | … | … | … | … | … | … | … | … | … | … | … | … | … | … | … | 1 | … | 1 | … | … | 4 | 1 | 1 | … | 3 | … | … | … | … | … | … | … |
| Females | 5 | … | … | … | … | … | … | … | … | … | 1 | … | … | 1 | … | … | 2 | … | … | … | … | … | … | 1 | … | … | … | … | … | … | … | … | … | |
| Total | Males | 2,665 | 81 | 70 | 1O1 | 93 | 80 | 89 | 77 | 81 | 66 | 69 | 90 | 56 | 74 | 62 | 58 | 205 | 46 | 143 | 188 | 190 | 158 | 196 | 135 | 90 | 52 | 52 | 25 | 12 | 9 | 5 | … | 2 |
| Females | 2,248 | 91 | 70 | 83 | 92 | 94 | 89 | 84 | 82 | 86 | 66 | 79 | 72 | 74 | 58 | 69 | 180 | 27 | 111 | 140 | 126 | 147 | 124 | 57 | 47 | 29 | 29 | 18 | 16 | 3 | 3 | … | 2 | |
| Clutha— | ||||||||||||||||||||||||||||||||||
| Read and Write | Males | 1,905 | … | … | … | … | … | 2 | 8 | 27 | 29 | 55 | 47 | 50 | 52 | 60 | 57 | 216 | 47 | 180 | 221 | 171 | 183 | 167 | 125 | 76 | 51 | 39 | 26 | 11 | 2 | 3 | … | 1 |
| Females | 1,209 | … | … | … | … | … | … | 7 | 23 | 35 | 42 | 46 | 48 | 47 | 41 | 52 | 156 | 35 | 111 | 93 | 113 | 102 | 80 | 65 | 43 | 27 | 16 | 8 | 14 | 4 | 1 | … | 2 | |
| Read only | Males | 135 | … | … | … | … | 5 | 18 | 31 | 32 | 21 | 6 | 4 | 2 | … | … | 1 | 1 | … | … | … | 6 | 2 | 1 | 1 | 2 | … | 1 | … | 1 | … | … | … | … |
| Females | 123 | … | … | … | 2 | 6 | 10 | 29 | 24 | 07 | 11 | 2 | 3 | … | 1 | … | 1 | … | 2 | … | 2 | 2 | 2 | 1 | 1 | … | 2 | 2 | … | 2 | 1 | … | … | |
| Cannot Read | Males | 407 | 69 | 73 | 51 | 60 | 55 | 44 | 23 | 8 | 4 | 2 | … | … | … | … | … | … | 1 | 2 | 1 | 3 | 4 | 2 | 1 | 1 | 2 | … | 1 | … | … | … | … | … |
| Females | 403 | 68 | 57 | 66 | 76 | 50 | 51 | 25 | 2 | 2 | 1 | … | 1 | … | … | … | … | … | … | … | 1 | 1 | 1 | … | … | … | … | … | 1 | … | … | … | … | |
| Education unknown | Males | 5 | … | … | … | … | … | … | … | … | 1 | … | … | … | … | … | 1 | … | … | 1 | … | … | … | 2 | … | … | … | … | … | … | … | … | … | … |
| Females | 6 | … | … | … | … | … | … | … | 1 | … | … | 1 | 1 | … | 1 | … | … | … | … | … | 1 | … | 1 | … | … | … | … | … | … | … | … | … | … | |
| Total | Males | 2,452 | 69 | 73 | 51 | 60 | 60 | 64 | 62 | 67 | 55 | 63 | 51 | 52 | 52 | 60 | 59 | 217 | 48 | 183 | 222 | 180 | 189 | 172 | 127 | 79 | 53 | 40 | 27 | 12 | 2 | 2 | … | 1 |
| Females | 1,741 | 68 | 57 | 66 | 78 | 56 | 61 | 61 | 50 | 54 | 54 | 49 | 53 | 47 | 43 | 52 | 157 | 35 | 113 | 93 | 117 | 105 | 84 | 64 | 44 | 27 | 18 | 10 | 15 | 6 | 2 | … | 2 | |
| Tuapeka— | ||||||||||||||||||||||||||||||||||
| Read and Write | Males | 2,414 | … | … | … | … | … | 8 | 17 | 38 | 64 | 65 | 73 | 82 | 90 | 73 | 66 | 222 | 34 | 143 | 228 | 190 | 230 | 271 | 254 | 147 | 49 | 42 | 13 | 6 | 2 | … | … | 7 |
| Females | 1,587 | … | … | … | … | … | 3 | 19 | 36 | 74 | 69 | 100 | 72 | 85 | 58 | 67 | 209 | 25 | 98 | 117 | 136 | 138 | 119 | 67 | 52 | 13 | 20 | 4 | 3 | 1 | … | 1 | 1 | |
| Read only | Males | 223 | … | … | … | 3 | 16 | 19 | 44 | 39 | 30 | 16 | 7 | 3 | 1 | 3 | 2 | 2 | … | 1 | 4 | 5 | 3 | 10 | 11 | 1 | 1 | 2 | … | … | … | … | … | … |
| Females | 224 | … | … | … | 1 | 12 | 27 | 41 | 35 | 31 | 12 | 6 | … | 1 | 1 | … | 3 | … | 2 | 6 | 10 | 11 | 13 | 2 | 4 | 1 | … | … | 1 | 1 | 2 | 1 | … | |
| Cannot Read | Males | 626 | 90 | 83 | 99 | 95 | 77 | 74 | 36 | 10 | 5 | 2 | 3 | … | 1 | 2 | … | … | … | 2 | 4 | 6 | 9 | 6 | 6 | 7 | 3 | 3 | … | 1 | … | 2 | … | … |
| Females | 598 | 105 | 73 | 88 | 101 | 91 | 67 | 34 | 6 | 4 | 1 | 2 | … | … | … | … | 2 | 2 | … | 2 | 1 | 3 | 4 | 6 | 2 | 1 | … | … | 1 | 1 | 1 | … | … | |
Table XIV. Table XIV. Showing the Education of Persons, Males, and Females (exclusive of Maoris and Chinese), in each County.—continued
| Counties. | All ages. | Under 5. | 5 and under 10. | 10 and under 15. | 15 and under 21. | 21 and under 40. | 40 and under 60. | 60 and under 80. | 80 and Upward. | Unspecified Children. | Unspecified Adults. | |||||||||||||||||||||||
|---|---|---|---|---|---|---|---|---|---|---|---|---|---|---|---|---|---|---|---|---|---|---|---|---|---|---|---|---|---|---|---|---|---|---|
| Under 1 year. | 1–3. | 3–3. | 3–4. | 4–5. | 5–6. | 6–7. | 7–8. | 8–9. | 9–10. | 10–11. | 11–12. | 12–13. | 13–14. | 14–15. | 15–20. | 20–21. | 21–25. | 25–30. | 30–35. | 35–40. | 40–45. | 45–50. | 50–55. | 55–60. | 60–65. | 65–70. | 50–75. | 75–80. | ||||||
| Education unknown | Males | 4 | … | … | … | … | … | … | … | … | … | … | … | … | … | … | … | … | … | … | … | … | … | 2 | … | 1 | … | … | … | … | … | … | … | 1 |
| Females | 1 | … | … | … | … | … | … | … | … | … | … | … | … | … | … | … | … | … | … | … | … | 1 | … | … | … | … | … | … | … | … | … | … | … | |
| Total | Males | 3,267 | 90 | 83 | 99 | 98 | 93 | 101 | 97 | 87 | 99 | 83 | 83 | 85 | 92 | 78 | 68 | 224 | 34 | 146 | 236 | 201 | 242 | 289 | 271 | 156 | 53 | 47 | 13 | 7 | 2 | 2 | … | 8 |
| Females | 2,410 | 105 | 73 | 88 | 102 | 103 | 97 | 94 | 77 | 109 | 82 | 108 | 72 | 86 | 59 | 67 | 214 | 27 | 100 | 125 | 147 | 153 | 136 | 75 | 58 | 15 | 20 | 4 | 5 | 3 | 3 | 2 | 1 | |
| Maniototo— | ||||||||||||||||||||||||||||||||||
| Read and Write | Males | 979 | … | … | … | … | 1 | 2 | 10 | 18 | 16 | 27 | 21 | 23 | 20 | 20 | 19 | 70 | 16 | 63 | 93 | 80 | 102 | 156 | 103 | 65 | 25 | 14 | 3 | 2 | 1 | … | … | 9 |
| Females | 593 | … | … | … | … | … | 4 | 5 | 18 | 20 | 21 | 25 | 27 | 31 | 20 | 23 | 64 | 7 | 50 | 56 | 69 | 60 | 39 | 25 | 13 | 7 | 4 | 1 | … | 1 | … | … | 1 | |
| Read only | Males | 76 | … | … | … | … | 2 | 9 | 13 | 11 | 9 | 3 | 2 | 1 | … | 1 | … | 1 | … | … | 3 | 4 | 2 | 4 | 4 | 5 | 1 | … | 1 | … | … | … | … | … |
| Females | 63 | … | … | … | … | 3 | 11 | 11 | 8 | 7 | 3 | 2 | 1 | 1 | … | 2 | … | … | 1 | … | 2 | … | 6 | … | 1 | 1 | … | 1 | 1 | 1 | … | … | … | |
| Cannot Read | Males | 243 | 37 | 33 | 53 | 42 | 29 | 21 | 8 | 4 | 2 | 1 | … | … | … | 1 | … | 1 | … | … | … | 1 | 2 | 4 | 2 | 1 | 1 | … | … | … | … | … | … | … |
| Females | 236 | 44 | 34 | 25 | 37 | 39 | 26 | 10 | 8 | 3 | 1 | 1 | … | … | … | … | … | … | … | 1 | 2 | 4 | … | 1 | … | … | … | … | … | … | … | … | … | |
| Education unknown | Males | 10 | … | … | … | … | … | … | … | … | … | … | 1 | … | … | … | … | … | … | 1 | 2 | 2 | … | 1 | 1 | … | 1 | … | … | … | … | … | … | 1 |
| Females | 7 | … | … | … | … | … | 2 | 1 | 1 | 2 | … | … | … | … | … | … | … | … | … | … | … | … | … | 1 | … | … | … | … | … | … | … | … | … | |
| Total | Males | 1,308 | 37 | 33 | 53 | 42 | 32 | 32 | 31 | 33 | 27 | 31 | 24 | 24 | 20 | 22 | 19 | 72 | 16 | 64 | 98 | 87 | 106 | 165 | 110 | 71 | 28 | 14 | 4 | 2 | 1 | … | … | 10 |
| Females | 899 | 44 | 34 | 25 | 37 | 42 | 43 | 27 | 35 | 32 | 25 | 28 | 28 | 32 | 20 | 25 | 64 | 7 | 51 | 57 | 73 | 64 | 45 | 27 | 14 | 8 | 4 | 2 | 3 | 2 | … | … | 1 | |
| Vincent— | ||||||||||||||||||||||||||||||||||
| Read and Write | Males | 1,540 | … | … | … | … | … | 2 | 7 | 19 | 26 | 28 | 46 | 32 | 42 | 36 | 30 | 106 | 19 | 113 | 131 | 107 | 158 | 222 | 182 | 128 | 51 | 25 | 5 | 4 | 2 | 1 | … | 18 |
| Females | 733 | … | … | … | … | … | 2 | 9 | 17 | 24 | 29 | 37 | 33 | 34 | 22 | 28 | 99 | 13 | 45 | 56 | 71 | 75 | 77 | 30 | 16 | 9 | 5 | 2 | … | 1 | 2 | … | 2 | |
| Read only | Males | 100 | … | … | … | … | 3 | 8 | 27 | 16 | 17 | 1 | 2 | … | … | 1 | … | 2 | … | … | 6 | 2 | 1 | 3 | 2 | 2 | 5 | 2 | … | … | … | … | … | … |
| Females | 99 | … | … | … | … | 6 | 15 | 18 | 15 | 11 | 8 | 6 | … | … | … | … | … | 1 | … | 2 | 1 | 4 | 3 | 5 | 2 | … | 1 | 1 | … | … | … | … | … | |
| Cannot Read | Males | 312 | 47 | 45 | 43 | 48 | 40 | 31 | 13 | 11 | 5 | 3 | … | … | 2 | … | 1 | 1 | … | … | … | 3 | … | 6 | 2 | 6 | 1 | 2 | 1 | … | … | … | … | 1 |
| Females | 293 | 45 | 32 | 51 | 44 | 38 | 32 | 16 | 10 | 6 | 2 | 1 | … | … | … | … | … | … | 1 | 1 | 1 | 2 | 4 | 3 | 1 | 2 | … | … | … | 1 | … | … | … | |
| Education unknown | Males | 6 | … | … | … | … | … | … | 1 | … | … | … | … | .. | 1 | … | … | 1 | … | … | … | … | … | 1 | … | 1 | … | 1 | … | … | … | … | … | … |
| Females | 4 | … | … | … | … | … | … | … | … | … | … | … | 32 | … | … | … | 1 | … | … | … | … | 2 | … | 1 | … | … | … | … | … | … | … | … | … | |
| Total | Males | 1,958 | 47 | 45 | 43 | 48 | 43 | 41 | 48 | 46 | 55 | 32 | 48 | 32 | 45 | 37 | 31 | 110 | 19 | 113 | 137 | 112 | 159 | 232 | 186 | 137 | 57 | 30 | 6 | 4 | 2 | 1 | … | 19 |
| Females | 1,134 | 45 | 32 | 51 | 44 | 44 | 49 | 43 | 42 | 41 | 39 | 44 | 33 | 14 | 22 | 28 | 100 | 14 | 46 | 59 | 73 | 83 | 84 | 39 | 19 | 11 | 6 | 3 | … | 2 | 2 | … | 2 | |
| Lake— | ||||||||||||||||||||||||||||||||||
| Read and Write | Males | 1,168 | … | … | … | … | … | 4 | 9 | 11 | 14 | 23 | 14 | 19 | 16 | 17 | 17 | 64 | 18 | 77 | 128 | 103 | 145 | 177 | 162 | 86 | 36 | 16 | 4 | 2 | 1 | 1 | … | 4 |
| Females | 478 | … | … | … | … | … | 2 | 11 | 10 | 15 | 22 | 24 | 19 | 29 | 13 | 15 | 41 | 6 | 41 | 49 | 53 | 43 | 37 | 17 | 15 | 8 | 6 | … | 2 | … | … | … | … | |
| Read only | Males | 64 | … | … | … | … | 2 | 6 | 7 | 12 | 6 | 8 | … | 1 | … | 1 | … | 2 | … | 1 | 1 | … | 5 | 4 | 6 | 1 | … | 1 | … | 1 | … | … | … | … |
| Females | 58 | … | … | … | … | 3 | 5 | 14 | 8 | 9 | 4 | 1 | … | … | … | … | … | … | … | 4 | 1 | 2 | 1 | 2 | 1 | … | 1 | 1 | 1 | … | … | … | … | |
| Cannot Read | Males | 198 | 22 | 42 | 25 | 35 | 25 | 19 | 10 | 5 | … | 2 | … | … | … | … | … | … | … | … | 2 | 1 | 1 | 3 | 3 | … | … | 1 | … | 1 | … | … | … | … |
| Females | 226 | 42 | 18 | 32 | 47 | 33 | 21 | 13 | 7 | 3 | 1 | 1 | 2 | … | … | … | … | … | … | 1 | 2 | 1 | 1 | 1 | … | … | … | … | … | … | … | … | … | |
| Education unknown | Males | 10 | … | … | … | … | … | … | … | 1 | … | … | … | 1 | … | … | … | … | … | … | 1 | … | … | 1 | 3 | … | … | … | 1 | … | … | … | … | 2 |
| Females | 1 | … | … | … | … | … | … | … | … | 1 | … | … | … | … | … | … | … | … | … | … | … | … | … | … | … | … | … | … | … | … | … | … | … | |
| Total | Males | 1,440 | 22 | 42 | 25 | 35 | 27 | 29 | 26 | 29 | 20 | 33 | 14 | 21 | 16 | 18 | 17 | 66 | 18 | 78 | 132 | 104 | 151 | 185 | 174 | 87 | 37 | 18 | 5 | 3 | 1 | 1 | … | 6 |
| Females | 763 | 42 | 18 | 32 | 37 | 36 | 28 | 38 | 25 | 28 | 27 | 26 | 21 | 29 | 13 | 15 | 41 | 6 | 41 | 54 | 56 | 46 | 39 | 20 | 16 | 8 | 7 | 1 | 3 | … | … | … | … | |
| Southland— | ||||||||||||||||||||||||||||||||||
| Read and Write | Males | 5,485 | … | … | … | … | … | 7 | 45 | 71 | 99 | 131 | 137 | 133 | 134 | 131 | 128 | 554 | 100 | 522 | 603 | 570 | 594 | 510 | 373 | 233 | 116 | 88 | 43 | 78 | 11 | 6 | … | 28 |
| Females | 3,367 | … | … | … | … | … | 8 | 30 | 70 | 105 | 111 | 138 | 119 | 150 | 138 | 134 | 459 | 77 | 296 | 374 | 283 | 286 | 209 | 130 | 95 | 55 | 50 | 24 | 11 | 6 | 4 | 1 | 4 | |
| Read only | Males | 402 | … | … | … | … | 13 | 28 | 75 | 65 | 37 | 40 | 11 | 11 | 6 | 4 | 4 | 7 | 2 | 8 | 9 | 14 | 14 | 20 | 10 | 15 | 3 | 3 | 1 | 1 | … | … | … | 1 |
| Females | 416 | … | … | … | … | 5 | 38 | 80 | 60 | 50 | 22 | 18 | 12 | 5 | 4 | 2 | 3 | … | 9 | 9 | 19 | 22 | 14 | 14 | 11 | 4 | 5 | 3 | 3 | 2 | 1 | … | 1 | |
| Cannot Read | Males | 1,648 | 273 | 212 | 252 | 216 | 243 | 153 | 88 | 32 | 22 | 10 | 6 | 2 | 3 | 3 | 1 | 6 | … | 10 | 16 | 19 | 23 | 17 | 11 | 11 | 3 | 8 | 3 | 1 | … | … | 1 | 3 |
| Females | 1,463 | 246 | 188 | 233 | 195 | 206 | 138 | 88 | 37 | 15 | 14 | 5 | 4 | 1 | … | 2 | 7 | … | 6 | 13 | 15 | 10 | 14 | 7 | 4 | 4 | 4 | 1 | 2 | 1 | 1 | … | 2 | |
Table XIV. Table XIV. Showing the Education of Persons, Males, and Females (exclusive of Maoris and Chinese), in each County.—continued
| Counties. | All ages. | Under 5. | 5 and under 10. | 10 and under 15. | 15 and under 21. | 21 and under 40. | 40 and under 60. | 60 and under 80. | 80 and Upward. | Unspecified Children. | Unspecified Adults. | |||||||||||||||||||||||
|---|---|---|---|---|---|---|---|---|---|---|---|---|---|---|---|---|---|---|---|---|---|---|---|---|---|---|---|---|---|---|---|---|---|---|
| Under 1 year. | 1–3. | 3–3. | 3–4. | 4–5. | 5–6. | 6–7. | 7–8. | 8–9. | 9–10. | 10–11. | 11–12. | 12–13. | 13–14. | 14–15. | 15–20. | 20–21. | 21–25. | 25–30. | 30–35. | 35–40. | 40–45. | 45–50. | 50–55. | 55–60. | 60–65. | 65–70. | 50–75. | 75–80. | ||||||
| Southland— | ||||||||||||||||||||||||||||||||||
| Education unknown | Males | 95 | … | … | … | … | … | 1 | 2 | 2 | 4 | … | 1 | … | 1 | … | 7 | 11 | 10 | 14 | 12 | 9 | 7 | 4 | … | 2 | 2 | 2 | 1 | … | … | … | 13 | |
| Females | 20 | … | … | … | … | … | … | 1 | 3 | … | … | … | … | … | … | … | 1 | .... | 2 | 3 | 3 | 4 | 1 | 1 | … | … | 1 | … | … | … | … | … | … | |
| Total | Males | 7,630 | 273 | 212 | 252 | 216 | 256 | 188 | 209 | 170 | 160 | 185 | 154 | 147 | 143 | 139 | 133 | 574 | 105 | 550 | 732 | 615 | 640 | 554 | 398 | 259 | 124 | 101 | 49 | 31 | 11 | 6 | 1 | 45 |
| Females | 5,266 | 246 | 188 | 233 | 195 | 211 | 184 | 199 | 170 | 170 | 147 | 161 | 135 | 156 | 142 | 138 | 470 | 77 | 313 | 399 | 320 | 322 | 238 | 152 | 110 | 63 | 60 | 28 | 16 | 9 | 6 | 1 | 7 | |
| Wallace— | ||||||||||||||||||||||||||||||||||
| Read and Write | Males | 1,524 | … | … | … | … | … | … | 8 | 18 | 14 | 32 | 20 | 26 | 27 | 27 | 35 | 158 | 42 | 192 | 213 | 162 | 153 | 146 | 107 | 71 | 32 | 25 | 7 | 4 | 1 | 1 | … | 3 |
| Females | 732 | … | … | … | … | … | 2 | 6 | 16 | 18 | 21 | 36 | 30 | 37 | 19 | 20 | 112 | 13 | 70 | 85 | 74 | 48 | 57 | 28 | 18 | 11 | 6 | 2 | 1 | 2 | … | … | … | |
| Read only | Males | 108 | … | … | … | … | 1 | 9 | 14 | 11 | 16 | 8 | 5 | 2 | 3 | 2 | 1 | 4 | … | 3 | 3 | 3 | 7 | 5 | 4 | 2 | … | … | 1 | 2 | 1 | 1 | … | … |
| Females | 82 | … | … | … | … | 3 | 7 | 10 | 19 | 7 | 2 | 7 | … | … | 1 | 2 | … | … | 4 | 5 | 3 | 4 | … | 3 | 1 | 3 | … | … | … | … | … | … | 1 | |
| Cannot Read | Males | 417 | 64 | 39 | 53 | 53 | 57 | 40 | 19 | 11 | 8 | 6 | 2 | 1 | 1 | 1 | … | 3 | 1 | 4 | 10 | 8 | 9 | 9 | 6 | 5 | 1 | 2 | 1 | 2 | 1 | … | … | … |
| Females | 394 | 54 | 44 | 42 | 51 | 44 | 45 | 26 | 14 | 11 | 7 | 2 | 4 | 2 | 1 | 1 | 3 | … | 5 | 8 | 10 | 7 | 6 | 2 | 1 | 1 | 1 | 1 | 1 | … | … | … | … | |
| Education unknown | Males | 3 | … | … | … | … | … | … | … | … | … | … | 1 | … | … | … | … | … | … | 1 | … | … | 1 | … | … | … | … | … | … | … | … | … | … | … |
| Females | 2 | … | … | … | … | … | … | … | … | … | … | … | … | … | … | … | 1 | … | 1 | … | … | … | … | … | … | … | … | … | … | … | … | … | … | |
| Total | Males | 2,052 | 64 | 39 | 53 | 53 | 58 | 49 | 41 | 40 | 38 | 46 | 28 | 29 | 31 | 30 | 36 | 165 | 43 | 200 | 226 | 173 | 170 | 160 | 117 | 78 | 33 | 27 | 9 | 8 | 3 | 2 | … | 3 |
| Females | 1,210 | 54 | 44 | 42 | 51 | 47 | 54 | 42 | 49 | 36 | 30 | 45 | 34 | 39 | 21 | 23 | 116 | 13 | 80 | 98 | 87 | 59 | 63 | 33 | 20 | 15 | 7 | 3 | 2 | 2 | … | … | 1 | |
| Fiord— | ||||||||||||||||||||||||||||||||||
| Read and Write | Males | 4 | … | … | … | … | … | … | … | … | … | … | … | … | … | … | … | … | … | … | 1 | 2 | … | 1 | … | … | … | … | … | … | … | … | … | … |
| Females | 3 | … | … | … | … | … | … | … | … | … | … | … | … | … | … | … | 1 | … | … | 2 | … | … | … | … | .. | … | … | … | … | … | … | … | … | |
| Read only | Males | … | … | … | … | … | … | … | … | … | … | … | … | … | … | … | … | … | … | … | … | … | … | … | … | … | … | … | … | … | … | … | … | … |
| Females | 2 | … | … | … | … | 1 | … | 1 | … | … | … | … | … | … | … | … | … | … | … | … | … | … | … | … | … | … | … | … | … | … | … | … | … | |
| Cannot Read | Males | 1 | … | … | 1 | … | … | … | … | … | … | … | … | … | … | … | … | … | … | … | … | … | … | … | … | … | … | … | … | … | … | … | … | … |
| Females | 3 | 1 | … | 1 | 1 | … | … | … | … | … | … | … | … | … | … | … | … | … | … | … | … | … | … | … | … | … | … | … | … | … | … | … | … | |
| Education unknown | Males | … | … | … | … | … | … | … | … | … | … | … | … | … | … | … | … | … | … | … | … | … | … | … | … | … | … | … | … | … | … | … | … | … |
| Females | … | … | … | … | … | … | … | … | … | … | … | … | … | … | … | … | … | … | … | … | … | … | … | … | … | … | … | … | … | … | … | … | … | |
| Total | Males | 5 | … | … | 1 | … | … | … | … | … | … | … | … | … | … | … | … | … | … | … | 1 | 2 | … | 1 | … | … | … | … | … | … | … | … | … | … |
| Females | 8 | 1 | … | 1 | 1 | 1 | … | 1 | … | … | … | … | … | … | … | … | 1 | … | … | 2 | … | … | … | … | … | … | … | … | … | … | … | … | … | |
| Stewart Island — | ||||||||||||||||||||||||||||||||||
| Read and Write | Males | 87 | … | … | … | … | … | … | 1 | … | 1 | 3 | 2 | 1 | 4 | 1 | 5 | 12 | 1 | 2 | 4 | 12 | 8 | 10 | 7 | 4 | 4 | 3 | 2 | … | … | … | … | … |
| Females | 68 | … | … | … | … | … | 2 | 2 | … | 2 | 3 | 5 | 5 | 5 | 3 | 4 | 11 | 3 | 1 | 6 | 6 | 2 | 5 | 1 | … | 1 | … | 1 | … | … | … | … | … | |
| Read only | Males | 17 | … | … | … | … | 1 | 1 | … | 2 | 1 | 1 | … | 2 | 1 | … | … | 3 | … | … | … | 1 | 1 | … | 2 | … | … | … | … | … | … | … | … | … |
| Females | 24 | … | … | … | … | 1 | 2 | 4 | 1 | 2 | … | … | … | 1 | … | … | 1 | … | … | 2 | 1 | 3 | 2 | 1 | … | … | 1 | … | … | 1 | … | … | 1 | |
| Cannot Read | Males | 58 | 8 | 8 | 3 | 7 | 11 | 5 | 2 | 1 | 1 | … | 1 | … | … | … | 1 | 1 | … | 1 | 3 | … | 1 | 1 | … | … | 1 | … | … | … | 1 | … | … | 1 |
| Females | 38 | 5 | 5 | 4 | 7 | 5 | 1 | 2 | 2 | … | 1 | … | … | … | … | … | … | … | … | 1 | 1 | 1 | 3 | … | … | … | … | … | … | … | … | … | … | |
| Education unknown | Males | 1 | … | … | … | … | … | … | … | … | … | … | … | … | … | … | … | … | … | … | … | … | 1 | … | … | … | … | … | … | … | … | … | … | … |
| Females | 1 | … | … | … | … | … | … | 1 | … | … | … | … | … | … | … | … | … | … | … | … | … | … | … | … | … | … | … | … | … | … | … | … | … | |
| Total | Males | 163 | 8 | 8 | 3 | 7 | 12 | 6 | 3 | 3 | 3 | 4 | 3 | 3 | 5 | 1 | 6 | 16 | 1 | 3 | 7 | 13 | 11 | 11 | 9 | 4 | 5 | 3 | 2 | … | 1 | … | … | 2 |
| Females | 131 | 5 | 5 | 4 | 7 | 6 | 5 | 9 | 3 | 4 | 4 | 5 | 5 | 6 | 3 | 4 | 12 | 3 | 1 | 9 | 8 | 6 | 10 | 2 | … | 1 | 1 | 1 | … | 1 | … | … | 1 | |
Table XV. Table XV. Showing the Education of Persons, Males, and Females (exclusive of Maoris and Chinese), in each Borough.
| Boroughs. | All Ages. | Under 5. | 5 and under 10. | 10 and under 15. | 15 and under 21. | 21 and under 40. | 40 and under 60. | 60 and under 80. | 80 and upwards | Unspecified Children | Unspecified Adults | |||||||||||||||||||||||
|---|---|---|---|---|---|---|---|---|---|---|---|---|---|---|---|---|---|---|---|---|---|---|---|---|---|---|---|---|---|---|---|---|---|---|
| Under 1 Year. | 1-2. | 3-3. | 3-4. | 4-5. | 5-6. | 6-7. | 7-8. | 8-9. | 9-10. | 10-11. | 11-12. | 12-13. | 13-14. | 14-15. | 15-20. | 20-21. | 21-25. | 25-30. | 30-35. | 35-40. | 40-45. | 45-50. | 50-55. | 55-60. | 60-65. | 65-70. | 70-75. | 75-80. | ||||||
| Auckland— | ||||||||||||||||||||||||||||||||||
| Read and Write | Males | 6,468 | … | … | … | … | … | 11 | 54 | 114 | 151 | 189 | 208 | 166 | 180 | 187 | 196 | 780 | 130 | 596 | 740 | 552 | 521 | 538 | 358 | 301 | 160 | 166 | 70 | 58 | 19 | 16 | … | 7 |
| Females | 5,883 | … | … | … | … | … | 13 | 62 | 85 | 135 | 164 | 198 | 177 | 221 | 173 | 172 | 938 | 186 | 617 | 598 | 506 | 449 | 366 | 281 | 195 | 117 | 118 | 54 | 32 | 13 | 12 | … | 1 | |
| Read only | Males | 425 | … | … | … | … | 6 | 45 | 81 | 79 | 43 | 25 | 15 | 8 | 3 | 6 | 4 | 11 | 4 | 10 | 15 | 15 | 18 | 9 | 12 | 5 | 2 | 7 | 1 | 1 | … | … | … | … |
| Females | 443 | … | … | … | … | 13 | 44 | 64 | 47 | 40 | 18 | 12 | 5 | 3 | 1 | 1 | 9 | 1 | 15 | 19 | 15 | 22 | 37 | 16 | 22 | 13 | 16 | 6 | 2 | 2 | … | … | … | |
| Cannot Read | Males | 1,738 | 294 | 191 | 249 | 250 | 265 | 173 | 77 | 45 | 15 | 10 | 9 | 5 | 5 | 2 | 3 | 8 | 5 | 5 | 14 | 21 | 24 | 12 | 10 | 16 | 4 | 14 | 2 | 5 | 2 | 3 | … | … |
| Females | 1,683 | 223 | 204 | 237 | 272 | 232 | 158 | 75 | 37 | 20 | 7 | 11 | 2 | 3 | 2 | 1 | 8 | 2 | 10 | 18 | 22 | 28 | 27 | 21 | 18 | 13 | 16 | 3 | 6 | 1 | 5 | … | 1 | |
| Education unknown | Males | 1 | … | … | … | … | … | … | … | … | … | … | … | 1 | … | … | … | … | … | … | … | … | … | … | … | … | … | … | … | … | … | … | … | … |
| Females | 1 | … | … | … | … | … | … | … | … | … | … | … | … | … | … | … | … | … | … | … | … | … | … | … | … | … | … | … | … | … | … | … | … | |
| Total | Males | 8,632 | 294 | 191 | 249 | 250 | 271 | 229 | 212 | 238 | 209 | 224 | 232 | 179 | 188 | 195 | 203 | 799 | 139 | 611 | 769 | 588 | 564 | 559 | 380 | 322 | 166 | 187 | 73 | 64 | 21 | 19 | … | 7 |
| Females | 8,010 | 223 | 204 | 237 | 272 | 245 | 215 | 201 | 169 | 195 | 189 | 221 | 184 | 227 | 176 | 174 | 955 | 189 | 642 | 635 | 543 | 500 | 430 | 318 | 235 | 143 | 150 | 63 | 40 | 16 | 17 | … | 2 | |
| Parnell— | ||||||||||||||||||||||||||||||||||
| Read and Write | Males | 1,272 | … | … | … | … | … | 4 | 20 | 27 | 39 | 39 | 55 | 49 | 33 | 57 | 40 | 150 | 27 | 91 | 109 | 82 | 87 | 97 | 73 | 58 | 43 | 32 | 22 | 22 | 11 | 5 | … | … |
| females | 1,322 | … | … | … | … | … | 5 | 17 | 25 | 43 | 34 | 44 | 50 | 39 | 37 | 38 | 198 | 35 | 113 | 140 | 106 | 98 | 73 | 71 | 51 | 29 | 31 | 21 | 17 | 4 | 2 | 1 | … | |
| Read only | Males | 83 | … | … | … | … | 6 | 9 | 15 | 6 | 5 | 3 | … | 1 | 3 | … | … | 1 | … | 1 | 1 | 2 | 1 | 2 | 2 | 4 | 4 | 4 | 4 | 2 | 4 | 3 | … | … |
| Females | 129 | … | … | … | 1 | 3 | 9 | 18 | 8 | 7 | 6 | 2 | 1 | … | … | … | 2 | 1 | 2 | 9 | 7 | 11 | 10 | 2 | 3 | 13 | 6 | 7 | … | … | 1 | … | … | |
| Cannot Read | Males | 369 | 64 | 52 | 53 | 50 | 47 | 34 | 20 | 10 | 5 | 2 | 1 | … | … | 1 | 1 | 1 | 2 | 1 | 2 | 2 | 2 | 4 | 4 | 4 | 4 | 1 | 3 | 2 | … | 2 | … | 1 |
| Females | 341 | 54 | 32 | 44 | 30 | 46 | 39 | 18 | 12 | 2 | 2 | … | 1 | 1 | … | … | 4 | 1 | 2 | 3 | 3 | 1 | 4 | 3 | 3 | … | 2 | 5 | 1 | 2 | 1 | … | … | |
| Education unknown | Males | … | … | … | … | … | … | … | … | … | … | … | … | … | … | … | … | … | … | … | … | … | … | … | … | … | … | … | … | … | … | … | … | … |
| Females | 11 | … | … | … | … | … | … | … | … | … | … | … | … | … | … | … | … | … | 2 | … | 4 | 2 | … | 1 | 1 | … | … | … | 1 | … | … | … | … | |
| Total | Males | 1,724 | 64 | 52 | 53 | 50 | 53 | 47 | 55 | 43 | 49 | 44 | 56 | 50 | 36 | 58 | 41 | 152 | 29 | 93 | 112 | 86 | 90 | 103 | 79 | 63 | 50 | 38 | 26 | 26 | 15 | 10 | … | 1 |
| Females | 1,803 | 54 | 32 | 44 | 56 | 49 | 53 | 53 | 45 | 52 | 42 | 46 | 52 | 40 | 37 | 38 | 204 | 37 | 119 | 152 | 129 | 112 | 87 | 77 | 58 | 42 | 39 | 33 | 19 | 6 | 4 | 1 | … | |
| Onehunga— | ||||||||||||||||||||||||||||||||||
| Read and Write | Males | 728 | … | … | … | … | … | 1 | 8 | 20 | 15 | 18 | 29 | 25 | 28 | 31 | 28 | 89 | 13 | 45 | 58 | 49 | 47 | 51 | 38 | 42 | 28 | 23 | 12 | 17 | 11 | 2 | … | … |
| Females | 844 | … | … | … | … | … | 5 | 6 | 19 | 22 | 42 | 30 | 34 | 38 | 23 | 33 | 132 | 26 | 54 | 66 | 69 | 61 | 42 | 33 | 37 | 22 | 23 | 11 | 8 | 1 | 3 | … | 1 | |
| Read only | Males | 70 | … | … | … | … | 2 | 4 | 10 | 13 | 7 | 4 | 1 | 1 | … | 1 | 3 | 2 | … | 3 | 2 | 2 | 3 | 4 | … | … | 2 | 1 | … | 4 | 1 | … | … | … |
| Females | 102 | … | … | … | … | … | 10 | 14 | 13 | 6 | 4 | 3 | … | 1 | 1 | … | … | … | 1 | 2 | 3 | 4 | 6 | 2 | 7 | 5 | 7 | 7 | 4 | 2 | … | … | … | |
| Cannot Read | Males | 249. | 28 | 34 | 40 | 36 | 41 | 25 | 15 | 3 | 1 | 1 | … | … | 1 | … | … | … | … | 1 | 1 | 2 | 2 | 4 | 2 | 4 | 1 | 1 | 2 | 3 | … | … | … | … |
| Females | 224 | 33 | 32 | 35 | 29 | 22 | 22 | 13 | 4 | 1 | … | … | … | … | … | … | … | … | 2 | … | 2 | 1 | 1 | 3 | 5 | 3 | 4 | 4 | 2 | 2 | 1 | … | … | |
| Education unknown | Males | … | … | … | … | … | … | … | … | … | … | … | … | … | … | … | … | … | … | … | … | … | … | … | … | … | … | … | … | … | … | … | … | … |
| Females | … | … | … | … | … | … | … | … | … | … | … | … | … | … | … | … | … | … | … | … | … | … | … | … | … | … | … | … | … | … | … | … | … | |
| Total | Males | 1,047 | 28 | 34 | 40 | 36 | 43 | 30 | 33 | 36 | 23 | 23 | 30 | 26 | 29 | 32 | 31 | 91 | 13 | 49 | 61 | 53 | 52 | 59 | 40 | 46 | 31 | 26 | 14 | 24 | 12 | 2 | … | … |
| Females | 1,170 | 33 | 32 | 35 | 29 | 22 | 37 | 33 | 36 | 29 | 46 | 33 | 35 | 39 | 26 | 33 | 132 | 26 | 57 | 68 | 74 | 66 | 49 | 40 | 49 | 30 | 34 | 22 | 14 | 6 | 4 | … | 1 | |
| Thames— | ||||||||||||||||||||||||||||||||||
| Read and Write | Males | 1,830 | … | … | … | … | … | 5 | 22 | 48 | 56 | 63 | 74 | 70 | 49 | 52 | 56 | 174 | 36 | 117 | 135 | 138 | 195 | 219 | 119 | 95 | 40 | 27 | 15 | 11 | 7 | … | 2 | 5 |
| Females | 1,580 | … | … | … | … | … | 6 | 26 | 44 | 44 | 55 | 71 | 51 | 75 | 49 | 56 | 212 | 44 | 117 | 149 | 145 | 141 | 111 | 66 | 45 | 26 | 19 | 11 | 5 | 4 | 1 | 2 | 5 | |
Table XV. Table XV. Showing the Education of Persons Males and Females (exclusive of Maoris and Chinese) in each Borough—continued.
| Boroughs. | All Ages. | Under 5. | 5 and under 10. | 10 and under 15. | 15 and under 21. | 21 and under 40. | 40 and under 60. | 60 and under 80. | 80 and upwards | Unspecified Children | Unspecified Adults | |||||||||||||||||||||||
|---|---|---|---|---|---|---|---|---|---|---|---|---|---|---|---|---|---|---|---|---|---|---|---|---|---|---|---|---|---|---|---|---|---|---|
| Under 1 Year. | 1-2. | 3-3. | 3-4. | 4-5. | 5-6. | 6-7. | 7-8. | 8-9. | 9-10. | 10-11. | 11-12. | 12-13. | 13-14. | 14-15. | 15-20. | 20-21. | 21-25. | 25-30. | 30-35. | 35-40. | 40-45. | 45-50. | 50-55. | 55-60. | 60-65. | 65-70. | 70-75. | 75-80. | ||||||
| Thames—continued. | ||||||||||||||||||||||||||||||||||
| Read only | Males | 139 | … | … | … | … | 9 | 27 | 40 | 18 | 5 | 8 | 1 | … | 1 | … | … | 3 | 1 | 1 | … | … | 7 | 6 | 3 | 2 | 1 | 4 | … | … | 1 | … | … | 1 |
| Females | 191 | … | … | … | … | 12 | 29 | 23 | 18 | 24 | 4 | 3 | … | 1 | 1 | 2 | 2 | 1 | 7 | 7 | 5 | 9 | 13 | 11 | 5 | 5 | 2 | 4 | 1 | … | 1 | … | 1 | |
| Cannot Read | Males | 562 | 92 | 66 | 94 | 85 | 79 | 63 | 25 | 11 | 6 | 1 | 3 | 1 | 1 | … | 1 | 1 | … | 1 | 1 | … | 8 | 6 | 6 | 3 | 4 | 2 | 1 | 1 | … | … | … | … |
| Females | 550 | 92 | 78 | 94 | 85 | 81 | 48 | 19 | 10 | 2 | 2 | … | … | 1 | … | … | … | 1 | 1 | 2 | 7 | 7 | 7 | 2 | 3 | 1 | 2 | 3 | … | … | … | 2 | … | |
| Education unknown | Males | 7 | … | … | … | … | … | 1 | 1 | … | … | 1 | … | … | … | … | … | … | … | … | … | … | … | 2 | … | 1 | … | 1 | … | … | … | … | … | … |
| Females | 4 | … | … | … | … | … | … | 1 | … | … | … | … | … | … | … | … | 1 | … | … | 1 | … | … | … | … | … | … | 1 | … | … | … | … | … | … | |
| Total | Males | 2,538 | 92 | 66 | 94 | 85 | 88 | 96 | 88 | 77 | 67 | 73 | 78 | 71 | 51 | 52 | 57 | 178 | 37 | 119 | 136 | 138 | 210 | 233 | 128 | 101 | 45 | 34 | 16 | 12 | 8 | … | 2 | 6 |
| Females | 2,325 | 92 | 78 | 94 | 85 | 93 | 83 | 69 | 72 | 70 | 61 | 74 | 51 | 77 | 50 | 58 | 215 | 46 | 125 | 159 | 157 | 157 | 131 | 79 | 53 | 32 | 24 | 18 | 6 | 4 | 2 | 4 | 6 | |
| Gisborne— | ||||||||||||||||||||||||||||||||||
| Read and Write | Males | 726 | … | … | … | … | … | 3 | 16 | 14 | 25 | 19 | 24 | 19 | 23 | 19 | 20 | 61 | 10 | 50 | 88 | 70 | 95 | 68 | 45 | 25 | 13 | 7 | 6 | 1 | 1 | … | … | 4 |
| Females | 564 | … | … | … | … | … | 8 | 14 | 10 | 15 | 14 | 22 | 18 | 18 | 21 | 17 | 61 | 15 | 57 | 84 | 65 | 45 | 34 | 18 | 9 | 6 | 6 | … | 2 | … | 1 | … | 4 | |
| Read only | Males | 24 | … | … | … | … | 3 | 2 | 4 | 3 | 3 | 1 | … | … | … | … | 1 | … | … | 1 | … | 2 | 1 | 3 | … | … | … | … | … | … | … | … | … | … |
| Females | 26 | … | … | … | … | 2 | 4 | 5 | 3 | 3 | 1 | 1 | … | … | … | … | … | … | … | 2 | 1 | 2 | … | … | 2 | … | … | … | … | … | … | … | … | |
| Cannot Read | Males | 206 | 36 | 38 | 36 | 37 | 26 | 16 | 7 | 4 | 3 | … | … | 1 | … | … | … | … | … | … | … | … | … | 1 | 1 | … | … | … | … | … | … | … | … | … |
| Females | 184 | 41 | 25 | 30 | 20 | 23 | 10 | 10 | 3 | 2 | … | 1 | 2 | … | … | 1 | 1 | … | 1 | 3 | 1 | 3 | 1 | … | … | … | … | … | … | … | … | … | … | |
| Education unknown | Males | 2 | … | … | … | … | … | … | … | … | … | … | … | … | … | … | … | … | … | 1 | … | 1 | … | … | … | … | … | … | … | … | … | … | … | … |
| Females | 4 | … | … | … | … | … | … | … | … | … | … | … | … | … | … | … | 2 | … | … | … | 1 | 1 | … | … | … | … | … | … | … | … | … | … | … | |
| Total | Males | 958 | 36 | 38 | 36 | 37 | 29 | 21 | 27 | 21 | 31 | 20 | 24 | 20 | 23 | 19 | 21 | 61 | 10 | 52 | 88 | 73 | 96 | 72 | 46 | 25 | 13 | 7 | 6 | 1 | 1 | … | … | 4 |
| Females | 778 | 41 | 25 | 30 | 20 | 25 | 28 | 29 | 16 | 20 | 15 | 24 | 20 | 18 | 21 | 18 | 64 | 15 | 58 | 89 | 68 | 51 | 35 | 18 | 11 | 6 | 6 | … | 2 | … | 1 | … | 4 | |
| Hamilton— | ||||||||||||||||||||||||||||||||||
| Read and Write | Males | 516 | … | … | … | … | … | … | 2 | 8 | 16 | 22 | 16 | 17 | 14 | 22 | 23 | 55 | 8 | 40 | 55 | 43 | 44 | 43 | 22 | 30 | 16 | 12 | 4 | 2 | 1 | … | … | 1 |
| Females | 466 | … | … | … | … | … | … | 9 | 12 | 11 | 17 | 20 | 18 | 18 | 22 | 17 | 47 | 14 | 50 | 36 | 40 | 38 | 17 | 24 | 19 | 6 | 7 | 1 | 1 | … | … | … | 2 | |
| Read only | Males | 20 | … | … | … | … | … | 3 | 5 | 6 | 3 | 1 | … | … | … | … | … | … | … | … | 2 | … | … | … | … | … | … | … | … | … | … | … | … | … |
| Males | 34 | … | … | … | … | 3 | 4 | 7 | 5 | 2 | 1 | 1 | 1 | 2 | … | … | 2 | … | 2 | 1 | 1 | … | 1 | 1 | … | … | … | … | … | … | … | … | … | |
| Cannot Read | Males | 159 | 25 | 17 | 21 | 25 | 28 | 20 | 9 | 5 | 3 | 1 | 2 | … | … | … | … | … | … | … | … | … | … | 1 | … | 1 | … | … | … | 1 | … | … | … | … |
| Females | 155 | 22 | 27 | 24 | 26 | 21 | 15 | 8 | 3 | 5 | 1 | … | … | … | … | … | … | … | 1 | … | … | … | … | … | 1 | 1 | … | … | … | … | … | … | … | |
| Education unknown | Males | 5 | … | … | … | … | … | … | … | … | … | … | … | … | … | … | … | … | … | 1 | … | … | 2 | … | 1 | 1 | … | … | … | … | … | … | … | … |
| Females | 6 | … | … | … | … | … | … | … | … | … | … | … | … | … | … | … | … | … | 3 | … | … | 1 | … | … | 1 | … | 1 | … | … | … | … | … | … | |
| Total | Males | 700 | 25 | 17 | 21 | 25 | 28 | 23 | 16 | 19 | 22 | 24 | 18 | 17 | 14 | 22 | 23 | 55 | 8 | 41 | 57 | 43 | 46 | 44 | 23 | 32 | 16 | 12 | 4 | 3 | 1 | … | … | 1 |
| Females | 661 | 22 | 27 | 24 | 26 | 24 | 19 | 24 | 20 | 18 | 19 | 21 | 19 | 20 | 22 | 17 | 49 | 14 | 56 | 57 | 41 | 39 | 18 | 25 | 21 | 7 | 8 | 1 | 1 | … | … | … | 2 | |
| New Plymouth— | ||||||||||||||||||||||||||||||||||
| Read and Write | Males | 1,223 | … | … | … | … | … | 10 | 17 | 31 | 37 | 32 | 34 | 32 | 37 | 35 | 35 | 123 | 24 | 98 | 148 | 110 | 92 | 87 | 64 | 62 | 35 | 29 | 18 | 14 | 5 | 4 | … | 10 |
| Females | 1,193 | … | … | … | … | … | 6 | 17 | 24 | 28 | 29 | 37 | 30 | 41 | 27 | 54 | 177 | 40 | 123 | 127 | 114 | 65 | 61 | 54 | 31 | 28 | 29 | 19 | 12 | 7 | 7 | 1 | 5 | |
| Read only | Males | 68 | … | … | … | … | 6 | 10 | 13 | 11 | 5 | 4 | 2 | 3 | … | … | … | 1 | … | 1 | … | 2 | 1 | 1 | 4 | 1 | 1 | 1 | … | 1 | … | … | … | … |
| Females | 75 | … | … | … | … | 10 | 5 | 12 | 9 | 3 | 6 | … | 2 | 3 | 1 | … | … | … | 2 | 2 | 1 | 1 | 3 | 5 | 1 | 1 | 1 | 3 | 1 | 2 | 1 | … | … | |
Table XV. Table XV. Showing the Education of Persons Males and Females (exclusive of Maoris and Chinese) in each Borough—continued.
| Boroughs. | All Ages. | Under 5. | 5 and under 10. | 10 and under 15. | 15 and under 21. | 21 and under 40. | 40 and under 60. | 60 and under 80. | 80 and upwards | Unspecified Children | Unspecified Adults | |||||||||||||||||||||||
|---|---|---|---|---|---|---|---|---|---|---|---|---|---|---|---|---|---|---|---|---|---|---|---|---|---|---|---|---|---|---|---|---|---|---|
| Under 1 Year. | 1-2. | 3-3. | 3-4. | 4-5. | 5-6. | 6-7. | 7-8. | 8-9. | 9-10. | 10-11. | 11-12. | 12-13. | 13-14. | 14-15. | 15-20. | 20-21. | 21-25. | 25-30. | 30-35. | 35-40. | 40-45. | 45-50. | 50-55. | 55-60. | 60-65. | 65-70. | 70-75. | 75-80. | ||||||
| Cannot Read | Males | 374 | 63 | 51 | 66 | 58 | 49 | 27 | 13 | 9 | 1 | 1 | … | 1 | 2 | 1 | … | 4 | … | 1 | 2 | 4 | 3 | 5 | … | 5 | … | 4 | 2 | … | … | … | 2 | … |
| Females | 366 | 66 | 54 | 63 | 55 | 45 | 33 | 15 | 6 | 4 | 3 | 1 | … | … | … | … | … | … | 1 | … | 2 | 3 | 2 | 4 | 2 | 2 | 1 | … | … | … | 1 | … | … | |
| Education unknown | Males | 3 | … | … | … | … | … | … | 1 | … | … | … | … | … | … | … | … | … | … | … | … | … | … | … | … | … | … | … | … | … | … | … | … | 2 |
| Females | 3 | … | … | … | … | … | … | 1 | … | 1 | … | … | … | … | … | … | … | … | … | … | … | … | … | … | … | … | … | … | … | … | … | … | 1 | |
| Total | Males | 1,668 | 63 | 51 | 66 | 58 | 55 | 47 | 44 | 51 | 43 | 37 | 36 | 35 | 128 | 24 | 100 | 150 | 116 | 96 | 93 | 68 | 36 | 34 | 20 | 15 | 5 | 4 | 2 | 12 | … | … | … | … |
| Females | 1,637 | 66 | 54 | 63 | 55 | 55 | 44 | 45 | 39 | 36 | 38 | 38 | 32 | 44 | 28 | 55 | 178 | 40 | 127 | 129 | 17 | 69 | 66 | 63 | 34 | 31 | 31 | 22 | 13 | 9 | 9 | 1 | 6 | |
| Wanganui— | ||||||||||||||||||||||||||||||||||
| Read and Write | Males | 1,693 | … | … | … | … | … | 13 | 34 | 40 | 38 | 42 | 48 | 42 | 59 | 45 | 44 | 197 | 34 | 138 | 197 | 150 | 156 | 135 | 111 | 74 | 36 | 27 | 13 | 6 | 7 | 1 | … | 6 |
| Females | 1,651 | … | … | … | … | … | 15 | 31 | 42 | 55 | 50 | 54 | 63 | 54 | 44 | 60 | 220 | 44 | 201 | 1S4 | 150 | 113 | 83 | 59 | 51 | 30 | 24 | 9 | 6 | 3 | 3 | … | 3 | |
| Read only | Males | 100 | … | … | … | … | 8 | 10 | 16 | 14 | 12 | 3 | 2 | … | 3 | 1 | 1 | 2 | … | 2 | 4 | 4 | … | 8 | 4 | … | 2 | 1 | 2 | 1 | … | … | … | … |
| Females | 132 | … | … | … | 1 | 9 | 22 | 18 | 13 | 12 | 3 | 3 | 2 | … | 1 | 1 | … | … | 3 | 6 | 3 | 11 | 7 | 7 | 4 | 2 | 2 | 1 | … | 1 | … | … | … | |
| Cannot Read | Males | 532 | 94 | 88 | 87 | 77 | 69 | 40 | 19 | 10 | 4 | 1 | 4 | 1 | 1 | 2 | 2 | 7 | 1 | 3 | 2 | 1 | 5 | 1 | 1 | 2 | 3 | 4 | 1 | … | … | … | … | … |
| Females | 527 | 107 | 87 | 90 | 76 | 61 | 45 | 22 | 5 | 4 | … | … | … | 1 | 1 | 1 | 4 | … | 2 | 5 | 5 | 4 | 11 | 9 | 8 | 2 | 5 | … | 1 | … | … | … | … | |
| Education unknown | Males | 1 | … | … | … | … | … | … | … | … | … | … | … | … | … | … | … | … | … | … | … | 1 | … | … | … | … | … | … | … | … | … | … | … | … |
| Females | 6 | … | … | … | … | … | … | … | … | … | … | 1 | 1 | … | … | … | 1 | … | … | 1 | … | 1 | … | 1 | … | … | … | … | … | … | … | … | … | |
| Total | Males | 2,326 | 94 | 88 | 87 | 77 | 77 | 63 | 69 | 64 | 54 | 48 | 54 | 43 | 63 | 48 | 47 | 206 | 35 | 143 | 203 | 156 | 161 | 144 | 116 | 76 | 41 | 32 | 16 | 7 | 7 | 1 | … | 6 |
| Females | 2,316 | 107 | 57 | 90 | 77 | 70 | 82 | 71 | 61 | 71 | 53 | 58 | 66 | 55 | 46 | 62 | 225 | 44 | 206 | 196 | 158 | 129 | 101 | 76 | 67 | 34 | 31 | 10 | 7 | 4 | 3 | … | 3 | |
| Marton— | ||||||||||||||||||||||||||||||||||
| Read and Write | Males | 290 | … | … | … | … | … | … | 2 | 5 | 8 | 9 | 11 | 11 | 6 | 7 | 8 | 37 | 5 | 20 | 29 | 34 | 24 | 21 | 22 | 15 | 7 | 6 | 1 | … | … | … | … | 2 |
| Females | 195 | … | … | … | … | … | … | 1 | 2 | 3 | 10 | 6 | 9 | 6 | … | … | 29 | 2 | 23 | 24 | 20 | 15 | 12 | 10 | 8 | 4 | … | 1 | … | … | … | … | … | |
| Read only | Males | 10 | … | … | … | … | 1 | 1 | 2 | … | 2 | … | 1 | … | … | … | … | 1 | … | … | … | … | 1 | … | 1 | … | … | … | … | … | … | … | … | … |
| Females | 16 | … | … | … | … | 1 | 2 | 4 | 1 | 1 | 1 | … | … | 1 | … | 1 | … | … | … | 1 | … | … | 1 | … | … | 1 | … | … | … | 1 | … | … | … | |
| Cannot Read | Males | 63 | 11 | 12 | 13 | 7 | 12 | 3 | 3 | … | … | … | … | … | … | … | … | … | … | … | … | 1 | … | … | … | … | … | 1 | … | … | … | … | … | … |
| Females | 88 | 14 | 14 | 13 | 13 | 13 | 13 | 4 | 2 | … | … | … | … | … | … | … | … | … | … | 1 | … | … | … | … | 1 | … | … | … | … | … | … | … | … | |
| Education unknown | Males | … | … | … | … | … | … | … | … | … | … | … | … | … | … | … | … | … | … | … | … | … | … | … | … | … | … | … | … | … | … | … | … | … |
| Females | … | … | … | … | … | … | … | … | … | … | … | … | … | … | … | … | … | … | … | … | … | … | … | … | … | … | … | … | … | … | … | … | … | |
| Total | Males | 363 | 11 | 12 | 13 | 7 | 13 | 4 | 7 | 5 | 10 | 9 | 12 | 11 | 6 | 7 | 8 | 38 | 5 | 20 | 29 | 35 | 25 | 21 | 23 | 15 | 7 | 7 | 1 | … | … | … | … | 2 |
| Females | 299 | 14 | 14 | 13 | 13 | 14 | 15 | 9 | 5 | 4 | 11 | 6 | 9 | 7 | 5 | 6 | 29 | 2 | 23 | 26 | 20 | 15 | 13 | 10 | 9 | 3 | … | 1 | … | 1 | … | … | … | |
| Palmerston North— | ||||||||||||||||||||||||||||||||||
| Read and Write | Males | 515 | … | … | … | … | … | 2 | 11 | 7 | 18 | 12 | 17 | 11 | 14 | 7 | 14 | 44 | 12 | 38 | 59 | 72 | 63 | 49 | 25 | 19 | 7 | 9 | 3 | … | 1 | … | … | 1 |
| Females | 418 | … | … | … | … | … | 6 | 6 | 11 | 19 | 12 | 25 | 15 | 10 | 8 | 11 | 54 | 9 | 33 | 48 | 57 | 33 | 22 | 12 | 7 | 5 | 7 | 2 | 1 | … | … | … | … | |
| Read only | Males | 29 | … | … | … | … | 4 | 5 | 4 | 2 | 4 | 4 | 1 | … | … | … | 1 | 1 | … | … | … | … | 1 | 1 | … | … | … | … | … | … | … | … | 1 | … |
| Females | 43 | … | … | … | 1 | 3 | 4 | 10 | 4 | 3 | … | … | … | 1 | … | … | … | … | … | … | 2 | 5 | 2 | 4 | 1 | … | 1 | 2 | … | … | … | … | … | |
| Cannot Read | Males | 177 | 27 | 28 | 25 | 29 | 27 | 18 | 7 | 2 | … | … | … | … | … | 1 | … | 1 | 1 | … | 1 | 5 | 3 | 1 | … | … | … | 1 | … | … | … | … | … | … |
| Females | 181 | 32 | 30 | 26 | 33 | 20 | 12 | 14 | 2 | 1 | … | … | … | 1 | … | … | … | … | 2 | 1 | 4 | 1 | … | … | … | … | 2 | … | … | … | … | … | … | |
| Education unknown | Males | 1 | … | … | … | … | … | … | … | … | … | 1 | … | … | … | … | … | … | … | … | … | … | … | … | … | … | … | … | … | … | … | … | … | … |
| Females | 1 | … | … | … | … | … | … | … | … | … | … | … | … | … | … | … | … | 1 | … | … | … | … | … | … | … | … | … | … | … | … | … | … | … | |
| Total | Males | 722 | 27 | 28 | 25 | 29 | 31 | 25 | 22 | 11 | 22 | 17 | 18 | 11 | 14 | 8 | 15 | 46 | 13 | 38 | 60 | 77 | 67 | 51 | 25 | 19 | 7 | 10 | 3 | … | 1 | … | 1 | 1 |
| Females | 643 | 32 | 30 | 26 | 34 | 23 | 22 | 30 | 17 | 23 | 12 | 25 | 15 | 12 | 8 | 11 | 55 | 9 | 35 | 49 | 63 | 44 | 24 | 16 | 8 | 5 | 10 | 4 | 1 | … | … | … | … | |
| Wellington— | ||||||||||||||||||||||||||||||||||
| Read and Write | Males | 7,494 | … | … | … | … | … | 34 | 106 | 163 | 199 | 231 | 245 | 234 | 218 | 209 | 202 | 825 | 138 | 663 | 882 | 709 | 687 | 602 | 405 | 273 | 173 | 127 | 56 | 45 | 16 | 5 | 9 | 38 |
| Females | 7,404 | … | … | … | … | … | 36 | 94 | 160 | 208 | 245 | 227 | 228 | 223 | 216 | 233 | 1,026 | 219 | 891 | 841 | 667 | 58o | 416 | 290 | 219 | 113 | 102 | 55 | 43 | 15 | 9 | 4 | 41 | |
| Read only | Males | 358 | … | … | … | 3 | 28 | 60 | 72 | 52 | 30 | 14 | 8 | 4 | 3 | 3 | 6 | 8 | … | 5 | 8 | 13 | 8 | 7 | 7 | 4 | 4 | 4 | 3 | 1 | … | … | 1 | 2 |
| Females | 494 | … | … | … | 5 | 22 | 58 | 107 | 59 | 33 | 14 | 8 | 7 | 4 | 2 | 4 | 6 | 5 | 11 | 16 | 22 | 20 | 25 | 22 | 17 | 2 | 8 | 9 | 5 | 1 | … | … | 2 | |
Table XV. Table XV. Showing the Education of Persons Males and Females (exclusive of Maoris and Chinese) in each Borough—continued.
| Boroughs. | All Ages. | Under 5. | 5 and under 10. | 10 and under 15. | 15 and under 21. | 21 and under 40. | 40 and under 60. | 60 and under 80. | 80 and upwards | Unspecified Children | Unspecified Adults | |||||||||||||||||||||||
|---|---|---|---|---|---|---|---|---|---|---|---|---|---|---|---|---|---|---|---|---|---|---|---|---|---|---|---|---|---|---|---|---|---|---|
| Under 1 Year. | 1-2. | 3-3. | 3-4. | 4-5. | 5-6. | 6-7. | 7-8. | 8-9. | 9-10. | 10-11. | 11-12. | 12-13. | 13-14. | 14-15. | 15-20. | 20-21. | 21-25. | 25-30. | 30-35. | 35-40. | 40-45. | 45-50. | 50-55. | 55-60. | 60-65. | 65-70. | 70-75. | 75-80. | ||||||
| Wellington—continued. | ||||||||||||||||||||||||||||||||||
| Cannot Read | Males | 2,267 | 409 | 315 | 365 | 350 | 307 | 228 | 111 | 34 | 13 | 2 | 2 | 2 | 3 | 1 | 1 | 6 | 2 | 9 | 14 | 13 | 11 | 15 | 12 | 8 | 8 | 9 | 4 | 3 | 1 | 4 | 4 | 1 |
| Females | 2,312 | 392 | 355 | 335 | 359 | 315 | 244 | 92 | 42 | 20 | 6 | 2 | 2 | 5 | 3 | 3 | 8 | 4 | 14 | 17 | 16 | 20 | 18 | 9 | 6 | 6 | 6 | 2 | 2 | 1 | 1 | 3 | 4 | |
| Education unknown | Males | 81 | … | … | … | … | … | … | 1 | 2 | 1 | 1 | 2 | … | … | … | 2 | 5 | … | 3 | 10 | 13 | 16 | 7 | 5 | 7 | 2 | … | 1 | 1 | 1 | … | … | 1 |
| Females | 127 | … | … | … | … | … | … | … | 2 | 1 | 3 | … | … | 2 | 1 | 3 | 9 | 4 | 13 | 11 | 16 | 17 | 6 | 16 | 8 | … | 6 | 1 | 3 | 2 | … | 1 | 2 | |
| Total | Males | 10,200 | 409 | 315 | 365 | 353 | 535 | 322 | 290 | 251 | 243 | 248 | 257 | 240 | 224 | 213 | 211 | 844 | 140 | 680 | 914 | 748 | 721 | 631 | 429 | 292 | 187 | 140 | 64 | 50 | 18 | 9 | 14 | 42 |
| Females | 10,337 | 392 | 355 | 335 | 364 | 337 | 338 | 293 | 263 | 262 | 268 | 237 | 237 | 234 | 222 | 243 | 1,049 | 232 | 929 | 885 | 721 | 637 | 465 | 337 | 250 | 121 | 122 | 67 | 53 | 19 | 10 | 11 | 49 | |
| Masterton— | ||||||||||||||||||||||||||||||||||
| Read and Write | Males | 735 | … | … | … | … | … | 2 | 6 | 13 | 23 | 18 | 23 | 25 | 12 | 20 | 19 | 50 | 13 | 66 | 104 | 99 | 70 | 74 | 33 | 31 | 12 | 8 | 10 | 2 | 1 | 1 | … | … |
| Females | 683 | … | … | … | … | … | … | 7 | 17 | 16 | 26 | 25 | 18 | 27 | 19 | 22 | 84 | 16 | 70 | 101 | 88 | 54 | 32 | 16 | 22 | 7 | 7 | 5 | 2 | 1 | 1 | … | … | |
| Read only | Males | 61 | … | … | … | … | 5 | 4 | 11 | 7 | 6 | 5 | … | … | … | 2 | 1 | 1 | 1 | … | 2 | 5 | 2 | 5 | … | 1 | 1 | … | … | 1 | … | … | … | … |
| Females | 59 | … | … | … | … | 1 | 3 | 8 | 9 | 4 | 2 | 3 | 1 | … | 1 | 1 | 4 | … | 1 | 1 | 6 | 3 | 2 | … | 2 | 2 | … | … | … | … | … | … | ||
| Cannot Read | Males | 354 | 57 | 49 | 48 | 51 | 52 | 36 | 18 | 10 | 5 | 1 | 1 | 1 | … | … | … | 1 | … | … | 3 | 5 | 8 | 3 | … | 1 | 1 | 1 | 2 | … | … | … | … | … |
| Females | 344 | 46 | 55 | 62 | 55 | 36 | 30 | 18 | 8 | 3 | 2 | … | … | … | 1 | 1 | 3 | … | 2 | 4 | 4 | 3 | 2 | 3 | 4 | … | … | 1 | … | … | … | 1 | … | |
| Education unknown | Males | 1 | … | … | … | … | … | … | … | … | … | … | … | … | … | … | … | … | … | … | … | … | … | … | 1 | … | … | … | … | … | … | … | … | … |
| Females | … | … | … | … | … | … | … | … | … | … | … | … | … | … | … | … | … | … | … | … | … | … | … | … | … | … | … | … | … | … | … | … | … | |
| Total | Males | 1,151 | 57 | 49 | 48 | 51 | 57 | 42 | 35 | 30 | 34 | 24 | 24 | 26 | 12 | 22 | 20 | 52 | 14 | 66 | 109 | 109 | 80 | 82 | 34 | 33 | 14 | 10 | 12 | 3 | 1 | 1 | … | … |
| Females | 1,086 | 46 | 55 | 62 | 55 | 37 | 33 | 33 | 34 | 23 | 30 | 28 | 19 | 27 | 21 | 24 | 91 | 16 | 73 | 106 | 98 | 60 | 36 | 24 | 28 | 9 | 7 | 6 | 2 | 1 | 1 | 1 | … | |
| Greytown— | ||||||||||||||||||||||||||||||||||
| Read and Write | Males | 376 | … | … | … | … | … | 1 | 4 | 12 | 7 | 11 | 17 | 15 | 8 | 12 | 14 | 47 | 6 | 30 | 37 | 34 | 34 | 21 | 21 | 17 | 5 | 7 | 5 | 9 | 1 | 1 | … | … |
| Females | 347 | … | … | … | … | … | 1 | 3 | 9 | 8 | 7 | 15 | 11 | 23 | 18 | 16 | 47 | 13 | 34 | 26 | 28 | 29 | 22 | 12 | 3 | 5 | 4 | 5 | 4 | … | … | … | 1 | |
| Read only | Males | 21 | … | … | … | 2 | 2 | 4 | 4 | 2 | … | 3 | 1 | … | … | … | … | … | … | … | … | 1 | … | 1 | … | … | 1 | … | … | … | … | … | … | … |
| Females | 20 | … | … | … | … | 2 | 1 | 3 | 2 | 4 | 1 | 1 | … | … | … | … | 1 | … | … | … | … | 1 | … | 2 | … | … | … | 1 | 1 | … | … | … | … | |
| Cannot Read | Males | 136 | 21 | 14 | 22 | 13 | 17 | 13 | 15 | 4 | 3 | 3 | 1 | … | 2 | … | 1 | … | … | … | 1 | 2 | … | 3 | 1 | … | … | … | … | … | … | … | … | … |
| Females | 130 | 20 | 21 | 20 | 17 | 17 | 15 | 6 | 6 | … | … | … | 1 | … | … | … | 1 | … | … | 1 | 1 | … | 3 | … | … | … | … | … | … | 1 | … | … | … | |
| Education unknown | Males | 25 | … | … | … | … | … | … | 4 | 3 | 1 | 3 | 1 | 2 | 1 | … | … | 1 | 1 | 1 | 1 | 3 | … | 2 | … | 1 | … | … | … | … | … | … | … | … |
| Females | 20 | … | … | … | … | … | 1 | 3 | 3 | … | 3 | 2 | … | … | … | … | 2 | … | 2 | 1 | … | … | 1 | 1 | 1 | … | … | … | … | … | … | … | … | |
| Total | Males | 558 | 21 | 14 | 22 | 15 | 19 | 18 | 27 | 21 | 11 | 20 | 20 | 17 | 11 | 12 | 15 | 48 | 7 | 31 | 39 | 40 | 34 | 27 | 22 | 18 | 6 | 7 | 5 | 9 | 1 | 1 | … | … |
| Females | 517 | 20 | 21 | 20 | 17 | 19 | 13 | 15 | 20 | 12 | 11 | 18 | 12 | 23 | 18 | 16 | 51 | 13 | 36 | 28 | 29 | 30 | 26 | 15 | 6 | 5 | 4 | 6 | 5 | 2 | … | … | 1 | |
| Napier— | ||||||||||||||||||||||||||||||||||
| Read and Write | Males | 2,129 | … | … | … | … | … | … | 12 | 44 | 72 | 48 | 59 | 71 | 67 | 63 | 59 | 237 | 39 | 167 | 255 | 53 | 203 | 178 | 123 | 86 | 41 | 31 | 17 | 9 | 6 | 2 | 3 | 5 |
| Females | 2,061 | … | … | … | … | … | 3 | 36 | 36 | 56 | 74 | 84 | 67 | 78 | 72 | 63 | 294 | 70 | 199 | 228 | 182 | 152 | 139 | 88 | 55 | 31 | 18 | 9 | 8 | 5 | 1 | 1 | 6 | |
| Read only | Males | 99 | … | … | … | 1 | 6 | 10 | 19 | 23 | 8 | 4 | 3 | 3 | … | … | … | 2 | … | 2 | … | 1 | 2 | 3 | 2 | 3 | 2 | 2 | 2 | … | … | … | 1 | … |
| Females | 131 | … | … | … | … | 7 | 11 | 19 | 12 | 11 | 10 | 5 | 1 | 2 | … | … | 2 | … | 3 | 2 | 8 | 10 | 10 | 3 | 6 | 3 | 2 | … | 2 | … | 1 | … | 1 | |
| Cannot Read | Males | 657 | 133 | 90 | 113 | 87 | 80 | 72 | 36 | 13 | 5 | 3 | 2 | … | … | 1 | 1 | 2 | … | … | 2 | 1 | 2 | 5 | 3 | … | 1 | 1 | … | 1 | 1 | … | 1 | 1 |
| Females | 658 | 119 | 13 | 104 | 81 | 89 | 70 | 45 | 21 | 5 | 2 | … | … | … | … | … | 2 | … | 1 | 3 | 3 | 4 | 4 | 5 | 5 | … | 3 | 1 | … | … | 1 | 1 | … | |
Table XV. Table XV. Showing the Education of Persons Males and Females (exclusive of Maoris and Chinese) in each Borough—continued.
| Boroughs. | All Ages. | Under 5. | 5 and under 10. | 10 and under 15. | 15 and under 21. | 21 and under 40. | 40 and under 60. | 60 and under 80. | 80 and upwards | Unspecified Children | Unspecified Adults | |||||||||||||||||||||||
|---|---|---|---|---|---|---|---|---|---|---|---|---|---|---|---|---|---|---|---|---|---|---|---|---|---|---|---|---|---|---|---|---|---|---|
| Under 1 Year. | 1-2. | 3-3. | 3-4. | 4-5. | 5-6. | 6-7. | 7-8. | 8-9. | 9-10. | 10-11. | 11-12. | 12-13. | 13-14. | 14-15. | 15-20. | 20-21. | 21-25. | 25-30. | 30-35. | 35-40. | 40-45. | 45-50. | 50-55. | 55-60. | 60-65. | 65-70. | 70-75. | 75-80. | ||||||
| Education unknown | Males | 11 | … | … | … | … | … | … | … | … | … | … | … | … | … | … | … | 1 | … | … | 3 | … | … | … | … | 1 | … | … | … | … | … | … | 1 | 5 |
| Females | 10 | … | … | … | … | … | … | 1 | … | … | … | … | 1 | … | … | … | … | 1 | 1 | 1 | 2 | 1 | … | … | … | … | … | … | … | … | … | 1 | 1 | |
| Total | Males | 2,896 | 133 | 90 | 113 | 88 | 86 | 82 | 67 | 80 | 85 | 55 | 64 | 74 | 67 | 64 | 60 | 242 | 39 | 169 | 260 | 234 | 207 | 186 | 128 | 90 | 44 | 34 | 19 | 10 | 7 | 2 | 6 | 11 |
| Females | 2,860 | 119 | 83 | 104 | 81 | 96 | 90 | 101 | 69 | 72 | 86 | 89 | 69 | 80 | 72 | 63 | 298 | 77 | 204 | 234 | 195 | 167 | 1S3 | 96 | 66 | 34 | 23 | 10 | 10 | 5 | 3 | 3 | 8 | |
| Picton— | ||||||||||||||||||||||||||||||||||
| Read and Write | Males | 295 | … | … | … | … | … | 4 | 4 | 10 | 5 | 14 | 11 | 21 | 12 | 5 | 9 | 30 | 5 | 23 | 21 | 16 | 21 | 18 | 21 | 16 | 10 | 7 | 3 | 6 | 3 | … | … | … |
| Females | 314 | … | … | … | … | … | … | 3 | 9 | 12 | 14 | 15 | 16 | 13 | 20 | 9 | 43 | 8 | 26 | 24 | 25 | 26 | 16 | 12 | 11 | 4 | 2 | 2 | 2 | 1 | … | … | 1 | |
| Read only | Males | 5 | … | … | … | … | … | 1 | … | 1 | 2 | … | … | … | … | … | 1 | … | … | … | … | … | … | … | … | … | … | … | … | … | … | … | … | … |
| Females | 18 | … | … | … | … | 1 | 3 | 6 | 4 | 1 | 1 | … | … | … | … | … | … | … | … | 1 | … | … | … | … | … | … | 1 | … | … | … | … | … | … | |
| Cannot Read | Males | 101 | 18 | 15 | 22 | 12 | 15 | 9 | 3 | 4 | … | 3 | … | … | … | … | … | … | … | … | … | … | … | … | … | … | … | … | … | … | … | … | … | … |
| Females | 101 | 17 | 10 | 13 | 17 | 15 | 16 | 5 | 2 | … | … | … | … | 1 | … | … | 2 | … | … | 1 | … | 1 | … | 1 | … | … | … | … | … | … | … | … | … | |
| Education unknown | Males | … | … | … | … | … | … | … | … | … | … | … | … | … | … | … | … | … | … | … | … | … | … | … | … | … | … | … | … | … | … | … | … | … |
| Females | … | … | … | … | … | … | … | … | … | … | … | … | … | … | … | … | … | … | … | … | … | … | … | … | … | … | … | … | … | … | … | … | … | |
| Total | Males | 401 | 18 | 15 | 22 | 12 | 15 | 14 | 7 | 15 | 7 | 17 | 11 | 21 | 12 | 5 | 10 | 30 | 5 | 23 | 21 | 16 | 21 | 18 | 21 | 16 | 10 | 7 | 3 | 6 | 3 | … | … | … |
| Females | 433 | 17 | 10 | 13 | 17 | 16 | 19 | 14 | 15 | 13 | 15 | 15 | 16 | 14 | 20 | 9 | 45 | 8 | 26 | 26 | 25 | 27 | 16 | 13 | 11 | 4 | 3 | 2 | 2 | 1 | … | … | 1 | |
| Blenheim— | ||||||||||||||||||||||||||||||||||
| Read and Write | Males | 712 | … | … | … | … | … | 2 | 4 | 9 | 18 | 19 | 26 | 28 | 32 | 19 | 13 | 78 | 14 | 70 | 80 | 66 | 53 | 55 | 52 | 31 | 11 | 19 | 5 | 5 | 1 | … | … | 2 |
| Females | 671 | … | … | … | … | … | 2 | 4 | 19 | 21 | 28 | 29 | 21 | 20 | 22 | 23 | 102 | 26 | 83 | 72 | 62 | 39 | 36 | 20 | 13 | 9 | 10 | 5 | 2 | 1 | 1 | … | 1 | |
| Read only | Males | 54 | … | … | … | … | 4 | 3 | 8 | 9 | 7 | 1 | 3 | 4 | 2 | 1 | … | … | … | 4 | 3 | … | 1 | 2 | 1 | … | 1 | … | … | … | … | … | … | … |
| Females | 54 | … | … | … | … | 2 | 3 | 7 | 7 | 4 | 1 | … | … | … | … | … | 2 | … | 2 | 7 | 3 | 1 | 1 | 3 | 3 | 2 | … | 2 | … | … | … | … | … | |
| Cannot Read | Males | 281 | 40 | 39 | 41 | 40 | 40 | 33 | 23 | 12 | 2 | 3 | … | 1 | … | … | … | 1 | … | … | 2 | … | … | … | … | 1 | 1 | 1 | … | 1 | … | … | … | … |
| Females | 332 | 72 | 36 | 48 | 52 | 39 | 27 | 23 | 7 | 6 | 3 | … | … | … | … | … | 2 | … | 1 | 3 | 2 | 4 | 2 | 1 | … | 1 | 1 | 1 | … | … | 1 | … | … | |
| Education unknown | Males | 3 | … | … | … | … | … | … | … | … | … | … | … | … | … | … | … | 1 | … | 1 | 1 | … | … | … | … | … | … | … | … | … | … | … | … | … |
| Females | 2 | … | … | … | … | … | … | … | … | … | … | … | … | … | … | … | … | 1 | … | … | 1 | … | … | … | … | … | … | … | … | … | … | … | … | |
| Total | Males | 1,050 | 40 | 39 | 41 | 40 | 44 | 38 | 35 | 30 | 27 | 23 | 29 | 33 | 34 | 20 | 13 | 80 | 14 | 75 | 86 | 66 | 54 | 57 | 53 | 32 | 13 | 20 | 5 | 6 | 1 | … | … | 2 |
| Females | 1,056 | 72 | 36 | 48 | 52 | 41 | 32 | 34 | 33 | 31 | 32 | 29 | 21 | 20 | 22 | 23 | 107 | 27 | 86 | 82 | 68 | 44 | 39 | 24 | 16 | 12 | 11 | 8 | 2 | 1 | 2 | … | 1 | |
| Nelson— | ||||||||||||||||||||||||||||||||||
| Read and Write | Males | 2,485 | … | … | … | … | … | 3 | 39 | 51 | 85 | 74 | 103 | 99 | 109 | 106 | 95 | 354 | 56 | 176 | 160 | 134 | 164 | 161 | 148 | 126 | 88 | 61 | 42 | 22 | 19 | 4 | … | 6 |
| Females | 2,693 | … | … | … | … | … | 10 | 34 | 74 | 75 | 84 | 102 | 81 | 101 | 91 | 70 | 469 | 70 | 267 | 214 | 177 | 170 | 159 | 135 | 88 | 73 | 50 | 32 | 29 | 17 | 10 | … | 5 | |
| Read only | Males | 142 | … | … | … | … | 6 | 21 | 22 | 24 | 13 | 7 | 2 | … | … | 2 | … | 3 | … | 1 | 2 | 2 | 7 | 5 | 6 | 5 | 4 | 3 | 2 | 2 | 2 | 1 | … | … |
| Females | 173 | … | … | … | 1 | 12 | 20 | 23 | 16 | 9 | 8 | 2 | 2 | … | … | 1 | 1 | … | 1 | 1 | 5 | 7 | 7 | 15 | 10 | 5 | 9 | 6 | 7 | 2 | 3 | … | … | |
| Cannot Read | Males | 620 | 106 | 79 | 117 | 100 | 80 | 66 | 32 | 11 | 1 | 2 | … | 2 | 2 | 2 | 1 | 1 | … | 2 | 2 | 2 | 1 | 2 | … | 4 | 2 | … | 1 | … | 1 | … | … | 1 |
| Females | 606 | 88 | 92 | 85 | 98 | 90 | 54 | 35 | 20 | 6 | 2 | 1 | … | … | … | … | 1 | … | 4 | 2 | 1 | 4 | 6 | 5 | 2 | 2 | 4 | 2 | 1 | 1 | … | … | … | |
| Education unknown | Males | 14 | … | … | … | … | … | … | … | … | 1 | … | … | 1 | … | … | … | 2 | … | 1 | … | 1 | 3 | 1 | 1 | … | … | 1 | … | 1 | … | … | … | 1 |
| Females | 31 | … | … | … | … | … | … | 2 | … | … | … | 3 | 2 | … | … | 1 | 3 | … | 1 | 1 | 1 | 3 | 6 | … | … | … | 2 | 3 | … | 1 | 2 | … | … | |
| Total | Males | 3,261 | 106 | 79 | 117 | 100 | 86 | 90 | 93 | 86 | 100 | 83 | 105 | 102 | 111 | 110 | 96 | 360 | 56 | 180 | 164 | 139 | 175 | 169 | 155 | 135 | 94 | 65 | 45 | 25 | 22 | 5 | … | 8 |
| Females | 3,503 | 88 | 92 | 85 | 99 | 102 | 84 | 94 | 110 | 90 | 94 | 108 | 85 | 101 | 91 | 72 | 474 | 76 | 273 | 218 | 184 | 184 | 178 | 155 | 100 | 80 | 65 | 43 | 37 | 21 | 15 | … | 5 | |
| Westport— | ||||||||||||||||||||||||||||||||||
| Read and Write | Males | 382 | … | … | … | … | … | 1 | 3 | 10 | 15 | 17 | 15 | 17 | 13 | 10 | 9 | 21 | 3 | 12 | 16 | 29 | 44 | 51 | 46 | 32 | 6 | 5 | 1 | 4 | … | … | … | 2 |
| Females | 329 | … | … | … | … | … | 1 | 4 | 7 | 10 | 14 | 14 | 11 | 13 | 7 | 10 | 41 | 8 | 27 | 33 | 31 | 37 | 26 | 22 | 7 | 3 | 2 | … | 1 | … | … | … | … | |
| Read only | Males | 35 | … | … | … | … | … | 4 | 10 | 16 | 3 | 1 | … | … | … | … | … | … | … | … | … | … | … | 1 | … | … | … | … | … | … | … | … | … | … |
| Females | 31 | … | … | … | … | 1 | 5 | 5 | 6 | 2 | 2 | … | … | 2 | … | … | 2 | … | … | 1 | 1 | 1 | 1 | … | 1 | … | … | … | … | 1 | … | … | … | |
| Cannot Read | Males | 121 | 21 | 12 | 27 | 22 | 15 | 12 | 6 | … | … | 2 | … | … | … | … | 1 | 1 | … | … | 1 | … | 1 | … | … | … | … | … | … | … | … | … | … | … |
| Females | 115 | 21 | 18 | 20 | 1s | 12 | 13 | 5 | 3 | 1 | … | … | … | … | … | … | … | … | … | … | 1 | 1 | 1 | … | 1 | … | 1 | … | 1 | 1 | … | … | … | |
Table XV. Table XV. Showing the Education of Persons Males and Females (exclusive of Maoris and Chinese) in each Borough—continued.
| Boroughs. | All Ages. | Under 5. | 5 and under 10. | 10 and under 15. | 15 and under 21. | 21 and under 40. | 40 and under 60. | 60 and under 80. | 80 and upwards | Unspecified Children | Unspecified Adults | |||||||||||||||||||||||
|---|---|---|---|---|---|---|---|---|---|---|---|---|---|---|---|---|---|---|---|---|---|---|---|---|---|---|---|---|---|---|---|---|---|---|
| Under 1 Year. | 1-2. | 3-3. | 3-4. | 4-5. | 5-6. | 6-7. | 7-8. | 8-9. | 9-10. | 10-11. | 11-12. | 12-13. | 13-14. | 14-15. | 15-20. | 20-21. | 21-25. | 25-30. | 30-35. | 35-40. | 40-45. | 45-50. | 50-55. | 55-60. | 60-65. | 65-70. | 70-75. | 75-80. | ||||||
| Westport—continued, | ||||||||||||||||||||||||||||||||||
| Education unknown | Males | … | … | … | … | … | … | … | … | … | … | … | … | … | … | … | … | … | … | … | … | … | … | … | … | … | … | … | … | … | … | … | … | … |
| Females | … | … | … | … | … | … | … | … | … | … | … | … | … | … | … | … | … | … | … | … | … | … | … | … | … | … | … | … | … | … | … | … | … | |
| Total | Males | 538 | 21 | 12 | 27 | 22 | 15 | 17 | 19 | 26 | 18 | 20 | 15 | 17 | 83 | 10 | 10 | 22 | 3 | 12 | 17 | 29 | 45 | 52 | 46 | 32 | 6 | 5 | 1 | 4 | … | … | … | 2 |
| Females | 475 | 21 | 18 | 20 | 15 | 13 | 19 | 14 | 16 | 13 | 16 | 14 | 11 | 15 | 7 | 10 | 43 | 8 | 27 | 34 | 33 | 39 | 28 | 22 | 9 | 3 | 3 | … | 2 | 2 | … | … | … | |
| Greymouth— | ||||||||||||||||||||||||||||||||||
| Read and Write | Males | 986 | … | … | … | … | … | 1 | 13 | 24 | 30 | 46 | 37 | 32 | 39 | 21 | 31 | 101 | 8 | 42 | 65 | 70 | 93 | 129 | 99 | 51 | 26 | 15 | 6 | 2 | 1 | … | … | 4 |
| Females | 910 | … | … | … | … | … | 7 | 18 | 33 | 37 | 33 | 34 | 43 | 32 | 24 | 26 | 98 | 32 | 71 | 80 | 79 | 95 | 82 | 49 | 15 | 8 | 4 | 2 | 3 | 2 | 1 | … | 2 | |
| Read only | Males | 52 | … | … | … | … | 7 | 10 | 15 | 8 | 4 | 1 | … | … | … | … | … | … | … | … | … | 2 | 2 | 2 | 1 | … | … | … | … | … | … | … | … | … |
| Female | 55 | … | … | … | … | 5 | 10 | 13 | 13 | 3 | … | … | … | … | … | 1 | … | … | … | … | 1 | 3 | 3 | 2 | … | … | … | 1 | … | … | … | … | … | |
| Cannot Read | Males | 248 | 36 | 32 | 44 | 39 | 39 | 29 | 10 | 3 | … | … | 1 | … | 1 | 1 | … | … | … | … | 2 | 1 | 1 | 3 | … | 2 | 1 | 1 | 2 | 1 | … | … | … | … |
| Females | 247 | 51 | 27 | 48 | 44 | 39 | 17 | 8 | 4 | 1 | … | 1 | … | 1 | … | … | … | … | … | … | 1 | 1 | 1 | 2 | … | … | 1 | … | … | … | * | … | … | |
| Education unknown | Males | … | … | … | … | … | … | … | … | … | … | … | … | … | … | … | … | … | … | … | … | … | … | … | … | … | … | … | … | … | … | … | … | … |
| Females | 1 | … | … | … | … | … | … | … | … | … | … | … | … | … | … | … | … | … | … | … | … | … | … | … | … | … | … | … | … | … | … | … | … | |
| Total | Males | 1,286 | 36 | 32 | 44 | 39 | 43 | 40 | 38 | 35 | 34 | 49 | 38 | 32 | 40 | 22 | 31 | 101 | 8 | 42 | 67 | 73 | 96 | 134 | 100 | 53 | 27 | 16 | 8 | 3 | 1 | … | … | 4 |
| Females | 1,213 | 51 | 27 | 48 | 44 | 44 | 34 | 39 | 50 | 41 | 33 | 35 | 43 | 33 | 24 | 27 | 98 | 32 | 71 | 80 | 82 | 99 | 86 | 53 | 15 | 8 | 5 | 3 | 3 | 2 | 1 | … | 2 | |
| Hokitika— | ||||||||||||||||||||||||||||||||||
| Read and Write | Males | 927 | … | … | … | … | … | 2 | 6 | 20 | 22 | 30 | 45 | 42 | 39 | 35 | 36 | 117 | 6 | 37 | 36 | 37 | 79 | 113 | 98 | 67 | 30 | 17 | 6 | 4 | 2 | 1 | … | … |
| Females | 1,006 | … | … | … | … | … | 2 | 14 | 27 | 37 | 50 | 53 | 43 | 49 | 43 | 30 | 134 | 17 | 60 | 67 | 70 | 100 | 92 | 50 | 32 | 11 | 5 | 6 | 4 | 2 | 1 | … | 1 | |
| Read only | Males | 51 | … | … | … | … | 2 | 6 | 12 | 12 | 8 | 3 | 3 | … | … | … | … | … | … | … | … | … | 1 | 2 | 1 | … | … | … | … | … | … | 1 | … | … |
| Females | 82 | … | … | … | … | 4 | 13 | 17 | 13 | 7 | 6 | … | 1 | 2 | … | … | … | … | 1 | … | 3 | 3 | 5 | 1 | 3 | … | 2 | 1 | … | … | … | … | … | |
| Cannot Read | Males | 263 | 42 | 38 | 42 | 42 | 44 | 22 | 17 | 4 | 2 | … | … | … | … | … | 1 | 1 | … | … | … | … | 1 | 5 | 1 | … | … | 1 | … | … | … | … | … | … |
| Females | 241 | 34 | 39 | 38 | 42 | 31 | 24 | 11 | 5 | … | 1 | … | … | … | … | 1 | … | … | … | … | … | 7 | 2 | 2 | 3 | … | 1 | … | … | … | … | … | … | |
| Education unknown | Males | 1 | … | … | … | … | … | … | … | … | … | … | … | … | … | … | … | … | … | … | … | … | … | … | … | … | 1 | … | … | … | … | … | … | … |
| Females | 7 | … | … | … | … | … | … | … | … | … | … | … | … | … | 1 | 1 | 2 | … | … | … | … | 2 | … | 1 | … | … | … | … | … | … | … | … | … | |
| Total | Males | 1,242 | 42 | 38 | 42 | 42 | 46 | 30 | 35 | 36 | 32 | 33 | 48 | 42 | 39 | 35 | 37 | 118 | 6 | 37 | 36 | 37 | 81 | 120 | 100 | 67 | 31 | 18 | 6 | 4 | 2 | 2 | … | … |
| Females | 1,356 | 34 | 39 | 38 | 42 | 35 | 39 | 42 | 43 | 44 | 57 | 53 | 44 | 51 | 44 | 32 | 136 | 17 | 67 | 67 | 73 | 112 | 99 | 54 | 38 | 11 | 8 | 7 | 4 | 2 | 1 | … | 1 | |
| Ross— | ||||||||||||||||||||||||||||||||||
| Read and Write | Males | 466 | … | … | … | … | … | 3 | 9 | 16 | 22 | 20 | 23 | 13 | 25 | 10 | 8 | 27 | 1 | 16 | 16 | 21 | 52 | 67 | 63 | 33 | 12 | 6 | 2 | 1 | … | … | … | … |
| Females | 323 | … | … | … | … | … | 4 | 5 | 15 | 10 | 21 | 22 | 21 | 16 | 13 | 15 | 26 | 2 | 15 | 11 | 35 | 38 | 24 | 18 | 5 | 3 | 3 | 1 | … | … | … | … | … | |
| Read only | Males | 29 | … | … | … | … | 1 | 3 | 4 | 6 | 1 | 1 | 1 | … | … | 1 | … | … | … | 2 | 1 | … | 2 | 4 | … | 1 | 1 | … | … | … | … | … | … | … |
| Females | 45 | … | … | … | … | 5 | 6 | 7 | 9 | 5 | … | … | … | … | 2 | … | … | … | … | 1 | 1 | 1 | 4 | 4 | … | … | … | … | … | … | … | … | … | |
| Cannot Read | Males | 104 | 20 | 11 | 21 | 16 | 10 | 14 | 3 | … | 1 | 1 | … | … | … | … | … | … | … | … | 1 | … | … | 1 | 1 | … | 2 | 1 | … | 1 | … | … | … | … |
| Females | 122 | 20 | 17 | 18 | 871 | 19 | 11 | 9 | 1 | 1 | … | … | … | … | … | … | … | … | … | … | … | 2 | 4 | … | 1 | 1 | … | … | … | … | … | … | … | |
Table XV. Table XV. Showing the Education of Persons Males and Females (exclusive of Maoris and Chinese) in each Borough—continued.
| Boroughs. | All Ages. | Under 5. | 5 and under 10. | 10 and under 15. | 15 and under 21. | 21 and under 40. | 40 and under 60. | 60 and under 80. | 80 and upwards | Unspecified Children | Unspecified Adults | |||||||||||||||||||||||
|---|---|---|---|---|---|---|---|---|---|---|---|---|---|---|---|---|---|---|---|---|---|---|---|---|---|---|---|---|---|---|---|---|---|---|
| Under 1 Year. | 1-2. | 3-3. | 3-4. | 4-5. | 5-6. | 6-7. | 7-8. | 8-9. | 9-10. | 10-11. | 11-12. | 12-13. | 13-14. | 14-15. | 15-20. | 20-21. | 21-25. | 25-30. | 30-35. | 35-40. | 40-45. | 45-50. | 50-55. | 55-60. | 60-65. | 65-70. | 70-75. | 75-80. | ||||||
| Education unknown | Males | 11 | … | … | … | … | … | … | … | … | … | … | … | … | … | … | … | … | … | 1 | 1 | 1 | 2 | 3 | 1 | 2 | … | … | … | … | … | … | … | … |
| Females | 2 | … | … | … | … | … | … | … | … | … | … | … | … | … | … | … | … | … | … | … | … | … | 1 | … | 1 | … | … | … | … | … | … | … | … | |
| Total | Males | 610 | 20 | 11 | 21 | 16 | 11 | 20 | 16 | 22 | 24 | 22 | 24 | 13 | 25 | 11 | 8 | 27 | 1 | 19 | 19 | 22 | 56 | 75 | 65 | 36 | 15 | 7 | 2 | 2 | … | … | … | … |
| Females | 492 | 20 | 17 | 18 | 17 | 24 | 21 | 21 | 25 | 16 | 21 | 22 | 21 | 16 | 15 | 15 | 26 | 2 | 15 | 13 | 36 | 41 | 33 | 22 | 7 | 4 | 3 | 1 | … | … | … | … | … | |
| Kumara— | ||||||||||||||||||||||||||||||||||
| Read and Write | Males | 476 | … | … | … | … | … | 4 | 6 | 11 | 11 | 19 | 7 | 17 | 13 | 17 | 8 | 20 | 3 | 23 | 35 | 39 | 50 | 81 | 48 | 33 | 16 | 9 | 2 | … | … | … | … | 4 |
| Females | 372 | … | … | … | … | … | 1 | 4 | 13 | 23 | 15 | 12 | 16 | 9 | 14 | 8 | 54 | 11 | 22 | 28 | 42 | 50 | 23 | 7 | 8 | 4 | 4 | 1 | 1 | … | … | … | 2 | |
| Read only | Males | 24 | … | … | … | … | 1 | 1 | 8 | 7 | … | … | … | … | … | … | … | … | … | … | … | … | 2 | 1 | 2 | … | … | … | 1 | … | … | … | … | … |
| Females | 20 | … | … | … | 1 | … | 3 | 4 | 3 | 1 | … | … | … | … | … | … | … | … | … | 2 | … | 2 | 2 | … | 1 | … | 1 | … | … | … | … | … | … | |
| Cannot Read | Males | 114 | 17 | 15 | 18 | 15 | 22 | 12 | 7 | 3 | 1 | 1 | … | … | … | … | … | 1 | … | … | … | … | 2 | … | … | … | … | … | … | … | … | … | … | … |
| Females | 124 | 23 | 24 | 17 | 18 | 12 | 9 | 5 | 4 | 4 | 1 | … | … | 1 | … | … | 1 | … | … | 1 | … | … | 1 | 1 | … | 1 | … | 1 | … | … | … | … | … | |
| Education unknown | Males | 2 | … | … | … | … | … | … | … | … | … | … | … | … | … | … | … | … | … | … | … | … | … | 2 | … | … | … | … | … | … | … | … | … | … |
| Females | 7 | … | … | … | … | … | … | … | 1 | … | 1 | … | … | … | … | … | 2 | … | 1 | … | 1 | … | … | … | … | 1 | … | … | … | … | … | … | … | |
| Total | Males | 616 | 17 | 15 | 18 | 15 | 23 | 18 | 21 | 21 | 12 | 20 | 7 | 17 | 13 | 17 | 8 | 21 | 3 | 23 | 35 | 39 | 54 | 84 | 50 | 33 | 16 | 9 | 3 | … | … | … | … | 4 |
| Females | 523 | 23 | 24 | 17 | 19 | 12 | 13 | 13 | 21 | 28 | 17 | 13 | 16 | 10 | 14 | 8 | 57 | 11 | 23 | 31 | 43 | 52 | 26 | 8 | 9 | 6 | 5 | 2 | 1 | … | … | … | 2 | |
| Ashburton— | ||||||||||||||||||||||||||||||||||
| Read and Write | Males | 658 | … | … | … | … | … | 4 | 7 | 9 | 20 | 15 | 15 | 17 | 19 | 9 | 8 | 60 | 12 | 61 | 103 | 76 | 75 | 38 | 43 | 23 | 8 | 11 | 7 | 5 | 5 | 2 | 1 | 5 |
| Females | 493 | … | … | … | … | … | 3 | 7 | 11 | 19 | 13 | 11 | 19 | 12 | 23 | 12 | 78 | 15 | 59 | 59 | 46 | 38 | 27 | 20 | 10 | 2 | 3 | 3 | … | … | … | … | 1 | |
| Read only | Males | 24 | … | … | … | … | 3 | 5 | 4 | 7 | 1 | … | … | 2 | … | … | … | … | … | … | … | 1 | … | 1 | … | … | … | … | … | … | … | … | … | … |
| Females | 28 | … | … | … | … | 1 | 4 | 5 | 6 | 2 | 3 | 1 | … | … | 1 | … | … | … | 1 | 3 | … | 1 | … | … | … | … | … | … | … | … | … | … | … | |
| Cannot Read | Males | 161 | 33 | 27 | 25 | 27 | 21 | 14 | 4 | 2 | … | … | 1 | … | … | … | … | … | … | … | … | 1 | 2 | … | 3 | … | … | 1 | … | … | … | … | … | … |
| Females | 157 | 29 | 23 | 25 | 27 | 29 | 7 | 9 | 1 | 3 | … | … | … | … | … | … | 1 | … | … | … | … | … | … | 1 | … | 1 | … | … | … | … | … | … | 1 | |
| Education unknown | Males | … | … | … | … | … | … | … | … | … | … | … | … | … | … | … | … | … | … | … | … | … | … | … | … | … | … | … | … | … | … | … | … | … |
| Females | 4 | … | … | … | … | … | … | … | … | … | … | 1 | … | … | … | … | … | … | 1 | … | … | 1 | … | … | … | … | … | 1 | … | … | … | … | … | |
| Total | Males | 843 | 33 | 27 | 25 | 27 | 24 | 23 | 15 | 18 | 21 | 15 | 16 | 19 | 19 | 9 | 8 | 60 | 12 | 61 | 103 | 78 | 77 | 39 | 46 | 23 | 8 | 12 | 7 | 5 | 5 | 2 | 1 | 5 |
| Females | 682 | 29 | 23 | 25 | 27 | 30 | 14 | 21 | 18 | 24 | 16 | 13 | 19 | 12 | 24 | 12 | 79 | 15 | 61 | 62 | 46 | 40 | 27 | 21 | 10 | 3 | 3 | 6 | … | … | … | … | 2 | |
| Kaiapoi— | ||||||||||||||||||||||||||||||||||
| Read and Write | Males | 419 | … | … | … | … | … | 1 | 6 | 11 | 11 | 15 | 13 | 13 | 16 | 8 | 13 | 56 | 11 | 35 | 37 | 36 | 37 | 32 | 25 | 13 | 11 | 11 | 3 | 3 | 1 | 1 | … | … |
| Females | 454 | … | … | … | … | … | … | 4 | 11 | 12 | 18 | 18 | 11 | 20 | 20 | 19 | 72 | 10 | 37 | 51 | 30 | 29 | 21 | 26 | 15 | 12 | 9 | 6 | 3 | … | … | … | … | |
| Read only | Males | 30 | … | … | … | 1 | … | 4 | 6 | 3 | 3 | 1 | 1 | … | … | … | … | … | … | 2 | 2 | 1 | 2 | 1 | 1 | … | … | 1 | … | 1 | … | … | … | … |
| Females | 34 | … | … | … | … | 1 | … | 4 | 5 | 3 | 4 | 2 | … | … | … | … | … | … | 1 | 1 | … | 3 | 1 | 2 | … | 1 | 1 | 2 | … | 2 | … | … | … | |
| Cannot Read | Males | 137 | 22 | 18 | 22 | 21 | 25 | 12 | 5 | 7 | … | … | … | … | … | … | … | … | … | … | 1 | 1 | … | … | … | … | 1 | 1 | 1 | … | … | … | … | … |
| Females | 132 | 22 | 18 | 20 | 20 | 19 | 10 | 14 | 5 | … | … | … | … | … | … | … | … | … | 1 | 1 | … | … | … | … | 2 | … | … | … | … | … | … | … | … | |
| Education unknown | Males | 8 | … | … | … | … | … | … | … | … | … | … | 2 | … | 1 | … | 1 | 1 | … | … | … | 1 | … | 1 | … | … | … | … | … | … | 1 | … | … | … |
| Females | 7 | … | … | … | … | … | … | 1 | … | 1 | … | … | … | … | 1 | … | … | … | … | 1 | 1 | … | … | … | … | 1 | … | … | … | … | 1 | … | … | |
| Total | Males | 594 | 22 | 18 | 22 | 22 | 25 | 17 | 17 | 21 | 14 | 16 | 16 | 13 | 17 | 8 | 14 | 57 | 11 | 37 | 40 | 39 | 39 | 34 | 26 | 13 | 12 | 13 | 4 | 4 | 2 | 1 | … | … |
| Females | 627 | 22 | 18 | 20 | 20 | 23 | 15 | 22 | 20 | 15 | 18 | 18 | 11 | 20 | 21 | 19 | 73 | 11 | 38 | 54 | 32 | 32 | 22 | 28 | 17 | 14 | 10 | 8 | 3 | 2 | 1 | … | … | |
| Akaroa— | ||||||||||||||||||||||||||||||||||
| Read and Write | Males | 230 | … | … | … | … | … | 2 | 4 | 7 | 3 | 3 | 8 | 6 | 7 | 5 | 12 | 26 | 6 | 16 | 25 | 20 | 23 | 16 | 16 | 7 | 6 | 3 | 2 | 3 | 2 | 2 | … | … |
| Females | 230 | … | … | … | … | … | 1 | 3 | 3 | 2 | 10 | 7 | 8 | 11 | 9 | 6 | 40 | 5 | 30 | 23 | 17 | 18 | 10 | 11 | 6 | 3 | 4 | … | 2 | … | 1 | … | … | |
| Read only | Males | 9 | … | … | … | … | 1 | 2 | 3 | … | 1 | … | … | … | … | … | … | 1 | … | … | … | … | … | … | … | 1 | … | … | … | … | … | … | … | … |
| Females | 13 | … | … | … | … | 1 | 1 | 2 | 2 | 1 | 1 | … | 1 | … | … | … | 2 | … | … | … | … | … | … | 1 | … | … | … | … | 1 | … | … | … | … | |
| Cannot Read | Males | 54 | 12 | 14 | 4 | 11 | 6 | 1 | 2 | … | … | … | … | … | … | … | … | … | … | … | … | 1 | … | … | 1 | 1 | 1 | … | … | … | … | … | … | … |
| Females | 69 | 6 | 12 | 11 | 9 | 11 | 5 | 3 | … | 2 | … | … | 1 | … | … | … | 2 | … | … | 1 | … | … | 1 | 1 | 3 | … | … | 1 | … | … | … | … | … | |
Table XV. Table XV. Showing the Education of Persons Males and Females (exclusive of Maoris and Chinese) in each Borough—continued.
| Boroughs. | All Ages. | Under 5. | 5 and under 10. | 10 and under 15. | 15 and under 21. | 21 and under 40. | 40 and under 60. | 60 and under 80. | 80 and upwards | Unspecified Children | Unspecified Adults | |||||||||||||||||||||||
|---|---|---|---|---|---|---|---|---|---|---|---|---|---|---|---|---|---|---|---|---|---|---|---|---|---|---|---|---|---|---|---|---|---|---|
| Under 1 Year. | 1-2. | 3-3. | 3-4. | 4-5. | 5-6. | 6-7. | 7-8. | 8-9. | 9-10. | 10-11. | 11-12. | 12-13. | 13-14. | 14-15. | 15-20. | 20-21. | 21-25. | 25-30. | 30-35. | 35-40. | 40-45. | 45-50. | 50-55. | 55-60. | 60-65. | 65-70. | 70-75. | 75-80. | ||||||
| Akaroa—continued. | ||||||||||||||||||||||||||||||||||
| Education unknown | Males | … | … | … | … | … | … | … | … | … | … | … | … | … | … | … | … | … | … | … | … | … | … | … | … | … | … | … | … | … | … | … | … | … |
| Females | 3 | … | … | … | … | … | … | … | 1 | … | … | … | … | … | … | … | 1 | … | … | … | … | … | … | … | … | 1 | … | … | … | … | … | … | … | |
| Total | Males | 293 | 12 | 4 | 4 | 11 | 7 | 5 | 9 | 7 | 4 | 3 | 8 | 6 | 7 | 5 | 12 | 27 | 6 | 16 | 25 | 21 | 23 | 16 | 17 | 9 | 7 | 3 | 2 | 3 | 2 | 2 | … | … |
| Females | 315 | 6 | 12 | 11 | 9 | 12 | 7 | 8 | 6 | 5 | 11 | 7 | 10 | 11 | 9 | 6 | 45 | 5 | 30 | 24 | 17 | 18 | 11 | 13 | 9 | 4 | 4 | 1 | 3 | … | 1 | … | … | |
| Lyttelton— | ||||||||||||||||||||||||||||||||||
| Read and Write | Males | 1,574 | … | … | … | … | … | 7 | 16 | 35 | 46 | 45 | 53 | 38 | 50 | 33 | 35 | 141 | 32 | 120 | 214 | 173 | 152 | 145 | 102 | 58 | 30 | 27 | 11 | 4 | 2 | 2 | … | 3 |
| Females | 1,291 | … | … | … | … | … | 6 | 21 | 30 | 46 | 43 | 48 | 43 | 62 | 42 | 48 | 157 | 40 | 141 | 145 | 100 | 119 | 74 | 48 | 22 | 18 | 18 | 9 | 4 | 5 | 1 | … | 1 | |
| Read only | Males | 96 | … | … | … | … | 3 | 14 | 19 | 13 | 13 | 4 | 3 | 1 | 2 | … | … | 2 | … | 1 | 5 | 2 | 5 | 1 | 4 | 1 | 1 | … | 2 | … | … | … | … | … |
| Females | 132 | … | … | … | … | 4 | 19 | 21 | 12 | o3 | 9 | 7 | 3 | 1 | 1 | … | 2 | 1 | 6 | 5 | 6 | 4 | 5 | 5 | 1 | 1 | 5 | … | … | 1 | … | … | … | |
| Cannot Read | Males | 535 | 92 | 71 | 75 | 82 | 70 | 49 | 23 | 9 | 6 | 1 | … | 2 | 3 | … | … | 3 | 1 | 1 | 12 | 11 | 9 | 2 | 4 | 4 | 2 | 1 | 1 | … | … | 1 | … | … |
| Females | 497 | 78 | 74 | 82 | 69 | 63 | 50 | 23 | 10 | 3 | 3 | 3 | 1 | … | 3 | 1 | 2 | … | 2 | 5 | 3 | 7 | 9 | 1 | 1 | 1 | 1 | … | 1 | … | 1 | … | … | |
| Education unknown | Males | … | … | … | … | … | … | … | … | … | … | … | … | … | … | … | … | … | … | … | … | … | … | … | … | … | … | … | … | … | … | … | … | … |
| Females | 2 | … | … | … | … | … | … | … | … | … | … | … | … | … | … | … | … | 1 | … | … | 1 | … | … | … | … | … | … | … | … | … | … | … | … | |
| Total | Males | 2,205 | 92 | 71 | 75 | 82 | 73 | 70 | 58 | 57 | 65 | 50 | 56 | 41 | 55 | 33 | 35 | 146 | 33 | 122 | 231 | 186 | 166 | 148 | 110 | 63 | 33 | 28 | 14 | 4 | 2 | 3 | … | 3 |
| Females | 1,922 | 78 | 74 | 82 | 69 | 67 | 75 | 65 | 52 | 62 | 55 | 58 | 47 | 63 | 46 | 49 | 161 | 42 | 149 | 155 | 110 | 130 | 88 | 54 | 24 | 20 | 24 | 9 | 5 | 6 | 2 | … | 1 | |
| Christchurch— | ||||||||||||||||||||||||||||||||||
| Read and Write | Males | 5,932 | … | … | … | … | … | 15 | 64 | 119 | 119 | 158 | 174 | 152 | 174 | 160 | 157 | 658 | 138 | 559 | 792 | 584 | 509 | 498 | 342 | 242 | 118 | 90 | 54 | 25 | 10 | 6 | … | 15 |
| Females | 5,733 | … | … | … | … | … | 22 | 52 | 101 | 148 | 150 | 190 | 164 | 158 | 163 | 174 | 910 | 193 | 679 | 674 | 487 | 417 | 384 | 237 | 153 | 102 | 90 | 38 | 29 | 8 | 6 | … | 4 | |
| Read only | Males | 287 | … | … | … | 1 | 22 | 46 | 66 | 48 | 40 | 13 | 6 | 4 | … | 1 | … | 1 | … | 1 | 1 | 6 | 3 | 10 | 6 | 3 | 2 | … | 5 | … | … | … | … | 1 |
| Females | 318 | … | … | … | 3 | 20 | 48 | 51 | 50 | 27 | 11 | 5 | 1 | 1 | … | 1 | 4 | 1 | 7 | 11 | 10 | 13 | 11 | 16 | 10 | 2 | 6 | 3 | 3 | 1 | 1 | … | 1 | |
| Cannot Read | Males | 1,457 | 308 | 199 | 218 | 212 | 203 | 149 | 54 | 28 | 11 | 2 | 1 | 2 | 2 | 3 | 1 | 7 | 3 | 6 | 4 | 8 | 5 | 7 | 10 | 3 | 6 | 3 | … | 1 | 1 | … | … | … |
| Females | 1,407 | 240 | 206 | 231 | 245 | 179 | 111 | 69 | 25 | 12 | 8 | 2 | 1 | 2 | 1 | 3 | 7 | 1 | 5 | 14 | 6 | 10 | 10 | 2 | 6 | 4 | 6 | … | 1 | … | … | … | … | |
| Education unknown | Males | 32 | … | … | … | … | … | … | … | … | … | … | 1 | … | … | … | … | 1 | … | 3 | 6 | 6 | 3 | 3 | … | 1 | … | … | … | … | … | … | … | 7 |
| Females | 21 | … | … | … | … | … | … | 1 | … | … | … | … | … | … | 1 | … | 5 | 1 | 4 | 3 | 2 | 1 | … | 1 | … | … | … | 1 | … | … | … | … | 1 | |
| Total | Males | 7,708 | 308 | 199 | 218 | 213 | 225 | 210 | 184 | 195 | 170 | 173 | 182 | 158 | 176 | 164 | 158 | 669 | 141 | 569 | 803 | 604 | 520 | 518 | 358 | 249 | 126 | 93 | 59 | 26 | 11 | 6 | … | 23 |
| Females | 7,479 | 240 | 206 | 231 | 248 | 199 | 181 | 173 | 176 | 187 | 169 | 197 | 166 | 161 | 165 | 178 | 926 | 196 | 695 | 702 | 505 | 441 | 405 | 256 | 169 | 108 | 102 | 42 | 33 | 9 | 7 | … | 6 | |
| Sydenham— | ||||||||||||||||||||||||||||||||||
| Read and Write | Males | 2,970 | … | … | … | … | … | 13 | 30 | 04 | 97 | 107 | 115 | 90 | 92 | 95 | 85 | 356 | 60 | 209 | 323 | 300 | 283 | 256 | 163 | 119 | 44 | 35 | 17 | 8 | 5 | 4 | … | … |
| Females | 2,824 | … | … | … | … | … | 13 | 45 | 78 | 89 | 117 | 106 | 106 | 99 | 87 | 97 | 330 | 53 | 250 | 329 | 294 | 228 | 196 | 131 | 71 | 41 | 38 | 17 | 5 | 2 | 2 | … | … | |
| Read only | Males | 209 | … | … | … | 1 | 5 | 33 | 49 | 42 | 11 | 14 | 3 | 2 | 1 | … | 1 | … | 1 | 3 | 8 | 9 | 6 | 4 | 5 | 3 | 6 | 1 | 1 | … | … | … | … | … |
| Females | 260 | … | … | … | 4 | 11 | 31 | 60 | 31 | 15 | 3 | 3 | … | … | 2 | … | 1 | … | 5 | 15 | 12 | 22 | 15 | 7 | 3 | 11 | 4 | 1 | 3 | 1 | … | … | … | |
| Cannot Read | Males | 1,101 | 199 | 139 | 185 | 164 | 171 | 105 | 60 | 18 | 8 | 3 | 1 | 3 | … | … | … | 3 | … | 5 | 4 | 3 | 5 | 10 | 5 | 2 | 2 | 3 | 1 | 1 | 1 | … | … | … |
| Females | 1,082 | 186 | 150 | 186 | 152 | 149 | 116 | 43 | 12 | 6 | 5 | 2 | … | 1 | 1 | 2 | 2 | 1 | 5 | 10 | 10 | 12 | 14 | 6 | 2 | 1 | 2 | … | 4 | 1 | … | … | … | |
Table XV. Table XV. Showing the Education of Persons Males and Females (exclusive of Maoris and Chinese) in each Borough—continued.
| Boroughs. | All Ages. | Under 5. | 5 and under 10. | 10 and under 15. | 15 and under 21. | 21 and under 40. | 40 and under 60. | 60 and under 80. | 80 and upwards | Unspecified Children | Unspecified Adults | |||||||||||||||||||||||
|---|---|---|---|---|---|---|---|---|---|---|---|---|---|---|---|---|---|---|---|---|---|---|---|---|---|---|---|---|---|---|---|---|---|---|
| Under 1 Year. | 1-2. | 3-3. | 3-4. | 4-5. | 5-6. | 6-7. | 7-8. | 8-9. | 9-10. | 10-11. | 11-12. | 12-13. | 13-14. | 14-15. | 15-20. | 20-21. | 21-25. | 25-30. | 30-35. | 35-40. | 40-45. | 45-50. | 50-55. | 55-60. | 60-65. | 65-70. | 70-75. | 75-80. | ||||||
| Education unknown | Males | 3 | … | … | … | … | … | … | … | … | … | … | … | … | … | … | … | … | … | … | 3 | … | … | … | … | … | … | … | … | … | … | … | … | … |
| Females | 4 | … | … | … | … | … | … | … | … | … | … | … | … | … | … | … | … | … | 1 | 1 | 1 | … | … | … | … | … | … | … | 1 | … | … | … | … | |
| Total | Males | 4,283 | 199 | 139 | 185 | 165 | 176 | 151 | 139 | 124 | 116 | 124 | 119 | 95 | 93 | 95 | 93 | 359 | 61 | 217 | 338 | 312 | 294 | 270 | 173 | 124 | 52 | 39 | 19 | 9 | 6 | 4 | … | … |
| Females | 4,170 | 186 | 150 | 186 | 156 | 160 | 160 | 148 | 121 | 110 | 125 | 111 | 106 | 100 | 90 | 99 | 333 | 54 | 261 | 355 | 317 | 262 | 225 | 144 | 76 | 43 | 44 | 19 | 13 | 4 | 2 | … | … | |
| Timaru— | ||||||||||||||||||||||||||||||||||
| Read and Write | Males | 1,595 | … | … | … | … | … | 7 | 20 | 24 | 30 | 42 | 45 | 37 | 47 | 24 | 43 | 142 | 41 | 163 | 249 | 177 | 171 | 138 | 81 | 54 | 24 | 16 | 10 | 4 | 2 | 2 | … | 2 |
| Females | 1,328 | … | … | … | … | … | 5 | 25 | 34 | 32 | 40 | 48 | 37 | 33 | 38 | 36 | 204 | 37 | 174 | 153 | 106 | 108 | 83 | 51 | 34 | 12 | 16 | 6 | 6 | 1 | 1 | … | 3 | |
| Read only | Males | 85 | … | … | … | 1 | 1 | 15 | 24 | 10 | 6 | 4 | … | 1 | 1 | 1 | … | 1 | 1 | 5 | 1 | 3 | 2 | 1 | 4 | 1 | … | … | 1 | … | 1 | … | … | … |
| Females | 76 | … | … | … | 1 | 5 | 14 | 10 | 11 | 7 | 1 | 3 | … | … | 1 | 1 | … | 2 | 1 | 3 | 2 | 6 | 1 | … | 2 | 2 | 1 | 2 | … | … | … | … | … | |
| Cannot Read | Males | 309 | 73 | 56 | 67 | 53 | 50 | 41 | 16 | 4 | 6 | 3 | … | 1 | 1 | … | 1 | 1 | … | 2 | 5 | 6 | 3 | 3 | 2 | 1 | 1 | 2 | … | … | 1 | … | … | … |
| Females | 382 | 70 | 62 | 59 | 15 | 45 | 30 | 23 | 6 | 2 | … | 1 | 1 | … | 3 | … | 1 | 1 | 1 | 2 | 2 | 3 | 1 | … | 1 | 1 | 1 | … | … | 1 | … | … | … | |
| Education unknown | Males | 32 | … | … | … | … | … | … | … | … | … | … | … | … | … | … | … | 5 | … | 2 | 3 | 4 | 3 | 4 | 5 | 3 | … | … | 2 | 1 | … | … | … | … |
| Females | 14 | … | … | … | … | … | … | … | … | … | … | … | … | … | … | … | 1 | 1 | 1 | 3 | 2 | 2 | … | 1 | 1 | 2 | … | … | … | … | … | … | … | |
| Total | Males | 2,111 | 73 | 56 | 67 | 54 | 51 | 63 | 60 | 38 | 42 | 49 | 45 | 39 | 49 | 25 | 44 | 149 | 42 | 172 | 258 | 190 | 179 | 146 | 92 | 59 | 25 | 18 | 13 | 5 | 4 | 2 | … | 2 |
| Females | 1,800 | 70 | 62 | 59 | 66 | 50 | 49 | 58 | 51 | 41 | 41 | 52 | 38 | 33 | 42 | 37 | 206 | 41 | 177 | 161 | 112 | 119 | 85 | 57 | 38 | 17 | 18 | 8 | 6 | 2 | 1 | … | 3 | |
| Rangiora— | ||||||||||||||||||||||||||||||||||
| Read and Write | Males | 531 | … | … | … | … | … | 2 | 5 | 11 | 10 | 16 | 20 | 20 | 18 | 19 | 17 | 68 | 9 | 49 | 56 | 42 | 49 | 39 | 22 | 19 | 10 | 16 | 4 | 6 | 1 | … | … | 3 |
| Females | 496 | … | … | … | … | … | 2 | 7 | 17 | 13 | 16 | 16 | 17 | 16 | 18 | 16 | 62 | 18 | 52 | 45 | 42 | 40 | 28 | 28 | 20 | 11 | 4 | 3 | 2 | 2 | … | … | 1 | |
| Read only | Males | 46 | … | … | … | … | 4 | 9 | 4 | 7 | 5 | … | … | … | … | … | … | 1 | … | 1 | 1 | 2 | 1 | 1 | 4 | 3 | … | … | … | 1 | 1 | … | … | … |
| Females | 43 | … | … | … | … | 3 | 8 | 6 | 6 | 2 | 1 | … | … | … | … | 1 | … | 1 | … | 3 | 2 | 1 | 3 | 1 | 3 | 1 | … | 1 | … | … | … | … | … | |
| Cannot Read | Males | 159 | 37 | 16 | 18 | 28 | 17 | 16 | 7 | 3 | 2 | … | … | … | … | 1 | 1 | 2 | … | … | 1 | 1 | 1 | … | 4 | … | 2 | 1 | 1 | … | … | … | … | … |
| Females | 158 | 25 | 28 | 24 | 31 | 18 | 11 | 7 | … | 1 | … | … | … | … | … | … | 1 | 2 | … | … | … | 2 | 3 | 3 | … | … | … | … | … | … | … | … | … | |
| Education unknown | Males | 7 | … | … | … | … | … | … | … | … | … | … | … | 1 | … | 1 | … | … | 1 | 1 | … | 2 | … | … | … | … | … | … | 1 | … | … | … | … | … |
| Females | 5 | … | … | … | … | … | … | 1 | … | … | … | … | … | … | … | … | 1 | … | … | 1 | … | … | … | … | … | … | … | 1 | … | 2 | … | … | … | |
| Total | Males | 743 | 37 | 16 | 18 | 28 | 21 | 27 | 16 | 21 | 17 | 16 | 20 | 21 | 18 | 21 | 18 | 71 | 10 | 51 | 58 | 47 | 51 | 40 | 30 | 22 | 12 | 18 | 6 | 7 | 2 | … | … | 3 |
| Females | 702 | 25 | 28 | 24 | 31 | 21 | 21 | 21 | 23 | 16 | 17 | 16 | 17 | 16 | 1S | 17 | 64 | 21 | 52 | 49 | 44 | 43 | 34 | 32 | 23 | 12 | 5 | 7 | 2 | 2 | … | … | 1 | |
| Waimate— | ||||||||||||||||||||||||||||||||||
| Read and Write | Males | 607 | … | … | … | … | … | 5 | 21 | 8 | 19 | 22 | 14 | 16 | 22 | 18 | 15 | 46 | 9 | 43 | 85 | 73 | 64 | 54 | 31 | 23 | 8 | 7 | 1 | … | 1 | 1 | … | 1 |
| Females | 500 | … | … | … | … | … | 7 | 13 | 10 | 18 | 23 | 26 | 16 | 21 | 15 | 15 | 67 | 6 | 44 | 59 | 49 | 40 | 41 | 12 | 12 | 2 | 3 | … | 2 | … | … | … | … | |
| Read only | Males | 39 | … | … | … | … | 2 | 10 | 5 | 4 | 3 | … | 2 | 1 | 1 | … | … | 1 | … | 1 | 1 | 4 | 3 | 3 | 1 | 2 | 3 | … | … | 1 | … | … | … | … |
| Females | 53 | … | … | … | … | 5 | 10 | 6 | 6 | 2 | 2 | 1 | … | 1 | … | … | 1 | … | 1 | 1 | 4 | 3 | 3 | 1 | 2 | 3 | … | … | 1 | … | … | … | … | |
| Cannot Read | Males | 224 | 35 | 47 | 37 | 25 | 31 | 16 | 5 | 4 | … | … | 1 | … | … | … | … | … | 2 | … | 2 | 4 | 5 | 2 | 2 | 3 | 1 | 1 | … | … | … | … | … | 1 |
| Females | 175 | 36 | 28 | 27 | 36 | 18 | 9 | 2 | 2 | 1 | … | … | … | … | … | … | 1 | … | … | 3 | 1 | 3 | 2 | 1 | 1 | … | … | 2 | … | … | … | … | … | |
| Education unknown | Males | … | … | … | … | … | … | … | … | … | … | … | … | … | … | … | … | … | … | … | … | … | … | … | … | … | … | … | … | … | … | … | … | … |
| Females | 2 | … | … | … | … | … | … | … | … | … | … | … | … | … | … | … | … | … | … | … | … | … | … | … | … | … | … | … | … | … | … | … | … | |
| Total | Males | 870 | 35 | 47 | 37 | 25 | 33 | 31 | 16 | 22 | 22 | 17 | 17 | 23 | 18 | 15 | 47 | 11 | 45 | 88 | 78 | 69 | 58 | 33 | 27 | 10 | 9 | 2 | 1 | … | 1 | 1 | … | 2 |
| Females | 730 | 36 | 28 | 27 | 36 | 23 | 26 | 21 | 18 | 21 | 24 | 27 | 16 | 22 | 15 | 15 | 69 | 6 | 45 | 63 | 54 | 47 | 46 | 15 | 16 | 5 | 4 | 2 | 3 | … | … | … | … | |
| Oamaru— | ||||||||||||||||||||||||||||||||||
| Read and Write | Males | 2,10O | … | … | … | … | … | 10 | 20 | 26 | 47 | 58 | 68 | 35 | 77 | 55 | 52 | 189 | 53 | 170 | 312 | 212 | 218 | 209 | 139 | 59 | 20 | 26 | 15 | 9 | 3 | … | … | 5 |
| Females | 1,864 | … | … | … | … | … | 2 | 17 | 43 | 54 | 72 | 70 | 70 | 58 | 54 | 61 | 250 | 43 | 210 | 216 | 190 | 165 | 142 | 48 | 37 | 28 | 15 | 9 | 6 | 1 | … | … | 3 | |
| Read only | Males | 187 | … | … | … | … | 6 | 29 | 36 | 35 | 12 | 13 | 4 | 1 | 1 | … | … | 6 | … | 7 | 5 | 3 | 8 | 9 | 3 | 4 | 1 | 1 | 1 | … | … | 1 | … | … |
| Females | 191 | … | … | … | … | 4 | 19 | 32 | 30 | 27 | 11 | 8 | 1 | … | 2 | 1 | 3 | 2 | 5 | 8 | 9 | 9 | 5 | 7 | 1 | 1 | 3 | 1 | 1 | 1 | … | … | … | |
| Cannot Read 5 | Males | 694 | 148 | 83 | 106 | 114 | 86 | 70 | 18 | 10 | 4 | 2 | 2 | 1 | … | 1 | … | 3 | … | 8 | 8 | 9 | 6 | 6 | 1 | 1 | 1 | 2 | 1 | … | 1 | … | 2 | … |
| Females | 710 | 114 | 104 | 111 | 110 | 88 | 79 | 23 | 6 | 5 | … | 1 | 1 | 1 | 1 | … | 10 | 5 | 5 | 10 | 6 | 11 | 6 | 5 | 6 | 1 | 1 | … | … | … | … | … | … | |
Table XV. Table XV. Showing the Education of Persons Males and Females (exclusive of Maoris and Chinese) in each Borough—continued.
| Boroughs. | All Ages. | Under 5. | 5 and under 10. | 10 and under 15. | 15 and under 21. | 21 and under 40. | 40 and under 60. | 60 and under 80. | 80 and upwards | Unspecified Children | Unspecified Adults | |||||||||||||||||||||||
|---|---|---|---|---|---|---|---|---|---|---|---|---|---|---|---|---|---|---|---|---|---|---|---|---|---|---|---|---|---|---|---|---|---|---|
| Under 1 Year. | 1-2. | 3-3. | 3-4. | 4-5. | 5-6. | 6-7. | 7-8. | 8-9. | 9-10. | 10-11. | 11-12. | 12-13. | 13-14. | 14-15. | 15-20. | 20-21. | 21-35. | 35-30. | 30-35. | 35-40. | 40-45. | 45-50. | 50-55. | 55-60. | 60-65. | 65-70. | 70-75. | 75-80. | ||||||
| Oamaru—continued. | ||||||||||||||||||||||||||||||||||
| Education unknown | Males | 24 | … | … | … | … | … | 4 | … | 4 | … | … | … | … | … | 1 | 1 | 2 | … | 1 | 2 | 2 | 1 | 3 | … | 1 | 1 | 1 | … | … | … | … | … | … |
| Females | 19 | 148 | 83 | … | … | … | 2 | 3 | 1 | … | 2 | … | 2 | … | … | … | 2 | 1 | 1 | 2 | … | … | 1 | … | … | … | … | … | … | … | ||||
| Total | Males | 3,005 | 148 | 83 | 106 | 114 | 92 | 113 | 74 | 75 | 63 | 66 | 74 | 57 | 78 | 57 | 53 | 200 | 53 | 186 | 327 | 226 | 233 | 227 | 143 | 65 | 23 | 30 | 18 | 9 | 4 | 1 | 2 | 5 |
| Females | 2,784 | 114 | 104 | 111 | 110 | 92 | 102 | 75 | 80 | 8O | 85 | 79 | 74 | 59 | 57 | 62 | 265 | 50 | 220 | 236 | 206 | 186 | 155 | 60 | 44 | 31 | 19 | 10 | 7 | 2 | … | … | 3 | |
| Hampden— | ||||||||||||||||||||||||||||||||||
| Read and Write | Males | 108 | … | … | … | … | … | … | 1 | 1 | 1 | … | 4 | 6 | 2 | 4 | 5 | 1 | … | 7 | 12 | 11 | 8 | 13 | 4 | 6 | 4 | 3 | 3 | 2 | … | … | … | … |
| Females | 89 | … | … | … | … | … | … | … | … | 2 | 4 | 3 | 2 | 4 | 3 | 2 | 11 | 2 | 9 | 15 | 11 | 7 | 2 | 5 | 4 | 2 | … | 1 | … | … | … | … | … | |
| Read only | Males | 16 | … | … | … | … | 1 | 4 | 1 | 1 | 2 | 1 | … | 1 | … | … | … | … | … | … | 1 | … | … | 3 | … | … | 1 | … | … | … | … | … | … | … |
| Females | 18 | … | … | … | … | … | 1 | 2 | 2 | 4 | 1 | 2 | 1 | 1 | … | … | … | … | … | … | 2 | … | 1 | … | … | … | … | … | 1 | … | … | … | … | |
| Cannot Read | Males | 56 | 10 | 4 | 10 | 7 | 10 | 7 | 1 | 2 | 1 | … | … | … | … | … | … | 1 | … | 2 | … | … | … | 1 | … | … | … | … | … | … | … | … | … | … |
| Females | 40 | 10 | 5 | 5 | 8 | 2 | 3 | 3 | 1 | 1 | … | … | … | … | … | … | … | … | … | … | … | 1 | … | 1 | … | … | … | … | … | … | … | … | … | |
| Education unknown | Males | … | … | … | … | … | … | … | … | … | … | … | … | … | … | … | … | … | … | … | … | … | … | … | … | … | … | … | … | … | … | … | … | … |
| Females | … | … | … | … | … | … | … | … | … | … | … | … | … | … | … | … | … | … | … | … | … | … | … | … | … | … | … | … | … | … | … | … | … | |
| Total | Males | 180 | 10 | 4 | 10 | 7 | 11 | 11 | 3 | 4 | 4 | 1 | 4 | 7 | 2 | 4 | 5 | 12 | … | 9 | 13 | 11 | 8 | 17 | 4 | 6 | 5 | 3 | 3 | 2 | … | … | … | … |
| Females | 147 | 10 | 5 | 5 | 8 | 2 | 4 | 5 | 3 | 7 | 5 | 5 | 3 | 5 | 3 | 2 | 11 | 2 | 9 | 15 | 13 | 8 | 3 | 6 | 4 | 2 | … | 1 | 1 | … | … | … | … | |
| Palmerston— | ||||||||||||||||||||||||||||||||||
| Read and Write | Males | 386 | … | … | … | … | … | 1 | 5 | 9 | 13 | 13 | 10 | 9 | 17 | 10 | 7 | 34 | 4 | 34 | 51 | 33 | 37 | 41 | 22 | 15 | 8 | 4 | … | 1 | 1 | 2 | … | 3 |
| Females | 330 | … | … | … | … | … | … | 1 | 7 | 8 | 8 | 12 | 14 | 17 | 9 | 20 | 46 | 9 | 35 | 46 | 26 | 18 | 16 | 17 | 6 | 6 | 6 | … | 3 | … | … | … | … | |
| Read only | Males | 25 | … | … | … | … | … | 5 | 7 | 8 | 2 | … | … | … | 1 | … | … | … | … | … | … | 1 | … | … | … | … | 1 | … | … | … | … | … | … | … |
| Females | 15 | … | … | … | … | … | 3 | 5 | 2 | 2 | … | … | … | … | … | … | … | … | … | … | … | … | 2 | 1 | … | … | … | … | … | … | … | … | … | |
| Cannot Read | Males | 99 | 21 | 18 | 15 | 10 | 16 | 14 | 3 | … | … | … | … | … | … | … | … | … | … | … | … | 1 | … | 1 | … | … | … | … | … | … | … | … | … | … |
| Females | 101 | 13 | 18 | 17 | 24 | 10 | 11 | 2 | 2 | … | … | … | … | 2 | … | … | … | … | 1 | … | … | … | … | 1 | … | … | … | … | … | … | … | … | … | |
| Education unknown | Males | 2 | … | … | … | … | … | … | … | … | … | … | 1 | … | … | … | … | … | … | … | … | … | 1 | … | … | … | … | … | … | … | … | … | … | … |
| Females | 4 | … | … | … | … | … | … | … | … | … | … | … | … | 1 | … | … | 1 | … | … | … | … | 1 | 1 | … | … | … | … | … | … | … | … | … | … | |
| Total | Males | 512 | 21 | 18 | 15 | 10 | 16 | 20 | 15 | 17 | 15 | 15 | 11 | 9 | 18 | 10 | 7 | 34 | 4 | 34 | 51 | 35 | 38 | 42 | 22 | 15 | 9 | 4 | … | 1 | 1 | 2 | … | 3 |
| Females | 450 | 13 | 18 | 17 | 24 | 10 | 14 | 8 | 11 | 10 | 8 | 12 | 14 | 20 | 9 | 20 | 47 | 9 | 36 | 46 | 26 | 19 | 19 | 19 | 6 | 6 | 6 | … | 3 | … | … | … | … | |
| Hawkesbury West— | ||||||||||||||||||||||||||||||||||
| Read and Write | Males | 155 | … | … | … | … | … | 1 | 2 | 3 | 7 | 3 | 10 | 6 | 8 | 7 | 11 | 17 | 1 | 9 | 8 | 7 | 16 | 14 | 7 | 8 | 5 | 3 | 1 | 1 | … | … | … | … |
| Females | 149 | … | … | … | … | … | … | 3 | 5 | 3 | 3 | 8 | 6 | 6 | 5 | 6 | 16 | 5 | 10 | 10 | 10 | 11 | 18 | 9 | 5 | 3 | 3 | 1 | 1 | 1 | 1 | … | … | |
| Read only | Males | 12 | … | … | … | … | … | 1 | 3 | 2 | 3 | … | 1 | … | … | … | … | … | … | … | … | … | … | … | … | 1 | 1 | … | … | … | … | … | … | … |
| Females | 9 | … | … | … | … | … | … | 2 | 4 | 2 | … | … | … | … | … | … | … | … | … | … | … | … | … | 1 | … | … | … | … | … | … | … | … | … | |
| Cannot Read | Males | 39 | 4 | 8 | 10 | 1 | 7 | 3 | 2 | 1 | … | … | … | … | … | … | … | … | … | 1 | … | 1 | … | 1 | … | … | … | … | … | … | … | … | … | … |
| Females | 51 | 6 | 7 | 6 | 7 | 11 | 8 | 3 | 1 | 1 | … | … | … | … | … | … | … | … | … | … | … | … | … | 1 | … | … | … | … | … | … | … | … | … | |
Table XV. Table XV. Showing the Education of Persons Males and Females (exclusive of Maoris and Chinese) in each Borough—continued.
| Boroughs. | All Ages. | Under 5. | 5 and under 10. | 10 and under 15. | 15 and under 21. | 21 and under 40. | 40 and under 60. | 60 and under 80. | 80 and upwards | Unspecified Children | Unspecified Adults | |||||||||||||||||||||||
|---|---|---|---|---|---|---|---|---|---|---|---|---|---|---|---|---|---|---|---|---|---|---|---|---|---|---|---|---|---|---|---|---|---|---|
| Under 1 Year. | 1-2. | 3-3. | 3-4. | 4-5. | 5-6. | 6-7. | 7-8. | 8-9. | 9-10. | 10-11. | 11-12. | 12-13. | 13-14. | 14-15. | 15-20. | 20-21. | 21-25. | 25-30. | 30-35. | 35-40. | 40-45. | 45-50. | 50-55. | 55-60. | 60-65. | 65-70. | 70-75. | 75-80. | ||||||
| Education unknown | Males | … | … | … | … | … | … | … | … | … | … | … | … | … | … | … | … | … | … | … | … | … | … | … | … | … | … | … | … | … | … | … | … | … |
| Females | … | … | … | … | … | … | … | … | … | … | … | … | … | … | … | … | … | … | … | … | … | … | … | … | … | … | … | … | … | … | … | … | … | |
| Total | Males | 206 | 4 | 8 | 10 | 1 | 7 | 5 | 7 | 6 | 10 | 3 | 11 | 6 | 8 | 7 | 11 | 17 | 1 | 10 | 8 | 8 | 16 | 15 | 7 | 9 | 6 | 3 | 1 | 1 | … | … | … | … |
| Females | 209 | 6 | 7 | 6 | 7 | 11 | 8 | 8 | 10 | 6 | 3 | 8 | 6 | 6 | 5 | 6 | 16 | 5 | 10 | 10 | 10 | 11 | 18 | 11 | 5 | 3 | 3 | 1 | 1 | 1 | 1 | … | … | |
| Port Chalmers — | ||||||||||||||||||||||||||||||||||
| Read and Write | Males | 848 | … | … | … | … | … | 3 | 10 | 16 | 23 | 20 | 33 | 21 | 21 | 13 | 21 | 89 | 15 | 72 | 13 | 84 | 75 | 70 | 58 | 51 | 11 | 15 | 6 | 4 | 1 | 1 | 1 | 1 |
| Females | 734 | … | … | … | … | … | 3 | 7 | 21 | 21 | 25 | 24 | 23 | 34 | 27 | 27 | 105 | 21 | 67 | 67 | 69 | 62 | 41 | 33 | 18 | 20 | 8 | 5 | 4 | 1 | … | … | 1 | |
| Read only | Males | 41 | … | … | … | … | … | 5 | 6 | 13 | 2 | 2 | 3 | … | … | 2 | … | … | … | 1 | 4 | 1 | … | … | … | 2 | … | … | … | … | … | … | … | … |
| Females | 47 | … | … | … | … | … | 4 | 7 | 9 | 4 | 5 | 1 | … | … | … | … | … | 1 | 1 | 3 | 2 | 3 | 1 | 3 | … | … | 1 | … | 1 | … | 1 | … | … | |
| Cannot Read | Males | 256 | 50 | 32 | 39 | 33 | 37 | 27 | 15 | 3 | 1 | … | 2 | 1 | … | … | … | 1 | … | 1 | 1 | 1 | 2 | 5 | 3 | … | … | 1 | … | … | … | … | … | 1 |
| Females | 239 | 44 | 25 | 33 | 42 | 42 | 36 | 6 | 5 | 2 | … | … | … | … | … | … | … | … | … | 2 | 1 | … | … | … | … | 1 | … | … | … | … | … | … | … | |
| Education unknown | Males | 9 | … | … | … | … | … | … | 1 | 1 | … | 1 | … | … | … | … | … | 1 | … | … | 1 | … | 2 | 2 | … | … | … | … | … | … | … | … | … | … |
| Females | 5 | … | … | … | … | … | … | … | … | 2 | … | 1 | … | 1 | … | … | … | … | … | … | … | 1 | … | … | … | … | … | … | … | … | … | … | … | |
| Total | Males | 1,154 | 50 | 32 | 39 | 33 | 37 | 35 | 32 | 33 | 26 | 23 | 38 | 22 | 21 | 15 | 21 | 91 | 15 | 74 | 119 | 86 | 79 | 77 | 61 | 53 | 11 | 16 | 6 | 4 | 1 | 1 | 1 | 2 |
| Females | 1,025 | 44 | 25 | 33 | 42 | 42 | 43 | 20 | 33 | 29 | 30 | 26 | 23 | 35 | 27 | 27 | 105 | 22 | 68 | 72 | 72 | 66 | 42 | 36 | 18 | 21 | 9 | 5 | 5 | 1 | 1 | … | 1 | |
| Dunedin— | ||||||||||||||||||||||||||||||||||
| Read and Write | Males | 9,372 | … | … | … | … | … | 23 | 81 | 167 | 202 | 249 | 268 | 264 | 268 | 261 | 268 | 1,137 | 234 | 910 | 1,030 | 827 | 748 | 782 | 668 | 458 | 214 | 162 | 56 | 44 | 14 | 13 | 1 | 23 |
| Females | 9,206 | … | … | … | … | … | 30 | 71 | 157 | 241 | 291 | 282 | 284 | 300 | 276 | 310 | 1,441 | 294 | 1,000 | 920 | 708 | 723 | 637 | 456 | 301 | 177 | 146 | 62 | 39 | 24 | 14 | … | 22 | |
| Read only | Males | 416 | … | … | … | … | 9 | 52 | 97 | 84 | 40 | 30 | 6 | 9 | 1 | 3 | 3 | 7 | … | 4 | 5 | 9 | 15 | 15 | 10 | 5 | 6 | 4 | 1 | 1 | … | … | … | … |
| Females | 605 | … | … | … | … | 20 | 69 | 114 | 94 | 64 | 27 | 12 | 7 | 3 | 2 | 5 | 8 | … | 12 | 18 | 18 | 26 | 30 | 24 | 18 | 9 | 11 | 6 | 3 | 4 | 1 | … | … | |
| Cannot Read | Males | 2,240 | 376 | 338 | 336 | 356 | 335 | 258 | 123 | 31 | 14 | 2 | 1 | 1 | … | … | 1 | 4 | … | 3 | 10 | 8 | 6 | 5 | 8 | 6 | 8 | 2 | 2 | 1 | 1 | … | 1 | 2 |
| Females | 2,218 | 367 | 293 | 362 | 322 | 326 | 233 | 123 | 41 | 8 | 2 | 3 | 3 | 3 | … | 1 | 11 | 2 | 11 | 26 | 19 | 16 | 16 | 8 | 10 | 5 | 4 | 1 | 1 | 1 | … | … | … | |
| Education unknown | Males | 71 | … | … | … | … | … | 1 | 6 | 4 | 5 | 2 | 4 | 3 | 3 | 2 | 3 | 5 | … | 3 | 3 | 4 | 4 | 1 | 4 | 7 | 1 | … | … | … | … | … | … | 2 |
| Females | 91 | … | … | … | … | … | … | 2 | 1 | 4 | 2 | 1 | 3 | … | 2 | 7 | 14 | 1 | 2 | 5 | 7 | 6 | 9 | 6 | 7 | 2 | 3 | 1 | 1 | 1 | … | … | 4 | |
| Total | Males | 12,099 | 376 | 338 | 336 | 356 | 344 | 334 | 307 | 286 | 261 | 283 | 280 | 277 | 272 | 266 | 275 | 1,153 | 234 | 920 | 1,048 | 848 | 773 | 807 | 690 | 476 | 229 | 16S | 59 | 46 | 15 | 13 | 2 | 27 |
| Females | 12,120 | 367 | 293 | 362 | 322 | 346 | 332 | 310 | 293 | 317 | 322 | 298 | 297 | 306 | 280 | 323 | 1,474 | 297 | 1,025 | 969 | 752 | 771 | 692 | 494 | 336 | 193 | 164 | 70 | 44 | 30 | 15 | … | 26 | |
| Roslyn— | ||||||||||||||||||||||||||||||||||
| Read and Write | Males | 1,066 | … | … | … | … | … | 2 | 9 | 21 | 35 | 36 | 46 | 43 | 51 | 37 | 50 | 150 | 22 | 75 | 87 | 78 | 70 | 85 | 79 | 35 | 23 | 17 | 4 | 5 | 4 | 2 | … | … |
| Females | 1,071 | … | … | … | … | … | 2 | 9 | 27 | 25 | 50 | 36 | 33 | 48 | 38 | 40 | 160 | 38 | 94 | 101 | 76 | 88 | 81 | 55 | 26 | 14 | 15 | 7 | 2 | 2 | 3 | … | 1 | |
| Read only | Males | 65 | … | … | … | … | 1 | 9 | 18 | 17 | 8 | 3 | … | … | 1 | … | … | … | … | … | … | … | 2 | 2 | … | 3 | … | 1 | … | … | … | … | … | … |
| Females | 84 | … | … | … | 2 | 7 | 10 | 22 | 16 | 8 | 3 | 1 | 1 | … | … | … | 2 | 1 | 1 | 1 | … | 1 | 2 | 5 | … | … | … | … | 1 | … | … | … | … | |
| Cannot Read | Males | 293 | 45 | 49 | 53 | 51 | 38 | 30 | 13 | 4 | 1 | … | … | … | … | … | … | … | … | … | 2 | … | 1 | 3 | 2 | 1 | … | … | … | … | … | … | … | … |
| Females | 289 | 54 | 47 | 40 | 54 | 38 | 34 | 8 | 3 | … | … | … | … | 1 | … | … | … | … | 1 | 2 | … | … | 4 | … | 1 | … | 1 | … | 1 | … | … | … | … | |
| Education unknown | Males | 4 | … | … | … | … | … | 1 | … | … | … | … | 1 | … | … | … | … | … | … | … | … | … | 1 | 1 | … | … | … | … | … | … | … | … | … | … |
| Females | 3 | … | … | … | … | … | … | … | … | … | … | … | … | … | … | … | … | … | … | … | 1 | 1 | 1 | … | … | … | … | … | … | … | … | … | … | |
| Total | Males | 1,428 | 45 | 49 | 53 | 51 | 39 | 42 | 40 | 42 | 44 | 39 | 47 | 43 | 52 | 37 | 50 | 150 | 22 | 75 | 89 | 78 | 74 | 91 | 81 | 39 | 23 | 18 | 4 | 5 | 4 | 2 | … | … |
| Females | 1,447 | 54 | 47 | 40 | 56 | 45 | 46 | 39 | 46 | 33 | 53 | 37 | 34 | 49 | 38 | 40 | 162 | 39 | 96 | 104 | 77 | 90 | 88 | 60 | 27 | 14 | 16 | 7 | 4 | 2 | 3 | … | 1 | |
| Caversham— | ||||||||||||||||||||||||||||||||||
| Read and Write | Males | 1,391 | … | … | … | … | … | 3 | 18 | 34 | 40 | 55 | 70 | 51 | 65 | 61 | 53 | 161 | 26 | 105 | 98 | 112 | 102 | 86 | 83 | 64 | 41 | 19 | 13 | 16 | 7 | … | 2 | 6 |
| Females | 1,309 | … | … | … | … | … | 3 | 17 | 26 | 39 | 48 | 61 | 48 | 55 | 51 | 46 | 160 | 26 | 123 | 121 | 115 | 113 | 96 | 55 | 41 | 22 | 10 | 12 | 7 | 2 | 1 | 4 | 2 | |
| Read only | Males | 139 | … | … | … | … | 1 | 19 | 23 | 34 | 25 | 11 | 5 | 3 | 1 | 3 | 2 | 2 | … | 1 | 3 | 1 | 3 | 1 | 1 | … | … | … | … | … | … | … | … | … |
| Females | 157 | … | … | … | 2 | 5 | 21 | 17 | 28 | 19 | 12 | 5 | 7 | 1 | 3 | 2 | 1 | … | 1 | 6 | 7 | 5 | 2 | 4 | 2 | 3 | 2 | … | 1 | … | 1 | … | … | |
| Cannot Read | Males | 504 | 83 | 57 | 71 | 91 | 73 | 61 | 28 | 13 | 6 | … | … | … | … | … | … | … | … | 1 | 1 | 2 | 3 | 4 | … | 1 | 1 | 2 | 3 | 1 | … | 2 | … | … |
| Females | 458 | 69 | 75 | 64 | 72 | 60 | 51 | 24 | 8 | 4 | 2 | 2 | 2 | … | 1 | … | 3 | … | 3 | 1 | 1 | 6 | 3 | 4 | 1 | 2 | … | … | … | … | … | … | … | |
Table XV. Table XV. Showing the Education of Persons Males and Females (exclusive of Maoris and Chinese) in each Borough—continued.
| Boroughs. | All Ages. | Under 5. | 5 and under 10. | 10 and under 15. | 15 and under 21. | 21 and under 40. | 40 and under 60. | 60 and under 80. | 80 and upwards | Unspecified Children | Unspecified Adults | |||||||||||||||||||||||
|---|---|---|---|---|---|---|---|---|---|---|---|---|---|---|---|---|---|---|---|---|---|---|---|---|---|---|---|---|---|---|---|---|---|---|
| Under 1 Year. | 1-2. | 3-3. | 3-4. | 4-5. | 5-6. | 6-7. | 7-8. | 8-9. | 9-10. | 10-11. | 11-12. | 12-13. | 13-14. | 14-15. | 15-20. | 20-21. | 21-25. | 25-30. | 30-35. | 35-40. | 40-45. | 45-50. | 50-55. | 55-60. | 60-65. | 65-70. | 70-75. | 75-80. | ||||||
| Caversham—continued. | ||||||||||||||||||||||||||||||||||
| Education unknown | Males | 7 | … | … | … | … | … | … | … | … | … | … | … | … | … | … | … | … | … | … | … | … | 1 | 1 | 1 | … | … | … | … | … | … | … | 2 | 2 |
| Females | 4 | … | … | … | … | … | … | … | … | … | … | … | … | … | … | … | … | … | … | 1 | … | … | … | 1 | … | … | … | … | … | … | … | 1 | 1 | |
| Total | Males | 2,041 | 83 | 57 | 71 | 91 | 74 | 83 | 69 | 81 | 71 | 66 | 75 | 54 | 66 | 64 | 55 | 153 | 26 | 107 | 102 | 115 | 109 | 92 | 85 | 65 | 42 | 21 | 16 | 17 | 7 | 2 | 4 | 8 |
| Females | 1,928 | 69 | 75 | 64 | 74 | 65 | 75 | 58 | 62 | 62 | 62 | 68. | 57 | 56 | 60 | 48 | 164 | 26 | 127 | 129 | 123 | 124 | 101 | 64 | 44 | 27 | 12 | 12 | 8 | 2 | 2 | 5 | 3 | |
| Mornington— | ||||||||||||||||||||||||||||||||||
| Read and Write | Males | 974 | … | … | … | … | … | 2 | 10 | 15 | 27 | 26 | 40 | 48 | 43 | 35 | 32 | 132 | 19 | 68 | 84 | 79 | 87 | 83 | 68 | 36 | 22 | 9 | 3 | 1 | 1 | … | … | 3 |
| Females | 1,005 | … | … | … | … | … | 4 | 9 | 14 | 32 | 34 | 40 | 37 | 39 | 42 | 47 | 145 | 22 | 70 | 84 | 88 | 95 | 80 | 45 | 26 | 10 | 15 | 2 | 3 | 5 | … | … | 2 | |
| Read only | Males | 67 | … | … | … | … | 1 | 10 | 16 | 15 | 13 | 2 | 3 | … | 1 | … | … | 2 | … | … | 2 | … | … | 2 | … | … | … | … | … | … | … | … | … | … |
| Females | 80 | … | … | … | … | … | 10 | 12 | 13 | 9 | 9 | 2 | … | 2 | … | … | 1 | 1 | 1 | … | 3 | 6 | 4 | 2 | 2 | 1 | 2 | … | … | … | … | … | … | |
| Cannot Read | Males | 339 | 60 | 46 | 58 | 55 | 30 | 51 | 11 | 7 | 1 | 2 | … | … | 1 | … | … | 2 | … | … | … | … | 3 | 1 | 1 | … | … | … | … | … | … | … | 1 | … |
| Females | 378 | 67 | 51 | 51 | 65 | 48 | 39 | 23 | 11 | 4 | … | 4 | … | … | … | 2 | 3 | … | … | … | 1 | 3 | 5 | 1 | … | … | … | … | … | … | … | … | … | |
| Education unknown | Males | 16 | … | … | … | … | … | … | 1 | 1 | … | … | … | 1 | … | 1 | 1 | 2 | … | 2 | 1 | 1 | 2 | 1 | 1 | … | … | … | 1 | … | … | … | … | … |
| Females | 27 | … | … | … | … | … | 2 | 2 | 1 | … | 3 | … | 1 | … | 1 | 1 | 1 | 1 | … | 3 | 5 | 3 | … | 1 | … | … | … | 1 | 1 | … | … | … | … | |
| Total | Males | 1,396 | 60 | 46 | 58 | 55 | 40 | 63 | 38 | 38 | 41 | 30 | 43 | 49 | 45 | 36 | 33 | 138 | 19 | 70 | 87 | 80 | 92 | 87 | 70 | 36 | 22 | 9 | 4 | 1 | 2 | … | 1 | 3 |
| Females | 1,490 | 67 | 51 | 51 | 65 | 48 | 55 | 46 | 39 | 45 | 46 | 52 | 38 | 41 | 43 | 50 | 150 | 24 | 80 | 87 | 97 | 107 | 89 | 49 | 28 | 11 | 17 | 3 | 4 | 5 | … | … | 2 | |
| Maori Hill— | ||||||||||||||||||||||||||||||||||
| Read and Write | Males | 415 | … | … | … | … | … | … | 4 | 8 | 4 | 16 | 13 | 7 | 15 | 14 | 18 | 56 | 8 | 31 | 48 | 44 | 33 | 28 | 25 | 22 | 7 | 8 | 5 | 1 | 1 | … | … | 6 |
| Females | 358 | … | … | … | … | … | … | 1 | 6 | 9 | 12 | 12 | 12 | 14 | 12 | 13 | 45 | 8 | 30 | 38 | 29 | 32 | 30 | 16 | 22 | 3 | 5 | 2 | 3 | 1 | … | … | 3 | |
| Read only | Males | 30 | … | … | … | … | 1 | 2 | 7 | 6 | 4 | 1 | 3 | … | … | … | … | … | … | … | … | … | … | 2 | 2 | 2 | … | … | … | … | … | … | … | … |
| Females | 35 | … | … | … | … | 1 | 2 | 2 | 6 | 7 | 1 | 1 | … | … | … | … | 1 | … | … | 2 | 3 | 2 | 3 | 1 | … | 2 | … | 1 | … | … | … | … | … | |
| Cannot Read | Males | 146 | 20 | 25 | 20 | 25 | 22 | 15 | 7 | 2 | 2 | … | … | … | … | 1 | … | 1 | … | … | … | 1 | 1 | … | 3 | … | 1 | … | … | … | … | … | … | … |
| Females | 130 | 22 | 19 | 19 | 18 | 19 | 14 | 6 | 6 | 1 | 1 | … | … | 1 | … | 1 | … | … | … | 1 | … | 1 | … | … | … | … | … | … | 1 | … | … | … | … | |
| Education unknown | Males | 14 | … | … | … | … | … | … | … | … | 1 | … | 1 | … | 1 | 1 | … | 1 | … | … | 2 | 1 | 1 | 1 | 1 | … | … | 1 | … | … | … | … | … | 2 |
| Females | 8 | … | … | … | … | … | … | 1 | … | 1 | … | … | … | … | … | … | … | … | … | 1 | … | 2 | 1 | 1 | … | … | … | … | … | … | 1 | … | … | |
| Total | Males | 605 | 20 | 25 | 20 | 25 | 23 | 17 | 18 | 16 | 11 | 17 | 17 | 7 | 16 | 16 | 18 | 58 | 8 | 31 | 43 | 46 | 35 | 31 | 31 | 24 | 8 | 9 | 5 | 1 | 1 | … | … | 8 |
| Females | 531 | 22 | 19 | 19 | 18 | 20 | 16 | 10 | 18 | 18 | 14 | 13 | 12 | 15 | 12 | 14 | 46 | 8 | 30 | 42 | 32 | 37 | 34 | 18 | 22 | 5 | 5 | 3 | 4 | 1 | 1 | … | 3 | |
| St Kilda— | ||||||||||||||||||||||||||||||||||
| Read and Write | Males | 258 | … | … | … | … | … | 1 | 6 | 6 | 5 | 6 | 7 | 9 | 4 | 8 | 9 | 20 | 7 | 19 | 27 | 28 | 27 | 17 | 16 | 13 | 4 | 4 | 2 | 1 | … | … | … | 3 |
| Females | 255 | … | … | … | … | … | … | 1 | 8 | 10 | 12 | 9 | 5 | 10 | 8 | 6 | 39 | 8 | 20 | 29 | 28 | 15 | 18 | 13 | 6 | 5 | … | 3 | … | 2 | … | … | … | |
| Read only | Males | 24 | … | … | … | … | 1 | 2 | 5 | 3 | 7 | 1 | … | … | … | … | … | … | … | … | … | 3 | … | … | 1 | … | … | … | … | … | … | … | … | … |
| Females | 22 | … | … | … | … | 2 | 8 | 3 | 2 | 1 | … | … | … | 1 | … | … | … | … | … | 2 | … | 2 | 1 | … | … | … | … | … | … | … | … | … | … | |
| Cannot Read | Males | 96 | 17 | 12 | 14 | 22 | 15 | 8 | 3 | … | … | … | … | … | … | … | … | … | … | … | 1 | 1 | 1 | 1 | … | … | … | … | 1 | … | … | … | … | … |
| Females | 109 | 17 | 17 | 22 | 12 | 17 | 9 | 6 | 1 | … | … | … | … | … | … | … | … | 1 | 1 | … | 1 | … | … | 1 | 3 | … | … | … | … | … | … | … | 1 | |
Table XV. Table XV. Showing the Education of Persons Males and Females (exclusive of Maoris and Chinese) in each Borough—continued.
| Boroughs. | All Ages. | Under 5. | 5 and under 10. | 10 and under 15. | 15 and under 21. | 21 and under 40. | 40 and under 60. | 60 and under 80. | 80 and upwards | Unspecified Children | Unspecified Adults | |||||||||||||||||||||||
|---|---|---|---|---|---|---|---|---|---|---|---|---|---|---|---|---|---|---|---|---|---|---|---|---|---|---|---|---|---|---|---|---|---|---|
| Under 1 Year. | 1-2. | 3-3. | 3-4. | 4-5. | 5-6. | 6-7. | 7-8. | 8-9. | 9-10. | 10-11. | 11-12. | 12-13. | 13-14. | 14-15. | 15-20. | 20-21. | 21-25. | 25-30. | 30-35. | 35-40. | 40-45. | 45-50. | 50-55. | 55-60. | 60-65. | 65-70. | 70-75. | 75-80. | ||||||
| Education unknown | Males | 5 | … | … | … | … | … | … | … | 2 | … | … | 1 | … | 2 | … | … | … | … | … | … | … | … | … | … | … | … | … | … | … | … | … | … | … |
| Females | 4 | … | … | … | … | … | … | … | … | … | … | 1 | … | … | … | … | … | … | … | … | … | … | 1 | 1 | … | … | … | … | … | … | … | … | 1 | |
| Total | Males | 383 | 17 | 12 | 14 | 22 | 16 | 11 | 14 | 11 | 12 | 7 | 8 | 9 | 6 | 8 | 9 | 29 | 7 | 19 | 28 | 32 | 28 | 18 | 17 | 13 | 5 | 4 | 3 | 1 | … | … | … | 3 |
| Females | 390 | 17 | 17 | 22 | 12 | 19 | 17 | 10 | 11 | 11 | 12 | 10 | 5 | 11 | 8 | 6 | 39 | 9 | 21 | 31 | 29 | 17 | 20 | 15 | 9 | 5 | … | 3 | … | 2 | … | … | 2 | |
| South Dunedin— | ||||||||||||||||||||||||||||||||||
| Read and Write | Males | 934 | … | … | … | … | … | 3 | 8 | 17 | 26 | 35 | 32 | 34 | 27 | 31 | 32 | 106 | 16 | 62 | 111 | 106 | 85 | 70 | 53 | 41 | 22 | 13 | 2 | 1 | … | … | … | 1 |
| Females | 861 | … | … | … | … | … | 5 | 8 | 20 | 26 | 24 | 43 | 32 | 30 | 25 | 29 | 100 | 19 | 72 | 113 | 112 | 67 | 52 | 34 | 28 | 10 | 7 | 3 | 2 | … | … | … | … | |
| Read only | Males | 80 | … | … | … | … | 2 | 9 | 11 | 18 | 11 | 4 | 3 | 1 | … | … | … | … | … | 1 | 1 | … | 4 | 6 | 2 | 4 | 2 | … | 1 | … | … | … | … | … |
| Females | 114 | … | … | … | … | 6 | 9 | 16 | 16 | 18 | 3 | 1 | 2 | 1 | 2 | … | 3 | 1 | 3 | 2 | 5 | 10 | 4 | 3 | 4 | 1 | 4 | … | … | … | … | … | … | |
| Cannot Read | Males | 389 | 62 | 62 | 61 | 70 | 47 | 49 | 8 | 6 | 1 | … | … | … | … | … | … | 1 | … | … | 7 | 2 | 9 | 2 | … | 1 | 1 | … | … | … | … | … | … | … |
| Females | 381 | 68 | 58 | 51 | 51 | 54 | 39 | 22 | 8 | … | 1 | 3 | 1 | … | … | … | 1 | … | 1 | 6 | 7 | 3 | … | 3 | 2 | 1 | … | … | … | 1 | … | … | … | |
| Education unknown | Males | 5 | … | … | … | … | … | … | … | … | … | … | 1 | … | … | … | … | … | … | … | 1 | … | 1 | … | … | 1 | … | 1 | … | … | … | … | … | … |
| Females | 9 | … | … | … | … | … | … | … | … | … | … | 1 | … | … | … | 1 | 2 | 1 | 1 | 1 | … | … | … | 1 | … | … | 1 | … | … | … | … | … | … | |
| Total | Males | 1,408 | 62 | 62 | 61 | 70 | 49 | 61 | 27 | 41 | 38 | 39 | 36 | 35 | 27 | 31 | 32 | 107 | 16 | 63 | 120 | 108 | 99 | 78 | 55 | 47 | 25 | 14 | 3 | 1 | … | … | … | 1 |
| Females | 1,365 | 68 | 58 | 51 | 51 | 60 | 53 | 46 | 44 | 44 | 28 | 48 | 35 | 31 | 27 | 30 | 106 | 21 | 77 | 122 | 124 | 80 | 56 | 41 | 34 | 12 | 12 | 3 | 2 | 1 | … | … | … | |
| North-East Valley— | ||||||||||||||||||||||||||||||||||
| Read and Write | Males | 924 | … | … | … | … | … | 4 | 3 | 19 | 22 | 29 | 31 | 37 | 32 | 28 | 32 | 103 | 16 | 63 | 85 | 106 | 89 | 74 | 59 | 31 | 18 | 25 | 6 | 4 | 4 | 2 | 1 | 1 |
| Females | 887 | … | … | … | … | … | 2 | 5 | 17 | 24 | 32 | 33 | 35 | 37 | 37 | 23 | 125 | 19 | 70 | 105 | 84 | 85 | 51 | 33 | 29 | 17 | 5 | 5 | 7 | 2 | 1 | … | 4 | |
| Read only | Males | 80 | … | … | … | … | 1 | 10 | 13 | 23 | 12 | 5 | 5 | 2 | … | … | … | 2 | … | … | … | 1 | 2 | 2 | … | … | 1 | 1 | … | … | … | … | … | … |
| Females | 97 | … | … | … | … | 4 | 12 | 17 | 89 | 8 | 8 | 2 | … | 1 | 3 | 1 | … | 1 | … | 3 | 4 | 4 | 3 | 1 | 2 | 1 | 1 | 1 | 1 | … | … | … | … | |
| Cannot Read | Males | 392 | 70 | 62 | 61 | 66 | 50 | 43 | 16 | 7 | 7 | 1 | 3 | … | … | … | … | 1 | … | … | 2 | … | 1 | 1 | 1 | … | … | … | … | … | … | … | … | … |
| Females | 359 | 52 | 40 | 67 | 59 | 44 | 40 | 21 | 5 | 2 | 3 | 2 | 1 | 1 | … | … | … | … | 2 | 4 | 3 | 2 | 2 | 1 | 1 | … | 1 | … | … | … | … | … | … | |
| Education unknown | Males | 6 | … | … | … | … | … | 1 | 1 | … | … | … | … | … | … | … | … | … | … | 1 | … | 1 | … | … | … | 1 | … | … | … | … | … | … | … | 1 |
| Females | 1 | … | … | … | … | … | … | … | … | … | … | … | … | … | … | … | … | … | … | … | … | … | … | … | … | … | … | 1 | … | … | … | … | … | |
| Total | Males | 1,402 | 70 | 62 | 61 | 66 | 51 | 58 | 33 | 49 | 41 | 35 | 39 | 39 | 32 | 28 | 32 | 106 | 16 | 64 | 87 | 108 | 92 | 77 | 60 | 32 | 19 | 26 | 6 | 4 | 4 | 2 | 1 | 2 |
| Females | 1,344 | 52 | 46 | 67 | 59 | 48 | 54 | 43 | 41 | 34 | 43 | 37 | 36 | 39 | 40 | 24 | 125 | 20 | 72 | 112 | 91 | 91 | 56 | 35 | 32 | 18 | 7 | 7 | 8 | 2 | 1 | … | 4 | |
| West Harbour— | ||||||||||||||||||||||||||||||||||
| Read and Write | Males | 406 | … | … | … | … | … | 2 | 4 | 13 | 16 | 84 | 17 | 20 | 20 | 1 | 21 | 34 | 4 | 17 | 33 | 37 | 54 | 39 | 26 | 14 | 12 | 5 | … | 3 | … | … | … | |
| Females | 395 | … | … | … | … | … | … | 4 | 11 | 22 | 8 | 20 | 14 | 18 | 16 | 14 | 38 | 6 | 30 | 34 | 44 | 49 | 20 | 19 | 13 | 8 | 4 | 3 | … | … | … | … | … | |
| Read only | Males | 33 | … | … | … | … | 2 | 5 | 8 | 8 | 3 | 1 | 1 | … | … | … | … | … | … | … | … | … | … | 1 | … | 3 | … | 1 | … | … | … | … | … | … |
| Females | 25 | … | … | … | … | … | 4 | 2 | 5 | 4 | … | 1 | … | … | … | … | 1 | 1 | … | … | 1 | … | 2 | 1 | … | 2 | 1 | … | … | … | … | … | … | |
| Cannot Read | Males | 175 | 31 | 30 | 28 | 25 | 21 | 17 | 5 | 4 | … | 1 | … | … | … | 1 | … | 1 | … | 1 | 1 | 4 | 1 | 3 | … | … | … | … | … | … | … | … | … | … |
| Females | 156 | 18 | 18 | 28 | 21 | 4 | 20 | 15 | 3 | 1 | 1 | … | … | … | … | … | … | … | … | 1 | … | 1 | 1 | 1 | 2 | … | 1 | … | … | … | … | … | … | |
| Education unknown | Males | 7 | … | … | … | … | … | … | … | … | 1 | … | … | … | 1 | … | 1 | … | … | … | 1 | … | 2 | 1 | … | … | … | … | … | … | … | … | … | … |
| Females | 2 | … | … | … | … | … | … | … | … | … | … | … | … | … | … | … | … | … | … | … | 1 | … | … | 1 | … | … | … | … | … | … | … | … | … | |
| Total | Males | 621 | 31 | 30 | 28 | 25 | 23 | 24 | 17 | 25 | 20 | 16 | 18 | 20 | 21 | 2 | 22 | 35 | 4 | 18 | 35 | 41 | 57 | 44 | 26 | 17 | 13 | 6 | … | 3 | … | … | … | … |
| Females | 578 | 18 | 18 | 28 | 21 | 24 | 24 | 21 | 19 | 27 | 9 | 21 | 14 | 18 | 16 | 14 | 39 | 7 | 30 | 35 | 46 | 50 | 23 | 22 | 15 | 10 | 6 | 3 | … | … | … | … | … | |
| Green Island— | ||||||||||||||||||||||||||||||||||
| Read and Write | Males | 158 | … | … | … | … | … | … | 2 | 5 | 2 | 3 | 3 | 7 | 4 | 5 | 5 | 20 | 3 | 13 | 19 | 13 | 21 | 12 | 10 | 3 | 1 | 2 | 1 | 1 | … | 2 | … | 1 |
| Females | 147 | … | … | … | … | … | 1 | 5 | 3 | 4 | 7 | 8 | 8 | 5 | 4 | 4 | 10 | 4 | 14 | 17 | 12 | 16 | 8 | 5 | 4 | 4 | 2 | 1 | … | 1 | … | … | … | |
| Read only | Males | 17 | … | … | … | 1 | … | 3 | 2 | 4 | 3 | 1 | … | … | 1 | … | … | … | … | … | … | 2 | … | … | … | … | … | … | … | … | … | … | … | … |
| Females | 21 | … | … | … | … | … | 2 | 4 | 4 | … | … | 1 | … | … | … | … | … | … | 1 | 1 | 1 | 3 | 1 | 2 | … | … | … | 1 | … | … | … | … | … | |
| Cannot Read | Males | 54 | 14 | 6 | 6 | 10 | 8 | 7 | 2 | … | 1 | … | … | … | … | … | … | … | … | … | … | … | … | … | … | … | … | … | … | … | … | … | … | … |
| Females | 60 | 5 | 13 | 8 | 17 | 8 | 5 | 3 | … | … | … | … | … | … | … | … | … | … | … | … | 1 | … | … | … | … | … | … | … | … | … | … | … | … | |
Table XV. Table XV. Showing the Education of Persons Males and Females (exclusive of Maoris and Chinese) in each Borough—continued.
| Boroughs. | All Ages. | Under 5. | 5 and under 10. | 10 and under 15. | 15 and under 21. | 21 and under 40. | 40 and under 60. | 60 and under 80. | 80 and upwards | Unspecified Children | Unspecified Adults | |||||||||||||||||||||||
|---|---|---|---|---|---|---|---|---|---|---|---|---|---|---|---|---|---|---|---|---|---|---|---|---|---|---|---|---|---|---|---|---|---|---|
| Under 1 Year. | 1-2. | 3-3. | 3-4. | 4-5. | 5-6. | 6-7. | 7-8. | 8-9. | 9-10. | 10-11. | 11-12. | 12-13. | 13-14. | 14-15. | 15-20. | 20-21. | 21-25. | 25-30. | 30-35. | 35-40. | 40-45. | 45-50. | 50-55. | 55-60. | 60-65. | 65-70. | 70-75. | 75-80. | ||||||
| Green Island—contd. | ||||||||||||||||||||||||||||||||||
| Education unknown | Males | 1 | … | … | … | … | … | … | … | … | … | … | … | … | … | … | … | … | … | … | … | … | … | … | 1 | … | … | … | … | … | … | … | … | … |
| Females | 4 | … | … | … | … | … | … | 1 | 1 | … | … | … | … | … | 1 | … | 1 | … | … | … | … | … | … | … | … | … | … | … | … | … | … | … | … | |
| Total | Males | 230 | 14 | 6 | 6 | 11 | 8 | 10 | 6 | 9 | 6 | 4 | 3 | 7 | 5 | 5 | 5 | 20 | 3 | 13 | 19 | 15 | 21 | 12 | 11 | 3 | 1 | 2 | 1 | 1 | … | 2 | … | 1 |
| Females | 232 | 5 | 13 | 8 | 17 | 8 | 8 | 13 | 8 | 4 | 7 | 9 | 8 | 5 | 5 | 4 | 11 | 4 | 15 | 18 | 14 | 19 | 9 | 7 | 4 | 4 | 2 | 2 | … | 1 | … | … | … | |
| Milton- | ||||||||||||||||||||||||||||||||||
| Read and Write | Males | 439 | … | … | … | … | … | … | 4 | 7 | 13 | 18 | 14 | 15 | 14 | 18 | 12 | 59 | 6 | 30 | 26 | 29 | 43 | 42 | 40 | 19 | 12 | 7 | 3 | 5 | 1 | 2 | … | … |
| Females | 426 | … | … | … | … | … | 1 | 1 | 10 | 16 | 12 | 28 | 24 | 18 | 22 | 12 | 59 | 6 | 33 | 27 | 35 | 35 | 30 | 22 | 17 | 5 | 6 | 3 | 1 | … | … | … | … | |
| Read only | Males | 41 | … | … | … | … | … | 4 | 10 | 10 | 6 | 2 | 1 | 1 | … | … | … | 1 | … | … | 1 | 1 | … | 1 | 2 | … | 1 | … | … | … | … | … | … | … |
| Females | 49 | … | … | … | … | 3 | 7 | 13 | 7 | 2 | 1 | 1 | 1 | … | … | … | … | … | 1 | 4 | 2 | 4 | … | … | 2 | … | … | … | … | … | 1 | … | … | |
| Cannot Read | Males | 163 | 30 | 24 | 16 | 30 | 27 | 18 | 5 | 4 | … | … | … | … | … | … | … | … | … | 1 | … | 2 | 4 | 1 | 1 | … | … | … | … | … | … | … | … | … |
| Females | 163 | 30 | 24 | 30 | 30 | 19 | 16 | 14 | 3 | 2 | … | … | … | … | … | … | 3 | … | 3 | … | 2 | 5 | 1 | … | 3 | … | 1 | … | … | … | … | … | … | |
| Education unknown | Males | … | … | … | … | … | … | … | … | … | … | … | … | … | … | … | … | … | … | … | … | … | … | … | … | … | … | … | … | … | … | … | … | … |
| Females | … | … | … | … | … | … | … | … | … | … | … | … | … | … | … | … | … | … | … | … | … | … | … | … | … | … | … | … | … | … | … | … | … | |
| Total | Males | 643 | 30 | 24 | 16 | 30 | 27 | 22 | 19 | 21 | 19 | 20 | 15 | 16 | 14 | 18 | 12 | 60 | 6 | 31 | 27 | 32 | 47 | 44 | 43 | 19 | 13 | 7 | 3 | 5 | 1 | 2 | … | … |
| Females | 640 | 18 | 24 | 30 | 30 | 22 | 24 | 19 | 20 | 20 | 13 | 29 | 25 | 18 | 22 | 12 | 62 | 9 | 37 | 31 | 39 | 44 | 38 | 22 | 22 | 5 | 7 | 3 | 1 | … | 1 | … | … | |
| Balclutha— | ||||||||||||||||||||||||||||||||||
| Read and Write | Males | 312 | … | … | … | … | … | … | 3 | 3 | 8 | 9 | 9 | 12 | 6 | 9 | 6 | 34 | 9 | 25 | 41 | 33 | 30 | 25 | 21 | 14 | 5 | 4 | … | 2 | … | … | … | 4 |
| Females | 263 | … | … | … | … | … | … | 2 | 5 | 5 | 10 | 5 | 5 | 10 | 13 | 11 | 33 | 7 | 21 | 40 | 25 | 20 | 15 | 19 | 7 | 4 | 2 | 2 | 1 | … | … | … | 1 | |
| Read only | Males | 30 | … | … | … | … | … | 4 | 9 | 5 | 6 | 1 | … | … | … | … | … | … | … | … | 1 | … | 1 | … | … | 2 | … | … | … | … | … | 1 | … | … |
| Females | 29 | … | … | … | … | 2 | 5 | 6 | 6 | 5 | 2 | … | 1 | … | … | … | … | … | … | … | … | … | … | … | … | 1 | … | 1 | … | … | … | … | … | |
| Cannot Read | Males | 96 | 21 | 15 | 12 | 13 | 15 | 10 | 3 | 1 | 1 | … | … | … | … | … | … | 1 | … | 1 | … | 1 | … | 1 | … | … | 1 | … | … | … | … | … | … | … |
| Females | 89 | 10 | 15 | 18 | 14 | 13 | 13 | 2 | 1 | … | … | … | … | … | … | … | … | … | 2 | … | 1 | … | … | … | … | … | … | … | … | … | … | … | … | |
| Education unknown | Males | … | … | … | … | … | … | … | … | … | … | … | … | … | … | … | … | … | … | … | … | … | … | … | … | … | … | … | … | … | … | … | … | … |
| Females | … | … | … | … | … | … | … | … | … | … | … | … | … | … | … | … | … | … | … | … | … | … | … | … | … | … | … | … | … | … | … | … | … | |
| Total | Males | 438 | 21 | 15 | 12 | 13 | 15 | 14 | 15 | 14 | 15 | 10 | 9 | 12 | 6 | 9 | 6 | 35 | 9 | 26 | 42 | 34 | 31 | 26 | 21 | 16 | 6 | 4 | … | 2 | … | 1 | … | 4 |
| Females | 381 | 10 | 15 | 18 | 14 | 15 | 18 | 10 | 12 | 10 | 12 | 5 | 6 | 10 | 13 | 11 | 33 | 7 | 23 | 40 | 26 | 20 | 15 | 19 | 7 | 5 | 2 | 3 | 1 | … | … | … | 1 | |
| Tapanui— | ||||||||||||||||||||||||||||||||||
| Read and Write | Males | 222 | … | … | … | … | … | 1 | 1 | 1 | 7 | 4 | 8 | 3 | 7 | 1 | 7 | 22 | 5 | 17 | 38 | 16 | 31 | 22 | 12 | 9 | 7 | 1 | 1 | … | … | … | … | 1 |
| Females | 201 | … | … | … | … | … | … | 4 | 6 | 5 | 10 | 7 | 5 | 13 | 5 | 10 | 24 | 3 | 26 | 18 | 16 | 15 | 15 | 10 | 2 | 2 | 1 | 1 | 2 | 1 | … | … | … | |
| Read only | Males | 9 | … | … | … | … | … | 2 | 3 | 1 | 2 | … | 1 | … | … | … | … | … | … | … | … | … | … | … | … | … | … | … | … | … | … | … | … | … |
| Females | 20 | … | … | … | … | 1 | 5 | 5 | 3 | 1 | … | … | … | 2 | 1 | … | … | … | … | … | … | … | … | … | … | … | … | … | … | 1 | … | … | 1 | |
| Cannot Read | Males | 69 | 10 | 9 | 12 | 14 | 11 | 8 | 1 | 2 | … | … | … | … | … | … | … | … | … | … | 1 | … | … | … | … | … | … | … | 1 | … | … | … | … | … |
| Females | 65 | 16 | 11 | 13 | 9 | 9 | 3 | … | 1 | 1 | 1 | … | … | … | … | … | … | … | 1 | … | … | … | … | … | … | … | … | … | … | … | … | … | … | |
Table XV. Table XV. Showing the Education of Persons, Males, and Females (exclusive of Maoris and Chinese), in each Borough.—continued
| Boroughs. | All ages. | Under 5. | 5 and under 10. | 10 and under 15. | 15 and under 21. | 21 and under 40. | 40 and under 60. | 60 and under 80. | 80 and Upward. | Unspecified Children. | Unspecified Adults. | |||||||||||||||||||||||
|---|---|---|---|---|---|---|---|---|---|---|---|---|---|---|---|---|---|---|---|---|---|---|---|---|---|---|---|---|---|---|---|---|---|---|
| Under 1 year. | 1–3. | 3–3. | 3–4. | 4–5. | 5–6. | 6–7. | 7–8. | 8–9. | 9–10. | 10–11. | 11–12. | 12–13. | 13–14. | 14–15. | 15–20. | 20–21. | 21–25. | 25–30. | 30–35. | 35–40. | 40–45. | 45–50. | 50–55. | 55–60. | 60–65. | 65–70. | 50–75. | 75–80. | ||||||
| Education unknown | Males | 3 | … | … | … | … | … | … | … | … | … | … | … | … | … | … | … | … | … | … | … | 1 | … | … | … | … | … | … | … | … | … | … | … | 2 |
| Females | 2 | … | … | … | … | … | … | … | … | … | … | … | … | … | … | … | … | … | … | … | 1 | … | … | … | … | 1 | … | … | … | … | … | … | … | |
| Total | Males | 303 | 10 | 9 | 12 | 14 | 11 | 11 | 5 | 4 | 9 | 4 | 9 | 3 | 7 | 1 | 7 | 22 | 5 | 17 | 39 | 17 | 31 | 22 | 12 | 9 | 7 | 1 | 2 | … | … | … | … | 3 |
| Females | 288 | 16 | 11 | 13 | 9 | 10 | 8 | 9 | 10 | 7 | 11 | 7 | 5 | 15 | 6 | 10 | 24 | 3 | 27 | 18 | 17 | 15 | 15 | 10 | 2 | 3 | 1 | 1 | 2 | 2 | … | … | 1 | |
| Lawrence— | ||||||||||||||||||||||||||||||||||
| Read and Write | Males | 381 | … | … | … | … | … | 1 | 5 | 13 | 10 | 14 | 14 | 9 | 12 | 12 | 9 | 36 | 11 | 26 | 40 | 30 | 23 | 23 | 48 | 23 | 13 | 7 | 2 | … | … | … | … | … |
| Females | 362 | … | … | … | … | … | 1 | 4 | 14 | 7 | 14 | 9 | 11 | 14 | 16 | 12 | 55 | 12 | 28 | 44 | 27 | 27 | 22 | 21 | 10 | 6 | 5 | 2 | 1 | … | … | … | … | |
| Read only | Males | 21 | … | … | … | … | 2 | 8 | 3 | 1 | 2 | 1 | … | … | … | … | … | … | … | … | … | … | 1 | 1 | 1 | … | … | 1 | … | … | … | … | … | … |
| Females | 18 | … | … | … | … | 2 | 2 | 5 | 1 | 1 | … | … | … | … | … | … | … | … | 1 | 1 | 1 | … | … | 1 | … | 1 | … | … | … | … | … | … | … | |
| Cannot Read | Males | 102 | 17 | 16 | 13 | 20 | 13 | 9 | 5 | 1 | 1 | 1 | … | … | 1 | … | … | … | … | … | … | … | … | 1 | 1 | … | … | … | … | 1 | … | … | … | 1 |
| Females | 119 | 18 | 24 | 17 | 15 | 19 | 11 | 3 | 1 | 2 | 1 | … | … | … | … | … | 2 | … | 1 | 1 | … | … | 2 | 1 | 1 | … | … | … | … | … | … | … | … | |
| Education unknown | Males | … | … | … | … | … | … | … | … | … | … | … | … | … | … | … | … | … | … | … | … | … | … | … | … | … | … | … | … | … | … | … | … | … |
| Females | … | … | … | … | … | … | … | … | … | … | … | … | … | … | … | … | … | … | … | … | … | … | … | … | … | … | … | … | … | … | … | … | … | |
| Total | Males | 504 | … | … | 16 | 13 | 20 | 15 | 18 | 13 | 16 | 13 | 16 | 14 | 9 | 13 | 12 | 9 | 36 | 11 | 26 | 40 | 30 | 24 | 25 | 50 | 23 | 13 | 8 | 2 | 1 | … | … | 1 |
| Females | 499 | 18 | 24 | 17 | 15 | 21 | 14 | 12 | 18 | 10 | 15 | 9 | 11 | 14 | 16 | 12 | 57 | 12 | 30 | 46 | 28 | 27 | 24 | 23 | 11 | 7 | 5 | 2 | 1 | … | … | … | … | |
| Roxburgh— | ||||||||||||||||||||||||||||||||||
| Read and Write | Males | 106 | … | … | … | … | … | … | 1 | 3 | … | 3 | 4 | 6 | 1 | 4 | 1 | 12 | … | 8 | 8 | 12 | 13 | 14 | 8 | 1 | 1 | 2 | … | 2 | 1 | … | … | 1 |
| Females | 84 | … | … | … | … | … | 1 | 1 | 3 | 4 | 6 | 1 | 1 | 1 | 2 | 2 | 12 | 2 | 10 | 12 | 7 | 5 | 4 | 1 | 2 | 1 | 1 | … | … | 1 | … | … | 1 | |
| Read only | Males | 8 | … | … | … | … | … | 2 | 3 | 1 | … | … | … | … | … | … | … | … | … | … | … | … | … | 1 | … | … | … | … | … | 1 | … | … | … | … |
| Females | 4 | … | … | … | … | … | 1 | … | 1 | … | … | … | … | … | … | … | … | … | … | … | 1 | … | … | … | … | 1 | … | … | … | … | … | … | … | |
| Cannot Read | Males | 20 | 2 | 4 | 2 | 7 | 2 | 1 | 1 | … | … | … | … | … | … | … | … | … | … | … | … | … | … | … | 1 | … | … | … | … | … | … | … | … | … |
| females | 23 | 5 | 6 | 3 | 1 | 4 | 2 | … | … | … | … | … | … | … | … | … | … | … | … | … | … | … | … | … | 1 | 1 | … | … | … | … | … | … | … | |
| Education unknown | Males | … | … | … | … | … | … | … | … | … | … | … | … | … | … | … | … | … | … | … | … | … | … | … | … | … | … | … | … | … | … | … | … | … |
| Females | … | … | … | … | … | … | … | … | … | … | … | … | … | … | … | … | … | … | … | … | … | … | … | … | … | … | … | … | … | … | … | … | … | |
| Total | Males | 134 | 2 | 4 | 2 | 7 | 2 | 3 | 5 | 4 | … | 3 | 4 | 6 | 1 | 4 | 1 | 12 | … | 8 | 8 | 12 | 13 | 15 | 9 | 1 | 1 | 2 | … | 3 | 1 | … | … | 1 |
| Females | 111 | 5 | 6 | 3 | 1 | 4 | 4 | 1 | 4 | 4 | 6 | 1 | 1 | 1 | 2 | 2 | 12 | 2 | 10 | 12 | 8 | 8 | 4 | 1 | 3 | 3 | 1 | … | … | 1 | … | … | 1 | |
| Naseby— | ||||||||||||||||||||||||||||||||||
| Read and Write | Males | 212 | … | … | … | … | … | 1 | 7 | 9 | 6 | 7 | 10 | 8 | 6 | 7 | 7 | 17 | 3 | 6 | 19 | 5 | 25 | 20 | 23 | 19 | 2 | 4 | … | … | … | 1 | … | … |
| Females | 172 | … | … | … | … | … | … | … | 4 | 7 | 9 | 3 | 6 | 6 | 9 | 4 | 26 | 5 | 9 | 15 | 12 | 21 | 14 | 15 | 3 | 1 | 2 | … | … | … | … | … | 1 | |
| Read only | Males | 23 | … | … | … | … | 2 | 5 | 7 | 3 | 2 | … | … | … | … | … | … | … | … | 1 | … | … | 3 | … | … | … | … | … | … | … | … | … | … | … |
| Females | 13 | … | … | … | … | … | 4 | 2 | 2 | 1 | 1 | … | … | … | … | … | 1 | … | … | … | 1 | … | … | 1 | … | … | … | … | … | … | … | … | … | |
| Cannot Read | Males | 65 | 16 | 7 | 11 | 14 | 9 | 4 | 2 | … | 1 | … | … | … | … | … | … | … | … | … | … | … | … | 1 | … | … | … | … | … | … | … | … | … | … |
| Females | 53 | 10 | 9 | 11 | 8 | 7 | 6 | 1 | 1 | … | … | … | … | … | … | … | … | … | … | … | … | … | … | … | … | … | … | … | … | … | … | … | … | |
| Education unknown | Males | … | … | … | … | … | … | … | … | … | … | … | … | … | … | … | … | … | … | … | … | … | … | … | … | … | … | … | … | … | … | … | … | … |
| Females | … | … | … | … | … | … | … | … | … | … | … | … | … | … | … | … | … | … | … | … | … | … | … | … | … | … | … | … | … | … | … | … | … | |
| Total | Males | 300 | 16 | 7 | 11 | 14 | 11 | 10 | 16 | 12 | 9 | 7 | 10 | 8 | 6 | 7 | 7 | 17 | 3 | 7 | 19 | 5 | 28 | 21 | 23 | 19 | 2 | 4 | … | … | … | 1 | … | … |
| Females | 238 | 10 | 9 | 11 | 8 | 7 | 10 | 3 | 7 | 8 | 10 | 3 | 6 | 6 | 9 | 4 | 27 | 5 | 9 | 15 | 13 | 21 | 14 | 16 | 3 | 1 | 2 | … | … | … | … | … | 1 | |
| Alexandra— | ||||||||||||||||||||||||||||||||||
| Read and Write | Males | 106 | … | … | … | … | … | 1 | 1 | 2 | 4 | 1 | 7 | 5 | 6 | 5 | 4 | 5 | 2 | 4 | 7 | 5 | 8 | 14 | 11 | 9 | 1 | 1 | 3 | … | … | … | … | … |
| Females | 72 | … | … | … | … | … | 3 | 1 | 1 | 3 | 4 | 1 | 3 | 3 | 1 | 1 | 14 | 2 | 5 | 4 | 7 | 5 | 4 | 3 | 4 | 1 | 1 | … | … | … | 1 | … | … | |
| Read only | Males | 2 | … | … | … | … | … | … | 1 | 1 | … | … | … | … | … | … | … | … | … | … | … | … | … | … | … | … | … | … | … | … | … | … | … | … |
| Females | 12 | … | … | … | … | 2 | 1 | 1 | 3 | 1 | 1 | … | … | … | … | … | … | … | … | 1 | 2 | … | … | … | … | … | … | … | … | … | … | … | … | |
| Cannot Read | Males | 27 | 5 | 2 | 4 | 5 | 7 | 2 | … | … | … | … | … | … | … | … | … | … | … | … | … | … | … | … | 1 | … | … | … | … | 1 | … | … | … | … |
| Females | 27 | 7 | 4 | 5 | 3 | 2 | 2 | 1 | … | … | … | … | … | … | … | … | … | … | … | … | 1 | … | … | … | 1 | … | … | 1 | … | … | … | … | … | |
Table XV. Table XV. Showing the Education of Persons, Males, and Females (exclusive of Maoris and Chinese), in each Borough.—continued
| Boroughs. | All ages. | Under 5. | 5 and under 10. | 10 and under 15. | 15 and under 21. | 21 and under 40. | 40 and under 60. | 60 and under 80. | 80 and Upward. | Unspecified Children. | Unspecified Adults. | |||||||||||||||||||||||
|---|---|---|---|---|---|---|---|---|---|---|---|---|---|---|---|---|---|---|---|---|---|---|---|---|---|---|---|---|---|---|---|---|---|---|
| Under 1 year. | 1–3. | 3–3. | 3–4. | 4–5. | 5–6. | 6–7. | 7–8. | 8–9. | 9–10. | 10–11. | 11–12. | 12–13. | 13–14. | 14–15. | 15–20. | 20–21. | 21–25. | 25–30. | 30–35. | 35–40. | 40–45. | 45–50. | 50–55. | 55–60. | 60–65. | 65–70. | 50–75. | 75–80. | ||||||
| Alexandra— | ||||||||||||||||||||||||||||||||||
| Education unknown | Males | … | … | … | … | … | … | … | … | … | … | … | … | … | … | … | … | … | … | … | … | … | … | … | … | … | … | … | … | … | … | … | … | … |
| Females | … | … | … | … | … | … | … | … | … | … | … | … | … | … | … | … | … | … | … | … | … | … | … | … | … | … | … | … | … | … | … | … | … | |
| Total | Males | 135 | 5 | 2 | 4 | 5 | 7 | 3 | 2 | 3 | 4 | 1 | 7 | 5 | 6 | 1 | 4 | 5 | 2 | 4 | 7 | 5 | 8 | 14 | 12 | 9 | 1 | 1 | 3 | 1 | … | … | … | … |
| Females | 111 | 7 | 4 | 5 | 3 | 5 | 6 | 3 | 4 | 4 | 5 | 1 | 3 | 3 | 1 | 1 | 14 | 2 | 5 | 5 | 10 | 5 | 4 | 3 | 5 | 1 | 1 | 1 | … | … | 1 | … | … | |
| Cromwell— | ||||||||||||||||||||||||||||||||||
| Read and Write | Males | 160 | … | … | … | … | … | 1 | 1 | 5 | 6 | 7 | 6 | 5 | 3 | 2 | 1 | 12 | 2 | 14 | 12 | 7 | 20 | 18 | 10 | 13 | 4 | 7 | 2 | 1 | 1 | … | … | … |
| Females | 146 | … | … | … | … | … | 2 | 5 | 7 | 3 | 4 | 6 | 12 | 2 | 7 | 4 | 26 | 2 | 10 | 7 | 9 | 13 | 8 | 9 | 3 | 2 | 4 | … | 1 | … | … | … | … | |
| Read only | Males | 7 | … | … | … | … | 1 | 2 | 3 | … | … | 1 | … | … | … | … | … | … | … | … | … | … | … | … | … | … | … | … | … | … | … | … | … | … |
| Females | 11 | … | … | … | … | 3 | 1 | 2 | … | 1 | 1 | … | … | … | 1 | … | … | … | … | … | … | … | 1 | 1 | … | … | … | … | … | … | … | … | … | |
| Cannot Read | Males | 28 | 7 | 6 | 2 | 7 | 2 | 2 | 2 | … | … | … | … | … | … | … | … | … | … | … | … | … | … | … | … | … | … | … | … | … | … | … | … | … |
| Females | 40 | 5 | 9 | 5 | 9 | 5 | 1 | 3 | 4 | … | … | … | … | … | … | … | … | … | … | … | … | 1 | … | 1 | … | … | … | … | … | … | … | … | … | |
| Education unknown | Males | … | … | … | … | … | … | … | … | … | … | … | … | … | … | … | … | … | … | … | … | … | … | … | … | … | … | … | … | … | … | … | … | … |
| Females | 4 | … | … | … | … | … | … | … | … | … | … | … | … | … | … | … | 1 | … | 1 | … | 2 | … | … | … | … | … | … | … | … | … | … | … | … | |
| Total | Males | 195 | 7 | 6 | 2 | 7 | 3 | 3 | 6 | 5 | 6 | 8 | 6 | 5 | 3 | 2 | 1 | 12 | 7 | 14 | 12 | 7 | 20 | 18 | 10 | 13 | 4 | 7 | 2 | 1 | 1 | … | … | … |
| Females | 201 | 5 | 9 | 5 | 9 | 8 | 4 | 10 | 8 | 4 | 5 | 6 | 12 | 2 | 8 | 4 | 27 | 2 | 11 | 7 | 11 | 14 | 9 | 11 | 3 | 2 | 4 | … | 1 | … | … | … | … | |
| Arrowtown— | ||||||||||||||||||||||||||||||||||
| Read and Write | Males | 158 | … | … | … | … | … | 1 | 1 | 5 | 8 | 8 | 2 | 3 | 3 | 5 | 4 | 10 | 2 | 11 | 11 | 18 | 17 | 22 | 10 | 13 | 2 | 2 | … | … | … | … | … | … |
| Females | 122 | … | … | … | … | … | … | 3 | 2 | 6 | 5 | 5 | 8 | 5 | 3 | 7 | 14 | 4 | 13 | 12 | 12 | 8 | 7 | 3 | 2 | … | … | … | 2 | 1 | … | … | … | |
| Read only | Males | 13 | … | … | … | … | … | 1 | 5 | 2 | 1 | 1 | 2 | 1 | … | … | … | … | … | … | … | … | … | … | … | … | … | … | … | … | … | … | … | … |
| Females | 13 | … | … | … | … | … | 2 | 5 | 3 | … | … | … | … | … | … | … | … | … | … | … | … | … | 1 | 1 | 1 | … | … | … | … | … | … | … | … | |
| Cannot Read | Males | 49 | 13 | 6 | 7 | 8 | 6 | 4 | 4 | … | … | … | … | … | … | … | … | … | … | … | … | … | … | 1 | … | … | … | … | … | … | … | … | … | … |
| females | 43 | 5 | 8 | 9 | 6 | 9 | 4 | 1 | … | … | … | … | … | … | … | … | … | … | … | … | … | 1 | … | … | … | … | … | … | … | … | … | … | … | |
| Education unknown | Males | … | … | … | … | … | … | … | … | … | … | … | … | … | … | … | … | … | … | … | … | … | … | … | … | … | … | … | … | … | … | … | … | … |
| Females | 2 | … | … | … | … | … | … | … | … | … | … | … | … | … | … | … | … | … | … | … | … | 1 | 1 | … | … | … | … | … | … | … | … | … | … | |
| Total | Males | 220 | 13 | 6 | 7 | 8 | 6 | 6 | 10 | 7 | 9 | 9 | 4 | 4 | 3 | 5 | 4 | 10 | 2 | 11 | 11 | 18 | 17 | 23 | 10 | 13 | 2 | 2 | … | … | … | … | … | … |
| Females | 180 | 5 | 8 | 9 | 6 | 9 | 6 | 9 | 5 | 6 | 5 | 5 | 8 | 5 | 3 | 7 | 14 | 4 | 13 | 12 | 12 | 10 | 9 | 4 | 3 | … | … | … | 2 | 1 | … | … | … | |
| Queenstown— | ||||||||||||||||||||||||||||||||||
| Read and Write | Males | 304 | … | … | … | … | … | 6 | 7 | 7 | 8 | 8 | 9 | 13 | 13 | 7 | 11 | 22 | 4 | 23 | 23 | 27 | 25 | 26 | 24 | 22 | 9 | 3 | 3 | 1 | 1 | 1 | … | 1 |
| Females | 218 | … | … | … | … | … | … | 2 | 6 | 1 | 6 | 9 | 6 | 9 | 10 | 1O | 20 | 7 | 27 | 21 | 17 | 14 | 19 | 12 | 11 | 2 | 1 | … | 2 | 1 | … | … | 1 | |
| Read only | Males | 11 | … | … | … | … | 2 | 5 | 2 | 1 | … | … | … | … | … | … | … | … | … | … | … | … | … | … | 1 | … | … | … | … | … | … | … | … | … |
| Females | 22 | … | … | … | 1 | 5 | 6 | 1 | 2 | … | 1 | … | … | … | … | … | … | … | … | … | … | 2 | 1 | … | 1 | … | 1 | … | … | 1 | … | … | … | |
| Cannot Read | Males | 50 | 3 | 10 | 9 | 11 | 4 | 7 | 2 | … | … | … | … | … | … | … | … | … | … | … | … | 1 | … | 1 | … | 1 | … | 1 | … | … | … | … | … | … |
| Females | 55 | 10 | 10 | 12 | 6 | 9 | 4 | 1 | 1 | … | … | … | … | … | … | … | … | … | … | … | … | 1 | … | … | 1 | … | … | … | … | … | … | … | … | |
Table XV. Table XV. Showing the Education of Persons, Males, and Females (exclusive of Maoris and Chinese), in each Borough.—continued
| Boroughs. | All ages. | Under 5. | 5 and under 10. | 10 and under 15. | 15 and under 21. | 21 and under 40. | 40 and under 60. | 60 and under 80. | 80 and Upward. | Unspecified Children. | Unspecified Adults. | |||||||||||||||||||||||
|---|---|---|---|---|---|---|---|---|---|---|---|---|---|---|---|---|---|---|---|---|---|---|---|---|---|---|---|---|---|---|---|---|---|---|
| Under 1 year. | 1–3. | 3–3. | 3–4. | 4–5. | 5–6. | 6–7. | 7–8. | 8–9. | 9–10. | 10–11. | 11–12. | 12–13. | 13–14. | 14–15. | 15–20. | 20–21. | 21–25. | 25–30. | 30–35. | 35–40. | 40–45. | 45–50. | 50–55. | 55–60. | 60–65. | 65–70. | 50–75. | 75–80. | ||||||
| Education unknown | Males | … | … | … | … | … | … | … | … | … | … | … | … | … | … | … | … | … | … | … | … | … | … | … | … | … | … | … | … | … | … | … | … | … |
| Females | … | … | … | … | … | … | … | … | … | … | … | … | … | … | … | … | … | … | … | … | … | … | … | … | … | … | … | … | … | … | … | … | … | |
| Total | Males | 365 | 3 | 10 | 9 | 11 | 6 | 18 | 11 | 8 | 8 | 8 | 9 | 13 | 13 | 7 | 11 | 22 | 4 | 23 | 23 | 28 | 25 | 27 | 25 | 23 | 9 | 4 | 3 | 1 | 1 | 1 | … | 1 |
| Females | 295 | 10 | 10 | 12 | 7 | 14 | 10 | 4 | 9 | 1 | 7 | 9 | 6 | 9 | 10 | 10 | 20 | 7 | 27 | 25 | 17 | 17 | 20 | 12 | 13 | 2 | 2 | … | 2 | 2 | … | … | 1 | |
| Invercargill— | ||||||||||||||||||||||||||||||||||
| Read and Write | Males | 1,749 | … | … | … | … | … | 6 | 17 | 24 | 45 | 48 | 46 | 49 | 58 | 45 | 52 | 199 | 22 | 176 | 222 | 163 | 127 | 158 | 122 | 89 | 32 | 22 | 11 | 7 | 2 | 3 | … | 4 |
| Females | 1,666 | … | … | … | … | … | 5 | 20 | 28 | 46 | 44 | 66 | 44 | 44 | 57 | 58 | 286 | 57 | 173 | 190 | 124 | 117 | 117 | 89 | 34 | 26 | 19 | 11 | 7 | 1 | 2 | … | 1 | |
| Read only | Males | 92 | … | … | … | … | 7 | 17 | 21 | 20 | 6 | 5 | 2 | 1 | 1 | 1 | … | 3 | … | … | 1 | 3 | 1 | … | 2 | 1 | … | … | … | … | … | … | … | … |
| Females | 116 | … | … | … | 1 | 6 | 8 | 32 | 25 | 6 | 7 | 3 | 1 | 2 | … | 1 | 3 | … | 2 | 2 | 3 | 4 | 1 | 6 | … | … | 2 | 1 | … | … | … | … | … | |
| Cannot Read | Males | 506 | 97 | 76 | 81 | 78 | 69 | 56 | 14 | 9 | 4 | 1 | 1 | … | … | 2 | 1 | 3 | … | … | 2 | 2 | 5 | 2 | … | 3 | … | … | … | … | … | … | … | … |
| Females | 438 | 66 | 58 | 76 | 76 | 64 | 45 | 18 | 8 | 3 | 3 | 1 | … | … | … | 2 | 1 | 1 | 1 | 2 | 3 | 4 | 2 | 2 | 1 | … | 1 | … | … | … | … | … | … | |
| Education unknown | Males | 2 | … | … | … | … | … | … | … | … | … | … | … | … | … | … | … | … | … | … | … | … | 1 | … | … | … | … | … | … | 1 | … | … | … | … |
| Females | 3 | … | … | … | … | … | … | … | … | … | … | … | … | 1 | … | … | … | … | … | 1 | … | … | … | … | … | … | … | … | 1 | … | … | … | … | |
| Total | Males | 2,349 | 97 | 76 | 81 | 78 | 76 | 79 | 52 | 53 | 55 | 54 | 49 | 50 | 59 | 48 | 53 | 205 | 22 | 176 | 225 | 168 | 134 | 160 | 124 | 93 | 32 | 22 | 11 | 8 | 2 | 3 | … | 4 |
| Females | 2,223 | 66 | 58 | 76 | 77 | 70 | 58 | 70 | 61 | 55 | 54 | 70 | 45 | 47 | 57 | 61 | 290 | 58 | 176 | 195 | 130 | 125 | 120 | 97 | 35 | 26 | 22 | 12 | 8 | 1 | 2 | … | 1 | |
| Invercargill South— | ||||||||||||||||||||||||||||||||||
| Read and Write | Males | 306 | … | … | … | … | … | … | 3 | 4 | 8 | 13 | 7 | 7 | 10 | 14 | 11 | 40 | 7 | 16 | 39 | 33 | 19 | 39 | 15 | 10 | 2 | 5 | 1 | 1 | 1 | … | … | … |
| Females | 272 | … | … | … | … | … | 2 | 6 | 4 | 7 | 16 | 18 | 13 | 7 | 7 | 10 | 28 | 6 | 22 | 26 | 31 | 21 | 25 | 6 | 9 | 5 | 2 | 1 | … | … | … | … | … | |
| Read only | Males | 36 | … | … | … | … | … | 5 | 6 | 8 | 7 | … | … | 1 | 1 | 1 | … | … | … | … | … | 4 | 1 | 1 | … | … | … | 1 | … | … | … | … | … | … |
| Females | 32 | … | … | … | … | … | 2 | 5 | 4 | 4 | 2 | 1 | 3 | … | … | … | … | … | … | 3 | 2 | 1 | 2 | 3 | … | … | … | … | … | … | … | … | … | |
| Cannot Read | Males | 129 | 22 | 17 | 19 | 21 | 16 | 12 | 4 | 4 | 1 | 1 | … | … | … | … | … | 1 | … | 1 | 1 | … | 3 | 1 | 2 | 1 | 1 | 1 | … | … | … | … | … | … |
| Females | 144 | 18 | 27 | 18 | 19 | 17 | 16 | 5 | 3 | 1 | 1 | … | 1 | 1 | … | … | 2 | 1 | … | 3 | 2 | 4 | 4 | … | 1 | … | … | … | … | … | … | … | … | |
| Education unknown | Males | 4 | … | … | … | … | … | … | 1 | … | … | … | 1 | … | 1 | … | 1 | … | … | … | … | … | … | … | … | … | … | … | … | … | … | … | … | … |
| Females | … | … | … | … | … | … | … | … | … | … | … | … | … | … | … | … | … | … | … | … | … | … | … | … | … | … | … | … | … | … | … | … | … | |
| Total | Males | 475 | 22 | 17 | 19 | 21 | 16 | 17 | 14 | 16 | 16 | 14 | 8 | 8 | 12 | 15 | 12 | 41 | 7 | 17 | 40 | 37 | 23 | 41 | 17 | 11 | 3 | 7 | 2 | 1 | 1 | … | … | … |
| Females | 448 | 18 | 27 | 18 | 19 | 17 | 20 | 16 | 11 | 12 | 19 | 19 | 17 | 8 | 7 | 10 | 30 | 7 | 22 | 32 | 35 | 26 | 31 | 9 | 10 | 5 | 2 | 1 | … | … | … | … | … | |
| Invercargill East— | ||||||||||||||||||||||||||||||||||
| Read and Write | Males | 306 | … | … | … | … | … | 1 | 5 | 6 | 8 | 14 | 9 | 12 | 8 | 12 | 10 | 50 | 8 | 23 | 26 | 19 | 11 | 27 | 24 | 12 | 4 | 5 | 4 | 6 | 2 | … | … | … |
| Females | 284 | … | … | … | … | … | 2 | 3 | 9 | 10 | 12 | 11 | 9 | 16 | 8 | 11 | 39 | 11 | 21 | 17 | 23 | 17 | 18 | 20 | 12 | 4 | 9 | 1 | 1 | … | … | … | … | |
| Read only | Males | 22 | … | … | … | … | 1 | 8 | 5 | 1 | 1 | … | 1 | … | … | … | … | 2 | 1 | 1 | … | … | … | … | … | … | … | 1 | … | … | … | … | … | … |
| Females | 18 | … | … | … | … | … | 2 | 2 | 3 | 1 | 1 | … | … | … | … | … | 1 | 1 | 2 | … | 1 | … | … | … | 1 | 1 | 1 | … | … | … | … | … | … | |
| Cannot Read | Males | 83 | 18 | 11 | 12 | 10 | 13 | 10 | 2 | … | … | … | … | … | … | … | … | … | … | … | … | 1 | … | … | 2 | 3 | … | … | … | … | … | … | … | … |
| Females | 72 | 18 | 4 | 11 | 15 | 8 | 7 | 2 | … | 1 | … | 1 | … | … | … | … | … | … | … | … | … | 1 | 2 | … | 1 | 1 | … | … | … | … | … | … | … | |
| Education unknown | Males | … | … | … | … | … | … | … | … | … | … | … | … | … | … | … | … | … | … | … | … | … | … | … | … | … | … | … | … | … | … | … | … | … |
| Females | … | … | … | … | … | … | … | … | … | … | … | … | … | … | … | … | … | … | … | … | … | … | … | … | … | … | … | … | … | … | … | … | … | |
| Total | Males | 411 | 18 | 11 | 12 | 10 | 14 | 19 | 12 | 7 | 9 | 14 | 10 | 12 | 8 | 12 | 10 | 52 | 9 | 24 | 26 | 20 | 12 | 27 | 26 | 15 | 4 | 6 | 4 | 6 | 2 | … | … | … |
| Females | 374 | 18 | 4 | 11 | 15 | 8 | 11 | 7 | 12 | 12 | 13 | 12 | 9 | 16 | 8 | 11 | 40 | 12 | 23 | 17 | 24 | 19 | 20 | 20 | 14 | 6 | 10 | 1 | 1 | … | … | … | … | |
| Invercargill North— | ||||||||||||||||||||||||||||||||||
| Read and Write | Males | 241 | … | … | … | … | … | 3 | 6 | 6 | 7 | 13 | 10 | 6 | 7 | 11 | 7 | 27 | 7 | 13 | 27 | 19 | 16 | 17 | 20 | 6 | 5 | 4 | 1 | … | 1 | 1 | … | 1 |
| Females | 222 | … | … | … | … | … | 2 | 1 | 11 | 9 | 5 | 11 | 19 | 9 | 6 | 3 | 21 | 4 | 15 | 23 | 22 | 17 | 19 | 12 | 7 | 2 | 1 | 2 | 1 | … | … | … | … | |
| Read only | Males | 13 | … | … | … | … | 1 | 3 | 1 | 2 | … | 2 | … | … | … | … | … | … | … | … | 1 | 1 | … | 1 | 1 | … | … | … | … | … | … | … | … | … |
| Females | 15 | … | … | … | 1 | … | 3 | 2 | 1 | 1 | … | … | … | … | … | … | … | … | 1 | … | 1 | 2 | 2 | 1 | … | … | … | … | … | … | … | … | … | |
| Cannot Read | Males | 84 | 16 | 20 | 9 | 4 | 15 | 9 | 4 | … | … | … | … | … | … | … | … | … | … | … | 1 | 2 | … | … | … | … | … | … | … | … | … | … | … | … |
| Females | 95 | 16 | 16 | 18 | 25 | 7 | 5 | 4 | … | … | … | … | 1 | … | … | … | … | … | … | 1 | 1 | … | 1 | … | … | … | … | … | … | … | … | … | … | |
Table XV. Table XV. Showing the Education of Persons. Males, and Females (exclusive of Maoris and Chinese), in each Borough.—continued
| Boroughs. | All ages. | Under 5. | 5 and under 10. | 10 and under 15. | 15 and under 21. | 21 and under 40. | 40 and under 60. | 60 and under 80. | 80 and Upward. | Unspecified Children. | Unspecified Adults. | |||||||||||||||||||||||
|---|---|---|---|---|---|---|---|---|---|---|---|---|---|---|---|---|---|---|---|---|---|---|---|---|---|---|---|---|---|---|---|---|---|---|
| Under 1 year. | 1–3. | 3–3. | 3–4. | 4–5. | 5–6. | 6–7. | 7–8. | 8–9. | 9–10. | 10–11. | 11–12. | 12–13. | 13–14. | 14–15. | 15–20. | 20–21. | 21–25. | 25–30. | 30–35. | 35–40. | 40–45. | 45–50. | 50–55. | 55–60. | 60–65. | 65–70. | 50–75. | 75–80. | ||||||
| Invercargill North— | ||||||||||||||||||||||||||||||||||
| Education unknown | Males | … | … | … | … | … | … | … | … | … | … | … | … | … | … | … | … | … | … | … | … | … | … | … | … | … | … | … | … | … | … | … | … | … |
| Females | … | … | … | … | … | … | … | … | … | … | … | … | … | … | … | … | … | … | … | … | … | … | … | … | … | … | … | … | … | … | … | … | … | |
| Total | Males | 338 | 16 | 20 | 9 | 4 | 16 | 15 | 11 | 8 | 7 | 15 | 10 | 6 | 7 | 11 | 7 | 27 | 7 | 13 | 29 | 22 | 17 | 20 | 21 | 7 | 5 | 4 | 1 | … | 1 | 1 | … | 1 |
| Females | 332 | 16 | 16 | 18 | 26 | 7 | 10 | 7 | 12 | 10 | 5 | 11 | 20 | 9 | 6 | 3 | 21 | 4 | 16 | 24 | 24 | 19 | 22 | 13 | 7 | 2 | 1 | 2 | 1 | … | … | … | … | |
| Campbelltown— | ||||||||||||||||||||||||||||||||||
| Read and Write | Males | 122 | … | … | … | … | … | 2 | 2 | 3 | 1 | 4 | 5 | 5 | 2 | 3 | 3 | 14 | 3 | 7 | 12 | 10 | 9 | 10 | 8 | 8 | 8 | 2 | … | … | … | 1 | … | … |
| Females | 122 | … | … | … | … | … | … | 2 | 2 | 5 | 2 | 8 | 2 | 3 | 6 | 2 | 23 | 2 | 20 | 9 | 4 | 12 | 8 | 5 | 2 | 3 | … | … | … | 1 | 1 | … | … | |
| Read only | Males | 17 | … | … | … | … | … | 3 | … | 4 | … | 2 | 1 | 1 | … | … | … | … | … | … | … | 2 | 1 | 2 | … | … | … | … | 1 | … | … | … | … | … |
| Females | 7 | … | … | … | … | … | … | 2 | … | 2 | … | 1 | … | … | … | … | 1 | … | … | 1 | … | … | … | … | … | … | … | … | … | … | … | … | ||
| Cannot Read | Males | 38 | 3 | 6 | 6 | 10 | 7 | 4 | 1 | … | … | … | … | … | … | … | … | … | … | … | … | … | 1 | … | … | … | … | … | … | … | … | … | … | … |
| Females | 45 | 7 | 6 | 9 | 8 | 5 | 4 | 2 | … | 1 | … | … | … | … | … | 1 | … | … | … | … | … | … | … | 1 | 1 | … | … | … | … | … | … | … | … | |
| Education unknown | Males | … | … | … | … | … | … | … | … | … | … | … | … | … | … | … | … | … | … | … | … | … | … | … | … | … | … | … | … | … | … | … | … | … |
| Females | … | … | … | … | … | … | … | … | … | … | … | … | … | … | … | … | … | … | … | … | … | … | … | … | … | … | … | … | … | … | … | … | … | |
| Total | Males | 177 | 3 | 6 | 6 | 10 | 7 | 9 | 3 | 7 | 1 | 6 | 6 | 6 | 2 | 3 | 3 | 14 | 3 | 7 | 12 | 12 | 11 | 12 | 8 | 8 | 8 | 2 | 1 | … | … | 1 | … | … |
| Females | 174 | 7 | 6 | 9 | 8 | 5 | 4 | 6 | 2 | 8 | 2 | 9 | 2 | 3 | 6 | 3 | 24 | 2 | 20 | 1O | 4 | 12 | 8 | 6 | 3 | 3 | … | … | … | 1 | 1 | … | … | |
| Avenal— | ||||||||||||||||||||||||||||||||||
| Read and Write | Males | 133 | … | … | … | … | … | … | 3 | 7 | 4 | 4 | 7 | 3 | 7 | 3 | 5 | 15 | 3 | 5 | 11 | 11 | 9 | 11 | 12 | 5 | 5 | 1 | 1 | 1 | … | … | … | … |
| Females | 129 | … | … | … | … | … | … | 1 | 2 | 3 | 9 | 5 | 5 | 5 | 5 | 6 | 16 | 3 | 10 | 11 | 12 | 14 | 8 | 5 | 3 | 3 | 2 | 1 | … | … | … | … | … | |
| Read only | Males | 5 | … | … | … | … | … | 2 | 2 | 1 | … | … | … | … | … | … | … | … | … | … | … | … | … | … | … | … | … | … | … | … | … | … | … | … |
| Females | 12 | … | … | … | … | … | 1 | 2 | 2 | 1 | … | … | 1 | … | … | … | … | 1 | … | 1 | … | … | 1 | … | 1 | … | … | … | … | 1 | … | … | … | |
| Cannot Read | Males | 42 | 7 | 6 | 8 | 4 | 7 | 4 | 3 | 1 | … | … | … | … | … | … | … | … | … | … | … | … | … | … | … | 1 | 1 | … | … | … | … | … | … | … |
| Females | 38 | 5 | 6 | 6 | 10 | 5 | 3 | … | 1 | … | … | … | … | … | … | … | … | … | … | … | … | … | … | 1 | 1 | … | … | … | … | … | … | … | … | |
| Education unknown | Males | 2 | … | … | … | … | … | … | … | … | … | … | … | … | … | … | … | … | … | 1 | 1 | … | … | … | … | … | … | … | … | … | … | … | … | … |
| Females | 11 | … | … | … | … | … | … | 1 | … | … | … | 2 | … | 2 | … | 1 | 2 | … | 1 | 1 | … | … | 1 | … | … | … | … | … | … | … | … | … | … | |
| Total | Males | 182 | 7 | 6 | 8 | 4 | 7 | 6 | 8 | 9 | 4 | 4 | 7 | 3 | 7 | 3 | 5 | 15 | 3 | 6 | 12 | 11 | 9 | 11 | 12 | 6 | 6 | 1 | 1 | 1 | … | … | … | … |
| Females | 190 | 5 | 6 | 6 | 10 | 5 | 4 | 4 | 5 | 4 | 9 | 7 | 6 | 7 | 5 | 7 | 18 | 4 | 11 | 13 | 12 | 34 | 10 | 6 | 5 | 3 | 2 | 1 | … | 1 | … | … | … | |
| Gladstone— | ||||||||||||||||||||||||||||||||||
| Read and Write | Males | 99 | … | … | … | … | … | 1 | 2 | 3 | 1 | 2 | 2 | 6 | 1 | 4 | 4 | 15 | 4 | 3 | 6 | 5 | 10 | 6 | 10 | 6 | 3 | 3 | … | … | … | … | … | … |
| Females | 102 | … | … | … | … | … | … | … | 2 | 4 | 3 | 7 | 4 | 3 | 4 | 5 | 18 | 5 | 4 | 13 | 4 | 8 | 6 | 6 | 2 | 2 | 1 | … | 1 | … | … | … | … | |
| Read only | Males | 4 | … | … | … | … | … | 3 | … | 1 | … | … | … | … | … | … | … | … | … | … | … | … | … | … | … | … | … | … | … | … | … | … | … | … |
| Females | 5 | … | … | … | … | … | 2 | … | 1 | … | … | … | … | … | … | … | 1 | … | … | … | … | … | 1 | … | … | … | … | … | … | … | … | … | … | |
| Cannot Read | Males | 27 | 9 | 4 | 5 | 3 | 3 | 1 | 1 | … | 1 | … | … | … | … | … | … | … | … | … | … | … | … | … | … | … | … | … | … | … | … | … | … | … |
| Females | 30 | 3 | 4 | 6 | 7 | 2 | 3 | 2 | … | 2 | … | … | … | … | … | … | … | … | … | … | … | … | … | … | 1 | … | … | … | … | … | … | … | … | |
Table XV. Table XV. Showing the Education of Persons, Males, and Females (exclusive of Maoris and Chinese), in each Borough.—continued
| Boroughs. | All ages. | Under 5. | 5 and under 10. | 10 and under 15. | 15 and under 21. | 21 and under 40. | 40 and under 60. | 60 and under 80. | 80 and Upward. | Unspecified Children. | Unspecified Adults. | |||||||||||||||||||||||
|---|---|---|---|---|---|---|---|---|---|---|---|---|---|---|---|---|---|---|---|---|---|---|---|---|---|---|---|---|---|---|---|---|---|---|
| Under 1 year. | 1–3. | 3–3. | 3–4. | 4–5. | 5–6. | 6–7. | 7–8. | 8–9. | 9–10. | 10–11. | 11–12. | 12–13. | 13–14. | 14–15. | 15–20. | 20–21. | 21–25. | 25–30. | 30–35. | 35–40. | 40–45. | 45–50. | 50–55. | 55–60. | 60–65. | 65–70. | 50–75. | 75–80. | ||||||
| Education unknown | Males | … | … | … | … | … | … | … | … | … | … | … | … | … | … | … | … | … | … | … | … | … | … | … | … | … | … | … | … | … | … | … | … | … |
| Females | 1 | … | … | … | … | … | … | … | … | … | … | … | … | … | … | … | … | … | … | … | … | … | … | … | … | … | 1 | … | … | … | … | … | … | |
| Total | Males | 130 | 9 | 4 | 5 | 3 | 3 | 5 | 3 | 4 | 2 | 2 | 2 | 6 | 1 | 4 | 4 | 15 | 4 | 5 | 6 | 5 | 10 | 6 | 10 | 6 | 3 | 3 | … | … | … | … | … | … |
| Females | 138 | 3 | 4 | 6 | 7 | 2 | 5 | 2 | 3 | 6 | 3 | 7 | 4 | 3 | 4 | 5 | 19 | 5 | 4 | 13 | 4 | 8 | 7 | 6 | 3 | 2 | 2 | … | 1 | … | … | … | … | |
| Winton— | ||||||||||||||||||||||||||||||||||
| Read and Write | Males | 92 | … | … | … | … | … | … | 1 | 3 | 2 | 3 | 3 | 1 | 5 | 4 | 2 | 12 | 1 | 5 | 14 | 7 | 6 | 10 | 6 | 5 | 1 | 1 | … | … | … | … | … | … |
| Females | 60 | … | … | … | … | … | … | … | … | 2 | 2 | 2 | 3 | 1 | 1 | 3 | 10 | 1 | 5 | 7 | 9 | 7 | 2 | 3 | 2 | … | … | … | … | … | … | … | … | |
| Read only | Males | 4 | … | … | … | … | … | … | … | … | … | 1 | … | … | … | … | … | … | … | … | … | … | 2 | … | … | 1 | … | … | … | … | … | … | … | … |
| Females | 10 | … | … | … | … | … | 1 | 1 | 2 | 1 | 1 | … | … | … | … | 1 | … | … | … | … | … | 1 | 2 | … | … | … | … | … | … | … | … | … | … | |
| Cannot Read | Males | 38 | 8 | 7 | 7 | 4 | 4 | 2 | 3 | … | 1 | … | … | … | … | … | … | … | … | … | … | 1 | … | … | 1 | … | … | … | … | … | … | … | … | … |
| Females | 26 | 3 | 4 | 4 | 4 | 7 | 4 | … | … | … | … | … | … | … | … | … | … | … | … | … | … | … | … | … | … | … | … | … | … | … | … | … | … | |
| Education unknown | Males | … | … | … | … | … | … | … | … | … | … | … | … | … | … | … | … | … | … | … | … | … | … | … | … | … | … | … | … | … | … | … | … | … |
| Females | … | … | … | … | … | … | … | … | … | … | … | … | … | … | … | … | … | … | … | … | … | … | … | … | … | … | … | … | … | … | … | … | … | |
| Total | Males | 134 | 8 | 7 | 7 | 4 | 4 | 3 | 4 | 3 | 3 | 4 | 3 | 1 | 5 | 4 | 2 | 12 | 1 | 5 | 14 | 8 | 8 | 10 | 7 | 6 | 1 | 1 | … | … | … | … | … | … |
| Females | 96 | 3 | 4 | 4 | 4 | 7 | 5 | 1 | 2 | 3 | 3 | 2 | 3 | 1 | 1 | 4 | 10 | 1 | 5 | 7 | 9 | 8 | 4 | 3 | 2 | … | … | … | … | … | … | … | … | |
| Riverton— | ||||||||||||||||||||||||||||||||||
| Read and Write | Males | 388 | … | … | … | … | … | 1 | 4 | 10 | 13 | 10 | 20 | 11 | 9 | 14 | 5 | 33 | 6 | 39 | 43 | 27 | 40 | 45 | 23 | 15 | 5 | 8 | 3 | 4 | … | … | … | … |
| Females | 349 | … | … | … | … | … | 2 | 4 | 8 | 8 | 14 | 12 | 12 | 12 | 10 | 14 | 52 | 6 | 42 | 33 | 28 | 35 | 30 | 12 | 8 | 2 | 3 | … | 1 | 1 | … | … | … | |
| Read only | Males | 20 | … | … | … | … | … | 1 | 7 | 5 | 3 | 1 | … | … | … | … | … | … | … | … | 1 | 2 | … | … | … | … | … | … | … | … | … | … | … | … |
| Females | 26 | … | … | … | … | 1 | 2 | 4 | 3 | 3 | … | 2 | 1 | … | … | … | … | … | … | 1 | 3 | 2 | 1 | … | … | 1 | … | 2 | … | … | … | … | … | |
| Cannot Read | Males | 153 | 34 | 23 | 21 | 19 | 23 | 14 | 8 | 2 | 2 | … | … | … | … | … | … | 1 | … | … | 1 | … | 2 | 2 | 1 | … | … | … | … | … | … | … | … | … |
| Females | 129 | 19 | 15 | 20 | 19 | 23 | 13 | 7 | 1 | 1 | 1 | … | … | … | … | … | 1 | … | 1 | 2 | 2 | 1 | … | … | 1 | 1 | … | 1 | … | … | … | … | … | |
| Education unknown | Males | 5 | … | … | … | … | … | … | … | 1 | … | … | 1 | … | … | … | … | 1 | … | … | 1 | … | … | 1 | … | … | … | … | … | … | … | … | … | … |
| Females | 4 | … | … | … | … | … | … | … | … | … | … | … | 1 | … | … | … | … | … | … | … | 1 | 1 | … | … | 1 | … | … | … | … | … | … | … | … | |
| Total | Males | 566 | 34 | 23 | 21 | 19 | 23 | 16 | 19 | 18 | 18 | 11 | 21 | 11 | 9 | 14 | 5 | 35 | 6 | 39 | 46 | 29 | 42 | 48 | 24 | 15 | 5 | 8 | 3 | 4 | … | … | … | … |
| Females | 508 | 19 | 15 | 20 | 19 | 24 | 17 | 15 | 12 | 12 | 15 | 14 | 14 | 12 | 10 | 14 | 53 | 6 | 43 | 36 | 34 | 39 | 31 | 12 | 10 | 4 | 3 | 3 | 1 | 1 | … | … | … | |
NOTE.—For totals of boroughs see Table IV.
Table of Contents
Table of Contents
Table I. Table I. Showing the Numbers and relative Proportions of British and Foreign Subjects (exclusive of Maoris) for each Provincial District and in the whole Colony.
| Provincial Districts. | Total of | British Subjects*. | Foreign Subjects. | Allegiance Unknown. | In every 100 Persons living, Proportion of | ||
|---|---|---|---|---|---|---|---|
| All Nationalities. | Specified Nationalities. | British Subjects. | Foreign Subjects. | ||||
| * Includes all persons born in British Possessions, naturalized British subjects, British subjects born abroad, with persons having British names born at sea, and those having British names whose birthplaces were not specified. | |||||||
| Total Population of Colony | 489,933 | 489,769 | 471,726 | 18,043 | 164 | 96.28 | 372 |
| Auckland | 99,451 | 99,442 | 97,277 | 2,165 | 9 | 97.81 | 2.19 |
| Taranaki | 14,858 | 14,856 | 14,147 | 709 | 1 | 95.21 | 4.79 |
| Wellington | 61,371 | 6l,369 | 58,563 | 2,806 | 2 | 95.42 | 4.58 |
| Hawke's Bay | 7,367 | 17,347 | 16,078 | 1,269 | 20 | 92.58 | 7.42 |
| Marlborough | 9,300 | 9,297 | 9,150 | 147 | 3 | 98.39 | 1.6r |
| Nelson | 26,075 | 26,068 | 24,766 | 1,302 | 7 | 94.98 | 5.02 |
| Westland | 15,010 | 15,010 | o3,293 | 1,717 | … | 88.56 | 11.44 |
| Canterbury | 112,182 | 112,096 | 109,881 | 2,215 | 86 | 97.95 | 2.05 |
| Otago | 134,077 | 134,042 | 128,360 | 5,682 | 35 | 95.74 | 4.26 |
| Chatham Islands | 242 | 242 | 211 | 31 | … | 87.19 | 12.8l |
Table II. Table II. Showing the Number of Persons of different Birthplaces living in New Zealand (exclusive of Maoris) at the various Census Periods, and the Numerical and Centesimal Increase or Decrease of each Nationality during the Interval between each of those Periods.
| Where Born. | Persons, December, 1858. | Increase, 1858 to 1861. | Persons, December, 1861. | Increase, 1861 to 1864. | Persons, December, 1864. | Increase, 1864 to 1867. | Persons, December, 1867. | Increase, 1867 to 1871. | Persons, February, 1871. | Increase, 1871 to 1874. | Persons, March, 1874. | Increase, 1874 to 1878. | Persons, March, 1878. | Increase, 1878 to 1881. | Persons, April, 1881. | |||||||
|---|---|---|---|---|---|---|---|---|---|---|---|---|---|---|---|---|---|---|---|---|---|---|
| Numerical. | Centesimal | Numerical. | Centesimal | Numerical. | Centesimal | Numerical. | Centesimal | Numerical. | Centesimal | Numerical. | Centesimal | Numerical. | Centesimal | |||||||||
| NOTE. —In cases where a decrease has taken place the minus sign (−) is prefixed to the numerical and centesimal decrease. | ||||||||||||||||||||||
| New Zealand | 18,702 | 8,902 | 47.60 | 27,604 | 13,631 | 49'38 | 41,235 | 22,817 | 55.33 | 64,052 | 29,422 | 45.93 | 93,474 | 29,161 | 31.20 | 122,635 | 51,491 | 41.99 | 174,126 | 49,278 | 28.30 | 223,404 |
| Australian Colonies | 1,410 | 1,169 | 82.91 | 2,579 | 6,954 | 269.64 | 9.533 | 1,780 | 18.67 | 11,313 | 1,113 | 984 | 12,426 | 1,175 | 946 | 13,601 | 2,490 | 18.31 | 16,091 | 1,186 | 7.37 | 17,277 |
| England | 23,680 | 12,448 | 52.57 | 36,128 | 22,316 | 61.77 | 58,444 | 7,170 | 12.27 | 65,614 | 1,430 | 2.18 | 67,044 | 7,584 | 11.31 | 74,128 | 31,865 | 42.70 | 106,493 | 12,731 | 11.95 | 119,224 |
| Wales | 233 | 239 | 102.58 | 472 | 557 | 118.01 | 1,029 | 290 | 28.18 | 1,319 | 26 | 1.97 | 1,345 | 36 | 2.68 | 1,38l | 321 | 23.24 | 1,702 | 261 | 15.33 | 1,963 |
| Scotland | 7.976 | 7,558 | 94.76 | 15,534 | 15,406 | 99.18 | 30,940 | 3,886 | 12.36 | 34,826 | 2,045 | 587 | 36,871 | 1,560 | 4'24 | 38,431 | 9,518 | 24.77 | 47,949 | 4,804 | 10.02 | 52,753 |
| Ireland | 4,554 | 4,277 | 93.92 | 8,831 | 11,486 | 130.06 | 20,317 | 7,638 | 37.59 | 27,955 | 1,778 | 636 | 29,733 | 522 | 1.76 | 30,255 | 13,503 | 44.63 | 43,758 | 5,605 | 12.80 | 49.363 |
| Other British Dominions, and at Sea | 1,431 | 864 | 60.38 | 2,295 | 1,415 | 61.66 | 3,710 | 839 | 22.61 | 4,549 | 336 | 7.39 | 4,885 | −888 | −18.18 | 3,997 | 843 | 21.09 | 4,840 | 499 | 10.30 | 5.339 |
| Foreign Countries | 1,342 | 1,315 | 97.99 | 2,657 | 3,151 | 118.59 | 5,808 | 2,463 | 42.41 | 8,271 | 1,804 | 21.81 | 10,075 | 4,005 | 39.7S | 14,080 | 4,425 | 31.43 | 18,505 | 1,272 | 687 | 19,777 |
| Unspecified | 85 | 2,836 | 3336.47 | 2,921 | −1,779 | −60.90 | 1,142 | −373 | −3266 | 769 | −229 | −29.78 | 540 | −34 | −6.30 | 506 | 442 | 87.35 | 948 | −115 | −12.13 | 833 |
| Total | 59,413 | 39,608 | 66.67 | 99,021 | 73,137 | 73.36 | 172,158 | 46,510 | 27.02 | 218,668 | 37,725 | 17.25 | 256,393 | 43,121 | 16.82 | 299,514 | 114,898 | 38.36 | 414,412 | 75,521 | 18.22 | 489,933 |
Table III. Table III. Showing the Numbers and Proportions per Cent, to their respective Totals of Persons. Males, and Females of different Birthplaces ; and the Proportions of Males and Females in every 100 Persons of each Nationality living in New Zealand (exclusive of Maoris), in April, 1881.
| Where Born. | Numbers. | Proportions per Cent. | Proportions of the Sexes in every 100 Persons. | ||||||||||||
|---|---|---|---|---|---|---|---|---|---|---|---|---|---|---|---|
| Persons. | Males. | Females. | Persons. | Males. | Females. | Males. | Females. | ||||||||
* Detailed particulars of these nationalities are given in Table IV. † 838 persons—namely, 553 males and 285 females—returned their birthplace as America only, and are included in “Other Countries.” 53 persons—namely, 34 males and 19 females—were returned as born in North America, and have been similarly treated. See Table IV. | |||||||||||||||
| Total | 489,933 | 269,605 | 220,328 | 100.00 | 100.00 | 100.00 | 55.03 | 44.97 | |||||||
| British Possessions :— | |||||||||||||||
| New Zealand | 223,404 | 112,404 | 111,000 | 45.60 | 41.69 | 50.38 | 50.31 | 49.69 | |||||||
| Australian Colonies | 17,277 | 8,788 | 8,489 | 3.53 | 3.26 | 3.85 | 50.87 | 49.13 | |||||||
| England | 119,224 | 69,471 | 49,753 | 24.33 | 25.77 | 22.58 | 58.27 | 41.73 | |||||||
| Wales | 1,963 | 1,233 | 730 | .40 | .46 | .33 | 6,281 | 37.19 | |||||||
| Scotland | 52,753 | 31,005 | 21,748 | 10.77 | 11.50 | 9.87 | 58.77 | 41.23 | |||||||
| Ireland | 49,363 | 27,666 | 21,697 | 10.08 | 10.26 | 9.85 | 56.05 | 43.95 | |||||||
| Other British Possessions* | 4,014 | 2,429 | 1,585 | .82 | .90 | .72 | 60.51 | 39.49 | |||||||
| Foreign Countries:— | |||||||||||||||
| France and French Colonies | 848 | 614 | 234 | .17 | .23 | .11 | 72.41 | 27.59 | |||||||
| Germany | 4,819 | 3,188 | 1,631 | .98 | 1.18 | .74 | 66.15 | 33.85 | |||||||
| Austria | 513 | 348 | 165 | .10 | .13 | .08 | 67.84 | 32.16 | |||||||
| Switzerland | 332 | 269 | 63 | .07 | .10 | .03 | 81.02 | 18.98 | |||||||
| Italy | 483 | 385 | 98 | .10 | .14 | .05 | 79.71 | 20.29 | |||||||
| Norway | 1,271 | 823 | 448 | .26 | .31 | .20 | 64.75 | 35.25 | |||||||
| Sweden | 1,264 | 1,049 | 215 | .26 | .39 | .09 | 82.99 | 17.01 | |||||||
| Denmark | 2,199 | 1,409 | 790 | .45 | .52 | .36 | 64.07 | 35.93 | |||||||
| Other European Countries* | 984 | 810 | 174 | .20 | .30 | .08 | 82.32 | 17.68 | |||||||
| United States of America† | 841 | 637 | 204 | .17 | .24 | .09 | 75.74 | 24.26 | |||||||
| China | 5,033 | 5,017 | 16 | 1.03 | 1.86 | .01 | 99.68 | .32 | |||||||
| Other Countries* | 1,190 | 792 | 398 | .24 | .29 | .l8 | 66.55 | 33.45 | |||||||
| At Sea :— | |||||||||||||||
| British Subjects | 1,288 | 652 | 636 | .26 | .24 | .29 | 50.62 | 49.38 | |||||||
| Foreign Subjects | 37 | 15 | 22 | .01 | .01 | .01 | 40.54 | 59.46 | |||||||
| Unspecified:— | |||||||||||||||
| British Names | 442 | 291 | 151 | .09 | .10 | .07 | 63.57 | 36.43 | |||||||
| Foreign Names | 24 | 11 | 13 | .00 | .00 | .00 | 45.83 | 54.17 | |||||||
| Names not mentioned | 367 | 299 | 68 | .08 | .12 | .03 | 81.47 | 18.53 | |||||||
| Allegiance. | |||||||||||||||
| British Subjects | 471,726 | 255,409 | 216,317 | 96.29 | 94.73 | 98.18 | 54.14 | 45.86 | |||||||
| Foreign Subjects | 18,043 | 14,048 | 3,995 | 3.68 | 5.21 | 1.81 | 77.86 | 22.14 | |||||||
| Allegiance unknown | 164 | 148 | 16 | .03 | .06 | .01 | 90.24 | 9.76 | |||||||
Table IV. Table IV. Showing the Number of Persons, Males, and Females (exclusive of Maoris) of different Nationalities in the Colony of New Zealand and the several Provincial Districts, and exhibiting in detail the Subdivisions of the various Groups of Nationalities given in the other Tables.
| Where Born. | Total for the Colony. | Provincial Districts. | Chatham Islands. | ||||||||||||||||||||||||||||||
|---|---|---|---|---|---|---|---|---|---|---|---|---|---|---|---|---|---|---|---|---|---|---|---|---|---|---|---|---|---|---|---|---|---|
| Auckland. | Taranaki. | Wellington. | Hawke's Bay. | Marlborough. | Nelson. | Westland. | Canterbury. | Otago. | |||||||||||||||||||||||||
| Persons. | Males. | Females. | Persons. | Males. | Females. | Persons. | Males. | Females. | Persons. | Males. | Females. | Persons. | Males. | Females. | Persons. | Males. | Females. | Persons. | Males. | Females. | Persons. | Males. | Females. | Persons. | Males. | Females. | Persons. | Males. | Females. | Persons. | Males. | Females. | |
* 838 persons—namely, 553 males and 285 females—returned their birthplace as America only, and are included in “Other Countries.” 53 persons—namely, 34 males and 19 females—were returned as born in North America, and have been similarly treated. † 39 persons were returned as born in China who were not Chinese. | |||||||||||||||||||||||||||||||||
| Total Population | 489,933 | 269,605 | 220,328 | 99,451 | 54,111 | 45,340 | 14,858 | 8,517 | 6,341 | 61,371 | 32,717 | 28,654 | 17,367 | 9,700 | 7,667 | 9,300 | 5,249 | 4,051 | 26,075 | 14,800 | 11,275 | 15,010 | 9,075 | 5,935 | 112,182 | 60,590 | 51,592 | 134,077 | 74,685 | 59,392 | 242 | 161 | 81 |
| British Possessions— | |||||||||||||||||||||||||||||||||
| New Zealand | 223,404 | 112,404 | 111,000 | 48,163 | 24,326 | 23,837 | 7,050 | 3,641 | 3,409 | 30,086 | 14,975 | 15,111 | 7,251 | 3,663 | 3,588 | 5,303 | 2,715 | 2,588 | 13,765 | 6,861 | 6,904 | 5,930 | 2,889 | 3,041 | 48,931 | 24,5371 | 24,334 | 56,815 | 28,678 | 28,137 | 110 | 59 | 51 |
| Australian Colonies | 17,277 | 8,788 | 8,489 | 3,085 | 1,606 | 1,479 | 385 | 231 | 154 | 1,979 | 977 | 1,002 | 374 | 214 | 160 | 220 | 120 | 100 | 935 | 444 | 491 | 1,133 | 520 | 613 | 2,932 | 1,553 | 1,379 | 6,225 | 3,117 | 3,408 | 9 | 6 | 3 |
| England | 119,224 | 69,471 | 49,753 | 24,924 | 14,668 | 10,256 | 4,409 | 2,679 | 1,730 | 17,123 | 9,659 | 7,464 | 5,160 | 3,055 | 2,105 | 2,189 | 1,387 | 802 | 5,739 | 3,486 | 2,253 | 2,424 | 1,639 | 785 | 34,992 | 19,660 | 15,332 | 22,208 | 13,197 | 9,011 | 56 | 41 | 15 |
| Wales | 1,963 | 1,233 | 730 | 367 | 216 | 151 | 48 | 33 | 15 | 242 | 137 | 105 | 48 | 34 | 14 | 25 | 16 | 9 | 151 | 105 | 46 | 107 | 90 | 17 | 529 | 301 | 228 | 44 | 301 | 145 | … | … | … |
| Scotland | 52,753 | 31,005 | 21,748 | 6,216 | 3,697 | 2,519 | 711 | 458 | 253 | 3,849 | 2,250 | 1,599 | 1,189 | 749 | 440 | 535 | 353 | 182 | 1,664 | 1,090 | 574 | 1,081 | 778 | 303 | 8,499 | 5,065 | 3,434 | 28,992 | 16,552 | 12,440 | 17 | 13 | 4 |
| Ireland | 49,363 | 27,666 | 21,697 | 12,017 | 6,498 | 5,519 | 1,249 | 871 | 378 | 4,209 | 2,242 | 1,967 | 1,672 | 1,008 | 664 | 719 | 423 | 296 | 2,208 | 1,470 | 738 | 2,41 3 | 1,437 | 976 | 12,494 | 6,892 | 5,602 | 12,365 | 6,812 | 5,553 | 17 | 13 | 4 |
| Other British Possessions— | |||||||||||||||||||||||||||||||||
| Aden | 1 | 1 | … | … | … | 1 | 1 | … | … | … | … | … | … | … | … | … | … | … | … | … | … | … | … | … | … | … | … | … | … | … | … | … | … |
| Africa (British) | 31 | 19 | 12 | 6 | 4 | 2 | … | … | … | 3 | … | 3 | 2 | 1 | 1 | 1 | 1 | … | 2 | 2 | … | 4 | 2 | 2 | 8 | 5 | 3 | 5 | 4 | 1 | … | … | … |
| America (British North) | 1,722 | 1,081 | 641 | 926 | 509 | 417 | 46 | 32 | 14 | 162 | 105 | 57 | 43 | 32 | 11 | 21 | 15 | 6 | 87 | 76 | 11 | 44 | 37 | 7 | 16 | 105 | 56 | 232 | 170 | 61 | … | … | … |
| Ascension | 1 | … | 1 | 1 | … | 1 | … | … | … | … | … | … | … | … | … | … | … | … | … | … | … | … | … | … | … | … | … | … | … | … | … | … | … |
| Barbadoes | 18 | 14 | 4 | 9 | 6 | 3 | … | … | … | 1 | 1 | … | … | … | … | 1 | 1 | … | … | … | … | … | … | … | 4 | 3 | 1 | 3 | 1 | … | … | … | … |
| Bermuda | 10 | 9 | 1 | 7 | 6 | 1 | … | … | … | 1 | 1 | … | … | … | … | … | … | … | 1 | 1 | … | … | … | … | 1 | 1 | … | … | … | … | … | … | … |
| Burmah (British) | 8 | 4 | 4 | 5 | 3 | 2 | … | … | … | … | … | … | … | … | … | … | … | … | 1 | … | 1 | … | … | … | 1 | … | 1 | 1 | 1 | … | … | … | … |
| Cape of Good Hope | 381 | 186 | 195 | 253 | 116 | 137 | 14 | 6 | 8 | 23 | 13 | 10 | 6 | 4 | 2 | 4 | 3 | 1 | 4 | 2 | 2 | 6 | 4 | 2 | 33 | 16 | 17 | 38 | 22 | 16 | … | … | … |
| Ceylon | 48 | 28 | 20 | 25 | 17 | 8 | … | … | … | 9 | 5 | 4 | 3 | 2 | 1 | 1 | … | 1 | … | … | … | … | … | … | 4 | 2 | 2 | 6 | 2 | 4 | … | … | … |
| Cyprus | 1 | 1 | … | … | … | … | … | … | … | 1 | 1 | … | … | … | … | … | … | … | … | … | … | … | … | … | … | … | … | … | … | … | … | … | … |
| Crozets | 1 | … | 1 | … | … | … | … | … | … | … | … | … | … | … | … | … | … | … | 1 | … | 1 | … | … | … | … | … | … | … | … | … | … | … | … |
| Falkland Islands | 8 | 6 | 2 | 3 | … | … | 1 | 1 | … | … | … | … | … | … | … | … | … | … | … | … | … | … | … | … | 2 | 2 | … | 2 | … | 2 | … | … | … |
| Fiji | 91 | 50 | 32 | 45 | 33 | 12 | 6 | 3 | 3 | 13 | 7 | 6 | 6 | 5 | 1 | 2 | 1 | 1 | 2 | 1 | … | … | … | … | 8 | 3 | 5 | 8 | 4 | 4 | 1 | 1 | … |
| Gambia | 1 | 1 | … | … | … | … | … | … | … | … | … | … | … | … | … | … | … | … | … | … | … | 1 | 1 | … | … | … | … | … | … | … | … | … | … |
| Gibraltar | 75 | 41 | 34 | 24 | 12 | 12 | 4 | 3 | 1 | 22 | 10 | 12 | 7 | 6 | 1 | … | … | … | 3 | 1 | 1 | … | … | … | 4 | 2 | 2 | 11 | 7 | 4 | … | … | … |
| Grenada | 2 | 2 | … | 2 | 2 | … | … | … | … | … | … | … | … | … | … | … | … | … | … | … | … | … | … | … | … | … | … | … | … | … | … | … | … |
| Guiana (British) | 20 | 16 | 4 | 5 | 3 | 2 | … | … | … | … | … | … | 3 | 3 | … | 1 | 1 | … | … | … | … | … | 1 | … | 8 | 6 | 2 | 2 | 2 | … | … | … | … |
| Heligoland | 19 | 18 | 1 | 2 | 2 | … | 1 | 1 | … | 5 | 4 | 1 | 1 | 1 | … | … | … | … | 2 | 2 | … | … | … | … | 3 | 3 | … | 5 | 5 | … | … | … | … |
| Honduras (British) | 5 | 2 | 3 | 4 | 2 | 2 | … | … | … | 1 | … | 1 | … | … | … | … | … | … | … | … | … | … | … | … | … | … | … | … | … | … | … | … | … |
| India (Europeans) | 1,106 | 622 | 484 | 361 | 201 | 160 | 60 | 32 | 28 | 150 | 98 | 52 | 49 | 25 | 24 | 22 | 13 | 9 | 59 | 24 | 35 | 11 | 6 | 5 | 197 | 105 | 92 | 197 | 118 | 79 | … | … | … |
| India (Asiatics) | 6 | 6 | … | 1 | 1 | … | 1 | 1 | … | 1 | 1 | … | … | … | … | … | … | … | … | … | … | … | … | … | 3 | 3 | … | … | … | … | … | … | … |
| Jamaica | 83 | 59 | 24 | 22 | 17 | 5 | 2 | 2 | … | 6 | 3 | 3 | 3 | 2 | 1 | … | … | … | 9 | 4 | 5 | 2 | 2 | … | 16 | 13 | 3 | 23 | 16 | 7 | … | … | … |
| Malacca | 4 | 2 | 2 | 1 | … | 1 | … | … | … | 2 | 1 | 1 | … | … | … | … | … | … | … | … | … | … | … | … | 1 | 1 | … | … | … | … | … | … | … |
| Malta | 73 | 46 | 27 | 24 | 12 | 12 | 4 | 2 | 2 | 14 | 9 | 5 | 1 | 1 | … | 2 | 2 | … | 1 | 1 | … | 2 | 1 | 1 | 12 | 7 | 5 | 13 | 11 | 2 | … | … | … |
| Mauritius | 40 | 27 | 13 | 13 | 6 | 7 | 2 | 2 | … | 3 | 3 | … | … | … | … | 3 | … | 3 | 1 | 1 | … | 5 | 5 | … | 2 | 1 | 1 | 11 | 9 | 2 | … | … | … |
| Natal | 7 | 6 | 1 | … | … | … | … | … | … | 1 | … | … | 3 | 3 | … | … | … | … | … | … | … | … | … | … | 2 | 1 | 1 | 1 | … | … | … | … | … |
| Norfolk Island | 10 | 6 | 4 | 7 | 3 | 4 | … | … | … | … | … | … | … | … | … | … | … | … | … | … | … | … | … | … | … | … | … | 3 | 3 | … | … | … | … |
| Prince of Wales Island | 1 | 1 | … | … | 1 | … | … | … | … | … | … | … | … | … | … | … | … | … | … | … | … | … | … | … | … | … | … | … | … | … | … | … | … |
| Sierra Leone | 1 | 1 | … | … | … | … | … | … | … | 1 | 1 | … | … | … | … | … | … | … | … | … | … | … | … | … | … | … | … | … | … | … | … | … | … |
| Singapore | 4 | 3 | 1 | 1 | 1 | … | … | … | … | … | … | … | 1 | 1 | … | … | … | … | 1 | … | 1 | … | … | … | … | … | … | 1 | 1 | … | … | … | … |
| St. Helena. | 54 | 36 | 18 | 15 | 10 | 5 | … | … | … | 11 | 8 | 3 | 1 | … | 1 | 1 | 1 | … | … | … | … | 5 | 3 | 2 | 4 | 3 | 1 | 17 | 11 | 6 | … | … | … |
| St. Kitts | 2 | 2 | … | … | … | … | 1 | 1 | … | … | … | … | … | … | … | … | … | … | … | … | … | … | … | … | 1 | 1 | … | … | … | … | … | … | … |
| St. Lucia | 1 | 1 | … | … | … | … | … | … | … | … | … | … | … | … | … | … | … | … | … | … | … | … | … | … | … | … | … | 1 | 1 | … | … | … | … |
| St. Vincent | 8 | 8 | … | 1 | 1 | … | … | … | … | 1 | 1 | … | … | … | … | 1 | 1 | … | … | … | … | … | … | … | 2 | 2 | … | 3 | 3 | … | … | … | … |
| Tobago | 4 | 2 | 2 | 3 | 1 | 1 | … | … | … | … | … | … | … | … | … | … | … | … | … | … | … | … | … | … | … | 1 | … | … | … | … | … | … | … |
| Trinidad | 6 | 3 | 3 | … | … | … | … | … | … | … | … | … | … | … | … | … | … | … | … | … | … | … | … | … | 2 | … | 2 | 4 | 3 | 1 | … | … | … |
| West Indies (island not named) | 161 | 110 | 51 | 43 | 27 | 16 | 4 | 4 | … | 26 | 17 | 9 | 8 | 5 | 3 | 2 | 1 | 1 | 6 | 4 | 2 | 13 | 9 | 4 | 28 | 16 | 12 | 31 | 27 | 4 | … | … | … |
| Foreign Countries— | |||||||||||||||||||||||||||||||||
| France (including Tahiti and New Caledonia) | 848 | 614 | 234 | 215 | 160 | 55 | 16 | 13 | 3 | 113 | 77 | 36 | 56 | 39 | 17 | 13 | 9 | 4 | 51 | 40 | 11 | 54 | 47 | 7 | 184 | 129 | 55 | 145 | 99 | 46 | 1 | 1 | … |
| Germany | 4,819 | 3,188 | 1,631 | 513 | 388 | 125 | 354 | 208 | 146 | 1,041 | 626 | 415 | 227 | 131 | 96 | 50 | 42 | 8 | 381 | 258 | 123 | 420 | 314 | 106 | 923 | 586 | 337 | 904 | 631 | 273 | 6 | 4 | 1 |
| Other European Countries: Austria (including Hungary, Bohemia, Dalmatian Moravia) | 513 | 348 | 165 | 190 | 111 | 79 | 19 | 15 | 4 | 43 | 38 | 5 | 14 | 10 | 4 | … | … | … | … | … | … | … | … | … | … | … | … | … | … | … | … | … | … |
| Belgium | 80 | 63 | 17 | 21 | 17 | 4 | 3 | 3 | … | 8 | 8 | … | 1 | 1 | … | 3 | 3 | … | 1 | 1 | … | 8 | 6 | 2 | 20 | 13 | 7 | 15 | 11 | 4 | … | … | … |
| Bulgaria | 2 | 2 | … | … | … | … | … | … | … | … | … | … | 1 | 1 | … | … | … | … | … | … | … | … | … | … | … | … | … | 1 | 1 | … | … | … | … |
| Denmark (including Greenland & Iceland) | 2,199 | 1,409 | 790 | 142 | 108 | 34 | 132 | 71 | 61 | 725 | 437 | 288 | 368 | 210 | 158 | 48 | 33 | 15 | 64 | 58 | 6 | 104 | 92 | 12 | 336 | 202 | 134 | 270 | 197 | 82 | 1 | 1 | … |
| Greece | 87 | 70 | 17 | 17 | 13 | 4 | 9 | 5 | 4 | 9 | 16 | 3 | 3 | 2 | 1 | 1 | 1 | … | 15 | 15 | … | … | … | … | 13 | 10 | 3 | 10 | 8 | 2 | … | … | … |
| Holland (including Java and Curacoa) | 145 | 126 | 19 | 28 | 24 | 4 | 3 | 1 | 1 | 26 | 22 | 4 | 3 | 3 | … | 3 | 3 | … | 12 | 10 | 2 | 11 | 10 | 1 | 26 | 20 | 6 | 33 | 33 | … | … | … | … |
| Italy | 483 | 385 | 98 | 54 | 47 | 1 | 22 | 10 | 12 | 146 | 101 | 45 | 7 | 6 | 1 | 4 | 4 | … | 47 | 46 | 1 | 70 | 68 | 2 | 78 | 55 | 23 | 55 | 48 | 7 | … | … | … |
| Norway | 1,271 | 823 | 445 | 136 | 96 | 40 | 12 | 10 | 2 | 268 | 159 | 109 | 461 | 239 | 222 | 10 | 8 | 2 | 50 | 49 | 1 | 40 | 37 | 3 | 136 | 95 | 41 | 155 | 128 | 27 | 3 | 2 | 1 |
| Poland | 100 | 70 | 30 | 15 | 14 | 1 | 4 | 2 | 2 | 16 | 9 | 7 | 1 | 1 | 1 | 14 | 2 | … | … | … | … | 26 | 14 | 12 | 11 | 8 | 3 | 24 | 20 | 4 | … | … | … |
| Portugal (including Azores, Cape de Verd, and Madeira) | 207 | 158 | 19 | 90 | 86 | 4 | 16 | 11 | 5 | 15 | 12 | 3 | 3 | 3 | … | 10 | 10 | … | 6 | 5 | 1 | 15 | 18 | … | 20 | 16 | 4 | 26 | 24 | 2 | 3 | 3 | … |
| Russia (including Finland and Lapland) | 273 | 224 | 49 | 54 | 81 | 3 | 39 | 15 | 24 | 23 | 18 | 5 | 12 | 12 | … | 2 | 2 | … | 14 | 13 | 1 | 21 | 19 | 2 | 54 | 41 | 13 | 54 | 53 | 1 | … | … | … |
| Spain (including Cuba, Manilla, Ladrones, and Canaries) | 67 | 53 | 14 | 16 | 12 | 4 | 5 | 4 | 1 | 9 | 8 | 1 | 2 | 2 | … | 1 | 1 | … | 8 | 6 | 2 | 1 | 1 | … | 8 | 7 | 1 | 17 | 12 | 5 | … | … | … |
| Sweden | 1,264 | 1,049 | 215 | 162 | 155 | 7 | 19 | 17 | 2 | 320 | 235 | 85 | 174 | 99 | 75 | 27 | 24 | 3 | 83 | 79 | 4 | 66 | 63 | 3 | 175 | 154 | 21 | 237 | 222 | 15 | 1 | 1 | … |
| Switzerland | 332 | 269 | 63 | 40 | 24 | 16 | 47 | 28 | 19 | 26 | 23 | 3 | 7 | 6 | 1 | 6 | 5 | 1 | 49 | 46 | 3 | 87 | 83 | 4 | 16 | 12 | 4 | 54 | 42 | 12 | … | … | … |
| Turkey (including Jerusalem, Palestine, and Smyrna) | 23 | 14 | 9 | 2 | 2 | … | 1 | 1 | … | 11 | 2 | 9 | … | … | … | … | … | … | … | … | … | … | … | … | 6 | 6 | … | 3 | 3 | … | … | … | … |
| United States of America* | 841 | 637 | 204 | 280 | 221 | 59 | 23 | 17 | 6 | 86 | 67 | 19 | 23 | 14 | 9 | 22 | 17 | 5 | 60 | 54 | 6 | 61 | 51 | 10 | 131 | 86 | 45 | 150 | 105 | 45 | 5 | 5 | … |
| China† | 5,033 | 5,017 | 16 | 125 | 119 | 6 | 7 | 7 | … | 93 | 93 | … | 4 | 4 | … | 1 | 1 | … | 453 | 453 | … | 758 | 758 | … | 138 | 136 | 2 | 3,451 | 3,444 | 7 | 3 | 2 | 1 |
| Other Countries:— | |||||||||||||||||||||||||||||||||
| Abysinnia | 1 | 1 | … | 1 | 1 | … | … | … | … | … | … | … | … | … | … | … | … | … | … | … | … | … | … | … | … | … | … | … | … | … | … | … | … |
| Africa (country not named) | 89 | 54 | 35 | 49 | 35 | 14 | 3 | 1 | 2 | 1 | 4 | 3 | 4 | 1 | 3 | 1 | 1 | … | 3 | … | 3 | 2 | 1 | 1 | 5 | 2 | 3 | o5 | 9 | 6 | … | … | … |
| America (country not named | 838 | 553 | 285 | 261 | 159 | 102 | 42 | 27 | 15 | 84 | 55 | 29 | 48 | 30 | 18 | 12 | 8 | 4 | 28 | 18 | 10 | 7 | 5 | 2 | 170 | 116 | 54 | 185 | 134 | 51 | 1 | 1 | … |
| America, North(country not named) | 53 | 34 | 19 | 18 | 13 | 5 | 2 | … | 2 | 3 | 2 | 1 | … | 1 | 1 | 1 | 1 | … | 3 | 2 | 1 | … | … | … | 12 | 6 | 6 | 12 | 9 | 3 | … | … | … |
Table IV. Table IV. Showing the Number of Persons, Males, and Females (exclusive of Maoris) of different Nationalities in the Colony of New Zealand and the several Provincial Districts, and exhibiting in detail the Subdivisions of the various Groups of Nationalities given in the other Tables—continued.
| Where Born. | Total for the Colony. | Provincial Districts. | Chatham Islands. | ||||||||||||||||||||||||||||||
|---|---|---|---|---|---|---|---|---|---|---|---|---|---|---|---|---|---|---|---|---|---|---|---|---|---|---|---|---|---|---|---|---|---|
| Auckland. | Taranaki. | Wellington. | Hawke's Bay. | Marlborough. | Nelson. | Westland. | Canterbury. | Otago. | |||||||||||||||||||||||||
| Persons. | Males. | Females. | Persons. | Males. | Females. | Persons. | Males. | Females. | Persons. | Males. | Females. | Persons. | Males. | Females. | Persons. | Males. | Females. | Persons. | Males. | Females. | Persons. | Males. | Females. | Persons. | Males. | Females. | Persons. | Males. | Females. | Persons. | Males. | Females. | |
| Other Countries—contd. | |||||||||||||||||||||||||||||||||
| America, South(country not named) | 43 | 31 | 12 | 16 | 3 | 8 | … | … | … | 6 | 6 | … | 1 | 1 | … | 2 | 1 | 1 | 1 | 1 | … | … | … | … | 5 | 4 | 1 | 12 | 10 | 2 | … | … | … |
| America, Central | 3 | 2 | 1 | 1 | 1 | … | … | … | … | 1 | 1 | … | 1 | … | 1 | … | … | … | … | … | … | … | … | … | … | … | … | … | … | … | … | … | … |
| Andaman Islands | 1 | … | 1 | … | … | … | … | … | … | … | … | … | … | … | … | … | … | … | … | … | … | … | … | … | … | … | … | 1 | … | 1 | … | … | … |
| Arabia | 1 | 1 | … | … | … | … | … | … | … | … | … | … | … | … | … | … | … | … | … | … | … | … | … | … | … | … | … | 1 | 1 | … | … | … | … |
| Argentine Confederation | 5 | 3 | 2 | 1 | 1 | … | 1 | 1 | … | … | … | … | 2 | … | 2 | … | … | … | … | … | … | … | 1 | … | … | … | … | … | … | … | … | … | … |
| Asia(country not named) | 5 | 4 | 1 | … | … | … | … | … | … | 1 | 1 | … | … | … | … | … | … | … | 1 | 1 | … | … | … | … | 3 | 2 | 1 | … | … | … | … | … | … |
| Brazil | 20 | 15 | 5 | 10 | 8 | 2 | 1 | 1 | … | 2 | 2 | … | … | … | … | 1 | 1 | … | 1 | 1 | … | … | … | … | 3 | 2 | 3 | … | … | … | … | … | … |
| Caroline Islands | 1 | 1 | … | 1 | 1 | … | … | … | … | … | … | … | … | … | … | … | … | … | … | … | … | … | … | … | … | … | … | … | … | … | … | … | … |
| Chili | 23 | 18 | 5 | 12 | 8 | 4 | 1 | 1 | … | … | … | … | 1 | 1 | … | … | … | … | … | … | … | … | … | … | 1 | 1 | … | 8 | 7 | 1 | … | … | … |
| Egypt | 1 | … | 1 | 1 | … | 1 | … | … | … | … | … | … | … | … | … | … | … | … | … | … | … | … | … | … | … | … | … | … | … | … | … | … | … |
| Friendly Islands | 7 | 5 | 2 | 5 | 4 | 1 | … | … | … | 2 | 1 | 1 | … | … | … | … | … | … | … | … | … | … | … | … | … | … | … | … | … | … | … | … | … |
| Ireland (New) | 3 | 1 | 2 | … | … | … | … | … | … | 1 | 1 | … | … | … | … | … | … | … | … | … | … | … | … | … | … | … | … | 2 | … | 2 | … | … | … |
| Japan | 7 | 2 | 5 | … | … | … | … | … | … | 4 | 1 | 3 | … | … | … | … | … | … | … | … | … | … | … | … | 3 | 1 | 2 | … | … | … | … | … | … |
| Mexico | 14 | 12 | 2 | 5 | 5 | … | … | … | … | 3 | 2 | 1 | 1 | 1 | … | … | … | … | … | … | … | … | … | … | 3 | 2 | 1 | 2 | 2 | … | … | … | … |
| New Hebrides | 4 | 4 | … | 4 | 4 | … | … | … | … | … | … | … | … | … | … | … | … | … | … | … | … | … | … | … | … | … | … | … | … | … | … | … | … |
| Nicaragua | 1 | … | 1 | 1 | … | 1 | … | … | … | … | … | … | … | … | … | … | … | … | … | … | … | … | … | … | … | … | … | … | … | … | … | … | |
| Persia | 2 | 2 | … | … | … | … | … | … | … | 1 | 1 | … | … | … | … | … | … | … | … | … | … | … | … | … | 1 | 1 | … | … | … | … | … | … | … |
| Peru | 4 | 4 | … | 3 | 3 | … | … | … | … | … | … | … | … | … | … | … | … | … | … | … | … | … | … | … | … | … | … | 1 | 1 | … | … | … | … |
| Rarotonga | 2 | 2 | … | 2 | 2 | … | … | … | … | … | … | … | … | … | … | … | … | … | … | … | … | … | … | … | … | … | … | … | … | … | … | … | … |
| Samoa or Navigator | |||||||||||||||||||||||||||||||||
| Islands | 15 | 6 | 9 | 12 | 5 | 7 | … | … | … | … | … | … | 1 | … | 1 | … | … | … | … | … | … | … | … | … | 1 | … | 1 | 1 | 1 | … | … | … | … |
| Sandwich Islands | 12 | 8 | 4 | 9 | s | 4 | … | … | … | … | … | … | … | … | … | … | … | … | … | … | … | … | … | … | 1 | 1 | … | 2 | 2 | … | … | … | … |
| Sumbawa (Sunda Isles) | 3 | 1 | 2 | 3 | 1 | 2 | … | … | … | … | … | … | … | … | … | … | … | … | … | … | … | … | … | … | … | … | … | … | … | … | … | … | … |
| Santa Cruz | 1 | 1 | … | 1 | 1 | … | … | … | … | … | … | … | … | … | … | … | … | … | … | … | … | … | … | … | … | … | … | … | … | … | … | … | … |
| Society Islands | 1 | 1 | … | 1 | 1 | … | … | … | … | … | … | … | … | … | … | … | … | … | … | … | … | … | … | … | … | … | … | … | … | … | … | … | … |
| Solomon Islands | 1 | 1 | … | … | … | … | 1 | 1 | … | … | … | … | … | … | … | … | … | … | … | … | … | … | … | … | … | … | … | … | … | … | … | … | … |
| South Sea Islands (island not named) | 22 | 22 | … | 8 | 8 | … | … | … | … | … | … | … | … | … | … | … | … | … | … | … | … | … | … | … | … | … | … | 6 | 6 | … | 8 | 8 | … |
| Tonga | 6 | 2 | 4 | 5 | 1 | 4 | … | … | … | … | … | … | 1 | 1 | … | … | … | … | … | … | … | … | … | … | … | … | … | … | … | … | … | … | … |
| Venezuela | 1 | 1 | … | … | … | … | … | … | … | 1 | 1 | … | … | … | … | … | … | … | … | … | … | … | … | … | … | … | … | … | … | … | … | … | … |
| At Sea— | |||||||||||||||||||||||||||||||||
| British Subjects | 1,288 | 652 | 636 | 268 | 125 | 143 | 47 | 21 | 26 | 191 | 92 | 99 | 52 | 31 | 21 | 20 | 14 | 6 | 48 | 23 | 25 | 14 | 6 | 8 | 318 | 157 | 161 | 330 | 183 | 147 | … | … | … |
| Foreign Subjects | 37 | 15 | 22 | 3 | 3 | … | 6 | 4 | 2 | 7 | 3 | 4 | 3 | … | 3 | … | … | … | 2 | 1 | 1 | … | … | … | 3 | 1 | 2 | 13 | 3 | 10 | … | … | … |
| Birthplace Unspecified— | |||||||||||||||||||||||||||||||||
| British Names | 442 | 291 | 251 | 47 | 36 | 11 | 17 | 14 | 3 | 100 | 60 | 40 | 28 | 20 | 8 | 4 | 2 | 2 | 22 | 14 | 8 | 12 | 10 | 2 | 88 | 46 | 42 | 124 | 89 | 35 | … | … | … |
| Foreign Names | 24 | 11 | 13 | 12 | 5 | 7 | 5 | 2 | 3 | 1 | … | 1 | 2 | 1 | 1 | 2 | … | 2 | … | … | … | … | … | … | … | … | … | 2 | 2 | … | … | … | … |
| Names not mentioned | 367 | 299 | 68 | 9 | 9 | … | 2 | 2 | … | 2 | 2 | … | 20 | 15 | 5 | 3 | 3 | … | 7 | 7 | … | … | … | … | 289 | 232 | 57 | 35 | 29 | 6 | … | … | … |
Table V. Table V. Showing the Number of Persons, Males, and Females of different Nationalities in the Colony of New Zealand (exclusive of Maoris), in the Boroughs, and Outside.
| Where Born. | The Colony.* | Boroughs. | Outside Boroughs. | ||||||
|---|---|---|---|---|---|---|---|---|---|
| Persons. | Males. | Females. | Persons. | Males. | Females. | Persons. | Males. | Females. | |
* The numbers for “The Colony” are the additions of the "Borough" and "Outside Boroughs" populations. Details of the population of the boroughs will be found in Table VIII. † Detailed particulars of these nationalities are given in the preceding table. ‡ 838 persons—namely, 553 males and 285 females—returned their birthplace as America only, and are included in “Other Countries.” 53 persons—namely, 34 males and 19 females—were returned as born in North America, and have been similarly treated. (See preceding table.) | |||||||||
| All Nationalities | 489,933 | 269,605 | 220,328 | 194,981 | 99,605 | 95,376 | 294,952 | 170,000 | 124,952 |
| British Possessions— | |||||||||
| New Zealand | 223,404 | 112,404 | 111,000 | 87,345 | 42,782 | 44,563 | 136,059 | 69,622 | 66,437 |
| Australian Colonies | 17,277 | 8,788 | 8,489 | 9,027 | 4,275 | 4,7S2 | 8,240 | 4,503 | 3,737 |
| England | 119,224 | 69,471 | 49,753 | 50,370 | 27,093 | 23,277 | 68,854 | 42,378 | 26,476 |
| Wales | 1,963 | 1,233 | 730 | 723 | 398 | 325 | 1,240 | 835 | 405 |
| Scotland | 52,753 | 31,005 | 21,748 | 21,676 | 11,522 | 10,154 | 31,077 | 19,483 | 11,594 |
| Ireland | 49,303 | 27,666 | 21,697 | 18,026 | 8,299 | 9,727 | 31,337 | 19,367 | 11,970 |
| Other British Possessions† | 4,014 | 2,429 | 1,585 | 1,519 | 865 | 654 | 2,495 | 1,564 | 931 |
| Foreign Countries— | |||||||||
| France and French Colonies | 848 | 614 | 234 | 353 | 234 | 119 | 495 | 380 | 115 |
| Germany | 4,819 | 3,188 | 1,631 | 1,587 | 1,046 | 541 | 3,232 | 2,142 | 1,090 |
| Austria | 513 | 348 | 165 | 89 | 66 | 23 | 424 | 282 | 142 |
| Switzerland | 332 | 269 | 63 | 61 | 42 | 19 | 271 | 227 | 44 |
| Italy | 483 | 38S | 98 | 221 | 165 | 56 | 262 | 220 | 42 |
| Norway | 1,271 | 823 | 448 | 362 | 222 | 140 | 909 | 601 | 308 |
| Sweden | 1,264 | 1,049 | 215 | 316 | 264 | 32 | 948 | 785 | 163 |
| Denmark | 2,199 | 1,409 | 790 | 561 | 327 | 234 | 1,638 | 1,082 | 556 |
| Other European Countries † | 984 | 810 | 174 | 329 | 262 | 67 | 655 | 548 | 107 |
| United States of America‡ | 841 | 637 | 204 | 320 | 226 | 94 | 521 | 411 | 110 |
| China | 5,033 | 5,017 | 16 | 828 | 816 | 12 | 4,205 | 4,201 | 4 |
| Other Countries† | 1,190 | 792 | 398 | 451 | 291 | 160 | 739 | 501 | 160 |
| At Sea | 1,328 | 667 | 658 | 532 | 248 | 284 | 793 | 419 | 374 |
| Unspecified | 833 | 601 | 232 | 285 | 162 | 123 | 548 | 439 | 109 |
Table VI. Table VI. Showing the Birthplaces of Persons, Males, and Females (exclusive of Maoris) in each Provincial District.
| Where Born. | Total for the Colony. | Provincial Districts. | Chatham Islands. | ||||||||||||||||||||||||||||||
|---|---|---|---|---|---|---|---|---|---|---|---|---|---|---|---|---|---|---|---|---|---|---|---|---|---|---|---|---|---|---|---|---|---|
| Auckland. | Taranaki. | Wellington. | Hawke's Bay. | Marlborough. | Nelson. | Westland. | Canterbury. | Otago. | |||||||||||||||||||||||||
| Persons. | Males. | Females. | Persons. | Males. | Females. | Persons. | Males. | Females. | Persons. | Males. | Females. | Persons. | Males. | Females. | Persons. | Males. | Females. | Persons. | Males. | Females. | Persons. | Males. | Females. | Persons. | Males. | Females. | Persons. | Males. | Females. | Persons. | Males. | Females. | |
| * 838 persons—namely, 553 males and 285 females—returned their birthplace as America only, and are included in “Other Countries.” 53 persons—namely, 34 males and 19 females—were returned as born in North America, and have been similarly treated. (See Table IV.) 1 | |||||||||||||||||||||||||||||||||
| Total | 489,933 | 269,605 | 220,328 | 99,451 | 54,111 | 45,340 | 14,858 | 8,517 | 6,341 | 61,371 | 32,717 | 28,654 | 17,367 | 9,700 | 7,667 | 9,300 | 5,249 | 4,051 | 26,075 | 14,800 | 11,275 | 15,010 | 9,075 | 5,935 | 112,182 | 60,590 | 51,592 | 134,077 | 74,685 | 59,392 | 242 | 161 | 81 |
| British Possessions— | |||||||||||||||||||||||||||||||||
| New Zealand | 223,404 | 112,404 | 111,000 | 48,163 | 24,326 | 23,837 | 7,050 | 3,641 | 3,409 | 30,086 | 14,975 | 15,111 | 7,251 | 3,663 | 3,588 | 5,303 | 2,715 | 2,588 | 13,765 | 6,86l | 6,904 | 5,930 | 2,889 | 3,041 | 48,931 | 24,597 | 24,334 | 56,815 | 28,678 | 28,137 | 110 | 59 | 51 |
| Australian Colonies | 17,277 | 8,788 | 8,489 | 3,085 | 1,606 | 1,479 | 385 | 231 | 154 | 1,979 | 977 | 1,002 | 374 | 214 | 160 | 220 | 120 | 100 | 935 | 444 | 491 | 1,133 | 520 | 613 | 2,932 | 1,553 | 1,379 | 6,225 | 3,147 | 3,108 | 9 | 6 | 3 |
| England | 119,224 | 69,471 | 49,753 | 24,924 | 14,668 | 10,256 | 4,409 | 2,679 | 1,730 | 17,123 | 9,659 | 7,464 | 5,160 | 3,055 | 2,105 | 2,189 | 1,387 | 802 | 5,739 | 3,486 | 2,253 | 2,424 | 1,639 | 785 | 34,992 | 19,660 | 15,332 | 22,208 | 13,197 | 9,011 | 56 | 41 | 15 |
| Wales | 1,963 | 1,233 | 730 | 367 | 216 | 151 | 41 | 33 | 15 | 242 | 137 | 105 | 48 | 34 | 14 | 25 | 16 | 9 | 151 | 105 | 46 | 107 | 90 | 17 | 529 | 301 | 228 | 446 | 301 | 145 | … | … | … |
| Scotland | 52,753 | 31,005 | 21,748 | 6,216 | 3,697 | 2,519 | 711 | 458 | 253 | 3,849 | 2,250 | 1,599 | 1,389 | 749 | 440 | 535 | 353 | 182 | 1,664 | 1,090 | 574 | 1,081 | 778 | 303 | 8,499 | 5,065 | 3,434 | 28,992 | 16,552 | 12,440 | 17 | 13 | 4 |
| Ireland | 49,303 | 27,666 | 21,697 | 12,017 | 6,498 | 5,519 | 1,249 | 87 | 378 | 4,209 | 2,242 | 1,967 | 1,672 | 1,008 | 664 | 719 | 423 | 296 | 2,208 | 1,470 | 738 | 2,413 | 1,437 | 976 | 12,494 | 6,892 | 3,602 | 12,365 | 6,812 | 5,553 | 17 | 13 | 1 |
| Other British Possessions | 4,014 | 2,429 | 1,585 | 1,810 | 999 | 811 | 147 | 91 | 56 | 457 | 290 | 67 | 137 | 91 | 46 | 62 | 40 | 22 | 180 | 120 | 60 | 94 | 71 | 23 | 508 | 302 | 206 | 6l8 | 424 | 194 | 1 | 1 | … |
| Foreign Countries— | |||||||||||||||||||||||||||||||||
| France and French Colonies | 848 | 614 | 234 | 215 | 160 | 55 | 16 | 13 | 3 | 113 | 77 | 36 | 56 | 39 | 17 | 13 | 9 | 4 | 51 | 40 | 11 | 54 | 47 | 7 | 184 | 129 | 55 | 145 | 99 | 46 | 1 | 1 | … |
| Germany | 4,819 | 3,188 | 1,631 | 513 | 385 | 125 | 354 | 208 | 146 | 1,041 | 626 | 415 | 227 | 131 | 96 | 50 | 42 | 8 | 381 | 258 | 123 | 420 | 314 | 106 | 923 | 586 | 337 | 904 | 631 | 273 | 6 | 4 | 2 |
| Austria | 513 | 348 | 165 | 190 | 111 | 79 | 19 | 15 | 4 | 63 | 38 | 25 | 14 | 10 | 4 | 3 | 2 | 1 | 20 | 20 | … | 47 | 47 | … | 114 | 70 | 44 | 43 | 35 | 8 | … | … | … |
| Switzerland | 332 | 269 | 63 | 40 | 24 | 16 | 47 | 28 | 19 | 26 | 23 | 3 | 7 | 6 | 1 | 6 | 5 | 1 | 49 | 46 | 3 | 87 | 83 | 4 | 16 | 12 | 4 | 54 | 42 | 12 | … | … | … |
| Italy | 483 | 3S5 | 98 | 54 | 47 | 7 | 22 | 10 | 12 | 146 | 101 | 45 | 7 | 6 | 1 | 4 | 4 | … | 47 | 46 | 1 | 70 | 68 | 2 | 78 | 55 | 23 | 55 | 48 | 7 | … | … | … |
| Norway | 1,271 | 823 | 448 | 136 | 96 | 40 | 12 | 10 | 2 | 268 | 159 | 109 | 46 | 239 | 222 | 10 | 8 | 2 | 50 | 49 | 1 | 40 | 37 | 3 | 136 | 95 | 41 | 155 | 128 | 27 | 3 | 2 | 1 |
| Sweden | 1,264 | 1,049 | 215 | 162 | 155 | 7 | 19 | 17 | 2 | 320 | 235 | 85 | 174 | 99 | 75 | 27 | 24 | 3 | 83 | 79 | 4 | 66 | 63 | 3 | 175 | 154 | 21 | 237 | 222 | 15 | 1 | 1 | … |
| Denmark | 2,199 | 1,409 | 790 | 142 | 108 | 34 | 132 | 71 | 6l | 725 | 437 | 288 | 368 | 210 | 158 | 48 | 33 | 15 | 64 | 58 | 6 | 104 | 92 | 12 | 336 | 202 | 134 | 279 | ?97 | 82 | 1 | 1 | … |
| Other European Countries | 984 | 810 | 174 | 243 | 219 | 24 | 80 | 42 | 38 | 127 | 95 | 32 | 27 | 25 | 2 | 18 | 18 | … | 60 | 54 | 6 | 85 | 68 | 17 | 158 | 121 | 37 | 183 | 165 | 18 | 3 | 3 | … |
| United States* | 841 | 637 | 204 | 280 | 221 | 59 | 23 | 17 | 6 | 86 | 67 | 19 | 23 | 14 | 9 | 22 | 17 | 5 | 60 | 54 | 6 | 61 | 5' | 10 | 131 | 86 | 45 | 150 | 105 | 45 | 5 | 5 | … |
| China | 5,033 | 5,017 | 16 | 125 | 119 | 6 | 7 | 7 | … | 93 | 93 | … | 4 | 4 | … | 1 | 1 | … | 453 | 453 | … | 758 | 758 | … | 138 | 136 | 2 | 3,451 | 3,444 | 7 | 3 | 2 | 1 |
| Other Countries | 1,190 | 792 | 398 | 430 | 275 | 155 | 51 | 32 | 19 | 116 | 78 | 38 | 62 | 36 | 26 | 18 | 13 | 5 | 36 | 22 | 14 | 10 | 7 | 3 | 210 | 138 | 72 | 248 | 182 | 66 | 9 | 9 | … |
| At Sea | 1,325 | 667 | 658 | 371 | 128 | 143 | 53 | 25 | 28 | 198 | 95 | i03 | 55 | 31 | 24 | 20 | 14 | 6 | 50 | 24 | 26 | 14 | 6 | 8 | 321 | 158 | 163 | 343 | 186 | 157 | … | … | … |
| Unspecified | 833 | 601 | 232 | 68 | 50 | 18 | 24 | 18 | 6 | 104 | 63 | 41 | 51 | 36 | 15 | 7 | 5 | 2 | 29 | 21 | 8 | 12 | 10 | 2 | 377 | 278 | 99 | 161 | 120 | 41 | … | … | … |
Table VII. Table VII. Showing the Birthplaces of Persons, Males, and Females (exclusive of Maoris) in each County.
| Where Born. | Mongonui. | Bay of Islands. | Hokianga. | Hobson. | Whangarei. | Rodney. | Waitemata. | ||||||||||||||
|---|---|---|---|---|---|---|---|---|---|---|---|---|---|---|---|---|---|---|---|---|---|
| Persons. | Males. | Females. | Persons. | Males. | Females. | Persons. | Males. | Females. | Persons. | Males. | Females. | Persons. | Males. | Females. | Persons. | Males. | Females. | Persons. | Males. | Females. | |
| * See note to “United States,” Table V., p. 195. | |||||||||||||||||||||
| Total | 1,471 | 871 | 600 | 2,184 | 1,258 | 926 | 587 | 367 | 220 | 2,851 | 1,734 | 1,097 | 3,953 | 2,245 | 1,708 | 3,287 | 1,802 | 1,485 | 4,522 | 2,60S | 1,914 |
| British Possessions— | |||||||||||||||||||||
| New Zealand | 905 | 482 | 423 | 1,090 | 544 | 546 | 383 | 207 | 176 | 1,360 | 734 | 606 | 1,939 | 993 | 946 | 1,709 | 873 | 536 | 2,013 | 1,049 | 964 |
| Australian Colonies | 34 | 16 | 18 | 88 | 50 | 38 | 11 | 5 | 6 | 77 | 47 | 30 | 79 | 46 | 33 | 61 | 33 | 28 | 149 | 81 | 68 |
| England | 294 | 192 | 102 | 494 | 310 | 184 | 90 | 68 | 22 | 839 | 547 | 292 | 831 | 523 | 308 | 907 | 542 | 365 | 1,263 | 767 | 496 |
| Wales | 4 | 3 | 1 | 10 | 3 | 7 | 3 | 1 | 2 | 8 | 7 | 1 | 14 | 10 | 4 | 15 | 9 | 6 | 15 | 11 | 4 |
| Scotland | 58 | 42 | 16 | 130 | 89 | 41 | 30 | 25 | 5 | 158 | 108 | 50 | 398 | 240 | 158 | 153 | 94 | 59 | 299 | 190 | 109 |
| Ireland | 82 | 57 | 25 | 240 | 164 | 76 | 47 | 39 | 8 | 248 | 159 | 89 | 243 | 171 | 72 | 170 | 92 | 7S | 544 | 340 | 204 |
| Other British Possessions | 33 | 23 | 10 | 40 | 23 | 17 | 9 | 8 | 1 | 61 | 50 | 11 | 325 | 169 | 156 | 40 | 20 | 20 | 68 | 40 | 28 |
| Foreign Countries— | |||||||||||||||||||||
| France and French Colonies | 5 | 5 | … | 4 | 4 | … | 2 | 2 | … | 17 | 17 | … | 10 | 8 | 2 | 6 | 6 | … | 10 | 9 | 1 |
| Germany | 7 | 6 | 1 | 16 | 11 | 5 | 3 | 3 | … | 18 | 13 | 5 | 23 | 18 | 5 | 27 | 17 | 10 | 35 | 27 | 8 |
| Austria | 1 | 1 | … | 1 | 1 | … | … | … | … | 4 | 3 | 1 | … | 1 | … | 126 | 63 | C13 | 2 | 2 | … |
| Switzerland | … | … | … | 4 | 1 | 3 | … | … | … | … | … | … | 13 | 8 | 5 | 3 | 2 | 1 | 3 | 3 | … |
| Italy | 1 | … | 1 | … | … | … | … | … | … | 4 | 3 | 1 | … | 1 | … | … | … | … | 7 | 4 | 3 |
| Norway | 3 | 3 | … | 4 | 3 | 1 | … | … | … | 7 | 5 | 2 | … | 6 | 1 | 11 | 6 | 5 | 20 | 14 | 6 |
| Sweden | 2 | 2 | … | 2 | 2 | … | 1 | 1 | … | 5 | 5 | … | … | 9 | … | 6 | 5 | 1 | 14 | 14 | … |
| Denmark | 2 | 2 | … | 2 | 2 | … | … | … | … | 7 | 7 | … | … | 1 | … | 5 | 4 | 1 | 14 | 13 | 1 |
| Other European Countries | 12 | 12 | … | 21 | 21 | … | 3 | 3 | … | 11 | 9 | 2 | … | 3 | 1 | 10 | 9 | 1 | 10 | 8 | 6 |
| United States of America* | 22 | 21 | 1 | 19 | 18 | 1 | 2 | 2 | … | 7 | … | … | 12 | 11 | 1 | 6 | 6 | … | 10 | 8 | 2 |
| China | … | … | … | 1 | 1 | … | … | … | … | … | 1 | … | … | … | … | … | … | … | … | … | … |
| Other Countries | 2 | 1 | 1 | 12 | 8 | 4 | 2 | 2 | … | 10 | 8 | 2 | 27 | 15 | 12 | 21 | 15 | 6 | 31 | 19 | 12 |
| At Sea | 4 | 3 | 1 | 4 | 2 | 2 | 1 | 1 | … | 9 | 4 | 5 | 10 | 6 | 4 | 10 | 5 | 5 | 14 | 8 | 6 |
| Unspecified | … | … | … | 2 | 1 | 1 | … | … | … | … | … | … | 6 | 6 | … | 1 | 1 | … | 1 | 1 | … |
Table VII. Table VII. Showing the Birthplaces of Persons, Males, and Females (exclusive of Maoris) in each County—continued.
| Where Born. | Eden. | Manukau. | Coromandel. | Thames. | Piako. | Tauranga. | Whakatane. | Cook. | ||||||||||||||||
|---|---|---|---|---|---|---|---|---|---|---|---|---|---|---|---|---|---|---|---|---|---|---|---|---|
| Persons. | Males. | Females. | Persons. | Males. | Females. | Persons. | Males. | Females. | Persons. | Males. | Females. | Persons. | Males. | Females. | Persons. | Males. | Females. | Persons. | Males. | Females. | Persons. | Males. | Females. | |
| Total | 17,393 | 8,785 | 8,808 | 10,274 | 5,416 | 4,858 | 2,153 | 1,355 | 798 | 5,179 | 2,935 | 2,244 | 981 | 713 | 268 | 2,599 | 1,447 | 1,152 | 913 | 527 | 286 | 1,740 | 1,035 | 705 |
| British Possessions— | ||||||||||||||||||||||||
| New Zealand | 8,464 | 4,065 | 4,399 | 5,545 | 2,816 | 2,729 | 1,023 | 555 | 468 | 2,647 | 1,371 | 1,276 | 368 | 228 | 140 | 955 | 458 | 497 | 466 | 242 | 224 | 847 | 415 | 432 |
| Australian Colonies | 508 | 245 | 260 | 134 | 65 | 69 | 70 | 40 | 30 | 185 | 96 | 89 | 44 | 27 | 17 | 94 | 53 | 41 | 46 | 24 | 22 | 70 | 48 | 22 |
| England | 4,963 | 2,623 | 2,340 | 1,864 | 1,095 | 769 | 461 | 327 | 134 | 1,215 | 747 | 468 | 288 | 230 | 58 | 642 | 421 | 221 | 163 | 108 | 55 | 407 | 269 | 138 |
| Wales | 65 | 47 | 18 | 27 | 10 | 17 | 7 | 4 | 3 | 24 | 15 | 9 | 7 | 6 | 1 | 10 | 5 | 5 | 2 | 1 | 1 | 7 | 5 | 2 |
| Scotland | 958 | 489 | 469 | 824 | 439 | 385 | 146 | 102 | 44 | 272 | 167 | 105 | 59 | 46 | 13 | 118 | 81 | 37 | 74 | 49 | 25 | 127 | 94 | 33 |
| Ireland | 2,090 | 999 | 1,091 | 1,608 | 843 | 765 | 329 | 234 | 95 | 600 | 372 | 228 | 176 | 147 | 29 | 632 | 341 | 291 | 136 | 84 | 52 | 194 | 132 | 62 |
| Other British Possessions | 242 | 113 | 129 | 141 | 63 | 78 | 47 | 34 | 13 | 85 | 51 | 34 | 20 | 16 | 4 | 6S | 38 | 27 | 11 | 6 | 5 | 23 | 17 | 6 |
| Foreign Countries— | ||||||||||||||||||||||||
| France and French Colonies | 26 | 15 | 11 | 12 | 6 | 6 | 8 | 8 | … | 7 | 4 | 3 | 1 | … | 1 | 15 | 11 | 4 | 4 | 4 | … | 11 | 10 | 1 |
| Germany | 42 | 34 | 8 | 38 | 26 | 12 | 16 | 14 | 2 | 26 | 22 | 4 | 4 | 4 | … | 19 | 11 | 8 | 2 | 2 | … | 9 | 8 | 1 |
| Austria | 1 | … | 1 | … | … | … | 3 | 3 | … | 3 | 3 | … | 2 | 1 | 1 | … | … | … | 1 | 1 | … | … | … | … |
| Switzerland | 1 | 1 | … | 2 | 1 | 1 | … | … | … | 2 | … | 2 | … | … | … | 2 | … | 2 | … | … | … | 1 | 1 | … |
| Italy | 7 | 6 | 1 | 1 | 1 | … | 1 | 1 | … | … | 2 | … | … | … | … | 3 | 3 | … | … | … | … | … | … | … |
| Norway | 14 | 7 | 7 | 2 | 2 | … | … | … | … | 13 | 13 | … | … | … | … | 1 | … | 1 | … | … | … | 5 | 2 | 3 |
| Sweden | 15 | 15 | … | 5 | 5 | … | 11 | 11 | … | 12 | 12 | … | 1 | 1 | … | … | … | … | … | … | … | 5 | 4 | 1 |
| Denmark | 10 | 8 | 2 | 1 | 1 | … | 2 | 2 | … | 6 | 6 | … | 1 | 1 | … | 6 | 6 | … | … | … | … | 8 | 6 | 2 |
| Other European Countries | 19 | 18 | 1 | 4 | 4 | … | 6 | 5 | 1 | 6 | 5 | 1 | 3 | 2 | 1 | 1 | … | 1 | … | … | … | 4 | 4 | … |
| United States of America | 20 | 9 | 11 | 10 | 4 | 6 | 10 | 8 | 2 | 22 | 17 | 5 | 1 | … | 1 | 16 | 7 | 9 | 1 | … | 1 | 6 | 6 | … |
| China | 28 | 27 | 1 | 1 | … | 1 | 1 | 1 | … | 7 | 7 | … | … | … | … | 3 | 2 | 1 | … | … | … | … | … | … |
| Other Countries | 64 | 31 | 33 | 28 | 19 | 9 | 5 | 3 | 2 | 25 | 18 | 7 | 5 | 3 | 2 | 4 | 3 | 1 | 2 | 2 | … | 8 | 6 | 2 |
| At Sea | 49 | 23 | 26 | 26 | 15 | 11 | 7 | 3 | 4 | 19 | 6 | 13 | 1 | 1 | … | 7 | 4 | 3 | 3 | 2 | 1 | 2 | 2 | … |
| Unspecified | 7 | 7 | … | 1 | 1 | … | … | … | … | 1 | 1 | … | … | … | … | 6 | 3 | 3 | 2 | 2 | … | 3 | 3 | … |
Table VII. Table VII. Showing the Birthplaces of Persons, Males, and Females (exclusive of Maoris) in each County—continued.
| Where Born. | Wairoa. | East Taupo. | West Taupo. | Waipa | Waikato. | Raglan. | Kawhia. | Taranaki. | ||||||||||||||||
|---|---|---|---|---|---|---|---|---|---|---|---|---|---|---|---|---|---|---|---|---|---|---|---|---|
| Persons. | Males. | Females. | Persons. | Males. | Females. | Persons. | Males. | Females. | Persons. | Males. | Females. | Persons. | Males. | Females. | Persons. | Males. | Females. | Persons. | Males. | Females. | Persons. | Males. | Females. | |
| Total | 1,009 | 597 | 412 | 126 | 93 | 33 | 11 | 8 | 3 | 3,097 | 1,685 | 1,412 | 2,857 | 1,607 | 1,250 | 776 | 460 | 316 | 108 | 59 | 49 | 6,820 | 3,930 | 2,890 |
| British Possessions— | ||||||||||||||||||||||||
| New Zealand | 526 | 276 | 250 | 51 | 31 | 20 | 5 | 2 | 3 | 1,419 | 702 | 717 | 1,280 | 641 | 6,39 | 459 | 255 | 204 | 97 | 48 | 40 | 3,225 | 1,696 | 1,529 |
| Australian Colonies | 35 | 26 | 9 | 7 | 5 | 2 | … | … | … | 104 | 56 | 48 | 108 | 51 | 57 | 18 | 9 | 4 | … | … | … | 161 | 105 | 56 |
| England | 215 | 137 | 78 | 31 | 25 | 6 | 6 | 6 | … | S83 | 524 | 359 | 763 | 500 | 263 | 864 | 102 | 62 | 7 | 7 | … | 2,089 | 1,263 | 126 |
| Wales | 2 | 2 | … | … | … | … | … | … | … | 17 | 10 | 7 | 8 | 5 | 3 | … | 3 | 4 | … | … | … | 12 | 7 | 5 |
| Scotland | 79 | 57 | 22 | 10 | 7 | 3 | … | … | … | 171 | 103 | 68 | 230 | 137 | 93 | 51 | 36 | 15 | … | … | … | 288 | 181 | 107 |
| Ireland | 105 | 69 | 36 | 18 | 13 | 2 | … | … | … | 372 | 213 | 159 | 369 | 219 | 150 | 58 | 41 | 17 | 4 | 4 | … | 463 | 348 | 115 |
| Other British Possessions | 8 | 5 | 3 | 4 | 4 | … | … | … | … | 39 | 19 | 20 | 45 | 25 | 20 | 8 | 5 | 3 | … | … | … | 58 | 35 | 23 |
| Foreign Countries— | ||||||||||||||||||||||||
| France and French Colonies | 7 | 3 | 4 | … | … | … | … | … | … | 1 | 1 | … | 3 | 2 | 1 | … | … | … | … | … | … | 8 | … | 1 |
| Germany | 9 | 6 | 3 | 2 | 2 | … | … | … | … | 26 | 2 | 9 | 5 | 3 | 2 | … | 3 | 2 | … | … | … | 225 | 132 | 93 |
| Austria | … | … | … | … | … | … | … | … | … | 24 | 16 | 8 | … | … | … | … | … | … | … | … | … | … | 12 | 3 |
| Switzerland | 2 | 1 | 1 | … | … | … | … | … | … | 1 | … | 1 | 2 | 2 | … | … | … | … | … | … | … | 24 | 15 | 6 |
| Italy | … | … | … | … | … | … | … | … | … | … | … | … | … | … | … | 2 | 1 | 1 | … | … | … | 11 | 4 | 7 |
| Norway | … | … | … | … | … | … | … | … | … | … | … | … | 1 | 1 | … | … | … | … | … | … | … | 6 | 5 | 1 |
| Sweden | 4 | 2 | 2 | 1 | 1 | … | … | … | … | 3 | 3 | … | 1 | 1 | … | … | … | … | … | … | … | 9 | 8 | 1 |
| Denmark | … | … | … | 1 | 1 | … | … | … | … | 7 | 5 | 2 | 6 | 2 | 4 | … | … | … | … | … | … | 104 | 51 | 53 |
| Other European Countries | 2 | 2 | … | 1 | 1 | … | … | … | … | 3 | 3 | … | s | 2 | 3 | … | … | … | … | … | … | 61 | 29 | 32 |
| United States of America | 1 | 1 | … | 2 | 2 | … | … | … | … | 4 | 3 | 1 | 1 | 1 | … | 1 | 1 | … | … | … | … | 4 | 4 | … |
| China | … | … | … | … | … | … | … | … | … | … | … | … | … | … | … | … | … | … | … | … | … | 1 | 1 | … |
| Other Countries | 4 | 3 | 1 | … | … | … | … | … | … | 4 | 1 | 3 | 18 | 9 | 9 | 4 | 2 | 2 | … | … | … | 17 | 7 | 10 |
| At Sea | 2 | 2 | … | 1 | 1 | … | … | … | … | 9 | 3 | 6 | 9 | 3 | 6 | 4 | 2 | 2 | … | … | … | 30 | 14 | 16 |
| Unspecified | 8 | 5 | 3 | … | … | … | … | … | … | 10 | 6 | 4 | 3 | 3 | … | … | … | … | … | … | … | 9 | 3 | 6 |
Table VII. Table VII. Showing the Birthplaces of Persons, Males, and Females (exclusive of Maoris) in each County—continued.
| Where Born. | Patea. | Wanganui. | Rangitikei. | Manawatu. | Hutt. | Wairarapa West. | Wairarapa East. | Waipawa. | ||||||||||||||||
|---|---|---|---|---|---|---|---|---|---|---|---|---|---|---|---|---|---|---|---|---|---|---|---|---|
| Persons. | Males. | Females. | Persons. | Males. | Females. | Persons. | Males. | Females. | Persons. | Males. | Females. | Persons. | Males. | Females. | Persons. | Males. | Females. | Persons. | Males. | Females. | Persons. | Males. | Females. | |
| Total | 5,789 | 3,490 | 2,299 | 3,456 | 1,935 | 1,521 | 3,311 | 1,828 | 1,483 | 7,372 | 4,147 | 3,225 | 7,553 | 4,200 | 3,655 | 5,759 | 3,167 | 2,592 | 1,475 | 1,046 | 429 | 5,867 | 3,411 | 2,456 |
| British Possessions— | ||||||||||||||||||||||||
| New Zealand | 2,621 | 1,348 | 1,273 | 1,737 | 881 | 856 | 1,736 | 885 | 851 | 3,436 | 1,790 | 1,646 | 4,542 | 2,296 | 2,246 | 3,132 | 1,588 | 1,544 | 6,34 | 381 | 253 | 2,350 | 1,243 | 1,107 |
| Australian Colonies | 215 | 122 | 93 | 78 | 38 | 40 | 65 | 37 | 28 | 182 | 102 | 80 | 135 | 63 | 72 | 85 | 41 | 44 | 37 | 24 | 13 | 94 | 59 | 35 |
| England | 1,479 | 1,019 | 460 | 803 | 494 | 309 | 8,46 | 494 | 352 | 2,190 | l,270 | 920 | 2,105 | 1,186 | 919 | 1,334 | 805 | 529 | 469 | 379 | 90 | 1,623 | 1,000 | 623 |
| Wales | 30 | 22 | 8 | 23 | 13 | 10 | l6 | 14 | 2 | 40 | 18 | 22 | 21 | 10 | 11 | 9 | 6 | 3 | 6 | 5 | 1 | 25 | 15 | 10 |
| Scotland | 440 | 286 | 154 | 328 | 194 | 134 | 292 | 170 | 122 | 359 | 239 | 120 | 353 | 206 | 147 | 335 | 208 | 127 | 144 | i03 | 41 | 391 | 239 | 152 |
| Ireland | 685 | 470 | 215 | 317 | 203 | 114 | 195 | 120 | 75 | 406 | 258 | 148 | 403 | 216 | 187 | 234 | 147 | 17 | 98 | 81 | 17 | 362 | 275 | 87 |
| Other British Possessions | 65 | 45 | 20 | 33 | … | 10 | 15 | 10 | 5 | 59 | 34 | 25 | 32 | 20 | 12 | 37 | 21 | 16 | 9 | 7 | 2 | 34 | 30 | 4 |
| Foreign Countries— | ||||||||||||||||||||||||
| France and French Colonies | 4 | 4 | … | 12 | … | 5 | 1 | … | 1 | 9 | 5 | 4 | 7 | 7 | … | 15 | 10 | 5 | 2 | 1 | 1 | 13 | 9 | 4 |
| Germany | 96 | 62 | 34 | 54 | 31 | 23 | 84 | 54 | 30 | 318 | 186 | 132 | 28 | 23 | 5 | 99 | 58 | 41 | 22 | 17 | 5 | 143 | 74 | 69 |
| Austria | 3 | 3 | … | 2 | 2 | … | 7 | 4 | 3 | 20 | 12 | 8 | 3 | 2 | 1 | 4 | 2 | 2 | 1 | 1 | … | 12 | 8 | 4 |
| Switzerland | 22 | 12 | 10 | 9 | 7 | 2 | 3 | 3 | … | 6 | 6 | … | 1 | 1 | … | … | … | … | … | … | … | 3 | 3 | … |
| Italy | 5 | 3 | 2 | 10 | 8 | 2 | 1 | 1 | … | 3 | 3 | … | 32 | 23 | 9 | 6 | 5 | 1 | … | … | … | 1 | 1 | … |
| Norway | 11 | 8 | 3 | 2 | 1 | 1 | 1 | 1 | … | 58 | 36 | 22 | 11 | 10 | 1 | 55 | 27 | 28 | S | 6 | 2 | 345 | 181 | 164 |
| Sweden | 9 | 8 | 1 | 5 | 5 | … | 8 | 7 | 1 | 64 | 40 | 24 | 21 | 18 | 3 | 96 | 61 | 35 | 16 | 15 | 1 | 133 | 79 | 54 |
| Denmark | 26 | 20 | 6 | 4 | 2 | 2 | 13 | 9 | 4 | 141 | 98 | 43 | 64 | 39 | 25 | 275 | 158 | 117 | 16 | 15 | 1 | 279 | 163 | 116 |
| Other European Countries | 12 | 10 | 2 | 2 | 2 | … | 5 | 3 | 2 | 27 | 16 | 11 | 11 | 9 | 2 | 11 | 10 | 1 | 6 | 6 | … | 6 | 6 | … |
| United States of America | 16 | 14 | 2 | 2 | … | 2 | 5 | 2 | 3 | 9 | 6 | 3 | 8 | 8 | … | … | … | … | 1 | 1 | … | 7 | 2 | 5 |
| China | 2 | 2 | … | 3 | 3 | … | 2 | 2 | … | 4 | 4 | … | 35 | 35 | … | … | … | … | … | … | … | … | … | … |
| Other Countries | 25 | 18 | 7 | 10 | 8 | 2 | 7 | 5 | 2 | 10 | 7 | 3 | 18 | 11 | 7 | 12 | 10 | 2 | 2 | 1 | 1 | 16 | 7 | 9 |
| At Sea | 17 | 8 | 9 | 18 | 9 | 9 | 7 | 5 | 2 | 28 | 14 | 14 | 23 | 12 | 11 | 19 | 10 | 9 | 3 | 2 | 1 | 17 | 6 | 11 |
| Unspecified | 6 | 6 | … | 4 | 4 | … | 2 | 2 | … | 3 | 3 | … | 5 | 5 | … | 1 | … | 1 | 1 | 1 | … | 13 | 11 | 2 |
Table VII. Table VII. Showing the Birthplaces of Persons, Males, and Females (exclusive of Maoris) in each County—continued.
| Where Born. | Hawke's Bay. | Sounds. | Marlborough. | Kaikoura. | Waima. | Collingwood. | Buller. | ||||||||||||||
|---|---|---|---|---|---|---|---|---|---|---|---|---|---|---|---|---|---|---|---|---|---|
| Persons. | Males. | Females. | Persons. | Males. | Females. | Persons. | Males. | Females. | Persons. | Males. | Females. | Persons. | Males. | Females. | Persons. | Males. | Females. | Persons. | Males. | Females. | |
| Total | 4,879 | 2,857 | 2,022 | 605 | 364 | 241 | 4,680 | 2,767 | 2,767 | 1,105 | 671 | 434 | 7,535 | 3,928 | 3,607 | 1,643 | 926 | 717 | 2,545 | 1,618 | 927 |
| British Possessions— | |||||||||||||||||||||
| New Zealand | 2,047 | 1,037 | 1,010 | 392 | 213 | 179 | 2,661 | 1,415 | 1,246 | 580 | 307 | 273 | 5,155 | 2,583 | 2,572 | 1,055 | 529 | 526 | 1,038 | 541 | 497 |
| Australian Colonies | 105 | 61 | 44 | 13 | … | 6 | 94 | 56 | 38 | 33 | 20 | 15 | 85 | 43 | 42 | 27 | 13 | 14 | 126 | 58 | 68 |
| England | 1,491 | 945 | 546 | 104 | 73 | 31 | 1,067 | 716 | 551 | 244 | 176 | 68 | 1,626 | 918 | 708 | 332 | 221 | 111 | 443 | 335 | 108 |
| Wales | 12 | 11 | 1 | 4 | 3 | 1 | 14 | 9 | 5 | 1 | 1 | … | 33 | 19 | 14 | 9 | 6 | 3 | 21 | 18 | 3 |
| Scotland | 376 | 24S | 128 | 36 | 27 | 9 | 283 | 186 | 97 | 103 | 75 | 2S | 220 | 126 | 94 | 146 | 74 | 42 | 282 | 198 | 84 |
| Ireland | 625 | 403 | 222 | 16 | 13 | 3 | 404 | 261 | 143 | 107 | 62 | 45 | 109 | 60 | 49 | 56 | 43 | 13 | 452 | 305 | 144 |
| Other British Possessions | 38 | 26 | 12 | 10 | 7 | 3 | 25 | 19 | 6 | 5 | 5 | … | 45 | 22 | 23 | 6 | 3 | 3 | 31 | 27 | 4 |
| Foreign Countries— | |||||||||||||||||||||
| France and French Colonies | 16 | 14 | 2 | 1 | … | 1 | 6 | 4 | 2 | … | … | … | 7 | 6 | 1 | 2 | 2 | … | 9 | 7 | 2 |
| Germany | 20 | 16 | 4 | 3 | 3 | … | 30 | 25 | 5 | 9 | 8 | 1 | 203 | 112 | 91 | 13 | 11 | 2 | 39 | 30 | 9 |
| Austria | 1 | 1 | … | … | … | … | 1 | 1 | … | … | … | … | 3 | 3 | … | … | … | … | 5 | 5 | … |
| Switzerland | 1 | 1 | … | … | … | … | 2 | 2 | … | … | 2 | … | 1 | 1 | 1 | … | … | … | 9 | 9 | … |
| Italy | 2 | 2 | … | … | … | … | 3 | 3 | … | … | … | … | 1 | 1 | … | … | … | … | 19 | 19 | … |
| Norway | 35 | 19 | 16 | 5 | 4 | 1 | 4 | 3 | 1 | … | … | … | 1 | 1 | … | 3 | 3 | … | 4 | 4 | … |
| Sweden | 12 | 4 | 8 | 3 | 3 | … | 14 | 13 | 1 | 5 | 5 | … | 10 | 9 | 1 | 4 | 4 | … | 9 | 9 | … |
| Denmark | 42 | 28 | 14 | 7 | 4 | 3 | 33 | 23 | 10 | 4 | 4 | … | 3 | 2 | … | 3 | 3 | … | 20 | 20 | … |
| Other European Countries | 4 | 4 | … | 2 | 2 | … | 10 | 10 | … | … | … | … | 4 | 4 | … | 1 | 1 | … | 9 | 5 | 1 |
| United States of America | 4 | 4 | … | 4 | 1 | 3 | 7 | 5 | 2 | 1 | 1 | … | 2 | 2 | … | 3 | 3 | … | 11 | 10 | 1 |
| China | 4 | 4 | … | … | … | … | … | … | … | … | … | … | 1 | 1 | … | … | … | … | 3 | 3 | … |
| Other Countries | 19 | 12 | 7 | 3 | 2 | 1 | 7 | 5 | 2 | 4 | 3 | 1 | 8 | 4 | 4 | 5 | 5 | … | 2 | 2 | … |
| At Sea | 15 | 10 | 5 | 2 | 2 | … | 10 | 7 | 3 | 2 | 2 | … | 10 | 5 | 5 | 5 | 2 | 3 | 5 | 2 | 3 |
| Unspecified | 10 | 7 | 3 | … | … | … | 5 | 4 | 1 | … | … | … | 8 | 6 | … | 3 | 3 | … | S | 5 | 3 |
Table VII. Table VII. Showing the Birthplaces of Persons, Males, and Females (exclusive of Maoris) in each County—continued.
| Where Born. | Inangahua. | Grey. | Westland. | Amuri. | Cheviot. | Ashley. | Akaroa. | Selwyn. | ||||||||||||||||
|---|---|---|---|---|---|---|---|---|---|---|---|---|---|---|---|---|---|---|---|---|---|---|---|---|
| Persons. | Males. | Females. | Persons. | Males. | Females. | Persons. | Males. | Females. | Persons. | Males. | Females. | Persons. | Males. | Females. | Persons. | Males. | Females. | Persons. | Males. | Females. | Persons. | Males. | Females. | |
| Total | 2,927 | 2,015 | 912 | 4,939 | 3,405 | 1,534 | 5,362 | 3,593 | 1,770 | 513 | 373 | 135 | 102 | 75 | 27 | 11,955 | 6,547 | 5,408 | 4,020 | 2,240 | 1,780 | 34,323 | 18,148 | 16,175 |
| British Possessions— | ||||||||||||||||||||||||
| New Zealand | 963 | 500 | 463 | 1,518 | 743 | 775 | 1,841 | 916 | 925 | 181 | 114 | 67 | 27 | 17 | 10 | 5,917 | 3,001 | 2,916 | 2,251 | 1,185 | 1,066 | 15,387 | 7,758 | 7,629 |
| Australian Colonies | 192 | 94 | 98 | 296 | 150 | 146 | 344 | 168 | 176 | 30 | 24 | 6 | 9 | 5 | 4 | 147 | 85 | 62 | 82 | 45 | 37 | 887 | 450 | 437 |
| England | 515 | 389 | 126 | 830 | 609 | 221 | 852 | 676 | 206 | 130 | 110 | 20 | 41 | 33 | 8 | 3,189 | 1,856 | 1,333 | 924 | 851 | 373 | 11,119 | 6,091 | 5,025 |
| Wales | 21 | 17 | 4 | 48 | 41 | 7 | 45 | 40 | 5 | 1 | 1 | … | 1 | 1 | … | 39 | 23 | 16 | 14 | 9 | 5 | 150 | 79 | 71 |
| Scotland | 226 | 163 | 58 | 402 | 320 | 82 | 467 | 371 | 96 | 100 | 74 | 26 | 12 | 10 | 2 | 892 | 532 | 360 | 351 | 151 | 100 | 2,131 | 1,199 | 932 |
| Ireland | 541 | 396 | 145 | 1,064 | 783 | 281 | 926 | 129 | 297 | 57 | 42 | 15 | 8 | 5 | 3 | 1,336 | 790 | 546 | 281 | 158 | 123 | 3,585 | 1,899 | 1,686 |
| Other British Possessions | 16 | 12 | 4 | 40 | 36 | 4 | 26 | 21 | 5 | 3 | 3 | … | 1 | 1 | … | 37 | 24 | 13 | 14 | 8 | 6 | 140 | 77 | 63 |
| Foreign Countries— | ||||||||||||||||||||||||
| France and French Colonies | 5 | 5 | … | 13 | 13 | … | 18 | 17 | 1 | 2 | 1 | 1 | … | … | … | 13 | 9 | 4 | 22 | 20 | 2 | 27 | 18 | 9 |
| Germany | 37 | 33 | 4 | 60 | 54 | 6 | 155 | 122 | 33 | 3 | 3 | … | … | … | … | 196 | 116 | 80 | 49 | 30 | 19 | 260 | 153 | 107 |
| Austria | 3 | 3 | … | 14 | 14 | … | 33 | 32 | … | … | … | … | … | … | … | 70 | 36 | 34 | 1 | 1 | … | 9 | 3 | 6 |
| Switzerland | 11 | 11 | … | 23 | 22 | 1 | 78 | 75 | 3 | … | … | … | … | … | … | … | … | … | … | … | … | 6 | 4 | 2 |
| Italy | 6 | 5 | 1 | 17 | 17 | … | 51 | 49 | 2 | … | … | … | … | … | … | 3 | 1 | 2 | 2 | 2 | … | 20 | 13 | 7 |
| Norway | 7 | 7 | … | 22 | 21 | 1 | 24 | 33 | 1 | 2 | 2 | … | 2 | 2 | … | 10 | 8 | 2 | 5 | 4 | 1 | 34 | 18 | 16 |
| Sweden | 12 | 12 | … | 36 | 33 | 3 | 33 | 33 | … | … | … | … | … | … | … | 10 | 9 | 1 | 18 | 13 | 5 | 29 | 22 | 7 |
| Denmark | 4 | 4 | … | 27 | 34 | 3 | 65 | 56 | 9 | … | … | … | 1 | 1 | … | 21 | 12 | 9 | 70 | 38 | 32 | 93 | 57 | 36 |
| Other European Countries | 11 | 9 | 2 | 39 | 39 | … | 36 | 28 | 8 | 2 | 2 | … | … | … | … | 9 | 7 | 2 | 12 | 10 | 2 | 35 | 22 | 13 |
| United States of America | 17 | 15 | 2 | 25 | 35 | … | 13 | 12 | 1 | … | … | … | … | … | … | 9 | 4 | 5 | 3 | 2 | 1 | 25 | 17 | 8 |
| China | 330 | 330 | … | 448 | 448 | … | 316 | 316 | … | 1 | 1 | … | … | … | … | 4 | 4 | … | … | … | … | 50 | 50 | … |
| Other Countries | 4 | 4 | … | 1 | … | 1 | 3 | 3 | … | … | … | … | … | … | … | 10 | 5 | 5 | 11 | 7 | 4 | 47 | 27 | 20 |
| At Sea | 6 | 1 | 5 | 9 | 6 | 3 | 4 | 1 | 1 | 1 | 1 | … | … | … | … | 31 | 15 | 16 | 8 | 5 | 3 | 99 | 53 | 46 |
| Unspecified | … | … | … | 7 | 7 | … | 3 | 2 | 1 | … | … | … | … | … | … | 12 | 10 | 2 | 2 | 1 | 1 | 190 | 138 | 52 |
Table VII. Table VII. Showing the Birthplaces of Persons, Males, arid Females (exclusive of Maoris) in each County—continued.
| Where Born. | Ashburton. | Geraldine. | Waimate. | Waitaki. | Waikouaiti. | Peninsula. | Taieri. | Bruce. | ||||||||||||||||
|---|---|---|---|---|---|---|---|---|---|---|---|---|---|---|---|---|---|---|---|---|---|---|---|---|
| Persons. | Males. | Females. | Persons. | Males. | Females. | Persons. | Males. | Females. | Persons. | Males. | Females. | Persons. | Males. | Females. | Persons. | Males. | Females. | Persons. | Males. | Females. | Persons. | Males. | Females. | |
| Total | 7,l65 | 4,397 | 2,768 | 12,729 | 7,041 | 5,688 | 3,438 | 2,118 | 1,320 | 6,955 | 4,142 | 2,813 | 6,661 | 3,776 | 2,885 | 2,425 | 1,300 | 1,125 | 7,416 | 4,230 | 3,246 | 5,049 | 2,801 | 2,248 |
| British Possessions:— | ||||||||||||||||||||||||
| New Zealand | 2,725 | 1,459 | 1,266 | 5,473 | 2,727 | 2,746 | 1,295 | 655 | 640 | 2,840 | 1,454 | 1,386 | 3,150 | 1,595 | 1,555 | 1,237 | 656 | 581 | 3,323 | 1,756 | 1,567 | 2,41,3 | 1,196 | 1,217 |
| Australian Colonies | 1,55 | 83 | 72 | 217 | 133 | 85 | 70 | 45 | 25 | 213 | 124 | 89 | 171 | 84 | 87 | 85 | 34 | 51 | 187 | 100 | 87 | 58 | 29 | 29 |
| England | 2,078 | 1,333 | 745 | 3,560 | 2,056 | 1,504 | 905 | 605 | 300 | 1,042 | 695 | 347 | 923 | 599 | 324 | 319 | 185 | 134 | 791 | 476 | 315 | 471 | 287 | 184 |
| Wales | 73 | 46 | 27 | 53 | 30 | 23 | 15 | 12 | 3 | 24 | 19 | 5 | 15 | 15 | … | 5 | 3 | 2 | 20 | 16 | 4 | 8 | 5 | … |
| Scotland | 718 | 479 | 239 | 1,213 | 762 | 451 | 520 | 356 | 164 | 1,752 | 1,108 | 644 | 1,552 | 881 | 671 | 562 | 291 | 271 | 2,245 | 1,274 | 971 | 1,391 | 806 | 585 |
| Ireland | 1,227 | 856 | 371 | 1,830 | 1,060 | 770 | 527 | 369 | 158 | 895 | 593 | 302 | 495 | 253 | 215 | 139 | 69 | 70 | 617 | 374 | 243 | 417 | 240 | 177 |
| Other British Possessions | 35 | 25 | 10 | 32 | 23 | 9 | 25 | 15 | 7 | 24 | 17 | 7 | 23 | 16 | 7 | 10 | 7 | 3 | 19 | 14 | 5 | 11 | 10 | 1 |
| Foreign Countries— | ||||||||||||||||||||||||
| France and French Colonies | 17 | 13 | 4 | 23 | 16 | 7 | 9 | 6 | 3 | 7 | 7 | … | 10 | G | 4 | … | … | … | 2 | 1 | 1 | 6 | 5 | 1 |
| Germany | 17 | 13 | 4 | 90 | 55 | 35 | 35 | 22 | 13 | 36 | 27 | 9 | 22 | 18 | 4 | 10 | 7 | 3 | 80 | 53 | 27 | 90 | 51 | 39 |
| Austria | 2 | 2 | … | 4 | 3 | 1 | 2 | 2 | … | … | … | … | 3 | 3 | … | … | … | … | 2 | 2 | … | … | … | … |
| Switzerland | 2 | 2 | … | … | … | … | … | … | … | … | … | … | 3 | 2 | 1 | … | … | … | 3 | 2 | 1 | … | … | … |
| Italy | … | … | … | 4 | 3 | 1 | … | … | … | … | … | … | 5 | 5 | … | … | … | … | 4 | 3 | 2 | … | … | … |
| Norway | 10 | 8 | 2 | 8 | 6 | 2 | … | … | … | 5 | 3 | … | 12 | 10 | 2 | 8 | 3 | 2 | 3 | 3 | … | 6 | 5 | 1 |
| Sweden | 15 | 13 | 2 | 14 | 12 | 2 | 8 | 8 | … | 24 | 21 | … | 16 | 16 | … | 12 | 11 | 1 | 18 | 15 | … | 2 | … | … |
| Denmark | 19 | 16 | 3 | 43 | 28 | 15 | … | … | … | 15 | 9 | 6 | 12 | 11 | 1 | 3 | 3 | … | 2 | … | … | 13 | 9 | 4 |
| Other European Countries | 5 | 4 | 1 | 15 | 9 | 6 | 4 | 4 | … | 8 | 7 | 1 | 17 | 17 | … | 5 | 3 | 2 | 7 | 6 | 1 | 4 | 4 | … |
| United States of America | 6 | 5 | 1 | 22 | 14 | 8 | 5 | 2 | 3 | 8 | 4 | 4 | 4 | 1 | 3 | 1 | 1 | … | 6 | 6 | … | … | … | … |
| China | 7 | 7 | … | 20 | 20 | … | 10 | 10 | … | 28 | 28 | … | 186 | 186 | … | 19 | 19 | … | 100 | 100 | … | 136 | 136 | … |
| Other Countries | 13 | 8 | 5 | 19 | 12 | 7 | 3 | 3 | … | 10 | 7 | 3 | 11 | 9 | 2 | 1 | … | 1 | 17 | 9 | 8 | 6 | 5 | 1 |
| At Sea | 28 | 12 | 16 | 30 | 17 | 13 | 5 | 1 | 4 | 12 | 7 | 5 | 11 | 4 | 7 | 12 | 8 | 4 | 23 | 12 | 11 | 15 | 6 | 9 |
| Unspecified | 13 | 13 | … | 59 | 16 | 3 | … | … | … | 12 | 10 | 2 | 17 | 15 | 2 | … | … | … | 7 | 6 | 1 | 2 | 2 | … |
Table VII. Table VII. Showing the Birthplaces of Persons, Males, and Females (exclusive of Maoris) in each County—continued.
| Where Born. | Clutha. | Tuapeka. | Maniototo. | Vincent. | Lake. | Southland. | Wallace. | Fiord. | Stewart Island. | ||||||||||||||||||
|---|---|---|---|---|---|---|---|---|---|---|---|---|---|---|---|---|---|---|---|---|---|---|---|---|---|---|---|
| Persons. | Males. | Females. | Persons. | Males. | Females. | Persons. | Males. | Females. | Persons. | Males. | Females. | Persons. | Males. | Females. | Persons. | Males. | Females. | Persons. | Males. | Females. | Persons. | Males. | Females. | Persons. | Males. | Females. | |
| Total | 4,205 | 2,464 | 1,741 | 6,380 | 3,970 | 2,410 | 2,454 | 1,555 | 899 | 3,565 | 2,431 | 1,134 | 2,486 | 1,723 | 763 | 13,215 | 7,949 | 5,266 | 3,616 | 2,406 | 13 | 5 | 8 | 295 | 164 | 131 | |
| British Possessions— | |||||||||||||||||||||||||||
| New Zealand | 1,996 | 1,038 | 958 | 2,738 | 1,381 | 1,357 | 958 | 479 | 479 | 1,259 | 653 | 606 | 823 | 404 | 419 | 5,137 | 2,930 | 2,701 | 1,329 | 707 | 622 | 6 | 1 | 5 | 202 | 98 | 104 |
| Australian Colonies | 97 | 61 | 35 | 261 | 132 | 129 | 108 | 54 | 54 | 174 | 97 | 77 | 135 | 83 | 52 | 561 | 335 | 226 | 165 | 103 | 62 | … | … | … | 13 | 6 | 7 |
| England | 444 | 304 | 140 | 690 | 485 | 205 | 366 | 242 | 124 | 609 | 442 | 167 | 356 | 281 | 75 | 1,856 | 1,234 | 622 | 512 | 376 | 136 | 3 | 1 | 2 | 25 | 19 | 6 |
| Wales | 9 | 8 | 1 | 17 | 13 | 4 | 35 | 18 | 17 | 23 | 20 | 3 | 19 | 15 | 1 | 36 | 27 | 9 | 6 | 5 | 1 | … | … | … | … | … | … |
| Scotland | 1,290 | 791 | 499 | 1,059 | 657 | 402 | 335 | 239 | 96 | 521 | 379 | 142 | 408 | 310 | 98 | 3,051 | 1,937 | 1,114 | 694 | 474 | 220 | 1 | 1 | … | 28 | 20 | 8 |
| Ireland | 261 | 176 | 85 | 770 | 482 | 288 | 340 | 215 | 125 | 396 | 265 | 131 | 357 | 252 | 105 | 1,289 | 842 | 447 | 481 | 324 | 157 | 1 | 1 | … | 10 | 6 | 4 |
| Other British Possessions | 14 | 12 | 1 | 14 | 9 | 5 | 12 | 12 | … | 11 | 10 | 1 | 10 | 10 | … | 49 | 38 | 11 | 16 | 11 | 5 | … | … | … | 3 | 3 | … |
| Foreign Countries— | |||||||||||||||||||||||||||
| France and French Colonies | 1 | 1 | … | 7 | 6 | 1 | 1 | 1 | … | 6 | 6 | … | 2 | 2 | … | 20 | 6 | 14 | … | 3 | … | … | … | … | 1 | 1 | … |
| Germany | 26 | 18 | 8 | 29 | 25 | 4 | 18 | 16 | 2 | 30 | 30 | … | 23 | 22 | … | 140 | 81 | 59 | 6 | 6 | … | … | … | … | 6 | 4 | 2 |
| Austria | 1 | 1 | … | 4 | 3 | 1 | 2 | 2 | … | … | … | … | 3 | 3 | … | 7 | 2 | 5 | 2 | 2 | … | … | … | … | … | … | … |
| Switzerland | … | … | … | 11 | 11 | … | 1 | 1 | … | 1 | 1 | … | 5 | 4 | 1 | 7 | 7 | … | … | … | … | … | … | … | … | … | … |
| Italy | 1 | 1 | … | 4 | 4 | … | 2 | 2 | … | 1 | 1 | … | 3 | 3 | … | 5 | 5 | … | 3 | 3 | … | … | … | … | … | … | … |
| Norway | 10 | 7 | 3 | 12 | 12 | … | 2 | 2 | … | 5 | 5 | … | 5 | 4 | 1 | 14 | 11 | 3 | 8 | 5 | 3 | … | … | … | … | … | … |
| Sweden | 12 | 12 | … | 11 | 11 | … | 2 | 2 | … | 13 | 13 | … | 10 | 9 | 1 | 22 | 22 | … | 4 | 4 | … | … | … | … | … | … | … |
| Denmark | 4 | 3 | 1 | 13 | 10 | 3 | 6 | 6 | … | 16 | 15 | 1 | 29 | 21 | 8 | 37 | 22 | 15 | 7 | 6 | 1 | 2 | 1 | 1 | … | … | … |
| Other European Countries | 9 | 8 | 1 | 8 | 8 | … | 2 | 2 | … | 8 | 7 | 1 | 3 | 5 | … | 9 | 8 | 1 | 1 | 1 | … | … | … | … | 3 | 3 | … |
| United States of America | 3 | … | 3 | 2 | 2 | … | 2 | 2 | … | 3 | 3 | … | 2 | 2 | … | 21 | 15 | 6 | 4 | 4 | … | … | … | … | 1 | 1 | … |
| China | 12 | 12 | … | 703 | 703 | … | 247 | 247 | … | 473 | 473 | … | 283 | 283 | … | 320 | 320 | … | 354 | 354 | … | … | … | … | 1 | 1 | … |
| Other Countries | 5 | 5 | … | 3 | 2 | 1 | 4 | 3 | 1 | 9 | 8 | 1 | 4 | 4 | … | 33 | 22 | 11 | 10 | 10 | … | … | … | … | 1 | 1 | … |
| At Sea | 10 | 6 | 4 | 13 | 8 | 5 | 3 | 2 | 1 | 6 | 3 | 3 | 8 | 3 | 2 | 47 | 31 | 16 | 10 | 7 | 3 | … | … | … | … | … | … |
| Unspecified | … | … | … | 11 | 6 | 5 | 8 | 8 | … | 1 | … | 1 | … | … | … | 54 | 48 | 6 | 1 | 1 | … | … | … | … | 1 | 1 | … |
Table VIII. Table VIII. Showing the Birthplaces of Persons, Males, and Females (exclusive of Maoris) in each Borough.
| Where Born. | Auckland. | Parnell. | Onehunga. | Thames. | Gisborne. | Hamilton. | New Plymouth. | ||||||||||||||
|---|---|---|---|---|---|---|---|---|---|---|---|---|---|---|---|---|---|---|---|---|---|
| Persons. | Males. | Females. | Persons. | Males. | Females. | Persons. | Males. | Females. | Persons. | Males. | Females. | Persons. | Males. | Females. | Persons. | Males. | Females. | Persons. | Males. | Females. | |
| * See note to “United States,” Table V., p. 195. | |||||||||||||||||||||
| Total | 16,664 | 8,651 | 8,013 | 3,529 | 1,726 | 1,803 | 2,217 | 1,047 | 1,170 | 4,863 | 2,538 | 2,325 | 8,737 | 959 | 778 | 1,36l | 700 | 661 | 3,310 | 1,673 | 1,637 |
| British Possessions— | |||||||||||||||||||||
| New Zealand | 7,689 | 3,839 | 3,850 | 1,638 | 807 | 831 | 1,223 | 585 | 638 | 2,591 | 1,283 | 1,308 | 837 | 436 | 401 | 6,37 | 306 | 331 | 1,780 | 872 | 908 |
| Australian Colonies | 676 | 335 | 341 | 92 | 41 | 51 | 41 | 18 | 23 | 175 | 79 | 96 | 67 | 38 | 29 | 86 | 42 | 44 | 59 | 29 | 30 |
| England | 4,379 | 2,433 | 1,946 | 1,002 | 523 | 479 | 496 | 239 | 257 | 1,158 | 665 | 493 | 464 | 267 | 197 | 350 | 200 | 150 | 1,036 | 527 | 509 |
| Wales | 66 | 31 | 35 | 13 | 6 | 7 | 2 | … | 2 | 7 | 4 | 3 | 10 | 6 | 4 | 4 | 2 | 2 | 7 | 5 | 2 |
| Scotland | 1,027 | 582 | 445 | 195 | 94 | 101 | 84 | 40 | 44 | 296 | 172 | 124 | 104 | 69 | 35 | 56 | 30 | 26 | 95 | 53 | 42 |
| Ireland | 2,106 | 967 | 1,139 | 462 | 193 | 269 | 297 | 121 | 176 | 474 | 236 | 238 | 173 | 90 | 83 | 192 | 102 | 90 | 181 | 107 | 74 |
| Other British Possessions | 265 | 143 | 122 | 55 | 22 | 33 | 35 | 18 | 17 | 65 | 32 | 33 | 30 | 21 | 9 | 10 | 4 | 6 | 36 | 17 | 19 |
| Foreign Countries— | |||||||||||||||||||||
| France and French Colonies | 49 | 31 | 18 | 7 | 4 | 3 | … | … | … | 3 | 1 | 2 | 5 | 4 | 1 | 1 | … | 1 | 4 | 2 | 2 |
| Germany | 105 | 76 | 29 | 7 | 6 | 1 | … | 7 | … | 27 | 19 | 8 | 4 | 3 | 1 | 5 | 2 | 3 | 48 | 24 | 24 |
| Austria | 8 | 5 | 3 | … | … | … | 1 | 1 | … | 7 | 5 | 2 | 3 | 3 | … | … | … | … | 1 | … | 1 |
| Switzerland | 2 | 2 | … | 1 | … | 1 | … | … | … | 1 | 1 | … | … | … | … | 2 | 2 | … | 3 | … | 3 |
| Italy | 14 | 14 | … | 1 | 1 | … | 2 | 2 | … | … | … | … | 2 | 2 | … | 2 | 2 | … | 6 | 3 | 3 |
| Norway | 17 | 9 | 8 | … | … | … | 1 | 1 | … | 3 | 3 | … | 7 | 3 | 4 | … | … | … | 1 | 1 | … |
| Sweden | 20 | 18 | 2 | 1 | 1 | … | 1 | 1 | … | 6 | 6 | … | 4 | … | 2 | … | … | … | 4 | 3 | 1 |
| Denmark | 38 | 24 | 11 | 2 | 1 | 1 | 8 | … | 4 | 4 | 3 | 1 | 5 | 2 | 3 | … | … | … | 6 | 2 | 4 |
| Other European Countries | 36 | 32 | 4 | 6 | 2 | 4 | 3 | … | 1 | 8 | 8 | … | 1 | 1 | … | 2 | 2 | … | 6 | 2 | 4 |
| United States of America* | 27 | 19 | 8 | 8 | 3 | 5 | 1 | … | … | 13 | 10 | 3 | 5 | 4 | 1 | 2 | 2 | … | 5 | 1 | 4 |
| China | 21 | 18 | 3 | 3 | 3 | … | 1 | … | … | … | … | … | 1 | 1 | … | … | … | … | 5 | 5 | … |
| Other Countries | 83 | 54 | 29 | 6 | 2 | 4 | 7 | 4 | 3 | 14 | 8 | 6 | 4 | 3 | 1 | 7 | 3 | 4 | 9 | 7 | 2 |
| At Sea | 38 | 18 | 20 | 12 | 5 | 7 | 7 | 2 | 5 | 11 | 3 | 8 | 8 | 4 | 4 | 4 | 1 | 3 | 9 | 4 | 5 |
| Unspecified | 1 | 1 | … | 18 | 12 | 6 | … | … | … | … | … | … | 3 | … | 3 | 1 | … | 1 | 9 | 9 | … |
Table VIII. Table VIII. Showing the Birthplaces of Persons, Males, and Females (exclusive of Maoris) in each Borough—continued.
| Where Born. | Wanganui. | Marton. | Palmerston North. | Wellington. | Masterton. | Greytown. | Napier. | ||||||||||||||
|---|---|---|---|---|---|---|---|---|---|---|---|---|---|---|---|---|---|---|---|---|---|
| Persons. | Males. | Females. | Persons. | Males. | Females. | Persons. | Males. | Females. | Persons. | Males. | Females. | Persons. | Males. | Females. | Persons. | Males. | Females. | Persons. | Males. | Females. | |
| Total | 4,646 | 2,330 | 2,3l6 | 662 | 363 | 299 | 1,366 | 723 | 643 | 20,363 | 10,226 | 10,337 | 2,241 | 1,155 | 1,086 | 1,078 | 56l | 517 | 5,756 | 2,896 | 2,860 |
| British Possessions— | |||||||||||||||||||||
| New Zealand | 2,280 | 1,093 | 1,l87 | 302 | 143 | 159 | 566 | 276 | 290 | 9,298 | 4,441 | 4,857 | 1,087 | 524 | 563 | 668 | 336 | 329 | 2,475 | 1,193 | 1,282 |
| Australian Colonies | 185 | 84 | 101 | 21 | 13 | 8 | 54 | 28 | 20 | 990 | 472 | 524 | 51 | 20 | 31 | 15 | 10 | 5 | 148 | 71 | 77 |
| England | 1,140 | 611 | 529 | 182 | 109 | 73 | 401 | 217 | 184 | 6,300 | 3,265 | 3,135 | 695 | 391 | 304 | 269 | 137 | 132 | 1,826 | 961 | 865 |
| Wales | 17 | 10 | 7 | 3 | 2 | 1 | 12 | 7 | 5 | 77 | 42 | 35 | 7 | 3 | 4 | 5 | 1 | 4 | 9 | 6 | 3 |
| Scotland | 371 | 201 | 170 | 63 | 36 | 27 | 68 | 43 | 25 | 1,206 | 633 | 573 | 105 | 53 | 52 | 27 | 19 | 8 | 342 | 199 | 143 |
| Ireland | 454 | 211 | 243 | 33 | 23 | 10 | 71 | 39 | 32 | 1,714 | 757 | 957 | 108 | 63 | 45 | 45 | 22 | 23 | 596 | 270 | 326 |
| Other British Possessions | 43 | 23 | 20 | 7 | 6 | 1 | 12 | 8 | 4 | 165 | 106 | 59 | 16 | 10 | 6 | 5 | 4 | 1 | 57 | 29 | 28 |
| Foreign Countries— | |||||||||||||||||||||
| France and French Colonies | 10 | 7 | 3 | 4 | 3 | 1 | 6 | 2 | 4 | 39 | 27 | 12 | 6 | 6 | … | … | … | … | 20 | 13 | 7 |
| Germany | 52 | 28 | 24 | 30 | 16 | 14 | 67 | 33 | 34 | 174 | 116 | 58 | 71 | 32 | 39 | 15 | 10 | 5 | 54 | 34 | 20 |
| Austria | 2 | 2 | … | … | … | … | 9 | 6 | 3 | 12 | 4 | 8 | … | … | … | … | … | … | 1 | 1 | … |
| Switzerland | 2 | 2 | … | … | … | … | … | … | … | 2 | 1 | 1 | 1 | 1 | … | … | … | … | 1 | 1 | … |
| Italy | 12 | 7 | 8 | 2 | 2 | … | … | … | … | 78 | 50 | 28 | 2 | 2 | … | … | … | … | 4 | 3 | 1 |
| Norway | 5 | 1 | 4 | … | … | … | 40 | 25 | 15 | 66 | 35 | 31 | 9 | 7 | 2 | 3 | 2 | 1 | 79 | 37 | 42 |
| Sweden | 7 | 6 | 1 | 6 | 4 | 2 | 16 | 13 | 3 | 55 | 46 | 9 | 11 | 6 | 5 | 1 | 1 | … | 21 | 9 | 12 |
| Denmark | 12 | 5 | 7 | 6 | 5 | 1 | 32 | 16 | 16 | 89 | 48 | 41 | 43 | 18 | 25 | 17 | 13 | 4 | 51 | 23 | 28 |
| Other Countries | 10 | 8 | 2 | … | … | … | 1 | 1 | … | 40 | 32 | 8 | 11 | 5 | 6 | … | … | … | 11 | 9 | 2 |
| United States of America | 7 | 7 | … | 1 | … | 1 | 5 | 5 | … | 41 | 33 | 8 | 2 | 1 | 1 | 1 | … | 1 | 10 | 6 | 4 |
| China | 6 | 6 | … | … | … | … | 1 | 1 | … | 31 | 31 | … | 7 | 7 | … | 3 | 3 | … | … | … | … |
| Other Countries | 10 | 7 | 3 | 2 | 1 | 1 | 2 | 1 | 1 | 36 | 22 | 14 | 2 | 1 | 1 | 1 | … | 1 | 21 | 12 | 9 |
| At Sea | 18 | 8 | 10 | … | … | … | 3 | 2 | 1 | 65 | 25 | 40 | 7 | 5 | 2 | 4 | 2 | 2 | 21 | 13 | 8 |
| Unspecified | 3 | 3 | … | … | … | … | … | … | … | 79 | 40 | 39 | … | … | … | 2 | 1 | 1 | 9 | 6 | 3 |
Table VIII. Table VIII. Showing the Birthplaces of Persons, Males, and Females (exclusive of Maoris) in each Borough—continued.
| Where Born. | Picton. | Blenheim. | Nelson. | Westport. | Greymouth. | Hokitika. | Ross. | Kumara. | ||||||||||||||||
|---|---|---|---|---|---|---|---|---|---|---|---|---|---|---|---|---|---|---|---|---|---|---|---|---|
| Persons. | Males. | Females. | Persons. | Males. | Females. | Persons. | Males. | Females. | Persons. | Males. | Females. | Persons. | Males. | Females. | Persons. | Males. | Females. | Persons. | Males. | Females. | Persons. | Males. | Females. | |
| Total | 834 | 401 | 433 | 2,107 | 1,051 | 1,056 | 6,764 | 3,261 | 3,503 | 1,013 | 538 | 475 | 2,544 | 1,331 | 1,213 | 2,600 | 1,264 | 1,336 | 1,139 | 647 | 492 | 1,145 | 622 | 523 |
| British Possessions— | ||||||||||||||||||||||||
| New Zealand | 525 | 244 | 281 | 1,176 | 548 | 628 | 3,853 | 1,815 | 2,038 | 511 | 267 | 244 | 1,171 | 583 | 588 | 1,262 | 588 | 674 | 546 | 266 | 280 | 496 | 237 | 259 |
| Australian Colonies | 25 | 8 | 17 | 49 | 27 | 22 | 195 | 81 | 114 | 71 | 25 | 46 | 243 | 112 | 131 | 249 | 97 | 152 | 78 | 38 | 40 | 113 | 47 | 66 |
| England | 176 | 91 | 85 | 599 | 327 | 272 | 1,901 | 953 | 949 | 174 | 104 | 70 | 455 | 250 | 205 | 405 | 230 | 175 | 143 | 90 | 53 | 194 | 124 | 70 |
| Wales | 5 | 3 | 2 | 1 | … | 1 | 24 | 9 | 15 | 6 | 4 | 2 | 13 | 10 | 3 | 7 | 5 | 2 | 17 | 13 | 4 | 5 | 7 | 1 |
| Scotland | 36 | 17 | 19 | 76 | 46 | 30 | 374 | 186 | 188 | 66 | 39 | 27 | 125 | 71 | 54 | 174 | 93 | 8l | 61 | 41 | 20 | 75 | 54 | 21 |
| Ireland | 40 | 19 | 21 | 153 | 60 | 84 | 241 | 111 | 130 | 129 | 53 | 76 | 384 | 177 | 207 | 284 | 100 | 184 | 169 | 89 | 80 | 179 | 90 | 89 |
| Other British Possessions | 7 | 3 | 4 | 16 | 7 | 9 | 37 | 18 | 19 | 7 | 4 | 3 | 25 | 16 | 9 | 15 | 10 | 5 | 11 | 8 | 3 | 5 | 4 | 1 |
| Foreign Countries— | ||||||||||||||||||||||||
| France and French Colonies | … | … | … | 6 | 5 | 1 | 15 | 8 | 7 | 5 | 5 | … | 3 | 2 | 1 | 9 | 7 | 2 | 12 | 11 | 1 | 4 | 2 | 2 |
| Germany | 4 | 4 | … | 5 | 3 | 2 | 40 | 26 | 14 | 19 | 16 | 3 | 31 | 28 | 3 | 125 | 80 | 45 | 27 | 19 | 8 | 35 | 24 | 11 |
| Austria | 1 | 1 | … | 1 | … | 1 | 1 | 1 | … | 1 | 1 | … | 2 | 2 | … | 3 | 3 | … | … | … | … | … | … | … |
| Switzerland | 1 | 1 | … | 1 | … | 1 | 2 | 1 | 1 | 2 | 2 | … | … | … | … | 2 | 1 | 1 | 6 | 6 | … | 1 | 1 | … |
| Italy | 1 | 1 | … | … | … | … | 8 | 8 | … | 1 | 1 | … | 3 | 3 | … | 3 | 3 | … | 4 | 4 | … | 3 | 3 | … |
| Norway | … | … | … | 1 | 1 | … | 5 | 5 | … | 2 | 2 | … | 2 | 2 | … | 5 | 3 | 2 | 1 | 1 | … | … | … | … |
| Sweden | 1 | … | 1 | 4 | 3 | 1 | 11 | 10 | 1 | 5 | 5 | … | 8 | 6 | 2 | 5 | 5 | … | 1 | 1 | … | 2 | 1 | … |
| Denmark | 4 | 3 | 1 | 1 | … | 1 | 9 | 6 | 3 | 3 | 3 | … | 9 | 8 | 1 | 2 | 2 | … | 14 | 13 | 1 | 5 | 4 | 1 |
| Other European Countries | 2 | 2 | … | 2 | 2 | … | 10 | 7 | 3 | 1 | 1 | … | 5 | 5 | … | 16 | 8 | 8 | 3 | 2 | 1 | 3 | 3 | … |
| United States of America | 2 | 2 | … | … | … | … | 4 | 3 | 1 | 8 | 6 | 2 | 16 | 9 | 7 | 7 | 5 | 2 | 2 | 2 | … | 11 | 11 | |
| China | … | … | … | 1 | 1 | … | 1 | 1 | … | … | … | … | 45 | 45 | … | 23 | 23 | … | 37 | 37 | … | 6 | 6 | … |
| Other Countries | 2 | 2 | … | 2 | 1 | 1 | 15 | 5 | 10 | … | … | … | … | … | … | 2 | 1 | 1 | … | … | … | 4 | 3 | 1 |
| At Sea | 2 | … | 2 | 4 | 3 | 1 | 15 | 7 | 8 | 1 | … | 1 | 3 | 2 | 1 | 2 | … | 2 | 1 | … | 1 | 1 | … | 1 |
| Unspecified | … | … | … | 2 | 1 | 1 | 3 | 1 | 2 | 1 | … | 1 | 1 | … | 1 | … | … | … | 6 | 6 | … | … | … | … |
Table VIII. Table VIII. Showing the Birthplaces of Persons, Males, and Females (exclusive of Maoris) in each Borough—continued.
| Where Born. | Ashburton. | Kaiapoi. | Akaroa. | Lyttelton. | Christchurch. | Sydenham. | Timaru. | ||||||||||||||
|---|---|---|---|---|---|---|---|---|---|---|---|---|---|---|---|---|---|---|---|---|---|
| Persons. | Males. | Females. | Persons. | Males. | Females. | Persons. | Males. | Females. | Persons. | Males. | Females. | Persons. | Males. | Females. | Persons. | Males. | Females. | Persons. | Males. | Females. | |
| Total | 1,526 | 844 | 682 | 1,221 | 594 | 627 | 611 | 296 | 315 | 4,127 | 2,205 | 1,922 | 15,213 | 7,734 | 7,479 | 8,460 | 4,290 | 4,170 | 3,917 | 2,117 | 1,800 |
| British Possessions— | |||||||||||||||||||||
| New Zealand | 589 | 290 | 299 | 594 | 285 | 309 | 311 | 138 | 173 | 1,941 | 934 | 1,007 | 6,024 | 2,978 | 3,046 | 3,598 | 1,793 | 1,805 | 1,527 | 762 | 765 |
| Australian Colonies | 63 | 25 | 38 | 19 | 9 | 10 | 17 | 6 | 11 | 154 | 83 | 71 | 685 | 349 | 33 | 199 | 105 | 94 | 165 | 89 | 76 |
| England | 508 | 305 | 203 | 422 | 209 | 213 | 157 | 81 | 76 | 1,201 | 674 | 527 | 5,467 | 2,857 | 2,610 | 3,019 | 1,581 | 1,438 | 1,249 | 706 | 543 |
| Wales | 7 | 3 | 4 | 6 | 3 | 3 | 1 | 1 | … | 23 | 115 | 8 | 85 | 41 | 44 | 25 | 17 | 8 | 23 | 13 | 10 |
| Scotland | 125 | 80 | 45 | 91 | 50 | 41 | 24 | 14 | 10 | 287 | 170 | 117 | 951 | 531 | 420 | 641 | 328 | 313 | 341 | 207 | 134 |
| Ireland | 183 | 100 | 82 | 65 | 31 | 34 | 52 | 22 | 30 | 255 | 134 | 121 | M75 | 646 | 829 | 790 | 350 | 440 | 486 | 252 | 234 |
| Other British Possessions | 15 | 11 | 4 | 6 | 2 | 4 | 7 | 4 | 3 | 19 | 12 | 7 | 90 | 51 | 39 | 35 | 15 | 20 | 30 | 18 | 12 |
| Foreign Countries— | |||||||||||||||||||||
| France and French Colonies | 1 | 1 | … | 2 | … | 2 | 19 | 13 | 6 | 11 | 8 | 3 | 23 | 14 | … | 2 | 2 | … | 9 | 4 | 5 |
| Germany | 18 | 16 | 2 | 7 | 2 | 5 | 6 | 5 | 1 | 27 | 20 | 7 | 103 | 69 | 34 | 29 | 16 | 13 | 31 | 21 | 10 |
| Austria | … | … | … | … | … | … | … | … | … | 14 | 13 | 1 | 8 | 6 | 2 | 1 | 1 | … | 3 | 3 | … |
| Switzerland | 1 | 1 | … | … | … | … | … | … | … | … | … | … | 5 | 3 | 2 | 1 | 1 | … | 1 | 1 | … |
| Italy | 2 | 1 | … | … | … | … | 1 | 2 | … | 12 | 12 | … | 22 | 15 | 7 | 8 | 4 | 4 | 2 | … | 2 |
| Norway | 2 | 1 | 1 | … | … | … | … | … | … | 21 | 16 | 5 | 14 | 10 | 4 | 16 | 10 | 6 | 3 | 3 | … |
| Sweden | 1 | 1 | … | 1 | 1 | … | 1 | 1 | … | 25 | 25 | … | 18 | 14 | 4 | 8 | 8 | … | 8 | 8 | … |
| Denmark | … | … | … | 2 | 1 | 1 | 4 | 1 | 3 | 14 | 11 | 3 | 42 | 19 | 23 | 20 | 14 | 6 | 3 | 2 | 1 |
| Other European Countries | 1 | 1 | … | … | … | … | 5 | 3 | 2 | 13 | 12 | 1 | 29 | 22 | 7 | 8 | 5 | 3 | 6 | 6 | … |
| United States of America | 2 | 2 | … | … | … | … | 1 | 1 | … | 12 | 5 | 7 | 27 | 18 | 9 | 4 | 3 | 1 | 8 | 7 | 1 |
| China | 1 | 1 | … | … | … | … | 3 | 3 | … | 1 | 1 | … | 26 | 26 | … | 7 | 7 | … | 7 | 7 | … |
| Other Countries | 3 | 3 | … | 1 | … | 1 | … | … | … | 19 | 19 | … | 42 | 25 | 17 | 21 | 15 | 6 | 2 | 1 | 1 |
| At Sea | 3 | … | 3 | 5 | 1 | 4 | 1 | 1 | … | 10 | 6 | 4 | 51 | 19 | 32 | 27 | 14 | 13 | 11 | 6 | 5 |
| Unspecified | 2 | 1 | 1 | … | … | … | … | … | … | 68 | 35 | 33 | 26 | 21 | 5 | 1 | 1 | … | 2 | 1 | 1 |
Table VIII. Table VIII. Showing the Birthplaces of Persons, Males, and Females (exclusive of Maoris) in each Borough—continued.
| Where Born. | Rangiora. | Waimate. | Oamaru. | Hampden. | Palmerston South. | West Hawkesbury. | Port Chalmers. | ||||||||||||||
|---|---|---|---|---|---|---|---|---|---|---|---|---|---|---|---|---|---|---|---|---|---|
| Persons. | Males. | Females. | Persons. | Males. | Females. | Persons. | Males. | Females. | Persons. | Males. | Females. | Persons. | Males. | Females. | Persons. | Males. | Females. | Persons. | Males. | Females. | |
| Total | 1,445 | 743 | 702 | 1,600 | 870 | 730 | 5,791 | 3,007 | 2,784 | 327 | 180 | 147 | 965 | 518 | 450 | 415 | 200 | 209 | 2,l8l | 1,156 | 1,015 |
| British Possessions— | |||||||||||||||||||||
| New Zealand | 609 | 285 | 324 | 673 | 340 | 333 | 2,461 | 1,208 | 1,253 | 166 | 92 | 74 | 423 | 213 | 210 | 227 | 113 | 114 | 996 | 485 | 511 |
| Australian Colonies | 16 | 10 | 6 | 49 | 30 | 19 | 227 | 107 | 120 | 5 | 4 | 1 | 56 | 24 | 32 | l6 | 11 | 5 | 132 | 63 | 69 |
| England | 517 | 294 | 223 | 467 | 264 | 203 | 1,051 | 595 | 456 | 61 | 34 | 27 | 131 | 75 | 56 | 81 | 38 | 43 | 372 | 213 | 159 |
| Wales | 3 | 2 | 1 | 8 | 3 | 5 | 2S | 12 | 13 | … | … | … | 1 | 1 | … | … | … | … | 8 | 6 | 2 |
| Scotland | 82 | 48 | 34 | 159 | 87 | 72 | 1,111 | 613 | 498 | 71 | 37 | 34 | 241 | 141 | 100 | 71 | 35 | 36 | 480 | 279 | 201 |
| Ireland | 183 | 83 | 100 | 193 | 116 | 77 | 806 | 407 | 399 | 20 | 9 | 11 | 89 | 44 | 45 | 14 | 6 | 8 | 126 | 49 | 77 |
| Other British Possessions | 4 | 1 | 3 | 10 | 4 | 6 | 24 | 12 | 12 | … | … | … | 8 | 5 | 3 | 2 | 1 | 1 | 7 | 6 | 1 |
| Foreign Countries— | |||||||||||||||||||||
| France and French Colonies | 3 | 2 | 1 | … | … | … | s | 3 | 2 | … | … | … | 1 | 1 | … | … | … | … | 2 | 2 | … |
| Germany | 9 | 8 | 1 | 23 | 17 | 6 | 6 | 3 | 3 | 1 | 1 | … | … | 4 | 3 | 1 | 1 | … | 12 | 11 | 1 |
| Austria | … | … | … | … | … | … | … | … | … | … | … | … | … | … | … | … | … | … | 4 | 3 | 1 |
| Switzerland | … | … | … | … | … | … | 1 | … | 1 | … | … | … | … | … | … | 1 | … | 1 | 1 | 1 | … |
| Italy | … | … | … | … | … | … | 6 | 3 | 3 | … | … | … | 1 | 1 | … | … | … | … | 3 | 3 | … |
| Norway | 1 | … | 1 | 1 | … | 1 | 2 | … | … | … | … | … | … | … | … | … | … | … | 5 | 5 | … |
| Sweden | … | … | … | … | … | 5 | 5 | … | 2 | 2 | … | … | … | … | 1 | 1 | … | 8 | 8 | … | |
| Denmark | 2 | 1 | 1 | 2 | l | 1 | 9 | 3 | 6 | … | … | … | 1 | 1 | … | … | … | … | 8 | 7 | 1 |
| Other European Countries | 3 | 3 | … | … | … | … | 6 | 6 | … | … | … | … | 1 | 1 | … | … | … | … | 3 | 3 | … |
| United States of America | 2 | 1 | 1 | 1 | 1 | … | 4 | 3 | 1 | … | … | … | … | … | … | … | … | … | 2 | 2 | … |
| China | 2 | … | 2 | … | … | … | 3 | 2 | 1 | … | … | … | 6 | 6 | … | … | … | … | 2 | 2 | |
| Other Countries | 4 | 1 | 3 | 5 | 2 | 3 | 21 | 16 | 5 | … | … | … | … | … | … | 1 | … | 1 | 7 | 6 | 1 |
| At Sea | 3 | 3 | … | 9 | 5 | 4 | 10 | 3 | 7 | 1 | 1 | … | … | … | … | … | … | … | 3 | 2 | 1 |
| Unspecified | 2 | 1 | 1 | … | … | … | 8 | 4 | 4 | … | … | … | 2 | 1 | 1 | … | … | … | … | … | … |
Table VIII. Table VIII. Showing the Birthplaces of Persons, Males, and Females (exclusive of Maoris) in each Borough—continued.
| Where Born. | Dunedin. | Roslyn. | Caversham. | Mornington. | Maori Hill. | St. Kilda. | South Dunedin. | ||||||||||||||
|---|---|---|---|---|---|---|---|---|---|---|---|---|---|---|---|---|---|---|---|---|---|
| Persons. | Males. | Females. | Persons. | Males. | Females. | Persons. | Males. | Females. | Persons. | Males. | Females. | Persons. | Males. | Females. | Persons. | Males. | Females. | Persons. | Males. | Females. | |
| Total | 24,372 | 12,246 | 12,126 | 2,875 | 1,428 | 1,447 | 3,989 | 2,061 | 1,928 | 2,886 | 1,396 | 1,490 | 1,136 | 605 | 531 | 773 | 383 | 390 | 2,796 | 1,431 | 1,365 |
| British Possessions— | |||||||||||||||||||||
| New Zealand | 9,711 | 4,738 | 4,973 | 1,270 | 631 | 639 | 1,679 | 872 | 807 | 1,173 | 557 | 616 | 473 | 249 | 224 | 328 | 153 | 175 | 1,046 | 530 | 516 |
| Australian Colonies | 1,795 | 154 | 941 | 119 | 54 | 65 | 211 | 111 | 100 | 149 | 64 | 85 | 41 | 19 | 22 | 30 | 11 | 19 | 107 | 52 | 55 |
| England | 4,886 | 2,618 | 2,208 | 529 | 279 | 250 | 1,009 | 539 | 470 | 691 | 347 | 344 | 175 | 104 | 71 | 211 | 110 | 101 | 726 | 368 | 358 |
| Wales | 61 | 43 | 19 | 5 | 3 | 2 | 22 | 5 | 17 | 15 | 8 | 7 | 2 | 1 | 1 | 8 | 4 | 4 | 5 | 2 | 3 |
| Scotland | 5,007 | 2,533 | 2,475 | 739 | 364 | 178 | 676 | 331 | 345 | 669 | 340 | 329 | 310 | 161 | 149 | 122 | 64 | 58 | 502 | 252 | 250 |
| Ireland | 2,076 | 870 | 1,206 | 158 | 59 | 99 | 299 | 139 | 160 | 136 | 55 | 81 | 93 | 44 | 49 | 80 | 29 | 30 | 323 | 159 | 164 |
| Other British Possessions | 170 | 102 | 68 | 17 | 12 | 5 | 19 | 12 | 7 | 8 | 2 | 6 | 3 | 2 | 1 | 6 | 4 | 2 | 15 | 7 | 8 |
| Foreign Countries— | |||||||||||||||||||||
| France and French Colonies | 33 | 22 | 11 | 2 | 1 | 1 | … | … | … | 1 | … | 1 | 1 | 1 | … | 3 | 2 | 1 | 1 | 1 | … |
| Germany | 185 | 125 | 60 | 13 | 8 | 5 | 8 | 5 | 3 | 10 | 6 | 4 | 6 | 3 | 3 | 1 | 1 | … | 16 | 13 | 3 |
| Austria | 7 | 7 | … | … | … | … | … | … | … | … | … | … | … | … | … | … | … | … | 1 | 1 | … |
| Switzerland | 10 | 7 | 3 | … | … | … | 2 | … | 2 | 1 | … | 1 | 1 | 1 | … | … | … | … | … | … | … |
| Italy | 10 | 8 | 2 | 1 | 1 | … | 1 | … | 1 | … | … | … | … | … | … | … | … | 11 | 1 | 1 | … |
| Norway | 21 | 13 | 8 | … | … | … | 3 | 3 | … | … | … | … | 2 | 2 | … | … | … | … | 1 | 1 | … |
| Sweden | 22 | 19 | 3 | 1 | 1 | … | 3 | 3 | … | … | … | … | 5 | 4 | 1 | 1 | 1 | … | 3 | 3 | … |
| Denmark | 44 | 31 | 13 | 1 | … | 1 | … | … | … | 1 | 2 | … | 15 | 8 | 7 | … | … | … | 4 | 1 | 3 |
| Other European Countries | 38 | 32 | 6 | 1 | 1 | … | 2 | 2 | … | 2 | 2 | … | 2 | 2 | … | … | … | … | … | … | … |
| United States of America | 38 | 22 | 16 | 2 | 2 | … | 2 | 1 | 1 | … | … | … | … | … | … | … | … | … | 3 | 2 | 1 |
| China | 149 | 146 | 3 | 1 | 1 | … | 21 | 21 | … | 2 | … | 2 | … | … | … | … | … | … | 23 | 23 | … |
| Other Countries | 46 | 31 | 15 | 1 | … | 1 | 11 | 5 | 6 | 6 | 5 | 1 | 1 | … | 1 | 1 | i | … | 10 | 8 | 2 |
| At Sea | 55 | 24 | 31 | 8 | 6 | 2 | 15 | 8 | 7 | 14 | 7 | 7 | 4 | 2 | 2 | 3 | 3 | … | 9 | 7 | 2 |
| Unspecified | 8 | 3 | 5 | 7 | 5 | 2 | 6 | 4 | 2 | 7 | 1 | 6 | 2 | 2 | … | … | … | … | … | … | … |
Table VIII. Table VIII. Showing the Birthplaces of Persons, Males, and Females (exclusive of Maoris) in each Borough—continued.
| Where Born. | North-East Valley. | West Harbour. | Milton. | Green Island. | Balclutha. | Tapanui. | Lawrence. | ||||||||||||||
|---|---|---|---|---|---|---|---|---|---|---|---|---|---|---|---|---|---|---|---|---|---|
| Persons. | Males. | Females. | Persons. | Males. | Females. | Persons. | Males. | Females. | Persons. | Males. | Females. | Persons. | Males. | Females. | Persons. | Males. | Females. | Persons. | Males. | Females. | |
| Total | 2,754 | 1,410 | 1,344 | 1,213 | 635 | 578 | 1,287 | 647 | 640 | 462 | 230 | 232 | 820 | 439 | 381 | 592 | 304 | 288 | 1,009 | 510 | 499 |
| British Possessions— | |||||||||||||||||||||
| New Zealand | 1,247 | 628 | 619 | 467 | 238 | 229 | 676 | 330 | 346 | 170 | 80 | 90 | 378 | 193 | 185 | 269 | 123 | 146 | 449 | 218 | 231 |
| Australian Colonies | 110 | 54 | 56 | 43 | 16 | 27 | 42 | 21 | 21 | 7 | 4 | 3 | 29 | 12 | 17 | 41 | 19 | 22 | 91 | 33 | 58 |
| England | 561 | 309 | 252 | 328 | 175 | 153 | 179 | 104 | 75 | 85 | 43 | 42 | 102 | 58 | 44 | 97 | 58 | 39 | 184 | 114 | 70 |
| Wales | 12 | 6 | 6 | 1 | … | 1 | 5 | 4 | 1 | 3 | 2 | 1 | … | … | … | … | … | … | 3 | 2 | 1 |
| Scotland | 571 | 283 | 288 | 222 | 117 | 105 | 251 | 122 | 129 | 161 | 85 | 76 | 237 | 129 | 105 | 129 | 70 | 59 | 170 | 89 | 81 |
| Ireland | 185 | 85 | 100 | 72 | 37 | 35 | 116 | 54 | 62 | 32 | 13 | 19 | 62 | 37 | 25 | 41 | 21 | 20 | 86 | 35 | 51 |
| Other British Possessions | 12 | 8 | 4 | 7 | 4 | 3 | 2 | 2 | … | … | … | … | 3 | 3 | … | 2 | … | 2 | 8 | 6 | 2 |
| Foreign Countries— | |||||||||||||||||||||
| France and French Colonies | 5 | 3 | 2 | 10 | 7 | 3 | 1 | 1 | … | … | … | … | … | … | … | … | … | … | … | … | … |
| Germany | 21 | 14 | 7 | 11 | 5 | 6 | 3 | 1 | 2 | … | … | … | 2 | 2 | … | 4 | 4 | … | 6 | 4 | 2 |
| Austria | … | … | … | … | … | … | 1 | 1 | … | … | … | … | … | … | … | … | … | … | … | … | … |
| Switzerland | 2 | 1 | 1 | 1 | 1 | … | … | … | … | … | … | … | … | … | … | … | … | … | … | … | … |
| Italy | … | … | … | 1 | 1 | … | … | … | … | … | … | … | … | … | … | … | … | … | 1 | 1 | … |
| Norway | 2 | 1 | 1 | 11 | 8 | 3 | … | … | … | 1 | 1 | … | … | … | … | … | … | … | … | … | … |
| Sweden | … | … | … | 4 | 2 | 2 | … | … | … | … | … | … | 1 | … | … | 1 | 1 | … | … | … | … |
| Denmark | 2 | 1 | 1 | 9 | 5 | 4 | 2 | 2 | … | 1 | 1 | … | … | … | … | … | … | … | … | … | … |
| Other European Countries | 3 | 3 | … | … | … | … | … | … | … | … | … | … | 1 | … | 1 | 1 | 1 | … | … | … | … |
| United States of America | 5 | 3 | 2 | 5 | 3 | 2 | … | … | … | … | … | … | … | … | … | 2 | 2 | … | … | … | … |
| China | 8 | 8 | … | 14 | 14 | … | 4 | 4 | … | … | … | … | 1 | 1 | … | 1 | 1 | … | 6 | 6 | … |
| Other Countries | 4 | 2 | 2 | 1 | 1 | … | … | … | … | 1 | … | 1 | 3 | 3 | … | 1 | 1 | … | 1 | 1 | … |
| At Sea | 4 | 1 | 3 | 3 | 1 | 2 | 5 | 1 | 4 | 1 | 1 | … | 2 | 1 | 1 | 1 | 1 | … | 4 | 1 | 3 |
| Unspecified | … | … | … | 3 | … | 3 | … | … | … | … | … | … | … | … | … | 2 | 2 | … | … | … | … |
Table VIII. Table VIII. Showing the Birthplaces of Persons, Males, and Females (exclusive of Maoris) in each Borough—continued.
| Where Born. | Roxburgh. | Naseby. | Alexandra. | Cromwell. | Arrowtown. | Queenstown. | Invercargill. | Invercargill South. | ||||||||||||||||
|---|---|---|---|---|---|---|---|---|---|---|---|---|---|---|---|---|---|---|---|---|---|---|---|---|
| Persons. | Males. | Females. | Persons. | Males. | Females. | Persons. | Males. | Females. | Persons. | Males. | Females. | Persons. | Males. | Females. | Persons. | Males. | Females. | Persons. | Males. | Females. | Persons. | Males. | Females. | |
| Total | 277 | 166 | 111 | 560 | 322 | 238 | 275 | 164 | 111 | 429 | 228 | 201 | 4l8 | 238 | 180 | 735 | 440 | 29s | 4,596 | 2,373 | 2,223 | 923 | 475 | 448 |
| British Possessions— | ||||||||||||||||||||||||
| New Zealand | 96 | 49 | 47 | 262 | 150 | 112 | 129 | 65 | 64 | 193 | 8l | 112 | 188 | 94 | 94 | 284 | 155 | 129 | 1,970 | 995 | 975 | 403 | 197 | 206 |
| Australian Colonies | 30 | 14 | 16 | 28 | 10 | 18 | 13 | 6 | 7 | 41 | 17 | 24 | 18 | 8 | 10 | 58 | 24 | 34 | 314 | 142 | 172 | 25 | 6 | 19 |
| England | 48 | 30 | 18 | 105 | 62 | 43 | 29 | 20 | 9 | 65 | 42 | 23 | 65 | 40 | 25 | 130 | 74 | 56 | 834 | 455 | 379 | 186 | 97 | 89 |
| Wales | 5 | 3 | 2 | 3 | 2 | 1 | … | … | … | 1 | 1 | … | 4 | 3 | 1 | 5 | 3 | 2 | 17 | 9 | 8 | 2 | 1 | 1 |
| Scotland | 36 | 21 | 15 | 79 | 42 | 37 | 46 | 29 | 17 | 40 | 21 | 19 | 68 | 43 | 25 | 80 | 46 | 34 | 924 | 496 | 428 | 168 | 88 | 80 |
| Ireland | 26 | 13 | 13 | 48 | 25 | 23 | 24 | 10 | 14 | 45 | 23 | 22 | 52 | 28 | 24 | 71 | 36 | 35 | 406 | 179 | 227 | 117 | 71 | 46 |
| Other British Possessions | … | … | … | … | … | … | … | … | … | 4 | 4 | … | 2 | … | … | 7 | 5 | 2 | 24 | 13 | 11 | 4 | 4 | … |
| Foreign Countries— | ||||||||||||||||||||||||
| France and French Colonies | … | … | … | … | 2 | 1 | … | … | … | … | … | … | … | … | … | 2 | 2 | … | 4 | 1 | 3 | … | … | … |
| Germany | 1 | 1 | … | 4 | 4 | … | 2 | … | … | 3 | 3 | … | 2 | 2 | … | 13 | 11 | 2 | 24 | 20 | 4 | 10 | 6 | 4 |
| Austria | … | … | … | … | … | … | … | … | … | … | … | … | … | … | … | 1 | … | … | 2 | 2 | … | … | … | … |
| Switzerland | … | … | … | … | … | … | … | … | … | … | … | … | … | … | … | … | … | … | 1 | 1 | … | … | … | … |
| Italy | … | … | … | … | … | … | … | … | … | … | … | … | … | … | … | … | … | … | 1 | 1 | … | … | … | … |
| Norway | … | … | … | … | … | … | … | … | … | … | … | … | … | … | … | … | … | … | 4 | 4 | … | … | … | … |
| Sweden | … | … | … | 2 | 1 | 1 | … | … | … | … | … | … | … | … | … | … | … | … | 5 | 5 | … | 1 | 1 | … |
| Denmark | … | … | … | 1 | 1 | … | 2 | 2 | … | 1 | 1 | … | 1 | … | 1 | … | … | 1 | 8 | 6 | 2 | … | … | … |
| Other European Countries | 1 | 1 | … | … | … | … | 1 | 1 | … | … | … | … | … | … | … | … | … | … | 8 | 7 | 1 | … | 1 | 1 |
| United Sates of America | … | … | … | 2 | 1 | 1 | … | … | … | 2 | 2 | … | … | … | … | … | … | … | 6 | 3 | 3 | … | … | … |
| China | 32 | 32 | … | 22 | 22 | … | 29 | 29 | … | 33 | 33 | … | 18 | 18 | … | 75 | 75 | … | 26 | 25 | 1 | … | … | … |
| Other Countries | … | … | … | … | … | … | … | … | … | … | … | … | … | … | … | 4 | 4 | … | 3 | 2 | 1 | 1 | 1 | … |
| At Sea | 2 | 2 | … | 1 | … | 1 | … | … | … | 1 | … | 1 | … | … | … | … | … | … | 14 | 7 | 7 | 4 | 2 | 2 |
| Unspecified | … | … | … | … | … | … | … | … | … | … | … | … | … | … | … | … | … | … | 1 | … | 1 | … | … | … |
Table VIII. Table VIII. Showing the Birthplaces of Persons, Males, and Females (exclusive of Maoris) in each Borough—continued.
| Where Born. | Invercargill East. | Invercargill North. | Campbelltown. | Avenal. | Gladstone. | Winton. | Riverton. | ||||||||||||||
|---|---|---|---|---|---|---|---|---|---|---|---|---|---|---|---|---|---|---|---|---|---|
| Persons. | Males. | Females. | Persons. | Males. | Females. | Persons. | Males. | Females. | Persons. | Males. | Females. | Persons. | Males. | Females. | Persons. | Males. | Females. | Persons. | Males. | Females. | |
| Total | 785 | 411 | 374 | 670 | 338 | 332 | 351 | 177 | 174 | 372 | 182 | 190 | 268 | 130 | 138 | 230 | 134 | 96 | 1,187 | 679 | 508 |
| British Possessions— | |||||||||||||||||||||
| New Zealand | 341 | 169 | 172 | 243 | 113 | 130 | 170 | 81 | 89 | 188 | 93 | 95 | 149 | 68 | 81 | 105 | 59 | 46 | 541 | 275 | 266 |
| Australian Colonies | 42 | 25 | 17 | 13 | 5 | 8 | 40 | 17 | 23 | 5 | 3 | 2 | 11 | 2 | 9 | 7 | 5 | 2 | 75 | 37 | 38 |
| England | 124 | 71 | 53 | 196 | 104 | 92 | 52 | 33 | l9 | 59 | 34 | 25 | 39 | 29 | 10 | 42 | 26 | 16 | 185 | 111 | 74 |
| Wales | 3 | 2 | 1 | 1 | 1 | … | … | … | … | 1 | … | 1 | 1 | … | 1 | … | … | … | 3 | 1 | 2 |
| Scotland | 204 | 111 | 93 | 159 | 83 | 76 | 50 | 29 | 21 | 94 | 41 | 53 | 51 | 24 | 27 | 43 | 27 | l6 | 167 | 91 | 76 |
| Ireland | 58 | 23 | 35 | 49 | 26 | 23 | 27 | 8 | 19 | 17 | 6 | 11 | 14 | 4 | 10 | 29 | 13 | 16 | 84 | 39 | 45 |
| Other British Possessions | 3 | 2 | 1 | 4 | 2 | 2 | 6 | 5 | 1 | 3 | 3 | … | 2 | 2 | … | 1 | 1 | … | 6 | 3 | 3 |
| Foreign Countries— | |||||||||||||||||||||
| France and French Colonies | … | … | … | … | … | … | … | … | … | … | … | … | … | … | … | 1 | 1 | … | … | … | … |
| Germany | 3 | 2 | 1 | … | … | … | 1 | … | 1 | 3 | 1 | 2 | … | … | … | … | … | … | 3 | 3 | … |
| Austria | … | … | … | 1 | 1 | … | … | … | … | … | … | … | … | … | … | … | … | … | … | … | … |
| Switzerland | … | … | … | … | … | … | … | … | … | … | … | … | … | … | … | … | … | … | 2 | 1 | 1 |
| Italy | … | … | … | … | … | … | … | … | … | … | … | … | … | … | … | … | … | … | … | … | … |
| Norway | … | … | … | … | … | … | 1 | 1 | … | … | … | … | … | … | … | … | … | … | 3 | 2 | 1 |
| Sweden | … | … | … | … | … | … | … | … | … | … | … | … | … | … | … | … | … | … | … | … | … |
| Denmark | … | … | … | … | … | … | 3 | 2 | 1 | … | … | … | … | … | … | … | … | … | 2 | 1 | 1 |
| Other European Countries | … | … | … | … | … | … | 1 | 1 | … | … | … | … | … | … | … | 2 | 2 | … | … | … | … |
| United States of America | 1 | 1 | … | 1 | 1 | … | … | … | … | 1 | 1 | … | … | … | … | … | … | … | 1 | 1 | … |
| China | … | … | … | … | … | … | … | … | … | … | … | … | … | … | … | … | … | … | 113 | 113 | … |
| Other Countries | 1 | 1 | … | … | … | … | … | … | … | … | … | … | … | … | … | … | … | … | … | … | … |
| At Sea | 5 | 4 | 1 | 3 | 2 | 1 | … | … | … | 1 | … | 1 | 1 | 1 | … | … | … | … | 2 | 1 | 1 |
| Unspecified | … | … | … | … | … | … | … | … | … | … | … | … | … | … | … | … | … | … | … | … | … |
Table of Contents
Table I. Table I. Showing the Number of Persons (exclusive of Maoris) belonging to each of the Principal Denominations at the Census Periods, December, 1867; February, 1871; March, 1874; March, 1878; and April, 1881; and the Increase or Decrease of each Denomination during the Intervals between the Censuses.
| Principal Denominations. | Persons, December, 1867. | Increase from 1861 to 1871. | Persons, February, 1871. | Increase from 1871 to 1874. | Persons, March, 1874. | Increase from 1874 to 1878. | Persons, March, 1878. | Increase from 1878 to 1881. | Persons, April, 1881. | — | ||||
|---|---|---|---|---|---|---|---|---|---|---|---|---|---|---|
| Numerical. | Centesimal. | Numerical. | Centesimal. | Numerical. | Centesimal. | Numerical. | Centesimal. | |||||||
NOTE.—In cases where a diminution has taken place the minus sign (−) is prefixed lo the numerical and centesimal decrease. * This appeared for the first time in 1871, under the provisions of “The Census Acts Amendment Act, 1870,” by which any person objecting to state whether he belongs to any or what religious denomination may enter the word “Object” in the Census form. | ||||||||||||||
| Church of England and Protestants not otherwise defined | 96,892 | 10,349 | 10.68 | 107,241 | 19,930 | 18.58 | 127,171 | 49,l66 | 38.66 | 176,337 | 26,996 | 15.30 | 203,333 | Principal Protestant Denominations. |
| Presbyterians | 54,929 | 8,695 | 15.83 | 63,624 | 8,853 | 13.91 | 72,477 | 22,626 | 31.22 | 95,103 | 18,005 | 18.93 | 113,108 | |
| Methodists, &c. | 18,088 | 3,916 | 21.65 | 22,004 | 3,215 | 14.61 | 25,219 | 12,660 | 50.20 | 37,879 | 8,778 | 23.17 | 46,657 | |
| Baptists | 4,353 | 379 | 8.71 | 4,732 | 1,623 | 34.30 | 6,355 | 2,804 | 44.12 | 9,159 | 2,317 | 25.30 | 11,476 | |
| Congregational Independents | 4,246 | − 305 | − 7.18 | 3,941 | 1,500 | 38.06 | 5,441 | 114 | 2.10 | 5,555 | 1,144 | 20.59 | 6,699 | |
| Lutherans | 2,383 | − 42 | − 1.76 | 2,341 | 1,573 | 67.19 | 3,914 | 1,729 | 44.17 | 5,643 | 130 | 2.30 | 5,773 | |
| Society of Friends | 146 | 55 | 37.67 | 201 | − 45 | − 22.39 | 156 | 27 | 17.31 | 183 | 49 | 26.78 | 232 | |
| Unitarians | 269 | None | None | 269 | 80 | 29.74 | 349 | 83 | 23.78 | 432 | 57 | 13.19 | 489 | |
| Roman Catholics and Catholics undefined | 30,413 | 5,195 | 17.08 | 35,608 | 4,763 | 13.38 | 40,371 | 18,510 | 45.85 | 58,881 | 10,103 | 17.16 | 68,987 | Catholics. |
| Hebrews | 1,247 | 15 | 1.20 | 1,262 | − 47 | − 3.72 | 1,215 | 209 | 17.20 | 1,424 | 112 | 7.87 | 1,536 | Hebrews. |
| Pagans | 1,111 | 1,501 | 135.10 | 2,612 | 2,152 | 82.39 | 4,764 | − 385 | − 8.08 | 4,379 | 557 | 12.72 | 4,936 | Pagans. |
| Otherwise described | 2,839 | 227 | 8.00 | 3,066 | 1,301 | 42.43 | 4,367 | 2,763 | 63.27 | 7,130 | 4,273 | 59.93 | 11,403 | Others. |
| Undescribed | 1,752 | − 890 | − 50.80 | 862 | 93 | 10.79 | 955 | 788 | 82.51 | 1,743 | − 414 | − 23.75 | 1,329 | |
| Object to state* | … | 8,630 | Infinite | 8,630 | − 1,870 | − 21.67 | 6,760 | 3,804 | 56.27 | 10,564 | 3,414 | 32.32 | 13,978 | Object. |
| Total | 218,668 | 37,725 | 17.25 | 256.393 | 43.121 | 16.82 | 299,514 | 114,898 | 38.36 | 414,412 | 75,521 | l8.22 | 489,933 | |
Table II. Table II. Showing the Number and Proportions per Cent, of Persons (exclusive of Maoris) of different Religions at the Successive Census Periods.
| Principal Denominations. | Persons. | |||||||||
|---|---|---|---|---|---|---|---|---|---|---|
| December, 1867. | February, 1871. | March, 1874. | March, 1878. | April, 1881. | ||||||
| Numbers. | Proportions per Cent. | Numbers. | Proportions per Cent. | Numbers. | Proportions per Cent. | Numbers. | Proportions per Cent. | Numbers. | Proportions per Cent. | |
| Church of England and Protestants not otherwise defined | 96,892 | 44.31 | 107,241 | 41.83 | 127,171 | 42.46 | 176,337 | 42.55 | 203,333 | 41.50 |
| Presbyterians | 54,929 | 25.12 | 63,624 | 24.81 | 72,477 | 24.20 | 95,103 | 22.95 | 113,108 | 23.09 |
| Methodists, &c. | 18,088 | 8.27 | 22,004 | 8.58 | 25,219 | 8.42 | 37,879 | 9.14 | 46,657 | 9.52 |
| Baptists | 4,353 | 1.99 | 4,732 | 1.85 | 6,355 | 2.12 | 9,159 | 2.21 | 11,476 | 2.34 |
| Congregational Independents | 4,246 | 1.94 | 3,941 | 1.54 | 5,441 | 1.82 | 5,555 | 1.34 | 6,699 | 1.37 |
| Lutherans | 2,383 | 1.09 | 2,341 | .91 | 3,914 | 1.31 | 5,643 | 1.36 | 5,773 | 1.18 |
| Society of Friends | 146 | .07 | 201 | .08 | 156 | .05 | 183 | .05 | 232 | .05 |
| Unitarians | 269 | .12 | 269 | .10 | 349 | .11 | 432 | .11 | 489 | .10 |
| Roman Catholics and Catholics undefined | 30,413 | 13.91 | 35,608 | 13.89 | 40,371 | 13,48 | 58,881 | 14.21 | 68,984 | 14.08 |
| Hebrews | 1,247 | .57 | 1,262 | .49 | 1,215 | .40 | 1,424 | .34 | 1,536 | .31 |
| Pagans | 1,111 | .51 | 2,612 | 1.02 | 4,764 | 1.59 | 4,379 | 1.05 | 4,936 | 1.01 |
| Otherwise described | 2,839 | 1.30 | 3,066 | 1.19 | 4,367 | 1.46 | 7,130 | 1.72 | 11,403 | 2.33 |
| Undescribed | 1,752 | .80 | 862 | .34 | 955 | .32 | 1,743 | .42 | 1,329 | .27 |
| Object to state | … | … | 8,630 | 3.37 | 6,760 | 2.26 | 10,564 | 2.55 | 13,978 | 2.85 |
| Total | 218,668 | 100.00 | 256,393 | 100.00 | 299,514 | 100.00 | 414,412 | 100.00 | 489,933 | 100.00 |
Table III. Table III. Showing the Number of Persons, Males, and Females (exclusive of Maoris) of different Religions, the Proportions per Cent, of those belonging to each Denomination, and the Proportions of Males and Females in every 100 Persons of each Religious Denomination, living in New Zealand in April, 1881.
| Religious Denominations. | Numbers. | Proportions per Cent. | Proportion of the Sexes in every 100 Persons. | |||||
|---|---|---|---|---|---|---|---|---|
| Persons. | Males. | Females. | Persons. | Males. | Females. | Males. | Females. | |
* Detailed particulars arc given in the succeeding table. | ||||||||
| Total | 489,933 | 269,605 | 220,328 | 100.00 | 100.00 | 100.00 | 55.03 | 44.97 |
| Episcopalians— | ||||||||
| Church of England—Episcopalians (not otherwise defined) | 200,816 | 110,090 | 90,726 | 40.99 | 40.83 | 41.l8 | 54.82 | 45.l8 |
| Protestants (not otherwise defined) | 2,517 | 1,563 | 954 | .51 | .58 | .43 | 62.10 | 37.90 |
| Presbyterians— | ||||||||
| Church of Scotland, Free Church of Scotland, Free Presbyterians, Presbyterian Church of New Zealand, Presbyterian Church of Otago and Southland, and Presbyterians otherwise defined | 113,038 | 61,506 | 51,532 | 23.07 | 22.81 | 23.39 | 54.41 | 45.59 |
| Reformed Presbyterians | 70 | 37 | 33 | .01 | .01 | .02 | 52.86 | 47.14 |
| Methodists— | ||||||||
| Wesleyan Methodists | 39,544 | 20,202 | 19,342 | 8.07 | 7.49 | 8.78 | 51.09 | 48.91 |
| Primitive Methodists | 4,643 | 2,384 | 2,259 | .95 | .89 | 1.03 | 51.35 | 48.65 |
| United Methodist Free Churches—Free Methodists—United Methodists | 2,009 | 1,015 | 994 | .41 | .38 | .45 | 50.52 | 49.48 |
| Bible Christians | 375 | 199 | 176 | .08 | .07 | .08 | 53.07 | 46.93 |
| New Connection Methodists | 31 | 15 | 16 | .01 | .01 | .01 | 48.39 | 51.61 |
| Others*. | 55 | 30 | 25 | .01 | .01 | .01 | 54.55 | 45.45 |
| Other Protestants— | ||||||||
| Baptists | 11,476 | 5,785 | 5,691 | 2.34 | 2.15 | 2.58 | 50.41 | 49.59 |
| Congregational Independents | 6,699 | 3,449 | 3,250 | 1.37 | 1.28 | 1.48 | 51.49 | 48.51 |
| Lutherans | 5,773 | 3,703 | 2,070 | 1.18 | 1.37 | .94 | 64.14 | 35.86 |
| Unitarians | 489 | 331 | 158 | .10 | .12 | .07 | 67.69 | 32.31 |
| Society of Friends | 232 | 153 | 79 | .05 | .06 | .04 | 65.95 | 34.05 |
| Catholic Apostolic | 121 | 68 | 53 | .02 | .03 | .02 | 56.19 | 43.81 |
| Others* | 6,083 | 3,134 | 2,949 | 1.24 | 1.16 | 1.34 | 51.52 | 48.48 |
| Catholics— | ||||||||
| Roman Catholics | 68,349 | 36,593 | 31,756 | 13.95 | 13.57 | 14.41 | 53.54 | 46.46 |
| Catholics, undefined | 635 | 370 | 265 | .13 | .14 | .12 | 58.27 | 41.73 |
| Greek Church | 55 | 55 | … | .01 | .02 | … | 100.00 | … |
| Other Denominations— | ||||||||
| Latter.Day Saints or Mormons | 271 | 157 | 114 | .06 | .06 | .05 | 57.93 | 42.07 |
| Jews | 1,536 | 844 | 692 | .31 | .31 | .31 | 54.95 | 45.05 |
| Mahometans | 7 | 7 | … | … | … | … | 100.00 | … |
| Pagans | 4,936 | 4,931 | 5 | 1.01 | 1.83 | … | 99.90 | .10 |
| Others* | 237 | 136 | 101 | .05 | .05 | .05 | 57.38 | 42.62 |
| No Denomination* | 4,357 | 2,966 | 1,391 | .89 | 1.10 | .63 | 68.07 | 31.93 |
| No Religion* | 272 | 184 | 88 | .06 | .07 | .04 | 67.65 | 32.35 |
| Unspecified | 1,329 | 950 | 379 | .27 | .35 | .17 | 71.48 | 28.52 |
| Object to state | 13,978 | 8,748 | 5,230 | 2.85 | 3.25 | 2.37 | 62.58 | 37.42 |
Table IV. Table IV. Showing the Number of Persons, Males, and Females (exclusive of Maoris) of different Religions in the Colony of New Zealand, and exhibiting in detail the Subdivisions of the various Groups of Religions given in the other Tables.
| Religious Denominations. | Persons. | Males. | Females. |
|---|---|---|---|
* In addition to the Presbyterian bodies stated above, belonging to each of which large numbers of persons were returned, the following designations of Presbyterians were found in the Census: Calvinistic Presbyterians, Covenanters, Episcopal Presbyterians, English Presbyterians, First Church, Independent Presbyterians, Irish Presbyterians, John Knox Presbyterians, Old Established Presbyterians, Old Church, Orthodox Presbyterians, Old Presbyterians, Old-Light Presbyterians, Original Seceders, Old Scotch Presbyterians, Presbyterian Church of America, Presbyterian Church of Ireland, Presbyterian Huguenôt, Prussian Presbyterians, Presbyterian Church of Victoria, Seceder, Scotch Presbyterians, Trinity Presbyterians, United Seceders, United Irish Presbyterians, Welsh Presbyterians, Presbyterian Church of Geneva, Catholic Presbyterians, Congregational Presbyterians, Danish Presbyterians, High Presbyterians, Primitive Presbyterians, Swiss Presbyterians, Old Form Presbyterians. † Seventy-three of the Chinese population of the colony were returned as professing Christianity: they belonged to the under-mentioned denominations: Church of England, 46 males, 2 females; Protestants undefined, 3 males; Presbyterians, 7 males, 2 females; Wesleyans, 6 males; Roman Catholics, 7 males. The rest were Pagans or Confucians, | |||
| Total Population | 489,933 | 269,605 | 220,328 |
| Episcopalians— | |||
| Church of England—Episcopalians (not otherwise defined) | 200,816 | 110,090 | 90,726 |
| Protestants (not otherwise defined) | 2,517 | 1,563 | 954 |
| Presbyterians*— | |||
| Church of Scotland, Free Church of Scotland, Free Presbyterians, Presbyterian Church of New Zealand, Presbyterian Church of Otago and Southland, and Presbyterians otherwise defined | 113,038 | 61,506 | 51,532 |
| Reformed Presbyterians | 70 | 37 | 33 |
| Methodists— | |||
| Wesleyan Methodists | 39,544 | 20,202 | 19,342 |
| Primitive Methodists | 4,643 | 2,384 | 2,259 |
| United Methodist Free Churches—Free Methodists — United Methodists | 2,009 | 1,015 | 994 |
| Bible Christians | 375 | 199 | 176 |
| New Connection Methodists | 31 | 15 | 16 |
| Congregational Methodists | 15 | 7 | 8 |
| Independent Methodists | 23 | 12 | 11 |
| Others | 17 | 11 | 6 |
| Baptists | 11,476 | 5,785 | 5,691 |
| Congregational Independents | 6,699 | 3,449 | 3,250 |
| Lutherans | 5,773 | 3,703 | 2,070 |
| Unitarians | 489 | 331 | 158 |
| Society of Friends | 232 | 153 | 79 |
| Catholic Apostolic | 121 | 68 | 53 |
| Other Protestants— | |||
| Adventist | 1 | 1 | … |
| Believers in Christ | 30 | 7 | 23 |
| Brethren— | |||
| Christian Brethren | 743 | 357 | 386 |
| Brethren | 571 | 287 | 284 |
| Exclusive Brethren | 19 | 9 | 10 |
| Open Brethren | 10 | 4 | 6 |
| Plymouth Brethren | 624 | 297 | 327 |
| Christadelphian | 509 | 257 | 252 |
| Church of Christ— | |||
| Christian Church of Christ | 2,369 | 1,236 | 1,133 |
| Christian Disciples | 210 | 102 | 108 |
| Disciples of Christ | 277 | 136 | 141 |
| Disciples | 17 | 12 | 5 |
| Calvinists—Calvinistic Methodists | 66 | 46 | 20 |
| Dissenters | 158 | 98 | 60 |
| Dutch Reformed Church | 1 | … | 1 |
| Evangelists — Evangelical Union, Evangelical Church, Evangelical Christians, Evangelical Brethren | 81 | 48 | 33 |
| Followers of Christ | 7 | 4 | 3 |
| Free Gospel Church | 2 | 1 | 1 |
| French Protestant—Huguenôt | 1 | … | 1 |
| Israelite—Christian Israelite | 66 | 39 | 27 |
| Lord's People | 6 | 4 | 2 |
| Members of Christ's Body | 5 | 4 | 1 |
| Moravians—United Brethren | 32 | 18 | 14 |
| Morrisonians | 8 | 6 | 2 |
| New Church (see also Swedenborgians) | 39 | 28 | 11 |
| New Jerusalem Church (see also Swedenborgians) | 8 | 5 | 3 |
| Nonconformists | 96 | 61 | 35 |
| Reformists — Reformed Church | 3 | 3 | … |
| Saints in Jesus | 5 | 2 | 3 |
| Second Adventists | 10 | 4 | 6 |
| Shakers | 8 | 6 | 2 |
| Swiss Protestants | 14 | 5 | 9 |
| Swedenborgians (see also New Church, New Jerusalem Church, ante) | 64 | 36 | 28 |
| Others | 23 | 11 | 12 |
| Catholics— | |||
| Roman Catholics | 68,349 | 36,593 | 31,756 |
| Catholics undefined | 635 | 370 | 265 |
| Greek Church | 55 | 55 | … |
| Latter-Day Saints or Mormons | 271 | 157 | 114 |
| Jews | 1,536 | 844 | 692 |
| Mahometans | 7 | 7 | … |
| Pagans† | 4,936 | 4,931 | 5 |
| Other Denominations— | |||
| Peculiar People | 8 | 3 | 5 |
| Spiritualists | 146 | 78 | 68 |
| Universalists | 55 | 36 | 19 |
| Others | 28 | 19 | 9 |
| No Denomination— | |||
| Christian of no Denomination | 236 | 132 | 104 |
| Church of God | 89 | 37 | 52 |
| No Denomination (so returned) | 1,025 | 630 | 395 |
| Unsectarian | 235 | 120 | 115 |
| Others | 27 | 11 | 16 |
| Of no defined Religious Belief, or described by Unmeaning Terms— | |||
| Agnostic | 33 | 25 | 8 |
| Deists—Theists | 61 | 54 | 7 |
| Doubling—Doubtful—Do not know—Cannot tell —Uncertain | 107 | 79 | 28 |
| Freethinkers | 2,422 | 1,790 | 632 |
| Free to choose | 6 | 2 | 4 |
| Others, chiefly unmeaning | 116 | 86 | 30 |
| No Religion— | |||
| Atheist | 47 | 39 | 8 |
| Materialist | 7 | 5 | 2 |
| No Religion (so returned) | 104 | 69 | 35 |
| Secularist | 96 | 55 | 41 |
| Others | 18 | 16 | 2 |
| Unspecified | 1,329 | 950 | 379 |
| Object to state | 13,978 | 8,748 | 5,230 |
Table V. Table V. Showing the Number of Persons, Males, and Females (exclusive of Maoris) of different Religions in the Colony of New Zealand, in Boroughs, and Outside Boroughs.
| Religious Denominations. | The Colony.* | Boroughs. | Outside Boroughs. | ||||||
|---|---|---|---|---|---|---|---|---|---|
| Persons. | Males. | Females. | Persons. | Males. | Females. | Persons. | Males. | Females. | |
* The numbers for “ The Colony ” arc the additions of the “ Boroughs ” and “ Outside Boroughs ” populations. Details of the population of the Boroughs will be found in Table VIII. † Detailed particulars are given in Table IV, | |||||||||
| Total Population | 489,933 | 269,605 | 220,328 | 194,981 | 99,605 | 95,376 | 294,952 | 170,000 | 124,952 |
| Total of Specified Beliefs | 488,604 | 268,655 | 219,949 | 194,377 | 99,248 | 95,129 | 294,227 | 169,407 | 124,820 |
| Episcopalians— | |||||||||
| Church of England—Episcopalians (not otherwise defined) | 200,8l6 | 110,090 | 90,726 | 79,198 | 40,704 | 38,494 | 121,618 | 69,386 | 52,232 |
| Protestants (not otherwise defined) | 2,517 | 1,563 | 954 | 1,292 | 757 | 535 | 1,225 | 806 | 419 |
| Presbyterians— | |||||||||
| Church of Scotland, Free Church of Scotland, Free Presbyterians, Presbyterian Church of New Zealand, Presbyterian Church of Otago and Southland, and Presbyterians otherwise defined | 113,038 | 61,506 | 51,532 | 41,368 | 20,857 | 20,511 | 71,670 | 40,649 | 31,021 |
| Reformed Presbyterians | 70 | 37 | 33 | 21 | 12 | 9 | 49 | 25 | 24 |
| Methodists— | |||||||||
| Wesleyan Methodists | 39,544 | 20,202 | 19,342 | 16,724 | 8,224 | 8,500 | 22,820 | 11,978 | 10,842 |
| Primitive Methodists | 4,643 | 2,384 | 2,259 | 2,241 | 1,107 | 1,134 | 2,402 | 1,277 | 1,125 |
| United Methodist Free Churches— | |||||||||
| Free Methodists—United Methodists | 2,009 | 1,015 | 994 | 1,076 | 529 | 547 | 933 | 486 | 447 |
| Bible Christians | 375 | 199 | 176 | 144 | 78 | 66 | 231 | 121 | 110 |
| New Connection Methodists | 31 | 15 | 16 | 21 | 8 | 13 | 10 | 7 | 3 |
| Others† | 55 | 30 | 25 | 27 | 12 | 15 | 28 | 18 | 10 |
| Other Protestants — | |||||||||
| Baptists | 11,476 | 5,785 | 5,691 | 5,603 | 2,715 | 2,888 | 5,873 | 3,070 | 2,803 |
| Congregational Independents | 6,699 | 3,449 | 3,250 | 3,716 | 1,842 | 1,874 | 2,983 | 1,607 | 1,376 |
| Lutherans | 5,773 | 3,703 | 2,070 | 1,225 | 755 | 470 | 4,548 | 2,948 | 1,600 |
| Unitarians | 489 | 331 | 158 | 196 | 129 | 67 | 293 | 202 | 91 |
| Society of Friends | 232 | 153 | 79 | 100 | 61 | 39 | 132 | 92 | 40 |
| Catholic Apostolic | 121 | 68 | 53 | 79 | 43 | 36 | 42 | 25 | 17 |
| Others† | 6,083 | 3,134 | 2,949 | 3,169 | 1,591 | 1,578 | 2,914 | 1,543 | 1,371 |
| Catholics— | |||||||||
| Roman Catholics | 68,349 | 36,593 | 31,756 | 27,781 | 13,149 | 14,632 | 40,568 | 23,444 | 17,124 |
| Catholics undefined | 635 | 370 | 265 | 286 | 165 | 121 | 349 | 205 | 144 |
| Greek Church | 55 | 55 | … | 13 | 13 | … | 42 | 42 | … |
| Other Denominations— | |||||||||
| Latter-Day Saints or Mormons | 271 | 157 | 114 | 94 | 47 | 47 | 177 | 110 | 67 |
| Jews | 1,536 | 844 | 692 | 1,303 | 710 | 593 | 233 | 134 | 99 |
| Mahometans | 7 | 7 | … | 1 | 1 | … | 6 | 6 | … |
| Pagans | 4,936 | 4,931 | 5 | 771 | 766 | 5 | 4,165 | 4,165 | … |
| Others† | 237 | 136 | 101 | 98 | 45 | 53 | 139 | 91 | 48 |
| No Denomination† | 4,357 | 2,966 | 1,391 | 2,398 | 1,621 | 777 | 1,959 | 1,345 | 614 |
| No Religion† | 272 | 184 | 88 | 143 | 88 | 55 | 129 | 96 | 33 |
| Unspecified | 1,329 | 950 | 379 | 604 | 357 | 247 | 725 | 593 | 132 |
| Object to state | 13,978 | 8,748 | 5,230 | 5,289 | 3,219 | 2,070 | 8,689 | 5,529 | 3,160 |
Table VI. Table VI. Showing the Religions of Persons, Males, and Females (exclusive of Maoris) in each Provincial District.
| Religious Denominations. | Total of New Zealand. | Auckland. | Taranaki. | Wellington. | Hawke's Bay. | Marlborough. | Nelson. | Westland. | Canterbury. | Otago. | Chatham Islands. | ||||||||||||||||||||||
|---|---|---|---|---|---|---|---|---|---|---|---|---|---|---|---|---|---|---|---|---|---|---|---|---|---|---|---|---|---|---|---|---|---|
| Persons. | Males. | Females. | Persons. | Males. | Females. | Persons. | Males. | Females. | Persons. | Males. | Females. | Persons. | Males. | Females. | Persons. | Males. | Females. | Persons. | Males. | Females. | Persons. | Males. | Females. | Persons. | Males. | Females. | Persons. | Males. | Females. | Persons. | Males. | Females. | |
* Including Free Methodists and United Methodists. † Detailed particulars are given in Table IV. | |||||||||||||||||||||||||||||||||
| Total | 489,933 | 269,605 | 220,328 | 99,451 | 54,111 | 45,340 | 14,858 | 8,517 | 6,341 | 61,371 | 32,717 | 28,654 | 17,367 | 9,700 | 7,667 | 9,300 | 5,249 | 4,051 | 26,075 | 14,800 | 11,275 | 15,010 | 9,075 | 5,935 | 112,l82 | 60,590 | 51,592 | 134,077 | 74,685 | 59,392 | 242 | 161 | 81 |
| Episcopalians— | |||||||||||||||||||||||||||||||||
| Church of England—Episcopalians (not otherwise denned) | 200,8l6 | 110,090 | 90,726 | 44,831 | 24,656 | 20,175 | 7,402 | 4,223 | 3,179 | 29,442 | 15,773 | 13,669 | 7,994 | 4,430 | 3,564 | 5,061 | 2,858 | 2,203 | 11,009 | 6,070 | 4,939 | 5,314 | 3,108 | 2,206 | 54,362 | 29,248 | 25,114 | 35,263 | 19,642 | 15,621 | 138 | 82 | 56 |
| Protestants (not otherwise defined) | 2,517 | 1,563 | 954 | 122 | 89 | 33 | 229 | 130 | 99 | 429 | 276 | 153 | 460 | 295 | 165 | 3 | 1 | 2 | 253 | 140 | 113 | 15 | 8 | 7 | 154 | 101 | 53 | 851 | 523 | 328 | 1 | … | 1 |
| Presbyterians— | |||||||||||||||||||||||||||||||||
| Church of Scotland, Free Church of Scotland, Free Presbyterians, Presbyterian Church of New Zealand, Presbyterian Church of Otago and Southland, and Presbyterians otherwise described | 113,038 | 61,506 | 51,532 | 17,020 | 9,169 | 7,851 | 1,449 | 839 | 610 | 8,664 | 4,635 | 4,029 | 2,819 | 1,547 | 1,272 | 1,313 | 713 | 600 | 2,821 | 1,718 | 1,103 | 2,313 | 1,417 | 896 | 19,919 | 10,885 | 9,034 | 56,685 | 30,557 | 26,128 | 35 | 26 | 9 |
| Reformed Presbyterians | 70 | 37 | 33 | 21 | 11 | 10 | 1 | 1 | … | … | … | … | 1 | 1 | … | … | … | … | 8 | 4 | 4 | … | … | … | 13 | 8 | 5 | 26 | 12 | 14 | … | … | … |
| Methodists— | |||||||||||||||||||||||||||||||||
| Wesleyan Methodists | 39,544 | 20,202 | 19,342 | 8,363 | 4,330 | 4,033 | 1,865 | 976 | 889 | 6,591 | 3,272 | 3,319 | 1,007 | 530 | 477 | 874 | 472 | 402 | 2,509 | 1,235 | 1,274 | 765 | 390 | 375 | 11,712 | 5,957 | 5,755 | 5,858 | 3,040 | 2,818 | … | … | … |
| Primitive Methodists | 4,643 | 2,384 | 2,259 | 993 | 514 | 479 | 480 | 245 | 235 | 753 | 374 | 379 | 54 | 33 | 21 | 10 | 8 | 2 | 41 | 25 | 16 | … | … | … | 1,313 | 693 | 620 | 998 | 491 | 507 | 1 | 1 | … |
| United Methodist Free Churches* | 2,009 | 1,015 | 994 | 443 | 210 | 233 | 10 | 7 | 3 | 184 | 82 | 102 | 246 | 123 | 123 | … | … | … | 105 | 61 | 44 | 3 | 1 | 2 | 998 | 516 | 482 | 20 | 15 | 5 | … | … | … |
| Bible Christians | 375 | 199 | 176 | 42 | 25 | 17 | 9 | 2 | 7 | 15 | 13 | 2 | 1 | 1 | … | 3 | 2 | 1 | 3 | 3 | … | 2 | 2 | … | 255 | 126 | 129 | 45 | 25 | 20 | … | … | … |
| New Connection Methodists | 31 | 15 | 16 | 5 | 2 | 3 | … | … | … | 5 | 4 | 1 | … | … | … | … | … | … | … | … | … | … | … | … | 5 | 2 | 3 | 16 | 7 | 9 | … | … | … |
| Others† | 55 | 30 | 25 | 8 | 5 | 3 | … | … | … | 16 | 8 | 8 | … | … | … | … | … | … | … | … | … | … | … | … | 19 | 10 | 9 | 12 | 7 | 5 | … | … | … |
| Other Protestants— | |||||||||||||||||||||||||||||||||
| Baptists | 11,476 | 5,785 | 5,691 | 2,583 | 1,280 | 1,303 | 213 | 112 | 101 | 1,288 | 640 | 648 | 167 | 105 | 62 | 111 | 60 | 51 | 690 | 357 | 333 | 79 | 50 | 29 | 2,789 | 1,407 | 1,382 | 3,555 | 1,774 | 1,781 | 1 | … | 1 |
| Congregational Independents | 6,699 | 3,449 | 3,250 | 1,969 | 1,045 | 924 | 67 | 38 | 29 | 612 | 314 | 298 | 65 | 38 | 27 | 35 | 13 | 22 | 402 | 260 | 232 | 43 | 30 | 13 | 1,536 | 763 | 773 | 1,874 | 942 | 932 | 6 | 6 | … |
| Lutherans | 5,773 | 3,703 | 2,070 | 392 | 312 | 80 | 189 | 121 | 68 | 1,525 | 895 | 630 | 1,143 | 622 | 521 | 72 | 59 | 13 | 728 | 457 | 271 | 368 | 292 | 76 | 673 | 433 | 240 | 666 | 501 | 165 | 17 | 11 | 6 |
| Unitarians | 489 | 331 | 158 | 163 | 106 | 57 | 28 | l8 | 10 | 73 | 47 | 26 | 30 | 18 | 12 | 8 | 6 | 2 | 17 | 12 | 5 | 9 | 9 | … | 61 | 41 | 20 | 93 | 69 | 24 | 7 | 5 | 2 |
| Society of Friends | 232 | 153 | 79 | 102 | 64 | 38 | 3 | 3 | … | 36 | 22 | 14 | 10 | 8 | 2 | 2 | 2 | … | 7 | 7 | … | 8 | 6 | 2 | 20 | 15 | 5 | 44 | 26 | 18 | … | … | … |
| Catholic Apostolic | 121 | 68 | 53 | 16 | 10 | 6 | … | … | … | 60 | 28 | 32 | 1 | 1 | … | 2 | 2 | … | … | … | … | … | … | … | 23 | 12 | 11 | 19 | 15 | 4 | … | … | … |
| Others† | 6,083 | 3,134 | 2,949 | 1,175 | 597 | 578 | 71 | 37 | 34 | 884 | 460 | 424 | 67 | 42 | 25 | 43 | 28 | 15 | 440 | 234 | 206 | 105 | 55 | 50 | 930 | 486 | 444 | 2,363 | 1,194 | 1,169 | 5 | 1 | 4 |
| Catholics— | |||||||||||||||||||||||||||||||||
| Roman Catholics | 68,349 | 36,593 | 31,756 | 16,543 | 8,713 | 7,830 | 2,077 | 1,267 | 810 | 7,718 | 3,957 | 3,761 | 2,436 | 1,333 | 1,103 | 1,467 | 812 | 655 | 4,166 | 2,352 | 1,814 | 4,779 | 2,606 | 2,173 | 12,946 | 7,005 | 5,941 | 16,199 | 8,530 | 7,669 | 18 | 18 | … |
| Catholics undefined | 635 | 370 | 265 | 55 | 35 | 20 | 26 | 11 | 15 | 69 | 51 | 18 | 115 | 64 | 51 | 3 | 2 | 1 | 84 | 48 | 36 | … | … | … | 64 | 36 | 28 | 219 | 123 | 96 | … | … | … |
| Greek Church | 55 | 55 | … | 10 | 10 | … | 2 | 2 | … | 11 | 11 | … | 4 | 4 | … | … | … | … | 13 | 13 | … | 3 | 3 | … | 4 | 4 | … | 8 | 8 | … | … | … | … |
| Other Denominations— | |||||||||||||||||||||||||||||||||
| Latter-Day Saints or Mormons | 271 | 157 | 114 | 93 | 48 | 45 | … | … | … | 38 | 25 | 13 | 30 | 16 | 14 | 1 | 1 | … | 1 | 1 | … | 4 | 4 | … | 85 | 50 | 35 | 19 | 12 | 7 | … | … | … |
| Jews | 1,536 | 844 | 692 | 373 | 209 | 164 | 12 | 11 | 1 | 290 | 151 | 139 | 42 | 23 | 19 | 8 | 8 | … | 46 | 29 | 17 | 68 | 47 | 21 | 310 | 165 | 145 | 387 | 201 | 186 | … | … | … |
| Mahometans | 7 | 7 | … | … | … | … | … | … | … | … | … | … | … | … | … | … | … | … | … | … | … | … | … | … | 6 | 6 | … | 1 | 1 | … | … | … | … |
| Pagans | 4,936 | 4,931 | 5 | 108 | 105 | 3 | 7 | 7 | … | 76 | 76 | … | … | … | … | … | … | … | 450 | 450 | … | 754 | 754 | … | 133 | 133 | … | 3,406 | 3,404 | 2 | 2 | 2 | … |
| Others† | 237 | 136 | 101 | 50 | 33 | 17 | … | … | … | 24 | 12 | 12 | 2 | 1 | 1 | 1 | 1 | … | 25 | 17 | 8 | … | … | … | 27 | 17 | 10 | 108 | 55 | 53 | … | … | … |
| No Denomination† | 4,357 | 2,966 | 1,391 | 855 | 557 | 298 | 147 | 97 | 50 | 391 | 264 | 127 | 105 | 74 | 33 | 70 | 45 | 25 | 329 | 206 | 123 | 91 | 70 | 21 | 595 | 425 | 170 | 1,773 | 1,228 | 545 | 1 | … | 1 |
| No Religion† | 272 | 184 | 88 | 52 | 31 | 21 | 14 | 9 | 5 | 47 | 33 | 14 | 2 | 2 | … | 18 | 12 | 6 | 50 | 30 | 20 | 14 | 11 | 3 | 31 | 25 | 6 | 44 | 31 | 13 | … | … | … |
| Unspecified | 1,329 | 950 | 379 | 86 | 59 | 27 | 62 | 46 | 16 | 287 | 172 | 115 | 113 | 84 | 29 | 10 | 9 | 1 | 105 | 70 | 35 | 32 | 23 | 9 | 275 | 233 | 42 | 359 | 254 | 105 | … | … | … |
| Object to state | 13,978 | 8,748 | 5,230 | 2,978 | 1,886 | 1,092 | 495 | 315 | 180 | 1,843 | 1,122 | 721 | 453 | 305 | 148 | 185 | 135 | 50 | 1,683 | 1,001 | 682 | 241 | 189 | 52 | 2,924 | 1,788 | 1,136 | 3,166 | 1,998 | 1,168 | 10 | 9 | 1 |
Table VII. Table VII. Showing the Religions of Persons, Males, and Females (exclusive of Maoris) in each County.
| Religious Denominations. | Mongonui. | Bay of Islands. | Hokianga. | Hobson. | Whangarei. | Rodney. | Waitemata. | ||||||||||||||
|---|---|---|---|---|---|---|---|---|---|---|---|---|---|---|---|---|---|---|---|---|---|
| Persons. | Males. | Females. | Persons. | Males. | Females. | Persons. | Males. | Females. | Persons. | Males. | Females. | Persons. | Males. | Females. | Persons. | Males. | Females. | Persons. | Males. | Females. | |
| Total | 1,471 | 871 | 600 | 2,184 | 1,258 | 926 | 587 | 367 | 220 | 2,851 | 1,754 | 1,097 | 3,953 | 2,245 | 1,708 | 3,287 | 1,802 | 1,485 | 4,522 | 2,608 | 1,914 |
| Episcopalians— | |||||||||||||||||||||
| Church of England—Episcopalians (not otherwise defined) | 830 | 488 | 342 | 1,352 | 733 | 619 | 329 | 191 | 138 | 1,210 | 748 | 462 | 1,314 | 765 | 549 | 1,268 | 719 | 549 | 2,344 | 1,385 | 959 |
| Protestants (not otherwise defined) | … | … | … | 6 | 5 | 1 | … | … | … | 4 | 4 | … | 4 | 4 | … | … | … | … | 4 | 4 | … |
| Presbyterians— | |||||||||||||||||||||
| Church of Scotland, Free Church of Scotland, Free Presbyterians, Presbyterian Church of New Zealand, Presbyterian Church of Otago and Southland, and Presbyterians otherwise described | 157 | 99 | 58 | 241 | 150 | 91 | 54 | 41 | 13 | 341 | 229 | 112 | 1,687 | 905 | 782 | 584 | 309 | 275 | 818 | 439 | 379 |
| Reformed Presbyterians | … | … | … | 3 | … | 3 | … | … | … | … | … | … | 2 | … | 2 | … | … | … | … | … | … |
| Methodists— | |||||||||||||||||||||
| Wesleyan Methodists | 182 | 99 | 83 | 189 | 99 | 90 | 60 | 28 | 32 | 360 | 204 | 156 | 195 | 146 | 149 | 306 | 146 | 160 | 331 | 180 | 151 |
| Primitive Methodists | 7 | 4 | 3 | 9 | 7 | 2 | … | … | … | 4 | 2 | 2 | 7 | 2 | 5 | 16 | 9 | 7 | 24 | 12 | 12 |
| United Methodist Free Churches | … | … | … | … | … | … | … | … | … | … | … | … | 1 | 1 | … | 31 | 14 | 17 | 20 | 4 | 16 |
| Bible Christians | 7 | 6 | 1 | … | … | … | … | … | … | 1 | 1 | … | … | … | … | 12 | 8 | 4 | … | … | … |
| New Connection Methodists | … | … | … | … | … | … | … | … | … | … | … | … | … | … | … | … | … | … | … | … | … |
| Others | … | … | … | 1 | 1 | … | … | … | … | … | … | … | … | … | … | … | … | … | … | … | … |
| Other Protestants— | |||||||||||||||||||||
| Baptists | 20 | 13 | 7 | 14 | 11 | 3 | 8 | 6 | 2 | 70 | 40 | 30 | 28 | 18 | 10 | 74 | 35 | 39 | 101 | 59 | 42 |
| Congregational Independents | 7 | 6 | 1 | 7 | 5 | 2 | 2 | 1 | 1 | 187 | 98 | 89 | 18 | 11 | 7 | 55 | 34 | 21 | 56 | 33 | 23 |
| Lutherans | 5 | 5 | … | 4 | 3 | 1 | 3 | 3 | … | 16 | 14 | 2 | 25 | 18 | 7 | 22 | 17 | 5 | 40 | 29 | 11 |
| Unitarians | 1 | 1 | … | 10 | 6 | 4 | … | … | … | 26 | 18 | 8 | 3 | 2 | 1 | 3 | 2 | 1 | 10 | 9 | 1 |
| Society of Friends | 2 | 2 | … | … | … | … | 2 | 2 | … | 3 | 3 | … | 9 | 7 | 2 | 5 | 2 | 3 | 7 | 2 | 5 |
| Catholic Apostolic | … | … | … | … | … | … | … | … | … | … | … | … | … | … | … | 1 | … | 1 | … | … | … |
| Others | 2 | … | 2 | 8 | 3 | 5 | … | … | … | 48 | 26 | 22 | 68 | 34 | 34 | 144 | 64 | 80 | 39 | 21 | 18 |
| Catholics— | |||||||||||||||||||||
| Roman Catholics | 129 | 85 | 44 | 247 | 174 | 73 | 100 | 72 | 28 | 301 | 198 | 103 | 276 | 181 | 95 | 451 | 243 | 208 | 592 | 334 | 258 |
| Catholics undefined | … | … | … | 1 | 1 | … | 5 | 5 | … | 4 | … | 4 | 1 | 1 | … | … | … | … | 1 | … | 1 |
| Greek Church | … | … | … | … | … | … | … | … | … | 3 | 3 | … | … | … | … | … | … | … | … | … | … |
| Other Denominations— | |||||||||||||||||||||
| Latter-Day Saints or Mormons | … | … | … | … | … | … | … | … | … | … | … | … | … | … | … | … | … | … | 9 | 6 | 3 |
| Jews | 4 | 3 | 1 | … | … | … | … | … | … | … | … | … | … | … | … | … | … | … | 4 | 2 | 2 |
| Mahometans | … | … | … | … | … | … | … | … | … | … | … | … | … | … | … | … | … | … | … | … | … |
| Pagans | … | … | … | 1 | 1 | … | … | … | … | … | … | … | … | … | … | … | … | … | … | … | … |
| Others | … | … | … | 2 | 2 | … | 1 | 1 | … | 1 | 1 | … | 4 | 3 | 1 | 1 | 1 | … | … | … | … |
| No Denomination | 38 | 19 | 19 | 10 | 6 | 4 | … | … | … | 33 | 17 | 16 | 27 | 22 | 5 | 44 | 29 | 15 | 25 | 19 | 6 |
| No Religion | … | … | … | … | … | … | 4 | 3 | 1 | 2 | 2 | … | 1 | 1 | … | 1 | 1 | … | 2 | 2 | … |
| Unspecified | 1 | 1 | … | 3 | 2 | 1 | 1 | 1 | … | 12 | 7 | 5 | 7 | 7 | … | 2 | 2 | … | 2 | … | 2 |
| Object to state | 79 | 40 | 39 | 76 | 49 | 27 | 18 | 13 | 5 | 225 | 139 | 86 | 276 | 117 | 59 | 267 | 167 | 100 | 93 | 68 | 25 |
Table VII. Table VII. Showing the Religions of Persons, Males, and Females (exclusive of Maoris) in each County—
| Religious Denominations. | Eden. | Manukau. | Coromandel. | Thames. | Piako. | Tauranga. | Whakatane. | ||||||||||||||
|---|---|---|---|---|---|---|---|---|---|---|---|---|---|---|---|---|---|---|---|---|---|
| Persons. | Males. | Females. | Persons. | Males. | Females. | Persons. | Males. | Females. | Persons. | Males. | Females. | Persons. | Males. | Females. | Persons. | Males. | Females. | Persons. | Males. | Females. | |
| Total | 17,593 | 8,785 | 8,808 | 10,274 | 5,416 | 4,858 | 2,153 | 1,355 | 798 | 5,179 | 2,935 | 2,244 | 981 | 713 | 268 | 2,599 | 1,447 | 1,152 | 913 | 527 | 386 |
| Episcopalians— | |||||||||||||||||||||
| Church of England—Episcopalians (not otherwise defined) | 7,692 | 3,874 | 3,818 | 4,245 | 2,276 | 1,969 | 938 | 586 | 352 | 2,033 | 1,196 | 837 | 522 | 370 | 152 | 1,440 | 799 | 641 | 477 | 268 | 209 |
| Protestants (net otherwise defined) | … | … | … | 10 | 4 | 6 | … | … | … | 1 | 1 | … | … | … | … | … | … | … | … | … | … |
| Presbyterians— | |||||||||||||||||||||
| Church of Scotland, Free Church of Scotland, Free Presbyterians, Presbyterian Church of New Zealand, Presbyterian Church of Otago and Southland, and Presbyterians otherwise described | 2,781 | 1,380 | 1,401 | 2,664 | 1,378 | 1,286 | 341 | 205 | 136 | 748 | 448 | 300 | 163 | 109 | 54 | 424 | 234 | 190 | 175 | 107 | 68 |
| Reformed Presbyterians | … | … | … | 5 | 3 | 2 | … | … | … | … | … | … | … | … | … | 2 | 1 | 1 | … | … | … |
| Methodists— | |||||||||||||||||||||
| Wesleyan Methodists | 1,606 | 779 | 827 | 765 | 416 | 349 | 125 | 71 | 54 | 697 | 344 | 353 | 73 | 49 | 24 | 140 | 72 | 68 | 18 | 12 | 6 |
| Primitive Methodists | 273 | 148 | 125 | 20 | 10 | 10 | … | … | … | 187 | 84 | 103 | … | … | … | 1 | 1 | … | … | … | … |
| United Methodist Free Churches | 171 | 83 | 88 | 1 | 1 | … | … | … | … | 8 | 5 | 3 | … | … | … | 1 | … | 1 | … | … | … |
| Bible Christians | 8 | 3 | 5 | 1 | 1 | … | … | … | … | … | … | … | … | … | … | … | … | … | … | … | … |
| New Connection Methodists | 1 | 1 | … | … | … | … | … | … | … | … | … | … | … | … | … | … | … | … | … | … | … |
| Others | … | … | … | … | … | … | … | … | … | … | … | … | … | … | … | … | … | … | … | … | … |
| Other Protestants— | |||||||||||||||||||||
| Baptists | 740 | 355 | 385 | 180 | 85 | 95 | 42 | 29 | 13 | 217 | 109 | 108 | 16 | 14 | 2 | 27 | 12 | 15 | 4 | 2 | 2 |
| Congregational Independents | 591 | 287 | 304 | 76 | 38 | 38 | 35 | 21 | 14 | 107 | 48 | 59 | 15 | 14 | 1 | 25 | 20 | 5 | 3 | 3 | … |
| Lutherans | 23 | 17 | 6 | 24 | 17 | 7 | 9 | 9 | … | 27 | 24 | 3 | 5 | 5 | … | 6 | 6 | … | … | … | … |
| Unitarians | 9 | 5 | 4 | 2 | 2 | … | 2 | 1 | 1 | 4 | 3 | 1 | … | … | … | 5 | 2 | 3 | … | … | … |
| Society of Friends | 7 | 4 | 3 | 1 | 1 | … | 2 | 2 | … | 9 | 5 | 4 | 1 | 1 | … | 8 | 4 | 4 | 1 | 1 | … |
| Catholic Apostolic | 2 | … | 2 | … | … | … | 2 | … | 2 | … | … | … | … | … | … | … | … | … | … | … | … |
| Others | 344 | 185 | 159 | 81 | 44 | 37 | 2 | 2 | … | 33 | 19 | 14 | 1 | 1 | … | 72 | 33 | 39 | 1 | 1 | … |
| Catholics— | |||||||||||||||||||||
| Roman Catholics | 2,515 | 1,167 | 1,348 | 1,901 | 971 | 930 | 582 | 372 | 210 | 957 | 548 | 409 | 173 | 140 | 33 | 336 | 182 | 154 | 194 | 99 | 95 |
| Catholics undefined | … | … | … | … | … | … | … | … | … | … | … | … | … | … | … | … | … | … | … | … | … |
| Greek Church | … | … | … | … | … | … | 1 | 1 | … | … | … | … | … | … | … | … | … | … | … | … | … |
| Other Denominations— | |||||||||||||||||||||
| Latter-Day Saints or Mormons | 47 | 24 | 23 | … | … | … | 2 | 1 | 1 | 2 | 2 | … | … | … | … | … | … | … | … | … | … |
| Jews | 34 | 17 | 17 | … | … | … | 2 | 2 | … | 8 | 5 | 3 | 1 | 1 | … | 20 | 10 | 10 | … | … | … |
| Mahometans | … | … | … | … | … | … | … | … | … | … | … | … | … | … | … | … | … | … | … | … | … |
| Pagans | 20 | 20 | … | … | … | … | 1 | 1 | … | 7 | 7 | … | … | … | … | 1 | 1 | … | … | … | … |
| Others | 15 | 8 | 7 | 1 | 1 | … | 1 | 1 | … | 2 | 2 | … | … | … | … | 2 | 2 | … | 1 | 1 | … |
| No Denomination | 209 | 138 | 71 | 66 | 30 | 36 | 4 | 4 | … | 9 | 7 | 2 | … | … | … | 18 | 14 | 4 | 2 | 1 | 1 |
| No Religion | 15 | 6 | 9 | 1 | 1 | … | … | … | … | 5 | 2 | 3 | … | … | … | 1 | 1 | … | … | … | … |
| Unspecified | 6 | 5 | 1 | 1 | … | 1 | 2 | 2 | … | 7 | 5 | 2 | … | … | … | 8 | 5 | 3 | 2 | 2 | … |
| Object to state | 484 | 279 | 205 | 229 | 137 | 92 | 60 | 45 | 15 | 111 | 71 | 40 | 11 | 9 | 2 | 62 | 48 | 14 | 35 | 30 | 5 |
Table VII. Table VII. Showing the Religions of Persons, Males, and Females (exclusive of Maoris) in each County—
| Religious Denominations. | Cook. | Wairoa. | East Taupo. | West Taupo. | Waipa. | Waikato. | Raglan. | ||||||||||||||
|---|---|---|---|---|---|---|---|---|---|---|---|---|---|---|---|---|---|---|---|---|---|
| Persons. | Males. | Females. | Persons. | Males. | Females. | Persons. | Males. | Females. | Persons. | Males. | Females. | Persons. | Males. | Females. | Persons. | Males. | Females. | Persons. | Males. | Females. | |
| Total | 1,740 | 1,035 | 705 | 1,009 | 597 | 412 | 126 | 93 | 33 | 11 | 8 | 3 | 3,097 | 1,685 | 1,412 | 2,857 | 1,607 | 1,250 | 776 | 460 | 316 |
| Episcopalians— | |||||||||||||||||||||
| Church of England—Episcopalians (not otherwise defined) | 937 | 557 | 380 | 486 | 282 | 204 | 79 | 58 | 21 | 9 | 6 | 3 | 1,409 | 763 | 646 | 1,390 | 8l6 | 574 | 373 | 217 | 156 |
| Protestants (not otherwise defined) | 17 | 13 | 4 | 10 | 10 | … | … | … | … | … | … | … | 29 | 15 | 14 | 2 | 2 | … | … | … | … |
| Presbyterians— | |||||||||||||||||||||
| Church of Scotland, Free Church of Scotland, Free Presbyterians, Presbyterian Church of New Zealand, Presbyterian Church of Otago and Southland, and Presbyterians otherwise described | 349 | 201 | 148 | 262 | 151 | 111 | 15 | 11 | 4 | … | … | … | 478 | 263 | 215 | 566 | 298 | 268 | 123 | 73 | 50 |
| Reformed Presbyterians | 1 | 1 | … | … | … | … | … | … | … | … | … | … | … | … | … | … | … | … | … | … | … |
| Methodists— | |||||||||||||||||||||
| Wesleyan Methodists | 20 | 10 | 10 | 10 | 5 | 5 | 1 | 1 | … | … | … | … | 361 | 197 | 164 | 202 | 109 | 93 | 132 | 73 | 59 |
| Primitive Methodists | 1 | 1 | … | … | … | … | … | … | … | … | … | … | 2 | 1 | 1 | 8 | 5 | 3 | … | … | … |
| United Methodist Free Churches | 6 | 4 | 2 | 5 | 3 | 2 | … | … | … | … | … | … | … | … | … | … | … | … | … | … | … |
| Bible Christians | … | … | … | … | … | … | … | … | … | … | … | … | … | … | … | … | … | … | … | … | … |
| New Connection Methodists | … | … | … | … | … | … | … | … | … | … | … | … | … | … | … | … | … | … | … | … | … |
| Others | … | … | … | … | … | … | … | … | … | … | … | … | … | … | … | … | … | … | 1 | 1 | … |
| Other Protestants— | |||||||||||||||||||||
| Baptists | 13 | 11 | 2 | 2 | 1 | 1 | … | … | … | … | … | … | 41 | 18 | 23 | 46 | 24 | 22 | 11 | 6 | 5 |
| Congregational Independents | 20 | 11 | 9 | 5 | 3 | 2 | 1 | 1 | … | … | … | … | 62 | 28 | 34 | 20 | 12 | 8 | 13 | 8 | 5 |
| Lutherans | 9 | 5 | 4 | 10 | 6 | 4 | 1 | 1 | … | … | … | … | 15 | 8 | 7 | 7 | 4 | 3 | 3 | 1 | 2 |
| Unitarians | 3 | 2 | 1 | … | … | … | … | … | … | … | … | … | 7 | 4 | 3 | 32 | 17 | 15 | 1 | 1 | … |
| Society of Friends | 2 | 2 | … | … | … | … | … | … | … | … | … | … | … | … | … | … | … | … | 7 | 5 | 2 |
| Catholic Apostolic | … | … | … | … | … | … | … | … | … | … | … | … | 6 | 5 | 1 | … | … | … | … | … | … |
| Others | 2 | 2 | … | … | … | … | … | … | … | … | … | … | 22 | 9 | 13 | 19 | 10 | 9 | 6 | 3 | 3 |
| Catholics— | |||||||||||||||||||||
| Roman Catholics | 269 | 165 | 104 | 172 | 99 | 73 | 21 | 14 | 7 | 2 | 2 | … | 521 | 288 | 233 | 463 | 248 | 215 | 86 | 54 | 32 |
| Catholics undefined | … | … | … | … | … | … | 2 | 1 | 1 | … | … | … | … | … | … | 10 | 2 | 8 | 3 | 3 | … |
| Greek Church | … | … | … | 1 | 1 | … | … | … | … | … | … | … | … | … | … | 1 | 1 | … | … | … | … |
| Other Denominations— | |||||||||||||||||||||
| Latter-Day Saints or Mormons | … | … | … | … | … | … | … | … | … | … | … | … | … | … | … | … | … | … | … | … | … |
| Jews | 2 | 2 | … | … | … | … | … | … | … | … | … | … | 20 | 9 | 11 | 14 | 8 | 6 | … | … | … |
| Mahometans | … | … | … | … | … | … | … | … | … | … | … | … | … | … | … | … | … | … | … | … | … |
| Pagans | 1 | 1 | … | … | … | … | … | … | … | … | … | … | … | … | … | … | … | … | … | … | … |
| Others | 1 | 1 | … | … | … | … | … | … | … | … | … | … | 9 | 3 | 6 | 1 | 1 | … | … | … | … |
| No Denomination | 7 | 4 | 3 | 5 | 5 | … | 1 | 1 | … | … | … | … | 11 | 11 | … | 12 | 10 | 2 | 5 | 5 | … |
| No Religion | 1 | 1 | … | … | … | … | 1 | 1 | … | … | … | … | … | … | … | … | … | … | … | … | … |
| Unspecified | 12 | 6 | 6 | 8 | 5 | 3 | … | … | … | … | … | … | 5 | 3 | 2 | 3 | 3 | … | 1 | 1 | … |
| Object to state | 67 | 35 | 32 | 33 | 26 | 7 | 4 | 4 | … | … | … | … | 99 | 60 | 39 | 61 | 37 | 24 | 11 | 9 | 2 |
Table VII. Table VII. Showing the Religions of Persons, Males, and Females (exclusive of Maoris) in each County—
| Religious Denominations. | Kawhia. | Taranaki. | Patea. | Wanganui. | Rangitikei. | Manawatu. | Hutt. | ||||||||||||||
|---|---|---|---|---|---|---|---|---|---|---|---|---|---|---|---|---|---|---|---|---|---|
| Persons. | Males. | Females. | Persons. | Males. | Females. | Persons. | Males. | Females. | Persons. | Males. | Females. | Persons. | Males. | Females. | Persons. | Males. | Females. | Persons. | Males. | Females. | |
| Total | 108 | 59 | 49 | 6,820 | 3,930 | 2,890 | 5,789 | 3,490 | 2,299 | 3,456 | 1,935 | 1,521 | 3,311 | 1,828 | 1,483 | 7,372 | 4,147 | 3,225 | 7,858 | 4,200 | 3,658 |
| Episcopalians— | |||||||||||||||||||||
| Church of England—Episcopalians (not otherwise defined) | 91 | 47 | 44 | 3,514 | 2,011 | 1,503 | 2,552 | 1,563 | 989 | 1,469 | 816 | 653 | 1,407 | 795 | 6l2 | 3,337 | 1,880 | 1,457 | 4,516 | 2,417 | 2,099 |
| Protestants (not otherwise defined) | … | … | … | 85 | 48 | 37 | 13 | 5 | 8 | 15 | 12 | 3 | 13 | 9 | 4 | 6 | 6 | … | 32 | 19 | 13 |
| Presbyterians— | |||||||||||||||||||||
| Church of Scotland, Free Church of Scotland, Free Presbyterians, Presbyterian Church of New Zealand, Presbyterian Church of Otago and Southland, and Presbyterians otherwise described | … | … | … | 454 | 267 | 187 | 1,105 | 630 | 475 | 863 | 459 | 404 | 951 | 516 | 435 | 772 | 442 | 330 | 772 | 419 | 353 |
| Reformed Presbyterians | … | … | … | … | … | … | 1 | 1 | … | … | … | … | … | … | … | … | … | … | … | … | … |
| Methodists— | |||||||||||||||||||||
| Wesleyan Methodists | 9 | 5 | 4 | 964 | 512 | 452 | 503 | 282 | 221 | 272 | 145 | 127 | 371 | 179 | 192 | 941 | 487 | 454 | 819 | 404 | 415 |
| Primitive Methodists | … | … | … | 298 | 155 | 143 | 14 | 10 | 4 | 6 | 4 | 2 | … | … | … | 216 | 106 | 110 | 142 | 83 | 59 |
| United Methodist Free Churches | … | … | … | 8 | 5 | 3 | 2 | 2 | … | 1 | … | 1 | … | … | … | 3 | 2 | 1 | 8 | 4 | 4 |
| Bible Christians | … | … | … | 6 | 2 | 4 | … | … | … | … | … | … | … | … | … | 6 | 6 | … | … | … | … |
| New Connection Methodists | … | … | … | … | … | … | … | … | … | 2 | 1 | 1 | 2 | 2 | … | … | … | … | … | … | … |
| Others | … | … | … | … | … | … | … | … | … | … | … | … | … | … | … | … | … | … | … | … | … |
| Other Protestants— | |||||||||||||||||||||
| Baptists | … | … | … | 112 | 58 | 54 | 94 | 46 | 48 | 55 | 31 | 24 | 33 | 18 | 15 | 247 | 118 | 129 | 134 | 65 | 69 |
| Congregational Independents | … | … | … | 29 | 18 | 11 | 26 | 15 | 11 | 37 | 18 | 19 | 8 | 7 | 1 | 51 | 30 | 21 | 53 | 24 | 29 |
| Lutherans | … | … | … | 123 | 73 | 50 | 96 | 66 | 30 | 26 | 15 | 11 | 160 | 94 | 66 | 442 | 260 | 182 | 51 | 36 | 15 |
| Unitarians | … | … | … | 13 | 8 | 5 | 14 | 9 | 5 | 6 | 3 | 3 | 1 | … | 1 | 6 | 4 | 2 | 2 | 1 | 1 |
| Society of Friends | … | … | … | … | … | … | 2 | 2 | … | … | … | … | … | … | … | 6 | 3 | 3 | 6 | 4 | 2 |
| Catholic Apostolic | … | … | … | … | … | … | 3 | 1 | 2 | … | … | … | … | … | … | … | … | … | … | … | … |
| Others | … | … | … | 34 | 17 | 17 | 36 | 19 | 17 | 42 | 18 | 24 | 13 | 8 | 5 | 184 | 98 | 86 | 61 | 33 | 28 |
| Catholics— | |||||||||||||||||||||
| Roman Catholics | 8 | 7 | 1 | 811 | 522 | 289 | 1,058 | 645 | 413 | 513 | 303 | 210 | 320 | 177 | 143 | 764 | 452 | 312 | 931 | 478 | 453 |
| Catholics undefined | … | … | … | 14 | 8 | 6 | 2 | 2 | … | 11 | 11 | … | … | … | … | … | … | … | 14 | 12 | 2 |
| Greek Church | … | … | … | 2 | 2 | … | … | … | … | … | … | … | … | … | … | … | … | … | 2 | 2 | … |
| Other Denominations— | |||||||||||||||||||||
| Latter-Day Saints or Mormons | … | … | … | … | … | … | … | … | … | … | … | … | 1 | 1 | … | 2 | 2 | … | 9 | 4 | 5 |
| Jews | … | … | … | … | … | … | 4 | 4 | … | 3 | 2 | 1 | … | … | … | 9 | 7 | 2 | 1 | … | 1 |
| Mahometans | … | … | … | … | … | … | … | … | … | … | … | … | … | … | … | … | … | … | … | … | … |
| Pagans | … | … | … | 1 | 1 | … | 3 | 3 | … | 3 | 3 | … | 2 | 2 | … | 1 | 1 | … | 35 | 35 | … |
| Others | … | … | … | … | … | … | … | … | … | 5 | 2 | 3 | … | … | … | 2 | 1 | 1 | … | … | … |
| No Denomination | … | … | … | 77 | 52 | 25 | 51 | 38 | 13 | 10 | 8 | 2 | 10 | 5 | 5 | 59 | 36 | 23 | 21 | 15 | 6 |
| No Religion | … | … | … | 4 | 3 | 1 | 8 | 4 | 4 | … | … | … | 1 | 1 | … | 2 | 2 | … | 1 | 1 | … |
| Unspecified | … | … | … | 29 | 22 | 7 | 16 | 13 | 3 | 12 | 10 | 2 | 1 | 1 | … | 10 | 9 | 1 | 24 | 14 | 10 |
| Object to state | … | … | … | 242 | 146 | 96 | 186 | 130 | 56 | 105 | 74 | 31 | 17 | 13 | 4 | 306 | 195 | 111 | 224 | 130 | 94 |
Table VII. Table VII. Showing the Religions of Persons, Males, and Females (exclusive of Maoris) in each County—
| Religious Denominations. | Wairarapa West. | Wairarapa East. | Waipawa. | Hawke's Bay. | Sounds. | Marlborough. | Kaikoura. | ||||||||||||||
|---|---|---|---|---|---|---|---|---|---|---|---|---|---|---|---|---|---|---|---|---|---|
| Persons. | Males. | Females. | Persons. | Males. | Females. | Persons. | Males. | Females. | Persons. | Males. | Females. | Persons. | Males. | Females. | Persons. | Males. | Females. | Persons. | Males. | Females. | |
| Total | 5,759 | 3,167 | 2,592 | 1,475 | 1,046 | 429 | 5,867 | 3,411 | 2,456 | 4,879 | 2,857 | 2,022 | 605 | 364 | 241 | 4,680 | 2,767 | 1,913 | 1,105 | 671 | 434 |
| Episcopalians— | |||||||||||||||||||||
| Church of England—Episcopalians (not otherwise defined) | 2,942 | 1,629 | 1,313 | 851 | 595 | 256 | 2,378 | 1,388 | 990 | 2,654 | 1,521 | 1,133 | 331 | 195 | 136 | 2,439 | 1,462 | 977 | 583 | 356 | 227 |
| Protestants (not otherwise defined) | 49 | 28 | 21 | 4 | 4 | … | 252 | 144 | 108 | 60 | 42 | 18 | 2 | … | 2 | … | … | … | 1 | 1 | … |
| Presbyterians— | |||||||||||||||||||||
| Church of Scotland, Free Church of Scotland, Free Presbyterians, Presbyterian Church of New Zealand, Presbyterian Church of Otago and Southland, and Presbyterians otherwise described | 705 | 392 | 313 | 313 | 200 | 113 | 882 | 491 | 391 | 849 | 487 | 362 | 66 | 42 | 24 | 625 | 349 | 276 | 260 | 154 | 106 |
| Reformed Presbyterians. | … | … | … | … | … | … | … | … | … | … | … | … | … | … | … | … | … | … | … | … | … |
| Methodists— | |||||||||||||||||||||
| Wesleyan Methodists | 653 | 339 | 314 | 25 | 17 | 8 | 268 | 154 | 114 | 202 | 109 | 93 | 26 | 19 | 7 | 531 | 293 | 238 | 9 | 4 | 5 |
| Primitive Methodists | 4 | 2 | 2 | … | … | … | 48 | 29 | 19 | … | … | … | 1 | 1 | … | 6 | 5 | 1 | 2 | 2 | … |
| United Methodist Free Churches | 5 | 2 | 3 | … | … | … | 142 | 72 | 70 | 8 | 5 | 3 | … | … | … | … | … | … | … | … | … |
| Bible Christians | … | … | … | … | … | … | … | … | … | 1 | 1 | … | … | … | … | 3 | 2 | 1 | … | … | … |
| New Connection Methodists | … | … | … | … | … | … | … | … | … | … | … | … | … | … | … | … | … | … | … | … | … |
| Others | … | … | … | … | … | … | … | … | … | … | … | … | … | … | … | … | … | … | … | … | … |
| Other Protestants— | |||||||||||||||||||||
| Baptists | 142 | 78 | 64 | 18 | 11 | 7 | 67 | 49 | 18 | 31 | 19 | 12 | 17 | 9 | 8 | 74 | 40 | 34 | 4 | 4 | … |
| Congregational Independents | 21 | 9 | 12 | 4 | 4 | … | 14 | 7 | 7 | 11 | 6 | 5 | 4 | 3 | 1 | 10 | 4 | 6 | … | … | … |
| Lutherans | 387 | 216 | 171 | 31 | 25 | 6 | 944 | 524 | 420 | 53 | 32 | 21 | 5 | 4 | 1 | 45 | 39 | 6 | 3 | 7 | 1 |
| Unitarians | 17 | 11 | 6 | 1 | 1 | … | 9 | 6 | 3 | … | … | … | … | … | … | 5 | 4 | 1 | … | … | … |
| Society of Friends | … | … | … | 3 | 3 | … | 3 | 2 | 1 | 6 | 5 | 1 | … | … | … | 2 | 2 | … | … | … | … |
| Catholic Apostolic | … | … | … | … | … | … | 1 | 1 | … | … | … | … | … | … | … | 1 | 1 | … | 1 | 1 | … |
| Others | 41 | 22 | 19 | 15 | 10 | 5 | 25 | 18 | 7 | 13 | 7 | 6 | 19 | 11 | 8 | 15 | 9 | 6 | 1 | 1 | … |
| Catholics— | |||||||||||||||||||||
| Roman Catholics | 479 | 255 | 224 | 148 | 120 | 28 | 501 | 327 | 174 | 801 | 483 | 3l8 | 98 | 56 | 42 | 787 | 459 | 328 | 205 | 115 | 90 |
| Catholics undefined | 3 | 2 | 1 | … | … | … | 52 | 22 | 30 | 17 | 11 | 6 | … | … | … | 2 | 1 | 1 | … | … | … |
| Greek Church | 1 | 1 | … | … | … | … | 1 | 1 | … | 2 | 2 | … | … | … | … | … | … | … | … | … | … |
| Other Denominations— | |||||||||||||||||||||
| Latter-Day Saints or Mormons | 6 | 5 | 1 | 1 | 1 | … | 20 | 11 | 9 | 1 | 1 | … | … | … | … | 1 | 1 | … | … | … | … |
| Jews | 7 | 4 | 3 | … | … | … | 1 | 1 | … | 10 | 7 | 3 | … | … | … | 1 | 1 | … | … | … | … |
| Mahometans | … | … | … | … | … | … | … | … | … | … | … | … | … | … | … | … | … | … | … | … | … |
| Pagans | … | … | … | … | … | … | … | … | … | … | … | … | … | … | … | … | … | … | … | … | … |
| Others | 10 | 5 | 5 | … | … | … | 2 | 1 | 1 | … | … | … | … | … | … | 1 | 1 | … | … | … | … |
| No Denomination | 11 | 10 | 1 | 4 | 4 | … | 29 | 21 | 8 | 31 | 20 | 11 | 3 | 3 | … | 24 | 19 | 5 | 7 | 3 | 4 |
| No Religion | 1 | 1 | … | 2 | 2 | … | … | … | … | 1 | 1 | … | 12 | 6 | 6 | 4 | 4 | … | 1 | 1 | … |
| Unspecified | 18 | 10 | 8 | 5 | 5 | … | 48 | 32 | 16 | 16 | 15 | 1 | 2 | 2 | … | 5 | 5 | … | 1 | 1 | … |
| Object to state | 257 | 146 | 111 | 50 | 44 | 6 | 180 | 110 | 70 | 112 | 83 | 29 | 19 | 13 | 6 | 99 | 66 | 33 | 22 | 21 | 1 |
Table VII. Table VII. Showing the Religions of Persons, Males, and Females (exclusive of Maoris) in each County—
| Religious Denominations. | Waimea. | Collingwood. | Buller. | Inangahua. | Grey. | Westland. | Amuri. | ||||||||||||||
|---|---|---|---|---|---|---|---|---|---|---|---|---|---|---|---|---|---|---|---|---|---|
| Persons. | Males. | Females. | Persons. | Males. | Females. | Persons. | Males. | Females. | Persons. | Males. | Females. | Persons. | Males. | Females. | Persons. | Males. | Females. | Persons. | Males. | Females. | |
| Total | 7,535 | 3,928 | 3,607 | 1,643 | 926 | 717 | 2,545 | 1,618 | 927 | 2,927 | 2,015 | 912 | 4,939 | 3,405 | 1,534 | 5,362 | 3,592 | 1,770 | 513 | 378 | 135 |
| Episcopalians— | |||||||||||||||||||||
| Church of England—Episcopalians (not otherwise defined) | 3,350 | 1,720 | 1,630 | 975 | 521 | 454 | 814 | 532 | 282 | 924 | 610 | 314 | 1,470 | 960 | 510 | 1,771 | 1,141 | 630 | 267 | 196 | 71 |
| Protestants (not otherwise defined) | 123 | 67 | 56 | 23 | 17 | 6 | 1 | 1 | … | 2 | 2 | … | 5 | 2 | 3 | 15 | 8 | 7 | 11 | 6 | 5 |
| Presbyterians— | |||||||||||||||||||||
| Church of Scotland, Free Church of Scotland, Free Presbyterians, Presbyterian Church of New Zealand, Presbyterian Church of Otago and Southland, and Presbyterians otherwise described | 380 | 197 | 183 | 185 | 106 | 79 | 328 | 225 | 103 | 422 | 300 | 122 | 689 | 476 | 213 | 890 | 610 | 280 | 168 | 120 | 48 |
| Reformed Presbyterians | … | … | … | … | … | … | … | … | … | … | … | … | 2 | 2 | … | … | … | … | … | … | … |
| Methodists— | |||||||||||||||||||||
| Wesleyan Methodists | 1,078 | 526 | 552 | 124 | 72 | 52 | 124 | 66 | 58 | 170 | 97 | 73 | 275 | 145 | 130 | 206 | 117 | 89 | 9 | 6 | 3 |
| Primitive Methodists | … | … | … | 1 | 1 | … | 20 | 12 | 8 | … | … | … | 12 | 9 | 3 | … | … | … | 1 | … | 1 |
| United Methodist Free Churches | … | … | … | … | … | … | 43 | 22 | 21 | 40 | 26 | 14 | 2 | 2 | 1 | 1 | 1 | … | … | … | … |
| Bible Christians | … | … | … | … | … | … | 1 | 1 | … | 2 | 2 | … | 2 | 2 | … | … | … | … | … | … | … |
| New Connection Methodists | … | … | … | … | … | … | … | … | … | … | … | … | … | … | … | … | … | … | … | … | … |
| Others | … | … | … | … | … | … | … | … | … | … | … | … | … | … | … | … | … | … | … | … | … |
| Other Protestants— | |||||||||||||||||||||
| Baptists | 251 | 118 | 133 | 10 | 6 | 4 | 46 | 31 | 15 | 32 | 21 | 11 | 29 | l8 | 11 | 29 | 16 | 13 | 1 | 1 | … |
| Congregational Independents | 38 | 24 | 14 | 16 | 12 | 4 | 11 | 6 | 5 | 8 | 7 | 1 | 28 | 21 | 7 | 13 | 13 | … | 1 | 1 | … |
| Lutherans | 514 | 276 | 238 | 24 | 20 | 4 | 53 | 45 | 8 | 29 | 27 | 2 | 84 | 78 | 6 | 189 | 162 | 27 | 2 | 2 | … |
| Unitarians | 4 | 2 | 2 | 1 | 1 | … | 1 | 1 | … | 3 | 3 | … | 4 | 4 | … | 8 | 8 | … | … | … | … |
| Society of Friends | 1 | 1 | … | 1 | 1 | … | … | … | … | … | … | … | 4 | 4 | … | 7 | 6 | 1 | … | … | … |
| Catholic Apostolic | … | … | … | … | … | … | … | … | … | … | … | … | … | … | … | … | … | … | … | … | … |
| Others | 304 | 156 | 148 | … | … | … | 9 | 5 | 4 | 3 | 3 | … | 28 | 22 | 6 | 28 | 14 | 14 | 1 | 1 | … |
| Catholics— | |||||||||||||||||||||
| Roman Catholics | 272 | 148 | 124 | 105 | 60 | 45 | 1,008 | 602 | 406 | 877 | 518 | 359 | 1,715 | 1,089 | 626 | 1,743 | 1,065 | 678 | 36 | 29 | 7 |
| Catholics undefined | 55 | 33 | 22 | 3 | 3 | … | … | … | … | … | … | … | 1 | 1 | … | … | … | … | 1 | 1 | … |
| Greek Church | 1 | 1 | … | … | … | … | 4 | 4 | … | 4 | 4 | … | 3 | 3 | … | 2 | 2 | … | … | … | … |
| Other Denominations— | |||||||||||||||||||||
| Latter-Day Saints or Mormons | … | … | … | … | … | … | … | … | … | … | … | … | … | … | … | 3 | 3 | … | … | … | … |
| Jews | 8 | 5 | 3 | … | … | … | … | … | … | 4 | 4 | … | 3 | 3 | … | 2 | 2 | … | … | … | … |
| Mahometans | … | … | … | … | … | … | … | … | … | … | … | … | … | … | … | … | … | … | … | … | … |
| Pagans | … | … | … | … | … | … | 3 | 3 | … | 330 | 330 | … | 448 | 448 | … | 314 | 314 | … | … | … | … |
| Others | 10 | 7 | 3 | … | … | … | 13 | 8 | 5 | 1 | 1 | … | … | … | … | … | … | … | … | … | … |
| No Denominations | 149 | 77 | 72 | 36 | 23 | 13 | 4 | 4 | … | 21 | 21 | … | 59 | 46 | 13 | 32 | 19 | 3 | 1 | 1 | … |
| No Religion | … | … | … | 6 | 5 | 1 | 1 | 1 | … | … | … | … | 6 | 4 | 2 | 3 | 3 | … | 1 | 1 | … |
| Unspecified | 30 | 21 | 9 | 15 | 13 | 2 | 2 | 2 | … | … | … | … | 7 | 7 | … | 10 | 6 | 4 | 4 | 4 | … |
| Object to state | 967 | 549 | 418 | 118 | 65 | 53 | 59 | 47 | 12 | 55 | 39 | 16 | 62 | 59 | 3 | 106 | 82 | 24 | 9 | 9 | … |
Table VII. Table VII. Showing the Religions of Persons, Males, and Females (exclusive of Maoris) in each County—
| Religious Denominations. | Cheviot. | Ashley. | Akaroa. | Selwyn. | Ashburton. | Geraldine. | Waimate. | ||||||||||||||
|---|---|---|---|---|---|---|---|---|---|---|---|---|---|---|---|---|---|---|---|---|---|
| Persons. | Males. | Females. | Persons. | Males. | Females. | Persons. | Males. | Females. | Persons. | Males. | Females. | Persons. | Males. | Females. | Persons. | Males. | Females. | Persons. | Males. | Females. | |
| Total | 102 | 75 | 27 | 11,955 | 6,547 | 5,408 | 4,020 | 2,240 | 1,780 | 34,323 | 18,148 | l6,175 | 7,165 | 4,397 | 2,768 | 12,729 | 7,041 | 5,688 | 3,438 | 2,118 | 1,320 |
| Episcopalians— | |||||||||||||||||||||
| Church of England—Episcopalians (not otherwise defined) | 66 | 50 | 16 | 5,819 | 3,177 | 2,642 | 2,487 | 1,373 | 1,114 | 17,505 | 9,223 | 8,282 | 3,095 | 1,860 | 1,235 | 5,409 | 2,976 | 2,433 | 1,374 | 851 | 523 |
| Protestants (not otherwise defined) | … | … | … | 25 | 17 | 8 | … | … | … | 17 | 9 | 8 | 30 | 25 | 5 | 27 | 19 | 8 | 7 | 6 | 1 |
| Presbyterians— | |||||||||||||||||||||
| Church of Scotland, Free Church of Scotland, Free Presbyterians, Presbyterian Church of New Zealand, Presbyterian Church of Otago and Southland, and Presbyterians Otherwise described | 29 | 21 | 8 | 2,271 | 1,277 | 994 | 705 | 388 | 317 | 5,898 | 3,109 | 2,789 | 1,806 | 1,082 | 724 | 2,843 | 1,607 | 1,236 | 874 | 535 | 339 |
| Reformed Presbyterians | … | … | … | 2 | 1 | 1 | … | … | … | 6 | 4 | 2 | … | … | … | … | … | … | 5 | 3 | 2 |
| Methodists— | |||||||||||||||||||||
| Wesleyan Methodists | … | … | … | 1,369 | 706 | 663 | 109 | 51 | 58 | 3,839 | 1,979 | 1,860 | 491 | 287 | 204 | 929 | 469 | 460 | 296 | 156 | 140 |
| Primitive Methodists | … | … | … | 47 | 22 | 25 | … | … | … | 293 | 152 | 141 | 135 | 75 | 60 | 379 | 201 | 178 | 46 | 25 | 21 |
| United Methodist Free Churches | … | … | … | 167 | 89 | 78 | 4 | 2 | 2 | 222 | 120 | 102 | 20 | 11 | 9 | 3 | 3 | … | … | … | … |
| Bible Christians | … | … | … | 5 | 3 | 2 | … | … | … | 124 | 54 | 70 | 1 | … | 1 | 11 | 8 | 3 | 1 | 1 | … |
| New Connection Methodists | … | … | … | 2 | 1 | 1 | … | … | … | 1 | … | 1 | … | … | … | … | … | … | … | … | … |
| Others | … | … | … | … | … | … | … | … | … | 11 | 5 | 6 | 2 | 2 | … | 1 | 1 | … | … | … | … |
| Other Protestants— | |||||||||||||||||||||
| Baptists | … | … | … | 269 | 132 | 137 | 43 | 21 | 22 | 1,121 | 572 | 549 | 149 | 76 | 73 | 171 | 91 | 80 | 44 | 26 | 18 |
| Congregational Independents | 1 | 1 | … | 50 | 26 | 24 | 78 | 47 | 31 | 464 | 241 | 223 | 31 | 19 | 12 | 138 | 73 | 65 | 35 | 15 | 20 |
| Lutherans | … | … | … | 99 | 54 | 45 | 85 | 55 | 30 | 178 | 99 | 79 | 23 | 21 | 2 | 64 | 49 | 15 | 29 | 16 | 13 |
| Unitarians | … | … | … | … | … | … | 12 | 8 | 4 | 16 | 10 | 6 | 2 | 2 | … | 4 | 3 | 1 | 2 | 2 | … |
| Society of Friends | … | … | … | 3 | 3 | … | … | … | … | 1 | … | 1 | 2 | 2 | … | 2 | 1 | 1 | … | … | … |
| Catholic Apostolic | … | … | … | 1 | 1 | … | … | … | … | 16 | 8 | 8 | 1 | … | 1 | … | … | … | … | … | … |
| Others | … | … | … | 72 | 38 | 34 | 12 | 7 | 5 | 260 | 137 | 123 | 37 | 21 | 16 | 94 | 45 | 49 | 23 | 15 | 8 |
| Catholics— | |||||||||||||||||||||
| Roman Catholics | 4 | 1 | 3 | 1,226 | 681 | 545 | 383 | 213 | 170 | 3,154 | 1,683 | 1,471 | 1,048 | 693 | 355 | 2,153 | 1,147 | 1,006 | 591 | 387 | 204 |
| Catholics undefined | … | … | … | 3 | 3 | … | 5 | 4 | 1 | 15 | 6 | 9 | 13 | 8 | 5 | 3 | 2 | 1 | … | … | … |
| Greek Church | … | … | … | 1 | 1 | … | … | … | … | 2 | 2 | … | … | … | … | … | … | … | … | … | … |
| Other Denominations— | |||||||||||||||||||||
| Latter-Day Saints or Mormons | … | … | … | 3 | 3 | … | 1 | 1 | … | 37 | 21 | 16 | 7 | 4 | 3 | 14 | 11 | 3 | 1 | 1 | … |
| Jews | … | … | … | 1 | 1 | … | … | … | … | 18 | 6 | 12 | … | … | … | 25 | 11 | 14 | 1 | 1 | … |
| Mahometans | … | … | … | … | … | … | … | … | … | 5 | 5 | … | 1 | 1 | … | … | … | … | … | … | … |
| Pagans | … | … | … | 4 | 4 | … | … | … | … | 49 | 49 | … | 8 | 8 | … | 19 | 19 | … | 10 | 10 | … |
| Others | … | … | … | … | … | … | … | … | … | 4 | 2 | 2 | 11 | 8 | 3 | 8 | 5 | 3 | … | … | … |
| No Denomination | … | … | … | 22 | 18 | 4 | 15 | 11 | 4 | 164 | 97 | 67 | 66 | 55 | 11 | 67 | 48 | 19 | 15 | 12 | 3 |
| No Religion | … | … | … | 1 | 1 | … | 2 | 2 | … | 10 | 10 | … | 7 | 4 | 3 | 1 | 1 | … | 3 | 1 | 2 |
| Unspecified | … | … | … | 8 | 5 | 3 | 23 | 22 | 1 | 52 | 45 | 7 | 14 | 14 | … | 81 | 75 | 6 | 3 | 3 | … |
| Object to state | 2 | 2 | … | 485 | 283 | 202 | 56 | 35 | 21 | 841 | 500 | 341 | 165 | 119 | 46 | 283 | 176 | 107 | 78 | 52 | 26 |
Table VII. Table VII. Showing the Religions of Persons, Males, and Females (exclusive of Maoris) in each County—
| Religious Denominations. | Waitaki. | Waikouaiti. | Peninsula. | Taieri. | Bruce. | Clutha. | Tuapeka. | ||||||||||||||
|---|---|---|---|---|---|---|---|---|---|---|---|---|---|---|---|---|---|---|---|---|---|
| Persons. | Males. | Females. | Persons. | Males. | Females. | Persons. | Males. | Females. | Persons. | Males. | Females. | Persons. | Males. | Females. | Persons. | Males. | Females. | Persons. | Males. | Females. | |
| Total | 6,955 | 4,142 | 2,813 | 6,66l | 3,776 | 2,885 | 2,425 | 1,300 | 1,125 | 7,476 | 4,230 | 3,246 | 5,049 | 2,801 | 2,248 | 4,205 | 2,464 | 1,741 | 6,380 | 3,970 | 2,410 |
| Episcopalians— | |||||||||||||||||||||
| Church of England—Episcopalians (not otherwise defined) | 1,707 | 1,048 | 659 | 1,732 | 968 | 764 | 511 | 28l | 230 | 1,330 | 792 | 538 | 767 | 430 | 337 | 650 | 405 | 245 | 1,394 | 844 | 550 |
| Protestants (not otherwise defined) | 7 | 7 | … | 30 | 20 | 10 | 26 | 16 | 10 | 61 | 39 | 22 | 2 | 2 | … | 5 | 1 | 4 | … | … | … |
| Presbyterians— | |||||||||||||||||||||
| Church of Scotland, Free Church of Scotland, Free Presbyterians, Presbyterian Church of New Zealand, Presbyterian Church of Otago and Southland, and Presbyterians otherwise described | 3,572 | 2,056 | 1,516 | 3,275 | 1,772 | 1,503 | 1,257 | 652 | 605 | 4,820 | 2,636 | 2,l84 | 3,161 | 1,701 | 1,460 | 2,875 | 1,646 | 1,229 | 2,452 | 1,399 | 1,053 |
| Reformed Presbyterians | … | … | … | … | … | … | … | … | … | 12 | 8 | 4 | … | … | … | 2 | … | 2 | 5 | … | 5 |
| Methodists — | |||||||||||||||||||||
| Wesleyan Methodists | 279 | 145 | 134 | 352 | 184 | 168 | 113 | 60 | 53 | 69 | 35 | 34 | 131 | 65 | 66 | 114 | 66 | 48 | 280 | 198 | 182 |
| Primitive Methodists | 11 | 5 | 6 | 19 | 6 | 13 | 6 | 3 | 3 | 21 | 11 | 10 | 1 | … | 1 | 16 | 11 | 5 | 4 | 4 | … |
| United Methodist Free Churches | … | … | … | … | … | … | … | … | … | … | … | … | … | … | … | … | … | … | … | … | … |
| Bible Christians | 5 | 3 | 2 | … | … | … | … | … | … | … | … | … | … | … | … | … | … | … | 8 | 5 | 3 |
| New Connection Methodists | … | … | … | … | … | … | … | … | … | … | … | … | … | … | … | … | … | … | 1 | 1 | … |
| Others | … | … | … | … | … | … | … | … | … | … | … | … | … | … | … | … | … | … | … | … | … |
| Other Protestants— | |||||||||||||||||||||
| Baptists | 125 | 69 | 56 | 88 | 48 | 40 | 119 | 61 | 58 | 157 | 79 | 78 | 78 | 37 | 41 | 48 | 27 | 21 | 26 | 17 | 9 |
| Congregational Independents | 69 | 30 | 39 | 126 | 66 | 60 | 52 | 28 | 24 | 32 | 17 | 15 | 13 | 6 | 7 | 2 | 1 | 1 | 81 | 47 | 34 |
| Lutherans | 42 | 34 | 8 | 33 | 27 | 6 | 14 | 13 | 1 | 15 | 15 | … | 19 | 14 | 5 | 28 | 18 | 10 | 46 | 35 | 11 |
| Unitarians | 3 | 3 | … | 11 | 7 | 4 | … | … | … | 2 | 2 | … | 1 | 1 | … | 3 | 3 | … | 1 | 1 | … |
| Society of Friends | 1 | 1 | … | … | … | … | … | … | … | … | … | … | 1 | 1 | … | 7 | 4 | 3 | … | … | … |
| Catholic Apostolic | … | … | … | 1 | 1 | … | … | … | … | 2 | 2 | … | … | … | … | … | … | … | … | … | … |
| Others | 108 | 59 | 49 | 59 | 30 | 29 | 29 | 13 | 16 | 63 | 33 | 30 | 12 | 7 | 5 | 37 | 21 | 16 | 26 | 15 | 11 |
| Catholics— | |||||||||||||||||||||
| Roman Catholics | 796 | 511 | 285 | 561 | 323 | 238 | 135 | 59 | 76 | 546 | 310 | 236 | 612 | 327 | 285 | 206 | 131 | 75 | 1,I37 | 612 | 525 |
| Catholics undefined | 11 | 8 | 3 | 10 | 5 | 5 | 17 | 12 | 5 | 33 | 12 | 21 | … | … | … | 1 | 1 | … | 1 | 1 | … |
| Greek Church | … | … | … | … | … | … | … | … | … | … | … | … | … | … | … | … | … | … | 1 | 1 | … |
| Other Denominations— | |||||||||||||||||||||
| Latter-Day Saints or Mormons | 2 | 2 | … | 1 | 1 | … | … | … | … | … | … | … | … | … | … | … | … | … | … | … | … |
| Jews | 5 | 4 | 1 | 5 | 3 | 2 | … | … | … | 5 | 4 | 1 | … | … | … | … | … | … | 1 | 1 | … |
| Mahometans | … | … | … | … | … | … | … | … | … | … | … | … | … | … | … | … | … | … | … | … | … |
| Pagans | 28 | 28 | … | 186 | 186 | … | 19 | 19 | … | 99 | 99 | … | 136 | 136 | … | 12 | 12 | … | 701 | 701 | … |
| Others | … | … | … | 1 | 1 | … | … | … | … | … | … | … | 6 | 4 | 2 | … | … | … | … | … | … |
| No Denomination | 54 | 39 | 15 | 29 | 25 | 4 | 24 | 17 | 7 | 41 | 28 | 13 | 18 | 12 | 6 | 51 | 35 | 16 | 30 | 20 | 10 |
| No Religion | 4 | 4 | … | … | … | … | … | … | … | 1 | 1 | … | … | … | … | … | … | … | … | … | … |
| Unspecified | 11 | 9 | 2 | 11 | 10 | 1 | 13 | 9 | 4 | 20 | 18 | 2 | 5 | 5 | … | 1 | 1 | … | 12 | 10 | 2 |
| Object to state | 115 | 77 | 38 | 131 | 93 | 38 | 90 | 57 | 33 | 147 | 89 | 58 | 86 | 53 | 33 | 147 | 81 | 66 | 73 | 58 | 15 |
Table VII. Table VII. Showing the Religions of Persons, Males, and Females (exclusive of Maoris) in each County—
| Religious Denominations. | Maniototo. | Vincent. | Lake. | Southland. | Wallace. | Fiord. | Stewart Island. | ||||||||||||||
|---|---|---|---|---|---|---|---|---|---|---|---|---|---|---|---|---|---|---|---|---|---|
| Persons. | Males. | Females. | Persons. | Males. | Females. | Persons. | Males. | Females. | Persons. | Males. | Females. | Persons. | Males. | Females. | Persons. | Males. | Females. | Persons. | Males. | Females. | |
| Total | 2,454 | 1,555 | 899 | 3,565 | 2,431 | 1,134 | 2,486 | 1,723 | 763 | 13,215 | 7,949 | 5,266 | 3,616 | 2,406 | 1,210 | 13 | 5 | 8 | 295 | 164 | 131 |
| Episcopalians— | |||||||||||||||||||||
| Church of England—Episcopalians (not otherwise defined) | 639 | 382 | 257 | 1,151 | 739 | 412 | 691 | 442 | 249 | 3,058 | 1,877 | 1,181 | 1,012 | 629 | 383 | 9 | 3 | 6 | 76 | 47 | 29 |
| Protestants (not otherwise defined) | 12 | 8 | 4 | … | … | … | … | … | … | 40 | 31 | 9 | 11 | 8 | 3 | … | … | … | … | … | … |
| Presbyterians— | |||||||||||||||||||||
| Church of Scotland, Free Church of Scotland, Free Presbyterians, Presbyterian Church of New Zealand, Presbyterian Church of Otago and Southland, and Presbyterians otherwise described | 740 | 424 | 316 | 1,016 | 650 | 366 | 757 | 499 | 258 | 6,449 | 3,731 | 2,718 | 1,403 | 875 | 528 | 1 | 1 | … | 137 | 68 | 69 |
| Reformed Presbyterians | … | … | … | … | … | … | … | … | … | … | … | … | … | … | … | … | … | … | … | … | … |
| Methodists— | |||||||||||||||||||||
| Wesleyan Methodists | 96 | 56 | 40 | 96 | 62 | 34 | 59 | 45 | 14 | 421 | 232 | 189 | 51 | 35 | l6 | … | … | … | 8 | 4 | 4 |
| Primitive Methodists | … | … | … | … | … | … | 1 | 1 | … | 84 | 48 | 36 | 5 | 4 | 1 | … | … | … | 1 | 1 | … |
| United Methodist Free Churches | … | … | … | … | … | … | … | … | … | … | … | … | 2 | 2 | … | … | … | … | … | … | … |
| Bible Christians | 12 | 7 | 5 | … | … | … | 8 | 4 | 4 | 3 | 1 | 2 | … | … | … | … | … | … | … | … | … |
| New Connection Methodists | … | … | … | … | … | … | … | … | … | 1 | 1 | … | … | … | … | … | … | … | … | … | … |
| Others | … | … | … | 4 | 2 | 2 | 1 | 1 | … | 5 | 3 | 2 | … | … | … | … | … | … | … | … | … |
| Other Protestants— | |||||||||||||||||||||
| Baptists | 46 | 25 | 21 | 43 | 26 | 17 | 19 | 13 | 6 | 209 | 116 | 93 | 16 | 13 | 3 | … | … | … | … | … | … |
| Congregational Independents | 15 | 9 | 6 | 17 | 11 | 6 | 8 | 6 | 2 | 32 | 18 | 14 | 8 | 5 | 3 | … | … | … | 14 | 6 | 8 |
| Lutherans | 19 | 18 | 1 | 31 | 30 | 1 | 45 | 41 | 4 | 85 | 57 | 28 | 6 | 6 | … | … | … | … | 18 | 11 | 7 |
| Unitarians | … | … | … | 2 | 2 | … | … | … | … | 6 | 4 | 2 | 1 | 1 | … | … | … | … | … | … | … |
| Society of Friends | … | … | … | 1 | 1 | … | … | … | … | … | … | … | … | … | … | … | … | … | … | … | … |
| Catholic Apostolic | 4 | 4 | … | … | … | … | … | … | … | … | … | … | … | … | … | … | … | … | … | … | … |
| Others | 18 | 10 | 8 | 15 | 7 | 8 | 15 | 7 | 8 | 203 | 117 | 86 | 55 | 27 | 28 | … | … | … | 2 | 1 | 1 |
| Catholics— | |||||||||||||||||||||
| Roman Catholics | 528 | 304 | 224 | 623 | 352 | 271 | 515 | 309 | 206 | 1,801 | 1,056 | 745 | 628 | 392 | 236 | 3 | 1 | 2 | 16 | 10 | 6 |
| Catholics undefined | 2 | 1 | 1 | … | … | … | … | … | … | l9 | 8 | 11 | … | … | … | … | … | … | … | … | … |
| Greek Church | … | … | … | 2 | 2 | … | 3 | 3 | … | 1 | 1 | … | … | … | … | … | … | … | … | … | … |
| Other Denominations— | |||||||||||||||||||||
| Latter-Day Saints or Mormons | … | … | … | … | … | … | … | … | … | … | … | … | … | … | … | … | … | … | 6 | 3 | 3 |
| Jews | … | … | … | … | … | … | 5 | 2 | 3 | … | … | … | … | … | … | … | … | … | … | … | … |
| Mahometans | … | … | … | … | … | … | … | … | … | … | … | … | … | … | … | … | … | … | … | … | … |
| Pagans | 247 | 247 | … | 472 | 472 | … | 283 | 283 | … | 314 | 314 | … | 352 | 352 | … | … | … | … | … | … | … |
| Others | … | … | … | 8 | 4 | 4 | 1 | 1 | … | 1 | 1 | … | … | … | … | … | … | … | … | … | … |
| No Denomination | 29 | 23 | 6 | 40 | 36 | 4 | 16 | 16 | … | 104 | 70 | 34 | 7 | 5 | 2 | … | … | … | 1 | 1 | … |
| No Religion | … | … | … | 2 | 2 | … | 2 | 2 | … | 5 | 4 | 1 | 2 | 2 | … | … | … | … | … | … | … |
| Unspecified | 11 | 11 | … | 7 | 1 | 6 | 3 | 3 | … | 55 | 51 | 4 | 6 | 5 | 1 | … | … | … | 9 | 9 | … |
| Object to state | 36 | 26 | 10 | 35 | 32 | 3 | 54 | 45 | 9 | 319 | 208 | 111 | 51 | 45 | 6 | … | … | … | 7 | 3 | 4 |
Table VIII. Table VIII. Showing the Religions of Persons, Males, and Females (exclusive of Maoris) in each Borough.
| Religious Denominations. | Auckland. | Parnell. | Onehunga. | Thames. | Gisborne. | Hamilton. | New Plymouth. | Wanganui. | ||||||||||||||||
|---|---|---|---|---|---|---|---|---|---|---|---|---|---|---|---|---|---|---|---|---|---|---|---|---|
| Persons. | Males. | Females. | Persons. | Males. | Females. | Persons. | Males. | Females. | Persons. | Males. | Females. | Persons. | Males. | Females. | Persons. | Males. | Females. | Persons. | Males. | Females. | Persons. | Males. | Females. | |
| Total | 16,664 | 8,651 | 8,013 | 3,529 | 1,726 | 1,803 | 2,217 | 1,047 | 1,170 | 4,863 | 2,538 | 2,325 | 1,737 | 959 | 778 | 1,361 | 700 | 661 | 3,310 | 1,673 | 1,637 | 4,646 | 2,330 | 2,3l6 |
| Episcopalians— | ||||||||||||||||||||||||
| Church of England—Episcopalians (not otherwise defined) | 6,909 | 3,620 | 3,289 | 2,091 | 1,035 | 1,056 | 984 | 479 | 505 | 1,912 | 1,012 | 900 | 88l | 480 | 401 | 858 | 449 | 409 | 1,765 | 882 | 883 | 1,716 | 873 | 843 |
| Protestants (not otherwise defined) | 8 | 8 | … | … | … | … | … | … | … | … | … | … | 21 | 13 | 8 | 1 | 1 | … | 127 | 73 | 54 | 2 | … | 2 |
| Presbyterian s— | ||||||||||||||||||||||||
| Church of Scotland, Free Church of Scotland, Free Presbyterians, Presbyterian Church of New Zealand, Presbyterian Church of Otago and Southland, and Presbyterians otherwise described | 2,175 | 1,104 | 1,071 | 425 | 203 | 222 | 241 | 109 | 132 | 773 | 417 | 356 | 296 | 170 | 126 | 110 | 54 | 56 | 207 | 103 | 104 | 899 | 454 | 445 |
| Reformed Presbyterians | … | … | … | … | … | … | … | … | … | … | … | … | 7 | 5 | 2 | … | … | … | … | … | … | … | … | … |
| Methodists— | ||||||||||||||||||||||||
| Wesleyan Methodists | 1,222 | 618 | 604 | 229 | 110 | 119 | 150 | 66 | 84 | 602 | 333 | 269 | 124 | 69 | 55 | 71 | 30 | 41 | 490 | 231 | 259 | 679 | 317 | 362 |
| Primitive Methodists | 295 | 157 | 138 | 12 | 6 | 6 | … | … | … | 126 | 64 | 62 | … | … | … | 1 | 1 | … | 167 | 79 | 88 | 3 | 1 | 2 |
| United Methodist Free Churches | 193 | 95 | 98 | 2 | 1 | 1 | … | … | … | 1 | 1 | … | 1 | … | 1 | … | … | … | … | … | … | 1 | 1 | … |
| Bible Christians | 1 | … | 1 | … | … | … | 1 | 1 | … | 4 | … | 4 | … | … | … | 7 | 5 | 2 | … | … | … | 2 | … | 2 |
| New Connection Methodists | 4 | 1 | 3 | … | … | … | … | … | … | … | … | … | … | … | … | … | … | … | … | … | … | … | … | … |
| Others | … | … | … | 3 | … | 3 | 1 | 1 | … | … | … | … | … | … | … | … | … | … | … | … | … | 16 | 8 | 8 |
| Other Protestants— | ||||||||||||||||||||||||
| Baptists | 560 | 263 | 297 | 41 | 23 | 18 | 34 | 17 | 17 | 254 | 108 | 146 | 25 | 14 | 11 | 8 | 1 | 7 | 32 | 17 | 15 | 66 | 32 | 34 |
| Congregational Independents | 407 | 220 | 187 | 42 | 24 | 18 | 59 | 28 | 31 | 107 | 61 | 46 | 15 | 7 | 8 | 25 | 16 | 9 | 19 | 9 | 10 | 19 | 11 | 8 |
| Lutherans | 50 | 39 | 11 | 4 | 3 | 1 | 4 | 3 | 1 | 9 | 8 | 1 | 11 | 5 | 6 | … | … | … | … | … | … | 44 | 20 | 24 |
| Unitarians | 27 | 17 | 10 | 7 | 6 | 1 | … | … | … | 5 | 2 | 3 | 1 | 1 | … | 2 | 2 | … | 11 | 7 | 4 | 1 | 1 | … |
| Society of Friends | 2 | 2 | … | 12 | 5 | 7 | 9 | 6 | 3 | 3 | 3 | … | 1 | 1 | … | 2 | 1 | 1 | 1 | 1 | … | 2 | 1 | 1 |
| Catholic Apostolic | … | … | … | 2 | 2 | … | … | … | … | 1 | 1 | … | 2 | 2 | … | … | … | … | … | … | … | 1 | 1 | … |
| Others | 191 | 90 | 101 | 15 | 10 | 5 | 43 | 21 | 22 | 34 | 19 | 15 | … | … | … | … | … | … | 2 | 1 | 1 | 44 | 20 | 24 |
| Catholics— | ||||||||||||||||||||||||
| Roman Catholics | 3,647 | 1,802 | 1,845 | 561 | 248 | 313 | 628 | 281 | 347 | 852 | 389 | 463 | 196 | 89 | 107 | 233 | 115 | 118 | 324 | 169 | 155 | 968 | 467 | 501 |
| Catholics undefined | 4 | 4 | … | … | … | … | … | … | … | … | … | … | 24 | 18 | 6 | … | … | … | 10 | 1 | 9 | … | … | … |
| Greek Church | 2 | 2 | … | … | … | … | … | … | … | … | … | … | … | … | … | … | … | … | … | … | … | … | … | … |
| Other Denominations— | ||||||||||||||||||||||||
| Latter-Day Saints or Mormons | 31 | 14 | 17 | … | … | … | … | … | … | 2 | 1 | 1 | … | … | … | … | … | … | … | … | … | 9 | 6 | 3 |
| Jews | 222 | 122 | 100 | … | … | … | 5 | 2 | 3 | 11 | 8 | 3 | 19 | 15 | 4 | 5 | 2 | 3 | 8 | 7 | 1 | 18 | 7 | 11 |
| Mahometans | … | … | … | … | … | … | … | … | … | … | … | … | … | … | … | … | … | … | … | … | … | … | … | … |
| Pagans | 22 | 19 | 3 | 2 | 2 | … | … | … | … | … | … | … | … | … | … | … | … | … | 4 | 4 | … | 3 | 3 | … |
| Others | 4 | 2 | 2 | … | … | … | … | … | … | 4 | 3 | 1 | … | … | … | … | … | … | … | … | … | 1 | 1 | … |
| No Denomination | 215 | 143 | 72 | 43 | 27 | 16 | 24 | 13 | 11 | 11 | 6 | 5 | 26 | 19 | 7 | 11 | 8 | 3 | 30 | 18 | 12 | 34 | 26 | 8 |
| No Religion | 17 | 9 | 8 | … | … | … | … | … | … | … | … | … | 1 | 1 | … | … | … | … | 2 | 2 | … | … | … | … |
| Unspecified | … | … | … | 4 | 1 | 3 | … | … | … | 1 | … | 1 | 4 | 4 | … | … | … | … | 25 | 16 | 9 | 5 | 3 | 2 |
| Object to state | 456 | 300 | 156 | 34 | 20 | 14 | 34 | 20 | 14 | 151 | 102 | 49 | 82 | 46 | 36 | 27 | 15 | 12 | 86 | 53 | 33 | 113 | 77 | 36 |
Table VIII. Table VIII. Showing the Religions of Persons, Males, and Females (exclusive of Maoris) in each Borough—
| Religious Denominations. | Marton. | Palmerston North. | Wellington. | Masterton. | Greytown. | Napier. | Picton. | Blenheim. | ||||||||||||||||
|---|---|---|---|---|---|---|---|---|---|---|---|---|---|---|---|---|---|---|---|---|---|---|---|---|
| Persons. | Males. | Females. | Persons. | Males. | Females. | Persons. | Males. | Females. | Persons. | Males. | Females. | Persons. | Males. | Females. | Persons. | Males. | Females. | Persons. | Males. | Females. | Persons. | Males. | Females. | |
| Total | 662 | 363 | 299 | 1,366 | 723 | 643 | 20,563 | 10,226 | 10,337 | 2,241 | 1,155 | 1,086 | 1,078 | 561 | 517 | 5,756 | 2,896 | 2,860 | 834 | 401 | 433 | 2,107 | 1,051 | 1,056 |
| Episcopalians— | ||||||||||||||||||||||||
| Church of England—Episcopalians (not otherwise defined) | 324 | 185 | 139 | 582 | 302 | 280 | 9,700 | 4,847 | 4,853 | 1,212 | 627 | 585 | 697 | 353 | 344 | 2,615 | 1,325 | 1,290 | 556 | 270 | 286 | 1,168 | 575 | 593 |
| Protestants (not otherwise defined) | … | … | … | … | … | … | 282 | 172 | 110 | … | … | … | 2 | 2 | … | 68 | 39 | 29 | … | … | … | … | … | … |
| Presbyterians— | ||||||||||||||||||||||||
| Church of Scotland, Free Church of Scotland, Free Presbyterians, Presbyterian Church of New Zealand, Presbyterian Church of Otago and Southland, and Presbyterians otherwise described | 122 | 69 | 53 | 126 | 67 | 59 | 2,375 | 1,182 | 1,193 | 294 | 156 | 138 | 53 | 29 | 24 | 866 | 437 | 429 | 133 | 55 | 78 | 234 | 114 | 120 |
| Reformed Presbyterians | … | … | … | … | … | … | … | … | … | … | … | … | … | … | … | 1 | 1 | … | … | … | … | … | … | … |
| Methodists— | ||||||||||||||||||||||||
| Wesleyan Methodists | 101 | 53 | 48 | 266 | 137 | 129 | 1,874 | 896 | 978 | 317 | 150 | l67 | 162 | 84 | 78 | 523 | 259 | 264 | 9 | 5 | 4 | 298 | 149 | 149 |
| Primitive Methodists | … | … | … | 4 | 2 | 2 | 377 | 175 | 202 | 1 | 1 | … | … | … | … | 5 | 3 | 2 | … | … | … | 1 | … | 1 |
| United Methodist Free Churches | … | … | … | … | … | … | 166 | 73 | 93 | … | … | … | … | … | … | 91 | 43 | 48 | … | … | … | … | … | … |
| Bible Christians | … | … | … | … | … | … | 7 | 7 | … | … | … | … | … | … | … | … | … | … | … | … | … | … | … | … |
| New Connection Methodists | … | … | … | … | … | … | 1 | 1 | … | … | … | … | … | … | … | … | … | … | … | … | … | … | … | … |
| Others | … | … | … | … | … | … | … | … | … | … | … | … | … | … | … | … | … | … | … | … | … | … | … | … |
| Other Protestants— | ||||||||||||||||||||||||
| Baptists | 4 | 1 | 3 | 18 | 8 | 10 | 491 | 238 | 253 | 36 | 17 | 19 | 16 | 12 | 4 | 73 | 42 | 31 | 3 | 2 | 1 | 14 | 6 | 8 |
| Congregational Independents | … | … | … | 17 | 12 | 5 | 359 | 175 | 184 | 21 | 10 | 11 | 12 | 7 | 5 | 35 | 22 | 13 | 6 | 1 | 5 | 15 | 5 | 10 |
| Lutherans | 41 | 20 | 21 | 127 | 74 | 53 | 114 | 66 | 48 | 41 | 24 | 17 | 13 | 9 | 4 | 142 | 65 | 77 | 9 | 5 | 4 | 5 | 4 | 1 |
| Unitarians | … | … | … | … | … | … | 28 | 19 | 9 | 1 | 1 | … | … | … | … | 21 | 12 | 9 | … | … | … | 3 | 2 | 1 |
| Society of Friends | … | … | … | 5 | 3 | 2 | 14 | 8 | 6 | … | … | … | … | … | … | 1 | 1 | … | … | … | … | … | … | … |
| Catholic Apostolic | … | … | … | 4 | 2 | 2 | 52 | 24 | 28 | … | … | … | … | … | … | … | … | … | … | … | … | … | … | … |
| Others | 7 | 3 | 4 | 25 | 18 | 7 | 437 | 225 | 212 | 11 | 4 | 7 | 1 | … | 1 | 29 | 17 | 12 | … | … | … | 8 | 7 | 1 |
| Catholics— | ||||||||||||||||||||||||
| Roman Catholics | 47 | 24 | 23 | 124 | 58 | 66 | 2,939 | 1,351 | 1,588 | 220 | 104 | 116 | 91 | 43 | 48 | 1,019 | 458 | 561 | 103 | 51 | 52 | 281 | 133 | 148 |
| Catholics undefined | … | … | … | 1 | 1 | … | 39 | 24 | 15 | … | … | … | … | … | … | 43 | 28 | 15 | 1 | 1 | … | … | … | … |
| Greek Church | … | … | … | … | … | … | 7 | 7 | … | 1 | 1 | … | … | … | … | … | … | … | … | … | … | … | … | … |
| Other Denominations— | ||||||||||||||||||||||||
| Latter-Day Saints or Mormons | … | … | … | 9 | 5 | 4 | 1 | 1 | … | … | … | … | … | … | … | 9 | 4 | 5 | … | … | … | … | … | … |
| Jews | 1 | 1 | … | 5 | 3 | 2 | 239 | 123 | 116 | 7 | 4 | 3 | … | … | … | 31 | 15 | 16 | … | … | … | 7 | 7 | … |
| Mahometans | … | … | … | … | … | … | … | … | … | … | … | … | … | … | … | … | … | … | … | … | … | … | … | … |
| Pagans | … | … | … | … | … | … | 25 | 25 | … | 3 | 3 | … | 3 | 3 | … | … | … | … | … | … | … | … | … | … |
| Others | … | … | … | … | … | … | 6 | 3 | 3 | … | … | … | … | … | … | … | … | … | … | … | … | … | … | … |
| No Denomination | 6 | 2 | 4 | 13 | 6 | 7 | 192 | 123 | 69 | 14 | 12 | 2 | 6 | 6 | … | 39 | 27 | 12 | 3 | 2 | 1 | 33 | 18 | 15 |
| No Religion | … | … | … | … | … | … | 36 | 23 | 13 | 4 | 3 | 1 | … | … | … | … | … | … | 1 | 1 | … | … | … | … |
| Unspecified | 2 | 2 | … | 9 | 5 | 4 | 171 | 92 | 79 | 7 | 5 | 2 | 8 | 4 | 4 | 19 | 14 | 5 | … | … | … | 3 | 2 | 1 |
| Object to state | 7 | 3 | 4 | 31 | 20 | 11 | 631 | 346 | 285 | 51 | 33 | 18 | 14 | 9 | 5 | 126 | 84 | 42 | 10 | 8 | 2 | 37 | 29 | 8 |
Table VIII. Table VIII. Showing the Religions of Persons, Males, and Females (exclusive of Maoris) in each Borough—
| Religious Denominations. | Nelson. | Westport. | Greymouth. | Hokitika. | Ross. | Kumara. | Ashburton. | ||||||||||||||
|---|---|---|---|---|---|---|---|---|---|---|---|---|---|---|---|---|---|---|---|---|---|
| Persons. | Males. | Females. | Persons. | Males. | Females. | Persons. | Males. | Females. | Persons. | Males. | Females. | Persons. | Males. | Females. | Persons. | Males. | Females. | Persons. | Males. | Females. | |
| Total | 6,764 | 3,261 | 3,503 | 1,013 | 538 | 475 | 2,544 | 1,331 | 1,213 | 2,600 | 1,264 | 1,336 | 1,139 | 647 | 492 | 1,145 | 622 | 523 | 1,526 | 844 | 682 |
| Episcopalian s— | |||||||||||||||||||||
| Church of England—Episcopalians (not otherwise defined) | 3,142 | 1,514 | 1,628 | 427 | 234 | 193 | 1,047 | 548 | 499 | 968 | 484 | 484 | 396 | 226 | 170 | 520 | 281 | 239 | 774 | 431 | 343 |
| Protestants (not otherwise defined) | 88 | 45 | 43 | … | … | … | … | … | … | … | … | … | … | … | … | … | … | … | … | … | … |
| Presbyterians— | |||||||||||||||||||||
| Church of Scotland, Free Church of Scotland, Free Presbyterians, Presbyterian Church of New Zealand, Presbyterian Church of Otago and Southland, and Presbyterians otherwise described | 718 | 36S | 353 | 150 | 79 | 71 | 335 | 177 | 158 | 481 | 228 | 253 | 152 | 85 | 67 | 163 | 107 | 56 | 314 | 171 | 143 |
| Reformed Presbyterians | 6 | 2 | 4 | … | … | … | … | … | … | … | … | … | … | … | … | … | … | … | … | … | … |
| Methodists— | |||||||||||||||||||||
| Wesleyan Methodists | 772 | 350 | 422 | 55 | 28 | 27 | 213 | 98 | 115 | 137 | 64 | 73 | 85 | 44 | 41 | 22 | 9 | 13 | 132 | 70 | 62 |
| Primitive Methodists | 7 | 3 | 4 | … | … | … | … | … | … | … | … | … | … | … | … | … | … | … | 50 | 22 | 28 |
| United Methodist Free Churches | 1 | 1 | … | 18 | 10 | 8 | 2 | … | 2 | … | … | … | … | … | … | … | … | … | … | … | … |
| Bible Christians | … | … | … | … | … | … | … | … | … | … | … | … | … | … | … | … | … | … | … | … | … |
| New Connection Methodists | … | … | … | … | … | … | … | … | … | … | … | … | … | … | … | … | … | … | 1 | 1 | … |
| Others | … | … | … | … | … | … | … | … | … | … | … | … | … | … | … | … | … | … | … | … | … |
| Other Protestants— | |||||||||||||||||||||
| Baptists | 320 | 162 | 158 | 11 | 7 | 4 | 16 | 9 | 7 | 13 | 8 | 5 | 2 | 2 | … | 3 | 2 | 1 | 4 | 2 | 2 |
| Congregational Independents | 397 | 194 | 203 | 5 | 1 | 4 | 9 | 3 | 6 | 6 | 5 | 1 | 1 | 1 | … | … | … | … | 15 | 7 | 8 |
| Lutherans | 35 | 24 | 11 | 14 | 11 | 3 | 21 | 17 | 4 | 68 | 46 | 22 | 45 | 28 | 17 | 12 | 7 | 5 | 2 | 1 | 1 |
| Unitarians | 4 | 1 | 3 | 1 | 1 | … | … | … | … | … | … | … | … | … | … | … | … | … | 1 | 1 | … |
| Society of Friends | 1 | 1 | … | … | … | … | … | … | … | … | … | … | … | … | … | 1 | … | 1 | … | … | … |
| Catholic Apostolic | … | … | … | … | … | … | … | … | … | … | … | … | … | … | … | … | … | … | … | … | … |
| Others | 102 | 52 | 50 | 1 | 1 | … | 28 | 11 | 17 | 11 | 7 | 4 | 21 | 12 | 9 | 9 | 5 | 4 | 17 | 13 | 4 |
| Catholics— | |||||||||||||||||||||
| Roman Catholics | 574 | 217 | 357 | 293 | 138 | 155 | 764 | 371 | 393 | 772 | 326 | 446 | 372 | 186 | 186 | 370 | 174 | 196 | 156 | 85 | 71 |
| Catholics undefined | 24 | 10 | 14 | … | … | … | … | … | … | … | … | … | … | … | … | … | … | … | … | … | … |
| Greek Church | … | … | … | 1 | 1 | … | … | … | … | … | … | … | 1 | 1 | … | … | … | … | … | … | … |
| Other Denominations— | |||||||||||||||||||||
| Latter-Day Saints or Mormons | 1 | 1 | … | … | … | … | … | … | … | … | … | … | … | … | … | … | … | … | … | … | … |
| Jews | 29 | 17 | 12 | … | … | … | 10 | 10 | … | 42 | 23 | 19 | 1 | 1 | … | 12 | 10 | 2 | 9 | 7 | 2 |
| Mahometans | … | … | … | … | … | … | … | … | … | … | … | … | … | … | … | … | … | … | … | … | … |
| Pagans | … | … | … | … | … | … | 44 | 44 | … | 22 | 22 | … | 37 | 37 | … | 6 | 6 | … | 1 | 1 | … |
| Others | 1 | 1 | … | … | … | … | … | … | … | … | … | … | … | … | … | … | … | … | 1 | 1 | … |
| No Denomination | 75 | 47 | 28 | 1 | 1 | … | 17 | 13 | 4 | 19 | 11 | 8 | 3 | 3 | … | 13 | 10 | 3 | 4 | 4 | … |
| No Religion | 37 | 20 | 17 | … | … | … | 8 | 5 | 3 | 1 | 1 | … | … | … | … | 1 | 1 | … | 1 | … | 1 |
| Unspecified | 39 | 15 | 24 | … | … | … | 2 | 1 | 1 | 8 | 4 | 4 | 8 | 8 | … | 3 | 3 | … | 3 | 2 | 1 |
| Object to state | 391 | 219 | 172 | 36 | 26 | 10 | 28 | 24 | 4 | 52 | 35 | 17 | 15 | 13 | 2 | 10 | 7 | 3 | 41 | 25 | 16 |
Table VIII. Table VIII. Showing the Religions of Persons, Males, and Females (exclusive of Maoris) in each Borough—
| Religious Denominations. | Kaiapoi. | Akaroa. | Lyttelton. | Christchurch. | Sydenham. | Timaru. | Rangiora. | ||||||||||||||
|---|---|---|---|---|---|---|---|---|---|---|---|---|---|---|---|---|---|---|---|---|---|
| Persons. | Males. | Females. | Persons. | Males. | Females. | Persons. | Males. | Females. | Persons. | Males. | Females. | Persons. | Males. | Females. | Persons. | Males. | Females. | Persons. | Males. | Females. | |
| Total | 1,221 | 594 | 627 | 611 | 296 | 315 | 4,127 | 2,205 | 1,922 | 15,213 | 7,734 | 7,479 | 8,460 | 4,290 | 4,170 | 3,917 | 2,117 | 1,800 | 1,445 | 743 | 702 |
| Episcopalians— | |||||||||||||||||||||
| Church of England—Episcopalians (not otherwise defined) | 532 | 251 | 28l | 381 | 188 | 193 | 2,159 | 1,131 | 1,028 | 7,862 | 4,016 | 3,846 | 3,658 | 1,887 | 1,771 | 1,853 | 994 | 859 | 645 | 341 | 304 |
| Protestants not (otherwise defined) | … | … | … | … | … | … | 2 | 1 | 1 | 15 | 7 | 6 | 5 | 1 | … | … | … | 1 | 1 | … | |
| Presbyterians— | |||||||||||||||||||||
| Church of Scotland, Free Church of Scotland, Free Presbyterians, Presbyterian Church of New Zealand, Presbyterian Church of Otago and Southland, and Presbyterians otherwise described | 195 | 94 | 101 | 58 | 29 | 29 | 551 | 281 | 270 | 1,994 | 1,029 | 965 | 1,294 | 643 | 651 | 547 | 312 | 235 | 171 | 89 | 82 |
| Reformed Presbyterians | … | … | … | … | … | … | … | … | … | … | … | … | … | … | … | … | … | … | … | … | … |
| Methodists— | |||||||||||||||||||||
| Wesleyan Methodists | 347 | 165 | 182 | 3 | 3 | … | 708 | 365 | 343 | 1,564 | 734 | 830 | 1,175 | 586 | 589 | 258 | 133 | 125 | 184 | 96 | 88 |
| Primitive Methodists | 3 | 2 | 1 | 10 | 4 | 6 | … | … | … | 104 | 55 | 49 | 42 | 26 | 16 | 122 | 63 | 59 | … | … | … |
| United Methodist Free Churches | 1 | 1 | … | 2 | 1 | 1 | 10 | 6 | 4 | 138 | 68 | 70 | 322 | 162 | 160 | 1 | … | 1 | 106 | 51 | 55 |
| Bible Christians | … | … | … | … | … | … | … | … | … | 59 | 31 | 28 | 49 | 25 | 24 | 2 | 1 | 1 | … | … | … |
| New Connection Methodists | … | … | … | … | … | … | … | … | … | 1 | … | 1 | … | … | … | … | … | … | … | … | … |
| Others | … | … | … | … | … | … | … | … | … | … | … | … | 5 | 2 | 3 | … | … | … | … | … | … |
| Other Protestants— | |||||||||||||||||||||
| Baptists | 36 | 17 | 19 | 13 | 7 | 6 | 41 | 21 | 20 | 518 | 251 | 267 | 188 | 89 | 99 | 84 | 46 | 38 | 74 | 38 | 36 |
| Congregational Independents | 8 | 6 | 2 | 8 | 4 | 4 | 3 | 2 | 1 | 374 | 166 | 208 | 95 | 43 | 52 | 220 | 105 | 115 | 8 | 4 | 4 |
| Lutherans | 4 | 2 | 2 | 3 | 3 | … | 20 | 18 | 2 | 93 | 60 | 33 | 41 | 24 | 17 | 7 | 6 | 1 | … | … | … |
| Unitarians | … | … | … | … | … | … | 1 | 1 | … | 12 | 9 | 3 | 10 | 4 | 6 | 1 | 1 | … | … | … | … |
| Society of Friends | … | … | … | 1 | 1 | … | … | … | … | 8 | 5 | 3 | 1 | 1 | … | 1 | 1 | … | 1 | 1 | … |
| Catholic Apostolic | … | … | … | … | … | … | 1 | 1 | … | 2 | 2 | … | 2 | … | 2 | … | … | … | … | … | … |
| Others | 1 | 1 | … | 2 | 2 | … | 12 | 8 | 4 | 202 | 105 | 97 | 137 | 61 | 76 | 48 | 25 | 23 | 3 | 1 | 2 |
| Catholics— | |||||||||||||||||||||
| Roman Catholics | 51 | 27 | 24 | 112 | 44 | 68 | 510 | 291 | 219 | 1,451 | 655 | 796 | 1,094 | 536 | 558 | 563 | 305 | 258 | 180 | 84 | 96 |
| Catholics undefined | … | … | … | … | … | … | 6 | 4 | 2 | 9 | 5 | 4 | … | … | … | 9 | 3 | 6 | … | … | … |
| Greek Church | … | … | … | … | … | … | … | … | … | … | … | … | … | … | … | … | … | … | … | … | … |
| Other Denominations— | |||||||||||||||||||||
| Litter-Day Saints or Mormons | … | … | … | … | … | … | … | … | … | 1 | 1 | … | 9 | 5 | 4 | 7 | 3 | 4 | 5 | … | 5 |
| Jews | … | … | … | … | … | … | … | … | … | 194 | 110 | 84 | 17 | 7 | 10 | 44 | 21 | 23 | 1 | 1 | … |
| Mahometans | … | … | … | … | … | … | … | … | … | … | … | … | … | … | … | … | … | … | … | … | … |
| Pagans | … | … | … | 3 | 3 | … | … | … | … | 26 | 26 | … | 7 | 7 | … | 6 | 6 | … | … | … | … |
| Others | … | … | … | … | … | … | … | … | … | 3 | 1 | 2 | … | … | … | … | … | … | … | … | … |
| No Denomination | 2 | 2 | … | … | … | … | 20 | 12 | 8 | 134 | 106 | 28 | 44 | 29 | 15 | 30 | 24 | 6 | 4 | 1 | 3 |
| No Religion | … | … | … | … | … | … | … | … | … | 6 | 6 | … | … | … | … | … | … | … | … | … | … |
| Unspecified | … | … | … | … | … | … | 36 | 27 | 9 | 32 | 27 | 5 | 13 | 8 | 5 | 7 | 3 | 4 | 2 | 1 | 1 |
| Object to state | 41 | 26 | 15 | 15 | 7 | 8 | 47 | 36 | 11 | 411 | 258 | 153 | 251 | 140 | 111 | 107 | 65 | 42 | 60 | 34 | 26 |
Table VIII. Table VIII. Showing the Religions of Persons, Males, and Females (exclusive of Maoris) in each Borough—
| Religious Denominations. | Waimate. | Oamaru. | Hampden. | Palmerston South. | West Hawkesbury. | Port Chalmers. | Dunedin. | ||||||||||||||
|---|---|---|---|---|---|---|---|---|---|---|---|---|---|---|---|---|---|---|---|---|---|
| Persons. | Males. | Females. | Persons. | Males. | Females. | Persons. | Males. | Females. | Persons. | Males. | Females. | Persons. | Males. | Females. | Persons. | Males. | Females. | Persons. | Males. | Females. | |
| Total | 1,600 | 870 | 730 | 5,791 | 3,007 | 2,784 | 327 | 180 | 147 | 968 | 518 | 450 | 415 | 206 | 209 | 2,181 | 1,156 | 1,025 | 24,372 | 12,246 | 12,126 |
| Episcopalians— | |||||||||||||||||||||
| Church of England—Episcopalians (not otherwise defined) | 522 | 284 | 238 | 1,525 | 792 | 733 | 117 | 62 | 55 | 300 | 157 | 143 | 188 | 100 | 88 | 636 | 351 | 285 | 7,179 | 3,667 | 3,512 |
| Protestants (not otherwise defined) | 24 | 10 | 14 | 38 | 22 | 16 | … | … | … | 9 | 7 | 2 | … | … | … | 61 | 39 | 22 | 268 | 142 | 126 |
| Presbyterians— | |||||||||||||||||||||
| Church of Scotland, Free Church of Scotland, Free Presbyterians, Presbyterian Church of New Zealand, Presbyterian Church of Otago and Southland, and Presbyterians otherwise described | 341 | 185 | 156 | 2,131 | 1,114 | 1,017 | 126 | 70 | 56 | 516 | 273 | 243 | 171 | 80 | 91 | 737 | 390 | 347 | 8,261 | 4,077 | 4,184 |
| Reformed Presbyterians | … | … | … | 3 | 1 | 2 | … | … | … | … | … | … | … | … | … | … | … | … | 2 | 1 | 1 |
| Methodists— | |||||||||||||||||||||
| Wesleyan Methodist | 297 | 146 | 151 | 535 | 263 | 272 | 17 | 7 | 10 | 42 | 20 | 22 | 35 | 17 | 18 | 235 | 119 | 116 | 988 | 478 | 510 |
| Primitive Methodists | 82 | 46 | 36 | 89 | 41 | 48 | 1 | 1 | … | … | … | … | 1 | 1 | … | … | … | … | 165 | 81 | 84 |
| United Methodist Free Churches | 2 | 2 | … | … | … | … | … | … | … | … | … | … | … | … | … | … | … | … | 12 | 10 | 2 |
| Bible Christians | 3 | 3 | … | … | … | … | … | … | … | … | … | … | … | … | … | … | … | … | 2 | 2 | … |
| New Connection Methodists | … | … | … | … | … | … | … | … | … | … | … | … | … | … | … | … | … | … | 6 | … | 6 |
| Others | … | … | … | … | … | … | … | … | … | … | … | … | … | … | … | … | … | … | 2 | 1 | 1 |
| Other Protestants— | |||||||||||||||||||||
| Baptists | 33 | 17 | 16 | 106 | 59 | 47 | 7 | 3 | 4 | 1 | 1 | … | 1 | … | 1 | 13 | 4 | 9 | 1,075 | 491 | 584 |
| Congregational Independents | 9 | 5 | 4 | 106 | 49 | 57 | … | … | … | 2 | 2 | … | … | … | … | 187 | 85 | 102 | 644 | 321 | 323 |
| Lutherans | 2 | 2 | … | 3 | 2 | 1 | … | … | … | … | … | … | … | … | … | 13 | 12 | 1 | 114 | 74 | 40 |
| Unitarians | … | … | … | 1 | 1 | … | … | … | … | 1 | 1 | … | … | … | … | … | … | … | 29 | 21 | 8 |
| Society of Friends | … | … | … | … | … | … | … | … | … | … | … | … | … | … | … | … | … | … | 2 | 1 | 1 |
| Catholic Apostolic | … | … | … | … | … | … | … | … | … | … | … | … | … | … | … | 1 | 1 | … | 1 | 1 | … |
| Others | 10 | 7 | 3 | 80 | 34 | 46 | 25 | 14 | 11 | … | … | … | … | … | … | 67 | 28 | 39 | 710 | 323 | 387 |
| Catholics— | |||||||||||||||||||||
| Roman Catholics | 236 | 137 | 99 | 950 | 477 | 473 | 27 | 20 | 7 | 62 | 33 | 29 | 17 | 6 | 11 | 176 | 87 | 89 | 2,907 | 1,301 | 1,606 |
| Catholics undefined | … | … | … | 5 | 3 | 2 | … | … | … | 3 | 2 | 1 | … | … | … | 1 | 1 | … | 74 | 38 | 36 |
| Greek Church | … | … | … | … | … | … | … | … | … | … | … | … | … | … | … | … | … | … | 1 | 1 | … |
| Other Denominations— | |||||||||||||||||||||
| Latter-Day Saints or Mormons | … | … | … | 1 | 1 | … | … | … | … | … | … | … | … | … | … | … | … | … | 7 | 3 | 4 |
| Jews | … | … | … | 4 | 3 | 1 | … | … | … | … | … | … | … | … | … | … | … | … | 312 | 157 | 155 |
| Mahometans | … | … | … | … | … | … | … | … | … | … | … | … | … | … | … | 1 | 1 | … | … | … | … |
| Pagans | … | … | … | 2 | 2 | … | … | … | … | 6 | 6 | … | … | … | … | 2 | 2 | … | 133 | 131 | 2 |
| Others | … | … | … | … | … | … | … | … | … | … | … | … | … | … | … | … | … | … | 31 | 12 | 19 |
| No Denomination | 8 | 6 | 2 | 68 | 51 | 17 | … | … | … | 10 | 7 | 3 | … | … | … | 22 | 18 | 4 | 6l2 | 422 | 190 |
| No Religion | … | … | … | … | … | … | … | … | … | … | … | … | … | … | … | 1 | 1 | … | 13 | 8 | 5 |
| Unspecified | 1 | 1 | … | 6 | 4 | 2 | … | … | … | 7 | 4 | 3 | … | … | … | 7 | 2 | 5 | 85 | 48 | 37 |
| Object to state | 30 | 19 | 11 | 138 | 88 | 50 | 7 | 3 | 4 | 9 | 5 | 4 | 2 | 2 | … | 21 | 15 | 6 | 737 | 434 | 303 |
Table VIII. Table VIII. Showing the Religions of Persons, Males, and Females (exclusive of Maoris) in each Borough—
| Religious Denominations. | Roslyn. | Caversham. | Mornington. | Maori Hill. | St. Kilda. | South Dunedin. | North-East Valley. | ||||||||||||||
|---|---|---|---|---|---|---|---|---|---|---|---|---|---|---|---|---|---|---|---|---|---|
| Persons. | Males. | Females. | Persons. | Males. | Females. | Persons. | Males. | Females. | Persons. | Males. | Females. | Persons. | Males. | Females. | Persons. | Males. | Females. | Persons. | Males. | Females. | |
| Total | 2,875 | 1,428 | 1,447 | 3,989 | 2,061 | 1,928 | 2,886 | 1,396 | 1,490 | 1,136 | 605 | 531 | 773 | 383 | 390 | 2,796 | 1,431 | 1,365 | 2,754 | 1,410 | 1,344 |
| Episcopalians— | |||||||||||||||||||||
| Church of England—Episcopalians (not otherwise defined) | 730 | 394 | 336 | 1,250 | 641 | 609 | 713 | 336 | 377 | 240 | 139 | 101 | 281 | 134 | 147 | 859 | 442 | 417 | 831 | 414 | 417 |
| Protestants (not otherwise defined) | 2 | 2 | … | 119 | 64 | 55 | 15 | 6 | 9 | 20 | 13 | 7 | … | … | … | 15 | 7 | 8 | 1 | 1 | … |
| Presbyterians— | |||||||||||||||||||||
| Church of Scotland, Free Church ? of Scotland, Free Presbyterians, Presbyterian Church of New Zealand, Presbyterian Church of Otago and Southland, .and Presbyterians otherwise described | 1,357 | 657 | 700 | 1,167 | 558 | 609 | 1,147 | 568 | 579 | 462 | 231 | 231 | 234 | 112 | 122 | 826 | 394 | 432 | 1,100 | 549 | 551 |
| Reformed Presbyterians | … | … | … | … | … | … | … | … | … | … | … | … | … | … | … | 2 | 2 | … | … | … | … |
| Methodists— | |||||||||||||||||||||
| Wesleyan Methodists | 53 | 18 | 35 | 172 | 88 | 84 | 288 | 132 | 156 | 25 | 18 | 7 | 11 | 7 | 4 | 65 | 36 | 29 | 104 | 59 | 45 |
| Primitive Methodists | 35 | 15 | 20 | 88 | 41 | 47 | 54 | 26 | 28 | … | … | … | 11 | 5 | 6 | 29 | 11 | 18 | 39 | 18 | 21 |
| United Methodist Free Churches | … | … | … | … | … | … | … | … | … | … | … | … | … | … | … | … | … | … | 3 | … | 3 |
| Bible Christians | … | … | … | … | … | … | … | … | … | … | … | … | 5 | 1 | 4 | … | … | … | … | … | … |
| New Connection Methodists | … | … | … | 1 | 1 | … | … | … | … | … | … | … | … | … | … | … | … | … | 3 | … | 3 |
| Others | … | … | … | … | … | … | … | … | … | … | … | … | … | … | … | … | … | … | … | … | … |
| Other Protestants— | |||||||||||||||||||||
| Baptists | 144 | 70 | 74 | 270 | 142 | 128 | 165 | 73 | 92 | 77 | 39 | 38 | 68 | 33 | 35 | 178 | 88 | 90 | 106 | 65 | 41 |
| Congregational Independents | 27 | 11 | 16 | 68 | 40 | 28 | 60 | 31 | 29 | 15 | 8 | 7 | 7 | 2 | 5 | 21 | 11 | 10 | 51 | 28 | 23 |
| Lutherans | 12 | 2 | 10 | 2 | 2 | … | 7 | 3 | 4 | 20 | 10 | 10 | … | … | … | 3 | 3 | … | 7 | 2 | 5 |
| Unitarians | 9 | 4 | 5 | … | … | … | 2 | 2 | … | … | … | … | … | … | … | … | … | … | 3 | 3 | … |
| Society of Friends | 9 | 5 | 4 | … | … | … | … | … | … | … | … | … | 2 | 1 | 1 | … | … | … | … | … | … |
| Catholic Apostolic | … | … | … | … | … | … | 2 | 1 | 1 | 1 | 1 | … | … | … | … | … | … | … | 6 | 4 | 2 |
| Others | 95 | 56 | 39 | 106 | 63 | 43 | 108 | 57 | 51 | 88 | 48 | 40 | 7 | 3 | 4 | 38 | 17 | 21 | 127 | 62 | 65 |
| Catholics— | |||||||||||||||||||||
| Roman Catholics | 301 | 134 | 167 | 390 | 200 | 190 | 126 | 49 | 77 | 156 | 77 | 79 | 107 | 57 | 50 | 547 | 274 | 273 | 227 | 113 | 114 |
| Catholics undefined | … | … | … | 12 | 9 | 3 | … | … | … | 6 | 2 | 4 | 1 | … | 1 | 6 | 6 | … | 1 | 1 | … |
| Greek Church | … | … | … | … | … | … | … | … | … | … | … | … | … | … | … | … | … | … | … | … | … |
| Other Denominations— | |||||||||||||||||||||
| Latter-Day Saints or Mormons | … | … | … | … | … | … | … | … | … | 1 | 1 | … | … | … | … | … | … | … | … | … | … |
| Jews | … | … | … | … | … | … | 3 | 1 | 2 | … | … | … | … | … | … | … | … | … | … | … | … |
| Mahometans | … | … | … | … | … | … | … | … | … | … | … | … | … | … | … | … | … | … | … | … | … |
| Pagans | 1 | 1 | … | 20 | 20 | … | 1 | 1 | … | … | … | … | … | … | … | 23 | 23 | … | 8 | 8 | … |
| Others | … | … | … | … | … | … | … | … | … | … | … | … | … | … | … | … | … | … | 1 | 1 | … |
| No Denomination | 32 | 21 | 11 | 159 | 91 | 68 | 63 | 41 | 22 | 9 | 6 | 3 | 13 | 11 | 2 | 85 | 55 | 30 | 38 | 26 | 12 |
| No Religion | … | … | … | … | … | … | 1 | 1 | … | … | … | … | … | … | … | 1 | … | 1 | 4 | 3 | 1 |
| Unspecified | 1 | 1 | … | 29 | 17 | 12 | 23 | 10 | 13 | 3 | 2 | 1 | … | … | … | 6 | 4 | 2 | 9 | 6 | 3 |
| Object to state | 67 | 37 | 30 | 136 | 84 | 52 | 108 | 58 | 50 | 13 | 10 | 3 | 26 | 17 | 9 | 92 | 58 | 34 | 85 | 47 | 38 |
Table VIII. Table VIII. Showing the Religions of Persons, Males, and Females (exclusive of Maoris) in each Borough—
| Religious Denominations. | West Harbour. | Green Island. | Milton. | Balclutha. | Tapanui. | Lawrence. | Roxburgh. | ||||||||||||||
|---|---|---|---|---|---|---|---|---|---|---|---|---|---|---|---|---|---|---|---|---|---|
| Persons. | Males. | Females. | Persons. | Males. | Females. | Persons. | Males. | Females. | Persons. | Males. | Females. | Persons. | Males. | Females. | Persons. | Males. | Females. | Persons. | Males. | Females. | |
| Total | 1,213 | 635 | 578 | 462 | 230 | 232 | 1,287 | 647 | 640 | 820 | 439 | 381 | 592 | 304 | 288 | 1,009 | 510 | 499 | 277 | 166 | 111 |
| Episcopalians— | |||||||||||||||||||||
| Church of England—Episcopalians (not otherwise defined) | 389 | 209 | 180 | 102 | 53 | 49 | 344 | 188 | 156 | 201 | 111 | 90 | 267 | 130 | 137 | 369 | 191 | 178 | 128 | 65 | 63 |
| Protestants (not otherwise defined) | 31 | 19 | 12 | 2 | 1 | 1 | … | … | … | 3 | 3 | … | … | … | … | … | … | … | … | … | … |
| Presbyterians— | |||||||||||||||||||||
| Church of Scotland, Free Church of Scotland, Free Presbyterians, Presbyterian Church of New Zealand, Presbyterian Church of Otago and Southland, and Presbyterians otherwise described | 280 | 139 | 141 | 248 | 121 | 127 | 642 | 311 | 331 | 392 | 196 | 196 | 201 | 102 | 99 | 330 | 173 | 157 | 49 | 27 | 22 |
| Reformed Presbyterians | … | … | … | … | … | … | … | … | … | … | … | … | … | … | … | … | … | … | … | … | … |
| Methodists— | |||||||||||||||||||||
| Wesleyan Methodists | 54 | 26 | 28 | 10 | 3 | 7 | 81 | 40 | 41 | 90 | 52 | 38 | 59 | 31 | 28 | 83 | 44 | 39 | 23 | 13 | 10 |
| Primitive Methodists | 44 | 22 | 22 | 6 | 3 | 3 | … | … | … | … | … | … | … | … | … | … | … | … | … | … | … |
| United Methodist Free Churches | … | … | … | … | … | … | … | … | … | … | … | … | … | … | … | … | … | … | … | … | … |
| Bible Christians | … | … | … | … | … | … | … | … | … | … | … | … | … | … | … | … | … | … | … | … | … |
| New Connection Methodists | … | … | … | … | … | … | … | … | … | … | … | … | … | … | … | … | … | … | … | … | … |
| Others | … | … | … | … | … | … | … | … | … | … | … | … | … | … | … | … | … | … | … | … | … |
| Other Protestants— | |||||||||||||||||||||
| Baptists | 36 | 16 | 20 | 27 | 13 | 14 | 28 | 8 | 20 | 19 | 12 | 7 | 5 | 4 | 1 | … | … | … | 1 | 1 | … |
| Congregational Independents | 80 | 42 | 38 | … | … | … | 5 | 3 | 2 | … | … | … | … | … | … | 69 | 30 | 39 | 1 | … | 1 |
| Lutherans | 19 | 11 | 8 | 1 | 1 | … | … | … | … | 1 | 1 | … | 4 | 4 | … | 1 | 1 | … | … | … | … |
| Unitarians | … | … | … | 1 | 1 | … | … | … | … | … | … | … | … | … | … | 1 | 1 | … | … | … | … |
| Society of Friends | 2 | 2 | … | … | … | … | 1 | 1 | … | … | … | … | … | … | … | 10 | 4 | 6 | … | … | … |
| Catholic Apostolic | … | … | … | … | … | … | … | … | … | … | … | … | … | … | … | … | … | … | … | … | … |
| Others | 56 | 28 | 28 | 24 | 14 | 10 | 7 | 3 | 4 | 1 | 1 | … | 7 | 4 | 3 | 1 | … | 1 | … | … | … |
| Catholics— | |||||||||||||||||||||
| Roman Catholics | 126 | 6l | 65 | 2 | … | 2 | 137 | 62 | 75 | 54 | 30 | 24 | 35 | 19 | 16 | 119 | 49 | 70 | 34 | 21 | 13 |
| Catholics undefined | … | … | … | … | … | … | … | … | … | 4 | 3 | 1 | … | … | … | … | … | … | 1 | 1 | … |
| Greek Church | … | … | … | … | … | … | … | … | … | … | … | … | … | … | … | … | … | … | … | … | … |
| Other Denominations— | |||||||||||||||||||||
| Latter-Day Saints or Mormons | … | … | … | … | … | … | … | … | … | … | … | … | … | … | … | … | … | … | … | … | … |
| Jews | 7 | 3 | 4 | … | … | … | … | … | … | … | … | … | … | … | … | 10 | 4 | 6 | … | … | … |
| Mahometans | … | … | … | … | … | … | … | … | … | … | … | … | … | … | … | … | … | … | … | … | … |
| Pagans | 14 | 14 | … | … | … | … | 4 | 4 | … | 1 | 1 | … | 1 | 1 | … | 6 | 6 | … | 31 | 31 | … |
| Others | … | … | … | … | … | … | … | … | … | … | … | … | 1 | 1 | … | … | … | … | … | … | … |
| No Denomination | 30 | 18 | 12 | 12 | 7 | 5 | 2 | 2 | … | 31 | 18 | 13 | 6 | 4 | 2 | 7 | 4 | 3 | 8 | 6 | 2 |
| No Religion | … | … | … | … | … | … | 1 | 1 | … | … | … | … | … | … | … | … | … | … | … | … | … |
| Unspecified | 4 | 2 | 2 | … | … | … | … | … | … | … | … | … | 2 | 2 | … | … | … | … | … | … | … |
| Object to state | 41 | 23 | 18 | 27 | 13 | 14 | 35 | 24 | 11 | 23 | 11 | 12 | 4 | 2 | 2 | 3 | 3 | … | 1 | 1 | … |
Table VIII. Table VIII. Showing the Religions of Persons, Males, and Females (exclusive of Maoris) in each Borough.
| Religious Denominations. | Naseby. | Alexandra. | Cromwell. | Arrowtown. | Queenstown. | Invercargill. | South Invercargill. | ||||||||||||||
|---|---|---|---|---|---|---|---|---|---|---|---|---|---|---|---|---|---|---|---|---|---|
| Persons. | Males. | Females. | Persons. | Males. | Females. | Persons. | Males. | Females. | Persons. | Males. | Females. | Persons. | Males. | Females. | Persons. | Males. | Females. | Persons. | Males. | Females. | |
| Total | 560 | 322 | 238 | 275 | 164 | 111 | 429 | 228 | 201 | 418 | 238 | 180 | 735 | 440 | 295 | 4,596 | 2,373 | 2,223 | 923 | 475 | 448 |
| Episcopalians— | |||||||||||||||||||||
| Church of England—Episcopalians (not otherwise defined) | 264 | 150 | 114 | 53 | 29 | 24 | 147 | 73 | 74 | 160 | 93 | 67 | 299 | 168 | 131 | 1,280 | 694 | 586 | 232 | 121 | 111 |
| Protestants (not otherwise defined) | 9 | 6 | 3 | … | … | … | 1 | 1 | … | … | … | … | … | … | … | 1 | 1 | … | … | … | … |
| Presbyterians— | |||||||||||||||||||||
| Church of Scotland, Free Church of Scotland, Free Presbyterians, Presbyterian Church of New Zealand, Presbyterian Church of Otago and Southland, and Presbyterians otherwise described | 142 | 77 | 65 | 134 | 74 | 60 | 117 | 56 | 61 | 106 | 56 | 50 | 191 | 100 | 91 | 1,790 | 924 | 866 | 299 | 147 | 152 |
| Reformed Presbyterians | … | … | … | … | … | … | … | … | … | … | … | … | … | … | … | … | … | … | … | … | … |
| Methodists— | |||||||||||||||||||||
| Wesleyan Methodists | 21 | 13 | 8 | … | … | … | 3 | 2 | 1 | 30 | 16 | 14 | 15 | 8 | 7 | 303 | 158 | 145 | 54 | 29 | 25 |
| Primitive Methodists | … | … | … | … | … | … | 1 | 1 | … | 1 | … | 1 | … | … | … | 112 | 47 | 65 | 37 | 18 | 19 |
| United Methodist Free Churches | … | … | … | … | … | … | … | … | … | … | … | … | … | … | … | 3 | 3 | … | … | … | … |
| Bible Christians | … | … | … | … | … | … | … | … | … | … | … | … | … | … | … | 2 | 2 | … | … | … | … |
| New Connection Methodists | … | … | … | … | … | … | … | … | … | … | … | … | … | … | … | … | … | … | … | … | … |
| Others | … | … | … | … | … | … | … | … | … | … | … | … | … | … | … | … | … | … | … | … | … |
| Other Protestants— | |||||||||||||||||||||
| Baptists | 10 | 4 | 6 | 4 | 2 | 2 | 2 | … | 2 | 8 | 6 | 2 | 4 | 2 | 2 | 135 | 58 | 77 | 36 | 20 | 16 |
| Congregational Independents | 2 | 2 | … | 13 | 4 | 9 | 2 | 1 | 1 | … | … | … | 2 | … | 2 | 15 | 7 | 8 | 2 | … | 2 |
| Lutherans | 4 | 4 | … | 3 | 3 | … | 2 | 2 | … | 1 | 1 | … | 4 | 3 | 1 | 15 | 14 | 1 | … | … | … |
| Unitarians | … | … | … | … | … | … | … | … | … | … | … | … | … | … | … | 12 | 7 | 5 | … | … | … |
| Society of Friends | … | … | … | … | … | … | … | … | … | 1 | 1 | … | 1 | 1 | … | 5 | 2 | 5 | … | … | … |
| Catholic Apostolic | … | … | … | … | … | … | … | … | … | … | … | … | … | … | … | … | … | … | … | … | … |
| Others | 1 | 1 | … | … | … | … | … | … | … | … | … | … | … | … | … | 90 | 41 | 49 | 14 | 8 | 6 |
| Catholics— | |||||||||||||||||||||
| Roman Catholics | 60 | 28 | 32 | 36 | 20 | 16 | 113 | 51 | 62 | 83 | 39 | 44 | 111 | 59 | 52 | 595 | 267 | 328 | 183 | 93 | 90 |
| Catholics undefined | 1 | … | 1 | … | … | … | … | … | … | … | … | … | … | … | … | 1 | … | 1 | … | … | … |
| Greek Church | … | … | … | … | … | … | … | … | … | … | … | … | … | … | … | … | … | … | … | … | … |
| Other Denominations— | |||||||||||||||||||||
| Latter-Day Saints or Mormons | … | … | … | … | … | … | … | … | … | … | … | … | … | … | … | 1 | 1 | … | … | … | … |
| Jews | … | … | … | … | … | … | 1 | 1 | … | … | … | … | 10 | 6 | 4 | l7 | 10 | 7 | … | … | … |
| Mahometans | … | … | … | … | … | … | … | … | … | … | … | … | … | … | … | … | … | … | … | … | … |
| Pagans | 22 | 22 | … | 29 | 29 | … | 33 | 33 | … | 18 | 18 | … | 75 | 75 | … | 18 | 18 | … | … | … | … |
| Others | … | … | … | … | … | … | … | … | … | … | … | … | … | … | … | 18 | 5 | 13 | 21 | 10 | 11 |
| No Denomination | 12 | 10 | 2 | 1 | 1 | … | 4 | 4 | … | … | … | … | 5 | 4 | 1 | 65 | 47 | 18 | 9 | 5 | 4 |
| No Religion | 7 | 2 | 5 | … | … | … | … | … | … | … | … | … | … | … | … | … | … | … | … | … | … |
| Unspecified | … | … | … | … | … | … | … | … | … | … | … | … | … | … | … | 5 | 3 | 2 | 2 | 1 | 1 |
| Object to state | 5 | 3 | 2 | 2 | 2 | … | 3 | 3 | … | 10 | 8 | 2 | 18 | 14 | 4 | 113 | 64 | 49 | 34 | 23 | 11 |
Table VIII. Table VIII. Showing the Religions of Persons, Males, and Females (exclusive of Maoris) in each Borough—
| Religious Denominations. | East Invercargill. | North Invercargill. | Campbelltown. | Avenal. | Gladstone. | Winton. | Riverton. | ||||||||||||||
|---|---|---|---|---|---|---|---|---|---|---|---|---|---|---|---|---|---|---|---|---|---|
| Persons. | Males. | Females. | Persons. | Males. | Females. | Persons. | Males. | Females. | Persons. | Males. | Females. | Persons. | Males. | Females. | Persons. | Males. | Females. | Persons. | Males. | Females. | |
| NOTE.—For totals of Boroughs see Table V. | |||||||||||||||||||||
| Total | 785 | 411 | 374 | 670 | 338 | 332 | 351 | 177 | 174 | 372 | 182 | 190 | 268 | 130 | 138 | 230 | 134 | 96 | 1,187 | 679 | 508 |
| Episcopalians— | |||||||||||||||||||||
| Church of England—Episcopalians (not otherwise defined) | 171 | 98 | 73 | 197 | 104 | 93 | 146 | 75 | 71 | 91 | 41 | 50 | 99 | 55 | 44 | 61 | 38 | 23 | 493 | 265 | 228 |
| Protestants (net otherwise defined) | 1 | 1 | … | 2 | 2 | … | … | … | … | … | … | … | … | … | … | 41 | 41 | … | 6 | 1 | 5 |
| Presbyterians— | |||||||||||||||||||||
| Church of Scotland, Free Church of Scotland, Free Presbyterians, Presbyterian Church of New Zealand, Presbyterian Church of Otago and Southland, and Presbyterians otherwise described | 368 | 196 | 172 | 240 | 110 | 130 | 97 | 45 | 52 | 146 | 71 | 75 | 121 | 54 | 67 | 58 | 15 | 43 | 389 | 193 | 196 |
| Reformed Presbyterians | … | … | … | … | … | … | … | … | … | … | … | … | … | … | … | … | … | … | … | … | … |
| Methodists— | |||||||||||||||||||||
| Wesleyan Methodists | 70 | 30 | 40 | 59 | 27 | 32 | 16 | 10 | 6 | 68 | 35 | 33 | 10 | 4 | 6 | 17 | 8 | 9 | 19 | 15 | 4 |
| Primitive Methodists | 47 | 26 | 21 | 45 | 26 | 19 | 15 | 8 | 7 | 9 | 6 | 3 | … | … | … | … | … | … | … | … | … |
| United Methodist Free Churches | … | … | … | … | … | … | … | … | … | … | … | … | … | … | … | … | … | … | … | … | … |
| Bible Christians | … | … | … | … | … | … | … | … | … | … | … | … | … | … | … | … | … | … | … | … | … |
| New Connection Methodists | … | … | … | … | … | … | … | … | … | … | … | … | … | … | … | … | … | … | 4 | 4 | … |
| Others | … | … | … | … | … | … | … | … | … | … | … | … | … | … | … | … | … | … | … | … | … |
| Other Protestants— | |||||||||||||||||||||
| Baptists | 2 | … | 2 | 16 | 6 | 10 | 6 | 3 | 3 | … | … | … | … | … | … | 2 | 2 | … | 20 | 11 | 9 |
| Congregational Independents | … | … | … | 1 | 1 | … | 9 | 5 | 4 | … | … | … | … | … | … | 1 | 1 | … | 10 | 4 | 6 |
| Lutherans | 4 | 4 | … | … | … | … | 1 | … | 1 | … | … | … | … | … | … | … | … | … | 3 | 2 | 1 |
| Unitarians | … | … | … | … | … | … | … | … | … | … | … | … | … | … | … | … | … | … | … | … | … |
| Society of Friends | … | … | … | … | … | … | 1 | 1 | … | … | … | … | … | … | … | … | … | … | … | … | … |
| Catholic Apostolic | … | … | … | 1 | … | 1 | … | … | … | … | … | … | … | … | … | … | … | … | … | … | … |
| Others | 11 | 8 | 3 | 9 | 7 | 2 | 1 | 1 | … | 12 | 5 | 7 | 8 | 3 | 5 | … | … | … | 25 | 16 | 9 |
| Catholics— | |||||||||||||||||||||
| Roman Catholics | 90 | 34 | 56 | 59 | 27 | 32 | 48 | 21 | 27 | 32 | 14 | 18 | 22 | 10 | 12 | 41 | 21 | 20 | 77 | 37 | 40 |
| Catholics undefined | … | … | … | … | … | … | … | … | … | … | … | … | … | … | … | … | … | … | … | … | … |
| Greek Church | … | … | … | … | … | … | … | … | … | … | … | … | … | … | … | … | … | … | … | … | … |
| Other Denominations— | |||||||||||||||||||||
| Latter-Day Saints or Mormons | … | … | … | … | … | … | … | … | … | … | … | … | … | … | … | … | … | … | … | … | … |
| Jews | … | … | … | … | … | … | … | … | … | … | … | … | … | … | … | … | … | … | 2 | 2 | … |
| Mahometans | … | … | … | … | … | … | … | … | … | … | … | … | … | … | … | … | … | … | … | … | … |
| Pagans | … | … | … | … | … | … | … | … | … | … | … | … | … | … | … | … | … | … | 109 | 109 | … |
| Others | … | … | … | … | … | … | … | … | … | 6 | 4 | 2 | … | … | … | … | … | … | … | … | … |
| No Denomination | 9 | 6 | 3 | 3 | 2 | 1 | 1 | 1 | … | 1 | 1 | … | … | … | … | 5 | 5 | … | 2 | 2 | … |
| No Religion | … | … | … | … | … | … | … | … | … | … | … | … | … | … | … | … | … | … | … | … | … |
| Unspecified | … | … | … | … | … | … | … | … | … | … | … | … | … | … | … | … | … | … | 3 | 3 | … |
| Object to state | 12 | 8 | 4 | 38 | 26 | 12 | 10 | 7 | 3 | 7 | 5 | 2 | 8 | 4 | 4 | 4 | 3 | 1 | 25 | 15 | 10 |
Table of Contents
Table I. Showing the Occupations of the Population under and over 20 Years of Age, Persons, Males, and Females (exclusive of Maoris), on the 3rd April, 1881, arranged in Six Classes; also the Proportions per Cent. of those of each Class to the Total.
| Class. | Occupations (arranged in Six Classes). | The Colony. | Under 20 Years of Age. | Over 20 Years of Age. | |||||||||||||||
|---|---|---|---|---|---|---|---|---|---|---|---|---|---|---|---|---|---|---|---|
| Numbers | Proportions per Cent. | Numbers. | Proportions per Cent. | Numbers | Proportions per Cent. | ||||||||||||||
| Persons. | Males. | Females. | Persons. | Males. | Females. | Persons. | Males. | Females. | Persons. | Males. | Females. | Persons. | Males. | Females. | Persons. | Males. | Females. | ||
| Total Population | 489,933 | 269,605 | 220,328 | ... | ... | ... | 250,565 | 125,948 | 124,617 | ... | ... | ... | 239,368 | 143,657 | 95,711 | ... | ... | ... | |
| Total of specified Occupations | 488,120 | 267,808 | 220,312 | 100.000 | 100.000 | 100.000 | 250,513 | 125,897 | 124,616 | 100.000 | 100.000 | 100.000 | 237,607 | 141,911 | 95,696 | 100.000 | 100.000 | 100.000 | |
| I. | Professional | 10,213 | 7,703 | 2,530 | 2.096 | 2.876 | 1.148 | 1,451 | 693 | 758 | .579 | .550 | .608 | 8,782 | 7,010 | 1,772 | 3.696 | 4.940 | 1.852 |
| II. | Domestic | 316,544 | 106,972 | 209,572 | 64.850 | 39.944 | 95.125 | 222,857 | 102,101 | 120,756 | 88.960 | 81.099 | 96.903 | 93,687 | 4,871 | 88,816 | 39.429 | 3.432 | 92.811 |
| III. | Commercial | 21,022 | 20,538 | 484 | 4.307 | 7.669 | .220 | 3,010 | 2,924 | 86 | 1.202 | 2.323 | .069 | 18,012 | 17,614 | 398 | 7.581 | 12.412 | .416 |
| IV. | Agricultural | 54,447 | 53,769 | 678 | 11.154 | 20.077 | .308 | 10,199 | 9,987 | 212 | 4.071 | 7.933 | .170 | 44,248 | 43,782 | 466 | 18.622 | 30.852 | .487 |
| V. | Industrial | 64,177 | 58,250 | 5,927 | 13.148 | 21.751 | 2.690 | 10,491 | 8,065 | 2,426 | 4.188 | 6.406 | 1.947 | 53,686 | 50,185 | 3,501 | 22.595 | 35.364 | 3.658 |
| VI. | Indefinite and Non-productive | 21,697 | 20,576 | 1,121 | 4.445 | 7.683 | .509 | 2,505 | 2,127 | 378 | 1.000 | 1.689 | .303 | 19,192 | 18,449 | 743 | 8.077 | 13.000 | .776 |
| Occupation not stated | 1,813 | 1,797 | 16 | ... | ... | ... | 52 | 51 | 1 | ... | ... | ... | 1,761 | 1,746 | 15 | ... | ... | ... | |
Table II. Showing the Occupations of the Population under and over Twenty Years of Age, Persons, Males, and Females (exclusive of Maoris), on the 3rd April, 1881; also the Proportions per Cent. of those of each Order to the Total.
| Class. | Order. | Occupations (arranged in Fifteen Orders). | The Colony. | Under Twenty Years of Age. | Over Twenty Years of Age. | |||||||||||||||
|---|---|---|---|---|---|---|---|---|---|---|---|---|---|---|---|---|---|---|---|---|
| Numbers. | Proportions per Cent. | Numbers | Proportions per Cent. | Numbers | Proportions per Cent. | |||||||||||||||
| Persons. | Males. | Females. | Persons. | Males. | Females. | Persons. | Males. | Females. | Persons. | Males. | Females. | Persons. | Males. | Females. | Persons. | Males. | Females. | |||
| Total Population | 489,933 | 269,605 | 220,328 | ... | ... | ... | 250,565 | 125,948 | 124,617 | ... | ... | ... | 239,368 | 143,657 | 95,711 | ... | ... | ... | ||
| Total of Specified Occupations | 488,120 | 267,808 | 220,312 | 100.000 | 100.000 | 100.000 | 250,513 | 125,897 | 124,616 | 100.000 | 100.000 | 100.000 | 237,607 | 141,911 | 95,696 | 100.000 | 100.000 | 100.000 | ||
| I. | I. | Persons engaged in the general or local government, or the defence or protection of the country | 2,963 | 2,946 | 23 | .607 | 1.098 | .010 | 167 | 166 | 1 | .067 | .131 | .001 | 2,796 | 2,774 | 22 | 1.177 | 1.955 | .023 |
| II. | Persons engaged in the learned professions, or in literature, art, science (with their immediate subordinates) | 7,270 | 4,763 | 2,507 | 1.489 | 1.779 | 1.138 | 1,284 | 527 | 757 | .513 | .418 | .607 | 5,986 | 4,236 | 1,750 | 2.519 | 2.985 | 1.829 | |
| II. | III. | Persons engaged in the domestic offices or duties of wives, mothers, mistresses of families, children, relatives (not otherwise returned) | 296,606 | 102,068 | 194,538 | 60.765 | 38.112 | 88.301 | 215,477 | 101,414 | 114,063 | 86.014 | 80.553 | 91.532 | 81,129 | 654 | 80,475 | 34.144 | .461 | 84.095 |
| IV. | Persons engaged in entertaining and performing personal offices for man | 19,938 | 4,904 | 15,034 | 4.085 | 1.831 | 6.824 | 7,380 | 687 | 6,693 | 2.946 | .545 | 5.371 | 12,558 | 4,217 | 8,341 | 5.285 | 2.972 | 8.716 | |
| III. | V. | Persons who buy and sell, keep or lend money, houses, or goods of various kinds | 9,649 | 9,209 | 440 | 1.977 | 3.439 | .200 | 1,535 | 1,452 | 83 | .613 | 1.153 | .067 | 8,114 | 7,757 | 357 | 3.415 | 5.466 | .373 |
| VI. | Persons engaged in the conveyance of men, animals, goods, and messages | 11,373 | 11,329 | 44 | 2.330 | 4.230 | .020 | 1,475 | 1,472 | 3 | .589 | 1.169 | .002 | 9,898 | 9,857 | 41 | 4.166 | 6.946 | .043 | |
| IV. | VII. | Persons possessing, working, or cultivating land; raising or dealing in animals; or following pursuits subsidiary thereto | 54,447 | 53,769 | 678 | 11.155 | 20.077 | .308 | 10,199 | 9,987 | 212 | 4.071 | 7.932 | .170 | 44,248 | 43,782 | 466 | 18.622 | 30.852 | .487 |
| V. | VIII. | Persons engaged in working and dealing in art and mechanic productions in which matters of various kinds are employed in combination | 17,602 | 17,439 | 163 | 3.606 | 6.512 | .074 | 2,979 | 2,928 | 51 | 1.189 | 2.325 | .041 | 14,623 | 14,511 | 112 | 6.154 | 10.225 | .117 |
| IX. | Persons working and dealing in textile fabrics, dress, and in fibrous materials | 11,930 | 6,389 | 5,541 | 2.444 | 2.286 | 2.515 | 3,852 | 1,518 | 2,334 | 1.5381.205 | 1.873 | 8.078 | 4,871 | 3,207 | 3.400 | 3.432 | 3.351 | ||
| X. | Persons working and dealing in food and drinks | 7,063 | 6,871 | 192 | 1.447 | 2.566 | .087 | 1,352 | 1,326 | 26 | .540 | 1.053 | .021 | 5,711 | 5,545 | 166 | 2.404 | 3.907 | .174 | |
| XI. | Persons working and dealing in animal and vegetable substance | 4,872 | 4,853 | 19 | .998 | 1.812 | .009 | 582 | 572 | 10 | .232 | .454 | .008 | 4,290 | 4,281 | 9 | 1.805 | 3.017 | .009 | |
| XII. | Persons working and dealing in minerals | 22,710 | 22,698 | 12 | 4.653 | 8.475 | .005 | 1,726 | 1,721 | 5 | .689 | 1.366 | .004 | 20,984 | 20,977 | 7 | 8.831 | 14,782 | .007 | |
| VI. | XIII. | Labourers and others (branch of labour undefined) | 17,822 | 17,786 | 36 | 3.651 | 6.641 | .016 | 1,589 | 1,574 | 15 | .634 | 1.250 | .012 | 16,233 | 16,212 | 21 | 6.832 | 11.424 | .022 |
| XIV. | Persons of property and rank (not returned under any office or occupation) | 399 | 278 | 121 | .081 | .104 | .055 | 3 | 2 | 1 | .001 | .001 | .001 | 396 | 276 | 120 | .167 | .194 | .125 | |
| XV. | Persons supported by the community, and of no specified occupation | 3,476 | 2,512 | 964 | .712 | .938 | .438 | 913 | 551 | 362 | .364 | .437 | .290 | 2,563 | 1,961 | 602 | 1.079 | 1.382 | .629 | |
| Occupations not stated | 1,813 | 1,797 | 16 | ... | ... | ... | 52 | 51 | 1 | ... | ... | ... | 1,761 | 1,746 | 15 | ... | ... | ... | ||
Table III. Showing the Occupations of the Population under and over 20 Years of Age, Persons, Males, and Females (exclusive of Maoris), on the 3rd April, 1881, arranged in Sixty-one Sub-Orders
| Class. | Orders. | Sub-Order. | Occupations (arranged in Sixty-one Sub-Orders). | The Colony. | Under 20 Years of Age. | Over 20 Years of Age. | ||||||
|---|---|---|---|---|---|---|---|---|---|---|---|---|
| Persons. | Males. | Females. | Persons. | Males. | Females. | Persons. | Males. | Females. | ||||
| Total Population | 489,933 | 269,605 | 220,328 | 250,565 | 125,948 | 124,617 | 239,368 | 143,657 | 95,711 | |||
| Total Specified Occupations | 488,120 | 267,808 | 220,312 | 250,513 | 125,897 | 124,616 | 237,607 | 141,911 | 95,696 | |||
| I. | I. | 1 | Officers of General Government | 1,972 | 1,949 | 23 | 153 | 152 | 1 | 1,819 | 1,797 | 22 |
| 2 | Officers of Local Government | 261 | 261 | ... | 7 | 7 | ... | 254 | 254 | ... | ||
| 3 | Defence | 730 | 730 | ... | 7 | 7 | ... | 723 | 723 | ... | ||
| II. | 1 | Clergymen, ministers, and church officers | 747 | 661 | 86 | 6 | 4 | 2 | 741 | 657 | 84 | |
| 2 | Law court officers, lawyers, and their immediate subordinates | 844 | 844 | ... | 155 | 155 | ... | 689 | 689 | ... | ||
| 3 | Physicians, surgeons, druggists, &c. | 810 | 755 | 55 | 80 | 80 | ... | 730 | 675 | 55 | ||
| 4 | Authors, literary persons, &c. | 121 | 116 | 5 | 5 | 4 | 1 | 116 | 112 | 4 | ||
| 5 | Scientific persons | 270 | 270 | ... | 9 | 9 | ... | 261 | 261 | ... | ||
| 6 | Teachers | 3,437 | 1,413 | 2,024 | 878 | 203 | 675 | 2,559 | 1,210 | 1,349 | ||
| 7 | Artists | 338 | 300 | 38 | 53 | 44 | 9 | 285 | 256 | 29 | ||
| 8 | Musicians, &c., music teachers | 447 | 190 | 257 | 77 | 19 | 38 | 370 | 171 | 199 | ||
| 9 | Actors, &c. | 256 | 214 | 42 | 21 | 9 | 12 | 235 | 205 | 30 | ||
| II. | III. | 1 | Wives and widows, of no specified occupation | 70,341 | ... | 70,341 | 1,004 | ... | 1,004 | 69,337 | ... | 69,337 |
| 2 | Sons, daughters, relatives, visitors (not otherwise specified) | 120,607 | 49,404 | 71,203 | 108,820 | 48,750 | 60,070 | 11,787 | 654 | 11,133 | ||
| 3 | Scholars (so described) | 105,638 | 52,664 | 52,994 | 105,653 | 52,664 | 52,989 | 5 | ... | 5 | ||
| IV. | 1 | Engaged in board and lodging | 3,196 | 2,437 | 759 | 53 | 44 | 9 | 3,143 | 2,393 | 750 | |
| 2 | Engaged in attendance | 16,742 | 2,467 | 14,275 | 7,327 | 643 | 6,684 | 9,415 | 1,824 | 7,591 | ||
| III. | V. | 1 | Mercantile persons | 6,770 | 6,603 | 167 | 1,139 | 1,089 | 50 | 5,631 | 5,514 | 117 |
| 2 | Other general dealers | 2,879 | 2,606 | 273 | 396 | 363 | 33 | 2,483 | 2,243 | 240 | ||
| VI. | 1 | Carriers on railways (not railway construction) | 1,157 | 1,157 | ... | 105 | 105 | ... | 1,052 | 1,052 | ... | |
| 2 | Carriers on roads | 3,574 | 3,569 | 5 | 337 | 337 | ... | 3,237 | 3,232 | 5 | ||
| 3 | Carriers on seas and rivers | 4,518 | 4,494 | 24 | 295 | 294 | 1 | 4,223 | 4,200 | 23 | ||
| 4 | Engaged in storage | 1,006 | 1,004 | 2 | 118 | 118 | ... | 888 | 886 | 2 | ||
| 5 | Messengers and porters | 1,118 | 1,105 | 13 | 620 | 618 | 2 | 498 | 487 | 11 | ||
| IV. | VII. | 1 | Engaged in agricultural pursuits | 42,722 | 42,108 | 614 | 8,911 | 8,704 | 207 | 33,811 | 33,404 | 407 |
| 2 | Engaged in pastoral pursuits | 5,541 | 5,512 | 29 | 532 | 527 | 5 | 5,009 | 4,985 | 24 | ||
| 3 | Engaged on land (not cultivating or grazing) | 3,924 | 3,891 | 33 | 327 | 327 | ... | 3,597 | 3,564 | 33 | ||
| 4 | Engaged about animals | 2,260 | 2,258 | 2 | 429 | 429 | ... | 1,831 | 1,829 | 2 | ||
| V. | VIII. | 1 | Engaged in books | 2,031 | 1,955 | 76 | 662 | 622 | 40 | 1,369 | 1,333 | 36 |
| 2 | Engaged in musical instruments | 63 | 60 | 3 | 4 | 4 | ... | 59 | 56 | 3 | ||
| V. | VIII. | 3 | Engaged in prints and pictures | 58 | 57 | 1 | 16 | 16 | ... | 42 | 41 | 1 |
| 4 | Engaged in carriages and figures | 32 | 29 | 3 | 6 | 4 | 2 | 26 | 25 | 1 | ||
| 5 | Engaged in tackle and sports and games | 5 | 4 | 1 | 1 | 1 | ... | 4 | 3 | 1 | ||
| 6 | Engaged in watches and philosophical instruments | 338 | 338 | ... | 62 | 62 | ... | 276 | 276 | ... | ||
| 7 | Engaged in surgical instruments | 3 | 3 | ... | ... | ... | ... | 3 | 3 | ... | ||
| 8 | Engaged in arms | 35 | 34 | 1 | 2 | 2 | ... | 33 | 32 | 1 | ||
| 9 | Engaged in machines and tools | 750 | 750 | ... | 130 | 130 | ... | 620 | 620 | ... | ||
| 10 | Engaged in carriages, harness, and implements | 1,521 | 1,521 | ... | 334 | 334 | ... | 1,187 | 1,187 | ... | ||
| 11 | Engaged in ships and boats | 752 | 749 | 3 | 88 | 87 | 1 | 664 | 662 | 2 | ||
| 12 | Engaged in houses and buildings | 10,864 | 10,826 | 38 | 1,377 | 1,377 | ... | 9,487 | 9,449 | 38 | ||
| 13 | Engaged in furniture | 1,079 | 1,047 | 32 | 293 | 285 | 8 | 786 | 262 | 24 | ||
| 14 | Engaged in chemicals | 71 | 66 | 5 | 4 | 4 | ... | 67 | 62 | 5 | ||
| IX. | 1 | Engaged in textiles fabrics | 2,026 | 1,802 | 224 | 524 | 418 | 106 | 1,502 | 1,384 | 118 | |
| 2 | Engaged in dress | 9,653 | 4,341 | 5,312 | 3,251 | 1,024 | 2,227 | 6,402 | 3,317 | 3,085 | ||
| 3 | Engaged in fibrous materials | 251 | 246 | 5 | 77 | 76 | 1 | 174 | 170 | 4 | ||
| X. | 1 | Engaged in animal food | 3,043 | 2,966 | 77 | 600 | 591 | 9 | 2,443 | 2,375 | 68 | |
| 2 | Engaged in vegetable food | 2,305,2,239 | 66 | 439,425 | 14 | 1,866 | 1,814 | 52 | ||||
| 3 | Engaged in drinks and stimulants | 1,715 | 1,666 | 49 | 313 | 310 | 3 | 1,402 | 1,356 | 46 | ||
| XI. | 1 | Engaged in animal matters | 746 | 738 | 8 | 132 | 128 | 4 | 614 | 610 | 4 | |
| 2 | Engaged in vegetable matters | 4,126 | 4,115 | 11 | 450 | 444 | 6 | 3,676 | 3,671 | 5 | ||
| XII. | 1 | Engaged in mining | 14,273 | 14,271 | 2 | 476 | 476 | ... | 13,797 | 13,795 | 2 | |
| 2 | Engaged in coal | 294 | 293 | 1 | 17 | 17 | ... | 277 | 276 | 1 | ||
| 3 | Engaged in stone, clay, earthenware, and glass | 4,181 | 4,174 | 7 | 297 | 292 | 5 | 3,884 | 3,882 | 2 | ||
| 4 | Engaged in water | 56 | 56 | ... | 2 | 2 | ... | 54 | 54 | ... | ||
| 5 | Engaged in gold, silver, and precious stones | 157 | 156 | 1 | 37 | 37 | ... | 120 | 119 | 1 | ||
| 6 | Engaged in metals other than gold and silver | 3,749 | 3,748 | 1 | 897 | 897 | ... | 2,852 | 2,851 | 1 | ||
| VI. | XIII. | 1 | Labourers (branch unspecified) | 14,904 | 14,904 | ... | 1,265 | 1,265 | ... | 13,639 | 13,639 | ... |
| 2 | Other indefinite occupations | 2,918 | 2,882 | 36 | 324 | 309 | 15 | 2,594 | 2,573 | 21 | ||
| XIV. | ... | Persons of property or rank (not returned under any under any other office or occupation) | 399 | 278 | 121 | 3 | 2 | 1 | 396 | 276 | 120 | |
| XV. | 1 | From voluntary sources and public revenue | 2,725 | 1,865 | 860 | 819 | 470 | 349 | 1,906 | 1,395 | 511 | |
| 2 | Criminal classes | 751 | 647 | 104 | 94 | 81 | 13 | 657 | 566 | 91 | ||
| Occupation not stated | 1,813 | 1,797 | 16 | 52 | 51 | 1 | 1,761 | 1,746 | 15 | |||
DETAILS OF OCCUPATIONS.—POPULATION UNDER AND OVER TWENTY YEARS.
Table IV. Showing the Occupations of the Population of the Colony, Persons, Males and Females (exclusive of Maoris), as on the 3rd April, 1881, distinguishing the Numbers under Twenty Years from those above Twenty Years of Age.
NOTE.—The numbers in the accompanying table have been obtained by arranging the occupations strictly in accordance with the descriptions given in the census schedules. The numbers given under the heading "Officers of the Government" do not represent the whole number employed by the Government, as the occupations of all officers engaged in exceptional services, such as Law Courts, Railway, Telegraph Departments, &c., have been placed in the classes to which those services belong. The numbers under "Trade and Manufactures" include all persons whose occupations were sufficiently defined to enable them to be classified in connection with the industry on which they were engaged. Many, chiefly those whose employment was of the nature of unskilled assistance, in giving an occupation did not give the industry in connection therewith. These necessarily are not given as employed in any special industry. Persons out of employment are included under their ordinary or former occupations. Inmates of hospitals and lunatic asylums are all included as inmates of charitable institutions. All prisoners are given as such under that heading. | |||||||||
|---|---|---|---|---|---|---|---|---|---|
| Occupations of Persons of both Sexes. | Population of the Colony. | Population under 20 Years. | Population over 20 Years. | ||||||
| Persons. | Males. | Females. | Persons. | Males. | Females. | Persons. | Males. | Females. | |
| Total Population | 489,933 | 269,605 | 220,328 | 250,565 | 125,948 | 124,617 | 239,368 | 143,657 | 95.711 |
| CLASS I.—PROFESSIONAL. | |||||||||
| Order I.—Persons engaged in the General or Local Governments, or the Defence or Protection of the Country. | |||||||||
| Sub-Order 1. Officers of General Government:— | |||||||||
| The Governor | 1 | 1 | ... | ... | ... | ... | 1 | 1 | ... |
| Cabinet Minister (not otherwise described) | 2 | 2 | ... | ... | ... | ... | 2 | 2 | ... |
| Member of Parliament (not otherwise described) | 3 | 3 | ... | ... | ... | ... | 3 | 3 | ... |
| Government Officer (other than professional or subordinate) | 908 | 956 | 2 | 107 | 107 | ... | 851 | 849 | 2 |
| 1 Architect, Surveyor, Civil Engineer, Draughtsman, Cadet | 219 | 219 | ... | 27 | 27 | ... | 192 | 192 | ... |
| Subordinate Officer | 164 | 164 | ... | 16 | 16 | ... | 148 | 148 | ... |
| Police | 457 | 457 | ... | 1 | 1 | ... | 456 | 456 | ... |
| Penal (including all persons employed in penal establishments, gaols, and reformatories) | 150 | 137 | 13 | 1 | 1 | ... | 149 | 136 | 13 |
| 2 Other Government Officers | 18 | 10 | 8 | 1 | ... | I | 17 | 10 | 7 |
| Sub-Order 2. Officers of Local Governments:— | |||||||||
| Member of Local Council (not otherwise described) | 16 | 16 | ... | ... | ... | ... | 16 | 16 | ... |
| Magistrate (J.P.) (not otherwise described) | 15 | 15 | ... | ... | ... | ... | 15 | 15 | ... |
| Officer of Local Body | 230 | 230 | ... | 7 | 7 | ... | 223 | 223 | ... |
| Sub-Order 3. Defence:— | |||||||||
| Army Officer | 20 | 20 | ... | ... | ... | ... | 20 | 20 | ... |
| Soldier | 3 | 3 | ... | ... | ... | ... | 3 | 3 | ... |
| Navy Officer | 3 | 3 | ... | ... | ... | ... | 3 | 3 | ... |
| Armed Constabulary or Militia Officer | 31 | 31 | ... | ... | ... | ... | 3 | 3 | ... |
| Armed Constabulary or Militia Private | 640 | 640 | ... | 7 | 7 | ... | 633 | 633 | ... |
| Volunteer (not otherwise described) | 2 | 2 | ... | ... | ... | ... | 2 | 2 | ... |
| 3 Others connected with Defence | 31 | 31 | ... | ... | ... | ... | 31 | 31 | ... |
| Order II.—Persons engaged in the Learned Professions, or in Literature, Art, and Science (with their immediate Subordinates). | |||||||||
| Sub-Order 1. Clergymen, Ministers, and Church Officers:— | |||||||||
| Clergyman | 556 | 556 | ... | ... | ... | ... | 556 | 556 | ... |
| Theological Student | 32 | 32 | ... | 2 | 2 | ... | 30 | 30 | ... |
| Irregular Clergy (Lay Reader, &c.) | 34 | 34 | ... | ... | ... | ... | 34 | 34 | ... |
| Church Officer | 32 | 32 | ... | ... | ... | ... | 32 | 32 | ... |
| Nun, Sister of Charity | 86 | ... | 86 | 2 | ... | 2 | 84 | ... | 84 |
| 1 Others connected with Religion | 7 | 7 | ... | 2 | 2 | ... | 5 | 5 | ... |
| Sub-Order 2. Law-court Officers, Lawyers, &c.:— | |||||||||
| Law-court Officer (not R.M. Court) | 59 | 59 | ... | 1 | 1 | ... | 58 | 58 | ... |
| Lawyer | 362 | 362 | ... | ... | ... | ... | 362 | 362 | ... |
| Law Student | 89 | 89 | ... | 29 | 29 | ... | 60 | 60 | ... |
| Law Clerk | 320 | 320 | ... | 124 | 124 | ... | 196 | 196 | ... |
| 5 Others connected with Law | 14 | 14 | ... | 1 | 1 | ... | 13 | 13 | ... |
Table 1.
| M. | F. | |
|---|---|---|
| 1. Architect | 2 | |
| Draughtsman | 74 | |
| Civil Engineer | 24 | |
| Surveyor | 90 | |
| Survey Cadet | 29 | |
| 2. Governor's Private Secretary | 1 | |
| Inspector of Public Works Department | 7 | |
| Plenipotentiary | 1 | |
| Postmistress | 1 | |
| Postmistress's Assistant | 1 | |
| Secretary to High Commissioner | 1 | |
| 3. Armourer, Defence Department | 2 | |
| Contractor, Armed Constabulary Force | 1 | |
| Custodian of Volunteers' Arms | 1 | |
| Defence Storekeeper | 2 | |
| Drill Instructor | 16 | |
| Drill-shed Caretaker | 1 | |
| Gunsmith, Defence Department | 1 | |
| Magazine-keeper | 4 | |
| Marker at Rifle-range | 3 | |
| 4. Catechist | 3 | |
| Church-cleaner | 1 | |
| Mormon Elder | 1 | |
| Professor of Theology | 1 | |
| Secretary to Bishop | 1 | |
| 5. Law Accountant | 4 | |
| Law Agent | 3 | |
| Law Stationer | 2 | |
| Law Writer | 1 | |
| Notary Public | 2 | |
| Secretary to Judge | 3 |
DETAILS OF OCCUPATIONS.—POPULATION UNDER AND OVER TWENTY YEARS.
Table IV. Showing the Occupations of the Population of the Colony, Persona, Males and Females (exclusive of Maoris), as on the 3rd April, 1881, distinguishing the Numbers under Twenty Years from those above Twenty Years of Age—continued.
| Occupations of Persons of both Sexes. | Population of the Colony. | Population under 20 Years. | Population over 30 Years. | ||||||
|---|---|---|---|---|---|---|---|---|---|
| Persons. | Males. | Females. | Persons. | Males. | Females. | Persons. | Males. | Females. | |
| CLASS I.—PROFESSIONAL.—continued. | |||||||||
| Order II.—Persons engaged in the Learned Professions, &c.—continued. | |||||||||
| Sub-Order 3. Physicians, Surgeons, Druggists:— | |||||||||
| Medical Man, Woman | 317 | 317 | ... | ... | ... | ... | 317 | 317 | ... |
| Medical Student | 10 | 10 | ... | ... | ... | ... | 10 | 10 | ... |
| Irregular Medical Practitioner | 7 | 7 | ... | ... | ... | ... | 7 | 7 | ... |
| Dentist (including Apprentice) | 46 | 45 | 1 | 4 | 4 | ... | 42 | 41 | 1 |
| 6 Chemist, Druggist, and Assistant | 362 | 359 | 3 | 71 | 71 | ... | 291 | 288 | 3 |
| Midwife | 51 | ... | 51 | ... | ... | ... | 51 | ... | 51 |
| 7 Others connected with Medicine, &c. | 17 | 17 | ... | 5 | 5 | ... | 12 | 12 | ... |
| Sub-Order 4. Authors, Literary Persons, &c.:— | |||||||||
| Author, Editor (not Newspaper) | 10 | 9 | 1 | ... | ... | ... | 10 | 9 | 1 |
| Reporter, Shorthand Writer | 46 | 46 | ... | 4 | 4 | ... | 42 | 42 | ... |
| Graduate of University (not otherwise described) | 7 | 7 | ... | ... | ... | ... | 7 | 7 | ... |
| 8 Others—Literary Persons | 58 | 54 | 4 | 1 | ... | 1 | 57 | 54 | 3 |
| Sub-Order 5. Scientific Persons:— | |||||||||
| Civil Engineer (not Government) | 228 | 228 | ... | 3 | 3 | ... | 225 | 225 | ... |
| Engineer's Draughtsman | 6 | 6 | ... | 1 | 1 | ... | 5 | 5 | ... |
| Analytical Chemist | 1 | 1 | ... | ... | ... | ... | 1 | 1 | ... |
| 9 Others—Scientific Persons | 35 | 35 | ... | 5 | 5 | ... | 30 | 30 | ... |
| Sub-Order 6. Teachers, &c.:— | |||||||||
| University Professor | 7 | 7 | ... | ... | ... | ... | 7 | 7 | ... |
| Inspector of Schools | 15 | 15 | ... | ... | ... | ... | 15 | 15 | ... |
| School Master, Mistress | 2,383 | 1,128 | 1,255 | 415 | 58 | 357 | 1,968 | 1,070 | 898 |
| Tutor, Governess | 494 | 18 | 476 | 97 | ... | 97 | 397 | 18 | 379 |
| Teacher of Accomplishments | 43 | 31 | 14 | 2 | ... | 2 | 43 | 31 | 12 |
| 10 Others connected with Education | 493 | 214 | 279 | 364 | 145 | 219 | 129 | 69 | 60 |
| Sub-Order 7. Fine Arts:— | |||||||||
| Artist, Painter | 92 | 71 | 21 | 1 | ... | 1 | 91 | 71 | 20 |
| Sculptor | 13 | 13 | ... | ... | ... | ... | 13 | 13 | ... |
| Engraver | 33 | 33 | ... | 8 | 8 | ... | 25 | 25 | ... |
| Diesinker, Medalist | 7 | 7 | ... | 1 | 1 | ... | 6 | 6 | ... |
| 11 Photographer and Assistant | 182 | 172 | 10 | 39 | 35 | 4 | 143 | 137 | 6 |
| 12 Others connected with Fine Arts | 11 | 4 | 7 | 4 | ... | 4 | 7 | 4 | 3 |
| Sub-Order 8. Musicians, Music Teachers:— | |||||||||
| Music Master, Mistress | 310 | 88 | 222 | 42 | 2 | 40 | 268 | 86 | 182 |
| Musician, Vocalist | 135 | 100 | 35 | 34 | 16 | 18 | 101 | 84 | 17 |
| 13 Others connected with Music | 2 | 2 | ... | 1 | 1 | ... | 1 | 1 | ... |
| Sub-Order 9. Actors, &c.:— | |||||||||
| Actor, Actress | 111 | 69 | 42 | 14 | 2 | 12 | 97 | 67 | 30 |
| Billiard-table Keeper, Marker | 123 | 123 | ... | 6 | 6 | ... | 117 | 117 | ... |
| 14 Others connected with Exhibitions | 22 | 22 | ... | 1 | 1 | ... | 21 | 21 | ... |
| CLASS II.—DOMESTIC. | |||||||||
| Order III.—Persons engaged in the Domestic Offices or Duties of Wives, Mothers, Mistresses of Families, Children, Relatives, Visitors (not otherwise described). | |||||||||
| Sub-Order 1. Wives and Widows:— | |||||||||
| Wife, Widow, of no specified occupation | 70,341 | ... | 70,341 | 1,004 | ... | 1,004 | 69,337 | ... | 69,337 |
| Sub-Order 2. Sons, Daughter, Relatives, Visitors:— | |||||||||
| Son, Daughter, Relative, Visitor (not otherwise described) | 120,607 | 49,404 | 71,203 | 108,820 | 48,750 | 60,070 | 11,787 | 654 | 11,133 |
| Sub-Order 3. Students and Scholars:— | |||||||||
| Scholar at Home | 6,553 | 2,732 | 3,821 | 6,852 | 2,732 | 3,820 | 1 | ... | 1 |
| Scholar at Public School | 85,857 | 44,207 | 41,650 | 85,857 | 44,207 | 41,650 | ... | ... | ... |
| Scholar at Private School | 13,248 | 5,725 | 7,523 | 13,244 | 5,725 | 7,519 | 4 | ... | 4 |
| Order IV.—Persons is engaged in Entertaining and Performing Personal Offices for Man. | |||||||||
| Sub-Order 1. In Board and Lodging:— | |||||||||
| Hotel-keeper | 1,591 | 1,470 | 121 | ... | ... | ... | 1,591 | 1,470 | 121 |
| Hotel-keeper's Wife assisting in business | 299 | ... | 299 | 2 | ... | 2 | 297 | ... | 297 |
| Coffee, Eating, House Keeper | 29 | 22 | 7 | ... | ... | ... | 29 | 22 | 7 |
| Coffee, Eating, House Keeper's Wife assisting in business | 3 | ... | 3 | ... | ... | ... | 3 | ... | 3 |
| Boarding, Lodging, House Keeper | 410 | 190 | 220 | 3 | 1 | 2 | 407 | 189 | 218 |
| Boarding, Lodging, House Keeper's Wife assisting in business | 10 | ... | 10 | ... | ... | ... | 10 | ... | 10 |
| Cook (not Domestic Servant) | 726 | 680 | 46 | 45 | 42 | 3 | 681 | 638 | 43 |
| Officer of Charitable Institution | 91 | 46 | 45 | 2 | 1 | 1 | 89 | 45 | 44 |
| Servants' Registry Office Keeper | 5 | ... | 5 | ... | ... | ... | 5 | ... | 5 |
| 15 Others engaged in Board and Lodging | 32 | 29 | 3 | 1 | ... | 1 | 31 | 29 | 2 |
| Sub-Order 2. In Attendance:— | |||||||||
| Domestic Servant | 12,874 | 899 | 11,975 | 6,651 | 372 | 6,279 | 6,223 | 527 | 5,696 |
| Housekeeper | 534 | ... | 534 | 24 | ... | 24 | 510 | ... | 510 |
| Inn, Club-house, Eating-house, Servant | 2,471 | 1,352 | 1,119 | 595 | 265 | 330 | 1,876 | 1,087 | 789 |
| Charitable Institution Servant | 274 | 140 | 134 | 34 | 4 | 30 | 240 | 136 | 104 |
| Nurse (not Domestic Servant, or Servant of Charitable Institution) | 408 | ... | 408 | 18 | ... | 18 | 390 | ... | 390 |
| Office Keeper, Cleaner, Porter, &c. (not Government) | 4 | 4 | ... | ... | ... | ... | 4 | 4 | ... |
| 16 Others engaged in Attendance | 177 | 72 | 105 | 5 | 2 | 3 | 172 | 70 | 102 |
| CLASS III.—COMMERCIAL. | |||||||||
| Order V.—Persons who Buy or Sell, Keep or Lend Money, Houses, or Goods of various Kinds. | |||||||||
| Sub-Order 1. Mercantile Persons:— | |||||||||
| Capitalist | 241 | 216 | 25 | ... | ... | ... | 241 | 216 | 25 |
| Merchant | 618 | 617 | 1 | 2 | 2 | ... | 616 | 615 | 1 |
| Auctioneer, Appraiser, Valuer | 188 | 188 | ... | ... | ... | ... | 188 | 188 | ... |
| Broker (not Share or Stock) | 42 | 42 | ... | ... | ... | ... | 42 | 42 | ... |
| Commission Agent, Factor | 569 | 569 | ... | 1 | 1 | ... | 568 | 568 | ... |
| Bank Officer, Clerk | 760 | 760 | ... | 141 | 141 | ... | 619 | 619 | ... |
| Public Company Officer | 152 | 152 | ... | 18 | 18 | ... | 134 | 134 | ... |
| Share, Stock, Broker, Dealer, Jobber | 11 | 11 | ... | ... | ... | ... | 11 | 11 | ... |
| 17 Commercial Clerk | 3,428 | 3,418 | 10 | 827 | 822 | 5 | 2,601 | 2,596 | 5 |
| Commercial Traveller, Salesman, Woman | 629 | 501 | 128 | 62 | 18 | 44 | 567 | 483 | 84 |
| 18 Others engaged in Mercantile Pursuits | 132 | 129 | 3 | 88 | 87 | 1 | 44 | 42 | 2 |
| Sub-Order 2. Other General Dealers:— | |||||||||
| 19 Shopkeeper (branch unspecified) and Assistants | 2,394 | 2,160 | 234 | 306 | 275 | 31 | 2,088 | 1,885 | 203 |
| Shopkeeper's Wife (branch unspecified) assisting in business | 20 | ... | 20 | ... | ... | ... | 20 | ... | 20 |
| 20 Pawnbroker | 29 | 27 | 2 | 5 | 5 | ... | 24 | 22 | 2 |
| Hawker, Pedlar | 177 | 173 | 4 | 6 | 6 | ... | 171 | 167 | 4 |
| 21 Other General Dealers | 259 | 246 | 13 | 79 | 77 | 2 | 180 | 169 | 11 |
| Order VI.— Persons engaged in the Conveyance of Men, Animals, Goods, and Messages. | |||||||||
| Sub-Order 1. Carriers on Railways:— | |||||||||
| Railway Officer, Clerk, Stationmaster | 397 | 397 | ... | 50 | 50 | ... | 347 | 347 | ... |
| Railway Engine-driver, Stoker, &c. | 233 | 233 | ... | 12 | 12 | ... | 221 | 221 | ... |
| Railway Servant | 465 | 465 | ... | 34 | 34 | ... | 431 | 431 | ... |
| 22 Others connected with Railways | 62 | 62 | ... | 9 | 9 | ... | 53 | 53 | ... |
| Sub-Order 2. Carriers on Roads:— | |||||||||
| Conch, Omnibus, Cab, Express, Owner | 169 | 168 | 1 | 3 | 3 | ... | 166 | 165 | 1 |
| Coach, Omnibus, Cab, Driver, Conductor | 399 | 399 | ... | 31 | 31 | ... | 368 | 368 | ... |
| Drayman, Carrier, Express Driver, Carter | 2,827 | 2,826 | 1 | 278 | 278 | ... | 2,549 | 2,548 | 1 |
| Livery Stable Keeper | 92 | 92 | ... | 8 | 8 | ... | 84 | 84 | ... |
| Toll Keeper, Contractor | 22 | 22 | ... | 5 | 5 | ... | 17 | 17 | ... |
| 23 Others connected with Conveyance on Roads | 65 | 62 | 3 | 12 | 12 | ... | 53 | 50 | 3 |
| Sub-Order 3. Carriers on Seas and Rivers:— | |||||||||
| Harbour, Pier, Service | 80 | 80 | ... | 5 | 5 | ... | 75 | 75 | ... |
| Pilot | 32 | 32 | ... | 5 | 5 | ... | 27 | 27 | ... |
| Lighthouse Keeper | 56 | 56 | ... | 2 | 2 | ... | 54 | 54 | ... |
| Ship-owner | 9 | 9 | ... | ... | ... | ... | 9 | 9 | ... |
| Ship Master, Officer, Sailor (Merchant Service) | 2,984 | 2,984 | ... | 191 | 191 | ... | 2,793 | 2,793 | ... |
| Engineer, Stoker, &c., of Steamer (Merchant Service) | 292 | 292 | ... | 5 | 5 | ... | 287 | 287 | ... |
| Ship Servant, Steward, Stewardess | 432 | 430 | 22 | 47 | 46 | 1 | 405 | 384 | 21 |
| Stevedore, Lumper | 194 | 194 | ... | 6 | 6 | ... | 188 | 188 | ... |
| Waterman, Boatman, &c. | 288 | 288 | ... | 31 | 31 | ... | 257 | 257 | ... |
| 24 Others connected with Seas and Rivers | 131 | 129 | 2 | 3 | 3 | ... | 128 | 126 | 2 |
| Sub-Order 4. Engaged in Storage:— | |||||||||
| Storekeeper (not Shopkeeper) | 6 | 4 | 2 | ... | ... | ... | 6 | 4 | 2 |
| Storeman (not Shopman) | 975 | 975 | ... | 112 | 112 | ... | 863 | 863 | ... |
| 25 Others connected with Storage | 25 | 25 | ... | 6 | 6 | ... | 19 | 19 | ... |
| Sub-Order 5. Messengers and Porters:— | |||||||||
| Messenger, Porter (not Government or Railway) | 290 | 290 | ... | 152 | 152 | ... | 138 | 138 | ... |
| Errand Boy, Girl | 206 | 203 | 1 | 202 | 202 | ... | 4 | 3 | 1 |
| Telegraph Service | 580 | 568 | 12 | 256 | 254 | 2 | 324 | 314 | 10 |
| 26 Others connected with Messages | 42 | 42 | ... | 10 | 10 | ... | 32 | 32 | ... |
| CLASS IV.—AGRICULTURAL. | |||||||||
| Order VII.—Persons Possessing, Working, or Cultivating Land, Raising or Dealing in Animals, or following Pursuits subsidiary thereto. | |||||||||
| Sub-Order 1. Engaged in Agricultural Pursuits:— | |||||||||
| Farmer, Market Gardener | 19,371 | 19,132 | 239 | 284 | 281 | 3 | 19,087 | 18,851 | 236 |
| Farmer's Wife assisting on faint | 66 | ... | 66 | ... | ... | ... | 66 | ... | 66 |
| Farmer's Son, Daughter, or other Relative over 15 years of age living on farm if not otherwise described, or under 15 if stated to be assisting on farm | 8,300 | 8,079 | 221 | 5,700 | 5,527 | 173 | 2,600 | 2,552 | 48 |
| Farm Bailiff, Overseer | 225 | 225 | ... | 4 | 4 | ... | 221 | 221 | ... |
| Farm Servant and Labourer | 12,544 | 12 461 | 83 | 2,719 | 2,688 | 31 | 9,825 | 9,773 | 52 |
| Gardener (not Domestic Servant) | 2,031 | 2,031 | ... | 123 | 123 | ... | 1,908 | 1,908 | ... |
| 27 Others connected with Agriculture | 185 | 180 | 5 | 81 | 81 | ... | 104 | 99 | 5 |
| CLASS IV.—AGRICULTURAL—continued. | |||||||||
| Order VII.—Persons Possessing, &c.—continued. | |||||||||
| Sub-Order 2. Engaged in Pastoral Pursuits:— | |||||||||
| Runholder, Grazier, Sheep or Cattle Farmer | 888 | 882 | 6 | 12 | 12 | ... | 876 | 870 | 6 |
| Runholder's or Grazier's Son, Daughter, or Relative over 15 years of age living on station or grazing farm if not otherwise described, or under 15 if stated to be assisting | 107 | 98 | 9 | 53 | 48 | 5 | 54 | 50 | 4 |
| Station or Grazing Farm Overseer, Superintendent, Manager | 371 | 371 | ... | 10 | 10 | ... | 361 | 361 | ... |
| 28 Station or Grazing Farm Servant, Labourer | 4,063 | 4,049 | 14 | 435 | 435 | ... | 3,628 | 3,614 | 14 |
| 29 Others connected with Grazing | 112 | 112 | 22 | 22 | ... | 90 | 90 | ... | |
| Sub-Order 3. Engaged on Land (not cultivating or grazing):— | |||||||||
| Landowner | 373 | 340 | 33 | 2 | 2 | ... | 371 | 338 | 33 |
| Land, Estate, Agent | 101 | 101 | ... | ... | ... | ... | 101 | 101 | ... |
| Land Surveyor (not Government) | 441 | 441 | ... | 24 | 24 | ... | 417 | 417 | ... |
| Agricultural Implement Owner, Worker | 273 | 273 | ... | 16 | 16 | ... | 257 | 257 | ... |
| Grubber, Bushman (not Fencer or Splitter) | 2,248 | 2,248 | ... | 228 | 228 | ... | 2,020 | 2,020 | ... |
| 30 Others engaged on Land (not cultivating or grazing) | 488 | 488 | 57 | 57 | 431 | 431 | |||
| Sub-Order 4. Engaged about Animals:— | |||||||||
| Horse Owner, Breeder, Dealer | 48 | 48 | ... | 2 | 2 | ... | 46 | 46 | ... |
| Veterinary Surgeon, Farrier (not Horse-shoer) | 83 | 83 | ... | 3 | 3 | ... | 80 | 80 | ... |
| Groom, Jockey, Horsebreaker (not Domestic Servant) | 756 | 755 | 1 | 232 | 232 | 524 | 523 | 1 | |
| Live Stock Salesman | 39 | 39 | ... | 3 | 3 | ... | 36 | 36 | ... |
| Animal, Bird, Dealer, Keeper | 11 | 11 | ... | ... | ... | ... | 11 | 11 | ... |
| Rabbit, Catcher, Killer | 709 | 709 | ... | 122 | 122 | ... | 587 | 587 | ... |
| Fisherman | 382 | 381 | 1 | 45 | 45 | ... | 337 | 336 | 1 |
| 31 Others engaged about Animals | 232 | 232 | ... | 22 | 22 | ... | 210 | 210 | ... |
| CLASS V.—INDUSTRIAL. | |||||||||
| Order VIII.—Persons engaged in Working and Dealing in Art and Mechanic Productions in which Mutters of various Kinds are employed in Combination. | |||||||||
| Sub-Order 1. In Books:— | |||||||||
| 32 Bookseller, Stationer, Publisher | 246 | 230 | 16 | 50 | 48 | 2 | 196 | 182 | 14 |
| 33 Bookbinder | 149 | 109 | 40 | 62 | 37 | 25 | 87 | 72 | 15 |
| 34 Printer, Compositor | 1,270 | 1,260 | 10 | 506 | 497 | 9 | 764 | 763 | 1 |
| Newspaper Proprietor, Editor, Publisher | 212 | 212 | ... | 3 | 3 | ... | 209 | 209 | ... |
| 35 Others connected with Books | 154 | 144 | 10 | 41 | 37 | 4 | 113 | 107 | 6 |
| Sub-order 2. In Musical Instruments:— | |||||||||
| Musical Instrument Maker, Dealer | 21 | 21 | ... | 2 | 2 | ... | 19 | 19 | ... |
| Music Publisher, Seller | 15 | 12 | 3 | 2 | 2 | ... | 13 | 10 | 3 |
| 36 Others connected with Musical Instruments | 27 | 27 | ... | ... | ... | 27 | 27 | ... | |
| Sub-Order 3. In Prints and Pictures:— | |||||||||
| Lithographer, Lithographic Printer | 55 | 55 | ... | 16 | 16 | ... | 39 | 39 | ... |
| Picture Cleaner, Dealer | 2 | 2 | ... | ... | ... | ... | ... | ... | ... |
| 37 Others connected with Prints and Pictures | 1 | ... | 1 | ... | ... | ... | 1 | ... | 1 |
| Sub-Order 4. In Carving and Figures:— | |||||||||
| Wood-carver | 14 | 14 | ... | 4 | 4 | ... | 10 | 10 | ... |
| Taxidermist | 9 | 9 | ... | ... | 9 | 9 | ... | ||
| 38 Others connected with Carvings and Figures | 9 | 6 | 3 | 2 | ... | 2 | 7 | 6 | 1 |
| Sub — Order 5. In Tackle for Sports and Games:— | |||||||||
| Toy Maker, Dealer | 4 | 3 | 1 | 1 | 1 | 3 | 2 | 1 | |
| Billiard-table Maker | 1 | 1 | ... | ... | ... | 1 | 1 | ... | |
| Sub-Order 6. In Watches and Philosophical Instruments:— | |||||||||
| 39 Watch, Clock, Maker | 329 | 329 | ... | 61 | 61 | 268 | 268 | ... | |
| Optician | 9 | 9 | ... | 1 | 1 | 8 | 8 | ... | |
| Sub-Order 7. In Surgical Instruments:— | |||||||||
| Surgical Instrument Maker, Dealer | 2 | 2 | ... | ... | ... | 2 | 2 | ... | |
| 40 Others | 1 | 1 | ... | ... | ... | 1 | 1 | ... | |
| Sub-Order 8. In Arms: — | |||||||||
| Gunsmith | 32 | 32 | ... | 2 | 2 | ... | 30 | 30 | |
| 41 Others making and dealing in Arms | 3 | 2 | 1 | ... | ... | ... | 3 | 2 | 1 |
| Sub-Order 9. In Machines and Tools:— | |||||||||
| 42 Engine, Machine Maker, Dealer | 699 | 699 | ... | 123 | 123 | ... | 576 | 576 | ... |
| Tool Maker, Dealer | 4 | 4 | ... | ... | ... | ... | 4 | 4 | ... |
| Cutler | 22 | 22 | ... | 4 | 4 | ... | 18 | 18 | ... |
| 43 Others making and dealing in Machines and Tools | 25 | 25 | ... | 3 | 3 | ... | 22 | 22 | |
| Sub-Order 10. In Carriage, Harness, and Implements:— | |||||||||
| 41 Coach Maker, Dealer | 407 | 407 | ... | 95 | 95 | ... | 312 | 312 | ... |
| Railway Carriage Maker | 12 | 12 | ... | 3 | 3 | ... | 9 | 9 | ... |
| Perambulator Maker | 3 | 3 | ... | ... | ... | ... | 3 | 3 | ... |
| 45 Saddler, Harness Maker, Dealer | 675 | 675 | ... | 174 | 174 | ... | 501 | 501 | ... |
| Whipmaker | 8 | 8 | ... | 1 | 1 | ... | 7 | 7 | |
| 46 Wheelwright | 319 | 319 | ... | 45 | 45 | ... | 274 | 274 | ... |
| 47 Millwright | 78 | 78 | ... | 9 | 9 | ... | 69 | 69 | ... |
| 48 Agricultural Implement Maker, Dealer | 17 | 17 | ... | 6 | 6 | ... | 11 | 11 | ... |
| 49 Others making and dealing in Carriages, Harness, and Implements | 2 | 2 | ... | 1 | 1 | ... | 1 | 1 | ... |
| Sub-Order 11. In Ships and Boats:— | |||||||||
| 50 Shipbuilder, Shipwright | 499 | 499 | 42 | 42 | ... | 457 | 457 | ... | |
| Shiprigger | 4 | 4 | ... | ... | ... | ... | 4 | 4 | ... |
| 51 Shipchandler | 18 | 17 | 1 | 2 | 2 | ... | 16 | 15 | 1 |
| Block, Oar, Mast Maker | 7 | 7 | ... | 1 | 1 | ... | 6 | 6 | ... |
| 52 Boatbuilder | 103 | 103 | ... | 23 | 23 | ... | 80 | 80 | ... |
| 53 Sailmaker | 119 | 117 | 2 | 20 | 19 | 1 | 99 | 98 | 1 |
| 54 Others connected with Ships and Boats | 2 | 2 | ... | ... | ... | ... | 2 | 2 | ... |
| Sub-Order 12. In Houses and Buildings:— | |||||||||
| House Owner | 202 | 164 | 38 | ... | ... | ... | 202 | 164 | 38 |
| House Agent, Factor, Rent Collector | 10 | 10 | ... | ... | ... | 10 | 10 | ... | |
| Architect | 162 | 162 | 13 | 13 | ... | 149 | 149 | ||
| Builder | 699 | 699 | ... | 15 | 15 | 684 | 684 | ||
| 55 Carpenter, Joiner | 6,272 | 6,272 | ... | 728 | 728 | ... | 5,544 | 5,544 | ... |
| 56 Bricklayer | 715 | 715 | ... | 59 | 59 | ... | 656 | 656 | ... |
| 57 Mason, Pavior | 477 | 477 | ... | 35 | 35 | ... | 442 | 442 | ... |
| Slater, Shingler, Tiler | 51 | 51 | ... | 3 | 3 | ... | 48 | 48 | ... |
| 58 Plasterer | 273 | 273 | ... | 57 | 57 | ... | 216 | 216 | ... |
| Sub-Order 12. In Houses and Buildings—contd. | |||||||||
| 59 Painter, Plumber, Glazier, Paperhanger | 1,898 | 1,898 | 439 | 439 | ... | 1,459 | 1,459 | ... | |
| Contractor for Buildings | 12 | 12 | ... | ... | ... | ... | 12 | 12 | ... |
| 60 Others engaged in Houses and Buildings | 93 | 93 | ... | 28 | 28 | ... | 65 | 65 | ... |
| Sub-Order 13. In Furniture:— | |||||||||
| 61 Furniture Maker, Cabinet Maker, Upholsterer | 967 | 939 | 28 | 275 | 268 | 7 | 692 | 671 | 21 |
| Furniture Broker. Dealer | 20 | 19 | 1 | ... | ... | ... | 20 | 19 | 1 |
| Picture Frame Maker | 12 | 12 | ... | 1 | 1 | ... | 11 | 11 | ... |
| Carver, Gilder | 39 | 39 | 12 | 12 | ... | 27 | 27 | ... | |
| Mattrass, Bed, Maker | 28 | 25 | 3 | 5 | 4 | 1 | 23 | 21 | 2 |
| 62 Others making and dealing in Furniture | 13 | 13 | ... | ... | ... | ... | 13 | 13 | ... |
| Sub-Order 14. In Chemicals:— | |||||||||
| Drysalter | 3 | 3 | ... | ... | ... | ... | 3 | 3 | ... |
| 63 Dyer, Scourer, &c. | 39 | 34 | 5 | 3 | 3 | ... | 36 | 31 | 5 |
| Asphalt Maker, Worker | 22 | 22 | ... | 1 | 1 | ... | 21 | 21 | ... |
| 64 Others working & dealing in Chemicals | 7 | 7 | ... | ... | ... | ... | 7 | 7 | ... |
| Order IX.—Persons Working and Dealing in Textile Fabrics, in Dress, and in Fibrous Materials. | |||||||||
| Sub-Order 1. In Textile Fabrics:— | |||||||||
| Manchester Warehouseman | 55 | 55 | ... | 4 | 4 | ... | 51 | 51 | ... |
| 65 Draper, Linen Draper, Mercer | 1,464 | 1,376 | 88 | 345 | 334 | 11 | 1,119 | 1,942 | 77 |
| 66 Wool Stapler, Classer, &c. | 182 | 182 | ... | 16 | 16 | ... | 166 | 166 | ... |
| 67 Woollen Manufacturer, &c. (all branches) | 297 | 161 | 136 | 158 | 63 | 95 | 139 | 98 | 41 |
| Woollen Dealer | 15 | 15 | ... | ... | ... | ... | 15 | 15 | ... |
| Silk Dealer | 2 | 2 | ... | ... | ... | ... | 2 | 2 | ... |
| 68 Others working and dealing in Textile Fabrics | 11 | 11 | ... | 1 | 1 | ... | 10 | 10 | ... |
| Sub-Order 2. In Dress:— | |||||||||
| 69 Hairdresser, Wigmaker | 190 | 188 | 2 | 36 | 36 | ... | 154 | 152 | 2 |
| 70 Hat, Cap, Maker, Straw-hat, Bonnet, Maker | 68 | 51 | 17 | 23 | 14 | 9 | 45 | 37 | 8 |
| 71 Tailor, Tailoress | 1,457 | 1,041 | 416 | 403 | 173 | 230 | 1,054 | 868 | 186 |
| Furrier | 4 | 4 | ... | 1 | 1 | 3 | 3 | ||
| 72 Outfitter, Clothes Dealer, Slopseller | 37 | 34 | 3 | 11 | 11 | 26 | 23 | 1 | |
| 73 Milliner, Dressmaker | 3,658 | ... | 3,658 | 1,592 | ... | 1,592 | 2,066 | ... | 2,066 |
| Shirtmaker, Seamstress | 221 | 6 | 215 | 50 | 1 | 49 | 171 | 5 | 166 |
| 74 Clothing Manufacturer | 27 | 26 | 1 | 4 | 3 | 1 | 23 | 23 | ... |
| Machinist, Sewing Machinist (not otherwise described) | 378 | 80 | 298 | 209 | 26 | 183 | 169 | 54 | 115 |
| Hosier, Haberdasher, Glover | 21 | 18 | 3 | 2 | 2 | 1 | 18 | 16 | 2 |
| 75 Shoe, Boot, Maker, Dealer | 3,032 | 2,855 | 177 | 891 | 755 | 136 | 2,141 | 2,100 | 41 |
| Shoeblack | 3 | 3 | ... | ... | ... | ... | 3 | 3 | ... |
| Umbrella, Parasol, Stick, Maker, Dealer, Mender | 20 | 18 | 2 | 2 | 2 | ... | 18 | 16 | 2 |
| Washerwoman, Mangier, Laundry Keeper, Worker | 500 | 7 | 493 | 18 | ... | 18 | 482 | 7 | 475 |
| 76 Others working and dealing in Dress | 37 | 10 | 27 | 8 | ... | 8 | 29 | 10 | 19 |
| Sub-Order 3. In Fibrous Materials:— | |||||||||
| 77 Flax, Phormium, Manufacture (all branches) | 100 | 100 | ... | 35 | 35 | ... | 65 | 65 | ... |
| 78 Mat Maker, Dealer | 5 | 5 | ... | ... | ... | ... | 5 | 5 | ... |
| 79 Rope, Cord, Maker, Dealer | 107 | 105 | 2 | 39 | 38 | 1 | 68 | 67 | 1 |
| Tent, Tarpaulin, Maker, Dealer | 32 | 29 | 3 | 2 | 2 | ... | 30 | 27 | 3 |
| 80 Others working and dealing in Fibrous Materials | 7 | 7 | ... | 1 | 1 | ... | 6 | 6 | ... |
| Order X.—Persons Working and Dealing in Food and Drinks. | |||||||||
| Sub-Order 1. In Animal Food:— | |||||||||
| 81 Dairyman, Woman, Milkseller | 632 | 562 | 70 | 103 | 95 | 8 | 529 | 467 | 62 |
| Cheesemonger | 1 | 1 | ... | ... | ... | ... | 1 | 1 | ... |
| 82 Butcher, Meat Salesman | 2,214 | 2,212 | 2 | 480 | 479 | 1 | 1,734 | 1,733 | 1 |
| Butcher's Wife assisting in business | 1 | ... | 1 | ... | ... | ... | 1 | ... | 1 |
| 83 Provision Curer, Dealer, Meat-preserving | 34 | 34 | ... | 5 | 5 | ... | 29 | 29 | ... |
| 84 Poulterer, Game Dealer | 11 | 11 | ... | 1 | 1 | ... | 10 | 10 | ... |
| Fishmonger, Curer, Dealer | 120 | 120 | ... | 8 | 8 | ... | 112 | 112 | ... |
| Oyster, Shellfish, Dealer | 26 | 23 | 3 | 3 | 3 | ... | 23 | 20 | 3 |
| 85 Others working and dealing in Animal Food | 4 | 3 | 1 | ... | ... | ... | 4 | 3 | 1 |
| Sub-Order 2. In Vegetable Food:— | |||||||||
| Corn, Flour, Meal, Merchant, Dealer | 74 | 74 | ... | ... | ... | ... | 74 | 74 | ... |
| 86 Miller, Flour-mill Worker | 418 | 418 | ... | 59 | 59 | ... | 359 | 359 | ... |
| 87 Baker | 1,372 | 1,359 | 13 | 293 | 288 | 5 | 1,079 | 1,071 | 8 |
| 88 Confectioner, Pastry-cook | 203 | 192 | 11 | 53 | 51 | 2 | 150 | 141 | 9 |
| 89 Greengrocer, Fruiterer | 159 | 119 | 40 | 25 | 19 | 6 | 134 | 100 | 34 |
| Seed Merchant, Dealer | 51 | 51 | 3 | 3 | 48 | 48 | |||
| 90 Others working and dealing in Vegetable Food | 28 | 26 | 2 | 6 | 5 | 1 | 22 | 21 | 1 |
| Sub-Order 3. In Drinks and Stimulants:— | |||||||||
| 91 Brewer | 412 | 410 | 2 | 39 | 38 | 1 | 373 | 372 | 1 |
| 92 Maltster | 78 | 78 | ... | 5 | 5 | ... | 73 | 73 | ... |
| Wine, Spirit, Merchant | 24 | 24 | ... | ... | ... | ... | 24 | 24 | ... |
| Wine Manufacturer | 3 | 3 | ... | ... | ... | ... | 3 | 3 | ... |
| 93 Aërated Waters, Cordial, Manufacturer | 163 | 163 | ... | 29 | 29 | 134 | 134 | ... | |
| 94 Coffee, Chicory, Roaster, Dealer | 7 | 7 | ... | 2 | 2 | ... | 5 | 5 | ... |
| 95 Grocer, Tea Dealer | 919 | 875 | 44 | 223 | 221 | 2 | 696 | 654 | 42 |
| 96 Tobacconist, Manufacturer | 81 | 79 | 2 | 10 | 10 | ... | 71 | 69 | 2 |
| Sugar Boiler | 6 | 6 | ... | 1 | 1 | ... | 5 | 5 | ... |
| 97 Others working and dealing in Drinks and Stimulants | 22 | 21 | 1 | 4 | 4 | ... | 18 | 17 | 1 |
| Order XI.—Persons Working and Dealing in Animal and Vegetable Substances. | |||||||||
| Sub-Order 1. In Animal Matters:— | |||||||||
| 98 Soapboiler | 41 | 41 | ... | 6 | 6 | ... | 35 | 35 | ... |
| 99 Tallow Chandler | 25 | 25 | ... | 9 | 9 | ... | 16 | 16 | ... |
| Sub-Order 1—continued. | |||||||||
| 100 Tallow Melter, Boiler-down (not meat-preserving) | 27 | 27 | ... | 1 | 1 | ... | 26 | 26 | ... |
| 101 Manure Manufacturer, Dealer | 8 | 8 | ... | ... | ... | ... | 8 | 8 | ... |
| Hide, Skin, Dealer | 9 | 9 | ... | 1 | 1 | ... | 8 | 8 | ... |
| 102 Fellmonger, Wool-scourer | 298 | 298 | ... | 53 | 53 | ... | 245 | 245 | ... |
| 103 Tanner | 146 | 146 | ... | 14 | 14 | ... | 132 | 132 | ... |
| 104 Currier | 98 | 98 | ... | 17 | 17 | ... | 81 | 81 | ... |
| 105 Leather Manufacturer | 17 | 17 | ... | 6 | 6 | ... | 11 | 11 | ... |
| Feather Dresser, Cleaner, Dealer | 3 | 1 | 2 | 1 | ... | 1 | 2 | 1 | 1 |
| 106 Hairbrush, Broom, Maker, Dealer | 29 | 33 | 6 | 13 | 10 | 3 | 16 | 13 | 3 |
| 107 Others working and dealing in Animal Matters | 45 | 45 | 11 | 11 | 34 | 34 | |||
| Sub-Order 2. In Vegetable Matters:— | |||||||||
| 108 Oil and Colour Man | 16 | 16 | ... | ... | ... | 16 | 16 | ... | |
| French Polisher | 69 | 69 | ... | 23 | 23 | ... | 46 | 46 | ... |
| 109 Timber Merchant and Employé | 232 | 232 | ... | 21 | 21 | ... | 211 | 211 | ... |
| 110 Firewood Dealer, Chopper, Woodcutter | 178 | 178 | ... | 28 | 28 | ... | 150 | 150 | ... |
| Fencer, Splitter | 271 | 270 | 1 | 17 | 16 | 1 | 254 | 254 | ... |
| 111 Turner | 121 | 121 | 41 | 41 | ... | 80 | 80 | ... | |
| 112 Cooper | 177 | 177 | ... | 21 | 21 | ... | 156 | 156 | ... |
| 113 Sawyer, Saw-mill Owner, Worker, Squarer | 1,815 | 1,815 | ... | 199 | 199 | ... | 1,616 | 1,616 | ... |
| Basketmaker | 33 | 33 | ... | 9 | 9 | ... | 24 | 24 | ... |
| 114 Kauri Gum Digger, Dealer, Worker | 1,160 | 1,159 | 1 | 78 | 78 | ... | 1,082 | 1,081 | 1 |
| Hay, Straw, Dealer, Chaff-cutter | 7 | 7 | ... | 1 | 1 | 6 | 6 | ... | |
| Paper Manufacturer | 4 | 4 | ... | 1 | 1 | ... | 3 | 3 | ... |
| Bill Sticker, Distributer | 5 | 5 | ... | 1 | 1 | ... | 4 | 4 | ... |
| 115 Others working and dealing in Vegetable Matters | 38 | 29 | 9 | 10 | 5 | 5 | 28 | 24 | 4 |
| Order XII.—Persons Working and Dealing in Minerals: | |||||||||
| Sub-Order 1. In Mining:— | |||||||||
| Gold Miner, Alluvial | 5,363 | 5,363 | ... | 107 | 107 | ... | 5,256 | 5,256 | ... |
| Sluicer | 2,943 | 2,941 | 2 | 43 | 43 | ... | 2,900 | 2,898 | 2 |
| 116 Quartz and Cement Miner, Crusher | 2,066 | 2,066 | ... | 138 | 138 | ... | 1,928 | 1,928 | ... |
| Gold Miner, Digger (not otherwise described) | 2,624 | 2,624 | ... | 102 | 102 | 2,522 | 2,522 | ... | |
| 117 Coal Miner, Collier | 1,087 | 1,087 | ... | 84 | 84 | ... | 1,003 | 1,003 | ... |
| 118 Others engaged in Mining | 190 | 190 | ... | 2 | 2 | ... | 188 | 188 | ... |
| Sub-Order 2. In Coal:— | |||||||||
| Coal, Coke, Merchant, Dealer | 130 | 129 | 1 | 2 | 2 | ... | 128 | 127 | 1 |
| Coal Heaver, Labourer | 40 | 40 | ... | 6 | 6 | ... | 34 | 34 | ... |
| Charcoal Burner, Dealer | 4 | 4 | ... | ... | ... | ... | 4 | 4 | ... |
| 119 Chimney-sweeper | 29 | 29 | ... | 4 | 4 | ... | 25 | 25 | ... |
| 120 Gasworks Service | 80 | 80 | ... | 5 | 5 | ... | 75 | 75 | ... |
| 121 Others working and dealing in Coal and Mineral Oil | 11 | 11 | ... | ... | ... | ... | 11 | 11 | ... |
| Sub-Order 3. In Stone, Clay, Earthenware, and Glass:— | |||||||||
| 122 Quarry Owner, Worker | 154 | 154 | ... | 10 | 10 | ... | 144 | 144 | ... |
| Stone Cutter, Dresser (not Mason) | 72 | 72 | 6 | 6 | ... | 66 | 66 | ... | |
| 123 Lime Burner, Quarrier, Dealer | 62 | 62 | ... | 5 | 5 | 57 | 57 | ... | |
| Plaster, Cement, Maker, Dealer | 3 | 3 | ... | ... | ... | ... | 3 | 3 | ... |
| 124 Brick Maker, Dealer | 524 | 524 | ... | 99 | 99 | ... | 425 | 425 | ... |
| 125 Pottery Maker, Dealer | 110 | 104 | 6 | 44 | 40 | 4 | 66 | 64 | 2 |
| Glass Maker, Dealer | 15 | 15 | ... | 1 | 1 | 14 | 14 | ... | |
| 126 China, Earthenware, Maker, Dealer | 21 | 21 | ... | 2 | 2 | ... | 19 | 19 | ... |
| Road, Railway, Contractor | 184 | 184 | ... | 7 | 7 | ... | 177 | 177 | ... |
| Road Surveyor, Inspector | 119 | 119 | ... | 1 | 1 | ... | 118 | 118 | ... |
| 127 Road, Railway, Labourer, Navvy, Excavator | 2,866 | 2,866 | ... | 121 | 121 | ... | 2,745 | 2,745 | ... |
| Nightman, Scavenger | 5 | 5 | ... | ... | ... | ... | 5 | 5 | ... |
| 128 Others working and dealing in Stone, Clay, Earthenware, and Glass | 46 | 45 | 1 | 1 | ... | 1 | 45 | 45 | ... |
| Sub-Order 4. In Waters:— | |||||||||
| Waterworks Service | 13 | 13 | ... | ... | ... | ... | 13 | 13 | ... |
| 129 Others working and dealing in Water | 43 | 43 | ... | 2 | 2 | ... | 41 | 41 | ... |
| Sub-Order 5. In Gold, Silver, and Precious Stones:— | |||||||||
| 130 Goldsmith, Silversmith, Jeweller | 133 | 132 | 1 | 33 | 33 | ... | 100 | 99 | 1 |
| Lapidary, Precious Stones Worker, Dealer | 14 | 14 | ... | 4 | 4 | 10 | 10 | ... | |
| Assayer | 2 | 2 | ... | ... | ... | ... | 2 | 2 | ... |
| Electroplater, Plater | 5 | 5 | ... | ... | ... | ... | 5 | 5 | ... |
| 131 Others working and dealing in Gold, Silver, and Precious Stones | 3 | 3 | ... | ... | ... | ... | 3 | 3 | ... |
| Sub-Order 6. In Metals other than Gold and Silver:— | |||||||||
| 132 Copper, Worker, Dealer | 29 | 29 | ... | 8 | 8 | 21 | 21 | ... | |
| 133 Tin, Quicksilver, Worker, Dealer | 303 | 303 | ... | 97 | 97 | ... | 206 | 206 | ... |
| Zinc Worker, Dealer | 3 | 3 | ... | ... | ... | ... | 3 | 3 | ... |
| 134 Iron Founder, Moulder, Boiler Maker, Worker, Dealer | 506 | 506 | ... | 116 | 116 | ... | 390 | 390 | ... |
| 135 Blacksmith, Whitesmith | 2,369 | 2,369 | ... | 535 | 535 | ... | 1,834 | 1,834 | ... |
| 136 Ironmonger, Hardware Dealer | 403 | 403 | ... | 104 | 104 | 299 | 299 | ... | |
| 137 Brass Founder, Moulder, Worker, Dealer | 74 | 74 | ... | 27 | 27 | ... | 47 | 47 | ... |
| Locksmith, Beil-hanger | 9 | 9 | ... | 1 | 1 | ... | 8 | 8 | ... |
| Gasfitter | 46 | 46 | ... | 9 | 9 | ... | 37 | 37 | ... |
| 138 Others working and dealing in Metals other than Gold or Silver | 7 | 6 | 1 | ... | ... | ... | 7 | 6 | 1 |
| CLASS VI.—INDEFINITE AND NON-PRODUCTIVE. | |||||||||
| Order XIII.—Labourers and Others (Branch of Labour undefined). | |||||||||
| Sub-Order 1. General Labourers:— | |||||||||
| Labourer (branch, undefined) | 14,904 | 14,904 | ... | 1,265 | 1,265 | ... | 13,639 | 13,639 | ... |
| Sub-Order 2. Other Indefinite Occupations:— | |||||||||
| Mechanic, Manufacturer (not otherwise described) | 64 | 64 | ... | 11 | 11 | ... | 53 | 53 | ... |
| Shop Man, Woman (branch undefined) | 28 | ... | 28 | 12 | ... | 12 | 16 | ... | 16 |
| Apprentice (branch undefined) | 90 | 88 | 2 | 77 | 75 | 2 | 13 | 13 | ... |
| Engineer, Engine-driver, Stoker, Fireman (undefined) | 1,126 | 1,126 | ... | 136 | 136 | ... | 990 | 990 | ... |
| Draughtsman (not otherwise described) | 51 | 51 | ... | 6 | 6 | ... | 45 | 45 | ... |
| Contractor, Assistant (undefined) | 1,083 | 1,083 | ... | 27 | 27 | ... | 1,056 | 1,056 | ... |
| Manager, Overlooker, Foreman | 50 | 50 | ... | 1 | 1 | ... | 49 | 49 | ... |
| 139 Other Indefinite Occupations | 426 | 420 | 6 | 54 | 53 | 1 | 372 | 367 | 5 |
| 140Order XIV.—Persons of Property or Rank (not returned under any Office or Occupation) | 399 | 278 | 121 | 3 | 2 | 1 | 396 | 276 | 120 |
| Order XV.—Persons Supported by the Community. | |||||||||
| Sub-Order 1. From Voluntary Sources and Public Revenue:— | |||||||||
| Pensioner (New Zealand) | 40 | 40 | ... | ... | ... | ... | 40 | 40 | ... |
| Dependent on Relatives | 6 | 4 | 2 | 1 | ... | 1 | 5 | 4 | 1 |
| Inmate of Charitable Institution | 2,173 | 1,510 | 663 | 314 | 161 | 153 | 1,859 | 1,349 | 510 |
| Inmate of Industrial School | 505 | 310 | 195 | 504 | 309 | 195 | 1 | 1 | ... |
| Pauper, Beggar | 1 | 1 | ... | ... | ... | ... | 1 | 1 | ... |
| Sub-Order 2. Criminal Classes:— | |||||||||
| Prisoner | 686 | 593 | 93 | 38 | 27 | 11 | 648 | 566 | 82 |
| Inmate of Reformatory | 54 | 54 | ... | 54 | 54 | ... | ... | ... | ... |
| Inmate of Refuge | 10 | ... | 10 | 2 | ... | 2 | 8 | ... | 8 |
| 141 Other Criminals | 1 | ... | 1 | ... | ... | ... | 1 | ... | 1 |
| No occupation stated | 1,813 | 1,797 | 16 | 52 | 51 | 1 | 1,761 | 1,746 | 15 |
Table 1.
| M. | F. | |
|---|---|---|
| 6. Chemist's Assistant | 43 | 1 |
| 7. Chiropodist | 1 | |
| Dentist's Assistant | 2 | |
| Dentist's Pupil | 1 | |
| Dispenser | 4 | |
| Doctor's Assistant | 2 | |
| Drug Merchant | 1 | |
| Drug-store Assistant | 1 | |
| Herbalist | 3 | |
| Hydropathist | 1 | |
| Medicine-maker | 1 | |
| 8. Compiler of History | 1 | |
| Interpreter | 50 | |
| Lecturer | 2 | 2 |
| Literary | 1 | |
| Poet | 1 | |
| Superintendent of Young Women's Institute | 1 | |
| 9. Botanist | 1 | |
| Civil Engineer's Assistant | 5 | |
| Civil Engineer's Cadet | 6 | |
| Curator of Botanical Gardens | 1 | |
| Curator of Museum | 2 | |
| Director of Museum | 1 | |
| Electrician | 3 | |
| Geologist | 2 | |
| Metallurgist | 1 | |
| Meteorologist | 1 | |
| Military Engineer | 1 | |
| Mineralogist | 1 | |
| Naturalist | 5 | |
| Phonographer | 1 | |
| Phrenologist | 3 | |
| Scientist | 1 | |
| 10. Agricultural School Director | 1 | |
| Agricultural School Student | 31 | |
| Caretaker, Government School | 2 | |
| Convent Teacher | 18 | |
| Education Board, Clerk | 4 | |
| Education Board, Secretary | 8 | |
| Inspector of School Buildings | 1 | |
| Instructor of Farming | 1 | |
| Principal of College | 1 | |
| Principal of Deaf and Dumb College | 1 | |
| Pupil-teacher | 106 | 311 |
| Rector of High School | 1 | |
| Sewing Mistress | 24 | |
| Student | 12 | |
| Teacher of Biology | 1 | |
| Teacher of Chemistry | 2 | |
| Teacher of Classics | 2 | |
| Teacher of Fancy Work | 1 | |
| Teacher of Geology | 1 | |
| Teacher of Mathematics | 4 | |
| Teacher of Mutes | 1 | |
| Teacher of Navigation | 1 | |
| Teacher of Religion | 4 | |
| Teacher of Science | 1 | |
| University, Registrar | 2 | |
| University, Student | 31 | |
| 11. Photographer's Assistant | 7 | 3 |
| 12. Artist's Colourist | 2 | 6 |
| Fine Arts—Collector, Dealer | 2 | |
| Floral Artist | 1 | |
| 13. Music Student | 1 | |
| Pianist | 1 | |
| 14. Bookmaker | 1 | |
| Exhibition of Arts Manager | 1 | |
| Gambler | 2 | |
| Gambling Ticket-seller | 2 | |
| Pedestrian | 1 | |
| Professor of Gymnastics | 1 | |
| Scenic Artist | 2 | |
| Stage-carpenter | 1 | |
| Street-player | 1 | |
| Theatrical Agent | 3 | |
| Theatre Manager | 3 | |
| Theatre Owner | 2 | |
| Ventriloquist | 1 | |
| Wizard | 1 | |
| 15. Bath Keeper, Manager | 5 | |
| Coffee-stall Keeper | 2 | |
| Hotel, Club, Manager | 17 | |
| Hotel, Club, Secretary | 3 | |
| Labour Agent, Clerk | 2 | 2 |
| Matron, Native Boarding-house | 1 | |
| 16. Bath Attendant | 2 | 2 |
| Caretaker | 11 | 7 |
| Charwoman | 81 | |
| Companion | 14 | |
| Custodian | 4 | |
| Hallkeeper | 1 | |
| Invalid Attendant | 1 | |
| Janitor | 2 | |
| Runner | 1 | |
| Waiting-room Attendant | 1 | |
| Watchman | 50 | |
| 17. Accountant | 595 | |
| Bookkeeper | 108 | 1 |
| 18. Account Collector | 6 | |
| Actuary | 3 | |
| Auctioneer's Assistant | 1 | |
| Average Adjuster | 3 | |
| Cashier | 4 | |
| Importer | 10 | |
| Merchant's Assistant | 6 | |
| Merchant's Manager | 5 | |
| Money, Broker, Lender | 3 | |
| Office Assistant | 3 | |
| Office Boy | 83 | |
| Speculator | 3 | |
| Valuer | 2 | |
| 19. Shopman | 78 | |
| Shop, Storekeeper's, Assistant | 322 | 54 |
| Shop, Storekeeper's, Clerk | 24 | |
| Shop, Storekeeper's, Labourer | 18 | |
| Shop, Storekeeper's, Manager | 7 | |
| Shop, Storekeeper's, Salesman | 1 | |
| 20, Pawnbroker's Assistant | 3 | |
| 21. Bazaarkeeper | 1 | |
| Dealer | 75 | |
| Fancy Goods Dealer | 9 | 9 |
| Fancy Goods Assistant | 3 | |
| Fancy Goods Clerk | 1 | |
| General Dealer | 91 | |
| Marine Storekeeper | 1 | |
| Shop-boys | 66 | |
| Trader | 3 | |
| 22. Railway Storekeeper | 1 | |
| Tram Conductor, Driver | 50 | |
| Tram Inspector, Foreman | 4 | |
| Tram Lessee | 1 | |
| Tram Manager | 1 | |
| Others | 5 | |
| 23. Bridgekeeper | 4 | |
| Cartage Contractor | 1 | |
| Forwarding Agent | 7 | |
| Hand-cart Porter | 5 | |
| Manager of Carrying Company | 2 | |
| Packer on Roads | 41 | |
| Others | 2 | 3 |
| 24. Ballastman | 4 | |
| Crane-driver | 4 | |
| Diver | 5 | |
| Dock-labourer | 2 | |
| Dredging-band | 9 | |
| Ferry Man, Woman | 29 | 1 |
| Foreman | 1 | |
| Harbour Board, Chairman | 1 | |
| Harbour Board, Clerk | 4 | |
| Harbour Board, Clerk of Works | 2 | |
| Harbour Board, Engineer | 3 | |
| Harbour Board, Foreman | 3 | |
| Harbour Board, Secretary | 3 | |
| Harbour Board, Storekeeper | 1 | |
| Hulkkeeper | 5 | |
| Inspector of Steamers | 1 | |
| Lessee of Ferry | 1 | |
| Lighterman | 12 | |
| Marine Depôtmaster | 1 | |
| Marine Engineer | 2 | |
| Marine Examiner | 1 | |
| Marine Superintendent | 1 | |
| Marine Surveyor | 11 | |
| Providore | 2 | |
| Puntsman | 5 | |
| Rafter on River | 4 | |
| Ship Agent | 6 | |
| Ship Broker | 1 | |
| Ship Keeper | 2 | |
| Steamboat Agent | 1 | 1 |
| Wharf Lessee | 1 | |
| Wharf-sweeper | 1 | |
| 25. Bond-warehouse Manager | 2 | |
| Packer in Store | 23 | |
| 26. Bellman | 4 | |
| Mail Agent | 1 | |
| Mail Carrier | 13 | |
| Mail Contractor | 22 | |
| Town Crier | 2 | |
| 27. Curator, Acclimatization Gardens | 1 | |
| Farm Cadet | 61 | |
| Farm Clerk | 2 | |
| Farm Contractor | 6 | |
| Fruitgrower | 3 | |
| Garden-labourer | 64 | 5 |
| Mopgrower | 8 | |
| Horticulturalist | 1 | |
| Nurseryman's Assistant | 22 | |
| Orchardist | 2 | |
| Planter | 6 | |
| Ploughing-contractor | 3 | |
| Vinegrower | 1 | |
| 28. Bullock-driver | 91 | |
| Cook, Station | 57 | |
| Cowkeeper | 29 | |
| Gardener | 29 | |
| Groom | 19 | |
| Herdsman | 15 | |
| Packer | 11 | |
| Ploughman | 47 | |
| Shepherd | 1,628 | |
| Stockman | 191 | |
| Wagoner, Carter | 28 | |
| 29. Cadet on Station | 53 | |
| Clerk on Station | 17 | |
| Shearer | 38 | |
| Others | 4 | |
| 30. Bullock, Horse, Driver in hush | 33 | |
| Bush Contractor | 84 | |
| Clerk, Land Agent | 1 | |
| Crown Land Ranger | 11 | |
| Ditcher, Swamper | 51 | |
| Forester | 2 | |
| Inspector of Forests | 1 | |
| Land Proprietor's Assistant | 2 | |
| Land Purchase Agent | 1 | |
| Land Salesman | 1 | |
| Land Trader, Broker, Valuer | 8 | |
| Native Land Agent | 1 | |
| Ploughing Contractor | 3 | |
| Station Agent | 1 | |
| Surveyor's Assistant | 20 | |
| Surveyor's Cadet | 36 | |
| Surveyor's Chainman | 68 | |
| Surveyor's Labourer | 151 | |
| Surveyor's Pupil | 2 | |
| Others | 2 | |
| 31. Apiarian | 6 | |
| Bird Fancier, Dealer | 4 | |
| Cattle-dealer | 23 | |
| Cattle and Sheep Inspector | 2 | |
| Clerk to Stock Agent | 1 | |
| Dog-trainer | 7 | |
| Drover | 84 | |
| Game Inspector | 1 | |
| Game Keeper | 5 | |
| Horse-clipper | 1 | |
| Huntsman | 1 | |
| Jockey-trainer | 1 | |
| Pig Breeder, Dealer | 3 | |
| Pisciculturist | 2 | |
| Pisciculturist Traveller | 1 | |
| Poultry Keeper, Farmer | 3 | |
| Rabbit Inspector | 3 | |
| Rabbit-poison Mixer | 1 | |
| Sealkeeper | 1 | |
| Sheep Dealer | 4 | |
| Sheep Inspector | 33 | |
| Stock Agent | 14 | |
| Stock Auctioneer | 1 | |
| Stock Dealer | 3 | |
| Stock Keeper | 1 | |
| Stock Owner | 6 | |
| Stud Company Manager | 1 | |
| Stud Manager | 1 | |
| Superintendent of Cattle-yards | 1 | |
| Whaler | 12 | |
| Whipper-in | 1 | |
| Wild-big Killer, Hunter | 4 | |
| 32. Bookseller's Assistant | 26 | 1 |
| Bookseller's Traveller | 1 | |
| Stationer's Assistant | 10 | |
| Stationer's Clerk | 3 | |
| Stationer's Shopman | 1 | |
| 33. Bookbinder's Assistant | 1 | |
| Bookfolder | 2 | |
| Paper-ruler | 2 | |
| 34. Printer's Assistant | 9 | |
| Printer's Boy | 11 | |
| Printer's Clerk | 2 | |
| Printer's Devil | 2 | |
| Printer's Machinist | 3 | |
| Printer's Manager | 1 | |
| Printer's Messenger | 1 | |
| Printer's Turnover | 1 | |
| 33. Advertising Agent | 1 | |
| Book Agent | 4 | |
| Canvasser | 1 | |
| Colporteur | 1 | |
| Correspondent | 1 | |
| Librarian | 19 | 3 |
| News Agent, Vendor | 24 | 2 |
| Newspaper Office Boy, Girl | 7 | 1 |
| Newspaper Office Clerk | 11 | |
| Newspaper Office Runner | 43 | |
| Newspaper Office Writer | 13 | |
| Paper Embosser | 1 | |
| Paper Folder | 4 | |
| Paper Rider | 7 | |
| Press Reader | 11 | |
| 36. Musical Instrument Maker's Asst. | 1 | |
| Piano Tuner | 26 | |
| 37. Picture-frame Maker | 1 | |
| 38. Artificial-flower Maker | 1 | 3 |
| Modeller | 4 | |
| Ornament Maker | 1 | |
| 39. Importer of Watches | 1 | |
| Watchmaker's Assistant | 1 | |
| 40. Artificial-limb Maker | 1 | |
| 41. Armourer | 2 | |
| Gun-cleaner | 1 | |
| 42. Engine-fitter | 85 | |
| Engine-fitter Labourer to | 5 | |
| Mechanical Engineer | 242 | |
| 43. Bellows Maker | 6 | |
| Saw Doctor, Maker, Setter | 13 | |
| Sewing-machine Importer | 1 | |
| Sewing-machine Maker, Dealer | 5 | |
| 44. Carriage-lamp Maker | 2 | |
| Cartwright | 1 | |
| Coach Painter | 19 | |
| Coach Smith | 9 | |
| Coach Maker's Trimmer's Assist. | 3 | |
| Wagon Maker | 1 | |
| 45. Collar Maker | 2 | |
| Saddler's Assistant | 14 | |
| Saddler's Salesman | 1 | |
| 46. Wheelwright's Assistant | 1 | |
| 47. Millwright's Assistant | 2 | |
| 48. Agricultural Implement Engineer | 1 | |
| Ploughmaker's Assistant | 1 | |
| 49. Agricultural Implement Importer | 1 | |
| Trolly Maker | 1 | |
| 50. Shipwright's Assistant | 5 | |
| Shipbuilder's Storekeeper | 1 | |
| 51. Shipchandler's Bookkeeper | 1 | |
| 52. Boatbuilder's Assistant | 4 | |
| 53. Sailmaker's Assistant | 2 | |
| 54. Cauiker | 1 | |
| Patent Slip Manager | 1 | |
| 55. Carpenter's Assistant | 23 | |
| Carpenter's Foreman | 1 | |
| Carpenter's Labourer | 15 | |
| 56. Bricklayer's Assistant | 2 | |
| Bricklayer's Labourer | 82 | |
| 57. Mason's Labourer | 5 | |
| 58. Plasterer's Assistant | 3 | |
| Plasterer's Labourer | 2 | |
| 59. Decorator | 1 | |
| Painter's, Plumber's Assistant | 30 | |
| Painter's, Clerk | 2 | |
| Paperhanger | 11 | |
| 60. Architect's Assistant | 4 | |
| Architect's Pupil | 3 | |
| Architect's Builder's Clerk | 3 | |
| Blindmaker (Venetian) | 29 | |
| Bridge Builder | 8 | |
| Bridge Labourer | 5 | |
| Bridge Inspector | ||
| Builder's Assistant | 10 | |
| Builder's Foreman, Labourer | 7 | |
| Building Inspector | 2 | |
| Clerk of Works | 10 | |
| Inspector of Works | 5 | |
| Piledriver | 3 | |
| Sash and Door Maker | 1 | |
| 61. Cabinetmaker's Assistant | 12 | |
| Chairmaker | 3 | |
| 62. Boxmaker | 3 | |
| Undertaker | 10 | |
| 63. Dyer's Assistant | 1 | |
| 64. Blue Manufacturer | 1 | |
| Hematite Paint Manufacturer | 3 | |
| Inkmaker | 1 | |
| Paint and Varnish Maker | 1 | |
| Sulphur-works Manager | 1 | |
| 65. Draper's Assistant | 246 | 25 |
| Draper's Clerk, Cashier | 14 | |
| Draper's Manager | 2 | |
| Draper's Salesman | 17 | |
| Draper's Softgoodsman | 2 | |
| Draper's Warehouseman | 2 | |
| 66. Wool-sorter | 2 | |
| Wool-stapler's Labourer | 6 | |
| 67. Hurler | 4 | |
| Cloth Cutter | 3 | |
| Cloth Presser | 2 | |
| Darner | 3 | |
| Finisher | 1 | |
| Machine-knitter | 6 | |
| Stocking-weaver | 2 | |
| Tweed Finisher | 4 | |
| Wool Carder, Packer, Presser, Spinner, Warper, Weaver, Worker | 31 | 86 |
| Woollen Factory Hands | 100 | 31 |
| Woollen Manufac. Salesman, Clerk | 2 | |
| Woollen Mills Foreman | 1 | |
| Woollen Works Factory Manager | 12 | |
| 68. Flock Manufacturer | 2 | |
| Fancy Softgoods Dealer | 1 | |
| Lace Manufacturer, Cutter | 2 | |
| Silk-dresser | 1 | |
| Wool Broker, Clerk, Exporter | 5 | |
| 69. Hairdresser's Assistant | 11 | |
| 70. Straw-hat Maker | 1 | |
| 71. Tailor's Assistant | 8 | |
| Tailor's Cutter | 3 | |
| Tailor's Foreman | 1 | |
| Vestmaker | 1 | |
| 72. Clothier's Assistant | 8 | |
| Clothier's Salesman | 4 | |
| 73. Dressmaker's Assistant | 1 | |
| Milliner's Assistant | 1 | |
| Mantle-maker | 3 | |
| 74. Clothing Factory Foreman | 1 | |
| 75. Boot Closer, Clicker, Cutter, Finisher, Factory Hand, Mender, Machinist | 30 | 121 |
| Boot Factory Foreman | 4 | |
| Boot Fitter | 1 | 19 |
| Boot Maker's Assistant | 21 | 1 |
| Boot Manufacturer | 5 | |
| Boot Sales Man, Woman | 3 | 5 |
| Shoe Embroiderer, Binder | 4 | |
| 76. Berlin Wool Shopkeeper | 3 | |
| Boot Importer | 5 | |
| Button-hole Maker | 1 | |
| Buttonmaker | 1 | |
| Costumier | 2 | |
| Fancy Needleworker | 6 | |
| Hat Trimmer | 5 | |
| Knitter | 2 | 4 |
| Lace Worker, Maker | 5 | |
| Mangling Labourer | 1 | |
| Oilskin-maker | 1 | |
| Staymaker | 1 | |
| 77. Flax Cutter | 6 | |
| Flax Dresser | 45 | |
| Flax Merchant | 1 | |
| Flax Mill Hand | 31 | |
| Flax Mill Manager | 2 | |
| Flax Mill Owner | 5 | |
| Flax Spinner | 1 | |
| 78. Matmaker's Assistant | 3 | |
| 79. Ropemaker's Assistant | 10 | 1 |
| Ropemaker's Labourer | 2 | |
| Ropeworks Malinger | 1 | |
| 80. Canvas-hose Maker | 3 | |
| Netting-maker | 4 | |
| 81. Dairy Manager | 1 | |
| Dairyman's Assistant | 26 | |
| Milkman | 59 | |
| Milkseller's Servant | 13 | |
| 82. Butcher's Assistant | 161 | 1 |
| Butcher's Boy | 23 | |
| Butcher's Carter | 2 | |
| Butcher's Clerk | 4 | |
| Butcher's Labourer | 11 | |
| Butcher's Manager | 2 | |
| 83. Provision Curer's Assistant | 1 | |
| 84. Poulterer's Shopman | 1 | |
| 85. Butter Dealer | 1 | |
| Cheesemaker | 1 | |
| Tripedresser | 1 | |
| Trotter-seller | 1 | |
| 86. Miller's Accountant, Clerk | 5 | |
| Miller's Assistant | 20 | |
| Miller's Carter | 2 | |
| Miller's Engineer | 1 | |
| Miller's Labourer | 27 | |
| Miller's Manager, Foreman | 2 | |
| Millowner | 1 | |
| 87. Baker's Assistant | 159 | 6 |
| Baker's Driver | 8 | |
| Baker's Shop Man, Woman | 1 | 1 |
| Baker's Man | 18 | |
| 88. Confectioner's Assistant | 7 | 2 |
| 89. Fruiterer's Assistant, Shopman | 4 | 1 |
| Greengrocer's Assistant | 8 | |
| 90. Grain Broker | 2 | |
| Grain Carrier | 2 | |
| Grain Classer | 1 | |
| Grain Picker | 1 | |
| Grain Store Labourer | 1 | |
| Grain Storeman | 3 | |
| Grain Trade Clerk | 3 | |
| Herbalist | 5 | |
| Produce Merchant's Clerk, Asst. | 2 | |
| Seedsman's Assistant | 3 | 2 |
| Seedsman's Clerk | 2 | |
| 91. Brewer's Assistant | 41 | 2 |
| Brewer's Bottler | 57 | |
| Brewer's Carter | 4 | |
| Brewer's Cellarman | 10 | |
| Brewer's Clerk | 4 | |
| Brewer's Cooper | 1 | |
| Brewer's Labourer | 20 | |
| Brewer's Manager | 1 | |
| Brewer's Traveller | 2 | |
| 92. Maltster's Clerk | 1 | |
| Maltster's Labourer | 1 | |
| 93. Aërated-water Maker's Assistan | 13 | |
| Aërated-water Maker's Carter | 1 | |
| Aërated-water Maker's Clerk | r | |
| Cordial Maker's Labourer | 2 | |
| Mineral-water Manufacturer | 1 | |
| 94. Coffee-dealer's Assistant | 1 | |
| 95. Grocer's Assistant | 199 | 3 |
| Grocer's Boy | 5 | |
| Grocer's Clerk | 4 | |
| Grocer's Driver | 1 | |
| Grocer's Storeman | 2 | |
| Grocer's Tea Assistant | 2 | |
| 96. Tobacconist's Assistant | 1 | |
| Tobacconist's Clerk | 1 | |
| 97. Ale and Stout Merchant | 1 | |
| Cigar Merchant | 2 | |
| Coffee Merchant's Storeman | 1 | |
| Coffee and Spice Merchant | 1 | |
| Hop Merchant | 1 | |
| Herbal Brewer | 2 | |
| Picklemaker | 5 | |
| Saucemaker | 2 | 1 |
| Tea Merchant | 3 | |
| Vinegarmaker | 1 | |
| Winegrower | 1 | |
| Wine-store Manager | 1 | |
| 98. Soap and Candle Manufacturer | 1 | |
| Soapmaker's Assistant | 2 | |
| 99. Candlemaker's Assistant | 3 | |
| 100. Boiling-down Works Clerk | 1 | |
| Boiling-down Works Labourer | 12 | |
| Boiling-down Works Manager | 6 | |
| Boiling-down Works Owner | 1 | |
| 101. Bonecrushing Labourer | 4 | |
| 103. Fellmonger's Assistant | 16 | |
| Fellmonger's Labourer | 8 | |
| Wool-scourer | 3 | |
| 103. Tanner's Assistant | 5 | |
| Tanner's Beamsman | 0 | |
| Tanner's Clerk | 1 | |
| Tanner's Labourer | 22 | |
| Tanner's Skinner | 1 | |
| 104. Currier's Assistant | 1 | |
| 105. Leather Cutter | 4 | |
| Leather Dresser | 2 | |
| Leather Maker's Assistant | 1 | |
| 106. Brush Factory Assistant | 2 | |
| 107. Fur-trader | 23 | |
| Gluemaker | 2 | |
| Horsehair-worker | 1 | |
| Leather Importer | 1 | |
| Leather Merchant | 11 | |
| Leather Merchant Assistant | 1 | |
| Leather Merchant Salesman | 2 | |
| Leather Seller | 1 | |
| Portmanteau-maker | 2 | |
| Sealskin-dresser | 1 | |
| 108. Oil and Colour Man's Shopma | 1 | |
| Paintkeeper | 1 | |
| 109. Timber Agent | 6 | |
| Timber Contractor | 6 | |
| Timber Measurer | 3 | |
| Timber Merchant's Assistant | 4 | |
| Timber Merchant's Clerk | 20 | |
| Timber Salesman | 2 | |
| Timber Yard Labourer | 30 | |
| Timber Yard Manager | 4 | |
| Timber Yardsman | 16 | |
| 110. Firewood Dealer's Assistant | 6 | |
| Firewood Dealer's Clerk | 1 | |
| 111. Turner's Assistant | 2 | |
| 112. Cooper's Assistant | 2 | |
| 113. Circular-sawman | 4 | |
| Saw-mill Bullock-driver | 20 | |
| Saw-mill Clerk | 17 | |
| Saw-mill Contractor | 1 | |
| Saw-mill Engineer | 29 | |
| Saw-mill Labourer | 694 | |
| Saw-mill Manager | 34 | |
| Saw-mill Storekeeper | 1 | |
| 114. Gum Broker | 3 | |
| Gum Digger | 79 | |
| Gum Labourer, Packer, Scraper, Sorter | 66 | |
| Gum Merchant | 13 | |
| Gum Merchant Assistant | 3 | |
| Gum Storeman | 5 | |
| 115. Bark-contractor | 1 | |
| Cork-cutter | 3 | |
| Dam-builder | 2 | |
| Edible Fungus Gatherer | 1 | |
| Firekindler-maker | 2 | |
| Lastmaker | 1 | |
| Oil Merchant's Clerk | 1 | |
| Paper Merchant | 1 | |
| Paper Mill Manager | 1 | |
| Paper Worker | 3 | 5 |
| Rag-gatherer | 4 | |
| Sleeper-cutter | 4 | |
| Straw-worker | ||
| Thatcher | 1 | |
| Wood Merchant's Assistant | 1 | |
| Wood-worker | 3 | |
| 116. Amalgamator | 24 | |
| Battery Assistant | 24 | |
| Battery Manager | 4 | |
| Battery Owner | 1 | |
| Cement Crushing | 133 | |
| Quartz-mine Manager | 18 | |
| 117. Coal Master | 1 | |
| Coal Mine Carpenter | 1 | |
| Coal Mine Clerk | 2 | |
| Coal Mine Engineer | 4 | |
| Coal Mine Manager | 14 | |
| Coal Mine Owner | 9 | |
| Coal Mine Secretary, Manager | 2 | |
| Coal Prospector | 2 | |
| Colliery Agent | 1 | |
| Colliery Brakesman | 1 | |
| Colliery Smith | 1 | |
| 118. Gold Miner, Dredging | 9 | |
| Gold Miner, Hydraulic | 2 | |
| Gold Miner, Prospecting | 8 | |
| Gold Miner, Tunnelling | 58 | |
| Manganese Miner | 20 | |
| Manganese Mine Clerk | 1 | |
| Manganese Mine Manager | 1 | |
| Mine Labourer | 1 | |
| Mine Manager | 28 | |
| Mine Owner | 2 | |
| Mining Advocate | 2 | |
| Mining Advocate Assistant | 1 | |
| Mining Agent | 14 | |
| Mining Contractor | 2 | |
| Mining Engineer | 21 | |
| Mining Manager (Legal) | 1 | |
| Mining Registrar | 1 | |
| Mining Smith | 1 | |
| Mining Speculator | 2 | |
| Mining Surveyor | 5 | |
| Water-race Manager's Labourer | 10 | |
| 119. Chimney-sweep's Assistant | 1 | |
| 120. Gasworks Engineer | 5 | |
| Gasworks Labourer | 2 | |
| Gasworks Lamplighter | 5 | |
| Gasworks Manager | 1 | |
| Gasworks Stoker | 2 | |
| 121. Coal Agent | 5 | |
| Coal Merchant's Clerk | 2 | |
| Coal Merchant's Traveller | 2 | |
| Coke-burner | 1 | |
| Oil-borer | 3 | |
| Oil-boring Works Foreman | 1 | |
| 122. Quarry Labourer | 1 | |
| Quarry Manager | 1 | |
| 133. Limeburner's Assistant | 3 | |
| 124. Brickmaker's Assistant, Carter | ||
| Labourer | 58 | |
| 125. Drain Pipe, Tile, Maker | 16 | |
| Pipemaker's Assistant | 4 | |
| Potter's Assistant | 5 | |
| Potter's Printer | 1 | |
| Terra Cotta Maker | 2 | |
| 126. China Packer | 1 | |
| Crockery Shopman | 1 | |
| Earthen ware-dealer's Assistant | 1 | |
| 127. Ganger, Foreman | 36 | |
| Platelayer | 472 | |
| Stonebreaker | 6 | |
| 128. Bottlemaker | 1 | |
| Breakwater-contract Hand | 5 | |
| Doll's-eye Maker | 1 | |
| Graving-dock Works Foreman | 1 | |
| Harbour Hoard Works Clerk | 1 | |
| Pipe Finisher | 1 | |
| Pipe Layer | 1 | |
| Railway-works Foreman | 1 | |
| Railway-works Manager | 1 | |
| River-works Overseer | 2 | |
| Road Engineer's Clerk | 1 | |
| Road Surveyor's Chainman | 1 | |
| Water-race Contractor | 1 | |
| Water-race Labourer | 28 | |
| 129. Pumper | 1 | |
| Water Carter | 2 | |
| Inspector | 1 | |
| Well Sinker, Borer | 39 | |
| 130. Jeweller's Assistant | 3 | |
| 131. Coiner | 1 | |
| Gold-chaser | 1 | |
| Silversmith | 1 | |
| 132. Coppersmith's Boy | 1 | |
| 133. Tinsmith's Assistant | 4 | |
| 134. Boilermaker | 101 | |
| Foundry Bookkeeper | 2 | |
| Foundry Labourer | 20 | |
| Hammerman | 6 | |
| Ironturner | 1 | |
| Moulder | 2 | |
| Patternmaker | 33 | |
| Range Maker, Fitter | 4 | |
| Rivetter | 6 | |
| Stovemaker | 2 | |
| 135. Blacksmith's Assistant | 39 | |
| 136. Hardware Salesman | 2 | |
| Hardware Storekeeper | 3 | |
| Ironmonger's Assistant | 67 | |
| Ironmonger's Clerk | 3 | |
| Ironmonger's Shopman | 4 | |
| 137. Brassfounder's Storeman | 1 | |
| 138. Fencing Standard Maker | 1 | |
| Iron Broker | 1 | |
| Lacquerer | 1 | |
| Wireworker | 4 | |
| 139. Adventurer | 1 | |
| Agent | 6 | |
| Bailiff | 13 | |
| Collector | 10 | |
| Contractor's Assistant | 13 | |
| Contractor's Clerk | 2 | |
| Globe Trotter | 1 | |
| Jack-of-all-Trades | 1 | |
| Lodger | 236 | |
| Machine-hand | 5 | |
| Passenger | 7 | |
| Secretary Sub-Enumerator | 9 | |
| Swagger | 10 | |
| Tourist | 12 | 3 |
| Traveller | 54 | |
| Others (one of each) | 28 | 3 |
| 140. Annuitant | 100 | 81 |
| Baronet | 1 | |
| Gentleman, Lady | 85 | 19 |
| Independent | 4 | 12 |
| Pensioner | 24 | |
| Property Owner | 4 | 9 |
| Retired Civil Servant, Farmer, Merchant, Shepherd, Surgeon, Surveyor, Tradesman | 34 | |
| Retired Judge | 2 | |
| Retired Officer | 23 | |
| Superannuated | 1 | |
| 141. Brothelkeeper | 1 |
THE COLONY AND PROVINCIAL DISTRICTS.—DETAILS OF OCCUPATIONS.
Table V. Showing the Occupations of the People, Males and
Females, in the Colony and the Provincial Districts.  Details of the groups of occupations are given in Table IV.
Persons out of employment are included in this table under their ordinary or
former occupation. The numbers under Trade and Manufactures (Group V.,
Industrial) generally include all persons returned as employed in them, such as
Apprentices, Assistants, and Labourers, as well as Masters; the few excepted are
thrown into others of the sub-orders to which they belong, and are specified in
Table IV. Inmates of hospitals and lunatic asylums are all
included as inmates of charitable institutions. All prisoners arc given as such
under that heading.
Details of the groups of occupations are given in Table IV.
Persons out of employment are included in this table under their ordinary or
former occupation. The numbers under Trade and Manufactures (Group V.,
Industrial) generally include all persons returned as employed in them, such as
Apprentices, Assistants, and Labourers, as well as Masters; the few excepted are
thrown into others of the sub-orders to which they belong, and are specified in
Table IV. Inmates of hospitals and lunatic asylums are all
included as inmates of charitable institutions. All prisoners arc given as such
under that heading.
| Occupations of Persons of both Sexes. | The Colony. | Provincial Districts. | Chatham Islands. | |||||||||||||||||||
|---|---|---|---|---|---|---|---|---|---|---|---|---|---|---|---|---|---|---|---|---|---|---|
| Auckland. | Taranaki. | Wellington. | Hawke's Bay. | Marlborough. | Nelson. | Westland. | Canterbury. | Otago. | ||||||||||||||
| Males. | Females. | Males. | Females. | Males. | Females. | Males. | Females. | Males. | Females. | Males. | Females. | Males. | Females. | Males. | Females. | Males. | Females, | Males. | Females. | Males. | Females. | |
| Total Population | 269,605 | 220,328 | 54,111 | 45,340 | 8,517 | 6,341 | 32,717 | 28,654 | 9,700 | 7,667 | 5,249 | 4,051 | 14,800 | 11,275 | 9,075 | 5,935 | 60,590 | 51,592 | 74,685 | 59,393 | 161 | 81 |
| CLASS I.—PROFESSIONAL. | ||||||||||||||||||||||
| Order I.—Persons engaged in the General or Local Governments, or the Defence or Protection of the Country. | ||||||||||||||||||||||
| Sub-Order 1. Officers of General Government— | ||||||||||||||||||||||
| The Governor | 1 | ... | ... | ... | ... | ... | 1 | ... | ... | ... | ... | ... | ... | ... | ... | ... | ... | ... | ... | ... | ... | ... |
| Cabinet Minister (not otherwise described) | 2 | ... | ... | ... | ... | ... | 2 | ... | ... | ... | ... | ... | ... | ... | ... | ... | ... | ... | ... | ... | ... | ... |
| Member of Parliament (not otherwise described) | 3 | ... | 1 | ... | ... | ... | I | ... | ... | ... | ... | ... | ... | ... | I | ... | ... | ... | ... | ... | ... | ... |
| Government Officer (other than professional or subordinate)... | 953 | ... | 178 | ... | 34 | ... | 294 | ... | 32 | ... | 15 | ... | 49 | ... | 30 | ... | 147 | ... | 173 | ... | 1 | ... |
| Architect, Surveyor, Civil Engineer, Draughtsman, Cadet | 219 | ... | 50 | ... | 20 | ... | 34 | ... | 6 | ... | 3 | ... | 14 | ... | 9 | ... | 34 | ... | 49 | ... | ... | ... |
| Subordinate Officer | 164 | ... | 32 | ... | 5 | ... | 50 | ... | 8 | ... | 3 | ... | 8 | ... | 4 | ... | 21 | ... | 33 | ... | ... | ... |
| Police | 457 | ... | 114 | ... | 15 | ... | 61 | ... | 18 | ... | 8 | ... | 19 | ... | 22 | ... | 86 | ... | 113 | ... | 1 | |
| Penal (including all persons employed in penal establishments, gaols, and reformatories) | 137 | 13 | 26 | 2 | 5 | 1 | 19 | ... | 6 | ... | ... | 3 | 14 | ... | 9 | ... | 34 | ... | 49 | ... | ... | ... |
| Other Government Officers | 13 | 10 | 3 | 2 | ... | ... | 6 | 1 | 2 | ... | ... | ... | ... | 2 | ... | 2 | ... | 2 | ||||
| Sub-Order 2. Officers of Local Governments— | ||||||||||||||||||||||
| Member of Local Council (not otherwise described) | 16 | ... | 5 | ... | 1 | ... | 5 | ... | ... | ... | ... | ... | ... | ... | 1 | ... | 3 | ... | 1 | ... | ... | |
| Magistrate (J.P.) (not otherwise described) | 15 | ... | 4 | ... | ... | ... | 2 | ... | ... | ... | ... | ... | 1 | ... | ... | ... | 5 | ... | 3 | ... | ... | |
| Officer of Local Body | 230 | ... | 46 | ... | 8 | ... | 27 | ... | 7 | ... | 5 | ... | 10 | ... | 7 | ... | 52 | ... | 68 | ... | ... | ... |
| Sub-Order 3. Defence— | ... | ... | ... | ... | ... | ... | ... | ... | ... | ... | ... | ... | ... | ... | ... | ... | ... | ... | ... | ... | ... | |
| Army Officer | 20 | ... | 6 | ... | ... | ... | 1 | ... | ... | ... | ... | ... | 5 | ... | ... | ... | ... | ... | 8 | ... | ... | |
| Soldier | 3 | ... | 1 | ... | ... | ... | ... | ... | ... | ... | ... | ... | ... | ... | ... | ... | 2 | ... | ... | ... | ... | |
| Navy Officer | 3 | ... | ... | ... | ... | ... | ... | ... | ... | ... | ... | ... | ... | ... | ... | ... | ... | ... | 2 | ... | ... | |
| Armed Constabulary or Militia Officer | 31 | ... | 7 | ... | 15 | ... | 4 | ... | ... | ... | 1 | ... | 1 | ... | ... | ... | I | ... | 2 | ... | ... | ... |
| Armed Constabulary or Militia Private | 640 | ... | 08 | ... | 489 | ... | 40 | ... | 7 | ... | ... | ... | 2 | ... | ... | ... | 2 | ... | 2 | ... | ... | ... |
| Volunteer (not otherwise described) | 2 | ... | ... | ... | ... | ... | 1 | ... | ... | ... | 1 | ... | ... | ... | ... | I | ... | ... | ... | ... | ||
| Others connected with Defence | 31 | ... | 13 | ... | 3 | ... | 4 | ... | ... | ... | ... | ... | 1 | ... | ... | ... | 3 | ... | 7 | ... | ... | ... |
| Order II.—Persons engaged in the Learned Professions, or in Literature, Art, and Science (ivith their immediate Subordinates). | ||||||||||||||||||||||
| Sub-Order 1. Clergymen, Ministers, and Church | ... | ... | ... | ... | ... | ... | ... | ... | ... | ... | ... | ... | ... | ... | ... | ... | ... | ... | ... | ... | ... | ... |
| Officers— | ||||||||||||||||||||||
| Clergyman | 556 | ... | 135 | ... | 12 | ... | 71 | ... | 35 | ... | 9 | ... | 30 | ... | 17 | ... | 121 | ... | 126 | ... | ... | ... |
| Theological Student | 32 | ... | 17 | ... | ... | ... | 1 | ... | 1 | ... | ... | ... | 7 | ... | ... | ... | 3 | ...3 | ... | ... | ... | ... |
| Irregular Clergy (Lay Reader, &c.) | 34 | ... | 9 | ... | 1 | ... | 8 | ... | ... | ... | 1 | ... | 2 | ... | ... | ... | 7 | ... | 6 | ... | ... | ... |
| Church Officer | 32 | ... | 6 | ... | ... | ... | 4 | ... | ... | ... | ... | 1 | ... | 2 | ... | 11 | ... | 8 | ... | ... | ... | |
| Nun, Sister of Charity | ... | 86 | ... | 10 | ... | ... | ... | ... | 27 | ... | 11 | ... | ... | ... | 15 | ... | 9 | ... | 12 | ... | 2 | ... |
| Others connected with Religion | 7 | ... | 1 | ... | ... | ... | 2 | ... | 1 | ... | ... | ... | 1 | ... | ... | ... | ... | ... | 2 | ... | ... | ... |
| Sub-Order 2. Law-court Officers, Lawyers, &c.— | ||||||||||||||||||||||
| Law-court Officer (not R.M. Court) | 59 | ... | 10 | ... | 1 | ... | 12 | ... | 2 | ... | 1 | ... | 3 | ... | 1 | ... | 19 | ... | 10 | ... | ... | ... |
| Lawyer | 362 | ... | 79 | ... | 17 | ... | 67 | ... | 13 | ... | 4 | ... | 15 | ... | 5 | ... | 68 | ... | 94 | ... | ... | ... |
| Law Student | 89 | ... | 27 | ... | 2 | ... | 26 | ... | 1 | ... | 3 | ... | 4 | ... | 5 | ... | 13 | ... | 7 | ... | 1 | ... |
| Law Clerk | 319 | ... | 46 | ... | 11 | ... | 58 | ... | 15 | ... | 6 | ... | 9 | ... | 2 | ... | 87 | ... | 85 | ... | ... | ... |
| Others Connected with Law | 15 | ... | 6 | ... | 1 | ... | 2 | ... | 1 | ... | ... | ... | ... | ... | 1 | ... | 2 | ... | 2 | ... | ... | ... |
| Sub-Order 3. Physicians, Surgeons, Druggists— | ||||||||||||||||||||||
| Medical Man, Woman | 317 | ... | 69 | ... | 10 | ... | 49 | ... | 10 | ... | 9 | ... | 19 | ... | 11 | ... | 58 | ... | 81 | ... | 1 | ... |
| Irregular Medical Partitioner | 7 | ... | 4 | ... | ... | ... | ... | ... | ... | ... | ... | ... | ... | ... | ... | ... | 1 | ... | 3 | ... | ... | ... |
| Dentist (including Apprentice) | 45 | 1 | 10 | ... | 2 | ... | 4 | ... | 1 | 12 | ... | 5 | ... | 1 | ... | 11 | ... | 9 | ... | ... | ... | |
| Chemist, Druggist, and Assistant | 359 | 3 | 91 | ... | 7 | ... | 47 | 1 | 10 | ... | 3 | ... | 10 | ... | 12 | ... | 68 | 2 | 110 | ... | 1 | ... |
| Midwife | ... | 51 | ... | 11 | ... | 1 | ... | 11 | ... | 4 | ... | ... | ... | ... | ... | 3 | ... | 8 | ... | 13 | ... | ... |
| Others connected with Medicine, &c. | ||||||||||||||||||||||
| Author, Editor (not Newspaper) | 9 | 1 | 2 | ... | 1 | ... | 1 | ... | 1 | ... | ... | ... | ... | ... | ... | ... | 2 | ... | 2 | 1 | ... | ... |
| Reporter, Shorthand Writer | 46 | ... | 10 | ... | 1 | ... | 7 | ... | ... | ... | ... | ... | ... | ... | 1 | ... | 9 | ... | 18 | ... | ... | ... |
| Graduate of University (not otherwise described) | 7 | ... | 1 | ... | ... | ... | ... | ... | ... | ... | ... | ... | ... | ... | ... | ... | 2 | ... | 4 | ... | ... | ... |
| Others—Literary Persons | 54 | 4 | 29 | 2 | 9 | ... | 4 | ... | 4 | ... | ... | ... | 1 | ... | ... | ... | 2 | ... | 5 | 2 | ... | ... |
| Sub-Order 5. Scientific Persons— | ||||||||||||||||||||||
| Civil Engineer (not Government) | 228 | ... | 46 | ... | 6 | ... | 26 | ... | 8 | ... | 1 | ... | 10 | ... | 9 | ... | 53 | ... | 69 | ... | ... | ... |
| Engineer's Draughtsman | 6 | ... | 3 | ... | ... | ... | 1 | ... | ... | ... | ... | ... | ... | ... | ... | ... | 1 | ... | 1 | ... | ... | ... |
| Analytical Chemist | 1 | ... | ... | ... | ... | ... | 1 | ... | ... | ... | ... | ... | ... | ... | ... | ... | ... | ... | ... | ... | ... | ... |
| Others–Scientific Persons | 35 | ... | 6 | ... | 2 | ... | 6 | ... | 1 | ... | 2 | ... | 1 | ... | ... | ... | 8 | ... | 9 | ... | ... | ... |
| Sub-Order 6. Teachers, &c.— | ||||||||||||||||||||||
| University Professor | 7 | ... | ... | ... | ... | ... | ... | ... | ... | ... | ... | ... | ... | ... | ... | ... | 1 | ... | 6 | ... | ... | ... |
| Inspector of Schools | 15 | ... | 2 | ... | 1 | ... | 2 | ... | 1 | ... | ... | ... | 1 | ... | 1 | ... | 4 | ... | 3 | ... | ... | ... |
| School Master, Mistress | 1,128 | 1,255 | 259 | 372 | 28 | 38 | 123 | 146 | 40 | 31 | 24 | 9 | 59 | 78 | 33 | 40 | 254 | 288 | 308 | 253 | ... | ... |
| Tutor, Governess | 18 | 476 | 1 | 98 | 1 | 11 | 9 | 79 | 1 | 31 | 1 | 5 | ... | 21 | ... | 5 | 2 | 130 | 3 | 96 | ... | ... |
| Teacher of Accomplishments | 31 | 14 | 13 | 2 | ... | ... | 2 | 2 | 1 | ... | 1 | ... | 4 | 1 | ... | ... | 3 | 6 | 7 | 3 | ... | ... |
| Others connected with Education | 214 | 279 | 15 | 54 | 1 | ... | 17 | 32 | 4 | 23 | 2 | 1 | 2 | 4 | 7 | 7 | 89 | 84 | 77 | 74 | ... | ... |
| Sub-Order 7. Fine Arts— | ||||||||||||||||||||||
| Artist, Painter | 71 | 21 | 16 | 5 | ... | ... | 11 | 3 | 9 | ... | 1 | ... | 3 | 1 | 1 | 1 | 15 | 3 | 15 | 8 | ... | ... |
| Sculptor | 13 | ... | 2 | ... | 1 | ... | 4 | ... | ... | ... | ... | ... | ... | ... | ... | ... | 1 | ... | 5 | ... | ... | ... |
| Engraver | 33 | ... | 7 | ... | ... | ... | 7 | ... | 1 | ... | ... | ... | 1 | ... | ... | ... | 8 | ... | 9 | ... | ... | ... |
| Diesinker, Medalist | 7 | ... | ... | ... | ... | ... | 1 | ... | ... | ... | ... | ... | ... | ... | ... | ... | 4 | ... | 2 | ... | ... | ... |
| Photographer and Assistant | 172 | 10 | 35 | 2 | 3 | ... | 25 | 4 | 9 | ... | 3 | ... | 10 | ... | 5 | ... | 29 | 2 | 53 | 2 | ... | ... |
| Others connected with Fine Arts | 4 | 7 | ... | ... | ... | ... | ... | ... | ... | ... | ... | ... | 2 | 3 | ... | ... | 1 | 1 | 1 | 3 | ... | ... |
| Sub-Order 8. Musicians, Music Teachers— | ||||||||||||||||||||||
| Music Master, Mistress | 88 | 222 | 26 | 51 | 5 | 6 | 8 | 27 | 4 | 4 | 4 | 1 | 4 | 6 | 2 | 6 | 13 | 59 | 22 | 62 | ... | ... |
| Musician, Vocalist | 100 | 35 | 21 | 3 | 1 | ... | 11 | 4 | 15 | 7 | 1 | 1 | 3 | 1 | 4 | 1 | 19 | ... | 25 | 18 | ... | ... |
| Others connected with Music | 2 | ... | 1 | ... | ... | ... | ... | ... | ... | ... | ... | ... | ... | ... | 1 | ... | ... | ... | ... | ... | ... | ... |
| Sub-Order 9. Actors, &c.— | ||||||||||||||||||||||
| Actor, Actress | 69 | 42 | 20 | 7 | 2 | 2 | 11 | 8 | 2 | 4 | 4 | 2 | 6 | 3 | 5 | 2 | 12 | 7 | 7 | 7 | ... | ... |
| Billiard-table Keeper, Market | 123 | ... | 18 | ... | 10 | ... | 21 | ... | 5 | ... | 1 | ... | 1 | ... | 2 | ... | 31 | ... | 34 | ... | ... | ... |
| Others connected with Exhibitions | 22 | ... | 6 | ... | ... | ... | 4 | ... | ... | ... | ... | ... | ... | ... | 2 | ... | 5 | ... | 5 | ... | ... | ... |
| CLASS II.—DOMESTIC. | ||||||||||||||||||||||
| Order III.—Persons engaged in the Domestic Officers or Duties of Wives, Mothers, Mistresses of Families, Children, Relatives, Visitors (not otherwise described). | ||||||||||||||||||||||
| Sub-Order 1. Wives and Windows— | ||||||||||||||||||||||
| Wife, Widow, of no specified occupation | ... | 70,341 | ... | 14,387 | ... | 2,150 | ... | 9,223 | ... | 2,457 | ... | 1,226 | ... | 3,526 | ... | 1,910 | ... | 16,438 | ... | 18,998 | ... | 26 |
| Sub-Order 2. Sons, Daughters, Relatives, Visitors: Son, Daughter, Relative, Visitor (not otherwise described) | 49,404 | 71,203 | 9,312 | 14,894 | 1,612 | 2,278 | 6,709 | 9,628 | 1,863 | 2,545 | 1,111 | 1,557 | 2,497 | 3,737 | 1,192 | 1,527 | 11,728 | 16,450 | 13,363 | 18,563 | 17 | 24 |
| Sub-Order 3. Students and Scholars— | ||||||||||||||||||||||
| Scholar at Home | 2,732 | 3,821 | 733 | 878 | 75 | 100 | 380 | 636 | 92 | 145 | 71 | 106 | 200 | 269 | 62 | 44 | 515 | 781 | 589 | 841 | 15 | 21 |
| Scholar at Public School | 44,207 | 41,650 | 8,823 | 1,172 | 1,078 | 5,336 | 4,973 | 1,367 | 1,221 | 674 | 621 | 2,267 | 2,171 | 1,312 | 1,398 | 10,431 | 9,722 | 12,825 | 12,318 | ... | ... | ... |
| Scholar at Private School | 5,725 | 7,523 | 1,343 | 1,881 | 188 | 221 | 696 | 1,005 | 296 | 305 | 98 | 127 | 372 | 424 | 339 | 434 | 1,353 | 1,672 | 1,040 | 1,454 | ... | ... |
| Order IV.—Persons engaged in Entertaining and Performing Personal Offices for Man. | ||||||||||||||||||||||
| Sub-Order 1. In Board and Lodging— | ||||||||||||||||||||||
| Hotel-keeper | 1,470 | 121 | 292 | 23 | 47 | 1 | 144 | 11 | 65 | 3 | 28 | 2 | 130 | 13 | 118 | 18 | 220 | 12 | 426 | 37 | ... | 1 |
| Hotel-keeper's Wife-assisting in business | ... | 299 | ... | 13 | ... | 5 | ... | 47 | ... | 34 | ... | 2 | ... | 17 | ... | 19 | ... | 70 | ... | 92 | ... | ... |
| Coffee, Eating, House Keeper | 22 | 7 | 4 | 3 | 1 | ... | 2 | 1 | ... | ... | ... | ... | ... | ... | 1 | 2 | 9 | 1 | 5 | ... | ... | ... |
| Coffee, Eating, House Keeper's Wife assisting in business | ... | 3 | ... | ... | ... | ... | ... | 1 | ... | ... | ... | ... | ... | ... | ... | ... | ... | ... | ... | 2 | ... | ... |
| Boarding, Lodging, House Keeper | 190 | 220 | 36 | 47 | 7 | 7 | 23 | 42 | 6 | 4 | 4 | 2 | 4 | 8 | 12 | 2 | 59 | 50 | 39 | 58 | ... | ... |
| Boarding, Lodging, House Keeper's Wife assisting in business | ... | 10 | ... | ... | ... | 1 | ... | 7 | ... | 1 | ... | 1 | ... | ... | ... | ... | ... | ... | ... | ... | ... | ... |
| Cook (not Domestic Servant) | 680 | 46 | 145 | 2 | 20 | 1 | 80 | 4 | 71 | 2 | 11 | 2 | 14 | 1 | 21 | ... | 166 | 25 | 152 | 9 | ... | ... |
| Officer of Charitable Institution | 46 | 45 | 5 | 6 | 2 | 2 | 4 | 6 | 3 | 3 | ... | 2 | 6 | 3 | 9 | 2 | 7 | 12 | 10 | 9 | ... | ... |
| Servants' Registry Office Keeper | ... | 5 | ... | 1 | ... | ... | ... | ... | ... | ... | ... | ... | ... | ... | ... | ... | ... | 1 | ... | 3 | ... | ... |
| Others engaged in Board and Lodging | 29 | 3 | 9 | 1 | ... | ... | 4 | ... | 2 | ... | ... | ... | 1 | ... | ... | ... | 4 | 1 | 9 | 1 | ... | ... |
| Sub-Order 2. In Attendance— | ||||||||||||||||||||||
| Domestic Servant | 899 | 11,975 | 234 | 2,234 | 30 | 251 | 152 | 1,615 | 46 | 498 | 21 | 226 | 37 | 498 | 15 | 216 | 209 | 3,188 | 152 | 3,244 | 3 | 5 |
| Housekeeper | ... | 534 | ... | 92 | ... | 10 | ... | 65 | ... | 21 | ... | 13 | ... | 27 | ... | 8 | ... | 133 | ... | 165 | ... | ... |
| Inn, Club-house, Eating-house, Servant | 1,352 | 1,119 | 270 | 150 | 57 | 36 | 227 | 113 | 77 | 70 | 14 | 11 | 38 | 55 | 32 | 60 | 313 | 271 | 324 | 350 | ... | 3 |
| Charitable Institution Servant | 140 | 134 | 30 | 14 | 1 | 2 | 22 | 11 | ... | 10 | 1 | ... | 15 | 10 | 3 | 8 | 32 | 34 | 36 | 45 | ... | ... |
| Nurse (not Domestic Servant, or Servant of Charitable Institution) | ... | 408 | ... | 61 | ... | 7 | ... | 69 | ... | 18 | ... | 6 | ... | 18 | ... | 12 | ... | 132 | ... | 85 | ... | ... |
| Office Keeper, Cleaner, Porter, &c. (not Government) | 4 | ... | ... | ... | 1 | ... | ... | ... | ... | ... | ... | ... | 1 | ... | ... | ... | 1 | ... | 1 | ... | ... | ... |
| Others engaged in Attendance | 72 | 105 | 9 | 18 | ... | 1 | 21 | 16 | ... | 6 | ... | ... | 2 | 6 | 3 | 2 | 12 | 28 | 25 | 30 | ... | ... |
| CLASS III.—COMMERCIAL. | ||||||||||||||||||||||
| Order V.—Persons who Buy or Sell, Keep or Lend Money, Houses, or Goods of various Kinds. | ||||||||||||||||||||||
| Sub-Order 1. Mercantile Persons— | ||||||||||||||||||||||
| Capitalist | 216 | 25 | 90 | 4 | 5 | 1 | 30 | 2 | 5 | ... | 3 | 1 | 8 | 2 | 1 | ... | 34 | 7 | 39 | 8 | 1 | ... |
| Merchant | 617 | 1 | 122 | ... | 11 | ... | 81 | ... | 26 | ... | 8 | ... | 25 | ... | 21 | ... | 128 | ... | 194 | 1 | 1 | ... |
| Auctioneer, Appraiser, Valuer | 188 | ... | 38 | ... | 8 | ... | 26 | ... | 12 | ... | 3 | ... | 6 | ... | 6 | ... | 46 | ... | 43 | ... | ... | ... |
| Broker (not Share or Stock) | 42 | ... | 14 | ... | ... | ... | 4 | ... | ... | ... | ... | ... | 5 | ... | ... | ... | 6 | ... | 13 | ... | ... | ... |
| Commission Agent, Factor | 569 | ... | 119 | ... | 15 | ... | 97 | ... | 22 | ... | 6 | ... | 9 | ... | 14 | ... | 140 | ... | 147 | ... | ... | ... |
| Bank Officer, Clerk | 760 | ... | 127 | ... | 24 | ... | 120 | ... | 31 | ... | 15 | ... | 34 | ... | 34 | ... | 146 | ... | 229 | ... | ... | ... |
| Public Company Officer | 152 | ... | 38 | ... | ... | ... | 30 | ... | 2 | ... | ... | ... | 1 | ... | 1 | ... | 27 | ... | 53 | ... | ... | ... |
| Share, Stock, Broker, Dealer, Jobber | 11 | ... | 8 | ... | ... | ... | ... | ... | ... | ... | ... | ... | ... | ... | ... | ... | ... | ... | 3 | ... | ... | ... |
| Commercial Clerk | 3,418 | 10 | 673 | 6 | 56 | ... | 579 | ... | 113 | 1 | 23 | ... | 99 | 1 | 52 | ... | 857 | 1 | 966 | 1 | ... | ... |
| Commercial Traveller, Sales Man woman | 501 | 128 | 96 | 21 | 12 | 3 | 68 | 15 | 20 | 3 | 5 | 1 | 20 | 2 | 10 | ... | 103 | 33 | 167 | 50 | ... | ... |
| Others engaged in Mercantile Pursuits | 129 | 3 | 24 | ... | ... | ... | 26 | ... | 6 | ... | ... | ... | ... | ... | 1 | ... | 29 | 2 | 43 | ... | ... | ... |
| Sub-Order 2. Other General Dealers— | ||||||||||||||||||||||
| Shopkeeper (branch unspecified) and Assistants | 2,160 | 234 | 597 | 60 | 76 | 9 | 302 | 21 | 83 | 3 | 31 | 4 | 132 | 19 | 92 | 9 | 328 | 46 | 516 | 63 | 3 | ... |
| Shopkeeper's Wife (branch unspecified) assisting in business | ... | 20 | ... | 11 | ... | ... | ... | 1 | ... | ... | ... | ... | ... | ... | ... | ... | ... | 5 | ... | 3 | ... | ... |
| Pawnbroker | 27 | 2 | 5 | 1 | ... | ... | 1 | ... | ... | ... | ... | ... | ... | ... | ... | ... | 5 | ... | 16 | 1 | ... | ... |
| Hawker, Pedlar | 173 | 4 | 18 | ... | 5 | ... | 12 | ... | 3 | ... | 2 | ... | 1 | ... | 7 | 2 | 36 | ... | 89 | 2 | ... | ... |
| Other General Dealers | 246 | 13 | 62 | 1 | 13 | ... | 55 | 2 | 3 | ... | 2 | ... | 1 | 1 | 7 | ... | 67 | 3 | 36 | 6 | ... | ... |
| Order VI.—Persons engaged in the Conveyance of Men, Animals, Goods, and Messages. | ||||||||||||||||||||||
| Sub-Order 1. Carriers on Railways— | ||||||||||||||||||||||
| Railway Officer, Clerk, Stationmaster | 397 | ... | 40 | ... | 4 | ... | 51 | ... | 10 | ... | 5 | ... | 8 | ... | 4 | ... | 154 | ... | 121 | ... | ... | ... |
| Railway Engine-driver, Stoker, &c. | 233 | ... | 26 | ... | 6 | ... | 23 | ... | 11 | ... | 3 | ... | 12 | ... | 2 | ... | 46 | ... | 104 | ... | ... | ... |
| Railway Servant | 465 | ... | 38 | ... | 5 | ... | 41 | ... | 11 | ... | 5 | ... | 10 | ... | 3 | ... | 164 | ... | 188 | ... | ... | ... |
| Others connected with Railways | 62 | ... | 3 | ... | ... | ... | 10 | ... | ... | ... | ... | ... | ... | ... | 4 | ... | 4 | ... | 41 | ... | ... | ... |
| Sub-Order 2. Carriers on Roads— | ||||||||||||||||||||||
| Coach, Omnibus, Cab. Express, Owner | 168 | 1 | 31 | ... | 3 | ... | 22 | ... | 8 | ... | 1 | ... | 12 | ... | 8 | ... | 39 | ... | 44 | 1 | ... | ... |
| Coach, Omnibus, Cab, Driver, Conductor | 399 | ... | 92 | ... | 10 | ... | 54 | ... | 31 | ... | 2 | ... | 17 | ... | 12 | ... | 111 | ... | 70 | ... | ... | ... |
| Drayman, Carrier, Express Driver, Carter | 2,826 | 1 | 505 | ... | 106 | ... | 358 | ... | 137 | ... | 52 | ... | 112 | 1 | 66 | ... | 645 | ... | 845 | ... | ... | ... |
| Livery Stable Keeper | 92 | ... | 5 | ... | 5 | ... | 22 | ... | 2 | ... | ... | ... | 5 | ... | ... | ... | 29 | ... | 27 | ... | ... | ... |
| Toll Keeper, Contractor | 22 | ... | 11 | ... | 2 | ... | 3 | ... | 1 | ... | 2 | ... | ... | ... | 2 | ... | ... | ... | 1 | ... | ... | ... |
| Others connected with Conveyance on Roads | 62 | 3 | 16 | ... | 1 | ... | 2 | ... | ... | ... | ... | ... | 10 | ... | 4 | ... | 4 | 3 | 25 | ... | ... | ... |
| Sub-Order 3. Carriers on Seas and Rivers— | ||||||||||||||||||||||
| Harbour, Pier, Service | 80 | ... | 17 | ... | 6 | ... | 13 | ... | 1 | ... | 1 | ... | 9 | ... | 6 | ... | 11 | ... | 16 | ... | ... | ... |
| Pilot | 32 | ... | 6 | ... | ... | ... | 6 | ... | 3 | ... | 1 | ... | 1 | ... | ... | ... | 5 | ... | 10 | ... | ... | ... |
| Lighthouse Keeper | 56 | ... | 9 | ... | ... | ... | 5 | ... | 5 | ... | 5 | ... | 6 | ... | ... | ... | 5 | ... | 21 | ... | ... | ... |
| Ship-owner | 9 | ... | 1 | ... | ... | ... | 1 | ... | ... | ... | ... | ... | ... | ... | ... | ... | 3 | ... | 4 | ... | ... | ... |
| Ship Master, Officer, Sailor (Merchant Service) | 2,984 | ... | 1,053 | ... | 31 | ... | 303 | ... | 105 | ... | 41 | ... | 120 | ... | 108 | ... | 560 | ... | 624 | ... | 39 | ... |
| Engineer, Stoker, &c., of Steamer Service | 292 | ... | 112 | ... | 7 | ... | 58 | ... | 18 | ... | 2 | ... | 18 | ... | 9 | ... | 15 | ... | 53 | ... | ... | ... |
| Ship Servant, Steward, Stewardess | 430 | 22 | 143 | 5 | 5 | 1 | 82 | 7 | 20 | 1 | 6 | ... | 24 | 3 | 11 | 1 | 48 | 1 | 87 | 3 | 4 | ... |
| Stevedore, Lumper | 194 | ... | 121 | ... | 2 | ... | 13 | ... | 8 | ... | ... | ... | 1 | ... | ... | ... | 16 | ... | 33 | ... | ... | ... |
| Waterman, Boatman, &c. | 288 | ... | 117 | ... | 15 | ... | 16 | ... | 4 | ... | 8 | ... | 17 | ... | 10 | ... | 41 | ... | 60 | ... | ... | ... |
| Others connected with Seas and Rivers | 129 | 2 | 21 | 2 | 7 | ... | 15 | ... | 6 | ... | 2 | ... | 11 | ... | 11 | ... | 23 | ... | 33 | ... | ... | ... |
| Sub-Order 4. Engaged in Storage— | ||||||||||||||||||||||
| Storekeeper (not Shopkeeper) | 4 | 2 | 1 | 2 | ... | ... | 2 | ... | ... | ... | 1 | ... | ... | ... | ... | ... | ... | ... | ... | ... | ... | ... |
| Storeman (not Shopman) | 975 | ... | 224 | ... | 8 | ... | 72 | ... | 45 | ... | 11 | ... | 31 | ... | 40 | ... | 189 | ... | 355 | ... | ... | ... |
| Others connected with Storage | 25 | ... | 15 | ... | 1 | ... | 4 | ... | ... | ... | ... | ... | ... | ... | ... | ... | ... | ... | 5 | ... | ... | ... |
| Sub-Order 5. Messengers and Porters— | ||||||||||||||||||||||
| Messenger, Porter (not Government or Railway) | 290 | ... | 79 | ... | 5 | ... | 66 | ... | 12 | ... | 1 | ... | 13 | ... | 8 | ... | 59 | ... | 47 | ... | ... | ... |
| Errand Boy, Girl | 205 | 1 | 51 | 1 | 5 | ... | 24 | ... | 4 | ... | ... | ... | 3 | ... | 3 | ... | 42 | ... | 73 | ... | ... | ... |
| Telegraph Service | 568 | 12 | 97 | ... | 15 | ... | 118 | 7 | 40 | ... | 48 | ... | 38 | ... | 21 | ... | 101 | 2 | 90 | 3 | ... | ... |
| Others connected with Messages | 42 | ... | 8 | ... | ... | ... | 6 | ... | 3 | ... | 3 | ... | 4 | ... | 3 | ... | 5 | ... | 10 | ... | ... | ... |
| CLASS IV.—AGRICULTURAL. | ||||||||||||||||||||||
| Order VII.—Persons Possessing, Working, or Cultivating Land, Raising or Dealing in Animals, or following Pursuits subsidiary thereto. | ||||||||||||||||||||||
| Sub-Order 1. Engaged in Agricultural Pursuits— | ||||||||||||||||||||||
| Farmer, Market Gardener | 19,132 | 239 | 4,535 | 73 | 1,041 | 4 | 2,376 | 29 | 451 | 10 | 348 | 8 | 1,129 | 5 | 179 | ... | 4,433 | 56 | 4,628 | 54 | 12 | ... |
| Farmer's Wife assisting on farm | ... | 66 | ... | 11 | ... | 3 | ... | 3 | ... | 2 | ... | 26 | ... | 3 | ... | ... | ... | 10 | ... | 8 | ... | ... |
| Farmer's Son, Daughter, or other Relative over 15 years of age living on Farm if not otherwise described, or under 15 if stated to be assisting on farm | 8,079 | 221 | 1,782 | 48 | 364 | 14 | 1,088 | 13 | 187 | 4 | 185 | 11 | 649 | 9 | 34 | ... | 1,754 | 45 | 2,031 | 77 | 5 | ... |
| Farm Bailiff, Overseer | 225 | ... | 32 | ... | 7 | ... | 39 | ... | 6 | ... | 10 | ... | 3 | ... | 2 | ... | 72 | ... | 53 | ... | 1 | ... |
| Farm Servant and Labourer | 12,461 | 83 | 2,166 | 13 | 335 | 3 | 1,148 | 5 | 353 | 5 | 231 | 2 | 390 | ... | 60 | ... | 3,678 | 27 | 4,079 | 28 | 21 | ... |
| Gardener (not Domestic Servant) | 2,031 | ... | 456 | ... | 33 | ... | 196 | ... | 88 | ... | 24 | ... | 89 | ... | 33 | ... | 582 | ... | 530 | ... | ... | ... |
| Others connected with Agriculture | 180 | 5 | 70 | ... | 5 | ... | 10 | ... | 4 | ... | ... | ... | 13 | ... | ... | ... | 51 | ... | 27 | 5 | ... | ... |
| Runholder, Grazier, Sheep or Cattle Farmer | 882 | 6 | 76 | ... | 10 | ... | 192 | ... | 149 | 1 | 57 | 2 | 52 | ... | 7 | ... | 169 | 1 | 159 | 2 | 11 | ... |
| Runholder's Grazier, Son, Dauther, or Relative over 15 years of age living on station or grazing farm if not otherwise described, or under 15 if stated to be assisting | 98 | 9 | 4 | 5 | ... | ... | 24 | ... | 24 | 2 | 7 | 1 | 5 | ... | ... | ... | 24 | ... | 10 | 1 | ... | ... |
| Station or Grazing Farm Overseer, Superintendent, Manager | 371 | ... | 31 | ... | 1 | ... | 60 | ... | 53 | ... | 24 | ... | 18 | ... | 1 | ... | 85 | ... | 98 | ... | ... | ... |
| Station or Grazing Farm Servant, Labourer | 4,049 | 14 | 193 | 2 | 5 | ... | 511 | 1 | 726 | 5 | 312 | 2 | 171 | ... | 15 | ... | 842 | 1 | 1,264 | 3 | 10 | ... |
| Others connected with Grazing | 112 | ... | 5 | ... | ... | ... | 26 | ... | 11 | ... | 13 | ... | 7 | ... | ... | ... | 20 | ... | 30 | ... | ... | ... |
| Sub-Order 3. Engaged on Land (not cultivating or grazing):— | ||||||||||||||||||||||
| Landowner | 340 | 33 | 74 | 5 | 17 | ... | 56 | 6 | 13 | ... | 9 | ... | 15 | 1 | 1 | ... | 80 | 11 | 75 | 10 | ... | ... |
| Land, Estate, Agent | 101 | ... | 42 | ... | 1 | ... | 10 | ... | 3 | ... | 2 | ... | 1 | ... | ... | ... | 24 | ... | 18 | ... | ... | ... |
| Land Surveyor (not Government) | 441 | ... | 136 | ... | 24 | ... | 67 | ... | 16 | ... | 4 | ... | 16 | ... | 12 | ... | 85 | ... | 81 | ... | ... | ... |
| Agricultural Implement Owner, Worker | 273 | ... | ... | ... | 1 | ... | ... | ... | ... | ... | 1 | ... | ... | ... | ... | ... | 184 | ... | 87 | ... | ... | ... |
| Grubber, Bushman (not Fencer or Splitter) | 2,248 | ... | 1,118 | ... | 78 | ... | 243 | ... | 91 | ... | 88 | ... | 41 | ... | 45 | ... | 241 | ... | 302 | ... | 1 | ... |
| Others engaged on Land (not cultivating or grazing) | 488 | ... | 181 | ... | 62 | ... | 59 | ... | 15 | ... | 7 | ... | 32 | ... | 19 | ... | 41 | ... | 72 | ... | ... | ... |
| Sub-Order 4. Engaged about Animals:— | ||||||||||||||||||||||
| Horse Owner, Breeder, Dealer | 48 | ... | 2 | ... | 2 | ... | 3 | ... | 2 | ... | ... | ... | ... | ... | ... | ... | 25 | ... | 14 | ... | ... | ... |
| Veterinary Surgeon, Farrier (not Horse-shoer) | 83 | ... | 12 | ... | 2 | ... | 17 | ... | 5 | ... | ... | ... | 1 | ... | 3 | ... | 20 | ... | 23 | ... | ... | ... |
| Groom, Jockey, Horsebreaker (not Domestic Servant) | 755 | 1 | 99 | ... | 41 | ... | 84 | ... | 31 | ... | 13 | ... | 10 | ... | 25 | ... | 260 | ... | 192 | 1 | ... | ... |
| Live Stock Salesman | 39 | ... | 3 | ... | 4 | ... | 8 | ... | 1 | ... | ... | ... | 2 | ... | 1 | ... | 18 | ... | 2 | ... | ... | ... |
| Animal, Bird, Dealer, Keeper | 11 | ... | 4 | ... | ... | ... | ... | ... | ... | ... | ... | ... | 1 | ... | ... | ... | 5 | ... | 1 | ... | ... | ... |
| Rabbit, Catcher, Killer | 709 | ... | ... | ... | ... | ... | 90 | ... | ... | ... | 40 | ... | 1 | ... | ... | 2 | ... | 576 | ... | ... | ... | |
| Fisherman | 381 | 1 | 70 | ... | 2 | ... | 44 | 1 | 18 | ... | 17 | ... | 18 | ... | 10 | ... | 50 | ... | 152 | ... | ... | ... |
| Others engaged about Animals | 232 | ... | 32 | ... | 5 | ... | 26 | ... | 39 | ... | 8 | ... | 10 | ... | 6 | ... | 63 | ... | 40 | ... | 3 | ... |
| CLASS V.—INDUSTRIAL. | ||||||||||||||||||||||
| Order VIII.—Persons engaged in Working and Dealing in Art and Mechanic Productions in which Mutters of various Kinds are employed in Combination. | ||||||||||||||||||||||
| Sub-Order 1. In Books:— | ||||||||||||||||||||||
| Bookseller, Stationer, Publisher | 230 | 16 | 56 | ... | 1 | ... | 28 | 7 | 7 | ... | 3 | ... | 6 | 2 | 8 | ... | 52 | 5 | 69 | 2 | ... | ... |
| Bookbinder | 109 | 40 | 11 | 5 | 1 | ... | 33 | 22 | 2 | 1 | 1 | ... | 3 | ... | 2 | ... | 27 | 7 | 29 | 5 | ... | ... |
| Printer, Compositor | 1,260 | 10 | 236 | 5 | 38 | ... | 240 | ... | 52 | ... | 22 | 2 | 41 | ... | 46 | ... | 254 | 1 | 331 | 2 | ... | ... |
| Newspaper Proprietor, Editor, Publisher | 212 | ... | 42 | ... | 7 | ... | 36 | ... | 8 | ... | 7 | ... | 5 | ... | 6 | ... | 45 | ... | 56 | ... | ... | ... |
| Others connected with Books | 144 | 10 | 15 | 1 | 3 | ... | 12 | 2 | 1 | 1 | 3 | ... | 7 | ... | 9 | ... | 48 | ... | 46 | 6 | ... | ... |
| Sub-order 2. In Musical Instruments:— | ||||||||||||||||||||||
| Musical Instrument Maker, Dealer | 21 | ... | 6 | ... | ... | ... | ... | ... | ... | ... | 1 | ... | ... | ... | ... | ... | 5 | ... | 9 | ... | ... | ... |
| Music Publisher, Seller | 12 | 3 | 1 | ... | ... | ... | 3 | ... | ... | ... | ... | ... | 1 | 1 | ... | ... | 4 | 1 | 3 | 1 | ... | ... |
| Others connected with Musical Instruments | 27 | ... | 9 | ... | 2 | ... | 4 | ... | 1 | ... | 1 | ... | 1 | ... | 1 | ... | 6 | ... | 2 | ... | ... | ... |
| Sub-Order 3. In Prints and Pictures— | ||||||||||||||||||||||
| Lithographer, Lithographic Printer | 55 | ... | 9 | ... | ... | ... | 14 | ... | 1 | ... | ... | ... | ... | ... | ... | |||||||
| Picture Cleaner, Dealer | 2 | ... | ... | ... | ... | ... | 2 | ... | ... | ... | ... | ... | ... | ... | ... | ... | 15 | ... | 16 | ... | ... | ... |
| Others connected with Prints and Pictures | ... | 1 | ... | ... | ... | ... | ... | ... | ... | 1 | ... | ... | ... | ... | ... | ... | ... | ... | ... | ... | ... | ... |
| Sub-Order 4. In Carving and Figures— | ||||||||||||||||||||||
| Wood-Carver | 14 | ... | 6 | ... | ... | ... | 3 | ... | ... | ... | ... | ... | ... | ... | ... | ... | 2 | ... | 3 | ... | ... | ... |
| Taxidermist | 9 | ... | 2 | ... | ... | ... | 3 | ... | ... | ... | ... | ... | ... | ... | 1 | ... | 1 | ... | 2 | ... | ... | ... |
| Others connected with Carvings and Figures | 6 | 3 | 1 | ... | ... | ... | 4 | ... | ... | ... | ... | ... | ... | ... | ... | ... | ... | 1 | 1 | 2 | ... | ... |
| Sub-Order 5. In Tackle for Sports and Games— | ||||||||||||||||||||||
| Toy Maker, Dealer | 3 | 1 | 2 | ... | ... | ... | 1 | ... | ... | ... | ... | ... | ... | 1 | ... | ... | ... | ... | ... | ... | ... | ... |
| Billiard-table Maker | 1 | ... | 1 | ... | ... | ... | ... | ... | ... | ... | ... | ... | ... | ... | ... | ... | ... | ... | ... | ... | ... | ... |
| Sub-Order 6. In Watches and Philosophical Instruments: | ||||||||||||||||||||||
| Watch, Clock, Maker | 329 | ... | 59 | ... | 9 | ... | 52 | ... | 14 | ... | 5 | ... | 14 | ... | 7 | ... | 75 | ... | 94 | ... | ... | ... |
| Optician | 9 | ... | 2 | ... | ... | ... | 1 | ... | ... | ... | ... | ... | ... | ... | ... | ... | 3 | ... | 3 | ... | ... | ... |
| Sub-Order 7. In Surgical Instruments:— | ||||||||||||||||||||||
| Surgical Instrument Maker, Dealer | 2 | ... | ... | ... | ... | ... | ... | ... | ... | ... | ... | ... | ... | ... | ... | ... | 1 | ... | 1 | ... | ... | ... |
| Others | 1 | ... | ... | ... | ... | ... | ... | ... | ... | ... | ... | ... | ... | ... | ... | ... | ... | ... | 1 | ... | ... | ... |
| Sub-Order 8. In Arms: — | ||||||||||||||||||||||
| Gunsmith | 32 | ... | 10 | ... | ... | ... | 4 | ... | 2 | ... | 2 | ... | ... | ... | ... | ... | 8 | ... | 6 | ... | ... | ... |
| Others making and dealing in Arms | 2 | 1 | 2 | ... | ... | ... | ... | ... | ... | ... | ... | ... | ... | ... | ... | ... | ... | 1 | ... | ... | ... | ... |
| Sub-Order 9. In Machines and Tools:— | ||||||||||||||||||||||
| Engine, Machine Maker, Dealer | 699 | ... | 260 | ... | 15 | ... | 57 | ... | 5 | ... | 6 | ... | 20 | ... | 14 | ... | 130 | ... | 192 | ... | ... | ... |
| Tool Maker, Dealer | 4 | ... | 2 | ... | 1 | ... | ... | ... | ... | ... | ... | ... | ... | ... | ... | ... | 1 | ... | ... | ... | ... | ... |
| Cutler | 22 | ... | 5 | ... | ... | ... | 2 | ... | ... | ... | ... | ... | 1 | ... | ... | ... | 7 | ... | 7 | ... | ... | ... |
| Others making and dealing in Machines and Tools | 25 | ... | 11 | ... | ... | ... | 6 | ... | ... | ... | ... | ... | ... | ... | ... | ... | 3 | ... | 5 | ... | ... | ... |
| Sub-Order 10. In Carriage, Harness, and Implements:— | ||||||||||||||||||||||
| Coach Maker, Dealer | 407 | ... | 82 | ... | 7 | ... | 61 | ... | 21 | ... | 3 | ... | 15 | ... | 3 | ... | 130 | ... | 85 | ... | ... | ... |
| Railway Carriage Maker | 12 | ... | 5 | ... | 2 | ... | 1 | ... | ... | ... | ... | ... | ... | ... | ... | ... | 4 | ... | ... | ... | ... | ... |
| Perambulator Maker | 3 | ... | ... | ... | ... | ... | ... | ... | ... | ... | ... | ... | ... | ... | ... | ... | 2 | ... | 1 | ... | ... | ... |
| Saddler, Harness Maker, Dealer | 675 | ... | 130 | ... | 17 | ... | 97 | ... | 40 | ... | 15 | ... | 26 | ... | 9 | ... | 183 | ... | 158 | ... | ... | ... |
| Whipmaker | 8 | ... | 1 | ... | 1 | ... | 2 | ... | ... | ... | ... | ... | ... | ... | ... | ... | 2 | ... | 2 | ... | ... | ... |
| Wheelwright | 319 | ... | 42 | ... | 11 | ... | 46 | ... | 10 | ... | 11 | ... | 19 | ... | 2 | ... | 108 | ... | 69 | ... | 1 | ... |
| Millwright | 78 | ... | 15 | ... | 2 | ... | 4 | ... | 1 | ... | 4 | ... | 1 | ... | ... | ... | 32 | ... | 19 | ... | ... | ... |
| Agricultural Implement Maker, Dealer | 17 | ... | 6 | ... | ... | ... | 1 | ... | ... | ... | ... | ... | ... | ... | ... | ... | 7 | ... | 3 | ... | ... | ... |
| Others making and dealing in Carriages, Harness, and Implements | 2 | ... | ... | ... | ... | ... | ... | ... | ... | ... | ... | ... | ... | ... | ... | ...2 | ... | ... | ... | ... | ... | |
| Sub-Order 11. In Ships and Boats:— | ||||||||||||||||||||||
| Shipbuilder, Shipwright | 499 | ... | 267 | ... | 12 | ... | 40 | ... | 5 | ... | 4 | ... | 16 | ... | 8 | ... | 60 | ... | 87 | ... | ... | ... |
| Shiprigger | 4 | ... | 4 | ... | ... | ... | ... | ... | ... | ... | ... | ... | ... | ... | ... | ... | ... | ... | ... | ... | ... | ... |
| Shipchandler | 17 | 1 | 11 | ... | ... | ... | ... | 1 | 1 | ... | ... | ... | 2 | ... | ... | ... | 2 | ... | 1 | ... | ... | ... |
| Block, Oar, Mast Maker | 7 | ... | 7 | ... | ... | ... | ... | ... | ... | ... | ... | ... | ... | ... | ... | ... | ... | ... | ... | ... | ... | ... |
| Boatbuilder | 103 | ... | 65 | ... | ... | ... | 8 | ... | ... | ... | 7 | ... | 1 | ... | 2 | ... | 10 | ... | 10 | ... | ... | ... |
| Sailmaker | 117 | 2 | 34 | ... | ... | ... | 20 | ... | 2 | ... | ... | ... | 3 | ... | 2 | ... | 27 | ... | 29 | 2 | ... | ... |
| Others connected with Ships and Boats | 2 | ... | ... | ... | ... | ... | 1 | ... | ... | ... | ... | ... | ... | ... | ... | ... | ... | ... | 1 | ... | ... | ... |
| Sub-Order 12. In Houses and Buildings:— | ||||||||||||||||||||||
| House Owner | 164 | 38 | 42 | 7 | 9 | ... | 23 | 3 | 3 | ... | 1 | ... | 5 | 1 | 3 | ... | 33 | 9 | 45 | 18 | ... | ... |
| House Agent, Factor, Rent Collector | 10 | ... | 4 | ... | ... | ... | 2 | ... | ... | ... | ... | ... | ... | ... | ... | ... | 2 | ... | 2 | ... | ... | ... |
| Architect | 162 | ... | 34 | ... | 7 | ... | 27 | ... | 3 | ... | 1 | ... | 3 | ... | 2 | ... | 47 | ... | 38 | ... | ... | ... |
| Builder | 699 | ... | 179 | ... | 26 | ... | 101 | ... | 30 | ... | 12 | ... | 18 | ... | 10 | ... | 189 | ... | 134 | ... | ... | ... |
| Carpenter, Joiner | 6,272 | ... | 1,315 | ... | 232 | ... | 807 | ... | 272 | ... | 102 | ... | 246 | ... | 120 | ... | 1,554 | ... | 1.621 | ... | 3 | ... |
| Bricklayer | 715 | ... | 188 | ... | 17 | ... | 89 | ... | 26 | ... | 11 | ... | 14 | ... | 5 | ... | 173 | ... | 192 | ... | ... | ... |
| Mason, Pavior | 477 | ... | 77 | ... | 18 | ... | 8 | ... | 14 | ... | 1 | ... | 7 | ... | 8 | ... | 115 | ... | 229 | ... | ... | ... |
| Slater, Shingler, Tiler | 51 | ... | 17 | ... | 2 | ... | 1 | ... | ... | ... | ... | ... | 2 | ... | ... | ... | 15 | ... | 14 | ... | ... | ... |
| Plasterer | 273 | ... | 25 | ... | 1 | ... | 12 | ... | 2 | ... | ... | ... | 5 | ... | ... | ... | 120 | ... | 108 | ... | ... | ... |
| Painter, Plumber, Glazier, Paperhanger | 1,898 | ... | 413 | ... | 59 | ... | 296 | ... | 61 | ... | 20 | ... | 60 | ... | 24 | ... | 412 | ... | 553 | ... | ... | ... |
| Contractor for Buildings | 12 | ... | 11 | ... | ... | ... | ... | ... | ... | ... | 1 | ... | ... | ... | ... | ... | ... | ... | ... | ... | ... | |
| Others engaged in Houses and Buildings | 93 | ... | 16 | ... | 5 | ... | 9 | ... | 1 | ... | ... | ... | ... | ... | 1 | ... | 30 | ... | 31 | ... | ... | ... |
| Sub-Order 13. In Furniture:— | ||||||||||||||||||||||
| Furniture Maker, Cabinet Maker, Upholsterer | 939 | 28 | 211 | 5 | 27 | ... | 171 | 2 | 33 | ... | 13 | ... | 30 | 1 | 8 | ... | 218 | 9 | 228 | 11 | ... | ... |
| Furniture Broker. Dealer | 19 | 1 | 3 | ... | ... | ... | 2 | ... | ... | ... | ... | ... | 1 | 1 | 1 | ... | 4 | ... | 8 | ... | ... | ... |
| Picture Frame Maker | 12 | ... | 1 | ... | ... | ... | 1 | ... | ... | ... | ... | ... | ... | ... | ... | ... | 6 | ... | 4 | ... | ... | ... |
| Carver, Gilder | 39 | ... | 10 | ... | 1 | ... | 1 | ... | ... | ... | 1 | ... | 1 | ... | ... | ... | 8 | ... | 17 | ... | ... | ... |
| Mattrass, Bed, Maker | 25 | 3 | 16 | 2 | ... | ... | ... | ... | ... | ... | ... | ... | ... | ... | 1 | ... | 3 | ... | 5 | 1 | ... | ... |
| Others making and dealing in Furniture | 13 | ... | 3 | ... | ... | ... | 4 | ... | ... | ... | ... | ... | ... | ... | 1 | ... | 1 | ... | 4 | ... | ... | ... |
| Sub-Order 14. In Chemicals:— | ||||||||||||||||||||||
| Drysalter | 3 | ... | 2 | ... | ... | ... | ... | ... | ... | ... | ... | ... | ... | ... | ... | ... | 1 | ... | ... | ... | ... | ... |
| Dyer, Scourer, &c. | 34 | 5 | 5 | ... | ... | ... | 2 | ... | ... | ... | ... | ... | 1 | ... | ... | ... | 9 | 1 | 17 | 4 | ... | ... |
| Asphalt Maker, Worker | 22 | ... | 3 | ... | ... | ... | 6 | ... | ... | ... | ... | ... | ... | ... | ... | ... | 2 | ... | 11 | ... | ... | ... |
| Others working & dealing in Chemicals | 7 | ... | 4 | ... | ... | ... | ... | ... | ... | ... | ... | ... | 3 | ... | ... | ... | ... | ... | ... | ... | ... | ... |
| Order IX.—Persons Working and Dealing in Textile Fabrics, in Dress, and in Fibrous Materials. | ||||||||||||||||||||||
| Sub-Order 1. In Textile Fabrics:— | ||||||||||||||||||||||
| Manchester Warehouseman | 55 | ... | 24 | ... | ... | ... | ... | ... | 1 | ... | ... | ... | 4 | ... | ... | ... | 14 | ... | 12 | ... | ... | ... |
| Draper, Linen Draper, Mercer | 1,376 | 88 | 272 | 23 | 35 | 4 | 167 | 14 | 14 | ... | 18 | ... | 58 | 3 | 47 | ... | 327 | 15 | 408 | 29 | ... | ... |
| Woolstapler, Classer, &c. | 182 | ... | 8 | ... | ... | ... | 10 | ... | 23 | ... | 2 | ... | 3 | ... | 1 | ... | 55 | ... | 80 | ... | ... | ... |
| Woollen Manufacturer, &C. (all branches) | 161 | 136 | 1 | ... | ... | ... | 1 | ... | ... | ... | ... | ... | 3 | ... | ... | ... | 47 | 69 | 109 | 67 | ... | ... |
| Woollen Dealer | 15 | ... | 2 | ... | ... | ... | 1 | ... | ... | ... | ... | ... | 1 | ... | ... | ... | 4 | ... | 7 | ... | ... | ... |
| Silk Dealer | 2 | ... | ... | ... | ... | ... | 1 | ... | ... | ... | ... | ... | ... | ... | ... | ... | 1 | ... | ... | ... | ... | ... |
| Others working and dealing in Textile Fabrics | 11 | ... | 3 | ... | ... | ... | ... | ... | ... | ... | 1 | ... | ... | ... | ... | ... | 1 | ... | 6 | ... | ... | ... |
| Sub-Order 2. In Dress:— | ||||||||||||||||||||||
| Hairdresser, Wigmaker | 188 | 2 | 35 | ... | 5 | ... | 29 | ... | 6 | ... | 1 | ... | 10 | 1 | 11 | ... | 41 | ... | 46 | 1 | ... | ... |
| Hat, Cap, Maker, Straw-hat, Bonnet, Maker | 51 | 17 | 11 | 3 | ... | ... | 7 | 5 | ... | ... | ... | ... | 1 | ... | ... | ... | 10 | 6 | 22 | 3 | ... | ... |
| Tailor, Tailoress | 1,041 | 416 | 222 | 91 | 24 | 12 | 122 | 36 | 45 | 5 | 7 | ... | 46 | 6 | 20 | 2 | 237 | 80 | 318 | 184 | ... | ... |
| Furrier | 4 | ... | 1 | ... | ... | ... | 2 | ... | ... | ... | ... | ... | ... | ... | ... | ... | ... | ... | 1 | ... | ... | ... |
| Outfitter, Clothes Dealer, Slopseller | 34 | 3 | 7 | ... | ... | ... | 7 | ... | ... | ... | ... | ... | 2 | 3 | ... | ... | 10 | ... | 8 | ... | ... | ... |
| Milliner, Dressmaker | ... | 3,658 | ... | 883 | ... | 53 | ... | 364 | ... | 104 | ... | 49 | ... | 164 | ... | 95 | ... | 886 | ... | 1,059 | ... | 1 |
| Shirtmaker, Seamstress | 6 | 215 | 4 | 66 | ... | 1 | ... | 18 | ... | 6 | ... | 6 | ... | 19 | ... | 4 | ... | 30 | 2 | 65 | ... | ... |
| Clothing Manufacturer | 26 | 1 | 4 | 1 | ... | ... | 1 | ... | ... | ... | ... | ... | ... | ... | ... | ...8 | ... | 13 | ... | ... | ... | |
| Machinist, Sewing Machinist (not otherwise described) | 80 | 298 | 14 | 38 | ... | ... | 12 | 22 | 3 | 1 | ... | ... | 4 | 1 | 2 | 1 | 22 | 85 | 23 | 150 | ... | ... |
| Hosier, Haberdasher, Glover | 18 | 3 | ... | ... | ... | 1 | 1 | ... | ... | ... | ... | ... | 1 | 1 | ... | ... | 2 | 1 | 14 | ... | ... | ... |
| Shoe, Boot, Maker, Dealer | 2,855 | 177 | 762 | 76 | 46 | ... | 335 | 10 | 65 | ... | 31 | ... | 121 | 1 | 76 | ... | 649 | 37 | 770 | 53 | ... | ... |
| Shoeblack | 3 | ... | 1 | ... | ... | ... | 1 | ... | ... | ... | ... | ... | ... | ... | ... | ... | 1 | ... | ... | ... | ... | ... |
| Umbrella, Parasol, Stick, Maker, Dealer Mender | 18 | 2 | 1 | ... | ... | ... | 3 | ... | ... | ... | ... | ... | ... | ... | ... | ... | 3 | 1 | 11 | 1 | ... | ... |
| Washerwoman, Mangier, Laundry Keeper, Worker | 7 | 493 | ... | 83 | 1 | 6 | 1 | 75 | ... | 14 | ... | 8 | ... | 25 | ... | 38 | 1 | 118 | 4 | 126 | ... | ... |
| Others working and dealing in Dress | 10 | 27 | 2 | 7 | 1 | ... | 2 | 4 | ... | ... | ... | ... | ... | ... | 1 | ... | 1 | 4 | 3 | 12 | ... | ... |
| Sub-Order 3. In Fibrous Materials:— | ||||||||||||||||||||||
| Flax, Phormium, Manufacture (all branches) | 100 | ... | 33 | ... | ... | ... | 3 | ... | 1 | ... | 24 | ... | 13 | ... | 2 | ... | 18 | ... | 6 | ... | ... | ... |
| Mat Maker, Dealer | 5 | ... | 4 | ... | ... | ... | ... | ... | ... | ... | ... | ... | ... | ... | ... | ... | ... | ... | 1 | ... | ... | ... |
| Rope, Cord, Maker, Dealer | 105 | 2 | 40 | 2 | 3 | ... | 15 | ... | 8 | ... | ... | ... | 2 | ... | 1 | ...18 | ... | 18 | ... | ... | ... | |
| Tent, Tarpaulin, Maker, Dealer | 29 | 3 | 1 | ... | 1 | ... | 2 | ... | ... | ... | ... | ... | ... | ... | 3 | 1 | 12 | ... | 10 | 2 | ... | ... |
| Others working and dealing in Fibrous Materials | 7 | 1 | ... | ... | ... | 1 | ... | ... | ... | 1 | ... | ... | ... | ... | ... | ... | ... | 4 | ... | ... | ... | |
| Order X.—Persons Working and Dealing in Food and Drinks. | ||||||||||||||||||||||
| Sub-Order 1. In Animal Food:— | ||||||||||||||||||||||
| Dairyman, Woman, Milkseller | 562 | 70 | 69 | 7 | 6 | 6 | 57 | 9 | 32 | 5 | 6 | ... | 20 | 5 | 17 | 2 | 230 | 17 | 125 | 19 | ... | ... |
| Cheesemonger | 1 | ... | ... | ... | ... | ... | ... | ... | ... | ... | ... | ... | ... | ... | ... | ... | 1 | ... | ... | ... | ... | ... |
| Butcher, Meat Salesman | 2,212 | 2 | 395 | 1 | 76 | ... | 299 | ... | 103 | ... | 41 | ... | 99 | ... | 87 | ... | 516 | ... | 596 | 1 | ... | ... |
| Butcher's Wife assisting in business | ... | 1 | ... | ... | ... | ... | ... | ... | ... | ... | ... | ... | ... | ... | ... | ... | ... | ... | ... | 1 | ... | ... |
| Provision Curer, Dealer, Meat-preserving | 31 | ... | 1 | ... | 2 | ... | ... | ... | ... | ... | ... | ... | ... | ... | ... | ... | 19 | ... | 9 | ... | ... | ... |
| Poulterer, Game Dealer | 11 | ... | 1 | ... | ... | ... | ... | ... | ... | ... | ... | ... | ... | ... | ... | ... | 6 | ... | 4 | ... | ... | ... |
| Fishmonger, Curer, Dealer | 120 | ... | 24 | ... | ... | ... | 7 | ... | ... | ... | 2 | ... | ... | ... | ... | ...28 | ... | 59 | ... | ... | ... | |
| Oyster, Shellfish, Dealer | 23 | 3 | 8 | ... | ... | ... | 9 | ... | ... | ... | ... | ... | 2 | ... | ... | ... | 3 | 3 | 1 | ... | ... | ... |
| Others working and dealing in Animal Food | 6 | 1 | 2 | 1 | ... | ... | 1 | ... | ... | ... | ... | ... | ... | ... | ... | ... | 3 | ... | ... | ... | ... | ... |
| Sub-Order 2. In Vegetable Food:— | ||||||||||||||||||||||
| Corn, Flour, Meal, Merchant, Dealer | 74 | ... | 8 | ... | ... | ... | 11 | ... | ... | ... | ... | ... | 9 | ... | 3 | ... | 30 | ... | 13 | ... | ... | ... |
| Miller, Flour-mill Worker | 418 | ... | 70 | ... | 12 | ... | 42 | ... | 12 | ... | 3 | ... | 23 | ... | 1 | ... | 126 | ... | 129 | ... | ... | ... |
| Baker | 1,359 | 13 | 327 | 4 | 43 | 1 | 185 | ... | 46 | ... | 16 | 1 | 75 | ... | 53 | ... | 273 | 2 | 341 | 4 | ... | ... |
| Confectioner, Pastry-cook | 192 | 11 | 44 | 3 | 1 | ... | 23 | 3 | 3 | ... | ... | 1 | 6 | ... | 1 | ... | 44 | 1 | 70 | 3 | ... | ... |
| Greengrocer, Fruiterer | 119 | 40 | 14 | 12 | 2 | ... | 23 | 5 | 4 | 1 | 1 | ... | 8 | 4 | 4 | 4 | 33 | 7 | 30 | 7 | ... | ... |
| Seed Merchant, Dealer | 51 | ... | 11 | ... | ... | ... | 3 | ... | ... | ... | 1 | ... | 2 | ... | 1 | ... | 15 | ... | 18 | ... | ... | ... |
| Others working and dealing in Vegetable Food | 26 | 2 | 4 | ... | ... | ... | ... | 2 | ... | ... | ... | ... | 1 | ... | ... | ... | 16 | ... | ... | ... | ... | ... |
| Sub-Order 3. In Drinks and Stimulants— | ||||||||||||||||||||||
| Brewer | 410 | 2 | 76 | ... | 16 | ... | 56 | ... | 14 | ... | 8 | ... | 28 | 2 | 16 | ... | 8a | ... | 114 | ... | ... | ... |
| Maltster | 78 | ... | 3 | ... | ... | ... | 5 | ... | 1 | ... | 5 | ... | 13 | ... | 1 | ... | 34 | ... | 16 | ... | ... | ... |
| Wine, Spirit, Merchant | 24 | ... | 3 | ... | ... | ... | 6 | ... | ... | ... | ... | ... | 1 | ... | ... | ... | 9 | ... | 5 | ... | ... | ... |
| Wine Manufacturer | 3 | ... | 1 | ... | ... | ... | ... | ... | ... | ... | ... | ... | 1 | ... | ... | ... | ... | ... | 1 | ... | ... | ... |
| Aërated Waters, Cordial, Manufacturer | 163 | ... | 32 | ... | 5 | ... | 23 | ... | 11 | ... | 3 | ... | 3 | ... | 10 | ... | 28 | ... | 48 | ... | ... | ... |
| Coffee, Chicory, Roaster, Dealer ... | 7 | ... | 2 | ... | ... | ... | 2 | ... | ... | ... | ... | ... | ... | ... | ... | ... | ... | ... | 3 | ... | ... | ... |
| Grocer, Tea Dealer | 875 | 44 | 251 | 26 | 14 | ... | 86 | 4 | 20 | 1 | 5 | ... | 13 | 1 | 20 | 1 | 181 | 5 | 285 | 6 | ... | ... |
| Tobacconist, Manufacturer | 79 | 2 | 16 | 1 | 1 | ... | 12 | 1 | 4 | ... | 1 | ... | 4 | ... | 4 | ... | 19 | ... | 18 | ... | ... | ... |
| Sugar Boiler ... | 6 | ... | 3 | ... | ... | ... | 1 | ... | ... | ... | ... | ... | ... | ... | ... | ... | ... | ... | 2 | ... | ... | ... |
| Others working and dealing in Drinks and Stimulants | 21 | 1 | 5 | 1 | ... | ... | ... | ... | ... | ... | ... | ... | ... | ... | ... | ... | 9 | ... | 7 | ... | ... | ... |
| Order XI.—Persons Working and Dealing in Animal and Vegetable Substances. | ||||||||||||||||||||||
| Sub-Order 1. In Animal Matters— | ||||||||||||||||||||||
| Soapboiler | 41 | ... | 12 | ... | ... | ... | 3 | ... | 1 | ... | ... | ... | ... | ... | ... | ... | 9 | ... | 16 | ... | ... | ... |
| Tallow Chandler | 25 | ... | 3 | ... | ... | ... | 3 | ... | ... | ... | ... | ... | ... | ... | ... | ... | 6 | ... | 13 | ... | ... | ... |
| Tallow Melter, Boiler-down (not meat-pre-serving) | 27 | ... | 2 | ... | ... | ... | 4 | ... | 17 | ... | ... | ... | ... | ... | ... | ... | 2 | ... | 2 | ... | ... | ... |
| Manure Manufacturer, Dealer | 8 | ... | 5 | ... | ... | ... | ... | ... | ... | ... | ... | ... | ... | ... | ... | ... | 2 | ... | 1 | ... | ... | ... |
| Hide, Skin, Dealer | 9 | ... | ... | ... | ... | ... | ... | ... | ... | ... | ... | ... | ... | ... | ... | ... | 1 | ... | 8 | ... | ... | ... |
| Fellmonger, Wool-scourer | 298 | ... | 13 | ... | 6 | ... | 41 | ... | 20 | ... | 19 | ... | 14 | ... | 2 | ... | 85 | ... | 98 | ... | ... | ... |
| Tanner | 146 | ... | 39 | ... | ... | ... | 28 | ... | 3 | ... | ... | ... | 3 | ... | 1 | ... | 24 | ... | 48 | ... | ... | ... |
| Currier | 98 | ... | 35 | ... | ... | ... | 25 | ... | ... | ... | ... | ... | 4 | ... | 2 | ... | 12 | ... | 20 | ... | ... | ... |
| Leather Manufacturer ... | 17 | ... | 6 | ... | ... | ... | 1 | ... | ... | ... | ... | ... | ... | ... | ... | ... | 7 | ... | 3 | ... | ... | ... |
| Feather Dresser, Cleaner, Dealer ... | 1 | 2 | ... | ... | ... | ... | ... | 1 | ... | ... | ... | ... | ... | ... | ... | ... | 1 | 1 | ... | ... | ... | ... |
| Hairbrush, Broom, Maker, Dealer... | 23 | 6 | 14 | 6 | ... | ... | 3 | ... | ... | ... | ... | ... | ... | ... | ... | ... | 1 | ... | 5 | ... | ... | ... |
| Others working and dealing in Animal Matters | 45 | ... | 4 | ... | ... | ... | 2 | ... | ... | ... | ... | 1 | ... | ... | ... | ... | 11 | ... | 27 | ... | ... | |
| Sub-Order 2. In Vegetable Matters— | ||||||||||||||||||||||
| Oil and Colour Man | 16 | ... | 8 | ... | ... | ... | 1 | ... | ... | ... | 1 | ... | ... | ... | 1 | ... | 1 | ... | 4 | ... | ... | ... |
| French Polisher | 69 | ... | 12 | ... | 1 | ... | 4 | ... | 3 | ... | ... | ... | 3 | ... | ... | ... | 14 | ... | 32 | ... | ... | ... |
| Timber Merchant and Employé | 232 | ... | 87 | ... | 4 | ... | 25 | ... | 16 | ... | 3 | ... | 3 | ... | 4 | ... | 38 | ... | 52 | ... | ... | ... |
| Firewood Dealer, Chopper, Woodcutter | 178 | ... | 39 | ... | 13 | ... | 34 | ... | 2 | ... | 6 | ... | 4 | ... | 11 | ... | 5 | ... | 64 | ... | ... | ... |
| Fencer, Splitter | 270 | 1 | 39 | 1 | 10 | ... | 59 | ... | 50 | ... | 18 | ... | 14 | ... | ... | ... | 25 | ... | 55 | ... | ... | ... |
| Turner | 121 | ... | 38 | ... | ... | ... | 17 | ... | 2 | ... | 1 | ... | 5 | ... | 1 | ... | 27 | ... | 30 | ... | ... | ... |
| Cooper | 177 | ... | 44 | ... | 10 | ... | 32 | ... | 9 | ... | 1 | ... | 11 | ... | 4 | ... | 34 | ... | 31 | ... | 1 | ... |
| Sawyer, Saw-mill Owner, Worker, Squarer | 1,815 | ... | 646 | ... | 48 | ... | 222 | ... | 77 | ... | 145 | ... | 111 | ... | 47 | ... | 148 | ... | 371 | ... | ... | ... |
| Basketmaker | 33 | ... | 6 | ... | 1 | ... | 8 | ... | 2 | ... | 1 | ... | ... | ... | ... | ... | 4 | ... | 11 | ... | ... | ... |
| Kauri Gum Digger, Dealer, Worker | 1,159 | 1 | 1,159 | 1 | ... | ... | ... | ... | ... | ... | ... | ... | ... | ... | ... | ... | ... | ... | ... | ... | ... | ... |
| Hay, Straw, Dealer, Chaff-cutter | 7 | ... | 2 | ... | ... | ... | ... | ... | ... | ... | ... | ... | ... | ... | ... | ... | 5 | ... | ... | ... | ... | ... |
| Paper Manufacturer | 4 | ... | ... | ... | ... | ... | 1 | ... | ... | ... | ... | ... | ... | ... | ... | ... | ... | ... | 3 | ... | ... | ... |
| Bill Sticker, Distributer | 5 | ... | ... | ... | ... | ... | 2 | ... | ... | ... | ... | ... | 1 | ... | ... | ... | 1 | ... | 1 | ... | ... | ... |
| Others working and dealing in Vegetable Matters | 29 | 9 | 15 | 4 | 2 | ... | 2 | ... | ... | ... | ... | ... | ... | ... | ... | ... | 3 | 2 | 7 | 3 | ... | ... |
| Order XII.—Persons Working and Dealing in Minerals. | ||||||||||||||||||||||
| Sub-Order 1. In Mining—Gold Miner, Alluvial | 5,363 | ... | ... | ... | ... | ... | ... | ... | ... | ... | 168 | ... | 1,538 | ... | 2,003 | ... | ... | ... | 1,654 | ... | ... | ... |
| Sluicer | 2,941 | 2 | 2 | ... | ... | ... | 1 | ... | ... | ... | ... | ... | 523 | ... | 751 | 1 | ... | ... | 1,664 | 1 | ... | ... |
| Quartz and Cement Miner, Crusher | 2,066 | ... | 1,312 | ... | ... | ... | 5 | ... | ... | ... | 25 | ... | 391 | ... | 11 | ... | ... | ... | 322 | ... | ... | ... |
| Gold Miner, Digger (not otherwise described) | 2,624 | ... | 188 | ... | 8 | ... | 33 | ... | 11 | ... | 14 | ... | 315 | ... | 423 | ... | 47 | ... | 1,585 | ... | ... | ... |
| Coal Miner, Collier | 1,087 | ... | 241 | ... | 2 | ... | ... | ... | ... | ... | 2 | ... | 154 | ... | 29 | ... | 179 | ... | 480 | ... | ... | ... |
| Others engaged in Mining | 190 | ... | 60 | ... | ... | ... | 3 | ... | ... | ... | 3 | ... | 16 | ... | 61 | ... | 5 | ... | 42 | ... | ... | ... |
| Sub-Order 2. In Coal— | ||||||||||||||||||||||
| Coal, Coke, Merchant, Dealer | 129 | 1 | 10 | ... | ... | ... | 11 | ... | 2 | ... | ... | ... | 7 | ... | 3 | ... | 37 | ... | 59 | 1 | ... | ... |
| Coal Heaver, Labourer | 40 | ... | 11 | ... | ... | ... | 1 | ... | ... | ... | ... | ... | 1 | ... | ... | ... | 9 | ... | 18 | ... | ... | ... |
| Charcoal Burner, Dealer | 4 | ... | 1 | ... | ... | ... | ... | ... | ... | ... | ... | ... | 2 | ... | ... | ... | ... | ... | 1 | ... | ... | ... |
| Chimney-sweeper | 29 | ... | 4 | ... | ... | ... | 7 | ... | 1 | ... | ... | ... | 1 | ... | 1 | ... | 7 | ... | 8 | ... | ... | ... |
| Gasworks Service | 80 | ... | 17 | ... | 2 | ... | 7 | ... | 4 | ... | ... | ... | 1 | ... | 6 | ... | 23 | ... | 20 | ... | ... | ... |
| Others working and dealing in Coal and Mineral Oil | 11 | ... | 6 | ... | ... | ... | ... | ... | ... | ... | ... | ... | ... | ... | 1 | ... | ... | ... | 4 | ... | ... | ... |
| Sub-Order 3. In Stone, Clay, Earthenware, and Glass— | ||||||||||||||||||||||
| Quarry Owner, Worker | 154 | ... | 14 | ... | 4 | ... | 1 | ... | 3 | ... | ... | ... | ... | ... | 12 | ... | 23 | ... | 97 | ... | ... | ... |
| Stone Cutter, Dresser (not Mason) | 72 | ... | 6 | ... | 1 | ... | 12 | ... | 1 | ... | ... | ... | 1 | ... | 1 | ... | 10 | ... | 40 | ... | ... | ... |
| Lime Burner, Quarrier, Dealer | 62 | ... | 22 | ... | ... | ... | ... | ... | 1 | ... | 3 | ... | 5 | ... | 4 | ... | 6 | ... | 21 | ... | ... | ... |
| Plaster, Cement, Maker, Dealer ... | 3 | ... | 1 | ... | ... | ... | ... | ... | ... | ... | ... | ... | ... | ... | ... | ... | ... | 2 | ... | ... | ... | ... |
| Brick Maker, Dealer | 524 | ... | 95 | ... | 16 | ... | 86 | ... | 26 | ... | 11 | ... | 12 | ... | 1 | ... | 139 | ... | 138 | ... | ... | ... |
| Pottery Maker, Dealer | 104 | 6 | 34 | ... | 1 | ... | 3 | ... | ... | ... | ... | ... | 3 | ... | ... | ... | 30 | ... | 33 | 6 | ... | ... |
| Glass Maker, Dealer | 15 | ... | 4 | ... | ... | ... | 3 | ... | ... | ... | ... | ... | ... | ... | ... | ... | 3 | ... | 5 | ... | ... | ... |
| China, Earthenware, Maker, Dealer | 21 | ... | 6 | ... | ... | ... | ... | ... | ... | ... | ... | ... | 1 | ... | ... | ... | 2 | ... | 12 | ... | ... | ... |
| Road, Railway, Contractor | 184 | ... | 63 | ... | 2 | ... | 14 | ... | 4 | ... | 5 | ... | 5 | ... | 7 | ... | 42 | ... | 42 | ... | ... | ... |
| Road Surveyor, Inspector | 119 | ... | 25 | ... | 23 | ... | 13 | ... | 10 | ... | 3 | ... | 1 | ... | 7 | ... | 13 | ... | 24 | ... | ... | ... |
| Road, Railway, Labourer, Navvy, Excavator | 2,866 | ... | 825 | ... | 203 | ... | 268 | ... | 75 | ... | 67 | ... | 112 | ... | 139 | ... | 471 | ... | 706 | ... | ... | ... |
| Nightman, Scavenger | 5 | ... | ... | ... | ... | ... | 1 | ... | ... | ... | ... | ... | ... | ... | ... | ... | 1 | ... | 3 | ... | ... | ... |
| Others working and dealing in Stone, Clay, Earthenware, and Glass | 45 | 1 | 3 | ... | 1 | ... | 2 | ... | ... | ... | ... | ... | ... | ... | ... | ... | 38 | ... | 1 | 1 | ... | ... |
| Sub-Order 4. In Water— | ||||||||||||||||||||||
| Waterworks Service | 13 | ... | 2 | ... | ... | ... | 2 | ... | 1 | ... | ... | ... | 4 | ... | 1 | ... | 1 | ... | 2 | ... | ... | ... |
| Others working and dealing in Water | 43 | ... | 8 | ... | ... | ... | 2 | ... | 1 | ... | 1 | ... | ... | ... | ... | ... | 28 | ... | 3 | ... | ... | ... |
| Sub-Order 5. In Gold, Silver, & Precious Stones— | ||||||||||||||||||||||
| Goldsmith, Silversmith, Jeweller | 132 | 1 | 19 | ... | 1 | ... | 7 | ... | 5 | ... | ... | ... | 7 | ... | 3 | ... | 33 | ... | 57 | 1 | ... | ... |
| Lapidary, Precious Stones Worker, Dealer | 14 | ... | 4 | ... | ... | ... | ... | ... | 1 | ... | ... | ... | 1 | ... | 1 | ... | ... | ... | 7 | ... | ... | ... |
| Assayer | 2 | ... | 2 | ... | ... | ... | ... | ... | ... | ... | ... | ... | ... | ... | ... | ... | ... | ... | ... | ... | ... | |
| Electroplater, Plater | 5 | ... | 3 | ... | ... | ... | ... | ... | ... | ... | ... | ... | 1 | ... | 1 | ... | ... | ... | ... | ... | ... | |
| Others Working and Dealing in Gold, Silver, and Precious Stones | 3 | ... | 1 | ... | ... | ... | ... | ... | ... | ... | ... | ... | ... | ... | ... | ... | 2 | ... | ... | ... | ||
| Sub-Order 6. In Metals other than Gold and Silver— | ||||||||||||||||||||||
| Copper, Worker, Dealer | 29 | ... | 6 | ... | ... | ... | 3 | ... | ... | ... | ... | ... | ... | ... | ... | ... | 4 | ... | 16 | ... | ... | ... |
| Tin, Quicksilver, Worker, Dealer | 303 | ... | 46 | ... | 5 | ... | 35 | ... | 10 | ... | 5 | ... | 15 | ... | 17 | ... | 82 | ... | 88 | |||
| Zinc Worker, Dealer | 3 | ... | 1 | ... | ... | ... | ... | ... | ... | ... | ... | ... | ... | ... | ... | ... | 1 | ... | 1 | ... | ... | ... |
| Iron Founder, Moulder, Boiler-maker, Worker, Dealer | 506 | ... | 105 | ... | 3 | ... | 49 | ... | 4 | ... | 1 | ... | 12 | ... | 4 | ... | 116 | ... | 212 | ... | ... | ... |
| Blacksmith, Whitesmith | 2,369 | ... | 440 | ... | 69 | ... | 230 | ... | 77 | ... | 45 | ... | 126 | ... | 53 | ... | 683 | ... | 646 | ... | ... | ... |
| Ironmonger, Hardware Dealer | 403 | ... | 77 | ... | 10 | ... | 74 | ... | 11 | ... | 2 | ... | 11 | ... | 13 | ... | 75 | ... | 130 | ... | ... | ... |
| Brass Founder, Moulder, Worker, Dealer | 74 | ... | 17 | ... | 1 | ... | 6 | ... | ... | ... | ... | ... | ... | ... | ... | ... | 9 | ... | 41 | ... | ... | ... |
| Locksmith, Bell Hanger | 9 | ... | ... | ... | 1 | ... | 4 | ... | ... | ... | ... | ... | 1 | ... | ... | ... | 1 | ... | 2 | ... | ... | ... |
| Gasfitter | 46 | ... | 7 | ... | ... | ... | 15 | ... | ... | ... | ... | ... | ... | ... | ... | ... | 22 | ... | 2 | ... | ... | ... |
| Others working and dealing in Metals other than Gold or Silver | 6 | 1 | 1 | ... | ... | ... | ... | ... | 1 | ... | ... | ... | ... | ... | ... | ... | 2 | ... | 1 | 1 | ... | ... |
| CLASS VI.—INDEFINITE AND NON-PRODUCTIVE. | ||||||||||||||||||||||
| Order XIII.—Labourers and Others (Branch of Labour undefined). | ||||||||||||||||||||||
| Sub-Order 1. General Labourers— | ||||||||||||||||||||||
| Labourer (branch undefined) | 14,904 | ... | 1,020 | ... | 573 | ... | 2,325 | ... | 663 | ... | 327 | ... | 487 | ... | 195 | ... | 4,960 | ... | 4,351 | ... | 3 | ... |
| Sub-Order 2. Other Indefinite Occupations— | ||||||||||||||||||||||
| Mechanic, Manufacturer (not otherwise described) | 64 | ... | 16 | ... | ... | ... | 5 | ... | 3 | ... | ... | ... | 2 | ... | 1 | ... | 11 | ... | 26 | ... | ... | ... |
| Shop Man, Woman (branch undefined) | ... | 28 | ... | 8 | ... | ... | ... | 4 | ... | ... | ... | ... | ... | 4 | ... | 1 | ... | 7 | ... | 4 | ... | ... |
| Apprentice (branch undefined) | ... | 88 | 2 | 16 | ... | 1 | ... | 17 | ... | 3 | ... | 2 | ... | 4 | ... | 1 | ... | 19 | 1 | 25 | 1 | ... |
| Engineer, Engine-driver, Stoker, Fireman (undefined) | 1,126 | ... | 146 | ... | 21 | ... | 182 | ... | 29 | ... | 17 | ... | 35 | ... | 21 | ...297 | ... | 378 | ... | ... | ... | |
| Draughtsman (not otherwise described) | 51 | ... | 14 | ... | 4 | ... | 11 | ... | ... | ... | ... | ... | 3 | ... | ... | ... | 9 | ... | 10 | ... | ... | ... |
| Contractor, Assistant (undefined) | 1,083 | ... | 130 | ... | 34 | ... | 174 | ... | 40 | ... | 11 | ... | 50 | ... | 38 | ... | 298 | ... | 308 | ... | ... | ... |
| Manager, Overlooker, Foreman | 50 | ... | 4 | ... | 3 | ... | 19 | ... | 4 | ... | ... | ... | 1 | ... | ... | ... | 13 | ... | 6 | ... | ... | ... |
| Other Indefinite Occupations | 420 | 6 | 58 | 1 | 20 | ... | 47 | 1 | 10 | ... | 10 | ... | 32 | ... | 2 | 2 | 154 | ... | 87 | 2 | ... | ... |
| Order XIV.— | ||||||||||||||||||||||
| Persons of Properly or Rank (not returned under any Office or Occupation) | 278 | 121 | 81 | 32 | 9 | 5 | 39 | 22 | 12 | 8 | 5 | 2 | 18 | 7 | 2 | ... | 46 | 23 | 65 | 22 | 1 | ... |
| Order XV.— | ||||||||||||||||||||||
| Persons supported by the Community. | ||||||||||||||||||||||
| Sub-Order 1. From Voluntary Sources and Public Revenue— | ||||||||||||||||||||||
| Pensioner (New Zealand) | 40 | ... | 18 | ... | 2 | ... | 5 | ... | 2 | ... | ... | ... | ... | ... | ... | ... | 3 | ... | 10 | ... | ... | ... |
| Dependent on Relatives | 4 | 2 | 1 | ... | ... | ... | 1 | ... | ... | ... | ... | ... | 1 | ... | ... | ... | 1 | ... | ... | 2 | ... | ... |
| Inmate of Charitable Institution | 1,510 | 663 | 344 | 135 | 24 | ... | 124 | 71 | 52 | 15 | 10 | 3 | 59 | 52 | 103 | 30 | 372 | 185 | 422 | 172 | ... | ... |
| Inmate of Industrial School | 310 | 195 | 47 | 29 | ... | ... | ... | ... | ... | ... | ... | ... | ... | ... | ... | ... | 118 | 56 | 145 | 110 | ... | ... |
| Pauper, Beggar | 1 | ... | ... | ... | ... | ... | ... | ... | ... | ... | ... | ... | 1 | ... | ... | ... | ... | ... | ... | ... | ... | ... |
| Sub-Order 2. Criminal Classes— | ||||||||||||||||||||||
| Prisoner | 593 | 93 | 122 | 22 | 28 | 3 | 86 | 12 | 34 | 1 | ... | ... | 13 | 1 | 12 | 2 | 184 | 23 | 114 | 29 | ... | ... |
| Inmate of Reformatory | 54 | ... | 54 | ... | ... | ... | ... | ... | ... | ... | ... | ... | ... | ... | ... | ... | ... | ... | ... | ... | ... | ... |
| Inmate of Refuge | ... | 10 | ... | ... | ... | ... | ... | ... | ... | ... | ... | ... | ... | ... | ... | ... | ... | 7 | ... | 3 | ... | ... |
| Other Criminals | ... | 1 | ... | ... | ... | ... | ... | ... | ... | ... | ... | ... | ... | ... | ... | ... ... | ... | ... | ... | 1 | ... | ... |
| No Occupation stated | 1,797 | 16 | 419 | 2 | 64 | 1 | 137 | 2 | 66 | 6 | 29 | ... | 88 | ... | 22 | ... | 539 | 4 | 433 | 1 | ... | ... |
OCCUPATIONS OF THE CHINESE.
Table VI. Showing the Occupations of the Chinese Population of the Colony, Persons, Males, and Females, on the 3rd April, 1881.
| Class. | Order. | Sub. Order. | Occupations of Chinese. | Persons. | Males. | Females. |
|---|---|---|---|---|---|---|
| Total Population | 5,004 | 4,995 | 9 | |||
| I. | II. | 3 | Irregular Medical Man | 3 | 3 | ... |
| 4 | Interpreter | 3 | 3 | ... | ||
| 9 | Gambling (Ticket Seller) | 1 | 1 | ... | ||
| II. | III. | 1 | Wife | 4 | ... | 4 |
| 2 | Son, Daughter, Relative, Visitor (not otherwise described) | 9 | 5 | 4 | ||
| 3 | Scholar at Public School | 2 | 2 | ... | ||
| IV. | 1 | Coffee, Eating, House Keeper | 3 | 3 | ... | |
| 1 | Boarding, Lodging, House Keeper | 19 | 19 | ... | ||
| 1 | Cook (not Domestic Servant) | 56 | 56 | ... | ||
| 2 | Domestic Servant | 12 | 11 | 1 | ||
| 2 | Inn, Club-house, Servant | 41 | 41 | ... | ||
| III. | V. | 1 | Merchant | 7 | 7 | ... |
| 1 | Commercial Clerk | 2 | 2 | ... | ||
| 2 | Shopkeeper (branch undefined) | 85 | 85 | ... | ||
| 2 | Hawker, Pedlar | 33 | 33 | ... | ||
| 2 | Other General Dealers* | 12 | 12 | ... | ||
| VI. | 2 | Others on Roads† | 4 | 4 | ... | |
| 3 | Officer, Sailor (Merchant Service) | 19 | 19 | ... | ||
| 3 | Engineer, Stoker | 21 | 21 | ... | ||
| 3 | Ship Servant, Steward | 13 | 13 | ... | ||
| 4 | Store Labourer, Storeman (not Shopman) | 8 | 8 | ... | ||
| IV. | VII. | 1 | Farmer, Market Gardener | 298 | 298 | ... |
| 1 | Farm Servant and Labourer | 60 | 60 | ... | ||
| 1 | Gardener (not Domestic Servant) | 95 | 95 | ... | ||
| 1 | Others connected with Agriculture‡ | 7 | 7 | ... | ||
| 2 | Station Servant, Labourer | 18 | 18 | ... | ||
| 2 | Cook | 6 | 6 | ... | ||
| 3 | Grubber, Bushman | 1 | 1 | ... | ||
| 4 | Fisherman | 15 | 15 | ... | ||
| 4 | Others, Rabbiters | 53 | 53 | ... | ||
| V. | VIII. | 4 | Wood Carver | 1 | 1 | ... |
| 12 | Carpenter, Joiner | 9 | 9 | ... | ||
| 13 | Furniture Maker | 10 | 10 | ... | ||
| IX. | 1 | Draper | 8 | 8 | ... | |
| 2 | Hairdresser | 1 | 1 | ... | ||
| 2 | Tailor | 1 | 1 | ... | ||
| X. | 1 | Butcher | 12 | 12 | ... | |
| 1 | Fishmonger, Curer, Dealer | 10 | 10 | ... | ||
| 2 | Greengrocer, Fruiterer, and Assistant | 8 | 8 | ... | ||
| 3 | Grocer, Tea Dealer | 2 | 2 | ... | ||
| 3 | Tobaconist | 1 | 1 | ... | ||
| 3 | Others working and dealing in Drinks and Stimulants§ | 2 | 2 | ... | ||
| XI. | 2 | Firewood Dealer | 3 | 3 | ... | |
| 2 | Cooper | 1 | 1 | ... | ||
| XII. | 1 | Gold Miner (alluvial) | 1,767 | 1,767 | ... | |
| 1 | Sluicer | 1,099 | 1,099 | ... | ||
| 1 | Quartz Miner, Crusher | 2 | 2 | ... | ||
| 1 | Gold Miner (not otherwise described) | 990 | 990 | ... | ||
| 3 | Quarry man, Coal Miner | 2 | 2 | ... | ||
| 3 | Road, Railway, Labourer, Navvy | 77 | 77 | ... | ||
| 5 | Silversmith | 1 | 1 | ... | ||
| VI. | XIII. | 1 | Labourer (branch undefined) | 56 | 56 | ... |
| 2 | Others, Lodgers | 3 | 3 | ... | ||
| XV. | 1 | Inmate of Charitable Institution | 18 | 18 | ... | |
| 2 | Prisoner | 1 | 1 | ... | ||
| No occupation stated | 9 | 9 | ... | |||
| * 7 General Dealers, 4 Storekeepers' Labourers, 1 Dealer's Assistant. | ||||||
| † 4 Packers. ‡ 7 Garden Labourers. § 2 Assistant Tea Dealers. | ||||||
PART VIII.—SICKNESS AND INFIRMITY.
CONTENTS.
PAGE.
Ages of the Sick and Infirm at Quinquennial Periods, with Proportions per 10,000 living 273
Occupations of the Sick and Infirm 275
CENSUS TABLES, 1881. PART VIII.
Table VIII. SICKNESS AND INFIRMITY. SICKNESS AND INFIRMITY.—AGES AT QUINQUENNIAL PERIODS, WITH PROPORTIONS PER 10,000.
| TABLE I.—Showing the Ages, in
Quinquennial Periods, and Proportions in every 10,000 Living, of
Persons, Males, and Females (exclusive of Maoris), of 15 Years of
Age and upwards, returned as Sick or Suffering from Accident; and of
all Ages returned as Deaf and Dumb, Blind, Lunatics, Idiots,
Epileptic, Paralyzed, Crippled and Deformed, Suffering from Debility
and Deafness, on the 3rd April, 1881. The sickness of those under 15 years has not
been brought out, the instruction to householders on the Census
schedule being that, if "unable to follow usual occupation by reason
of illness or accident," the word "Sick" or "Accident" was to be
entered. | |||||||||||||||
|---|---|---|---|---|---|---|---|---|---|---|---|---|---|---|---|
| NUMBERS. | |||||||||||||||
| Ages. | PERSONS. | ||||||||||||||
| Total of Population | Sick and Accident, 15 Years and upwards. | Specified Infirmities, all Ages. | |||||||||||||
| Total. | Sick. | Specified Complaints. | Suffering from Accident. | Total. | Deaf and Dumb. | Blind. | Lunatic. | Idiots. | Epileptic. | Paralysis. | Crippled and Deformed. | Debility and Infirmity. | Deaf only. | ||
| All ages | 489,933 | ... | ... | ... | ... | 2,269 | 114 | 138 | 1,120 | 58 | 194 | 104 | 132 | 272 | 137 |
| 15 years and upwards | 282,107 | 3,160 | 2,333 | 250 | 577 | ... | ... | ... | ... | ... | ... | ... | ... | ... | ... |
| Under 5 years | 82,289 | ... | ... | ... | ... | 22 | 5 | 6 | ... | 2 | 5 | ... | 1 | 3 | ... |
| 5 years to 10 years | 67,915 | ... | ... | ... | ... | 82 | 29 | 2 | 5 | 3 | 12 | 7 | 15 | 4 | 5 |
| 10 years to 15 years | 57,622 | ... | ... | ... | ... | 127 | 21 | 11 | 10 | 14 | 27 | 7 | 15 | 18 | 4 |
| 15 years to 20 years | 42,609 | 218 | 172 | 17 | 29 | 140 | 17 | 4 | 24 | 11 | 35 | 3 | 25 | 18 | 3 |
| 20 years to 25 years | 41,365 | 278 | 215 | 14 | 49 | 146 | 10 | 5 | 63 | 10 | 21 | ... | 9 | 13 | 15 |
| 25 years to 30 years | 40,586 | 330 | 244 | 9 | 77 | 152 | 9 | 3 | 98 | 5 | 15 | 1 | 7 | 8 | 6 |
| 30 years to 35 years | 34,595 | 280 | 209 | 12 | 59 | 208 | 6 | 9 | 143 | 6 | 16 | 5 | 3 | 13 | 7 |
| 35 years to 40 years | 33,562 | 338 | 244 | 26 | 68 | 268 | 4 | 8 | 196 | 1 | 12 | 11 | 5 | 18 | 13 |
| 40 years to 45 years | 31,100 | 345 | 245 | 24 | 76 | 273 | 2 | 9 | 199 | 1 | 10 | 8 | 10 | 18 | 16 |
| 45 years to 50 years | 21,341 | 313 | 222 | 25 | 66 | 227 | 2 | 9 | 151 | ... | 7 | 13 | 9 | 20 | 16 |
| 50 years to 55 years | 14,563 | 274 | 179 | 35 | 60 | 164 | ... | 6 | 102 | 1 | 8 | 10 | 6 | 17 | 14 |
| 55 years to 60 years | 7,820 | 204 | 149 | 27 | 28 | 136 | 2 | 12 | 60 | 2 | 10 | 10 | 9 | 23 | 8 |
| 60 years to 65 years | 6,339 | 211 | 156 | 24 | 31 | 94 | 3 | 9 | 32 | ... | 4 | 12 | 3 | 20 | 11 |
| 65 years to 70 years | 3,232 | 133 | 98 | 16 | 19 | 79 | 1 | 10 | 20 | 1 | 5 | 7 | 5 | 25 | 5 |
| 70 years to 75 years | 2,087 | 116 | 95 | 9 | 12 | 65 | 2 | 15 | 11 | ... | 2 | 5 | 3 | 20 | 7 |
| 75 years to 80 years | 992 | 55 | 46 | 7 | 2 | 37 | ... | 8 | 2 | ... | 3 | 2 | 3 | 16 | 3 |
| 80 and upwards | 584 | 54 | 49 | 5 | ... | 41 | ... | 12 | 2 | ... | 1 | 2 | 3 | 18 | 3 |
| Unspecified | 1,332 | 11 | 10 | ... | 1 | 8 | 1 | ... | 2 | 1 | 1 | 1 | 1 | ... | 1 |
| MALES. | |||||||||||||||
| All ages | 269,605 | ... | ... | ... | ... | 1,433 | 60 | 79 | 736 | 36 | 112 | 67 | 101 | 164 | 78 |
| 15 years and upwards | 164,789 | 2,114 | 1,404 | 181 | 529 | ... | ... | ... | ... | ... | ... | ... | ... | ... | ... |
| Under 5 years | 41,636 | ... | ... | ... | ... | 12 | 3 | 2 | ... | ... | 3 | ... | 1 | 3 | ... |
| 5 years to 10 years | 34,305 | ... | ... | ... | ... | 46 | 16 | 1 | 3 | 2 | 6 | 4 | 8 | 4 | 2 |
| 10 years to 15 years | 28,875 | ... | ... | ... | ... | 70 | 10 | 5 | 6 | 7 | 17 | 3 | 10 | 10 | 2 |
| 15 years to 20 years | 21,060 | 113 | 80 | 8 | 25 | 77 | 6 | 2 | 14 | 7 | 20 | 3 | 18 | 6 | 1 |
| 20 years to 25 years | 22,078 | 173 | 121 | 9 | 43 | 82 | 4 | 3 | 36 | 8 | 10 | ... | 7 | 6 | 8 |
| 25 years to 30 years | 23,916 | 212 | 133 | 4 | 75 | 97 | 7 | 2 | 64 | 3 | 8 | 1 | 6 | 3 | 3 |
| 30 years to 35 years | 20,202 | 177 | 112 | 9 | 56 | 133 | 4 | 5 | 92 | 4 | 8 | 4 | 3 | 8 | 5 |
| 35 years to 40 years | 20,318 | 228 | 143 | 20 | 65 | 168 | 3 | 5 | 120 | ... | 9 | 9 | 4 | 9 | 9 |
| 40 years to 45 years | 20,099 | 239 | 155 | 14 | 70 | 183 | 1 | 8 | 132 | 1 | 3 | 6 | 10 | 10 | 12 |
| 45 years to 50 years | 13,972 | 230 | 151 | 20 | 59 | 159 | 1 | 8 | 105 | ... | 4 | 9 | 8 | 15 | 9 |
| 50 years to 55 years | 9,553 | 205 | 127 | 25 | 53 | 114 | ... | 1 | 78 | 1 | 6 | 5 | 4 | 13 | 6 |
| 55 years to 60 years | 4,855 | 142 | 96 | 19 | 27 | 84 | ... | 7 | 37 | 2 | 6 | 6 | 7 | 13 | 6 |
| 60 years to 65 years | 3,809 | 148 | 99 | 22 | 27 | 59 | 3 | 8 | 19 | ... | 3 | 7 | 2 | 11 | 6 |
| 65 years to 70 years | 1,879 | 100 | 68 | 15 | 17 | 54 | 1 | 7 | 16 | 1 | 2 | 6 | 5 | 16 | ... |
| 70 years to 75 years | 1,175 | 75 | 59 | 6 | 10 | 46 | ... | 10 | 8 | ... | 2 | 2 | 3 | 16 | 5 |
| 75 years to 80 years | 581 | 35 | 27 | 7 | 1 | 23 | ... | 1 | 2 | ... | 3 | 1 | 3 | 10 | 3 |
| 80 and upwards | 322 | 28 | 25 | 3 | ... | 21 | ... | 4 | 2 | ... | 1 | 1 | 1 | 11 | 1 |
| Unspecified | 970 | 9 | 8 | ... | 1 | 5 | 1 | ... | 2 | ... | 1 | ... | 1 | ... | ... |
| FEMALES. | |||||||||||||||
| All Ages | 220,328 | ... | ... | ... | ... | 836 | 54 | 59 | 384 | 22 | 82 | 37 | 31 | 108 | 59 |
| 15 years and upwards | 117,318 | 1,046 | 929 | 69 | 48 | ... | ... | ... | ... | ... | ... | ... | ... | ... | ... |
| Under 5 years | 40,653 | ... | ... | ... | ... | 10 | 2 | 4 | ... | 2 | 2 | ... | ... | ... | ... |
| 5 years to 10 years | 33,610 | ... | ... | ... | ... | 36 | 13 | 1 | 2 | 1 | 6 | 3 | 7 | ... | 3 |
| 10 years to 15 years | 28,747 | ... | ... | ... | ... | 57 | 11 | 6 | 4 | 7 | 10 | 4 | 5 | 8 | 2 |
| 15 years to 20 years | 21,549 | 105 | 92 | 9 | 4 | 63 | 11 | 2 | 10 | 4 | 15 | ... | 7 | 12 | 2 |
| 20 years to 25 years | 19,287 | 105 | 94 | 5 | 6 | 64 | 6 | 2 | 27 | 2 | 11 | ... | 2 | 7 | 7 |
| 25 years to 30 years | 16,670 | 118 | 111 | 5 | 2 | 55 | 2 | 1 | 34 | 2 | 7 | ... | 1 | 5 | 3 |
| 30 years to 35 years | 14,393 | 103 | 97 | 3 | 3 | 75 | 2 | 4 | 51 | 2 | 8 | 1 | ... | 5 | 2 |
| 35 years to 40 years | 13,244 | 110 | 101 | 6 | 3 | 100 | 1 | 3 | 76 | 1 | 3 | 2 | 1 | 9 | 4 |
| 40 years to 45 years | 11,001 | 106 | 90 | 10 | 6 | 90 | 1 | 1 | 67 | ... | 7 | 2 | ... | 8 | 4 |
| 45 years to 50 years | 7,369 | 83 | 71 | 5 | 7 | 68 | 1 | 1 | 46 | ... | 3 | 4 | 1 | 5 | 7 |
| 50 years to 55 years | 5,010 | 69 | 52 | 10 | 7 | 50 | ... | 5 | 24 | ... | 2 | 5 | 2 | 4 | 8 |
| 55 years to 60 years | 2,965 | 62 | 53 | 8 | 1 | 52 | 2 | 5 | 23 | ... | 4 | 4 | 2 | 10 | 2 |
| 60 years to 65 years | 2,530 | 63 | 57 | 2 | 4 | 35 | ... | 1 | 13 | ... | 1 | 5 | 1 | 9 | 5 |
| 65 years to 70 years | 1,353 | 33 | 30 | 1 | 2 | 25 | ... | 3 | 4 | ... | 3 | 1 | ... | 9 | 5 |
| 70 years to 75 years | 912 | 41 | 36 | 3 | 2 | 19 | 2 | 5 | 3 | ... | ... | 3 | ... | 4 | 2 |
| 75 years to 80 years | 411 | 20 | 19 | ... | 1 | 14 | ... | 7 | ... | ... | ... | 1 | ... | 6 | ... |
| 80 and upwards | 262 | 36 | 24 | 2 | ... | 20 | ... | 8 | ... | ... | ... | 1 | 2 | 7 | 2 |
| Unspecified | 362 | 2 | 2 | ... | ... | 3 | ... | ... | ... | 1 | ... | 1 | ... | ... | 1 |
| All ages | ... | ... | ... | ... | 46.31 | 2.33 | 2.82 | 22.86 | 1.18 | 3.96 | 2.12 | 2.69 | 5.55 | 2.80 | |
| 15 years and upwards | 112.01 | 82.70 | 8.86 | 20.45 | ... | ... | ... | ... | ... | ... | ... | ... | ... | ... | |
| Under 5 years | ... | ... | ... | ... | 2.67 | .61 | .73 | ... | .24 | .61 | ... | .12 | .36 | ... | |
| 5 years to 10 years | ... | ... | ... | ... | 12.07 | 4.27 | .29 | .74 | .44 | 1.77 | 1.03 | 2.21 | .59 | .73 | |
| 10 years to 15 years | ... | ... | ... | ... | 22.04 | 3.64 | 1.91 | .74 | 2.43 | 4.69 | 1.22 | 2.6o | 3.12 | .69 | |
| 15 years to 20 years | 51.16 | 40.37 | 3.99 | 6.80 | 32.86 | 399 | .94 | 5.63 | 2.58 | 8.22 | .70 | 5.87 | 4.23 | .70 | |
| 20 years to 25 years | 07.21 | 51.98 | 3.38 | 11.85 | 35.30 | 2.42 | 1.21 | 15.23 | 2.42 | 5.08 | ... | 2.17 | 3.14 | 3.63 | |
| 25 years to 30 years | 81.31 | 60.12 | 2.22 | 18.97 | 37.45 | 2.22 | .74 | 24.15 | 1.23 | 3.69 | .25 | 1.72 | 1.97 | 1.48 | |
| 30 years to 35 years | 80.94 | 60.41 | 3.47 | 17.06 | 60.12 | 1.73 | 2.60 | 41.34 | 1.73 | 4.62 | 1.45 | .87 | 3.76 | 2.02 | |
| 35 years to 40 years | 100.71 | 72.70 | 7.75 | 20.26 | 79.85 | 1.19 | 2.38 | 58.40 | .30 | 3.58 | 3.28 | 1.49 | 5.36 | 3.87 | |
| 40 years to 45 years | 110.93 | 78.78 | 7.71 | 24.44 | 87.78 | .64 | 2.89 | 63.99 | .32 | 3.22 | 2.57 | 3.22 | 5.79 | 5.14 | |
| 40 years to 45 years | 146.67 | 104.03 | 11.71 | 30.93 | 106.37 | .94 | 4.22 | 70.75 | ... | 3.28 | 6.09 | 4.22 | 9.37 | 7.50 | |
| 45 years to 50 years | 188.14 | 122.91 | 24.03 | 41.20 | 112.61 | ... | 4.12 | 70.04 | .69 | 5.49 | 6.87 | 4.12 | 11.67 | 9.61 | |
| 50 years to 55 years | 260.87 | 190.54 | 34.53 | 35.80 | 173.91 | 2.56 | 15.34 | 76.72 | 2.56 | 12.79 | 12.79 | 11.51 | 29.45 | 10.23 | |
| 60 years to 65 years | 332.86 | 246.10 | 37.86 | 48.90 | 148.29 | 4.73 | 14.20 | 50.48 | ... | 6.31 | 18.93 | 4.73 | 31.55 | 17.36 | |
| 65 years to 70 years | 411.51 | 303.22 | 49.50 | 58.79 | 244.43 | 3.10 | 30.94 | 61.88 | 3.09 | 15.47 | 21.66 | 15.47 | 77.35 | 15.47 | |
| 70 years to 75 years | 555.82 | 455.20 | 43.12 | 57.50 | 11.45 | 9.58 | 71.87 | 52.71 | ... | 9.58 | 23.96 | 14.38 | 95.83 | 33.54 | |
| 75 years to 80 years | 554.43 | 463.71 | 70.56 | 20.16 | 72.98 | ... | 80.65 | 20.16 | ... | 30.24 | 20.l6 | 30.24 | 161.29 | 30.24 | |
| 80 and upwards | 924.66 | 839.04 | 85.62 | ... | 702.05 | ... | 205.48 | 34.25 | ... | 17.12 | 34.24 | 51.37 | 308.22 | 51.37 | |
| Unspecified | 82.58 | 75.07 | ... | 7.51 | 60.06 | 7.51 | ... | 15.01 | 7.51 | 7.51 | 7.51 | 7.51 | ... | 7.50 | |
| Males. | |||||||||||||||
| All ages | ... | ... | ... | ... | 53.15 | 2.23 | 2.93 | 27.30 | 1.34 | 4.15 | 2.48 | 3.75 | 6.08 | 2.89 | |
| 15 years and upwards | 128.29 | 85.20 | 10.99 | 32.10 | ... | ... | ... | ... | ... | ... | ... | ... | ... | ... | |
| Under 5 years | ... | ... | ... | ... | 2.88 | .72 | .48 | ... | ... | .72 | ... | .24 | .72 | ... | |
| 5 years to 10 years | ... | ... | ... | ... | 13.41 | 4.66 | .29 | .88 | .58 | 1.75 | .17 | 2.33 | 1.17 | .58 | |
| 10 years to 15 years | ... | ... | ... | ... | 24.24 | 3.46 | 1.73 | 2.08 | 2.43 | 5.89 | 1.04 | 3.46 | 3.46 | .69 | |
| 15 years to 20 years | 53.66 | 37.99 | 3.80 | 11.87 | 36.56 | 2.85 | .95 | 6.65 | 3.32 | 9.50 | 1.42 | 8.55 | 2.85 | .47 | |
| 20 years to 25 years | 78.36 | 54.80 | 4.08 | 19.48 | 37.14 | 1.81 | 1.36 | 16.31 | 3.62 | 4.53 | ... | 3.17 | 2.72 | 3.62 | |
| 25 years to 35 years | 81.80 | 51.32 | 1.54 | 28.94 | 40.56 | 2.93 | .84 | 26.76 | 1.25 | 3.35 | .42 | 2.51 | 1.25 | 1.25 | |
| 30 years to 35 years | 87.62 | 55.44 | 4.46 | 27.72 | 65.84 | 1.98 | 2.48 | 45.54 | 1.98 | 3.96 | 1.98 | 1.48 | 3.96 | 2.48 | |
| 35 years to 40 years | 112.22 | 70.38 | 9.85 | 31.99 | 82.69 | 1.48 | 2.46 | 59.06 | ... | 4.43 | 4.43 | 1.97 | 4.43 | 4.43 | |
| 40 years to 45 years | 118.91 | 77.12 | 6.96 | 34.83 | 91.05 | .50 | 3.98 | 65.67 | .50 | 1.49 | 2.98 | 4.98 | 4.98 | 5.97 | |
| 45 years to 50 years | 164.61 | 108.07 | 14.31 | 42.23 | 113.80 | .71 | 5.73 | 75.15 | ... | 2.86 | 6.44 | 5.73 | 10.74 | 6.44 | |
| 50 years to 55 years | 214.59 | 132.94 | 26.17 | 55.48 | 119.33 | ... | 1.05 | 81.65 | 1.04 | 6.28 | 5.23 | 4.19 | 13.61 | 6.28 | |
| 55 years to 60 years | 292.48 | 197.73 | 39.14 | 55.61 | 173.02 | ... | 14.42 | 76.21 | 4.12 | 12.36 | 12.36 | 14.42 | 26.77 | 12.36 | |
| 60 years to 65 years | 388.55 | 259.91 | 57.76 | 70.88 | 154.90 | 7.88 | 21.00 | 49.88 | ... | 7.88 | 18.38 | 5.25 | 28.88 | 15.75 | |
| 65 years to 70 years | 532.20 | 361.90 | 79.83 | 90.47 | 287.39 | 5.32 | 37.26 | 85.15 | 5.32 | 10.65 | 31.93 | 26.61 | 85.15 | ... | |
| 70 years to 75 years | 638.30 | 502.13 | 51.06 | 85.11 | 391.49 | ... | 85.11 | 68.09 | ... | 17.02 | 17.02 | 25.53 | 136.17 | 42.55 | |
| 75 years to 80 years | 602.41 | 464.72 | 120.48 | 17.21 | 395.87 | ... | 17.21 | 34.42 | ... | 51.64 | 17.21 | 51.64 | 172.12 | 51.63 | |
| 80 and upwards | 869.57 | 776.40 | 93.17 | ... | 652.17 | ... | 124.22 | 62.11 | ... | 31.06 | 31.06 | 31.06 | 341.61 | 31.05 | |
| Unspecified | 92.78 | 82.47 | ... | 10.31 | 51.54 | 10.31 | ... | 20.61 | ... | 10.31 | ... | 10.31 | ... | ... | |
| Females. | |||||||||||||||
| All ages | ... | ... | ... | ... | 37.94 | 2.45 | 2.68 | 17.43 | 1.00 | 3.72 | 1.68 | 1.40 | 4.90 | 2.68 | |
| 15 years and upwards | 89.16 | 79.19 | 5.88 | 4.09 | ... | ... | ... | ... | ... | ... | ... | ... | ... | ... | |
| Under 5 years | ... | ... | ... | ... | 2.46 | .49 | .99 | ... | .49 | .49 | ... | ... | ... | ... | |
| 5 years to 10 years | ... | ... | ... | ... | 10.71 | 3.87 | .30 | .59 | .30 | 1.79 | .89 | 2.08 | ... | .89 | |
| 10 years to 15 years | ... | ... | ... | ... | 19.83 | 3.83 | 2.09 | 1.39 | 2.43 | 3.48 | 1.39 | 1.74 | 2.78 | .70 | |
| 15 years to 20 years | 48.73 | 42.69 | 4.18 | 1.86 | 29.24 | 5.10 | .93 | 4.64 | 1.86 | 6.96 | ... | 3.25 | 5.57 | .93 | |
| 20 years to 25 years | 54.44 | 48.74 | 2.59 | 3.11 | 33.19 | 3.11 | 1.04 | 14.00 | 1.04 | 5.70 | ... | 1.04 | 3.63 | 3.63 | |
| 25 years to 30 years | 70.79 | 66.59 | 3.00 | 1.20 | 33.00 | 1.20 | .60 | 20.40 | 1.20 | 4.20 | ... | .60 | 3.00 | 1.80 | |
| 30 years to 35 years | 71.56 | 67.40 | 2.08 | 2.08 | 52.11 | 1.39 | 2.78 | 35.43 | 1.39 | 5.56 | .70 | ... | 3.48 | 1.39 | |
| 35 years to 40 years | 83.06 | 76.26 | 4.53 | 2.27 | 75.51 | .76 | 2.27 | 57.38 | .75 | 2.26 | 1.51 | .76 | 6.80 | 3.02 | |
| 40 years to 45 years | 96.35 | 81.81 | 9.09 | 5.45 | 81.81 | .91 | .91 | 60.90 | ... | 6.36 | 1.82 | ... | 7.27 | 3.64 | |
| 45 years to 50 years | 112.63 | 96.35 | 6.79 | 9.50 | 92.28 | 1.36 | 1.36 | 62.42 | ... | 4.07 | 5.43 | 1.36 | 6.78 | 9.50 | |
| 50 years to 55 years | 137.72 | 103.79 | 19.96 | 13.97 | 99.80 | ... | 9.98 | 47.91 | ... | 3.99 | 9.98 | 3.99 | 7.98 | 15.97 | |
| 55 years to 60 years | 209.10 | 178.75 | 26.98 | 3.37 | 175.38 | 6.75 | 16.86 | 77.57 | ... | 13.49 | 13.49 | 6.75 | 33.72 | 6.75 | |
| 60 years to 65 years | 249.01 | 225.30 | 7.91 | 15.81 | 138.34 | ... | 3.95 | 51.39 | ... | 3.95 | 19.76 | 3.95 | 35.58 | 19.76 | |
| 65 years to 70 years | 243.90 | 221.73 | 7.39 | 14.78 | 184.77 | ... | 22.17 | 29.56 | ... | 22.17 | 7.39 | ... | 66.52 | 36.96 | |
| 70 years to 75 years | 449.56 | 394.74 | 32.89 | 21.93 | 205.33 | 21.93 | 54.82 | 32.89 | ... | ... | 32.90 | ... | 43.86 | 21.93 | |
| 75 years to 80 years | 486.62 | 462.29 | ... | 24.33 | 340.63 | ... | 170.32 | ... | ... | ... | 24.33 | ... | 145.98 | ... | |
| 80 and upwards | 992.37 | 916.03 | 76.34 | ... | 763.36 | ... | 305.34 | ... | ... | 38.17 | 16.34 | 267.17 | 76.34 | ||
| Unspecified | 55.22 | 55.22 | ... | ... | 82.87 | ... | ... | 27.63 | ... | 27.62 | ... | ... | 27.62 | ||
Table II. Showing the Occupations of Persons, Males, and Females (exclusive of Maoris) of 15 Years of Age and upwards, returned as Sick or Suffering from Accident; and the Occupations, past or present, of the Deaf and Dumb, Blind, Lunatics, Idiots, Epileptics, Paralyzed, Crippled or Deformed, Suffering from Debility or Deafness, of all Ages, on the 3rd April, 1881.
| The sickness of those under 15 years has not been brought out, the instruction to householders on the Census schedule being that, if “unable to follow usual occupation by reason of illness or accident,” the word “Sick” or “Accident” was to be entered. | ||||||||||||||||||||||||||||||||||||
|---|---|---|---|---|---|---|---|---|---|---|---|---|---|---|---|---|---|---|---|---|---|---|---|---|---|---|---|---|---|---|---|---|---|---|---|---|
| Occupations. | 15 Years and upwards. | All Ages. | ||||||||||||||||||||||||||||||||||
| Sick. | Specified Complaints. | Suffering from Accident. | Deaf and Dumb. | Blind. | Lunatics. | Idiots. | Epileptic. | Paralysis. | Crippled and Deformed. | Debility and Infirmity. | Deaf only. | |||||||||||||||||||||||||
| Persons. | Males. | Females. | Persons. | Males. | Females. | Persons. | Males. | Females. | Persons. | Males. | Females. | Persons. | Males. | Females. | Persons. | Males. | Females. | Persons. | Males. | Females. | Persons. | Males. | Females. | Persons. | Males. | Females. | Persons. | Males. | Females. | Persons. | Males. | Females. | Persons. | Males. | Females. | |
| Total | 2,333 | 1,404 | 929 | 250 | 181 | 69 | 577 | 529 | 48 | 114 | 60 | 54 | 138 | 79 | 59 | 1,120 | 736 | 384 | 58 | 36 | 22 | 194 | 112 | 82 | 104 | 67 | 37 | 132 | 101 | 31 | 272 | 164 | 108 | 137 | 78 | 59 |
| CLASS I.—PROFESSIONAL. | ||||||||||||||||||||||||||||||||||||
| Order I.—Persons engaged in the General or Local Governments, or the Defence or Protection of the Country. | ||||||||||||||||||||||||||||||||||||
| Sub-Order 1. Officers of General Government— | ||||||||||||||||||||||||||||||||||||
| Government Officer (other than professional or subordinate) | 3 | 3 | ... | ... | ... | ... | 2 | 2 | ... | ... | ... | ... | ... | ... | ... | ... | ... | ... | ... | ... | ... | 1 | 1 | ... | 1 | 1 | ... | ... | ... | ... | ... | ... | ... | ... | ... | ... |
| Architect, Surveyor, Draughtsman | 1 | 1 | ... | ... | ... | ... | ... | ... | ... | 1 | 1 | ... | ... | ... | ... | ... | ... | ... | ... | ... | ... | ... | ... | ... | ... | ... | ... | ... | ... | ... | ... | ... | ... | ... | ... | ... |
| Subordinate Officer | 3 | 3 | ... | ... | ... | ... | ... | ... | ... | ... | ... | ... | ... | ... | ... | ... | ... | ... | ... | ... | ... | ... | ... | ... | ... | ... | ... | 1 | 1 | ... | ... | ... | ... | ... | ... | ... |
| Police | 8 | 8 | ... | ... | ... | ... | 1 | 1 | ... | ... | ... | ... | ... | ... | ... | 1 | 1 | ... | ... | ... | ... | ... | ... | ... | ... | ... | ... | ... | ... | ... | ... | ... | ... | ... | ... | ... |
| Penal | 1 | 1 | ... | ... | ... | ... | ... | ... | ... | ... | ... | ... | ... | ... | ... | ... | ... | ... | ... | ... | ... | 1 | 1 | ... | ... | ... | ... | ... | ... | ... | ... | ... | ... | ... | ... | ... |
| Sub-Order 2. Officers of Local Governments— | ||||||||||||||||||||||||||||||||||||
| Member of Local Council | ... | ... | ... | 1 | 1 | ... | ... | ... | ... | ... | ... | ... | ... | ... | ... | ... | ... | ... | ... | ... | ... | ... | ... | ... | ... | ... | ... | ... | ... | ... | 1 | 1 | ... | ... | ... | ... |
| Officer of Local Body | ... | ... | ... | ... | ... | ... | 1 | 1 | ... | ... | ... | ... | ... | ... | ... | ... | ... | ... | ... | ... | ... | ... | ... | ... | 1 | 1 | ... | ... | ... | ... | 1 | 1 | ... | ... | ... | ... |
| Sub-Order 3. Defence- | ||||||||||||||||||||||||||||||||||||
| Soldier | ... | ... | ... | ... | ... | ... | ... | ... | ... | ... | ... | ... | 4 | 4 | ... | 5 | 5 | ... | ... | ... | ... | ... | ... | ... | ... | ... | ... | 1 | 1 | ... | ... | ... | ... | 1 | 1 | ... |
| Armed Constabulary or Militia Private | ... | ... | ... | ... | ... | ... | 1 | 1 | ... | ... | ... | ... | ... | ... | ... | 4 | 4 | ... | ... | ... | ... | ... | ... | ... | ... | ... | ... | ... | ... | ... | ... | ... | ... | ... | ... | ... |
| Order II.—Persons engaged in the Learned Professions, or in Literature, Art, and Science (with their immediate Subordinates). | ||||||||||||||||||||||||||||||||||||
| Sub-Order X. Clergymen, Ministers, and Church Officers— | ||||||||||||||||||||||||||||||||||||
| Clergyman | 7 | 7 | ... | ... | ... | ... | ... | ... | ... | ... | ... | ... | 1 | 1 | ... | ... | ... | ... | ... | ... | ... | ... | ... | ... | 1 | 1 | ... | ... | ... | ... | 2 | 2 | ... | ... | ... | ... |
| Church Officer | ... | ... | ... | ... | ... | ... | 1 | 1 | ... | ... | ... | ... | ... | ... | ... | ... | ... | ... | ... | ... | ... | ... | ... | ... | ... | ... | ... | ... | ... | ... | ... | ... | ... | ... | ... | ... |
| Nun | 1 | ... | 1 | ... | ... | ... | ... | ... | ... | ... | ... | ... | ... | ... | ... | ... | ... | ... | ... | ... | ... | ... | ... | ... | ... | ... | ... | ... | ... | ... | ... | ... | ... | ... | ... | ... |
| Sub-Order 2. Law-court Officers, Lawyers, &c.— | ||||||||||||||||||||||||||||||||||||
| Lawyer | 2 | 2 | ... | ... | ... | ... | ... | ... | ... | ... | ... | ... | ... | ... | ... | 2 | 2 | ... | ... | ... | ... | ... | ... | ... | ... | ... | ... | ... | ... | ... | 2 | 2 | ... | ... | ... | ... |
| Law Student | 1 | 1 | ... | ... | ... | ... | 1 | 1 | ... | ... | ... | ... | ... | ... | ... | ... | ... | ... | ... | ... | ... | ... | ... | ... | 1 | 1 | ... | ... | ... | ... | ... | ... | ... | ... | ... | ... |
| Law Clerk | 1 | 1 | ... | ... | ... | ... | ... | ... | ... | ... | ... | ... | ... | ... | ... | 1 | 1 | ... | ... | ... | ... | ... | ... | ... | ... | ... | ... | ... | ... | ... | ... | ... | ... | ... | ... | |
| Sub-Order 3. Physicians, Surgeons, Druggists— | ||||||||||||||||||||||||||||||||||||
| Medical Man | 3 | 3 | ... | ... | ... | ... | 2 | 2 | ... | ... | ... | ... | ... | ... | ... | 2 | 2 | ... | ... | ... | ... | ... | ... | ... | ... | ... | ... | ... | ... | ... | 1 | 1 | ... | ... | ... | ... |
| Chemist, Druggist | 1 | 1 | ... | 1 | 1 | ... | 2 | 2 | ... | ... | ... | ... | ... | ... | ... | ... | ... | ... | ... | ... | ... | ... | ... | ... | ... | ... | ... | ... | ... | ... | ... | ... | ... | ... | ... | ... |
| Sub-Order 4. Authors, Literary Persons, &c.— | ||||||||||||||||||||||||||||||||||||
| Others—Interpreter | 1 | 1 | ... | 1 | 1 | ... | 1 | 1 | ... | ... | ... | ... | ... | ... | ... | ... | ... | ... | ... | ... | ... | ... | ... | ... | ... | ... | ... | ... | ... | ... | ... | ... | ... | ... | ... | ... |
Table II. Showing the Occupations of Persons, Males, and Females (exclusive of Maoris), of 15 Years of Age and upwards, returned as Sick or Suffering from Accident; and the Occupations, past or present, of the Deaf and Dumb, Blind, Lunatics, Idiots, Epileptics, Paralyzed, Crippled or Deformed, Suffering from Debility or Deafness, of All Ages, on the 3rd April, 1881—continued.
| Occupations. | 15 Years and upwards. | All Ages. | ||||||||||||||||||||||||||||||||||
|---|---|---|---|---|---|---|---|---|---|---|---|---|---|---|---|---|---|---|---|---|---|---|---|---|---|---|---|---|---|---|---|---|---|---|---|---|
| Sick. | Specified Complaints. | Suffering from Accident. | Deaf and Dumb. | Blind. | Lunatics. | Idiots. | Epileptic. | Paralysis. | Crippled and Deformed. | Debility and Infirmity. | Deaf only. | |||||||||||||||||||||||||
| Persons. | Males. | Females. | Persons. | Males. | Females. | Persons. | Males. | Females. | Persons. | Males. | Females. | Persons. | Males. | Females. | Persons. | Males. | Females. | Persons. | Males. | Females. | Persons. | Males. | Females. | Persons. | Males. | Females. | Persons. | Males. | Females. | Persons. | Males. | Females. | Persons. | Males. | Females. | |
| CLASS I.—PROFESSIONAL—continued. | ||||||||||||||||||||||||||||||||||||
| Order II.—Persons engaged in the Learned Professions, cfc.—continued. | ||||||||||||||||||||||||||||||||||||
| Sub-Order 5. Scientific Persons— | ||||||||||||||||||||||||||||||||||||
| Civil Engineer (not Government) | 3 | 3 | ... | 1 | 1 | ... | ... | ... | ... | ... | ... | ... | ... | ... | ... | ... | ... | ... | ... | ... | ... | ... | ... | ... | ... | ... | ... | ... | ... | ... | ... | ... | ... | ... | ... | ... |
| Sub-Order 6. Teachers, &c.— | ||||||||||||||||||||||||||||||||||||
| School Master, Mistress | 17 | 11 | 6 | 1 | 1 | ... | 2 | 1 | 1 | ... | ... | ... | ... | ... | ... | 3 | 3 | ... | ... | ... | ... | 1 | 1 | ... | 1 | 1 | ... | ... | ... | ... | 2 | 2 | ... | ... | ... | ... |
| Tutor, Governess | 1 | ... | 1 | ... | ... | ... | ... | ... | ... | ... | ... | ... | ... | 3 | ... | 3 | ... | ... | ... | ... | ... | ... | ... | ... | ... | ... | ... | ... | ... | ... | ... | ... | ... | ... | ||
| Others—Teacher of Accomplishments | 1 | 1 | ... | ... | ... | ... | ... | ... | ... | ... | ... | ... | ... | ... | ... | ... | ... | ... | ... | ... | ... | ... | ... | ... | ... | ... | ... | ... | ... | ... | ... | ... | ... | ... | ... | ... |
| Sub-Order 7. Fine Arts— | ||||||||||||||||||||||||||||||||||||
| Artist, Painter | ... | ... | ... | ... | ... | ... | 1 | 1 | ... | ... | ... | ... | ... | ... | ... | ... | ... | ... | ... | ... | ... | ... | ... | ... | ... | ... | ... | ... | ... | ... | ... | ... | ... | 1 | 1 | ... |
| Photographer | ... | ... | ... | ... | ... | ... | 2 | 2 | ... | ... | ... | ... | ... | ... | ... | 1 | 1 | ... | ... | ... | ... | ... | ... | ... | ... | ... | ... | ... | ... | ... | ... | ... | ... | 2 | 2 | ... |
| Sub-Order 8. Musicians, Music Teachers— | ||||||||||||||||||||||||||||||||||||
| Music Master, Mistress | 1 | 1 | ... | ... | ... | ... | ... | ... | ... | ... | ... | ... | 1 | 1 | ... | 1 | 1 | ... | ... | ... | ... | ... | ... | ... | ... | ... | ... | ... | ... | ... | 1 | 1 | ... | 1 | ... | 1 |
| Musician, Vocalist | ... | ... | ... | ... | ... | ... | ... | ... | ... | ... | ... | ... | ... | ... | ... | ... | ... | ... | ... | ... | ... | 1 | 1 | ... | ... | ... | ... | ... | ... | ... | ... | ... | ... | ... | ... | ... |
| Sub-Order 9. Actors, &c.— | ||||||||||||||||||||||||||||||||||||
| Actor, Actress | ... | ... | ... | ... | ... | ... | ... | ... | ... | ... | ... | ... | ... | ... | ... | ... | ... | ... | ... | ... | ... | ... | ... | ... | 1 | 1 | ... | ... | ... | ... | ... | ... | ... | ... | ... | ... |
| Others—Billiard Marker | ... | ... | ... | 1 | 1 | ... | 1 | 1 | ... | 1 | 1 | ... | ... | ... | ... | ... | ... | ... | ... | ... | ... | ... | ... | ... | ... | ... | ... | ... | ... | ... | ... | ... | ... | ... | ... | ... |
| CLASS II.—DOMESTIC. | ||||||||||||||||||||||||||||||||||||
| Order III.—Persons engaged in the Domestic Offices or Duties of Wives, Mothers, Mistresses of Families, Children, Relatives, Visitors (not otherwise described). | ||||||||||||||||||||||||||||||||||||
| Sub-Order 1. Wives and Widows— | ||||||||||||||||||||||||||||||||||||
| Wife, Widow | 645 | ... | 645 | 49 | ... | 49 | 27 | ... | 27 | 4 | ... | 4 | 27 | ... | 27 | 125 | ... | 125 | 1 | ... | 1 | 26 | ... | 26 | 25 | ... | 25 | 10 | ... | 10 | 60 | ... | 60 | 36 | ... | 36 |
| Sub-Order 2. Sons, Daughters,Relatives, Visitors: | ||||||||||||||||||||||||||||||||||||
| Son, Daughter, Relative, Visitor (not otherwise described) | 195 | 45 | 150 | 13 | 4 | 9 | 23 | 10 | 13 | 55 | 15 | 40 | 38 | 12 | 56 | 16 | 2 | 14 | 30 | 13 | 17 | 89 | 40 | 49 | 17 | 8 | 9 | 31 | 14 | 17 | 54 | 22 | 32 | 13 | 4 | 9 |
| Sub-Order 3. Students and Scholars— | ||||||||||||||||||||||||||||||||||||
| Scholar at Home | ... | ... | ... | 1 | ... | 1 | ... | ... | ... | 8 | ... | 8 | 1 | ... | 1 | ... | ... | ... | 1 | ... | 1 | ... | ... | ... | 3 | 1 | 2 | 1 | 1 | ... | 1 | 1 | ... | ... | ... | ... |
| Scholar at Public School | 6 | 3 | 3 | ... | ... | ... | 2 | 2 | ... | 12 | 12 | ... | ... | ... | ... | ... | ... | ... | 3 | 1 | 2 | 10 | 7 | 3 | 3 | 3 | ... | 18 | 16 | 2 | 6 | 4 | 2 | 5 | 2 | 3 |
| Scholar at Private School | ... | ... | ... | ... | ... | ... | 1 | 1 | ... | 1 | 1 | ... | 2 | 1 | 1 | ... | ... | ... | 1 | 1 | ... | 1 | ... | 1 | 1 | ... | 1 | 1 | ... | 1 | 2 | 2 | ... | ... | ... | ... |
| Order IV.—Persons engaged in Entertaining and Performing Personal Offices for Man. | ||||||||||||||||||||||||||||||||||||
| Sub-Order I. In Board and Lodging— | ||||||||||||||||||||||||||||||||||||
| Hotel-keeper | 10 | 9 | 1 | 1 | 1 | ... | 4 | 4 | ... | ... | ... | ... | ... | ... | ... | 5 | 4 | 1 | ... | ... | ... | ... | ... | ... | 1 | 1 | ... | ... | ... | ... | ... | ... | ... | ... | ... | ... |
| Occupations. | 15 Years and upwards. | All Ages. | ||||||||||||||||||||||||||||||||||
|---|---|---|---|---|---|---|---|---|---|---|---|---|---|---|---|---|---|---|---|---|---|---|---|---|---|---|---|---|---|---|---|---|---|---|---|---|
| Sick. | Specified Complaints. | Suffering from Accident. | Deaf and Dumb. | Blind. | Lunatics. | Idiots. | Epileptic. | Paralysis. | Crippled and Deformed. | Debility and Infirmity. | Deaf only. | |||||||||||||||||||||||||
| Persons. | Males. | Females. | Persons. | Males. | Females. | Persons. | Males. | Females. | Persons. | Males. | Females. | Persons. | Males. | Females. | Persons. | Males. | Females. | Persons. | Males. | Females. | Persons. | Males. | Females. | Persons. | Males. | Females. | Persons. | Males. | Females. | Persons. | Males. | Females. | Persons. | Males. | Females. | |
| Hotel-keeper's Wife | 1 | ... | 1 | ... | ... | ... | ... | ... | ... | ... | ... | ... | ... | ... | ... | 1 | ... | 1 | ... | ... | ... | ... | ... | ... | ... | ... | ... | ... | ... | ... | ... | ... | ... | ... | ... | ... |
| Boarding, Lodging, House Keeper | 5 | 5 | ... | ... | ... | ... | 1 | 1 | ... | ... | ... | ... | ... | ... | ... | ... | ... | ... | ... | ... | ... | ... | ... | ... | ... | ... | ... | ... | ... | ... | ... | ... | ... | ... | ... | ... |
| Cook (not Domestic Servant) | 16 | 15 | 1 | 1 | 1 | ... | ... | ... | ... | ... | ... | ... | ... | ... | ... | 4 | 1 | 3 | ... | ... | ... | ... | ... | ... | ... | ... | ... | ... | ... | ... | ... | ... | ... | ... | ... | ... |
| Sub-Order 2. In Attendance— | ||||||||||||||||||||||||||||||||||||
| Domestic Servant | 47 | ... | 47 | 6 | 2 | 4 | 1 | ... | 1 | ... | ... | ... | ... | ... | ... | 95 | ... | 95 | ... | ... | ... | 1 | ... | 1 | 1 | 1 | ... | ... | ... | ... | 5 | 1 | 4 | 3 | ... | 3 |
| Housekeeper | 2 | ... | 2 | 1 | ... | 1 | ... | ... | ... | ... | ... | ... | ... | ... | ... | 1 | ... | 1 | ... | ... | ... | ... | ... | ... | ... | ... | ... | ... | ... | ... | ... | ... | ... | ... | ... | ... |
| Inn, Club-house, Eating-house, Servant | 6 | 3 | 3 | 1 | 1 | ... | 3 | 2 | 1 | ... | ... | ... | ... | ... | ... | 2 | 2 | ... | ... | ... | ... | 1 | 1 | ... | ... | ... | ... | ... | ... | ... | ... | ... | ... | ... | ... | ... |
| Charitable Institution Servant | 4 | 3 | 1 | ... | ... | ... | 1 | 1 | ... | ... | ... | ... | 1 | 1 | ... | ... | ... | ... | ... | ... | ... | ... | ... | ... | ... | ... | ... | ... | ... | ... | ... | ... | ... | ... | ... | ... |
| Nurse (not Domestic Servant, or Servant of Charitable Institution) | 4 | ... | 4 | ... | ... | ... | ... | ... | ... | ... | ... | ... | ... | ... | ... | 2 | ... | 2 | ... | ... | ... | ... | ... | ... | ... | ... | ... | ... | ... | ... | ... | ... | ... | 1 | ... | 1 |
| Others, Caretaker, Watchman | ... | ... | ... | ... | ... | ... | 6 | 6 | ... | ... | ... | ... | ... | ... | ... | ... | ... | ... | ... | ... | ... | ... | ... | ... | ... | ... | ... | 1 | 1 | ... | ... | ... | ... | ... | ... | ... |
| CLASS III.—COMMERCIAL. | ||||||||||||||||||||||||||||||||||||
| Order V.—Persons who Buy or Sell, Keep or Lend Money, Houses, or Goods of various Kinds. | ||||||||||||||||||||||||||||||||||||
| Sub-Order 1. Mercantile Persons— | ||||||||||||||||||||||||||||||||||||
| Capitalist | ... | ... | ... | ... | ... | ... | 1 | 1 | ... | ... | ... | ... | 2 | 2 | ... | ... | ... | ... | ... | ... | ... | ... | ... | ... | ... | ... | ... | ... | ... | ... | 2 | 2 | ... | ... | ... | ... |
| Merchant | 2 | 2 | ... | ... | ... | ... | ... | ... | ... | ... | ... | ... | ... | ... | ... | ... | ... | ... | ... | ... | ... | 1 | 1 | ... | ... | ... | ... | ... | ... | ... | ... | ... | ... | ... | ... | ... |
| Auctioneer, Appraiser, Valuer | 2 | 2 | ... | ... | ... | ... | ... | ... | ... | ... | ... | ... | ... | ... | ... | ... | ... | ... | ... | ... | ... | ... | ... | ... | ... | ... | ... | ... | ... | ... | ... | ... | ... | ... | ... | ... |
| Commission Agent, Factor | 2 | 2 | ... | ... | ... | ... | ... | ... | ... | ... | ... | ... | ... | ... | ... | ... | ... | ... | ... | ... | ... | 1 | 1 | ... | ... | ... | ... | ... | ... | ... | ... | ... | ... | 1 | 1 | ... |
| Bank Officer, Clerk | 3 | 3 | ... | ... | ... | ... | ... | ... | ... | ... | ... | ... | ... | ... | ... | 4 | 4 | ... | ... | ... | ... | 1 | 1 | ... | ... | ... | ... | ... | ... | ... | ... | ... | ... | ... | ... | ... |
| Share, Stock, Broker | 1 | 1 | ... | ... | ... | ... | ... | ... | ... | ... | ... | ... | ... | ... | ... | ... | ... | ... | ... | ... | ... | ... | ... | ... | ... | ... | ... | ... | ... | ... | ... | ... | ... | ... | ... | ... |
| Commercial Clerk | 22 | 22 | ... | 1 | 1 | ... | 12 | 12 | ... | ... | ... | ... | ... | ... | ... | 12 | 12 | ... | ... | ... | ... | ... | ... | ... | 2 | 2 | ... | 4 | 4 | ... | 1 | 1 | ... | ... | ... | ... |
| Commercial Traveller, Salesman. | 3 | 3 | ... | ... | ... | ... | ... | ... | ... | ... | ... | ... | ... | ... | ... | 1 | 1 | ... | ... | ... | ... | ... | ... | ... | ... | ... | ... | ... | ... | ... | ... | ... | ... | ... | ... | ... |
| Sub-Order 2. Other General Dealers— | ||||||||||||||||||||||||||||||||||||
| Shopkeeper (branch unspecified) | 15 | 15 | ... | 2 | 2 | ... | 7 | 7 | ... | ... | ... | ... | ... | ... | ... | 2 | 2 | ... | ... | ... | ... | 1 | 1 | ... | ... | ... | ... | 1 | 1 | ... | 3 | 3 | ... | 2 | 2 | ... |
| Hawker, Pedlar | 5 | 4 | 1 | ... | ... | ... | ... | ... | ... | ... | ... | ... | 1 | 1 | ... | 1 | 1 | ... | ... | ... | ... | ... | ... | ... | 2 | 2 | ... | ... | ... | ... | ... | ... | ... | ... | ... | ... |
| Other General Dealers, Dealer, Trader, &c. | 3 | 3 | ... | 1 | 1 | ... | ... | ... | ... | ... | ... | ... | ... | ... | ... | ... | ... | ... | ... | ... | ... | ... | ... | ... | ... | ... | ... | ... | ... | ... | ... | ... | ... | ... | ... | ... |
| Order VI.—Persons engaged in the Conveyance of Men, Animals, Goods', and Messages. | ||||||||||||||||||||||||||||||||||||
| Sub-Order 1. Carriers on Railways— | ||||||||||||||||||||||||||||||||||||
| Railway Officer, Clerk, Stationmaster | 1 | 1 | ... | ... | ... | ... | 1 | 1 | ... | ... | ... | ... | ... | ... | ... | 1 | 1 | ... | ... | ... | ... | ... | ... | ... | ... | ... | ... | ... | ... | ... | ... | ... | ... | ... | ... | ... |
| Railway Engine-driver | 1 | 1 | ... | ... | ... | ... | ... | ... | ... | ... | ... | ... | ... | ... | ... | ... | ... | ... | ... | ... | ... | ... | ... | ... | ... | ... | ... | ... | ... | ... | ... | ... | ... | ... | ... | ... |
| Railway Servant | 1 | 1 | ... | ... | ... | ... | 7 | 7 | ... | ... | ... | ... | ... | ... | ... | ... | ... | ... | ... | ... | ... | ... | ... | ... | 1 | 1 | ... | ... | ... | ... | ... | ... | ... | ... | ... | ... |
| Sub-Order 2. Carriers on Roads— | ||||||||||||||||||||||||||||||||||||
| Coach, Omnibus, Cab, Express, Owner | ... | ... | ... | 1 | 1 | ... | 2 | 2 | ... | ... | ... | ... | ... | ... | ... | ... | ... | ... | ... | ... | ... | ... | ... | ... | ... | ... | ... | ... | ... | ... | 1 | 1 | ... | ... | ... | ... |
| Coach, Omnibus, Cab, Driver, Conductor | 2 | 2 | ... | ... | ... | ... | 3 | 3 | ... | ... | ... | ... | ... | ... | ... | 1 | 1 | ... | ... | ... | ... | ... | ... | ... | ... | ... | ... | ... | ... | ... | ... | ... | ... | ... | ... | ... |
| Drayman, Carrier, Express Driver, Carter | 9 | 9 | ... | 3 | 3 | ... | 15 | 15 | ... | ... | ... | ... | ... | ... | ... | 3 | 3 | ... | ... | ... | ... | ... | ... | ... | ... | ... | ... | ... | ... | ... | ... | ... | ... | ... | ... | ... |
| Livery Stable Keeper | 1 | 1 | ... | ... | ... | ... | ... | ... | ... | ... | ... | ... | ... | ... | ... | ... | ... | ... | ... | ... | ... | ... | ... | ... | ... | ... | ... | ... | ... | ... | ... | ... | ... | ... | ... | ... |
| Toll Keeper, Contractor | ... | ... | ... | 1 | 1 | ... | 1 | 1 | ... | ... | ... | ... | ... | ... | ... | ... | ... | ... | ... | ... | ... | ... | ... | ... | ... | ... | ... | ... | ... | ... | ... | ... | ... | ... | ... | ... |
| Others, Bridge Keeper | ... | ... | ... | ... | ... | ... | 2 | 2 | ... | ... | ... | ... | ... | ... | ... | ... | ... | ... | ... | ... | ... | ... | ... | ... | ... | ... | ... | ... | ... | ... | ... | ... | ... | ... | ... | ... |
| Sub-Order 3. Carriers on Seas and Rivers— | ||||||||||||||||||||||||||||||||||||
| Lighthouse Keeper | 1 | 1 | ... | ... | ... | ... | ... | ... | ... | ... | ... | ... | ... | ... | ... | ... | ... | ... | ... | ... | ... | ... | ... | ... | ... | ... | ... | ... | ... | ... | ... | ... | ... | ... | ... | ... |
| Ship Master, Officer, Sailor (Merchant Service) | 50 | 50 | ... | ... | ... | ... | 14 | 14 | ... | ... | ... | ... | ... | ... | ... | 39 | 39 | ... | 1 | 1 | ... | 1 | 1 | ... | 1 | 1 | ... | ... | ... | ... | 4 | 4 | ... | 1 | 1 | ... |
| Ship Servant, Steward, Stewardess | 1 | 1 | ... | ... | ... | ... | ... | ... | ... | ... | ... | ... | ... | ... | ... | 1 | 1 | ... | ... | ... | ... | ... | ... | ... | ... | ... | ... | ... | ... | ... | ... | ... | ... | ... | ... | ... |
| Waterman, Boatman, &c. | 2 | 2 | ... | 1 | 1 | ... | 3 | 3 | ... | ... | ... | ... | 1 | 1 | ... | 1 | 1 | ... | ... | ... | ... | ... | ... | ... | ... | ... | ... | ... | ... | ... | ... | ... | ... | ... | ... | ... |
| Others, Ferryman, Signalman, Wharf-labourer | ... | ... | ... | ... | ... | ... | 1 | 1 | ... | ... | ... | ... | ... | ... | ... | ... | ... | ... | ... | ... | ... | ... | ... | ... | 1 | 1 | ... | ... | ... | ... | ... | ... | ... | 1 | 1 | ... |
| Sub-Order 4. Engaged in Storage— | ||||||||||||||||||||||||||||||||||||
| Storekeeper (not Shopkeeper) | ... | ... | ... | ... | ... | ... | ... | ... | ... | ... | ... | ... | 1 | 1 | ... | ... | ... | ... | ... | ... | ... | ... | ... | ... | ... | ... | ... | ... | ... | ... | ... | ... | ... | ... | ... | ... |
| Storeman (not Shopman) | 8 | 8 | ... | 2 | 2 | ... | 3 | 3 | ... | ... | ... | ... | ... | ... | ... | ... | ... | ... | ... | ... | ... | ... | ... | ... | ... | ... | ... | ... | ... | ... | 2 | 2 | ... | ... | ... | ... |
Table II. Showing the Occupations of Persons, Males, and Females (exclusive of Maoris), of 15 Years of Age and upwards, returned as Sick or Suffering from Accident; and the Occupations, past or present, of the Deaf and Dumb, Blind, Lunatics, Idiots, Epileptics, Paralyzed, Crippled or Deformed, Suffering from Debility or Deafness, of all Ages, on the 3rd April, 1881—continued.
| Occupations. | 15 Years and upwards. | All Ages. | ||||||||||||||||||||||||||||||||||
|---|---|---|---|---|---|---|---|---|---|---|---|---|---|---|---|---|---|---|---|---|---|---|---|---|---|---|---|---|---|---|---|---|---|---|---|---|
| Sick. | Specified Complaints. | Suffering from Accident. | Deaf and Dumb. | Blind. | Lunatics. | Idiots. | Epileptic. | Paralysis. | Crippled and Deformed. | Debility and Infirmity. | Deaf only. | |||||||||||||||||||||||||
| Persons. | Males. | Females. | Persons. | Males. | Females. | Persons. | Males. | Females. | Persons. | Males. | Females. | Persons. | Males. | Females. | Persons. | Males. | Females. | Persons. | Males. | Females. | Persons. | Males. | Females. | Persons. | Males. | Females. | Persons. | Males. | Females. | Persons. | Males. | Females. | Persons. | Males. | Females. | |
| CLASS III.—COMMERCIAL—continued, | ||||||||||||||||||||||||||||||||||||
| Order VI.—Persons engaged in the Conveyance ofMen, &c.—continued. | ||||||||||||||||||||||||||||||||||||
| Others, Packer, Servant to Storekeeper | ... | ... | ... | ... | ... | ... | ... | ... | ... | ... | ... | ... | ... | ... | ... | 1 | 1 | ... | ... | ... | ... | ... | ... | ... | ... | ... | ... | ... | ... | ... | ... | ... | ... | ... | ... | ... |
| Sub-Order 5. Messengers and Porters— | ||||||||||||||||||||||||||||||||||||
| Messenger, Porter (not Government or Railway) | 4 | 4 | ... | 1 | 1 | ... | 2 | 2 | ... | ... | ... | ... | ... | ... | ... | 1 | 1 | ... | ... | ... | ... | ... | ... | ... | ... | ... | ... | ... | ... | ... | ... | ... | ... | ... | ... | ... |
| Errand Boy, Girl | 1 | 1 | ... | ... | ... | ... | ... | ... | ... | ... | ... | ... | ... | ... | ... | ... | ... | ... | ... | ... | ... | ... | ... | ... | ... | ... | ... | 1 | 1 | ... | ... | ... | ... | ... | ... | ... |
| Telegraph Service | 6 | 6 | ... | ... | ... | ... | ... | ... | ... | ... | ... | ... | ... | ... | ... | ... | ... | ... | ... | ... | ... | 1 | 1 | ... | ... | ... | ... | ... | ... | ... | ... | ... | ... | ... | ... | ... |
| CLASS IV.—AGRICULTURAL. | ||||||||||||||||||||||||||||||||||||
| Order VII.—Persons Possessing, Working, or Cultivating Land, Raising or Dealing in Animals, or following Pursuits subsidiary thereto. | ||||||||||||||||||||||||||||||||||||
| Sub-Order 1. Engaged in Agricultural Pursuits— | ||||||||||||||||||||||||||||||||||||
| Farmer, Market Gardener | 129 | 128 | 1 | 23 | 33 | ... | 70 | 70 | ... | 2 | 2 | ... | 7 | 7 | ... | 50 | 49 | 1 | 1 | 1 | ... | 8 | 8 | ... | 4 | 4 | ... | 10 | 10 | ... | 14 | 14 | ... | 10 | 10 | ... |
| Farmer's Relative (over 15 years) | 19 | 19 | ... | ... | ... | ... | 8 | 8 | ... | 5 | 5 | ... | 2 | 2 | ... | ... | ... | ... | ... | ... | ... | 6 | 6 | ... | 1 | 1 | ... | ... | ... | ... | 1 | 1 | ... | 1 | 1 | ... |
| Farm Bailiff, Overseer | 1 | 1 | ... | ... | ... | ... | ... | ... | ... | ... | ... | ... | ... | ... | ... | ... | ... | ... | ... | ... | ... | ... | ... | ... | ... | ... | ... | ... | ... | ... | ... | ... | ... | ... | ... | |
| Farm Servant and Labourer | 90 | 89 | 1 | 5 | 5 | ... | 29 | 29 | ... | 2 | 2 | ... | 3 | 3 | ... | 4 | 4 | ... | 1 | 1 | ... | 2 | 2 | ... | 5 | 5 | ... | 3 | 3 | ... | ... | ... | ... | 3 | 3 | ... |
| Gardener (not Domestic Servant) | 26 | 26 | ... | 6 | 6 | ... | 9 | 9 | ... | ... | ... | ... | 2 | 2 | ... | 4 | 4 | ... | ... | ... | ... | ... | ... | ... | 2 | 2 | ... | 3 | 3 | ... | 6 | 6 | ... | 3 | 3 | ... |
| Others, Planters, Farm Contractor | 2 | 2 | ... | ... | ... | ... | 1 | 1 | ... | ... | ... | ... | ... | ... | ... | ... | ... | ... | ... | ... | ... | ... | ... | ... | ... | ... | ... | ... | ... | ... | ... | ... | ... | ... | ... | ... |
| Sub-Order 2. Engaged in Pastoral Pursuits— | ||||||||||||||||||||||||||||||||||||
| Runholder, Grazier, Sheep or Cattle Farmer | 5 | 5 | ... | ... | ... | ... | 1 | 1 | ... | ... | ... | ... | ... | ... | ... | ... | ... | ... | ... | ... | ... | ... | ... | ... | ... | ... | ... | ... | ... | ... | ... | ... | ... | 1 | 1 | ... |
| Runholder's Relative (over 15 years of age) | 1 | 1 | ... | ... | ... | ... | ... | ... | ... | ... | ... | ... | ... | ... | ... | ... | ... | ... | ... | ... | ... | ... | ... | ... | ... | ... | ... | ... | ... | ... | ... | ... | ... | ... | ... | ... |
| Station Overseer, Superintendent | ... | ... | ... | ... | ... | ... | 1 | 1 | ... | ... | ... | ... | ... | ... | ... | ... | ... | ... | ... | ... | ... | ... | ... | ... | ... | ... | ... | ... | ... | ... | ... | ... | ... | ... | ... | ... |
| Station or Grazing Farm Servant, Labourer. | 10 | 10 | ... | 2 | 2 | ... | 1 | 1 | ... | ... | ... | ... | ... | ... | ... | 14 | 14 | ... | ... | ... | ... | ... | ... | ... | ... | ... | ... | ... | ... | ... | ... | ... | ... | ... | ... | ... |
| Sub-Order 3. Engaged on Land (not cultivating or grazing)— | ||||||||||||||||||||||||||||||||||||
| Landowner | 6 | 6 | ... | ... | ... | ... | 4 | 4 | ... | ... | ... | ... | ... | ... | ... | 1 | 1 | ... | ... | ... | ... | ... | ... | ... | ... | ... | ... | ... | ... | ... | 3 | 3 | ... | 2 | 2 | ... |
| Land Agent | ... | ... | ... | ... | ... | ... | ... | ... | ... | ... | ... | ... | ... | ... | ... | 1 | 1 | ... | ... | ... | ... | ... | ... | ... | ... | ... | ... | ... | ... | ... | ... | ... | ... | ... | ... | ... |
| Land Surveyor (not Government) | 3 | 3 | ... | 1 | 1 | ... | ... | ... | ... | ... | ... | ... | 1 | 1 | ... | ... | ... | ... | ... | ... | ... | ... | ... | ... | ... | ... | ... | ... | ... | ... | ... | ... | ... | ... | ... | ... |
| Agricultural Implement Owner, Worker | ... | ... | ... | ... | ... | ... | 1 | 1 | ... | ... | ... | ... | ... | ... | ... | ... | ... | ... | ... | ... | ... | ... | ... | ... | ... | ... | ... | ... | ... | ... | ... | ... | ... | ... | ... | ... |
| Grubber, Bushman | 25 | 25 | ... | 2 | 2 | ... | 9 | 9 | ... | 1 | 1 | ... | ... | ... | ... | 9 | 9 | ... | ... | ... | ... | ... | ... | ... | ... | ... | ... | ... | ... | ... | 2 | 2 | ... | 5 | 5 | ... |
| Survey Labourer | ... | ... | ... | ... | ... | ... | 2 | 2 | ... | ... | ... | ... | ... | ... | ... | ... | ... | ... | ... | ... | ... | ... | ... | ... | ... | ... | ... | ... | ... | ... | ... | ... | ... | ... | ... | ... |
| Sub-Order 4. Engaged on Animals— | ||||||||||||||||||||||||||||||||||||
| Veterinary Surgeon, Farrier | 1 | 1 | ... | 1 | 1 | ... | 1 | 1 | ... | ... | ... | ... | ... | ... | ... | ... | ... | ... | ... | ... | ... | ... | ... | ... | ... | ... | ... | ... | ... | ... | 1 | 1 | ... | ... | ... | ... |
| Occupations. | 15 Years and upwards. | All Ages. | ||||||||||||||||||||||||||||||||||
|---|---|---|---|---|---|---|---|---|---|---|---|---|---|---|---|---|---|---|---|---|---|---|---|---|---|---|---|---|---|---|---|---|---|---|---|---|
| Sick. | Specified Complaints. | Suffering from Accident. | Deaf and Dumb. | Blind. | Lunatics. | Idiots. | Epileptic. | Paralysis. | Crippled and Deformed. | Debility and Infirmity. | Deaf only. | |||||||||||||||||||||||||
| Persons. | Males. | Females. | Persons. | Males. | Females. | Persons. | Males. | Females. | Persons. | Males. | Females. | Persons. | Males. | Females. | Persons. | Males. | Females. | Persons. | Males. | Females. | Persons. | Males. | Females. | Persons. | Males. | Females. | Persons. | Males. | Females. | Persons. | Males. | Females. | Persons. | Males. | Females. | |
| Groom, Jockey, Horsebreaker (not Domestic Servant) | 8 | 8 | ... | ... | ... | ... | 4 | 4 | ... | ... | ... | ... | ... | ... | ... | 2 | 2 | ... | ... | ... | ... | ... | ... | ... | ... | ... | ... | 1 | 1 | ... | ... | ... | ... | ... | ... | ... |
| Cattle Dealer | 1 | 1 | ... | ... | ... | ... | ... | ... | ... | ... | ... | ... | ... | ... | ... | 1 | 1 | ... | ... | ... | ... | ... | ... | ... | ... | ... | ... | ... | ... | ... | ... | ... | ... | ... | ... | ... |
| Rabbit Catcher, Killer | 6 | 6 | ... | ... | ... | ... | ... | ... | ... | ... | ... | ... | ... | ... | ... | 1 | 1 | ... | ... | ... | ... | ... | ... | ... | ... | ... | ... | ... | ... | ... | ... | ... | ... | 1 | 1 | ... |
| Fisherman | 8 | 8 | ... | ... | ... | ... | ... | ... | ... | ... | ... | ... | ... | ... | ... | ... | ... | ... | 1 | 1 | ... | ... | ... | ... | 1 | 1 | ... | 1 | 1 | ... | ... | ... | ... | ... | ... | ... |
| Others, Bee Farmer | 1 | 1 | ... | ... | ... | ... | ... | ... | ... | ... | ... | ... | ... | ... | ... | ... | ... | ... | ... | ... | ... | ... | ... | ... | ... | ... | ... | ... | ... | ... | 1 | 1 | ... | ... | ... | ... |
| CLASS V.—INDUSTRIAL. | ||||||||||||||||||||||||||||||||||||
| Order VIII.—Persons engaged in Working and Dealing in Art and. Mechanic Productions in which Matters of various Kinds are employed in combination. | ||||||||||||||||||||||||||||||||||||
| Sub-Order 1. In Books— | ||||||||||||||||||||||||||||||||||||
| Bookseller | ... | ... | ... | ... | ... | ... | ... | ... | ... | ... | ... | ... | ... | ... | ... | ... | ... | ... | ... | ... | ... | ... | ... | ... | ... | ... | ... | 1 | 1 | ... | ... | ... | ... | ... | ... | ... |
| Bookbinder | ... | ... | ... | 1 | 1 | ... | ... | ... | ... | ... | ... | ... | ... | ... | ... | ... | ... | ... | ... | ... | ... | ... | ... | ... | ... | ... | ... | ... | ... | ... | ... | ... | ... | 1 | ... | 1 |
| Printer, Compositor | 9 | 9 | ... | 3 | 3 | ... | 1 | 1 | ... | ... | ... | ... | ... | ... | ... | 5 | 5 | ... | ... | ... | ... | ... | ... | ... | 1 | 1 | ... | ... | ... | ... | ... | ... | ... | 2 | 2 | ... |
| Newspaper Proprietor, Editor | ... | ... | ... | ... | ... | ... | ... | ... | ... | ... | ... | ... | ... | ... | ... | 1 | 1 | ... | ... | ... | ... | ... | ... | ... | ... | ... | ... | ... | ... | ... | ... | ... | ... | ... | ... | ... |
| Others, Proof Reader, News Vendor, News Agent | ... | ... | ... | 1 | 1 | ... | 2 | 2 | ... | ... | ... | ... | ... | ... | ... | ... | ... | ... | ... | ... | ... | ... | ... | ... | ... | ... | ... | ... | ... | ... | ... | ... | ... | ... | ... | ... |
| Sub-Order 3. In Prints and Pictures— | ||||||||||||||||||||||||||||||||||||
| Lithographer, Lithographic Printer | ... | ... | ... | ... | ... | ... | 1 | 1 | ... | ... | ... | ... | ... | ... | ... | ... | ... | ... | ... | ... | ... | ... | ... | ... | ... | ... | ... | ... | ... | ... | ... | ... | ... | ... | ... | ... |
| Sub-Order 4. In Carving and Figures— | ||||||||||||||||||||||||||||||||||||
| Stone-carver | ... | ... | ... | 1 | 1 | ... | ... | ... | ... | ... | ... | ... | ... | ... | ... | ... | ... | ... | ... | ... | ... | ... | ... | ... | ... | ... | ... | ... | ... | ... | ... | ... | ... | ... | ... | ... |
| Sub-Order 6. In Watches and Philosophical Instruments— | ||||||||||||||||||||||||||||||||||||
| Watch, Clock, Maker | 2 | 2 | ... | 1 | 1 | ... | 1 | 1 | ... | ... | ... | ... | ... | ... | ... | 3 | 3 | ... | ... | ... | ... | ... | ... | ... | ... | ... | ... | ... | ... | ... | ... | ... | ... | ... | ... | ... |
| Sub-Order 8. In Arms — | ||||||||||||||||||||||||||||||||||||
| Gunsmith | 1 | 1 | ... | ... | ... | ... | ... | ... | ... | ... | ... | ... | ... | ... | ... | ... | ... | ... | ... | ... | ... | ... | ... | ... | ... | ... | ... | ... | ... | ... | ... | ... | ... | ... | ... | ... |
| Sub-Order 9. In Machines and Tools— | ||||||||||||||||||||||||||||||||||||
| Engine, Machine, Maker, Dealer | 11 | 11 | ... | ... | ... | ... | 4 | 4 | ... | ... | ... | ... | ... | ... | ... | 1 | 1 | ... | ... | ... | ... | ... | ... | ... | 1 | 1 | ... | ... | ... | ... | ... | ... | ... | 1 | 1 | ... |
| Sub-Order 10. In Carriages, Harness, and Implements— | ||||||||||||||||||||||||||||||||||||
| Coach Maker, Dealer | ... | ... | ... | ... | ... | ... | 1 | 1 | ... | ... | ... | ... | ... | ... | ... | 1 | 1 | ... | ... | ... | ... | ... | ... | ... | ... | ... | ... | ... | ... | ... | ... | ... | ... | ... | ... | ... |
| Saddler, Harness Maker, Dealer | 5 | 5 | ... | ... | ... | ... | 4 | 4 | ... | 2 | 2 | ... | ... | ... | ... | 2 | 2 | ... | ... | ... | ... | ... | ... | ... | ... | ... | ... | ... | ... | ... | ... | ... | ... | ... | ... | ... |
| Wheelwright | 1 | 1 | ... | ... | ... | ... | 1 | 1 | ... | ... | ... | ... | ... | ... | ... | ... | ... | ... | ... | ... | ... | ... | ... | ... | 1 | 1 | ... | ... | ... | ... | ... | ... | ... | ... | ... | ... |
| Millwright | 1 | 1 | ... | ... | ... | ... | ... | ... | ... | ... | ... | ... | ... | ... | ... | ... | ... | ... | ... | ... | ... | ... | ... | ... | ... | ... | ... | ... | ... | ... | ... | ... | ... | ... | ... | ... |
| Sub-Order 11. In Ships and Boats— | ||||||||||||||||||||||||||||||||||||
| Shipbuilder, Shipwright | 8 | 8 | ... | 1 | 1 | ... | 3 | 3 | ... | ... | ... | ... | ... | ... | ... | 1 | 1 | ... | ... | ... | ... | ... | ... | ... | ... | ... | ... | ... | ... | ... | 2 | 2 | ... | ... | ... | ... |
| Boatbuilder | ... | ... | ... | 1 | 1 | ... | ... | ... | ... | ... | ... | ... | ... | ... | ... | 1 | 1 | ... | ... | ... | ... | ... | ... | ... | ... | ... | ... | ... | ... | ... | ... | ... | ... | ... | ... | ... |
| Sailmaker | 1 | 1 | ... | ... | ... | ... | 3 | 3 | ... | ... | ... | ... | ... | ... | ... | ... | ... | ... | ... | ... | ... | ... | ... | ... | ... | ... | ... | 1 | 1 | ... | ... | ... | ... | ... | ... | ... |
| Sub-Order 12. In Houses and Buildings— | ||||||||||||||||||||||||||||||||||||
| House Owner | 5 | 5 | ... | 1 | 1 | ... | 2 | 2 | ... | ... | ... | ... | 1 | 1 | ... | ... | ... | ... | ... | ... | ... | ... | ... | ... | ... | ... | ... | ... | ... | ... | ... | ... | ... | ... | ... | ... |
| House Agent | ... | ... | ... | ... | ... | ... | ... | ... | ... | ... | ... | ... | ... | ... | ... | 1 | 1 | ... | ... | ... | ... | ... | ... | ... | ... | ... | ... | ... | ... | ... | ... | ... | ... | ... | ... | ... |
| Architect | 1 | 1 | ... | ... | ... | ... | ... | ... | ... | ... | ... | ... | ... | ... | ... | ... | ... | ... | ... | ... | ... | ... | ... | ... | ... | ... | ... | ... | ... | ... | ... | ... | ... | 1 | 1 | ... |
| Builder | 4 | 4 | ... | 3 | 3 | ... | 2 | 2 | ... | ... | ... | ... | ... | ... | ... | ... | ... | ... | ... | ... | ... | ... | ... | ... | ... | ... | ... | ... | ... | ... | ... | ... | ... | 1 | 1 | ... |
| Carpenter, Joiner | 70 | 70 | ... | 7 | 7 | ... | 22 | 22 | ... | 2 | 2 | ... | ... | ... | ... | 22 | 22 | ... | ... | ... | ... | ... | ... | ... | 1 | 1 | ... | ... | ... | ... | 6 | 6 | ... | 6 | 6 | ... |
| Bricklayer | 7 | 7 | ... | 1 | 1 | ... | 3 | 3 | ... | ... | ... | ... | ... | ... | ... | 3 | 3 | ... | ... | ... | ... | 1 | ... | ... | ... | ... | ... | 1 | 1 | ... | ... | ... | ... | ... | ... | ... |
| Mason, Pavior | 6 | 6 | ... | ... | ... | ... | 1 | 1 | ... | ... | ... | ... | ... | ... | ... | 2 | 2 | ... | ... | ... | ... | ... | ... | ... | ... | ... | ... | ... | ... | ... | 1 | 1 | ... | ... | ... | ... |
| Plasterer | 4 | 4 | ... | ... | ... | ... | ... | ... | ... | ... | ... | ... | ... | ... | ... | ... | ... | ... | ... | ... | ... | ... | ... | ... | ... | ... | ... | ... | ... | ... | 1 | 1 | ... | ... | ... | ... |
| Painter, Plumber, Glazier | 22 | 22 | ... | ... | ... | ... | 5 | 5 | ... | ... | ... | ... | ... | ... | ... | 2 | 2 | ... | ... | ... | ... | 1 | ... | ... | ... | ... | ... | 1 | 1 | ... | ... | ... | ... | ... | ... | ... |
| Contractor for Buildings | 3 | 3 | ... | ... | ... | ... | ... | ... | ... | ... | ... | ... | ... | ... | ... | ... | ... | ... | ... | ... | ... | ... | ... | ... | ... | ... | ... | ... | ... | ... | ... | ... | ... | ... | ... | ... |
| Sub-Order 13. In Furniture— | ||||||||||||||||||||||||||||||||||||
| Furniture Maker, Cabinet Maker, Upholsterer | 4 | 4 | ... | 1 | 1 | ... | 2 | 2 | ... | 1 | 1 | ... | ... | ... | ... | 3 | 3 | ... | ... | ... | ... | ... | ... | ... | 1 | 1 | ... | ... | ... | ... | 4 | 4 | ... | 3 | 3 | ... |
| Carver, Gilder, Mattrass Maker | ... | ... | ... | ... | ... | ... | ... | ... | ... | ... | ... | ... | ... | ... | ... | ... | ... | ... | ... | ... | ... | 1 | 1 | ... | ... | ... | ... | ... | ... | ... | ... | ... | ... | ... | ... | ... |
| Undertaker | 1 | 1 | ... | ... | ... | ... | ... | ... | ... | ... | ... | ... | ... | ... | ... | ... | ... | ... | ... | ... | ... | ... | ... | ... | ... | ... | ... | ... | ... | ... | ... | ... | ... | ... | ... | ... |
Table II. Showing the Occupations of Persons, Males, and Females (exclusive of Maoris), of 15 Years of Age and upwards, returned as Sick, or Suffering from Accident; and the Occupations, past or present, of the Deaf and Dumb, Blind, Lunatics, Idiots, Epileptics, Paralyzed, Crippled or Deformed, Suffering from Debility or Deafness, of all Ages, on the 3rd April, 1881— continued.
| Occupations. | 15 Years and upwards. | All Ages. | ||||||||||||||||||||||||||||||||||
|---|---|---|---|---|---|---|---|---|---|---|---|---|---|---|---|---|---|---|---|---|---|---|---|---|---|---|---|---|---|---|---|---|---|---|---|---|
| Sick. | Specified Complaints. | Suffering from Accident. | Deaf and Dumb. | Blind. | Lunatics. | Idiots. | Epileptic. | Paralysis. | Crippled and Deformed. | Debility and Infirmity. | Deaf only. | |||||||||||||||||||||||||
| Persons. | Males. | Females. | Persons. | Males. | Females. | Persons. | Males. | Females. | Persons. | Males. | Females. | Persons. | Males. | Females. | Persons. | Males. | Females. | Persons. | Males. | Females. | Persons. | Males. | Females. | Persons. | Males. | Females. | Persons. | Males. | Females. | Persons. | Males. | Females. | Persons. | Males. | Females. | |
| CLASS V.—INDUSTRIAL—continued. | ||||||||||||||||||||||||||||||||||||
| Order IX.—Persons Working and Dealing in Textile Fabrics, in Dress, and in Fibrous Materials. | ||||||||||||||||||||||||||||||||||||
| Sub-Order I. In Textile Fabrics— | ||||||||||||||||||||||||||||||||||||
| Draper, Linen Draper, Mercer, and Assistant | 7 | 7 | ... | 1 | 1 | ... | 2 | 2 | ... | ... | ... | ... | ... | ... | ... | 3 | 3 | ... | ... | ... | ... | ... | ... | ... | 1 | 1 | ... | ... | ... | ... | ... | ... | ... | ... | ... | ... |
| Woolstapler | 1 | 1 | ... | ... | ... | ... | ... | ... | ... | ... | ... | ... | ... | ... | ... | ... | ... | ... | ... | ... | ... | 1 | 1 | ... | ... | ... | ... | ... | ... | ... | ... | ... | ... | ... | ... | ... |
| Woollen Dealer | 3 | 1 | 2 | ... | ... | ... | ... | ... | ... | ... | ... | 1 | ... | ... | ... | ... | ... | ... | ... | ... | ... | ... | ... | ... | ... | ... | ... | ... | ... | ... | ... | ... | ... | ... | ... | ... |
| Sub-Order 2. In Dress— | ||||||||||||||||||||||||||||||||||||
| Hairdresser, Wigmaker | 1 | 1 | ... | ... | ... | ... | 2 | 2 | ... | 1 | 1 | ... | ... | ... | ... | ... | ... | ... | ... | ... | ... | ... | ... | ... | ... | ... | ... | ... | ... | ... | ... | ... | ... | ... | ... | ... |
| Tailor | 15 | 14 | 1 | ... | ... | ... | 2 | 2 | ... | 2 | 1 | 1 | ... | ... | ... | 6 | 4 | 2 | ... | ... | ... | ... | ... | ... | ... | ... | ... | 1 | 1 | ... | 5 | 1 | ... | ... | ... | ... |
| Outfitter | 1 | 1 | ... | ... | ... | ... | ... | ... | ... | ... | ... | ... | ... | ... | ... | ... | ... | ... | ... | ... | ... | ... | ... | ... | ... | ... | ... | ... | ... | ... | ... | ... | ... | ... | ... | ... |
| Milliner, Dressmaker | 19 | ... | 19 | 1 | ... | 1 | 3 | ... | 3 | ... | ... | ... | ... | ... | ... | 3 | ... | 3 | ... | ... | ... | ... | ... | ... | ... | ... | ... | ... | ... | ... | 1 | ... | 1 | 4 | ... | 4 |
| Shirtmaker, Seamstress | 2 | ... | 2 | ... | ... | ... | 1 | 1 | ... | ... | ... | ... | ... | ... | ... | ... | ... | ... | ... | ... | ... | 1 | ... | 1 | ... | ... | ... | 1 | ... | 1 | 1 | ... | 1 | 2 | 1 | 1 |
| Machinist, Sewing Machinist (not otherwise described) | 1 | ... | 1 | ... | ... | ... | 1 | 1 | ... | ... | ... | ... | ... | ... | ... | ... | ... | ... | ... | ... | ... | ... | ... | ... | ... | ... | ... | ... | ... | ... | 1 | ... | 1 | ... | ... | ... |
| Shoe, Boot, Maker, Dealer | 20 | 19 | 1 | 4 | 4 | ... | 6 | 6 | ... | 3 | 2 | 1 | 1 | 1 | ... | 9 | 9 | ... | ... | ... | ... | 3 | 3 | ... | ... | ... | ... | 3 | 3 | ... | 1 | 1 | ... | 3 | 3 | ... |
| Washerwoman, Laundryman | 5 | ... | 5 | ... | ... | ... | 1 | ... | 1 | ... | ... | ... | ... | ... | ... | 3 | ... | 3 | ... | ... | ... | ... | ... | ... | 1 | 1 | ... | ... | ... | ... | ... | ... | ... | ... | ... | ... |
| Lacemaker, Knitter | ... | ... | ... | 2 | ... | 2 | ... | ... | ... | ... | ... | ... | 1 | ... | 1 | ... | ... | ... | ... | ... | ... | ... | ... | ... | ... | ... | ... | ... | ... | ... | ... | ... | ... | ... | ... | ... |
| Others, Button-maker | 1 | 1 | ... | ... | ... | ... | ... | ... | ... | ... | ... | ... | ... | ... | ... | ... | ... | ... | ... | ... | ... | ... | ... | ... | ... | ... | ... | ... | ... | ... | ... | ... | ... | ... | ... | ... |
| Sub-Order 3. In Fibrous Materials— | ||||||||||||||||||||||||||||||||||||
| Mat-maker | 1 | 1 | ... | ... | ... | ... | ... | ... | ... | ... | ... | ... | ... | ... | ... | ... | ... | ... | ... | ... | ... | 1 | 1 | ... | ... | ... | ... | ... | ... | ... | ... | ... | ... | ... | ... | ... |
| Tent, Tarpaulin, Maker, Dealer | 1 | 1 | ... | ... | ... | ... | ... | ... | ... | ... | ... | ... | ... | ... | ... | ... | ... | ... | ... | ... | ... | ... | ... | ... | ... | ... | ... | ... | ... | ... | ... | ... | ... | ... | ... | ... |
| Order X.—Persons Working and Dealing in Food and Drinks. | ||||||||||||||||||||||||||||||||||||
| Sub-Order 1. In Animal Food— | ||||||||||||||||||||||||||||||||||||
| Dairy Man, Woman, Milkseller | 3 | 2 | 1 | 1 | 1 | ... | ... | ... | ... | ... | ... | ... | ... | ... | ... | 2 | 2 | ... | ... | ... | ... | ... | ... | ... | ... | ... | ... | ... | ... | ... | ... | ... | ... | ... | ... | ... |
| Butcher | 22 | 22 | ... | 2 | 2 | ... | 3 | 3 | ... | ... | ... | ... | ... | ... | ... | ... | ... | ... | ... | ... | ... | ... | ... | ... | ... | ... | ... | 1 | 1 | ... | 1 | 1 | ... | ... | ... | ... |
| Fishmonger | ... | ... | ... | ... | ... | ... | 1 | 1 | ... | ... | ... | ... | ... | ... | ... | ... | ... | ... | ... | ... | ... | ... | ... | ... | ... | ... | ... | ... | ... | ... | ... | ... | ... | ... | ... | ... |
| Provision Curer, Dealer, Tripe-dresser | ... | ... | ... | ... | ... | ... | 1 | 1 | ... | ... | ... | ... | ... | ... | ... | 1 | 1 | ... | ... | ... | ... | ... | ... | ... | ... | ... | ... | ... | ... | ... | ... | ... | ... | ... | ... | ... |
| Others, Butcher's Clerk | ... | ... | ... | 1 | 1 | ... | ... | ... | ... | ... | ... | ... | ... | ... | ... | ... | ... | ... | ... | ... | ... | ... | ... | ... | ... | ... | ... | ... | ... | ... | ... | ... | ... | ... | ... | ... |
| Sub-Order 2. In Vegetable Food- | ||||||||||||||||||||||||||||||||||||
| Corn, Flour Merchants | ... | ... | ... | ... | ... | ... | 2 | 2 | ... | ... | ... | ... | ... | ... | ... | ... | ... | ... | ... | ... | ... | ... | ... | ... | ... | ... | ... | ... | ... | ... | ... | ... | ... | ... | ... | ... |
| Miller | ... | ... | ... | ... | ... | ... | 3 | 3 | ... | ... | ... | ... | ... | ... | ... | 1 | 1 | ... | ... | ... | ... | ... | ... | ... | ... | ... | ... | ... | ... | ... | ... | ... | ... | ... | ... | ... |
| Baker | 6 | 6 | ... | 2 | 2 | ... | 8 | 8 | ... | ... | ... | ... | ... | ... | ... | 6 | 6 | ... | ... | ... | ... | 1 | 1 | ... | 1 | 1 | ... | ... | ... | ... | ... | ... | ... | ... | ... | ... |
| Confectioner, Pastry-cook | ... | ... | ... | ... | ... | ... | ... | ... | ... | ... | ... | ... | ... | ... | ... | 1 | 1 | ... | ... | ... | ... | ... | ... | ... | ... | ... | ... | ... | ... | ... | ... | ... | ... | ... | ... | ... |
| Greengrocer, Fruiterer | 1 | 1 | ... | 1 | 1 | ... | 1 | ... | ... | ... | ... | ... | ... | ... | ... | ... | ... | ... | ... | ... | ... | ... | ... | ... | ... | ... | ... | ... | ... | ... | ... | ... | ... | ... | ... | ... |
| Occupations. | 15 Years and upwards. | All Ages. | ||||||||||||||||||||||||||||||||||
|---|---|---|---|---|---|---|---|---|---|---|---|---|---|---|---|---|---|---|---|---|---|---|---|---|---|---|---|---|---|---|---|---|---|---|---|---|
| Sick. | Specified Complaints. | Suffering from Accident. | Deaf and Dumb. | Blind. | Lunatics. | Idiots. | Epileptic. | Paralysis. | Crippled and Deformed. | Debility and Infirmity. | Deaf only. | |||||||||||||||||||||||||
| Persons. | Males. | Females. | Persons. | Males. | Females. | Persons. | Males. | Females. | Persons. | Males. | Females. | Persons. | Males. | Females. | Persons. | Males. | Females. | Persons. | Males. | Females. | Persons. | Males. | Females. | Persons. | Males. | Females. | Persons. | Males. | Females. | Persons. | Males. | Females. | Persons. | Males. | Females. | |
| Seed Merchant, Dealer | ... | ... | ... | ... | ... | ... | ... | ... | ... | ... | ... | ... | ... | ... | ... | 1 | 1 | ... | ... | ... | ... | ... | ... | ... | ... | ... | ... | ... | ... | ... | ... | ... | ... | ... | ... | ... |
| Others, Herbalist | ... | ... | ... | ... | ... | ... | 1 | 1 | ... | ... | ... | ... | ... | ... | ... | ... | ... | ... | ... | ... | ... | ... | ... | ... | ... | ... | ... | ... | ... | ... | ... | ... | ... | ... | ... | ... |
| Sub-Order 3. In Drinks and Stimulants— | ||||||||||||||||||||||||||||||||||||
| Brewer and others engaged in Brewing | 2 | 2 | ... | 1 | 1 | ... | ... | ... | ... | ... | ... | ... | ... | ... | ... | ... | ... | ... | ... | ... | ... | ... | ... | ... | ... | ... | ... | ... | ... | ... | 1 | 1 | ... | ... | ... | ... |
| Maltster | 1 | 1 | ... | ... | ... | ... | ... | ... | ... | ... | ... | ... | ... | ... | ... | ... | ... | ... | ... | ... | ... | ... | ... | ... | ... | ... | ... | ... | ... | ... | ... | ... | ... | ... | ... | ... |
| Wine and Spirit Merchant | ... | ... | ... | ... | ... | ... | 1 | 1 | ... | ... | ... | ... | ... | ... | ... | ... | 1 | 1 | ... | ... | ... | ... | ... | ... | ... | ... | ... | ... | ... | ... | ... | ... | ... | ... | ... | ... |
| Aerated Waters, Cordial Manufacturer | 1 | 1 | ... | ... | ... | ... | 3 | 3 | ... | ... | ... | ... | ... | ... | ... | ... | ... | ... | ... | ... | ... | ... | ... | ... | ... | ... | ... | ... | ... | ... | ... | ... | ... | ... | ... | ... |
| Grocer, Tea Dealer | 7 | 7 | ... | 1 | 1 | ... | 1 | 1 | ... | ... | ... | ... | ... | ... | ... | ... | ... | ... | ... | ... | ... | ... | ... | ... | ... | ... | ... | ... | ... | ... | ... | ... | ... | ... | ... | ... |
| Tobacconist | ... | ... | ... | ... | ... | ... | ... | ... | ... | ... | ... | ... | ... | ... | ... | ... | ... | ... | ... | ... | ... | ... | ... | ... | ... | ... | ... | 1 | 1 | ... | ... | ... | ... | ... | ... | ... |
| Bottler | ... | ... | ... | ... | ... | ... | ... | ... | ... | ... | ... | ... | ... | ... | ... | ... | ... | ... | ... | ... | ... | ... | ... | ... | ... | ... | ... | 1 | 1 | ... | ... | ... | ... | ... | ... | ... |
| Sugar Boiler | ... | ... | ... | ... | ... | ... | ... | ... | ... | ... | ... | ... | 1 | 1 | ... | ... | ... | ... | ... | ... | ... | ... | ... | ... | ... | ... | ... | ... | ... | ... | ... | ... | ... | ... | ... | ... |
| Order XI.—Persons Working and Dealing in Animal and Vegetable Substances. | ||||||||||||||||||||||||||||||||||||
| Sub-Order 1. In Animal Matters— | ||||||||||||||||||||||||||||||||||||
| Tallow Chandler | ... | ... | ... | ... | ... | ... | ... | ... | ... | ... | ... | ... | ... | ... | ... | ... | ... | ... | ... | ... | ... | ... | ... | ... | ... | ... | ... | ... | ... | ... | ... | ... | ... | 1 | 1 | ... |
| Fellmonger | 3 | 3 | ... | ... | ... | ... | ... | ... | ... | ... | ... | ... | ... | ... | ... | ... | ... | ... | ... | ... | ... | ... | ... | ... | ... | ... | ... | ... | ... | ... | ... | ... | ... | ... | ... | ... |
| Currier | 1 | 1 | ... | ... | ... | ... | ... | ... | ... | ... | ... | ... | ... | ... | ... | ... | ... | ... | ... | ... | ... | ... | ... | ... | ... | ... | ... | ... | ... | ... | ... | ... | ... | ... | ... | ... |
| Tanner | ... | ... | ... | ... | ... | ... | 1 | 1 | ... | ... | ... | ... | ... | ... | ... | ... | ... | ... | ... | ... | ... | ... | ... | ... | ... | ... | ... | ... | ... | ... | ... | ... | ... | ... | ... | ... |
| Hairbrush, Broom, Maker | 1 | 1 | ... | ... | ... | ... | ... | ... | ... | ... | ... | ... | ... | ... | ... | ... | ... | ... | ... | ... | ... | ... | ... | ... | ... | ... | ... | ... | ... | ... | ... | ... | ... | ... | ... | ... |
| Others, Portmanteau Maker | 1 | 1 | ... | ... | ... | ... | ... | ... | ... | ... | ... | ... | ... | ... | ... | ... | ... | ... | ... | ... | ... | ... | ... | ... | ... | ... | ... | ... | ... | ... | ... | ... | ... | ... | ... | ... |
| Sub-Order 2. In Vegetable Matters— | ||||||||||||||||||||||||||||||||||||
| Oil and Colour Man | ... | ... | ... | ... | ... | ... | ... | ... | ... | ... | ... | ... | 1 | 1 | ... | ... | ... | ... | ... | ... | ... | ... | ... | ... | 1 | 1 | ... | ... | ... | ... | ... | ... | ... | ... | ... | ... |
| French Polisher | ... | ... | ... | ... | ... | ... | ... | ... | ... | ... | ... | ... | ... | ... | ... | ... | ... | ... | ... | ... | ... | ... | ... | ... | 1 | 1 | ... | ... | ... | ... | ... | ... | ... | ... | ... | ... |
| Timber Merchant | ... | ... | ... | ... | ... | ... | ... | ... | ... | ... | ... | ... | ... | ... | ... | ... | ... | ... | ... | ... | ... | ... | ... | ... | ... | ... | ... | ... | ... | ... | ... | ... | ... | 1 | 1 | ... |
| Firewood Dealer | 2 | 2 | ... | ... | ... | ... | ... | ... | ... | ... | ... | ... | ... | ... | ... | ... | ... | ... | ... | ... | ... | ... | ... | ... | ... | ... | ... | ... | ... | ... | ... | ... | ... | ... | ... | ... |
| Fencer, Splitter | ... | ... | ... | ... | ... | ... | ... | ... | ... | ... | ... | ... | ... | ... | ... | 1 | 1 | ... | ... | ... | ... | ... | ... | ... | ... | ... | ... | 1 | 1 | ... | ... | ... | ... | ... | ... | ... |
| Cooper | 3 | 3 | ... | 1 | 1 | ... | ... | ... | ... | ... | ... | ... | ... | ... | ... | ... | ... | ... | ... | ... | ... | ... | ... | ... | ... | ... | ... | ... | ... | ... | ... | ... | ... | ... | ... | ... |
| Sawyer, Sawmill Owner | 6 | 6 | ... | 1 | 1 | ... | 8 | 8 | ... | 2 | 1 | ... | ... | ... | ... | 1 | 1 | ... | ... | ... | ... | ... | ... | ... | ... | ... | ... | ... | ... | ... | ... | ... | ... | 1 | 1 | ... |
| Basket Maker | ... | ... | ... | ... | ... | ... | ... | ... | ... | ... | ... | ... | ... | ... | ... | ... | ... | ... | ... | ... | ... | ... | ... | ... | ... | ... | ... | ... | ... | ... | 1 | 1 | ... | ... | ... | ... |
| Kauri Gum Digger | 9 | 9 | ... | 3 | 3 | ... | 4 | 4 | ... | ... | ... | ... | ... | ... | ... | 4 | 4 | ... | ... | ... | ... | 1 | 1 | ... | ... | ... | ... | ... | ... | ... | 1 | 1 | ... | ... | ... | ... |
| Gum Scraper | 1 | 1 | ... | ... | ... | ... | ... | ... | ... | ... | ... | ... | ... | ... | ... | ... | ... | ... | ... | ... | ... | ... | ... | ... | ... | ... | ... | ... | ... | ... | ... | ... | ... | ... | ... | ... |
| Labourer in Gum Store | 1 | 1 | ... | ... | ... | ... | ... | ... | ... | ... | ... | ... | ... | ... | ... | ... | ... | ... | ... | ... | ... | ... | ... | ... | ... | ... | ... | ... | ... | ... | ... | ... | ... | ... | ... | ... |
| Order XII.—Persons Working and Dealing in Minerals. | ||||||||||||||||||||||||||||||||||||
| Sub-Order 1. In Mining— | ||||||||||||||||||||||||||||||||||||
| Gold Miner, Alluvial | 19 | 19 | ... | 3 | 3 | ... | 7 | 7 | ... | ... | ... | ... | ... | ... | ... | ... | ... | ... | ... | ... | ... | ... | ... | ... | 1 | 1 | ... | 2 | 2 | ... | 1 | 1 | ... | 4 | 4 | ... |
| Sluicer | 7 | 7 | ... | ... | ... | ... | ... | ... | ... | ... | ... | ... | ... | ... | ... | ... | ... | ... | ... | ... | ... | ... | ... | ... | ... | ... | ... | ... | ... | ... | ... | ... | ... | ... | ... | ... |
| Gold Miner, Quartzo | 14 | 14 | ... | ... | ... | ... | 4 | 4 | ... | ... | ... | ... | ... | ... | ... | ... | ... | ... | ... | ... | ... | ... | ... | ... | ... | ... | ... | ... | 1 | ... | ... | ... | ... | 1 | 1 | ... |
| Gold Miner, Digger (not otherwise described) | 53 | 53 | ... | 11 | 11 | ... | 15 | 15 | ... | ... | ... | ... | ... | ... | ... | 67 | 67 | ... | ... | ... | ... | 2 | 2 | ... | 1 | 1 | ... | ... | ... | ... | 3 | 3 | ... | ... | ... | ... |
| Amalgamist | ... | ... | ... | ... | ... | ... | ... | ... | ... | ... | ... | ... | ... | ... | ... | 1 | 1 | ... | ... | ... | ... | ... | ... | ... | ... | ... | ... | ... | ... | ... | ... | ... | ... | ... | ... | ... |
| Quartz Crusher | 1 | 1 | ... | ... | ... | ... | ... | ... | ... | ... | ... | ... | ... | ... | ... | ... | ... | ... | ... | ... | ... | ... | ... | ... | ... | ... | ... | ... | ... | ... | ... | ... | ... | ... | ... | ... |
| Copper Miner | ... | ... | ... | ... | ... | ... | 1 | 1 | ... | ... | ... | ... | ... | ... | ... | ... | ... | ... | ... | ... | ... | ... | ... | ... | ... | ... | ... | 1 | 1 | ... | ... | ... | ... | ... | ... | ... |
| Manganese Miner | ... | ... | ... | ... | ... | ... | 1 | 1 | ... | ... | ... | ... | ... | ... | ... | ... | ... | ... | ... | ... | ... | ... | ... | ... | ... | ... | ... | ... | ... | ... | ... | ... | ... | ... | ... | ... |
| Coal Miner | 1 | 1 | ... | ... | ... | ... | 5 | 5 | ... | ... | ... | ... | ... | ... | ... | ... | ... | ... | ... | ... | ... | ... | ... | ... | ... | ... | ... | ... | ... | ... | ... | ... | ... | ... | ... | ... |
| Mining Engineer | ... | ... | ... | ... | ... | ... | ... | ... | ... | 1 | 1 | ... | ... | ... | ... | ... | ... | ... | ... | ... | ... | 1 | 1 | ... | ... | ... | ... | ... | ... | ... | ... | ... | ... | ... | ... | ... |
| Sub-Order 2. In Coal— | ||||||||||||||||||||||||||||||||||||
| Coal, Coke, Merchant, Dealer | 2 | 2 | ... | ... | ... | ... | ... | ... | ... | ... | ... | ... | ... | ... | ... | ... | ... | ... | ... | ... | ... | ... | ... | ... | ... | ... | ... | ... | ... | ... | ... | ... | ... | ... | ... | ... |
| Chimney-sweeper | 1 | 1 | ... | ... | ... | ... | ... | ... | ... | ... | ... | ... | ... | ... | ... | ... | ... | ... | ... | ... | ... | ... | ... | ... | ... | ... | ... | ... | ... | ... | ... | ... | ... | ... | ... | ... |
| Sub-Order 3. In Stone, Clay, Earthenware, and Glass— | ||||||||||||||||||||||||||||||||||||
| Quarry Owner, Worker | 3 | 3 | ... | ... | ... | ... | ... | ... | ... | ... | ... | ... | ... | ... | ... | ... | ... | ... | ... | ... | ... | ... | ... | ... | ... | ... | ... | ... | ... | ... | ... | ... | ... | ... | ... | ... |
| Limeburner | 1 | 1 | ... | ... | ... | ... | ... | ... | ... | ... | ... | ... | ... | ... | ... | ... | ... | ... | ... | ... | ... | ... | ... | ... | ... | ... | ... | ... | ... | ... | ... | ... | ... | ... | ... | ... |
| Brick Maker, Dealer | 4 | 4 | ... | ... | ... | ... | 2 | 2 | ... | ... | ... | ... | ... | ... | ... | ... | ... | ... | ... | ... | ... | 1 | 1 | ... | 1 | 1 | ... | ... | ... | ... | ... | ... | ... | ... | ... | ... |
| Pottery Maker, Dealer | 2 | 2 | ... | ... | ... | ... | ... | ... | ... | ... | ... | ... | ... | ... | ... | ... | ... | ... | ... | ... | ... | ... | ... | ... | ... | ... | ... | ... | ... | ... | ... | ... | ... | ... | ... | ... |
| Road, Railway, Contractor | ... | ... | ... | 1 | 1 | ... | 2 | 2 | ... | ... | ... | ... | ... | ... | ... | ... | ... | ... | ... | ... | ... | ... | ... | ... | ... | ... | ... | ... | ... | ... | ... | ... | ... | ... | ... | ... |
| Road, Railway, Labourer, Navvy | 17 | 17 | ... | 1 | 1 | ... | 6 | 6 | ... | ... | ... | ... | 1 | 1 | ... | 2 | 2 | ... | ... | ... | ... | 1 | 1 | ... | ... | ... | ... | 3 | 3 | ... | ... | ... | ... | ... | ... | ... |
| Bridcmaker's Labourer | 1 | 1 | ... | ... | ... | ... | ... | ... | ... | ... | ... | ... | ... | ... | ... | ... | ... | ... | ... | ... | ... | ... | ... | ... | ... | ... | ... | ... | ... | ... | ... | ... | ... | ... | ... | ... |
Table II. Showing the Occupations of Persons, Males, and Females (exclusive of Maoris), of 15 Years of Age and upwards, returned as Sick, or Suffering from Accident; find the Occupations, past or present, of the Deaf and Dumb, Blind, Lunatics, Idiots, Epileptics, Paralyzed, Crippled or Deformed, Suffering from Debility or Deafness, of all Ages, on the 3rd April, 1881—continued.
| Occupations. | 15 Years and upwards. | All Ages. | ||||||||||||||||||||||||||||||||||
|---|---|---|---|---|---|---|---|---|---|---|---|---|---|---|---|---|---|---|---|---|---|---|---|---|---|---|---|---|---|---|---|---|---|---|---|---|
| Sick. | Specified Complaints. | Suffering from Accident. | Deaf and Dumb. | Blind. | Lunatics. | Idiots. | Epileptic. | Paralysis. | Crippled and Deformed. | Debility and Infirmity. | Deaf only. | |||||||||||||||||||||||||
| Persons. | Males. | Females. | Persons. | Males. | Females. | Persons. | Males. | Females. | Persons. | Males. | Females. | Persons. | Males. | Females. | Persons. | Males. | Females. | Persons. | Males. | Females. | Persons. | Males. | Females. | Persons. | Males. | Females. | Persons. | Males. | Females. | Persons. | Males. | Females. | Persons. | Males. | Females. | |
| Sub-Order 5. In Gold, Silver, and Precious Stones: | ||||||||||||||||||||||||||||||||||||
| Goldsmith, Silversmith, Jeweller | ... | ... | ... | ... | ... | ... | ... | ... | ... | ... | ... | ... | ... | ... | ... | 2 | 2 | ... | ... | ... | ... | ... | ... | ... | ... | ... | ... | ... | ... | ... | ... | 1 | ... | ... | ... | ... |
| Lapidary | 1 | 1 | ... | ... | ... | ... | ... | ... | ... | ... | ... | ... | ... | ... | ... | ... | ... | ... | ... | ... | ... | ... | ... | ... | ... | ... | ... | ... | ... | ... | ... | ... | ... | ... | ... | ... |
| Electroplater | ... | ... | ... | ... | ... | ... | ... | ... | ... | ... | ... | ... | ... | ... | ... | ... | ... | ... | ... | ... | ... | ... | ... | ... | ... | ... | ... | 1 | 1 | ... | ... | ... | ... | ... | ... | ... |
| Sub-Order 6. In Metals other than Gold and Silver— | ||||||||||||||||||||||||||||||||||||
| Tin, Quicksilver, Worker, Dealer | 3 | 3 | ... | 1 | 1 | ... | ... | ... | ... | ... | ... | ... | ... | ... | ... | 1 | 1 | ... | ... | ... | ... | ... | ... | ... | ... | ... | ... | ... | ... | ... | ... | ... | ... | ... | ... | ... |
| Iron-founder, Moulder, Boiler-maker, Worker, Dealer | 3 | 3 | ... | 2 | 2 | ... | ... | ... | ... | ... | ... | ... | ... | ... | ... | 2 | 2 | ... | ... | ... | ... | ... | ... | ... | ... | ... | ... | ... | ... | ... | 1 | 1 | ... | ... | ... | ... |
| Blacksmith, Whitesmith | 13 | 13 | ... | 2 | 2 | ... | ... | 5 | ... | ... | ... | ... | 1 | 1 | ... | 4 | 4 | ... | ... | ... | ... | 2 | 2 | ... | 1 | 1 | ... | ... | ... | ... | 5 | 5 | ... | ... | ... | ... |
| Ironmonger, Hardware Dealer | 6 | 6 | ... | 1 | 1 | ... | 1 | 1 | ... | ... | ... | ... | ... | ... | ... | 2 | 2 | ... | ... | ... | ... | ... | ... | ... | ... | ... | ... | ... | ... | ... | ... | ... | ... | ... | ... | ... |
| Locksmith, Bell-hanger | ... | ... | ... | ... | ... | ... | 1 | 1 | ... | ... | ... | ... | ... | ... | ... | ... | ... | ... | ... | ... | ... | ... | ... | ... | ... | ... | ... | ... | ... | ... | ... | ... | ... | ... | ... | ... |
| CLASS VI.—INDEFINITE AND NOW-PHODUCTIVE. | ||||||||||||||||||||||||||||||||||||
| Order XIII.—Labourers and Others (Branch of Labour undefined). | ||||||||||||||||||||||||||||||||||||
| Sub-Order 1. General Labourers— | ||||||||||||||||||||||||||||||||||||
| Labourer (branch undefined) | 195 | 198 | ... | 12 | 12 | ... | 73 | 73 | ... | 4 | 4 | ... | 6 | 6 | ... | 285 | 285 | ... | ... | ... | ... | 7 | 7 | ... | 5 | 5 | ... | 10 | 10 | ... | 16 | 16 | ... | 10 | 10 | ... |
| Sub-Order 2. Other Indefinite Occupations— | ||||||||||||||||||||||||||||||||||||
| Shop Woman | 2 | ... | 2 | ... | ... | ... | ... | ... | ... | ... | ... | ... | ... | ... | ... | 1 | ... | 1 | ... | ... | ... | ... | ... | ... | ... | ... | ... | ... | ... | ... | ... | ... | ... | ... | ... | ... |
| Apprentice (unspecified) | ... | ... | ... | ... | ... | ... | 1 | 1 | ... | ... | ... | ... | ... | ... | ... | ... | ... | ... | ... | ... | ... | ... | ... | ... | ... | ... | ... | ... | ... | ... | ... | ... | ... | ... | ... | ... |
| Engineer, Engine-driver, Stoker, Fireman (undefined) | 9 | 9 | ... | 3 | 3 | ... | 9 | 9 | ... | ... | ... | ... | ... | ... | ... | 1 | 1 | ... | ... | ... | ... | ... | ... | ... | 1 | 1 | ... | ... | ... | ... | ... | ... | ... | ... | ... | ... |
| Draughtsman (unspecified) | 2 | 2 | ... | ... | ... | ... | ... | ... | ... | ... | ... | ... | ... | ... | ... | ... | ... | ... | ... | ... | ... | ... | ... | ... | ... | ... | ... | ... | ... | ... | ... | ... | ... | ... | ... | ... |
| Contractor (unspecified) | 1 | 7 | ... | 1 | 1 | ... | 3 | 3 | ... | ... | ... | ... | ... | ... | ... | 1 | 1 | ... | ... | ... | ... | ... | ... | ... | ... | ... | ... | ... | ... | ... | 1 | 1 | ... | ... | ... | ... |
| Others | 4 | 4 | ... | ... | ... | ... | ... | ... | ... | ... | ... | ... | ... | ... | ... | ... | ... | ... | ... | ... | ... | ... | ... | ... | ... | ... | ... | ... | ... | ... | ... | ... | ... | ... | ... | ... |
| Order XIV.—Persons of Property or Rank (not returned under any Office or Occupation) | 14 | 13 | 1 | 1 | 1 | ... | 4 | 4 | ... | ... | ... | ... | 4 | 3 | 1 | 5 | 5 | ... | ... | ... | ... | 2 | 1 | 1 | 1 | 1 | ... | 3 | 3 | ... | 3 | 3 | ... | ... | ... | ... |
| Order XV.—Persons supported by the Community. | ||||||||||||||||||||||||||||||||||||
| Sub-Order 1. From Voluntary Sources and Public Revenue— | ||||||||||||||||||||||||||||||||||||
| Dependent on Relatives | ... | ... | ... | ... | ... | ... | ... | ... | ... | ... | ... | ... | ... | ... | ... | ... | ... | ... | ... | ... | ... | ... | ... | ... | ... | ... | ... | ... | ... | ... | 1 | 1 | ... | ... | ... | ... |
| Inmate of Charitable Institution | 28 | 3 | 25 | 15 | 14 | 1 | 1 | 1 | ... | ... | ... | ... | 8 | 8 | ... | 215 | 87 | 128 | 4 | 3 | 1 | 5 | 5 | ... | ... | ... | ... | 4 | 4 | ... | 12 | 6 | 6 | ... | ... | ... |
| Sub-Order 2. Criminal Classes— | ||||||||||||||||||||||||||||||||||||
| Prisoner | 1 | 1 | ... | 1 | ... | 1 | ... | ... | ... | ... | ... | ... | ... | ... | ... | 1 | 1 | ... | 1 | 1 | ... | ... | ... | ... | ... | ... | ... | ... | ... | ... | ... | ... | ... | ... | ... | ... |
| Inmate of Refuge | ... | ... | ... | ... | ... | ... | ... | ... | ... | ... | ... | ... | ... | ... | ... | ... | ... | ... | 1 | 1 | ... | ... | ... | ... | ... | ... | ... | ... | ... | ... | 1 | 1 | ... | ... | ... | ... |
| Others—Vagrant | ... | ... | ... | ... | ... | ... | ... | ... | ... | ... | ... | ... | ... | ... | ... | 1 | 1 | ... | ... | ... | ... | ... | ... | ... | ... | ... | ... | ... | ... | ... | ... | ... | ... | ... | ... | ... |
| No occupation at present | 102 | 102 | ... | 16 | 16 | ... | 15 | 14 | 1 | 2 | 2 | ... | 18 | 16 | 2 | 9 | 8 | 1 | 12 | 12 | ... | 8 | 8 | ... | 6 | 6 | ... | ... | 5 | ... | 21 | 22 | 1 | 1 | 1 | ... |
| Occupation not stated | 14 | 14 | ... | 3 | 3 | ... | 5 | 5 | ... | 2 | 2 | ... | ... | ... | ... | ... | ... | ... | ... | ... | ... | ... | ... | ... | ... | ... | 1 | 1 | ... | 3 | 3 | ... | ... | ... | ... | |
Table of Contents
Table I. Table I. Showing the Ages, in Quinquennial Periods, and Proportions in every 10,000 Living, of Persons, Males, and Females (exclusive of Maoris), of 15 Years of Age and upwards, returned as Sick or Suffering from Accident; and of all Ages returned as Deaf and Dumb, Blind, Lunatics, Idiots, Epileptic, Paralyzed, Crippled and Deformed, Suffering from Debility and Deafness, on the 3rd April, 1881.
| The sickness of those under 15 years has not been brought out, the instruction to householders on the Census schedule being that, if “unable to follow usual occupation by reason of illness or accident,” the word “Sick” or “Accident” was to be entered. | |||||||||||||||
|---|---|---|---|---|---|---|---|---|---|---|---|---|---|---|---|
| NUMBERS. | |||||||||||||||
| Ages. | Persons. | ||||||||||||||
| Total of Population | Sick and Accident, 15 Years and upwards. | Specified Infirmities, all Ages. | |||||||||||||
| Total. | Sick. | Specified Complaints. | Suffering from Accident. | Total. | Deaf and Dumb. | Blind. | Lunatic. | Idiots. | Epileptic. | Paralysis. | Crippled and Deformed. | Debility and Infirmity. | Deaf only. | ||
| All ages | 489,933 | … | … | … | … | 2,269 | 114 | 138 | 1,120 | 58 | 194 | 104 | 132 | 272 | 137 |
| 15 years and upwards | 282,107 | 3,160 | 2,333 | 250 | 577 | … | … | … | … | … | … | … | … | … | … |
| Under 5 years | 82,289 | … | … | … | … | 22 | 5 | 6 | … | 2 | 5 | … | 1 | 3 | … |
| 5 years to 10 years | 67,915 | … | … | … | … | 82 | 29 | 2 | 5 | 3 | 12 | 7 | 15 | 4 | 5 |
| 10 years to 11 years | 57,622 | … | … | … | … | 127 | 21 | 11 | 10 | 14 | 27 | 7 | 15 | 18 | 4 |
| 15 years to 20 years | 42,609 | 218 | 172 | 17 | 29 | 140 | 17 | 4 | 24 | 11 | 35 | 3 | 25 | 18 | 3 |
| 20 years to 25 years | 41,365 | 278 | 215 | 14 | 49 | 146 | 10 | 5 | 63 | 10 | 21 | … | 9 | 13 | 15 |
| 25 years to 30 years | 40,586 | 330 | 244 | 9 | 77 | 152 | 9 | 3 | 98 | 5 | 15 | 1 | 7 | 8 | 6 |
| 30 years to 35 years | 34,595 | 280 | 209 | 12 | 59 | 208 | 6 | 9 | 143 | 6 | 16 | 5 | 3 | 13 | 7 |
| 35 years to 40 years | 33,562 | 338 | 244 | 26 | 68 | 268 | 4 | 8 | 196 | 1 | 12 | 11 | 5 | 18 | 13 |
| 40 years to 45 years | 31,100 | 345 | 245 | 24 | 76 | 273 | 2 | 9 | 199 | 1 | 10 | 8 | 10 | 18 | 16 |
| 45 years to 50 years | 21,341 | 313 | 222 | 25 | 66 | 227 | 2 | 9 | 151 | … | 7 | 13 | 9 | 20 | 16 |
| 50 years to 55 years | 14,563 | 274 | 179 | 35 | 60 | 164 | … | 6 | 102 | 1 | 8 | 10 | 6 | 17 | 14 |
| 55 years to 60 years | 7,820 | 204 | 149 | 27 | 28 | 136 | 2 | 12 | 60 | 2 | 10 | 10 | 9 | 23 | 8 |
| 60 years to 65 years | 6,339 | 211 | 156 | 24 | 31 | 94 | 3 | 9 | 32 | … | 4 | 12 | 3 | 20 | 11 |
| 65 years to 70 years | 3,232 | 133 | 98 | 16 | 19 | 79 | 1 | 10 | 20 | 1 | 5 | 7 | 5 | 25 | 5 |
| 70 years to 75 years | 2,087 | 116 | 95 | 9 | 12 | 65 | 2 | 15 | 11 | … | 2 | 5 | 3 | 20 | 7 |
| 75 years to 80 years | 992 | 55 | 46 | 7 | 2 | 37 | … | 8 | 2 | … | 3 | 2 | 3 | 16 | 3 |
| 80 and upwards | 584 | 54 | 49 | 5 | … | 41 | … | 12 | 2 | … | 1 | 2 | 3 | 18 | 3 |
| Unspecified | 1,332 | 11 | 10 | … | 1 | 8 | 1 | … | 2 | 1 | 1 | 1 | 1 | … | 1 |
| MALES. | |||||||||||||||
| All ages | 269,605 | … | … | … | … | 1,433 | 60 | 79 | 736 | 36 | 112 | 67 | 101 | 164 | 78 |
| 15 years and upwards | 164,789 | 2,114 | 1,404 | 181 | 529 | … | … | … | … | … | … | … | … | … | … |
| Under 5 years | 41,636 | … | … | … | … | 12 | 3 | 2 | … | … | 3 | … | 1 | 3 | … |
| 5 years to 10 years | 34,305 | … | … | … | … | 46 | 16 | 1 | 3 | 2 | 6 | 4 | 8 | 4 | 2 |
| 10 years to 15 years | 28,875 | … | … | … | … | 70 | 10 | 5 | 6 | 7 | 17 | 3 | 10 | 10 | 2 |
| 15 years to 20 years | 21,060 | 113 | 80 | 8 | 25 | 77 | 6 | 2 | 14 | 7 | 20 | 3 | 18 | 6 | 1 |
| 20 years to 25 years | 22,078 | 173 | 121 | 9 | 43 | 82 | 4 | 3 | 36 | 8 | 10 | … | 7 | 6 | 8 |
| 25 years to 30 years | 23,916 | 212 | 133 | 4 | 75 | 97 | 7 | 2 | 64 | 3 | 8 | 1 | 6 | 3 | 3 |
| 30 years to 35 years | 20,202 | 177 | 112 | 9 | 56 | 133 | 4 | 5 | 92 | 4 | 8 | 4 | 3 | 8 | 5 |
| 35 years to 40 years | 20,318 | 228 | 143 | 20 | 65 | 168 | 3 | 5 | 120 | … | 9 | 9 | 4 | 9 | 9 |
| 40 years to 45 years | 20,099 | 239 | 155 | 14 | 70 | 183 | 1 | 8 | 132 | 1 | 3 | 6 | 10 | 10 | 12 |
| 45 years to 50 years | 13,972 | 230 | 151 | 20 | 59 | 159 | 1 | 8 | 105 | … | 4 | 9 | 8 | 15 | 9 |
| 50 years to 55 years | 9,553 | 205 | 127 | 25 | 53 | 114 | … | 1 | 78 | 1 | 6 | 5 | 4 | 13 | 6 |
| 55 years to 60 years | 4,855 | 142 | 96 | 19 | 27 | 84 | … | 7 | 37 | 2 | 6 | 6 | 7 | 13 | 6 |
| 60 years to 65 years | 3,809 | 148 | 99 | 22 | 27 | 59 | 3 | 8 | 19 | … | 3 | 7 | 2 | 11 | 6 |
| 65 years to 70 years | 1,879 | 100 | 68 | 15 | 17 | 54 | 1 | 7 | 16 | 1 | 2 | 6 | 5 | 16 | … |
| 70 years to 75 years | 1,175 | 75 | 59 | 6 | 10 | 46 | … | 10 | 8 | … | 2 | 2 | 3 | 16 | 5 |
| 75 years to 80 years | 581 | 35 | 27 | 7 | 1 | 23 | … | 1 | 2 | … | 3 | 1 | 3 | 10 | 3 |
| 80 and upwards | 322 | 28 | 25 | 3 | … | 21 | … | 4 | 2 | … | 1 | 1 | 1 | 11 | 1 |
| Unspecified | 970 | 9 | 8 | … | 1 | 5 | 1 | … | 2 | … | 1 | … | 1 | … | … |
| FEMALES. | |||||||||||||||
| All Ages | 220,328 | … | … | … | … | 836 | 54 | 59 | 384 | 22 | 82 | 37 | 31 | 108 | 59 |
| 15 years and upwards | 117,318 | 1,046 | 929 | 69 | 48 | … | … | … | … | … | … | … | … | … | … |
| Under 5 years | 40,653 | … | … | … | … | 10 | 2 | 4 | … | 2 | 2 | … | … | … | … |
| 5 years to 10 years | 33,610 | … | … | … | … | 36 | 13 | 1 | 2 | 1 | 6 | 3 | 7 | … | 3 |
| 10 years to 15 years | 28,747 | … | … | … | … | 57 | 11 | 6 | 4 | 7 | 10 | 4 | 5 | 8 | 2 |
| 15 years to 20 years | 21,549 | 105 | 92 | 9 | 4 | 63 | 11 | 2 | 10 | 4 | 15 | … | 7 | 12 | 2 |
| 20 years to 25 years | 19,287 | 105 | 94 | 5 | 6 | 64 | 6 | 2 | 27 | 2 | 11 | … | 2 | 7 | 7 |
| 25 years to 30 years | 16,670 | 118 | 111 | 5 | 2 | 55 | 2 | 1 | 34 | 2 | 7 | … | 1 | 5 | 3 |
| 30 years to 35 years | 14,393 | 103 | 97 | 3 | 3 | 75 | 2 | 4 | 51 | 2 | 8 | 1 | … | 5 | 2 |
| 35 years to 40 years | 13,244 | 110 | 101 | 6 | 3 | 100 | 1 | 3 | 76 | 1 | 3 | 2 | 1 | 9 | 4 |
| 40 years to 45 years | 11,001 | 106 | 90 | 10 | 6 | 90 | 1 | 1 | 67 | … | 7 | 2 | … | 8 | 4 |
| 45 years to 50 years | 7,369 | 83 | 71 | 5 | 7 | 68 | 1 | 1 | 46 | … | 3 | 4 | 1 | 5 | 7 |
| 50 years to 55 years | 5,010 | 69 | 52 | 10 | 7 | 50 | … | 5 | 24 | … | 2 | 5 | 2 | 4 | 8 |
| 55 years to 60 years | 2,965 | 62 | 53 | 8 | 1 | 52 | 2 | 5 | 23 | … | 4 | 4 | 2 | 10 | 2 |
| 60 years to 65 years | 2,530 | 63 | 57 | 2 | 4 | 35 | … | 1 | 13 | … | 1 | 5 | 1 | 9 | 5 |
| 65 years to 70 years | 1,353 | 33 | 30 | 1 | 2 | 25 | … | 3 | 4 | … | 3 | 1 | … | 9 | 5 |
| 70 years to 75 years | 912 | 41 | 36 | 3 | 2 | 19 | 2 | 5 | 3 | … | … | 3 | … | 4 | 2 |
| 75 years to 80 years | 411 | 20 | 19 | … | 1 | 14 | … | 7 | … | … | … | 1 | … | 6 | … |
| 80 and upwards | 262 | 26 | 24 | 2 | … | 20 | … | 8 | … | … | … | 1 | 2 | 7 | 2 |
| Unspecified | 362 | 2 | 2 | … | … | 3 | … | … | … | 1 | … | 1 | … | … | 1 |
Table I. Table I. Showing the Ages, in Quinquennial Periods, and Proportions in every 10,000 Living, of Persons, Males and Females (exclusive of Maoris), of 15 Years of Age and upwards, returned as Sick or Suffering from Accident; and of all Ages returned as Deaf and Dumb, Blind, Lunatics, Idiots, Epileptic, Paralyzed, Crippled and Deformed, Suffering from Debility and Deafness, on the 3rd April, 1881—continued.
| PROPORTIONS PER 10,000 LIVING. | ||||||||||||||
|---|---|---|---|---|---|---|---|---|---|---|---|---|---|---|
| Ages. | Persons. | |||||||||||||
| Sick and Accident, 15 Years and upwards. | Specified Infirmities, all Ages. | |||||||||||||
| Total. | Sick. | Specified Complaints. | Suffering from Accident. | Total. | Deaf and Dumb. | Blind. | Lunatic. | Idiots. | Epileptic. | Paralysis. | Crippled and Deformed | Debility and Infirmity. | Deaf Only. | |
| All ages | … | … | … | … | 46.31 | 2.33 | 2.82 | 22.86 | 1.18 | 3.96 | 2.12 | 2.69 | 5.55 | 2.80 |
| 15 years and upwards | 112.01 | 82.70 | 8.86 | 20.45 | … | … | … | … | … | … | … | … | … | … |
| Under 5 years | … | … | … | … | 2.67 | .61 | .73 | … | .24 | .61 | … | .12 | .36 | … |
| 5 years to 10 years | … | … | … | … | 12.07 | 4.27 | .29 | .74 | .44 | 1.77 | 1.03 | 2.21 | .59 | .73 |
| 10 years to 15 years | … | … | … | … | 22.04 | 3.64 | 1.91 | .74 | 2.43 | 4.69 | 1.22 | 2.6o | 3.12 | .69 |
| 15 years to 20 years | 51.16 | 40.37 | 3.99 | 6.80 | 32.86 | 399 | .94 | 5.63 | 2.58 | 8.22 | .70 | 5.87 | 4.23 | .70 |
| 20 years to 25 years | 07.21 | 51.98 | 3.38 | 11.85 | 35.30 | 2.42 | 1.21 | 15.23 | 2.42 | 5.08 | … | 2.17 | 3.14 | 3.63 |
| 25 years to 30 years | 81.31 | 60.12 | 2.22 | 18.97 | 37.45 | 2.22 | .74 | 24.15 | 1.23 | 3.69 | .25 | 1.72 | 1.97 | 1.48 |
| 30 years to 35 years | 80.94 | 60.41 | 3.47 | 17.06 | 60.12 | 1.73 | 2.60 | 41.34 | 1.73 | 4.62 | 1.45 | .87 | 3.76 | 2.02 |
| 35 years to 40 years | 100.71 | 72.70 | 7.75 | 20.26 | 79.85 | 1.19 | 2.38 | 58.40 | .30 | 3.58 | 3.28 | 1.49 | 5.36 | 3.87 |
| 40 years to 45 years | 110.93 | 78.78 | 7.71 | 24.44 | 87.78 | .64 | 2.89 | 63.99 | .32 | 3.22 | 2.57 | 3.22 | 5.79 | 5.14 |
| 40 years to 45 years | 146.67 | 104.03 | 11.71 | 30.93 | 106.37 | .94 | 4.22 | 70.75 | … | 3.28 | 6.09 | 4.22 | 9.37 | 7.50 |
| 45 years to 50 years | 188.14 | 122.91 | 24.03 | 41.20 | 112.61 | … | 4.12 | 70.04 | .69 | 5.49 | 6.87 | 4.12 | 11.67 | 9.61 |
| 50 years to 55 years | 260.87 | 190.54 | 34.53 | 35.80 | 173.91 | 2.56 | 15.34 | 76.72 | 2.56 | 12.79 | 12.79 | 11.51 | 29.45 | 10.23 |
| 60 years to 65 years | 332.86 | 246.10 | 37.86 | 48.90 | 148.29 | 4.73 | 14.20 | 50.48 | … | 6.31 | 18.93 | 4.73 | 31.55 | 17.36 |
| 65 years to 70 years | 411.51 | 303.22 | 49.50 | 58.79 | 244.43 | 3.10 | 30.94 | 61.88 | 3.09 | 15.47 | 21.66 | 15.47 | 77.35 | 15.47 |
| 70 years to 75 years | 555.82 | 455.20 | 43.12 | 57.50 | 11.45 | 9.58 | 71.87 | 52.71 | … | 9.58 | 23.96 | 14.38 | 95.83 | 33.54 |
| 75 years to 80 years | 554.43 | 463.71 | 70.56 | 20.16 | 72.98 | … | 80.65 | 20.16 | … | 30.24 | 20.l6 | 30.24 | 161.29 | 30.24 |
| 80 and upwards | 924.66 | 839.04 | 85.62 | … | 702.05 | … | 205.48 | 34.25 | … | 17.12 | 34.24 | 51.37 | 308.22 | 51.37 |
| Unspecified | 82.58 | 75.07 | … | 7.51 | 60.06 | 7.51 | … | 15.01 | 7.51 | 7.51 | 7.51 | 7.51 | … | 7.50 |
| MALES. | ||||||||||||||
| All ages | … | … | … | … | 53.15 | 2.23 | 2.93 | 27.30 | 1.34 | 4.15 | 2.48 | 3.75 | 6.08 | 2.89 |
| 15 years and upwards | 128.29 | 85.20 | 10.99 | 32.10 | … | … | … | … | … | … | … | … | … | … |
| Under 5 years | … | … | … | … | 2.88 | .72 | .48 | … | … | .72 | … | .24 | .72 | … |
| 5 years to 10 years | … | … | … | … | 13.41 | 4.66 | .29 | .88 | .58 | 1.75 | .17 | 2.33 | 1.17 | .58 |
| 10 years to 15 years | … | … | … | … | 24.24 | 3.46 | 1.73 | 2.08 | 2.43 | 5.89 | 1.04 | 3.46 | 3.46 | .69 |
| 15 years to 20 years | 53.66 | 37.99 | 3.80 | 11.87 | 36.56 | 2.85 | .95 | 6.65 | 3.32 | 9.50 | 1.42 | 8.55 | 2.85 | .47 |
| 20 years to 25 years | 78.36 | 54.80 | 4.08 | 19.48 | 37.14 | 1.81 | 1.36 | 16.31 | 3.62 | 4.53 | … | 3.17 | 2.72 | 3.62 |
| 25 years to 35 years | 81.80 | 51.32 | 1.54 | 28.94 | 40.56 | 2.93 | .84 | 26.76 | 1.25 | 3.35 | .42 | 2.51 | 1.25 | 1.25 |
| 30 years to 35 years | 87.62 | 55.44 | 4.46 | 27.72 | 65.84 | 1.98 | 2.48 | 45.54 | 1.98 | 3.96 | 1.98 | 1.48 | 3.96 | 2.48 |
| 35 years to 40 years | 112.22 | 70.38 | 9.85 | 31.99 | 82.69 | 1.48 | 2.46 | 59.06 | … | 4.43 | 4.43 | 1.97 | 4.43 | 4.43 |
| 40 years to 45 years | 118.91 | 77.12 | 6.96 | 34.83 | 91.05 | .50 | 3.98 | 65.67 | .50 | 1.49 | 2.98 | 4.98 | 4.98 | 5.97 |
| 45 years to 50 years | 164.61 | 108.07 | 14.31 | 42.23 | 113.80 | .71 | 5.73 | 75.15 | … | 2.86 | 6.44 | 5.73 | 10.74 | 6.44 |
| 50 years to 55 years | 214.59 | 132.94 | 26.17 | 55.48 | 119.33 | … | 1.05 | 81.65 | 1.04 | 6.28 | 5.23 | 4.19 | 13.61 | 6.28 |
| 55 years to 60 years | 292.48 | 197.73 | 39.14 | 55.61 | 173.02 | … | 14.42 | 76.21 | 4.12 | 12.36 | 12.36 | 14.42 | 26.77 | 12.36 |
| 60 years to 65 years | 388.55 | 259.91 | 57.76 | 70.88 | 154.90 | 7.88 | 21.00 | 49.88 | … | 7.88 | 18.38 | 5.25 | 28.88 | 15.75 |
| 65 years to 70 years | 532.20 | 361.90 | 79.83 | 90.47 | 287.39 | 5.32 | 37.26 | 85.15 | 5.32 | 10.65 | 31.93 | 26.61 | 85.15 | … |
| 70 years to 75 years | 638.30 | 502.13 | 51.06 | 85.11 | 391.49 | … | 85.11 | 68.09 | … | 17.02 | 17.02 | 25.53 | 136.17 | 42.55 |
| 75 years to 80 years | 602.41 | 464.72 | 120.48 | 17.21 | 395.87 | … | 17.21 | 34.42 | … | 51.64 | 17.21 | 51.64 | 172.12 | 51.63 |
| 80 and upwards | 869.57 | 776.40 | 93.17 | … | 652.17 | … | 124.22 | 62.11 | … | 31.06 | 31.06 | 31.06 | 341.61 | 31.05 |
| Unspecified | 92.78 | 82.47 | … | 10.31 | 51.54 | 10.31 | … | 20.61 | … | 10.31 | … | 10.31 | … | … |
| FEMALES. | ||||||||||||||
| All ages | … | … | … | … | 37.94 | 2.45 | 2.68 | 17.43 | 1.00 | 3.72 | 1.68 | 1.40 | 4.90 | 2.68 |
| 15 years and upwards | 89.16 | 79.19 | 5.88 | 4.09 | … | … | … | … | … | … | … | … | … | … |
| Under 5 years | … | … | … | … | 2.46 | .49 | .99 | … | .49 | .49 | … | … | … | … |
| 5 years to 10 years | … | … | … | … | 10.71 | 3.87 | .30 | .59 | .30 | 1.79 | .89 | 2.08 | … | .89 |
| 10 years to 15 years | … | … | … | … | 19.83 | 3.83 | 2.09 | 1.39 | 2.43 | 3.48 | 1.39 | 1.74 | 2.78 | .70 |
| 15 years to 20 years | 48.73 | 42.69 | 4.18 | 1.86 | 29.24 | 5.10 | .93 | 4.64 | 1.86 | 6.96 | … | 3.25 | 5.57 | .93 |
| 20 years to 25 years | 54.44 | 48.74 | 2.59 | 3.11 | 33.19 | 3.11 | 1.04 | 14.00 | 1.04 | 5.70 | … | 1.04 | 3.63 | 3.63 |
| 25 years to 30 years | 70.79 | 66.59 | 3.00 | 1.20 | 33.00 | 1.20 | .60 | 20.40 | 1.20 | 4.20 | … | .60 | 3.00 | 1.80 |
| 30 years to 35 years | 71.56 | 67.40 | 2.08 | 2.08 | 52.11 | 1.39 | 2.78 | 35.43 | 1.39 | 5.56 | .70 | … | 3.48 | 1.39 |
| 35 years to 40 years | 83.06 | 76.26 | 4.53 | 2.27 | 75.51 | .76 | 2.27 | 57.38 | .75 | 2.26 | 1.51 | .76 | 6.80 | 3.02 |
| 40 years to 45 years | 96.35 | 81.81 | 9.09 | 5.45 | 81.81 | .91 | .91 | 60.90 | … | 6.36 | 1.82 | … | 7.27 | 3.64 |
| 45 years to 50 years | 112.63 | 96.35 | 6.79 | 9.50 | 92.28 | 1.36 | 1.36 | 62.42 | … | 4.07 | 5.43 | 1.36 | 6.78 | 9.50 |
| 50 years to 55 years | 137.72 | 103.79 | 19.96 | 13.97 | 99.80 | … | 9.98 | 47.91 | … | 3.99 | 9.98 | 3.99 | 7.98 | 15.97 |
| 55 years to 60 years | 209.10 | 178.75 | 26.98 | 3.37 | 175.38 | 6.75 | 16.86 | 77.57 | … | 13.49 | 13.49 | 6.75 | 33.72 | 6.75 |
| 60 years to 65 years | 249.01 | 225.30 | 7.91 | 15.81 | 138.34 | … | 3.95 | 51.39 | … | 3.95 | 19.76 | 3.95 | 35.58 | 19.76 |
| 65 years to 70 years | 243.90 | 221.73 | 7.39 | 14.78 | 184.77 | … | 22.17 | 29.56 | … | 22.17 | 7.39 | … | 66.52 | 36.96 |
| 70 years to 75 years | 449.56 | 394.74 | 32.89 | 21.93 | 205.33 | 21.93 | 54.82 | 32.89 | … | … | 32.90 | … | 43.86 | 21.93 |
| 75 years to 80 years | 486.62 | 462.29 | … | 24.33 | 340.63 | … | 170.32 | … | … | … | 24.33 | … | 145.98 | … |
| 80 and upwards | 992.37 | 916.03 | 76.34 | … | 763.36 | … | 305.34 | … | … | … | 38.17 | 16.34 | 267.17 | 76.34 |
| Unspecified | 55.22 | 55.22 | … | … | 82.87 | … | … | 27.63 | … | … | 27.62 | … | … | 27.62 |
Table II. Table II. Showing the Occupations of Persons, Males, and Females (exclusive of Maoris) of 15 Years of Age and upwards, returned as Sick or Suffering from Accident; and the Occupations, past or present, of the Deaf and Dumb, Blind, Lunatics, Idiots, Epileptics, Paralyzed, Crippled or Deformed, Suffering from Debility or Deafness, of all Ages, on the 3rd April, 1881.
| The sickness of those under 15 years has not been brought out, the instruction to householders on the Census schedule being that, if “unable to follow usual occupation by reason of illness or accident,” the word “Sick” or “Accident” was to be entered. | ||||||||||||||||||||||||||||||||||||
|---|---|---|---|---|---|---|---|---|---|---|---|---|---|---|---|---|---|---|---|---|---|---|---|---|---|---|---|---|---|---|---|---|---|---|---|---|
| Occupations. | 15 Years and upwards. | All Ages. | ||||||||||||||||||||||||||||||||||
| Sick. | Specified Complaints. | Suffering from Accident. | Deaf and Dumb. | Blind. | Lunatics. | Idiots. | Epileptic. | Paralysis. | Crippled and Deformed. | Debility and Infirmity. | Deaf only. | |||||||||||||||||||||||||
| Persons. | Males. | Females. | Persons. | Males. | Females. | Persons. | Males. | Females. | Persons. | Males. | Females. | Persons. | Males. | Females. | Persons. | Males. | Females. | Persons. | Males. | Females. | Persons. | Males. | Females. | Persons. | Males. | Females. | Persons. | Males. | Females. | Persons. | Males. | Females. | Persons. | Males. | Females. | |
| Total | 2,333 | 1,404 | 929 | 250 | 181 | 69 | 577 | 529 | 48 | 114 | 60 | 54 | 138 | 79 | 59 | 1,120 | 736 | 384 | 58 | 36 | 22 | 194 | 112 | 82 | 104 | 67 | 37 | 132 | 101 | 31 | 272 | 164 | 108 | 137 | 78 | 59 |
| CLASS I.—PROFESSIONAL. | ||||||||||||||||||||||||||||||||||||
| Order I.—Persons engaged in the General or Local Governments, or the Defence or Protection of the Country. | ||||||||||||||||||||||||||||||||||||
| Sub-Order 1. Officers of General Government— | ||||||||||||||||||||||||||||||||||||
| Government Officer (other than professional or subordinate) | 3 | 3 | … | … | … | … | 2 | 2 | … | … | … | … | … | … | … | … | … | … | … | … | … | 1 | 1 | … | 1 | 1 | … | … | … | … | … | … | … | … | … | … |
| Architect, Surveyor, Draughtsman | 1 | 1 | … | … | … | … | … | … | … | 1 | 1 | … | … | … | … | … | … | … | … | … | … | … | … | … | … | … | … | … | … | … | … | … | … | … | … | … |
| Subordinate Officer | 3 | 3 | … | … | … | … | … | … | … | … | … | … | … | … | … | … | … | … | … | … | … | … | … | … | … | … | … | 1 | 1 | … | … | … | … | … | … | … |
| Police | 8 | 8 | … | … | … | … | 1 | 1 | … | … | … | … | … | … | … | 1 | 1 | … | … | … | … | … | … | … | … | … | … | … | … | … | … | … | … | … | … | … |
| Penal | 1 | 1 | … | … | … | … | … | … | … | … | … | … | … | … | … | … | … | … | … | … | … | 1 | 1 | … | … | … | … | … | … | … | … | … | … | … | … | … |
| Sub-Order 2. Officers of Local Governments— | ||||||||||||||||||||||||||||||||||||
| Member of Local Council | … | … | … | 1 | 1 | … | … | … | … | … | … | … | … | … | … | … | … | … | … | … | … | … | … | … | … | … | … | … | … | … | 1 | 1 | … | … | … | … |
| Officer of Local Body | … | … | … | … | … | … | 1 | 1 | … | … | … | … | … | … | … | … | … | … | … | … | … | … | … | … | 1 | 1 | … | … | … | … | 1 | 1 | … | … | … | … |
| Sub-Order 3. Defence- | ||||||||||||||||||||||||||||||||||||
| Soldier | … | … | … | … | … | … | … | … | … | … | … | … | 4 | 4 | … | 5 | 5 | … | … | … | … | … | … | … | … | … | … | 1 | 1 | … | … | … | … | 1 | 1 | … |
| Armed Constabulary or Militia Private | … | … | … | … | … | … | 1 | 1 | … | … | … | … | … | … | … | 4 | 4 | … | … | … | … | … | … | … | … | … | … | … | … | … | … | … | … | … | … | … |
| Order II.—Persons engaged in the Learned Professions, or in Literature, Art, and Science (with their immediate Subordinates). | ||||||||||||||||||||||||||||||||||||
| Sub-Order X. Clergymen, Ministers, and Church Officers— | ||||||||||||||||||||||||||||||||||||
| Clergyman | 7 | 7 | … | … | … | … | … | … | … | … | … | … | 1 | 1 | … | … | … | … | … | … | … | … | … | … | 1 | 1 | … | … | … | … | 2 | 2 | … | … | … | … |
| Church Officer | … | … | … | … | … | … | 1 | 1 | … | … | … | … | … | … | … | … | … | … | … | … | … | … | … | … | … | … | … | … | … | … | … | … | … | … | … | … |
| Nun | 1 | … | 1 | … | … | … | … | … | … | … | … | … | … | … | … | … | … | … | … | … | … | … | … | … | … | … | … | … | … | … | … | … | … | … | … | … |
| Sub-Order 2. Law-court Officers, Lawyers, &c.— | ||||||||||||||||||||||||||||||||||||
| Lawyer | 2 | 2 | … | … | … | … | … | … | … | … | … | … | … | … | … | 2 | 2 | … | … | … | … | … | … | … | … | … | … | … | … | … | 2 | 2 | … | … | … | … |
| Law Student | 1 | 1 | … | … | … | … | 1 | 1 | … | … | … | … | … | … | … | … | … | … | … | … | … | … | … | … | 1 | 1 | … | … | … | … | … | … | … | … | … | … |
| Law Clerk | 1 | 1 | … | … | … | … | … | … | … | … | … | … | … | … | … | 1 | 1 | … | … | … | … | … | … | … | … | … | … | … | … | … | … | … | … | … | … | … |
| Sub-Order 3. Physicians, Surgeons, Druggists— | ||||||||||||||||||||||||||||||||||||
| Medical Man | 3 | 3 | … | … | … | … | 2 | 2 | … | … | … | … | … | … | … | 2 | 2 | … | … | … | … | … | … | … | … | … | … | … | … | … | 1 | 1 | … | … | … | … |
| Chemist, Druggist | 1 | 1 | … | 1 | 1 | … | 2 | 2 | … | … | … | … | … | … | … | … | … | … | … | … | … | … | … | … | … | … | … | … | … | … | … | … | … | … | … | … |
| Sub-Order 4. Authors, Literary Persons, &c.— | ||||||||||||||||||||||||||||||||||||
| Others—Interpreter | 1 | 1 | … | 1 | 1 | … | 1 | 1 | … | … | … | … | … | … | … | … | … | … | … | … | … | … | … | … | … | … | … | … | … | … | … | … | … | … | … | … |
Table II. Table II. Showing the Occupations of Persons, Males, and Females (exclusive of Maoris), of 15 Years of Age and upwards, returned as Sick or Suffering from Accident; and the Occupations, past or present, of the Deaf and Dumb, Blind, Lunatics, Idiots, Epileptics, Paralyzed, Crippled or Deformed, Suffering from Debility or Deafness, of All Ages, on the 3rd April, 1881—continued.
| Occupations.2s | 15 Years and upwards. | All Ages. | ||||||||||||||||||||||||||||||||||
|---|---|---|---|---|---|---|---|---|---|---|---|---|---|---|---|---|---|---|---|---|---|---|---|---|---|---|---|---|---|---|---|---|---|---|---|---|
| Sick. | Specified Complaints. | Suffering from Accident. | Deaf and Dumb. | Blind. | Lunatics. | Idiots. | Epileptic. | Paralysis. | Crippled and Deformed. | Debility and Infirmity. | Deaf only. | |||||||||||||||||||||||||
| Persons. | Males. | Females. | Persons. | Males. | Females. | Persons. | Males. | Females. | Persons. | Males. | Females. | Persons. | Males. | Females. | Persons. | Males. | Females. | Persons. | Males. | Females. | Persons. | Males. | Females. | Persons. | Males. | Females. | Persons. | Males. | Females. | Persons. | Males. | Females. | Persons. | Males. | Females. | |
| CLASS I.—PROFESSIONAL—continued. | ||||||||||||||||||||||||||||||||||||
| Order II.—Persons engaged in the Learned Professions, cfc.—continued. | ||||||||||||||||||||||||||||||||||||
| Sub-Order 5. Scientific Persons— | ||||||||||||||||||||||||||||||||||||
| Civil Engineer (not Government) | 3 | 3 | … | 1 | 1 | … | … | … | … | … | … | … | … | … | … | … | … | … | … | … | … | … | … | … | … | … | … | … | … | … | … | … | … | … | … | … |
| Sub-Order 6. Teachers, &c.— | ||||||||||||||||||||||||||||||||||||
| School Master, Mistress | 17 | 11 | 6 | 1 | 1 | … | 2 | 1 | 1 | … | … | … | … | … | … | 3 | 3 | … | … | … | … | 1 | 1 | … | 1 | 1 | … | … | … | … | 2 | 2 | … | … | … | … |
| Tutor, Governess | 1 | … | 1 | … | … | … | … | … | … | … | … | … | … | 3 | … | 3 | … | … | … | … | … | … | … | … | … | … | … | … | … | … | … | … | … | … | … | |
| Others—Teacher of Accomplishments | 1 | 1 | … | … | … | … | … | … | … | … | … | … | … | … | … | … | … | … | … | … | … | … | … | … | … | … | … | … | … | … | … | … | … | … | … | … |
| Sub-Order 7. Fine Arts— | ||||||||||||||||||||||||||||||||||||
| Artist, Painter | … | … | … | … | … | … | 1 | 1 | … | … | … | … | … | … | … | … | … | … | … | … | … | … | … | … | … | … | … | … | … | … | … | … | … | 1 | 1 | … |
| Photographer | … | … | … | … | … | … | 2 | 2 | … | … | … | … | … | … | … | 1 | 1 | … | … | … | … | … | … | … | … | … | … | … | … | … | … | … | … | 2 | 2 | … |
| Sub-Order 8. Musicians, Music Teachers— | ||||||||||||||||||||||||||||||||||||
| Music Master, Mistress | 1 | 1 | … | … | … | … | … | … | … | … | … | … | 1 | 1 | … | 1 | 1 | … | … | … | … | … | … | … | … | … | … | … | … | … | 1 | 1 | … | 1 | … | 1 |
| Musician, Vocalist | … | … | … | … | … | … | … | … | … | … | … | … | … | … | … | … | … | … | … | … | … | 1 | 1 | … | … | … | … | … | … | … | … | … | … | … | … | … |
| Sub-Order 9. Actors, &c.— | ||||||||||||||||||||||||||||||||||||
| Actor, Actress | … | … | … | … | … | … | … | … | … | … | … | … | … | … | … | … | … | … | … | … | … | … | … | … | 1 | 1 | … | … | … | … | … | … | … | … | … | … |
| Others—Billiard Marker | … | … | … | 1 | 1 | … | 1 | 1 | … | 1 | 1 | … | … | … | … | … | … | … | … | … | … | … | … | … | … | … | … | … | … | … | … | … | … | … | … | … |
| CLASS II.—DOMESTIC. | ||||||||||||||||||||||||||||||||||||
| Order III.—Persons engaged in the Domestic Offices or Duties of Wives, Mothers, Mistresses of Families, Children, Relatives, Visitors (not otherwise described). | ||||||||||||||||||||||||||||||||||||
| Sub-Order 1. Wives and Widows— | ||||||||||||||||||||||||||||||||||||
| Wife, Widow | 645 | … | 645 | 49 | … | 49 | 27 | … | 27 | 4 | … | 4 | 27 | … | 27 | 125 | … | 125 | 1 | … | 1 | 26 | … | 26 | 25 | … | 25 | 10 | … | 10 | 60 | … | 60 | 36 | … | 36 |
| Sub-Order 2. Sons, Daughters,Relatives, Visitors: | ||||||||||||||||||||||||||||||||||||
| Son, Daughter, Relative, Visitor (not otherwise described) | 195 | 45 | 150 | 13 | 4 | 9 | 23 | 10 | 13 | 55 | 15 | 40 | 38 | 12 | 56 | 16 | 2 | 14 | 30 | 13 | 17 | 89 | 40 | 49 | 17 | 8 | 9 | 31 | 14 | 17 | 54 | 22 | 32 | 13 | 4 | 9 |
| Sub-Order 3. Students and Scholars— | ||||||||||||||||||||||||||||||||||||
| Scholar at Home | … | … | … | 1 | … | 1 | … | … | … | 8 | … | 8 | 1 | … | 1 | … | … | … | 1 | … | 1 | … | … | … | 3 | 1 | 2 | 1 | 1 | … | 1 | 1 | … | … | … | … |
| Scholar at Public School | 6 | 3 | 3 | … | … | … | 2 | 2 | … | 12 | 12 | … | … | … | … | … | … | … | 3 | 1 | 2 | 10 | 7 | 3 | 3 | 3 | … | 18 | 16 | 2 | 6 | 4 | 2 | 5 | 2 | 3 |
| Scholar at Private School | … | … | … | … | … | … | 1 | 1 | … | 1 | 1 | … | 2 | 1 | 1 | … | … | … | 1 | 1 | … | 1 | … | 1 | 1 | … | 1 | 1 | … | 1 | 2 | 2 | … | … | … | … |
| Order IV.—Persons engaged in Entertaining and Performing Personal Offices for Man. | ||||||||||||||||||||||||||||||||||||
| Sub-Order I. In Board and Lodging— | ||||||||||||||||||||||||||||||||||||
| Hotel-keeper | 10 | 9 | 1 | 1 | 1 | … | 4 | 4 | … | … | … | … | … | … | … | 5 | 4 | 1 | … | … | … | … | … | … | 1 | 1 | … | … | … | … | … | … | … | … | … | … |
| Occupations. | 15 Years and upwards. | All Ages. | ||||||||||||||||||||||||||||||||||
|---|---|---|---|---|---|---|---|---|---|---|---|---|---|---|---|---|---|---|---|---|---|---|---|---|---|---|---|---|---|---|---|---|---|---|---|---|
| Sick. | Specified Complaints. | Suffering from Accident. | Deaf and Dumb. | Blind. | Lunatics. | Idiots. | Epileptic. | Paralysis. | Crippled and Deformed. | Debility and Infirmity. | Deaf only. | |||||||||||||||||||||||||
| Persons. | Males. | Females. | Persons. | Males. | Females. | Persons. | Males. | Females. | Persons. | Males. | Females. | Persons. | Males. | Females. | Persons. | Males. | Females. | Persons. | Males. | Females. | Persons. | Males. | Females. | Persons. | Males. | Females. | Persons. | Males. | Females. | Persons. | Males. | Females. | Persons. | Males. | Females. | |
| Hotel-keeper's Wife | 1 | … | 1 | … | … | … | … | … | … | … | … | … | … | … | … | 1 | … | 1 | … | … | … | … | … | … | … | … | … | … | … | … | … | … | … | … | … | … |
| Boarding, Lodging, House Keeper | 5 | 5 | … | … | … | … | 1 | 1 | … | … | … | … | … | … | … | … | … | … | … | … | … | … | … | … | … | … | … | … | … | … | … | … | … | … | … | … |
| Cook (not Domestic Servant) | 16 | 15 | 1 | 1 | 1 | … | … | … | … | … | … | … | … | … | … | 4 | 1 | 3 | … | … | … | … | … | … | … | … | … | … | … | … | … | … | … | … | … | … |
| Sub-Order 2. In Attendance— | ||||||||||||||||||||||||||||||||||||
| Domestic Servant | 47 | … | 47 | 6 | 2 | 4 | 1 | … | 1 | … | … | … | … | … | … | 95 | … | 95 | … | … | … | 1 | … | 1 | 1 | 1 | … | … | … | … | 5 | 1 | 4 | 3 | … | 3 |
| Housekeeper | 2 | … | 2 | 1 | … | 1 | … | … | … | … | … | … | … | … | … | 1 | … | 1 | … | … | … | … | … | … | … | … | … | … | … | … | … | … | … | … | … | … |
| Inn, Club-house, Eating-house, Servant | 6 | 3 | 3 | 1 | 1 | … | 3 | 2 | 1 | … | … | … | … | … | … | 2 | 2 | … | … | … | … | 1 | 1 | … | … | … | … | … | … | … | … | … | … | … | … | … |
| Charitable Institution Servant | 4 | 3 | 1 | … | … | … | 1 | 1 | … | … | … | … | 1 | 1 | … | … | … | … | … | … | … | … | … | … | … | … | … | … | … | … | … | … | … | … | … | … |
| Nurse (not Domestic Servant, or Servant of Charitable Institution) | 4 | … | 4 | … | … | … | … | … | … | … | … | … | … | … | … | 2 | … | 2 | … | … | … | … | … | … | … | … | … | … | … | … | … | … | … | 1 | … | 1 |
| Others, Caretaker, Watchman | … | … | … | … | … | … | 6 | 6 | … | … | … | … | … | … | … | … | … | … | … | … | … | … | … | … | … | … | … | 1 | 1 | … | … | … | … | … | … | … |
| CLASS III.—COMMERCIAL. | ||||||||||||||||||||||||||||||||||||
| Order V.—Persons who Buy or Sell, Keep or Lend Money, Houses, or Goods of various Kinds. | ||||||||||||||||||||||||||||||||||||
| Sub-Order 1. Mercantile Persons— | ||||||||||||||||||||||||||||||||||||
| Capitalist | … | … | … | … | … | … | 1 | 1 | … | … | … | … | 2 | 2 | … | … | … | … | … | … | … | … | … | … | … | … | … | … | … | … | 2 | 2 | … | … | … | … |
| Merchant | 2 | 2 | … | … | … | … | … | … | … | … | … | … | … | … | … | … | … | … | … | … | … | 1 | 1 | … | … | … | … | … | … | … | … | … | … | … | … | … |
| Auctioneer, Appraiser, Valuer | 2 | 2 | … | … | … | … | … | … | … | … | … | … | … | … | … | … | … | … | … | … | … | … | … | … | … | … | … | … | … | … | … | … | … | … | … | … |
| Commission Agent, Factor | 2 | 2 | … | … | … | … | … | … | … | … | … | … | … | … | … | … | … | … | … | … | … | 1 | 1 | … | … | … | … | … | … | … | … | … | … | 1 | 1 | … |
| Bank Officer, Clerk | 3 | 3 | … | … | … | … | … | … | … | … | … | … | … | … | … | 4 | 4 | … | … | … | … | 1 | 1 | … | … | … | … | … | … | … | … | … | … | … | … | … |
| Share, Stock, Broker | 1 | 1 | … | … | … | … | … | … | … | … | … | … | … | … | … | … | … | … | … | … | … | … | … | … | … | … | … | … | … | … | … | … | … | … | … | … |
| Commercial Clerk | 22 | 22 | … | 1 | 1 | … | 12 | 12 | … | … | … | … | … | … | … | 12 | 12 | … | … | … | … | … | … | … | 2 | 2 | … | 4 | 4 | … | 1 | 1 | … | … | … | … |
| Commercial Traveller, Salesman. | 3 | 3 | … | … | … | … | … | … | … | … | … | … | … | … | … | 1 | 1 | … | … | … | … | … | … | … | … | … | … | … | … | … | … | … | … | … | … | … |
| Sub-Order 2. Other General Dealers— | ||||||||||||||||||||||||||||||||||||
| Shopkeeper (branch unspecified) | 15 | 15 | … | 2 | 2 | … | 7 | 7 | … | … | … | … | … | … | … | 2 | 2 | … | … | … | … | 1 | 1 | … | … | … | … | 1 | 1 | … | 3 | 3 | … | 2 | 2 | … |
| Hawker, Pedlar | 5 | 4 | 1 | … | … | … | … | … | … | … | … | … | 1 | 1 | … | 1 | 1 | … | … | … | … | … | … | … | 2 | 2 | … | … | … | … | … | … | … | … | … | … |
| Other General Dealers, Dealer, Trader, &c. | 3 | 3 | … | 1 | 1 | … | … | … | … | … | … | … | … | … | … | … | … | … | … | … | … | … | … | … | … | … | … | … | … | … | … | … | … | … | … | … |
| Order VI.—Persons engaged in the Conveyance of Men, Animals, Goods', and Messages. | ||||||||||||||||||||||||||||||||||||
| Sub-Order 1. Carriers on Railways— | ||||||||||||||||||||||||||||||||||||
| Railway Officer, Clerk, Stationmaster | 1 | 1 | … | … | … | … | 1 | 1 | … | … | … | … | … | … | … | 1 | 1 | … | … | … | … | … | … | … | … | … | … | … | … | … | … | … | … | … | … | … |
| Railway Engine-driver | 1 | 1 | … | … | … | … | … | … | … | … | … | … | … | … | … | … | … | … | … | … | … | … | … | … | … | … | … | … | … | … | … | … | … | … | … | … |
| Railway Servant | 1 | 1 | … | … | … | … | 7 | 7 | … | … | … | … | … | … | … | … | … | … | … | … | … | … | … | … | 1 | 1 | … | … | … | … | … | … | … | … | … | … |
| Sub-Order 2. Carriers on Roads— | ||||||||||||||||||||||||||||||||||||
| Coach, Omnibus, Cab, Express, Owner | … | … | … | 1 | 1 | … | 2 | 2 | … | … | … | … | … | … | … | … | … | … | … | … | … | … | … | … | … | … | … | … | … | … | 1 | 1 | … | … | … | … |
| Coach, Omnibus, Cab, Driver, Conductor | 2 | 2 | … | … | … | … | 3 | 3 | … | … | … | … | … | … | … | 1 | 1 | … | … | … | … | … | … | … | … | … | … | … | … | … | … | … | … | … | … | … |
| Drayman, Carrier, Express Driver, Carter | 9 | 9 | … | 3 | 3 | … | 15 | 15 | … | … | … | … | … | … | … | 3 | 3 | … | … | … | … | … | … | … | … | … | … | … | … | … | … | … | … | … | … | … |
| Livery Stable Keeper | 1 | 1 | … | … | … | … | … | … | … | … | … | … | … | … | … | … | … | … | … | … | … | … | … | … | … | … | … | … | … | … | … | … | … | … | … | … |
| Toll Keeper, Contractor | … | … | … | 1 | 1 | … | 1 | 1 | … | … | … | … | … | … | … | … | … | … | … | … | … | … | … | … | … | … | … | … | … | … | … | … | … | … | … | … |
| Others, Bridge Keeper | … | … | … | … | … | … | 2 | 2 | … | … | … | … | … | … | … | … | … | … | … | … | … | … | … | … | … | … | … | … | … | … | … | … | … | … | … | … |
| Sub-Order 3. Carriers on Seas and Rivers— | ||||||||||||||||||||||||||||||||||||
| Lighthouse Keeper | 1 | 1 | … | … | … | … | … | … | … | … | … | … | … | … | … | … | … | … | … | … | … | … | … | … | … | … | … | … | … | … | … | … | … | … | … | … |
| Ship Master, Officer, Sailor (Merchant Service) | 50 | 50 | … | … | … | … | 14 | 14 | … | … | … | … | … | … | … | 39 | 39 | … | 1 | 1 | … | 1 | 1 | … | 1 | 1 | … | … | … | … | 4 | 4 | … | 1 | 1 | … |
| Ship Servant, Steward, Stewardess | 1 | 1 | … | … | … | … | … | … | … | … | … | … | … | … | … | 1 | 1 | … | … | … | … | … | … | … | … | … | … | … | … | … | … | … | … | … | … | … |
| Waterman, Boatman, &c. | 2 | 2 | … | 1 | 1 | … | 3 | 3 | … | … | … | … | 1 | 1 | … | 1 | 1 | … | … | … | … | … | … | … | … | … | … | … | … | … | … | … | … | … | … | … |
| Others, Ferryman, Signalman, Wharf-labourer | … | … | … | … | … | … | 1 | 1 | … | … | … | … | … | … | … | … | … | … | … | … | … | … | … | … | 1 | 1 | … | … | … | … | … | … | … | 1 | 1 | … |
| Sub-Order 4. Engaged in Storage— | ||||||||||||||||||||||||||||||||||||
| Storekeeper (not Shopkeeper) | … | … | … | … | … | … | … | … | … | … | … | … | 1 | 1 | … | … | … | … | … | … | … | … | … | … | … | … | … | … | … | … | … | … | … | … | … | … |
| Storeman (not Shopman) | 8 | 8 | … | 2 | 2 | … | 3 | 3 | … | … | … | … | … | … | … | … | … | … | … | … | … | … | … | … | … | … | … | … | … | … | 2 | 2 | … | … | … | … |
Table II. Table II. Showing the Occupations of Persons, Males, and Females (exclusive of Maoris), of 15 Years of Age and upwards, returned as Sick or Suffering from Accident; and the Occupations, past or present, of the Deaf and Dumb, Blind, Lunatics, Idiots, Epileptics, Paralyzed, Crippled or Deformed, Suffering from Debility or Deafness, of all Ages, on the 3rd April, 1881—continued.
| Occupations. | 15 Years and upwards. | All Ages. | ||||||||||||||||||||||||||||||||||
|---|---|---|---|---|---|---|---|---|---|---|---|---|---|---|---|---|---|---|---|---|---|---|---|---|---|---|---|---|---|---|---|---|---|---|---|---|
| Sick. | Specified Complaints. | Suffering from Accident. | Deaf and Dumb. | Blind. | Lunatics. | Idiots. | Epileptic. | Paralysis. | Crippled and Deformed. | Debility and Infirmity. | Deaf only. | |||||||||||||||||||||||||
| Persons. | Males. | Females. | Persons. | Males. | Females. | Persons. | Males. | Females. | Persons. | Males. | Females. | Persons. | Males. | Females. | Persons. | Males. | Females. | Persons. | Males. | Females. | Persons. | Males. | Females. | Persons. | Males. | Females. | Persons. | Males. | Females. | Persons. | Males. | Females. | Persons. | Males. | Females. | |
| CLASS III.—COMMERCIAL—continued, | ||||||||||||||||||||||||||||||||||||
| Order VI.—Persons engaged in the Conveyance ofMen, &c.—continued. | ||||||||||||||||||||||||||||||||||||
| Others, Packer, Servant to Storekeeper | … | … | … | … | … | … | … | … | … | … | … | … | … | … | … | 1 | 1 | … | … | … | … | … | … | … | … | … | … | … | … | … | … | … | … | … | … | … |
| Sub-Order 5. Messengers and Porters— | ||||||||||||||||||||||||||||||||||||
| Messenger, Porter (not Government or Railway) | 4 | 4 | … | 1 | 1 | … | 2 | 2 | … | … | … | … | … | … | … | 1 | 1 | … | … | … | … | … | … | … | … | … | … | … | … | … | … | … | … | … | … | … |
| Errand Boy, Girl | 1 | 1 | … | … | … | … | … | … | … | … | … | … | … | … | … | … | … | … | … | … | … | … | … | … | … | … | … | 1 | 1 | … | … | … | … | … | … | … |
| Telegraph Service | 6 | 6 | … | … | … | … | … | … | … | … | … | … | … | … | … | … | … | … | … | … | … | 1 | 1 | … | … | … | … | … | … | … | … | … | … | … | … | … |
| CLASS IV.—AGRICULTURAL. | ||||||||||||||||||||||||||||||||||||
| Order VII.—Persons Possessing, Working, or Cultivating Land, Raising or Dealing in Animals, or following Pursuits subsidiary thereto. | ||||||||||||||||||||||||||||||||||||
| Sub-Order 1. Engaged in Agricultural Pursuits— | ||||||||||||||||||||||||||||||||||||
| Farmer, Market Gardener | 129 | 128 | 1 | 23 | 33 | … | 70 | 70 | … | 2 | 2 | … | 7 | 7 | … | 50 | 49 | 1 | 1 | 1 | … | 8 | 8 | … | 4 | 4 | … | 10 | 10 | … | 14 | 14 | … | 10 | 10 | … |
| Farmer's Relative (over 15 years) | 19 | 19 | … | … | … | … | 8 | 8 | … | 5 | 5 | … | 2 | 2 | … | … | … | … | … | … | … | 6 | 6 | … | 1 | 1 | … | … | … | … | 1 | 1 | … | 1 | 1 | … |
| Farm Bailiff, Overseer | 1 | 1 | … | … | … | … | … | … | … | … | … | … | … | … | … | … | … | … | … | … | … | … | … | … | … | … | … | … | … | … | … | … | … | … | … | … |
| Farm Servant and Labourer | 90 | 89 | 1 | 5 | 5 | … | 29 | 29 | … | 2 | 2 | … | 3 | 3 | … | 4 | 4 | … | 1 | 1 | … | 2 | 2 | … | 5 | 5 | … | 3 | 3 | … | … | … | … | 3 | 3 | … |
| Gardener (not Domestic Servant) | 26 | 26 | … | 6 | 6 | … | 9 | 9 | … | … | … | … | 2 | 2 | … | 4 | 4 | … | … | … | … | … | … | … | 2 | 2 | … | 3 | 3 | … | 6 | 6 | … | 3 | 3 | … |
| Others, Planters, Farm Contractor | 2 | 2 | … | … | … | … | 1 | 1 | … | … | … | … | … | … | … | … | … | … | … | … | … | … | … | … | … | … | … | … | … | … | … | … | … | … | … | … |
| Sub-Order 2. Engaged in Pastoral Pursuits— | ||||||||||||||||||||||||||||||||||||
| Runholder, Grazier, Sheep or Cattle Farmer | 5 | 5 | … | … | … | … | 1 | 1 | … | … | … | … | … | … | … | … | … | … | … | … | … | … | … | … | … | … | … | … | … | … | … | … | … | 1 | 1 | … |
| Runholder's Relative (over 15 years of age) | 1 | 1 | … | … | … | … | … | … | … | … | … | … | … | … | … | … | … | … | … | … | … | … | … | … | … | … | … | … | … | … | … | … | … | … | … | … |
| Station Overseer, Superintendent | … | … | … | … | … | … | 1 | 1 | … | … | … | … | … | … | … | … | … | … | … | … | … | … | … | … | … | … | … | … | … | … | … | … | … | … | … | … |
| Station or Grazing Farm Servant, Labourer. | 10 | 10 | … | 2 | 2 | … | 1 | 1 | … | … | … | … | … | … | … | 14 | 14 | … | … | … | … | … | … | … | … | … | … | … | … | … | … | … | … | … | … | … |
| Sub-Order 3. Engaged on Land (not cultivating or grazing)— | ||||||||||||||||||||||||||||||||||||
| Landowner | 6 | 6 | … | … | … | … | 4 | 4 | … | … | … | … | … | … | … | 1 | 1 | … | … | … | … | … | … | … | … | … | … | … | … | … | 3 | 3 | … | 2 | 2 | … |
| Land Agent | … | … | … | … | … | … | … | … | … | … | … | … | … | … | … | 1 | 1 | … | … | … | … | … | … | … | … | … | … | … | … | … | … | … | … | … | … | … |
| Land Surveyor (not Government) | 3 | 3 | … | 1 | 1 | … | … | … | … | … | … | … | 1 | 1 | … | … | … | … | … | … | … | … | … | … | … | … | … | … | … | … | … | … | … | … | … | … |
| Agricultural Implement Owner, Worker | … | … | … | … | … | … | 1 | 1 | … | … | … | … | … | … | … | … | … | … | … | … | … | … | … | … | … | … | … | … | … | … | … | … | … | … | … | … |
| Grubber, Bushman | 25 | 25 | … | 2 | 2 | … | 9 | 9 | … | 1 | 1 | … | … | … | … | 9 | 9 | … | … | … | … | … | … | … | … | … | … | … | … | … | 2 | 2 | … | 5 | 5 | … |
| Survey Labourer | … | … | … | … | … | … | 2 | 2 | … | … | … | … | … | … | … | … | … | … | … | … | … | … | … | … | … | … | … | … | … | … | … | … | … | … | … | … |
| Sub-Order 4. Engaged on Animals— | ||||||||||||||||||||||||||||||||||||
| Veterinary Surgeon, Farrier | 1 | 1 | … | 1 | 1 | … | 1 | 1 | … | … | … | … | … | … | … | … | … | … | … | … | … | … | … | … | … | … | … | … | … | … | 1 | 1 | … | … | … | … |
| Occupations. | 15 Years and upwards. | All Ages. | ||||||||||||||||||||||||||||||||||
|---|---|---|---|---|---|---|---|---|---|---|---|---|---|---|---|---|---|---|---|---|---|---|---|---|---|---|---|---|---|---|---|---|---|---|---|---|
| Sick. | Specified Complaints. | Suffering from Accident. | Deaf and Dumb. | Blind. | Lunatics. | Idiots. | Epileptic. | Paralysis. | Crippled and Deformed. | Debility and Infirmity. | Deaf only. | |||||||||||||||||||||||||
| Persons. | Males. | Females. | Persons. | Males. | Females. | Persons. | Males. | Females. | Persons. | Males. | Females. | Persons. | Males. | Females. | Persons. | Males. | Females. | Persons. | Males. | Females. | Persons. | Males. | Females. | Persons. | Males. | Females. | Persons. | Males. | Females. | Persons. | Males. | Females. | Persons. | Males. | Females. | |
| Groom, Jockey, Horsebreaker (not Domestic Servant) | 8 | 8 | … | … | … | … | 4 | 4 | … | … | … | … | … | … | … | 2 | 2 | … | … | … | … | … | … | … | … | … | … | 1 | 1 | … | … | … | … | … | … | … |
| Cattle Dealer | 1 | 1 | … | … | … | … | … | … | … | … | … | … | … | … | … | 1 | 1 | … | … | … | … | … | … | … | … | … | … | … | … | … | … | … | … | … | … | … |
| Rabbit Catcher, Killer | 6 | 6 | … | … | … | … | … | … | … | … | … | … | … | … | … | 1 | 1 | … | … | … | … | … | … | … | … | … | … | … | … | … | … | … | … | 1 | 1 | … |
| Fisherman | 8 | 8 | … | … | … | … | … | … | … | … | … | … | … | … | … | … | … | … | 1 | 1 | … | … | … | … | 1 | 1 | … | 1 | 1 | … | … | … | … | … | … | … |
| Others, Bee Farmer | 1 | 1 | … | … | … | … | … | … | … | … | … | … | … | … | … | … | … | … | … | … | … | … | … | … | … | … | … | … | … | … | 1 | 1 | … | … | … | … |
| CLASS V.—INDUSTRIAL. | ||||||||||||||||||||||||||||||||||||
| Order VIII.—Persons engaged in Working and Dealing in Art and. Mechanic Productions in which Matters of various Kinds are employed in combination. | ||||||||||||||||||||||||||||||||||||
| Sub-Order 1. In Books— | ||||||||||||||||||||||||||||||||||||
| Bookseller | … | … | … | … | … | … | … | … | … | … | … | … | … | … | … | … | … | … | … | … | … | … | … | … | … | … | … | 1 | 1 | … | … | … | … | … | … | … |
| Bookbinder | … | … | … | 1 | 1 | … | … | … | … | … | … | … | … | … | … | … | … | … | … | … | … | … | … | … | … | … | … | … | … | … | … | … | … | 1 | … | 1 |
| Printer, Compositor | 9 | 9 | … | 3 | 3 | … | 1 | 1 | … | … | … | … | … | … | … | 5 | 5 | … | … | … | … | … | … | … | 1 | 1 | … | … | … | … | … | … | … | 2 | 2 | … |
| Newspaper Proprietor, Editor | … | … | … | … | … | … | … | … | … | … | … | … | … | … | … | 1 | 1 | … | … | … | … | … | … | … | … | … | … | … | … | … | … | … | … | … | … | … |
| Others, Proof Reader, News Vendor, News Agent | … | … | … | 1 | 1 | … | 2 | 2 | … | … | … | … | … | … | … | … | … | … | … | … | … | … | … | … | … | … | … | … | … | … | … | … | … | … | … | … |
| Sub-Order 3. In Prints and Pictures— | ||||||||||||||||||||||||||||||||||||
| Lithographer, Lithographic Printer | … | … | … | … | … | … | 1 | 1 | … | … | … | … | … | … | … | … | … | … | … | … | … | … | … | … | … | … | … | … | … | … | … | … | … | … | … | … |
| Sub-Order 4. In Carving and Figures— | ||||||||||||||||||||||||||||||||||||
| Stone-carver | … | … | … | 1 | 1 | … | … | … | … | … | … | … | … | … | … | … | … | … | … | … | … | … | … | … | … | … | … | … | … | … | … | … | … | … | … | … |
| Sub-Order 6. In Watches and Philosophical Instruments— | ||||||||||||||||||||||||||||||||||||
| Watch, Clock, Maker | 2 | 2 | … | 1 | 1 | … | 1 | 1 | … | … | … | … | … | … | … | 3 | 3 | … | … | … | … | … | … | … | … | … | … | … | … | … | … | … | … | … | … | … |
| Sub-Order 8. In Arms — | ||||||||||||||||||||||||||||||||||||
| Gunsmith | 1 | 1 | … | … | … | … | … | … | … | … | … | … | … | … | … | … | … | … | … | … | … | … | … | … | … | … | … | … | … | … | … | … | … | … | … | … |
| Sub-Order 9. In Machines and Tools— | ||||||||||||||||||||||||||||||||||||
| Engine, Machine, Maker, Dealer | 11 | 11 | … | … | … | … | 4 | 4 | … | … | … | … | … | … | … | 1 | 1 | … | … | … | … | … | … | … | 1 | 1 | … | … | … | … | … | … | … | 1 | 1 | … |
| Sub-Order 10. In Carriages, Harness, and Implements— | ||||||||||||||||||||||||||||||||||||
| Coach Maker, Dealer | … | … | … | … | … | … | 1 | 1 | … | … | … | … | … | … | … | 1 | 1 | … | … | … | … | … | … | … | … | … | … | … | … | … | … | … | … | … | … | … |
| Saddler, Harness Maker, Dealer | 5 | 5 | … | … | … | … | 4 | 4 | … | 2 | 2 | … | … | … | … | 2 | 2 | … | … | … | … | … | … | … | … | … | … | … | … | … | … | … | … | … | … | … |
| Wheelwright | 1 | 1 | … | … | … | … | 1 | 1 | … | … | … | … | … | … | … | … | … | … | … | … | … | … | … | … | 1 | 1 | … | … | … | … | … | … | … | … | … | … |
| Millwright | 1 | 1 | … | … | … | … | … | … | … | … | … | … | … | … | … | … | … | … | … | … | … | … | … | … | … | … | … | … | … | … | … | … | … | … | … | … |
| Sub-Order 11. In Ships and Boats— | ||||||||||||||||||||||||||||||||||||
| Shipbuilder, Shipwright | 8 | 8 | … | 1 | 1 | … | 3 | 3 | … | … | … | … | … | … | … | 1 | 1 | … | … | … | … | … | … | … | … | … | … | … | … | … | 2 | 2 | … | … | … | … |
| Boatbuilder | … | … | … | 1 | 1 | … | … | … | … | … | … | … | … | … | … | 1 | 1 | … | … | … | … | … | … | … | … | … | … | … | … | … | … | … | … | … | … | … |
| Sailmaker | 1 | 1 | … | … | … | … | 3 | 3 | … | … | … | … | … | … | … | … | … | … | … | … | … | … | … | … | … | … | … | 1 | 1 | … | … | … | … | … | … | … |
| Sub-Order 12. In Houses and Buildings— | ||||||||||||||||||||||||||||||||||||
| House Owner | 5 | 5 | … | 1 | 1 | … | 2 | 2 | … | … | … | … | 1 | 1 | … | … | … | … | … | … | … | … | … | … | … | … | … | … | … | … | … | … | … | … | … | … |
| House Agent | … | … | … | … | … | … | … | … | … | … | … | … | … | … | … | 1 | 1 | … | … | … | … | … | … | … | … | … | … | … | … | … | … | … | … | … | … | … |
| Architect | 1 | 1 | … | … | … | … | … | … | … | … | … | … | … | … | … | … | … | … | … | … | … | … | … | … | … | … | … | … | … | … | … | … | … | 1 | 1 | … |
| Builder | 4 | 4 | … | 3 | 3 | … | 2 | 2 | … | … | … | … | … | … | … | … | … | … | … | … | … | … | … | … | … | … | … | … | … | … | … | … | … | 1 | 1 | … |
| Carpenter, Joiner | 70 | 70 | … | 7 | 7 | … | 22 | 22 | … | 2 | 2 | … | … | … | … | 22 | 22 | … | … | … | … | … | … | … | 1 | 1 | … | … | … | … | 6 | 6 | … | 6 | 6 | … |
| Bricklayer | 7 | 7 | … | 1 | 1 | … | 3 | 3 | … | … | … | … | … | … | … | 3 | 3 | … | … | … | … | 1 | … | … | … | … | … | 1 | 1 | … | … | … | … | … | … | … |
| Mason, Pavior | 6 | 6 | … | … | … | … | 1 | 1 | … | … | … | … | … | … | … | 2 | 2 | … | … | … | … | … | … | … | … | … | … | … | … | … | 1 | 1 | … | … | … | … |
| Plasterer | 4 | 4 | … | … | … | … | … | … | … | … | … | … | … | … | … | … | … | … | … | … | … | … | … | … | … | … | … | … | … | … | 1 | 1 | … | … | … | … |
| Painter, Plumber, Glazier | 22 | 22 | … | … | … | … | 5 | 5 | … | … | … | … | … | … | … | 2 | 2 | … | … | … | … | 1 | … | … | … | … | … | 1 | 1 | … | … | … | … | … | … | … |
| Contractor for Buildings | 3 | 3 | … | … | … | … | … | … | … | … | … | … | … | … | … | … | … | … | … | … | … | … | … | … | … | … | … | … | … | … | … | … | … | … | … | … |
| Sub-Order 13. In Furniture— | ||||||||||||||||||||||||||||||||||||
| Furniture Maker, Cabinet Maker, Upholsterer | 4 | 4 | … | 1 | 1 | … | 2 | 2 | … | 1 | 1 | … | … | … | … | 3 | 3 | … | … | … | … | … | … | … | 1 | 1 | … | … | … | … | 4 | 4 | … | 3 | 3 | … |
| Carver, Gilder, Mattrass Maker | … | … | … | … | … | … | … | … | … | … | … | … | … | … | … | … | … | … | … | … | … | 1 | 1 | … | … | … | … | … | … | … | … | … | … | … | … | … |
| Undertaker | 1 | 1 | … | … | … | … | … | … | … | … | … | … | … | … | … | … | … | … | … | … | … | … | … | … | … | … | … | … | … | … | … | … | … | … | … | … |
Table II. Table II. Showing the Occupations of Persons, Males, and Females (exclusive of Maoris), of 15 Years of Age and upwards, returned as Sick, or Suffering from Accident; and the Occupations, past or present, of the Deaf and Dumb, Blind, Lunatics, Idiots, Epileptics, Paralyzed, Crippled or Deformed, Suffering from Debility or Deafness, of all Ages, on the 3rd April, 1881— continued.
| Occupations. | 15 Years and upwards. | All Ages. | ||||||||||||||||||||||||||||||||||
|---|---|---|---|---|---|---|---|---|---|---|---|---|---|---|---|---|---|---|---|---|---|---|---|---|---|---|---|---|---|---|---|---|---|---|---|---|
| Sick. | Specified Complaints. | Suffering from Accident. | Deaf and Dumb. | Blind. | Lunatics. | Idiots. | Epileptic. | Paralysis. | Crippled and Deformed. | Debility and Infirmity. | Deaf only. | |||||||||||||||||||||||||
| Persons. | Males. | Females. | Persons. | Males. | Females. | Persons. | Males. | Females. | Persons. | Males. | Females. | Persons. | Males. | Females. | Persons. | Males. | Females. | Persons. | Males. | Females. | Persons. | Males. | Females. | Persons. | Males. | Females. | Persons. | Males. | Females. | Persons. | Males. | Females. | Persons. | Males. | Females. | |
| CLASS V.—INDUSTRIAL—continued. | ||||||||||||||||||||||||||||||||||||
| Order IX.—Persons Working and Dealing in Textile Fabrics, in Dress, and in Fibrous Materials. | ||||||||||||||||||||||||||||||||||||
| Sub-Order I. In Textile Fabrics— | ||||||||||||||||||||||||||||||||||||
| Draper, Linen Draper, Mercer, and Assistant | 7 | 7 | … | 1 | 1 | … | 2 | 2 | … | … | … | … | … | … | … | 3 | 3 | … | … | … | … | … | … | … | 1 | 1 | … | … | … | … | … | … | … | … | … | … |
| Woolstapler | 1 | 1 | … | … | … | … | … | … | … | … | … | … | … | … | … | … | … | … | … | … | … | 1 | 1 | … | … | … | … | … | … | … | … | … | … | … | … | … |
| Woollen Dealer | 3 | 1 | 2 | … | … | … | … | … | … | … | … | 1 | … | … | … | … | … | … | … | … | … | … | … | … | … | … | … | … | … | … | … | … | … | … | … | … |
| Sub-Order 2. In Dress— | ||||||||||||||||||||||||||||||||||||
| Hairdresser, Wigmaker | 1 | 1 | … | … | … | … | 2 | 2 | … | 1 | 1 | … | … | … | … | … | … | … | … | … | … | … | … | … | … | … | … | … | … | … | … | … | … | … | … | … |
| Tailor | 15 | 14 | 1 | … | … | … | 2 | 2 | … | 2 | 1 | 1 | … | … | … | 6 | 4 | 2 | … | … | … | … | … | … | … | … | … | 1 | 1 | … | 5 | 1 | … | … | … | … |
| Outfitter | 1 | 1 | … | … | … | … | … | … | … | … | … | … | … | … | … | … | … | … | … | … | … | … | … | … | … | … | … | … | … | … | … | … | … | … | … | … |
| Milliner, Dressmaker | 19 | … | 19 | 1 | … | 1 | 3 | … | 3 | … | … | … | … | … | … | 3 | … | 3 | … | … | … | … | … | … | … | … | … | … | … | … | 1 | … | 1 | 4 | … | 4 |
| Shirtmaker, Seamstress | 2 | … | 2 | … | … | … | 1 | 1 | … | … | … | … | … | … | … | … | … | … | … | … | … | 1 | … | 1 | … | … | … | 1 | … | 1 | 1 | … | 1 | 2 | 1 | 1 |
| Machinist, Sewing Machinist (not otherwise described) | 1 | … | 1 | … | … | … | 1 | 1 | … | … | … | … | … | … | … | … | … | … | … | … | … | … | … | … | … | … | … | … | … | … | 1 | … | 1 | … | … | … |
| Shoe, Boot, Maker, Dealer | 20 | 19 | 1 | 4 | 4 | … | 6 | 6 | … | 3 | 2 | 1 | 1 | 1 | … | 9 | 9 | … | … | … | … | 3 | 3 | … | … | … | … | 3 | 3 | … | 1 | 1 | … | 3 | 3 | … |
| Washerwoman, Laundryman | 5 | … | 5 | … | … | … | 1 | … | 1 | … | … | … | … | … | … | 3 | … | 3 | … | … | … | … | … | … | 1 | 1 | … | … | … | … | … | … | … | … | … | … |
| Lacemaker, Knitter | … | … | … | 2 | … | 2 | … | … | … | … | … | … | 1 | … | 1 | … | … | … | … | … | … | … | … | … | … | … | … | … | … | … | … | … | … | … | … | … |
| Others, Button-maker | 1 | 1 | … | … | … | … | … | … | … | … | … | … | … | … | … | … | … | … | … | … | … | … | … | … | … | … | … | … | … | … | … | … | … | … | … | … |
| Sub-Order 3. In Fibrous Materials— | ||||||||||||||||||||||||||||||||||||
| Mat-maker | 1 | 1 | … | … | … | … | … | … | … | … | … | … | … | … | … | … | … | … | … | … | … | 1 | 1 | … | … | … | … | … | … | … | … | … | … | … | … | … |
| Tent, Tarpaulin, Maker, Dealer | 1 | 1 | … | … | … | … | … | … | … | … | … | … | … | … | … | … | … | … | … | … | … | … | … | … | … | … | … | … | … | … | … | … | … | … | … | … |
| Order X.—Persons Working and Dealing in Food and Drinks. | ||||||||||||||||||||||||||||||||||||
| Sub-Order 1. In Animal Food— | ||||||||||||||||||||||||||||||||||||
| Dairy Man, Woman, Milkseller | 3 | 2 | 1 | 1 | 1 | … | … | … | … | … | … | … | … | … | … | 2 | 2 | … | … | … | … | … | … | … | … | … | … | … | … | … | … | … | … | … | … | … |
| Butcher | 22 | 22 | … | 2 | 2 | … | 3 | 3 | … | … | … | … | … | … | … | … | … | … | … | … | … | … | … | … | … | … | … | 1 | 1 | … | 1 | 1 | … | … | … | … |
| Fishmonger | … | … | … | … | … | … | 1 | 1 | … | … | … | … | … | … | … | … | … | … | … | … | … | … | … | … | … | … | … | … | … | … | … | … | … | … | … | … |
| Provision Curer, Dealer, Tripe-dresser | … | … | … | … | … | … | 1 | 1 | … | … | … | … | … | … | … | 1 | 1 | … | … | … | … | … | … | … | … | … | … | … | … | … | … | … | … | … | … | … |
| Others, Butcher's Clerk | … | … | … | 1 | 1 | … | … | … | … | … | … | … | … | … | … | … | … | … | … | … | … | … | … | … | … | … | … | … | … | … | … | … | … | … | … | … |
| Sub-Order 2. In Vegetable Food- | ||||||||||||||||||||||||||||||||||||
| Corn, Flour Merchants | … | … | … | … | … | … | 2 | 2 | … | … | … | … | … | … | … | … | … | … | … | … | … | … | … | … | … | … | … | … | … | … | … | … | … | … | … | … |
| Miller | … | … | … | … | … | … | 3 | 3 | … | … | … | … | … | … | … | 1 | 1 | … | … | … | … | … | … | … | … | … | … | … | … | … | … | … | … | … | … | … |
| Baker | 6 | 6 | … | 2 | 2 | … | 8 | 8 | … | … | … | … | … | … | … | 6 | 6 | … | … | … | … | 1 | 1 | … | 1 | 1 | … | … | … | … | … | … | … | … | … | … |
| Confectioner, Pastry-cook | … | … | … | … | … | … | … | … | … | … | … | … | … | … | … | 1 | 1 | … | … | … | … | … | … | … | … | … | … | … | … | … | … | … | … | … | … | … |
| Greengrocer, Fruiterer | 1 | 1 | … | 1 | 1 | … | 1 | … | … | … | … | … | … | … | … | … | … | … | … | … | … | … | … | … | … | … | … | … | … | … | … | … | … | … | … | … |
| Occupations. | 15 Years and upwards. | All Ages. | ||||||||||||||||||||||||||||||||||
|---|---|---|---|---|---|---|---|---|---|---|---|---|---|---|---|---|---|---|---|---|---|---|---|---|---|---|---|---|---|---|---|---|---|---|---|---|
| Sick. | Specified Complaints. | Suffering from Accident. | Deaf and Dumb. | Blind. | Lunatics. | Idiots. | Epileptic. | Paralysis. | Crippled and Deformed. | Debility and Infirmity. | Deaf only. | |||||||||||||||||||||||||
| Persons. | Males. | Females. | Persons. | Males. | Females. | Persons. | Males. | Females. | Persons. | Males. | Females. | Persons. | Males. | Females. | Persons. | Males. | Females. | Persons. | Males. | Females. | Persons. | Males. | Females. | Persons. | Males. | Females. | Persons. | Males. | Females. | Persons. | Males. | Females. | Persons. | Males. | Females. | |
| Seed Merchant, Dealer | … | … | … | … | … | … | … | … | … | … | … | … | … | … | … | 1 | 1 | … | … | … | … | … | … | … | … | … | … | … | … | … | … | … | … | … | … | … |
| Others, Herbalist | … | … | … | … | … | … | 1 | 1 | … | … | … | … | … | … | … | … | … | … | … | … | … | … | … | … | … | … | … | … | … | … | … | … | … | … | … | … |
| Sub-Order 3. In Drinks and Stimulants— | ||||||||||||||||||||||||||||||||||||
| Brewer and others engaged in Brewing | 2 | 2 | … | 1 | 1 | … | … | … | … | … | … | … | … | … | … | … | … | … | … | … | … | … | … | … | … | … | … | … | … | … | 1 | 1 | … | … | … | … |
| Maltster | 1 | 1 | … | … | … | … | … | … | … | … | … | … | … | … | … | … | … | … | … | … | … | … | … | … | … | … | … | … | … | … | … | … | … | … | … | … |
| Wine and Spirit Merchant | … | … | … | … | … | … | 1 | 1 | … | … | … | … | … | … | … | … | 1 | 1 | … | … | … | … | … | … | … | … | … | … | … | … | … | … | … | … | … | … |
| Aerated Waters, Cordial Manufacturer | 1 | 1 | … | … | … | … | 3 | 3 | … | … | … | … | … | … | … | … | … | … | … | … | … | … | … | … | … | … | … | … | … | … | … | … | … | … | … | … |
| Grocer, Tea Dealer | 7 | 7 | … | 1 | 1 | … | 1 | 1 | … | … | … | … | … | … | … | … | … | … | … | … | … | … | … | … | … | … | … | … | … | … | … | … | … | … | … | … |
| Tobacconist | … | … | … | … | … | … | … | … | … | … | … | … | … | … | … | … | … | … | … | … | … | … | … | … | … | … | … | 1 | 1 | … | … | … | … | … | … | … |
| Bottler | … | … | … | … | … | … | … | … | … | … | … | … | … | … | … | … | … | … | … | … | … | … | … | … | … | … | … | 1 | 1 | … | … | … | … | … | … | … |
| Sugar Boiler | … | … | … | … | … | … | … | … | … | … | … | … | 1 | 1 | … | … | … | … | … | … | … | … | … | … | … | … | … | … | … | … | … | … | … | … | … | … |
| Order XI.—Persons Working and Dealing in Animal and Vegetable Substances. | ||||||||||||||||||||||||||||||||||||
| Sub-Order 1. In Animal Matters— | ||||||||||||||||||||||||||||||||||||
| Tallow Chandler | … | … | … | … | … | … | … | … | … | … | … | … | … | … | … | … | … | … | … | … | … | … | … | … | … | … | … | … | … | … | … | … | … | 1 | 1 | … |
| Fellmonger | 3 | 3 | … | … | … | … | … | … | … | … | … | … | … | … | … | … | … | … | … | … | … | … | … | … | … | … | … | … | … | … | … | … | … | … | … | … |
| Currier | 1 | 1 | … | … | … | … | … | … | … | … | … | … | … | … | … | … | … | … | … | … | … | … | … | … | … | … | … | … | … | … | … | … | … | … | … | … |
| Tanner | … | … | … | … | … | … | 1 | 1 | … | … | … | … | … | … | … | … | … | … | … | … | … | … | … | … | … | … | … | … | … | … | … | … | … | … | … | … |
| Hairbrush, Broom, Maker | 1 | 1 | … | … | … | … | … | … | … | … | … | … | … | … | … | … | … | … | … | … | … | … | … | … | … | … | … | … | … | … | … | … | … | … | … | … |
| Others, Portmanteau Maker | 1 | 1 | … | … | … | … | … | … | … | … | … | … | … | … | … | … | … | … | … | … | … | … | … | … | … | … | … | … | … | … | … | … | … | … | … | … |
| Sub-Order 2. In Vegetable Matters— | ||||||||||||||||||||||||||||||||||||
| Oil and Colour Man | … | … | … | … | … | … | … | … | … | … | … | … | 1 | 1 | … | … | … | … | … | … | … | … | … | … | 1 | 1 | … | … | … | … | … | … | … | … | … | … |
| French Polisher | … | … | … | … | … | … | … | … | … | … | … | … | … | … | … | … | … | … | … | … | … | … | … | … | 1 | 1 | … | … | … | … | … | … | … | … | … | … |
| Timber Merchant | … | … | … | … | … | … | … | … | … | … | … | … | … | … | … | … | … | … | … | … | … | … | … | … | … | … | … | … | … | … | … | … | … | 1 | 1 | … |
| Firewood Dealer | 2 | 2 | … | … | … | … | … | … | … | … | … | … | … | … | … | … | … | … | … | … | … | … | … | … | … | … | … | … | … | … | … | … | … | … | … | … |
| Fencer, Splitter | … | … | … | … | … | … | … | … | … | … | … | … | … | … | … | 1 | 1 | … | … | … | … | … | … | … | … | … | … | 1 | 1 | … | … | … | … | … | … | … |
| Cooper | 3 | 3 | … | 1 | 1 | … | … | … | … | … | … | … | … | … | … | … | … | … | … | … | … | … | … | … | … | … | … | … | … | … | … | … | … | … | … | … |
| Sawyer, Sawmill Owner | 6 | 6 | … | 1 | 1 | … | 8 | 8 | … | 2 | 1 | … | … | … | … | 1 | 1 | … | … | … | … | … | … | … | … | … | … | … | … | … | … | … | … | 1 | 1 | … |
| Basket Maker | … | … | … | … | … | … | … | … | … | … | … | … | … | … | … | … | … | … | … | … | … | … | … | … | … | … | … | … | … | … | 1 | 1 | … | … | … | … |
| Kauri Gum Digger | 9 | 9 | … | 3 | 3 | … | 4 | 4 | … | … | … | … | … | … | … | 4 | 4 | … | … | … | … | 1 | 1 | … | … | … | … | … | … | … | 1 | 1 | … | … | … | … |
| Gum Scraper | 1 | 1 | … | … | … | … | … | … | … | … | … | … | … | … | … | … | … | … | … | … | … | … | … | … | … | … | … | … | … | … | … | … | … | … | … | … |
| Labourer in Gum Store | 1 | 1 | … | … | … | … | … | … | … | … | … | … | … | … | … | … | … | … | … | … | … | … | … | … | … | … | … | … | … | … | … | … | … | … | … | … |
| Order XII.—Persons Working and Dealing in Minerals. | ||||||||||||||||||||||||||||||||||||
| Sub-Order 1. In Mining— | ||||||||||||||||||||||||||||||||||||
| Gold Miner, Alluvial | 19 | 19 | … | 3 | 3 | … | 7 | 7 | … | … | … | … | … | … | … | … | … | … | … | … | … | … | … | … | 1 | 1 | … | 2 | 2 | … | 1 | 1 | … | 4 | 4 | … |
| Sluicer | 7 | 7 | … | … | … | … | … | … | … | … | … | … | … | … | … | … | … | … | … | … | … | … | … | … | … | … | … | … | … | … | … | … | … | … | … | … |
| Gold Miner, Quartz | 14 | 14 | … | … | … | … | 4 | 4 | … | … | … | … | … | … | … | … | … | … | … | … | … | … | … | … | … | … | … | … | 1 | … | … | … | … | 1 | 1 | … |
| Gold Miner, Digger (not otherwise described) | 53 | 53 | … | 11 | 11 | … | 15 | 15 | … | … | … | … | … | … | … | 67 | 67 | … | … | … | … | 2 | 2 | … | 1 | 1 | … | … | … | … | 3 | 3 | … | … | … | … |
| Amalgamist | … | … | … | … | … | … | … | … | … | … | … | … | … | … | … | 1 | 1 | … | … | … | … | … | … | … | … | … | … | … | … | … | … | … | … | … | … | … |
| Quartz Crusher | 1 | 1 | … | … | … | … | … | … | … | … | … | … | … | … | … | … | … | … | … | … | … | … | … | … | … | … | … | … | … | … | … | … | … | … | … | … |
| Copper Miner | … | … | … | … | … | … | 1 | 1 | … | … | … | … | … | … | … | … | … | … | … | … | … | … | … | … | … | … | … | 1 | 1 | … | … | … | … | … | … | … |
| Manganese Miner | … | … | … | … | … | … | 1 | 1 | … | … | … | … | … | … | … | … | … | … | … | … | … | … | … | … | … | … | … | … | … | … | … | … | … | … | … | … |
| Coal Miner | 1 | 1 | … | … | … | … | 5 | 5 | … | … | … | … | … | … | … | … | … | … | … | … | … | … | … | … | … | … | … | … | … | … | … | … | … | … | … | … |
| Mining Engineer | … | … | … | … | … | … | … | … | … | 1 | 1 | … | … | … | … | … | … | … | … | … | … | 1 | 1 | … | … | … | … | … | … | … | … | … | … | … | … | … |
| Sub-Order 2. In Coal— | ||||||||||||||||||||||||||||||||||||
| Coal, Coke, Merchant, Dealer | 2 | 2 | … | … | … | … | … | … | … | … | … | … | … | … | … | … | … | … | … | … | … | … | … | … | … | … | … | … | … | … | … | … | … | … | … | … |
| Chimney-sweeper | 1 | 1 | … | … | … | … | … | … | … | … | … | … | … | … | … | … | … | … | … | … | … | … | … | … | … | … | … | … | … | … | … | … | … | … | … | … |
| Sub-Order 3. In Stone, Clay, Earthenware, and Glass— | ||||||||||||||||||||||||||||||||||||
| Quarry Owner, Worker | 3 | 3 | … | … | … | … | … | … | … | … | … | … | … | … | … | … | … | … | … | … | … | … | … | … | … | … | … | … | … | … | … | … | … | … | … | … |
| Limeburner | 1 | 1 | … | … | … | … | … | … | … | … | … | … | … | … | … | … | … | … | … | … | … | … | … | … | … | … | … | … | … | … | … | … | … | … | … | … |
| Brick Maker, Dealer | 4 | 4 | … | … | … | … | 2 | 2 | … | … | … | … | … | … | … | … | … | … | … | … | … | 1 | 1 | … | 1 | 1 | … | … | … | … | … | … | … | … | … | … |
| Pottery Maker, Dealer | 2 | 2 | … | … | … | … | … | … | … | … | … | … | … | … | … | … | … | … | … | … | … | … | … | … | … | … | … | … | … | … | … | … | … | … | … | … |
| Road, Railway, Contractor | … | … | … | 1 | 1 | … | 2 | 2 | … | … | … | … | … | … | … | … | … | … | … | … | … | … | … | … | … | … | … | … | … | … | … | … | … | … | … | … |
| Road, Railway, Labourer, Navvy | 17 | 17 | … | 1 | 1 | … | 6 | 6 | … | … | … | … | 1 | 1 | … | 2 | 2 | … | … | … | … | 1 | 1 | … | … | … | … | 3 | 3 | … | … | … | … | … | … | … |
| Brickmaker's Labourer | 1 | 1 | … | … | … | … | … | … | … | … | … | … | … | … | … | … | … | … | … | … | … | … | … | … | … | … | … | … | … | … | … | … | … | … | … | … |
Table II. Table II. Showing the Occupations of Persons, Males, and Females (exclusive of Maoris), of 15 Years of Age and upwards, returned as Sick, or Suffering from Accident; find the Occupations, past or present, of the Deaf and Dumb, Blind, Lunatics, Idiots, Epileptics, Paralyzed, Crippled or Deformed, Suffering from Debility or Deafness, of all Ages, on the 3rd April, 1881—continued.
| Occupations. | 15 Years and upwards. | All Ages. | ||||||||||||||||||||||||||||||||||
|---|---|---|---|---|---|---|---|---|---|---|---|---|---|---|---|---|---|---|---|---|---|---|---|---|---|---|---|---|---|---|---|---|---|---|---|---|
| Sick. | Specified Complaints. | Suffering from Accident. | Deaf and Dumb. | Blind. | Lunatics. | Idiots. | Epileptic. | Paralysis. | Crippled and Deformed. | Debility and Infirmity. | Deaf only. | |||||||||||||||||||||||||
| Persons. | Males. | Females. | Persons. | Males. | Females. | Persons. | Males. | Females. | Persons. | Males. | Females. | Persons. | Males. | Females. | Persons. | Males. | Females. | Persons. | Males. | Females. | Persons. | Males. | Females. | Persons. | Males. | Females. | Persons. | Males. | Females. | Persons. | Males. | Females. | Persons. | Males. | Females. | |
| Sub-Order 5. In Gold, Silver, and Precious Stones: | ||||||||||||||||||||||||||||||||||||
| Goldsmith, Silversmith, Jeweller | … | … | … | … | … | … | … | … | … | … | … | … | … | … | … | 2 | 2 | … | … | … | … | … | … | … | … | … | … | … | … | … | … | 1 | … | … | … | … |
| Lapidary | 1 | 1 | … | … | … | … | … | … | … | … | … | … | … | … | … | … | … | … | … | … | … | … | … | … | … | … | … | … | … | … | … | … | … | … | … | … |
| Electroplater | … | … | … | … | … | … | … | … | … | … | … | … | … | … | … | … | … | … | … | … | … | … | … | … | … | … | … | 1 | 1 | … | … | … | … | … | … | … |
| Sub-Order 6. In Metals other than Gold and Silver— | ||||||||||||||||||||||||||||||||||||
| Tin, Quicksilver, Worker, Dealer | 3 | 3 | … | 1 | 1 | … | … | … | … | … | … | … | … | … | … | 1 | 1 | … | … | … | … | … | … | … | … | … | … | … | … | … | … | … | … | … | … | … |
| Iron-founder, Moulder, Boiler-maker, Worker, Dealer | 3 | 3 | … | 2 | 2 | … | … | … | … | … | … | … | … | … | … | 2 | 2 | … | … | … | … | … | … | … | … | … | … | … | … | … | 1 | 1 | … | … | … | … |
| Blacksmith, Whitesmith | 13 | 13 | … | 2 | 2 | … | … | 5 | … | … | … | … | 1 | 1 | … | 4 | 4 | … | … | … | … | 2 | 2 | … | 1 | 1 | … | … | … | … | 5 | 5 | … | … | … | … |
| Ironmonger, Hardware Dealer | 6 | 6 | … | 1 | 1 | … | 1 | 1 | … | … | … | … | … | … | … | 2 | 2 | … | … | … | … | … | … | … | … | … | … | … | … | … | … | … | … | … | … | … |
| Locksmith, Bell-hanger | … | … | … | … | … | … | 1 | 1 | … | … | … | … | … | … | … | … | … | … | … | … | … | … | … | … | … | … | … | … | … | … | … | … | … | … | … | … |
| CLASS VI.—INDEFINITE AND NON-PRODUCTIVE.— | ||||||||||||||||||||||||||||||||||||
| Order XIII.Labourers and Others (Branch of Labour undefined). | ||||||||||||||||||||||||||||||||||||
| Sub-Order 1. General Labourers— | ||||||||||||||||||||||||||||||||||||
| Labourer (branch undefined) | 195 | 198 | … | 12 | 12 | … | 73 | 73 | … | 4 | 4 | … | 6 | 6 | … | 285 | 285 | … | … | … | … | 7 | 7 | … | 5 | 5 | … | 10 | 10 | … | 16 | 16 | … | 10 | 10 | … |
| Sub-Order 2. Other Indefinite Occupations— | ||||||||||||||||||||||||||||||||||||
| Shop Woman | 2 | … | 2 | … | … | … | … | … | … | … | … | … | … | … | … | 1 | … | 1 | … | … | … | … | … | … | … | … | … | … | … | … | … | … | … | … | … | … |
| Apprentice (unspecified) | … | … | … | … | … | … | 1 | 1 | … | … | … | … | … | … | … | … | … | … | … | … | … | … | … | … | … | … | … | … | … | … | … | … | … | … | … | … |
| Engineer, Engine-driver, Stoker, Fireman (undefined) | 9 | 9 | … | 3 | 3 | … | 9 | 9 | … | … | … | … | … | … | … | 1 | 1 | … | … | … | … | … | … | … | 1 | 1 | … | … | … | … | … | … | … | … | … | … |
| Draughtsman (unspecified) | 2 | 2 | … | … | … | … | … | … | … | … | … | … | … | … | … | … | … | … | … | … | … | … | … | … | … | … | … | … | … | … | … | … | … | … | … | … |
| Contractor (unspecified) | 1 | 7 | … | 1 | 1 | … | 3 | 3 | … | … | … | … | … | … | … | 1 | 1 | … | … | … | … | … | … | … | … | … | … | … | … | … | 1 | 1 | … | … | … | … |
| Others | 4 | 4 | … | … | … | … | … | … | … | … | … | … | … | … | … | … | … | … | … | … | … | … | … | … | … | … | … | … | … | … | … | … | … | … | … | … |
| Order XIV.—Persons of Property or Rank (not returned under any Office or Occupation) | 14 | 13 | 1 | 1 | 1 | … | 4 | 4 | … | … | … | … | 4 | 3 | 1 | 5 | 5 | … | … | … | … | 2 | 1 | 1 | 1 | 1 | … | 3 | 3 | … | 3 | 3 | … | … | … | … |
| Order XV.—Persons supported by the Community. | ||||||||||||||||||||||||||||||||||||
| Sub-Order 1. From Voluntary Sources and Public Revenue— | ||||||||||||||||||||||||||||||||||||
| Dependent on Relatives | … | … | … | … | … | … | … | … | … | … | … | … | … | … | … | … | … | … | … | … | … | … | … | … | … | … | … | … | … | … | 1 | 1 | … | … | … | … |
| Inmate of Charitable Institution | 28 | 3 | 25 | 15 | 14 | 1 | 1 | 1 | … | … | … | … | 8 | 8 | … | 215 | 87 | 128 | 4 | 3 | 1 | 5 | 5 | … | … | … | … | 4 | 4 | … | 12 | 6 | 6 | … | … | … |
| Sub-Order 2. Criminal Classes— | ||||||||||||||||||||||||||||||||||||
| Prisoner | 1 | 1 | … | 1 | … | 1 | … | … | … | … | … | … | … | … | … | 1 | 1 | … | 1 | 1 | … | … | … | … | … | … | … | … | … | … | … | … | … | … | … | … |
| Inmate of Refuge | … | … | … | … | … | … | … | … | … | … | … | … | … | … | … | … | … | … | 1 | 1 | … | … | … | … | … | … | … | … | … | … | 1 | 1 | … | … | … | … |
| Others—Vagrant | … | … | … | … | … | … | … | … | … | … | … | … | … | … | … | 1 | 1 | … | … | … | … | … | … | … | … | … | … | … | … | … | … | … | … | … | … | … |
| No occupation at present | 102 | 102 | … | 16 | 16 | … | 15 | 14 | 1 | 2 | 2 | … | 18 | 16 | 2 | 9 | 8 | 1 | 12 | 12 | … | 8 | 8 | … | 6 | 6 | … | 5 | 5 | … | 23 | 22 | 1 | 1 | 1 | … |
| Occupation not stated | 14 | 14 | … | 3 | 3 | … | 5 | 5 | … | 2 | 2 | … | … | … | … | … | … | … | … | … | … | … | … | … | … | … | … | 1 | 1 | … | 3 | 3 | … | … | … | … |
Table of Contents
Table I. Table I. Showing the Extent of Occupied Holdings of Land in New Zealand over One Acre in extent, classified according to Tenure, as returned by the Census of the 3rd April, 1881.
| Provincial Districts. | Extent of Holding—Acres. | ||||||
|---|---|---|---|---|---|---|---|
| Freehold. | Rented from Private Individuals. | Rented from Public Bodies, | Rented from Natives (including Reserves Rented). | Held from Crown for Other than Pastoral Purposes (including Deferred Payments, &c.) | Rented from Crown for Pastoral Purposes only. | Total Acreage held. | |
| Auckland | 1,5,64,579 | 206,024 | 17,931 | 785,917 | 126,919 | 158,120 | 2,859,490 |
| Taranaki | 1,34,876 | 36,940 | 5,282 | 30,115 | 26,956 | … | 234,169 |
| Wellington | 1,303,172 | 222,203 | 17,792 | 691,069 | 22,250 | 334 | 2,255,820 |
| Hawke's Bay | 1,107,658 | 315,752 | 26,778 | 601,372 | 7,267 | 77,8i9 | 2,136,646 |
| Marlborough | 744,703 | 44,893 | 1,600 | 20,637 | 2,267 | 1,029,338 | 1,843,438 |
| Nelson | 692,330 | 46,127 | 6,823 | 39,542 | 55,069 | 700,612 | 1,540,502 |
| Westland | 21,456 | 3,828 | 3,133 | 2,571 | 3,609 | 378,339 | 412,936 |
| Canterbury | 2,247,592 | 325,383 | 215,996 | 11,662 | 7,699 | 3,203,873 | 6,012,205 |
| Otago | 2,450,209 | 317,393 | 267,790 | 9,829 | 271,948 | 6,090,134 | 9,407,303 |
| Chatham Islands | 43,595 | 25,912 | … | 73,450 | … | … | 142,957 |
| Total Census, April, 1881 | 10,309,170 | 1,544,455 | 563,124 | 2,266,164 | 523,984 | 11,638,569 | 26,845,466 |
| Total Census, March, 1878 | 8,869,547 | 3,709,525 | 12,690,074 | 25,269,146 | |||
| Numerical increase since 1878 | 1,439,623 | 1,188,202 | … | 1,576,320 | |||
| Numerical decrease since 1878 | … | … | 1,051,505 | … | |||
| Centesimal increase | 16.23 | 32.03 | … | 6.24 | |||
| Centesimal decrease | … | … | 8.28 | … | |||
Table II. Table II. Showing the Number and Acreage of Occupied Holdings upwards of an Acre in Extent (exclusive of Crown Pastoral Lands), classified according to size, in the different Countries of the Colony
| Under the heading “Freehold” are included lands set down by their occupiers in the census schedule as held under this tenure. Under “Leasehold” are included lands return by their occupiers under the following heads: 1, Rented from private individual 2, Rented from public bodies; 3, Rented from Natives (including reserves rented); 4, Held from crown for other pastoral purposes (including deferred payments, &c.). Thus Native leases lands in process of alienation are included but crown held for pastoral purposes only have been omitted. A properly part free and part leased has been considered as one holding, and placed according to its full size. Lands occupied by Maoris are not dealt with. The aggregate acreage under each of the classes is given in another table. | ||||||||||||||||||||||||||||||||||||||||||
|---|---|---|---|---|---|---|---|---|---|---|---|---|---|---|---|---|---|---|---|---|---|---|---|---|---|---|---|---|---|---|---|---|---|---|---|---|---|---|---|---|---|---|
| County | Over 1 Acre to 10 Acres inclusive | Over 10 Acre to 50 Acres inclusive | Over 50 Acre to 100 Acres inclusive | Over 100 Acre to 200 Acres inclusive | Over 200 Acre to 320 Acres inclusive | Over 320 Acre to 640 Acres inclusive | Over 640 Acre to 1000 Acres inclusive | Over 1000 Acre to 5000 Acres inclusive | Over 5000 Acre to 10,000 Acres inclusive | Over 10,000 Acre to 20,000 Acres inclusive | Over 20,000 Acre to 50,000 Acres inclusive | Over 50,000 Acre to 100,000 Acres inclusive | Upwards of 100,000 Acres. | Totals | ||||||||||||||||||||||||||||
| Number of Holdings. | Free | Lease | Number of Holdings. | Free | Lease | Number of Holdings. | Free | Lease | Number of Holdings. | Free | Lease | Number of Holdings. | Free | Lease | Number of Holdings. | Free | Lease | Number of Holdings. | Free | Lease | Number of Holdings. | Free | Lease | Number of Holdings. | Free | Lease | Number of Holdings. | Free | Lease | Number of Holdings. | Free | Lease | Number of Holdings. | Free | Lease | Number of Holdings. | Free | Lease | Number of Holdings. | Free | Lease | |
| Acres. | Acres. | Acres. | Acres. | Acres. | Acres. | Acres. | Acres. | Acres. | Acres. | Acres. | Acres. | Acres. | Acres. | Acres. | Acres. | Acres. | Acres. | Acres. | Acres. | Acres. | Acres. | Acres. | Acres. | Acres. | Acres. | Acres. | Acres. | |||||||||||||||
| Mongonui | 27 | 88 | 64 | 31 | 722 | 72 | 17 | 797 | 569 | 17 | 1,559 | 1,017 | 20 | 4,695 | 915 | 26 | 10,027 | 2,108 | 15 | 7,801 | 3,622 | 15 | 17,959 | 6,779 | 1 | 6,500 | … | 1 | … | 10,600 | 1 | 315 | 20,000 | 1 | … | 57,520 | … | … | … | 172 | 50,463 | 103,296 |
| Bay of Islands | 38 | 108 | 95 | 50 | 1,260 | 209 | 23 | 1,308 | 461 | 28 | 2,572 | 1,843 | 11 | 1,828 | 1,808 | 11 | 3,102 | 1,700 | 4 | 1,800 | 1,552 | 18 | 23,365 | 12,270 | 3 | 14,552 | 7,261 | … | … | … | … | … | … | … | … | … | … | … | … | 189 | 50,275 | 27,196 |
| Hokianga | 11 | 72 | 13 | 9 | 93 | 127 | 7 | 248 | 334 | 6 | 671 | 190 | 4 | 900 | 300 | 4 | 1,664 | … | 3 | 1,430 | 760 | … | … | … | 1 | 51 | 6,816 | 1 | … | 12,600 | 1 | 5 | 35,440 | … | … | … | … | … | … | 47 | 5,143 | 56,580 |
| Hotson | 24 | 62 | 48 | 37 | 1,227 | 100 | 52 | 3,768 | 363 | 74 | 10,430 | 758 | 30 | 7,227 | 560 | 11 | 4,657 | … | 4 | 3,093 | 90 | 6 | 12,186 | 14 | … | … | … | 1 | 13,600 | … | … | … | … | … | … | … | … | … | … | 239 | 56,259 | 1,933 |
| Whangarei | 33 | 113 | 58 | 51 | 1,343 | 311 | 113 | 8,100 | 1,007 | 167 | 23,479 | 2,280 | 83 | 16,280 | 5,746 | 50 | 18,670 | 3,215 | 12 | 7,892 | 1,815 | 3 | 4,020 | 2,540 | 1 | 8,000 | … | … | … | … | … | … | … | … | … | … | … | … | … | 513 | 156,670 | 10,440 |
| Rodney | 45 | 120 | 107 | 50 | 1,643 | 367 | 105 | 8,313 | 128 | 101 | 21,905 | 2,470 | 70 | 17,110 | 2,980 | 62 | 25,020 | 1,700 | 16 | 10,020 | 622 | 13 | 23,264 | 2,060 | 1 | 9,100 | … | 1 | 16,040 | … | 1 | 24,000 | … | … | … | … | … | … | … | 543 | 156,670 | 10,440 |
| Waitemata | 100 | 314 | 183 | 115 | 2,017 | 671 | 97 | 7,309 | 456 | 70 | 9,332 | 671 | 42 | 9,368 | 1,179 | 23 | 10,850 | 556 | 12 | 6,938 | 1,586 | 19 | 28,546 | 11,187 | 3 | 20,500 | … | … | … | … | … | … | … | … | … | … | … | … | … | 486 | 96,080 | 16,492 |
| Eden | 620 | 1,022 | 814 | 233 | 3,237 | 2,098 | 66 | 3,357 | 1,653 | 29 | 2,755 | 1,273 | 17 | 3,150 | 909 | 13 | 2,741 | 2,741 | 2,996 | 3 | 1,194 | 1,106 | 4 | 4,604 | 3,562 | 1 | 9,150 | … | … | … | … | … | … | … | … | … | … | … | … | 986 | 32,119 | 14,402 |
| Manukau | 210 | 908 | 403 | 430 | 12,013 | 1,288 | 270 | 18,513 | 2,103 | 310 | 39,236 | 5,377 | 125 | 27,217 | 4,042 | 102 | 38,348 | 5,785 | 24 | 17,439 | 2,001 | 28 | 41,218 | 9,108 | 1 | 25 | 6,430 | … | … | … | … | … | … | … | … | … | … | … | … | 1,545 | 195,036 | 36,537 |
| Coromandel | 32 | 78 | 61 | 10 | 222 | 71 | 9 | 651 | 83 | 13 | 1,227 | 642 | 9 | 1,237 | 1,012 | 3 | 955 | 500 | 5 | 1,000 | 4,000 | 6 | 7,082 | 6,618 | … | … | … | … | … | … | 1 | 25,000 | … | … | … | … | … | … | … | 94 | 37,453 | 13,017 |
| Thames | 50 | 107 | 123 | 56 | 784 | 1,118 | 27 | 750 | 1,401 | 26 | 1,386 | 2,630 | 15 | 2,017 | 2,075 | 9 | 3,108 | 960 | 3 | 1,809 | … | 4 | 9,626 | 1,199 | … | … | … | … | … | … | … | … | … | … | … | … | … | … | … | 199 | 19,713 | 9,506 |
| Pinko | 2 | 4 | 1 | 5 | 124 | 38 | 14 | 274 | 928 | 10 | 375 | 893 | 8 | 723 | 1,357 | 14 | 5,947 | 526 | 6 | 3,840 | 736 | 12 | 18,997 | 4,900 | 7 | 52,367 | 8,533 | 2 | 28,000 | … | 1 | 23,000 | … | 51,068 | 10,573 | … | … | … | … | 82 | 184,719 | 28,485 |
| Tauranga | 68 | 123 | 110 | 41 | 922 | 412 | 42 | 2,498 | 677 | 16 | 4,070 | 1,757 | 31 | 7,360 | 633 | 19 | 7,679 | 1,146 | 5 | 3,273 | 984 | 5 | 5,060 | 5,900 | 3 | 14,287 | 8,670 | … | … | … | … | … | … | … | … | … | … | … | … | 250 | 46,199 | 20,268 |
| Whakatane | 53 | 123 | 100 | 28 | 752 | 150 | 24 | 1,776 | 103 | 15 | 1,794 | 370 | 9 | 2,006 | 510 | 8 | 2,647 | 385 | 3 | 2,249 | 150 | 4 | 4,316 | 9,230 | … | … | … | 1 | 4,000 | 12,096 | 1 | … | 26,000 | … | … | … | … | … | … | 148 | 19,663 | 49,104 |
| Cook | 107 | 180 | 305 | 52 | 203 | 1,060 | 69 | 300 | 1,200 | 21 | 1,683 | 1,635 | 10 | 1,036 | 1,250 | 18 | 5,467 | 3,261 | 7 | 204 | 5,714 | 18 | 6,950 | 49,236 | 13 | 38,743 | 63,363 | 6 | 25,782 | 47,032 | 6 | 5,112 | 158,050 | 1 | 38,000 | 12,770 | … | … | … | 281 | 124,427 | 347,080 |
| Wairoa | 39 | 70 | 100 | 15 | 188 | 264 | 8 | 309 | 222 | 9 | 630 | 415 | 1 | 220 | … | 6 | 1,906 | 1,266 | 2 | 1,655 | 80 | 14 | 33,116 | 15,812 | 5 | 18,800 | 15,800 | 11 | 68,202 | 74,719 | 8 | 20,488 | 173,720 | … | … | … | … | … | … | 118 | 145,884 | 282,428 |
| East Taupo | … | … | … | … | … | … | 1 | … | 92 | 1 | … | 150 | … | … | … | … | … | … | … | … | … | 1 | … | 2,000 | … | … | … | 1 | … | 12,000 | … | … | … | … | … | … | 1 | … | 109,000 | 5 | … | 123,242 |
| West Taupo | … | … | … | … | … | … | … | … | … | 1 | … | 200 | … | … | … | … | … | … | … | … | … | 1 | 2,500 | … | … | … | … | … | … | … | … | … | … | 1 | … | 95,000 | … | … | … | 3 | 2,500 | 95,200 |
| Waipa | 82 | 253 | 143 | 57 | 1,720 | 521 | 65 | 4,664 | 887 | 70 | 10,032 | 1,002 | 41 | 9,336 | 811 | 50 | 20,729 | 1,213 | 20 | 13,056 | 2,662 | 9 | 10,906 | 1,170 | … | … | … | 2 | 25,210 | … | 1 | 21,800 | … | … | … | … | … | … | … | 397 | 117,708 | 8,442 |
| Waikato | 120 | 265 | 176 | 57 | 1,045 | 358 | 39 | 2,887 | 430 | 40 | 4,860 | 985 | 26 | 4,871 | 1,929 | 23 | 7,573 | 2,565 | 5 | 2,955 | 1,406 | 9 | 16,440 | … | 2 | 5,128 | 5,600 | 1 | 11,000 | … | … | … | … | 1 | 90,000 | … | … | … | … | 323 | 150,624 | 13,455 |
| Raglan | 8 | 20 | 13 | 13 | 515 | 71 | 14 | 904 | 130 | 24 | 2,601 | 1,030 | 25 | 3,854 | 2,445 | 26 | 8,100 | 2,335 | 9 | 3,394 | 3,493 | 8 | 14,624 | 2,780 | … | … | … | … | … | … | … | … | … | 1 | 1,700 | 94,800 | … | … | … | 128 | 35,440 | 107,097 |
| Kawhia. | … | … | … | 10 | 70 | 250 | 7 | 60 | 600 | 2 | … | 240 | 2 | … | 500 | … | … | … | … | … | … | … | … | … | … | … | … | … | … | … | … | … | … | … | … | … | … | … | … | 21 | 130 | 1,590 |
| Taranaki | 128 | 231 | 247 | 200 | 4,170 | 3,250 | 267 | 10,588 | 9,230 | 102 | 17,151 | 10,307 | 60 | 12,010 | 4,969 | 55 | 19,402 | 7,188 | 8 | 3,518 | 2,378 | 10 | 9,357 | 5,612 | … | … | … | … | … | … | … | … | … | … | … | … | … | … | … | 929 | 76,822 | 43,251 |
| Patea | 117 | 270 | 266 | 78 | 804 | 1,450 | 100 | 3,398 | 3,781 | 85 | 7,211 | 5,144 | 54 | 7,416 | 6,887 | 93 | 26,717 | 13,470 | 30 | 13,591 | 10,361 | 24 | 20,167 | 22,038 | … | … | … | 1 | 423 | 10,365 | … | … | … | … | … | … | … | … | … | 585 | 80,000 | 73,412 |
| Wanganui | 109 | 257 | 415 | 70 | 675 | 931 | 10 | 1,331 | 1,082 | 55 | 5,093 | 3,250 | 37 | 5,115 | 4,276 | 71 | 20,417 | 12,577 | 34 | 14,586 | 3,210 | 34 | 46,168 | 18,500 | 5 | 20,340 | 14,400 | 1 | 11,000 | … | 1 | 25,757 | 162 | … | … | … | … | … | … | 381 | 154,546 | 48,206 |
| Rangitikei | 101 | 220 | 183 | 27 | 460 | 361 | 47 | 2,507 | 1,100 | 59 | 7,251 | 1,515 | 23 | 4,610 | 1,691 | 57 | 21,592 | 7,075 | 21 | 14,586 | 3,210 | 34 | 46,164 | 18,500 | 5 | 20,340 | 14,400 | 1 | 11,000 | … | 1 | 25,757 | 162 | … | … | … | … | … | … | 381 | 154,546 | 48,206 |
| Manawatu | 208 | 540 | 366 | 215 | 3,870 | 2,589 | 163 | 7,844 | 4,117 | 144 | 13,616 | 7,974 | 78 | 14,092 | 5,609 | 57 | 19,643 | 6,871 | 21 | 11,064 | 6,867 | 25 | 24,264 | 18,955 | 5 | 31,538 | 3,134 | 2 | 3,000 | 32,000 | 1 | 26,661 | … | … | … | … | … | … | … | 919 | 156,076 | 93,482 |
| Hutt | 304 | 866 | 546 | 211 | 3,771 | 2,760 | 157 | 7,014 | 4,390 | 115 | 12,015 | 4,692 | 58 | 10,347 | 4,607 | 58 | 20,058 | 6,773 | 19 | 8,303 | 6,426 | 24 | 32,894 | 10,698 | 4 | 10,694 | 18,500 | 1 | 4,777 | 6,375 | … | … | … | … | … | … | … | … | … | 931 | 110,622 | 65,767 |
| Wairarapa West | 216 | 656 | 488 | 233 | 5,110 | 2,546 | 121 | 6,774 | 2,594 | 123 | 13,447 | 4,853 | 31 | 6,370 | 1,642 | 70 | 20,758 | 11,866 | 26 | 16,395 | 4,501 | 47 | 79,055 | 21,050 | 6 | 36,843 | 7,340 | 6 | 54,270 | 27,160 | … | … | … | … | … | … | … | … | … | 909 | 239,714 | 84,040 |
| Wairarapa East | 10 | 13 | 36 | 10 | 50 | 302 | 10 | 554 | 280 | 7 | 453 | 592 | 5 | 1,200 | 100 | 6 | 1,372 | 1,578 | 9 | 7,217 | 860 | 34 | 67,345 | 26,850 | 8 | 37,087 | 20,830 | 19 | 210,461 | 59,640 | 6 | 138,764 | 34,421 | 1 | 52,000 | 200 | … | … | … | 125 | 516,581 | 145,689 |
| Waipawa | 99 | 191 | 236 | 256 | 7,125 | 2,630 | 102 | 4,876 | 3,553 | 60 | 6,364 | 2,796 | 22 | 3,707 | 1,830 | 21 | 9,067 | 2,600 | 24 | 15,250 | 4,888 | 21 | 33,499 | 11,308 | 9 | 46,557 | 15,542 | 15 | 134,504 | 87,711 | 13 | 262,376 | 109,490 | … | … | … | … | … | … | 645 | 523,076 | 242,598 |
| Hawke's Bay | 103 | 400 | 454 | 106 | 1,182 | 1,500 | 33 | 1,390 | 1,035 | 17 | 1,832 | 1,133 | 10 | 2,123 | 1,105 | 16 | 4,783 | 2,784 | 10 | 3,193 | 6,018 | 24 | 41,480 | 17,407 | 11 | 71,969 | 17,105 | 16 | 156,711 | 81,618 | 8 | 70,683 | 171,800 | 3 | 139,200 | 61,900 | 3 | 461 | 375,000 | 419 | 494,969 | 738,865 |
| Sounds | 1 | … | 10 | 12 | 350 | … | 8 | 402 | 208 | 10 | 1,011 | 634 | 7 | 964 | 932 | 4 | 1,227 | 411 | 4 | 2,200 | 1,150 | 7 | 4,426 | 8,750 | … | … | … | 1 | … | 15,000 | … | … | … | … | … | … | … | … | … | 60 | 11,000 | 27,155 |
| Marlborough | 170 | 568 | 197 | 144 | 2,760 | 1,158 | 70 | 4,967 | 705 | 83 | 9,360 | 8,223 | 31 | 6,217 | 2,567 | 29 | 9,860 | 2,956 | 11 | 7,666 | 1,621 | 24 | 38,706 | 8,711 | 9 | 66,317 | 2,700 | 8 | 116,869 | … | 10 | 308,622 | 13,112 | 1 | 78,000 | … | … | … | … | 616 | 649,921 | 37,049 |
| Kaikoura | 37 | 153 | 30 | 27 | 602 | 159 | 16 | 902 | 202 | 21 | 2,391 | 526 | 7 | 1,340 | 662 | 3 | 1,181 | 105 | 2 | 1,160 | 350 | 5 | 11,511 | 3,100 | 1 | 5,224 | … | 2 | 30,337 | … | 1 | 28,381 | … | … | … | … | … | … | … | 122 | 83,782 | 5,193 |
| Waimea | 285 | 830 | 475 | 205 | 5,644 | 2,205 | 175 | 6,525 | 3,570 | 193 | 19,355 | 9,196 | 80 | 15,084 | 5,214 | 98 | 30,523 | 12,727 | 30 | 16,561 | 8,933 | 25 | 36,182 | 20,202 | 1 | 7,000 | 1,400 | … | … | … | … | … | … | … | … | … | … | … | … | 1,152 | 141,014 | 64,023 |
| Collingwood | 10 | 71 | 27 | 38 | 987 | 358 | 44 | 2,581 | 828 | 55 | 5,860 | 2,174 | 29 | 6,731 | 1,584 | 14 | 3,966 | 1,626 | 3 | 1,540 | 930 | 3 | 3,348 | 1,137 | … | … | … | … | … | … | … | … | … | … | … | … | … | … | … | 205 | 24,128 | 8,664 |
| Buller | 47 | 83 | 112 | 64 | 579 | 1,185 | 31 | 210 | 1,942 | 21 | 722 | 2,814 | 5 | 160 | 1,182 | 2 | 120 | 630 | … | … | … | … | … | … | … | … | … | … | … | … | … | … | … | … | … | … | … | … | … | 163 | 1,912 | 7,865 |
| Inangahua | 20 | 42 | 47 | 21 | 151 | 400 | 27 | 273 | 1,708 | 20 | 1,156 | 2,010 | 13 | 1,117 | 1,196 | 4 | 465 | 1,290 | 3 | 750 | 1,282 | … | … | … | … | … | … | 1 | 5,000 | 7,000 | … | … | … | … | … | … | … | … | … | 115 | 9,254 | 16,751 |
| Grey | 57 | 95 | 152 | 54 | 799 | 925 | 43 | 891 | 2,352 | 35 | 1,002 | 4,195 | 12 | 1,608 | 1,673 | 12 | 1,614 | 3,156 | 2 | 133 | 1,445 | 1 | 4,500 | … | … | … | … | … | … | … | … | … | … | … | … | … | … | … | … | 216 | 10,642 | 13,898 |
| Westland | 97 | 220 | 201 | 117 | 2,021 | 1,730 | 40 | 2,008 | 1,547 | 31 | 3,831 | 955 | 2 | 95 | 450 | 5 | 1,855 | 720 | 2 | 700 | 1,000 | 4 | 4,710 | 5,095 | … | … | … | … | … | … | … | … | … | … | … | … | … | … | … | 307 | 15,092 | 11,698 |
| Amuri | 8 | 20 | 11 | 8 | 101 | 33 | 1 | 1 | 70 | … | … | … | … | … | … | 2 | 78 | 72l | 2 | 707 | 877 | 2 | 1,810 | 6,991 | 1 | 8,538 | … | 4 | 52,592 | … | 9 | 252,540 | 29,100 | … | … | … | … | … | … | 37 | 316,543 | 37,802 |
| Cheviot | … | … | … | … | … | … | … | … | … | … | … | … | … | … | … | … | … | … | … | … | … | … | … | … | … | … | … | … | … | … | 3 | 95,201 | … | 1 | 100,000 | … | … | … | … | 4 | 195,201 | … |
| Ashley | 381 | 904 | 748 | 355 | 7,321 | 3,802 | 287 | 15,263 | 7,023 | 238 | 22,786 | 11,528 | 113 | 20,166 | 8,688 | 81 | 23,280 | 11,966 | 35 | 21,433 | 6,199 | 53 | 101,979 | 15,155 | 6 | 31,268 | 9,693 | 4 | 50,293 | 1,053 | 2 | 50,000 | 1,000 | 1 | 79,000 | … | … | … | … | 1,555 | 426,106 | 76,855 |
| Akaroa | 80 | 152 | 100 | 118 | 2,473 | 1,230 | 108 | 5,572 | 2,556 | 77 | 7,161 | 3,876 | 39 | 7,653 | 2,607 | 35 | 14,028 | 1,627 | 17 | 11,380 | 2,249 | 25 | 52,586 | 6,578 | 4 | 27,430 | 3,267 | 1 | 15,292 | 106 | … | … | … | … | … | … | … | … | … | 504 | 143,727 | 24,295 |
| Selwyn | 790 | 1,944 | 1,602 | 728 | 12,912 | 8,743 | 396 | 19,024 | 11,704 | 372 | 37,560 | 18,239 | 197 | 32,107 | 17,284 | 134 | 35,639 | 26,364 | 55 | 31,772 | 14,315 | 58 | 99,894 | 21,941 | 6 | 29,703 | 7,915 | 4 | 42,205 | 10,387 | 2 | 30,286 | 36,970 | … | … | … | … | … | … | 2,742 | 373,055 | 175,523 |
| Ashburton | 156 | 324 | 392 | 103 | 1,609 | 1,090 | 71 | 3,768 | 1,860 | 120 | 13,273 | 6,476 | 11 | 16,689 | 9,492 | 100 | 29,073 | 16,426 | 46 | 24,592 | 12,328 | 64 | 107,552 | 29,841 | 11 | 76,057 | 5,862 | 9 | 122,306 | 4,604 | 10,387 | 2 | 30,286 | 36,970 | … | … | … | … | … | 2,742 | 373,055 | 175,523 |
| Geraldine | 208 | 503 | 314 | 203 | 5,380 | 2,220 | 150 | 8,462 | 3,372 | 184 | 17,809 | 8,476 | 113 | 19,183 | 9,476 | 110 | 34,725 | 13,395 | 32 | 18,705 | 10,475 | 51 | 82,659 | 12,698 | 13 | 84,973 | 9,276 | 6 | 86,694 | … | 2 | 21,094 | 26,500 | 1 | 73,861 | 371 | … | … | … | 1,133 | 454,056 | 96,468 |
| Waimate | 95 | 231 | 74 | 67 | 1,376 | 542 | 44 | 2,864 | 647 | 61 | 7,879 | 1,904 | 45 | 9,062 | 2,797 | 40 | 13,653 | 3,729 | 7 | 4,082 | 1,833 | 21 | 40,775 | 9,540 | 4 | 29,576 | 120 | 4 | 61,555 | 1,812 | 6 | 212,824 | 24,580 | … | … | … | … | … | … | 394 | 393,877 | 47,578 |
| Waitaki | 180 | 415 | 354 | 105 | 1,465 | 1,500 | 68 | 3,115 | 2,249 | 101 | 8,966 | 6,342 | 79 | 13,141 | 6,886 | 79 | 21,183 | 14,720 | 26 | 13,556 | 8,217 | 27 | 37,512 | 16,457 | 7 | 53,643 | 3,765 | 5 | 79,144 | 896 | 1 | 33,000 | 1,100 | 1 | 90 | 65,000 | … | … | … | 394 | 393,877 | 47,578 |
| Waikouaiti | 249 | 695 | 464 | 288 | 5,641 | 2,731 | 151 | 9,100 | 2,186 | 132 | 12,535 | 7,227 | 61 | 8,535 | 8,361 | 19 | 8,709 | 3,279 | 10 | 6,279 | 2,400 | 15 | 14,522 | 18,880 | 2 | 12,000 | 9,408 | 3 | 36,212 | 12,325 | 1 | 23,394 | 476 | … | … | … | … | … | … | 931 | 137,631 | 68,243 |
| Peninsula | 80 | 240 | 220 | 115 | 2,023 | 1,581 | 69 | 3,107 | 1,777 | 20 | 2,136 | 1,582 | 4 | 186 | 779 | 4 | 1,470 | 571 | … | … | … | 3 | 230 | 3,830 | … | … | … | … | … | … | … | … | … | … | … | … | … | … | … | 304 | 9,482 | 10,343 |
| Taieri | 386 | 966 | 688 | 191 | 3,316 | 2,052 | l19 | 6,906 | 3,358 | 114 | 10,757 | 5,501 | 57 | 9,147 | 5,105 | 46 | 16,406 | 4,722 | 14 | 7,944 | 3,558 | 26 | 43,473 | 7,705 | 4 | 25,253 | 4,369 | 2 | 19,500 | 11,000 | 1 | 21,000 | … | … | … | … | … | … | … | 970 | 164,668 | 48,148 |
| Bruce | 113 | 317 | 215 | 55 | 1,133 | 921 | 62 | 4,961 | 1,292 | 106 | 11,890 | 4,035 | 67 | 12,469 | 5,166 | 42 | 13,441 | 4,845 | 19 | 9,931 | 5,489 | 36 | 62,954 | 16,593 | 3 | 25,690 | 755 | 2 | 27,425 | … | 2 | 42,192 | 1,528 | … | … | … | … | … | … | 557 | 212,403 | 41,159 |
| Clutha | 65 | 173 | 120 | 59 | 1,768 | 430 | 63 | 4,072 | 813 | 190 | 21,070 | 10,051 | 70 | 13,859 | 4,294 | 56 | 19,451 | 5,732 | 16 | 7,990 | 3,526 | 20 | 33,911 | 3,533 | 4 | 18,870 | 6,400 | 4 | 46,284 | 286 | 4 | 133,347 | 9,375 | … | … | … | … | … | … | 546 | 300,785 | 45,466 |
| Tuapeka | 170 | 458 | 280 | 90 | 1,805 | 529 | 46 | 2,314 | 1,250 | 150 | 12,880 | 13,011 | 69 | 8,999 | 8,373 | 47 | 12,364 | 7,211 | 15 | 6,913 | 4,548 | 28 | 30,271 | 17,528 | 1 | 6,000 | … | 2 | 25,500 | … | 1 | 22,730 | … | 1 | 78,240 | … | … | … | … | 620 | 208,474 | 52,739 |
| Maniototo | 55 | 23 | 191 | 28 | 199 | 400 | 17 | 323 | 1,100 | 42 | 1,352 | 6,381 | 12 | 892 | 2,415 | 14 | 3,846 | 2,557 | 8 | 5,275 | 1,010 | 6 | 7,830 | 3,700 | … | … | … | 1 | 434 | 9,816 | … | … | … | … | … | … | … | … | … | 183 | 20,174 | 27,708 |
| Vincent | 73 | 150 | 213 | 87 | 416 | 890 | 23 | 529 | 1,320 | 40 | 2,380 | 4,718 | 24 | 1,037 | 5,594 | 15 | 3,515 | 2,658 | 7 | 2,990 | 2,404 | 4 | 6,688 | 1,200 | … | … | … | … | … | … | 1 | … | 26,000 | … | … | … | … | … | … | 224 | 17,740 | 45,006 |
| Lake | 78 | 142 | 188 | 53 | 745 | 720 | 30 | 1,386 | 971 | 59 | 4,316 | 5,485 | 15 | 2,568 | 1,481 | 18 | 2,499 | 8 | 2,350 | 6 | 7,091 | 1,435 | 1 | 6,800 | 1 | 52 | 12,300 | 1 | 52 | 12,300 | … | … | … | … | … | … | ... | ... | ... | 269 | 33,092 | 27,429 |
| Southland | 420 | 1,181 | 703 | 240 | 4,013 | 2,501 | 181 | 9,665 | 4,632 | 429 | 34,663 | 39,823 | 135 | 20,203 | 10,003 | 197 | 65,512 | 21,500 | 63 | 35,787 | 14,540 | 69 | 118,883 | 23,306 | 6 | 25,578 | 20,626 | 6 | 88,063 | 1,800 | 4 | 103,594 | 29,725 | 1 | 50,447 | … | 2 | 283,000 | 1,107 | 1,782 | 849,684 | 170,451 |
| Wallace | 62 | 124 | 155 | 43 | 637 | 520 | 31 | 1,748 | 714 | 111 | 7,446 | 11,521 | 56 | 6,630 | 8,067 | 44 | 13,061 | 5,901 | 20 | 14,091 | 1,873 | 14 | 25,618 | 1,502 | 6 | 31,450 | 8,358 | 5 | 64,341 | 4,698 | 5 | 67,322 | 95,121 | 1 | … | 64,000 | … | … | … | 398 | 232,474 | 202,433 |
| Fiord | … | … | … | … | … | … | … | … | … | … | … | … | … | … | … | … | … | … | … | … | … | … | … | … | … | … | … | … | … | … | … | … | … | … | … | … | … | … | … | … | … | … |
| Stewart Island | 9 | 64 | … | 22 | 401 | 40 | … | … | … | … | … | … | … | … | … | … | … | … | … | … | … | … | … | … | … | … | … | … | … | … | … | … | … | … | … | … | … | … | … | 31 | 468 | 40 |
| Adjacent island | 6 | 9 | 16 | 10 | 271 | 70 | 8 | 476 | 160 | 12 | 1,567 | … | 9 | 2,341 | … | 13 | 4,954 | 1,320 | 9 | 3,949 | 3,200 | 13 | 22,474 | 4,040 | 1 | 5,600 | … | … | … | … | … | … | … | … | … | … | … | … | … | 81 | 41,641 | 8,806 |
| Chatham Island | 2 | … | 12 | 2 | … | 100 | 1 | 100 | … | 4 | 132 | 500 | 2 | … | 550 | 2 | 550 | 550 | 2 | 900 | 850 | 5 | 10,500 | 6,500 | 1 | 9,283 | … | 4 | 17,130 | 35,300 | 2 | 5,000 | 55,000 | … | … | … | … | … | … | 27 | 43,595 | 99,362 |
| Total | 7,680 | 19,949 | 14,724 | 6,498 | 128,430 | 68,774 | 4,462 | 237,768 | 108,734 | 5,066 | 520,035 | 264,984 | 2,453 | 435,524 | 197,190 | 258 | 734,565 | 280,813 | 823 | 462,158 | 209,963 | 1,097 | 1,698,787 | 608,620 | 185 | 1,048,404 | 331,429 | 169 | 1,754,822 | 613,626 | 11,111 | 2,153,658 | 1,130,629 | 18 | 831,609 | 462,134 | 7 | 283,641 | 606,107 | 30,832 | 10,309,170 | 4,897,727 |
Table III. Table III. Showing the Number of Occupied Holdings of over One Acre in extent in the different Provincial Districts, classified according to size.
| This Table deals with the full extent of occupied land, exclusive of Crown pastoral leases. | ||||||||||||||
|---|---|---|---|---|---|---|---|---|---|---|---|---|---|---|
| Provincial Districts, | Holdings. | |||||||||||||
| Total | Over 1 Acre to 10 inclusive. | Over 10 Acres to 50 inclusive. | Over 50 Acres to 100 inclusive. | Over 100 Acres to 200 inclusive. | Over 200 Acres to 320 inclusive. | Over 320 Acres to 640 inclusive. | Over 640 Acres to 1,000 inclusive. | Over 1,000 Acres to 5,000 inclusive. | Over 5,000 Acres to 10,000 inclusive. | Over 10,000 Acres to 20,000 inclusive. | Over 20,000 Acres to 50,000 inclusive. | Over 50,000 Acres to 100,000 inclusive. | Upwards of 100,000 Acres. | |
| Auckland | 6,785 | 1,697 | 1,375 | 1,027 | 1,146 | 599 | 487 | 167 | 201 | 41 | 23 | 14 | 6 | 1 |
| Taranaki | 1,374 | 216 | 265 | 347 | 257 | 110 | 122 | 29 | 27 | … | 1 | … | … | … |
| Wellington | 3,877 | 1,010 | 788 | 538 | 523 | 244 | 349 | 139 | 214 | 31 | 30 | 8 | 1 | 2 |
| Hawke's Bay | 1,160 | 316 | 367 | 138 | 83 | 33 | 44 | 34 | 54 | 22 | 36 | 28 | 3 | 2 |
| Marlborough | 798 | 217 | 183 | 103 | 125 | 48 | 36 | 17 | 36 | 10 | 11 | 11 | 1 | … |
| Nelson | 1,858 | 408 | 437 | 319 | 332 | 139 | 132 | 40 | 31 | 2 | 5 | 12 | 1 | … |
| Westland | 341 | 125 | 120 | 48 | 35 | 2 | 5 | 2 | 4 | … | … | … | … | … |
| Canterbury | 7,121 | 1,711 | 1,635 | 1,056 | 1,058 | 607 | 500 | 192 | 272 | 44 | 28 | 16 | 2 | … |
| Otago | 7,491 | 1,978 | 1,325 | 835 | 1,503 | 669 | 581 | 206 | 253 | 34 | 31 | 20 | 4 | 2 |
| Chatham Islands | 27 | 2 | 2 | 1 | 4 | 2 | 2 | 2 | 5 | 1 | 4 | 2 | … | … |
| Total | 30,832 | 7,680 | 6,498 | 4,462 | 5,066 | 2,453 | 2,258 | 828 | 1,097 | 185 | 169 | 111 | 18 | 7 |
NOTE.—Lands occupied by Maoris are not included in the above table.
Table IV. Table IV. Showing the Number and Acreage of Holdings of Land, classified according to Size, returned as Unoccupied and Uncultivated in the Census Schedules.
| Provincial Districts. | Total. | Over 1 Acre to 10 Acres inclusive. | Over 10 Acres to 50 Acres inclusive. | Over 50 Acres to 100 Acres inclusive. | Over 100 Acres to 200 Acres inclusive. | Over 200 Acres to 320 Acres inclusive. | Over 320 Acres to 640 Acres inclusive. | Over 640 Acres to 1,000 Acres inclusive. | Over 1,000 Acres to 5,000 Acres inclusive. | Over 5,000 Acres to 10,000 Acres inclusive. | Over 10,000 Acres to 20,000 Acres inclusive. | Over 20,000 Acres to 50,000 Acres inclusive. | ||||||||||||
|---|---|---|---|---|---|---|---|---|---|---|---|---|---|---|---|---|---|---|---|---|---|---|---|---|
| Acres. | No. of Holdings. | Acres. | No. of Holdings. | Acres. | No. of Holdings. | Acres. | No. of Holdings. | Acres. | No. of Holdings. | Acres. | No. of Holdings. | Acres. | No. of Holdings. | Acres. | No. of Holdings. | Acres. | No. of Holdings. | Acres. | No. of Holdings. | Acres. | No. of Holdings. | Acres. | No. of Holdings. | |
| Auckland | 481,526 | 1,373 | 767 | 156 | 11,963 | 310 | 28,651 | 370 | 36,520 | 246 | 32,343 | 125 | 41,814 | 93 | 19,765 | 25 | 68,027 | 34 | 43,176 | 6 | 81,800 | 5 | 116,700 | 3 |
| Taranaki | 31,472 | 228 | 92 | 27 | 1,174 | 33 | 5,511 | 74 | 7,252 | 49 | 6,602 | 27 | 6,380 | 15 | 1,460 | 2 | 3,000 | 1 | … | … | … | … | … | … |
| Wellington | 105,002 | 406 | 455 | 129 | 1,729 | 62 | 6,001 | 76 | 7,094 | 48 | 9,903 | 39 | 9,164 | 21 | 13,151 | 16 | 25,889 | 12 | 15,554 | 2 | 16,062 | 1 | … | … |
| Hawke's Bay | 28,718 | 108 | 98 | 28 | 1,036 | 31 | 1,784 | 23 | 2,078 | 13 | 1,285 | 5 | 1,873 | 4 | 1,645 | 2 | 4,919 | 1 | … | … | 14,000 | 1 | … | … |
| Marlborough | 22,429 | 43 | 71 | 13 | 401 | 11 | 508 | 6 | 653 | 4 | 247 | 1 | 1,499 | 4 | 750 | 1 | 3,000 | 1 | 15,300 | 2 | … | … | … | … |
| Nelson | 37,818 | 256 | 313 | 52 | 1,627 | 56 | 4,212 | 54 | 6,955 | 45 | 6,593 | 25 | 6,319 | 14 | 2,913 | 4 | 8,886 | 6 | … | … | … | … | … | … |
| Westland | 9,785 | 69 | 97 | 19 | 593 | 20 | 1,167 | 14 | 1,073 | 7 | 1,038 | 4 | 1,530 | 3 | 787 | 1 | 3,500 | 1 | … | … | … | … | … | … |
| Canterbury | 135,171 | 527 | 491 | 109 | 4,008 | 132 | 5,396 | 69 | 9,833 | 65 | 7,850 | 31 | 30,780 | 67 | 23,518 | 28 | 42,295 | 25 | … | … | 11,000 | 1 | … | … |
| Otago | 79,514 | 477 | 707 | 162 | 3,081 | 101 | 5,101 | 68 | 9,176 | 60 | 9,233 | 37 | 10,617 | 25 | 12,029 | 15 | 8,570 | 7 | 8,000 | 1 | 13,000 | 1 | … | … |
| Chatham Islands | … | … | … | … | … | … | … | … | … | … | … | … | … | … | … | … | … | … | … | … | … | … | … | … |
| Total | 931,435 | 3,487 | 3,091 | 695 | 25,612 | 756 | 58,332 | 754 | 80,634 | 537 | 75,094 | 294 | 109,976 | 246 | 76,018 | 94 | 168,086 | 88 | 82,030 | 11 | 135,862 | 9 | 116,700 | 3 |
NOTE.—This table has been compiled from the information supplied by the Census schedule; but it cannot be considered as exhibiting the total number and acreage of unoccupied holdings, as many proprietors are absent from the colony, and others residing in the colony have not given any particulars respecting such holdings.
Table V. Table V. Showing the Extent of Occupied Holdings over 1 Acre, Land Fenced, and the Number of Live Stock and Poultry (exclusive of Stock and Poultry belonging to Maoris), as returned by the Census of the 3rd April, 1881.
| Provincial Districts. | Extent of Occupied Holdings over 1 Acre. | Land Fenced. | Live Stock. | Poultry. | ||||||||||||||||||
|---|---|---|---|---|---|---|---|---|---|---|---|---|---|---|---|---|---|---|---|---|---|---|
| Number of Acres. | Number. | Number. | ||||||||||||||||||||
| Total. | Freehold. | Leasehold or Not Freehold of Occupier, including Crown Land rented for Other than Pastoral Purposes. | Crown Land rented for Pastoral Purposes. | Acres. | Total of all Descriptions. | Horses. | Brood Mares (included in the foregoing). | Mules and Asses. | Cattle (including Calves). | Breeding Cows (included in the foregoing). | Sheep (including Lambs). | Breeding Ewes (included in the foregoing). | Goats. | Pigs. | Other Stock. | Total of all Descriptions. | Fowls. | Geese. | Turkeys. | Ducks. | Unspecified. | |
| Auckland | 2,859,490 | 1,564,579 | 1,136,791 | 158,120 | 823,371 | 757,020 | 25,545 | 4,861 | 134 | 158,181 | 52,072 | 534,980 | 230,055 | 3,099 | 35,040 | 51 | 307,184 | 236,000 | 7,132 | 29,705 | 33,446 | 901 |
| Taranaki | 234,169 | 134,876 | 99,293 | … | 122,778 | 136,573 | 5,959 | 1,177 | 4 | 51,846 | 15,147 | 69,413 | 26,657 | 109 | 9,221 | 21 | 48,619 | 39,496 | 1,987 | 2,464 | 4,511 | 161 |
| Wellington | 2,255,820 | 1,302,172 | 953,314 | 334 | 1,157,727 | 1,737,335 | 21,149 | 3,458 | 51 | 140,951 | 44,707 | 1,547,167 | 634,673 | 878 | 27,061 | 78 | 177,396 | 141,681 | 5,711 | 11,780 | 17,771 | 453 |
| Hawke's Bay | 2,136,646 | 1,107,658 | 957,169 | 77,819 | 1,578,662 | 1,953,323 | 7,561 | 1,236 | 9 | 36,213 | 12,552 | 1,903,413 | 762,699 | 119 | 6,003 | 5 | 68,970 | 51,114 | 1,259 | 10,830 | 5,698 | 69 |
| Marlborough | 1,843,438 | 744,703 | 69,397 | 1,029,338 | 1,047,645 | 780,212 | 4,454 | 829 | 10 | 9,919 | 2,878 | 760,781 | 280,927 | 359 | 4,687 | 2 | 35,020 | 29,034 | 954 | 1,936 | 3,008 | 88 |
| Nelson | 1,540,502 | 692,330 | 147,560 | 700,612 | 941,663 | 680,786 | 6,634 | 1,251 | 13 | 31,620 | 10,582 | 631,286 | 206,148 | 1,699 | 9,497 | 37 | 93,734 | 76,070 | 3,840 | 6,018 | 7,643 | 163 |
| Westland | 412,936 | 21,456 | 13,141 | 378,339 | 7,677 | 17,301 | 1,103 | 141 | 6 | 7,944 | 2,613 | 4,428 | 2,299 | 2,098 | 1,722 | … | 37,749 | 30,609 | 2,054 | 293 | 4,700 | 93 |
| Canterbury | 6,012,205 | 2,247,592 | 560,740 | 3,203,873 | 4,150,644 | 3,743,765 | 45,609 | 8,141 | 83 | 111,155 | 36,771 | 3,519,404 | 1,305,456 | 653 | 66,765 | 66 | 386,182 | 333,042 | 8,864 | 11,099 | 32,603 | 574 |
| Otago | 9,407,303 | 2,450,209 | 866,960 | 6,090,134 | 6,285,217 | 4,187,465 | 43,019 | 8,761 | 61 | 150,150 | 49,318 | 3,952,022 | 1,473,850 | 2,167 | 39,907 | 139 | 409,622 | 350,568 | 12,675 | 14,479 | 31,512 | 388 |
| Chatham Islands | 142,957 | 43,595 | 99,362 | … | 78,190 | 63,745 | 703 | 134 | 1 | 658 | 179 | 62,191 | 26,079 | 12 | 180 | … | 1,638 | 1,134 | 232 | 85 | 179 | 8 |
| Total of Census, April, 1881 | 26,845,466 | 10,309,170 | 4,897,727 | 11,638,569 | 16,193,574 | 14,057,525 | 161,736 | 29,989 | 362 | 698,637 | 226,819 | 12,985,085 | 4,948,843 | 11,223 | 200,083 | 399 | 1,566,114 | 1,288,748 | 44,708 | 88,689 | 141,071 | 2,898 |
| Total of Census, March, 1878 | 25,269,146 | 8,369,547 | 3,709,525 | 12,690,074 | 11,567,565 | 14,007,838 | 137,768 | 25,863 | 241 | 578,430 | 186,067 | 13,069,338 | 5,138,974 | 14,243 | 201,337 | 481 | 1,323,542 | 1,039,891 | 42,355 | 116,871 | 114,246 | 10,179 |
| Numerical increase since 1878 | 1,576,320 | 1,439,623 | 1,188,202 | … | 4,626,009 | 49,687 | 23,968 | 4,126 | 121 | 120,207 | 40,752 | … | … | … | … | … | 242,572 | 248,857 | 2,353 | … | 26,825 | … |
| Numerical decrease since 1878 | … | … | … | 1,051,505 | … | … | … | … | … | … | … | 84,253 | 190,131 | 3,020 | 7,254 | 82 | … | … | … | 28,182 | … | 7,281 |
| Centesimal increase | 6.24 | 16.23 | 32.03 | … | 39.99 | 0.35 | 17.40 | 15.95 | 50.21 | 20.78 | 23.90 | … | … | … | … | … | 18.33 | 23.93 | 5.56 | … | 23.48 | … |
| Centesimal decrease | … | … | … | 8.28 | … | … | … | … | … | … | … | 0.64 | 3.70 | 21.20 | 3.50 | 17.05 | … | … | … | 24.11 | … | 71.53 |
Table VI. Table VI. Showing the Extent of Occupied Holdings, and the Number of Live Stuck and Poultry (exclusive of Land, Stock, and Poultry belonging to Maoris).
| Counties. | Extent of Occupied Holdings over 1 Acre in extent. | Land Fenced. | Live Stock. | Poultry | ||||||||||||||||||
|---|---|---|---|---|---|---|---|---|---|---|---|---|---|---|---|---|---|---|---|---|---|---|
| Number of Acres. | Number. | |||||||||||||||||||||
| Total. | Freehold. | Leasehold, or not Freehold of Occupier, including Crown Land rented for other than Pastoral Purposes. | Crown Land rented for Pastoral Purposes. | Acres. | Total Number of all Descriptions. | Horses. | Brood Mares (included in the foregoing). | Asses and Mules. | Cattle (including Calves). | Breeding Cows (included in the foregoing). | Sheep (including Lambs). | Breeding Ewes (included in the foregoing). | Goats. | Pigs. | Other Stocks. | Total Number of all Descriptions. | Fowls. | Geese. | Turkeys. | Ducks. | Other Poultry. | |
| Mongonui | 256,961 | 50,463 | 103,296 | 103,202 | 8,052 | 22,355 | 739 | 178 | 1 | 4,884 | 1,967 | 14,499 | 7,029 | 83 | 2,149 | … | 6,466 | 5,205 | 80 | 775 | 369 | 37 |
| Bay of Islands | 81,985 | 50,275 | 27,196 | 4,514 | 20,547 | 26,030 | 926 | 212 | 2 | 5,020 | 1,519 | 19,073 | 6,920 | 169 | 839 | 1 | 7,074 | 6,096 | 116 | 388 | 474 | … |
| Hokianga | 61,723 | 5,143 | 56,580 | … | 1,563 | 3,239 | 231 | 46 | … | 996 | 340 | 1,223 | 685 | 29 | 760 | … | 2,133 | 1,559 | 95 | 152 | 322 | 5 |
| Hobson | 98,192 | 56,259 | 1,933 | 40,000 | 14,582 | 14,620 | 651 | 134 | 32 | 5,454 | 1,704 | 6,874 | 3,241 | 98 | 1,521 | … | 10,139 | 7,675 | 80 | 1,112 | 1,222 | 50 |
| Whangarei | 113,160 | 87,903 | 16,971 | 8,286 | 28,567 | 43,539 | 1,501 | 365 | … | 10,499 | 3,625 | 30,053 | 13,842 | 113 | 1,373 | … | 21,112 | 15,974 | 73 | 3,709 | 1,224 | 32 |
| Rodney | 167,110 | 156,670 | 10,440 | … | 56,330 | 32,920 | 1,060 | 220 | 4 | 10,454 | 3,281 | 20,228 | 9,386 | 88 | 1,079 | 7 | 19,710 | 13,675 | 519 | 3,359 | 2,090 | 67 |
| Waitemata | 112,572 | 96,080 | 16,492 | … | 28,317 | 17,400 | 924 | 144 | 11 | 6,974 | 2,072 | 7,856 | 3,742 | 239 | 1,396 | … | 18,345 | 14,971 | 289 | 1,119 | 1,903 | 63 |
| Eden | 46,521 | 32,119 | 14,402 | … | 22,213 | 18,982 | 3,106 | 328 | 21 | 6,882 | 2,864 | 5,557 | 2,375 | 332 | 3,081 | 3 | 63,961 | 49,343 | 1,859 | 1,198 | 11,354 | 207 |
| Manukau | 2,311,839 | 195,036 | 36,597 | 206 | 131,852 | 78,717 | 4,524 | 1,043 | 9 | 33,257 | 11,23s | 35,028 | 18,410 | 119 | 5,773 | 7 | 57,921 | 46,475 | 779 | 4,257 | 6,200 | 210 |
| Coromandel | 51,950 | 37,453 | 13,017 | 1,480 | 2,752 | 5,258 | 292 | 34 | 7 | 1,600 | 601 | 1,985 | 987 | 406 | 968 | … | 6,952 | 5,330 | 379 | 418 | 825 | … |
| Thames | 29,219 | 19,713 | 9,506 | … | 6,880 | 12,000 | 813 | 87 | 8 | 3,537 | 1,163 | 3,685 | 1,481 | 932 | 3,025 | … | 20,043 | 16,138 | 980 | 1,215 | 1,646 | 64 |
| Piako | 213,204 | 184,719 | 28,485 | … | 102,179 | 32,193 | 676 | 87 | … | 13,674 | 4,390 | 17,330 | 6,032 | 5 | 508 | … | 2,779 | 2,074 | 54 | 473 | 176 | 2 |
| Tauranga | 66,458 | 46,190 | 20,268 | … | 21,126 | 15,868 | 1,025 | 192 | 3 | 5,107 | 1,687 | 8,328 | 1,827 | 69 | 1,336 | … | 10,608 | 8,367 | 246 | 809 | 1,085 | 101 |
| Whakatane | 68,767 | 19,663 | 49,104 | … | 20,457 | 21,852 | 879 | 216 | 1 | 4,522 | 1,415 | 15,266 | 9,044 | 47 | 1,135 | 2 | 5,905 | 4,486 | 374 | 546 | 475 | 24 |
| Cook | 471,507 | 124,427 | 347,080 | … | 164,596 | 235,251 | 2,800 | 479 | 1 | 9,912 | 3,162 | 220,625 | 97,193 | 20 | 1,862 | 31 | 18,379 | 12,869 | 119 | 3,542 | 1,847 | 2 |
| Wairoa | 474,831 | 145,884 | 282,428 | 46,519 | 149,852 | 250,128 | 916 | 228 | … | 2,031 | 687 | 246,428 | 88,930 | 15 | 738 | … | 6,049 | 3,295 | 142 | 2,039 | 551 | 22 |
| East Taupo | 123,242 | … | 123,242 | … | 80 | 9,184 | 100 | 3 | … | 360 | 112 | 8,637 | 4,800 | … | 87 | … | 225 | 170 | 5 | 15 | 35 | … |
| West Taupo | 97,700 | 2,500 | 95,200 | … | 400 | 10,162 | 25 | 5 | … | 108 | 4 | 10,015 | 5,000 | … | 14 | … | 23 | 21 | … | … | 2 | … |
| Waipa | 126,150 | 117,708 | 8,442 | … | 79,444 | 42,382 | 2,190 | 461 | … | 13,893 | 3,621 | 23,953 | 9,350 | 12 | 2,334 | … | 13,213 | 10,167 | 403 | 1,964 | 676 | 3 |
| Waikato | 164,079 | 150,624 | 13,455 | … | 69,046 | 29,473 | 1,790 | 346 | 2 | 11,349 | 4,126 | 14,807 | 7,552 | 51 | 1,474 | … | 11,458 | 9,374 | 180 | 1,120 | 776 | 8 |
| Raglan | 112,537 | 35,440 | 107,097 | … | 11,135 | 21,659 | 591 | 135 | … | 6,554 | 1,993 | 12,241 | 6,062 | 22 | 2,251 | … | 4,381 | 2,817 | 223 | 1,058 | 265 | 18 |
| Kawhia | 1,720 | 130 | 1,590 | … | 1,650 | 1,810 | 244 | 48 | … | 302 | 93 | 48 | 40 | 3 | 1,213 | … | 414 | 261 | 34 | 89 | 30 | … |
| Taranaki | 120,073 | 76,822 | 43,251 | … | 60,440 | 45,261 | 3,105 | 534 | 4 | 21,475 | 6,967 | 14,368 | 6,793 | 105 | 6,187 | 14 | 34,038 | 27,555 | 1,400 | 1,860 | 3,146 | 77 |
| Patea | 153,442 | 80,000 | 73,442 | … | 94,742 | 142,388 | 4,389 | 919 | 1 | 42,103 | 11,585 | 91,503 | 32,541 | 9 | 4,376 | 7 | 20,724 | 16,708 | 775 | 1,277 | 1,850 | 114 |
| Wanganui | 314,439 | 100,839 | 213,600 | … | 131,141 | 234,095 | 4,166 | 783 | 10 | 30,244 | 9,129 | 194,771 | 85,217 | 100 | 4,789 | 15 | 28,953 | 22,257 | 1,398 | 10,584 | 2,611 | 103 |
| Rangitikei | 202,752 | 154,546 | 48,206 | … | 147,627 | 206,155 | 2,759 | 520 | 3 | 18,837 | 6,604 | 182,217 | 77,550 | 9 | 2,314 | 16 | 15,286 | 11,899 | 670 | 153 | 874 | 24 |
| Manawatu | 249,581 | 156,076 | 93,482 | … | 125,105 | 175,383 | 3,536 | 545 | 13 | 27,58S | 8,743 | 137,226 | 59,962 | 95 | 6,881 | 47 | 31,072 | 25,148 | 1,140 | 1,860 | 2,861 | 61 |
| Hutt | 176,389 | 110,622 | 63,767 | … | 56,483 | 145,675 | 2,909 | 333 | 9 | 13,648 | 5,614 | 122,285 | 49,222 | 641 | 6,183 | … | 57,354 | 46,701 | 1,364 | 1,328 | 7,900 | 61 |
| Wairarapa West | 323,754 | 239,714 | 84,040 | … | 200,795 | 231,132 | 4,200 | 668 | 1 | 20,614 | 5,937 | 201,415 | 78,588 | 26 | 4,876 | … | 32,591 | 26,640 | 759 | 2,404 | 2,704 | 84 |
| Wairarapa East | 662,270 | 516,581 | 145,689 | … | 464,021 | 590,664 | 1,766 | 301 | 11 | 17,268 | 4,896 | 570,983 | 224,948 | 2 | 634 | … | 5,688 | 4,016 | 188 | 1,089 | 305 | 90 |
| Waipawa | 765,674 | 523,076 | 242,598 | … | 653,971 | 862,095 | 3,115 | 500 | 1 | 21,848 | 7,426 | 834,494 | 339,869 | 35 | 2,602 | … | 24,215 | 20,005 | 473 | 2,142 | 1,566 | 29 |
| Hawke's Bay | 1,265,134 | 494,969 | 738,865 | 31,300 | 793,197 | 926,814 | 4,032 | 594 | 10 | 13,994 | 5,130 | 967,818 | 388,259 | 69 | 2,876 | 5 | 40,583 | 28,913 | 653 | 7,307 | 3,684 | 26 |
| Sounds | 74,895 | 11,000 | 27,155 | 36,740 | 21,764 | 28,725 | 36 | 7 | 1 | 1,133 | 308 | 26,495 | 10,256 | 101 | 959 | … | 2,747 | 1,853 | 154 | 409 | 330 | 1 |
| Marlborough | 1,401,759 | 649,921 | 37,049 | 714,789 | 894,205 | 606,372 | 3,485 | 661 | 6 | 7,387 | 2,195 | 592,030 | 219,123 | 251 | 3,214 | 2 | 28,501 | 24,038 | 768 | 1,287 | 2,321 | 87 |
| Kaikoura | 366,784 | 83,782 | 5,193 | 277,809 | 131,676 | 145,115 | 933 | 161 | 3 | 1,399 | 375 | 142,256 | 51,548 | 7 | 517 | … | 3,772 | 3,143 | 32 | 240 | 357 | … |
| Counties. | Extent of Occupied Holdings over 1 Acre in extent. | Land Fenced. | Live Stock. | Poultry | ||||||||||||||||||
|---|---|---|---|---|---|---|---|---|---|---|---|---|---|---|---|---|---|---|---|---|---|---|
| Number of Acres. | Number. | |||||||||||||||||||||
| Total. | Freehold. | Leasehold, or not Freehold of Occupier, including Crown Land rented for other than Pastoral Purposes. | Crown Land rented for Pastoral Purposes. | Acres. | Total Number of all Descriptions. | Horses. | Brood Mares (included in the foregoing). | Asses and Mules. | Cattle (including Calves). | Breeding Cows (included in the foregoing). | Sheep (including Lambs). | Breeding Ewes (included in the foregoing). | Goats. | Pigs. | Other Stocks. | Total Number of all Descriptions. | Fowls. | Geese. | Turkeys. | Ducks. | Other Poultry. | |
| Waimea | 268,318 | 141,014 | 64,023 | 63,281 | 72,367 | 108,448 | 3,731 | 712 | 5 | 12,296 | 4,451 | 86,728 | 36,581 | 307 | 5,344 | 37 | 54,701 | 45,944 | 1,978 | 2,659 | 4,029 | 91 |
| Collingwood | 47,475 | 24,128 | 8,664 | 14,683 | 7,078 | 23,703 | 737 | 176 | … | 4,618 | 1,559 | 16,351 | 8,472 | 27 | 1,970 | … | 7,414 | 5,159 | 252 | 1,254 | 726 | 23 |
| Buller | 10,803 | 1,912 | 7,865 | 1,026 | 1,999 | 5,264 | 258 | 25 | … | 2,775 | 1,017 | 555 | 143 | 937 | 709 | … | 10,747 | 9,033 | 504 | 136 | 1,069 | 5 |
| Inangahua | 54,897 | 9,254 | 16,751 | 28,892 | 5,034 | 10,065 | 518 | 81 | 1 | 3,887 | 1,268 | 4,925 | 2,177 | 133 | 601 | … | 9,583 | 7,119 | 1,470 | 1,127 | 848 | 19 |
| Grey | 38,696 | 10,642 | 13,898 | 14,156 | 10,367 | 11,411 | 719 | 88 | 5 | 4,847 | 1,522 | 3,827 | 1,934 | 1,037 | 976 | … | 21,741 | 17,589 | 1,451 | 552 | 2,133 | 16 |
| Westland | 393,919 | 15,092 | 11,698 | 367,129 | 5,257 | 12,825 | 901 | 138 | 4 | 6,983 | 2,354 | 2,362 | 1,290 | 1,356 | 1,219 | … | 24,589 | 19,931 | 1,203 | 134 | 3,236 | 85 |
| Amuri | 942,849 | 316,543 | 37,802 | 588,504 | 650,797 | 386,355 | 717 | 119 | 1 | 3,627 | 901 | 381,705 | 109,350 | … | 305 | … | 1,865 | 1,430 | 12 | 274 | 142 | 7 |
| Cheviot | 196,481 | 195,201 | … | 1,280 | 196,481 | 140,016 | 156 | 53 | 3 | 531 | 123 | 139,261 | 48,500 | … | 65 | … | 843 | 474 | 24 | 175 | 160 | 10 |
| Ashley | 1,060,111 | 426,106 | 76,855 | 557,150 | 638,279 | 659,801 | 8,415 | 1,507 | 18 | 20,151 | 6,559 | 621,465 | 218,482 | 53 | 9,699 | … | 67,345 | 58,834 | 1,367 | 1,751 | 5,349 | 44 |
| Akaroa | 196,026 | 143,727 | 24,295 | 28,004 | 120,350 | 189,521 | 2,157 | 503 | 2 | 19,695 | 7,364 | 162,384 | 75,311 | 112 | 5,155 | 116 | 18,666 | 14,832 | 880 | 1,366 | 1,574 | 44 |
| Selwyn | 980,572 | 373,055 | 175,523 | 431,994 | 650,987 | 653,307 | 16,153 | 2,634 | 11 | 32,357 | 11,946 | 578,946 | 227,873 | 279 | 25,511 | 50 | 166,998 | 144,467 | 3,366 | 2,943 | 15,860 | 362 |
| Ashburton | 1,267,378 | 454,678 | 140,021 | 672,679 | 115,272 | 668,005 | 6,658 | 1,241 | 16 | 11,820 | 2,995 | 638,940 | 246,655 | 44 | 10,527 | … | 37,250 | 32,697 | 754 | 1,196 | 2,550 | 53 |
| Geraldine | 1,678,323 | 454,056 | 96,468 | 1,127,799 | 956,486 | 997,223 | 8,595 | 1,402 | 32 | 17,829 | 5,161 | 958,380 | 340,501 | 151 | 12,236 | … | 69,364 | 58,827 | 1,988 | 2,756 | 5,708 | 85 |
| Waimate | 786,925 | 393,877 | 47,578 | 345,470 | 621,270 | 567,367 | 3,585 | 844 | 4 | 9,283 | 2,743 | 550,819 | 192,634 | 44 | 3,632 | … | 26,469 | 23,302 | 509 | 1,087 | 1,555 | 16 |
| Waitaki | 1,289,101 | 265,227 | 117,795 | 896,079 | 926,417 | 645,025 | 5,662 | 1,055 | 5 | 14,405 | 4,701 | 619,292 | 195,306 | 135 | 5,519 | … | 57,265 | 51,369 | 562 | 1,761 | 3,378 | 195 |
| Waikouaiti | 407,051 | 137,631 | 68,243 | 201,177 | 361,364 | 242,329 | 3,677 | 737 | 9 | 14,121 | 5,658 | 220,280 | 99,871 | 135 | 4,006 | 101 | 48,394 | 42,566 | 1,524 | 1,169 | 3,124 | 11 |
| Peninsula | 19,825 | 9,482 | 10,343 | … | 14,625 | 11,747 | 809 | 128 | … | 4,904 | 2,531 | 4,654 | 2,833 | 41 | 1,339 | … | 13,205 | 11,587 | 201 | 163 | 1,254 | … |
| Taieri | 501,324 | 164,668 | 48,148 | 289,508 | 343,074 | 262,837 | 5,444 | 787 | 2 | 20,678 | 5,674 | 231,790 | 73,453 | 128 | 4,795 | … | 73,919 | 63,947 | 1,607 | 1,208 | 7,107 | 50 |
| Bruce | 260,541 | 212,403 | 41,159 | 6,979 | 243,232 | 204,546 | 3,098 | 768 | 22 | 8,709 | 3,005 | 189,987 | 81,965 | 32 | 2,698 | … | 29,221 | 25,660 | 346 | 855 | 2,344 | 16 |
| Clutha | 415,391 | 300,785 | 45,466 | 69,140 | 371,257 | 270,244 | 3,021 | 718 | 4 | 10,001 | 3,385 | 254,787 | 113,374 | 55 | 2,376 | … | 26,672 | 24,523 | 187 | 450 | 1,508 | 4 |
| Tuapeka | 685,975 | 208,474 | 52,739 | 424,762 | 390,589 | 364,571 | 4,024 | 986 | 10 | 11,326 | 4,148 | 345,393 | 124,336 | 81 | 3,705 | 32 | 29,245 | 23,729 | 1,725 | 1,650 | 2,135 | 6 |
| Maniototo | 929,410 | 20,174 | 27,708 | 881,538 | 552,294 | 354,039 | 1,719 | 305 | 1 | 4,766 | 1,481 | 346,206 | 114,818 | 458 | 884 | 5 | 13,158 | 9,343 | 1,837 | 1,204 | 772 | 2 |
| Vincent | 1,201,964 | 17,740 | 45,006 | 1,139,218 | 787,275 | 525,661 | 2,199 | 394 | 2 | 5,443 | 1,789 | 516,273 | 168,546 | 497 | 1,247 | … | 16,765 | 11,675 | 2,371 | 1,348 | 1,345 | 26 |
| Lake | 5,126,395 | 33,092 | 27,429 | 1,065,874 | 415,220 | 262,978 | 2,006 | 449 | … | 4,849 | 1,653 | 253,947 | 107,935 | 306 | 1,869 | 1 | 17,759 | 13,603 | 648 | 2,366 | 1,505 | 62 |
| Southland | 1,668,160 | 849,684 | 170,451 | 648,025 | 1,295,757 | 739,764 | 8,991 | 1,939 | 4 | 41,022 | 12,266 | 679,947 | 269,032 | 199 | 9,601 | … | 68,818 | 59,869 | 1,288 | 1,577 | 6,077 | 7 |
| Wallace | 940,528 | 232,474 | 202,433 | 505,621 | 585,956 | 310,603 | 2,405 | 504 | 2 | 9,823 | 2,987 | 296,535 | 125,546 | 7 | 1,831 | … | 14,564 | 12,211 | 344 | 702 | 1,298 | 9 |
| Fiord | … | … | … | … | … | 6 | … | … | … | … | … | … | … | 6 | … | … | 61 | 57 | … | … | 4 | … |
| Stewart Island | 3,548 | 468 | 40 | 3,000 | 157 | 1,656 | 3 | 1 | … | 123 | 43 | 1,401 | 11,835 | 87 | 42 | … | 666 | 57 512 | 35 | 26 | 93 | … |
| Adjacent Islands | 51,213 | 41,641 | 8,806 | 766 | 13,396 | 17,577 | 231 | 44 | 23 | 2,206 | 836 | 11,154 | 7,207 | 262 | 701 | … | 4,375 | 2,107 | 140 | 1,752 | 376 | … |
| Chatham Islands | 142,957 | 43,595 | 99,362 | … | 78,190 | 63,745 | 703 | 134 | 1 | 658 | 179 | 62,191 | 26,079 | 12 | 150 | … | 1,638 | 1,134 | 232 | 85 | 179 | 8 |
| Total | 26,845,466 | 10,309,170 | 4,897,727 | 11,638,569 | 16,193,574 | 14,057,525 | 161,736 | 29,989 | 362 | 698,637 | 226,819 | 12,985,085 | 4,948,843 | 11,223 | 200,083 | 399 | 1,566,114 | 1,288,748 | 44,708 | 88,689 | 141,071 | 2,898 |
Table VII. Table VIII.Showing the Numbers of Live Stock (exclusive of Stock belonging to Maoris), in the several Provincial Districts of New Zealand, in the Years 1858, 1861, 1864, 1867, 1871, 1874, 1878, and 1881 respectively.
| Provincial Districts. | Horses. | Asses and Mules. | Cattle. | Sheep. | Goats. | Pigs. | Poultry. | |
|---|---|---|---|---|---|---|---|---|
| * Poultry not enumerated in 1858. | ||||||||
| Auckland | 1858 | 3,839 | 7 | 31,700 | 58,792 | 3,079 | 11,461 | * |
| 1861 | 5,621 | 20 | 36,482 | 67,803 | 5,999 | 12,612 | 82,861 | |
| 1864 | 7,482 | 113 | 42,294 | 73,151 | 3,264 | 13,072 | 105,404 | |
| 1867 | 9,436 | 106 | 53,066 | 172,030 | 3,382 | 25,814 | 145,222 | |
| 1871 | 11,620 | 64 | 80,443 | 210,760 | 4,032 | 34,008 | 184,827 | |
| 1874 | 14,555 | 50 | 105,595 | 340,241 | 5,107 | 32,439 | 258,439 | |
| 1878 | 20,932 | 62 | 127,575 | 540,277 | 4,737 | 38,459 | 267,182 | |
| 1881 | 25,545 | 124 | 158,181 | 534,980 | 3,099 | 35,040 | 307,184 | |
| Taranaki | 1858 | 452 | 2 | 4,052 | 16,000 | 55 | 1,931 | * |
| 1861 | 220 | … | 2,171 | 10,566 | 33 | 245 | 2,283 | |
| 1864 | 737 | … | 4,229 | 12,350 | 27 | 368 | 4,570 | |
| 1867 | 1,441 | 4 | 3,406 | 19,772 | 62 | 2,112 | 13,807 | |
| 1871 | 1,825 | 9 | 7,966 | 24,281 | 136 | 5,032 | 21,569 | |
| 1874 | 2,512 | 20 | 17,621 | 51,321 | 176 | 3,598 | 28,139 | |
| 1878 | 4,084 | 2 | 33,929 | 81,378 | 171 | 7,578 | 37,178 | |
| 1881 | 5,959 | 4 | 51,846 | 69,413 | 109 | 9,221 | 48,619 | |
| Wellington | 1858 | 3,199 | 43 | 35,799 | 155,994 | 2,896 | 11,994 | * |
| 1861 | 5,147 | 42 | 49,323 | 247,940 | 2,856 | 11,670 | 38,635 | |
| 1864 | 71,356 | 90 | 49,200 | 411,502 | 1,016 | 13,073 | 42,064 | |
| 1867 | 10,597 | 49 | 562,831 | 754,026 | 1,263 | 20,283 | 87,643 | |
| 1871 | 11,246 | 32 | 75,202 | 714,094 | 1,081 | 22,699 | 84,072 | |
| 1874 | 13,402 | 29 | 84,352 | 1,116,965 | 1,108 | 15,479 | 103,776 | |
| 1878 | 18,807 | 25 | 99,234 | 1,386,30 | 589 | 23,531 | 152,104 | |
| 1881 | 21,149 | 51 | 140,951 | 1,547,167 | 878 | 27,061 | 177,396 | |
| Hawke's Bay | 1858 | 727 | 8 | 4,492 | 180,320 | 880 | 1,555 | * |
| 1861 | 1,782 | 9 | 8,320 | 312,459 | 974 | 1,693 | 9,823 | |
| 1864 | 2,780 | 9 | 14,552 | 537,094 | 1,501 | 2,176 | 11,682 | |
| 1867 | 4,078 | 14 | 11,783 | 841,814 | 449 | 3,325 | 21,914 | |
| 1871 | 4,375 | 54 | 17,485 | 904,416 | 220 | 4,864 | 36,289 | |
| 1874 | 5,362 | 4 | 22,818 | 1,184,387 | 114 | 2,571 | 38,954 | |
| 1878 | 6,758 | 2 | 27,745 | 1,572,544 | 70 | 5,273 | 53,027 | |
| 1881 | 7,561 | 9 | 36,213 | 1,903,413 | 119 | 6,003 | 68,970 | |
| Marlborough | 1861 | 1,519 | 17 | 8,474 | 368,836 | 1,099 | 1,452 | 6,333 |
| 1864 | 2,735 | 16 | 7,483 | 456,374 | 3,930 | 2,708 | 9,516 | |
| 1867 | 2,608 | 24 | 7,913 | 61,757 | 2,317 | 5,243 | 16,173 | |
| 1871 | 2,646 | 28 | 8,860 | 604,808 | 1,274 | 9,429 | 21,633 | |
| 1874 | 3,160 | 21 | 9,758 | 734,139 | 1,213 | 4,034 | 26,057 | |
| 1878 | 3,758 | 13 | 8,176 | 799,902 | 1,123 | 8,258 | 28,496 | |
| 1881 | 4,454 | 10 | 9,919 | 760,781 | 359 | 4,687 | 35,020 | |
| Nelson (including Marlborough territory in 1858) | 1858 | 2,266 | 11 | 19,435 | 393,041 | 3,820 | 5,628 | * |
| 1861 | 2,360 | 17 | 11,100 | 181,367 | 419 | 2,985 | 23,293 | |
| 1864 | 3,597 | 16 | 15,825 | 341,281 | 522 | 4,033 | 25,579 | |
| 1867 | 4,277 | 24 | 15,894 | 523,799 | 749 | 8,822 | 49,030 | |
| 1871 | 4,518 | 66 | 20,602 | 523,558 | 901 | 9,839 | 76,553 | |
| 1874 | 4,749 | 13 | 25,793 | 591,384 | 1,244 | 7,291 | 83,724 | |
| 1878 | 6,320 | 20 | 25,735 | 626,331 | 1,593 | 9,071 | 87,125 | |
| 1881 | 6,634 | 13 | 31,620 | 631,286 | 1,699 | 9,497 | 93,734 | |
| Westland | 1867 | 619 | 9 | 2,103 | 852 | 247 | 1,535 | 9,636 |
| 1871 | 759 | 9 | 2,688 | 4,588 | 731 | 1,811 | 30,626 | |
| 1874 | 924 | 17 | 4,509 | 3,8o8 | 1,179 | 895 | 33,819 | |
| 1878 | 1,182 | 8 | 7,025 | 6,927 | 2,040 | 1,932 | 38,786 | |
| 1881 | 1,103 | 6 | 7,944 | 4,428 | 2,098 | 1,722 | 37,749 | |
| Canterbury (including Westland territory in 1858, 1861, 1864) | 1858 | 2,749 | 46 | 20,739 | 495,58o | 724 | 6,680 | * |
| 1861 | 6,049 | 29 | 33,576 | 877,369 | 625 | 9,586 | 41,729 | |
| 1864 | 10,868 | 62 | 45,050 | 1,567,733 | 769 | 18,028 | 73,745 | |
| 1867 | 14,501 | 49 | 59,493 | 2,496,097 | 1,115 | 31,460 | 155,238 | |
| 1871 | 17,654 | 105 | 79,022 | 2,965,701 | 1,060 | 43,466 | 196,249 | |
| 1874 | 23,757 | 83 | 86,752 | 3,325,630 | 972 | 37,181 | 221,103 | |
| 1878 | 37,117 | 80 | 100,310 | 3,560,301 | 1,025 | 82,807 | 323,417 | |
| 1881 | 45,609 | 83 | 111,155 | 3,519,404 | 683 | 66,765 | 386,182 | |
| Otago (including Southland territory in 1858) | 1858 | 1,680 | 5 | 20,987 | 223,597 | 343 | 1,485 | * |
| 1861 | 4,790 | 15 | 34,544 | 619,853 | 156 | 2,218 | 26,412 | |
| 1864 | 11,225 | 39 | 57,594 | 1,300,413 | 742 | 6,455 | 86,403 | |
| 1867 | 14,458 | 41 | 81,982 | 2,438,260 | 1,521 | 12,543 | 148,042 | |
| 1871 | 21,020 | 30 | 109,404 | 2,893,814 | 2,231 | 16,823 | 189,514 | |
| As after reunion with Southland | 1874 | 30,840 | 30 | 136,921 | 4,326,988 | 3,115 | 20,253 | 363,209 |
| 1878 | 38,103 | 29 | 147,929 | 4,446,023 | 2,335 | 30,278 | 335,067 | |
| 1881 | 43,019 | 61 | 150,150 | 3,952,022 | 2,167 | 39,907 | 409,622 | |
| Provincial Districts. | Horses. | Asses and Mules. | Cattle. | Sheep. | Goats. | Pigs. | Poultry. | |
|---|---|---|---|---|---|---|---|---|
| * Poultry not enumerated in 1858. | ||||||||
| Southland | 1861 | 812 | 4 | 9,160 | 73,990 | 9 | 585 | 4,293 |
| 1864 | 2,519 | 3 | 13,230 | 235,056 | 234 | 1,072 | 18,649 | |
| 1867 | 3,555 | 3 | 20,486 | 551,512 | 557 | 3,644 | 28,518 | |
| 1871 | 4,784 | … | 34,205 | 837,631 | 768 | 3,201 | 29,829 | |
| Chatham Islands | 1861 | 5 | … | 135 | 1,400 | 21 | 224 | 436 |
| 1864 | 50 | … | 303 | 2,319 | … | 291 | 802 | |
| 1867 | 145 | … | 498 | 8,660 | 302 | 323 | 842 | |
| 1871 | 581 | … | 715 | 16,978 | … | 288 | 1,013 | |
| 1874 | 598 | … | 804 | 29,990 | 50 | 180 | 978 | |
| 1878 | 807 | … | 772 | 49,350 | 60 | 150 | 1,160 | |
| 1881 | 703 | 1 | 658 | 62,191 | 12 | 180 | 1,638 | |
| Totals for the Colony | 1858 | 14,912 | 122 | 137,204 | 1,523,324 | 11,797 | 40,734 | * |
| 1861 | 28,275 | 153 | 193,285 | 2,761,383 | 12,191 | 43,270 | 236,098 | |
| 1864 | 49,409 | 339 | 249,760 | 4,937,273 | 12,005 | 61,276 | 178,414 | |
| 1867 | 65,715 | 323 | 312,835 | 8,418,579 | 11,964 | 115,124 | 676,065 | |
| 1871 | 81,028 | 397 | 436,592 | 9,700,629 | 12,434 | 151,460 | 872,174 | |
| 1874 | 99,859 | 267 | 494,917 | 11,704,853 | 14,276 | 123,921 | 1,058,198 | |
| 1878 | 137,768 | 241 | 578,430 | 13,069,338 | 14,243 | 207,337 | 1,323,542 | |
| 1881 | 161,736 | 362 | 698,637 | 12,985,085 | 11,223 | 200,083 | 1,566,114 | |
Table VIII. Table VIII. Showing the Annual Production of Butter and Cheese, the Number of Agricultural Machines, and the Quantity of Grain in hand, at the time of the Census of April, 1881.
| Provincial Districts. | Weight of | Number of | Quantity on hand of | |||||||||
|---|---|---|---|---|---|---|---|---|---|---|---|---|
| Annual Production of | Threshing Machines. | Reaping Machines. | Steam Ploughs. | Steam Harrows. | Wheat. | Oats. | Barley. | Flour. | ||||
| Butter. | Cheese. | Steam | Water. | Horse. | ||||||||
| lb. | lb. | Bushels. | Bushels. | Bushels. | Tons. | |||||||
| Auckland | 1,743,553 | 330,929 | 19 | 6 | 63 | 327 | 3 | 2 | 118,420 | 55,225 | 8,452 | 1,093 |
| Taranaki | 514,154 | 45,203 | 8 | 2 | 18 | 111 | 2 | … | 32,201 | 26,103 | 2,651 | 97 |
| Wellington | 1,110,666 | 117,322 | 27 | … | 48 | 308 | 4 | … | 180,981 | 142,554 | 16,997 | 350 |
| Hawke's Bay | 245,851 | 5,922 | 15 | 1 | 36 | 137 | … | … | 34,468 | 41,253 | 10,129 | 185 |
| Marlborough | 141,390 | 12,118 | 8 | 1 | 9 | 137 | 1 | … | 21,031 | 30,967 | 77,095 | 46 |
| Nelson | 527,613 | 57,539 | 8 | 4 | 26 | 150 | 1 | 3 | 38,602 | 41,496 | 79,667 | 122 |
| Westland | 67,237 | 1,730 | … | … | 3 | 1 | … | 1 | 838 | 2,154 | 35 | 48 |
| Canterbury | 1,944,766 | 2,035,492 | 238 | 5 | 64 | 3,124 | 11 | 4 | 2,781,579 | 2,303,124 | 604,123 | 1,774 |
| Otago | 2,156,339 | 572,439 | 170 | 49 | 190 | 2,299 | 7 | 3 | 1,720,518 | 2,692,839 | 230,576 | 1,348 |
| Chatham Islands | 2,216 | … | … | … | 1 | 1 | … | … | 1,500 | 600 | 285 | 2 |
| Totals, April, 1881 | 8,453,815 | 3,178,694 | 493 | 68 | 458 | 6,595 | 29 | 13 | 4,930,138 | 5,336,315 | 1,030,010 | 4,965 |
| Totals, March, 1878 | 7,379,447 | 2,701,908 | 374 | 93 | 518 | 4,829 | 34 | 32 | 1,726,944 | 1,092,654 | 248,929 | 5,261 |
Table of Contents
Table I. Table I. Showing the Number of Manufactories, Works, &c, of the under-mentioned Descriptions, which were in Operation in the several Provincial Districts of New Zealand in the Month of April, 1881; with the Number of Hands employed, the Approximate Value of Land and Buildings, Machinery and Plant, and a Comparison with the Industries returned in 1878.
| Class | Order | Sub-Division | Manufactories, Works,&c.[Classified according to the Sub-Orders of Class V.(Industrial) of the Occupations of the People]. | Provincial Districts (Number of Manufactories in) | Totals. | Number of Hands employed. | Approximate Value of | Industries returned in 1878. | ||||||||||||
|---|---|---|---|---|---|---|---|---|---|---|---|---|---|---|---|---|---|---|---|---|
| Auckland. | Taranaki. | Wellington. | Hawke's Bay. | Marlborough. | Nelson. | Westland. | Canterbury. | Otago. | Males. | Females. | Land and Buildings. | Machinery and Plant. | No. | Hands employed. | ||||||
| Males. | Females. | |||||||||||||||||||
| £ | £ | |||||||||||||||||||
| V. | 8 | I | Printing' Establishments(1) | 20 | 3 | 16 | 6 | 4 | 9 | 5 | 15 | 28 | 106 | 1,735 | 44 | 99,449 | 129,717 | 77 | 1,242 | 26 |
| 2 | Musical Instrument Factory— | … | … | … | … | … | … | … | 1 | … | 1 | 3 | … | … | … | 1 | 6 | 1 | ||
| 9 | Machines, Tools, Implements— | |||||||||||||||||||
| Agricultural Implement Manufactories | 6 | … | 2 | 1 | … | … | … | 7 | 7 | 23 | 315 | … | 27,582 | 16,272 | 8 | 208 | … | |||
| Machinists and Millwrights | 3 | … | … | 1 | … | 1 | … | 1 | 2 | 8 | 90 | … | 6,690 | 6,703 | 8 | 111 | … | |||
| 10 | Carriages and Harness— | |||||||||||||||||||
| Coach-building and Painting Works | 10 | 2 | 5 | 4 | 1 | 3 | … | 15 | 9 | 49 | 387 | … | 35,570; | 10,760 | 49 | 433 | … | |||
| 11 | Ships and Boats— | |||||||||||||||||||
| Ship- and Boat-building Works | 17 | … | 1 | … | … | … | … | 2 | 5 | 25 | 100 | … | 8,068 | 2,500 | 43 | 322 | … | |||
| Block and Pump Manufactories | 2 | … | … | … | … | … | … | … | 1 | 3 | 6 | … | 1,800 | 1,300 | 2 | 5 | … | |||
| Patent Slips | … | … | 2 | … | … | … | … | … | 2 | 4 | 31 | … | 6,700 | 30,220 | 5 | 42 | … | |||
| 13 | Furniture— | |||||||||||||||||||
| Furniture-making Manufactories | 14 | 4 | 4 | 2 | 3 | 3 | … | 7 | 8 | 45 | 438 | 28 | 71,415 | 4,512 | 12 | 88 | 8 | |||
| Chair-and Washboard-making Manufactories | 1 | … | … | … | … | … | … | 2 | … | 3 | 8 | … | 1,075 | 4,0 | 1 | 3 | … | |||
| Bellows-making Manufactory | 1 | … | … | … | … | … | … | … | … | 1 | 5 | … | … | … | … | … | … | |||
| 14 | Chemicals— | |||||||||||||||||||
| Chemical Works | 1 | … | … | … | … | … | … | … | 1 | 2 | 12 | … | … | … | 3 | 25 | … | |||
| Cleaning and Dyeing Works | 2 | … | 1 | … | … | 1 | … | 3 | 3 | 10 | 16 | 1O | 4,170 | 655 | 2 | 5 | 3 | |||
| Hematite Paint Factories(2) | 2 | … | … | … | … | … | … | … | … | 2 | 4 | … | … | … | 1 | 4 | … | |||
| y. | 9 | 1 | Textile Fabrics— | |||||||||||||||||
| Woollen Mills (3) | … | … | … | … | … | … | … | 1 | 3 | 4 | 193 | 224 | 36,000 | 62,500 | 3 | 36 | 42 | |||
| Ornamental Silk Manufactory | 1 | … | … | … | … | … | … | … | … | 1 | 1 | … | … | … | … | … | … | |||
| 2 | Dress— | |||||||||||||||||||
| Boot Manufactories (4) | 12 | … | 4 | … | … | … | … | 4 | 11 | 31 | 956 | 343 | 33,100 | 13,267 | 18 | 555 | 192 | |||
| Clothing Factories | 4 | … | … | … | … | … | … | 1 | 3 | 8 | 222 | 534 | 6,200 | 2,480 | 2 | 17 | 103 | |||
| Hat and Cap Factories | 3 | … | 1 | … | … | … | … | 1 | 3 | 8 | 34 | 24 | 3,892 | 1,190 | 1 | 4 | 3 | |||
| Oilskin Manufactories | 1 | … | 2 | … | … | … | 1 | 1 | … | 5 | 11 | 8 | … | … | 2 | 4 | 5 | |||
| Stocking Weaving Manufactories | … | … | … | … | … | 1 | … | … | 1 | 2 | … | 2 | … | … | 1 | … | 4 | |||
| 3 | Fibrous Materials— | |||||||||||||||||||
| Flax-mills(5) | 20 | … | 2 | 1 | 5 | 5 | 1 | 4 | 2 | 40 | 277 | 7 | … | … | 31 | 253 | 9 | |||
| Rope and Twine Works(6) | 4 | 2 | 3 | 3 | … | … | … | S | 1 | 18 | 122 | 2 | 9,735 | 8,285 | 19 | 105 | 4 | |||
| Sail Factories | 7- | … | 2 | … | … | 1 | … | 1 | 2 | 13 | 36 | 1 | 6,038 | 130 | 1 | 3 | … | |||
| v. | 10 | 1 | Animal Food— | |||||||||||||||||
| Meat-preserving Works (included with boiling down),see Animal Matters. | ||||||||||||||||||||
| Bacon-curing Establishments (7) | 3 | … | 2 | … | … | … | … | 7 | 8 | 20 | 61 | 3 | 10,030 | 1,060 | 6 | 35 | … | |||
| Fish-curing Establishments (8) | 3 | … | … | … | 4 | 1 | … | … | 6 | 14 | 64 | 4 | 2,655 | 995 | 2 | 17 | … | |||
| v. | 10 | 2 | Vegetable Food— | |||||||||||||||||
| Grain-mills(9) | 18 | 6 | 13 | 5 | 2 | 10 | … | 39 | 38 | 131 | 450; | … | 207,085 | 150,093 | 102 | 325 | … | |||
| Biscuit Manufactories(10) | 5 | … | 3 | … | … | 1 | … | 2 | 7 | 18 | 146 | 2 | 18,380 | 9,965 | 6 | 50 | 2 | |||
Table I. Table I. Showing the Number of Manufactories, Works, &c, of the under-mentioned Descriptions, which were in Operation in the several Provincial Districts of New Zealand in the Month of April, 1881; with the Number of Hands employed, the Approximate Value of Land and Buildings, Machinery and Plant, and a Comparison with the Industries returned in 1878.
| Class | Order | Sub-Division | Manufactories, Works,&c.[Classified according to the Sub-Orders of Class V.(Industrial) of the Occupations of the People]. | Provincial Districts (Number of Manufactories in) | Totals. | Number of Hands employed. | Approximate Value of | Industries returned in 1878. | ||||||||||||
|---|---|---|---|---|---|---|---|---|---|---|---|---|---|---|---|---|---|---|---|---|
| Auckland. | Taranaki. | Wellington. | Hawke's Bay. | Marlborough. | Nelson. | Westland. | Canterbury. | Otago. | Males. | Females. | Land and Buildings. | Machinery and Plant. | No. | Hands employed. | ||||||
| Males. | Females. | |||||||||||||||||||
(1) Not including Government Printing Office. Full particulars respecting the printing industry in special table (No. III., post). (2) Produce, 22 tons of paint and i,coo gallons of varnish. (3) 844,647 lb.of wool worked up, and 96,768 yards of cloth made in addition. (4) 280,291 pairs boots and 7,350 uppers manufactured, and value in addition £108,072. (5) Full particulars in special table (No. IV.,post) (6) Produce, 408 tons rope and twine, and value in addition £150. (7) Produce, 655 tons, and curing 2,100 hogs. In one case the produce was not returned. (8) Produce, 47 tons and 16,430 dozen of fish, and value in addition £400. At two establishments cod-liver and porpoise oil are made. (9) Full particulars respecting this industry in special table (No. V., post). (10) Produce, 1,164 tons of biscuits, and value in addition £27,520. (11) Special tables (Nos. VI. and VII., post) contain full particulars about these industries. (12) Produce, 49^ tons coffee, 30 tons chicory, 18 tons pepper and spices, and 160 tons of produce unspecified. (13) Produce, 294,555 bushels of malt. 14) Produce, 4,440 gallons of wine. (15) Special table (No. VIII., post) contains full particulars about this industry. (16) Produce, 1,350 tons of bonedust, and value in addition £200. In one case quantity or value not given. (17) Produce, 3,291 tons of soap and candles, and value in addition £4,500. (18) Special tables (Nos. IX., X., XI.) contain full particulars of these industries. (19) Produce, 247,428,144 cubic feet of gas. (20) Special table (No. XII.) contains full particulars of this industry. (21) Lime-works producing 300 bushels and upwards included. Produce, 207,000 bushels of lime. (22) In connection with brickworks. (23) Special table (No. XIII.) contains full particulars about this industry. (24) These total amounts represent the full amounts for all the above specified industries, except flax mills and quartz-crushing machinery. They are in excess of the separate details if added together, as the details are not given when the number of any particular industry is so small that the particulars of that industry would be identified. | ||||||||||||||||||||
| Breweries(11) | 15 | 4 | 11 | 5 | 5 | 14 | 7 | 19 | 19 | 99 | 526 | … | 233,218 | 84,180 | 91 | 513 | … | |||
| Coffee, Spice, and Chicory Works (12) | 3 | … | 1 | … | … | 1 | … | 1 | 3 | 9 | 63 | … | 16,700 | 5,650 | 10 | 40 | … | |||
| Malthouses (often in connection with Brew- | ||||||||||||||||||||
| eries)(13) | 3 | … | 1 | 1 | 3 | 5 | … | 12 | 9 | 34 | 67 | … | 47.850 | 666 | 25 | 66 | … | |||
| Sauce and Pickle Manufactories | 1 | … | … | … | … | … | … | 1 | 1 | 3 | 15 | … | 800 | 900 | 2 | 7 | 1 | |||
| Colonial Wine Manufactories(14) | 1 | … | 1 | … | … | 1 | … | … | 2 | 5 | 10 | 5 | 825 | 75 | 4 | 8 | 1 | |||
| 11 | 1 | Animal Matters— | ||||||||||||||||||
| Boiling-down and Meat-preserving Works(15) | 4 | 3 | 9 | 5 | 9 | … | … | 7 | 3 | 40 | 465 | 3 | 62,525 | 34,320 | 32 | 439 | 4 | |||
| Bone-cutting Mills(16) | 6 | 1 | 2 | … | … | 1 | … | 4 | 3 | 17 | 25 | … | 6,500 | 5,195 | 8 | 16 | 5 | |||
| Brush Manufactory | 1 | … | … | … | … | … | … | … | … | 1 | 16 | 8 | … | … | 1 | 10 | 8 | |||
| Glue Manufactories | … | … | 1 | … | … | … | … | 1 | … | 2 | 4 | … | … | … | 2 | 5 | ||||
| Portmanteau Manufactory | 1 | … | … | … | … | … | … | … | … | 1 | 2 | … | … | … | 1 | 2 | 1 | |||
| Soap and Candle Works (17) | 4 | … | 2 | … | … | 1 | … | 6 | 2 | 15 | 108 | … | 15,55 | 17,690 | 13 | 70 | … | |||
| Fellmongering, Tanning, Currying, and Wool- | ||||||||||||||||||||
| scouring Works (18) | 12 | 2 | 12 | 17 | 6 | 4 | 3 | 34 | 29 | 1,9 | 8,8 | 21 | 88,156 | 47,926 | 1OO | 661 | 10 | |||
| 2 | Vegetable Matters— | |||||||||||||||||||
| Chaff-cutting Works | 9 | … | 2 | … | 1 | 4 | … | 7 | »S | 38 | 99 | 1 | 13,476 | 3,980 | 6 | 10 | … | |||
| Saw-mills, and Sash and Door Manufactories(18) | 43 | 6 | 43 | 8 | 16 | 22 | 1O | 28 | 47 | 223 | 4,198 | 40 | 397,084 | 376,544 | 204 | 4,111 | 3 | |||
| Paper-mill | … | … | … | … | … | … | … | … | 1 | 1 | 10 | … | … | … | 2 | 18 | 5 | |||
| Starch-works | … | … | … | … | … | … | … | … | 2 | 2 | 6 | … | … | … | … | … | ||||
| 12 | 2 | Coal— | ||||||||||||||||||
| Collieries(18) | 5 | … | … | … | … | 9 | 3 | 6 | 28 | 51 | 992 | … | 100,071 | 121,079 | 40 | 516 | 2 | |||
| Gasworks(19) | 2 | 1 | 2 | 1 | … | 1 | 2 | 4 | 4 | 17 | 188 | … | 177,749 | 314,367 | 12 | 145 | … | |||
| 3 | Stone, Clay, and Earthenware— | |||||||||||||||||||
| Brick, Tile, and Pottery Manufactories also | ||||||||||||||||||||
| Limeworks)(20) | 30 | 4 | 19 | 5 | 4 | 5 | 2 | 23 | 35 | 127 | 666 | 19 | 77,030 | 28,735 | 124 | 616 | 4 | |||
| Limeworks (often in connection with Brick | ||||||||||||||||||||
| works)(21) | 7 | … | 2 | 1 | 2 | 1 | 1 | 4 | 5 | 23 | 63 | … | 4,560 | 2,020 | 34 | 68 | … | |||
| Glass Manufactory(22) | … | … | … | … | … | … | … | … | 1 | 1 | … | … | … | … | … | … | … | |||
| Stone Quarries (Building) | 1 | … | … | … | … | … | … | 1 | 8 | 1O | 136 | … | 16,533 | 2,160 | 14 | 88 | 2 | |||
| Stone-sawing Works | … | … | … | … | … | … | … | 1 | … | 1 | 8 | … | … | … | … | … | … | |||
| 6 | Metals— | |||||||||||||||||||
| Quartz-mining (Gold) Works(23) | 28 | … | … | … | 2 | 32 | … | … | 22 | 84 | 1,147 | … | … | … | 103 | 1,49l | … | |||
| Mining (Manganese) Works | 2 | … | … | … | … | … | … | … | … | 2 | 19 | … | … | … | 1 | 11 | … | |||
| Iron and Brass Foundries | 10 | … | 6 | 1 | 1 | 1 | 1 | 5 | 10 | 35 | 952 | 1 | 83,581 | 71,686 | 28 | 854 | 1 | |||
| Spouting and Ridging Manufactories | 4 | 1 | 1 | … | 1 | … | … | 1 | 1 | 9 | 20 | … | 2,500 | 1,895 | 1 | 13 | … | |||
| Totals, Census 1881 | 366 | 43 | 189 | 71 | 72 | 142 | 40 | 296 | 424 | 1,643 | 16,599 | 1,339 | 1,993,330(24) | 1,612,141(24) | … | … | … | |||
| Totals, Census 1878 | 278 | 29 | 137 | 41 | 54 | 134 | 51 | 243 | 304 | 1,271 | 13,728 | 449 | 1,761,694 | 1,289,378 | … | … | … | |||
NOTE.—Produce, where given above, signifies the quantities produced during the year 1880. At some establishments two or more distinct industries were carried on. In such cases each industry has been counted for the purposes of the above table, but if the particulars of power, hands, and plant employed were not separately shown in any return, the whole have been treated as belonging to the most important work.
Table II. Table II. General Summary of certain Manufactories, Works, &c. (specified in the preceding Table No. I.), in Operation in the several Provincial Districts of New Zealand in die Month of April, 1881, with the Nature and Amount of Power, and the Number of Hands, employed; also the Approximate Value of Land and Buildings, and Machinery and Plant.
| Provincial Districts, | Number of Manufactories, Works, &c. | Motive Power employed. | Amount of Horsepower employed. | Number of Hands employed. | Approximate Value of. | ||||||||||
|---|---|---|---|---|---|---|---|---|---|---|---|---|---|---|---|
| Steam. | Gas. | Steam and Gas. | Water. | Steam and Water. | Wind. | Steam and Wind. | Horse. | Manual and Unspecified. | Males. | Females | Land and Buildings. | Machinery and Plant. | |||
| £ | £ | ||||||||||||||
| Auckland | 366 | 126 | 6 | … | 54 | 5 | 1 | 1 | 30 | 143 | 3,212 | 4,499 | 239 | 414,322 | 322,844 |
| Taranaki | 43 | 10 | … | … | 6 | … | … | … | 6 | 21 | 236 | 245 | 3 | 23,035 | 25,178 |
| Wellington | 189 | 99 | 2 | … | 10 | 1 | 1 | … | 15 | 61 | 1,509 | 1,692 | 58 | 271,601 | 278,336 |
| Hawke's Bay | 71 | 23 | 4 | … | 3 | … | … | … | 5 | 36 | 300 | 577 | 6 | 56,636 | 54,445 |
| Marlborough | 72 | 27 | … | … | 10 | 1 | … | … | 6 | 28 | 590 | 506 | 9 | 50,535 | 51,213 |
| Nelson | 142 | 39 | … | … | 30 | 1 | … | … | 8 | 64 | 821 | 934 | 5 | 50,054 | 94,410 |
| Westland | 40 | 12 | 1 | … | 7 | … | … | … | 1 | 19 | 296 | 282 | 3 | 24,138 | 29,954 |
| Canterbury | 296 | 107 | 8 | 1 | 47 | 1 | 1 | 2 | 25 | 110 | 1,663 | 3,018 | 317 | 468,907 | 321,564 |
| Otago | 424 | 125 | 11 | … | 60 | 12 | 1 | … | 43 | 172 | 4,974 | 4,846 | 699 | 634,102 | 434,197 |
| Totals, Census 1881 | 1,643 | 568 | 32 | 1 | 221 | 21 | 4 | 3 | 139 | 654 | 13,601 | 16,599 | 1,339 | 1,993,330 | 1,612,141 |
| Totals, Census 1878 | 1,271 | 4,38 | … | … | 175 | 26 | 1 | 3 | 97 | 531 | 9,583 | 13,728 | 449 | 1,761,694 | 1,289,378 |
Table III. Table III. Showing the Number of Printing Establishments in Operation in the Month of April, 1881, the Power and Hands employed, and the Approximate Value of Machinery and Plant, and Land and Buildings.
| Provincial Districts, | Number of Establishments. | Motive Power. | Horse-power. | Hands | Approximate Value of. | ||||||
|---|---|---|---|---|---|---|---|---|---|---|---|
| Steam. | Gas. | Steam and Gas. | Water. | Hand. | Males. | Females | Land and Buildings. | Machinery and Plant. | |||
| * Excluding the Government Printing Office. | |||||||||||
| £ | £ | ||||||||||
| Auckland | 20 | 3 | 2 | … | 3 | 12 | 30 | 321 | 12 | 23,950 | 26,690 |
| Taranaki | 3 | … | … | … | … | 3 | … | 37 | … | 1,500 | 2,500 |
| Wellington* | 16 | 4 | 2 | … | 3 | 7 | 34 | 205 | 7 | 11,050 | 19,200 |
| Hawke's Bay | 6 | … | 2 | … | … | 4 | 6 | 62 | 1 | 5,600 | 5,330 |
| Marlborough | 4 | … | … | … | … | 4 | 1 | 26 | 2 | 1,050 | 1,555 |
| Nelson | 9 | … | … | … | 2 | 7 | 4 | 61 | 1 | 2,720 | 6,675 |
| Westland | 5 | … | 1 | … | … | 4 | 1 | 41 | … | 2,350 | 1,750 |
| Canterbury | 15 | 4 | 4 | 1 | 1 | 5 | 31 | 532 | 8 | 23,400 | 32,700 |
| Otago | 28 | 4 | 8 | … | 4 | 12 | 44 | 450 | 13 | 27,829 | 32,317 |
| Totals* | 106 | 15 | 19 | 1 | 13 | 58 | 150 | 1,735 | 44 | 99,449 | 129,717 |
Table IV. Table IV. Showing (approximately) the Number of Flax-mills in Operation in the Month of April, 1881; with the Number of Machines used, the Power and Number of Plants employed, and the Quantity of Flax manufactured, during the Year, 1880.
| Provincial Districts. | Number of Mills. | Number of Machines used and Power employed. | Amount of Horsepower. | Hands employed. | Quantity in Tons manufactured. | |||
|---|---|---|---|---|---|---|---|---|
| Number of Machines. | Steam. | Water. | Males. | Females. | ||||
| Auckland | 20 | 24 | 6 | 18 | 143 | 145 | 4 | 500 |
| Taranaki | … | … | … | … | … | … | … | … |
| Wellington | 2 | 2 | 1 | 1 | 22 | 6 | … | 22 |
| Hawke's Bay | 1 | 1 | … | … | … | 1 | … | ½ |
| Marlborough | 5 | 5 | … | 5 | 58 | 43 | 1 | 313 |
| Nelson | 5 | 6 | 1 | 5 | 63 | 34 | … | 176 |
| Westland | 1 | 1 | 1 | … | 2 | 3 | 2 | … |
| Canterbury | 4 | 6 | … | 6 | 21 | 34 | … | 346 |
| Otago | 2 | 2 | … | 2 | 20 | 11 | … | 25 |
| Totals | 40 | 47 | 9 | 37 | 329 | 277 | 7 | 1,382½ |
NOTE,—Four of these mills were worked for a portion of the year only.
Table V. Table V. Showing the Number of Mills for Grinding and Dressing Grain in Operation in New Zealand in April, 1881 ; with the Nature and Amount of the Power employed, the Number of Pairs of Stones in Operation, the Number of Hands employed, the Approximate Quantities of Flour and Meal produced (during the Year 1880), and the Approximate Value of Land and Buildings, and Machinery and Plant.
| Provincial Districts | Number of Mills. | Motive Power employed | Amount of Horsepower. | Number of Pairs of Stones. | Number of Hands employed. | Flour made during the Year. | Meal made during the Year. | Approximate Value of | |||||
|---|---|---|---|---|---|---|---|---|---|---|---|---|---|
| Steam | Water | Wind. | Steam and Water. | Steam and Wind. | Land and Buildings. | Machinery and Plant. | |||||||
| Tens. | Tons. | £ | £ | ||||||||||
| Auckland | 18 | 10 | 6 | … | 1 | 1 | 372 | 44 | 89 | 9,464 | 140 | 42,100 | 32,600 |
| Taranaki | 6 | … | 6 | … | … | … | 103 | 13 | 11 | 2,174 | … | 5,300 | 3.750 |
| Wellington | 13 | 10 | 2 | … | 1 | … | 199 | 28 | 33 | 4,930 | 151 | 14,170 | 14,100 |
| Hawke's Bay | 5 | 3 | 2 | … | … | … | 44 | 7 | '3 | 643 | 96 | 5,000 | 3,200 |
| Marlborough | 2 | … | 2 | … | … | … | 26 | 6 | 3 | 395 | 10 | 2,600 | 1,400 |
| Nelson | 10 | 5 | 4 | … | 1 | … | 110 | 19 | 17 | 1,382 | 116 | 5.810 | 4,470 |
| Westland | … | … | … | … | … | … | … | … | … | … | … | … | … |
| Canterbury | 39 | 10 | 26 | … | 1 | 2 | 602 | 107 | 132 | 22,044 | 3,102 | 64,450 | 45,146 |
| Otago | 38 | 11 | 20 | … | 7 | … | 672 | 131 | 152 | 28,244 | 3,528 | 67,655 | 45,427 |
| Totals | 131 | 49 | 68 | … | 11 | 3 | 2,128 | 355 | 450 | 69,251 | 7,143 | 207,085 | 150,093 |
NOTE.— Eight of the mills were worked for part of the year. In four cases the value of land, buildings, machinery, and plant was not given, and in six cases the value of land and buildings was not given. The quantity of flour made at six mills was not returned.
Table VI. Table VI. Showing the Number of Aerated Waters and Cordial Manufactories in New Zealand in Operation in April, 1881; the Power and Hands employed, the Produce (for the Year 1880), and Approximate Value of Lands and Buildings, and Machinery and Plant.
| Provincial Districts. | Number of Works. | Motive Power. | Horse-Power. | Hands. | Quantity Manufactured, | Approximate Value of | |||||||||
|---|---|---|---|---|---|---|---|---|---|---|---|---|---|---|---|
| Steam. | Gas. | Water. | Horse. | Hand | Males | Females | Aërated Waters | Cordials | Tonic Beer | Value* | Land and Building | Machine and Plant. | |||
| * Where value is given it is to be understood as the value of produce in addition to the produce stated. | |||||||||||||||
| Dozen. | Dozen. | Gallons. | £ | £ | £ | ||||||||||
| Auckland | 14 | 5 | 1 | 1 | 1 | 6 | 42 | 50 | 2 | 185,685 | 894 | … | 6,560 | 10,170 | 6,545 |
| Taranaki | 4 | … | … | … | … | 4 | … | 6 | … | 3.900 | … | 5,000 | 600 | 800 | 510 |
| Wellington | 11 | 4 | … | … | 1 | 6 | '7 | 34 | … | 115,752 | 353 | 1,350 | … | 2,810 | 4,700 |
| Hawke's Bay | 4 | 2 | 1 | … | … | 1 | 8 | 10 | … | 39,408 | 933 | … | … | 826 | 2,100 |
| Marlborough | 3 | … | … | … | 1 | 2 | 1 | 6 | … | 11,046 | 100 | … | … | 720 | 650 |
| Nelson | 4 | 1 | … | … | … | 3 | 2 | 9 | … | 22,100 | 40 | … | 500 | 1,130 | 1,720 |
| Westland | 4 | … | … | 1 | … | 3 | 1 | 6 | … | 4,900 | 200 | … | … | 400 | 245 |
| Canterbury | 12 | 4 | 1 | 1 | 4 | 2 | 20 | 37 | … | 168,659 | 905 | … | 1,000 | 8,075 | 6,260 |
| Otago | 23 | 2 | 2 | 4 | 4 | 11 | 17 | 65 | 3 | 146,204 | 6,859 | … | 19,700 | 11,270 | 7,970 |
| Totals | 79 | 18 | 5 | 7 | 11 | 38 | 108 | 223 | 5 | 637,144 | 10,284 | 6,350 | 28,360 | 36,201 | 30,700 |
Table VII. Table VII. Showing the Number of Breweries in Operation in New Zealand in April, 1881 ; also the Number of Hands, Horses, and Drays employed, the .Quantity of Beer produced (during the Year 1880), and the Approximate Value of Land and Buildings, and Machinery and Plant.
| Provincial Districts. | Number of Breweries. | Number of Hands employed. | Number of Horses employed. | Number of Drays and Wagons employed. | Beer made during the Year. | Approximate Value of | |
|---|---|---|---|---|---|---|---|
| Land and Buildings. | Machinery and Plant. | ||||||
*One at work only two months. †One at work only four months. ‡One at work only a portion of the year. | |||||||
| Gallons. | £ | £ | |||||
| Auckland | 15 | 94 | 30 | 26 | 953,312 | 41,965 | 10,290 |
| Taranaki | 4 | 12 | … | … | 81,328 | 5,100 | 2,050 |
| Wellington* | 11 | 50 | 19 | 17 | 552,186 | 25,300 | 12,545 |
| Hawke's Bay | 5 | 18 | 8 | 6 | 151,564 | 7,600 | 3,000 |
| Marlborough | 5 | 10 | 9 | 9 | 92,392 | 5,33 | 1,400 |
| Nelson† | 14 | 32 | 27 | 26 | 212,748 | 11,540 | 5,975 |
| Westland‡ | 7 | 15 | 9 | 9 | 102,848 | 1,218 | 895 |
| Canterbury | 19 | 132 | 71 | 44 | 1,177,559 | 52,345 | 14,525 |
| Otago* | 19 | 163 | 45 | 32 | 1,550,817 | 82,820 | 33,500 |
| Totals | 99 | 526 | 218 | 169 | 4,874,754 | 233,248 | 84,180 |
NOTE.—In one case the value of the land, buildings, machinery, and plant was not given, and in two cases that of machinery and plant was omitted. There were 34 malthouses returned, mostly in connection with breweries, turning out 29-^555 bushels of malt.
Table VIII. Table VIII. Showing the Number of Boiling-down and Meat-preserving Establishments in New Zealand in Operation in April, 1881, the Power and Hands employed, the Produce (for the Year 1880), and Approximate Value of Land and Buildings, and Machinery and Plant.
| Provincial Districts. | No. of Works. | Power. | Horse-power. | Hands. | Quantity Produced. | Approximate Value of | ||||||||||
|---|---|---|---|---|---|---|---|---|---|---|---|---|---|---|---|---|
| Steam. | Gas. | Water. | Horse. | Hand | Males | Females | Preserved Meats. | Tallow. | Neatsfoot Oil. | Sheep Boiled.* | Land and Buildings. | Machinery and Plant. | ||||
| * The number of sheep boiled is in addition to the tallow previously specified. | ||||||||||||||||
| Tons. | Casks | Galls. | No. | £ | £ | |||||||||||
| Auckland | 4 | 3 | 1 | … | … | … | 17 | 42 | 2 | 50,000 lb. | 120 | 200 | 800 | … | 8,700 | 1,980 |
| Taranaki | 3 | 3 | … | … | … | … | 21 | 16 | … | … | 338 | … | … | … | 1,680 | 750 |
| Wellington | 9 | 8 | … | … | … | 1 | 58 | 74 | … | 179,200 lb. | 1,773 | 122 | … | … | 9,270 | 4,685 |
| Hawke's Bay | 5 | 5 | … | … | … | … | 63 | 95 | 1 | … | 249 | 570 | … | 40,400 | 5,325 | 7,450 |
| Marlborough | 9 | 9 | … | … | … | … | 70 | 78 | … | … | 106 | … | … | 1,200 | 2,800 | 5,110 |
| Nelson | … | … | … | … | … | … | … | … | … | … | … | … | … | … | … | … |
| Westland | … | … | … | … | … | … | … | … | … | … | … | … | … | … | … | … |
| Canterbury | 7 | 7 | … | … | … | … | 90 | 79 | … | 613,591 lb. | 537 | … | 100 | … | 13,400 | 8,295 |
| Otago | 3 | 3 | … | … | … | … | 33 | 81 | … | 201,204 tins | 168 | … | 500 | … | 21,350 | 6,050 |
| Totals | 40 | 38 | 1 | … | … | 1 | 352 | 465 | 3 | 842,791 lb. and 201,204 tins. | 3,291 | 892 | 1,400 | 41,600 | 62,525 | 34,320 |
Table IX. Table IX. Showing the Number of Fellmongering, Tanning, Currying, and Wool-scouring Establishments in New Zealand in April, 1881, the Power and Hands employed, the Produce (for the Year 1880), and Approximate Value of Land and Buildings, and Machinery and Plant.
| Provincial Districts. | No. of Works. | Power. | Horse-power. | Hands. | Quantity Produced. | Land and Buildings. | Machinery and Plant. | |||||||||||||
|---|---|---|---|---|---|---|---|---|---|---|---|---|---|---|---|---|---|---|---|---|
| Steam. | Wind. | Water. | Horse. | Hand | Males | Females | Wool Scoured. | Hides. | Skins. | Basils. | Sides. | Kips and Pelts. | Others. | Value.* | ||||||
* Where value is given it is to be understood as the value of produce in addition to the produce stated. † The produce of one establishment was not returned. | ||||||||||||||||||||
| Lb. | Bales. | T. cwt. | £ | £ | £ | |||||||||||||||
| Auckland | 12 | 4 | … | 1 | 1 | 6 | 50 | 158 | … | 304,014 | 690 | … | 6,240 | 2,040 | 112,011 | 5,000 | … | 4,182 | 6,02O | 3,778 |
| Taranaki | 2 | … | … | … | 1 | 1 | 1 | 7 | … | … | 100 | … | … | … | … | … | … | 328 | 650 | 50 |
| Wellington | 12 | 6 | 1 | 1 | … | 4 | 89 | 119 | … | … | 3,993 | 15,028 | 12,591 | 26,034 | … | … | … | … | 16,546 | 20,228 |
| Hawke's Bay | 17 | 3 | … | 1 | … | 13 | 21 | 99 | 1 | 146,140 | 4,914 | 1,000 | 80 | 480 | … | … | 12 0 | … | 5,500 | 3,080 |
| Marlborough | 6 | … | … | 3 | … | 3 | 15 | 22 | 4 | 8,000 | 2,027 | … | … | 288 | … | … | … | … | 4,135 | 750 |
| Nelson† | 4 | 1 | … | … | … | 3 | 8 | 10 | … | 2,000 | 200 | 720 | 2,000 | … | … | … | 3 11 | … | 1,280 | 445 |
| Westland | 3 | 1 | … | 1 | … | 1 | 10 | 10 | 1 | 5,766 | 20 | … | … | … | … | … | … | 3,500 | 1,515 | 310 |
| Canterbury | 34 | 6 | 1 | 4 | … | 23 | 61 | 179 | 1 | 175,885 | 7,120 | 3,771 | 20,816 | 16,800 | … | 10,000 | 7 0 | 1,500 | 25,560 | 8,215 |
| Otago† | 29 | 7 | … | 2 | … | 20 | 45 | 234 | 14 | 521,430 | 5,337 | 100 | 150 | 15,000 | … | … | … | 77,000 | 26,950 | 11,070 |
| Totals | 119 | 28 | 2 | 13 | 2 | 74 | 300 | 838 | 21 | 1,163,235 | 24,401 | 20,619 | 41,877 | 60,642 | 112,011 | 15,000 | 22 11 | 86,510 | 88,156 | 47,926 |
Table X. Table X. Showing the Number of Saw-mills and Sash and Door Manufactories in Operation in New Zealand in April, 1881, the Power and Hands employed, the Produce (for the Year 1880), and Approximate Value of Land and Buildings, and Machinery and Plant.
| Provincial Districts. | No. of Works. | Power. | Horse power, | Hands. | Quantity Produced. | Approximate Value of | |||||
|---|---|---|---|---|---|---|---|---|---|---|---|
| Steam. | Steam and Water | Water | Males. | Females. | Sawn Timber. | Value.(1) | Land and Buildings. | Machinery and Plant. | |||
(1) Where value is given it is to be understood as the value of produce in addition to the produce stated. (2) Besides 6,500 doors, 6,000 sashes, 2,000,000 feet planing. (3) Besides 2,000 doors, 2,000 sashes, 65,000 palings, 3,691 rails, 2,105 Posts,105,800 shingles. (4) Besides 500 doors, 500 sashes. (5) Besides 79.000 feet planed. (6) Besides 96,000 feet planed. (7) Besides 750 doors, 1,600 sashes, 500,000 feet mouldings, 200,000 feet flooring, 500,000 feet lining, 100,000 feet skirting, 150,000 feet rusticated, 400,000 feet planing, 1,000 posts. (8) Besides 208,000 feet planing. | |||||||||||
| Feet. | £ | £ | £ | ||||||||
| Auckland | 43 | 35 | … | 8 | 1,036 | 1,443 | 35 | 48,631,206 (2) | 16,150 | 105,444 | 107,896 |
| Taranaki | 6 | 6 | … | … | 100 | 115 | … | 3,899,471 | … | 1,570 | 9,338 |
| Wellington | 43 | 43 | … | … | 771 | 562 | … | 29,114,105(3) | 2,950 | 95,725 | 61,900 |
| Hawke's Bay | 8 | 8 | … | … | 136 | 158 | … | 3,888,000(4) | … | 12,620 | 13,150 |
| Marlborough | 16 | 15 | 1 | … | 361 | 242 | … | 9,451,623(5) | … | 26,990 | 38,450 |
| Nelson | 22 | 19 | … | 3 | 215 | 139 | … | 5,260,007(6) | 1,500 | 7,349 | 11,900 |
| Westland | 10 | 5 | … | 5 | 171 | 71 | … | 3,845,000 | … | 4,330 | 5,330 |
| Canterbury | 28 | 28 | … | … | 414 | 338 | 1 | 9,571.997(7) | 10,800 | 53,715 | 36,300 |
| Otago | 47 | 41 | … | 6 | 1,060 | 1,130 | 4 | 29,484,842(8) | 37,150 | 89,341 | 92,280 |
| Totals | 223 | 200 | 1 | 22 | 4,264 | 4,198 | 40 | 143,146,251 | 68,550 | 397,084 | 376,544 |
NOTE.—For 23 mills the quantity or value produced was not given, and these mills employed 335 men,
Table XL. Table XI. Showing the Number of Collieries in New Zealand in Operation in April, 1881, the Power and Hands employed, the Produce (for the Year 1880), and Approximate Value of Land and Buildings, and Machinery and Plant.
| Provincial Districts. | No. of Works. | Power. | Horse-power. | Hands. | Quantity of Coal Produced, In Tons. | Approximate Value of | ||||||
|---|---|---|---|---|---|---|---|---|---|---|---|---|
| Steam. | Wind. | Water. | Horse. | Hand | Males | Females | Land and Buildings. | Machinery and Plant. | ||||
| * The output for these 51 mines was given as 277,918 tons, but the Census returns do not include a number of small mines. The total number accounted for to the department for their inspection for the year 1880 was 101, and the output amounted to 299,923 tons. | ||||||||||||
| £ | £ | |||||||||||
| Auckland | 5 | 3 | … | … | 1 | 1 | 233 | 221 | … | 94,177 | 8,666 | 11,994 |
| Taranaki | … | … | … | … | … | … | … | … | … | … | … | … |
| Wellington | … | … | … | … | … | … | … | … | … | … | … | … |
| Hawke's Bay | … | … | … | … | … | … | … | … | … | … | … | … |
| Marlborough | … | … | … | … | … | … | … | … | … | … | … | … |
| Nelson | 9 | … | … | 1 | 3 | 5 | 4 | 144 | … | 9,293 | 3,595 | 47,6lO |
| Westland | 3 | 3 | … | … | … | … | 89 | 101 | … | 46,00O | 2,600 | 9,000 |
| Canterbury | 6 | 1 | … | 1 | 2 | 2 | 42 | 166 | … | l8,212 | 65,350 | 22,495 |
| Otago | 28 | 5 | 1 | 1 | 6 | 1s | 116 | 360 | … | 110,236 | 19,860 | 29,980 |
| Totals | 51 | 12 | 1 | 3 | 12 | 23 | 484 | 992 | … | 277,918* | 100,071 | 121,079 |
Table XII. Table XII. Showing the Number of Brick, Tile, and Potter}'- Manufactories in New Zealand in Operation in April, 1881, the Power and Hands employed, the Produce (for the Year 1880), and the Approximate Value of Land and Buildings, and Machinery and Plant.
| Provincial Districts. | No. of Works. | Power. | Horse-power. | Hands. | Quantity Manufactured. | Approximate Value of | |||||||||||
|---|---|---|---|---|---|---|---|---|---|---|---|---|---|---|---|---|---|
| Steam. | Water. | Horse. | Hand | Males | Females | Bricks. | Fire Bricks. | Drainpipes. | Tiles. | Flowerpots. | Miscellaneous. | Value.* | Land and Buildings. | Machinery and Plant. | |||
| * When value is given it is to be understood as the value of produce in addition to the produce stated. | |||||||||||||||||
| £ | £ | £ | |||||||||||||||
| Auckland | 30 | 5 | … | 20 | 5 | 76 | 125 | … | 8,252,000 | 60,430 | 60,660 | 622,720 | 314,350 | 17,126 | 3.500 | 10,910 | 5,660 |
| Taranaki | 4 | … | … | 3 | 1 | 3 | 9 | 3 | 555,000 | … | … | … | … | … | … | 800 | 270 |
| Wellington | 19 | 4 | 1 | 13 | 1 | 58 | 57 | … | 1,955,000 | … | 76,300 | 500 | 1,200 | … | 1,000 | 7,370 | 3,712 |
| Hawke's Bay | 5 | … | … | 3 | 2 | 4 | 15 | … | 956,000 | … | … | … | … | … | … | 750 | 210 |
| Marlborough | 4 | … | … | 4 | … | 4 | 11 | … | 322,000 | … | 72,000 | … | … | … | … | 630 | 568 |
| Nelson | 5 | … | 1 | 2 | 2 | 6 | 11 | 1 | 310,000 | 20,000 | 26,000 | 500 | … | … | … | 1,480 | 1,060 |
| Westland | 2 | 1 | … | 1 | … | 10 | 7 | … | 130,000 | … | … | … | … | … | … | 600 | 310 |
| Canterbury | 23 | 4 | … | 17 | 2 | 77 | 236 | … | 6,058,500, | … | 30,000 | … | … | … | 18,450 | 33,550 | 11,205 |
| Otago | 35 | 8 | … | 22 | 5 | 107 | 195 | 15 | 9,952,000 | … | 328,000 | … | … | … | 14,000 | 20,940 | 5,740 |
| Totals | 127 | 22 | 2 | 85 | 18 | 345 | 666 | 19 | 28,490,500 | 80,430 | 592,960 | 623,720 | 315.550 | 17,126 | 36,950 | 77,030 | 28,735 |
Table XIII. Table XIII. Showing the Gold Quartz Mines and Quartz-crushing Machinery in Operation in New Zealand in April, 1881; with the Nature and Amount of Power, the Number of Hands employed, the Amount in Tons of Stone crushed, and the Quantity of Gold produced, during the Year 1880.
| Provincial Districts. | No. of Works. | Power employed. | Amount of Horsepower. | No. of Hands employed. | Quantity of Gold produced, in Ounces. | Quantity of Quarts Crushed, in Tons. | Average Value of Gold per Ounce in each Provincial District. | ||||||
|---|---|---|---|---|---|---|---|---|---|---|---|---|---|
| Steam. | Water. | Steam and Water. | Without Machinery. | Males. | Females. | ||||||||
| £ | s. | d. | |||||||||||
| Auckland | 28 | 11 | 14 | 3 | … | 775 | 499 | … | 56,198 | 49,157 | 2 | 14 | 3⅗ |
| Taranaki | … | … | … | … | … | … | … | … | … | … | … | … | … |
| Wellington | … | … | … | … | … | … | … | … | … | … | … | … | … |
| Hawke's Bay | … | … | … | … | … | … | … | … | … | … | … | … | … |
| Marlborough | 2 | 2 | … | … | … | 50 | 30 | … | 221 | 836 | 3 | 17 | 10 |
| Nelson | 32 | 5 | 13 | … | 14 | 360 | 396 | … | 20,984 | 36,880 | 3 | 17 | 3 |
| Westland | … | … | … | … | … | … | … | … | … | … | … | … | … |
| Canterbury | … | … | … | … | … | … | … | … | … | … | … | … | … |
| Otago | 22 | 3 | 11 | 4 | 4 | 278 | 222 | … | 6,781 | 11,587 | 3 | 15 | 5 |
| Totals | 84 | 21 | 33 | 7 | 18 | 1,463 | 1,147 | … | 84,184 | 98,460 | … | … | … |
Table XIV. Table IV. Showing the Number of Societies formed under Building and Land Societies Acts in New Zealand, to April, 1881.
| Provincial Districts, | No. of Societies in each Provincial District. | Aggregate Number of Shareholders. | Aggregate Number of Shares, | Average Amount of Monthly Contributions for preceding Six Months. | |||
|---|---|---|---|---|---|---|---|
| Realized. | Unrealized. | ||||||
| £ | s. | d. | |||||
| Auckland | 6 | 1,821 | 5,285 | 11,129 | 5,121 | 16 | 7 |
| Taranaki | 5 | 393 | 1,530 | 1,963 | 833 | 18 | 4 |
| Wellington | 9 | 1,613 | 7,849 | 8,601 | 11,964 | 9 | 8 |
| Hawke's Bay | 2 | 316 | 276 | 561 | 1,095 | 9 | 5 |
| Marlborough | 2 | 360 | 224 | 1,030 | 184 | 9 | 1 |
| Nelson | 2 | 360 | 1,141¼ | 1,975½ | 874 | 18 | 11 |
| Westland | 1 | 31 | … | 186 | 40 | 0 | 0 |
| Canterbury | 10 | 1,390 | 4,590 | 11,689 | 11,291 | 15 | 0 |
| Otago | 14 | 3,293 | 8,631 | 16,583 | 7,823 | 6 | 7 |
| Total | 51 | 9,356 | 29,526¼ | 53,717½ | 39,230 | 3 | 7 |
NOTE.—In thirteen cases the number of realized shares, and in two cases the number of unrealized shares, were not given. In two cases the average monthly contributions were not given.
Table XV. Table XV. Showing, for the Year ending April, 1881, the Public Libraries, Mechanics' Institutes, and other Literary and Scientific Institutions in' the Colony of New Zealand which furnished Returns to the Registrar-General; specifying the Number of Institutions in each Provincial District, the Number of Members, and the Number of Volumes of Books.
| Provincial Districts. | Number of Institutions. | Number of Members. | Number of Volumes. |
|---|---|---|---|
| Auckland | 60 | 2,259 | 38,638 |
| Taranaki | 5 | 354 | 1,963 |
| Wellington | 12 | 1,273 | 17,385 |
| Hawke's Bay | 13 | 809 | 6,973 |
| Marlborough | 5 | 204 | 3,531 |
| Nelson | 19 | 946 | 17,647 |
| Westland | 8 | 325 | 4,244 |
| Canterbury | 47 | 2,586 | 51,836 |
| Otago | 56 | 4,112 | 56,303 |
| Total | 225 | 12,868 | 198,520 |
NOTE.—Five institutions are free public libraries, having a total number of 22,718 books.
Table XVI. Table XVI. Showing the Number of Churches and Chapels, Schoolhouses and other Buildings used for Public Worship by the different Religious Denominations; also the Number of Persons for whom there was Accommodation, and the Number usually attending, in April, 1881.
| Denominations. | Churches and Chapels. | Schoolhouses used for Public Worship. | Dwellings or Public Buildings used for Public Worship. | Number of Persons | |
|---|---|---|---|---|---|
| For whom Accommodation. | Attending Services. | ||||
| Protestant Churches— | |||||
| Church of England | 265 | 60 | 28 | 51,952 | 32,324 |
| Presbyterian | 169 | 58 | 22 | 43,266 | 29,250 |
| Wesleyan and Wesleyan Methodist | 149 | 22 | 11 | 28,962 | 18,915 |
| Baptist | 21 | … | 1 | 4,030 | 2,590 |
| United Free Methodist | 20 | 6 | … | 4,925 | 2,495 |
| Congregational Independent | 15 | 3 | 3 | 5,430 | 3,400 |
| Primitive Methodist | 24 | 2 | 2 | 4,750 | 2,517 |
| Lutheran | 6 | … | … | 900 | 435 |
| Brethren | 1 | … | 1 | 1,750 | 517 |
| Plymouth Brethren | 1 | … | … | 300 | 206 |
| Bible Christians | 1 | … | … | 125 | 120 |
| Catholic Apostolic Church | 1 | … | … | 200 | 40 |
| Church of Christ | 8 | 2 | 1 | 2,490 | 11,172 |
| Buildings (open to more than one Protestant | |||||
| Denomination) | '9 | 20 | 6 | 3,655 | 1,907 |
| Undenominational | 11 | 3 | 9 | 7,975 | 2,395 |
| Roman Catholics | 120 | 16 | 4 | 28,135 | 19,400 |
| Jews | 3 | … | … | 310 | 140 |
| Total | 834 | 192 | 88 | 189,155 | 117,817 |
| SUMMARY BY PPROVINCIAL DISTRICTS. | |||||
|---|---|---|---|---|---|
| Denominations. | Churches and Chapels. | Schoolhouses used for Public Worship. | Dwellings or Public Buildings used for Public Worship. | Number of Persons | |
| For whom Accommodation. | Attending Services. | ||||
| Auckland | 2l6 | 59 | 35 | 52,860 | 30,058 |
| Taranaki | 23 | 1 | … | 3,725 | 2,432 |
| Wellington | 96 | 17 | 7 | 20,463 | 12,940 |
| Hawke's Bay. | 31 | 23 | 14 | 7,865 | 4,854 |
| Marlborough | 20 | 1 | … | 3,382 | 1,863 |
| Nelson | 66 | 12 | 2 | 11,050 | 6,194 |
| Westland | 33 | 3 | … | 6,930 | 4,065 |
| Canterbury | 196 | 28 | 7 | 39,479 | 28,119 |
| Otago | 153 | 48 | 23 | 43,401 | 27,292 |
| Total | 834 | 192 | 88 | 189,155 | 117,817 |
Table of Contents
Table I. Showing the Strength of the Maori Population of New Zealand (North and South Islands distinguished), in April, 1881, specifying the principal Tribes, their Residences, and the Number of Males and Females under and over 15 Years of Age.
| TRIBES IN THE NORTH ISLAND. | ||||||||||
|---|---|---|---|---|---|---|---|---|---|---|
| Principal Tribe. | Residence. | Males. | Females. | Total. | ||||||
| Under 15. | Over 15. | Age not Specified. | Total Males. | Under 15. | Over 15. | Age not Specified | Total Females. | |||
| Arawa | Auckland | 2 | 13 | … | 15 | 3 | 8 | … | 11 | 26 |
| Arawa | Thames | … | 50 | … | 50 | … | … | … | … | 50 |
| Arawa | Tauranga | 4 | 23 | … | 27 | 5 | 22 | … | 27 | 54 |
| Arawa | Maketu | 115 | 275 | … | 390 | 115 | 257 | … | 372 | 762 |
| Arawa | Rotorua | 291 | 456 | … | 747 | 193 | 435 | … | 628 | 1,375 |
| Arawa | Opotiki | 13 | 35 | … | 48 | 13 | 32 | … | 45 | 93 |
| Arawa | East Coast | 1 | 5 | … | 6 | … | … | … | … | 6 |
| Arawa | Taupo | 386 | 443 | … | 829 | 289 | 442 | … | 731 | 1,560 |
| Arawa | Hawke's Bay | 4 | … | … | 4 | 8 | … | … | 8 | 12 |
| Total | 816 | 1,300 | … | 2,116 | 626 | 1,196 | … | 1,822 | 3,938 | |
| Muaupoko | Otaki | 15 | 30 | … | 45 | 10 | 26 | … | 36 | 81 |
| Ngatiporou | Thames | 35 | 94 | … | 129 | 26 | 60 | … | 86 | 215 |
| Ngatiporou | Opotiki | 2 | 1 | … | 3 | 1 | … | … | 1 | 4 |
| Ngatiporou | East Coast | 678 | 1,602 | … | 2,280 | 511 | 1,341 | … | 1,852 | 4,132 |
| Ngatiporou | Taranaki, Mokau | … | 1 | … | 1 | … | 1 | … | 1 | 2 |
| Ngatiporou | Hawke's Bay | 4 | 5 | … | 9 | 12 | … | … | 12 | 21 |
| Ngatiporou | Wairarapa | … | 6 | … | 6 | … | 1 | … | 1 | 7 |
| Total | 719 | 1,709 | … | 2,428 | 550 | 1,403 | … | 1,953 | 4,381 | |
| Ngatikahungunu | Auckland | … | 1 | … | 1 | … | … | … | … | 1 |
| Ngatikahungunu | Opotiki | 10 | 19 | … | 29 | 4 | 12 | … | 16 | 45 |
| Ngatikahungunu | East Coast | … | … | … | … | … | 1 | … | 1 | 1 |
| Ngatikahungunu | Wairoa | 413 | 731 | … | 1,144 | 295 | 578 | … | 873 | 2,017 |
| Ngatikahungunu | Hawke's Bay | 255 | 597 | … | 852 | 197 | 521 | … | 718 | 1,570 |
| Ngatikahungunu | Taupo | 1 | 1 | … | 2 | 1 | 2 | … | 3 | 5 |
| Ngatikahungunu | Wanganui | 13 | 52 | … | 65 | 11 | 20 | … | 31 | 96 |
| Ngatikahungunu | Rangitikei | 7 | 16 | … | 23 | 10 | 14 | … | 24 | 47 |
| Ngatikahungunu | Wairarapa | 149 | 391 | … | 540 | 124 | 284 | … | 408 | 948 |
| Total | 848 | 1,808 | … | 2,656 | 642 | 1,432 | … | 2,074 | 4,730 | |
| Ngaiterangi | Auckland | 2 | 2 | … | 4 | … | 4 | … | 4 | 8 |
| Ngaiterangi | Thames | 3 | 10 | … | 13 | 1 | 7 | … | 8 | 21 |
| Ngaiterangi | Tauranga | 138 | 387 | … | 525 | 117 | 324 | … | 441 | 966 |
| Ngaiterangi | Taupo | 1 | … | … | 1 | … | … | … | … | 1 |
| Total | 144 | 399 | … | 543 | 118 | 335 | 453 | 996 | ||
| Ngapuhi | Bay of Islands | 529 | 920 | … | 1,449 | 481 | 711 | … | 1,192 | 2,641 |
| Ngapuhi | Hokianga | 396 | 634 | … | 1,030 | 356 | 461 | … | 817 | 1,847 |
| Ngapuhi | Kaipara | 84 | 230 | … | 314 | 94 | 154 | … | 248 | 562 |
| Ngapuhi | Whangarei | 53 | 181 | … | 234 | 45 | 125 | … | 170 | 404 |
| Ngapuhi | Auckland | 26 | 30 | … | 56 | 7 | 21 | … | 28 | 84 |
| Ngapuhi | Waiuku | … | 2 | … | 2 | … | … | … | … | 2 |
| Ngapuhi | Thames | … | 5 | … | 5 | … | 1 | … | 1 | 6 |
| Ngapuhi | Opotiki | 1 | 1 | … | 2 | … | 1 | … | 1 | 3 |
| Ngapuhi | East Coast | … | 14 | … | 14 | … | … | … | … | 14 |
| Ngapuhi | Hawkes' Bay | … | … | … | … | 1 | … | … | 1 | 1 |
| Total | 1,089 | 2,017 | … | 3,106 | 984 | 1,474 | … | 2,458 | 5,564 | |
Table I. Showing the Strength of the Maori Population of New Zealand (North and South Islands distinguished), in April, 1881, specifying the Principal Tribes, their Residences, and the Number of Males and Females under and over 15 Years of Age—continued.
| TRIBES IN THE NORTH ISLAND. | ||||||||||
|---|---|---|---|---|---|---|---|---|---|---|
| Principal Tribe. | Residence. | Males. | Females. | Total. | ||||||
| Under 15. | Over 15. | Age not Specified. | Total Males. | Under 15. | Over 15. | Age not Specified | Total Females. | |||
| Ngatimaniapoto | Auckland | 7 | 15 | … | 22 | 3 | 12 | … | 15 | 37 |
| Ngatimaniapoto | Hamilton | 5 | 3 | … | 8 | 3 | 1 | … | 4 | 12 |
| Ngatimaniapoto | Upper Waikato | … | … | 650 | 650 | … | … | 550 | 550 | 1,200 |
| Ngatimaniapoto | Taupo | 3 | 3 | … | 6 | 1 | 5 | … | 6 | 12 |
| Ngatimaniapoto | Taranaki, Mokau | 25 | 54 | … | 79 | 23 | 59 | … | 82 | 161 |
| Ngatimaniapoto | Rangitikei | 19 | 41 | … | 60 | 11 | 35 | … | 46 | 106 |
| Total | 59 | 116 | 650 | 825 | 41 | 112 | 550 | 703 | 1,528 | |
| Ngatimaru | Auckland | 15 | 39 | … | 54 | 23 | 29 | … | 52 | 106 |
| Ngatimaru | Thames | 174 | 524 | … | 698 | 127 | 402 | … | 529 | 1,227 |
| Ngatimaru | Taupo | 2 | 4 | … | 6 | 2 | 8 | … | 10 | 16 |
| Total | 191 | 567 | … | 758 | 152 | 439 | … | 591 | 1,349 | |
| Ngatiawa | Opotiki | 95 | 219 | … | 314 | 94 | 200 | … | 294 | 608 |
| Ngatiawa | Taupo | 3 | 15 | … | 18 | 3 | 4 | … | 7 | 25 |
| Ngatiawa | Motiti Island | 21 | 43 | … | 64 | 19 | 26 | … | 45 | 109 |
| Ngatiawa | Taranaki, Mokau | 118 | 321 | … | 439 | 114 | 387 | … | 501 | 940 |
| Ngatiawa | Wairarapa | 3 | 7 | … | 10 | 1 | … | … | 1 | 11 |
| Ngatiawa | Waikanae | 10 | 23 | … | 33 | 15 | 20 | … | 35 | 68 |
| Ngatiawa | Wellington | 19 | 41 | … | 60 | 15 | 33 | … | 48 | 108 |
| Total | 269 | 669 | … | 938 | 261 | 670 | … | 931 | 1,869 | |
| Ngatiraukawa | Upper Waikato | … | … | 300 | 300 | … | … | 255 | 255 | 555 |
| Ngatiraukawa | Taupo | 3 | 4 | … | 7 | 4 | 7 | … | 11 | 18 |
| Ngatiraukawa | Rangitikei | 33 | 40 | … | 73 | 29 | 39 | … | 68 | 141 |
| Ngatiraukawa | Manawatu | 38 | 71 | … | 109 | 22 | 41 | … | 63 | 172 |
| Ngatiraukawa | Otaki | 96 | 133 | … | 229 | 88 | 138 | … | 226 | 455 |
| Ngatiraukawa | Waikanae | 1 | 4 | … | 5 | 2 | 2 | … | 4 | 9 |
| Ngatiraukawa | Wairarapa | 7 | 21 | … | 28 | 1 | 11 | … | 12 | 40 |
| Ngatiraukawa | Wellington | 9 | 25 | … | 34 | 5 | 14 | … | 19 | 53 |
| Total | 187 | 298 | 300 | 785 | 151 | 252 | 255 | 658 | 1,443 | |
| Ngatiruanui | Taranaki, Mokau | 115 | 269 | … | 384 | 112 | 260 | … | 372 | 756 |
| Ngatiruanui | Wellington | … | 8 | … | 8 | … | 5 | … | 5 | 13 |
| Total | 115 | 277 | … | 392 | 112 | 265 | … | 377 | 769 | |
| Ngatiwhatua | Kaipara | 81 | 160 | … | 241 | 69 | 105 | … | 174 | 415 |
| Ngatiwhatua | Auckland | 11 | 31 | … | 42 | 7 | 21 | … | 28 | 70 |
| Ngatiwhatua | Onewhero | … | 2 | … | 2 | … | … | … | … | 2 |
| Total | 92 | 193 | … | 285 | 76 | 126 | … | 202 | 487 | |
| Rangitane | Manawatu | 10 | 24 | … | 34 | 9 | 12 | … | 21 | 55 |
| Rangitane | Wairarapa | 5 | 7 | … | 12 | 3 | 19 | … | 22 | 34 |
| Total | 15 | 31 | … | 46 | 12 | 31 | … | 43 | 89 | |
| Rarawa | Mongonui | 422 | 524 | … | 946 | 355 | 466 | … | 821 | 1,767 |
| Rarawa | Hokianga | 210 | 351 | … | 561 | 157 | 263 | … | 420 | 981 |
| Rarawa | Auckland | 4 | 12 | … | 16 | 2 | 6 | … | 8 | 24 |
| Rarawa | Newcastle | … | 2 | … | 2 | … | 1 | … | 1 | 3 |
| Total | 636 | 889 | … | 1,525 | 514 | 736 | … | 1,2So | 2,775 | |
| Taranaki | Thames | … | 5 | … | 5 | … | 1 | … | 1 | 6 |
| Taranaki | Taranaki, Mokau | 54 | 173 | … | 227 | 47 | 165 | … | 212 | 439 |
| Taranaki | Wellington | 2 | 5 | … | 7 | 2 | 6 | … | 8 | 15 |
| Total | 56 | 183 | … | 239 | 49 | 172 | … | 221 | 460 | |
| Urewera | Opotiki | 360 | 444 | … | 804 | 339 | 388 | … | 727 | 1,531 |
| Urewera | Wairoa | 53 | 87 | … | 140 | 54 | 65 | … | 119 | 259 |
| Urewera | Hawke's Bay | … | 26 | … | 26 | … | 2 | … | 2 | 28 |
| Urewera | Taupo | 6 | 16 | … | 22 | 3 | 7 | … | 10 | 32 |
| Total | 419 | 573 | … | 992 | 396 | 462 | … | 858 | 1,850 | |
Table I. Showing the Strength of the Maori Population of New Zealand (North and South Islands distinguished), in April, 1SS1, specifying the Principal Tribes, their Residences, and the Number of Males and Females under and over 15 Years of Age—continued.
| TRIBES IN THE NORTH ISLAND. | ||||||||||
|---|---|---|---|---|---|---|---|---|---|---|
| Principal Tribe. | Residence. | Males. | Females. | Total. | ||||||
| Under 15. | Over 15. | Age not Specified. | Total Males. | Under 15. | Over 15. | Age not Specified | Total Females. | |||
| Waikato | Auckland | 4 | 13 | … | 17 | 5 | 9 | … | 14 | 31 |
| Waikato | Waiuku | 25 | 114 | … | 139 | 27 | 54 | … | 8l | 220 |
| Waikato | Whangape | 66 | 186 | … | 252 | 63 | 108 | … | 171 | 423 |
| Waikato | Onewhero | 45 | 86 | … | 131 | 49 | 71 | … | 120 | 251 |
| Waikato | Rangiriri | 49 | 78 | … | 127 | 47 | 65 | … | 112 | 239 |
| Waikato | Newcastle | 2 | 3 | … | 5 | 3 | 2 | … | 5 | 10 |
| Waikato | Waipa | 18 | 22 | … | 40 | 21 | 27 | … | 48 | 88 |
| Waikato | Hamilton | 12 | 18 | … | 30 | 11 | 16 | … | 27 | 57 |
| Waikato | Cambridge | 150 | 227 | … | 377 | 79 | 99 | … | 178 | 555 |
| Waikato | Upper Waikato | … | … | 1,350 | 1,350 | … | … | 1,100 | 1,100 | 2,450 |
| Waikato | Raglan | 131 | 267 | … | 398 | 115 | 230 | … | 345 | 743 |
| Waikato | Thames | 8 | 14 | … | 22 | 7 | 19 | … | 26 | 48 |
| Waikato | Taranaki, Mokau | 20 | 38 | … | 58 | 21 | 39 | … | 60 | 118 |
| Total | 530 | 1,066 | 1,350 | 2,946 | 448 | 739 | 1,100 | 2,287 | 5,233 | |
| Whanau-a-Apanui | Auckland | 2 | 9 | … | 11 | 2 | 6 | … | 8 | 19 |
| Whanau-a-Apanui | Opotiki | 146 | 251 | … | 397 | 115 | 214 | … | 329 | 726 |
| Whanau-a-Apanui | Hawke's Bay | … | 3 | … | 3 | … | … | … | … | 3 |
| Total | 148 | 263 | … | 411 | 117 | 220 | … | 337 | 748 | |
| Whanganui | Upper Waikato | … | … | 25 | 25 | … | … | 20 | 20 | 45 |
| Whanganui | Taupo | 19 | 16 | … | 35 | 4 | 6 | … | 10 | 45 |
| Whanganui | Taranaki, Mokau | 74 | 130 | … | 204 | 61 | 119 | … | 180 | 384 |
| Whanganui | Wanganui | 282 | 752 | … | 1,034 | 276 | 562 | … | 838 | 1,872 |
| Whanganui | Rangitikei | 35 | 75 | … | 110 | 22 | 55 | … | 77 | 187 |
| Whanganui | Wairarapa | 2 | 16 | … | 18 | … | 9 | … | 9 | 27 |
| Total | 412 | 989 | 25 | 1,426 | 363 | 751 | 20 | 1,134 | 2,560 | |
| Whakatohea | Auckland | … | 2 | … | 2 | … | 2 | … | 2 | 4 |
| Whakatohea | Opotiki | 110 | 222 | … | 332 | 99 | 190 | … | 289 | 621 |
| Total | 110 | 224 | … | 334 | 99 | 192 | … | 291 | 625 | |
| Various Tribes | Auckland and Thames | 12 | 64 | … | 76 | 17 | 33 | … | 50 | 126 |
| RECAPITULATION. | |||||||||
|---|---|---|---|---|---|---|---|---|---|
| Principal Tribe. | Males. | Females. | Total. | ||||||
| Under 15. | Over 15. | Age not Specified. | Total Males. | Under 15. | Over 15. | Age not Specified | Total Females. | ||
| Arawa | 816 | 1,300 | … | 2,116 | 626 | 1,196 | … | 1,822 | 3,938 |
| Muaupoko | 15 | 30 | … | 45 | 10 | 26 | … | 36 | 81 |
| Ngatiporou | 719 | 1,709 | … | 2,428 | 550 | 1,403 | … | 1,953 | 4,381 |
| Ngatikahungunu | 848 | 1,808 | … | 2,656 | 642 | 1,432 | … | 2,074 | 4,730 |
| Ngaiterangi | 144 | 399 | … | 543 | 118 | 335 | … | 453 | 996 |
| Ngapuhi | 1,089 | 2,017 | … | 3,106 | 984 | 1,474 | … | 2,458 | 5,564 |
| Ngatimaniapoto | 59 | 116 | 650 | 825 | 41 | 112 | 550 | 703 | 1,528 |
| Ngatimaru | 191 | 567 | … | 758 | 152 | 439 | … | 591 | 1,349 |
| Ngatiawa | 269 | 669 | … | 938 | 261 | 670 | … | 931 | 1,869 |
| Ngatiraukawa | 187 | 298 | 300 | 785 | 151 | 252 | 255 | 658 | 1,443 |
| Ngatiruanui | 115 | 277 | … | 392 | 112 | 265 | … | 377 | 769 |
| Ngatiwhatua | 92 | 193 | … | 285 | 76 | 126 | … | 202 | 487 |
| Rangitane | 15 | 31 | … | 46 | 12 | 31 | … | 43 | 89 |
| Rarawa | 636 | 889 | … | 1,525 | 514 | 736 | … | 1,250 | 2,775 |
| Taranaki | 56 | 183 | … | 239 | 49 | 172 | … | 221 | 460 |
| Urewera | 419 | 573 | … | 992 | 396 | 462 | … | 858 | 1,850 |
| Waikato | 530 | 1,066 | 1,350 | 2,946 | 448 | 739 | 1,100 | 2,287 | 5,233 |
| Whanau-a-Apanui | 148 | 263 | 411 | 117 | 220 | … | 337 | 748 | |
| Whanganui | 412 | 989 | 25 | 1,426 | 363 | 751 | 20 | 1,134 | 2,560 |
| Whakatohea | 110 | 224 | … | 334 | 99 | 192 | … | 291 | 625 |
| Various Tribes at Auckland and Thames | 12 | 64 | … | 76 | 17 | 33 | … | 50 | 126 |
| Total | 6,882 | 13,665 | 2,325 | 22,872 | 5,738 | 11,066 | 1,925 | 18,729 | 41,601 |
| SOUTH ISLAND. | |||||||
|---|---|---|---|---|---|---|---|
| Residence.* | Males. | Females. | Total. | ||||
| Under 15. | Over 15. | Total Males. | Under 15. | Over 15. | Total Females. | ||
| * The Natives resident in the South Island cannot well be classified in tribes, the information afforded by the Maori Census returns not being sufficiently explicit. | |||||||
| Marlborough | 60 | 139 | 199 | 62 | 96 | 158 | 357 |
| Nelson | 30 | 80 | 110 | 23 | 70 | 93 | 203 |
| Westland | 16 | 23 | 39 | 9 | 15 | 24 | 63 |
| Canterbury | 104 | 212 | 316 | 137 | 148 | 285 | 601 |
| Otago, Ruapuke, and Stewart Island | 214 | 243 | 457 | 183 | 197 | 380 | 837 |
| Total South Island | 424 | 697 | 1,121 | 414 | 526 | 940 | 2,061 |
| MAORI AND MORIORI POPULATION OF THE CHATHAM ISLANDS. | |||||||
|---|---|---|---|---|---|---|---|
| — | Males. | Females. | Total. | ||||
| Under 15. | Over 15. | Total Males. | Under 15. | Over 15. | Total Females. | ||
| Maoris | 6 | 33 | 39 | 15 | 27 | 42 | 81 |
| Morioris | 1 | 25 | 26 | … | 18 | 18 | 44 |
| Total | 7 | 58 | 65 | 15 | 45 | 60 | 125 |
| SUMMARY. | |||
|---|---|---|---|
| — | Males. | Females. | Total. |
| † The half castes enumerated in the general Census are not included in these numbers. | |||
| North Island | 22,872 | 18,739 | 41,601 |
| South Island | 1,121 | 940 | 2,061 |
| Chatham Islands | 65 | 60 | 125 |
| Maori Prisoners from North Island in Hokitika, Lyttelton, and Dunedin Gaols | 310 | … | 310 |
| Total | 24,368 | 19,729 | 44,097† |
Table I. Table II. Showing the Numbers of the Males and Females, under and over 15 Years of Age of the Maori Tribes of New Zealand, and the Proportions per Cent, at those Age-Periods where full Information was obtained, in April, 1881.
| NUMBERS. | |||||||
|---|---|---|---|---|---|---|---|
| Tribe. | Males. | Females. | Total. | ||||
| Under 15. | Over 15. | Total. | Under 15. | Over 15. | Total. | ||
| Tribes respecting whom full Information was obtained of the Ages of all the Members— | |||||||
| Arawa | 816 | 1,300 | 2,116 | 626 | 1,196 | 1,822 | 3,938 |
| Muaupoko | 15 | 30 | 45 | 10 | 26 | 36 | 81 |
| Ngatiporou | 719 | 1,709 | 2,428 | 550 | 1,403 | 1,953 | 4,381 |
| Ngaiterangi | 144 | 399 | 543 | 118 | 335 | 453 | 996 |
| Ngapuhi | 1,089 | 2,017 | 3,106 | 984 | 1,474 | 2,458 | 5,564 |
| Ngatimaru | 191 | 567 | 758 | 152 | 439 | 591 | 1,349 |
| Ngatiawa | 269 | 669 | 938 | 261 | 670 | 931 | 1,869 |
| Ngatikahungunu | 848 | 1,808 | 2,656 | 642 | 1,432 | 2,074 | 4,730 |
| Ngatiruanui | 115 | 277 | 392 | 112 | 265 | 377 | 769 |
| Ngatiwhatua | 92 | 193 | 285 | 76 | 126 | 202 | 487 |
| Rangitane | 15 | 31 | 46 | 12 | 31 | 43 | 89 |
| Rarawa | 636 | 889 | 1,525 | 514 | 736 | 1,250 | 2,775 |
| Taranaki | 56 | 183 | 239 | 49 | 172 | 221 | 460 |
| Urewera | 419 | 573 | 992 | 396 | 462 | 858 | 1,850 |
| Whanau-a-Apanui | 148 | 263 | 411 | 117 | 220 | 337 | 748 |
| Whakatohea | 110 | 224 | 334 | 99 | 192 | 291 | 625 |
| Tribe not stated | 12 | 64 | 76 | 17 | 33 | 50 | 126 |
| Total | 5,694 | 11,196 | 16,890 | 4,735 | 9,212 | 13,947 | 30,837 |
| Tribes respecting whom the Information was given for a Portion of the Members only— | … | … | … | … | … | … | … |
| Ngatimania poto—Age specified | 59 | 116 | 175 | 41 | 112 | 153 | 328 |
| Ngatimania poto—Age not stated | … | … | 650 | … | … | 550 | 1,200 |
| Ngatiraukawa Age specified | 187 | 298 | 485 | 151 | 252 | 403 | 888 |
| Ngatiraukawa Age not stated | … | … | … | 300 | … | 255 | 555 |
| Waikato Age specified | 530 | 1,066 | 1,596 | 448 | 739 | 1,187 | 2,783 |
| Waikato Age not stated | … | … | 1,350 | … | … | 1,100 | 2,450 |
| Whanganui Age specified | 412 | 989 | 1,401 | 363 | 751 | 1,114 | 2,515 |
| Whanganui Age not stated | … | … | 25 | … | … | 20 | 45 |
| Total | 1,188 | 2,469 | 5,982 | 1,003 | 1,854 | 4,782 | 10,764 |
| Total North Island | 6,882 | 13,665 | 22,872 | 5,738 | 11,066 | 18,729 | 41,601 |
| Population of South and Stewart Islands— | |||||||
| Resident | 424 | 697 | 1,121 | 414 | 526 | 940 | 2,061 |
| North Island Prisoners in South Island Gaols | … | … | 310 | … | … | … | 310 |
| Total South Island | 424 | 697 | 1,431 | 414 | 526 | 940 | 2,371 |
| Chatham Islands— | |||||||
| Maoris | 6 | 33 | 39 | 15 | 27 | 42 | 81 |
| Morioris | 1 | 25 | 26 | … | 18 | 18 | 44 |
| Total | 7 | 58 | 65 | 15 | 45 | 60 | 125 |
| Grand Total | 7,313 | 14,420 | 24,368 | 6,167 | 11,637 | 19,729 | 44,097 |
Table II. Table II. Showing the Numbers of the Males and Females, under and over 15 Years of Age, of the Maori Tribes of New Zealand, and the Proportions per Cent, at those Age-Periods where full Information was obtained, in April, 1881—continued.
| PROPORTIONS PER CENT, OF MALES AND FEMALES UNDER AND OVER 15. | ||||
|---|---|---|---|---|
| Tribe. | Males. | Females. | ||
| Under 15. | Over 15. | Under 15. | Over 15. | |
| Tribes respecting whom full Information was obtained of the Ages of all the Members— | ||||
| Arawa | 38.56 | 61.54 | 34.36 | 65.64 |
| Muaupoko | 33.33 | 66.67 | 27.28 | 72.22 |
| Ngatiporou | 29.61 | 70.39 | 28.16 | 71.84 |
| Ngaiterangi | 26.52 | 73.48 | 26.05 | 73.95 |
| Ngapuhi | 35.06 | 64.94 | 40.04 | 59.96 |
| Ngatimaru | 25.20 | 74.80 | 25.72 | 74.28 |
| Ngatiawa | 28.68 | 71.32 | 28.03 | 71.97 |
| Ngatikahungunu | 31.93 | 68.07 | 30.95 | 69.05 |
| Ngatiruanui | 29.34 | 70.66 | 29.71 | 70.29 |
| Ngatiwhatua | 32.28 | 67.72 | 37.62 | 62.38 |
| Rangitane | 32.61 | 67.39 | 27.91 | 72.09 |
| Rarawa | 41.70 | 58.30 | 41.12 | 58.88 |
| Taranaki | 23.43 | 76.57 | 22.17 | 77.83 |
| Urewera | 42.24 | 57.76 | 46.15 | 53.85 |
| Whanau-a-Apanui | 36.01 | 63.99 | 34.72 | 65.28 |
| Whakatohea | 32.93 | 67.07 | 34.02 | 65.98 |
| Tribe not stated | 15.79 | 84.21 | 34.00 | 66.00 |
| Total | 33.71 | 66.29 | 33.95 | 66.05 |
| Tribes respecting whom the Information was given for a Portion of the Members only— | ||||
| Ngatimaniapoto | 33.71 | 66.29 | 26.80 | 73.20 |
| Ngatiraukawa | 38.56 | 61.44 | 37.47 | 62.53 |
| Waikato | 33.21 | 66.79 | 37.74 | 62.26 |
| Whanganui | 29.41 | 70.59 | 32.59 | 64.89 |
| Total | 32.49 | 67.51 | 35.11 | 64.89 |
| Total North Island | 33.49 | 66.51 | 34.15 | 65.85 |
| Population of South and Stewart Islands | 37.82 | 62.18 | 44.04 | 55.96 |
| Chatham Islands | 10.77 | 89.23 | 25.00 | 75.00 |
| Grand Total | 33.63 | 66.35 | 34.64 | 65.36 |
By Authority : GEORGE DIDSBURY, Government Printer, Wellington.