
Te Pukapuka Houanga Whaimana o Aotearoa
Statistics New Zealand
In answer to a telephone call, email, visit or letter, Statistics New Zealand information analysts can provide statistical information, or tell you more about the department's other services, including how to access statistics on the INFOS computer database and the Statistics New Zealand website.
Website: www.stats.govt.nz
Telephone: 0508-525-525 (toll free)
Email: info@stats.govt.nz
AUCKLAND
70 Symonds Street
Private Bag
92003
Telephone: (09) 920–9100
Facsimile: (09) 920–9198
WELLINGTON
Statistics House
The
Boulevard
Harbour Quays
PO
Box 2922
Telephone: (04) 931–4600
Facsimile: (04) 931–4610
CHRISTCHURCH
Dollan House
401 Madras
Street
Private Bag 4741
Telephone: (03) 964–8700
Facsimile: (03)
964–8964
Acknowledgements
The New Zealand Official Yearbook 2006 was produced by the Product Development and Publishing Business Unit of Statistics New Zealand, with the assistance of the many individuals and organisations listed in the ‘Contributors’ section at the end of each chapter, or below the sidebars. The department thanks them and the following:
Statistics New Zealand
Business Unit Manager: Gareth McGuinness
Publishing Manager: Lesley Hooper
Project Editor: Paul Cavanagh
Editor: Brendan Hutching
Production Editor: Marie Smith
Illustrations Editor and Photographer: Margaret Low
Technical support: Nicky McCreanor, Shirley Dixon
Other
Graphics and typesetters: Totem Communications Ltd
Cover: Shelley Watson/Sublime Design
Indexer: Jill Gallop
Liability
Statistics New Zealand has made every effort to obtain, analyse and edit the information and statistics used in the New Zealand Official Yearbook 2006. However, Statistics New Zealand gives no warranty that the information or data supplied contains no errors, and will not be liable for any loss or damage caused by the use, directly or indirectly, of material contained in the Yearbook.
New Zealand Official Yearbook 2006
ISSN 0078-0170
ISBN 978186953-638-1
1-86953-638-X
This book is copyright. Except for the purpose of fair review, no part may be stored or transmitted in any form or by any means, electronic or mechanical, including recording or storage in any information retrieval systems, without permission in writing from the publisher. No reproduction may be made, whether by photocopying or by any other means, unless a licence has been obtained from the publisher or their agent.
Copyright © Statistics New Zealand 2006.
Published in 2006 by David Bateman Ltd, 30 Tarndale Grove, Albany, Auckland, New Zealand.
Printed by PrintLink, Wellington, New Zealand.
Table of Contents
List of Figures
- 1.01. Climate norms
- 4.01. Overseas representation
- 5.06. Components of annual population change
Natural increase' and net migration2
Years ending 31 March
- 9.02. Tertiary attendance 2004
- 10.01. Convictions by offence type
- 16.01. Land use
- 16.06. Parks of New Zealand
- 16.06. Whale sanctuaries
- 17.01. Consumers Price Index groups
- 17.02. Consumers Price Index international comparisons 1999–2005
Excludes housing and credit services
- 19.02. Land use
- 27.02. Operating balance
List of Tables
- 1.02. Principal mountains
- 1.03. Principal rivers1
- 1.04. Principal lakes1
- 4.05. State of the navy
- 4.07. State of the army
- 4.09. State of the air force
- 6.04. Religious affiliation1
- 8.11. Abortion rates
New Zealand and other low fertility countries
Latest available year ending 31 December
- 9.07. Enrolments at tertiary institutions
By field of study, level of education and sex
At 31 July 2004
- 9.13. Education 1875–2004
- 10.01. Judges of the Supreme Court and Court of Appeal, and judges and associate
judges of the High Court1
- 10.13. Community-based sentences1
- 10.19. Drug seizures (combined NZ Police and NZ Customs Service)By substanceYears ending 31 December
- 11.03. Magazine circulation1
- 11.1. 2004–05 Stamp issues
- 13.01. Gambling statistics
Non-inflation adjusted for year ending 30 June1rounded to the nearest million
- 14.01. Movable public holidays
- 14.05. Labour force participation rates in 20051
By sex and age group
Average for year ending 30 September
- 14.16. Median weekly earnings
Full-time wage and salary/workers
By age and sex
Quarter ending 30 June 2005
- 16.01. Land use1
- 18.02. Sheep categories
At 30 June
- 18.03. Cattle categories
At 30 June
- 18.05. Average net schedule prices
- 18.14. Pigs
At 30 June
- 21.02. North Island regional employment in manufacturing
By major types of industry, in employee count1
- 21.03. South Island regional employment in manufacturing
2005
By major types of industry, in employee count1
- 22.09. Residential and non-residential building authorisations
By number and value
Years ending 31 March
- 23.06. Formed roads and streets
- 24.05. Credit card usage1
By value
- 27.09. Refinancing/repricing risk
Table of Contents
The New Zealand Official Yearbook has provided a comprehensive statistical picture of life in New Zealand for more than 100 years. This 105th edition of the Yearbook celebrates and continues this tradition, providing a wide-ranging picture of New Zealand society in 2006, based on the latest possible information.
Most recent Yearbooks have carried a theme, and the 2006 edition has an international focus, highlighting New Zealand's position, statistically, on the world stage. Sidebar stories, tables and graphs show ‘How we measure up’ in areas such as population, health and education against the other 29 member countries of the Organisation for Economic Co-operation and Development (OECD).
This international focus is timely. Statistics which are internationally comparable provide a valuable context for evaluation and decision making. New Zealand is an active member of the international statistical community and makes a valuable contribution towards improved global standards and techniques in statistical measures. Internationally, New Zealand's expertise in measuring small populations is used to good effect in its role as a contributor of advice to developing countries, especially around the Pacific Rim. Recent projects have included coordinating the 2004 Census for the newly-formed nation of Timor-Leste and, latterly, the censuses of Niue and Tokelau.
Back home, Statistics New Zealand is taking a leadership role in making government statistics more readily available, promoting the use of statistical standards and managing the burden of government surveys. Data accessibility has been much enhanced by the launch of Statisphere (www.statisphere.govt.nz), an online portal that provides a gateway to government information. Statisphere is a register of all statistics produced by government, and facilitates access to them via links to the relevant ‘producing’ departments’ websites. The portal is a collaborative effort across government agencies and in time will grow to become an essential one-stop shop for those wishing to access government information.
Statistics are primarily about people and their activities, and in this context I would like to pay special tribute to my colleague, the late Kevin Eddy, who died earlier this year. Kevin worked at Statistics New Zealand for more than 30 years and for more than a decade oversaw publication and development of the New Zealand Official Yearbook, making it the accessible and modern publication it is today.
I would also like to offer special thanks to the New Zealand Official Yearbook 2006 team for the high standards they have achieved and to publisher David Bateman Ltd for continuing to provide a high-quality finished product.
On behalf of Statistics New Zealand, I thank the nearly 400 businesses, government departments, nongovernment organisations, academic institutions and individuals for their time, effort and goodwill in providing and updating contributions to the 2006 Yearbook. Their high level of cooperation, not only with the Yearbook but with all our surveys, ensures the continuing high quality of New Zealand's official statistics.

Brian Pink
Government Statistician

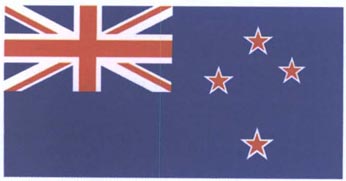
The New Zealand flag is the symbol of the realm, government and people of New Zealand. The flag features, on a royal blue background, a Union Jack in the first quarter and four five-pointed red stars of the Southern Cross on the fly. The stars have white borders. The royal blue background is reminiscent of New Zealand's blue sea and clear sky, while the stars of the Southern Cross emphasise New Zealand's location in the South Pacific Ocean. The Union Jack gives recognition to New Zealand's historical foundations and the fact that the country was once a British colony and dominion.
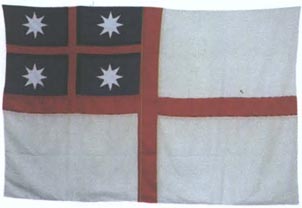
For a detailed history of Te Hakituatahi o Aotearoa, see Chapter 3: Government. The flag features, on a white field, a red St George's Cross. In the upper canton next to the staff, on a blue field, a smaller St George's Cross in red, severed from the blue by a fimbriation of black half the width of the red, and, in the centre of each blue quarter, a white eight-pointed star.
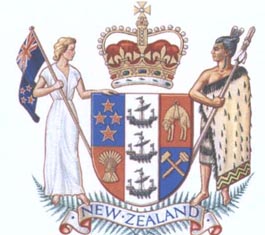
New Zealand has had its own coat of arms since 1911. Before that the United Kingdom coat of arms (featuring a lion and a unicorn on either side of a shield and crown) was used. This design still adorns the top of the pediment on the Old Government Buildings in Lambton Quay, Wellington, which were built in 1875 to house the colony's public service, but which now house Victoria University's law school. One of the few specific changes to flow on from the granting of Dominion status in 1907 was the right for New Zealand to have its own coat of arms. The design was approved by royal warrant on 26 August 1911. The coat of arms was revised in 1956 following further constitutional changes when the country became the ‘Realm of New Zealand’ instead of the ‘Dominion of New Zealand’. Accordingly, the British lion holding aloft the Union Jack was replaced by St Edward's Crown, worn by Queen Elizabeth II at her coronation. At the same time, the dress of the figures at the side of the shield was revamped, some Victorian-looking scroll work at the base of the design was replaced by two ferns, and the motto ‘Onward’ was replaced with ‘New Zealand’.
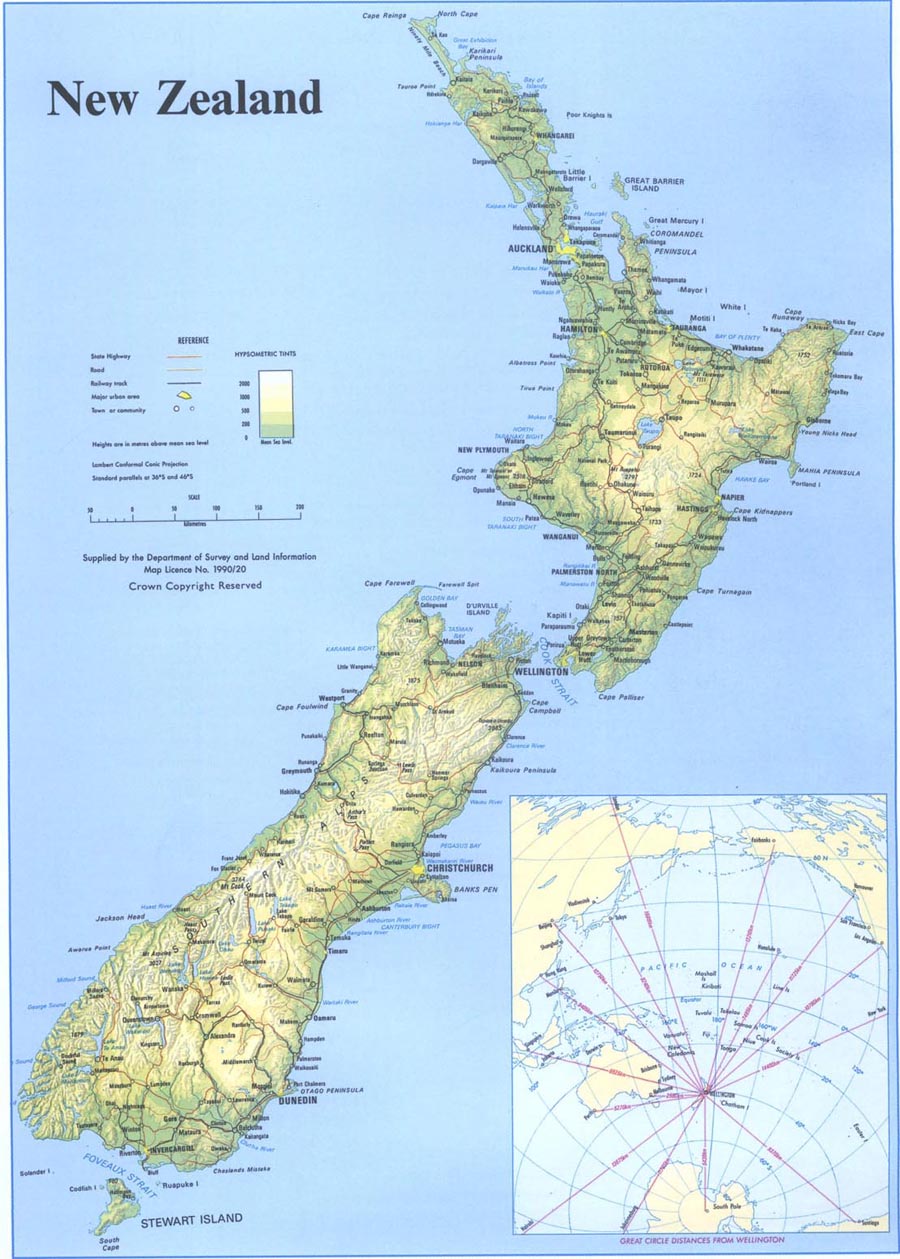
Table of Contents
Volcanic eruptions have killed more people than earthquakes in New Zealand in the past 150 years, including the 108 who died in the 1886 eruption of Mt Tarawera (pictured).
New Zealand lies in the south-west Pacific Ocean and comprises two main and a number of smaller islands. Their combined area of 267,707 square kilometres is similar in size to Japan or the British Isles. Table 1.01 gives more detail of the size of the islands.
The main North and South Islands are separated by Cook Strait, which, at its narrowest point, is 20 kilometres wide.
The North and South Islands lie on an axis running from north-east to south-west, except for the low-lying Northland peninsula.
The administrative boundaries of New Zealand extend from 33 degrees to 53 degrees south latitude and from 160 degrees east to 173 degrees west longitude.
In addition to the main and nearby islands, New Zealand also includes the small inhabited outlying islands of the Chathams, 850 kilometres east of Christchurch; Raoul Island, in the Kermadec Group, 930 kilometres north-east of the Bay of Islands; and Campbell Island, 590 kilometres south of Stewart Island.
New Zealand also has jurisdiction over the territories of Tokelau and the Ross Dependency.
Table 1.01. Land area of New Zealand1
| Land area | Size (sq km) |
|---|---|
1Includes all internal waterways (lakes and rivers). 2Includes all offshore Islands 20 square kilometres or larger, except those listed separately. Source: Land Information New Zealand | |
| North Island | 114,154 |
| South Island | 150,416 |
| Stewart Island/Rakiura | 1,681 |
| Chatham Islands | 963 |
| Raoul Island | 34 |
| Campbell Island/Motu Ihupuku | 113 |
| Offshore islands2 | 346 |
New Zealand is more than 1,600 kilometres long and 450 kilometres wide at its widest part, and has a long coastline (more than 18,000 kilometres) for its area. The coast is very indented in places, providing many natural harbours.
The country is also very mountainous, with about three-quarters of the land 200 metres or more above sea level.
In the North Island, the main ranges run generally north-east to south-west, parallel to the coast, from East Cape to Cook Strait, with further ranges and four volcanic peaks to the north-west.
The South Island is much more mountainous than the North Island, with the Southern Alps, a massive mountain chain, running nearly the length of the island. There are many outlying ranges to the Southern Alps in the north and the south-west of the South Island. New Zealand has at least 223 named peaks higher than 2,300 metres. Table 1.02 lists the highest mountains in both the North and South Islands.
Table 1.02. Principal mountains
| Mountain or peak | Elevation (metres) |
|---|---|
1Taranaki or Egmont is the correct format for the dual name as prescribed in the 1986 Gazette. 2The Institute of Geological and Nuclear Sciences photogrammetrically confirmed the height of Aoraki/Mt Cook as 3,754 metres after a 1991 slip from the peak. Source: Land Information New Zealand | |
| North Island: | |
| Ruapehu | 2,797 |
| Taranaki or Egmont1 | 2.518 |
| Ngauruhoe | 2,287 |
| Tongariro | 1,967 |
| South Island: | |
| Aoraki/Mt Cook2 | 3,754 |
| Tasman | 3,497 |
| Dampier | 3,440 |
| Silberhorn | 3,300 |
| Malte Brun | 3,199 |
| Hicks (St David's Dome) | 3,198 |
| Lendenfeld Peak | 3,194 |
| Graham | 3,184 |
| Torres | 3,160 |
| Sefton | 3,151 |
| Haast | 3,114 |
| Elie de Beaumont | 3,109 |
| La Perouse | 3,078 |
| Douglas Peak | 3,077 |
| Haidinger | 3,070 |
| Minarets | 3,040 |
| Aspiring/Tititea | 3,033 |
| Glacier Peak | 3,002 |
There are 360 glaciers in the Southern Alps. The largest are, on the east, the Tasman (29 kilometres in length), Murchison (13 kilometres), Mueller (13 kilometres), Godley (13 kilometres) and Hooker (11 kilometres), and, on the west, the Fox (15 kilometres) and the Franz Josef (13 kilometres).
New Zealand's rivers (see Table 1.03) are mainly swift and difficult to navigate. They are important as sources of hydro-electric power, and artificial lakes have been created as part of major hydroelectric schemes.
Braided channels of the Rakaia River, Canterbury.
Table 1.03. Principal rivers1
| River | Length km |
|---|---|
1More than 150 kilometres in length from the mouth to the farthest point in the river system, irrespective of name, including estimated courses through lakes. Source: Land Information New Zealand | |
| North Island: | |
| Flowing into the Pacific Ocean – | |
| Rangitaiki | 193 |
| Waihou | 175 |
| Mohaka | 172 |
| Ngaruroro | 154 |
| Flowing into the Tasman Sea – | |
| Waikato | 425 |
| Whanganui | 290 |
| Rangitikei | 241 |
| Manawatu | 182 |
| Whangaehu | 161 |
| Mokau | 158 |
| South Island: | |
| Flowing into Cook Strait – | |
| Wairau | 169 |
| Flowing into the Pacific Ocean – | |
| Clutha/Mata-Au | 322 |
| Taieri | 288 |
| Clarence | 209 |
| Waitaki | 209 |
| Waiau | 169 |
| Waimakariri | 161 |
| Flowing into Foveaux Strait – | |
| Mataura | 240 |
| Waiau | 217 |
| Oreti | 203 |
| Flowing into the Tasman Sea – | |
| Buller | 177 |
New Zealand's artificial lakes created by the South Island's hydroelectric schemes are identified in Table 1.04, which describes the country's principal lakes.
Table 1.04. Principal lakes1
| Maximum depth (metres) | Area (km2) | |
|---|---|---|
1Greater than 20 square kilometres in area. Sources: National Institute of Water and Atmospheric Research (depths) Land Information New Zealand (areas) | ||
| North Island: | ||
| Taupo (Taupomoana) | 163 | 613 |
| Rotorua | 45 | 81 |
| Wairarapa | 3 | 77 |
| Waikaremoana | 248 | 50 |
| Tarawera | 87 | 41 |
| Rotoiti | 94 | 34 |
| Waikari | 2 | 34 |
| South Island: | ||
| Te Anau | 417 | 344 |
| Wakatipu | 380 | 295 |
| Wanaka | 311 | 201 |
| Ellesmere (Te Waihora) | 2 | 197 |
| Pukaki | 99 | 172 |
| Manapouri | 444 | 139 |
| Hawea | 384 | 152 |
| Tekapo | 120 | 96 |
| Benmore (artificial) | 120 | 75 |
| Hauroko | 462 | 71 |
| Ohau | 129 | 59 |
| Poteriteri | uncharted | 44 |
| Brunner (Moana) | 109 | 41 |
| Coleridge | 200 | 37 |
| Monowai | 161 | 32 |
| Aviemore (artificial) | 62 | 28 |
| Dunstan (artificial) | 70 | 27 |
| Rotoroa | 152 | 24 |
| McKerrow | 121 | 23 |
New Zealand is in an area of the world characterised by active volcanoes and frequent earthquakes. The ‘ring of fire’, as this area is known, forms a belt that surrounds the Pacific Ocean and is the surface expression of a series of boundaries between the plates that make up the earth's crust.
The boundary between the Indo-Australian and the Pacific plates runs through New Zealand, and processes from their collisions have had a profound effect on New Zealand's size, shape and geology.
Renewed mountain building in New Zealand between about six million years ago and the present is primarily responsible for the landscape of today.
Mountain chains have been built by folding and displacement of the earth's crust along faults, or by flexing of crustal plates due to sediment loading and unloading. Due to this activity, well-preserved tilted blocks bounded by fault scarps (steep faces hundreds or even thousands of metres high) are visible in the landscape of some regions.
In the past six million years, waves have eaten back New Zealand headlands and built beaches, spits and bars.
Ongoing movement of the Pacific and Indo-Australian plates is responsible for continued earth strain in New Zealand, and this results in periodic rupture of faults, several of which caused major earthquakes during the past century.
Erosion, enhanced by climate, has transformed the landscape, carving detailed patterns of peaks, ridges, valleys and gorges. Deposition of debris has built up alluvial plains, shingle fans and other construction forms.
At the coast, waves have eaten back headlands and built beaches, spits and bars. Glaciers have carved the sea-filled valleys of Fiordland and have occupied most valleys of the South Island, many of which now have lakes held in by terminal moraines. Sea level changes accompanied formation, and later melting, of global glacial ice. These changes affected the erosion and deposition of rivers and were responsible for the formation of many prominent river terraces.
Volcanic activity during the past few million years has played an important part in shaping the landscape of the central North Island. The largest volcanic outpourings of late geological times were in the region between Tongariro National Park and the Bay of Plenty coast.
The most recognisable volcanoes in New Zealand, all of which are active, include Ruapehu, Tongariro, Ngauruhoe, White Island and Taranaki or Egmont.
Other major volcanoes are less obvious, but have even more dramatic impacts on the landscape. These are the caldera-forming volcanoes that are now occupied by large central North Island lakes. Lakes Taupo, Rotorua and Tarawera can be thought of as upside down volcanoes.
Small volcanic cones, such as One Tree Hill, Mt Eden and Rangitoto, are an important part of the Auckland landscape. These are dormant, but the volcanic field is still regarded as posing a significant hazard.
Living in New Zealand means living with earthquakes. There is an almost continuous belt of earthquake activity around the edge of the Pacific Ocean that affects the geological stability of many countries on the Pacific rim, particularly New Zealand, the west coast of the United States, Chile, Peru, Japan and the Philippines.
New Zealand's level of earthquake activity is similar to that of California, but slightly lower than that of Japan. A shallow magnitude eight earthquake occurs in New Zealand about once a century, a shallow magnitude seven earthquake about once a decade, and a shallow magnitude six earthquake about once a year.
New Zealand has many earthquakes because it straddles the boundary between two of the earth's great tectonic plates – the Pacific plate in the east and the Indo-Australian plate in the west. These two plates are converging obliquely at about 30 millimetres a year in Fiordland, increasing to about 50 millimetres a year at East Cape.
The plates converge in different ways. In the North Island and the northern South Island, the Pacific plate sinks below the Indo-Australian plate. Earthquakes originating within the subducting Pacific plate are less than 60 kilometres deep along the eastern coast and become deeper westward. In Fiordland and the region to the south, the Indo-Australian plate subducts beneath the Pacific plate, so earthquake sources are shallow in the west and deeper in the east under Fiordland.
Between these two subduction zones, the crust of both plates is too buoyant to subduct, so convergence is accommodated by uplift, which has created the Southern Alps, and horizontal movement along the Alpine Fault. This has resulted in parts of Nelson and western Otago, adjacent five million years ago, now being 450 kilometres apart.
Shallow earthquakes are the most numerous and originate within the earth's crust, which has an average thickness of 35 kilometres in New Zealand. Crustal earthquakes are responsible for almost all damage to property and are widely scattered throughout New Zealand.
In the Taupo volcanic zone, from White Island to Ruapehu, swarms of small earthquakes of similar magnitude are common, and are associated with the area's active volcanism. Although the number of such shocks can be alarming, they rarely cause major damage.
An almost continuous belt of earthquake activity around the edges of the Pacific Ocean affects the geological stability of many countries, including New Zealand.
Earthquake risk. The worst disaster in New Zealand that can reasonably be expected within a generation is a 7.5 magnitude earthquake on the segment of the Wellington Fault within the city. It has a 12 percent probability of occurring within the next 30 years and would affect 200,000 residential properties, from Palmerston North to Nelson, as well as roads, bridges and dams, and services such as electricity, water and sewerage. GNS Science runs national and regional earthquake and volcano monitoring networks. A major upgrade of monitoring equipment began in 2001 with the Earthquake Commission providing core funding of $5 million a year over 10 years. Funding was increased in 2005 after a positive review of the success of the project. The project, known as GeoNet (www.geonet.org.nz), is being undertaken by GNS Science on a not-for-profit basis for the national good. GeoNet equipment at sites throughout New Zealand is linked to GNS Science data centres via satellite, cellular and radio networks, permitting more rapid and reliable determinations of the location and magnitude of all significant earthquakes and volcanic activity within the New Zealand region. GeoNet information is made available to civil defence and emergency management authorities and international earthquake centres, but also underpins current and emerging research on geological hazards. New Zealand scientists undertake a large body of research aimed at improving the understanding of, and ways to mitigate, seismic and volcanic risk in New Zealand. Mitigation measures include improved engineering design of buildings and infrastructure, better prepared communities and better regional planning.
The New Zealand region is characterised by both a high density of active volcanoes and a high frequency of eruptions. Volcanic activity in the New Zealand region occurs within the North Island and offshore to the north-east in the Kermadec Islands. In the past 150 years, volcanoes have killed more people than earthquakes, yet the scale and style of historically-recorded volcanic activity is dwarfed by events known to have occurred in the past 2,000 to 5,000 years.
Volcanism. New Zealand volcanism is confined to five areas in the North Island – the Bay of Islands, Whangarei, Auckland, a zone extending from White Island to Ruapehu, and Taranaki or Egmont. The area from White Island to Ruapehu is known as the Taupo Volcanic Zone and is by far the most frequently active. There are three major types of volcano in New Zealand:
Volcanic fields, such as Auckland, where each eruption builds a single small volcano (e.g. Mt Eden), which does not erupt again. The next eruption in the field occurs at a different place, the site of which cannot be predicted until the eruption is imminent.
Cone volcanoes, such as Taranaki or Egmont and Ruapehu, where a succession of small eruptions occurs from roughly the same point on the earth's surface. The products of successive eruptions accumulate close to the vent to form a large cone, which is the volcano itself. The site of future eruptions can generally be predicted.
Caldera volcanoes, such as Taupo and Rotorua. Eruptions at these volcanoes are occasionally so large that the ground surface collapses into the ‘hole’ left behind. For example, Lake Taupo infills a caldera formed in two episodes about 1,800 and 26,000 years ago.
The Taupo Volcanic Zone contains three frequently active cone volcanoes (Ruapehu, Tongariro/ Ngauruhoe and White Island) and two of the most productive caldera volcanoes (Taupo and Okataina) in the world.
Casualties. Deaths due directly or indirectly to volcanism (and associated hydrothermal explosions) represent the biggest single source of fatalities from natural disasters in New Zealand since 1846.
Table 1.05 lists deaths in volcanic areas of New Zealand since 1846. Economic loss due to volcanism, however, has been low compared with that from earthquakes or flooding.
The cost of the 1995 and 1996 eruptions of Ruapehu has been estimated at $130 million.
However, an assessment of the size and style of volcanic eruptions in the geologically recent past, coupled with consideration of the economic development of New Zealand, especially in the central North Island, shows that the record since 1846 represents only a fraction of the type and size of hazard posed by New Zealand volcanism.
Table 1.05. Deaths in volcanic areas since 1846
| Year | Location (eruption) | Cause/hazard | Fatalities |
|---|---|---|---|
| Source: GNS Science | |||
| 1846 | Waihi (Lake Taupo) | Debris avalanche/mudflow from thermal area | c60 |
| 1886 | Tarawera Rift | Large volcanic eruption | >108 |
| 1903 | Waimangu (Tarawera) | Hydrothermal explosion | 4 |
| 1910 | Waihi (Lake Taupo) | Debris avalanche/mudflow from thermal area | 1 |
| 1914 | White Island | Debris avalanche from crater wall | 11 |
| 1917 | Waimangu (Tarawera) | Hydrothermal explosion | 2 |
| 1953 | Tangiwai (Ruapehu) | Lahar and flood from crater lake | 151 |
| Total | >337 | ||
Surveillance. All the active volcanoes in New Zealand are monitored as part of the GeoNet project funded by the Earthquake Commission. This provides a near real-time understanding of volcanoes.
Volcanologists use three primary techniques to establish the status of an active volcano:
Monitoring of volcanic earthquakes. This is done using closely-spaced networks of seismometers, designed to detect movement of magma (molten rock) below the surface and allow assessment of the possible onset and timing of eruptive activity. There are five volcano-seismic networks in New Zealand (Auckland, Bay of Plenty-Rotorua, Taranaki, Tongariro and Taupo). The Auckland and Taranaki networks are operated by regional councils.
Monitoring of ground deformation. This is done using precise geodetic surveys. The concept is that if magma is moving upwards before an eruption it will cause the volcano to swell (i.e. the ground surface to rise) and this swelling can be detected. Most of this work is done using continuous GPS installations on the volcanoes. The lakes at Taupo and Tarawera are also used as giant spirit levels to detect height changes.
Monitoring of volcanic gases. Magma at depth in the earth contains gases (carbon dioxide, together with various compounds of sulphur, chlorine and fluorine) dissolved in it. As the magma rises to shallow levels before an eruption, these gases are released and come to the surface via fumaroles. The temperatures and the abundance of the gases and their relative proportions give information on the state of the magma and how close to the surface it is.
In a volcanic crisis, practical steps can be taken to mitigate risk and lessen the threat to life, but this requires accurate recognition of the onset of a crisis.
This recognition in turn depends on a knowledge of the ‘background’ or ‘normal’ levels of seismicity, ground movement and gas flux at the volcano, coupled with ‘real-time’ determination of any significant changes from this background.
The GeoNet active volcano surveillance programme helps define these background levels.
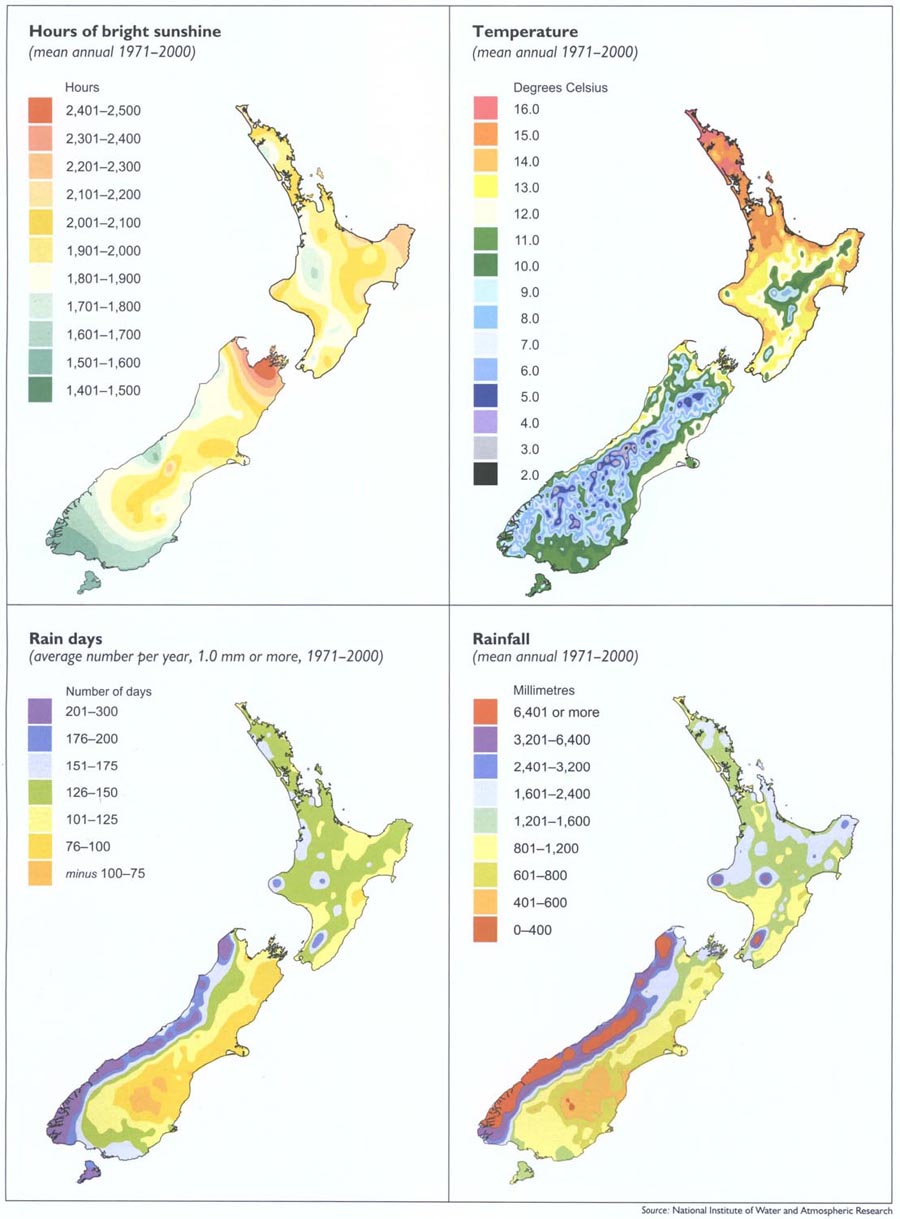
Summaries of New Zealand's climate extremes compiled by the National Institute of Water and Atmospheric Research (NIWA) contain detailed descriptions of the most extreme weather events recorded in the country.
Figure 1.01 shows mean annual sunshine, temperature, rain days and rainfall for various parts of New Zealand. The maps are prepared by NIWA and show mean annual figures struck over a 30-year period to create what are referred to as ‘climate norms.’
The next ‘normal’ period for calculating mean annual figures will be 1981 to 2010.
The climate of New Zealand is largely influenced by:
Its location in a latitude zone where the prevailing wind flow is westerly.
Its surrounding ocean environment.
Its mountains, especially the main mountain chain, which modify weather systems as they pass eastwards, and which also provide a sheltering effect on the leeward side.
Day-to-day weather is mostly determined by a series of anticyclones and troughs of low pressure in the westerlies. Consequently, New Zealand's weather is changeable, typically with short periods of settled or unsettled weather. At times, the westerly regime breaks down and there are cold, southerly outbreaks, with snow in winter and sometimes spring; or northerly intrusions of warm, moist air when tropical depressions move southwards into New Zealand latitudes in the summer. The main mountain chain is a major barrier to weather systems approaching from the west. Consequently, there is a marked contrast between the climates of regions west and east of the mountains. This contrast is much greater than north-south climatic differences. Surrounding oceans have a moderating effect on temperatures in most northern and western regions. However, inland and eastern areas can experience large temperature variations.
High temperatures usually occur in the east in warm, north-westerly wind conditions. These high temperatures are often followed by sudden falls in temperature, as cold fronts move up the east coast of both islands. Many parts of New Zealand are subject to extremes of wind, occasionally causing damage to buildings and forests, and rain as depressions with their fronts pass close to or over the country. The rugged terrain is an important factor in enhancement of wind strength and/or rainfall.
The Intergovernmental Panel on Climate Change (IPCC) concluded in 2001 that there was comprehensive evidence of climate change caused by human activities during the 20th century. The IPCC report predicted increases in global mean temperatures from 1990 to 2100 of between 1.4 and 5.8 degrees Celsius and global mean sea level increases of between 9 and 88 centimetres.
The report said changes could also be expected in some extreme weather and climate events, including higher maximum temperatures and more hot days, more heavy rainfall events, and, in some areas, an increase in peak wind intensities. What the warming climate will mean in detail for the South Pacific is still the subject of investigation by scientific researchers, with key emerging issues including changes in rainfall patterns and associated shifts in water resources and agricultural growing conditions. Following is a summary of knowledge gained in the past decade about the effect of climate change on New Zealand:
Projected climate changes – Temperatures in New Zealand are likely to increase faster in the North Island than in the South Island, but generally less than global average temperatures. Rainfall is projected to increase in the west of the country and to decrease in many eastern regions. In the long term, rising seas are expected to increase erosion of vulnerable beaches and breach coastal protection structures more often.
Agriculture – The agricultural sector could benefit from climate change, but also faces risks. The key benefit is likely to be from increased carbon dioxide concentrations, which could lead to greatly increased growth rates and water-use efficiency. In addition, warmer conditions and lengthened growing seasons could result in a long-term southward shift of climate-linked activities, and new crops and related industries could be introduced. The most significant risks include more droughts and floods in some areas, particularly in the east of New Zealand. Warmer temperatures could also make the growing of some current fruit crops in some northern areas uneconomical.
Native ecosystems – Climate change may add to pressures on ecosystems already under threat. Fragmented native forests of drier lowland environments in Northland, Waikato and Manawatu, and in the east from East Cape to Southland, are probably the most vulnerable to climate change.
Urban environment, transport and energy – The main threat to the urban environment comes from possible increases in heavy rainfall, which would put pressure on drainage and stormwater systems and increase the risk of flooding in some areas. Warmer conditions would substantially reduce home heating costs, leading to reduced electricity demand during the peak winter season, but possibly increased demand for air conditioning during summer. Wetter conditions on the West Coast could increase hydroelectricity production in winter.
Health – Higher temperatures are expected to reduce winter illnesses, but could lead to higher death rates during summer. A warmer climate could also allow the spread of mosquitoes capable of transmitting diseases such as Ross River virus and dengue fever. Recent research has also found that climate change could lead to a delay in the recovery of the ozone layer. This would increase the period during which New Zealanders are exposed to high levels of ultraviolet radiation, which is known to lead to skin cancers. However, the possible effects of greenhouse gases on the ozone layer are still highly uncertain.
Table 1.06 lists predicted temperature and rainfall changes.
Table 1.06. Predicted changes in annual mean temperature and precipitation
Between 1970–1999 and
2070–2099
| Region | Temperature | Precipitation |
|---|---|---|
| Source: National Institute of Water and Atmospheric Research | ||
| Northland, Auckland | +0.6° to +4.0°C | -16% to +7% |
| Western North Island from Waikato to Wellington | +0.3° to +3.8°C | -6% to +32% |
| Eastern North Island from Bay of Plenty to Wairarapa | +0.5° to +3.8°C | -32% to +4% |
| Nelson, Marlborough, Canterbury | +0.4° to +3.3°C | -21% to +5% |
| West Coast, Otago, Southland | +0.2° to +3.5°C | +1% to +57% |
Table 1.07 summarises New Zealand's climate extremes.
Table 1.07. Summary of New Zealand climate extremes
At 31 December 2005
| Rainfall | |||
|---|---|---|---|
| Period | Amount mm | Location | Date |
| Source: National Institute of Water and Atmospheric Research | |||
| Highest | |||
| 10 minutes | 34 | Tauranga | 17 April 1948 |
| 1 hour | 109 | Leigh | 30 May 2001 |
| 12 hours | 473 | Colliers Creek (Hokitika Catchment) | 22 January 1994 |
| 24 hours | 682 | Colliers Creek (Hokitika Catchment) | 21–22 January 1994 |
| 48 hours | 1,049 | Waterfall, Cropp River (Hokitika Catchment) | 12–13 December 1995 |
| 1 calendar month | 2,927 | Waterfall, Cropp River (Hokitika Catchment) | December 1995 |
| 1 calendar year | 16,617 | Waterfall, Cropp River (Hokitika Catchment) | January-December 1998 |
| 365 days | 18,442 | Waterfall, Cropp River (Hokitika Catchment) | 29 October 1997–29 October 1998 |
| Lowest: | |||
| 3 months | 9 | Cape Campbell | January-March 2001 |
| 6 months | 52 | Cape Campbell | Nov 2000–April 2001 |
| 12 months | 167 | Alexandra | Nov 1963–Oct 1964 |
| Longest rainless period: | |||
| 71 days | 0 | Wai-iti, Marlborough | From 8 Feb 1939 |
| Temperature | |||
|---|---|---|---|
| Location | Temperature (°C) | Date | |
| Highest air temperature | |||
| North Island | 39.2 | Ruatoria | 7 February 1973 |
| South Island | 42.4 | Rangiora | 7 February 1973 |
| Lowest air temperature | |||
| North Island | -13.6 | Chateau Tongariro | 7 July 1937 |
| South Island | -21.6 | Ophir | 3 July 1995 |
| Lowest grass minimum | -21.6 | LakeTekapo | 4 August 1938 |
| Sunshine | |||
|---|---|---|---|
| Location | Total (hours) | Date | |
| Highest in one year | |||
| North Island | 2,588 | Napier | 1994 |
| South Island | 2,711 | Nelson | 1931 |
| Highest in one month | |||
| North Island | 335 | Taupo | January 1950 |
| South Island | 336 | Nelson | December 1934 |
| Lowest in one year | |||
| North Island | 1,357 | Palmerston North | 1992 |
| South Island | 1,333 | Invercargill | 1983 |
| Lowest in one month | |||
| North Island | 27 | Taumarunui | June 2002 |
| South Island | 35 | Invercargill | June 1935 |
| Wind gusts | |||
|---|---|---|---|
| Location | Speed (km/h) | Date | |
| North Island | 248 | Hawkins Hill, Wellington | 6 November 1959 and 4 July 1962 |
| South Island | 250 | Mt John, Canterbury | 18 April 1970 |
New Zealand's climate in 2005 was marked by too little rain in some places and too much in others. Rainfall during the year was less than 75 percent of normal over much of the South Island, whereas severe flooding in the Bay of Plenty in May caused widespread damage.
The national average temperature of 13.1 degrees Celsius made 2005 the fourth warmest year nationally since reliable records began in the 1860s.
Notable climate features in various parts of the country included heat waves, low soil moisture, a tornado in Greymouth, unseasonable snowstorms and damaging hailstorms.
Anticyclones and northeasterlies brought one of the warmest Februaries on record, with maximum temperatures of 30 degrees Celsius or more in many locations throughout New Zealand and temperatures of 35 degrees Celsius or more in sheltered inland areas of the South Island.
Disastrous floods hit the Bay of Plenty in May, causing widespread damage in parts of Tauranga, with a state of emergency declared from there south to Matata. Hundreds of people were evacuated, with several homes destroyed by mudslides and floodwaters.
The winter of 2005 was the sixth warmest on record, with extremely dry conditions in the east of the South Island.
Overall, the National Institute of Water and Atmospheric Research reported at least 26 heavy rainfall events during 2005, half of which produced floods. There were seven damaging hailstorms and 12 damaging tornadoes. The Greymouth tornado of 10 March left 30 people homeless and caused damage of at least $10 million.
Wellington's airport was closed by fog for more hours in 2005 than in any other year, with 52 hours of fog recorded there.
The islands of New Zealand separated from their nearest neighbours more than 80 million years ago. They stretch across 24 degrees of latitude from the subtropical to the subantarctic, making New Zealand a slender archipelago with an extraordinary natural heritage born from its biological and geological isolation.
Some of the original inhabitants endured times of turbulent change and violent upheaval, evolving and adapting to become part of a unique natural biota (or region). Other species died out (either nationally or regionally), unable to compete or survive environmental disturbances such as ice ages. For example, coconut palms were once found in New Zealand, and kauri, now confined to the north of the North Island, used to grow as far south as Canterbury.
Over the years, the earliest inhabitants were joined by other plants and animals carried across the oceans by wind and current.
The pre-human environment was notable for the absence of snakes, land mammals (apart from three species of bat) and many of the flowering plant families. Whole orders and families were found only in New Zealand, including tuatara, moa and kiwi, all of the native lizards, and nearly 200 species of native earthworms.
Many remarkable plants, insects and birds evolved to fill ecological niches normally occupied by mammals. Others diversified to fill new territories created by sea-level fluctuations and land uplift.
With no mammalian predators on the ground, but avian predators everywhere, flightlessness was not a handicap, nor was size. Moa (11 species, some up to 3 metres tall) became extinct in pre-European times, but many other large flightless birds still remain, including kiwi, the nocturnal kākāpō (the only flightless parrot in the world) and weka (of the rail family).
Flightless insects are numerous, including many large beetles and 70 or so species of the cricket-like weta, found only in New Zealand.
New Zealand, with 84 species, has the most diverse seabird fauna of any country. Nearly half of all native bird species depend on the ocean for food, the feeding zones of some extending as far south as the Antarctic continent. New Zealand's extensive coastline and many islands offer a huge range of habitat, from estuary and mud-flat, to rocky cliffs and boulder bank.
The ocean is marvellously rich. There are about 400 different fish in the waters around New Zealand, as well as various species of seals, dolphins and porpoises. Twenty-nine species of whale have been recorded, and three of the largest (sperm, humpback and right) regularly migrate to New Zealand waters in spring and autumn.
The most widespread and complex type of forest in New Zealand is a podocarp (conifer) broadleaf association. It is generally found at lower altitudes and is characterised by a variety of species, a stratified canopy and an abundance of vines and epiphytic plants.
Beech and kauri forests, by contrast, are much simpler in structure. New Zealand's beech species have close relatives in Australia and South America and the five different types of species in New Zealand have exploited habitats from valley floor to mountain tops. Kauri, true forest giants, dominate only in the warmer climes to the north.
Some of the most specialised plants are those occupying the alpine zone. A remarkable 25 percent of all New Zealand's plants can be found above the treeline. Ninety-three percent of all alpine plants are found only in New Zealand, compared with 80 percent for the rest of the higher plant species. Snow tussock herbfields are one of the most distinctive elements in this cold, windswept environment. Remarkably long-lived, some larger specimens may be several centuries old. Like beech trees, they seed infrequently, but in profusion.
A definitive feature of New Zealand's land-based plants and animals is their degree of specialisation and narrow habitat requirements (e.g. takahē/tussock grasslands; blue duck/fast flowing rivers and streams) and their evolution in the absence of mammalian predators (birds) or browsers (plants). This specialisation, and adaptations which make New Zealand's wildlife so unique, render them extremely vulnerable to introduced predators, such as rats and cats; competitors, such as deer and possums; and loss of habitat.
The arrival of people in New Zealand heralded times of rapid change.
Introduction (intentionally or accidentally) of exotic plants and animals, and modification of habitat, radically affected native species populations.
In the pre-1800 period, following the arrival and expansion of Māori, forest cover was reduced and 34 species became extinct, including moa, the adzebill and the flightless goose.
In the much shorter post-1800 period of European settlement, the forest area was further reduced to around 25 percent of the land, nine more bird species became extinct and many more were threatened.
Since 1840, more than 80 new species of mammals, birds and fish, and more than 1,800 plant species have been introduced, in many places totally changing the landscape and ecology.
One uniform time is kept throughout mainland New Zealand. This time is 12 hours ahead of Coordinated Universal Time (UTC) and is called New Zealand Standard Time (NZST). It is an atomic standard maintained by the Measurement Standards Laboratory, part of Industrial Research Ltd, Lower Hutt.
One hour of daylight saving, called New Zealand Daylight Time (NZDT), which is 13 hours ahead of UTC, is observed from 2am (NZST) on the first Sunday in October, until 2am (NZST) on the third Sunday in March.
Time kept in the Chatham Islands is 45 minutes ahead of that kept in New Zealand.
1.1 Land Information New Zealand; National Institute of Water and Atmospheric Research.
1.2 GNS Science.
1.3 National Institute of Water and Atmospheric Research.
1.4 Department of Conservation.
1.5 Industrial Research Ltd.
Table of Contents
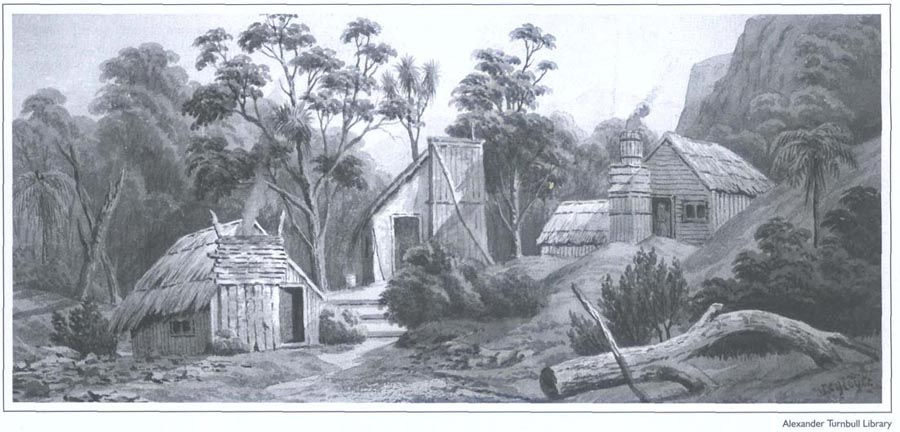
Miners’ slab huts in a bush clearing in the Coromandel district between 1864 and 1867. From a watercolour by John Barr Clark Hoyte (1835–1913).
New Zealand has a shorter human history than any other country. The precise date of settlement is a matter of debate, but current understanding is that the first arrivals came from East Polynesia in the 13th century. It was not until 1642 that Europeans became aware the country existed.
The original Polynesian settlers discovered the country on deliberate voyages of exploration, navigating by ocean currents, winds and stars. The navigator credited in some traditions with discovering New Zealand is Kupe. Some time later, the first small groups arrived from Polynesia. Now known as Māori, these tribes did not identify themselves by a collective name until the arrival of Europeans when, to mark their distinction, the name Māori, meaning ‘ordinary’, came into use.
The early settlers lived in small hunting bands. Seals and the large flightless moa bird were their main prey, until moa were hunted to extinction.
In the South Island, hunting and gathering remained the main mode of survival, but the kūmara (sweet potato) and yams the Polynesians brought with them grew well in the warmer North Island. Extensive kūmara gardens supported relatively large settlements. But even in the north, birds, fish and shellfish were important in the Māori diet. In some northern areas, larger populations put pressure on resources. The Polynesian dog and rat came with the early arrivals, but the domestic pigs and chickens of the islands did not, for reasons not fully understood.
In favourable conditions, Māori lived reasonably well. Their life expectancy was low by modern standards, but probably comparable with that of Europeans in the same era. The Māori population before European contact may have reached 100,000.
Māori passed on rich and detailed history and legends orally. Society was organised around groups that traced their descent from common ancestors. Reciting whakapapa (genealogies) was an important way to communicate knowledge.
The concepts of mana (status) and utu (reciprocity) were central to the culture, and led to widespread warfare. But the violence was usually episodic. For most of the time, Māori lived not in fortified pā, but in unprotected settlements or seasonal camps.
The greatest achievements of Māori material culture were carving wood for important buildings and canoes, and fashioning stone into tools and ornaments. Warfare did not inhibit regular trade in desirable stones and foods, and was itself a means by which resources were appropriated.
In 1642, Dutch explorer Abel Tasman made the first confirmed European discovery of New Zealand. He charted the country's west coast from about Hokitika up to Cape Maria van Diemen. Subsequently, a Dutch map maker gave the name Nieuw Zeeland to the land Tasman had discovered. A surprisingly long time – 127 years – passed before another European reached New Zealand.
James Cook first visited New Zealand in 1769, on the first of three voyages. He circumnavigated and mapped both main islands and returned to Britain with reports about the country's inhabitants and resources.
For 50 years after Sydney was founded in 1788, New Zealand was an economic and cultural outpost of New South Wales, and most of the earliest European settlers came from Sydney. In the late 18th century, sealers and whalers began visiting, and by the early 19th century some began to settle, some to farm. During these years, New Zealand was part of a Pacific-wide trade system and New Zealand goods were sold in China.
The first European ‘town’ grew at Kororāreka when whalers began calling into the Day of Islands for food and water. From the 1790s, Māori produced pork and potatoes for this trade. The other main area of early interaction between Māori and others was the Foveaux Strait sealing grounds.
The presence of traders drew Māori to particular locations. Having a European living among them gave some tribal groups an advantage in the race to acquire European goods, especially firearms.
A Sydney chaplain, Samuel Marsden, founded the first Christian mission station in the Bay of Islands in 1814. By 1840, more than 20 stations had been established. From missionaries, Māori learnt not just about Christianity, but also about European farming techniques and trades, and how to read and write. The missionaries also transcribed the Māori language into written form. In the 1830s, French missionaries brought Catholicism to Māori.
Christianity would become important for Māori, but they were slow to convert. Muskets, traded for flax and potatoes, had a greater impact in the 1820s and 1830s than religion, and escalated killings in tribal conflicts. The Ngā Puhi tribe, led by Hongi Hika, devastated southerly tribes, and Ngāti Toa, under Te Rauparaha, attacked Ngai Tahu in the South Island. But diseases introduced by Europeans caused more fatalities than firearms.
In the 1830s, the British Government came under increasing pressure to curb lawlessness in New Zealand to protect British traders, and to forestall the French, who also had imperial ambitions. The missionaries, for their part, wanted to protect Māori from the effects of European settlement.
In 1833, James Busby was sent to the Bay of Islands as British Resident. At Busby's instigation, northern chiefs adopted a flag in 1834 and signed a declaration of independence in 1835. Seven years after Busby's arrival, at Waitangi on 6 February 1840, William Hobson, New Zealand's first governor, invited assembled Māori chiefs to sign a treaty with the British Crown. The treaty was taken all round the country, as far south as Foveaux Strait, for signing by local chiefs, and eventually more than 500 signed.
Under the treaty, Māori ceded powers of government to Britain in return for the rights of British subjects and guaranteed possession of their lands and other ‘treasures’. In later years, differences of interpretation between the English and Māori texts complicated efforts to redress breaches of the treaty.
British sovereignty was proclaimed over New Zealand on the basis of Māori consent, though the South Island was initially claimed on the basis of discovery.
In the 19th century, the British and the French were rivals in the Pacific. The French had only minor interests in New Zealand, but the myth persists that the South Island escaped being French only because in the scramble to colonise Akaroa the British got there first. But by the time the French settlers and their naval escort reached New Zealand, the whole country was securely British. Governor Hobson, learning the French were heading for Akaroa, did send Captain Stanley of the Britomart to demonstrate British sovereignty there. However, there was never any chance Cook Strait would become, like the English Channel, a passage between English and French-speaking regions.
Even before the Treaty of Waitangi had been signed, the New Zealand Company, inspired by the colonial promoter Edward Gibbon Wakefield, had despatched British settlers to Wellington. In the next two years, the company also founded Wanganui, Nelson and New Plymouth. Otago was founded in 1848 and Canterbury in 1850, both by New Zealand Company affiliates. Auckland, capital of the new Crown colony, grew independently.
By the 1850s, most of the interior of the North Island had been explored by Europeans. Māori guides usually showed European explorers the way and New Zealand's first Anglican bishop, George Selwyn, travelled widely. Much of the mountainous interior of the South Island was not explored until gold miners arrived in the 1860s.
When British settlers sought self-government, the British parliament passed the New Zealand Constitution Act of 1852, setting up a central government with an elected House of Representatives and six provincial governments. The settlers soon won the right to responsible government (with an executive supported by a majority in the elected assembly). But the governor, and through him the Colonial Office in London, retained control of ‘native’ policy.
In the 1840s, there were clashes between Māori and Pākehā. In Marlborough's Wairau Valley in 1843, a dispute over land erupted, leading to bloodshed. The war in the north (1845–46) began when Hōne Heke cut down the flagpole flying the British flag at Russell. There were also troubles in the 1840s over land in Wellington and Wanganui. In the 1850s, disputes between Māori over the sale of land to Europeans kept Taranaki in ferment.
Until the late 1850s, the government managed to purchase enough land to meet settler demands. But many Māori became increasingly reluctant to sell their land, which tribes owned collectively. The Māori King movement, under the leadership of Wiremu Tāmihana, grew in part out of Māori resistance to land sales. Pōtatau Te Wherowhero was elected the first Māori King in 1858.
The flashpoint was Taranaki. The refusal of Wiremu Kīngi Te Rangitāke to sell land at Waitara led to war in 1860. The efforts of Māori to retain their land were depicted by the settlers as a challenge to British sovereignty.
Māori resistance was effectively crushed after Governor George Grey took war to the Waikato in 1863–64.
Two chiefs, Te Kooti and Titokowaru, prolonged war through the 1860s, but by 1872 the wars over land had ended. Large areas of land were confiscated from ‘rebellious’ tribes. A Native Land Court gave land titles to individual Māori, to facilitate sales to Pākehā.
After the wars, many Māori drew back from contact with European settlers. Most lived in isolated rural communities. Māori land continued to pass into Pākehā hands, usually by sale through the Native Land Court. In the 1870s, the village of Parihaka became the centre of a peaceful protest, led by the prophet Te Whitio-Rongomai, against occupation of confiscated land in Taranaki. In 1881, government forces invaded Parihaka in an attempt to crush this resistance.
While progress in the North Island was held back by war, the South Island forged ahead on the proceeds of wool and gold. Sheep were turned loose on South Island grasslands and after gold had been discovered in Otago in 1861, and then on the West Coast, settlers flooded in. Six years later, the discovery of gold at Thames boosted the town of Auckland. Wool ensured that Canterbury became the wealthiest province, and gold made Dunedin the largest town.
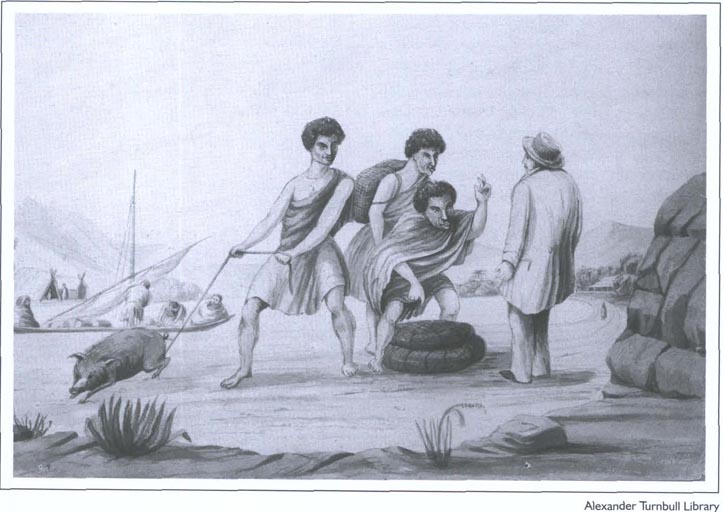
Māori with baskets of potatoes and a pig bargain with a European trader around 1845. From a drawing by John Williams.
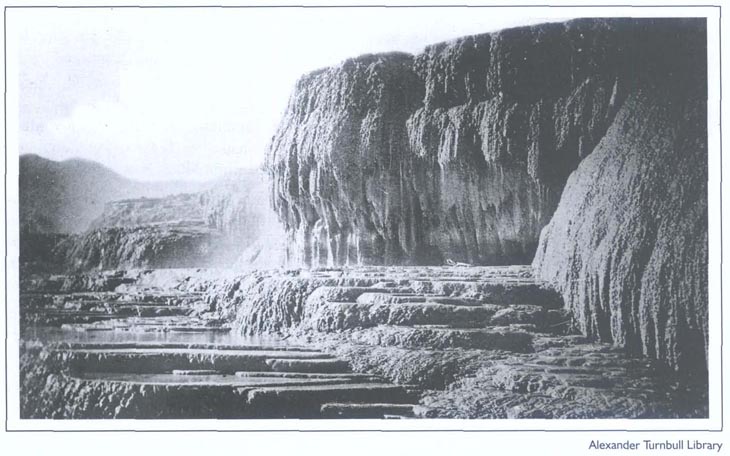
The Giant Buttress, part of the pink and white terraces at Lake Rotomahana destroyed in the Mt Tarawera eruption of 1886.
Towards the end of the 1860s, gold production fell and wool prices slipped. A new boost to growth came in 1870 when Colonial Treasurer Julius Vogel proposed a loans-funded programme of public works, including the building of railways, and assisted immigration.
The population increased dramatically. The census (non-Māori) of 1871 recorded a total of about 250,000; 10 years later this had grown to half a million. Vogel's policies, like those of Wakefield before him, were based on a belief that New Zealand would grow only if people and capital could be attracted. This stimulated a sense of a single nation rather than separate settlements, and led to the abolition of the provinces in 1876.
The aftermath of Vogel's borrowing was an economic depression that lasted into the 1890s. Despite a brief boom in wheat, prices for farm products sagged and the market for land became depressed. Hard times led to urban unemployment and sweated labour in industry. The country lost people through emigration, mostly to Australia.
Scarcely had depression gripped the country than future prosperity was anticipated with the first successful shipment of frozen meat to England in 1882. Exporting meat (frozen) and butter and cheese (chilled) became possible. After dealing with initial setbacks in refrigerated shipping, New Zealand became a British farm. With an economy based on agriculture, the landscape was transformed from forest to farmland.
The watershed election of 1890 put the Liberals, New Zealand's first ‘modern’ political party, into power. From 1893 to 1906, the government was headed by ‘King Dick’ Seddon. The Liberals cemented in place New Zealand's ‘family farm’ economy by subdividing large estates, buying Māori land in the North Island, and offering advances to settlers. Buoyant markets for New Zealand's farm products ensured the success of these policies. The Minister of Lands, John McKenzie, championed the family farm. Farming progressed, especially in the north, and by 1901, more than half the European population was living north of Cook Strait for the first time since the 1850s.
The Liberal government reinforced an established pattern of state involvement in the economy and regulation of society. Its old-age pensions and workers’ dwellings anticipated the welfare state. In 1893, after campaigns led by women like Kate Sheppard, New Zealand became the first country in the world to give women the vote.
New Zealand's close economic ties with Britain reinforced the loyalty of New Zealanders to an empire that secured their place in the world. The loyalty found expression in the despatch of troops to fight for Britain in South Africa in 1899. A self-confident nationalism was also evident, and New Zealand declined to join the Australian Federation of 1901.
Liberal rule ended in 1912, when William Massey led the Reform Party to power, promising state leaseholders they could freehold their land.
When World War I broke out, New Zealand rallied to England's aid. Thousands of New Zealanders served, and died, overseas. The 1915 landing at Gallipoli in Turkey was a coming of age for the country and established the potent tradition of ANZAC (Australian and New Zealand Army Corps) – a pride in New Zealand's military achievement and its special relationship with Australia. New Zealand troops also fought and died on the Western Front.
After some prosperous years in the later 1920s, the worldwide Great Depression hit New Zealand hard. Export prices collapsed. Farmers faced difficulties over their mortgages and urban unemployment soared. Discontent erupted in riots. A coalition government, dominated by Gordon Coates, failed to lift the country out of depression.
Organised labour flexed its muscle in the 1890 maritime strike and in the Waihī and watersider strikes of 1912–13. Setbacks on the industrial front turned the labour movement towards political action. The Labour Party, founded in 1916, made uneven gains through the 1920s, then was swept into power under Michael Joseph Savage in 1935 by an electorate disillusioned with how the conservative coalition government had handled the depression. When Savage died in 1940, Peter Fraser became prime minister.
In power, the Labour Party, aided by an economic recovery already underway when it was elected, revived the economy further by pragmatic rather than doctrinaire socialist policies. The Reserve Bank of New Zealand was taken over by the state in 1936, spending on public works increased and a state housing programme began. The Social Security Act 1938 dramatically extended the welfare state.
With the outbreak of World War II, New Zealand troops again fought overseas in support of the United Kingdom. The fall of Singapore shook New Zealanders’ confidence that Britain could guarantee the country's security. During the war in the Pacific, the United States protected New Zealand against Japan.
Labour remained in power through World War II and in 1945, Peter Fraser played a significant role in the conference that set up the United Nations. But the party had lost the reforming zeal of the previous decade and its electoral support ebbed after the war.
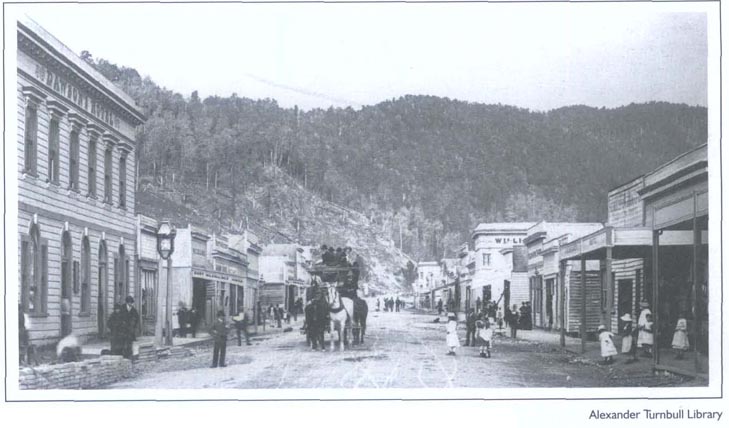
Coach and business premises on Broadway, Reefton, in the 1880s.
In the early 1950s, New Zealand troops fought in Korea. Later, in the 1960s, concern to keep on side with this new protector prompted the National government of Keith Holyoake to send troops to Vietnam, despite popular protests.
After Labour lost power in 1949, the conservative National Party ruled the country until 1984, interrupted by two single-term Labour governments, in 1957–60 and 1972–75. National Party Prime Minister Sidney Holland used the bitter 1951 waterfront strike to consolidate his power by calling a snap election.
New immigrants, still mainly British, flooded in while New Zealand remained prosperous by exporting farm products to Britain. The country's culture remained based on Britain's. In 1953 New Zealanders took pride that a countryman, Edmund Hillary, gave Queen Elizabeth II a coronation gift by reaching the summit of Mt Everest.
Britain joined the European Economic Community in 1973. New Zealand had already diversified its export trade, but the loss of an assured market for farm products was a blow.
The first oil shock of 1973 contributed to the fall of the Labour government in 1975, led until his death by Norman Kirk. After the second oil shock of 1978, the National government of Robert Muldoon tried to keep New Zealand prosperous by so-called ‘think big’ industrial and energy projects, and farm subsidies. The economy faltered as the fall of oil prices in the early 1980s made these schemes unsound. Inflation and unemployment mounted.
The fourth Labour government was elected in 1984. The Minister of Finance, Roger Douglas, was an ardent advocate of economic liberalisation. He removed most controls over the economy, privatised many state enterprises and called aspects of the welfare state into question. Many saw these measures as an assault on New Zealand's egalitarian traditions.
In foreign affairs, Labour's anti-nuclear policy ruptured relations with the United States.
The National government of 1990–99 pursued similar policies to Labour's, passing the controversial Employment Contracts Act which opened up the labour market and diminished the power of trade unions. The government also mounted a more sustained attack on the welfare state, most obviously by cutting benefits.
After the 1996 introduction of a new voting system (mixed member proportional representation), minority or coalition governments became the norm, but National and Labour remained the major parties.
Most Māori continued to live in remote rural communities until World War II. But Māori society was dynamic. The Kotahitanga movement of the late 19th and early 20th centuries was evidence of Māori resilience. So were the land development work of āpirana Ngata and the revitalisation of the Māori King movement by Te Puea Hērangi. In the early 1920s, Wiremu Rātana founded the Rātana Church.
Post-World War II Māori migration into the cities, together with Māori anger at their economic deprivation and concern about their mana and continuing loss of land, pushed race relations and the place of the Treaty of Waitangi into the forefront of national life.
For many, sporting contacts with apartheid South Africa became a touchstone of race relations. During the 1981 Springbok rugby tour, New Zealand experienced divisive unrest. After the tour, attention turned to domestic race relations and to the need for New Zealanders to have a better understanding of the Treaty of Waitangi.
Māori became more assertive. Some, alleging breaches of the Treaty of Waitangi, wished to reclaim Māori sovereignty. The Waitangi Tribunal was set up in 1975 to consider their claims and to address grievances. In 1985, the tribunal was empowered to look at breaches of the treaty since 1840, rather than since 1975.
A Māori cultural renaissance, including efforts to foster the Māori language in the early 1980s, increased awareness that New Zealand society was bicultural. At the same time, more immigrants were arriving.
Almost before it had been properly acknowledged that New Zealand was bicultural, it became multicultural – first in the composition of its population, more slowly in how it ran its national life. The country's new Pacific Island and Asian citizens were testament to the fact that it was no longer, culturally or economically, the offshore island of Europe it had seemed to earlier generations.
John Wilson, Te Ara – The Encyclopedia of New Zealand
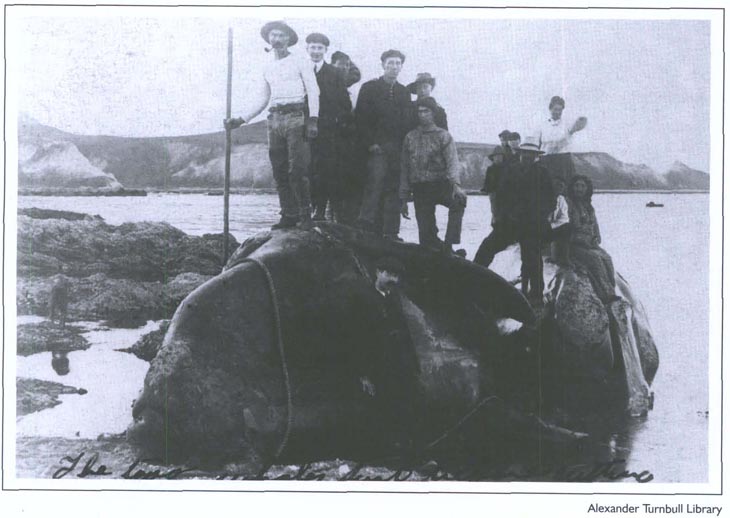
Two whales brought ashore at Kaikoura around 1910.
| c1300 | Archaeological evidence indicates Polynesian settlement of New Zealand established by this date. |
| 1642 | Dutch explorer Abel Janszoon Tasman discovers a land he calls Staten Landt, later named Nieuw Zeeland. |
| 1769 | British explorer James Cook makes first of three visits to New Zealand, taking possession of the country in the name of King George III. |
| 1790s | Sealing, deep-sea whaling, flax and timber trading begins, with some small temporary settlements. First severe introduced epidemic among Māori population. |
| 1791 | First visit by a whaling vessel, the William and Ann, to Doubtless Bay. |
| 1806 | First Pākehā women arrive in New Zealand. |
| 1814 | British missionary Samuel Marsden makes first visit to New Zealand. Anglican mission station established. Sheep, cattle, horses and poultry introduced. |
| 1815 | First Pākehā child, Thomas Holloway King, born in New Zealand. |
| 1819 | Raids on Taranaki and Te Whanganuia-Tara regions by Ngā Puhi and Ngāti Toa people led by chiefs Patuone, Nene, Moetara, Tuwhare and Te Rauparaha. |
| 1820 | Ngā Puhi chief Hongi Hika visits England, meets King George IV and secures supply of muskets. |
| 1821 | Musket wars begin with raids by Hongi Hika and Te Morenga on southern iwi and continue throughout the decade. |
| 1822 | Ngāti Toa migration south to Cook Strait region, led by Te Rauparaha, begins. |
| 1823 | Wesleyan Missionary Society mission established. First Church of England marriage between Pākehā and Māori – Phillip Tapsell and Maria Ringa. |
| 1824 | Te Heke Niho-Puta migration of Taranaki iwi to the Kapiti Coast. Rawiri Taiwhanga in Bay of Islands sells dairy produce and other food supplies to visiting ships. |
| 1827 | Te Rauparaha's invasion of the South Island from Kapiti begins. |
| 1831 | Whaling stations established at Tory Channel and Preservation Inlet. |
| 1833 | James Busby arrives in the Bay of Islands to take up appointment as British Resident in New Zealand. |
| 1834 | United Tribes’ flag adopted by some 25 northern chiefs at Busby's suggestion. |
| 1835 | Declaration of Independence by the ‘United Tribes of New Zealand’ signed by 34 northern chiefs. |
| 1837 | New Zealand Association formed in London, becoming the New Zealand Colonisation Society in 1838 and the New Zealand Company in 1839, under the inspiration of Edward Gibbon Wakefield. William Colenso completes printing the New Testament in Māori, the first book printed in New Zealand. |
| 1838 | Bishop Pompallier founds Roman Catholic mission at Hokianga. |
| 1839 | William Hobson instructed to establish British rule in New Zealand, as a dependency of New South Wales. Colonel William Wakefield, of the New Zealand Company, arrives on the Tory to purchase land for settlement. |
| 1840 | Treaty of Waitangi signed at Bay of Islands and later over most of the country. British sovereignty proclaimed. Hobson becomes first governor and sets up executive and legislative councils. New Zealand Company settlers arrive at Port Nicholson, Wellington. French settlers land at Akaroa. Local Māori initially provide food for these and later settlements. |
| 1841 | European settlements established at New Plymouth and Wanganui. Capital shifted from Russell to Auckland. |
| 1842 | Main body of settlers arrive at Nelson. |
| 1843 | Twenty-two European settlers and four Māori killed at a confrontation at Tua Marina, near Wairau, in Marlborough. Robert FitzRoy becomes governor. |
| 1844 | New Zealand Company suspends colonising operations due to financial difficulties. |
| 1845 | Hōne Heke begins war in the north. George Grey becomes governor. Half of all adult Māori are at least partly literate. |
| 1846 | War in the north ends with capture of Ruapekapeka. Fighting between Māori and Pākehā around Wellington. Te Rauparaha captured by Grey. First New Zealand Constitution Act passed. Heaphy, Fox and Brunner begin exploring the West Coast, First steam vessel, HMS Driver, arrives in New Zealand. |
| 1848 | Settlement founded by Scottish Otago Association. Provinces of New Ulster and New Munster established. Coal discovered at Brunner on the West Coast. Earthquake centred in Marlborough damages most Wellington buildings. |
| 1850 | Canterbury settlement founded. |
| 1852 | Second New Zealand Constitution Act passed creating general assembly and six provinces with representative government. |
| 1853 | Idea of a Māori King canvassed by Tamihana Te Rauparaha and Matene Te Whiwhi. Many Māori agree not to sell any more land – 32 million acres have been bought by the government in the past five years. |
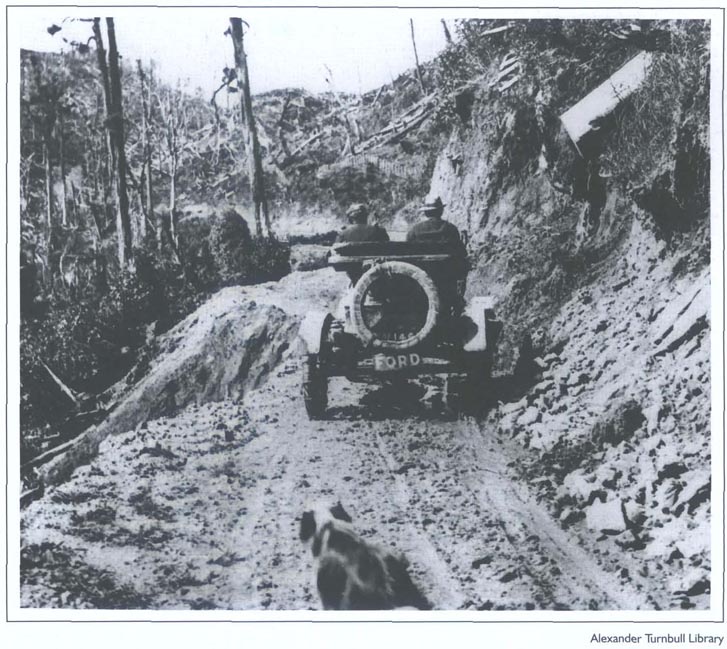 A Ford car on a King Country road during the first motor trip from Wellington to Auckland in 1912. | |
| 1854 | First session of general assembly opens in Auckland. |
| 1855 | Governor Thomas Gore Browne, appointed in 1854, arrives. Severe earthquake on both sides of Cook Strait. |
| 1856 | Henry Sewell forms first ministry under responsible government and becomes first premier. Edward Stafford forms first stable ministry. |
| 1858 | New Provinces Act passed. Te Wherowhero installed as first Māori King, taking name Potatau I. |
| 1859 | First session of new Hawke's Bay and Marlborough provincial councils. Gold discovered in Buller River. |
| 1860 | Waitara dispute develops into general warfare in Taranaki. Te Wherowhero dies and is replaced as Māori King by his son, Tawhiao. Kohimaramara Conference of Chiefs. |
| 1861 | Grey begins second governorship. Gold discovered at Gabriel's Gully and Otago goldrushes begin. First session of Southland provincial council. Bank of New Zealand incorporated at Auckland. |
| 1862 | First electric telegraph line opens – from Christchurch to Lyttelton. First gold shipment from Dunedin to London. |
| 1863 | War resumes in Taranaki and begins in Waikato when General Cameron crosses the Mangatawhiri Stream. New Zealand Settlements Act passed to effect land confiscation. First steam railway in New Zealand opened. |
| 1864 | War in the Waikato ends after battle of Orakau. Māori defeat British at Gate Pa, Tauranga. Land in Waikato, Taranaki, Bay of Plenty and Hawke's Bay confiscated. Gold discovered in Marlborough and Westland. Arthur, George and Edward Dobson are the first Pākehā to cross what becomes known as Arthur's Pass. |
| 1865 | Seat of government transferred from Auckland to Wellington. Native Land Court established. Māori resistance continues. Auckland streets lit by gas for first time. |
| 1866 | Cook Strait submarine telegraph cable laid. Cobb and Co coaches start running from Canterbury to the West Coast. |
| 1867 | Thames goldfield opens. Four Māori seats established in parliament. Lyttelton railway tunnel completed. Armed constabulary established. |
| 1868 | Māori resistance continues through campaigns of Te Kooti Arikirangi and Titokowaru. New Zealand's first sheep breed, the Corriedale, developed. |
| 1869 | New Zealand's first university, the University of Otago, established. |
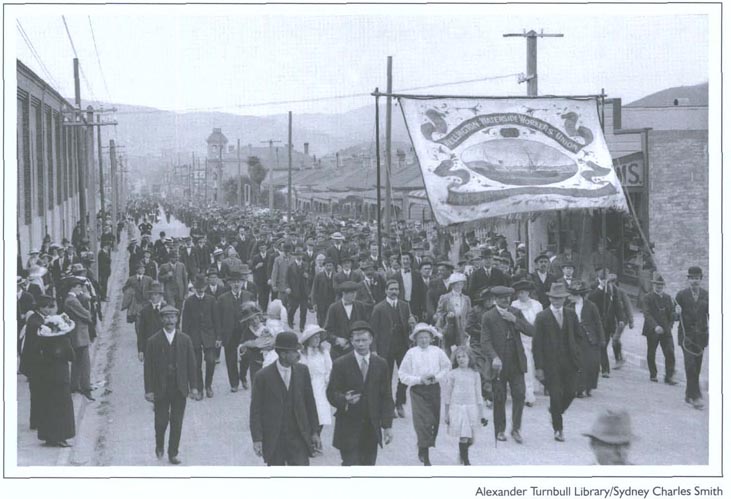 Striking workers and their supporters march through Newtown, Wellington, during a 1913 waterfront dispute. | |
| 1870 | Last imperial forces leave New Zealand. Vogel's public works and immigration policy begins. New Zealand University Act passed, establishing a federal system which lasts until 1961. Vogel announces national railway construction programme; more than 1,000 miles constructed by 1879. First rugby match in New Zealand played at Nelson. Auckland to San Francisco mail service begins. |
| 1871 | Deer released in Otago. |
| 1872 | Te Kooti retreats to the King Country and Māori armed resistance ceases. Telegraph communication links Auckland, Wellington and southern provinces. |
| 1873 | New Zealand Shipping Company established. |
| 1876 | Abolition of the provinces and establishment of local government by counties and boroughs. New Zealand–Australia telegraph cable established. |
| 1877 | Education Act passed, establishing national system of primary education. |
| 1878 | Completion of Christchurch–Invercargill railway. |
| 1879 | Triennial Parliaments Act passed. Vote is given to every male aged 21 and over. Kaitangata mine explosion, 34 people die. Annual property tax introduced. |
| 1881 | Parihaka community forcibly broken up by troops. Te Whiti, Tohu Kakahi and followers arrested and imprisoned. Wreck of SS Tararua, 131 people die. Auckland and Christchurch telephone exchanges open. |
| 1882 | First shipment of frozen meat leaves Port Chalmers for England on the Dunedin. |
| 1883 | Te Kooti pardoned; Te Whiti and other prisoners released. Direct steamer link established between New Zealand and Britain. |
| 1884 | King Tawhiao visits England with petition to the Queen and is refused access. First overseas tour by a New Zealand rugby team, to New South Wales. Construction of King Country section of North Island main trunk railway begins. |
| 1886 | Mt Tarawera erupts and Pink and White Terraces destroyed, 108 people die. Oil discovered in Taranaki. |
| 1887 | New Zealand's first national park, Tongariro, is presented to the nation by Te Heuheu Tukino IV. Reefton becomes first town to have electricity. First inland parcel post service. |
| 1888 | Birth of writer Katherine Mansfield. |
| 1889 | Abolition of non-residential or property qualification to vote. First New Zealand-built locomotive completed at Addington. |
| 1890 | Maritime strike involves 8,000 unionists. ‘Sweating’ Commission reports on employment conditions. First election on a one-man one-vote basis. |
| 1891 | John McKenzie introduces the first of a series of measures to promote closer land settlement. John Ballance becomes premier of first Liberal government. |
| 1892 | First meeting of national Kotahitanga Māori parliament. The Kingitanga sets up its own Kauhanganui parliament. |
| 1893 | Franchise extended to women. John Ballance dies and is succeeded by Richard John Seddon. Liquor licensing poll introduced. Elizabeth Yates becomes New Zealand's first woman mayor, of Onehunga. Banknotes become legal tender. |
| 1894 | Compulsory arbitration of industrial disputes and reform of employment laws. Advances to Settlers Act. Clark, Fyfe and Graham become the first people to climb Mt Cook. |
| 1896 | Brunner mine explosion, 67 people die. Census measures national population as 743,214. |
| 1897 | First of series of colonial, and later imperial, conferences in London. |
| 1898 | Old Age Pensions Act passed. First cars imported to New Zealand. |
| 1899 | New Zealand army contingent sent to South African war. First celebration of Labour Day. |
| 1900 | Māori Councils Act passed. Public Health Act passed setting up Department of Public Health in 1901. |
| 1901 | Cook and other Pacific islands annexed. Penny postage first used. |
| 1902 | Pacific cable begins operating between New Zealand, Australia and Fiji. |
| 1903 | Richard Pearse achieves semi-controlled flight near Timaru. |
| 1905 | The ‘Originals’ rugby team tours Britain and becomes known as the All Blacks. |
| 1906 | Seddon dies and is succeeded by William Hall-Jones as prime minister. |
| 1907 | New Zealand constituted as a dominion. Fire destroys parliament buildings. |
| 1908 | Auckland to Wellington main trunk railway line opens. Ernest Rutherford awarded Nobel Prize in Chemistry. New Zealand's population reaches 1 million. |
| 1909 | ‘Red’ Federation of Labour formed. SS Penguin wrecked in Cook Strait, 75 people die. Compulsory military training introduced. Stamp-vending machine invented and manufactured in New Zealand. |
| 1912 | William Massey wins vote in the house and becomes first Reform Party prime minister. Waihi miners strike. Malcolm Champion New Zealand's first Olympic gold medallist (as a member of the Australasian 200 metre freestyle relay swimming team). |
| 1913 | Waterfront strikes in Auckland and Wellington. |
| 1914 | World War I begins and German Samoa occupied. New Zealand Expeditionary Forces despatched to Egypt. Huntly coal mine disaster, 43 people die. |
| 1915 | New Zealand forces take part in Gallipoli campaign. Reform and Liberal form National War Cabinet. Britain announces its intention to purchase all New Zealand meat exports during war. |
| 1916 | New Zealand troops transfer to Western Front. Conscription introduced. Labour Party formed. |
| 1917 | Battle of Passchendaele – about 1,000 New Zealanders die. Six o’clock public house closing introduced. |
| 1918 | World War I ends. Influenza epidemic kills an estimated 8,500. Prohibition petition with 242,001 signatures presented to parliament. |
| 1919 | Women eligible for election to parliament. Massey signs Treaty of Versailles. First official airmail flight from Auckland to Dargaville. |
| 1920 | Anzac Day established. New Zealand gets League of Nations mandate to govern Western Samoa. First aeroplane flight across Cook Strait. |
| 1921 | New Zealand division of Royal Navy established. |
| 1923 | Otira tunnel opens. Ross Dependency proclaimed. Death of Katherine Mansfield. |
| 1926 | National public broadcasting begins under auspices of Radio Broadcasting Co Ltd. |
| 1928 | General election won by new United Party. Kingsford-Smith completes first trans-Tasman flight. |
| 1929 | Depression deepens. Severe earthquake in Murchison–Karamea district, 15 people die. First health stamps issued. |
| 1930 | Unemployment Board set up to provide relief work. |
| 1931 | Newly formed coalition government under George Forbes wins general election. Hawke's Bay earthquake, 261 die. Substantial reductions in public service wages and salaries. |
| 1932 | Compulsory arbitration of industrial disputes abolished. Unemployed riot in Auckland, Dunedin and Christchurch. Reductions in old age and other pensions. |
| 1933 | Elizabeth McCombs becomes first woman MP. Distinctive New Zealand coins first issued. |
| 1934 | First trans-Tasman airmail. |
| 1935 | First Labour government elected under Michael Joseph Savage. Air services begin across Cook Strait. |
| 1936 | Reserve Bank of New Zealand taken over by state. State housing programme launched. Guaranteed prices for dairy products introduced. National Party formed from former Coalition MPs. Inter-island trunk air services introduced. Jean Batten's record flight from England. Standard working week reduced from 44 to 40 hours for many workers. |
| 1937 | Federation of Labour unifies trade union movement. RNZAF set up as separate branch of armed forces. |
| 1938 | Social Security Act establishes revised pensions structure and the basis of a national health service. Import and exchange controls introduced. |
| 1939 | World War II begins. Second New Zealand Expeditionary Force formed and a Maori Battalion organised on tribal lines. Bulk purchases of farm products by Great Britain. HMS Achilles, on loan to New Zealand, takes part in Battle of the River Plate. |
| 1940 | Michael Joseph Savage dies and is succeeded by Peter Fraser. Sidney Holland becomes leader of opposition. Conscription for military service. German mines laid across Hauraki Gulf. |
| 1941 | Japan enters the war. Maori War Effort Organisation set up. Pharmaceutical and general practitioner medical benefits introduced. |
| 1942 | Economic stabilisation. New Zealand troops in Battle of El Alamein. Food rationing introduced. Mobilisation of women for essential work. |
| 1943 | New Zealand troops take part in invasion of Italy. |
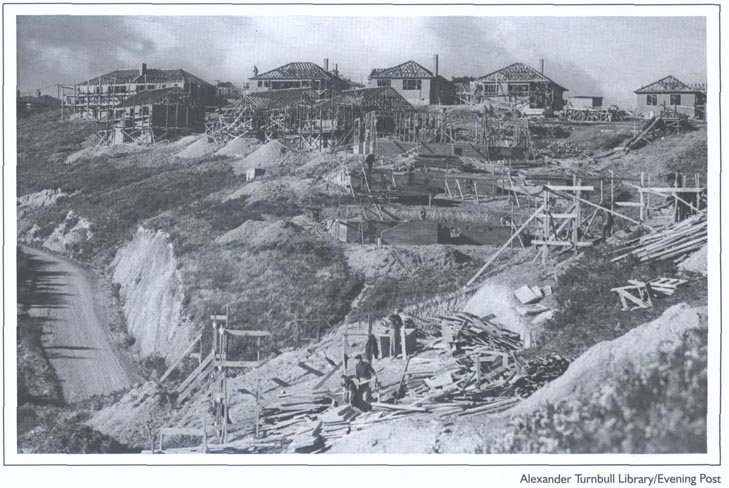 State houses being constructed on Kaihuia Street, Northland, Wellington, in 1938. | |
| 1944 | Australia-New Zealand Agreement provides for cooperation in the South Pacific. |
| 1945 | War in Europe ends on 8 May and in the Pacific on 15 August. New Zealand signs United Nations charter. Māori Social and Economic Advancement Act passed. National Airways Corporation founded. |
| 1946 | Family benefit of £1 a week becomes universal. Bank of New Zealand nationalised. |
| 1947 | Statute of Westminster adopted by New Zealand Parliament. First public performance by National Orchestra. Mabel Howard becomes first woman cabinet minister. Fire in Ballantyne's department store, Christchurch, 41 die. |
| 1948 | Protest campaign against exclusion of Māori players from 1949 rugby tour of South Africa. Polio epidemic closes schools. Ruapehu and Ngauruhoe erupt. Meat rationing ends. |
| 1949 | Referendum agrees to compulsory military training. National government elected. New Zealand gets first four navy frigates. |
| 1950 | Naval and ground forces sent to Korean War. Legislative Council abolished. Wool boom. Empire Games held in Auckland. |
| 1951 | Prolonged waterfront dispute – state of emergency proclaimed. ANZUS Treaty signed by United States, Australia and New Zealand. Māori Women's Welfare League established. |
| 1952 | Population passes 2 million. |
| 1953 | First tour by a reigning monarch, Queen Elizabeth II. Edmund Hillary and Sherpa Tensing Norgay first to climb Mt Everest. Railway disaster at Tangiwai, 151 die. World sheep-shearing record set by Godfrey Bowen. |
| 1954 | New Zealand signs South-east Asia Collective Defence Treaty. New Zealand gains seat on United Nations Security Council. Social Credit gets 10 percent of vote in general election, but no seat in parliament. |
| 1955 | Pulp and paper mill opens at Kawerau. Rimutaka rail tunnel opens. |
| 1956 | New Zealand troops deployed in Malaya. |
| 1957 | National loses election; Walter Nash leads second Labour government. Last hanging. Scott Base established in Ross Dependency. Court of Appeal constituted. Dairy products gain 10 years of unrestricted access to Britain. Compulsory military training abolished. |
| 1958 | PAYE tax introduced. Arnold Nordmeyer's ‘Black Budget’. First geothermal electricity generated at Wairakei. |
| 1959 | Antarctic Treaty signed with other countries involved in scientific exploration in Antarctica. Auckland harbour bridge opened. |
| 1960 | Regular television programmes begin in Auckland. National government elected. Government Service Equal Pay Act passed. |
| 1961 | New Zealand joins the International Monetary Fund. Capital punishment abolished. |
| 1962 | Western Samoa becomes independent. Sir Guy Powles becomes first ombudsman. New Zealand Māori Council established. Cook Strait rail ferry service begins. Taranaki gas well opens. Olympic gold medallist Peter Snell establishes mile and half-mile world athletic records. |
| 1964 | Marsden Point oil refinery opens near Whangarei. Cook Strait power cables laid. |
| 1965 | Free trade (NAFTA) agreement negotiated with Australia. New Zealand combat forces sent to support United States troops in Vietnam amid public protests. Cook Islands becomes self-governing. |
| 1966 | International airport officially opens at Auckland. Te Ata-i-rangi-kaahu becomes first Māori Queen. |
| 1967 | Referendum extends hotel closing hours to 10pm. Decimal currency introduced. Lord Arthur Porritt becomes first New Zealand-born governor-general. Breath and blood tests introduced for suspected drinking drivers. |
| 1968 | Inter-island ferry Wahine sinks in storm in Wellington Harbour, 51 die. Inangahua earthquake, three die. |
| 1969 | Vote extended to 20-year-olds. National government wins fourth election in a row. First output from Glenbrook steel mill. |
| 1970 | Natural gas from Kapuni supplied to Auckland. |
| 1971 | New Zealand secures continued access of butter and cheese to the United Kingdom. Ngā Tamatoa protest at Waitangi celebrations. Tiwai Point aluminium smelter begins operating. Warkworth satellite communications station begins operation. |
| 1972 | Labour government led by Norman Kirk elected. Equal Pay Act passed. |
| 1973 | Great Britain becomes a member of the EEC. Naval frigate despatched in protest against French nuclear testing in the Pacific. New Zealand's population reaches 3 million. Rugby tour by South Africa cancelled. Colour television introduced. |
| 1974 | Prime Minister Norman Kirk dies. Commonwealth Games held in Christchurch. Vote given to 18 year olds. |
| 1975 | Robert Muldoon becomes prime minister after National election victory. Māori land march protests against land loss. Waitangi Tribunal established. |
| 1976 | Matrimonial Property Act passed. Pacific Islands overstayers deported. EEC import quotas for New Zealand butter set until 1980. Introduction of metric system of weights and measures. Subscriber toll dialling introduced. |
| 1977 | New Zealand's 200-mile exclusive economic zone established. Bastion Point occupied by Māori land protesters. |
| 1978 | National government re-elected. |
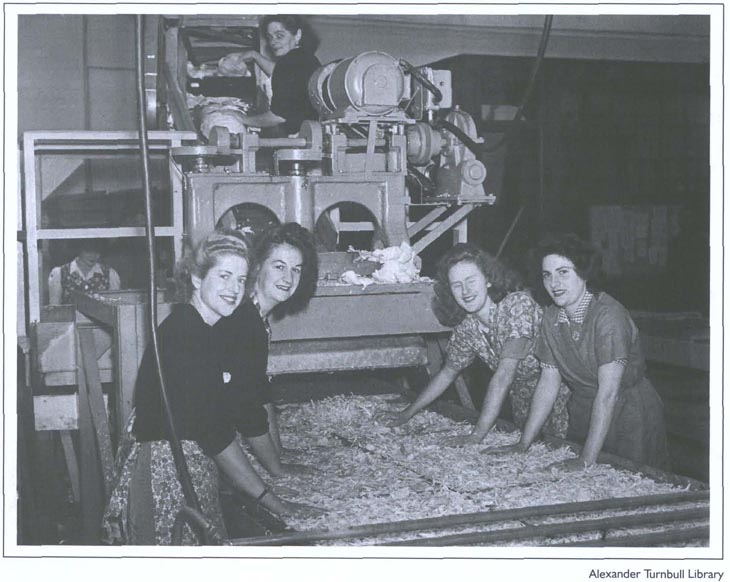 Women working in a food dehydration plant at Pukekohe during World War II. | |
| 1979 | Air New Zealand plane crashes on Mt Erebus, Antarctica, 257 die. Carless days introduced to reduce petrol consumption. |
| 1980 | Saturday trading partially legalised. Eighty-day strike at Kinleith pulp and paper mill. |
| 1981 | South African rugby team's tour brings widespread disruption. |
| 1982 | Closer Economic Relations (CER) agreement signed with Australia. First kōhanga reo established. Year-long wage, price and rent freeze imposed – lasts until 1984. |
| 1983 | Visit by nuclear-powered United States Navy frigate Texas sparks protests. Official Information Act replaces Official Secrets Act. New Zealand Party founded. |
| 1984 | Labour Party wins snap general election. Finance Minister Roger Douglas begins deregulating economy. Te Hikoi ki Waitangi march and disruption of Waitangi Day celebrations. Auckland's population exceeds that of the South Island. Government devalues New Zealand dollar by 20 percent. |
| 1985 | Anti-nuclear policy leads to refusal of visit by American warship USS Buchanan. Greenpeace vessel Rainbow Warrior bombed and sunk by French agents in Auckland harbour. New Zealand dollar floated. Author Keri Hulme wins Booker Prize for The Bone People. First case of locally-contracted AIDS reported. Waitangi Tribunal given power to hear Māori land grievances going back to 1840. |
| 1986 | Homosexual Law Reform Bill passed. Royal Commission reports in favour of MMP electoral system. Jim Bolger becomes National Party leader. Soviet cruise ship, the Mikhail Lermontov, sinks in Marlborough Sounds. Goods and services tax introduced. First visit to New Zealand by a pope. |
| 1987 | Share prices plummet by 59 percent in four months. Labour wins general election. Māori Language Act passed making Māori an official language. Anti-nuclear legislation enacted. First lotto draw. New Zealand's first heart transplant performed. New Zealand wins first rugby World Cup. |
| 1988 | Number of unemployed exceeds 100,000. Bastion Point land returned to Māori ownership. Electrification of North Island's main trunk line completed. New Zealand Post closes 432 post offices. Fisheries quota package announced for Māori iwi. |
| 1989 | Prime Minister David Lange suggests formal withdrawal from ANZUS. Jim Anderton founds NewLabour Party, Lange resigns and Geoffrey Palmer becomes prime minister. Reserve Bank Act sets bank's role as one of maintaining price stability. First elections under revised local government structure. Sunday trading begins. Māori Fisheries Act passed. |
| 1990 | New Zealand celebrates its sesquicentennial. Māori leaders inaugurate National Congress of Tribes. Dame Catherine Tizard becomes first woman governor-general. Geoffrey Palmer resigns as prime minister and is replaced by Mike Moore. National Party has landslide victory. Jim Bolger becomes prime minister. One and two-cent coins withdrawn from circulation. Commonwealth Games held in Auckland. Telecom sold for $4.25 billion. Welfare payments cut. |
| 1991 | Welfare payments further reduced. Alliance Party formed. Employment Contracts Act passed. Number of unemployed exceeds 200,000 for first time. New Zealand troops join multi-national force in the Gulf War. Avalanche reduces the height of Mt Cook by 10.5 metres. |
| 1992 | Government and Māori interests negotiate Sealord fisheries deal. Public health system reformed. State housing commercialised. New Zealand gets seat on United Nations Security Council. |
| 1993 | New Zealand First Party launched. National wins election without majority; Opposition MP Peter Tapsell becomes Speaker of the House, thus giving the government a majority. Referendum favours MMP electoral system. |
| 1994 | Government commits 250 soldiers to peacekeeping duty in Bosnia. Government proposes $1 billion cap for final settlement of Treaty of Waitangi claims. New Zealand's first casino opens in Christchurch. First fast-ferry passenger service begins operation across Cook Strait. |
| 1995 | Team New Zealand wins America's Cup. Occupation of Moutua Gardens, Wanganui. Conservative, Christian Heritage and United New Zealand Parties launched. Renewal of French nuclear tests results in New Zealand protest flotilla and navy ship Tui sailing for Mururoa Atoll. Commonwealth Heads of Government meeting in Auckland. New Zealand contingent returns from Bosnia. |
| 1996 | First legal sports betting through Totalisator Agency Board. First MMP election brings National/New Zealand First coalition government. |
| 1997 | A $170 million settlement signed with Ngāi Tahu. Jim Bolger resigns as prime minister after a National Party coup while he is overseas. Bolger replaced by New Zealand's first woman prime minister, Jenny Shipley. |
| 1998 | Auckland city businesses hit by power cut which continues for more than a month. New Zealand women's rugby team, the Black Ferns, become world champions. Coalition government dissolved, leaving Shipley's National Party as a minority government. |
| 1999 | New Zealand sends peacekeeping troops to East Timor. Auckland hosts the APEC world leaders’ conference. Former prime minister Mike Moore becomes head of the World Trade Organisation. The minority National government loses the November election and Labour forms government in coalition with the Alliance party and with the support of the Greens, who enter parliament for the first time with seven seats. Legal drinking age lowered from 20 to 18 years. |
| 2000 | Air New Zealand gains ownership of Ansett Australia. Team New Zealand beats Italy's Prada 5–0 in the final series to retain the America's Cup. Labour government abolishes knighthoods. Dr Alan G MacDiarmid wins Nobel Prize for Chemistry for his part in the discovery and development of conductive polymers. |
Michael Campbell is welcomed home to Titahi Bay, Wellington, with his US Open golf trophy in 2005. | |
| 2001 | New Zealand's largest company, Fonterra, is formed from merger of the New Zealand Dairy Group and Kiwi Dairies, Qantas New Zealand and Ansett collapse, Government injects $550 million to keep Air New Zealand flying after the company announces a $1.4 billion loss – the largest in New Zealand's corporate history, Government disbands RNZAF combat wing, Shipley resigns and Bill English becomes leader of the National Party, Former America's Cup yachtsman Sir Peter Blake murdered by pirates at the mouth of the Amazon. |
| 2002 | Labour wins election and forms a coalition government with Progressive Coalition and enters into a special arrangement with United Future, Rakiura, New Zealand's 14th National Park covering about 85 percent of Stewart Island, opens, Three New Zealanders among 185 killed in Bali terrorist bombing, Lowest road toll (402) since 1963, The Fellowship of the Ring, first film in The Lord of the Rings trilogy directed by New Zealand's Peter Jackson, wins four Oscars. |
| 2003 | New Zealand loses America's Cup to Swiss challenger Alinghi, skippered by Russell Coutts, previously of Team New Zealand. Population reaches 4 million. National caucus votes in Don Brash as leader, replacing English. |
| 2004 | The Return of the King, third film in The Lord of the Rings trilogy, wins 11 Oscars. Controversial Foreshore and Seabed Act passed following a hikoi of thousands of protestors. Tariana Turia resigns as Labour Party MP and re-elected eight weeks later as the Māori Party's first MP. Supreme Court replaces London-based Privy Council as New Zealand's court of final appeal. Unknown Warrior from World War I Somme battlefield returned and laid to rest at Wellington's National War Memorial. |
| 2005 | Titahi Bay golfer Michael Campbell wins US Open, only the second New Zealander to win one of golf's ‘majors.’ Former Prime Minister David Lange dies. Labour has one-seat election night lead over National and subsequently forms government in coalition with Jim Anderton's Progressives and United Future. Green Party co-leader Rod Donald dies suddenly in Christchurch. Decommissioned naval frigate Wellington scuttled off Wellington's south coast for use as a diving attraction. New Zealand wins right to host 2011 rugby World Cup. |
www.archives.govt.nz – Archives New Zealand
www.dnzb.govt.nz – Dictionary of New Zealand Biography
www.nzhistory.net.nz – History Group, Ministry for Culture and Heritage
www.natlib.govt.nz – National Library of New Zealand
www.nzarchaeology.org – New Zealand Archaeology
www.nzetc.org – New Zealand Electronic Text Centre
www.stats.govt.nz – Statistics New Zealand
www.teara.govt.nz – Te Ara – The Encyclopedia of New Zealand
www.treatyofwaitangi.govt.nz – Treaty of Waitangi
Table of Contents
The power to make laws is vested by the Constitution Act 1986 in the Parliament of New Zealand.
New Zealand's constitutional history can be traced back to the signing of the Treaty of Waitangi in 1840. The treaty is an agreement between the British Crown and Māori in which Māori gave the Crown rights to govern and the Crown guaranteed Māori full protection of their interests and status, and full citizenship rights.
Five years earlier, on October 28 1835, an assembly of the Confederation of Chiefs of the United Tribes of New Zealand had proclaimed the country independent and signed a Declaration of Independence.
New Zealand is a constitutional monarchy with a parliamentary government. Queen Elizabeth II has the title Queen of New Zealand.
Table 3.01 lists Sovereigns of New Zealand since signing of the Treaty of Waitangi.
Table 3.01. Sovereigns of New Zealand
| Monarch | Accession | Died | Age | Reigned (years) |
|---|---|---|---|---|
1Abdicated: reigned 325 days. Source: Statistics New Zealand | ||||
| House of Hanover | ||||
| Victoria | 1837 | 1901 | 81 | 63 |
| House of Saxe-Coburg | ||||
| Edward VII | 1901 | 1910 | 68 | 9 |
| House of Windsor | ||||
| George V | 1910 | 1936 | 70 | 25 |
| Edward VIII1 | 1936 | 1972 | 77 | |
| George VI | 1936 | 1952 | 56 | 15 |
| Elizabeth II | 1952 | |||
Aconstitution is concerned with establishment and composition of the legislative, executive and judicial branches of government, their powers and duties, and the relationship between these branches.
New Zealand's Constitution Act 1986 brought together important statutory constitutional provisions and clarified rules relating to the governmental hand-over of power.
Other key written sources of New Zealand's constitution include the Electoral Act 1993, the Imperial Laws Application Act 1988 (which lists United Kingdom statutes still in force in New Zealand) and Standing Orders of the House of Representatives.
Other sources of the constitution include constitutional conventions, New Zealand legislation and decisions of the courts.
The Governor-General of New Zealand is the representative of the Sovereign in New Zealand and exercises the royal powers derived from statute and the general law (prerogative powers). The powers of the governor-general are set out in the Letters Patent 1983 and it is for the courts to decide on the limits of these powers.
One of the governor-general's main constitutional functions is to arrange for the leader of the majority party in parliament to form a government. The Crown is part of parliament and the governor-general's assent is required before bills can become law. The governor-general is required, however, by constitutional convention and the Letters Patent, to follow the advice of ministers. In extraordinary circumstances, the governor-general can reject advice if he or she believes a government is intending to act unconstitutionally. This is known as the reserve power, The Sovereign appoints the governor-general on the prime minister's recommendation, normally for a term of five years.
Table 3.02 lists Lieutenant-Governors, Governors and Governors-General of New Zealand since signing of the Treaty of Waitangi
Table 3.02. Vice-regal representatives
| Representative1 | Assumed office | Retired |
|---|---|---|
1Honours are specified only if held on retirement from office. Source: Office of the Governor-General | ||
| Dependency | ||
| Lieutenant-Governor | ||
| Captain William Hobson, RN | 30 Jan 1840 | 3 May 1841 |
| Crown colony | ||
| Governor | ||
| Captain William Hobson, RN | 3 May 1841 | 10 Sep 1842 |
| Captain Robert FitzRoy, RN | 26 Dec 1843 | 17 Nov 1845 |
| Captain George Grey | 18 Nov 1845 | 31 Dec 1847 |
| Governor-in-Chief Sir George Grey, KCB | 1 Jan 1848 | 7 Mar 1853 |
| Self-governing colony | ||
| Governors of New Zealand | ||
| Sir George Grey, KCB | 7 Mar 1853 | 31 Dec 1853 |
| Colonel Thomas Gore Browne, CB | 6 Sep 1855 | 2 Oct 1861 |
| Sir George Grey, KCB | 4 Dec 1861 | 5 Feb 1868 |
| Sir George Ferguson Bowen, GCMG | 5 Feb 1868 | 19 Mar 1873 |
| Rt Hon Sir James Fergusson, Bt | 14 Jun 1873 | 3 Dec 1874 |
| Marquess of Normanby, GCM, GCMG, PC | 9 Jan 1875 | 21 Feb 1879 |
| Sir Hercules George Robert Robinson, GCMG | 17 Apr 1879 | 8 Sep 1880 |
| Hon Sir Arthur Hamilton Gordon, GCMG | 29 Nov 1880 | 23 Jun 1882 |
| Lieutenant-General Sir William Francis Drummond Jervois, GCMG, CB | 20 Jan 1883 | 22 Mar 1889 |
| Earl of Onslow, GCMG | 2 May 1889 | 24 Feb 1892 |
| Earl of Glasgow, GCMG | 7 Jun 1892 | 6 Feb 1897 |
| Earl of Ranfurly, GCMG | 10 Aug 1897 | 19 Jun 1904 |
| Lord Plunket, GCMG, KCVO | 20 Jun 1904 | 7 Jun 1910 |
| Dominion | ||
| Lord Islington, KCMG, DSO, PC | 22 Jun 1910 | 2 Dec 1912 |
| Earl of Liverpool, GCMG, MVO, PC | 19 Dec 1912 | 27 Jun 1917 |
| Governors-General of New Zealand | ||
| Earl of Liverpool, GCB, GCMG, GBE, MVO, PC | 28 Jun 1917 | 7 Jul 1920 |
| Admiral of the Fleet Viscount Jellicoe, GCB, OM, GCVO | 27 Sep 1920 | 26 Nov 1924 |
| General Sir Charles Fergusson, BT, GCMG, KCB, DSO, MVO | 13 Dec 1924 | 8 Feb 1930 |
| Viscount Bledisloe, GCMG, KBE, PC | 19 Mar 1930 | 15 Mar 1935 |
| Viscount Galway, GCMG, DOS, OBE, PC | 12 Apr 1935 | 3 Feb 1941 |
| Marshal of the Royal Air Force Sir Cyril Louis Norton Newall, GCB, OM, GCMG, CBE, AM | 22Feb 1941 | 19 Apr 1946 |
| Realm | ||
| Lieutenant-General the Lord Freyberg, VC, GCMG, KCB, KBE, DSO | 17 Jun 1946 | 15 Aug 1952 |
| Lieutenant-General the Lord Norrie, GCMG, GCVO, CB, DSO, MC | 2 Dec 1952 | 25 Jul 1957 |
| Viscount Cobham, GCMG, TD | 5 Sep 1957 | 13 Sep 1962 |
| Brigadier Sir Bernard Fergusson, GCMG, GCVO, DSO, OBE | 9 Nov 1962 | 20 Oct 1967 |
| Sir Arthur Espie Porritt, BT, GCMG, GCVO, CBE | 1 Dec 1967 | 7 Sep 1972 |
| Sir (Edward) Denis Blundell, GCMG, GCVO, KBE, QSO | 27 Sep 1972 | 5 Oct 1977 |
| Rt Hon Sir Keith Jacka Holyoake, KG, GCMG, CH, QSO | 26 Oct 1977 | 27 Oct 1980 |
| Hon Sir David Stuart Beattie, GCMG, GCVO, QSO, QC | 6 Nov 1980 | 10 Nov 1985 |
| Most Reverend Sir Paul Alfred Reeves, GCMG, GCVO, QSO | 20 Nov 1985 | 29 Nov 1990 |
| Dame Catherine Tizard, GCMG, GCVO, DBE, QSO | 13 Dec 1990 | 3 Mar 1996 |
| Rt Hon Sir Michael Hardie Boys, GNZM, GCMG, QSO | 21 Mar 1996 | 21 Mar 2001 |
| Dame Silvia Cartwright, PCNZM, DBE | 4 April 2001 | 4 Aug 2006 |
| Judge Anand Satyanand, PCNZM | 4 Aug 2006 | |
Since 1856, New Zealand has been a constitutional monarchy with a parliamentary system of government.
The government cannot act effectively without parliament, because it cannot raise or spend money without parliamentary approval.
For most categories of expenditure, this approval takes the form of an annual vote of funds to the government. Parliament has to be assembled regularly, therefore, and thus has the opportunity to hold the government to account.
New Zealand has had a Mixed Member Proportional (MMP) electoral system since 1996.
Voters have two votes – one electorate vote and one party vote. Electorate votes are used to elect Members of Parliament (MPs) to represent their local areas. Party votes are used to allocate extra seats to political parties so that the makeup of parliament reflects the support for these parties across the country.
For the 2005 election, New Zealand was divided geographically into 62 general and seven Māori electorates.
The political parties were subsequently allocated 52 seats after counting of party votes and the number of seats in parliament increased by one to 121.
Electorate boundaries are redrawn by the Representation Commission after each population census. The number of electorates can change as the population increases or decreases.
The Māori Electoral Option follows every census and gives people of Māori descent the opportunity to choose whether to be on the Māori or general electoral roll.
Once electors have chosen to be on the Māori roll, they cannot change until the next Māori Electoral Option.
Workings of the New Zealand electoral system are set out in the Electoral Act 1993. This act is the only statute in New Zealand with entrenched provisions. This means that either 75 percent of MPs, or a majority of voters in a referendum of all registered voters, must agree to make changes to these provisions. Normally, a simple majority of MPs is all that is required to make changes to legislation.
Table 3.03 lists New Zealand's Premiers and Prime Ministers.
Table 3.03. Premiers and Prime Ministers of New Zealand
| Premier/Prime Minister1 | Term(s) of office | |
|---|---|---|
1Honours are specified only if held on retirement from office. Source: Cabinet Office | ||
| Premiers | ||
| Henry Sewell | 7 May 1856–20 May 1856 | |
| William Fox | 20 May 1856–2 Jun 1856 | |
| Edward William Stafford | 2 Jun 1856–12 Jul 1861 | |
| William Fox | 12 Jul 1861–6 Aug 1862 | |
| Alfred Domett | 6 Aug 1862–30 Oct 1863 | |
| Frederick Whitaker, MIX | 30 Oct 1863–24 Nov 1864 | |
| Frederick Aloysius Weld | 24 Nov 1864–16 Oct 1865 | |
| Edward William Stafford | 16 Oct 1865–28 Jun 1869 | |
| William Fox | 28 Jun 1869–10 Sep 1872 | |
| Edward William Stafford | 10 Sep 1872–11 Oct 1872 | |
| George Marsden Waterhouse, MLC | 11 Oct 1872–3 Mar 1873 | |
| William Fox | 3 Mar 1873–8 Apr 1873 | |
| Sir Julius Vogel, KCMG | 8 Apr 1873–6 Jul 1875 | |
| Daniel Pollen, MLC | 6 Jul 1875–15 Feb 1876 | |
| Sir Julius Vogel, KCMG | 15 Feb 1876–1 Sep 1876 | |
| Sir Harry Albert Atkinson, KCMG | 1 Sep 1876–13 Oct 1877 | |
| Sir George Grey, KCB | 13 Oct 1877–8 Oct 1879 | |
| John Hall | 8 Oct 1879–21 Apr 1882 | |
| Frederick Whitaker, MLC | 21 Apr 1882–25 Sep 1883 | |
| Sir Harry Albert Atkinson, KCMG | 25 Sep 1883–16 Aug 1884 | |
| Sir Robert Stout, KCMG | 16 Aug 1884–28 Aug 1884 | |
| Sir Harry Albert Atkinson, KCMG | 28 Aug 1884–3 Sep 1884 | |
| Sir Robert Stout, KCMG | 3 Sep 1884–8 Oct 1887 | |
| Sir Harry Albert Atkinson, KCMG | 8 Oct 1887–24 Jan 1891 | |
| John Ballance | Liberal | 24 Jan 1891–d 27 Apr 1893 |
| Rt Hon Richard John Seddon | Liberal | 1 May 1893–d 10 Jun 1906 |
| Prime Ministers | ||
| William Hall-Jones | Liberal | 21 Jun 1906–6 Aug 1906 |
| Rt Hon Sir Joseph George Ward, Bt, KCMG | Liberal | 6 Aug 1906–28 Mar 1912 |
| Thomas MacKenzie | Liberal | 28 Mar 1912–10 Jul 1912 |
| Rt Hon William Ferguson Massey | Reform | 10 Jul 1912–10 May 1925 |
| Sir Francis Henry Dillon Bell, GCMG, KC, MLC | Reform | 14 May 1925–30 May 1925 |
| Rt Hon Joseph Gordon Coates, MC | Reform | 30 May 1925–10 Dec 1928 |
| Rt Hon Sir Joseph George Ward, Bt, KCMG | United | 10 Dec 1928–28 May 1930 |
| Rt Hon George William Forbes | United | 28 May 1930–22 Sep 1931 |
| Coalition | 22 Sep 1931–6 Dec 1935 | |
| Rt Hon Michael Joseph Savage | Labour | 6 Dec 1935–d 27 Mar 1940 |
| Rt Hon Peter Fraser, CH | Labour | 1 Apr 1940–13 Dec 1949 |
| Rt Hon Sidney George Holland, CH | National | 13 Dec 1949–20 Sep 1957 |
| Rt Hon Sir Keith Jacka Holyoake, GCMG, CH | National | 20 Sep 1957–12 Dec 1957 |
| Rt Hon Walter Nash, CH | Labour | 12 Dec 1957–12 Dec 1960 |
| Rt Hon Sir Keith Jacka Holyoake, GCMG, CH | National | 12 Dec 1960–7 Feb 1972 |
| Rt Hon John Ross Marshall | National | 7 Feb 1972–8 Dec 1972 |
| Rt Hon Norman Eric Kirk | Labour | 8 Dec 1973–d 31 Aug 1974 |
| Rt Hon Wallace Edward Rowling | Labour | 6 Sep 1974–12 Dec 1975 |
| Rt Hon Sir Robert David Muldoon, GCMG, CH | National | 12 Dec 1975–26 Jul 1984 |
| Rt Hon David Russell Lange | Labour | 26 Jul 1984–8 Aug 1989 |
| Rt Hon Geoffrey Winston Russell Palmer | Labour | 8 Aug 1989–4 Sep 1990 |
| Rt Hon Michael Kenneth Moore | Labour | 4 Sep 1990–2 Nov 1990 |
| Rt Hon James Brendan Bolger | National | 2 Nov 1990–12 Oct 1996 |
| Coalition | 12 Oct 1996–8 Dec 1997 | |
| Rt Hon Jennifer Mary Shipley | Coalition | 8 Dec 1997–10 Dec 1999 |
| Rt Hon Helen Elizabeth Clark | Labour/Alliance | 10 Dec 1999–15 Aug 2002 |
| Labour/Progressive | 15 Aug 2002–11 Aug 2005 | |
| Labour/Progressive | 19 Oct 2005– | |
The power to make laws lies at the heart of New Zealand's parliamentary system.
This power is vested in the Parliament of New Zealand by the Constitution Act 1986.
Parliament consists of the Sovereign (normally represented by the governor-general) and an elected House of Representatives.
Table 3.04 shows seats held by political parties after general elections since 1890.
Table 3.04. Seats held by political parties after general elections
| Election | Total | Liberal | Conservative | Labour | ACT | NZ First | Alliance | Green | Other | Independent | |
|---|---|---|---|---|---|---|---|---|---|---|---|
1Māori members whose party allegiances are difficult to determine 2Country Party 3Rātana 4Social Credit/Democrats 5New Labour 6Includes Speaker of the House 7United 8United Future 8 seats, Progressive Coalition 2 sears 9United Future 3 seats, Progressive 1 seat, Māori 4 seats. Source: Office of the Clerk of the House of Representatives | |||||||||||
| 1890 | 74 | 38 | 25 | 41 | 7 | ||||||
| 1893 | 74 | 51 | 13 | 41 | 6 | ||||||
| 1896 | 74 | 39 | 25 | 41 | 6 | ||||||
| 1899 | 74 | 49 | 19 | 41 | 2 | ||||||
| 1902 | 80 | 47 | 19 | 41 | 10 | ||||||
| 1905 | 80 | 58 | 16 | 6 | |||||||
| Reform | |||||||||||
| 1908 | 80 | 50 | 26 | 1 | 3 | ||||||
| 1911 | 80 | 33 | 37 | 4 | 6 | ||||||
| 1914 | 80 | 33 | 41 | 6 | |||||||
| 1919 | 80 | 21 | 47 | 8 | 4 | ||||||
| 1922 | 80 | 22 | 37 | 17 | 4 | ||||||
| 1925 | 80 | 11 | 55 | 12 | 2 | ||||||
| 1928 | 80 | 27 | 27 | 19 | 12 | 6 | |||||
| Coalition | |||||||||||
| 1931 | 80 | 51 | 24 | 12 | 4 | ||||||
| National | |||||||||||
| 1935 | 80 | 19 | 53+23 | 22 | 4 | ||||||
| 1938 | 80 | 25 | 53 | 2 | |||||||
| 1943 | 80 | 34 | 45 | 1 | |||||||
| 1946 | 80 | 38 | 42 | ||||||||
| 1949 | 80 | 46 | 34 | ||||||||
| 1951 | 80 | 50 | 30 | ||||||||
| 1954 | 80 | 45 | 35 | ||||||||
| 1957 | 80 | 39 | 41 | ||||||||
| 1960 | 80 | 46 | 34 | ||||||||
| 1963 | 80 | 45 | 35 | ||||||||
| 1966 | 80 | 44 | 35 | 14 | |||||||
| 1969 | 84 | 45 | 39 | ||||||||
| 1972 | 87 | 32 | 55 | ||||||||
| 1975 | 87 | 55 | 32 | ||||||||
| 1978 | 92 | 51 | 40 | 14 | |||||||
| 1981 | 92 | 47 | 43 | 24 | |||||||
| 1984 | 95 | 37 | 56 | 24 | |||||||
| 1987 | 97 | 40 | 57 | ||||||||
| 1990 | 97 | 67 | 29 | 15 | |||||||
| 1993 | 99 | 50 | 456 | 2 | 2 | ||||||
| 1996 | 120 | 446 | 37 | 8 | 17 | 13 | 17 | ||||
| 1999 | 120 | 39 | 49 | 9 | 5 | 10 | 7 | 17 | |||
| 2002 | 120 | 27 | 52 | 9 | 13 | 9 | 108 | ||||
| 2005 | 121 | 48 | 50 | 2 | 7 | 6 | 89 | ||||
Ministers of the Labour-led minority coalition government are sworn in following the general election of 17 September 2005.
The principal functions of parliament are to enact laws, to supervise the government's administration, to vote supply, to provide a government and to redress grievances by way of petition. The Constitution Act forbids the Crown taxing citizens without express parliamentary approval.
Under standing orders, private members are able to initiate proposals involving expenditure or taxation. However, the government has an absolute right to veto such proposals if, in its view, they would have more than a minor impact on the government's fiscal aggregates.
Perhaps the most important privilege of the House of Representatives is that of freedom of speech, guaranteed by the Bill of Rights 1688 and claimed by the Speaker upon confirmation in office by the governor-general.
The house meets in answer to a summons from the governor-general. Sessions of parliament are marked by a formal opening, when the government's legislative programme is described in the Speech from the Throne, read by the governor-general in the absence of the Sovereign. The session is either terminated by prorogation or, as is now usually the case, directly by dissolution of parliament.
Unless there is a new session, the prime minister's statement at the start of business in the second and third years of the parliamentary term reviews public affairs and outlines the government's legislative and other policy intentions for the year ahead.
The Speaker, elected by the house, is the principal presiding officer, maintaining order in proceedings and ensuring standing orders are complied with. The Speaker is assisted by the Clerk of the House of Representatives, who notes all proceedings of the house and of any committee of the house, and provides advice on parliamentary law and custom.
Role of parties. For many years up until 1993, under the first past the post (FPP) system of electoral representation, the House of Representatives was characterised by the presence of two, large, dominant parties, with the majority party forming the government and the minority party the opposition. This, however, has given way to multiparty representation under the mixed member proportional (MMP) system of electoral representation, adopted after two referendums, one indicative (1992) and one binding (1993). The four general elections held since 1996 have demonstrated that under MMP it is unlikely that any single party will command an absolute majority in the house and be able to form a government on its own account. Because of the importance that parties have assumed within the political framework, the party caucus (a meeting of each party's Members of Parliament in closed session at regular intervals – once a week when parliament is in session) has become a primary means of developing policies and tactics.
Party representation. The general election on 17 September 2005 resulted in the formation again of a Labour-led minority coalition government. The Labour Party entered into a coalition government agreement with Jim Anderton's Progressive Party on 17 October 2005. The agreement saw the leader of Jim Anderton's Progressive Party continue to be a cabinet minister. Agreements were also concluded on 17 October 2005 by the minority coalition government with United Future and New Zealand First. Both parties promised to provide confidence and supply for the term of the parliament to a Labour/Progressive government. It was also agreed that the leaders of United Future and New Zealand First would be appointed to ministerial positions outside of cabinet. The new ministry was sworn in on 19 October 2005. Further, a cooperation agreement was entered into by the government with the Green Party, which provided for consultation on the broad outline of the legislative programme, on key legislative measures on which support was needed, on major policy issues and on broad budget parameters. The fourth House of Representatives elected under MMP consisted of:
1An overhang of one seat resulted from the Māori Party winning more electorate seats than it was entitled to based on its share of all party votes. | |
|---|---|
| Labour | 50 seats (31 electorate, 19 party list). |
| National | 48 seats (31 electorate, 17 party list). |
| New Zealand First | 7 seats (7 party list). |
| Green | 6 seats (6 party list). |
| Māori | 4 seats (4 electorate)1. |
| United Future | 3 seats (1 electorate, 2 party list). |
| ACT New Zealand | 2 seats (1 electorate,1 party list). |
| Jim Anderton's Progressive | 1 seat (1 electorate). |
Legislative procedure. The legislative procedure starts in New Zealand when proposed laws are presented to the House of Representatives in the form of draft laws known as ‘bills’. Classes of bills are:
Government bills, which deal with matters of public policy and which are introduced by a minister.
Members’ bills, which deal with matters of public policy and which are introduced by a Member of Parliament who is not a minister.
Local bills, which are promoted by local authorities to give them special powers or to validate unlawful actions they may have taken, and which affect particular localities.
Private bills, promoted by individuals or bodies (such as companies or trusts) for their particular interest or benefit.
All types of bills follow a similar procedure in the house, with every bill being required to be ‘read’ three times. A local bill or a private bill must also comply with prescribed preliminary procedures, which entail advertising the bill before its introduction into the house. The number of members’ bills that may be introduced and proceed at any one time to first reading is limited to four, chosen by ballot. Under standing orders, a government bill is introduced by the Leader of the House informing the Clerk of the House on any working day, or by 1pm on a sitting day, of the government's intention to introduce the bill. A member's bill or a local bill is introduced after notice of intention to introduce it is given and the bill's introduction has been announced to the house. A private bill is introduced by presentation of a petition for the bill to the house. The bill is then set down for first reading on the third sitting day following. Debate on the first reading is limited to 12 speeches in the case of a government bill, or six speeches of 10 minutes each for private bills and local bills, with the member in charge getting a five-minute right of reply. For members’ bills, there may be up to two 10-minute speeches and eight five-minute speeches, with a right of reply. After its first reading, a bill is referred to a select committee of the house for consideration, unless it is an appropriation bill, an imprest supply bill, or a bill that has been accorded urgency for its passing. Select committee consideration of bills provides an opportunity for the public and interested bodies to make submissions in the expectation that better law will result. Committees also carry out scrutiny functions in relation to such matters as estimates, financial reviews and petitions. A committee must finally report to the house on a bill within six months of the bill being referred to it, unless the business committee extends that time. In its report recommending amendments to a bill, the committee must distinguish between those adopted unanimously by the committee and those adopted by a majority. Following presentation of a select committee report on a bill, the report is set down for second reading on the third sitting day following. At the conclusion of debate on the report, the house decides whether to agree to the amendments recommended by the select committee by majority. The house then decides whether the bill should be read a second time. The second reading of a bill is directed to the principles and objects of the bill. A bill to which the house gives a second reading is set down for consideration in a committee of the whole house next sitting day, unless the business committee decides that the bill does not require consideration in committee. In committee, the bill is considered in detail, normally part by part. Once a bill has been fully considered by the committee, it is reported to the house with any amendments agreed to. The house having adopted the report, the bill is then set down for third reading next sitting day. Debate on the third reading is limited to 12 speeches of 10 minutes each. After a third reading has been given, a bill that has been passed by the house is forwarded to the governor-general for the Royal Assent. The bill then becomes an Act of Parliament and part of the law of New Zealand.
Sessions of parliament. The first session of the 48th New Zealand Parliament was called following the general election of 17 September 2005 and began sitting on 7 November 2005.
Salaries and allowances of parliamentarians. Salaries and allowances of parliamentarians are set by the Remuneration Authority and are shown in Table 3.05.
Table 3.05. Parliamentary salaries and allowances
| Salary | Yearly rate of salary payable on or after 1 July 20051 |
|---|---|
1Parliamentary Salaries and Allowance Determination 2005 Source: The Remuneration Authority | |
| Members of the Executive | $ |
| Prime Minister | 347,000 |
| Deputy Prime Ministet | 245,000 |
| Minister in cabinet | 216,000 |
| Minister with portfolio outside cabinet | 183,000 |
| Minister without portfolio | 158,500 |
| Parliamentary Under-Secretary | 141,000 |
| Officers of the House of Representatives | |
| Speaker of the House of Representatives | 216,000 |
| Deputy Speaker | 152,000 |
| Assistant Speaker | 130,000 |
| Chairperson of a select committee | 130,000 |
| Deputy chairperson of a select committee | 122,000 |
| Leaders of non-government parties | |
| Leader of the Opposition | 216,000 |
| Other party leaders (depending on number of MPs) | 130,000 + |
| Deputy leader of party with 25 MPs or more (depending on number of MPs) | 150,075 + |
| Whips | |
| Senior Government Whip (depending on number of MPs) | 134,000 + |
| Other whips (depending on number of MPs) | 130,000 + |
| Junior Whip of party with 25 MPs or more | 130,000 |
| Other Members of Parliament | |
| Member of Parliament | 118,000 |
| Expenses allowance | |
| Prime Minister | 17,900 |
| Speaker | 16,800 |
| Other Members of Parliament | 13,500 |
Table 3.06 shows the makeup of New Zealand's 48th Parliament.
Table 3.06. House of Representatives, 48th Parliament
| Prime Minister | – Rt Hon Helen Clark | |||
|---|---|---|---|---|
| Leader of the Opposition | – Dr Don Brash | |||
| Speaker | – Hon Margaret Wilson | |||
| Deputy Speaker | – Hon Clem Simich | |||
| Clerk of the House | – D G McGee | |||
| Member1 | Year of birth | Previous occupation | Electorate/list | Party |
1Names are given by which individual members prefer to be addressed. 2Died 6 November 2005. 3Replaced Rod Donald. Source: Office of the Clerk of the House of Representatives | ||||
| Anderton, Hon Jim | 1938 | Company director | Wigram | Progressive |
| Ardern, Shane | 1960 | Farmer | Taranaki/King Country | National |
| Auchinvole, Chris | 1945 | Manager | List | National |
| Barker, Hon Rick | 1951 | Trade unionist | List | Labour |
| Barnett, Tim | 1958 | Voluntary sector manager | Christchurch Central | Labour |
| Bennett, David | 1970 | Farmer | Hamilton East | National |
| Bennett, Paula | 1969 | Manager | List | National |
| Benson-Pope, Hon David | 1950 | Teacher | Dunedin South | Labour |
| Beyer, Georgina | 1957 | Mayor | List | Labour |
| Blue, Dr Jackie | 1956 | Medical practitioner | List | National |
| Blumsky, Mark | 1957 | Mayor | List | National |
| Borrows, Chester | 1957 | Police officer, lawyer | Whanganui | National |
| Bradford, Sue | 1952 | Community development worker | List | Green |
| Brash, Dr Don | 1940 | Governor of RBNZ | List | National |
| Brown, Peter | 1939 | Company director | List | NZ First |
| Brownlee, Gerry | 1956 | Teacher | Ilam | National |
| Burton, Hon Mark | 1956 | Community education organiser | Taupo | Labour |
| Carter, Hon Chris | 1952 | Electorate secretary | Te Atatu | Labour |
| Carter, Hon David | 1952 | Businessman, farmer | List | National |
| Carter, John | 1950 | Local government officer | Northland | National |
| Chadwick, Steve | 1948 | Nurse, midwife | Rotorua | Labour |
| Choudhary, Dr Ashraf | 1949 | University lecturer | List | Labour |
| Clark, Rt Hon Helen | 1950 | University lecturer | Mt Albert | Labour |
| Clarkson, Bob | 1939 | Commercial property developer | Tauranga | National |
| Coleman, Dr Jonathan | 1966 | Medical practitioner | Northcote | National |
| Collins, Judith | 1959 | Lawyer | Clevedon | National |
| Connell, Brian | 1956 | Farmer | Rakaia | National |
| Copeland, Gordon | 1943 | Financial administrator | List | United Future |
| Cosgrove, Hon Clayton | 1969 | Public relations executive | Waimakariri | Labour |
| Cullen, Hon Dr Michael | 1945 | University lecturer | List | Labour |
| Cunliffe, Hon David | 1963 | Management consultant | New Lynn | Labour |
| Dalziel, Hon Lianne | 1960 | Trade unionist | Christchurch East | Labour |
| Dean, Jacqui | 1957 | Professional actor | Otago | National |
| Donald, Rod2 | 1960 | Voluntary sector administrator | List | Green |
| Donnelly, Hon Brian | 1949 | School principal | List | NZ First |
| Dunne, Hon Peter | 1954 | Deputy chief executive officer | Ohariu/Belmont | United Future |
| Duynhoven, Hon Harry | 1955 | Teacher | New Plymouth | Labour |
| Dyson, Hon Ruth | 1957 | Employment consultant | Banks Peninsula | Labour |
| English, Hon Bill | 1961 | Farmer | Clutha/Southland | National |
| Fairbrother, Russell | 1944 | Lawyer | List | Labour |
| Fenton, Darien | 1954 | Trade unionist | List | Labour |
| Field, Taito Phillip | 1952 | Trade unionist | Mangere | Labour |
| Finlayson, Christopher | 1956 | Lawyer | List | National |
| Fitzsimons, Jeanette | 1945 | Organic farmer, consultant | List | Green |
| Flavell, Te Ururoa | 1955 | Lecturer | Waiāriki | Māori |
| Foss, Craig | 1963 | Banker | Tukituki | National |
| Gallagher, Martin | 1952 | Teacher | Hamilton West | Labour |
| Goff, Hon Phil | 1953 | University lecturer | Mt Roskill | Labour |
| Goodhew, Jo | 1961 | Nurse | Aoraki | National |
| Gosche, Hon Mark | 1955 | Trade unionist | Maungakiekie | Labour |
| Goudie, Sandra | 1952 | Farmer | Coromandel | National |
| Groser, Tim | 1949 | Diplomat | List | National |
| Guy, Nathan | 1970 | Farmer | List | National |
| Harawira, Hone | 1955 | Manager | Te Tai Tokerau | Māori |
| Hartley, Ann | 1942 | Real estate agent | List | Labour |
| Hawkins, Hon George | 1946 | Teacher | Manurewa | Labour |
| Hayes, John | 1948 | Diplomat | Wairarapa | National |
| Heatley, Phil | 1967 | Professional engineer | Whangarei | National |
| Henare, Hon Tau | 1960 | Advisory officer | List | National |
| Hereora, Dave | 1956 | Trade unionist | List | Labour |
| Hide, Rodney | 1956 | Economic consultant | Epsom | ACT |
| Hobbs, Hon Marian | 1947 | Teacher | Wellington Central | Labour |
| Hodgson, Hon Pete | 1950 | Veterinarian | Dunedin North | Labour |
| Horomia, Hon Parekura | 1950 | Farmer | Ikaroa/Rawhiti | Labour |
| Hughes, Darren | 1978 | Executive secretary | Otaki | Labour |
| Hutchison, Dr Paul | 1947 | Medical practitioner | Port Waikato | National |
| Jones, Shane | 1959 | Manager | List | Labour |
| Kedgley, Sue | 1948 | Author, city councillor | List | Green |
| Key, John | 1961 | Investment banker | Helensville | National |
| King, Hon Annette | 1947 | Chief executive officer | Rongotai | Labour |
| King, Colin | 1951 | Shearer, manager | Kaikoura | National |
| Laban, Hon Winnie | 1955 | Family therapist | Mana | Labour |
| Locke, Keith | 1944 | Bookshop manager | List | Green |
| Mackey, Moana | 1974 | Biochemist | List | Labour |
| Maharey, Hon Steve | 1953 | University lecturer | Palmerston North | Labour |
| Mahuta, Hon Nanaia | 1970 | Archivist librarian | Tainui | Labour |
| Mallard, Hon Trevor | 1954 | Executive assistant | Hutt South | Labour |
| Mapp, Dr Wayne | 1952 | University law lecturer | North Shore | National |
| Mark, Ron | 1954 | Businessman, army officer | List | NZ First |
| McCully, Hon Murray | 1953 | Public relations consultant | East Coast Bays | National |
| Moroney, Sue | 1964 | Trade unionist | List | Labour |
| O’Connor, Hon Damien | 1958 | Tourism operator | West Coast/Tasman | Labour |
| Okeroa, Hon Mahara | 1946 | Regional director | Te Tai Tonga | Labour |
| Paraone, Pita | 1945 | Public servant | List | NZ First |
| Parker, Hon David | 1960 | Biotechnology businessman | List | Labour |
| Peachey, Allan | 1949 | Teacher | Tamaki | National |
| Peters, Rt Hon Winston | 1945 | Lawyer | List | NZ First |
| Pettis, Jill | 1952 | Education administrator | List | Labour |
| Pillay, Lynne | 1950 | Trade unionist | Waitakere | Labour |
| Power, Simon | 1969 | Lawyer | Rangitikei | National |
| Rich, Katherine | 1967 | Businesswoman | List | National |
| Ririnui, Hon Mita | 1951 | Minister of religion | List | Labour |
| Robertson, H V Ross | 1949 | Industrial engineer | Manukau East | Labour |
| Roy, Eric | 1948 | Farmer | Invercargill | National |
| Roy, Heather | 1964 | Gallery contractor | List | ACT |
| Ryall, Hon Tony | 1964 | Accountant | Bay of Plenty | National |
| Samuels, Hon Dover | 1939 | Company director | List | Labour |
| Sharples, Dr Pita | 1941 | University lecturer | Tamaki Makaurau | Māori |
| Simich, Hon Clem | 1939 | General manager | List | National |
| Smith, Dr the Hon Lockwood | 1948 | Managing director | Rodney | National |
| Smith, Hon Dr Nick | 1964 | Engineer | Nelson | National |
| Stewart, Barbara | 1952 | Training and development manager | List | NZ First |
| Street, Maryan | 1955 | Teacher, trade unionist | List | Labour |
| Sutton, Hon Jim | 1941 | Farmer | List | Labour |
| Swain, Hon Paul | 1951 | Trade unionist | Rimutaka | Labour |
| Tanczos, Nandor3 | 1966 | Business owner/director | List | Green |
| Te Heuheu, Hon Georgina | 1942 | Consultant, advocate Treaty issues | List | National |
| Tisch, Lindsay | 1947 | Management consultant | Piako | National |
| Tizard, Hon Judith | 1956 | Electorate secretary | Auckland Central | Labour |
| Tolley, Anne | 1953 | Bed and breakfast operator | East Coast | National |
| Tremain, Chris | 1966 | Businessman | Napier | National |
| Turei, Metiria | 1970 | Lawyer | List | Green |
| Turia, Tariana | 1944 | Iwi development worker | Te Tai Hauāru | Māori |
| Turner, Judy | 1956 | Teacher | List | United Future |
| Wagner, Nicky | 1953 | Company director | List | National |
| Wilkinson, Kate | 1957 | Lawyer | List | National |
| Williamson, Hon Maurice | 1951 | Planning analyst | Pakuranga | National |
| Wilson, Hon Margaret | 1947 | University lecturer | List | Labour |
| Wong, Pansy | 1955 | Accountant | List | National |
| Woolerton, R Doug | 1944 | Farmer | List | NZ First |
| Worth, Dr Richard | 1948 | Lawyer | List | National |
| Yates, Dianne | 1943 | Education officer | List | Labour |
The executive government of New Zealand is carried out on behalf of the Sovereign (represented by the governor-general) by ministers of the Crown who make up membership of the cabinet and the Executive Council.
Ministers are responsible to parliament for their official actions by constitutional convention and are required to be Members of Parliament by the Constitution Act 1986.
After a general election, the governor-general invites the leader of the party, or parties, with the confidence of the House of Representatives to accept office as prime minister and form a government. On the new prime minister's advice, the governor-general appoints a number of Members of Parliament as ministers, generally with responsibilities for various areas of government administration (portfolios).
The governor-general may also appoint parliamentary under-secretaries, who are not ministers and not members of the Executive Council, to assist ministers.
Cabinet and the Executive Council. The cabinet and the Executive Council have separate functions. The Executive Council is a formal body with formal functions, whereas cabinet is an informal body with deliberative functions.
All ministers are members of the Executive Council, but not all ministers are necessarily in cabinet.
The cabinet is, in effect, the highest policy-making body of government. It is the main vehicle by which the executive considers major policy issues, legislative proposals and government appointments, and it coordinates the work of ministers.
The cabinet has a system of committees that can examine subjects in detail before consideration by the full cabinet.
Proceedings of cabinet are informal and confidential, and decisions are usually made by consensus. By convention, cabinet accepts collective responsibility for its decisions, which ensures that, unless the matter is agreed to be one of party differentiation, once a decision is made, it will be publicly supported by all members of the government.
The Executive Council is the main vehicle for law-making by the executive. Authority to make statutory regulations, for example, is delegated by parliament to the governor-general in council.
The governor-general presides over, but is not a member of, the Executive Council. He or she takes formal actions, such as making regulations or significant appointments, on the basis of advice tendered by ministers in Executive Council meetings.
The Cabinet Office provides support services for the cabinet and its committees.
The Secretary of the Cabinet is also Clerk of the Executive Council.
The makeup of the New Zealand Government at 3 May 2006 is shown in Table 3.07.
The cabinet of the 48th New Zealand Parliament met for the first time on 20 October 2005.
Table 3.07. New Zealand Government
3 May
2006
| Source: Cabinet Office | |
|---|---|
| Governor-General of New Zealand | |
| His Excellency The Honourable Judge Anand Satyanand, PCNZM (assumed office 4 August 2006). | |
| Executive Council | |
| Membership of the Executive Council comprises all ministers, with the governor-general presiding. | |
| The Cabinet | |
| 1 | Rt Hon Helen Clark, Prime Minister, Minister for Arts, Culture and Heritage, Minister Responsible for Ministerial Services, Minister in Charge of the New Zealand Security Intelligence Service, Minister Responsible for the Government Communications Security Bureau. |
| 2 | Hon Dr Michael Cullen, Deputy Prime Minister, Minister of Finance, Minister for Tertiary Education, Attorney-General, Leader of the House. |
| 3 | Hon Jim Anderton, Minister for Agriculture, Minister for Biosecurity, Minister of Fisheries, Minister of Forestry, Minister Responsible for the Public Trust, Associate Minister of Health, Associate Minister for Tertiary Education. |
| 4 | Hon Steve Maharey, Minister for Education, Minister of Broadcasting, Minister of Research, Science and Technology, Minister for Crown Research Institutes, Minister Responsible for the Education Review Office. |
| 5 | Hon Phil Goff, Minister of Defence, Minister for Trade Negotiations, Minister of Trade, Minister of Pacific Island Affairs, Minister for Disarmament and Arms Control, Associate Minister of Finance. |
| 6 | Hon Annette King, Minister of State Services, Minister of Police, Minister for Food Safety, Minister of Transport. |
| 7 | Hon Trevor Mallard, Minister for Economic Development, Minister for Industry and Regional Development, Minister for State Owned Enterprises, Minister for Sport and Recreation, Associate Minister of Finance, Minister for the Rugby World Cup. |
| 8 | Hon Pete Hodgson, Minister of Health. |
| 9 | Hon Parekura Horomia, Minister of Maori Affairs, Associate Minister for Social Development and Employment, Associate Minister of Education, Associate Minister of State Services, Associate Minister of Fisheries. |
| 10 | Hon Mark Burton, Minister of Justice, Minister of Local Government, Minister in Charge of Treaty of Waitangi Negotiations, Deputy Leader of the House, Minister Responsible for the Law Commission. |
| 11 | Hon Ruth Dyson, Minister of Labour, Minister for Accident Compensation Corporation, Minister for Senior Citizens, Minister for Disability Issues, Associate Minister for Social Development and Employment (CYF). |
| 12 | Hon Chris Carter, Minister of Conservation, Minister of Housing, Minister for Ethnic Affairs. |
| 13 | Hon Rick Barker, Minister of Internal Affairs, Minister of Civil Defence, Minister for Courts, Minister for Veterans’ Affairs. |
| 14 | Hon David Benson-Pope, Minister for Social Development and Employment, Minister for the Environment. |
| 15 | Hon Lianne Dalziel, Minister of Commerce, Minister of Women's Affairs, Minister for Small Business. |
| 16 | Hon Damian O’Connor, Minister of Corrections, Minister of Tourism, Minister for Rural Affairs, Associate Minister of Health. |
| 17 | Hon David Cunliffe, Minister of Immigration, Minister of Communications, Minister for Information Technology, Associate Minister for Economic Development. |
| 18 | Hon David Parker, Minister of Energy, Minister for Land Information, Minister Responsible for Climate Change Issues. |
| 19 | Hon Nanaia Mahuta, Minister of Customs, Minister of Youth Affairs, Associate Minister for the Environment, Associate Minister of Local Government. |
| 20 | Hon Clayton Cosgrove, Minister for Building Issues, Minister of Statistics, Associate Minister of Finance, Associate Minister of Immigration, Associate Minister of Justice |
| 21 | Hon Jim Sutton, Minister of State, Associate Minister for Trade Negotiations. |
| Ministers outside Cabinet: | |
| 22 | Hon Judith Tizard, Minister of Consumer Affairs, Minister Responsible for Archives New Zealand, Minister Responsible for the National Library, Associate Minister for Arts, Culture and Heritage, Associate Minister of Commerce, Associate Minister of Transport, Minister Responsible for Auckland Issues. |
| 23 | Hon Dover Samuels, Minister of State, Associate Minister for Economic Development, Associate Minister for Industry and Regional Development, Associate Minister of Housing, Associate Minister of Tourism. |
| 24 | Hon Harry Duynhoven, Minister for Transport Safety, Associate Minister of Energy. |
| 25 | Hon Mita Ririnui, Minister of State, Associate Minister of Corrections, Associate Minister in Charge of Treaty of Waitangi Negotiations, Associate Minister of Forestry, Associate Minster of Health. |
| 26 | Hon Luamanuvao Winnie Laban, Minister for the Community and Voluntary Sector, Associate Minister of Pacific Island Affairs, Associate Minister for Social Development and Employment, Associate Minister for Economic Development. |
| 27 | Hon Mahara Okeroa, Minister of State, Associate Minister for Social Development and Employment, Associate Minister for Arts, Culture and Heritage, Associate Minister of Conservation. |
| Ministers outside cabinet from other parties with confidence and supply agreements: | |
| Rt Hon Winston Peters, Minister of Foreign Affairs, Minister for Racing, Associate Minister for Senior Citizens. | |
| Hon Peter Dunne, Minister of Revenue, Associate Minister of Health. | |
People 18 years and over have the right to vote in New Zealand's parliamentary elections. Enrolment as an elector is compulsory, but voting is not. To qualify for enrolment people must:
Be at least 18 years old.
Be New Zealand citizens or permanent residents.
Have lived continuously in New Zealand for at least a year at some time.
Have lived continuously for one month or more in the electorate in which they are to be enrolled.
Māori and people of Māori descent may choose to enrol for either a Māori or a general electorate, but may make the choice at certain times only. Māori may make the choice the first time they enrol, or at the five-yearly Māori electoral option exercise. The most recent Māori option was in 2006.
Electoral rolls are maintained by the Electoral Enrolment Centre, a division of New Zealand Post.
Voting. The conduct of parliamentary elections and referendums is the responsibility of the Chief Electoral Office, a division of the Ministry of Justice. In an election year, a returning officer is appointed for each electorate. Returning officers are responsible for arranging voting facilities and staff and conducting elections in their electorates.
Only people enrolled before an election are qualified to vote. Voting is by secret ballot. Most electors cast their votes at polling places in their electorates on polling day, but they may cast a special vote at polling places outside their electorates if necessary.
Electors are able to cast their vote at an advance voting place or by post if they are unable to attend a polling place due to illness, will be travelling outside their electorate, or for religious beliefs.
Voters overseas can cast their vote by downloading their voting papers from the internet and faxing or posting them back to New Zealand.
A preliminary count of ordinary votes is available for each electorate on election night and final results are normally available a fortnight later, once special and overseas votes have been counted.
Voting patterns in recent general elections are shown in Table 3.08.
Table 3.08. Voting patterns 1981–2005
| Year | Electors on master roll | Valid votes | Informal votes | Special votes disallowed | Percentage of votes cast to electors on master roll |
|---|---|---|---|---|---|
1Party votes rather than electorate votes. 2In 1999, there were 2,047,473 valid electorate votes cast and 37,908 informal electorate votes. In 2002, there were 1,9995,586 valid electorate votes and 33,289 informal electorate votes. In 2005, there were 2,235,869 valid electorate votes cast and 24,801 informal electorate votes. 3In 2002, 15,156 special voters had both their electorate and their party vote disallowed, while 18,133 had their electorate votes disallowed but their party vote allowed because they voted in the wrong electorate. In 2005, 17,815 special voters had both their electorate and their party vote disallowed, while 25,520 had their electorate vote disallowed but their party vote allowed because they voted in the wrong electorate. Source: Chief Electoral Office, Ministry of Justice | |||||
| 1981 | 2,034,747 | 1,801,303 | 8,998 | 50,263 | 91.44 |
| 1984 | 2,111,651 | 1,929,201 | 7,565 | 42,032 | 93.71 |
| 1987 | 2,114,656 | 1,831,777 | 11,184 | 40,433 | 89.06 |
| 1990 | 2,202,157 | 1,824,092 | 10,180 | 42,843 | 85.24 |
| 1993 | 2,321,664 | 1,922,796 | 11,364 | 43,932 | 85.20 |
| 1996 | 2,418,587 | 2,072,3591 | 8,1831 | 54,633 | 88.28 |
| 1999 | 2,509,365 | 2,065,4941,2 | 19,8871,2 | 41,884 | 84.77 |
| 2002 | 2,670,030 | 2,031,6171,2 | 8,6311,2 | 15,1563 | 76.98 |
| 2005 | 2,847,396 | 2,275,6291,2 | 10,5611,2 | 17,8153 | 80.92 |
The boundaries of electorates are revised every five years after the Census of Population and Dwellings, and the new boundaries come into effect at the expiry of the parliamentary term during which the revision is finalised.
The revision is based on electoral population figures provided by Statistics New Zealand.
Electoral boundaries are defined by the Representation Commission, which consists of a chairperson, four officials (the Surveyor-General, the Government Statistician, the Chief Electoral Officer and the Chairman of the Local Government Commission) and two members nominated by parliament to represent the government and the opposition.
When determining boundaries of Māori electoral districts, the commission is joined by the Chief Executive Officer of Te Puni Kōkiri and two Māori representatives nominated by parliament to represent the government and the opposition.
After proposed boundaries have been drawn up and published, objections and counter-objections are considered by the commission, which makes a final decision.
Under the Electoral Act 1993, the South Island is allocated 16 general electorates. The number of North Island general and Māori electorates is then calculated so that their electoral populations are approximately the same as those for South Island general electorates.
The commission is also required to give consideration to community of interest, communication facilities, topographical features and any projected variation in the general electoral population of the electorates.
Based on the South Island general electoral population, the South Island general electorate quota for the 2005 general election was 54,296, resulting in 46 North Island general electorates (quota 54,288) and seven Māori electorates (quota 53,130).
All electorates have an allowance of 5 percent above or below their electoral population quota.
Figures 3.01 and 3.02 show general and Māori electoral districts for the 2005 general elections.
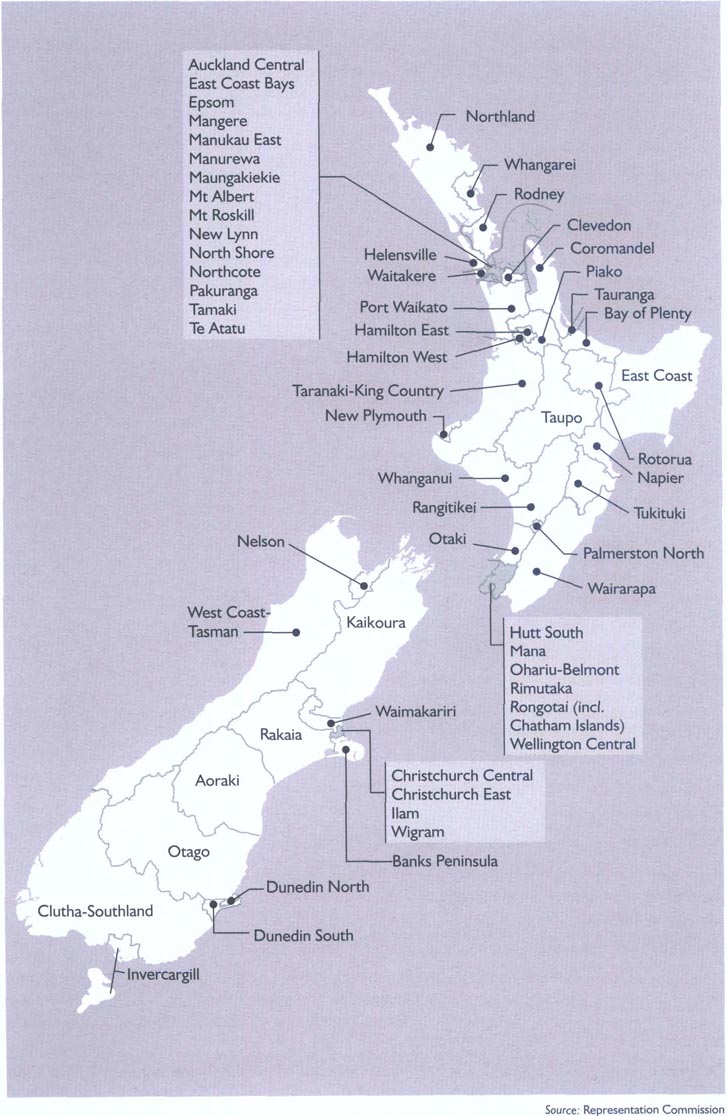
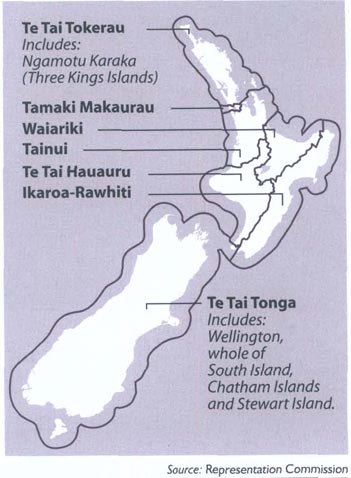
General election voting. There were 2,847,396 electors on the master roll for the 2005 general election. A total of 2,304,005 votes were cast, representing a turnout of 80.92 percent. This was an increase of 5.12 percent on the 2002 election, where turnout was 76.98 percent. The highest turnout in recent elections was 93.71 percent in 1984. Figure 3.03 shows the percentage of enrolled voters voting in general elections from 1879 to 2005.
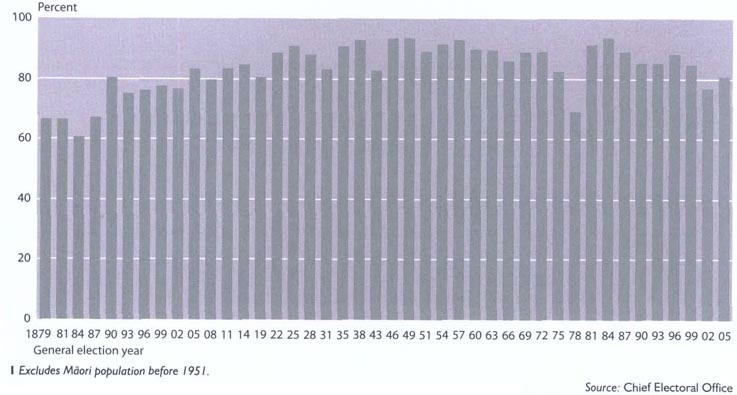
State sector is the common term for all organisations whose financial situation and performance is reported in the annual financial statements of the government prepared under the Public Finance Act 1989.
The state sector includes all state services – Crown-owned agencies through which executive government carries out many of its roles and functions.
State services consist of all public service departments; other departments not part of the public service; Crown entities (except tertiary education institutions); organisations listed in the Fourth Schedule to the Public Finance Act 1989 (see below); and the Reserve Bank of New Zealand.
In addition to state services, the state sector includes tertiary education institutions, offices of parliament, state-owned enterprises and some departments not part of the state services.
The various agencies are listed below:
State services
Public service departments – Departments listed in the First Schedule to the State Sector Act 1988 make up the New Zealand Public Service. At 30 November 2005, there were 35 public service departments (‘departments’ in terms of the act irrespective of their individual designation as a ‘department’, a ‘ministry’ or any other title):
Ministry of Agriculture and Forestry – www.maf.govt.nz
Archives New Zealand – www.archives.govt.nz
Department of Building and Housing – www.dbh.govt.nz
Department of Child, Youth and Family Services – www.cyf.govt.nz
Department of Conservation – www.doc.govt.nz
Department of Corrections – www.corrections.govt.nz
Crown Law Office – www.crownlaw.govt.nz
Ministry for Culture and Heritage – www.mch.govt.nz
New Zealand Customs Service – www.customs.govt.nz
Ministry of Defence – www.defence.govt.nz
Ministry of Economic Development – www.med.govt.nz
Ministry of Education – www.minedu.govt.nz
Education Review Office – www.ero.govt.nz
Ministry for the Environment – www.mfe.govt.nz
Ministry of Fisheries – www.fish.govt.nz
Ministry of Foreign Affairs and Trade – www.mfat.govt.nz
Government Communications Security Bureau – www.gcsb.govt.nz
Ministry of Health – www.moh.govt.nz
Inland Revenue Department – www.ird.govt.nz
Department of Internal Affairs – www.dia.govt.nz
Ministry of Justice – www.justice.govt.nz
Department of Labour – www.dol.govt.nz
Land Information New Zealand – www.linz.govt.nz
Ministry of Maori Development – www.tpk.govt.nz
National Library of New Zealand – www.natlib.govt.nz
Ministry of Pacific Island Affairs – www.minpac.govt.nz
Department of the Prime Minister and Cabinet – www.dpmc.govt.nz
Ministry of Research, Science and Technology – www.morst.govt.nz
Serious Fraud Office – www.sfo.govt.nz
Ministry of Social Development – www.msd.govt.nz
State Services Commission – www.ssc.govt.nz
Statistics New Zealand – www.stats.govt.nz
Ministry of Transport – www.transport.govt.nz
The Treasury – www.treasury.govt.nz
Ministry of Women's Affairs – www.mwa.govt.nz
At 30 June 2005, the number of staff (calculated on a full-time equivalent basis) employed in public service departments was 38,032, compared with 33,129 at 30 June 2003 and 30,355 at 30 June 2001. When reform of the state sector began in the 1980s, about 70,000 people were permanent employees in government departments. Many jobs in government departments have shifted to Crown entities, state-owned enterprises or the private sector. The public service today is characterised by relatively small departments, which have defined roles in policy advice, service delivery, regulatory or sectoral funding functions. Some bigger departments perform a combination of roles.
Non public service departments – A small number of agencies are departments in terms of the Public Finance Act 1989, but are not listed in the First Schedule to the State Sector Act 1988 and, consequently, are not part of the public service. At 30 November 2005, there were four such departments:
New Zealand Defence Force – www.nzdf.mil.nz
New Zealand Police – www.police.govt.nz
New Zealand Security Intelligence Service – www.nzsis.govt.nz
Parliamentary Counsel Office – www.pco.parliament.govt.nz
Crown entities – These are organisations included in one of the five categories of Crown entities defined in Section 7 of the Crown Entities Act 2004:
Statutory entities (further subdivided into Crown agents, autonomous Crown entities and independent Crown entities).
Crown entity companies.
Crown entity subsidiaries.
School boards of trustees.
Tertiary education institutions.
Crown entities make up a significant part of the state services and include a wide variety of statutory corporations, statutory boards and authorities, corporations sole, Crown companies and subsidiaries. The Crown Entities Act 2004 establishes comprehensive provisions for establishment and accountability of Crown entities, their operations and reporting and financial obligations. At 30 November 2005, Crown entities in the state services included:
Eighty-three statutory entities.
Forty-six Crown agents, including 21 district health boards.
Twenty-two autonomous Crown entities.
Fifteen independent Crown entities.
Twelve Crown entity companies, including nine Crown Research Institutes.
Approximately 135 Crown entity subsidiaries.
Approximately 2,470 school boards of trustees.
Organisations listed in the Fourth Schedule to the Public Finance Act 1989 – These are agencies included in state services for which the full governance, accountability and reporting obligations of the Crown Entities Act 2004 would not be suitable. They include reserves boards, fish and game councils, a small number of trusts and other organisations.
Reserve Bank of New Zealand – The bank is a stand-alone organisation included in the state services. It does not come under any other specific category or type of organisation within the state services.
State sector
In addition to all state services, the state sector covers the following agencies that are also part of the government reporting entity under the Public Finance Act 1989:
Non public service departments – Two departments are considered outside the state services because their roles are supportive of the legislative branch of government, rather than executive government.
They are part of the state sector as departments under the Public Finance Act 1989:
Office of the Clerk of the House of Representatives – www.clerk.parliament.govt.nz
Parliamentary Services – www.ps.parliament.govt.nz
Tertiary education institutions – These institutions are one of the five categories of Crown entities defined in the Crown Entities Act 2004, but are explicitly excluded from the definition of state services in the State Sector Act 1988. At 30 November 2005, there were 33 such institutions comprising eight universities, 20 polytechnics/institutes of technology, two colleges of education and three wānanga.
Offices of parliament – The Office of the Ombudsmen, the Office of the Controller and Auditor-General and the Office of the Parliamentary Commissioner for the Environment are not part of the executive branch of the government, as their primary function is to provide a check on the executive's use of power and resources. In doing so, they perform functions that the House of Representatives itself could carry out if it so wished.
State-owned enterprises – These are companies listed in the First Schedule to the State-Owned Enterprises Act 1986 that operate on commercial lines and that are companies under the Companies Act 1993. Their objective is to be as profitable and as efficient as comparable businesses that are not owned by the Crown, and to exhibit a sense of social responsibility. The government may purchase services from SOEs, but generally will do so on the same basis as other purchasers. The government's interest in SOEs is substantially in their ownership. The government's interest in SOEs is supported by the Crown Company Monitoring Advisory Unit, a unit attached to the Treasury. At 30 November 2005, there were 18 state-owned enterprises:
Agriquality New Zealand Limited – www.agriquality.com
Airways Corporation of New Zealand Limited – www.airways.co.nz
Animal Control Products Limited – www.pestoff.co.nz
Asure New Zealand Limited – www.asure.co.nz
Electricity Corporation of New Zealand Limited – www.ecnz.co.nz
Genesis Power Limited – www.genesispower.co.nz
Landcorp Farming Limited – www.landcorp.co.nz
Learning Media Limited – www.learningmedia.co.nz
Meridian Energy Limited – www.meridianenergy.co.nz
Meteorological Service of New Zealand – www.metservice.co.nz
Mighty River Power Limited – www.mightyriverpower.co.nz
New Zealand Post Limited – www.nzpost.co.nz
New Zealand Railways Corporation – www.nzrailcorp.co.nz
Quotable Value Limited – www.quotable.co.nz
Solid Energy New Zealand Limited – www.solidenergy.co.nz
Timberlands West Coast Limited – www.timberlands.co.nz
Transmission Holdings Limited
Transpower New Zealand Limited – www.transpower.co.nz
Air New Zealand Limited is also included in the annual financial statements of the government for disclosure purposes as if it were a state-owned enterprise.
The Office of State Services Commissioner is central to New Zealand's politically neutral permanent public service.
The commissioner has two separate roles. As holder of a statutory office, the commissioner acts independently in a range of matters concerning operation of the public service, state services and the wider state sector. As Chief Executive of the State Services Commission, the commissioner is also responsible to the Minister of State Services for the commission's capability and performance.
The commissioner is appointed by the governor-general on the recommendation of the prime minister.
The Office of State Services Commissioner descends directly from the Public Service Commission, established in 1912 to employ all public servants, thus protecting the public service from political interference and preserving its political neutrality. The commissioner no longer employs all public servants, but in his employment of chief executives of public service departments, he continues to act as a buffer between ministers and the public service.
In addition to employing public service chief executives and reviewing their performance, the commissioner undertakes a variety of functions relating to departmental performance.
Other responsibilities of the commissioner in relation to the wider state sector include:
Promoting and developing policies and standards for personnel administration and equal employment opportunities in the public service.
Promoting and developing senior leadership and management capability in the public service.
Providing advice on management systems, structures and organisations within the public service and Crown entities.
Setting minimum standards of integrity and conduct for the public service, most Crown entities and some other agencies.
Advising the government on the structure of the state sector, including allocation of functions among agencies.
Negotiating collective employment agreements applicable to employees of government departments and to employees of the education service. These responsibilities have been delegated by the commissioner to departmental chief executives and to the Chief Executive of the Ministry of Education.
The State Services Commission, with the support of other central agencies and the government, launched Development Goals for New Zealand's State Services in March 2005. The goals were developed following passage of new state sector legislation and focus on performance and quality within the state services as a whole. The commission is responsible for driving the goals’ work programmes. Table 3.09 lists chief executives of government departments at 1 April 2006.
Table 3.09. Chief executives of government departments1
| Department | Title | Name |
|---|---|---|
1As at 1 April 2006 Source: State Services Commission | ||
| Ministry of Agriculture and Forestry | Chief Executive and Director-General | Murray Sherwin |
| Archives New Zealand | Chief Archivist and Chief Executive. | Dianne Macaskill |
| Department of Building and Housing | Chief Executive | Katrina Bach |
| Department of Child, Youth and Family Services | Chief Executive | Paula Tyler |
| Department of Conservation | Director-General and Chief Executive | Hugh Logan |
| Department of Corrections | Chief Executive | Barry Matthews |
| Crown Law Office | Solicitor-General and Chief Executive | Terence Arnold QC |
| Ministry for Culture and Heritage | Chief Executive | Martin Matthews |
| Ministry of Defence | Secretary of Defence and Chief Executive | Graham Fortune |
| Ministry of Economic Development | Chief Executive | Geoff Dangerfield |
| Ministry of Education | Secretary of Education and Chief Executive | Howard Fancy |
| Education Review Office | Chief Review Officer and Chief Executive | Karen Sewell |
| Ministry for the Environment | Secretary for the Environment and Chief Executive | Barry Carbon |
| Ministry of Fisheries | Chief Executive | Dr John Glaister |
| Ministry of Foreign Affairs and Trade | Secretary of Foreign Affairs and Trade and Chief Executive | Simon Murdoch |
| Government Communications Security Bureau | Director | Dr Warren Tucker |
| Ministry of Health | Director-General and Chief Executive | Dr Karen Poutasi |
| Inland Revenue Department | Commissioner of Inland Revenue and Chief Executive | David Butler |
| Department of Internal Affairs | Secretary for Internal Affairs and Chief Executive | Christopher Blake |
| Ministry of Justice | Secretary of Justice and Chief Executive | Belinda Clark |
| Department of Labour | Secretary of Labour and Chief Executive | Dr James Buwalda |
| Land Information NZ | Chief Executive | Brendan Boyle |
| Ministry of Māori Development Te Puni Kōkiri | Chief Executive | Leith Comer |
| National Library | Chief Executive | Penny Carnaby |
| New Zealand Customs Service | Comptroller and Chief Executive | Martyn Dunne |
| Ministry of Pacific Island Affairs | Chief Executive | Fuimaono Les McCarthy |
| Department of Prime Minister and Cabinet. | Chief Executive | Maarten Wevers |
| Ministry of Research, Science and Technology | Chief Executive | Dr Helen Anderson |
| Serious Fraud Office | Director and Chief Executive | David Bradshaw |
| Ministry of Social Development | Chief Executive | Peter Hughes |
| State Services Commission | State Services Commissioner | Dr Mark Prebble |
| Statistics New Zealand | Government Statistician and Chief Executive | Brian Pink |
| Ministry of Transport | Secretary of Transport and Chief Executive | Dr Robin Dunlop |
| The Treasury | Secretary to the Treasury and Chief Executive | John Whitehead |
| Ministry of Women's Affairs | Acting Chief Executive | Shenagh Gleisner |
The increasing number and diversity of limited liability companies owned by the Crown led to establishment of the Crown Company Monitoring Advisory Unit (CCMAU) in 1993 to monitor the performance of these entities.
CCMAU advises and supports primarily the Minister for State-owned Enterprises and the Minister for Crown Research Institutes. Shareholding ministers of other Crown companies (such as Television New Zealand Ltd, Radio New Zealand Ltd, Animal Control Products Ltd and three airport companies) also receive advice from the unit in its role as monitor of the Crown's ownership interest.
Advice to another shareholding minister, the Minister of Finance, is provided by the Treasury directly, while the Treasury and CCMAU also prepare joint reports for shareholding ministers.
One of CCMAU's chief functions is provision of advice on development of corporate intent targets and monitoring performance of Crown companies against those targets. Other functions include provision of advice on company restructuring, expansion, diversification and divestment plans; management of ownership issues; and identification of prospective directors and advice on director remuneration.
The unit, while independent for advice purposes, is attached to the Treasury for administrative purposes.
The Controller and Auditor-General is an officer of parliament appointed by the governor-general under the Public Audit Act 2001. The position is independent of the executive government and only the governor-general, upon an address from the House of Representatives, can end tenure.
The constitutionally important ‘controller’ function, as set out in the Public Finance Act 1989, is to act as a monitor on behalf of parliament and to control issues of money from the Crown bank account. The auditor-general has to be satisfied that all issues from the account for the government's expenditure requirements are within appropriations and other authorities granted by parliament. This role is crucial to the ability of parliament to control the supply of funds to the Crown.
In certain circumstances, the auditor-general may prevent the issue of money.
The auditor-general audits the financial statements of government departments, local authorities and most government-controlled corporations, boards and companies, and plays a key part in ensuring adequate accountability by these organisations.
The auditor-general also conducts periodic performance audits to ascertain whether public entities are carrying out their activities effectively and efficiently and are complying with their statutory obligations.
If shortcomings are discovered during an audit, the principal recourse of the auditor-general is to report to the management of the organisation, to a minister, or to parliament and its select committees.
The Official Information Act 1982 is based on the principle that information should be made available unless there is good reason for withholding it. The purposes of the act are to:
Increase availability of official information to the people of New Zealand.
Provide for proper access by bodies corporate to official information relating to themselves (access by individuals to their information is now governed by the Privacy Act 1993).
Protect official information consistent with the public interest and preservation of individual privacy.
With the exception of the Parliamentary Counsel Service, the Official Information Act 1982 covers all government departments, state-owned enterprises and a range of statutory bodies. It does not include courts, tribunals (in relation to their judicial function) or some judicial bodies.
All local authorities and statutory boards are covered under either the Official Information Act 1982 or the Local Government Official Information and Meetings Act 1987.
These acts provide special rights of access by bodies corporate to personal information about themselves.
Requests for access to official information can be made by a corporation sole and by a body of people, whether corporate or not. Protection of the privacy of natural persons may be overturned if it is in the public interest to make information available.
Among criteria to be considered when judging whether information should be withheld are whether, if the information were released, it would prejudice the security, defence or economic international relations of New Zealand; the maintenance of law and order; the effective conduct of public affairs; trade secrets and commercial sensitivity; personal privacy and the safety of any person.
Ombudsmen can review a decision to refuse to release information. This investigation is private and free. The formal recommendation of an ombudsman is binding unless overridden by the governor-general by order-in-council.
The principal function of ombudsmen is to enquire into complaints relating to administrative decisions of government departments and related organisations, hospitals and health authorities.
Under the Ombudsmen Act 1975, there is provision for the appointment of a Chief Ombudsman and one or more ombudsmen in temporary or permanent positions as independent officers of parliament.
All investigations undertaken by ombudsmen are conducted in private. When an ombudsman believes a complaint can be sustained, his opinion is reported to the government department or organisation concerned, along with any recommendation for action. A copy of this report is made available to the responsible minister.
At the local government level, the ombudsman reports his finding to the organisation and provides a copy to the mayor or chairperson.
Ombudsmen also investigate recommendations made to ministers by government departments, organisations or employees. Similarly, they look into recommendations made to local body councils or boards by any committee, subcommittee, officer, employee or member.
Ombudsmen are also responsible for investigating complaints about decisions for the request of official information.
Under the Protected Disclosures Act 2000, ombudsmen can provide guidance and information to employees who have made, or who are considering making, a protected disclosure pursuant to the act, and they fulfil the ‘appropriate authority’ requirements of the act.
Ombudsmen have no authority to investigate complaints against private companies and individuals, decisions of judges, complaints directed at ministerial decisions, or at the full council of local government. They can also decide that certain complaints, although within their sphere, are better suited to other avenues of administrative redress.
Table 3.10 details complaints to the ombudsmen for the year ending 30 June 2005.
Table 3.1. Complaints to the ombudsmen
Year
ending 30 June 2005
| Action | Ombudsmen Act 1975 | Official Information Act 1982 | Local Government Official Information and Meetings Act 1987 |
|---|---|---|---|
– nil or zero Source: Office of the Ombudsmen | |||
| Declined, no jurisdiction | 42 | 3 | 1 |
| Declined or discontinued (section 17) | 434 | 49 | 29 |
| Resolved in course of investigation | 158 | 173 | 31 |
| Sustained, recommendation made | 4 | 1 | – |
| Sustained, no recommendation made | 14 | 2 | – |
| Not sustained | 72 | 112 | 13 |
| Formal investigation not undertaken, but explanation, advice or assistance given | 3,862 | 348 | 72 |
| Complaints transferred to | |||
| Privacy Commissioner | 10 | 27 | 2 |
| Health and Disability Commissioner | 1 | – | – |
| Police Complaints Authority | 9 | – | – |
| Still under investigation at 30 June | 491 | 207 | 42 |
| Total | 5,097 | 922 | 190 |
| Total 2004 | 4,220 | 973 | 194 |
The Office of the Privacy Commissioner Te Mana Matapono Matatapu, whose functions are set out in the Privacy Act 1993, is independent of the executive and of parliament. One of the main purposes of the office is to promote and protect individual privacy.
The act establishes 12 information privacy principles and four public register privacy principles. The principles apply to both public and private sectors and are subject to other laws.
Information privacy principles cover collection, security, use and disclosure of personal information, access to and correction of personal information, and assignment and use of unique identifiers.
Public register privacy principles place some controls on the availability of public register information and its subsequent use.
The privacy commissioner performs a general watchdog role over privacy, making public statements and reporting on a range of issues affecting individual privacy. The commissioner examines new legislation and appears before parliamentary select committees considering bills.
The privacy commissioner has the power to issue codes of practice which may modify privacy principles by setting different standards. Codes replace the principles in particular contexts. Two major industry codes issued by the commissioner are the Health Information Privacy Code 1994 and the Credit Reporting Privacy Code 2004.
The commissioner oversees the operation of statutory information-matching programmes in the public sector. Information matching is the process by which government agencies compare databases of personal records to establish, for example, entitlement to services, or instances of benefit fraud. The act requires that an affected individual be given notice before adverse action is taken as a result of a match.
The Office of the Privacy Commissioner investigates complaints about breaches of privacy. The investigation process emphasises low-level dispute resolution and conciliation between parties. If a complaint cannot be settled, the commissioner may refer it to the Director of Human Rights Proceedings, who may bring proceedings before the Human Rights Review Tribunal. Alternatively, aggrieved people may bring proceedings on their own behalf before the tribunal. The tribunal has the power to award remedies, including declarations, orders, damages and costs. In the year ending 30 June 2005, the privacy commissioner referred 13 complaints to the Director of Human Rights Proceedings.
The Official Information Act 1982 and the Local Government Official Information and Meetings Act 1987 require the ombudsmen to consult with the commissioner on official information access requests where privacy is a possible ground for withholding information. In the year ending 30 June 2005, 43 formal consultations under the two acts were completed.
The Office of the Privacy Commissioner's website is www.privacy.org.nz
Table 3.11 details complaints made to the privacy commissioner in recent years.
Table 3.11. Complaints to the privacy commissioner
Years ending 30 June
| 2001 | 2002 | 2003 | 2004 | 2005 | |
|---|---|---|---|---|---|
| Source: Office of the Privacy Commissioner | |||||
| New complaints received | 881 | 1,044 | 928 | 934 | 721 |
| Complaints current at start of year | 966 | 1,041 | 1,039 | 1,052 | 818 |
| Number of complaints under process | 1,847 | 2,085 | 1,967 | 1,986 | 1,539 |
| Number of complaints closed during year | 806 | 1,049 | 915 | 1,168 | 970 |
| No jurisdiction | 36 | 16 | 23 | 56 | 40 |
| Complaints resolved without final opinion | 654 | 901 | 747 | 848 | 683 |
| Final opinion | 116 | 132 | 145 | 264 | 247 |
The Human Rights Act 1993 makes it unlawful to discriminate in employment; access to places, vehicles and facilities; provision of goods and services; provision of land, housing and other accommodation; and access to education. Other forms of discrimination made unlawful by the act include racial disharmony, racial harassment, sexual harassment and victimisation. Both the public and private sectors are subject to the act.
There are 13 prohibited grounds of discrimination – sex, marital status, religious belief, ethical belief, colour, race, ethnic or national origins, disability, age, political opinion, employment status, family status and sexual orientation.
The act also defines a number of circumstances where discrimination is not unlawful. These exemptions allow a practice to occur that would normally be discriminatory.
The Human Rights Commission, which from 2002 has included the former Office of the Race Relations Conciliator, is an independent Crown entity. Its primary functions are to:
Advocate and promote respect for, and an understanding and appreciation of, human rights.
Encourage maintenance and development of harmonious relations between individuals and among the diverse groups in New Zealand society.
Mediate disputes relating to unlawful discrimination.
The commission has developed a National Plan of Action for Human Rights and also promotes a better understanding of the human rights aspects of the Treaty of Waitangi and their relationship with domestic and international human rights law.
All human rights complaints regarding government activities – other than employment and sexual and racial harassment – are tested against the anti-discrimination standard set out in the act, which provides that government or public sector activities that discriminate will be exempt if they are reasonable, lawful and demonstrably justifiable in a free and democratic society.
The commission acts as first port-of-call for those who wish to make a discrimination complaint, and assists parties to resolve complaints using either mediation or other low-level means of resolving disputes.
Commission staff work with parties to try to reach a settlement, which may include an apology, an agreement not to discriminate in the future and/or compensation.
If lower level dispute resolution is not appropriate or possible, a complainant may approach the Director of Human Rights Proceedings for possible litigation assistance. Complainants may also take their own litigation or engage their own legal counsel and bring their case to the Human Rights Review Tribunal.
If the tribunal upholds a complaint, a wide range of remedies is available, such as damages and orders of specific performance.
When a complaint concerns legislation or validly-made regulations, and the complaint is upheld, the sole remedy available is a declaration of inconsistency. While this does not invalidate the legislation, the responsible minister is required to bring the tribunal's declaration to the attention of the House of Representatives, along with the executive's response.
There are appeal rights from the tribunal to the High Court.
The Parliamentary Commissioner for the Environment (PCE) is an independent officer of parliament with wide-ranging powers to investigate environmental concerns. The PCE's main aim is to maintain and improve the quality of New Zealand's environment, with the central focus on environmental sustainability – how New Zealand can live within the ecological limits of the planet today and into the future.
The office has five key roles:
Checking the integrity of environmental management regimes.
Auditing the environmental performance of public agencies.
Providing information about the environment to groups and individuals.
Offering information and advice to parliamentary select committees.
Advocating for preventative measures and remedial actions to protect the environment.
The commissioner has powers to investigate and report on any matter where the environment may be, or has been, adversely affected. However, he does not have the power to make any binding rulings and nor can he reverse decisions made by public authorities.
The commissioner's strategic plan for 2003–2007 focuses on three broad areas: legislation and policies that impact on environmental sustainability; ecosystems at risk; and the environmental performance of public authorities.
Major reports in 2004/05 included Growing for Good, on intensive farming and New Zealand's natural capital; Missing Links, on connecting science with environmental policy; and Future Currents, which outlines electricity scenarios for New Zealand 2005–2050. Subjects of current investigation include transport, coastal waters and estuaries, the future of wind power, and distributed energy from dispersed and local sources.
In the year ending 30 June 2005, the PCE responded to 223 requests for information and advice, or to issues of concern raised by individuals and groups.
The Parliamentary Commissioner for the Environment website is www.pce.govt.nz
Table 3.12 lists reports and papers produced by the commissioner since 2000.
Table 3.12. Reports and papers by the Parliamentary Commissioner for the
Environment
Years ending 30
June
| 2000 | 2001 | 2002 | 2003 | 2004 | 2005 | |
|---|---|---|---|---|---|---|
| Source: Parliamentary Commissioner for the Environment | ||||||
| Investigation reports | 32 | 37 | 35 | 81 | 90 | 92 |
| Information transfer papers or presentations | 242 | 291 | 189 | 147 | 185 | 155 |
| Total | 274 | 328 | 224 | 228 | 275 | 247 |
Public Trust, the first organisation of its kind in the world, was launched in 1873 by an act of parliament to provide New Zealanders with the opportunity of writing a will, thereby decreasing the number of intestacies, and to provide executor and trustee services.
Before its inception, problems had arisen with unscrupulous individuals cheating beneficiaries out of their inheritances.
The Public Trust Act 2001 constituted Public Trust as a statutory corporation and Crown entity with effect from 1 March 2002. It is the statutory successor to the former corporation sole, the Public Trustee and the former government department, the Public Trust Office. Public Trust is subject to the accountability and reporting arrangements applicable to statutory entities under the Crown Entities Act 2004.
Public Trust is owned by the Crown and is governed by a board accountable to the Minister Responsible for Public Trust and, in addition in respect of certain matters, to the Minister of Finance. The board appoints the chief executive.
Principal function of Public Trust is provision of comprehensive estate management and administration services, including associated legal, financial and other services. In addition, Public Trust performs a range of public and social functions under other legislation, or as agreed with the minister.
Private trust management and administration services provided by Public Trust include estates of people who die with or without leaving a will; affairs of living people either on a voluntary basis or as a result of incapacity; a wide range of family and charitable trusts; and associated activities such as preparation of wills, trust instruments, tax returns and undertaking conveyancing transactions.
Corporate trust management and administration services provided by Public Trust include acting as trustee for unit trusts, group investment or superannuation funds; as supervisor required under securities or other legislation in respect of publicly offered or available securities; and a range of other public fiduciary, stakeholder or custodial roles.
Public Trust acts independently in respect of all client matters. Its governing legislation requires that when managing and administering estates and in fulfilling any other fiduciary obligations, it act in an independent manner, free from any instruction or direction from its owner, the Crown.
With 36 full-time outlets throughout New Zealand, Public Trust administers about 50,000 estates, trusts, funds and agencies. In its private trust roles, Public Trust manages approximately $2 billion worth of assets, of which $1 billion are wholesale funds and the remainder direct investments, including residential property.
In its corporate trust roles, Public Trust has a supervisory or trustee responsibility in relation to approximately $11 billion worth of assets. Public Trust also holds the statutorily-required deposits of insurance companies.
Most Public Trust activities are commercial in nature, but it is also required to provide a number of statutory services that may not be income earning. These are of a regulatory, quasi-judicial, trustee of last resort, trustee-guardian or representative (in the case of legal incapacity) nature. Non-commercial services undertaken at the request of the minister are funded by the Crown.
New Zealand has a system of local government largely independent of central government. The system has, however, a subordinate role in the constitution, as the powers of local authorities are only those conferred by parliament.
Local authorities fall into three categories – regional, territorial and special purpose authorities.
Many territorial authorities contain one or more communities administered by community boards, but these are not separate local authorities.
Boundaries of regions, cities and districts are usually defined by the Local Government Commission or the Minister of Local Government
Six special purpose authorities are constituted under their own acts.
Local authorities have their own sources of income, independent of central government, with the basic source (apart from income from trading activities) local taxes on landed property (rates). Rates are set by local authorities themselves, subject to the Local Government (Rating) Act 2002.
Several important statutes apply not only to local authorities as defined in the Local Government Act 2002, but to a wider range of public bodies. These include the Local Government Official Information and Meetings Act 1987, the Local Authorities (Members’ Interests) Act 1968 and the Local Electoral Act 2001.
Local authorities derive their functions and powers not only from local government legislation, but from numerous other acts, such as the Resource Management Act 1991, the Transit New Zealand Act 1989 and the Building Act 2004.
Under parliamentary standing orders, local authorities can promote legislation about matters affecting areas within their jurisdiction which they are not empowered to deal with already. When permanent or major additional powers are sought, a local bill must be prepared for the consideration of parliament. If this is enacted, it becomes a local act, and applies only to the body or bodies which promoted it.
Local authorities are answerable to their electorates through triennial local elections.
Legislation includes numerous provisions for local authorities to give public notice and receive public submissions before making certain important decisions. Local authorities may also come under the scrutiny of ombudsmen, the Controller and Auditor-General and the Parliamentary Commissioner for the Environment. Any decision by a local authority may be reviewed by appeal to the High Court, and decisions under the Resource Management Act 1991 may be appealed to the Environment Court.
The Minister of Local Government may appoint a review authority when it is considered there has been serious mismanagement by a local authority and may require the local authority to implement the review authority's recommendations.
New Zealand has 12 regional councils, 73 territorial authorities, 144 community boards and six special authorities.
The Local Government Act 2002 holds as central recognition of the existence of different communities in New Zealand, their separate identities and values, and the effective participation of local people in local government.
Local authorities are required by statute to conduct their affairs in an open and proper manner, to separate their regulatory and non-regulatory activities and to adequately inform local communities of their activities. Emphasis is placed on setting objectives and measuring performance.
Local authorities are permitted to corporatise or privatise their trading activities and may put out the delivery of services to competitive tender as an alternative to using in-house business units.
Table 3.13 lists regional councils, territorial authorities and numbers of councillors.
Table 3.13. Territorial authorities and councillors
| Cities/district | Number of councillors1 | Council type |
|---|---|---|
1Figures include mayors. 2Unitary authority (city or district council and regional council responsibilities). 3Trading name of Manawatu/Wanganui Regional Council. Source: Local Government New Zealand | ||
| Ashburton | 13 | District |
| Auckland | 20 | City |
| Auckland | 13 | Regional |
| Buller | 12 | District |
| Carterton | 9 | District |
| Central Hawke's Bay | 11 | District |
| Central Otago | 14 | District |
| Chatham Islands | 9 | Council |
| Christchurch | 25 | City |
| Clutha | 15 | District |
| Dunedin | 15 | City |
| Environment Bay of Plenty | 12 | Regional |
| Environment Canterbury | 14 | Regional |
| Environment Southland | 9 | Regional |
| Environment Waikato | 14 | Regional |
| Far North | 11 | District |
| Franklin | 15 | District |
| Gisborne1 | 15 | District |
| Gore | 12 | District |
| Greater Wellington | 13 | Regional |
| Grey | 9 | District |
| Hamilton | 14 | City |
| Hastings | 16 | District |
| Hauraki | 14 | District |
| Hawke's Bay | 9 | Regional |
| Horizons3 | 11 | Regional |
| Horowhenua | 11 | District |
| Hurunui | 10 | District |
| Hutt City | 12 | City |
| Invercargill | 13 | City |
| Kaikoura | 8 | District |
| Kaipara | 11 | District |
| Kapiti Coast | 15 | District |
| Kawerau | 9 | District |
| Mackenzie | 11 | District |
| Manawatu | 11 | District |
| Manukau | 21 | City |
| Marlborough2 | 13 | District |
| Masterton | 11 | District |
| Matamata-Piako | 12 | District |
| Napier | 13 | City |
| Nelson2 | 13 | City |
| New Plymouth | 17 | District |
| Cities/districts | Number of councillors1 | Council type |
| Northland | 8 | Regional |
| North Shore | 16 | City |
| Opotiki | 11 | District |
| Otago | 12 | Regional |
| Otorohanga | 8 | District |
| Palmerston North | 16 | City |
| Papakura | 9 | District |
| Porirua | 14 | City |
| Queenstown-Lakes | 12 | District |
| Rangitikei | 12 | District |
| Rodney | 13 | District |
| Rotorua | 13 | District |
| Ruapehu | 12 | District |
| Selwyn | 12 | District |
| South Taranaki | 13 | District |
| South Waikato | 11 | District |
| South Wairarapa | 10 | District |
| Southland | 13 | District |
| Stratford | 11 | District |
| Taranaki | 10 | Regional |
| Tararua | 9 | District |
| Tasman2 | 14 | District |
| Taupo | 13 | District |
| Tauranga | 14 | City |
| Thames-Coromandel | 10 | District |
| Timaru | 13 | District |
| Upper Hutt | 11 | City |
| Waikato | 15 | District |
| Waimakariri | 15 | District |
| Waimate | 9 | District |
| Waipa | 13 | District |
| Wairoa | 10 | District |
| Waitakere | 15 | City |
| Waitaki | 16 | District |
| Waitomo | 11 | District |
| Wanganui | 13 | District |
| Wellington | 20 | City |
| West Coast | 6 | Regional |
| Western Bay of Plenty | 13 | District |
| Westland | 13 | District |
| Whakatane | 14 | District |
| Whangarei | 14 | District |
Regional councils. Regional councils are directly elected, set their own rates and have a chairperson elected by their members. Their main functions are matters under the Resource Management Act 1991 and the Soil Conservation and Rivers Control Act; the control of pests and noxious plants; harbour regulations and marine pollution control; regional aspects of civil defence; an overview of transport planning; and control of passenger transport operators. Some regional councils also have other functions, such as those formerly undertaken by land drainage boards.
Territorial authorities. New Zealand's 73 territorial authorities consist of 16 city councils, 56 district councils and the Chatham Islands Council. Territorial authorities are directly elected, set their own rates and have a mayor elected by the people. They have a wide range of functions, including land use consents under the Resource Management Act 1991; noise and litter control; roading; water supply; sewage reticulation and disposal; rubbish collection and disposal; parks and reserves; libraries; land subdivision; pensioner housing; health inspection; liquor licensing; building consents; parking controls; and civil defence. New cities can either be constituted by Order in Council giving effect to a determination of the Local Government Commission, or be constituted by a reorganisation scheme, where a new district is formed and that district has a population of at least 50,000, is predominantly urban, is a distinct entity and a major centre of activity within the region.
Unitary authorities. Unitary authorities are territorial authorities which also have regional powers. Legislation in 1989 prevented any unitary authorities being established, other than in Gisborne. However, an amendment in 1992 not only created three more unitary authorities (Marlborough District, Tasman District and Nelson City), but made it possible for others to be created by submitting proposals to the Local Government Commission.
Community boards. A community board is primarily an advocate for its community and a means whereby the territorial authority can consult with the community. Any power the community board has is delegated by the territorial authority, but cannot include such powers as levying rates, appointing staff or owning property. Community boards are partly elected by the community and partly appointed by the territorial authority from among its own members, or are entirely elected. Community boards can be established anywhere in New Zealand to serve any number of inhabitants. They may be established upon the initiative either of a given number of electors of the territorial authority, or as provided in a reorganisation scheme. Community boundaries often coincide with those of wards (divisions of the district for electoral purposes). Boards have between four and 12 members.
Local authority functions. The Local Government Act 2002 provides that the purpose of local government is to enable democratic local decision making and action, by and on behalf of local communities to promote the social, economic, environmental and cultural well-being of communities, in the present and for the future. The act lets regional councils and territorial authorities carry out any activity they consider appropriate for their region or district in the context of the purpose of local government. Prior to 2002, local authorities were permitted to carry out only those activities specifically allowed by statute.
The number of special purpose local authorities was greatly reduced following local government reform in 1989.
Catchment boards, harbour boards, pest destruction boards and land drainage boards, among others, disappeared, with their functions reallocated either to regional councils or, to a lesser extent, territorial authorities.
Categories remaining include scenic and recreation boards. There are also some one-off authorities, such as the Aotea Centre Board of Management, the Canterbury Museum Trust Board, the Council of the Auckland Institute and Museum, the Otago Museum Trust Board, the Masterton Lands Trust and the Greytown Lands Trust.
More than half a million voting papers will be distributed for the 2007 local government elections in October.
Local government elections are held on the second Saturday in October every third year. The next elections will be in 2007.
All regional council, territorial authority, special purpose local authority and community board elections are conducted at the same time.
At least once every six years, in the year before an election, regional and territorial authorities are required to review the number of members, the number and size of their electorates and whether or not community boards should be established.
Electorates are known as wards in the case of territorial authorities and constituencies in the case of regions.
Territorial authorities have the option of deciding whether members will be elected by the electors of wards, from the district as a whole, or a mixture of both. Regions must be divided into constituencies.
The purpose of the review is to give effective representation to communities of interest and fair representation to electors. The review process provides for objections and appeals by the public. When necessary, final decisions are made by the Local Government Commission.
Voting procedures. Although postal voting is now universal, any territorial authority may decide whether an election is to be conducted by attendance at a polling booth or by post. The method of casting a vote is similar to parliamentary elections. The surnames of candidates are printed on the ballot paper and electors place a tick after the name of the candidate they wish to vote for. The voting system currently used is ‘first past the post’, except for district health boards and nine local authorities who use the single transferable vote (STV) system. Other local authorities have the option of using STV at future elections.
Local authority franchise. Every parliamentary elector is automatically qualified as a residential elector of a local authority if the address at which the person is registered on the electoral roll is within the district of the local authority. Ratepayers who are not residents are entitled to enrol and vote in any region, district or community in which they pay rates. Rolls are compiled by territorial authorities, who usually compile rolls and conduct elections for other authorities as well. Information for the residential electoral roll is obtained from the parliamentary electoral database, and the ratepayer roll is compiled from enrolment forms received from ratepayers.
Membership of local authorities. Subject to meeting certain residency and citizenship requirements, any person who is a parliamentary elector may be elected to a regional council or territorial authority or community board. In 1992, a prohibition was introduced on a person being a candidate for both a regional council and a territorial authority or community board within that region. Vacancies may be filled either by an election or by appointment, depending upon the timing of the vacancy.
Remuneration. Most boards and councils pay their chairperson or mayor an annual salary, while other members are paid a combination of a daily meeting allowance and an annual salary. Maximum and minimum salary and allowance levels are set by the Remuneration Authority, giving the council or board the discretion to decide the actual rate within prescribed limits.
The Local Government Commission consists of three members, one of whom is the chairperson, appointed by the Minister of Local Government.
The commission has two major functions.
Firstly, as a quasi-judicial appeal authority, to hear and determine appeals against decisions of local authorities on proposed boundary alterations; appeals and objections relating to ward and membership proposals of a local authority following a representation review; and proposals for the constitution of communities.
Secondly, the commission has responsibilities relating to consideration and processing of reorganisation proposals for the union or constitution of districts or regions.
The commission may also carry out investigations of particular matters affecting local government and report on them to the Minister of Local Government.
The Local Government Act 2002 also requires the commission to review and report to the Minister of Local Government on the operation of that act and the Local Electoral Act 2001. It must report to the minister as soon as practicable after the 2007 elections.
Most of New Zealand's local authorities separate their activities into regulatory-type functions and those run along the lines of normal businesses.
To facilitate this, councils have set up business units which compete with outside businesses for council contracts, such as those involving roading, works and maintenance, and refuse collection.
In addition to business units, councils often have shareholdings in electricity supply companies, as well as companies which operate ports, airports and bus transport.
Total value of the non-trading activities of all local authorities for the years 2000–05 are shown in Table 3.14.
Table 3.14. Local authority statistics – non-trading activities
Years ending 30
June1
| 2000 | 2001 | 2002 | 2003 | 2004 | 20052 | |
|---|---|---|---|---|---|---|
1Covers all activities of local authorities not classified as trading activities, e.g. local government administration, provision of water supply, roading, parks and reserves, town planning and regulation. 2Provisional. 3Rates, petroleum tax and fees and fines not available separately. .. figures not available Note:Figures may not add to stated totals due to rounding. Source: Statistics New Zealand | ||||||
| Operating income | $(million) | |||||
| Rates (including water values) | 2,102.9 | 2,195.3 | 2,300.5 | 2,439.5 | 2,619.5 | 3,111.43 |
| Petroleum tax | 26.4 | 26.3 | 27.0 | 27.5 | 28.2 | .. |
| Grants, subsidies and levies | 398.7 | 402.6 | 444.4 | 482.8 | 555.7 | 585.6 |
| Fees and fines | 174.9 | 194.1 | 199.9 | 214.0 | 246.5 | .. |
| Sales and other income | 712.4 | 727.5 | 748.0 | 809.4 | 874.4 | 909.5 |
| Investment income | 334.3 | 293.2 | 420.4 | 278.5 | 301.7 | 310.1 |
| Total | 3,749.7 | 3,838.9 | 4,140.1 | 4,251.8 | 4,626.0 | 4,916.6 |
| Operating expenditure | ||||||
| Employee costs | 830.9 | 839.7 | 883.9 | 950.7 | 1,029.6 | 1,111.4 |
| Interest | 153.9 | 146.1 | 141.0 | 140.5 | 141.7 | 160.0 |
| Depreciation | 715.7 | 730.5 | 769.9 | 828.9 | 889.5 | 993.5 |
| Purchases and other expenditure | 1,808.1 | 1,891.9 | 1,997.3 | 2,106.2 | 2,309.3 | 2,530.0 |
| Total | 3,508.5 | 3,608.2 | 3,792.0 | 4,026.4 | 4,370.0 | 4,794.9 |
| Surplus before non-operating items | 241.2 | 230.7 | 348.1 | 225.4 | 256.0 | 121.6 |
| Net gains from non-operating items | 672.9 | 247.5 | 184.1 | 375.2 | 492.9 | .. |
| Surplus after non-operating items | 914.1 | 478.2 | 532.2 | 600.5 | 748.9 | .. |
| Additions to fixed assets | 1,249.9 | 1390.1 | 1,597.7 | 1,724.5 | 1,938.3 | .. |
| Disposal of fixed assets | 131.4 | 107.2 | 97.2 | 235.1 | 115.1 | .. |
The New Zealand Coat of Arms is protected under the Flags, Emblems and Names Protection Act 1981.
Use of the coat of arms is restricted to the government and may not be used by private individuals or organisations.
The first quarter of the shield on the coat of arms depicts four stars as representative of the Southern Cross, then three ships symbolising the importance of New Zealand's sea trade. In the second quarter, a fleece represents the farming industry. The wheat sheaf in the third quarter represents the agricultural industry, while the crossed hammers in the fourth quarter represent the mining industry.
Supporters on either side of the shield consist of a Māori chieftain holding a taiaha (a Māori war weapon) and a European woman holding the New Zealand flag.
Surmounting the arms is the St Edward's Crown, used in the coronation ceremony of Queen Elizabeth II.
The crown symbolises the fact that the Queen is Queen of New Zealand under the New Zealand Royal Titles Act 1953.
The flag previously known as the New Zealand Ensign was declared the National Flag of New Zealand under the Flags, Emblems and Names Protection Act 1981.
The New Zealand flag is the symbol of the realm, government and people of New Zealand.
The basis of the New Zealand flag is the Union flag (Jack) in the upper left quarter, and, on a blue ground to the right, the Southern Cross represented by four five-pointed red stars with white borders.
The flag's royal blue background represents the blue sea and clear sky surrounding New Zealand.
The stars of the Southern Cross emphasise the country's location in the South Pacific.
The Union flag gives recognition to New Zealand's historical foundations and the fact that the country was once a British colony and dominion.
3.1 Ministry of Justice; Statistics New Zealand; Office of the Clerk of the House of Representatives.
3.2 Office of the Clerk of the House of Representatives; Cabinet Office; Chief Electoral Office.
3.3 State Services Commission; Office of the Controller and Auditor-General; Crown Company Monitoring Advisory Unit; Office of the Ombudsmen; Office of the Privacy Commissioner; Ministry of Justice; Office of the Parliamentary Commissioner for the Environment; Public Trust.
3.4 Local Government Commission; Local Government New Zealand; Statistics New Zealand.
3.5 Ministry for Culture and Heritage.
www.elections.govt.nz
– Electoral Commission
www.vuw.ac.nz/inst-policy-studies
– Institute of Policy Studies
www.lawcom.govt.nz
– Law Commission
www.localgovtnz.co.nz
– Local Government New Zealand
www.parliament.govt.nz
– Office of the Clerk of the House of Representatives
www.ombudsmen.govt.nz
– Office of the Ombudsmen
www.pce.govt.nz
– Parliamentary Commissioner for the Environment
www.pco.parliament.govt.nz
– Parliamentary Counsel Office
www.parliament.govt.nz
– Parliamentary Service
www.ssc.govt.nz
– State Services Commission
www.justice.govt.nz
– Ministry of Justice
www.dpmc.govt.nz
– Department for Prime Minister and Cabinet
Table of Contents

More than 800 personnel and 250 military vehicles took part in Exercise Silver Warrior in the lower central North Island in November 2005.
The New Zealand Government established the then Department of External Affairs and began stationing diplomatic representatives overseas in 1943. Today, New Zealand has diplomatic and consular representation in more than 40 countries, with multiple accreditation allowing New Zealand representatives to cover another 80 countries and states from their bases.
On behalf of the government, the Ministry of Foreign Affairs and Trade Te Manatū Aorere (MFAT) is responsible for all major policy functions related to New Zealand's external relations. The main thrust of the ministry's work is directed at management of New Zealand's bilateral relations with other countries, and with its interests in international institutions. Other functions include management of development assistance, provision of consular services to New Zealanders abroad, and provision of operational and administrative support services to other New Zealand government agencies overseas.
The ministry is the official channel of communication between the New Zealand Government and other governments. It also administers Tokelau and undertakes external affairs and defence functions for the Cook Islands and Niue, after consultations with their heads of government.
The ministry consults closely with other government departments and agencies on domestic and international developments and their interrelationships. The New Zealand Trade Development Board is a particularly important partner in developing and implementing programmes to promote foreign exchange earnings.
The ministry operates and administers the diplomatic and consular posts that represent and pursue New Zealand's interests overseas. The posts perform services on behalf of all government departments, offer assistance to New Zealanders overseas, whether travelling in official or private capacities, and issue passports and visas overseas.
The Ministry of Foreign Affairs and Trade website is www.mfat.govt.nz
The Pacific is a key area in New Zealand's international relations. New Zealand enjoys a close association with Pacific Island nations, with 10 diplomatic missions and consulates in the region and accreditation to a further six states and territories.
Special relationships exist between New Zealand and the Cook Islands, Niue and Tokelau. The Cook Islands became a self-governing state in free association with New Zealand in 1965 and Niue followed in 1974. Tokelau is a non self-governing territory of New Zealand. Cook Islanders, Niueans and Tokelauans are New Zealand citizens.
Trade with the Pacific is important to New Zealand. Exports totalled $941 million in the year ending 30 June 2005. Imports totalled $82 million, having dropped by 50 percent on the previous year largely as a result of oil companies no longer sourcing from Papua New Guinea.
Imports from Pacific countries have duty-free access on a non-reciprocal basis to New Zealand and Australian markets under the South Pacific Regional Trade and Economic Cooperation Agreement (SPARTECA). Efforts are being made to promote imports from the Pacific, with increased NZAID support for the Pacific Islands Trade and Investment Commission in Auckland.
New Zealand has developed extensive links with Pacific regional organisations. It was a founding member of the South Pacific Forum, formed in 1971 to promote regional cooperation, particularly in trade and economic development. Renamed the Pacific Islands Forum in 1999, it now comprises 16 Pacific countries and provides an opportunity to discuss regional and international issues of interest to the region, such as regional security, environmental issues, fisheries and economic development. Pacific Islands Forum countries meet annually at heads of government level, with meetings throughout the year at ministerial and official levels to consider a variety of specific issues.
An important aspect of the forum's work is the annual Forum Economic Ministers’ Meeting (FEMM). Since the first meeting in 1995, ministers have agreed on an action plan covering accountability principles, public sector reform initiatives, tariff reform and investment reform. Forum trade ministers also meet at least once every two years to progress regional trade initiatives.
The Pacific Agreement on Closer Economic Relations (PACER) is an agreement covering all Pacific Islands Forum countries, including Australia and New Zealand, and represents an important step in New Zealand's relations with Pacific countries. It provides for the development of arrangements to achieve closer trade and economic integration in the Pacific region.
The Pacific Island Countries Trade Agreement (PICTA), a free trade agreement among Pacific Islands Forum countries will, over a period of 10 years, lead to establishment of a free trade area among Pacific island states.
The importance of fisheries as an economic resource in the Pacific led to completion in September 2000 of the Convention on the Conservation and Management of Highly Migratory Fish Stocks in the Western and Central Pacific Ocean (WCPFC). The convention is the first regional fisheries management arrangement to base itself on the 1995 United Nations Fish Stocks Agreement and will lead to establishment of a broad-based fisheries management organisation in the Pacific region, including both coastal states and distant water fishing nations.
Other regional organisations of which New Zealand is a member include:
The Forum Fisheries Agency (FFA), which assists members with management and conservation of the region's marine resources.
The Secretariat of the Pacific Community (formerly the South Pacific Commission), which helps promote economic and social development in the region through work in agriculture, marine resources, health, socio-economic and statistical services, and community education.
The South Pacific Regional Environment Programme (SPREP), which focuses on protection and management of environmental resources.
The Pacific Forum Line (PFL), which facilitates regional trade through improved shipping links.
The South Pacific Applied Geoscience Commission (SOPAC), which assists in assessment, exploration and development of mineral and other non-living resources.
New Zealand has other links with the Pacific covering official development assistance, defence and disaster coordination. The France, Australia, New Zealand (FRANZ) arrangement is an important element in the provision of rapid emergency assistance to the region in the event of natural disasters, such as tropical cyclones.
The Pacific is also the area of New Zealand's primary aid focus. Nearly half of the New Zealand Agency for International Development's (NZAID) budget – about $110 million – goes towards development assistance in the Pacific.
NZAID has extensive bilateral relationships with countries in the Pacific and provides significant support for regional organisations such as the Secretariat of the Pacific Community and the University of the South Pacific. Pacific regional programmes are divided into broad themes of health, education, law and justice, and the environment.
Security issues in the Pacific are characterised by internal and external security challenges stemming from factors including ethnic differences, economic disparities, land disputes and transnational crime. New Zealand has been involved extensively in regional efforts to resolve these security challenges, especially in Bougainville and the Solomon Islands. On Bougainville, New Zealand committed personnel to the Peace Monitoring Group (PMG 1998–2003) and the Bougainville Transitional Team (BTT–2003). New Zealand also contributes police and military personnel, as well as civilian staff, to the Regional Assistance Mission to the Solomon Islands (RAMSI).
Tahitian dancers welcome visitors to a Pacific Trade Expo in Auckland.
Regional cooperation in security matters has been centred on the Pacific Islands Forum and its regional security committee. A significant development was the Biketawa Declaration made by forum leaders in 2000 under which the forum secretary-general was assigned a specific role in monitoring possible sources of conflict and developing methods of dispute settlement and conflict avoidance to prevent their developing into open conflict.
Figure 4.01 shows where the Ministry of Foreign Affairs and Trade has diplomatic and consular representation. The legend below also shows accreditations.
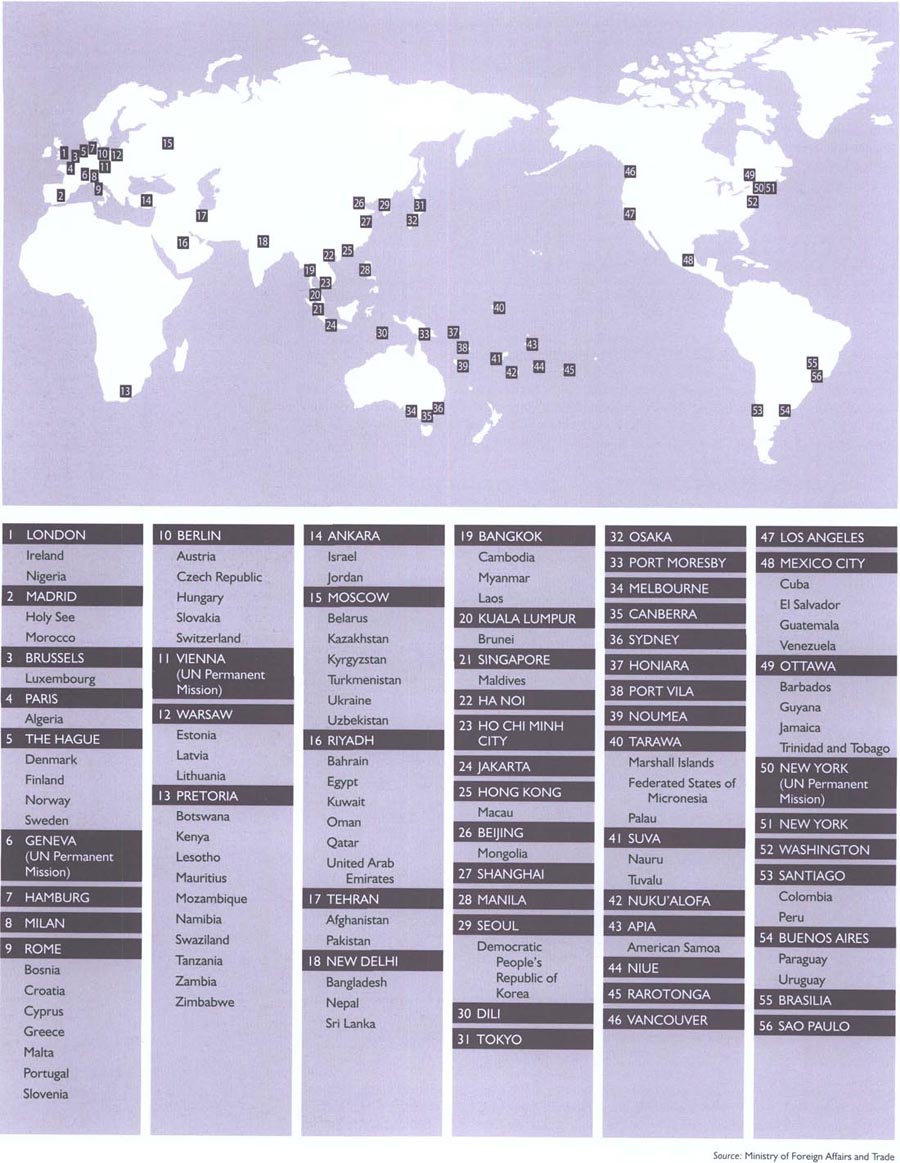
New Zealand's closest partnership is with Australia. The relationship is central to New Zealand's trade and economic interests, its defence, security and foreign policy interests, and to the country's overall economic and social well-being.
The political framework for management of the relationship includes regular dedicated meetings between the Prime Ministers of New Zealand and Australia, between Ministers of Foreign Affairs, Ministers of Finance and Ministers of Defence, and the annual Closer Economic Relations Ministerial Forum comprising key trade and economic ministers.
Complementing these meetings, around 80 business and community leaders from both countries – including relevant senior ministers and opposition spokespeople – meet annually as the Australia New Zealand Leadership Forum.
New Zealand is represented in Australia by a high commission in Canberra and consulates-general in Sydney and Melbourne.
The Trans-Tasman Travel Arrangement (TTTA) enables New Zealand citizens to travel, live and work in Australia, and Australian residents to receive similar access to New Zealand.
A social security agreement negotiated with Australia, covering superannuation and severe disability, came into effect on 1 July 2002. This preserves the ability of New Zealanders to live and work in Australia (and vice versa) under the TTTA, while allowing both governments to determine their own policies regarding access to all other social welfare benefits.
There are more than 400,000 New Zealanders living in Australia and about 55,000 Australians in New Zealand. More than a million New Zealanders and 800,000 Australians cross the Tasman on short-term visits each year.
Australia is New Zealand's most important trading partner and New Zealand is Australia's number one market for elaborately-transformed goods and the fourth largest individual export market.
The Australia New Zealand Closer Economic Relations Trade Agreement (ANZCERTA or CER), signed in 1983, and its associated arrangements and agreements, is the main instrument governing trade and economic relations between the two countries. The economies of the two countries have become increasingly integrated since signing of the agreement, with complete free trade in goods achieved five years ahead of schedule, on 1 July 1990. The 1988 CER Protocol on Services provides for free trade in nearly all services sectors.
The CER relationship also addresses a range of non-tariff measures, such as customs requirements, standards, business law regulations and occupational registration requirements. A Joint Food Standards Treaty was signed in 1995 and, in December 2002, the Australia New Zealand Food Standards Code took effect.
In 1998, CER was further expanded to include the Trans-Tasman Mutual Recognition Arrangement and, in 2000, an agreement on coordination of business law was signed.
The 1996 Single Aviation Market Arrangement was expanded in 2000 to an ‘open skies’ agreement.
In 2003, New Zealand and Australia signed an agreement to establish a joint therapeutics products agency.
The focus is now on reforms that seek to progress development of the relationship to create a seamless trans-Tasman business environment – a Single Economic Market (SEM).
Australia is also New Zealand's closest and most important security partner. The alliance with Australia, founded in the Canberra Pact (1944), formalised in the ANZUS Treaty (1952) and finding current expression in the Closer Defence Relations concept, as confirmed in 2003, remains central to New Zealand's defence policies. Both governments are committed to achieving the highest possible level of interoperability with each other, while acknowledging the need for each to meet its own defence priorities. Australia and New Zealand have worked together closely and effectively in East Timor, Bougainville and the Solomon Islands.
New Zealand has a long association with Asia, dating back to its military involvement in the region during World War II and, later, the Korean War. New Zealand was a founding member of the Colombo Plan and contributed significant levels of development assistance to many Asian countries throughout the 1960s and 1970s.
With the reindustrialisation of Japan and the rapid development of a number of Asian economies in the post-war period, the Asian region offered New Zealand new markets for its exports as Britain moved to join the European Economic Community in the early 1970s.
In the year ending 30 June 2005, Asia took 34 percent of New Zealand's exports and provided nearly 38 percent of imports.
Trade in tourism and education services has been increasing rapidly, especially with the large economies of North Asia. In recent years, China has emerged as a significant economic player in its own right and is now New Zealand's fourth largest trading partner. There are also significant flows of direct investment between Asia and New Zealand.
New Zealand invests considerable resources in developing closer political relations with neighbours in the Asian region and it is represented by a network of offices in Bangkok, Beijing, Dili, Ha Noi, Ho Chi Minh City, Hong Kong, Jakarta, Kuala Lumpur, Manila, New Delhi, Seoul, Singapore, Shanghai and Tokyo.
Establishment of the Asia 2000 Foundation in 1991 (renamed the Asia New Zealand Foundation in 2004) has seen New Zealand's relations with Asia expand beyond the trade and economic prism. Support for a wide range of cultural, academic and business engagements, including an extensive research programme, has helped promote closer ties with Asia. New Zealand's increasing Asian orientation has also resulted in greater numbers of people from Asia coming to New Zealand to holiday, study, work or live.
The Auckland region has become the focus of New Zealand's Asian community, with one in eight residents there now of Asian descent.
At the political level, New Zealand is one of the original dialogue partners of the Association of South-East Asian Nations (ASEAN) and cooperates with members on a range of regional trade facilitation and economic development activities.
A New Zealand Red Cross worker tends to a patient in an Indonesian field hospital following the Boxing Day 2004 tsunami.
In July 2005, New Zealand acceded formally to the ASEAN Treaty of Amity and Cooperation, signalling a commitment to closer engagement with ASEAN and with Asia more generally.
New Zealand's participation in the inaugural East Asia Summit in Malaysia in December 2005 was a further step in building a deeper, more inclusive relationship with the region, as were negotiations on an ASEAN-Australia/New Zealand Free Trade Agreement (AANZFTA) launched at the ASEAN and Australia/New Zealand Leaders Summit in November 2004.
In the security arena, New Zealand takes part in the ASEAN Regional Forum, which provides ministers from throughout the Asia/Pacific region with an opportunity to focus collectively on regional security issues.
New Zealand is also a member of the Five Power Defence Arrangement, which brings together Malaysia, Singapore, Britain, Australia and New Zealand.
United States. New Zealand's relationship with the United States is one of its most important. Shared values underpin close government and private sector contacts across a broad range of bilateral, regional and multilateral activities. The United States is one of New Zealand's key economic partners. It is one of New Zealand's three most important export markets and a major source of imports and investment. In the multilateral trade field, the two countries espouse similar open market philosophies. Cooperation is also long standing and close on issues such as international and regional security, human rights, environmental matters and Antarctic scientific research.
Canada. New Zealand and Canada enjoy a positive and close relationship, based on shared Commonwealth, United Nations and Asia/Pacific interests. The two countries cooperate closely on a range of issues, including disarmament, international peacekeeping and security, Asia/Pacific policies and international economic matters. Canada is an important market for New Zealand's agricultural products, particularly beef.
Latin America. Development of New Zealand's relationships with Latin America takes place in the context of its Latin America Strategy, in place since 2000. The strategy's aim is to increase links between New Zealand and the region in three broad areas: political and diplomatic; economic and trade; and people-to-people. The strategy is supported by a fund of $250,000 a year – the Latin America Strategy Fund (LASF) – to encourage people-to-people links in particular. The strategy focuses on six priority countries: Argentina, Brazil, Chile, Mexico, Peru and Uruguay. The two most significant developments in the five years following the strategy's implementation were signing of the Trans-Pacific Strategic Economic Partnership agreement with Chile (as well as Singapore and Brunei), which has lifted the relationship with Chile to a new level; and establishment of a Joint Experts Group with Mexico, New Zealand's largest trade partner in the region, to advance trade and economic liberalisation. Other developments included conclusion of working holiday agreements with Chile, Argentina and Uruguay, and a considerable increase in cultural links. Latin American countries also cooperate with New Zealand in a range of multilateral areas, including trade, the environment, Antarctica, disarmament and fisheries.
Caribbean. New Zealand's relationship with the Caribbean is based largely on membership of the Commonwealth, of which many Caribbean states are members. Beyond this, New Zealand's relationship with the Caribbean is underpinned by direct people-to-people links, such as tourism.
European Union. The European Union (EU) is a major political and economic entity and a significant player in world affairs. It admitted 10 new members on 1 May 2004 to become a community of 25 states. New Zealand and the EU enjoy a broad and wide-ranging relationship. The EU is New Zealand's second largest trading partner after Australia, a significant source of tourists and an important source of investment. New Zealand, the EU and its constituent member states cooperate on many international issues, particularly at the multilateral level. Twice-yearly political consultations are held at ministerial level with the revolving EU presidency and the European Commission. Contact with the European Commission in Brussels, and also with the European Parliament, is critical to maintaining New Zealand's trade access to Europe. The EU is the largest market for a broad range of primary produce, including sheepmeat, wool, butter, kiwifruit, apples and venison. It is also the most important market for New Zealand's wine exports. Successful negotiations during the General Agreement on Tariffs and Trade Uruguay Round resulted in a significant improvement in both the volume and overall stability of New Zealand's access to this market. New Zealand also has important relationships with the EU's individual member states, particularly its strong historical ties with the United Kingdom. Enlargement of the EU in May 2004 to encompass the former communist states of Central and Eastern Europe and the Baltics has resulted in increased contacts between New Zealand and these countries.
A New Zealand embassy was opened in Warsaw in January 2005 in order to further support development of these relationships. New Zealand has embassies or consulates in Berlin, Brussels, Geneva, Hamburg, Madrid, Milan, Paris, Rome, The Hague and Warsaw and a high commission in London. These posts are cross-accredited to all other EU member states, including those admitted in 2004.
Russia and the Commonwealth of Independent States (CIS). Trade remains the central component of New Zealand's relationship with the states that made up the former Soviet Union, the Russian Federation being the principal partner. The long-term potential for trade with some regions, notably the Russian far east, is strong. New Zealand cooperates with Russia on a range of international issues in regional bodies such as the Asia Pacific Economic Cooperation organisation and the Association of South-East Asian Nations Regional Forum. It is heavily involved in negotiations for the accession of Russia to the World Trade Organisation. New Zealand has an embassy in Moscow, which is accredited to Belarus, Kazakhstan, Kyrgyzstan, Turkmenistan, Ukraine and Uzbekistan. In 2001, a new honorary consulate was opened in Vladivostok to cover New Zealand's interests in the Russian far east.
Events in the Middle East in the opening years of the 21st century have had a greater impact on the international community than at any time since the oil shocks of the 1970s.
New Zealand has shown its commitment to stability in the Middle East through the provision of monitors and peacekeepers for more than 50 years. In recent years, New Zealand personnel have served with United Nations (UN) assistance missions in Afghanistan and Iraq, and the UN Truce Supervision Mission in Israel, Egypt, Jordan, Lebanon and Syria. New Zealand has also contributed to UN-endorsed regional support missions, including the Multinational Force and Observers in the Sinai and the International Security Assistance Force in Afghanistan. New Zealand makes direct contributions to support reconstruction and humanitarian activities in the Occupied Palestinian Territories, as well as in Afghanistan and Iraq.
Arab-Israeli conflict. The Arab-Israeli conflict continues to be a major threat to stability in the Middle East. New Zealand maintains a balanced approach to the conflict and has consistently urged both sides to re-engage in the Roadmap for Peace process. New Zealand upholds Israel's right to exist within secure and recognised borders and also considers that Palestinians have the right to self-determination and to a viable and territorially contiguous state. New Zealand contributes $300,000 annually to the United Nations Relief and Works Agency for Palestinian Refugees in the Near East (UNRWA). A new allocation of $1 million will be channelled through the Public Financial Management Reform Trust Fund for the West Bank and Gaza in support of reconstruction and basic services projects; and to the United Nations International Children's Fund (UNICEF) Relief Appeal.
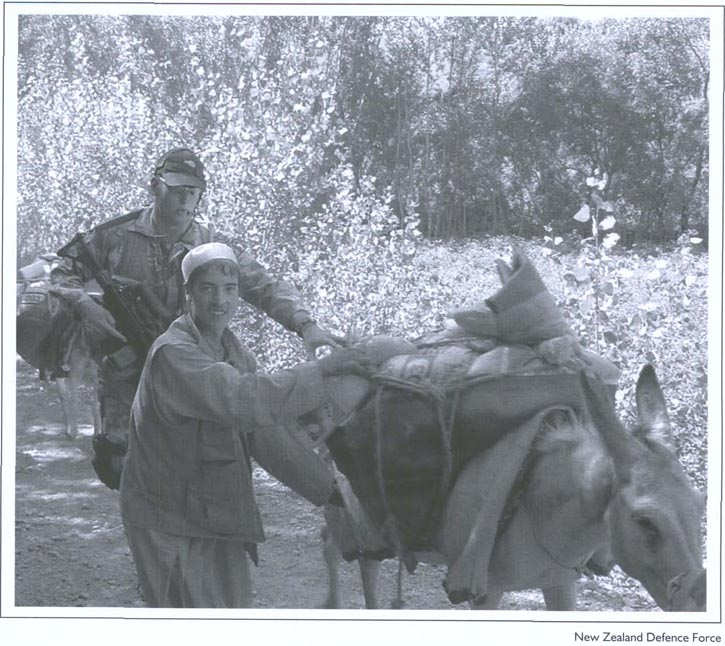
Food and reconstruction tools had to be carried in by donkey as a New Zealand Defence Force unit brought help to a village in Bamyan Province, Afghanistan, devastated by floods.
Iraq. New Zealand did not support the military invasion of Iraq, but it backed the United Nations-mandated political process of restoring to Iraqis the power to determine their own future. New Zealand welcomed the transfer of sovereignty from the Coalition Provisional Authority to the Interim Iraqi Government in June 2004 and the outcome of the 30 January 2005 election of a Transitional National Assembly. Ratification of the Iraqi Constitution in October 2005 paved the way for national elections at the end of 2005. Since March 2003. New Zealand has contributed $12.5 million in development assistance to Iraq to support the election process and for humanitarian and reconstruction assistance. This included $2 million to the United Nations Development Group Iraq Trust Fund in 2004/05. New Zealand also contributed $10 million for the deployment of a New Zealand Defence Force light engineering group, which carried out humanitarian and reconstruction tasks near Basra from September 2003 to September 2004.
Afghanistan. New Zealand supported the Bonn Process under which Afghanistan was returned to constitutional democratic government and has been involved continuously in security efforts in Afghanistan since late 2001, supporting both the NATO-led International Security Assistance Force and Operation Enduring Freedom. New Zealand took command of the Provincial Reconstruction Team (PRT) in Bamyan Province (200 kilometres north west of Kabul) in September 2003. This involved deployments of about 100 New Zealand Defence Force personnel drawn from the three services. PRTs are designed to assist the Afghanistan Government extend its influence beyond Kabul. Between 2001 and 2006, New Zealand contributed more than $110 million to Afghanistan in the form of military assistance and development support.
Trade and economic interests. New Zealand has significant economic interests in the Middle East and North Africa. The region is a valuable market for products, including wool, dairy, meat, manufactured goods and services. The Middle East is an important source for New Zealand's crude oil, polymers and fertilisers. In the year ending 30 June 2005, New Zealand's exports to the region totalled $1.139 billion, while imports for the same period were $1.743 billion. In North Africa, New Zealand's exports for the year ending 30 June 2005 totalled $166 million, while imports for the same period were $183 million. Exports were mainly dairy products, while imports were mainly phosphates and crude oil. New Zealand is also working with Algeria in its bid to become a World Trade Organisation member.
Diplomatic missions. New Zealand has embassies in Saudi Arabia (Riyadh), Turkey (Ankara) and Iran (Tehran), with cross accreditations to Afghanistan, Bahrain, Egypt, Israel, Jordan, Kuwait, Oman, Qatar and the United Arab Emirates. The New Zealand Consulate-General in Dubai is also the regional office for New Zealand Trade and Enterprise. In North Africa, New Zealand is accredited to Morocco from its embassy in Madrid, and Algeria from its embassy in Paris. In 2006, preparations were under way for establishment of a New Zealand Embassy in Cairo.
New Zealand's official relations with Sub-Saharan Africa are mainly with the Commonwealth countries of southern and eastern Africa, with South Africa being the most substantial. There is a strong humanitarian focus to many of these relationships.
New Zealand has a long-standing involvement in development cooperation in Africa through its official development assistance programme, which focuses on primary and non-formal education, rural development and primary health care. There is also provision for short-term technical assistance and support for New Zealand non-government organisations (NGOs), including Volunteer Service Abroad. During 2005, $20 million was spent in the region on development assistance, including scholarships.
As part of peacebuilding operations in Africa, New Zealand provided defence force personnel to the United Nations (UN) mission in Sudan in September 2005. Previously, New Zealand provided defence force personnel to the UN peacekeeping mission in Sierra Leone and to the UN de-mining programme in Mozambique. Both UN missions wound down in 2005.
Trade with Sub-Saharan Africa accounts for only a small proportion of New Zealand's global trade, with exports valued at around $335 million in the year ending 30 June 2005. Among major exports to the region were dairy, fish and other food products, casein and electrical equipment. South Africa and Mauritius were New Zealand's most important markets in the region.
Imports in the year ending 30 June 2005 totalled $667 million, with petroleum products, iron and steel, vehicles and parts, tobacco, coffee and wine the major items.
New Zealand has one diplomatic mission in Africa – the New Zealand High Commission in Pretoria, South Africa. This is accredited to 10 other southern and eastern African countries: Botswana, Kenya, Lesotho, Mauritius, Mozambique, Namibia, Swaziland, Tanzania, Zambia and Zimbabwe. The New Zealand High Commission in London is responsible for relations with Nigeria.
New Zealand's International Aid and Development Agency (NZAID) is the government agency responsible for delivering New Zealand's Official Development Assistance (ODA) and for advising ministers on development assistance policy and operations.
NZAID is a semi-autonomous body within the Ministry of Foreign Affairs and Trade. Its management arrangements are tailored to its core business and it has its own source of government funding.
When NZAID was established in 2002, New Zealand development assistance was dispersed to more than 100 countries, 10 Pacific regional agencies and 21 international agencies. Since its establishment, NZAID has been trying to focus on a smaller number of regions and countries where New Zealand has a greater chance of making a difference. As a consequence, the majority of NZAID programmes are now focussed on the Pacific and South-east Asia, though NZAID retains smaller regional programmes in Latin America and southern Africa.
NZAID concentrates its development assistance on activities that contribute to poverty elimination by creating safe, just and inclusive societies, fulfilling basic needs, and achieving environmental sustainability and sustainable livelihoods.
As Table 4.01 shows, NZAID's total spend for 2004/05 was $296.73 million, which included $41.77 million of the government's $68 million aid package following the Boxing Day 2004 tsunami in Asia and the Indian Ocean.
Table 4.01. Spending on New Zealand aid programmes
Year ending 30 June 2005
| Programme | Spending | Proportion of total |
|---|---|---|
Note:Figures may not add to stated totals due to rounding. Source: NZAID | ||
| $(million) | Percent | |
| Pacific | 119.28 | 40 |
| Global | 52.98 | 18 |
| Emergency management/disaster relief | 53.40 | 18 |
| International agencies | 51.69 | 17 |
| New Zealand agencies | 19.36 | 7 |
| Total | 296.73 | 100 |
NZAID's total budget allocation for the 2005/06 financial year was $345.59 million, including an increase of $37.1 million for aid to the Pacific to significantly expand programmes with Vanuatu, Papua New Guinea, the Solomon Islands and Fiji. Bilateral programmes with Indonesia and Viet Nam were also strengthened significantly, reflecting New Zealand's developing partnership with Asia in trade, security and travel.
Building on New Zealand's strong tradition of working with the United Nations, NZAID doubled its core contributions to a number of UN agencies in 2005/06.
Expansion of the budget in 2005/06 took ODA across all government departments to $383 million, or 0.27 percent of gross national income (GNI). Ministers have agreed that baseline ODA funding will increase in 2006/07 and 2007/08 to levels that will ensure New Zealand continues to report an ODA: GNI ratio of 0.27 percent and 0.28 percent respectively.
NZAID works to make sure it is a good neighbour to countries in the Pacific. Many parts of the region have low economic growth, high population growth, social and health issues such as HIV/AIDS, and tensions between traditional structures and introduced forms of governance.
Many of the countries are also small-island developing states, which leaves them particularly vulnerable to external shocks and natural disasters. All countries in the region have human resource capacity constraints and, due to their size, poor economies of scale.
As a neighbour, there are expectations both in the region and domestically that New Zealand will play a positive role in assisting Pacific countries achieve their development aspirations.
New Zealand's bilateral support for countries in the Pacific involves direct assistance on a country-to-country basis in the form of development projects and activities.
NZAID's Pacific programme is focusing future growth on six core Pacific partners – Vanuatu, Papua New Guinea and the Solomon Islands, where poverty is deeper and more pervasive; Fiji, in order to tackle the problem of income inequality and to help prevent further conflict and build peace in the country; and Niue and Tokelau, where New Zealand has constitutional obligations.
This will give New Zealand an increased country presence in these countries and more intensified participation in country-led policy dialogue and donor coordinated efforts.
NZAID's Pacific programme focuses on five thematic regional programmes – education, health, governance, economic growth and support for fisheries.
NZAID also funds a number of regional agencies and organisations. In 2005/06, these included the Secretariat of the Pacific Community; the University of the South Pacific; the Pacific Islands Forum Secretariat; the South Pacific Applied Geoscience Commission; the Forum Fisheries Agency; UNICEF Pacific; the South Pacific Regional Environment Programme; Pacific Island Association for Non-government Organisations; the South Pacific Board for Educational Assessment; the Foreign Investment Advisory Service; Fiji School of Medicine; Pacific Enterprise Development Facility; Pacific Islands AIDS Foundation; and the Pacific Financial Technical Centre.
NZAID's Pacific Scholarships programme provides funding for students from Pacific Island countries. These scholarships are funded independently of bilateral country and regional programmes.
In the year ending 30 June 2005, NZAID spent $119.28 million on its Pacific programme, of which $88.16 million went directly to bilateral partners, nearly $11 million to regional programmes and $16.54 million on assistance to regional agencies. Approximately $4 million was spent on Pacific scholarships.
In the year ending 30 June 2005, NZAID spent more than $52 million on its global programme.
Asia programme. NZAID's Asia programme is guided by an Asia Strategy, approved in 2004 after extensive consultation with governments, non-government organisations and other interested parties in the region. Main focus of this programme is South-east Asia, where aid priorities have been identified at regional level within the Greater Mekong sub-region, which comprises Viet Nam, Lao PDR, Cambodia, Thailand, Myanmar and Yunan province in China; and at bilateral level in Cambodia, Lao PDR, Indonesia, Viet Nam, Timor Leste and the Philippines. NZAID's key focus under the Asia Strategy is sustainable rural livelihoods, complemented by initiatives in the trade, health and education sectors. All activities are aligned with partner government poverty reduction and national development plans, and the coordinated efforts of the international donor community.
Latin America programme. NZAID's Latin America programme is guided by a regional strategy approved in 2004 after extensive consultation with governments and other donors in the region, non-government organisations and other interested parties. The strategy aims to contribute to the elimination of poverty in Latin America, with a focus on promoting sustainable rural livelihoods, particularly among indigenous peoples. As a small donor with limited capacity in the region, NZAID's strategy is to add value to the endeavours of those already working there. The programme focuses on three sub-regions – Central America (E1 Salvador, Guatemala, Honduras and Nicaragua), the Andean Highlands (Bolivia, Ecuador and Peru) and Brazil and the Southern Cone (Brazil, Chile, Argentina, Uruguay and Paraguay). Strengthening governance is the focus of NZAID support in the latter sub-region.
Africa programme. NZAID's South Africa bilateral and Africa regional programmes highlight assistance in the areas of primary and non-formal education; HIV/AIDS awareness and support for affected communities; capacity building for the public sector and civil society; and food security.
Emergency and disaster relief. The ability to respond effectively to natural disasters and needs arising out of conflict are a key focus for NZAID. Disasters increase vulnerability to poverty, and longterm recovery can divert populations away from development objectives. NZAID's support covers immediate emergency assistance, reconstruction activities and preventative programmes through international agencies, New Zealand non-government organisations (NGOs) and their overseas partners, and partner governments. NZAID's support for emergency and disaster relief programmes was $53.4 million in the year ending 30 June 2005. Support was provided in the following main categories:
Emergency relief – global: $2.39 million.
Emergency relief – Pacific: $2.23 million.
Complex emergencies: $7.02 million.
Natural disasters (tsunami): $41.77 million.
Non-government organisations. NZAID engages actively with New Zealand's non-government organisation (NGO) development community and provides funding to support a wide range of NGO programmes with partners on the ground overseas. Main vehicle for such support is the Voluntary Agencies Support Scheme (VASS), a co-funding programme jointly managed by NZAID and New Zealand NGOs. Alongside this, NZAID provides core funding for Volunteer Service Abroad, the Council for International Development, the Development Resource Centre (commonly known as Dev-Zone) and Trade Aid. A joint NZAID/NGO working group was established in 2005 to oversee and monitor implementation of their framework. Strengthening civil organisations in partner countries is a key feature of NZAID's work. Relationships include long-term engagement with umbrella organisations in Papua New Guinea, Fiji, Samoa, Tonga and Indonesia. Support is also provided to NGOs and community groups through small-project funds for rural development and local capacity building. In the year ending 30 June 2005, NZAID provided $19.36 million in funding to New Zealand NGOs.
NZAID believes that working multilaterally recognises the power of collective action and acknowledges that global problems require global solutions.
NZAID contributes annual core funding to 23 multilateral agencies, of which 10 are prioritised under the Multilateral Engagement Strategy for comprehensive engagement, encompassing funding as well as participation in governance, policy and evaluation processes.
The multilateral agencies and programmes of the United Nations, the Commonwealth, the World Bank and the Asian Development Bank, as well as a range of other international bodies, provide key vehicles for the distribution of aid. Multilateral agencies and programmes provide a proven and effective means for New Zealand to address poverty, conflict, governance issues and humanitarian crises worldwide.
By engaging with such agencies and institutions, NZAID is able to extend its outreach and impact globally, to have its voice heard in global debate surrounding development assistance, and to contribute to and benefit from the norm-setting functions, regulatory roles and expertise brought to development issues by these larger organisations.
Such agencies are periodically assessed under NZAID's Multilateral and Regional Agencies Assessment Framework to ensure their priorities are aligned with those of NZAID and that they are delivering effective and efficient programmes on the ground.
In the year ending 30 June 2005, NZAID provided $51.69 million to international agencies, of which $21.71 million went to international financial institutions and $22.10 million to United Nations agencies.
New Zealand was a founding member of the United Nations (UN) in 1945 and successive governments have strongly supported it as the major global instrument for maintaining peace and security, for developing friendly relations among countries, for encouraging international cooperation aimed at solving economic and social problems, for establishing and strengthening an international legal framework, and for promoting respect for human rights.
The range and complexity of the functions of the UN and its specialised agencies have grown steadily during the years, and New Zealand concentrates on areas where it can play a useful role in matters directly affecting its interests and where it can support efforts to secure lasting peace and security.
New Zealand is a strong advocate of international law and is actively engaged in the global debate on peace and security issues, disarmament, conflict prevention, sustainable development, the environment and the promotion of human rights, decolonisation and reform of the organisation itself.
New Zealand is a member of the International Law Commission, the Statistical Commission of the Economic and Social Council of the United Nations and the Committee of Experts on the Transport of Dangerous Goods.
Contributions to the United Nations. Contributions to the United Nation's budget are based on members’ capacity to pay. In 2004/05, New Zealand contributed annual dues to the United Nations of $6.7 million, plus $14.75 million for the peacekeeping budget and $898,415 for international tribunals. New Zealand's level of assessment for 2004 was 0.221 percent of the UN budget. Contributions to budgets of United Nations specialised agencies vary, with assessments fixed according to scales agreed by members of each agency.
Human rights. New Zealand supported resolutions addressing a wide range of international human rights concerns at the 2004 sessions of the UN Commission on Human Rights and the Third Committee of the UN General Assembly, both of which dealt with a full range of civil, political, economic, social and cultural rights. Resolutions supported by New Zealand included those addressing the rights of women and children and core civil and political rights, such as freedom from torture and the death penalty. New Zealand was also active in negotiating a new convention on the rights of people with disabilities and maintained its involvement in negotiations on a new instrument on the rights of indigenous peoples. As a party to six core international human rights instruments, New Zealand is required to report regularly to UN monitoring bodies on measures it has taken to give effect to international standards. No periodic reports to these monitoring bodies fell due during 2004.
Specialised agencies. Many subsidiary, specialised or otherwise-related agencies work with the UN and each other to achieve a broad range of shared goals. New Zealand is a member of all the major specialised agencies, including the Food and Agricultural Organisation (FAO), the International Labour Organisation (ILO), the World Health Organisation (WHO) and the UN Educational, Scientific and Cultural Organisation (UNESCO). The FAO aims to raise nutrition levels and improve food production and distribution, thereby contributing towards an expanding world economy and humanity's freedom from hunger. Similarly, the ILO seeks to achieve important advances in working and living conditions, WHO in the sphere of international health, and UNESCO in the interconnected fields of education, science and culture. New Zealand has served on the governing bodies of the UN Environment Programme and the ILO, as well as the governing body of the World Meteorological Organisation. New Zealand also served its first term on the World Heritage Committee, its membership ending in 2007. The committee is responsible for implementing the World Heritage Convention through which 176 member countries agree to protect their natural and cultural heritage. Between 2004 and 2006, New Zealand served on the Executive Council of the Organisation for the Prohibition of Chemical Weapons, which is not a specialised agency but an independent intergovernment organisation under the aegis of the UN.
The World Trade Organisation (WTO) is the only international organisation dealing with rules of trade among nations. It acts as a single institutional framework over the General Agreement on Tariffs and Trade (GATT) and over the multilateral agreements that resulted from the Uruguay Round of trade negotiations between 1986 and 1994.
The GATT came into force in 1948. Its basic aim was to help trade flow as freely as possible by removing obstacles and increasing transparency, thereby contributing to international economic growth and development. By the time the WTO came into force on 1 January 1995, the GATT's contracting parties accounted for about 90 percent of world trade.
The WTO provides a code of rules and a forum in which its 148 member countries can discuss trade problems and negotiate and enlarge world trading opportunities. It is based on the premises that the trading system should be:
Without discrimination – The ‘most favoured nation’ clause stipulates that each WTO member must grant all other members treatment as favourable as that which they grant any other country. This principle is particularly important for countries such as New Zealand, since it ensures that larger countries cannot adopt discriminatory trade policies, except for preferential free trade areas and customs unions. A second non-discrimination principle is ‘national treatment’, which requires that imported products are treated no less favourably than domestic products with respect to internal taxes, regulations and other requirements.
Freer – Barriers such as tariffs should progressively come down through negotiations.
Predictable – Businesses should be confident that trade barriers, including tariffs, non-tariff barriers and other measures, will not be raised arbitrarily. This is achieved by members making binding commitments not to raise trade barriers beyond current levels.
Transparent – Less transparent instruments, such as quotas and import licensing, are discouraged in favour of protection in the form of tariffs.
More competitive – Unfair practices, such as export subsidies and dumping products below cost to gain market share, are discouraged.
More beneficial to less developed countries – Developing countries are allowed more time to adjust, with greater flexibility and special privileges to help them in their development objectives.
Eight rounds of multilateral trade negotiations were held under the auspices of the GATT, each with the aim of liberalising trade between contracting parties by reducing trade barriers and other measures impeding free trade. The most ambitious of these was the Uruguay Round (1986–94). In addition to establishing the WTO, the Uruguay Round:
Brought agriculture effectively within the multilateral trading system for the first time.
Secured eventual integration of the textiles and clothing sector into the WTO system.
Extended the multilateral trading system to trade in services.
Strengthened multilateral trade rules in areas such as subsidies, anti-dumping, technical barriers to trade, sanitary and phytosanitary measures, safeguards, trade-related investment measures and dispute settlement.
Established a multilateral framework for protection and enforcement of intellectual property rights.
Further reduced tariffs on goods.
The highest decision-making level in the WTO is the Ministerial Conference, which meets every two years to make decisions on matters under WTO agreements. The Ministerial Conference that took place in November 2001 in Doha, Qatar, launched a new round of negotiations with the aim of concluding them by 1 January 2005. The new round was termed the Doha Development Agenda, to acknowledge the importance of development issues to the achievement of further trade liberalisation.
Key provisions in the Doha declaration included agreement to improve market access for agricultural and non-agricultural products and services, new mandates to negotiate to reduce fishing subsidies, and recognition of the relationship between WTO trade rules and multilateral environmental agreements. The declaration also contained a reference to the work of the International Labour Organisation and to avoidance of mandates that could weaken critical WTO disciplines, such as the Sanitary and Phytosanitary Agreement. The declaration set 1 January 2005 as the date for completing most of the negotiations, but this deadline was not met.
The next Ministerial Conference was held in Cancun, Mexico, from 10–14 September 2003, to take stock of progress in the round and provide any necessary political guidance. But the conference failed to reach agreement on key issues. It was therefore agreed that the WTO General Council in Geneva would meet at senior officials’ level no later than 15 December 2003. In the absence of a consensus at this meeting, Chair Perez del Castillo outlined areas where agreement looked possible. It was left to incoming negotiating groups, formed in February 2004, to take the issues further.
Real progress was not evident until the first half of 2004, when a political process produced breakthroughs in agriculture that led to a ‘framework’ agreement being adopted in Geneva in July 2004. This included advances on export subsidy elimination in agriculture and progress across a range of other issues. Intensive negotiations have continued and members are working on an unofficial target date of the end of 2006 to conclude negotiations.
The World Bank group consists of five affiliated financial and investment facilitation institutions – the International Bank of Reconstruction and Development (IBRD), the International Development Association (IDA), the International Finance Corporation (IFC), the Multilateral Investment Guarantee Agency (MIGA) and the International Centre for the Settlement of Investment Disputes (ICSID). Having joined the MIGA in 2005, New Zealand is now a member of all five arms of the World Bank.
The common objective of the institutions is to fight poverty and to improve living standards in developing countries by financing specific country-based and regional activities.
These cover sectors such as health, education, social development, private sector development, gender, environment and infrastructure development.
Total new lending in the year ending 30 June 2005 was approximately US$18.7 billion through both the IBRD and IDA.
The IDA provides highly concessional resources to low-income countries, with US$8.9 billion lent in 2005.
New Zealand makes contributions to periodic replenishments of the IDA and in 2005 made a commitment of NZ$39.0 million, payable over three years, amounting to a 0.12 percent share of total donor funding.
New Zealand is looking to contribute to the Multilateral Debt Relief Initiative – endorsed by the Group of Eight Leaders in July 2005 – on its implementation by IDA. New Zealand has already contributed approximately NZ$6.4 million to the IDA and International Monetary Fund (IMF) trust fund for Heavily Indebted Poor Countries.
These trusts give resources to heavily indebted poor countries to help relieve their debt servicing burdens to the IMF and the IDA. Twenty-six of the 38 countries eligible for debt relief currently receive assistance.
The Asian Development Bank (ADB) is a regional development bank established in 1965. It has 63 members, of which 45 are in Asia and the Pacific, the remainder being donor countries outside the region.
The ADB's goal is to reduce poverty in the region through sustainable economic growth, social development and good governance.
New Zealand holds 54,340 shares in the ADB, about 1.56 percent of the bank's voting share.
New Zealand also makes contributions to the periodic replenishment of the ADB's Asian Development Fund (ADF), the bank's concessional lending facility for its poorest developing member countries.
In the year ending 30 June 2004, lending by the ADB totalled approximately US$5.3 billion and other development assistance extended through grants, technical assistance and equity investments totalled US$0.6 billion.
In 2004, New Zealand agreed to contribute NZ$36.3 million, payable over seven years, to the eighth replenishment of the fund. The total replenishment level was US$3.2 billion, shared among 25 donors.
The Commonwealth has 53 member countries representing approximately 1.7 billion people across the globe. New Zealand was a founding member in 1931 and has long been involved in a wide range of Commonwealth activities – the Empire or Commonwealth Games have been held in New Zealand three times.
Commonwealth policies and activities are decided at biennial meetings of Commonwealth Heads of Government (CHOGM), with New Zealand hosting the gathering in 1995.
Most activities are executed through the Commonwealth secretariat in London. Former New Zealand Minister of Foreign Affairs and Trade Don McKinnon was appointed Commonwealth Secretary-General in 1999 and re-elected for a second term in 2003.
New Zealand is the sixth largest contributor to the Commonwealth secretariat by volume and one of the eight largest contributors to combined Commonwealth funds.
New Zealand actively promotes the Commonwealth's core beliefs and principles. Since 1992, New Zealanders have participated in numerous missions to observe elections in member countries, including, more recently, Zimbabwe in 2000 and 2002, Fiji in 2001, Pakistan in 2002, Nigeria in 2003 and Sri Lanka in 2004.
The Commonwealth Ministerial Action Group (CMAG) functions as the Commonwealth's watchdog on democracy and was established in Millbrook, New Zealand, in 1995. New Zealand served on CMAG from 1995 to 1999.
The Organisation for Economic Co-operation and Development (OECD) – which New Zealand joined in 1973 – is a forum for democratic and market-oriented economies to study and develop economic, social, environment and development policies, with the ultimate aim of fostering prosperity and sustainable development. The OECD works on almost all of the key economic, social and development issues on the international agenda. Its work programme includes projects on growth and innovation, agricultural policy reform, employment and social inclusion, sustainable development, ageing populations, education, information and communications technology, health care issues and global trade liberalisation. Its staff are among the world's leading authorities in many of these areas.
Based in Paris, the OECD has 30 members: Australia, Austria, Belgium, Canada, Czech Republic, Denmark, Finland, France, Germany, Greece, Hungary, Iceland, Ireland, Italy, Japan, Korea, Luxembourg, Mexico, Netherlands, New Zealand, Norway, Poland, Portugal, Slovak Republic, Spain, Sweden, Switzerland, Turkey, the United Kingdom and the United States. The OECD has extensive cooperation programmes with key non-member countries, including China, India, Russia, Brazil and other Latin American and Eastern European economies. Also of central importance is its programme of contact with non-government organisations and the broader society to explain how the OECD's goals and activities are designed to promote the economic well-being of all citizens in both developed and developing countries.
New Zealand is a member of the International Energy Agency (IEA), an autonomous body within the OECD framework. The primary focus of the IEA is on oil security among members, but its programme embraces a wide range of energy issues. New Zealand is also a member of the Financial Action Task Force (FATF), an independent body housed in the OECD dedicated to combating money laundering and terrorist financing.
Tokelau consists of three small atolls in the South Pacific – Atafu, Fakaofo and Nukunonu – with a combined land area of 12 square kilometres and a population of just over 1,600. The central atoll, Nukunonu, is 92 kilometres from Atafu and 64 kilometres from Fakaofo. Western Samoa is 480 kilometres to the south.
The British Government transferred administrative control of Tokelau (then known as the Union Islands) to New Zealand in 1925. Formal sovereignty was transferred to New Zealand in 1948 by an act of the New Zealand Parliament. New Zealand statute law, however, does not apply to Tokelau unless it is expressly extended. In practice, no New Zealand legislation is extended to Tokelau without its consent.
Tokelau is listed as a non self-governing territory for the purposes of the self-determination principles of the United Nations charter. This status was confirmed in 1962 when New Zealand added Tokelau to the schedule of territories under supervision of the United Nations Special Committee on Decolonisation. The Administrator of Tokelau is appointed by the Minister of Foreign Affairs and Trade and is responsible for administration of the executive government of Tokelau. Under a programme of constitutional change agreed in 1992, the role of Tokelau's political institutions have been re-defined and expanded. This process was formalised in January 1994 by delegation of the administrator's powers to the General Fono (National Parliament) and the Council of Faipule (now the Council for Ongoing Government) when the General Fono is not in session.
In 1996, the formal step of devolving legislative power was taken. With passage of the Tokelau Amendment Act 1996 by the New Zealand parliament, the General Fono has been able, since 1 August 1996, to exercise rule-making power. This power has been used primarily to manage major economic activities in Tokelau and for financial management of Tokelau's accounts. The Faipule are leaders of their respective villages (one on each atoll) and the ministerial portfolios they hold represent an extension of their formal responsibility. Traditionally, each village has been largely autonomous. This was confirmed by the Tokelau Village Incorporation Regulations 1986, giving legal recognition to each village and granting it independent law-making power.
As part of the Modern House of Tokelau Project, the administrator's powers were delegated from the General Fono to the three village councils (Taupulega) in June 2004. The aim of the delegation to village council was to put in place a governance system that was functional in the local setting, blending the modern with the traditional. The challenge was to devise a structure which properly established the village as the focus of social and economic activities, that delivered services within the village, and that integrated traditional decision-making processes with modern advice and support.
A review of Tokelau public services carried out in 2003/04 saw a shift of responsibility for public services away from the national office in Apia back to the three atolls. The national office in Apia has been restructured to enhance its capability to deliver services on a national basis, and to provide a liaison point for international issues.
In October 2003, the General Fono instituted a number of constitutional and law changes, including the decision that the Council of Faipule would be renamed the Tokelau Council for Ongoing Government. The new council comprises six members, the three Faipule and the three Pulenuku (village mayors).
The position of Ulu o Tokelau (Leader of Tokelau) will continue to rotate on a yearly basis among the three Faipule.
Tokelau runs its own budget, and although it is currently heavily dependent on New Zealand for economic support, Tokelau has its own Trust Fund (now standing at just over $25 million) and is looking at ways of increasing its own revenue-earning capacity in areas such as fisheries licensing, handicrafts, tourism and stamps and coins.
Tokelau has in recent years been moving steadily towards an act of self-determination based on the Niue and Cook Islands formula of self-government in association with New Zealand. With the administrative powers formerly exercised by New Zealand having been transferred progressively to Tokelau, the point has been reached where it is, in most practical respects, self-governing.
In 2005, New Zealand and Tokelau completed a draft Constitution for Tokelau and Treaty of Free Association that could form the basis for a formal act of self-determination. In February 2006, Tokelau, under United Nations supervision, voted on whether to become self-governing in free association with New Zealand. Sixty percent of registered voters were in favour of self-government, but the vote did not produce the required two-thirds majority – the benchmark set by the General Fono. Thus a change in Tokelau's status will not take place. However, it is expected that Tokelau will revisit the issue of self-government at some time in the future.
The Ross Dependency consists of the land, permanent ice-shelf and islands of Antarctica below 60 degrees south and between 160 degrees east and 150 degrees west. New Zealand's Antarctic territory, therefore, comprises the Ross Ice Shelf, the Balleny Islands, Scott Island and the landmass and adjacent islands within these longitudes to the point of their convergence at the South Pole.
The land is almost entirely covered by ice and is uninhabited except for people conducting or supporting scientific research programmes.
New Zealand operates a permanent scientific research station, Scott Base, on Ross Island in the dependency.
New Zealand has exercised jurisdiction over the dependency since 1923, when an Imperial Order-In-Council vested in the New Zealand Governor-General executive and legislative power in respect of the dependency.
New Zealand actively participates in the Antarctic Treaty System (ATS), which consists of the 1959 Antarctic Treaty and associated agreements. The treaty system serves to coordinate relations among states with respect to Antarctica, and its primary purpose is to ensure Antarctica is used for peaceful purposes only and that it does not become the scene or object of international discord. It designates Antarctica as ‘a natural reserve, devoted to peace and science’, promotes international scientific cooperation, and bans mining, dumping of nuclear waste and deployment of military personnel (except in support of peaceful purposes) in Antarctica.
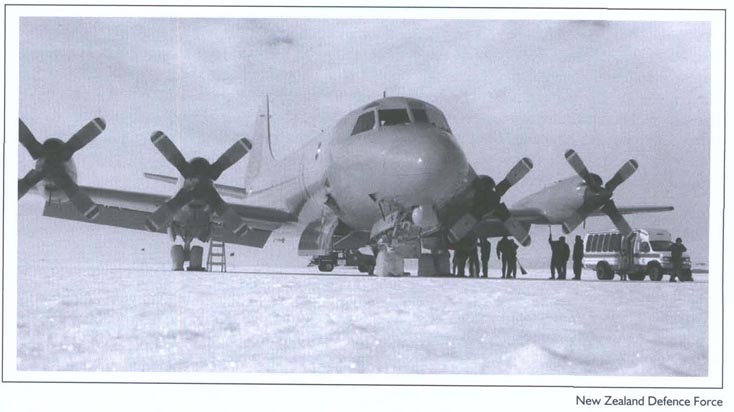
An RNZAF Orion landed on an ice runway in Antarctica for the first time in January 2005. The trial flight was to determine the feasibility of conducting patrols from Antarctica in support of the Convention for the Conservation of Antarctic Marine Living Resources.
Membership of the ATS has grown from the 12 original signatories of the treaty (of which New Zealand was one) to 45 parties, 28 of which have consultative or decision-making status.
Antarctic Treaty parties meet regularly to consider issues within its framework, such as scientific and logistic cooperation and environmental protection measures.
All those seeking to carry out activities in the Ross Dependency, or who depart for Antarctica from New Zealand (notwithstanding their nationality), are required to prepare Environmental Impact Assessments (EIAs) under the Antarctica (Environmental Protection) Act 1994. On the basis of the EIA, the Minister of Foreign Affairs and Trade decides whether the activity may proceed. Permits must also be obtained for certain Antarctic activities. Official expeditions of governments which are parties to the Antarctic Treaty are exempt from these requirements.
Fishing in the Ross Sea is conducted consistent with conservation measures adopted by the Commission for the Conservation of Antarctic Marine Living Resources, based in Hobart. New Zealand has conducted exploratory fishing for toothfish in the Ross Sea since 1997.
The Governor-General of New Zealand is Commander-in-Chief in and over New Zealand. Authority over New Zealand's armed forces, however, is vested in the government and responsibility for defence matters within the government is held by the Minister of Defence.
The defence portfolio encompasses both the Ministry of Defence (MoD) and the New Zealand Defence Force, with the Chief of Defence Force and the Chief Executive of the Ministry of Defence (the Secretary of Defence) both accountable to the Minister of Defence.
The Secretary of Defence is the government's principal civilian adviser on defence policy matters. The Ministry of Defence is responsible for policy and advice on funding for defence activities, major capability procurement and repair. The ministry also conducts evaluations of the performance of the New Zealand Defence Force.
New Zealand's armed forces consist of the Royal New Zealand Navy, the New Zealand Army, and the Royal New Zealand Air Force. These regular forces, together with territorial, reserve and civilian personnel, constitute the New Zealand Defence Force.
The Chief of Defence Force is both the commander and chief executive of the New Zealand Defence Force and is the government's principal military adviser on defence matters. The Chief of Defence Force is responsible for the New Zealand Defence Force's management of resources, the general conduct of the New Zealand Defence Force, and chairs the Chiefs of Service Committee and meetings of the Executive Leadership Team.
The roles of the Chiefs of Navy, Army and Air Force are to raise, train and maintain their respective services.
The Commander Joint Forces New Zealand exercises operational control of forces assigned to that headquarters and commands all New Zealand Defence Force operations and exercises, as directed by the Chief of Defence Force.
The military and civilian advisory roles to the government are complementary, with considerable overlap on defence, security and capability issues. This requires close cooperation and consultation between the Ministry of Defence and the New Zealand Defence Force. Coordination is achieved through the Office of Chief Executives, which brings the Secretary of Defence and the Chief of Defence Force together to discuss policy issues of mutual interest, and on the executive governance boards, which oversee major New Zealand Defence Force capital equipment and infrastructure projects.
The Government of New Zealand's defence policy objectives are set out in the government's Defence Policy Framework, released in June 2000. The five key objectives for New Zealand's defence policy are:
To defend New Zealand and to protect its people, land, territorial waters, exclusive economic zone, natural resources and critical infrastructure.
To meet New Zealand's alliance commitments to Australia by maintaining a close defence partnership in pursuit of common security interests.
To assist in the maintenance of security in the South Pacific and to provide assistance to New Zealand's Pacific neighbours.
To play an appropriate role in the maintenance of security in the Asia-Pacific region, including meeting New Zealand's obligations as a member of the Five Power Defence Arrangements.
To contribute to global security and peacekeeping through participation in the full range of United Nations and other appropriate multilateral peace support and humanitarian relief operations.
The framework led to the government's plan for a modern, professional and well-equipped defence force with the military capabilities to meet New Zealand's objectives, outlined on 8 May 2001 in the government defence statement – A Modern, Sustainable Defence Force Matched to New Zealand's Needs.
Key features of the plan are:
A joint approach to structure and operational orientation.
A modernised army.
A practical navy fleet matched to New Zealand's wider security needs.
A refocused and updated air force.
A funding commitment to provide financial certainty.
Under the 2002 Long-Term Development Plan, the New Zealand Defence Force is being reconfigured to increase its sustainability and affordability. The aim is to enhance the ability of all three services to undertake combat and peace support operations. In recent years, all three services have acquired, or are to acquire, new capabilities and equipment:
Communications equipment is being continually upgraded. Counter-terrorist, improvised explosive device disposal and neutralisation of chemical and biological devices capabilities have been introduced.
Seven new ships/patrol vessels for the navy are being delivered in 2006 and 2007, including an 8,000 tonne multi-role/sealift/training ship, two 1,800 tonne helicopter-capable offshore patrol vessels and four 55-metre inshore patrol vessels.
The army has been re-equipped with new tactical radios, 105 light armoured vehicles, direct fire support weapons (automatic grenade launchers), medium range anti-armour weapons (Javelin missiles) and a deployable air defence system (Mistral surface to air missiles). Three hundred and twenty-one light operational vehicles are also being delivered.
The mission, communications and navigation systems of the six P-3K Orion maritime patrol aircraft are being upgraded. The service life of the five C-130H Hercules transport aircraft fleet is being extended and communications and navigation systems are being upgraded. Two Boeing 757–200 aircraft have replaced two Boeing 727 aircraft and are being converted to handle both passengers and freight. Eurocopter NH90 medium utility helicopters are to replace the existing Iroquois fleet. A replacement training/light utility helicopter will also be acquired.
These acquisitions will increase the ability of the New Zealand Defence Force to defend New Zealand's interests and to contribute effectively to international and regional peace and security.
While New Zealand may not face a direct military threat from another country in the foreseeable future, the security of the country and citizens is threatened by non-military groups, such as terrorists, international criminals and resource poachers.
Deployment of New Zealand Defence Force personnel to trouble spots around the world demonstrates New Zealand's commitment to international peace and security. During 2005, defence force personnel and force elements were deployed to Afghanistan and the Arabian Gulf region in the international fight against terrorism.
New Zealand Defence Force personnel were also deployed to longer-standing commitments in the Middle East, the Balkans, North-east and South-east Asia and Africa.
Principal New Zealand Defence Force locations are shown in Figure 4.02.
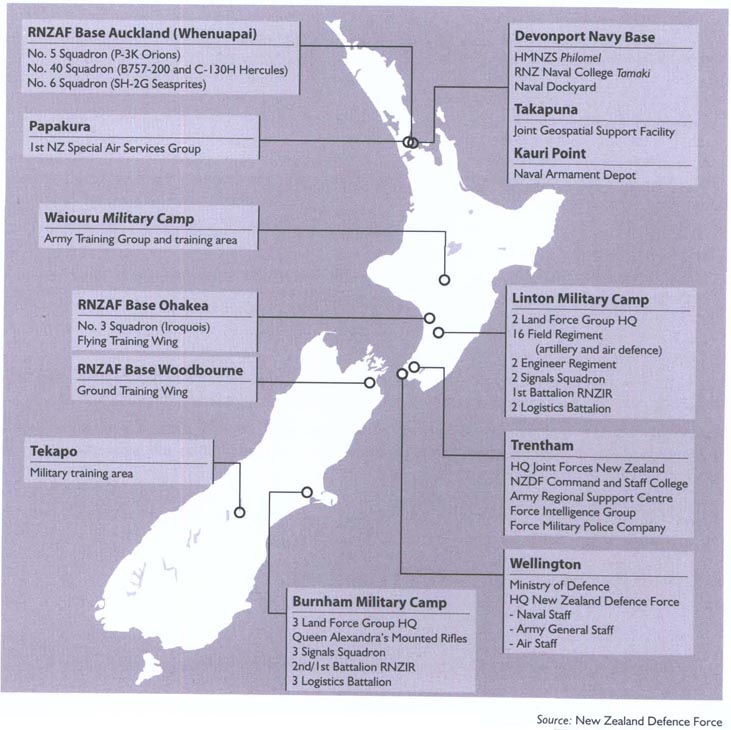
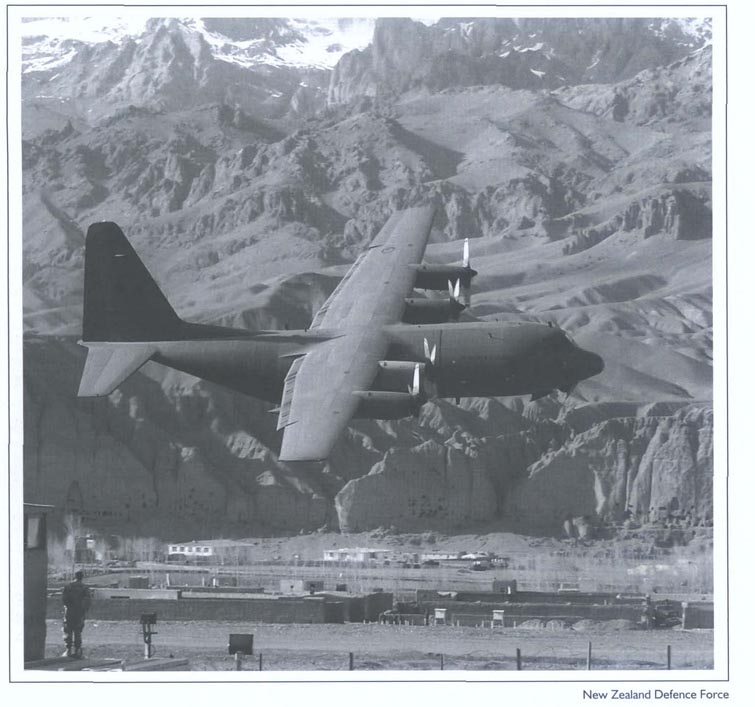
An RNZAF C-130H over Kiwi Base, Bamyan Province, Afghanistan, where 120 New Zealand Defence Force personnel are deployed as a provincial reconstruction team.
Five Power Defence Arrangements. Concern about security arrangements in South-east Asia led to the establishment, in 1971, of the Five Power Defence Arrangements (FPDA), involving New Zealand, Australia, Singapore, Malaysia and the United Kingdom. Consultative in nature, the arrangements aim to contribute to the security of Malaysia and Singapore and to the long-term stability of the region. Members take part in an exercise programme that increases the ability of the five countries’ armed forces to operate with each other. Defence ministers and defence chiefs meet regularly and there is a range of other exchanges. The exercises and contacts which New Zealand has with Malaysia and Singapore and the other partners is an important part of the New Zealand Defence Force's training programme and has expanded significantly in recent years. The FPDA continues to evolve to meet the challenges of the changing security environment, with attention now being given to combating nontraditional threats such as maritime terrorism, piracy and people smuggling. Scenarios based around these threats are being introduced into exercises.
Mutual Assistance Programme. Most South Pacific countries, some members of the Association of South-East Asian Nations (ASEAN) and Timor-Leste participate in the New Zealand Defence Force's Mutual Assistance Programme. Through training cooperation and advisory assistance, the programme contributes to the effectiveness of defence forces and law enforcement agencies in New Zealand's South Pacific neighbourhood. The programme also supports development projects in the South Pacific by using the engineering and trade skills of the armed forces. Training is provided in New Zealand and training and technical teams are deployed overseas. Military instructors are attached to other armed forces for periods of up to two years in the Cook Islands, Samoa, Tonga, Vanuatu and Malaysia.
Australia. There is no strategic partnership in the South-west Pacific closer than that between Australia and New Zealand. A close defence relationship with Australia in support of common interests for a secure and peaceful region is a key policy objective in the government's Defence Policy Framework. Both countries share a strong commitment to the security and stability of the Asia-Pacific region, as reflected in combined efforts in Bougainville, East Timor and the Solomon Islands. The security relationship between Australia and New Zealand is embodied by the policy of Closer Defence Relations, adopted in 1991 and realised through a programme of cooperative activities designed to give the relationship practical effect.
ANZUS. The ANZUS security treaty between Australia, New Zealand and the United States came into force in 1952. The United States, however, is not prepared to accept restrictions on access to New Zealand ports for nuclear-powered or nuclear-armed ships of the United States Navy and the ANZUS Council has not met since 1984.
Liaison with other countries. To facilitate exchanges on military matters, defence representatives are posted to many of New Zealand's overseas diplomatic missions, with some of those representatives accredited to more than one country. These countries are Australia, Canada, China, Fiji, Indonesia/ Timor-Leste, Malaysia/Brunei, Cook Islands/Niue, Papua New Guinea/Vanuatu/Solomon Islands, Philippines, Japan, Korea, Singapore, Thailand/Laos/Cambodia/Vietnam, United Kingdom/Germany/France/Belgium/Italy/Ireland, and the United States. Military representatives are also accredited to multilateral bodies. One representative is posted to New Zealand's United Nations New York mission and the representative in the United Kingdom is accredited to the European Union and the North Atlantic Treaty Organisation. In addition, a number of countries have military representatives attached to their diplomatic missions in Wellington or have service attachés accredited to, but not resident in, New Zealand.
United Nations Truce and Supervisory Organisation. New Zealand military observers have worked with the United Nations Truce and Supervisory Organisation (UNTSO) in Israel, Lebanon and Syria since 1954. A New Zealand Major General is Head of Mission of UNTSO and another officer is Chief of the Observer Group in Lebanon. Seven more NZDF personnel are deployed as military observers. They monitor ceasefires, supervise armistice agreements, prevent isolated incidents from escalating and assist in subsequent peacekeeping operations.
Multinational Force and Observers, Sinai. The Multinational Force and Observers (MFO), Sinai was established in April 1982 to verify compliance with the terms of the 1979 peace treaty between Egypt and Israel. Eleven countries contribute to the MFO, including New Zealand, whose 26-strong contingent comprises a training and advisory team, a heavy transport section, engineers and staff officers.
Former Yugoslavia. The New Zealand Defence Force contributes eight personnel (who serve in liaison and observation teams) to British Army units assigned to European Union Force Command in Bosnia-Herzegovina. It has three staff officers at the liaison and observation teams’ headquarters and a fourth staff officer who serves as a Military Liaison Officer at Headquarters of the United Nations Mission in Kosovo (UNMIK).
Timor-Leste. In mid-1999, the Indonesian Government agreed to hold a plebiscite in East Timor to decide the future of that part of the island. The United Nations Assistance Mission in East Timor (UNAMET), to which New Zealand provided civilian police and military personnel, was established to oversee the referendum. Following the failure of UNAMET to halt violence in East Timor, the United Nations agreed to sanction a multinational force, International Force East Timor (INTERFET), to restore order until a United Nations-mandated force could be established. New Zealand deployed ground troops, a helicopter detachment and naval units in support of INTERFET. The ground troops and the helicopter detachment were subsumed into the United Nations Interim Administration in East Timor (UNTAET) in January 2000. The United Nations Mission in Support of East Timor (UNMISET), the successor to UNTAET, stood up in May 2002, and most New Zealand troops have now been withdrawn. In April 2005, the United Nations Security Council approved establishment of the United Nations Office in Timor-Leste (UNOTIL) to replace UNMISET. New Zealand has a military observer serving with UNOTIL and three New Zealand Defence Force personnel are assisting with training of the Timor-Leste Defence Force. A Mutual Assistance Programme with Timor-Leste was established in 2005, to provide a framework for training assistance in the longer term.
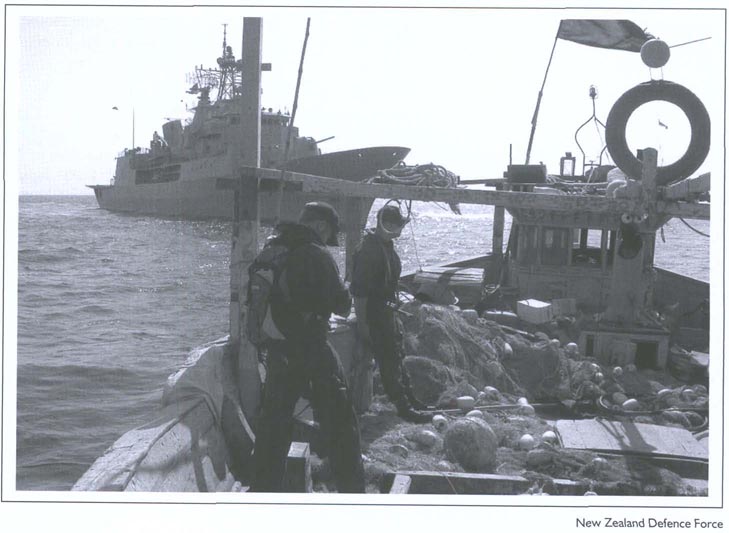
HMNZS Te Kaha on boarding operations as part of the maritime interdiction force in the North Arabian Sea.
Regional Assistance Mission to the Solomon Islands. The Regional Assistance Mission to the Solomon Islands (RAMSI) was deployed following a request from Solomon Islands’ Prime Minister Kanaleeza in July 2003 for assistance in restoring security, particularly on the islands of Guadalcanal and Malaita. RAMSI is an Australian-led mission comprising Australian, Papua New Guinean, Fijian, New Zealand and Tongan officials, elements of the Australian Defence Force, the New Zealand Defence Force and police officers from Australia, New Zealand and Pacific countries. New Zealand initially contributed 230 personnel to RAMSI, although the mission is now scaling down. The New Zealand Defence Force deployed a 30-strong platoon and a three-person National Support Element between November 2004 and February 2005 and deployed another infantry platoon in 2006.
Iraq. After the return to New Zealand in September 2004 of the 61 New Zealand Defence Force personnel attached to a British Engineer Regiment in Basra, only one defence force officer remains in Iraq. That officer serves as a Military Liaison Adviser with the United Nations Assistance Mission in Iraq.
Arabian Gulf. Six New Zealand Defence Force personnel are based in the Arabian Gulf to provide logistical support to defence force operations in the region.
Sudan. Two New Zealand Defence Force military observers and one staff officer are serving with the United Nations Mission in Sudan.
Afghanistan. One hundred and twenty-two New Zealand Defence Force personnel are deployed as the New Zealand Provincial Reconstruction Team (PRT) in the province of Bamyan in central Afghanistan. Three other personnel are attached to the International Security Assistance Force Headquarters in Kabul. Another defence force officer works as a Military Liaison Officer to the United Nations Assistance Mission to Afghanistan (UNAMA). Two New Zealand Defence Force personnel serve at the Headquarters of the Combined Forces Command Afghanistan and Coalition Joint Task Force 76. Two more New Zealand Defence Force personnel assist in the training of the Afghan National Army as part of the Kabul-based United Kingdom Afghan National Army Training Team. Three New Zealand Defence Force staff officers are based at Central Command Headquarters in Florida to provide planning advice and support for the New Zealand personnel contributing to Operation Enduring Freedom in Afghanistan. A contingent drawn from the New Zealand Special Air Service Group that deployed to Afghanistan in 2005 has now returned.
South Korea. Three New Zealand Defence Force officers serve with the United Nations Command Military Armistice Commission in South Korea.
Casualties. There have been five fatalities among New Zealand Defence Force personnel serving in United Nations observer and peacekeeping missions.
New Zealand Cadet Forces. Cadet forces comprise the Sea Cadet Corps, the New Zealand Cadet Corps and the Air Training Corps. These are community-based youth groups that receive assistance from the New Zealand Defence Force and support from the Sea Cadet Association of New Zealand, the Cadet Corps Association of New Zealand, the Air Training Corps Association of New Zealand, community organisations and the Royal New Zealand Returned Services’ Association. During 2004/05, the New Zealand Defence Force supported 107 cadet units with a total strength of 3,095 cadets and 298 officers.
Limited Service Volunteer Scheme. Limited service volunteer training courses have been run by the army since 1995, with additional staffing support provided by the navy and air force since 1998. The programme provides unemployed volunteers between the ages of 17 and 25 with six weeks of residential motivational training in a military cultural environment, teaching outdoor activities and general life skills.
Disaster relief. The New Zealand Defence Force provides assistance to civil authorities in the wake of natural disasters in New Zealand, the Pacific and South-east Asia. Assistance can include post-disaster reconnaissance of damage; transportation of relief, food and medical supplies; and the provision of medical, engineering and communications services. Recent examples include assistance during civil defence emergencies caused by floods in 2004 and 2005 in Eastern Bay of Plenty, Manawatu/Rangitikei and Tauranga; post-cyclone damage assessment and delivery of supplies in Niue and the Cook Islands; and deployment of Boeing 757–200 and C-130H aircraft and up to 61 personnel to South-east Asia following the Boxing Day 2004 tsunami.
Fisheries protection. Royal New Zealand Air Force P-3K Orions and Royal New Zealand Navy vessels patrol New Zealand's 200-mile Exclusive Economic Zone (EEZ). Information from surveillance patrols is passed to the Ministry of Fisheries. Fisheries officers are sometimes carried on board aircraft or ships when patrols are conducted. The air force conducted numerous patrols in the New Zealand and South Pacific EEZs during 2004/05 and also patrolled the Southern Ocean.
Search and rescue. All three New Zealand Defence Force services maintain a search and rescue capability, with naval and air units on 24-hour standby. The navy and air force assist in extensive sea searches, while the army and the air force assist police in land searches and rescues. The air force also carries out emergency medical evacuations throughout New Zealand, the South Pacific and Antarctica. In 2004/05, the air force recorded the highest number of search and rescue hours flown for 11 years.
Operation Antarctica. Up to 69 New Zealand Defence Force personnel support Operation Antarctica in terminal and logistic support operations at Harewood in Christchurch, McMurdo Station and Scott Base for varying periods during the September to February Antarctic summer season.
Royal New Zealand Air Force C-130H Hercules aircraft made 11 return flights to McMurdo in 2004/05.
Border surveillance. The Royal New Zealand Navy and the Royal New Zealand Air Force support the New Zealand Customs Service in maintaining border security and reducing the risks that may arise as a result of the movement of people, goods and craft into and out of New Zealand. As one of the New Zealand Defence Force's Multi-Agency Operations and Tasks, its liaison with Customs will increase in importance as the navy's new offshore and inshore patrol vessels are introduced into service.
Other assistance. Other assistance provided by the New Zealand Defence Force includes transportation of Department of Conservation personnel to New Zealand's outlying islands, ceremonial support for state occasions, helicopter and logistic support to the police, assistance with fire fighting and explosive ordnance disposal.
Defence funding is voted by parliament to two organisations, the Ministry of Defence and the New Zealand Defence Force. The two organisations’ expenditure is consolidated in Table 4.02.
Table 4.02. Defence expenditure
Years ending 30
June
| Item | 2002 | 2003 | 2004 | 2005 |
|---|---|---|---|---|
1Non-cash technical adjustments. 2In addition to departmental expenses appropriated to Vote Defence, Vote Defence Force and Vote Veterans Affairs – Defence, there has been additional Non Departmental – Expenditure separately appropriated under the Defence Force Allowance programme to Vote Social Development as follows: 3Amounts subsequently recovered by New Zealand Defence Force to provide for long-term working capital requirements. -nil or zero Sources: New Zealand Defence Force Ministry of Defence | ||||
| $(000) | ||||
| Personnel costs | 528,721 | 526,104 | 561,887 | 576,119 |
| Operating costs | 428,185 | 441,505 | 461,666 | 443,561 |
| Depreciation | 209,458 | 211,402 | 229,678 | 232,669 |
| Capital charge | 266,668 | 261,902 | 289,139 | 281,894 |
| Total output expenses | 1,433,032 | 1,440,913 | 1,542,370 | 1,534,243 |
| Other expenses1 | - | 23,414 | 72,000 | (3,266) |
| Total expenses2 | 1,433,032 | 1,464,327 | 1,614,370 | 1,530,977 |
| Less - | ||||
| Other revenue | (24,059) | (21,166) | (17,202) | (17,037) |
| Profit on sale of assets3 | - | - | (25,483) | (40,762) |
| Net operating surplus/(deficit) | 2,431 | (16,708) | (46,296) | 63,468 |
| Revenue Crown-provided | 1,411,404 | 1,426,453 | 1,525,389 | 1,536,646 |
| Years ending 30 June | ||||
|---|---|---|---|---|
| Item | 2002 | 2003 | 2004 | 2005 |
| $(000) | ||||
| Defence force allowance | 22,910 | 13,004 | 12,311 | 9,850 |
Table 4.03 compares New Zealand's defence expenditure internationally for the period 1997 to 2004.
Table 4.03. International comparison of defence expenditure
| As proportion of gross domestic product | ||||||||
|---|---|---|---|---|---|---|---|---|
| 1997 | 1998 | 1999 | 2000 | 2001 | 2002 | 20031 | 20041 | |
1Estimated. 2Year ending 30 September; US budget definition differs from NATO definition. 3Years ending 31 March. 4Years ending 30 June. 5Using NATO definition, excluding GST, capital charge and war pensions. Source: New Zealand Defence Force | ||||||||
| Percent | ||||||||
| United States2 | 3.2 | 3.0 | 2.9 | 3.2 | 3.1 | 3.0 | 3.3 | 4.0 |
| United Kingdom3 | 3.0 | 2.7 | 2.7 | 2.5 | 2.4 | 2.4 | 2.4 | 1.5 |
| Australia4 | 2.0 | 1.9 | 1.9 | 1.8 | 1.9 | 2.3 | 2.3 | 2.6 |
| Sweden4 | 2.3 | 2.3 | 2.1 | 2.2 | 2.9 | 1.9 | 1.8 | 1.7 |
| Canada3 | 1.3 | 1.2 | 1.3 | 1.2 | 1.1 | 1.2 | 1.2 | 1.3 |
| New Zealand4 | 1.4 | 1.4 | 1.35 | 1.35 | 1.15 | 1.15 | 1.15 | 1.15 |
Table 4.04 shows defence force personnel numbers for the period 1994 to 2005.
Table 4.04. Defence personnel
At 30
June
| Navy | Army | Air Force | Total | Civilians (NZDF and MoD) | |
|---|---|---|---|---|---|
| Sources: New Zealand Defence Force Ministry of Defence | |||||
| 1994 | 2,188 | 4,516 | 3,368 | 10,072 | 2,513 |
| 1995 | 2,152 | 4,510 | 3,296 | 9,958 | 2,024 |
| 1996 | 2,074 | 4,349 | 3,188 | 9,611 | 2,103 |
| 1997 | 2,080 | 4,391 | 2,991 | 9,462 | 2,243 |
| 1998 | 2,104 | 4,431 | 2,991 | 9,526 | 2,195 |
| 1999 | 2,080 | 4,417 | 2,885 | 9,382 | 1,912 |
| 2000 | 1,967 | 4,513 | 2,786 | 9,266 | 1,936 |
| 2001 | 1,893 | 4,580 | 2,624 | 9,097 | 1,877 |
| 2002 | 1,911 | 4,492 | 2,194 | 8,597 | 1,879 |
| 2003 | 1,969 | 4,388 | 2,245 | 8,602 | 1,923 |
| 2004 | 1,953 | 4,479 | 2,249 | 8,681 | 2,025 |
| 2005 | 1,910 | 4,438 | 2,266 | 8,614 | 2,092 |
Command and administration. The Chief of Navy exercises full command of the navy, although the fleet is tasked by the Commander Joint Forces New Zealand through the Maritime Component Commander, based at Headquarters Joint Forces New Zealand at Trentham. The Deputy Chief of Navy, based at Naval Staff, in Wellington, is responsible to the Chief of Navy for the navy's ‘raise, train and maintain’ functions.
Shore establishments. The naval base at Devonport, Auckland, known as HMNZS Philomel, consists of the navy's main naval barracks, wharf facilities, weapons ranges and administrative units; the Royal New Zealand Naval College, which is the navy's training establishment; the naval hospital; and the naval supply and armament depots. The base also contains the naval dockyard, an engineering and support facility managed by a private company under contract. HMNZS Wakefield is the administrative unit for naval personnel in the Wellington area. There are four Royal New Zealand Naval Volunteer Reserve units in the main centres – HMNZS Ngapona in Auckland, HMNZS Olphert in Wellington, HMNZS Pegasus in Christchurch and HMNZS Toroa in Dunedin. There is also a Port Headquarters in Tauranga.
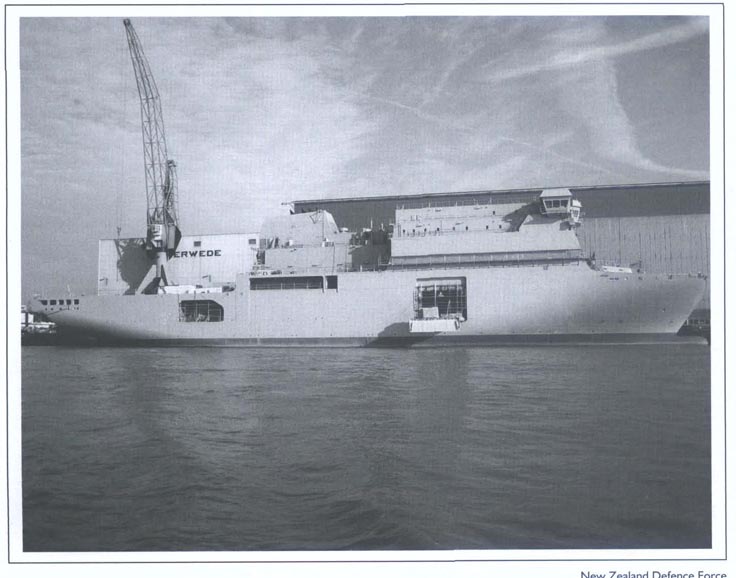
The Royal New Zealand Navy's Multi-Role Vessel being built in Rotterdam will be capable of transporting the army's light armoured vehicles and light operational vehicles, as well as 250 troops and one Seasprite and four NH90 helicopters.
Table 4.05 lists the navy's ships and helicopters, while Table 4.06 shows navy personnel from 1999 to 2005.
Table 4.05. State of the navy
| Ship/helicopter type | Name | Force |
|---|---|---|
Note:Between December 2006 and December 2007, the navy will take delivery of seven new vessels: an 8,000-tonne multi role vessel (MRV), two 1,800-tonne helicopter-capable offshore patrol vessels (OPVs), and four 55-metre inshore patrol vessels (IPVs). Source: New Zealand Defence Force | ||
| ANZAC-class frigates | Te Kaha | Naval combat |
| Te Mana | ||
| Logistics (fleet replenishment) | Endeavour | Naval support |
| Survey ship | Resolution | Hydrographic support |
| Diving support ship | Manawanui | Diving support |
| Training tender | Kahu | Sea training |
| Inshore patrol craft | Hinau | Training, mine countermeasures |
| Kiwi | Training, mine countermeasures | |
| Wakakura | Training, mine countermeasures | |
| Moa | Training, mine countermeasures | |
| 5 Kaman Seasprite SH-2G helicopters | Seasprite | Naval aviation |
Table 4.06. Strength of the navy
At 30
June
| Category | 1999 | 2000 | 2001 | 2002 | 2003 | 2004 | 2005 |
|---|---|---|---|---|---|---|---|
| Source: New Zealand Defence Force | |||||||
| Regular Force (all ranks) | 2,080 | 1,967 | 1,893 | 1,918 | 1,978 | 1,953 | 1,910 |
| Royal New Zealand Naval | |||||||
| Volunteer Reserve (all ranks) | 401 | 385 | 385 | 357 | 354 | 317 | 327 |
| Total uniformed | 2,481 | 2,352 | 2,278 | 2,275 | 2,332 | 2,270 | 2,237 |
| Civilian employees | 524 | 453 | 434 | 444 | 441 | 436 | 40 |
| Total navy | 3,005 | 2805 | 2,712 | 2,719 | 2,773 | 2,706 | 2,646 |
The New Zealand Army is organised, equipped and trained to provide a flexible range of units and sub-units for deployments of up to a battalion group in size. It can respond to lower level contingencies in the Asia-Pacific region, or contribute to a collective force, including a United Nations force.
The Chief of Army, under the Chief of Defence Force, retains full command of the army. The Chief of Army is assisted in fulfilling that position's statutory command requirements by the Army General Staff (Army GS). The Army GS has both a policy formulation and a policy implementation role.
The Land Component Commander (LCC), under the Commander Joint Forces New Zealand (COMJFNZ), commands operational elements of the army. The LCC, through the COMJFNZ, is assigned operational command of the 2nd Land Force Group, primarily based at Linton, and the 3rd Land Force Group, primarily based at Burnham, and commands all regular and territorial force units, with the exception of those elements assigned to the Army Training Group (ATG). The ATG, primarily based in Waiouru, reports directly to Army General Staff and is responsible for most of the individual training conducted within the army.
Army specialist units, based at Auckland and Trentham, include a Special Air Service Group and a Military Police company, and are commanded by the LCC.
Table 4.07 lists army headquarters and units and Table 4.08 shows army personnel from 1999 to 2005.
Table 4.07. State of the army
| HQs/units | Locations | Role |
|---|---|---|
Note: CSCombat Support,CSSCombat Service Support,TFTerritorial Force. Source: New Zealand Defence Force | ||
| Army General Staff | Wellington | Command |
| 1 NZ Special Air Service Group | Auckland | Special forces |
| Force Military Police Company | Trentham | CSS |
| HQ 2 Land Force Group | Linton | Command |
| 16 Field Regiment | Linton | CS |
| 1 Bn. Royal NZ Infantry Regiment | Linton | Combat |
| 3 Auckland and Northland Bn. Gp | Auckland | TF |
| 5 Wellington, West Coast and Taranaki Bn. Gp | Wanganui | TF |
| 6 Hauraki Bn. Gp | Tauranga | TF |
| 7 Wellington and Hawke's Bay Bn. Gp | Napier | TF |
| 2 Engineer Regiment | Linton | CS |
| 2 Signals Squadron | Linton | CS |
| Force Intelligence Group | Trentham | CS |
| 2 Logistics Battalion | Linton | CSS |
| 2 Health Services Battalion | Linton | CSS |
| HQ 3 Land Force Group | Burnham | Command |
| Queen Alexandra's Mounted Rifles | Burnham | Combat |
| 2/1 Bn. Royal NZ Infantry Regiment | Burnham | Combat |
| 2 Canterbury, Nelson, Marlborough and West Coast Bn. Gp | Burnham | TF |
| 4 Otago and Southland Bn. Gp | Dunedin | TF |
| 3 Field Troop | Burnham | CS |
| 3 Signals Squadron | Burnham | CS |
| 3 Logistics Battalion | Burnham | CSS |
| HQ Army Training Group | Waiouru | Command |
| Land Operations Training Centre | Waiouru | Training |
| The Army Depot | Waiouru | Training |
| Officer Cadet School | Waiouru | Training |
| Trentham Regional Support Centre | Trentham | Static Support |
Table 4.08. Strength of the army
At 30
June
| Category | 1999 | 2000 | 2001 | 2002 | 2003 | 2004 | 2005 |
|---|---|---|---|---|---|---|---|
| Source: New Zealand Defence Force | |||||||
| Regular Force | |||||||
| Officers | 652 | 731 | 742 | 735 | 732 | 729 | 746 |
| Other ranks | 3,765 | 3,782 | 3,838 | 3,757 | 3,656 | 3,750 | 3,692 |
| Total | 4,417 | 4,513 | 4,580 | 4,492 | 4,388 | 4,479 | 4,438 |
| Territorial Force (all ranks) | 3,085 | 2,474 | 2,159 | 2,158 | 2,031 | 1,856 | 1,888 |
| Total uniformed | 7,502 | 6,987 | 6,739 | 6,650 | 6,419 | 6,335 | 6,326 |
| Civilians | 734 | 723 | 643 | 779 | 687 | 684 | 706 |
| Total army | 8,236 | 7,710 | 7,382 | 7,429 | 7,106 | 7,019 | 7,032 |
Command and administration. The Royal New Zealand Air Force provides a maritime patrol force, a fixed wing transport force and a rotary wing transport force. The Chief of Air Force, supported by the Air Staff, commands the air force.
Organisation. The Air Component Commander within Headquarters Joint Forces New Zealand commands the Royal New Zealand Air Force's deployable operational units. The broad range of activities carried out to raise, train and maintain the operational units of the air force is provided under the direction of the air staff. Operational flying units are based at RNZAF Base Auckland and RNZAF Base Ohakea. RNZAF Base Ohakea also hosts primary and advanced flying training, while most ground training is done at RNZAF Base Woodbourne.
Logistics. Royal New Zealand Air Force logistics services are coordinated by Air Staff with specific levels of aircraft maintenance and supply support performed by operational squadrons and base logistics units. Much of the depot-level repair and overhaul work is contracted to private companies in New Zealand and overseas. RNZAF training aircraft are maintained and supported by private contractors.
Table 4.09 lists air force aircraft and Table 4.10 overleaf shows air force personnel from 1999 to 2005.
Table 4.09. State of the air force
| Aircraft | Location | |
|---|---|---|
| Source: New Zealand Defence Force | ||
| 6 P-3K Orions | RNZAF Base Auckland | Maritime Patrol Force |
| 2 Boeing 757–200s | RNZAF Base Auckland | Fixed Wing Transport Force |
| 5 C-130H Hercules | RNZAF Base Auckland | Fixed Wing Transport Force |
| 5 SH-2G Seasprite | RNZAF Base Auckland | Naval Helicopter Force |
| 14 Bell UH-1H Iroquois | RNZAF Base Ohakea | Rotary Wing Transport Force |
| 5 Bell 47G Sioux | RNZAF Base Ohakea | Flying training |
| 13 CT-4E Air Trainers | RNZAF Base Ohakea | Flying training |
| 5 King Air B200s | RNZAF Base Ohakea | Flying training |
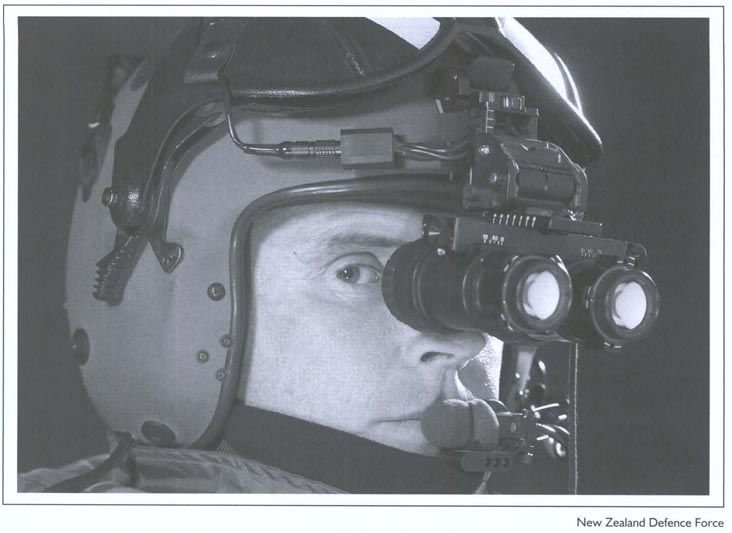
The primary role of the RNZAF Iroquois fleet is to provide tactical air transport to both conventional and counter-terrorist military operations. Here an Iroquois crew member tests night vision goggles.
Table 4.1. Strength of the air force
At 30
June
| Category | 1999 | 2000 | 2001 | 2002 | 2003 | 2004 | 2005 |
|---|---|---|---|---|---|---|---|
| Source: New Zealand Defence Force | |||||||
| Regular force | |||||||
| Officers | 619 | 596 | 571 | 509 | 508 | 523 | 541 |
| Other ranks | 2,266 | 2,190 | 2,053 | 1,714 | 1,718 | 1,726 | 1,725 |
| Total | 2,885 | 2,786 | 2,624 | 2,223 | 2,226 | 2,249 | 2,266 |
| Territorial force (all ranks) | 163 | 161 | 176 | 157 | 155 | 32 | 28 |
| Total uniformed | 3,048 | 2,947 | 2,800 | 2,380 | 2,381 | 2,281 | 2,294 |
| Civilians | 371 | 384 | 411 | 390 | 412 | 402 | 376 |
| Total air force | 3,419 | 3,331 | 3,211 | 2,770 | 2,793 | 2,683 | 2,670 |
New Zealand's role in creation of the United Nations (UN), its opposition to nuclear testing, establishment of a nuclear-free New Zealand and practical contributions to UN peacekeeping and de-mining operations, mean its voice on disarmament and arms control is listened to with respect.
New Zealand also exerts influence in cooperation with other like-minded countries, for example through its membership of the New Agenda Coalition (Brazil, Egypt, Ireland, Mexico, New Zealand, South Africa and Sweden), a strong advocate for multilateral progress towards nuclear disarmament.
The Ministry of Foreign Affairs and Trade's Disarmament Division includes five officers responsible for policy and treaty implementation. They prepare advice on disarmament and arms control issues for the Minister for Disarmament and Arms Control, represent New Zealand at international meetings and ensure that New Zealand's international legal obligations are implemented at the national level.
Officers of the ministry based overseas, including an Ambassador for Disarmament, are involved in negotiations and activities with disarmament organisations, mainly in Geneva, Vienna, New York and The Hague.
The government values the views of New Zealand's non-government peace and disarmament groups, whose representatives join official delegations to international meetings to contribute their advice and perspective on the pursuit of New Zealand's disarmament goals.
A statutory body, the Public Advisory Committee on Disarmament and Arms Control (PACDAC) was established under the New Zealand Nuclear Free Zone, Disarmament and Arms Control Act 1987 to:
Advise the Minister of Foreign Affairs and Trade on such aspects of disarmament and arms control matters as it thinks fit.
Advise the Prime Minister on implementation of the act.
Publish reports on disarmament and arms control matters and on implementation of the act.
Make recommendations for grants from the Peace and Disarmament Education Trust, established from Rainbow Warrior compensation funds, and make grants from the UN Disarmament and Education Implementation Fund.
PACDAC comprises nine members, including the Minister for Disarmament and Arms Control who is the chair. The other eight are appointed by the Minister of Foreign Affairs and Trade for three-year terms.
Inspector-General of Intelligence and Security. The Inspector-General of Intelligence and Security assists the prime minister in the oversight and review of the Security Intelligence Service and the Government Communications Security Bureau. The inspector-general also ensures that each organisation's activities are lawful and that any complaints about either of them are independently investigated. The inspector-general is appointed by the governor-general on the recommendation of the prime minister following consultation with the leader of the opposition.
The New Zealand Security Intelligence Service (NZSIS) is a government agency with approximately 150 staff, a head office in Wellington and regional offices in Auckland and Christchurch.
Principal functions of the NZSIS are to obtain, correlate and evaluate intelligence relevant to New Zealand's security and to advise ministers on security matters. These functions are outlined in the New Zealand Security Intelligence Service Act 1969 and amendments.
The legislation specifies that the act does not limit the right of people to engage in lawful protest, advocacy or dissent, and that it is not a function of the service to enforce measures of security.
The NZSIS reports directly to the Minister in Charge of the NZSIS, traditionally the prime minister, and the director is required by legislation to also consult regularly with the leader of the opposition, to keep him or her informed about matters relating to security.
The service is subject to oversight and review by the Inspector-General of Intelligence and Security and by the intelligence and security committee of parliament.
Responsible to the prime minister, the Government Communications Security Bureau (GCSB) provides information, advice and assistance to the New Zealand Government, government departments and organisations.
The GCSB is subject to oversight and review under the Intelligence and Security Committee Act 1996 and the Inspector-General of Intelligence and Security Act 1996.
Its functions are:
Communications security and computer security – protecting information that is processed, stored or communicated by electronic or similar means, including formulation of communications security and computer security policy; promulgation of standards and provision of material, advice and assistance to government departments and authorities, including the New Zealand armed forces, on matters relating to the security and integrity of official information, the loss or compromise of which could adversely affect national security; provision of advice as required by government departments and authorities in relation to official information which, although unrelated to national security, requires protection from disclosure to protect the functions of government, and for privacy, safety and commercial reasons.
Critical infrastructure protection – provision of warnings, guidance and coordination of the national response to information technology-based threats to New Zealand's critical infrastructures (i.e. power, telecommunications, emergency services, banking and finance, transport and government) through operation of a Centre for Critical Infrastructure Protection.
Technical security – providing defence against eavesdropping and other forms of technical attack against New Zealand Government premises worldwide.
Signals intelligence – providing foreign signals intelligence to meet the national intelligence requirements of the New Zealand Government.
The GCSB head office is in Wellington and it operates two communications stations, at Tangimoana and Waihopai.
Part of the Department of the Prime Minister and Cabinet, the External Assessments Bureau produces intelligence assessments of events and trends overseas to support informed decision-making by the government on events or trends likely to influence New Zealand's foreign relations and external interests.
The staff of about 30 identify, collate, evaluate and analyse information collected from a range of sources and prepare assessments and reports on political, economic, biographic, strategic and scientific matters.
Table 4.11 lists annual expenditure on the three intelligence and security agencies since 1993.
Table 4.11. Expenditure on intelligence and security agencies
Years ending 30 June
| EAB | NZSIS | GCSB | |
|---|---|---|---|
Sources: External Assessments Bureau New Zealand Security Intelligence Service Government Communications Security Bureau | |||
| $(000) | |||
| 1993 | 2,256 | 10,304 | 20,967 |
| 1994 | 2,289 | 9,987 | 19,279 |
| 1995 | 2,121 | 9,964 | 19,498 |
| 1996 | 2,216 | 9,968 | 18,496 |
| 1997 | 2,274 | 10,514 | 18,506 |
| 1998 | 2,287 | 10,583 | 19,083 |
| 1999 | 2,292 | 11,500 | 21,289 |
| 2000 | 2,462 | 10,956 | 19,327 |
| 2001 | 2,541 | 11,690 | 20,116 |
| 2002 | 2,709 | 13,376 | 23,216 |
| 2003 | 3,129 | 15,655 | 29,154 |
| 2004 | 3,079 | 17,206 | 29,754 |
| 2005 | 3,040 | 22,433 | 38,963 |
4.1 Ministry of Foreign Affairs and Trade.
4.2 New Zealand Aid.
4.3 Ministry of Foreign Affairs and Trade; New Zealand Aid.
4.4 Ministry of Foreign Affairs and Trade.
4.5 New Zealand Defence Force.
4.6 Ministry of Foreign Affairs and Trade.
4.7 Department of the Prime Minister and Cabinet; New Zealand Security Intelligence Service; Government Communications Security Bureau; Office of the Inspector General of Intelligence and Security.
www.dpmc.govt.nz – Department of Prime Minister and Cabinet
www.gcsb.govt.nz – Government Communications Security Bureau
www.defence.govt.nz – Ministry of Defence
www.mfat.govt.nz – Ministry of Foreign Affairs and Trade
www.nzaid.govt.nz – New Zealand Aid
www.army.mil.nz – New Zealand Army
www.nzdf.mil.nz – New Zealand Defence Force
www.nzsis.govt.nz – New Zealand Security Intelligence Service
www.airforce.mil.nz – Royal New Zealand Air Force
www.navy.mil.nz – Royal New Zealand Navy
www.stats.govt.nz – Statistics New Zealand
Table of Contents
The primary school age population of New Zealand in 2021 is projected to drop to 440,000, a 7 percent decrease on the 2004 figure.
The population of New Zealand reached 500,000 in 1880, boosted by the introduction of government-assisted immigration. The first million was passed in 1908, following economic recovery from the depression of the 1880s and 1890s. In the aftermath of World War II, the growth rate climbed dramatically, compared with stagnation in the early 1930s, as the baby boom and increased immigration took effect. The second million of population was reached in 1952, 44 years after the first million, and the third was added only 21 years later, in 1973. Nearly 20 percent of the population growth during this period came from net immigration. According to the estimated resident population of New Zealand, the fourth million was reached in April 2003. Nearly all the population growth from 3 million to 4 million was due to natural increase, with migration not contributing significantly.
Figure 5.01 tracks New Zealand's historical and projected population and growth rate from 1951 to 2051.
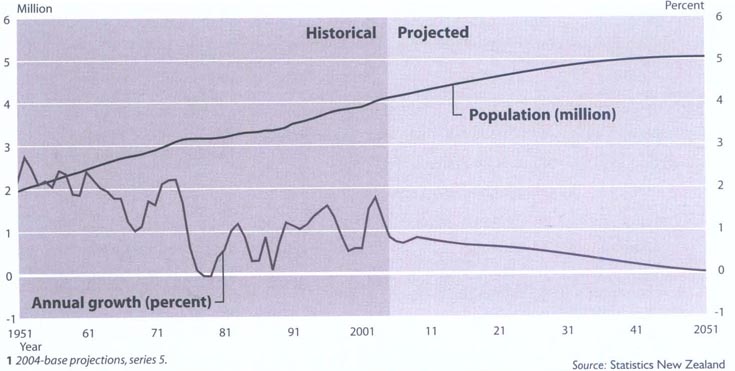
Population trends can be difficult to predict because demographic changes affect, and in turn are influenced by, social, economic, political and other circumstances.
However, demographic projections are generally more reliable than other types of forecasts for several reasons.
Firstly, despite the range of influences that can impact on it, population change is fundamentally driven by births, deaths and net migration (arrivals minus departures).
Secondly, birth and death rates are generally consistent over several years, especially for larger geographical areas, barring major catastrophes, wars or epidemics.
Thirdly, three-quarters of New Zealand's population in 20 years time is already alive. With the uncertainty of the births component removed, only migration and death can change the population that is already alive.
Some broad future trends and structural changes can be identified. For example, population ageing and sub-replacement fertility in New Zealand have raised the prospect of a slow-growth or no-growth environment in coming decades.
The entry of large baby boom cohorts into retirement ages after 2010 will result in a burgeoning 65-plus population. New Zealand's workforce will take on an older profile.
Latest projections also point to greater ethnic diversity in the future, with the broad Māori, Pacific and Asian populations all expected to increase their share of the New Zealand population.
Within the national scene, there will be contrasting population changes, with further concentration of population in the northern North Island likely.
Summary. Although fertility has been below replacement level for most of the past quarter of a century and is likely to remain so in the foreseeable future, New Zealand's population will continue to grow slowly for some time. This is because the current age structure has a built-in momentum for further growth. Slow growth aside, there will be profound shifts in population composition, including further ageing of the population, a burgeoning 65 years and over population, growing ethnic diversity and possible geographic redistribution of population, especially within territorial authorities.
Table 5.01 shows the growth in New Zealand's population as measured by Censuses of Population and Dwellings.
Table 5.01. New Zealand population
By
census
| Census1, 2 | Population | Intercensal increase | Average annual increase | |
|---|---|---|---|---|
1Omits censuses of 1851, 1864, 1867 and 1871 as censuses of Māori population were not taken in these years. 2Figures from 1981 onwards are census usually resident population counts, replacing census night population counts used in the past. ... not applicable Note:All figures randomly rounded to base 3. Source: Statistics New Zealand | ||||
| Number | Number | Percent | Percent | |
| 1858, 24 December | 115,461 | ... | ... | ... |
| 1874, 1 March | 344,985 | ... | ... | ... |
| 1878, 3 March | 458,007 | 113,022 | 32.76 | 7.33 |
| 1881, 3 April | 534,030 | 76,023 | 16.60 | 5.10 |
| 1886, 28 March | 620,451 | 86,421 | 16.18 | 3.06 |
| 1891, 5 April | 668,652 | 48,201 | 7.77 | 1.50 |
| 1896, 12 April | 743,214 | 74,562 | 11.15 | 2.13 |
| 1901, 31 March | 815,862 | 72,648 | 9.77 | 1.90 |
| 1906, 29 April | 936,309 | 120,447 | 14.76 | 2.75 |
| 1911, 2 April | 1,058,313 | 122,004 | 13.03 | 2.52 |
| 1916, 15 October | 1,149,225 | 90,912 | 8.59 | 1.50 |
| 1921, 17 April | 1,271,667 | 122,442 | 10.65 | 2.27 |
| 1926, 20 April | 1,408,140 | 136,473 | 10.73 | 2.06 |
| 1936, 24 March | 1,573,812 | 165,672 | 11.77 | 1.13 |
| 1945, 25 September | 1,702,329 | 128,517 | 8.17 | 0.83 |
| 1951, 17 April | 1,939,473 | 237,144 | 13.93 | 2.37 |
| 1956, 17 April | 2,174,061 | 234,588 | 12.10 | 2.31 |
| 1961, 18 April | 2,414,985 | 240,924 | 11.08 | 2.12 |
| 1966, 22 March | 2,676,918 | 261,933 | 10.85 | 2.11 |
| 1971, 23 March | 2,862,630 | 185,712 | 6.94 | 1.35 |
| 1976, 23 March | 3,129,384 | 266,754 | 9.32 | 1.80 |
| 1981, 24 March | 3,143,307 | ... | ... | ... |
| 1986, 4 March | 3,263,283 | 119,976 | 3.82 | 0.76 |
| 1991, 5 March | 3,373,926 | 110,643 | 3.39 | 0.67 |
| 1996, 5 March | 3,618,303 | 244,377 | 7.24 | 1.41 |
| 2001, 6 March | 3,737,277 | 118,974 | 3.29 | 0.65 |
More than 6.5 million questionnaires printed on 178 tonnes of paper were distributed for the 2006 Census of Population and Dwellings on Tuesday 7 March.
A number of population projection series have been produced to illustrate a range of possible scenarios. Projections given in this chapter draw on series 5 of the 2004-base national population projections. Series 5 projections assume that New Zealand women will average 1.85 births each (below the 2.1 children required for the population to replace itself without migration); life expectancy at birth will increase to reach 83.5 years for males and 87.0 years for females by 2051; and there will be a long-term annual net migration gain of 10,000 people from 2009.
Given this scenario, the New Zealand population is projected to reach 4.73 million in 2026 and 5.05 million in 2051. The five million population mark is projected to be reached in 2041. The pace of growth is not likely to be uniform. The New Zealand population grew at an average rate of 1.4 percent a year between 1951 and 2004, and the population is projected to grow by an average of 0.8 percent a year between 2004 and 2011. Growth is expected to slow in the remainder of the projection period, to almost zero by 2051.
The age structure of New Zealand's population will undergo significant changes as a result of past and likely future changes in fertility, improvement in longevity and a change in migration patterns. Overall, the population will take on an older profile. The median age (half the population is older, and half younger, than this age) of New Zealand's population increased from 26 in 1971 to 35 in 2004. According to projection series 5, half the population will be 40 years and older by 2020, and half the population will be 45 years and older by 2045. This reflects the combined impact of sub-replacement fertility, increasing longevity, and movement of the large number of people born after World War II into older ages.
Table 5.02 shows projected New Zealand population growth according to series 5.
Table 5.02. New Zealand population projections1
| Categories | 2004 | 2011 | 2021 | 2031 | 2041 | 2051 |
|---|---|---|---|---|---|---|
12004-base projections, series 5. Note:Figures may not add to stated totals due to rounding. Source: Statistics New Zealand | ||||||
| Age group (at 30 June) | (000) | |||||
| All ages | 4,061 | 4,292 | 4,594 | 4,847 | 5,001 | 5,047 |
| 0–14 years | 885 | 862 | 821 | 819 | 813 | 787 |
| 15–39years | 1,434 | 1,422 | 1,458 | 1,447 | 1,408 | 1,382 |
| 40–64 years | 1,256 | 1,427 | 1,511 | 1,501 | 1,512 | 1,553 |
| 65 years and over | 486 | 581 | 804 | 1,080 | 1,269 | 1,325 |
| Components of population change (years ending 30 June) | (000) | |||||
| Births | 58 | 53 | 52 | 53 | 51 | 50 |
| Deaths | 28 | 29 | 34 | 41 | 51 | 59 |
| Net migration | 22 | 10 | 10 | 10 | 10 | 10 |
| Annual population change | 52 | 34 | 29 | 21 | 10 | 1 |
| Median age (at 30 June) | 35 | 38 | 40 | 42 | 45 | 46 |
| Dependency ratio (at 30 June) | (Per 100 people aged 15–64) | |||||
| 0–14 years | 33 | 30 | 28 | 28 | 28 | 27 |
| 65 years and over | 18 | 20 | 27 | 37 | 43 | 45 |
| 0–14 and 65 years and over | 51 | 51 | 55 | 64 | 71 | 72 |
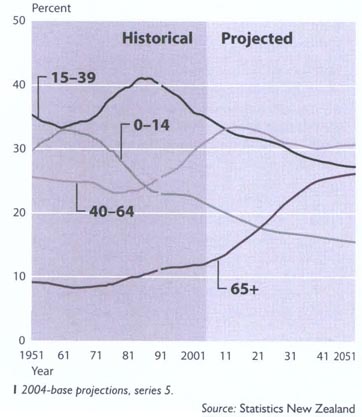
The number of children (those aged 0–14) is expected to decrease from 890,000 in 2004 to 820,000 in 2021 and to 790,000 in 2051. The decrease mainly reflects the impact of sustained sub-replacement fertility.
As a result, children will account for only 16 percent of the population by 2051, compared with 22 percent in 2004.
By contrast, the population aged 65 and over is projected to nearly double, from 490,000 in 2004 to 970,000 in 2027, and continue increasing to 1.33 million in 2051.
The number of people aged 65 and over is expected to surpass the number of children by 2022. In 2051, 26 percent of the population will be 65 and over, compared with 12 percent in 2004 (see Figure 5.02).
Within the 65 years and over group, there will be about 320,000 people aged 85 and over in 2051, six times the 2004 total of 54,000.
The working-age population (those aged 15–64) is projected to increase from 2.69 million in 2004 to 2.98 million in 2024, before declining gradually to 2.93 million in 2051. Most of the increase will be in the older half of this age group (40–64 years) as the large number of people born after World War II move through these ages.
In 2004, the population aged 15–39 was 14 percent larger than the population aged 40–64. The 40–64 age group is expected to overtake the 15–39 age group in size by 2011.
In 2004, there were 5.5 people in the working-age group for every person aged 65 and over.
This ratio is expected to drop substantially, to 3.0 in 2028 and to 2.2 by 2051. In the mid-1960s, the ratio was 7.1 people in the working-age group for every person aged 65 and over.
Children are expected to account for 16 percent of New Zealand's population by 2051, compared with 22 percent in 2004.
Educational ages. While numbers in the various educational age groups are projected to fluctuate in the future, there will be a general downward trend in all groups. The fluctuations mainly reflect changes in births in preceding years and are likely to have significant impacts on the demand for teachers and other educational resources. Note, however, that the projected numbers refer to the New Zealand resident population. Between 2004 and 2021, the primary school age population (5–12 years) will drop by 32,000 (7 percent) to 440,000. This compares with a peak of 503,000 in 1975. Further decreases will mean that by 2051 there will be 51,000 fewer primary school age children than in 2004. The trend in the secondary school age population (13–17 years) is similar to that for the primary school age population, except that the peaks and troughs of the secondary school population lag behind those of the primary school age population by about six years. The secondary school age population is projected to increase from 310,000 in 2004 to 317,000 in 2006. Then the number will drop by 26,000 to 291,000 in 2026. By 2051, the secondary school age population will number 285,000, about 38,000 fewer than the 1976 peak. Peaks and troughs in the tertiary age population (18–22 years) lag those of the secondary school age population by about five years. Between 2004 and 2012, there will be an increase of 26,000 to a peak of 322,000. This will be followed by drops of 13,000 and 15,000 in the next two decades, and smaller changes thereafter.
Figure 5.03 shows the projected population in each of the three educational age groups to 2051.
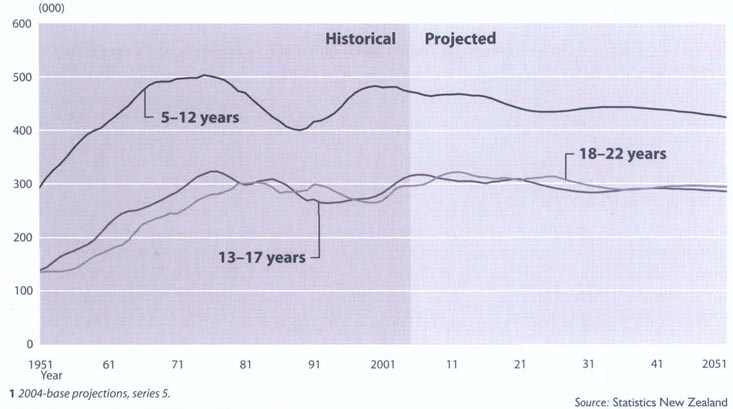
Ethnic population information presented in this chapter is based on the concept of self-identification. Each ethnic group includes people who identify with that ethnic group, either solely or in conjunction with other ethnic groups, but excludes people who have ancestry but do not identify with that ethnic group. Some people identify with two or more ethnic groups, so the broad European, Māori, Pacific and Asian populations are not mutually exclusive.
New Zealand's Asian population is expected to be 145 percent higher in 2021 than it was in 2001. Pacific and Māori populations are projected to increase by 59 and 29 percent respectively and the European population by 5 percent.
Table 5.03. Ethnic population projections1, 2
| Proportion of New Zealand population by age | ||||
|---|---|---|---|---|
| Age group (in years) | Māori | Pacific | Asian | European |
1People who identify with more than one ethnicity are included in each ethnic population, so percentage figures may add to more than 100. 2Ethnic population projections 2001-base, series 6; New Zealand population projections 2004-base. series 5. 3Base: Estimated resident population of each ethnic group at 30 June 2001. Source: Statistics New Zealand | ||||
| 20013 | Percent | |||
| Under 15 | 25 | 11 | 7 | 74 |
| 15–39 | 17 | 8 | 9 | 75 |
| 40–64 | 10 | 4 | 6 | 83 |
| 65 and over | 4 | 2 | 2 | 92 |
| All ages | 15 | 7 | 7 | 79 |
| 2021 | ||||
| Under 15 | 28 | 17 | 17 | 63 |
| 15–39 | 20 | 11 | 16 | 64 |
| 40–64 | 12 | 6 | 15 | 71 |
| 65 and over | 7 | 3 | 7 | 86 |
| All ages | 17 | 9 | 15 | 70 |
New Zealand has been ethnically and culturally connected to Polynesia for at least 1,000 years. Its population and cultural heritage 200 years ago was wholly that of Polynesia, but it is now dominated by cultural traditions that are mainly European, emanating especially from the British Isles.
About 79 percent of New Zealanders are of European ethnicity. The indigenous Māori ethnic group makes up the next largest group of the population (about 15.1 percent in 2001). The other main ethnic groups are Asian and Pacific peoples, who made up 7.0 and 6.7 percent respectively of the estimated resident population in 2001.
The ethnic and cultural composition of New Zealand has been shaped and reshaped by three main demographic processes: international migration, natural increase and inter-marriage. The most important of these processes has been international migration.
All four ethnic populations are projected to experience growth between 2001 and 2021. The Asian population is projected to have the largest percentage growth, up 145 percent. The Pacific and Māori populations will experience increases of 59 and 29 percent, respectively, while the European population will increase by 5 percent.
The higher Asian growth rate is mainly driven by assumed levels of net migration. By comparison, the higher Māori and Pacific growth relative to the New Zealand population overall is largely driven by their higher fertility rates and their larger proportions in the main childbearing ages. The European share of the New Zealand population is projected to fall to 70 percent by 2021 – a reflection of the slower growth rate of the European population compared with the growth rate of the total New Zealand population.
By contrast, the share of the population belonging to the Māori, Asian and Pacific ethnic groups is projected to increase, to 17, 15 and 9 percent respectively, by 2021. Diversity in fertility and migration patterns means the various ethnic groups will follow different paths to population ageing in future decades.
With a median age of 37 in 2001, the European population has a much older age structure than the Māori (22 years) and Pacific (21 years) populations. Despite ageing, the median age of the Māori (26 years) and Pacific populations (24 years) in 2021 will still be lower than the median age of the total New Zealand population.
Table 5.03 shows projected changes in New Zealand's population proportions, by ethnicity and age group, while Table 5.04 shows ethnic population projections to 2021.
Table 5.04. Ethnic population projections
| Total New Zealand | European | Māori | Pacific | Asian | |
|---|---|---|---|---|---|
1People who identify with more than one ethnicity are included in each ethnic population, so figures do not add to stated totals. 2Ethnic population projections 2001-base, series 6; New Zealand population projections 2004-base, series 5. 3Base: Estimated resident population of each ethnic group at 30 June 2001. 4Half the population is older, and half younger, than this age. Source: Statistics New Zealand | |||||
| (000) | |||||
| 20013 | 3,880 | 3,074 | 586 | 262 | 272 |
| 2011 | 4,292 | 3,198 | 674 | 337 | 476 |
| 2021 | 4,594 | 3,226 | 758 | 417 | 667 |
| Population change (percent) | |||||
| 2001–2021 | 18 | 5 | 29 | 59 | 145 |
| Median age4 (in years) | |||||
| 2001 | 35 | 37 | 22 | 21 | 29 |
| 2011 | 38 | 41 | 24 | 22 | 32 |
| 2021 | 40 | 44 | 26 | 24 | 36 |
Of New Zealand's 74 territorial authorities, 39 are projected to have more people in 2026 than in 2001. However population growth will generally slow over the projection period.
Among cities and districts, there is considerable variation likely in population growth rates, largely because of differences in age structures, fertility levels and migration patterns.
The Queenstown-Lakes District is projected to have the highest population growth rate, at 79 percent, followed by Rodney District (up 59 percent), Selwyn District (up 57 percent) and Manukau City (up 54 percent).
Natural increase will contribute most of the population growth in Manukau City, while net migration gains will be the most important factor in Queenstown-Lakes, Rodney and Selwyn districts.
By contrast, 35 of the 74 territorial authority areas are projected to decrease in population.
The largest percentage decreases in population are projected to be for the districts of Kawerau (down 27 percent), Ruapehu (down 26 percent), Wairoa and South Waikato (both down 22 percent) and Rangitikei (down 21 percent).
These five areas are all likely to have shrinking natural increases and continuing net migration outflows, although these outflows are assumed to be smaller than experienced historically.
Figure 5.04 shows projected regional population changes between 2001 and 2026.
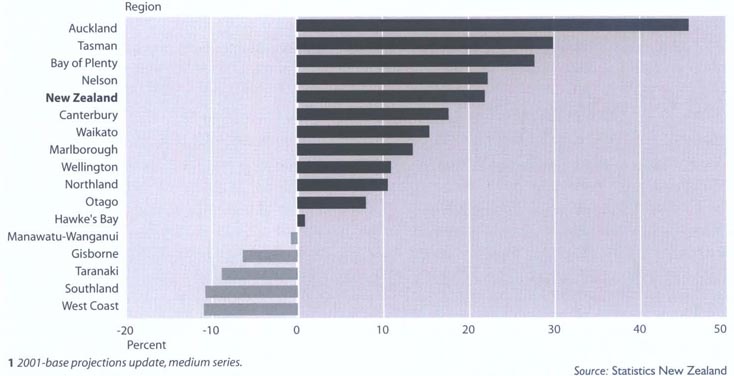
Family and household numbers in New Zealand are projected to increase by 24 percent and 28 percent respectively between 2001 and 2021. This exceeds projected population growth of 18 percent in the same period. Faster family and household growth is due to the ageing of New Zealand's population, resulting in an increasing proportion of couple without children families and one-person households.
A family refers to a couple, with or without a child or children, or one parent with a child or children, usually living together in a household. A household consists of either one person usually living alone, or two or more people usually living together and sharing facilities, in a private dwelling.
The number of families is projected to increase from an estimated 1.05 million in 2001 to 1.30 million in 2021. Couple-without-children families will account for the majority of this growth, increasing 53 percent, from 407,000 in 2001 to 623,000 in 2021. The increasing prevalence of couple-without-children families is mainly due to the large number of people born after World War II reaching 50 years and over, when they are most likely to live as a partner in a couple-without-children family. Most of these couples will have had children who have left the parental home. Couple-without-children families will overtake two-parent families to become the most common family type in 2006.
The number of two-parent families is projected to decrease after 2006 because of the continuing trends towards single parenting and fewer couples having children. The number of two-parent families is projected to increase from 446,000 in 2001 to 456,000 in 2006, but then fall to 427,000 by 2021.
The number of one-parent families is projected to increase by 28 percent, from 198,000 in 2001 to 254,000 in 2021. This is due to population growth, changes in population age structure and an assumed higher rate of single parenting. The latter is because of the increasing number of separations and divorces, increasing rates of childbearing outside of couple relationships, and more complex shared care arrangements with parents living in different households.
The number of households is projected to increase from 1.44 million in 2001 to 1.84 million in 2021. One-person households are projected to be the fastest growing household type, increasing by 46 percent from 333,000 in 2001 to 488,000 in 2021, mainly due to the increasing number of people at older ages. During the same period, family households are projected to increase by 23 percent, from 1.02 million to 1.25 million. Other multiperson households (households containing more than one person, but not containing a family) are projected to increase by 15 percent, from 88,000 to 102,000.
The average size of households is projected to slowly decline between 2001 and 2021, from 2.6 to 2.4 people per household. This continues the decline of recent decades, with the average household size down from 3.7 people in 1951 and 3.0 people in 1981. The projected decrease in average household size is due to the increasing proportion of one-person households and a decrease in the average size of family households.
Statistics New Zealand has adopted the ‘estimated resident population’ concept as a standard for producing official population estimates and projections.
This concept is viewed as a more accurate estimate of the population normally living in an area than the ‘census usually resident population count’. The estimated resident population of New Zealand includes all residents present in New Zealand and counted by the census (census usually resident population count), residents who are temporarily overseas (who are not included in the census), and an adjustment for residents missed or counted more than once by the census (net census undercount). Visitors from overseas are excluded.
Three major trends stand out in the geographic distribution and redistribution of New Zealand's population in the past 150 years.
The first is an increasing proportion of people living in the north of the country. The second is a tendency for people to move northward within each island and, with the exception of the past 20 years, from the South Island to the North Island. The third is for an increasing degree of urbanisation and, in particular, a concentration of people in the main urban centres.
Following the end of the gold boom in the South Island in the 1870s, the proportion of the census night population count living in the South Island began to steadily decrease. From the 1896 Census onward, the census night population of the North Island has exceeded that of the South. Since that time, the North Island's census night population has continued to grow at a greater rate, and its share of the New Zealand census night population has continued to increase.
In 1956, 69 percent of New Zealanders lived in the North Island. The percentage had risen to more than 72 by 1976 and in 2001 it was 76 percent.
Many influences have contributed to the population differential between the islands. For example, the North Island has had a higher birth rate and most overseas migrants choose to settle in the North Island.
Table 5.05 shows the estimated population of New Zealand from 1885 to 2004.
Table 5.06 lists the populations of the North and South Islands on census night from 1858 to 2001.
The movement of people within and among regions is an important determinant of New Zealand's population distribution. Overall, New Zealanders are a mobile people and, while the majority of movement is within regions, there is significant movement among regions.
In addition to affecting the size of the population, inter-regional migration also influences age structures, fertility levels and population growth rates within regions.
Table 5.07 shows population movements between regions between the 1996 and 2001 censuses.
Table 5.06. North and South Island populations1
By census
| Census | North Island | South Island | Total population |
|---|---|---|---|
1Figures from 1981 onwards are census usually resident population counts, replacing census night population counts used in the past. Note:The North Island includes the population of Kermadec Islands and people on oil rigs. The South Island includes the populations of the Chatham Islands and Campbell Island, All figures randomly rounded to base 3. Source: Statistics New Zealand | |||
| 1858 | 87,150 | 28,311 | 115,461 |
| 1874 | 155,472 | 189,513 | 344,985 |
| 1878 | 199,524 | 258,483 | 458,007 |
| 1881 | 234,648 | 299,382 | 534,030 |
| 1886 | 290,010 | 330,441 | 620,451 |
| 1891 | 321,246 | 347,403 | 668,652 |
| 1896 | 377,955 | 365,259 | 743,214 |
| 1901 | 431,472 | 384,390 | 815,862 |
| 1906 | 521,898 | 414,411 | 936,309 |
| 1911 | 610,599 | 447,714 | 1,058,313 |
| 1916 | 695,397 | 453,828 | 1,149,225 |
| 1921 | 791,919 | 479,751 | 1,271,667 |
| 1926 | 892,680 | 515,460 | 1,408,140 |
| 1936 | 1,018,038 | 555,774 | 1,573,812 |
| 1945 | 1,146,315 | 556,014 | 1,702,329 |
| 1951 | 1,313,871 | 625,602 | 1,939,473 |
| 1956 | 1,497,363 | 676,698 | 2,174,061 |
| 1961 | 1,684,785 | 730,200 | 2,414,985 |
| 1966 | 1,893,327 | 783,594 | 2,676,918 |
| 1971 | 2,051,364 | 811,269 | 2,862,630 |
| 1976 | 2,268,393 | 860,991 | 3,129,384 |
| 1981 | 2,306,667 | 836,643 | 3,143,307 |
| 1986 | 2,412,660 | 850,623 | 3,263,283 |
| 1991 | 2,520,348 | 853,578 | 3,373,926 |
| 1996 | 2,718,189 | 900,114 | 3,618,303 |
| 2001 | 2,829,801 | 907,476 | 3,737,277 |
Table 5.07. Migration between regions, 1996–2001
| Regions | Population1 | Migration in | Migration out | Net migration |
|---|---|---|---|---|
1Census usually resident population count of all people aged five and over, 2001. Note:All figures have been randomly rounded to base 3. Source: Statistics New Zealand | ||||
| Northland | 129,687 | 17,487 | 18,102 | -615 |
| Auckland | 1,070,565 | 65,601 | 67,956 | -2,355 |
| Waikato | 330,090 | 44,046 | 42,573 | 1,473 |
| Bay of Plenty | 221,130 | 34,827 | 26,250 | 8,577 |
| Gisborne | 40,122 | 4,839 | 7,503 | -2,664 |
| Hawke's Bay | 132,168 | 14,577 | 16,704 | -2,127 |
| Taranaki | 95,622 | 8,637 | 12,291 | -3,654 |
| Manawatu- Wanganui | 204,168 | 25,806 | 32,040 | -6,234 |
| Wellington | 393,078 | 39,234 | 37,077 | 2,157 |
| Tasman | 38,544 | 8,082 | 5,529 | 2,553 |
| Nelson | 38,982 | 8,412 | 8,310 | 102 |
| Marlborough | 37,080 | 6,738 | 6,162 | 576 |
| West Coast | 28,359 | 3,750 | 5,910 | -2,160 |
| Canterbury | 450,636 | 38,907 | 30,219 | 8,688 |
| Otago | 170,856 | 21,744 | 20,634 | 1,110 |
| Southland | 84,729 | 6,699 | 12,129 | -5,430 |
New Zealand is a highly urbanised country, with 86 percent of the census usually resident population count living in urban areas at the 2001 Census.
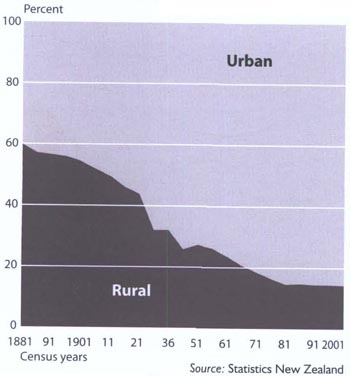
Table 5.08 shows urban and rural populations at censuses from 1881 to 2001, while Figure 5.05 shows changes in the proportions of urban and rural populations for every second census from 1881.
Table 5.08. Urban and rural populations1
By census
| Census2 | Urban | Rural | ||
|---|---|---|---|---|
1From 1881–1921. ‘urban’ based on boroughs and cities, ‘rural’ based on counties (including town districts). From 1926–2001. ‘urban’ based on urban areas and towns with over 1,000 population, and ‘rural’ is the remainder. 2Figures from 1981 onwards are census usually resident population counts, replacing census night population counts used in the past. 3Based on boundaries as at 6 March 2001. Note:All figures have been randomly rounded to base 3. Source: Statistics New Zealand | ||||
| Number | Percent | Number | Percent | |
| Non-Māori population | ||||
| 1881 | 194,982 | 40.1 | 291,237 | 59.9 |
| 1886 | 245,613 | 42.9 | 327,327 | 57.1 |
| 1891 | 270,342 | 43.4 | 352,098 | 56.6 |
| 1896 | 307,293 | 44.0 | 391,734 | 56.0 |
| 1901 | 350,202 | 45.6 | 417,597 | 54.4 |
| 1906 | 424,614 | 48.1 | 458,796 | 51.9 |
| 1911 | 505,599 | 50.4 | 496,779 | 49.6 |
| 1916 | 585,306 | 53.9 | 501,258 | 46.1 |
| 1921 | 681,987 | 56.2 | 530,853 | 43.8 |
| Total population | ||||
| 1926 | 953,172 | 68.0 | 448,500 | 32.0 |
| 1936 | 1,065,228 | 67.9 | 503,886 | 32.1 |
| 1945 | 1,227,069 | 72.2 | 472,077 | 27.8 |
| 1951 | 1,406,517 | 72.7 | 527,079 | 27.3 |
| 1956 | 1,600,809 | 73.8 | 568,806 | 26.2 |
| 1961 | 1,840,203 | 76.4 | 569,217 | 23.6 |
| 1966 | 2,119,086 | 79.3 | 553,023 | 20.7 |
| 1971 | 2,328,876 | 81.5 | 528,609 | 18.5 |
| 1976 | 2,614,119 | 83.6 | 511,005 | 16.4 |
| 19813 | 2,682,906 | 85.4 | 460,401 | 14.6 |
| 19863 | 2,780,151 | 85.2 | 481,467 | 14.8 |
| 19913 | 2,884,260 | 85.5 | 489,012 | 14.5 |
| 19963 | 3,091,104 | 85.5 | 525,633 | 14.5 |
| 20013 | 3,203,574 | 85.7 | 532,740 | 14.3 |
Seventy-one percent of the 2001 Census usually resident population count lived in main urban areas (places with 30,000 people or more). Between 1996 and 2001, most main urban areas experienced population growth, particularly those located in the north of both islands. However, most secondary urban areas (places with between 10,000 and 29,999 people) lost population during that period. Table 5.09 shows the population of New Zealand's largest urban areas at selected censuses.
Table 5.09. Population of largest urban areas
At
selected censuses
| Urban area | 18861 | 19111 | 1936 | 1961 | 19862,3 | 19912,3 | 19962,3 | 20012,3 |
|---|---|---|---|---|---|---|---|---|
1Excludes Māori. 2Boundaries as at 6 March 2001. 3Figures from 1986 onwards are census usually resident population counts, replacing census night population counts used in the past. Note:All figures have been randomly rounded to base 3. Source: Statistics New Zealand | ||||||||
| Auckland | 33,162 | 102,675 | 226,365 | 448,365 | 816,927 | 878,223 | 991,833 | 1,074,513 |
| Wellington | 25,944 | 70,728 | 159,357 | 249,531 | 323,421 | 324,156 | 334,065 | 339,750 |
| Christchurch | 29,655 | 80,193 | 133,515 | 220,509 | 295,749 | 303,411 | 325,251 | 334,107 |
| Hamilton | 1,200 | 3,543 | 20,097 | 50,505 | 138,645 | 146,148 | 158,046 | 166,128 |
| Dunedin | 23,244 | 64,236 | 85,608 | 105,003 | 107,331 | 107,523 | 110,790 | 107,088 |
| Tauranga | 1,149 | 1,347 | 5,808 | 24,660 | 62,370 | 70,257 | 82,095 | 95,697 |
| Palmerston North | 2,607 | 10,992 | 24,372 | 43,185 | 66,951 | 70,236 | 73,860 | 72,681 |
| Hastings | 1,503 | 6,285 | 17,919 | 32,490 | 56,718 | 57,219 | 58,500 | 59,142 |
| Napier | 7,680 | 11,736 | 19,170 | 32,715 | 52,524 | 52,119 | 54,291 | 54,534 |
| Nelson | 7,314 | 8,235 | 13,494 | 25,320 | 43,725 | 45,879 | 50,688 | 53,688 |
| Rotorua | ... | 2,391 | 8,898 | 25,068 | 48,855 | 50,772 | 52,956 | 52,608 |
| New Plymouth | 3,093 | 5,238 | 18,597 | 32,388 | 47,370 | 47,652 | 48,879 | 47,763 |
| Invercargill | 8,250 | 15,858 | 25,911 | 41,088 | 52,818 | 51,540 | 49,404 | 46,305 |
| Whangarei | ... | 2,664 | 9,867 | 21,789 | 44,097 | 44,346 | 45,876 | 46,047 |
| Wanganui | 4,902 | 14,703 | 25,749 | 35,694 | 40,512 | 41,100 | 41,097 | 39,423 |
| Kapiti | ... | 1,068 | 5,367 | 12,306 | 23,040 | 27,342 | 30,291 | 33,669 |
| Gisborne | 2,193 | 8,196 | 15,879 | 25,065 | 32,019 | 31,401 | 32,607 | 31,722 |
| Timaru | 3,753 | 11,280 | 18,771 | 26,424 | 28,692 | 27,783 | 27,171 | 26,748 |
| Blenheim | 3,093 | 3,771 | 5,037 | 11,955 | 22,998 | 23,787 | 25,704 | 26,547 |
| Masterton | ... | 5,181 | 9,096 | 15,120 | 19,353 | 19,770 | 19,689 | 19,497 |
Tables 5.10 and 5.11 outline the estimated resident population of New Zealand's territorial authorities and regions.
Table 5.1. Estimated resident population of territorial authorities
At 30 June
| Territorial authority1 | Estimated resident population2 | Population change | |||
|---|---|---|---|---|---|
| 2001 | 2004 | 2005 | 2004–2005 | ||
1Based on 2005 territorial authority boundaries. 2Resident population estimates are not strictly comparable with census usually resident population counts as they include adjustments for census undercount and New Zealand residents temporarily overseas. 3Includes the population of inlets, ships, oil rigs and Kermadec, Mayor. Motiti and White Islands, which are not included within territorial authorities. Note:Figures may not add to stated totals due to rounding. Source: Statistics New Zealand | |||||
| Number | Percent | ||||
| Far North District | 56,400 | 57,400 | 57,800 | 370 | 0.6 |
| Whangarei District | 70,000 | 72,200 | 72,800 | 610 | 0.8 |
| Kaipara District | 17,950 | 18,050 | 18,050 | -20 | -0.1 |
| Rodney District | 78,500 | 86,600 | 89,200 | 2,530 | 2.9 |
| North Shore City | 194,200 | 209,400 | 212,200 | 2,850 | 1.4 |
| Waitakere City | 176,200 | 189,300 | 191,900 | 2,590 | 1.4 |
| Auckland City | 388,800 | 420,800 | 425,400 | 4,680 | 1.1 |
| Manukau City | 298,200 | 326,200 | 332,900 | 6,680 | 2.0 |
| Papakura District | 42,300 | 43,500 | 43,700 | 210 | 0.5 |
| Franklin District | 53,300 | 56,500 | 57,400 | 940 | 1.7 |
| Thames-Coromandel District | 25,800 | 26,500 | 26,700 | 150 | 0.6 |
| Hauraki District | 17,250 | 16,900 | 16,750 | -120 | -0.7 |
| Waikato District | 41,300 | 42,400 | 42,600 | 190 | 0.5 |
| Matamata-Piako District | 30,300 | 30,300 | 30,300 | 20 | 0.1 |
| Hamilton City | 120,900 | 129,300 | 131,400 | 2,110 | 1.6 |
| Waipa District | 40,000 | 41,500 | 42,100 | 600 | 1.4 |
| Otorohanga District | 9,590 | 9,490 | 9,480 | -10 | -0.2 |
| South Waikato District | 24,200 | 23,300 | 22,900 | -430 | -1.8 |
| Waitomo District | 9,780 | 9,660 | 9,610 | -50 | -0.6 |
| Taupo District | 32,500 | 33,600 | 33,900 | 260 | 0.8 |
| Western Bay of Plenty District | 39,300 | 41,400 | 42,200 | 780 | 1.9 |
| Tauranga City | 93,300 | 101,400 | 103,900 | 2,490 | 2.5 |
| Rotorua District | 66,900 | 67,800 | 67,600 | -230 | -0.3 |
| Whakatane District | 34,000 | 34,000 | 33,900 | -100 | -0.3 |
| Kawerau District | 7,290 | 6,790 | 6,610 | -180 | -2.6 |
| Opotiki District | 9,540 | 9,590 | 9,520 | -60 | -0.7 |
| Gisborne District | 45,500 | 44,900 | 44,700 | -250 | -0.5 |
| Wairoa District | 9,260 | 8,630 | 8,410 | -210 | -2.5 |
| Hastings District | 69,600 | 71,100 | 71,400 | 250 | 0.3 |
| Napier City | 55,200 | 56,100 | 56,400 | 260 | 0.5 |
| Central Hawke's Bay District | 13,200 | 13,150 | 13,200 | 30 | 0.2 |
| New Plymouth District | 68,400 | 69,200 | 69,300 | 40 | 0.1 |
| Stratford District | 9,110 | 8,750 | 8,600 | -150 | -1.7 |
| South Taranaki District | 28,400 | 27,700 | 27,300 | -330 | -1.2 |
| Ruapehu District | 15,000 | 13,700 | 13,150 | -560 | -4.1 |
| Wanganui District | 44,400 | 43,600 | 43,300 | -280 | -0.7 |
| Rangitikei District | 15,500 | 14,900 | 14,600 | -270 | -1.8 |
| Manawatu District | 28,200 | 28,200 | 28,400 | 110 | 0.4 |
| Palmerston North City | 75,200 | 78,100 | 78,400 | 330 | 0.4 |
| Tararua District | 18,350 | 17,800 | 17,600 | -190 | -1.1 |
| Horowhenua District | 30,600 | 30,600 | 30,500 | -60 | -0.2 |
| Kapiti Coast District | 43,600 | 46,200 | 47,000 | 810 | 1.8 |
| Porirua City | 49,500 | 50,600 | 50,500 | -100 | -0.2 |
| Upper Hutt City | 37,700 | 37,900 | 37,900 | 20 | 0.0 |
| Lower Hutt City | 99,100 | 100,400 | 100,500 | 130 | 0.1 |
| Wellington City | 171,100 | 182,600 | 185,100 | 2,590 | 1.4 |
| Masterton District | 23,200 | 23,300 | 23,300 | 20 | 0.1 |
| Carterton District | 7,000 | 7,140 | 7,160 | 20 | 0.3 |
| South Wairarapa District | 8,940 | 8,840 | 8,810 | -30 | -0.4 |
| Tasman District | 42,400 | 45,800 | 46,600 | 790 | 1.7 |
| Nelson City | 42,900 | 45,200 | 45,700 | 480 | 1.1 |
| Marlborough District | 40,700 | 42,300 | 42,700 | 420 | 1.0 |
| Kaikoura District | 3,580 | 3,630 | 3,610 | -20 | -0.4 |
| Buller District | 9,860 | 9,640 | 9,570 | -70 | -0.7 |
| Grey District | 13,200 | 13,050 | 13,100 | 30 | 0.2 |
| Westland District | 7,990 | 7,900 | 7,880 | -20 | -0.3 |
| Hurunui District | 10,150 | 10,650 | 10,850 | 160 | 1.5 |
| Waimakariri District | 37,900 | 41,000 | 42,100 | 1,130 | 2.7 |
| Christchurch City | 327,200 | 344,100 | 347,700 | 3,560 | 1.0 |
| Banks Peninsula District | 8,040 | 8,310 | 8,430 | 120 | 1.4 |
| Selwyn District | 28,300 | 30,800 | 31,600 | 810 | 2.6 |
| Ashburton District | 26,000 | 26,700 | 26,900 | 210 | 0.8 |
| Timaru District | 42,800 | 43,100 | 43,000 | -90 | -0.2 |
| Mackenzie District | 3,790 | 3,750 | 3,730 | -20 | -0.4 |
| Waimate District | 7,220 | 7,100 | 7,030 | -80 | -1.1 |
| Chatham Islands Territory | 750 | 750 | 750 | 0 | 0.1 |
| Waitaki District | 20,500 | 20,000 | 19,850 | -150 | -0.7 |
| Central Otago District | 14,750 | 15,050 | 15,100 | 30 | 0.2 |
| Queenstown-Lakes District | 17,850 | 22,200 | 23,500 | 1,320 | 6.0 |
| Dunedin City | 119,300 | 121,900 | 122,500 | 560 | 0.5 |
| Clutha District | 17,550 | 17,350 | 17,200 | -130 | -0.8 |
| Southland District | 29,400 | 29,400 | 29,300 | -50 | -0.2 |
| Gore District | 12,750 | 12,500 | 12,350 | -140 | -1.1 |
| Invercargill City | 51,100 | 51,700 | 51,300 | -430 | -0.8 |
| New Zealand3 | 3,880,500 | 4,061,400 | 4,098,900 | 37,450 | 0.9 |
Table 5.11. Estimated resident population of regions
At 30 June
| Regions1 | Estimated resident population2 | Population change | |||
|---|---|---|---|---|---|
| 2001 | 2004 | 2005 | 2004–2005 | ||
1Based OH 2005 regional council boundaries. 2Resident population estimates are not strictly comparable with census usually resident population counts as they include adjustments for census undercount and New Zealand residents temporarily overseas. 3Includes the population of Kermadec Islands. Chatham Islands Territory and people on oil rigs which are not included within regional councils. Note:Figures may not add to stated totals due to rounding. Source: Statistics New Zealand | |||||
| North Island | Number | Percent | |||
| Northland Region | 144,400 | 147,600 | 148,600 | 970 | 0.7 |
| Auckland Region | 1,216,900 | 1,316,800 | 1,337,100 | 20,280 | 1.5 |
| Waikato Region | 369,800 | 381,900 | 384,800 | 2,900 | 0.8 |
| Bay of Plenty Region | 246,900 | 257,600 | 260,300 | 2,710 | 1.1 |
| Gisborne Region | 45,500 | 44,900 | 44,700 | -250 | -0.5 |
| Hawke's Bay Region | 147,300 | 149,200 | 149,500 | 320 | 0.2 |
| Taranaki Region | 105,700 | 105,500 | 105,000 | -440 | -0.4 |
| Manawatu-Wanganui Region | 227,500 | 227,100 | 226,200 | -930 | -0.4 |
| Wellington Region | 440,200 | 456,900 | 460,400 | 3,460 | 0.8 |
| Total North Island regions | 2,944,300 | 3,087,500 | 3,116,600 | 29,020 | 0.9 |
| South Island | |||||
| Tasman Region | 42,400 | 45,800 | 46,600 | 790 | 1.7 |
| Nelson Region | 42,900 | 45,200 | 45,700 | 480 | 1.1 |
| Marlborough Region | 40,700 | 42,300 | 42,700 | 420 | 1.0 |
| West Coast Region | 31,100 | 30,600 | 30,500 | -70 | -0.2 |
| Canterbury Region | 496,700 | 520,600 | 526,400 | 5,750 | 1.1 |
| Otago Region | 188,300 | 194,900 | 196,600 | 1,680 | 0.9 |
| Southland Region | 93,300 | 93,600 | 93,000 | -620 | -0.7 |
| Total South Island regions | 935,400 | 973,100 | 981,500 | 8,420 | 0.9 |
| New Zealand3 | 3,880,500 | 4,061,400 | 4,098,900 | 37,450 | 0.9 |
On an estimated resident population basis, the Tasman Region grew by 1.7 percent in the year to 30 June 2005 – the highest percentage increase of any region in New Zealand.
Population change has two main components, natural increase (the excess of births over deaths) and net migration (the difference between arrivals and departures). The relative contribution of the two components has varied from time to time, but net migration's share of population change has never exceeded 40 percent.
Figure 5.06 shows contributions made by natural increase and net migration to New Zealand's population change from 1861 to 2005.
Figure 5.06. Components of annual population change
Natural increase' and net
migration2
Years ending 31 March
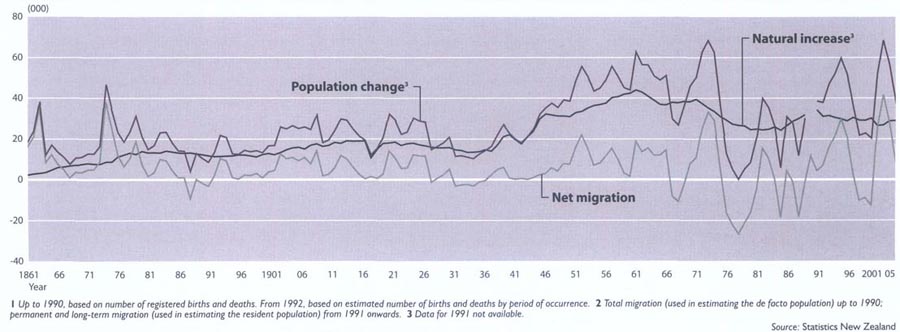
Changing levels of fertility over the years have played a major role in determining the size and structure of New Zealand's population. Figure 5.07 shows the significant changes in the fertility rate (births per woman) in New Zealand from 1917 to 2004. In 1935, the fertility rate in New Zealand fell to 2.2 births per woman. This was attributed to fewer and later marriages, and family limitation within marriage. With demobilisation of forces after World War II and the resulting increase in marriages and births, the fertility rate reached 3.6 births per woman in 1947.
Other features of the years following World War II were New Zealanders marrying younger and marriage becoming almost universal. By 1961, half of all women were married before the age of 22, compared with barely a quarter married by that age in the early 1940s. These trends were reinforced by early childbearing and the shortening of birth intervals.
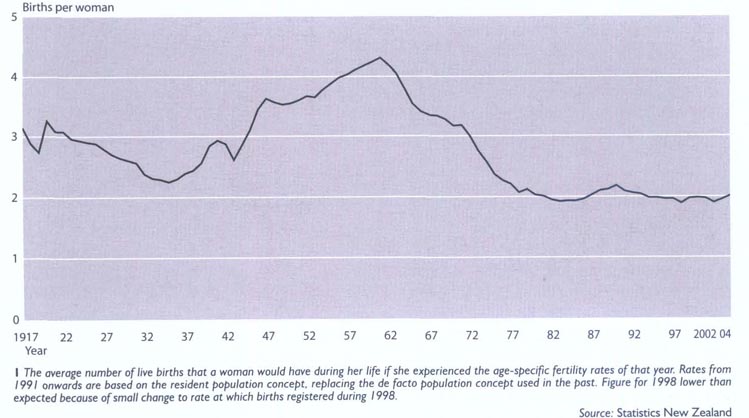
The median age at first birth fell from 25.4 years in 1945 to 22.8 years in 1964. Fewer couples remained childless or had only one child. The net result was soaring birth numbers, up from 27,000 in 1935 to about 42,000 in 1945, and to 65,000 in 1961. About 1.13 million New Zealanders were born between 1946 and 1965. At its peak in 1961, the total fertility rate exceeded 4.3 births per woman and significantly exceeded figures for other developed nations. The upward trend was reversed in the early 1960s just as suddenly as it had begun, which has prompted demographers to suggest that the ‘baby boom’ was merely a temporary diversion from a long-term downward trend. The turnaround coincided with introduction of the oral contraceptive pill in the early 1960s, but the ‘cause-and-effect’ relationship is not clear-cut. It is possible that increased acceptance and use of the pill helped sustain the downward trend.
By the mid-1970s, the post-depression rise in fertility had ended. The total fertility rate fell below the ‘replacement level’ (2.1 births per woman) in 1978 and then to a low of 1.9 births per woman in 1983. This drop had a great impact on the annual number of births. Despite a substantial increase in the number of prospective mothers caused by the ‘baby boomers’ entering prime reproductive ages, births dropped from around 64,000 in 1971 to around 50,000 in 1982.
After 1983, there was a minor resurgence in the fertility rate, to 2.18 births per woman in 1990, but the rate subsequently dropped to 1.96 in 1996 and has remained around this level since. This level of fertility is slightly below the level required for the population to replace itself without migration.
From 22.8 years in 1964, the median age at first birth rose steadily to 30.7 years in 2004. In 2002, the age group 30–34 replaced 25–29 as the most common age group for childbearing among New Zealand women.
Figure 5.08 shows the median age of childbearing for New Zealand women from 1962 to 2004, based on nuptial and ex-nuptial live confinements.
The dynamics of the fertility decline and of current low fertility levels are complex. Increased use of contraceptives, increased participation of women in the labour force, rising divorce rates and general economic conditions have probably all, directly or indirectly, contributed to it.
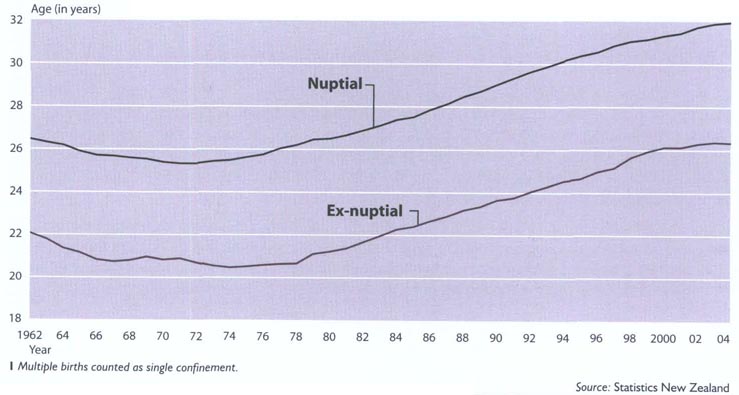
Patterns of marriage and family formation have changed radically, with a shift away from early marriage and childbearing toward later marriage and delayed parenthood. Between 1971 and 1986, the first marriage rate for women aged 20–24 dropped by about two-thirds, from 314 to 113 marriages per 1,000 never-married women. By 2001, the first marriage rate for women aged 20–24 had dropped to 37 per 1,000. New Zealand women, in 2004, are marrying for the first time, on average, about seven years later than those who married for the first time in 1971. The median age at first marriage in 2004 for women was 28.1 years, and 29.9 for men. This compared with 20.8 and 23.0 years respectively in 1971.
A growing proportion of New Zealanders are remaining single through their 20s. The substantial postponement of marriage has been partly offset by the growth of de facto relationships (cohabitation outside marriage). Such relationships may be either a prelude to, or a substitute for, formal marriages. The growth in de facto unions partly accounts for the rise in the number of ex-nuptial births (children born to women who are not legally married to the child's father), up from nearly 7,000 in 1966 to nearly 10,000 in 1976 and to 26,000 in 2004. Ex-nuptial births comprised 12 percent of all births registered in New Zealand in 1966 and 45 percent in 2004. Changing social norms have contributed to this increase. There is also a high incidence of ex-nuptial births among Māori. In 2004, 76 percent of all Māori births were classified as ex-nuptial and they accounted for nearly half of New Zealand's ex-nuptial births. Latest demographic measures indicate a significant ethnic differential in fertility, with the rate for Pacific women at 2.9 births and Māori women 2.6 births per woman, compared with 1.7 and 1.8 births for Asian and European women respectively.
Figure 5.09 shows the ex-nuptial birth rate per 1,000 not-married women in New Zealand for selected years from 1896 to 2004.
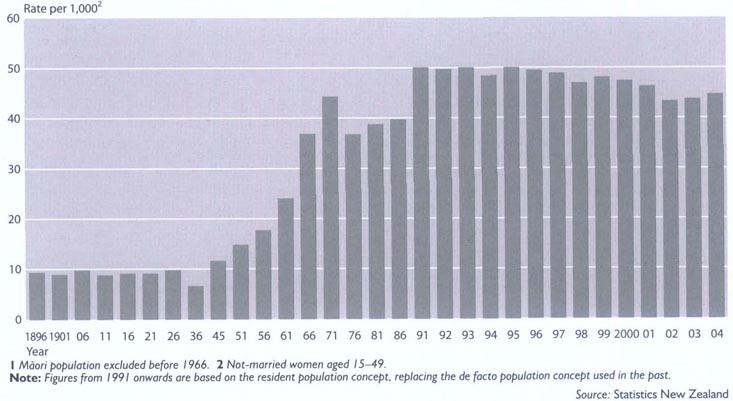
Table 5.12 illustrates fertility trends and patterns from 1881 to 2004.
Table 5.12. Fertility trends and patterns
Years
ending 31 December
| Year | Live births | Crude birth rate1 | Fertility rate2 | Gross reproduction rate3, 4 | Net reproduction rate3, 4 | Ex-nuptial birth rate4, 6 |
|---|---|---|---|---|---|---|
1Live births per 1,000 estimated mean population. 2The average number of live births that a woman would have during her life if she experienced the age-specific fertility rates of that year. Rates from 1991 onwards based on resident population concept, replacing de facto population concept used in the past. 3The average number of daughters that a woman would have during her life if she experienced the age-specific fertility rates of that year. 4Figures before 1966 exclude Māori population. 5The average number of daughters that a woman would have during her life if she experienced the age-specific fertility and mortality rates of that year. 6Ex-nuptial births per 1,000 estimated mean number of not-married women aged 15–49. Before 1966, rates based on census counts of not-married women aged 15–44. 7Excludes Māori population. 8Births and fertility rates for 1998 lower than expected because of small change to rate at which births registered during 1998. Rrevised ..figures not available Note:Birth and fertility rates for 1991 onwards are based on the resident population concept, replacing the de facto population concept used previously. Source: Statistics New Zealand | ||||||
| 18817 | 18,732 | 38.00 | .. | .. | .. | .. |
| 18867 | 19,299 | 33.14 | .. | .. | .. | .. |
| 18917 | 18,273 | 29.01 | .. | .. | .. | 9.38 |
| 18967 | 18,612 | 26.35 | .. | .. | .. | 9.44 |
| 19017 | 20,491 | 26.34 | .. | .. | .. | 9.04 |
| 19067 | 24,252 | 27.08 | .. | .. | .. | 9.92 |
| 19117 | 26,354 | 25.99 | .. | .. | .. | 8.93 |
| 19167 | 28,509 | 25.94 | .. | .. | .. | 9.24 |
| 1921 | 29,623 | 23.24 | 3.08 | .. | .. | 9.21 |
| 1926 | 29,904 | 21.15 | 2.88 | .. | .. | 9.92 |
| 1931 | 28,867 | 19.06 | 2.56 | .. | .. | .. |
| 1936 | 28,395 | 18.03 | 2.30 | 1.04 | 0.97 | 6.71 |
| 1941 | 39,170 | 24.02 | 2.93 | 1.37 | 1.27 | .. |
| 1946 | 47,524 | 27.01 | 3.45 | 1.59 | 1.47 | 11.67 |
| 1951 | 49,806 | 25.57 | 3.60 | 1.64 | 1.58 | 14.85 |
| 1956 | 56,531 | 25.90 | 3.98 | 1.84 | 1.77 | 17.79 |
| 1961 | 65,390 | 26.95 | 4.31 | 2.03 | 1.96 | 24.14 |
| 1966 | 60,003 | 22.37 | 3.41 | 1.66 | 1.61 | 36.92 |
| 1971 | 64,460 | 22.51 | 3.18 | 1.55 | 1.51 | 44.39 |
| 1976 | 55,105 | 17.60 | 2.27 | 1.09 | 1.07 | 36.86 |
| 1981 | 50,794 | 16.09 | 2.01 | 0.98 | 0.96 | 38.81 |
| 1986 | 52,823 | 16.12 | 1.96 | 0.96 | 0.94 | 39.80 |
| 1991 | 59,911 | 17.14 | 2.09 | 1.01 | 1.00 | 50.17 |
| 1996 | 57,280 | 15.34 | 1.96 | 0.95 | 0.93 | 49.60 |
| 1997 | 57,604 | 15.23 | 1.96 | 0.96 | 0.94 | 48.97 |
| 19988 | 55,349 | 14.51 | 1.89 | 0.92 | 0.90 | 47.02 |
| 1999 | 57,053 | 14.87 | 1.97 | 0.96 | 0.95 | 48.21 |
| 2000 | 56,605 | 14.66 | 1.98 | 0.96 | 0.95R | 47.50 |
| 2001 | 55,799 | 14.36 | 1.97 | 0.97 | 0.95 | 46.41 |
| 2002 | 54,021 | 13.70 | 1.90 | 0.93R | 0.92R | 43.40 |
| 2003 | 56,134 | 14.00 | 1.95 | 0.95 | 0.94 | 43.85 |
| 2004 | 54,073 | 14.29 | 2.01 | 0.98 | 0.97 | 44.77 |
Table 5.13 provides a summary of vital statistics for the New Zealand population from 1950 to 2004.
Table 5.13. Vital statistics
Years ending 31
December
| Year | Live births | Deaths | Natural increase1 | Mean age at death | |
|---|---|---|---|---|---|
| Male | Female | ||||
1Live births minus deaths. 2Births lower than expected because of small change to rate at which births registered during 1998. Note:Figures from 1991 onwards are based on the resident population concept, replacing the de facto population concept used in the past. Source: Statistics New Zealand | |||||
| Number | Years | ||||
| 1950 | 49,331 | 18,084 | 31,247 | 60.0 | 61.8 |
| 1955 | 55,596 | 19,225 | 36,371 | 60.7 | 64.3 |
| 1960 | 62,779 | 20,892 | 41,887 | 62.2 | 65.9 |
| 1965 | 60,047 | 22,976 | 37,071 | 62.9 | 68.0 |
| 1970 | 62,050 | 24,840 | 37,210 | 63.2 | 68.8 |
| 1975 | 56,639 | 25,114 | 31,525 | 63.4 | 69.5 |
| 1980 | 50,542 | 26,676 | 23,866 | 65.7 | 71.0 |
| 1985 | 51,798 | 27,480 | 24,318 | 66.4 | 72.8 |
| 1990 | 60,153 | 26,531 | 33,622 | 66.5 | 73.3 |
| 1991 | 59,911 | 26,389 | 33,522 | 67.0 | 73.7 |
| 1992 | 59,166 | 27,115 | 32,051 | 67.8 | 74.3 |
| 1993 | 58,782 | 27,100 | 31,682 | 68.1 | 74.3 |
| 1994 | 57,321 | 26,953 | 30,368 | 68.7 | 74.7 |
| 1995 | 57,671 | 27,813 | 29,858 | 68.8 | 74.8 |
| 1996 | 57,280 | 28,255 | 29,025 | 68.9 | 75.1 |
| 1997 | 57,604 | 27,471 | 30,133 | 68.9 | 75.3 |
| 19982 | 55,349 | 26,206 | 29,143 | 69.1 | 75.5 |
| 1999 | 57,053 | 28,122 | 28,931 | 69.9 | 76.3 |
| 2000 | 56,605 | 26,660 | 29,945 | 69.9 | 76.0 |
| 2001 | 55,799 | 27,825 | 27,974 | 70.6 | 76.8 |
| 2002 | 54,021 | 28,065 | 25,956 | 70.9 | 76.9 |
| 2003 | 56,134 | 28,010 | 28,124 | 70.8 | 77.0 |
| 2004 | 58,073 | 28,419 | 29,654 | 71.3 | 77.2 |
According to 2002–04 life tables, an average newborn New Zealand male has a life expectancy of 77 years.
A temperate climate, low population density, lack of heavy industry and good nutrition have given New Zealand a comparative advantage over other nations in terms of health. Ongoing advances in living standards, medical knowledge, technology and health services continue to reduce mortality rates.
Nevertheless, New Zealand mortality rates mask the fact that Māori mortality rates are much higher than non-Māori, and that New Zealand life expectancy has been eclipsed by several other countries, as shown in Table 5.14.
A large part of longevity improvement in New Zealand occurred before 1930 and was due to the saving of life at younger ages. Allowing for higher Māori mortality, the infant mortality rate fell steadily from more than 100 deaths per 1,000 live births in the late 19th century to about 50 per 1,000 in the 1920s. As Table 5.15 shows, the infant (under the age of one year) mortality rate has continued to drop, from 22.76 per 1,000 in 1961, to 5.58 per 1,000 in 2004.
Table 5.14. Life expectancy at birth
International comparisons
| Country | Year/period | Males | Females |
|---|---|---|---|
1Excludes Māori population. Source: Statistics New Zealand | |||
| Years of life | |||
| New Zealand | 1901–19051 | 58.1 | 60.6 |
| Australia | 1901–1910 | 55.2 | 58.8 |
| Denmark | 1895–1900 | 50.2 | 53.2 |
| Japan | 1899–1903 | 37.8 | 38.2 |
| Norway | 1891–1900 | 50.4 | 54.1 |
| United Kingdom | 1906 | 48.0 | 51.6 |
| New Zealand | 1950–1952 | 67.2 | 71.3 |
| Australia | 1953–1955 | 67.1 | 72.8 |
| Denmark | 1951–1960 | 70.1 | 73.2 |
| Japan | 1950–1952 | 59.6 | 63.0 |
| Norway | 1951–1955 | 71.1 | 74.7 |
| United Kingdom | 1951 | 66.2 | 71.2 |
| New Zealand | 1970–1972 | 68.5 | 74.6 |
| Australia | 1975–1977 | 69.5 | 76.4 |
| Denmark | 1971–1975 | 70.9 | 76.5 |
| Japan | 1970 | 69.3 | 74.7 |
| Norway | 1971–1975 | 71.4 | 77.7 |
| United Kingdom | 1971 | 68.8 | 75.0 |
| New Zealand | 1980–1982 | 70.4 | 76.4 |
| Australia | 1981 | 71.4 | 78.4 |
| Denmark | 1981–1985 | 71.5 | 77.5 |
| Japan | 1980 | 73.3 | 78.8 |
| Norway | 1981–1982 | 72.6 | 79.4 |
| United Kingdom | 1981 | 70.8 | 76.8 |
| New Zealand | 1990–1992 | 72.9 | 78.7 |
| Australia | 1993 | 75.0 | 80.9 |
| Denmark | 1991–1992 | 72.4 | 77.8 |
| Japan | 1992 | 76.1 | 82.2 |
| Norway | 1992 | 74.2 | 80.3 |
| United Kingdom | 1990 | 73.0 | 78.5 |
| New Zealand | 2002–2004 | 77.0 | 81.3 |
| Australia | 2001–2003 | 77.8 | 82.8 |
| Denmark | 2003–2004 | 75.2 | 79.9 |
| Japan | 2004 | 78.6 | 85.6 |
| Norway | 2003 | 77.0 | 81.9 |
| United Kingdom | 2001–2003 | 75.9 | 80.5 |
Table 5.15. Death rate
By age and
sex
Years ending 31
December
| Year | Under 11 | 1–4 | 5–14 | 15–24 | 25–34 | 35–44 | 45–54 | 55–64 | 65–74 | 75 and over |
|---|---|---|---|---|---|---|---|---|---|---|
1Per 1,000 live births. 2Excludes Māori population. Note:Live births for 1901–1961 include late registrations, while those from 1981 onwards exclude late registrations. Death rates for 1991 onwards are based on the resident population concept, replacing the de facto population concept used previously. Source: Statistics New Zealand | ||||||||||
| Males | Per 1,000 mean estimated population | |||||||||
| 19012 | 78.60 | 6.81 | 1.89 | 3.52 | 3.97 | 6.16 | 11.94 | 23.12 | 50.59 | 141.67 |
| 19212 | 53.10 | 4.78 | 1.85 | 2.44 | 3.56 | 5.55 | 9.61 | 19.96 | 46.17 | 128.60 |
| 1941 | 43.65 | 4.39 | 1.36 | 2.53 | 2.93 | 3.95 | 9.20 | 21.13 | 47.45 | 140.17 |
| 1961 | 25.86 | 1.35 | 0.49 | 1.28 | 1.47 | 2.67 | 7.37 | 19.70 | 47.40 | 125.90 |
| 1981 | 13.01 | 0.95 | 0.35 | 1.53 | 1.35 | 2.26 | 6.57 | 17.30 | 43.39 | 114.11 |
| 2001 | 6.14 | 0.33 | 0.20 | 1.08 | 1.20 | 1.56 | 3.26 | 9.04 | 26.86 | 87.33 |
| 2002 | 5.62 | 0.39 | 0.20 | 0.90 | 1.13 | 1.60 | 3.40 | 8.86 | 24.95 | 86.58 |
| 2003 | 5.69 | 0.34 | 0.19 | 0.93 | 1.14 | 1.60 | 3.40 | 8.43 | 23.82 | 83.92 |
| 2004 | 5.68 | 0.30 | 0.17 | 0.90 | 0.96 | 1.53 | 3.29 | 7.88 | 23.01 | 83.71 |
| Females | ||||||||||
| 19012 | 63.87 | 5.50 | 1.64 | 3.58 | 4.72 | 6.70 | 10.62 | 19.44 | 43.32 | 127.98 |
| 19212 | 42.31 | 4.49 | 1.31 | 2.34 | 3.38 | 4.46 | 8.00 | 14.88 | 36.81 | 120.23 |
| 1941 | 35.75 | 3.84 | 1.20 | 1.94 | 2.44 | 3.50 | 6.90 | 15.04 | 38.61 | 118.74 |
| 1961 | 19.50 | 1.16 | 0.35 | 0.54 | 0.87 | 1.95 | 4.59 | 11.23 | 29.92 | 104.72 |
| 1981 | 10.22 | 0.64 | 0.23 | 0.67 | 0.64 | 1.51 | 3.94 | 9.19 | 23.73 | 84.67 |
| 2001 | 4.44 | 0.33 | 0.18 | 0.41 | 0.51 | 0.90 | 2.47 | 6.30 | 15.68 | 72.37 |
| 2002 | 5.48 | 0.32 | 0.13 | 0.39 | 0.56 | 0.96 | 2.29 | 6.04 | 15.69 | 72.30 |
| 2003 | 4.14 | 0.36 | 0.12 | 0.46 | 0.50 | 0.98 | 2.43 | 5.72 | 15.41 | 70.54 |
| 2004 | 5.47 | 0.25 | 0.12 | 0.40 | 0.48 | 0.97 | 2.44 | 5.73 | 14.81 | 71.72 |
| Both sexes | ||||||||||
| 19012 | 71.40 | 6.17 | 1.77 | 3.55 | 4.33 | 6.40 | 11.37 | 21.63 | 47.87 | 135.71 |
| 19212 | 47.82 | 4.64 | 1.58 | 2.39 | 3.47 | 5.10 | 8.85 | 17.59 | 41.90 | 124.84 |
| 1941 | 39.81 | 4.12 | 1.28 | 2.22 | 2.67 | 3.72 | 8.02 | 18.16 | 43.06 | 129.00 |
| 1961 | 22.76 | 1.26 | 0.42 | 0.92 | 1.18 | 2.31 | 5.99 | 15.43 | 37.71 | 113.84 |
| 1981 | 11.65 | 1.56 | 0.29 | 1.11 | 0.99 | 1.89 | 5.29 | 13.15 | 32.67 | 95.41 |
| 2001 | 5.30 | 0.33 | 0.19 | 0.75 | 0.84 | 1.22 | 2.86 | 7.65 | 21.07 | 78.11 |
| 2002 | 5.55 | 0.35 | 0.17 | 0.65 | 0.83 | 1.27 | 2.84 | 7.43 | 20.15 | 77.84 |
| 2003 | 4.93 | 0.35 | 0.16 | 0.70 | 0.81 | 1.28 | 2.91 | 7.06 | 19.46 | 75.81 |
| 2004 | 5.58 | 0.28 | 0.14 | 0.66 | 0.71 | 1.24 | 2.86 | 6.80 | 18.76 | 76.48 |
Significant ethnic differentials exist in mortality rates.
According to 2002–04 life tables, a newborn non-Māori girl could expect to live 81.9 years, and a newborn non-Māori boy could expect to live 77.2 years. For Māori, life expectancy at birth was 73.2 years for females and 69.0 years for males.
Lower non-Māori death rates at ages 45–79 account for about three-quarters of these differences, and this partly reflects different rates of smoking and diabetes, as well as socio-economic differentials. For example, the 1996 Census reported that 44 percent of Māori aged 15 and over were regular smokers, compared with 21 percent of non-Māori.
Women live longer than men and experience lower death rates at all ages, although men have closed the gap in recent decades. A century ago, women could expect to outlive men by about 2.5 years. By 1950–52, the female advantage had increased to 4.1 years and by 1975–77 it was 6.4 years. However, the male-female difference had narrowed to 4.3 years in 2002–04.
Figure 5.10 shows movements in the median age at death for males and females since 1950.
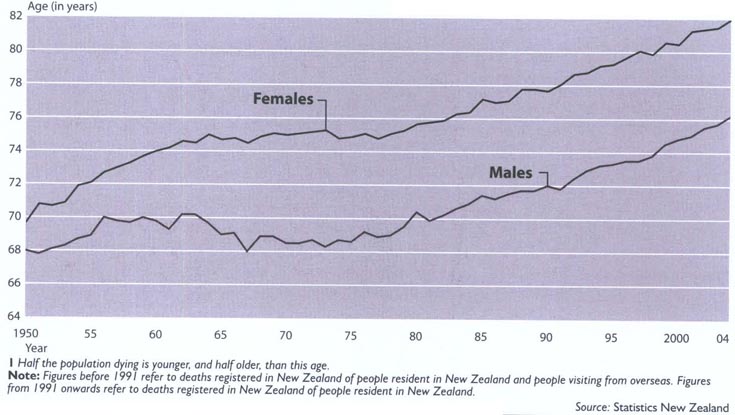
New Zealand has traditionally been a country of immigration, although the intake has been small compared with immigration flows to New World countries such as Australia, Canada and the United States.
The end of World War II saw economic stability and the reintroduction, in 1947, of an assisted/free passage scheme to attract working-age industrial and agricultural labour from the United Kingdom.
There are now nearly 200,000 Australian-born children living in Australia who have at least one New Zealand-born parent.
Agreements were also negotiated to accept young non-British European migrants, and refugee immigration was allowed on humanitarian grounds. These grounds were to lead to the settlement of nearly 4,000 Indo-Chinese refugees in New Zealand during 1978–82. Historical and regional considerations also led to establishment of immigration quotas for small Pacific Island countries.
The government adopted a new immigration policy in 1974, which ended unrestricted immigration from the United Kingdom and Ireland and provided for the selection of immigrants from all sources on the same criteria.
The reciprocal Trans-Tasman Travel Agreement, which allows free movement of residents between Australia and New Zealand, was not changed.
Similarly, the right of free entry into New Zealand was maintained for the people of the Cook Islands, Niue and the Tokelau Islands, who are regarded as New Zealand citizens. As a result of these initiatives, and further policy changes in the 1980s and 1990s, immigrants in post-war years have come from a wider range of countries than before.
Between 1947 and 1967, New Zealand recorded a net gain of about 281,000 permanent and long-term migrants (people whose stated intention is to settle, or depart, for 12 months or more, or permanently). In each of the 21 years, net migration was positive; for 16 of those years, the net gain was more than 10,000. During this period, annual immigrants increased from 8,106 to 38,999, while emigrants increased from 6,051 to 21,128.
Table 5.16 provides a summary of external migration from 1900 to 2005.
Table 5.16. External migration
Years ending 31
March
| Year | Total | Permanent and long term | Short term | ||||||
|---|---|---|---|---|---|---|---|---|---|
| Arrivals | Departures | Net | Arrivals | Departures | Net | Arrivals | Departures | Net | |
Note:Only total arrivals and departures recorded before 1930. Source: Statistics New Zealand | |||||||||
| Five-year totals | |||||||||
| 1900 | 93,037 | 84,398 | 8,639 | ||||||
| 1905 | 141,678 | 99,501 | 42,177 | ||||||
| 1910 | 190,772 | 146,783 | 43,989 | ||||||
| 1915 | 202,087 | 165,286 | 36,801 | ||||||
| 1920 | 98,473 | 90,532 | 7,941 | ||||||
| 1925 | 199,791 | 151,285 | 48,506 | ||||||
| 1930 | 192,606 | 167,346 | 25,260 | 53,988 | 16,081 | 37,907 | 138,618 | 151,265 | -12,647 |
| 1935 | 111,933 | 118,076 | -6,143 | 13,466 | 14,830 | -1,364 | 98,467 | 103,246 | -4,779 |
| 1940 | 171,424 | 159,514 | 11,910 | 22,871 | 19,267 | 3,604 | 148,553 | 140,247 | 8,306 |
| 1945 | 35,003 | 32,414 | 2,589 | 6,597 | 9,241 | -2,644 | 28,406 | 23,173 | 5,233 |
| 1950 | 158,637 | 135,439 | 23,198 | 51,487 | 30,020 | 21,467 | 107,150 | 105,419 | 1,731 |
| 1955 | 306,837 | 239,148 | 67,689 | 116,510 | 37,419 | 79,091 | 190,327 | 201,729 | -11,402 |
| 1960 | 395,218 | 347,021 | 48,197 | 115,308 | 51,169 | 64,139 | 279,910 | 295,852 | -15,942 |
| 1965 | 737,703 | 676,137 | 61,566 | 156,462 | 75,055 | 81,407 | 581,241 | 601,082 | -19,841 |
| 1970 | 1,278,867 | 1,273,409 | 5,458 | 155,008 | 127,814 | 27,194 | 1,123,859 | 1,145,595 | -21,736 |
| 1975 | 2,506,714 | 2,400,234 | 106,480 | 274,842 | 196,993 | 77,849 | 2,231,872 | 2,203,241 | 28,631 |
| 1980 | 3,793,483 | 3,874,575 | -81,092 | 204,867 | 319,964 | -115,097 | 3,588,616 | 3,554,611 | 34,005 |
| 1985 | 4,772,257 | 4,766,993 | 5,264 | 213,059 | 247,712 | -34,653 | 4,559,198 | 4,519,281 | 39,917 |
| 1990 | 7,359,340 | 7,394,389 | -35,049 | 226,420 | 306,653 | -80,233 | 7,132,920 | 7,087,736 | 45,184 |
| 1995 | 9,773,429 | 9,711,641 | 61,788 | 280,508 | 220,473 | 60,035 | 9,492,921 | 9,491,168 | 1,753 |
| 2000 | 13,519,016 | 13,462,491 | 56,525 | 337,781 | 303,480 | 34,301 | 13,181,235 | 13,159,011 | 22,224 |
| 2005 | 18,000,320 | 17,815,512 | 184,808 | 419,038 | 326,420 | 92,618 | 17,581,282 | 17,489,092 | 92,190 |
| Annual totals | |||||||||
| 1987 | 1,321,729 | 1,317,372 | 4,357 | 44,360 | 58,629 | -14,269 | 1,277,369 | 1,258,743 | 18,626 |
| 1988 | 1,554,992 | 1,555,949 | -957 | 47,844 | 63,469 | -15,625 | 1,507,148 | 1,492,480 | 14,668 |
| 1989 | 1,669,637 | 1,687,935 | -18,298 | 46,233 | 70,941 | -24,708 | 1,623,404 | 1,616,994 | 6,410 |
| 1990 | 1,701,056 | 1,702,689 | -1,633 | 52,001 | 56,019 | -4,018 | 1,649,055 | 1,646,670 | 2,385 |
| 1991 | 1,772,524 | 1,757,948 | 14,576 | 57,088 | 45,472 | 11,616 | 1,715,436 | 1,712,476 | 2,960 |
| 1992 | 1,809,885 | 1,806,947 | 2,938 | 49,010 | 44,723 | 4,287 | 1,760,875 | 1,762,224 | -1,349 |
| 1993 | 1,898,769 | 1,890,689 | 8,080 | 49,562 | 42,714 | 6,848 | 1,849, 207 | 1,847, 975 | 1232 |
| 1994 | 2,057,005 | 2,041,212 | 15,793 | 57,257 | 41,670 | 15,587 | 1,999,748 | 1,999,542 | 206 |
| 1995 | 2,235,246 | 2,214,845 | 20,401 | 67,591 | 45,894 | 21,697 | 2,167,655 | 2,168,951 | -1,296 |
| 1996 | 2,464,732 | 2,436,106 | 28,626 | 80,288 | 50,456 | 29,832 | 2,384,444 | 2,385,650 | -1,206 |
| 1997 | 2,726,897 | 2,689,118 | 37,779 | 76,896 | 55,948 | 20,948 | 2,650,001 | 2,633,170 | 16,831 |
| 1998 | 2,651,737 | 2,649,814 | 1,923 | 62,928 | 60,221 | 2,707 | 2,588,809 | 2,589,593 | -784 |
| 1999 | 2,755,895 | 2,769,847 | -13,952 | 56,580 | 66,779 | -10,199 | 2,699,315 | 2,703,068 | -3,753 |
| 2000 | 2,919,755 | 2,917,606 | 2,149 | 61,089 | 70,076 | -8,987 | 2,858,666 | 2,847,530 | 11,136 |
| 2001 | 3,218,995 | 3,214,037 | 4,958 | 66,465 | 79,065 | -12,600 | 3,152,530 | 3,134,972 | 17,558 |
| 2002 | 3,336,555 | 3,269,158 | 67,397 | 88,365 | 62,730 | 25,635 | 3,248,190 | 3,206,428 | 41,762 |
| 2003 | 3,481,498 | 3,417,540 | 63,958 | 98,671 | 57,079 | 41,592 | 3,382,827 | 3,360,461 | 22,366 |
| 2004 | 3,702,754 | 3,668,348 | 34,406 | 87,473 | 59,495 | 27,978 | 3,615,281 | 3,608,853 | 6,428 |
| 2005 | 4,261,006 | 4,246,399 | 14,607 | 78,064 | 68,051 | 10,013 | 4,182,942 | 4,178,348 | 4,594 |
Since 1968, net migration has been more volatile, with periods of net outflow followed by periods of net inflow. As a result, the net gain from permanent and long-term migration over the period 1968 to 2005 was 27,433, a tenth of the 1947–67 gain.
The economic recession of the late 1960s led to a significant drop in immigration, and an upturn in emigration, which resulted in a net outflow of 7,387 during 1968–70.
Over the next six years, there was a net migration gain for each year, with a total gain for the six years of 83,149. Over this period, the number of immigrants increased to a peak of 69,815 in 1974, before dropping to 48,460 in 1976, while the number of emigrants increased from 29,822 to 43,160. Also during this period, the preponderance of immigrants from the United Kingdom and Ireland decreased, and migration to and from Australia became the largest in terms of volume.
Between 1976 and 1979, the number of emigrants almost doubled, to 81,008, with nearly two-thirds of this increase being departures to Australia. However, in the year ending 31 March 1980, the number of permanent and long-term departures declined by 6 percent. By 1984, the number of emigrants had fallen to 34,147. A drop in departures to Australia accounted for about 60 percent of this decline.
The number of arrivals dropped by almost one-quarter between 1976 and 1977 and then gradually increased over the next six years. Departures exceeded arrivals for each year between 1977 and 1982, with a total net loss of 156,704.
For the first time since 1976, more people arrived in New Zealand than left in 1983 and 1984, giving small gains to the country of 3,180 and 6,558 respectively. The turnaround was short-lived, however. During the remainder of the 1980s, the number of departures resumed an upward movement, primarily driven by people moving to Australia. The peak year was 1989, with 70,941 emigrants, giving a net outflow of 24,708 people for that year. Although arrivals also increased over the period, departures exceeded arrivals for each year from 1985 and 1990, with a total net loss of 88,317.
The 1990s saw a return to net population gains from migration, with arrivals exceeding departures from 1991 to 1998. During this period, arrivals increased steadily, from 49,010 in 1992 to a peak of 80,288 in 1996, before dropping back. Migrants from Asia made a significant contribution to these changes.
In the year ending 31 March 1991, there was a net gain of 11,616 people. By 1995 this had almost doubled to 21,697 and by 1996 reached 29,832. This figure dropped to 20,948 in 1997 and further to 2,707 in 1998. The total net gain over the eight years was 113,522.
Between 1999 and 2001, there were net population losses from migration totalling 31,786.
There was a return to net gains from migration for the years 2002 to 2005. Arrivals increased from 66,465 in 2001 to a record March year total of 98,671 in 2003. This increase was driven predominantly by arrivals from Asia, many of whom were students, and the United Kingdom. The main contributor to the subsequent decrease in arrivals in 2004 and 2005 was arrivals from Asia.
There was a drop in departures of over 20,000 between 2001 and 2003, mainly due to fewer departures to Australia. This was followed by a smaller upturn between 2003 and 2005. The total net gain over the four years was 105,218.
During the past two decades, there have been consistent net migration gains from Asia. This contrasts with consistent net losses to Australia. Net migration from Asia increased significantly between 1988 and 1996, then declined over the next three years. The net gain then almost trebled between 2000 and 2003, when a net gain of 32,655 was recorded, before dropping to 7,463 in 2005.
The age and sex profile of a population represents the cumulative effect of past changes in the dynamics of population growth – fertility, mortality and migration.
There were slightly more females than males in the New Zealand population at the 2001 Census. This contrasts with early colonial days, when there was a large surplus of males, especially young males. Each census has seen the sex ratio draw closer to parity, with two exceptions when there was a temporary excess of females – during World War I and, again, during World War II. Females again outnumbered males in 1968 and the ratio has increased steadily since then, with the 2001 Census showing 1,823,007 males and 1,914,273 females usually resident in New Zealand, representing a sex ratio of 95 males to 100 females. Final counts from the 2006 Census were not available in time for this edition of the Yearbook.
Figure 5.11 shows the age and sex distribution of the New Zealand population at 10-year intervals from 1971 to 2001.
Changes in the age structure of New Zealand's population have been profound during the past 100 years. The changes largely reflect ‘roller coaster’ movements in the birth rate, with small and large birth cohorts moving through the age structure. However, migration gains and losses (dominated by people of younger and middle working ages) have added significantly to these structural changes.
The ‘baby boom’ lifted the proportion of children in the population to 33 percent in 1961, with nearly half the population under the age of 25.
New Zealand's Pacific population at the 2001 Census contained nearly double the proportion of children as the European and Asian populations.
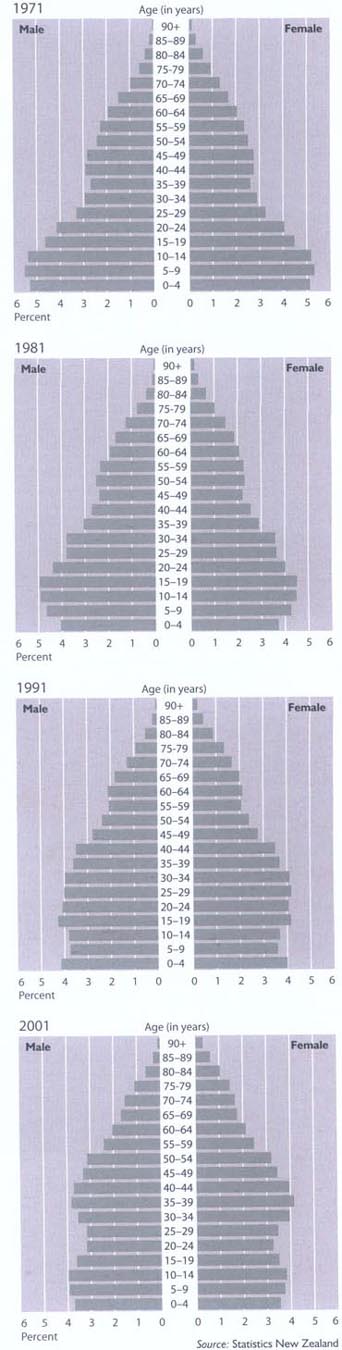
The subsequent sharp decline in fertility, increased longevity and movement of the ‘baby boomers’ into working ages caused a major realignment of the age structure. The median age of the population rose by 8.3 years between 1976 and 2001, from 26.5 years to 34.8 years.
At the 2001 Census, there were 847,743 children under the age of 15, down from 928,205 in 1976. They made up 23 percent of the population (down from 30 percent in 1976).
The 15–64 year group has risen considerably since 1976 (by more than half a million) to number 2,439,111 at the 2001 Census. However, the proportion of the male population in working ages has declined slightly since 1991, whereas the proportion of the female population in the working ages has continued to increase.
The greatest change in the age structure of the population is at the older ages. Since 1976, the number of people aged 65 and over has increased by more than one and-a-half times and the number aged 80 and over has more than doubled.
There are population sub-groups within New Zealand with remarkably different age structures.
Ethnic groups such as Māori and Pacific peoples have more youthful populations, commonly characteristic of developing nations. At the 2001 Census, they contained nearly twice the proportion of children under 15 years as their European or Asian counterparts. Nearly two-thirds of their populations were under 30 and their median ages were about 15 years lower than their European counterparts.
At the other end of the age scale, only about 4 percent of the Māori, Asian and Pacific peoples populations were aged 65 or more, compared with 14 percent for the European ethnic group, reflecting both different life expectancy and recent migration history.
Figure 5.12 shows crude birth and death rates since 1855.
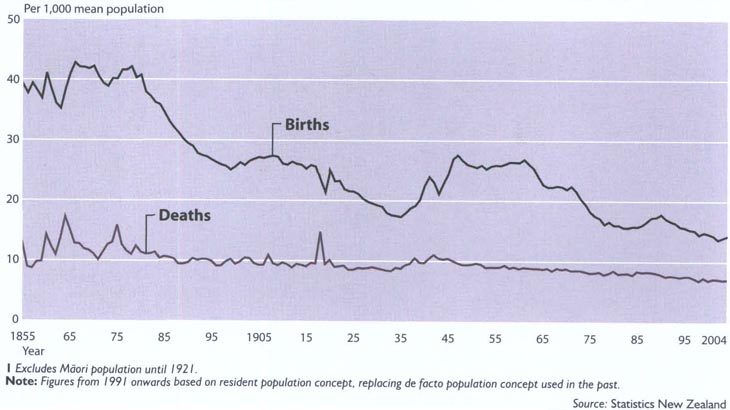
Table of Contents
The Ministry of Youth Development's Aotearoa Youth Voices project gives young people the opportunity to voice their opinions on youth issues, have their views published and get involved in decision making.
Ethnicity is a key variable in explaining differences in social characteristics, social well-being and social change.
The population census has traditionally been the main source of national statistics on ethnicity in New Zealand, although prior to 1991 a biological or race-based measure was used. Since 1991, people have been asked to identify which ethnic group or groups they belong to, and multiple responses are counted.
The 2001 Census question differed from that used in the 1996 Census in two main ways: the wording of the question did not encourage multiple responses, and there were no tick-box categories for European ethnic groups, apart from New Zealand European.
As a result, data from the 1991 Census, which used a similar ethnicity question to 2001, is being used for comparison purposes. (Ethnicity information from the 2006 Census was not available in time for this edition of the Yearbook.)
Information presented in this chapter is based on the census usually resident population count. This is a count of all people who usually live in New Zealand and were present in New Zealand on the night of the census. It excludes visitors from overseas and New Zealand residents who were temporarily overseas on census night.
In 2001, nine out of 10 people living in New Zealand identified with only one ethnic group, but young people were far more likely to list multiple ethnicities. For example, one in five children under the age of five gave more than one ethnic response in 2001. This is a reflection of the increasing ethnic diversity of the New Zealand population.
Eighty percent of people living in New Zealand in 2001 were European. However, compared with other major ethnic groups, there had been only a small increase in the European population since 1991.
The Māori population grew by 21 percent between 1991 and 2001 to comprise just under 15 percent of the population.
Other major ethnic groups made even more rapid gains, with the Asian population more than doubling in the same period, to 6.6 percent of the total population. For the first time in recent censuses, people of Asian ethnicity outnumbered Pacific peoples (6.5 percent of the population) in 2001.
There were also large gains in the ‘other’ ethnic group, which includes African, Middle Eastern and South American ethnic groups. These increases reflect a move away from the more traditional source countries, such as the United Kingdom.
Ethnic groups such as Korean, Arab, Croatian, Iraqi and South African are examples of specific ethnic groups that made huge population gains in the decade to 2001.
Table 6.01 shows changes in the ethnic makeup of the New Zealand population between the 1991 and 2001 censuses.
Table 6.01. Ethnic groups of population (total responses)
| Ethnic group (total people) | 1991 Census | 2001 Census | Intercensal percentage change 1991–2001 | ||
|---|---|---|---|---|---|
| Number | Percentage of population2 | Number | Percentage of population2 | ||
1Includes response unidentifiable, response outside scope and not staled. 2Calculated in terms of specified cases only. - figure too small to be expressed. Note: The number of responses is greater than the total population, as multiple responses are counted. Source: Statistics New Zealand. | |||||
| European | 2,783,025 | 83.2 | 2,868,009 | 80.0 | 3.1 |
| Māori | 434,847 | 13.0 | 526,281 | 14.7 | 21.0 |
| Pacific peoples | 167,070 | 5.0 | 231,798 | 6.5 | 38.7 |
| Asian | 99,756 | 3.0 | 237,459 | 6.6 | 138.0 |
| Other | 6,693 | 0.2 | 24,924 | 0.7 | 272.4 |
| Not elsewhere included1 | 28,113 | 150,546 | |||
| Total New Zealand resident population | 3,373,926 | 3,737,277 | 10.8 | ||
| Selected ethnic groups (total responses) | |||||
| New Zealand European | 2,618,445 | 78.3 | 2,689,308 | 75.0 | 2.7 |
| Māori | 434,847 | 13.0 | 526,281 | 14.7 | 21.0 |
| Samoan | 85,743 | 2.6 | 114,432 | 3.2 | 33.5 |
| Chinese | 44,136 | 1.3 | 100,203 | 2.8 | 127.0 |
| Indian | 29,820 | 0.9 | 59,823 | 1.7 | 100.6 |
| Cook Island Maori | 37,233 | 1.1 | 51,141 | 1.4 | 37.4 |
| Tongan | 23.175 | 0.7 | 40,713 | 1.1 | 75.7 |
| English | 53,325 | 1.6 | 34,074 | 1.0 | -36.1 |
| Dutch | 24,732 | 0.7 | 27,396 | 0.8 | 10.8 |
| Niuean | 14,427 | 0.4 | 20,148 | 0.6 | 39.7 |
| Korean | 930 | - | 19,026 | 0.5 | 1,945.8 |
| British | 16,659 | 0.5 | 16,524 | 0.5 | -0.8 |
| South African | 2,007 | 0.1 | 14,889 | 0.4 | 641.9 |
| Scottish | 14,094 | 0.4 | 12,792 | 0.4 | -9.2 |
| Irish | 7,392 | 0.2 | 11,199 | 0.3 | 51.5 |
| Filipino | 4,917 | 0.1 | 11,091 | 0.3 | 125.6 |
| Japanese | 2,970 | 0.1 | 10,002 | 0.3 | 236.8 |
| Fijian | 5,100 | 0.2 | 7.041 | 0.2 | 38.1 |
| Tokelauan | 4,146 | 0.1 | 6,204 | 0.2 | 49.6 |
| Sri Lankan | 2,406 | 0.1 | 6,042 | 0.2 | 151.1 |
| Arab | 177 | - | 2,856 | 0.1 | 1,513.6 |
| Croat/Croatian | 171 | - | 2,502 | 0.1 | 1,363.2 |
| Iraqi | 246 | - | 2,145 | 0.1 | 772.0 |
Table 6.02 compares age structures of the major ethnic groups in New Zealand.
Table 6.02. Comparison of age structure of major ethnic groups
2001 Census
| Age group (in years) | Percentage of population in age groups | ||||
|---|---|---|---|---|---|
| European | Māori | Pacific peoples | Asian | Other | |
Note: Figures may not add to staled totals due to rounding. Source: Statistics New Zealand | |||||
| 0–4 | 6.8 | 12.8 | 14.1 | 7.7 | 10.0 |
| 5–14 | 14.7 | 24.5 | 24.7 | 15.9 | 19.7 |
| 15–24 | 12.4 | 17.4 | 17.8 | 21.5 | 18.3 |
| 25–34 | 13.5 | 15.1 | 15.4 | 15.9 | 17.6 |
| 35–44 | 15.4 | 13.5 | 12.4 | 17.9 | 17.5 |
| 45–54 | 13.6 | 8.5 | 7.8 | 11.4 | 9.8 |
| 55–64 | 9.7 | 4.8 | 4.4 | 5.6 | 4.1 |
| 65–74 | 7.4 | 2.5 | 2.3 | 2.9 | 2.0 |
| 75–84 | 4.9 | 0.7 | 0.8 | 0.9 | 0.8 |
| 85 and over | 1.6 | 0.1 | 0.1 | 0.2 | 0.3 |
| Total | 100.0 | 100.0 | 100.0 | 100.0 | 100.0 |
The increasing diversity of New Zealand's population is reflected in changes in the country of birth of the population.
In 2001. people who were born in New Zealand made up 80.5 percent of those people who usually live in New Zealand, down from 82.5 percent in 1996 (see Table 6.03).
Table 6.03. Country of birth of population
| Country of birth | 1996 Census | 2001 Census | Intercensal percentage change 1996–2001 | ||
|---|---|---|---|---|---|
| Number | Percentage of responses1 | Number | Percentage of responses1 | ||
1Calculated in terms of specified cases only. ... not applicable Note: All totals randomly rounded to base 3. Source: Statistics New Zealand | |||||
| New Zealand | 2,848,209 | 82.5 | 2,890,869 | 80.5 | 1.5 |
| Australia | 54,711 | 1.6 | 56,259 | 1.6 | 2.8 |
| Samoa | 42,174 | 1.2 | 47,118 | 1.3 | 11.7 |
| Fiji | 18,774 | 0.5 | 25,725 | 0.7 | 37.0 |
| Tonga | 14,040 | 0.4 | 18,051 | 0.5 | 28.6 |
| Cook Islands | 13,755 | 0.4 | 15,222 | 0.4 | 10.7 |
| Other Oceania and Antarctica | 10,533 | 0.3 | 11,877 | 0.3 | 12.8 |
| Total Oceania and Antarctica | 3,002,193 | 86.9 | 3,065,121 | 85.4 | 2.1 |
| United Kingdom and Ireland | 230,049 | 6.7 | 225,123 | 6.3 | -2.1 |
| Netherlands | 23,430 | 0.7 | 22,242 | 0.6 | -5.1 |
| Germany | 7,068 | 0.2 | 8,382 | 0.2 | 18.6 |
| Other Europe | 25,098 | 0.7 | 28,923 | 0.8 | 15.2 |
| Total Europe | 285,648 | 8.3 | 284,670 | 7.9 | -0.3 |
| North Africa and Middle East | 7,239 | 0.2 | 12,174 | 0.3 | 68.2 |
| Malaysia | 11,889 | 0.3 | 11,460 | 0.3 | -3.6 |
| Philippines | 7,002 | 0.2 | 10,137 | 0.3 | 44.8 |
| Other South-east Asia | 18,441 | 0.5 | 23,595 | 0.7 | 27.9 |
| China | 19,518 | 0.6 | 38,949 | 1.1 | 99.6 |
| Korea, Republic of | 12,183 | 0.4 | 17,934 | 0.5 | 47.2 |
| Taiwan | 10,932 | 0.3 | 12,486 | 0.3 | 14.2 |
| Hong Kong | 11,763 | 0.3 | 11,301 | 0.3 | -3.9 |
| Japan | 6,501 | 0.2 | 8,622 | 0.2 | 32.6 |
| India | 12,807 | 0.4 | 20,889 | 0.6 | 63.1 |
| Other North-east, Southern and Central Asia | 6,885 | 0.2 | 10,401 | 0.3 | 51.1 |
| Total Asia | 117,915 | 3.4 | 177,948 | 4.6 | 50.9 |
| North America | 19,065 | 0.6 | 21,114 | 0.6 | 10.7 |
| Central and South America | 3,561 | 0.1 | 4,395 | 0.1 | 23.4 |
| Total Americas | 22,626 | 0.7 | 25,509 | 0.7 | 12.7 |
| South Africa | 11,334 | 0.3 | 26,061 | 0.7 | 129.9 |
| Other sub-Saharan Africa | 6,114 | 0.2 | 10,152 | 0.3 | 66.0 |
| Total sub-Saharan Africa | 17,445 | 0.5 | 36,213 | 1.0 | 107,6 |
| Not specified/born at sea | 165,078 | ... | 147,816 | ... | -10.5 |
| Total | 3,618,303 | 3,737,277 | 3.3 | ||
Between 1996 and 2001, New Zealand's overseas-born population rose by approximately 93,600, an increase of 15.5 percent. Much of this increase occurred in Auckland, where, in 2001, people born overseas accounted for one in every three.
While people born in the United Kingdom and Ireland continue to comprise the largest immigrant group, at around 6.3 percent of the total population, their number fell slightly, by 4,926, between 1996 and 2001.
There were large increases in the number of people born in Asia, Africa and the Middle East.
The proportion of the New Zealand population born in Asia increased from 3.4 percent to 4.6 percent during the period 1996 to 2001. Those born in China doubled, from 19,518 in 1996 to 38,949 in 2001. In the same period, the Indian-born population increased by 63.1 percent (to 20,889), those born in the Republic of Korea by 47,2 percent (to 17,934), and the Philippines-born population by 44.8 percent (to 10,137).
The number of people born in South Africa increased by 129.9 percent between 1996 and 2001, to 26,061. The number of people born in North Africa and the Middle East rose from 7,239 in 1996 to 12,174 in 2001, an increase of 68.2 percent. The rest of the sub-Saharan-born population increased by 66 percent, to 10,152.
Figure 6.01 shows birthplaces as a proportion of all New Zealanders born overseas.
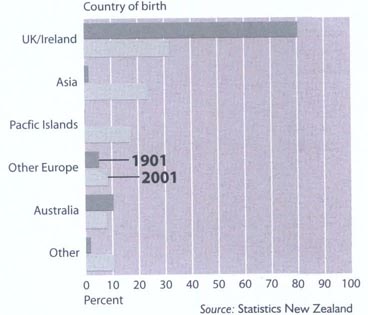
Results from the 2001 Census showed that Christianity (including Māori Christian) remained the dominant religion, with 61 percent of people identifying an affiliation to this group. Around 30 percent of people stated they had no religion, and 7 percent objected to answering the religious affiliation question.
Within the Christian religion, the Anglican (28 percent), Catholic (23 percent), Presbyterian (20 percent) and Methodist (6 percent) denominations continued to have the majority of affiliates. Together their members made up more than 75 percent of all Christian denominations (including Māori Christian). Of those who identified with Māori Christian, the most popular denominations were Rātana (77 percent) and Ringatū (24 percent). Although non-Christian religions are becoming more established in New Zealand, they each still make up only about 1 percent of the population. The three most common non-Christian religions in 2001 were Buddhist (1 percent), Hindu (1 percent) and Islam/Muslim (0.7 percent).
Changes to the 2001 Census question on religious affiliation mean direct intercensal comparisons cannot be made. Previous censuses collected only one response for religious affiliation, whereas up to four responses were collected in 2001. Table 6.04 summarises responses to the religious affiliation question in the 1991, 1996 and 2001 censuses.
Table 6.04. Religious affiliation1
| Religious affiliation (total responses) | 1991 | 1996 | 2001 |
|---|---|---|---|
12001 data is not directly comparable with previous data, as in the 1991 and 1996 censuses only one response to religious affiliation was collected. In the 2001 Census, up to four responses were collected. Where a person reported more than one religious affiliation, each was counted in its applicable group. The 1991 and 1996 data includes Ecumenical, which in 2001 was included in Uniting/Union Church and Ecumenical. The 1996 data includes Fundamentalist. Born Again, which in 2001 was included in Evangelical, Born Again and Fundamentalist. Note: All totals randomly rounded to base 3. ..figures not available Source: Statistics New Zealand | |||
| Anglican | 732,048 | 631,764 | 584,793 |
| Catholic | 498,612 | 473,112 | 486,012 |
| Presbyterian, Congregational and Reformed | 553,386 | 470,442 | 431,547 |
| Christian (not further denned) | 79,317 | 186,891 | 192,165 |
| Methodist | 139,494 | 121,650 | 120,705 |
| Pentecostal | 49,596 | 69,333 | 67,239 |
| Māori Christian | 56,055 | 45,450 | 63,597 |
| Baptist | 70,155 | 53,613 | 51,426 |
| Buddhist | 12,762 | 28,131 | 41,634 |
| Latter-day Saints | 48,009 | 41,166 | 39,912 |
| Hindu | 18,036 | 25,551 | 39,798 |
| Islam/Muslim | 6,096 | 13,545 | 23,631 |
| Brethren | 21,915 | 21,933 | 20,406 |
| Jehovah's Witness | 19,182 | 19,527 | 17,826 |
| Spiritualism and New Age | 5,196 | 9,786 | 16,062 |
| Adventist | 15,675 | 14,691 | 14,868 |
| Salvation Army | 19,992 | 14,625 | 12,618 |
| Evangelical, Born Again and Fundamentalist | 5,169 | 1,584 | 11,019 |
| Orthodox | 4,263 | 6,933 | 9,588 |
| Judaism/Jewish | 3,126 | 4,809 | 6,636 |
| Lutheran | 4,965 | 5,007 | 4,314 |
| Other Christian | 3,276 | 2,766 | 3,558 |
| Church of Christ and Associated Churches of Christ | 4,842 | 4,233 | 3,270 |
| Protestant (not further defined) | 1,785 | 2,778 | 2,784 |
| Uniting/Union Church and Ecumenical | 1,026 | 1,728 | 1,389 |
| Asian Christian | .. | 222 | 195 |
| Other | 19,863 | 10,176 | 18,783 |
| No religion | 670,455 | 867,264 | 1,028,052 |
| Object to answering | 251,709 | 256,593 | 239,244 |
| Total people | 3,316,005 | 3,405,306 | 3,468,813 |
New Zealand's citizenship legislation is contained in the Citizenship Act 1977, the Citizenship (Western Samoa) Act 1982 and Citizenship Regulations 2002. All citizenship legislation and policy is administered by the Department of Internal Affairs. The principal legislation, the 1977 act, includes the Cook Islands, Niue, Tokelau and the Ross Dependency in the definition of New Zealand for purposes of New Zealand citizenship.
Under the act, a person may be a New Zealand citizen by birth in New Zealand, or by grant, or by descent from a New Zealand parent, that parent being a citizen otherwise than by descent. British subjects resident in New Zealand throughout 1948 may also apply for confirmation of citizenship.
Citizenship by birth. Most people born in New Zealand after 1 January 1949 are New Zealand citizens by birth. From 1 January 2006, children born in New Zealand (or in the Cook Islands, Niue or Tokelau) can acquire New Zealand citizenship at birth only if at least one of their parents is either a New Zealand citizen or entitled to be in New Zealand (or in the Cook Islands, Niue or Tokelau) indefinitely. This generally includes Australian citizens and persons entitled to be in Australia indefinitely. A child born in New Zealand is a New Zealand citizen by birth if they would otherwise be stateless.
Citizenship by descent. Most people born outside New Zealand after 1 January 1949 to a New Zealand parent, that parent being a citizen otherwise than by descent, have a claim to citizenship by descent. There are some limitations on this. New Zealand's citizenship legislation also contains provisions for those adopted by New Zealand citizens.
Migrants who have lived in New Zealand for five years and want to make New Zealand their home, can apply for, and be granted, New Zealand citizenship.
Grant of citizenship. Migrants to New Zealand who wish to make New Zealand their home may apply for a grant of citizenship. They must be 16 years or older, of full capacity and apply on the application form with the fee. General requirements are that applicants satisfy the Minister of Internal Affairs that they:
Have been present in New Zealand for the five years immediately preceding their application.
Are entitled to remain in New Zealand indefinitely (most applicants are required to have permanent residence status).
Are of good character.
Have a sufficient knowledge of the English language and of the responsibilities and privileges attached to New Zealand citizenship.
Intend to continue to live in New Zealand, or to work overseas in Crown service or for a New Zealand resident or established organisation.
The Citizenship Act 1977 contains special provisions for those whose parents are citizens by descent, for minors, for those who would otherwise be stateless and for people with special circumstances.
The Citizenship (Western Samoa) Act 1982 provides for the grant of citizenship to Samoan citizens. To be granted citizenship under this act, a person must be able to prove that they either have been in New Zealand at any time on 14 September 1982, or have lawfully entered New Zealand after that date and have an entitlement to remain in New Zealand indefinitely (most applicants will be required to have permanent residence status).
Applicants aged 14 and over approved for citizenship are required to attend a citizenship ceremony to swear allegiance to New Zealand and Queen Elizabeth II as Head of State. After this, the grant of citizenship is complete and a citizenship certificate is provided.
New Zealand citizens may be deprived of their citizenship if they act contrary to the interests of New Zealand, or if citizenship was obtained by fraud, false representation, or wilful concealment of relevant information.
A citizen cannot be deprived of citizenship if citizenship was acquired by mistake or if depriving them would leave them stateless. New Zealand citizens may choose to renounce citizenship if they hold citizenship of another country.
Figure 6.02 shows citizenship applications granted from 1960 to 2005, while Table 6.05 shows the country of birth of approved citizenship applicants in 2004 and 2005.
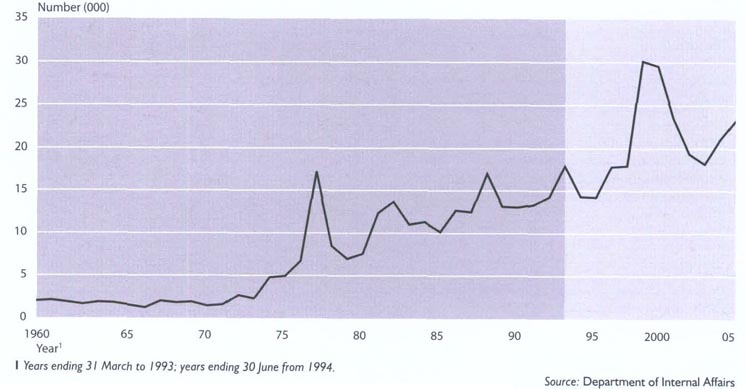
Immigration legislation and policy is administered by Immigration New Zealand (INZ), part of the Department of Labour.
The role of INZ is to manage immigration for national advantage on behalf of the government. INZ has branches throughout New Zealand and overseas.
The Ministry of Foreign Affairs and Trade processes temporary applications on behalf of INZ in some countries where INZ is not represented.
Residence. People who want to migrate permanently to New Zealand can apply under one of the three residence streams of the New Zealand Immigration Programme – skilled/business, family sponsored and international/humanitarian. Each stream has a number of categories. For the 2004/05 year, the immigration programme's residence approval limit was 45,000 (plus 5,000 extra places if required). This was the same as for the 2003/04 financial year. Residence applications are considered on the basis of whether principal applicants meet policy criteria set by the government. Principal applicants may include their partners and dependent children in their application. All applicants must meet health and character requirements, and all migrants over the age of 16 in the skilled migrant, investor and entrepreneur categories must meet a minimum standard of English. The English standard can be met by either exceeding the specified score in the International English Language Testing System (IELTS), or by showing other evidence of English ability. Skilled migrants must have an average of 6.5 on the IELTS scale across the four skill areas (speaking, writing, listening and reading) and business migrants must have an average of 5. Non-principal applicants who do not meet the standard may still be granted residence, provided they purchase English language tuition to be taken up once they arrive in New Zealand.
Table 6.05. Citizenship approvals
By country of
birth
Years ending 31
December
| Country of birth | Year | Total | |
|---|---|---|---|
| 2004 | 2005 | ||
| Source: Department of Internal Affairs | |||
| Afghanistan | 162 | 273 | 435 |
| Albania | 1 | 4 | 5 |
| Algeria | 8 | 10 | 18 |
| American Samoa | 23 | 20 | 43 |
| Angola | 1 | – | 1 |
| Argentina | 9 | 23 | 32 |
| Armenia | – | 1 | 1 |
| Australia | 136 | 108 | 244 |
| Austria | 8 | 8 | 16 |
| Azerbaijan | 2 | 9 | 11 |
| Bahamas | 1 | – | 1 |
| Bahrain | 7 | 8 | 15 |
| Bangladesh | 171 | 110 | 281 |
| Barbados | 1 | 4 | 5 |
| Belarus | 9 | 10 | 19 |
| Belgian Congo | 1 | – | 1 |
| Belgium | 7 | 5 | 12 |
| Belize | 1 | – | 1 |
| Bermuda | 1 | 4 | 5 |
| Bhutan | 1 | – | 1 |
| Bolivia | 4 | 3 | 7 |
| Bosnia-Herzegovina | 14 | 15 | 29 |
| Botswana | 7 | 2 | 9 |
| Brazil | 28 | 46 | 74 |
| Brunei | 7 | 6 | 13 |
| Bulgaria | 39 | 67 | 106 |
| Burma | 35 | 38 | 73 |
| Burundi | 2 | 4 | 6 |
| Cambodia | 489 | 443 | 932 |
| Cameroon | 1 | 1 | 2 |
| Canada | 164 | 154 | 318 |
| Central Africa | 1 | – | 1 |
| Ceylon | 1 | 2 | 3 |
| Channel Islands | 11 | 17 | 28 |
| Chile | 11 | 24 | 35 |
| China | 2,967 | 3,466 | 6,433 |
| Colombia | 25 | 25 | 50 |
| Congo | 1 | 3 | 4 |
| Costa Rica | 2 | 2 | |
| Croatia | 42 | 27 | 69 |
| Cuba | 4 | – | 4 |
| Cyprus | 4 | 5 | 9 |
| Czech Republic | 30 | 24 | 54 |
| Czechoslovakia | 5 | 3 | 8 |
| Democratic Republic of the Congo | 12 | 3 | 15 |
| Denmark | 2 | 6 | 8 |
| Djibouti | 1 | 10 | 11 |
| Dominica | 2 | – | 2 |
| Egypt | 63 | 88 | 151 |
| El Salvador | 12 | – | 12 |
| England | 2,142 | 2,201 | 4,343 |
| Eritrea | 12 | 8 | 20 |
| Estonia | 4 | – | 4 |
| Ethiopia | 102 | 93 | 195 |
| Fiji | 1,511 | 1,608 | 3,119 |
| Finland | 12 | 8 | 20 |
| France | 51 | 57 | 108 |
| French Indo-China | 2 | – | 2 |
| French Polynesia | 3 | 2 | 5 |
| Georgia | 4 | 6 | 10 |
| Germany | 101 | 87 | 188 |
| Ghana | 14 | 18 | 32 |
| Gibraltar | 5 | – | 5 |
| Greece | 1 | 3 | 4 |
| Guyana | 1 | – | 1 |
| Haiti | – | 1 | 1 |
| Honduras | – | 1 | 1 |
| Hong Kong | 276 | 231 | 507 |
| Hungary | 24 | 27 | 51 |
| India | 2,278 | 3,095 | 5,373 |
| Indonesia | 98 | 157 | 255 |
| Iran | 210 | 181 | 391 |
| Iraq | 536 | 482 | 1,018 |
| Ireland | 39 | 15 | 54 |
| Isle of Man | 4 | 1 | 5 |
| Israel | 24 | 33 | 57 |
| Italy | 22 | 16 | 38 |
| Jamaica | 2 | 3 | 5 |
| Japan | 31 | 28 | 59 |
| Jordan | 18 | 23 | 41 |
| Kazakhstan | 20 | 25 | 45 |
| Kenya | 42 | 48 | 90 |
| Kiribati | 4 | 10 | 14 |
| Korea | 1,133 | 1,586 | 2,719 |
| Kuwait | 69 | 61 | 130 |
| Kyrgyzstan | 7 | 7 | 14 |
| Laos | 19 | 8 | 27 |
| Latvia | 6 | 1 | 7 |
| Lebanon | 14 | 21 | 35 |
| Lesotho | 1 | – | 1 |
| Liberia | – | 6 | 6 |
| Libya | 6 | 10 | 16 |
| Lithuania | 3 | 7 | 10 |
| Macao | 7 | 6 | 13 |
| Macau | – | 5 | 5 |
| Macedonia | 76 | 62 | 138 |
| Madagascar | 2 | 1 | 3 |
| Malawi | 5 | 6 | 11 |
| Malaya | 2 | 2 | 4 |
| Malaysia | 366 | 303 | 669 |
| Maldives | 3 | 1 | 4 |
| Malta | 12 | 2 | 14 |
| Mauritania | 1 | – | 1 |
| Mauritius | 3 | 16 | 19 |
| Mexico | 17 | 13 | 30 |
| Moldova | 5 | 12 | 17 |
| Mongolia | 1 | 3 | 4 |
| Morocco | 17 | 8 | 25 |
| Mozambique | 3 | 3 | 6 |
| Myanmar | 67 | 64 | 131 |
| Namibia | 35 | 22 | 57 |
| Nauru | 3 | 4 | 7 |
| Nepal | 22 | 35 | 57 |
| Netherlands Antilles | 1 | 1 | 2 |
| Netherlands East Indies | 2 | – | 2 |
| New Caledonia | 3 | – | 3 |
| New Hebrides | 1 | 1 | 2 |
| New Zealand | 1 | – | 1 |
| Nicaragua | – | 1 | 1 |
| Nigeria | 30 | 33 | 63 |
| North Korea | 1 | 2 | 3 |
| Northern Ireland | 50 | 50 | 100 |
| Northern Mariana Islands | 1 | – | 1 |
| Northern Rhodesia | 2 | 5 | 7 |
| Norway | 5 | 3 | 8 |
| Oman | 9 | 18 | 27 |
| Pakistan | 162 | 264 | 426 |
| Palestine | 5 | 1 | 6 |
| Palestinian Administered Area | 6 | 4 | 10 |
| Panama | 3 | – | 3 |
| Papua New Guinea | 17 | 14 | 31 |
| Peru | 37 | 17 | 54 |
| Philippines | 728 | 860 | 1,588 |
| Pitcairn Island | – | 1 | 1 |
| Poland | 36 | 53 | 89 |
| Portugal | 3 | 10 | 13 |
| Qatar | 15 | 3 | 18 |
| Republic of Ireland | 22 | 22 | 44 |
| Reunion | 1 | – | 1 |
| Rhodesia | 34 | 19 | 53 |
| Rhodesia and Nyasaland | – | 5 | 5 |
| Romania | 141 | 225 | 366 |
| Russia | 325 | 359 | 684 |
| Rwanda | 9 | 8 | 17 |
| Samoa | 965 | 1,068 | 2,033 |
| Sarawak | 1 | – | 1 |
| Saudi Arabia | 21 | 28 | 49 |
| Scotland | 283 | 249 | 532 |
| Serbia and Montenegro | 9 | 15 | 24 |
| Seychelles | 3 | – | 3 |
| Sierra Leone | 7 | – | 7 |
| Singapore | 104 | 101 | 205 |
| Slovakia | 26 | 16 | 42 |
| Slovenia | 3 | 6 | 9 |
| Solomon Islands | 6 | 2 | 8 |
| Somalia | 305 | 194 | 499 |
| South Africa | 2,517 | 2,540 | 5,057 |
| South Korea | 13 | – | 13 |
| South Vietnam | 3 | – | 3 |
| Southern Rhodesia | 21 | 48 | 69 |
| Spain | 3 | 3 | 6 |
| Sri Lanka | 533 | 450 | 983 |
| St Lucia | 1 | – | 1 |
| Sudan | 44 | 34 | 78 |
| Suriname | 1 | – | 1 |
| Swaziland | 8 | 1 | 9 |
| Sweden | 22 | 16 | 38 |
| Switzerland | 53 | 63 | 116 |
| Syria | 35 | 47 | 82 |
| Tahiti | 1 | 1 | 2 |
| Taiwan | 376 | 434 | 810 |
| Tajikistan | 1 | 4 | 5 |
| Tanganyika | 1 | – | 1 |
| Tanzania | 12 | 11 | 23 |
| Thailand | 288 | 298 | 586 |
| The Gambia | – | 1 | 1 |
| The Netherlands | 123 | 114 | 237 |
| Tibet | 1 | 1 | 2 |
| Tonga | 205 | 177 | 382 |
| Trinidad and Tobago | 5 | 4 | 9 |
| Tunisia | 5 | 4 | 9 |
| Turkey | 38 | 31 | 69 |
| Turkmenistan | 1 | – | 1 |
| Tuvalu | 7 | 15 | 22 |
| U.S.A | 362 | 287 | 649 |
| Uganda | 3 | 7 | 10 |
| Ukraine | 81 | 111 | 192 |
| United Arab Emirates | 52 | 51 | 103 |
| Uruguay | 2 | 1 | 3 |
| USSR | 41 | 45 | 86 |
| Uzbekistan | 10 | 11 | 21 |
| Vanuatu | 1 | – | 1 |
| Venezuela | 2 | 6 | 8 |
| Vietnam | 170 | 241 | 411 |
| Wales | 79 | 84 | 163 |
| West Germany | 4 | 5 | 9 |
| Western Samoa | 147 | 139 | 286 |
| Yemen | 3 | 6 | 9 |
| Yugoslavia | 137 | 76 | 213 |
| Zambia | 56 | 71 | 127 |
| Zimbabwe | 409 | 562 | 971 |
| Total | 23,293 | 25,481 | 48,774 |
Skilled/business. The skilled/business stream consists of the Skilled Migrant Category, Work to Residence categories and the business categories of Investor, Entrepreneur and Employees of Businesses Relocating to New Zealand. In 2004/05, there were 29,826 people approved for residence under the skilled/business stream. This represented 61 percent of all approvals. The Skilled Migrant Category and the Work to Residence categories provided 26,325 of these approvals and the other 3,501 were approved under the business categories.
Skilled Migrant Category – The Skilled Migrant Category replaced the General Skills Category from December 2003. This policy change shifted the focus of skilled immigration policy from the passive acceptance of residence applications to the active recruitment of applicants with the skills that New Zealand needs. Potential migrants submit expressions of interest, information from which is used to score points for a number of employability and capacity-building factors. Potential migrants must meet a pre-set number of points in order to enter a pool of potential residence applicants. Prospective migrants are invited to apply for residence based on their ranking in the pool and other point factors, and subject to them meeting health, character, English language and initial verification requirements. Principal applicants invited to apply must be no older than 55. Applications for residence are assessed against government residence policy and the applicant's ability to settle and contribute to New Zealand. A person who can demonstrate their ability to settle in New Zealand successfully, through having skilled employment or an offer of skilled employment in New Zealand, or a New Zealand post-graduate qualification, may qualify for residence. A person who has potential, but does not have these attributes, will be interviewed to gather more information. Either a residence or a work to residence visa/permit may be issued to these people.
Work to Residence – This category provides a pathway to residence for holders of permits granted under three specific work policies: Talent (Accredited Employers); Talent (Arts, Culture and Sports): and the Long-Term Skill Shortage List policy.
Investor – A new investor policy came into effect in July 2005. Under the new policy, applicants must first submit an expression of interest, after which they may be invited to apply for residence. The minimum amount of investment is NZ$2 million and these funds are held by the New Zealand Government for five years. Applicants may withdraw up to NZ$1 million after two years to invest in a business that will benefit New Zealand. Applicants must be no older than 54 and have at least five years business experience. Conditions will apply for the first five years post residence.
Entrepreneur – People who have successfully established a business that benefits New Zealand and have been self-employed in New Zealand in that business for at least two years can be granted residence under this category. Successful establishment means the applicant has established, purchased or made a substantial investment in a profit-making business operating in New Zealand. A business is considered to benefit New Zealand if it creates employment, revitalises an existing business, enhances New Zealand's export markets or introduces new skills or technologies to New Zealand.
Employees of Businesses Relocating to New Zealand – This category is available on a case by case basis to essential employees of businesses relocating to New Zealand who do not qualify for residence under any other category.
Family sponsored. Thirty percent of approvals were allocated to the family sponsored stream for the 2004/05 financial year and 13,949 people were approved. The family sponsored stream allows migrants in a variety of close relationships with New Zealand citizens or residents to be sponsored for residence. Sponsors must have held New Zealand residence for at least three years immediately prior to sponsorship, and must sign a declaration that they will provide accommodation and financial support for the first two years of the migrant's residence in New Zealand. Financially dependent children under the age of 25 may also be sponsored. Parents (or grandparents or legal guardians if the parents are dead) qualify for sponsorship under certain conditions. Adult children and siblings who have no siblings or parents in their home country are eligible to be sponsored for residence, along with their dependants, providing they have a job offer in New Zealand. A family quota exists for a small number of sponsored parents, siblings, adult children and grandparents who do not meet other family policy criteria.
Partnership policy. To qualify for residence under this policy, applicants have to prove they have been living in a genuine and stable relationship with a New Zealander for 12 months or more at the time of application, whether or not they are in a marriage or de facto relationship (whether opposite or same sex).
Sources of migration. Of the 48,815 people approved for residence in New Zealand in 2004/05, 31 percent were from the United Kingdom. China accounted for 10 percent, while South Africa and India accounted for 7 percent each. In 2003/04, 39,017 people were approved for residence, with the United Kingdom the source of 21 percent, followed by China (12 percent) and India (8 percent). In 2004/05, skilled categories accounted for 54 percent (26,325) of all approvals and a further 29 percent (13,949) were granted residence under the family sponsored stream. In 2003/04, skilled categories accounted for 43 percent (16,883) of the total number of residence approvals and the family sponsored stream for 35 percent (13,462). The largest proportion of people approved under the Skilled Migrant Category in 2004/05 came from the United Kingdom, with 49 percent of approvals, followed by South Africa (12 percent) and China (6 percent).
All travellers arriving in New Zealand, including New Zealand citizens, must produce a valid passport or another form of recognised travel document.
With the exception of New Zealand citizens (including people born in the Cook Islands, Niue and Tokelau), Australian citizens and a small number of other people exempt under the Immigration Act 1987, everyone entering New Zealand is required to obtain a permit to remain in New Zealand. Categories for temporary permits include:
Visitors – People may enter New Zealand as visitors if they are tourists, visiting friends or relatives, studying for less than three months, playing sport or performing in cultural events without pay, or making short business trips. A visitor's permit is usually granted for an initial period of three months, and may be extended for up to a further six months. Citizens of more than 50 countries granted visa waivers do not need to apply for a visitor's visa before they travel to New Zealand (they are granted a visitor's permit at the border). Visitors from countries without visa waivers need to apply for a visitor's visa before travelling to New Zealand. Visitors must have sponsorship or sufficient funds to support themselves while they are in New Zealand, and must have an outward ticket or some other travel arrangement.
Students – International students are required to apply for a visa before travelling to New Zealand to study or, if they are from a visa waiver country, they may apply for a student permit in New Zealand if they intend studying for more than three months. Students must show they have been offered a place at a recognised educational institution, evidence that course fees have been paid, a guarantee of accommodation, the ability to support themselves and a return ticket (or the funds to buy one). During their studies, student permit holders must attend classes and make satisfactory progress. Students may be granted permission to work for up to 20 hours a week if certain conditions are met. Students undertaking a full-time course of 12 months or more may be allowed to work full time during the summer holiday period. Students who have graduated from a course that would gain points under the Skilled Migrant Category are eligible for a six-month open work permit. Partners of students undertaking particular courses may be eligible for an open work permit for the duration of the student's course of study.
Guardian – In September 2003, a new visa and permit category was introduced allowing a parent of young international students to live with and care for their children while they study in New Zealand. The guardian visa applies to children aged 17 and under and who are enrolled for Year 1 to 13 at a New Zealand school. Currency of the guardian visa is linked to the child's student visa and can be renewed annually. Only one parent or guardian in each family is eligible for a guardian visa.
Work – Anyone who wishes to work in New Zealand (except New Zealand or Australian citizens or residents) must have a work permit. Work permit policy allows people to enter New Zealand for a variety of work-related purposes. Some policies allow employers to recruit temporary workers from overseas to meet particular or seasonal skill needs that cannot be met from within New Zealand. Other policies allow family members to participate in the labour market. Work permits are also issued to young people (18–30 years) participating in working holiday schemes that New Zealand has established with a number of countries, and to people applying through Work to Residence policies. For immigration purposes ‘work’ is defined as an activity for which the person receives ‘gain or reward’, which can include not only money, but also accommodation and food. A work permit is still required if payment is made by an overseas employer.
Immigration New Zealand publishes a regionally-based labour market skills shortage list (the Immediate Skill Shortage List) to facilitate work visa and permit applications from employers, where skills appear to be in shortage. This list is updated six-monthly. In 2002, new work permit categories were introduced that provide a pathway for gaining residence in New Zealand. These categories allow people who are interested in applying for residence in New Zealand to work for up to two years before lodging their application for residence. These categories include the Long Term Skill Shortage List and Talent visas.
Long Term Skill Shortage List – Applicants are eligible under this category if they have an offer of employment for an occupation that is included on the Long Term Skill Shortage List and have the necessary qualifications, training or experience and (if required) registration to undertake the offer of employment. The offer of employment must be for at least 24 months, be full time, be compliant with all relevant New Zealand employment laws and have a salary of at least $45,000 a year.
Talent (Accredited Employer) – Businesses operating in New Zealand can apply to become accredited employers with Immigration New Zealand. Accredited employers are able to recruit workers directly from overseas to fill skill shortages, provided those workers meet immigration criteria. Talent visa holders are eligible for permanent residence after two years, provided they have met the conditions of their visa and have an offer of on-going employment.
Talent (Arts, Culture and Sports) – Under this category, a person who has an international reputation, a record of excellence in their field, and who will enhance the quality of New Zealand's accomplishments and participation in that field, may be granted a work permit. An applicant must be sponsored by a New Zealand organisation of national repute. They may be eligible for permanent residence after a two-year temporary residence period, provided they have met the conditions of their visa and have an offer of on-going employment.
Working holiday schemes – Working holiday schemes generally allow 18–30 year olds from partner countries to spend 12 months in New Zealand and undertake work of a temporary nature. The schemes also allow young New Zealanders to work overseas under reciprocal agreements. At 1 July 2005, New Zealand had schemes with 25 countries, with more than 30,000 places available. Changes effective from 1 July 2005 increased the number of places available and changed work restrictions in certain schemes (working holidaymakers from the United Kingdom can now stay for up to two years). Working holiday schemes have been established for people from Argentina, Belgium, Canada, Chile, Czech Republic, Denmark, Finland, France, Germany, Hong Kong, Ireland, Italy, Japan, Malaysia, Malta, Netherlands, Norway, Singapore, South Korea, Sweden. Taiwan, Thailand, the United Kingdom, the United States and Uruguay.
Long-term business visa – Work permits may be granted to business people interested in either applying for residence under the Entrepreneur Category, or establishing a business in New Zealand without living permanently in New Zealand. A satisfactory business plan must be submitted, and applicants must have sufficient funds to finance their proposed business and to support themselves and their families. English language requirements were introduced for this category of applicants in November 2002. A long-term business visa is issued for nine months. By the end of the nine-month period, applicants must provide evidence of having established a business to be granted an extension to their visa for a three-year term (including the initial nine months).
The international/humanitarian immigration stream includes the refugee quota and other refugee-linked categories, such as refugee status and the refugee family sponsored quota.
Other categories include the Pacific access category and the Samoan quota, ministerial exceptions to policy, a policy for victims of domestic violence, and various miscellaneous policies.
Ten percent of residence approvals were allocated to this stream for the 2004/05 financial year and 5,040 people were approved.
New Zealand's Refugee Quota Programme allows up to 750 refugees to settle in New Zealand each year.
Refugees. New Zealand is committed to working with the international community to help resolve refugee problems. The Department of Labour manages the Refugee Quota Programme, which allows up to 750 refugees to settle in New Zealand each year. In 2004/05, 715 people were approved for residence through the programme. The Refugee Quota Programme consists of a number of categories, including women at risk, medical/disabled, protection, emergency and other. The 2004/05 quota consisted of refugees from Afghanistan, Sudan, Burundi, Iraq, Ethiopia and other countries. All refugees attend a six-week orientation programme at the Department of Labour's Mangere Refugee Resettlement Centre. The department locates and maintains sponsors who assist refugees to settle in the community following their induction. Refugees accepted under the quota are granted residence permits on arrival in New Zealand. This means they are entitled to live in New Zealand permanently and to enjoy the rights of New Zealand residents in matters such as education, health, employment and social welfare. New Zealand also considers claims for refugee status from people who arrive in New Zealand and seek asylum. Claims are assessed under the 1951 United Nations Convention and 1967 Protocols Relating to the Status of Refugees. The refugee status branch of Immigration New Zealand assesses refugee status claims in the first instance. In 2004/05 there were 81 successful refugee status claimants. The number of refugee status claims in New Zealand has reduced substantially in recent years. Should a claim be declined, the claimant may appeal to the Refugee Status Appeals Authority.
Samoan quota. Up to 1,100 Samoan citizens may be granted residence in New Zealand each year under the Samoan quota. English language, health and character requirements must be met and the principal applicant must also have an offer of employment in New Zealand.
Pacific access. The Pacific access category enables up to 250 people from Tonga, 250 people from Fiji, 75 people from Tuvalu and 75 people from Kiribati to be granted residence each year. Applicants must be citizens of their country, meet English language, health and character requirements and have an offer of employment in New Zealand.
Pitcairn Islanders. A special residence category exists for Pitcairn Islanders because New Zealand recognises there are limited employment opportunities on the island. Pitcairn Islanders will be considered for residence if they have an offer of employment in New Zealand and meet health and character requirements.
Domestic violence policy. The domestic violence policy enables ex-partners of New Zealand citizens or residents to apply for residence when their relationship has ended as a result of domestic violence and they are unable to return to their home country for cultural or social reasons.
Special Zimbabwe Residence Policy. The Special Zimbabwe Residence Policy allowed Zimbabwe nationals who arrived in New Zealand on or before 23 September 2004, and who did not meet requirements for approval under any other category of residence policy, to be granted residence. Principal applicants were required to meet health, character and criteria specific to this policy.
The Immigration Act 1987 requires all people in New Zealand other than New Zealand citizens to hold a permit or be exempt from holding a permit. The act provides for the revocation of residence by the minister on certain grounds. People who do not hold a permit or exemption are deemed to be unlawfully in New Zealand and liable for removal.
Any person may appeal on humanitarian grounds against removal to the Removal Review Authority within 42 days of becoming unlawfully present in New Zealand. People removed from New Zealand are not eligible to return for five years after the date of their departure.
The act provides for deportation of people who threaten national security, are suspected terrorists, and criminal offenders who are residents of New Zealand. Such people may appeal on humanitarian grounds to the Deportation Review Tribunal, an independent tribunal administered by the Ministry of Justice. If the tribunal dismisses an appeal, the deportation order remains in place. A further appeal, only on a point of law, may be made to the High Court of New Zealand. Anyone in this category deported from New Zealand is not permitted to return without special permission from the Minister of Immigration.
In censuses of population, people are counted as having Māori ethnicity if they give this response as any one of their ethnicities.
A radical shift took place between the 1991 and 1996 Censuses of Population and Dwellings in the way people identified themselves, reflecting a significant real-world change which affected New Zealand as well as many other countries.
One of the outcomes among people of Māori ethnicity is increasing identity with more than one ethnicity.
While statistics based on ethnicity are widely used for analysing Māori growth and distribution, and are relevant to many requirements of users, the concept used to measure the Māori electoral population is based on Māori descent.
Age distribution. Table 6.06 overleaf compares the Māori ethnic group population at the 1991 and 2001 censuses by age group. When the intercensal change is analysed on a cohort basis (i.e. the 10–14 year group at the 1991 Census is compared with the 20–24 year group at the 2001 Census), the contribution made by net external migration and natural increase to the change in the Māori ethnic group can be seen. Another factor which affects this pattern is ethnic mobility (when a person changes ethnicity between censuses).
At the 2001 Census, the Māori ethnic group was significantly younger in age structure than the total population – 37.3 percent of the Māori population were under 15, compared with 22.7 percent of the total population.
By contrast, only 3.4 percent of the Māori population were aged 65 and over, compared with 12.1 percent of the total population.
These differences reflect both higher historical fertility (in terms of birth numbers) and mortality levels of the Māori ethnic group relative to the total population.
The impact of the levels and directions of net external migration on the age structures of the two populations has been much less.
Table 6.06. Māori ethnic group
By age
group1
| Age group (in years) | 1991 Census | 2001 Census | Intercensal percentage change 1991–2001 | ||
|---|---|---|---|---|---|
| Number | Percentage | Number | Percentage | ||
1Māori ethnic group census usually resident population count. Note: Figures may not add to stated totals due to rounding. Source: Statistics New Zealand | |||||
| 0–4 | 62,001 | 14.3 | 67,560 | 12.8 | 9.0 |
| 5–9 | 51,075 | 11.7 | 66,114 | 12.6 | 29.4 |
| 10–14 | 49,968 | 11.5 | 62,805 | 11.9 | 25.7 |
| 15–17 | 30,021 | 6.9 | 31,071 | 5.9 | 3.5 |
| 18–19 | 19,890 | 4.6 | 18,456 | 3.5 | -7.2 |
| 20–24 | 42,855 | 9.9 | 42,096 | 8.0 | -1.8 |
| 25–29 | 39,564 | 9.1 | 40,164 | 7.6 | 1.5 |
| 30–34 | 33,996 | 7.8 | 39,252 | 7.5 | 15.5 |
| 35–39 | 26,010 | 6.0 | 38,325 | 7.3 | 47.3 |
| 40–44 | 20,745 | 4.8 | 32,859 | 6.2 | 58.4 |
| 45–49 | 15,438 | 3.6 | 25,095 | 4.8 | 62.6 |
| 50–54 | 13,836 | 3.2 | 19,473 | 3.7 | 40.7 |
| 55–59 | 10,653 | 2.4 | 13,827 | 2.6 | 29.8 |
| 60–64 | 7,836 | 1.8 | 11,553 | 2.2 | 47.4 |
| 65–69 | 5,064 | 1.2 | 7,941 | 1.5 | 56.8 |
| 70–74 | 2,931 | 0.7 | 5,070 | 1.0 | 73.0 |
| 75–79 | 1,725 | 0.4 | 2,685 | 0.5 | 55.7 |
| 80 and over | 1,239 | 0.3 | 1,941 | 0.4 | 56.7 |
| Total | 434,847 | 100.0 | 526,281 | 100.0 | 21.0 |
Male to female ratio. Females outnumbered males in the Māori ethnic group at the 2001 Census. There were 268,797 Māori females and 257,481 Māori males, representing a sex ratio of 104.4 females to every 100 males.
At the time of the 2001 Census, there were 104.4 Māori females for every 100 Māori males.
Figure 6.03 shows the Māori ethnic group population as a proportion of the total New Zealand population in census years from 1901 to 2001.
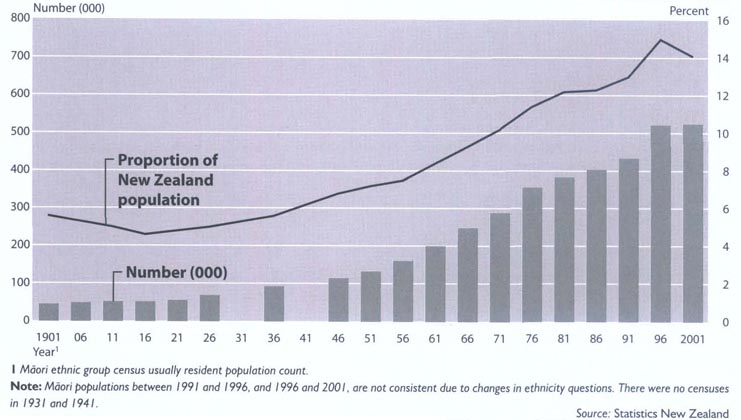
Geographical distribution. Changes in the regional distribution of the Māori ethnic group between the 1991 and 2001 censuses are shown in Table 6.07. People of Māori ethnicity continue to be concentrated in the North Island, and more especially in the northern regions of Northland, Auckland, Waikato and Bay of Plenty. The Māori ethnic group population in the North and South Islands increased 18.9 and 38.5 percent respectively during the 1991–2001 intercensal period. Tasman and Nelson regions showed the largest percentage increases between 1991 and 2001. Redistribution of the Māori population between 1991 and 2001 was the result of variations in the relative levels of natural increase (births less deaths) in the regions, and the impact of both internal and external migration flows.
Table 6.07. Māori ethnic group1
By region
| Region | 1991 Census | 2001 Census | Intercensal percentage change 1991–2001 | ||
|---|---|---|---|---|---|
| Number | Percentage | Number | Percentage | ||
1Māori ethnic group census usually resident population count. 2Includes Chatham Islands. Note: Figures may not add to slated totals due to rounding. Source: Statistics New Zealand | |||||
| North Island | |||||
| Northland | 35,610 | 8.2 | 40,734 | 7.7 | 14.4 |
| Auckland | 103,587 | 23.8 | 127,626 | 24.3 | 23.2 |
| Waikato | 59,985 | 13.8 | 72,822 | 13.8 | 21.4 |
| Bay of Plenty | 53,175 | 12.2 | 63,654 | 12.1 | 19.7 |
| Gisborne | 17,820 | 4.1 | 19,365 | 3.7 | 8.7 |
| Hawke's Bay | 28,242 | 6.5 | 32,088 | 6.1 | 13.6 |
| Taranaki | 12,762 | 2.9 | 14,559 | 2.8 | 14.1 |
| Manawatu–Wanganui | 34,575 | 8.0 | 39,267 | 7.5 | 13.6 |
| Wellington | 42,078 | 9.7 | 51,123 | 9.7 | 21.5 |
| Total North Island | 387,834 | 89.2 | 461,238 | 87.6 | 18.9 |
| South Island | |||||
| Tasman | 1,629 | 0.4 | 2,778 | 0.5 | 70.5 |
| Nelson | 1,707 | 0.4 | 3,219 | 0.6 | 88.6 |
| Marlborough | 2,778 | 0.6 | 3,894 | 0.7 | 40.2 |
| West Coast | 2,025 | 0.5 | 2,547 | 0.5 | 25.8 |
| Canterbury | 22,005 | 5.1 | 31,632 | 6.0 | 43.7 |
| Otago | 7,410 | 1.7 | 10,542 | 2.0 | 42.3 |
| Southland | 9,129 | 2.1 | 10,038 | 1.9 | 10.0 |
| Total South Island | 46,680 | 10.7 | 64,653 | 12.3 | 38.5 |
| Area outside region2 | 330 | 0.1 | 390 | 0.1 | 18.2 |
| Total New Zealand | 434,847 | 100.0 | 526,281 | 100.0 | 21.0 |
Dynamics of population change. Māori have a substantially higher rate of natural increase than the total population due largely to a higher birth rate, which, in turn, is due mainly to the more youthful age structure. The Māori fertility rate fell rapidly during the 1960s and 1970s and, as a consequence, the gap between Māori and total average family size narrowed, from a two-child difference in 1962 to less than one child in 2004. Nevertheless, the Māori fertility rate of 2.65 births per woman in 2004 remains 32 percent higher than that for all women (2.01 births per woman). Unlike the total population, which has sub-replacement fertility, Māori fertility remains about 26 percent above ‘replacement level’ (2.1 births per woman).
The Treaty of Waitangi Te Tiriti O Waitangi was signed at Waitangi on 6 February 1840. While the treaty has always been recognised within Māori society as an affirmation of rights and highly valued as a taonga, a sacred pact, this has not always been the case for governments or the courts.
In 1987, however, a court ruling ensured that the treaty moved from being ‘a simple nullity’, as it was described in 1877, to holding an important influence over much of the government's activities.
The ruling confirmed the special relationship between Māori and the Crown as one of an ongoing partnership, requiring the partners to act reasonably and with the utmost good faith towards each other.
The Waitangi Tribunal Te Ropu Whakamana i te Tiriti o Waitangi, established under the Treaty of Waitangi Act 1975, is a permanent commission of inquiry. Its main functions are to inquire into, and make findings and recommendations to the Crown on, claims related to the Treaty of Waitangi by Māori.
The tribunal consists of up to 16 members appointed by the governor-general for up to three years, and a chairperson, who is either a judge or retired judge of the High Court of New Zealand or the Chief Judge of the Māori Land Court.
The chairperson may appoint a judge of the Māori Land Court as deputy chairperson. Members are appointed for their expertise in matters likely to come before the tribunal.
Membership of the tribunal reflects partnership in the Treaty of Waitangi through balanced representation of Māori and Pākeha.
In exercising any of its functions, the Waitangi Tribunal has exclusive authority to determine the meaning and effect of the Treaty of Waitangi as embodied in the English and Māori texts, and to decide upon issues raised by the differences between them.
The tribunal may inquire only into claims by Māori concerning legislation, acts, omissions, policies and practices of the Crown that are alleged to have caused prejudice to the claimants, and that are claimed to be inconsistent with the principles of the Treaty of Waitangi.
Claims fall into three broad categories: historical claims (e.g. past government actions), contemporary claims (e.g. current government policies or practices) and conceptual claims (e.g. ownership of natural resources).
The tribunal must register any claim that complies with the act, but may refuse to inquire into claims it considers frivolous or vexatious.
The tribunal does not settle claims; it makes recommendations to the government on how claims might be settled. Generally, the tribunal has the authority to make recommendations only.
In most instances, its recommendations do not bind the Crown, claimants or third parties, and nearly all claims are settled by negotiation with the government. However, in certain limited situations, the tribunal does have binding powers.
The tribunal cannot recommend or order the return of private land.
The tribunal's process is flexible and inquisitorial. It is not required to follow court rules of evidence, and it can adapt its procedures as it thinks fit. For example, the tribunal can adopt the protocols of the marae at which a hearing is taking place.
All evidence is presented in public, hearings are open to all, and the tribunal's reports are published.
At 30 June 2005, the tribunal had registered 1,240 claims since 1975. Of these, 134 (11 percent) had been fully settled, withdrawn or refused further inquiry.
The tribunal had reported on 428 (35 percent) of the claims, fully in respect of 154 and partially in respect of 274. Six hundred and twelve claims (49 percent) were in or preparing for inquiry, while 340 claims (27 percent) were awaiting inquiry or direct entry into settlement negotiations.
The tribunal has given priority to hearing historical claims, which are defined as those alleging grievances that arose before September 1992.
The Waitangi Tribunal website is www.waitangi-tribunal.govt.nz
The Waitangi Tribunal's process is flexible and it can adapt procedures as it thinks fit, by adopting the protocols of the marae, for example.
Office of Treaty Settlements. The Office of Treaty Settlements Te Tari Whakatau Take e pa ana ki te Tiriti o Waitangi was established on 1 January 1995 to give better focus to government objectives to resolve historical claims under the Treaty of Waitangi. The office has the following major functions:
To provide policy advice to the Minister in Charge of Treaty of Waitangi Negotiations on specific treaty claims and generic issues that impact on these claims.
To negotiate and implement settlement of specific claims.
To acquire, manage and dispose of Crown-owned property for purposes related to treaty claims.
For administration and financial management purposes, the office is attached to, but funded separately from, the Ministry of Justice, having its own Vote: Treaty Negotiations. At the beginning of 2006, the office was dealing with about 25 claimant groups at the pre-negotiation, negotiation or implementation stage. The Office of Treaty Settlements website is www.ots.govt.nz
Te Puni Kōkiri The Ministry of Māori Development is responsible for promoting increases in the levels of achievement attained by Māori with respect to education, training and employment, health and economic resource development.
Te Puni Kōkiri also monitors and liaises with government departments and agencies to ensure the adequacy of services provided to or for Māori.
Te Puni Kōkiri's strategic outcome is ‘Māori succeeding as Māori’. This strategic outcome recognises the importance of Māori as individuals, in organisations and in collectives achieving a sustainable level of success.
The role of Te Puni Kōkiri is that of a principal advisor on government–Māori relationships, leading Māori public policy, and managing relationships and information.
The purpose of Te Puni Kōkiri is to lead and influence policies that enable Māori participation and success as Māori, wherever and in whatever they choose.
Te Puni Kōkiri's website is www.tpk.govt.nz
Māori Trustee. The role of the Māori Trustee is to help manage Māori land. The Māori Trustee has been in existence since 1921 and is now governed by the Māori Trustee Act 1953. The Māori Trustee is independent of the Crown and is accountable to landowners and the Māori Land Court. The Māori Trustee is responsible for:
Acting either as a trustee or agent for owners of Māori land, usually in leasing the land.
Collecting and paying rent and other income to owners.
Investing trust monies.
Regularly publishing the unclaimed moneys list for distribution to organisations.
Keeping landowners informed about how their land is managed.
New Zealand Māori Council. The New Zealand Māori Council Te Kaunihera Māori is constituted under the Māori Community Development Act] 962 and is a founding member of the World Indigenous People's Council. Some of the functions of the council are to:
Consider and discuss such matters as appear relevant to the social and economic advancement of Māori.
Consider, and as far as possible act on, any measures that will conserve and promote harmonious and friendly relations between Māori and other members of the community.
Promote, encourage and assist Māori to conserve, improve and advance their physical, economic, industrial, educational, social, moral, cultural and spiritual well-being through self-reliance, sound economic management and pride in themselves.
Collaborate with and assist government departments and other organisations and agencies in development of employment, education, training, housing and health care for Māori people.
As a statutory body, the council is accountable to the government for its funding. The council is based on the 946 marae throughout New Zealand. It represents 17 district Māori councils, which nominate three delegates to attend full council meetings. The council also includes representatives from the Māori Women's Welfare League and Māori Wardens. The executive committee consists of the chairman of each district council. The council is the only national Māori body with a statutory framework that recognises non-iwi based representation. Apart from urban district Māori councils, each district council is tribally represented and the council promotes the traditional social infrastructure of whānau and hapū.
Māori Congress. The Māori Congress Te Whakakotahitanga o ngā iwi o Aotearoa was officially launched in July 1990, after three national Māori leaders – the late Sir Hepi Te Heuheu, Dame Te Atairangikaahu and the late Mrs Te Reo Hura – sought to create a national body under which iwi could gather to share, consolidate and advance their positions. Objectives of the congress include:
Advancement of all Māori people.
Exercise by each iwi of tino rangatiratanga.
Provision of a national forum for iwi representatives to address economic, social, cultural and political issues within tikanga Māori.
Promotion of constitutional and legislative arrangements enabling Māori to control their own right to development and self-determination.
While acknowledging the strengths and autonomy of each iwi, the Māori Congress provides a forum at which matters of national importance affecting all iwi and, indeed, all Māori, can be debated within a Māori context. By standing apart from government, both in terms of direction and funding, it offers Māori people an opportunity to consider options and strategies for social, economic and cultural advancement. With its wide iwi base, the congress provides a source of collective Māori opinion from which Māori development policies acceptable to it can take shape. The congress is led by two presidents and has three elected officers. Membership includes five delegates from 45 participating iwi.
Māori Women's Welfare League. The Māori Women's Welfare League Te Roopu Wahine Māori Toko i Te Ora is a national voluntary organisation which aims to promote the well-being of Māori women and their families. The league has a nationwide network of 165 branches, with a membership of 3,000. It has been actively involved with Māori families and communities since 1951, improving health, housing, education, welfare, justice and economic development for Māori people.
Te reo Māori is the language of the indigenous people of New Zealand and an official language of the country. The Māori language renaissance, which began about 30 years ago, has fostered many Māori language initiatives to regenerate te reo Māori, including kōhanga reo (Māori language immersion preschool movement), kura kaupapa Māori and wharekura (Māori language immersion primary and secondary schools), and whare wānanga (Māori tertiary institutions). There are also 21 Māori radio stations and a Māori television service which began in 2004. Legislation that led to the declaration of Māori as an official language of New Zealand and establishment of the Māori Language Commission Te Taura Whiri i te Reo Māori was passed in 1987.
Kōhanga reo. Te kōhanga reo is a whānau (family) base where Māori language, values and customs are naturally acquired by preschool children from their kaumātua (elders). The movement's aim is that through the example of the whānau, children learn aroha (love, compassion), manaakitanga (caring, hospitality) and whānaungatanga (family responsibilities) through the medium of Māori language. There were 521 kōhanga reo throughout New Zealand in 2005, where 9,400 children were taught in te reo Māori. Approximately 60,000 children have passed through te kōhanga reo since it was established in 1982. The kōhanga reo movement provides a variety of courses and training programmes which can be accessed by whānau through their own kōhanga reo. These courses are whānau based and have been designed to improve whānau skills and knowledge, not only in te reo and tikanga Māori, but also in learning and teaching, administration and management of the kōhanga reo operation.
Māori Language Commission. The Māori Language Commission Te Taura Whiri i te Reo Māori was established by the Māori Language Act 1987 to promote the Māori language and its use as an official language of New Zealand, as a living language, and as an ordinary means of communication.
Pacific ethnic group population statistics are compiled on the basis of self-identification. People are counted as Pacific if they give any Pacific ethnicities in response to a census ethnicity question.
The Pacific ethnic group includes people of Samoan, Cook Island Maori, Niuean, Tokelauan and other Pacific (e.g. Hawaiian and Tahitian) ethnicities.
People may identify themselves as belonging to more than one Pacific ethnicity. While they are counted in each ethnicity when considering ethnicities within the broad group, they are counted only once in the Pacific ethnic group.
Age distribution. Table 6.08 compares the Pacific population at the 1991 and 2001 censuses on an age group basis. When intercensal population growth is analysed on a cohort basis (i.e. the 10–14 year group at the 1991 Census is compared with the 20–24 year group at the 2001 Census), the major contribution made by net immigration to the increase in Pacific peoples is evident. In addition, the big increase of 64,725 (38.7 percent) in the Pacific population during the 1991–2001 intercensal period was partly a result of significant natural increase (births less deaths). At the 2001 Census, the Pacific population was considerably younger in age structure than the total population, with 38.9 percent of Pacific peoples under the age of 15, compared with 22.7 percent of the total population. By contrast, only 3.3 percent of Pacific peoples were aged 65 and over, compared with 12.1 percent of the total population. People of Pacific ethnicities in New Zealand have had a different age structure in the past from that of the Māori ethnic group. This was mainly the result of consistently high external net migration levels, especially for the younger working-age group (15–24 years) during the 1970s. However, with a large increase in intermarriage, the ageing of Pacific peoples and relatively high fertility rates, the age structure has, since 1996, been almost identical with Māori. Two other features affect the Pacific population: first, the number of Pacific peoples born in New Zealand has shown a significant increase in the past three decades, the result of the growth in the population of reproductive age; and, second, an increasingly large proportion of children and teenagers identify themselves as being of both Pacific and Māori ethnicities. More than 25 percent of all people under the age of five belonging to the Pacific ethnic group also belong to the Māori ethnic group.
Table 6.08. Pacific ethnic group1
By age group
| Age group (in years) | 1991 Census | 2001 Census | Intercensal percentage change 1991–2001 | ||
|---|---|---|---|---|---|
| Number | Percentage | Number | Percentage | ||
1Pacific ethnic group census usually resident population count. Note: Figures may not add to stated totals due to rounding. Source: Statistics New Zealand | |||||
| 0–4 | 25,737 | 15.4 | 32,775 | 14.1 | 27.3 |
| 5–9 | 19,854 | 11.9 | 30,480 | 13.1 | 53.5 |
| 10–14 | 19,113 | 11.4 | 26,889 | 11.6 | 40.7 |
| 15–19 | 17,226 | 10.3 | 21,486 | 9.3 | 24.7 |
| 20–24 | 16,695 | 10.0 | 19,782 | 8.5 | 18.5 |
| 25–29 | 15,627 | 9.4 | 17,976 | 7.8 | 15.0 |
| 30–34 | 13,080 | 7.8 | 17,778 | 7.7 | 35.9 |
| 35–39 | 10,788 | 6.5 | 16,011 | 6.9 | 48.4 |
| 40–44 | 8,547 | 5.1 | 12,753 | 5.5 | 49.2 |
| 45–49 | 5,997 | 3.6 | 10,131 | 4.4 | 68.9 |
| 50–54 | 4,710 | 2.8 | 7,977 | 3.4 | 69.4 |
| 55–59 | 3,339 | 2.0 | 5,667 | 2.4 | 69.7 |
| 60–64 | 2,622 | 1.6 | 4,461 | 1.9 | 70.1 |
| 65–69 | 1,731 | 1.0 | 3,150 | 1.4 | 82.0 |
| 70–74 | 1,059 | 0.6 | 2,241 | 1.0 | 111.6 |
| 75–79 | 561 | 0.3 | 1,269 | 0.5 | 126.2 |
| 80 and over | 390 | 0.2 | 975 | 0.4 | 150.0 |
| Total | 167,073 | 100.0 | 231,798 | 100.0 | 38.7 |
The Auckland Region is home to more than two-thirds of New Zealand's Pacific population.
Table 6.09 illustrates the Auckland Region's dominance as home to New Zealand's Pacific population.
Table 6.09. Pacific ethnic group1
By region
| Region | 1991 Census | 2001 Census | Intercensal percentage change 1991–2001 | ||
|---|---|---|---|---|---|
| Number | Percentage | Number | Percentage | ||
1Pacific ethnic group census usually resident population count. 2Includes Chatham Islands territory. - nil or zero Note: Figures may not add to stated totals due to rounding. Source: Statistics New Zealand | |||||
| North Island | |||||
| Northland | 1,587 | 0.9 | 2.943 | 1.3 | 85.4 |
| Auckland | 111,855 | 66.9 | 154,680 | 66.7 | 38.3 |
| Waikato | 6,930 | 4.1 | 10.524 | 4.5 | 51.9 |
| Bay of Plenty | 3,246 | 1.9 | 5.463 | 2.4 | 68.3 |
| Gisborne | 504 | 0.3 | 1,137 | 0.5 | 125.6 |
| Hawke's Bay | 2,517 | 1.5 | 4,710 | 2.0 | 87.1 |
| Taranaki | 633 | 0.4 | 1,059 | 0.5 | 67.3 |
| Manawatu–Wanganui | 3,348 | 2.0 | 5,031 | 2.2 | 50.3 |
| Wellington | 26,133 | 15.6 | 32,283 | 13.9 | 23.5 |
| Total North Island | 156,753 | 93.8 | 217,833 | 94.0 | 39.0 |
| South Island | |||||
| Tasman | 126 | 0.1 | 222 | 0.1 | 76.2 |
| Nelson | 225 | 0.1 | 594 | 0.3 | 164.0 |
| Marlborough | 177 | 0.1 | 408 | 0.2 | 130.5 |
| West Coast | 144 | 0.1 | 186 | 0.1 | 29.2 |
| Canterbury | 5,838 | 3.5 | 8,619 | 3.7 | 47.6 |
| Otago | 2,238 | 1.3 | 2,646 | 1.1 | 18.2 |
| Southland | 1,566 | 0.9 | 1,278 | 0.6 | -18.4 |
| Total South Island | 10,311 | 6.2 | 13,953 | 6.0 | 35.3 |
| Area outside region2 | 9 | - | 12 | - | 33.3 |
| Total New Zealand | 167,073 | 100.0 | 231,798 | 100.0 | 38.7 |
Geographical distribution. More than two thirds of New Zealand's Pacific population live in the Auckland Region. All regions except Southland experienced significant growth in their Pacific populations between the 1991 and 2001 censuses. The Auckland Region grew by 42,825 (38.3 percent) during the 10-year period, with 66.7 percent of the Pacific population living in the Auckland Region at the time of the 2001 Census.
Cook Islands. The Cook Islands gained independence in free association with New Zealand in 1965. Its people retained the right of free entry to New Zealand and significant emigration began from the 1950s, and increased during the 1960s and 70s. The most common destinations were Auckland and Wellington. Smaller numbers of migrants settled in other parts of New Zealand, mostly in the main urban areas. The 2001 Census recorded 52,569 Cook Island Maori living in New Zealand.
Niue. Niue achieved self-government in free association with New Zealand in 1974 and Niueans were granted right of free entry, residence and New Zealand citizenship. Among New Zealand's attractions for Niueans is a more certain way of life. Niue is particularly vulnerable to natural disasters, such as drought and cyclones, and successive cyclones in 1959, 1960 and 2004 had a devastating effect. There are about 20,000 Niueans living in New Zealand, most of them in Auckland.
Tonga. The Kingdom of Tonga is an independent nation where population pressures have forced the nation to adopt emigration as an official policy. In 1970, a scheme was initiated under which Tongans were allowed to migrate to New Zealand temporarily to work in unskilled jobs within the processing industry. Many also went to Australia and to the United States. There were more than 40,000 Tongans living in New Zealand in 2001, most of them in Auckland.
Tokelau. The small island group of Tokelau was declared a British Protectorate in 1889. New Zealand took over administration on behalf of Britain in 1925 and it became part of New Zealand's territory in 1948, with full political independence gained in 1994. The 10 square kilometres of Tokelau's three atolls have few natural resources, apart from lagoons, coconut palms and the ocean. The atolls are also vulnerable to cyclones. After a devastating cyclone in 1966, the New Zealand Government set up a resettlement scheme which involved about 500 people, half the Tokelauan population. These people voluntarily left Tokelau and resettled in Porirua and forest-industry towns like Rotorua. In 2001, there were more than 6,000 Tokelauans living in New Zealand and only about 1,500 in Tokelau.
Samoa. Samoa's 13 islands are divided into Samoa and American Samoa. The six islands east of the 171st meridian were annexed by the United States in 1899. New Zealand assumed control of Western Samoa at the start of World War I and retained it until 1962, when Western Samoa became independent. Western Samoa is now known as Samoa. Emigration from the islands picked up in the mid-1960s and continues largely through the process of chain migration. Rapid population growth, a decline in export prices for cocoa and copra, a banana crop disease and a major cyclone in 1966 were persuading factors for migrants. The Treaty of Friendship signed at Western Samoa's independence ensured emigrants would not have to register in New Zealand as aliens. Samoans constitute the largest group of Pacific peoples living in New Zealand – more than 115,000. Most live in Auckland.
Fiji. There were 7,041 Fijians living in New Zealand at the time of the 2001 Census, a 38 percent increase on the 1991 figure. New Zealand-born Fijians made up 47 percent of the Fijian population in New Zealand in 2001, while 32 percent of Fijians born overseas had been living in New Zealand for between 10 and 20 years. Fifty-seven percent of Fijians living in New Zealand lived in the Auckland urban area, with the next largest concentration, 11 percent, being in the Wellington urban area.
Figure 6.04 shows the pattern of Pacific migration to New Zealand from 1980 to 2005.
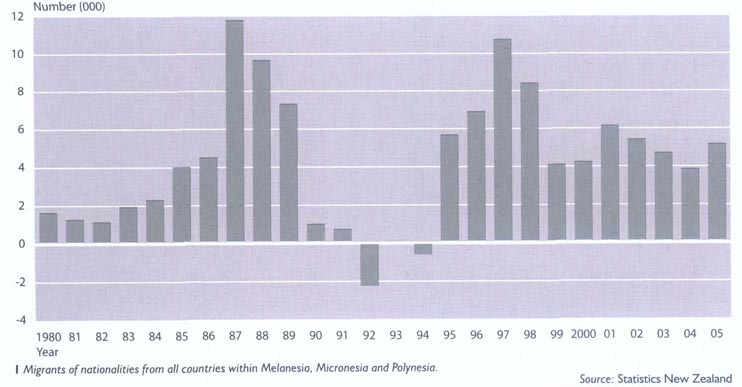
The Asian ethnic group population in New Zealand increased markedly in the decade between 1991 and 2001. People are counted as Asian if they give any Asian ethnicity in response to a census ethnicity question. People may identify themselves as belonging to more than one Asian ethnicity. While they are counted in each ethnicity when considering the ethnicities within the broad group, they are counted only once in the Asian ethnic group.
Figure 6.05 shows the pattern of Asian migration to New Zealand from 1980 to 2005.
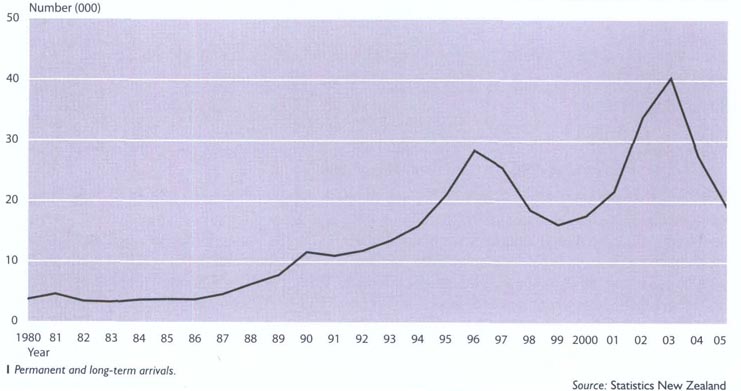
Age distribution. Table 6.10 compares the Asian population in New Zealand at the 1991 and 2001 censuses by age group. When intercensal population growth is analysed on a cohort basis (i.e. the 10–14 year group at the 1991 Census is compared with the 20–24 year group at the 2001 Census), it is evident that the major contribution to the increase in the Asian ethnic group is from net immigration. Between the 1991 and 2001 censuses, the Asian ethnic group population more than doubled, from 99,756 to 238,176. This represents an average growth rate of 9.1 percent a year, compared with 1.0 percent for the total New Zealand population. This growth also had a significant impact on the overall age structure of the Asian group. At the 2001 Census, 72.3 percent of the Asian ethnic group were of working age (15–64 years), compared with 65.3 percent for the total population. By contrast, only 4.0 percent of Asians were aged 65 and over, compared with 12.1 percent of the total population.
Table 6.1. Asian ethnic group1
By age group
| Age group (in years) | 1991 Census | 2001 Census | Intercensal percentage change 1991–2001 | ||
|---|---|---|---|---|---|
| Number | Percentage | Number | Percentage | ||
1Asian ethnic group census usually resident population count. Note: Figures may not add to slated totals due to rounding. Source: Statistics New Zealand | |||||
| 0–4 | 9,600 | 9.6 | 18,378 | 7.7 | 91.4 |
| 5–9 | 9,093 | 9.1 | 18,381 | 7.7 | 102.1 |
| 10–14 | 9,021 | 9.0 | 19,521 | 8.2 | 116.4 |
| 15–19 | 9,006 | 9.0 | 27,102 | 11.4 | 200.9 |
| 20–24 | 9,339 | 9.4 | 24,018 | 10.1 | 157.2 |
| 25–29 | 11,847 | 11.9 | 17,979 | 7.5 | 51.8 |
| 30–34 | 11,589 | 11.6 | 19,947 | 8.4 | 72.1 |
| 35–39 | 9,420 | 9.4 | 22,722 | 9.5 | 141.2 |
| 40–44 | 7,131 | 7.1 | 19,806 | 8.3 | 177.7 |
| 45–49 | 4,311 | 4.3 | 15,690 | 6.6 | 264.0 |
| 50–54 | 2,991 | 3.0 | 11,520 | 4.8 | 285.2 |
| 55–59 | 2,163 | 2.2 | 7,161 | 3.0 | 231.1 |
| 60–64 | 1,608 | 1.6 | 6,192 | 2.6 | 285.1 |
| 65–69 | 1,059 | 1.1 | 4,434 | 1.9 | 318.7 |
| 70–74 | 657 | 0.7 | 2,589 | 1.1 | 294.1 |
| 75–79 | 447 | 0.4 | 1,485 | 0.6 | 232.2 |
| 80 and over | 471 | 0.5 | 1,254 | 0.5 | 166.2 |
| Total | 99,756 | 100.0 | 238,176 | 100.0 | 138.8 |
Asian ethnicities. Even though most Asian ethnicities more than doubled in the decade between 1991 and 2001, their share of the total Asian ethnic group changed only marginally. In 2001, with a share of 44.1 percent, people of Chinese ethnicities were the largest within the Asian ethnic group and experienced the biggest numerical increase in their population, from 44,793 in 1991 to 105,057 in 2001. People of Indian ethnicities represented 26.1 percent of the Asian ethnic group in 2001, and during 1991–2001 increased from 30,609 to 62,187. The Korean ethnic group experienced the highest percentage increase during the 10-year period, rising from 930 to 19,026. People of South-east Asian ethnicities were the third largest group within the Asian ethnic group. In 2001, 30,648 (12.9 percent) of the Asian ethnic group were of South-east Asian ethnicities, and more than 33 percent of these were of Filipino ethnicity.
Geographical distribution. Distribution of the Asian ethnic population by region at the 1991 and 2001 censuses is shown in Table 6.11. The Asian ethnic group continues to be concentrated in the regions of Auckland, Wellington and Canterbury. Auckland Region experienced the largest growth in Asians, both in numerical and relative terms, between the 1991 and 2001 censuses. Auckland Region's Asian population increased by nearly 100,000, to reach 151,602 in 2001, and represented 71.5 percent of the national increase of 138,420 between 1991 and 2001.
Table 6.11. Asian ethnic group1
By region
| Region | 1991 Census | 2001 Census | Intercensal percentage change 1991–2001 | ||
|---|---|---|---|---|---|
| Number | Percentage | Number | Percentage | ||
1Asian ethnic group census usually resident population count. 2Includes Chatham Islands territory. - nil or zero Note: Figures may not add to staled totals due to rounding. Source: Statistics New Zealand | |||||
| North Island | |||||
| Northland | 1,020 | 1.0 | 1,998 | 0.8 | 95.9 |
| Auckland | 52,584 | 52.7 | 151,602 | 63.7 | 188.3 |
| Waikato | 5,448 | 5.5 | 12,021 | 5.0 | 120.6 |
| Bay of Plenty | 2,121 | 2.1 | 5,202 | 2.2 | 145.3 |
| Gisborne | 429 | 0.4 | 621 | 0.3 | 44.8 |
| Hawke's Bay | 1,770 | 1.8 | 2,937 | 1.2 | 65.9 |
| Taranaki | 1,002 | 1.0 | 1,500 | 0.6 | 49.7 |
| Manawatu–Wanganui | 4,344 | 4.4 | 6,564 | 2.8 | 51.1 |
| Wellington | 19,533 | 19.6 | 27,819 | 11.7 | 42.4 |
| Total North Island | 88,257 | 88.5 | 210,264 | 88.3 | 138.2 |
| South Island | |||||
| Tasman | 132 | 0.1 | 366 | 0.2 | 177.3 |
| Nelson | 378 | 0.4 | 861 | 0.4 | 127.8 |
| Marlborough | 183 | 0.2 | 387 | 0.2 | 111.5 |
| West Coast | 177 | 0.2 | 246 | 0.1 | 39.0 |
| Canterbury | 6,996 | 7.0 | 19,431 | 8.2 | 177.7 |
| Otago | 3,075 | 3.1 | 5,766 | 2.4 | 87.5 |
| Southland | 561 | 0.6 | 849 | 0.4 | 51.3 |
| Total South Island | 11,499 | 11.5 | 27,906 | 11.7 | 142.7 |
| Area outside region2 | 3 | - | 3 | - | - |
| Total New Zealand | 99,756 | 100.0 | 238,176 | 100.0 | 138.8 |
The Human Rights Commission Te Kāhui Tika Tangata is an independent Crown entity given a range of functions to perform under the Human Rights Act 1993.
The commission's four major functions are:
To advocate and promote respect for, and an understanding and appreciation of, human rights in New Zealand society.
To encourage maintenance and development of harmonious relations among individuals, and among the diverse groups in New Zealand society.
To lead, evaluate, monitor, advise, analyse and liaise on equal employment opportunities.
To respond to enquiries from members of the public about discrimination and to facilitate the resolution of disputes alleging discrimination in the most efficient, informal and cost-effective manner possible.
The commission is required by the act to act independently in performing its statutory functions and duties and in exercising its statutory powers.
The act provides for the positions of Chief Commissioner. Equal Employment Opportunities Commissioner, Race Relations Commissioner and no more than five part-time Human Rights Commissioners.
The commission has offices in Auckland, Wellington and Christchurch.
The Human Rights Commission website is www.hrc.co.nz
Dispute resolution. The commission mediates disputes relating to unlawful discrimination on the grounds of sex (including pregnancy) and sexual harassment; marital status (including being in a civil union): religious belief; ethical belief; colour; race and racial harassment; ethnic or national origins; disability; age; political opinion; employment status; family status; and sexual orientation in the areas of government or public sector activities; employment; access to education; access to public places, vehicles and facilities; provision of goods and services; provision of land, housing and accommodation; industrial and professional associations, qualifying bodies, and vocational training bodies; and partnerships. In the year ending 30 June 2005, the commission received 7,215 enquiries and complaints. Of these, 1,900 had an unlawful discrimination component. The rest were predominantly about other human rights matters. Outcomes achieved through the dispute resolution process include encouraging parties towards self-help (where appropriate), increasing understanding of human rights standards by both complainants and respondents, apologies, participation in policy reviews, and financial compensation. Where a settlement cannot be agreed, complainants may take their case to the Human Rights Review Tribunal and seek legal representation from the Director of Human Rights Proceedings.
The Equal Employment Opportunities (EEO) Trust was established in 1991 by the government and the private sector to promote EEO principles and best practice in the workplace.
Trustees are representative of both public and private sectors.
The trust encourages employers to recognise the business benefits of employing on the basis of merit and helps them to get full potential from a diverse workforce.
Annual EEO Trust Work and Life Awards recognise organisations and individuals that champion work/life balance.
The Equal Employment Opportunities Trust website is www.eeotrust.org.nz
New Zealand was the first country in which women won the right to vote in national elections (in 1893) and women's rights have wide legislative protection.
Despite this, inequalities still exist, and in an attempt to improve the lives of New Zealand women, the government launched an Action Plan for New Zealand Women in March 2004.
The five-year, whole-of-government plan guides the Ministry of Women's Affairs in monitoring progress on implementation of the plan.
Three high level outcomes have been identified within the plan. These are:
Improving economic independence of women – to help ensure women have enough money to care for themselves and those who depend on them.
Greater work-life balance in New Zealand – to help women balance work, family, whānau and community roles.
Improved well-being for all New Zealand women – focused on preserving women's general well-being, including their safety, security, housing, physical and mental health.
The Ministry of Women's Affairs website is www.mwa.govt.nz
The Ministry of Youth Development Te Manatū Whakahiato Taiohi is funded by the government to provide advice on policies, services and legislation affecting young people (aged 12 to 24 inclusive) and their future.
Created on 1 October 2003 and administered by the Ministry of Social Development, the ministry brought together the former Ministry of Youth Affairs and the youth policy functions of the Ministry of Social Development.
The Ministry of Youth Development leads and coordinates implementation of the Youth Development Strategy Aotearoa, leads the United Nations Convention on the Rights of the Child five-year work programme and works alongside the Ministry of Health on youth suicide prevention.
The Ministry of Youth Development promotes the interests of people between the ages of 12 and 24 by listening and responding to their needs.
In 2005, the ministry developed Aotearoa Youth Voices, an umbrella brand for youth participation projects.
The Ministry of Youth Development aligned with the Ministry of Social Development in four regional offices in 2005/06 so it could better respond to local needs and promote best practice youth development and participation.
The ministry manages funding and contracts for youth development programmes and services, including New Zealand Conservation Corps programmes, the Youth Service Corps, the Specialist Youth Service Corps, the Young New Zealanders’ Challenge and the Youth Development Partnership Fund.
Launched in 2005, the Youth Development Partnership Fund enables territorial authorities to apply for funding for projects that benefit local young people and demonstrate a positive youth development approach.
The Ministry of Youth Development website is www.myd.govt.nz
Youth Parliament. Parliament opens its doors every three to four years for a Youth Parliament, which gives young people a chance the find out how parliament works and what it is like to be a Member of Parliament (MP). Youth MPs get involved in things that real MPs do, like debating in the house, asking ministers questions in parliament, taking part in select committees and having their own Speaker of the House. A Youth Parliamentary Press Gallery is also established. The next Youth Parliament is expected to be in 2007.
Youth Development Strategy Aotearoa. Youth development is the process of young people developing the skills and attitudes they need to take part positively in society, now and in the future. Youth Development Strategy Aotearoa is about how government and society can support women and men between the ages of 12 and 24 to develop these skills and attitudes. The strategy is widely used by organisations and groups in the youth sector that are committed to a strengths-based holistic approach to working with young people.
Property (Relationships) Act 1976. The Matrimonial Property Act 1976 was amended in 2001 to provide for division of property when a married or de facto couple separates, or when one of the partners in a married or de facto relationship dies. The 1976 act was further amended in 2005 to include civil union couples.
Domestic Violence Act 1995. The Domestic Violence Act 1995 aims to provide greater protection for victims of domestic violence. It combines non-molestation and non-violence orders into one protection order that can last indefinitely and which is available to a wider range of people in closer relationships than under previous legislation. The act also places particular emphasis on provision of programmes for victims and their children and for perpetrators of domestic violence.
6.1 Statistics New Zealand;
6.2 Department of Internal Affairs; Immigration New Zealand.
6.3 Statistics New Zealand; Ministry of Justice; Te Puni Kōkiri The Ministry of Māori Development; New Zealand Māori Council; Māori Congress; Māori Women's Welfare League; Te Kōhanga Reo National Trust; Māori Language Commission.
6.4 Statistics New Zealand.
6.5 Statistics New Zealand.
6.6 Human Rights Commission; Equal Employment Opportunities Trust; Ministry of Women's Affairs; Ministry of Youth Development; Ministry of Justice.
www.dia.govt.nz – Department of Internal Affairs
www.eeotrust.org.nz – Equal Employment Opportunities Trust
www.hrc.co.nz – Human Rights Commission
www.immigration.govt.nz – Immigration New Zealand
www.justice.govt.nz – Ministry of Justice
www.mwa.govt.nz – Ministry of Women's Affairs
www.myd.govt.nz – Ministry of Youth Development
www.stats.govt.nz – Statistics New Zealand
www.kohanga.ac.nz – Te Kōhanga Reo
www.tetaurawhiri.govt.nz – Māori Language Commission
www.tpk.govt.nz – Te Puni Kōkiri The Ministry of Māori Development
Table of Contents
The Ministry of Youth Development works with the government and communities to promote the development of young New Zealanders.
The Ministry of Social Development was established on 1 October 2001, bringing together the policy advice and research functions of the Ministry of Social Policy and the income support and employment services of Work and Income New Zealand.
The ministry's aims include building strong and healthy families, supporting young people, helping people achieve economic independence, developing well-being within communities, and contributing to a growing and resilient economy.
The Ministry of Social Development works closely with other social sector agencies, such as health, education and housing, to improve all areas of people's lives. The ministry's framework covers children and young people, working-age people, older people, families and communities.
The ministry undertakes social research and evaluation, gives cross-sectoral policy advice to the government, delivers income support and employment services through Work and Income, and delivers services to students through StudyLink. The ministry's Family and Community Services leads and co-ordinates community-based services to families.
The ministry also administers the Office for Disability Issues, the Office for the Community and Voluntary Sector and the Office for Senior Citizens.
On 1 October 2003, the ministry took over administration of the Ministry of Youth Development, and the government announced in March 2006 that the ministry and Child, Youth and Family would be merged on 1 July 2006.
The Ministry of Social Development's Strategic Social Policy Group monitors and reports on the social well-being of New Zealanders and delivers policy advice to the government on cross-sectoral policy issues.
The Sector Policy Group delivers policy advice on the care and protection of children and young people; on social assistance and employment; on positive ageing and retirement; on disability issues; and on family and community development.
The Centre for Social Research and Evaluation researches key social policy issues, provides evidence to support policy development, and evaluates the effectiveness of government policies and programmes.
With age discrimination not permitted, many New Zealanders are now choosing to remain in the workforce beyond the age of 65.
Work and Income, a service line of the Ministry of Social Development, provides income support and employment services for more than 1 million New Zealanders a year, employing approximately 4,400 people in 190 locations throughout the country.
The average number of applications for main benefits and pensions per working day is about 1,800. (Applications for supplementary benefits from people receiving a main benefit, and lump sum grants and benefit advances, are not included).
The total includes applications for all benefits, including the Orphan's Benefit and the Unsupported Child Benefit, non-beneficiaries receiving a supplementary benefit, Unemployment Student Hardship, New Zealand Superannuation and the Veteran's Pension.
Work and Income pays a wide range of benefits, supplementary benefits and pensions.
Benefits paid in the year ending 30 June 2005 included:
Caring benefits – Domestic Purposes Benefit (Sole Parent), Domestic Purposes Benefit (Caring for the Sick or Infirm) and Domestic Purposes Benefit (Woman Alone).
Incapacity benefits – Sickness Benefit and Invalid's Benefit.
Work-related benefits – Independent Youth Benefit and Unemployment Benefit.
Miscellaneous benefits – Emergency Benefit, Transitional Retirement Benefit, Unsupported Child Benefit, Orphan's Benefit and Widow's Benefit.
Military service pensions – Veteran's Pension, War Disability Pension and dependant's allowance. Concessions to assist with interest payments on land and buildings, medical treatment and other expenses are also available.
New Zealand Superannuation.
Supplementary benefits and lump sum assistance payments – Accommodation Supplement, Childcare Subsidy, Out-of-School Care and Recreation (OSCAR) Subsidy, Disability Allowance, Funeral Grant, Special Benefit, Special Needs Grant, Training Incentive Allowance, advance payments of income support, and recoverable assistance available to people not receiving benefits or pensions.
Weekly rates of income support at 1 April 2005 are shown in Table 7.01.
Table 7.01. Income support weekly rates
At 1 April
2005
| Type of income support | Net weekly payment1,2,3 |
|---|---|
1Some clients may receive fortnightly payments at double the indicated rates. 2Rates shown are maximum amounts. For income-tested benefits, the amount a person actually receives will depend on their income from other sources. 3From 1 April 2005. the child component of benefits tie additional payment included for each additional child} was removed from benefit payments and included in Family Support payments. Source: Ministry of Social Development | |
| Unemployment Benefit/Sickness Benefit granted on or after 1 July 1998 | |
| Without children: | |
| Single 18–19 years old, at home | 112.38 |
| Single 18–19 years old, away from home | 140.48 |
| Single 20–24 years old | 140.48 |
| Single 25 and over | 168.59 |
| Married couple (each partner) | 140.48 |
| With children: | |
| Single (1 child) | 241.47 |
| Single (2 children or more) | 241.47 |
| Married couple (each partner) | 140.48 |
| Sickness Benefit (granted before 1 July 1998) | |
| Without children: | |
| Single 18–24 years old | 147.34 |
| Single 25 and over | 168.59 |
| Married couple (each partner) | 140.48 |
| With children: | |
| Single (1 child) | 241.47 |
| Single (2 children or more) | 241.47 |
| Married couple (each partner) | 140.48 |
| Invalid's Benefit | |
| Without children: | |
| Single 16–17 years old | 170.52 |
| Single 18 and over | 210.72 |
| Married couple (each partner) | 175.61 |
| With children: | |
| Single (1 child) | 276.82 |
| Single (2 children or more) | 276.82 |
| Married couple (each partner) | 175.61 |
| Widow's Benefit and Domestic Purposes Benefit | |
| Women Alone | 175.61 |
| Sole parent (1 child) | 241.47 |
| Sole parent (2 children or more) | 241.47 |
| Domestic Purposes Benefit – Caring for Sick or Infirm | |
| Single 16–17 years old | 170.52 |
| Single 18 and over | 210.72 |
| Sole parent (1 child) | 276.82 |
| Sole parent (2 children or more) | 276.82 |
| Half married rate | 175.61 |
| Orphan's Benefit and Unsupported Child's Benefit | |
| Child under 5 years | 94.77 |
| Child 5–9 years old | 111.88 |
| Child 10–13 years old | 120.43 |
| Child 14 and over | 128.97 |
| Independent Youth Benefit | |
| Single 16–17 years old | 140.48 |
| New Zealand Superannuation and Veteran's Pension | |
| Single living alone | 255.81 |
| Single sharing | 236.14 |
| Married person | 196.78 |
| Married couple (both qualify) | 393.56 |
| Married couple with non-qualifying spouse (each partner) | 187.64 |
Income adjustment. People receiving an Invalid's Benefit, a Widow's Benefit, any Domestic Purposes Benefit, a Sickness Benefit or an Unemployment Benefit are income tested, and people receiving some of these benefits are subject to stand down periods. The levels at which all benefits are paid are adjusted annually in line with movement in the Consumers Price Index (CPI). In addition, the CPI-adjusted rate for New Zealand Superannuation and Veteran's Pension is compared with average wage levels to ensure the after-tax payment rate for couples is between 65 and 72.5 percent of the after-tax average ordinary time weekly wage.
Basic income exemptions. People receiving an Unemployment Benefit, a Sickness Benefit or an Independent Youth Benefit, and non-qualified spouses of people receiving New Zealand Superannuation, have their weekly benefit reduced by 70 cents for each dollar of weekly income above $80. People receiving an Invalid's Benefit, a Widow's Benefit or any Domestic Purposes Benefit have their benefit reduced by 30 cents for every dollar earned between $80 and $180 a week, while every dollar of income above $180 a week reduces the weekly benefit by 70 cents.
Unemployment Benefit. An Unemployment Benefit is available to people who are unemployed, capable and willing to undertake full-time work and who are taking reasonable steps to obtain employment. The benefit is also available to people who are not full-time students, but are engaged in full-time, employment-related training programmes. At 30 June 2005, 50,714 working-aged people were receiving an Unemployment Benefit, 18,041 fewer than at 30 June 2004. At the same date, 4,123 working-aged people in training were receiving an Unemployment Benefit, 94 fewer than at 30 June 2004.
Domestic Purposes Benefit. Domestic Purposes Benefits are available to parents caring for children without the support of partners, to people caring at home for someone who would otherwise be receiving hospital care, and, in some circumstances, to older women living alone. At 30 June 2005, 105,647 working-aged people were receiving a Domestic Purposes Benefit, 3,246 fewer than at 30 June 2004.
Widow's Benefit. Widow's Benefits are available to women whose husbands or de facto partners have died. At 30 June 2005, 7,637 working-aged people were receiving the Widow's Benefit, 624 fewer than at 30 June 2004.
Invalid's Benefit. Invalid's Benefits are available to people aged 16 and over who are either totally blind or permanently and severely restricted in their capacity for work due to a disability. At 30 June 2005, 73,186 working-aged people were receiving an Invalid's Benefit, 2,379 more than at 30 June 2004.
Sickness Benefit. Sickness Benefits are available to people aged 18 and over who lose earnings as a result of being temporarily incapacitated for work. At 30 June 2005, 45,176 working-aged people were receiving a Sickness Benefit, 1,478 more than at 30 June 2004.
Family Assistance tax credits provide financial help for families with children aged 18 and under.
Family Support. Family Support is provided to low-income families with dependent children. It is paid to income earners through taxation, but is delivered through Work and Income to people receiving benefits.
Childcare Subsidy. A Childcare Subsidy provides financial assistance to low-income families with dependent children under five years to obtain access to preschool childcare services. In the year ending 30 June 2005, there were 50,567 approved applications for Childcare Subsidies, 12,087 more than in the year ending 30 June 2004.
OSCAR Subsidy. OSCAR (Out of School Care and Recreation) Subsidies provide financial assistance with costs of childcare before and after school and of holiday programmes to low-income families with dependent children aged 5 to 13. In the year ending 30 June 2005, 15,411 applications for OSCAR Subsidies were approved, 5,708 more than in the year ending 30 June 2004.
Orphan's Benefit and Unsupported Child's Benefit. The Orphan's Benefit is available to caregivers of children whose parents cannot support the child because they are deceased, are ill or incapacitated, or cannot be found. Unsupported Child's Benefits are available to caregivers of children whose parents are, because of a family breakdown, unable to either care for the child, or provide fully for the child's support. At 30 June 2005, 371 people were receiving an Orphan's Benefit, two more than at 30 June 2004. At the same date, 6,908 people were receiving an Unsupported Child's Benefit, 226 more than at 30 June 2004.
Child Disability Allowance. A Child Disability Allowance is a non-taxable allowance paid to the parent or guardian of a seriously physically or mentally disabled child who requires constant care and attention. There were 33,050 children covered by the Child Disability Allowance at 30 June 2005, 1,579 more than at 30 June 2004. In the year ending 30 June 2005, 9,121 applications for the allowance were granted, an increase of 243 on the previous 12 months.
Disability Allowance. Disability Allowances are income-tested allowances paid to people with special costs arising from a disability or a personal health need. At 30 June 2005, 226,834 people were receiving a Disability Allowance, 4,551 fewer than at 30 June 2004. People may receive a Disability Allowance for themselves or on behalf of one or more dependant.
Community Services Card. Community Services Cards are entitlement cards which people on low to middle incomes can use to reduce the cost of doctors’ fees and prescription charges. At 30 June 2005, there were 1,014,440 cardholders, 38,821 fewer than at 30 June 2004.
Special Needs Grant. Special Needs Grants are one-off payments made in an emergency situation where the need cannot be met in any other way and where the person has insufficient financial resources to meet the need. In the year ending 30 June 2005, 401,505 grants were made, 10,843 fewer than in the previous year. Table 7.02 provides more details.
Special Benefit. The Special Benefit provides financial assistance for people who have ongoing expenses that exceed their income and who are in individual circumstances of hardship. At 30 June 2005, 53,255 people were receiving a Special Benefit, 1,804 more than at 30 June 2004.
Advance payment of benefit. Advance payment of a benefit is available to all people receiving benefits to assist them to meet essential needs they would otherwise be unable to meet. In the year ending 30 June 2005, 339,336 advance payments of benefits were granted, 3,927 fewer than in the previous year.
StudyLink. In the year ending 31 December 2004, nearly 61,000 students received student allowances, a decrease of around 3,000 on the 2003 year figure. Nearly 157,000 students made drawings against student loans in the year ending 31 December 2004, an increase of 800 on the previous year.
Table 7.02. Special Needs Grants1
Year ending 30 June 2005
| Main benefit | Number | Amount ($) |
|---|---|---|
1Includes recoverable and non-recoverable Special Needs Grants. Excludes benefit advances and payments made under the recoverable assistance programme. 2Includes Domestic Purposes Benefit – Sole Parent, Domestic Purposes Benefit – Caring for Sick or Infirm, Domestic Purposes Benefit – Woman Alone, and Emergency Maintenance Allowance. 3Includes Unemployment Benefit, Unemployment Benefit – Hardship, Unemployment Benefit – Training, Unemployment Benefit – Training – Hardship, Unemployment Benefit – Hardship – Students, Independent Youth Benefit, and Emergency Benefits. 4Includes Sickness Benefit and Sickness Benefit – Hardship. 5Includes Accommodation Supplement, Childcare Subsidy, OSCAR Subsidy, Disability Allowance, Child Disability Allowance, and Orphan's Benefit and Unsupported Child Benefit. Source: Ministry of Social Development | ||
| Domestic Purposes Benefit2 | 151,357 | 18,200,056 |
| Unemployment Benefit3 | 70,142 | 8,035,566 |
| Invalid's Benefit | 50,637 | 5,777,744 |
| Sickness Benefit4 | 50,660 | 5,447,814 |
| Low-income earner5 | 64,425 | 9,967,905 |
| NZ Superannuation | 10,594 | 1,341,257 |
| Widow's Benefit | 3,535 | 432,794 |
| Veteran's Pension | 155 | 25,362 |
| Total | 401,505 | 49,228,498 |
| Reason for grant: | ||
| Food | 299,072 | 27,718,821 |
| Other emergency | 18,521 | 3,376,275 |
| Medical, in rest home | 48,339 | 11,361,741 |
| Education | 3,577 | 681,777 |
| Health related | 14,014 | 1,182,593 |
| Re-establishment | 11,006 | 3,654,150 |
| Benefit stand downs | 2,445 | 272,310 |
| Goods or services | 582 | 54,677 |
| Miscellaneous | 3,949 | 926,154 |
| Total | 401,505 | 49,228,498 |
Training Incentive Allowance. Training Incentive Allowances help meet costs associated with attending recognised occupational or work-related courses which provide specific work skills. The allowance is available to people receiving a Widow's Benefit, an Invalid's Benefit or any Domestic Purposes Benefit. In the year ending 30 June 2005, 19,832 Training Incentive Allowances were granted, 3,131 fewer than in the previous year.
Payment while in hospital. Income support clients with no dependent children receive income support at the going rate for the first 13 weeks of hospitalisation. Following 13 weeks of hospitalisation, they receive a reduced rate. The benefit rate is not reduced for clients with dependent children.
Continuation of benefit after death. Certain benefits and pensions may be paid for four weeks following a client's death.
Table 7.03 shows trends in income support and pension expenditure since 1940, while Table 7.04 shows trends in the number of benefits and pensions in force.
Child support. Responsibility for collection of child support payments from non-custodial parents rests with the Inland Revenue Department. The aim of collecting payments is to ensure that parents contribute to the support of their children according to their ability to provide.
At 1 April 2005, New Zealand Superannuation provided $255.81 a week (after tax at the M rate) for a single person living alone and $393.56 a week for a married couple (or $375.28 if one spouse did not qualify for New Zealand Superannuation).
Recipients are required to pay tax on their superannuation payments.
The qualifying age for New Zealand Superannuation has been 65 since 1 April 2001, and residency qualifications also apply.
At 30 June 2005, there were 475,215 people receiving New Zealand Superannuation, 10,591 more than at 30 June 2004.
It is a goal of New Zealand's positive ageing strategy that people of all ages have a positive attitude to ageing and to older people.
Transitional Retirement Benefit. Transitional Retirement Benefits were introduced to assist those adversely affected by the increase in the age of eligibility for New Zealand Superannuation from 60 to 65. Transitional Retirement Benefits were introduced on 1 April 1994 and the age of eligibility for the benefit was raised in line with the age of eligibility for New Zealand Superannuation. The Transitional Retirement Benefit was abolished on 1 April 2004, when the age of eligibility reached 65.
War pensions and concessions are available for those who served in World War I and II, Korea, Operation Grapple, Malaya, Vietnam, Mururoa, the Gulf, Angola, Bosnia, Sierra Leone, East Timor, Afghanistan, the Solomon Islands and Iraq.
Also included is routine service in New Zealand before 1 April 1974. Since then, service personnel have been covered under accident compensation provisions.
The War Pensions Act 1954 is administered by the Secretary for War Pensions, who is also Director of Veterans’ Affairs New Zealand. Payments are provided from Vote: Veterans’ Affairs – Social Development, and the processing and payment of pensions is carried out by Work and Income.
Decisions on eligibility for war pensions are made by war pension claims panels, acting under delegation from the secretary. Each claims panel consists of a nominee from the Royal New Zealand Returned Services Association and an employee of Veterans’ Affairs New Zealand.
Veteran's Pension. Veteran's Pensions are available to ex-service personnel with a significant disability. The pension is paid at the same rate as New Zealand Superannuation and is taxable. At 30 June 2005, 8,871 people were receiving a Veteran's Pension, 406 more than at 30 June 2004.
War Disablement Pension. The War Disablement Pension provides tax-free compensation for people who served in the armed forces and who suffer from a disability or disabilities related to that service. War pensions are increasingly related to the ageing of the population and numbers receiving these pensions have remained relatively constant in recent years. At 30 June 2005, 16,255 War Disablement Pensions were in force, 669 fewer than at 30 June 2004.
Other war pension provisions. In addition to War Disablement Pensions, the war pensions programme provides pensions for surviving spouses and additional allowances and concessions for clients receiving War Disablement Pensions. At 30 June 2005, 4,873 surviving spouses and other dependents were receiving war pensions, 65 more than at 30 June 2004.
New Zealand has social security agreements with Australia, Canada, Denmark, Greece (the Hellenic Republic), the Republic of Ireland, Jersey and Guernsey, the Netherlands and the United Kingdom.
The main purposes of the agreements are to encourage the free movement of labour and to ensure that when a person has lived or worked in more than one country, each of those countries takes a fair share of responsibility for meeting the costs of that person's social security coverage.
The agreements are becoming part of the basic infrastructure of the global village, enabling people to move about the world, for short or long periods, either to work or to be with family, without jeopardising their social security coverage. By entering into such agreements, New Zealand is better able to attract skills, specialist knowledge and technical know-how from overseas. A widening network of agreements also provides more options for New Zealanders wishing to live overseas in their retirement.
General portability. Under the general portability provision, people eligible to receive New Zealand Superannuation or a Veteran's Pension in their own right may receive 50 percent of the payment while living outside New Zealand, provided they are not living in a country which has a social security agreement with New Zealand. Applications under this provision must be made while applicants are living in New Zealand.
Special portability arrangement. People leaving New Zealand to live in certain Pacific countries can receive a rate of New Zealand Superannuation or Veteran's Pension based on their New Zealand residence since the age of 20. People with 10 years New Zealand residence since the age of 20 receive 50 percent of New Zealand Superannuation or 50 percent of the Veteran's Pension. People with between 10 and 20 years New Zealand residence since the age of 20 are entitled to an additional 5 percent of New Zealand Superannuation or Veteran's Pension for each year of residence over 10 years. At the date of application, applicants must be living and be present in New Zealand and intending to live in the Pacific country for 52 weeks or more. Pacific countries covered by the arrangement are American Samoa, the Cook Islands, the Federated States of Micronesia, Fiji, French Polynesia, Guam, Kiribati, Marshall Islands, Nauru, New Caledonia, Niue, Northern Mariana Islands, Palau, Papua New Guinea, Pitcairn Island, Samoa, Solomon Islands, Tokelau, Tonga, Tuvalu, Vanuatu and Wallis and Fortuna.
Child, Youth and Family provides direct services for children and young people in need of care and protection, for those who have committed offences and for those involved in adoption processes.
Child, Youth and Family works towards a vision of safe children and young people in strong families and responsive communities, free from abuse, free from neglect and free from offending.
Child, Youth and Family was established on 1 October 1999 following integration of two Department of Social Welfare business units – the Children, Young Persons and Their Families Service and the New Zealand Community Funding Agency. From 1 July 2006, Child, Youth and Family became a service line of the Ministry of Social Development.
Child, Youth and Family has statutory responsibility for children and young people whose family circumstances put them at risk of abuse and neglect, offending behaviour or poor life outcomes.
Child, Youth and Family is guided by the objectives and principles of the Children, Young Persons and Their Families Act 1989, and also by other legislation, including the Adoptions Act 1955, Adult Adoption Information Act 1985, Adoption (Intercountry) Act 1997 and the Guardianship Act 1968.
Table 7.05 shows the number of care and protection notifications received and the number assessed as requiring further investigation and action by a social worker. All cases accepted for investigation are assigned a criticality rating, or response category, at time of intake.
In the year ending 30 June 2005, 53,097 notifications involving children and young people under the age of 17 were received, of which 43,460 required further action. In the previous year, there were 43,314 notifications, with 36.066 requiring further investigation.
Table 7.05. Care and protection notifications
Years ending 30 June
| Action | 2001 | 2002 | 2003 | 2004 | 2005 |
|---|---|---|---|---|---|
| Source: Child, Youth and Family | |||||
| Care and protection notifications received | 26,707 | 27,507 | 31,781 | 43,314 | 53,097 |
| Notifications for further investigation | 22,868 | 23,805 | 27,394 | 36,066 | 43,460 |
| Critical – immediate response time (same day) | 2,880 | 2,589 | 3,045 | 4,302 | 4,725 |
| Very urgent (same day + one calendar day) | 2,191 | 1,738 | 1,656 | 2,354 | 2,621 |
| Urgent (same day + six calendar days) | 11,180 | 13,067 | 14,963 | 20,277 | 25,832 |
| Low urgency (same day + 27 calendar days) | 6,556 | 6,402 | 7,730 | 8,410 | 8,187 |
After investigation, findings are classified and recorded under the categories of sexual abuse, physical abuse, emotional abuse, neglect, behavioural/relationship problems, self-harm/suicidal behaviour, or abuse not found. Table 7.06 lists investigation findings for these categories in each of the five years ending 30 June 2005.
Table 7.06. Abuse and neglect investigation findings
Years ending 30
June1
| Year | Sexual abuse | Physical abuse | Emotional abuse | Neglect | Behavioural/relationship problems | Self-harm/suicidal | Abuse not found | Total |
|---|---|---|---|---|---|---|---|---|
1Figures represent the number of findings, not the number of clients. Due to multiple findings, some clients are counted across more than one category. Source: Child. Youth and Family | ||||||||
| 2001 | 827 | 1,567 | 1,576 | 2,189 | 2,626 | 89 | 11,433 | 20,307 |
| 2002 | 1,250 | 2,066 | 2,153 | 3,053 | 3,473 | 83 | 15,007 | 27,085 |
| 2003 | 1,288 | 2,002 | 2,282 | 2,939 | 3,328 | 128 | 14,238 | 26,205 |
| 2004 | 1,187 | 2,035 | 2,807 | 3,212 | 3,589 | 104 | 16,682 | 29,616 |
| 2005 | 1,466 | 2,477 | 4,889 | 4,366 | 4,573 | 179 | 24,414 | 42,364 |
Case management. When, on investigation, it is decided that Child, Youth and Family needs to remain involved with a child or family, direct services may be provided through family/whānau agreements, care agreements, family group conference plans or court plans.
Family/whānau agreements. Family/whānau agreements are negotiated by a social worker when a family agrees there is a problem to address and agrees voluntarily to intervention. Such agreements may be in force for up to three months, must be formally reviewed and may be renewed for one further three-month period. Table 7.07 shows the number of agreements signed from 2001 to 2005.
Table 7.07. Family/whānau agreements
Years ending 30 June
| 2001 | 2002 | 2003 | 2004 | 2005 | |
|---|---|---|---|---|---|
| Source: Child, Youth and Family | |||||
| Agreements signed | 2,305 | 2,395 | 2,346 | 2,528 | 3,010 |
Family group conferences and court orders. When a family/whānau agreement is not considered appropriate, intervention may occur through the statutorily-defined process of a family group conference. Child, Youth and Family manages family group conference plans and court orders to provide care for children, while working towards their return to parents, family or whānau. These may include custody orders, plans resulting from family group conferences, counselling orders and support orders. Family group conference plans predominate over court plans as a means of managing young people who come to the notice of Child, Youth and Family. Family group conferences encourage participation in the resolution of care and protection issues and often avoid the need for court involvement. Family group conference plans must be reviewed by reconvening the conference or by a less formal process. Table 7.08 gives a statistical summary of family group conferences for the period 2002–05.
Table 7.08. Youth justice family group conference plans
Years ending 30 June
| 2002 | 2003 | 2004 | 2005 | |
|---|---|---|---|---|
| Source: Child, Youth and Family | ||||
| Number | ||||
| Referrals for family group conferences | 7,802 | 7,660 | 8,616 | 8,153 |
| Family group conferences held (new and reconvened) | 6,094 | 6,613 | 7,506 | 7,654 |
| Percent | ||||
| Family group conferences convened within statutory timeframes: | ||||
| 7 days | 70.3 | 91.3 | 84.1 | 93.8 |
| 14 days | 80.7 | 91.8 | 92.3 | 96.6 |
| 21 days | 92.0 | 94.0 | 96.1 | 97.7 |
| All family group conferences convened within statutory timeframes | 86.7 | 94.0 | 93.3 | 96.9 |
| Family group conference plans reviewed on time | 83.2 | 89.6 | 94.2 | 94.7 |
Emergency actions. The Children, Young Persons and Their Families Act 1989 provides measures for securing the safety of a child through warrant action by social workers or the police, or through temporary care agreements with parents, to provide immediate care for a child while longer-term solutions are explored.
Youth justice services provided by Child, Youth and Family under the Children, Young Persons and Their Families Act 1989 and the Criminal Justice Act 1985 include:
Working with police to ensure that cases are brought into the formal system only when public interest and/or safety is an issue.
Providing programmes and services targeted at youth at risk of offending, reoffending or those with poor life outcomes. These include young people with conduct disorders, serious and repeat youth offenders, young sex abusers, young people with difficult-to-manage behaviour and those at risk of self-harm.
Providing appropriate placements for young people who have been arrested.
Providing custodial services.
Youth justice family group conferences. Family group conferences are convened to address the offending behaviour of children and young people. They bring together, in a statutory-defined forum, members of the offender's family or whānau, law enforcement officers and victims to agree how the young offender will be held accountable, and to agree on appropriate intervention plans.
Care services. Two main placement options are used in New Zealand for children and young people requiring alternative care. These are either based in a home (extended family, caregivers, family home, special purpose family home, specialist or group homes) or in a residential care centre (short or extended-term local or national residences). International research indicates that family-based placements are more effective than other forms of placement. Children and young people are more likely to return to their usual caregivers, and are less likely to be re-abused, if they are placed in family-based care, rather than in non kin-based care. The Children, Young Persons and Their Families Act 1989 shifted the emphasis away from longer-term, extended-care placements towards restoring usual caregiving arrangements. When alternative placements are necessary, emphasis is put on making a placement, whenever possible, within the child's extended family or community.
Home-based care. There were 3,085 children in non-family/whānau care and 1,395 in family/whānau care at 30 June 2002. By 30 June 2003, there were 3,117 in non-family/whānau care and 1,565 in family/whānau care.
Residential care. After a review of the residential care building programme in 1996, the government agreed to build or upgrade nine residential facilities. The residential care strategy allows for establishment of specialist units for young sex abusers, for conduct disorder children and young people, and for the separation of youth justice and care and protection residential facilities. Three residential facilities were expected to begin operating during 2006. Table 7.09 shows admissions to national residences in recent years.
The adoption information and services unit of Child, Youth and Family is responsible for statutory adoption services.
Local and intercountry adoption services include education, preparation and assessment of prospective adoptive applicants, counselling of birthparents, approval of placements, supervision, and reporting to the New Zealand Family Court.
Post-adoption services for birth and adoptive families are provided when requested, or referrals made.
Table 7.10 shows access to adoption information for the years 1994 to 2005.
Table 7.1. Access to adoption information
| Action | 1994 | 1995 | 1996 | 1997 | 1998 | 1999 | 2000 | 2001 | 2002 | 2003 | 2004 |
|---|---|---|---|---|---|---|---|---|---|---|---|
- nil or zero Sources: Child, Youth and Family Department of Internal Affairs | |||||||||||
| Original birth certificates issued to adopted people | 1,849 | 1,597 | 1,580 | 1,925 | 1,446 | 1,356 | 1,230 | 1,030 | 943 | 902 | 800 |
| Original vetoes from adopted people | 26 | 36 | 17 | 30 | 22 | 8 | 1 | 4 | - | 6 | 2 |
| Renewal vetoes from adopted people | - | - | 51 | 13 | 4 | 5 | 6 | 8 | - | 9 | 1 |
| Cancelled vetoes from adopted people | 14 | 8 | 17 | - | 2 | 3 | 5 | 1 | 2 | 2 | 1 |
| Birthparent applications for identifying information (section 8) | 717 | 610 | 650 | 534 | 450 | 392 | 325 | 303 | 285 | 269 | 254 |
| Original vetoes from birthparents | 34 | 69 | 126 | 60 | 22 | 15 | 4 | 2 | 1 | 5 | 3 |
| Renewal vetoes from birthparents | - | - | 351 | 77 | 19 | 11 | 13 | 13 | 10 | 11 | 23 |
| Cancelled vetoes from birthparents | 15 | 14 | 10 | 2 | 6 | 1 | 1 | 1 | 5 | - | - |
Table 7.11 shows adoptions by New Zealand citizens from 2001 to 2005.
Table 7.11. Adoptions by New Zealand citizens
Years ending 30 June
| 2001 | 2002 | 2003 | 2004 | 2005 | |
|---|---|---|---|---|---|
1A registration may occur in a different fiscal year from the adoption report hence the total adoptions may not always equal the sum of the adoption reports written for the same period. Any disparity is included under ‘adoption type not recorded’. Source: Child, Youth and Family | |||||
| Adoption of New Zealand children | |||||
| Adoption reports in respect to: | |||||
| Non-relatives | 78 | 104 | 81 | 108 | 113 |
| One parent and spouse | 119 | 89 | 71 | 54 | 56 |
| Relatives | 104 | 96 | 71 | 65 | 71 |
| Foster parents | 9 | 9 | 2 | 8 | 8 |
| Adoption type not recorded1 | 9 | 27 | 98 | 40 | 66 |
| Total | 319 | 325 | 323 | 275 | 314 |
| Adoption of foreign children | |||||
| In New Zealand court to non-relatives | 14 | 7 | 13 | 12 | 12 |
| In New Zealand court to relatives | 50 | 48 | 38 | 36 | 41 |
| In overseas court | 344 | 256 | 265 | 339 | 209 |
| Total | 408 | 311 | 316 | 387 | 262 |
| Total adoptions granted or recognised by New Zealand | 727 | 636 | 639 | 662 | 576 |
Community services funding. Community providers are funded each year by Child, Youth and Family to provide a variety of social services from non-departmental output classes. Child, Youth and Family is responsible for allocation and management of funding and support to iwi and community-based social and welfare services in accordance with government policies and criteria. Table 7.12 shows budget allocations for contracted social services in 2004 and 2005.
Table 7.12. Non-departmental budget allocations
Years ending 30 June
| Allocation | 2004 | 2005 |
|---|---|---|
| Source: Child, Youth and Family | ||
| $(000) | ||
| Information and advice | 1,426 | 1,429 |
| Education and prevention services | 9,605 | 9,876 |
| Family well-being services | 51,851 | 55,684 |
| Counselling and rehabilitation services | 15,109 | 15,966 |
| Emergency and special purpose housing and associated services | 995 | 1,006 |
| Strengthening providers and communities | 8,925 | 6,679 |
| Total | 87,911 | 90,640 |
| Other expenses to be incurred by Child, Youth and Family | ||
| Contingency and innovations fund | 365 | 365 |
| Stronger communities action fund | 1,916 | 1,916 |
7.1 Ministry of Social Development.
7.2 Child, Youth and Family; Department of Internal Affairs; Ministry of Social Development; Veterans’ Affairs New Zealand; Retirement Commission.
7.3 Child, Youth and Family; Department of Internal Affairs; New Zealand Association of Citizens Advice Bureaux.
www.cyf.govt.nz – Child, Youth and Family
www.dia.govt.nz – Department of Internal Affairs
www.msd.govt.nz – Ministry of Social Development
www.cab.org.nz – New Zealand Association of Citizens Advice Bureaux
www.odi.govt.nz – Office of Disability Issues
www.sorted.org.nz – Retirement Commission
www.veteransaffairs.mil.nz – Veterans’ Affairs New Zealand
Table of Contents
New Zealand's Youth Action Plan identifies the need to improve the health of young people, with special reference to Māori and Pacific youth.
The New Zealand health system is made up of public, private and voluntary sectors which interact to provide and fund health care. Seventy-eight percent of health care is publicly funded, with out-of-pocket payments and private insurance the other main contributors.
The Ministry of Health is the government's primary advisor on health policy and disability support services. The ministry aims to ensure that the health and disability system works for all New Zealanders.
The ministry consists of eight directorates, each led by a deputy director-general.
The Corporate and Information Directorate provides:
Strategic advice on information management and technology.
Stewardship, management and coordination of national data collections and dissemination of health information.
Processing and auditing of claims, payments and agreements on behalf of district health boards (DHBs) for the health and disability sector.
Information systems and the means by which national data collections can be accessed by the health and disability sector.
Ministerial services.
Legal advice.
Corporate services.
The Clinical Services Directorate is responsible for:
Providing a trusted interface between the ministry, communities, health providers and health professionals to support provision of safe and effective personal health services.
Providing policy advice on clinical services to the minister.
Providing strategic leadership to the health sector to facilitate changes to operating environments for clinical services.
Implementing government policy in collaboration with DHBs and evaluating outcomes.
Developing, embedding and maintaining performance-monitoring frameworks that are congruent across DHBs and Primary Health Organisations (PHOs).
Administration of safety and facility licensing legislation.
The DHB Funding and Performance Directorate is responsible for:
Funding and monitoring the performance of DHBs and other health sector Crown entities.
Providing the key accountability interface with DHBs (funders of health services for defined communities) and with other health sector Crown entities.
Supporting DHBs' strategic planning, annual planning and Crown Funding Agreement processes.
Providing nationwide planning and maintenance of service frameworks.
Acting as the minister's agent in providing strategic advice on the Crown's investments and risks.
Funding and monitoring some undevolved personal health programmes.
The directorate includes the Clinical Training Agency, which purchases post-entry clinical training and is involved in workforce analysis and development.
The Disability Services Directorate focuses on providing advice to the Minister of Health and Associate Ministers of Health on disability support services policy, service development and funding, strategic direction of the disability support services sector, and future options for meeting the disability support services needs of younger people. The directorate also:
Analyses disability support services expenditure and service trends.
Contributes to implementation of the New Zealand Disability Strategy throughout the health and disability sector.
Funds disability support services, including negotiating service agreements with providers, payments for services, provider audit and monitoring, and payment of claims from people with disabilities.
The Māori Health Directorate provides policy advice to the minister and associate ministers on the strategic direction of the health and disability sector with respect to Māori health and disability. This includes providing advice on:
Māori provider and workforce development.
How to improve access to, and the quality and effectiveness of, services to Māori consumers.
The impact of policy and legislation in relation to the Treaty of Waitangi.
Māori health aspirations and needs.
The Mental Health Directorate is responsible for implementing the Mental Health Strategy and administration of regulations relating to mental health. Its objectives are to work with key stakeholders to assist the government in achieving:
Mental health services that meet the needs of the New Zealand population and provide value for money.
An environment of safety for consumers and the general public.
A community that is non-discriminatory towards people with mental illness.
The Public Health Directorate is responsible for the direction of population health services and regulation of public health and safety. It can advise on other health policy areas where they impact on population health. The focus of the directorate is on:
Providing policy and strategic advice on, and management of, public health issues and services.
Providing advice on setting and monitoring national public health goals and targets.
Policy development and advice on opportunities for dealing with health disparities among population groups.
Health promotion and education services and programmes.
Administration and enforcement of public health legislation.
Funding public health providers.
The directorate contains the National Screening Unit, the National Radiation Laboratory, Medsafe and Public Health Intelligence.
The Sector Policy Directorate is responsible for:
Providing an integrated view of the overall performance of the health and disability sector.
Providing an integrated view of the future directions, design and priorities for the health and disability sector.
Assessing external and domestic influences on the sector, including determinants of demand for health and disability support services.
Leading strategic policy issues that span whole or part of the health sector, including funding, therapeutics and the workforce.
Providing strategic advice on ethics, innovations and associated regulatory frameworks.
The directorate also provides operational policy on services for older people and logistical and administrative support for international fellowships, international visits and relationship management with international organisations.
There are eight business units within the ministry:
The New Zealand Health Information Service is responsible for stewardship, management and coordination of national data collections and dissemination of health information.
HealthPAC is responsible for processing and auditing claims, payments and agreements on behalf of DHBs.
The National Screening Unit is responsible for ensuring effective delivery of the National Breast Screening Programme and the National Cervical Screening Programme.
Medsafe is responsible for regulation of therapeutic products under the Medicines Act 1981 and parts of the Misuse of Drugs Act 1975.
The National Radiation Laboratory is responsible for expert advice, service provision and research capability on matters concerning public, occupational and medical exposure to radiation, performance of radiation equipment, and measurement of radiation and radioactivity.
The Clinical Training Agency is responsible for funding post-entry clinical training programmes.
Information Technology Shared Services provides information technology services to DHBs and to the ministry.
Public Health Intelligence carries out the ministry's statutory responsibility to monitor the health of the population over time by analysing population health outcomes, risks and determinants, and by examining inequalities in health across regional boundaries and among population groups. Public Health Intelligence also works collaboratively with a variety of national and international academic and health agencies.
New Zealand's 21 district health boards are Crown entities and have both funding (planning and funding health services for their populations) and provider (delivery of hospital and related services) roles.
Established under the New Zealand Public Health and Disability Act 2000, the statutory objectives of district health boards are to improve, promote and protect the health of communities, to promote integration of health services, especially primary and secondary care services, and to promote effective care or support for those in need of personal health services or disability support.
Boards also have the responsibility of promoting the independence, inclusion and participation in society of people with disabilities and of reducing health outcome disparities among various population groups.
Boards are expected to show a sense of social responsibility, to foster community participation in health improvement and to uphold ethical and quality standards expected of providers of services and public sector organisations.
The boards work with all health care provider organisations to ensure provision of specified health services and to balance each community's needs for health and disability services.
Crown-owned public hospitals are the main providers of secondary health care services. Primary and community-based care comes from private/non-government providers, such as general practitioners, Māori providers and disability support providers.
Boards have a majority of elected members, with some members appointed by the Minister of Health. Each board has three statutory advisory committees – a community and public health advisory committee, a disability support advisory committee and a hospital advisory committee.
Each board has a separate operating charter and a set of accountabilities and reporting requirements.
The 21 district health boards and their constituencies are:
Northland – Far North, Whangarei, Kaipara.
Waitemata – Rodney, North Shore, Waitakere.
Auckland – Auckland north-west and gulf, Auckland north-east, Auckland south.
Counties Manukau – Manukau, Mangere, Manurewa, Franklin, Papakura.
Waikato – Thames-Coromandel, Waikato, Hamilton, South Waikato.
Bay of Plenty – Western Bay of Plenty, Tauranga, Whakatane.
Lakes – Rotorua north, Rotorua south, Taupo.
Tairawhiti – Gisborne, Tairawhiti.
Hawke's Bay – Wairoa, Hastings, Napier-Chatham Islands, Central Hawke's Bay.
Taranaki – New Plymouth, Taranaki north, Taranaki south.
Whanganui – Wanganui, Waimarino, Rangitikei.
Midcentral – Manawatu, Palmerston North, Tararua, Horowhenua.
Wairarapa – Masterton, Carterton, South Wairarapa.
Hutt – Lower Hurt central, Lower Hutt harbour, Wainuiomata.
Capital and Coast – Kapiti Coast. Porirua, Wellington north-west, Lambton, Wellington south-east.
Nelson-Marlborough – Tasman, Richmond, Nelson, Marlborough, Blenheim.
West Coast – Buller, Grey, Westland.
Canterbury – North Canterbury, Christchurch, Mid-Canterbury.
South Canterbury – Timaru, Temuka-Pleasant Point, Mackenzie-Geraldine, Waimate.
Otago – Waitaki, Central Otago, Clutha, Dunedin north, Dunedin south.
Southland – Queenstown-Lakes, Southland, Gore, Invercargill.
Crown Health Financing Agency. The Crown Health Financing Agency (CHFA) is the Crown provider of long-term debt finance to district health boards. The range of loan facilities available to boards is similar to that offered by private banks. CHFA loans are available to refinance boards' private bank debt or to finance new capital work projects. The CHFA offers property advice and a land disposal service to assist district health boards dispose of surplus property. Formerly the Residual Health Management Unit, the CHFA is the legal successor to area health boards and manages a range of residual functions, assets and liabilities transferred from area health boards to the CHFA in 1993. The CHFA operates under provisions of the New Zealand Public Health and Disability Act 2000.
National Advisory Committee on Health and Disability (National Health Committee). The National Health Committee provides the Minister of Health with advice on public health, personal health and disability support services it believes should be publicly funded. It may also advise the minister on other public health matters. The Public Health Advisory Committee operates as a sub-committee of the National Health Committee. The committee's website is www.nhc.govt.nz
National Advisory Committee on Health and Disability Support Services Ethics. The National Advisory Committee on Health and Disability Support Services Ethics is responsible for providing the Minister of Health with advice on ethical issues of national significance in respect of any health and disability matter, including research and health services. The committee is also required to determine nationally consistent ethical standards across the health and disability sector. The committee's website is www.newhealth.govt.nz/neac
Health Workforce Advisory Committee. The Health Workforce Advisory Committee is a discretionary advisory committee responsible for advising the Minister of Health on health workforce issues. The committee's website is www.hwac.govt.nz
Child and Youth Mortality Review Committee. The discretionary Child and Youth Mortality Review Committee reviews deaths of children and young people aged between 28 days and 25 years with a view to reducing the number of preventable deaths in this age group. The committee's website is www.newhealth.govt.nz/cymrc
Ethics Committee on Assisted Reproductive Technology. The main function of the Ethics Committee on Assisted Reproductive Technology is to consider and determine applications for assisted reproductive procedures or research.
National Health Epidemiology and Quality Assurance Committee. The National Health Epidemiology and Quality Assurance Committee – a compulsory advisory committee – provides the Minister of Health with advice on any matter of health epidemiology and quality assurance, but must specifically examine perinatal, child and adolescence morbidity and mortality.
Cancer Control Council. The Cancer Control Council is a discretionary advisory committee established in 2005 under s.11 of the New Zealand Public Health and Disability Act 2000 to oversee implementation of the Cancer Control Action Plan.
Advisory Committee on Assisted Human Reproduction. The Advisory Committee on Assisted Human Reproduction (ACART), established under s.32 of the Human Assisted Reproductive Technology Act 2004, is responsible for issuing guidelines and advice to the Ethics Committee on Assisted Reproductive Technology. ACART is also responsible for providing advice to the Minister of Health on options for regulation of assisted reproductive procedures and research.
Health Information Standard Organisation. The Health Information Standard Organisation is a discretionary advisory committee established under s.11 of the New Zealand Public Health and Disability Act 2000 responsible for providing the Minister of Health with advice on a national framework for development of health information standards.
Perinatal and Maternity Mortality Review Committee. The Perinatal and Maternity Mortality Review Committee was established in 2005 under s.11 and s.19 of the New Zealand Public Health and Disability Act 2000 to review and report to the Minister of Health on perinatal and maternal deaths. The aim is to reduce the number of deaths and to encourage continuous quality improvement through promotion of quality assurance programmes.
Radiation Protection Advisory Council. The Radiation Protection Advisory Council is a statutory council established under the Radiation Protection Act 1956 to advise and make recommendations to the Minister of Health and to the Director-General of Health regarding use of ionizing radiations.
The supply of safe blood and blood products is the responsibility of the New Zealand Blood Service.
The New Zealand Blood Service (NZBS) ensures the supply of safe blood and blood products.
It is also responsible for all aspects of the integrated national blood transfusion service, from collection of blood from volunteer donors to transfusion of blood products within the hospital environment – ‘vein to vein’ transfusion.
In addition to its core activities, NZBS provides related services, including matching of patients and donors prior to transplantation and provision of tissue banking services.
Health Research Council of New Zealand. The Health Research Council of New Zealand (HRC) was established under the Health Research Council Act 1990 and is the Crown agency responsible for management of the government's investment in public good health research in New Zealand. The act requires the HRC to set guidelines for health research ethics and to accredit regional ethics committees. Ownership of the HRC resides with the Minister of Health. The HRC is also responsible for advising the Ministry of Health and administering funds in relation to national health research policy. The HRC's statutory functions include fostering recruitment, education, training and retention of those engaged in health research in New Zealand. The HRC's mission is to improve human health by promoting and funding health research. The HRC funds a broad spectrum of health research, including biomedical, public health, Māori and Pacific people's health and clinical research. HRC funding is largely allocated through Vote: Research, Science and Technology, with funding for ethics policy advice coming from Vote: Health. Total government funding for the HRC's work in 2005/06 was $70.07 million (including GST). The Health Research Council of New Zealand website is www.hrc.govt.nz
The Malaghan Institute of Medical Research. Established in Wellington in 1979 as an independent medical research institute, the Malaghan Institute of Medical Research is a charitable trust dedicated to the relief of human suffering through scientific research into the causes, nature and treatment of disease. Formerly the Wellington Cancer and Medical Research Foundation, it was renamed in 1986 to recognise the contribution of Len and Ann Malaghan. More than 40 full-time Malaghan Institute scientists carry out research into cancer, asthma, arthritis, multiple sclerosis and infectious diseases, including tuberculosis and RSV (a respiratory infection most serious in children under 12 months). The institute has a commitment to educating, fostering and developing scientists, which it regards as essential to the continuing success of scientific research in New Zealand. To that end, the institute sponsors programmes for doctoral candidates, summer internships for university students and a science investigator award for secondary students. The Malaghan Institute is funded by contestable research grants, contributions from corporate sponsors and bequests and donations. Formerly housed at the Wellington School of Medicine, the institute moved in 2005 to a larger, state-of-the-art facility at Victoria University which provides greater scope for its research capabilities. The Malaghan Institute website is www.malaghan.org.nz
As shown in Table 8.01 overleaf, health expenditure (public) in New Zealand amounted to $8.7 billion in the financial year ending 30 June 2003, the latest year for which figures are available. This represented 21 percent of the government's total budgeted expenditure for the financial year.
Table 8.01. Health expenditure1
Years ending 30 June
| Sector | 1994 | 1995 | 1996 | 1997 | 1998 | 1999 | 2000 | 2001 | 2002 | 2003 |
|---|---|---|---|---|---|---|---|---|---|---|
1CPI-deflated, non-health items excluded. 2Expressed in 1998/99 dollars. Note: Figures may not add to stated totals due to rounding. Source: Ministry of Health | ||||||||||
| $(million)2 | ||||||||||
| Public | 5,350 | 5,489 | 5,534 | 5,843 | 6,208 | 6,490 | 6,984 | 7,602 | 8,319 | 8,741 |
| Private | 1,551 | 1,624 | 1,683 | 1,717 | 1,851 | 1,886 | 1,968 | 2,300 | 2,361 | 2,418 |
| Total | 6,902 | 7,112 | 7,218 | 7,560 | 8,059 | 8,376 | 8,952 | 9,902 | 10,680 | 11,159 |
The health service workforce is made up of a large number of professions and occupations. The Health Practitioners Competence Assurance Act 2003 seeks to protect the health and safety of members of the public by providing mechanisms to ensure that registered health practitioners are competent and fit to practise their professions.
Doctors. The Medical Council of New Zealand is a statutory body operating under the Health Practitioners Competence Assurance Act 2003. Registration of a doctor by the council is evidence that a doctor has met a certain standard. In addition to registration, the council has responsibilities in areas of doctor education, standards, conduct and health. Main functions of the council are:
Registration – The council registers all doctors working in New Zealand. Doctors who complete medical training outside New Zealand or Australia must show they meet certain standards by examination and/or assessment before registration is granted. Doctors with recognised postgraduate qualifications and training are vocationally registered in recognised branches of medicine (sometimes called specialists).
Medical education – This involves accreditation of New Zealand medical schools, courses and curriculums, in association with the Australian Medical Council. The council approves ‘runs’ in hospitals as suitable for the education, training and experience of interns in their seventh year, the mandatory period before general registration. In addition, it promotes vocational and continuing medical education in New Zealand and accredits societies and colleges responsible for postgraduate or higher training.
Health – The council manages the rehabilitation and continued monitoring of doctors who, because of some mental or physical health problem, may not be fit to practise for a period of time.
Professional standards – Legislation provides for the council to review the competency or performance of doctors and to implement remediation as appropriate, including, if necessary, imposing conditions on annual practising certificates or registration. The council also ensures doctors maintain their competency to practise through continuing medical education, peer reviews and individual audits to overcome any knowledge or skill gaps.
Complaints about doctors may be received by either the Medical Council of New Zealand or the Health and Disability Commissioner (HDC), but all complaints must be referred to the HDC. The HDC may refer complaints back to the medical council and the council must assess the complaint promptly and consider what action should be taken, including referral to a Professional Conduct Committee. The HDC must notify the medical council of any investigation under the Health and Disability Commissioner Act 1994 directly involving a doctor. The number of practising doctors at 30 June 2005 was 11,029 – 674 more than at 31 March 2003. The Medical Council of New Zealand website is www.mcnz.org.nz
Dentists. The Dental Council of New Zealand was established under the Health Practitioners Competence Assurance Act 2003 and regulates all oral health professionals. At 30 June 2005, 1,640 dentists, 640 dental therapists and 377 dental hygienists were registered and held annual practising certificates. The Office of the Health and Disability Commissioner (HDC) is the initial recipient of complaints about health care practitioners, including dentists. The dental council investigates complaints referred by the HDC and may, in turn, refer the complaint to a Professional Conduct Committee, which can recommend that the dental council review the practitioner's competence and fitness to practise. Disciplining of practitioners is carried out by the Health Practitioners Disciplinary Tribunal (HPDT), which can impose penalties ranging from fines to suspension or cancellation of registration. Between 18 September 2004 and 31 March 2005, the HPDT received three charges of professional misconduct, two of which involved the same dentist. In each case the proceedings were not concluded. The dental council issues annual practising certificates, which certify that the practitioner is competent and fit to practise. Where public safety issues arise, the council may appoint a Competence Review Committee, consisting of two of the practitioner's peers and a layperson. Competency review aims to ensure practitioners are practising at the required standard and may require them to undertake further education or assessment. Between 18 September 2004 and 31 March 2005, there were four notifications of sub-standard competence. Professional dental studies are provided at the School of Dentistry, University of Otago.
Nurses. The Nursing Council of New Zealand is the health regulatory authority responsible for nurses in New Zealand, with legislated functions under the Health Practitioners Competence Assurance Act 2003. The council's primary concern is public safety. The council registers nurses; sets minimum standards for registration; issues practising certificates; sets standards for, approves and monitors nursing programmes at educational institutions; conducts examinations; ensures maintenance of professional standards and continuing competence of nurses; assesses, investigates and prosecutes complaints about nurses; and deals with health issues that affect a nurse's ability to practise safely. The council aims to act in a manner that is proactive and responsive to relevant national and international trends that influence the practice of nursing. As at 31 March 2005, 50,198 New Zealand nurses held practising certificates, down from 51,602 a year before.
Midwives. The Midwifery Council is constituted under the Health Practitioners Competence Assurance Act 2003. The council is concerned with registration and education of midwives, setting standards for practice, issuing practising certificates, ensuring midwives maintain competence and (in conjunction with the Health and Disability Commissioner) addressing matters involving the competence and discipline of registered midwives. A direct entry, three-year Bachelor of Midwifery programme is offered at five learning institutions throughout New Zealand. Students must complete the programme, pass a national examination and meet required standards of fitness for practise and competencies for entry to the register before being registered. Overseas qualified midwives who meet a separate set of requirements are able to be registered in New Zealand. All midwives wishing to hold practising certificates must engage in a recertification programme, which requires completion of compulsory and elective clinical and theoretical courses and engagement in professional development in each three-year period, in order to maintain competence. At 1 April 2005, there were 13,116 registered midwives, with approximately 2,500 holding practising certificates.
Psychologists. The Psychologists' Board is constituted under the Health Practitioners Competence Assurance Act 2003. Maintenance of an accurate register of psychologists is one of the board's key responsibilities. The board promotes education and training in the profession and reviews and promotes the competency of registered psychologists. It sets standards of clinical and cultural competence and ethical conduct. The board also investigates complaints against psychologists. At 31 March 2005, there were 2,447 registered psychologists (an increase of 306 since 31 March 2003), with 1,542 holding annual practising certificates (an increase of 234 since 31 March 2003).
Physiotherapists. The Physiotherapy Board, constituted under the Health Practitioners Competence Assurance Act 2003, protects the New Zealand public by ensuring physiotherapists who gain registration are safe and competent to practise. It also monitors practices of registered physiotherapists and, where necessary, disciplines registered physiotherapists. At 31 January 2004, 2,933 physiotherapists held annual practising certificates, 155 more than a year before.
Occupational therapists. The Occupational Therapy Board of New Zealand is an authority under the Health Practitioners Competence Assurance Act 2003. Three-year, full-time degree courses for occupational therapists are conducted at Auckland University of Technology and at Otago Polytechnic. At November 2005, there were 2,107 registered occupational therapists (a decrease of 874 on the figure at 31 March 2003), with 1,673 (an increase of 64) holding current practising certificates.
Dietitians. The Dietitians' Board is constituted under the Health Practitioners Competence Assurance Act 2003. A 15-month postgraduate training course for dietitians is conducted at the University of Otago, the prerequisite qualification being a three-year Bachelor of Science degree in Human Nutrition or a Bachelor of Consumer and Applied Science from the University of Otago. As at 31 March 2005, there were 1,104 registered dietitians (an increase of 34 from March 2004), with 422 (an increase of 10 from March 2004) holding annual practising certificates.
Optometrists and dispensing opticians. The Optometrists and Dispensing Opticians Board, constituted under the Health Practitioners Competence Assurance Act 2003, is concerned with registration and conduct of optometrists and dispensing opticians. Optometrists are trained at the University of Auckland in a five-year, full-time degree course. Dispensing opticians are trained through a two and-a-half-year correspondence course. At 27 October 2005, there were 1,324 registered optometrists (an increase of 271 on the figure at 31 March 2003), of whom 620 (an increase of 89) held annual practising certificates. At the same dates, there were 242 registered dispensing opticians (an increase of 64), of whom 131 (an increase of 32) held annual practising certificates.
Podiatrists. The Health Practitioners Competence Assurance Act 2003 provides for the constitution of a Podiatrists' Board. The board registers qualified podiatrists and sets standards of education and conduct. The Auckland University of Technology offers a three-year Bachelor of Health Science (Podiatry) degree, the qualification recognised for registration. At 21 November 2005, there were 556 registered podiatrists, with 282 holding current annual practising certificates, compared with 514 registered podiatrists holding 254 practising certificates at 6 November 2003.
Chiropractors. The Chiropractic Board is constituted under the Health Practitioners Competence Assurance Act 2003 and is concerned with registration, education and professional conduct of registered chiropractors. The board conducts competence examinations twice a year and successful candidates are considered for registration by the board. The board also issues annual practising certificates and acts on complaints against members of the profession. At 31 January 2006, there were 307 chiropractors registered in New Zealand and holding annual practising certificates.
There were 3,770 registered pharmacists in New Zealand at 30 June 200S.
Pharmacists. The Pharmacy Council of New Zealand, established under the Health Practitioners Competence Assurance Act 2003, is the regulatory authority responsible for pharmacists' registration, competence and fitness to practise. Entry to the pharmacy profession can be gained through a four-year degree course at either the University of Auckland or the University of Otago, followed by one year's practical training as an intern pharmacist. Recognition of pharmacy qualifications exists between New Zealand and Australia. Other routes of entry are available for pharmacists with qualifications gained in the United Kingdom and Ireland, and also for those from other countries where qualifications can be assessed as equivalent to the New Zealand Bachelor of Pharmacy degree. At 30 June 2005, there were 3,770 registered pharmacists (a decrease of 123 on the figure at 1 January 2004), of whom 2,787 held annual practising certificates.
Medical radiation technologists. The Medical Radiation Technologists' Board, constituted under the Health Practitioners Competency Assurance Act 2003, is concerned with registration, education and conduct of those practising medical radiation technology. There are five scopes of practice of medical radiation technology – diagnostic imaging general; radiation therapy (both of which require undergraduate degrees); nuclear medicine; ultrasound imaging; and magnetic resonance imaging (all of which require postgraduate qualifications). Students study diagnostic imaging general at the Auckland University of Technology, the Universal College of Learning and the Christchurch Polytechnic Institute of Technology. Those studying radiation therapy undertake a three-year course at the University of Otago's Wellington School of Medicine and Health Sciences. At 31 March 2005, 1,858 medical radiation technologists held annual practising certificates, 210 more than at 31 March 2003.
Medical laboratory scientists and technicians. The Medical Laboratory Science Board, formerly the Medical Laboratory Technologists Board, is constituted under the Health Practitioners Competence Assurance Act 2003. The board deals with training, registration and conduct of people who practise medical laboratory science and has approved two scopes of practise under the new act – medical laboratory scientists and medical laboratory technicians. The University of Otago, Massey University and Auckland University of Technology offer a Bachelor of Medical Laboratory Science degree and the board also approves a graduate diploma route to registration in the scope of medical laboratory scientist. The New Zealand Institute of Medical Laboratory Science offers two qualifications in the scope of medical laboratory technician. These are the Qualified Technical Assistant examination and the Qualified Phlebotomy Technician examination. At 31 March 2005, there were 2,964 registered medical laboratory scientists. Of these, 1,581 were licensed to practise. At 31 March 2005, there were 928 registered medical laboratory technicians, all licensed to practise.
Clinical dental technicians and dental technicians. The Dental Technicians' Board, a workforce board of the Dental Council of New Zealand, controls registration of clinical dental technicians and dental technicians, liaises with educational establishments on training and examination requirements and advises the Minister of Health on any matter relating to the work of clinical dental technicians and dental technicians. The board is constituted under the Health Practitioners Competence Assurance Act 2003. At 31 December 2005, 162 clinical dental technicians (an increase of 28 on the 20 November 2001 figure) and 160 dental technicians (a decrease of 30) were registered and held annual practising certificates. Dental technicians train at the School of Dentistry, University of Otago, where, after completing a three-year training programme, they graduate as a Bachelor in Dental Technology. After obtaining their degree as a dental technician, they are eligible to complete the Postgraduate Diploma in Clinical Dental Technology from the School of Dentistry, University of Otago. Osteopaths. The Osteopathic Council is constituted under the Health Practitioners Competence Assurance Act 2003 and is concerned with registration, conduct and certification of competency of osteopaths. Osteopaths are required to complete a Master of Osteopathy degree from the Auckland University of Technology or successfully complete an Osteopathic Council examination in order to seek registration. There were 360 registered osteopaths at 31 March 2005.
General practice subsidies. Nearly all New Zealanders are enrolled with a general practice that is part of a Primary Health Organisation (PHO). Funding is based on a PHO's population, rather than a payment for each service. General practitioners set their own fees but, where funding has been increased, practices must show they have reduced their charges correspondingly. Cheaper doctors' visits through PHOs have already been rolled out to people aged under 25 and over 65. Funding was expanded to include 45 to 64-year-olds in July 2006, and those aged 25 to 44 in July 2007. The increased funding results in fee reductions (compared with unsubsidised charges) of approximately $25 for those over the age of six, while doctors' visits for children under six continue to be free. Where people receive care outside a PHO, previous subsidies still apply – $35 for children under six; $15 for older children and low income or high use adults; and $20 for low income or high use older children. Immunisation services for children and influenza vaccine for high-need adults are free.
Hospital treatment. Inpatient, outpatient and day treatment in New Zealand public hospitals is free to all people eligible for publicly-funded health services. Services related to public hospital treatment, such as pharmaceuticals and x-rays, are also free, as are inpatient, outpatient and day treatment in public psychiatric hospitals. Mental health services, including pharmaceuticals, are free to day patients or outpatients, including those who are patients of community mental health teams on community treatment orders.
Pharmaceutical benefits. All people eligible for publicly-funded health services are entitled to a wide range of medicines, approved appliances and materials included in the pharmaceutical schedule. These are usually supplied at a small cost. The pharmaceutical schedule is a list of drugs and services subsidised by the government. Special mechanisms ensure people get access to non-schedule drugs in exceptional circumstances. The government sets a standard maximum pharmaceutical charge of $15 an item. People who are enrolled in Access PHOs (primary health organisations in deprived areas) and those under the age of 24 and over 65 are entitled to higher government subsidies on pharmaceuticals. The standard charge for this group is $3 for a prescription item on the pharmaceutical schedule. Individuals or families pay the pharmaceutical charge for the first 20 pharmaceutical items from 1 February each year. Subsequent pharmaceutical needs attract a further subsidy, and non-cardholder families and high-use health cardholders pay a residual charge of $2 an item until the following 1 February. Community services cardholders do not pay a prescription charge until the following 1 February.
Dental services. Routine dental care is free for preschoolers, primary school children and adolescents. Dental therapists provide dental care for preschoolers and primary school children. Dentists under contract to district health boards provide dental care for adolescents. Some public hospitals have dental departments providing services to patients. The government also funds emergency dental treatment for low income earners.
Maternity services. Eligible women in New Zealand receive free pregnancy, childbirth and postnatal care from general practitioners or midwives through benefits paid by the Ministry of Health. Some women choose to receive primary maternity care from a specialist obstetrician and may then be charged above the rate provided by the benefit. If clinical reasons require involvement of a specialist obstetrician, the service is available free from public hospitals. Approximately 96 percent of births take place in hospitals, but midwives may provide care to women who choose to have their babies at home. All maternity hospitals are licensed under the Hospitals Act 1957 and the Ministry of Health is responsible for ensuring regulations regarding buildings, equipment and staff are observed.
Home nursing and home help. Home nursing and home help in New Zealand is free when provided by a registered nurse or midwife employed by a district health board or an approved organisation. Subsidies are available to organisations that provide domestic help in appropriate cases to older people or families with young children. District health boards also provide home aid as part of a range of services to reduce the need for hospital or residential home care, and as a temporary follow up to hospital care.
Environmental support services. Environmental support services include services, equipment and supplies to promote disabled people's independence, maintain their mobility, enable them to remain in their own homes, and to support and maintain their access to education, training and employment. Services include, but are not limited to, hearing aids, wheelchairs, breast prostheses, artificial eyes and wigs. Specific eligibility conditions apply for each type of service and in some cases access may be prioritised. Some items may have part charges.
HealthPAC. HealthPAC (Health Payments, Agreements and Compliance) is a business unit of the Ministry of Health which makes government subsidy payments to health professionals on behalf of the Ministry of Health and district health boards. It also administers contracts between funders and health professionals and monitors payments to ensure taxpayer money is being spent appropriately. Contractual agreements apply to all primary care-based transactions subsidised by the government, such as visits to the doctor, pharmaceutical prescriptions and maternity, immunisation and disability services. HealthPAC handles around $4.3 billion in payments a year, involving around 70 million items. Confidential aggregated payment-related information from HealthPAC is used by the Ministry of Health for health reports and planning.
The Pharmaceutical Management Agency (PHARMAC) is a Crown entity reporting to the Minister of Health whose main role is to manage New Zealand's pharmaceutical schedule – the list of nearly 2,400 subsidised prescription drugs and related products. The schedule, updated monthly, records the price of each drug, the subsidy it receives from public funds and guidelines or conditions under which it is subsidised. In 2004/05, nine new chemicals were added to the schedule, compared with 15 in 2003/04. District health boards spent $565 million on pharmaceuticals (drug cost ex manufacturer) in the year ending 30 June 2005, up $30 million (5.6 percent) on the previous year despite prescription growth over the same period of about 11 percent. This controlled increase reflects PHARMAC's ability to negotiate lower prices, which offsets volume growth and spending on new pharmaceuticals. PHARMAC also promotes optimal use of prescription medicines and manages the purchasing of some pharmaceuticals used in hospitals.
Public health services are generally those provided to populations rather than to individuals, or those provided to individuals who require population-wide planning, such as population-based screening and development of an immunisation register.
Public health supports a population health approach which takes into account all factors which determine health, and systematically plans how these will be tackled and how inequalities can be reduced.
Public health services account for 1.9 percent of health services funded through Vote: Health.
The Public Health Directorate of the Ministry of Health is responsible for providing policy and strategic advice on public health issues and services, for monitoring the state of health of the population, for developing and enforcing public health legislation, for developing public health strategies and for planning and funding public health services.
Twelve public health units based in district health boards (DHB) provide health promotion, health protection and disease prevention services to all 21 DHB districts.
Public health activities are also carried out by local authorities, who have a role in improvement, promotion and protection of public health and are charged with developing long-term plans, with a focus on community public health.
Around 200 non-government providers also provide complementary public health services at national, regional and local level.
Safe drinking water is an essential prerequisite for public health. If a community's drinking water supply becomes contaminated by pathogenic organisms, a large number of people can be infected quickly and this can lead to the spread of infectious diseases in pandemic proportions.
Chemical contamination of drinking water also has to be guarded against. Although direct health risks are lower than for contamination by pathogens, public concern about chemical contamination is often high.
The Ministry of Health informs the public about the safety of both public and privately-owned community drinking water supplies by way of a grading system. Grades given for water source and water treatment range from A1 (completely satisfactory) to E (completely unsatisfactory).
Gradings are determined by the extent to which the supply complies with drinking water standards and whether adequate barriers to contamination are in place. The water supply distribution system (pipes, reservoirs etc) is graded similarly.
The Register of Community Drinking Water Supplies in New Zealand lists all community drinking water supplies – those which serve 25 or more people for 60 or more days a year- known to the Ministry of Health. The register also lists public health gradings and whether any chemical contaminants are present at concentrations that could potentially be of public health significance.
The 2004 register covered 2,013 community drinking water supplies. Grades awarded varied greatly, with Auckland's drinking water given an A grade, Wellington's between A and C, Christchurch's B and Dunedin's between B and E.
A wide range of drugs capable of being misused, including illegal and prescription drugs, are controlled by the Misuse of Drugs Act 1975, the Misuse of Drugs Regulations 1977 and associated legislation.
It is an offence to obtain, manufacture, possess, consume, supply, or offer to supply controlled drugs unless authorised under the act. Illegal dealing in any class of controlled drug is subject to penalties varying from imprisonment to fines.
Controlled drugs are divided into three classes. Heavier penalties are provided for offences involving Class A drugs, such as heroin, cocaine and methamphetamine. Classes B and C contain many drugs legitimately used for medical and scientific purposes, such as morphine and pethidine. Cannabis plants, fruit and seeds are included in Class C. Substances manufactured from cannabis plants are classified B.
Rapid emergence of potentially dangerous ‘designer’ drugs necessitated a quicker way to control these drugs. In 2000, parliament amended the Misuse of Drugs Act 1975 to create a more rapid and evidence-based process of classifying drugs. The amendment clarified the basis of drug classification to relate to risk of harm to individuals and society arising from the drug. The risks range from Class A (very high) and Class B (high) to Class C (moderate risk). An expert advisory committee has been established to assess the relative risk of various drugs and to make classification recommendations to the Minister of Health.
The government reclassified methamphetamine as a Class A drug in 2002, giving police and customs officers more effective tools to deal with suppliers, manufacturers and importers. In 2003, the government announced a methamphetamine action plan designed to build resilience in at-risk communities, improve treatment options and develop community action programmes to deal with methamphetamine-related issues.
In 2005, a new Class D (low risk) was added to the act to allow for control of ‘restricted substances’. Benzylpiperazine (BZP) has been added as a restricted substance and its sale and supply limited to those over the age of 18. There are also advertising and promotion restrictions. Penalties associated with breaches of restricted substances legislation include fines and confiscation of substances and equipment.
National Drug Policy. The National Drug Policy (NDP) is a comprehensive strategy to minimise all legal and illegal drug-related harm. The NDP is a cohesive policy framework, coordinating initiatives of relevant government agencies under a three-pronged approach, including:
Supply control (limiting availability of drugs through, for instance, law enforcement).
Demand reduction (reducing the desire to use drugs through, for example, education programmes).
Problem limitation (mitigating harm already occurring from drugs through treatment services).
The NDP, led by the Ministry of Health, provides a basis for priority setting, intersectoral decision making and strategic alignment. The National Drug Policy website is www.ndp.govt.nz
National Drug Intelligence Bureau. To further assist in deterring drug abuse, the Ministry of Health, the New Zealand Customs Service and the New Zealand Police have maintained the National Drug Intelligence Bureau since 1972.
Alcohol is a feature of New Zealand life. For many, it is a symbol of hospitality and is used on occasions to celebrate important events in people's lives.
When alcohol is misused, however, the resulting harm can be considerable. Alcohol abuse can lead to physical and mental health problems, injury and death on the roads, drownings, violence, fetal abnormalities, absenteeism and impaired work performance.
Figure 8.01 shows alcohol consumed in New Zealand from 1990 to 2005.
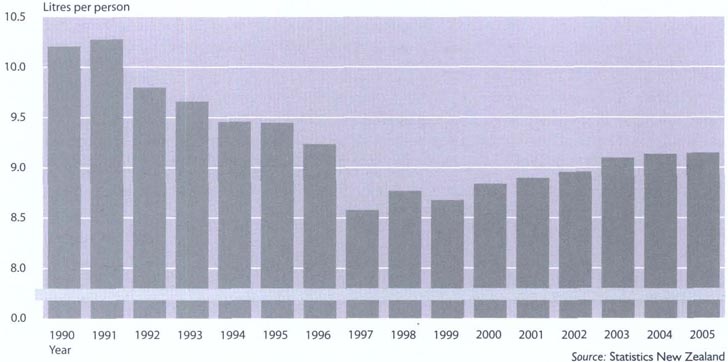
Land Transport Safety Authority figures indicate that alcohol was a contributing factor in about 31 percent of fatal road accidents and 12 percent of injury accidents in 2004. In annual terms, the social cost of alcohol misuse in New Zealand has been estimated at between $1.5 billion and $2.4 billion.
The most recent New Zealand Health Survey reported that one in six adults who had consumed alcohol in the previous year had a potentially hazardous drinking pattern. Māori and Pacific peoples were more likely to have potentially hazardous drinking patterns than other groups, and young people who drank were also likely to have hazardous drinking patterns, such as binge drinking. Thirty-six percent of those aged 14–17 reported they had five or more glasses on their last drinking occasion.
The Alcohol Advisory Council of New Zealand (ALAC) promotes moderation in the use of alcohol and develops and promotes strategies aimed at reducing alcohol-related problems. To help address alcohol-related harm, ALAC has begun a programme that aims to change New Zealand's drinking culture from one that accepts high per occasion consumption and intoxication as social norms to one that does not. The programme involves a media campaign, supported by a range of other activities in the supply-control, demand-reduction and problem-limitation areas.
Alcohol and other drug issues are one of the priority areas for action identified in the New Zealand Health Strategy. Alcohol is one of the substances covered by the National Drug Policy, which aims to minimise harm from alcohol, tobacco and other drugs.
Smoking is the greatest single preventable cause of premature death in New Zealand. Each year about 4,700 New Zealanders die from cancers, cardiovascular disease, chronic obstructive pulmonary disease and other diseases caused by smoking.
There is also considerable evidence of harm to adults and children from exposure to second-hand smoke in homes, workplaces and enclosed public places.
Smokers who die from tobacco-related causes lose, on average, 13 years of life compared with non-smokers.
From 1999 to 2004, tobacco smoking decreased slightly, from 25.5 percent to 23.4 percent of the population aged 15 and over. This was lower than the 1990 smoking level of 28 percent and maintained a trend of decreasing smoking since 1983, when smoking prevalence was 33 percent.
Increases in the prevalence of smoking by secondary school students in the 1990s have been reversed, with a strong downward trend apparent between 1999 and 2004 for both males and females.
There is a continuing high prevalence of smoking among adult Māori, with 47 percent of the adult population in 2004 smokers.
Tobacco consumption per adult (15 years and over) continues to track downwards, from 1,971 cigarettes per adult in 1990 to 999 cigarettes per adult in 2004.
Figure 8.02 shows tobacco consumption per person in New Zealand in the years 1974 to 2004.
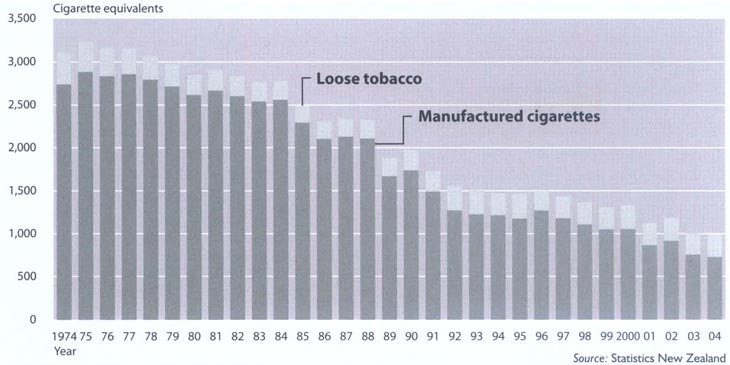
The successes of New Zealand's smoking cessation programme have been achieved through a mix of tobacco legislation, taxation, health promotion and cessation support.
An amendment to the Smoke-free Environments Act 1990, which reduced exposure to environmental tobacco smoke by extending the scope of smoke-free workplaces to include bars, restaurants, cafes and clubs, took effect during 2004. The amendments also restricted further access by minors to tobacco products and placed restrictions on display of tobacco products at point of sale.
Table 8.02. Recommended immunisation schedule from 1 February 2006
| Age | Vaccine |
|---|---|
1Diphtheria, tetanus, whooping cough (acellular pertussis) and inactivated poliovirus vaccine. 2Haemophilus influenzae type b and hepatitis B vaccine. 3Meningococcal B vaccine. 4Haemophilus influenzae type b vaccine. 5Measles, mumps, rubella vaccine. 6Adult-type tetanus-diphtheria, acellular pertussis and inactivated poliovirus vaccine. 7Adult-type tetanus-diphtheria vaccine. 8Influenza vaccine is also funded for persons of all ages with certain chronic medical conditions. Note:Infants who receive their third meningococcal B dose between five to six months of age, have the fourth at a minimum of 10 months of age. Infants who receive their third dose after six months of age or older have the fourth dose at a minimum of four months after the third dose. In addition, hepatitis B vaccine and hepatitis B immunoglobulin is given at birth to babies of a mother who is a carrier of hepatitis B, and BCG is offered to babies who will be living in households where there are recent immigrants from high risk countries or persons with current or past history of tuberculosis. Rubella vaccine or MMR is available for susceptible women. Source: Ministry of Health | |
| 6 weeks | DTaP-IPV1 Hib-Hepatitis B2, MeNZB3 |
| 3 months | DTaP-IPV, Hib-Hepatitis B |
| 5 months | DTaP-IPV, Hepatitis B, MeNZB |
| 10 months | MeNZB |
| 15 months | Hib4, MMR5 |
| 4 years | DTaP-IPV, MMR |
| 11 years | dTAP-IPV6 |
| 45 years | Td7 |
| 65 years | Td, annual influenza vaccine8 |
Medical practitioners are required under the Health Act 1956 to notify medical officers of health of cases of notifiable diseases they suspect or diagnose.
Notification data is recorded on a computerised database in each public health service and is used to guide local control measures. The data is, in turn, collated and analysed at national level by the Institute of Environmental Science and Research on behalf of the Ministry of Health.
The Ministry of Health monitors the prevalence of communicable diseases, manages national coordination of responses to disease outbreaks, and is responsible for the national immunisation schedule and the control of communicable diseases through designated officers.
The ministry is also responsible for policy development, promulgation of regulations and fulfilment of international disease reporting requirements.
National Immunisation Register. Roll-out of the National Immunisation Register (NIR) was a key feature of the National Immunisation Programme during 2005. The NIR was first launched in July 2004 in Counties Manukau to support the meningococcal B immunisation programme. During 2005, the NIR became operational across all 21 district health boards for the immunisation programme for both primary care and school-based components. At the beginning of 2006, more than 2.9 million vaccinations had been recorded on the NIR, with more than 1.9 million of these being from the school-based campaign. The second phase of development of the NIR, and its primary purpose, is to support delivery of the national immunisation schedule for all newborn children. This component of the NIR has also been rolled out across all district health boards. All children born in New Zealand after 5 December 2005 can be enrolled on the NIR and as of 23 December 2005, 21,522 children were enrolled, with 12,759 having received their six-week immunisations. Table 8.02 shows the immunisation schedule recommended from 1 February 2006.
The New Zealand Food Safety Authority (NZFSA) is New Zealand's ‘competent authority’ (recognised by our trading partners) for the import and export of food and food-related products.
It also administers legislation covering food manufactured and sold on the domestic market (both local and imported); primary production and processing of animal products and official assurances related to their export; export of plant products; and controls surrounding registration and use of agricultural compounds and veterinary medicines.
The authority's market access activities focus on negotiating conditions and certification requirements with ‘competent authorities’ of countries importing New Zealand's animal and plant products. This includes managing bilateral agreements, trading partner relationships and equivalency negotiations.
NZFSA works to secure market access at various levels. At a multilateral level, it works with international bodies such as the World Organisation for Animal Health and the International Plant Protection Convention. These are multinational groups of the World Trade Organisation that review international standards for trade in food and other agricultural products. NZFSA's role is to ensure that rules are science and risk-based and reflect New Zealand's needs.
Under the Food Act 1981, the NZFSA is responsible for development of food safety standards and for ensuring labelling and composition standards developed for both Australia and New Zealand by Food Standards Australia and New Zealand meet New Zealand's needs. The act and its amendments require food for sale not to be labelled or advertised in a misleading manner. It provides for composition. labelling and safe food processing and handling.
NZFSA is responsible for compliance and enforcement of food legislation and for investigation of food complaints, while the Ministry of Health manages communicable disease, including identification of foodborne illness events. Health protection officers, Food Act officers and medical officers of health all have complementary roles in these areas.
Dietary supplements are regulated as foods under the Dietary Supplements Regulations 1985. The regulations define dietary supplements, state maximum daily doses for some nutrients and list food additive permissions and labelling requirements. As with other foods, it is the manufacturer/ importer's responsibility to ensure their products are safe and comply with legal requirements. Dietary supplements may not be sold for therapeutic purposes. While most dietary supplements are sold as capsules, pills or in powder form, some are sold in food form.
The New Zealand Food Safety Authority's website is www.nzfsa.govt.nz
Cancer is a major health issue for New Zealanders. About 16,000 people develop cancer each year, excluding basal and squamous cancers of the skin, and about 7,500 die from the disease. One in three New Zealanders will have some experience of cancer, either personally or through a relative or friend.
Reducing the incidence and impact of cancer is one of 13 population health objectives in the New Zealand Health Strategy.
The cancer control programme is an organised approach to reducing the community burden of cancer through prevention, screening and early detection, treatment, support and rehabilitation, and palliative care. The New Zealand Cancer Control Strategy was developed in partnership with the non-government sector, represented by the New Zealand Cancer Control Trust. The strategy was completed in August 2003.
The strategy encompasses the following goals:
Reduce the incidence of cancer through primary prevention.
Ensure effective screening and early detection to reduce incidence and mortality.
Ensure effective diagnosis and treatment to reduce morbidity and mortality.
Improve the quality of life for those with cancer, their family and whānau through support, rehabilitation and palliative care.
Improve delivery of services across the continuum of cancer control through effective planning, coordination and integration of resources and activity, monitoring and evaluation.
Improve effectiveness of cancer control in New Zealand through research and surveillance.
The Cancer Control Action Plan was launched in March 2005 and the Minister of Health has since appointed a Cancer Control Council to monitor implementation of the plan.
Most older people are fit and well and live independent lives. However, with advancing age, older people become increasingly high users of health and disability support services, such as home support and residential care.
People are now entering residential care later and with a higher level of dependency than in the past. The average age of entry to aged residential care is 82.3 years.
In terms of government expenditure, the most significant services used specifically by older people are residential care; home-based support; assessment, treatment and rehabilitation; environmental support; and carer support.
District health boards (DHBs) are responsible for planning and funding health and disability services for older people, except for environmental support services, which are funded by the Ministry of Health.
In the 2004/05 financial year, approximately 28,000 people received aged residential care funded to a greater or lesser extent by DHBs, at a cost of approximately $524 million, excluding GST. This did not include contributions made by residents.
Government expenditure on aged residential care increased by approximately $222 million between 1996/97 and 2003/04, representing a 6.19 percent compounding annual growth rate (not adjusted for inflation) over the period.
Approximately $109.21 million was spent by DHBs on home-based support services for older people in the 2004/05 financial year. DHBs also spent $110 million on assessment, treatment and rehabilitation services, $28 million on carer support and $6 million on respite care
The Health of Older People Strategy released in 2002 provides a framework for future service development for older people. Key directions in the strategy are an integrated approach to service planning and provision, and a greater emphasis on community-based services to support older people to ‘age in place’ (remain at home with a good quality of life).
Community-based support packages that enable people to remain at home are being evaluated in Hamilton, Hutt Valley/Horowhenua and Christchurch. Results of the evaluation, due in 2006, will provide DHBs with information on the effectiveness of these types of community packages relative to conventional care.
Legislative changes to the income and asset-testing regime for long-term residential care came into force on 1 July 2005. The new legislation enacted the government's commitment to progressively remove asset testing for older people assessed as requiring residential care indefinitely, while ensuring access to long-term care is equitable and fair.
Voluntary welfare organisations make valuable contributions to aspects of public health. Vote: Health, through a variety of contracts and other agreements, funds a wide range of independent service providers and related organisations, including, among others, the Royal New Zealand Plunket Society, the New Zealand Family Planning Association and the New Zealand AIDS Foundation.
The Ministry of Health has responsibility for leading implementation of the National Mental Health Strategy contained in Looking Forward (1994) and Moving Forward (1997) and the government's most recent policy direction for mental health and addiction, Te Tāhuhu – Improving Mental Health 2005–2015: The Second New Zealand Mental Health and Addiction Plan released in June 2005.
Implementation of the strategy has been supported by a growth in public funding, from $465 million (GST excl) in 1997/98 to $863 million (GST excl) in 2004/05. Growth in funding has been accompanied by a significant growth in services, 69 percent of which are community based, with the rest inpatient.
Services provided by non-government organisations receive 28 percent of funding for community-based services.
New Zealand's 21 district health boards have responsibility for planning, funding and ensuring provision of mental health and addiction services.
Te Tāhuhu – Improving Mental Health sets out government policy and priorities for mental health and addiction for the 10 years to 2015, and provides an overall direction for investment in mental health and addiction. Based on an outcomes framework, it broadens the government's interest in the mental health of all New Zealanders, while continuing to place an emphasis on those most severely affected by mental illness and addiction. It covers the spectrum of interventions, from promotion and prevention, to primary care and specialist services.
Te Puāwaitanga (2002) is the Māori Mental Health National Strategic Framework developed to assist and provide detailed guidance for the mental health sector and district health boards on the planning and delivery of services for Māori, recognising the importance of cultural identity as an essential component of mental health care.
Building on Strengths (2002) outlines a national approach to mental health promotion, with the aim of providing education and guidance on mental health promotion, along with planned priority actions for promotional activities.
The Like Minds, Like Mine project continues to focus on destigmatising mental illness and improving the social environment for people with serious mental illness.
Suicidal behaviour is a significant and preventable public health issue in New Zealand. It is a major cause of death and injury and a significant contributor to social and health costs. In 2004, the total cost (economic and non-economic) of suicide and attempted suicide was estimated at $1.6 billion.
In 2003, 515 people died by suicide. The age-standardised suicide rate was 11.5 deaths per 100,000 population. The hospitalisation rate for intentional self-harm in 2002/03 was 131.5 per 100,000 population (5,292 hospitalisations). Hospitalisation for intentional self-harm is an internationally recognised proxy measure for attempted suicide.
Females consistently have a lower rate of suicide than males (6.2 compared with 16.9 per 100,000 population respectively in 2003). However, females have a higher rate of hospitalisation for intentional self-harm than males (178.6 compared with 84.2 per 100,000).
In 1998, the New Zealand Youth Suicide Prevention Strategy was published as a response to New Zealand's high youth suicide rate. However, in recognition of the need to address suicidal behaviour across all age groups, New Zealand is now moving to an all-age approach to suicide prevention.
A draft all-age New Zealand Suicide Prevention Strategy was released for public consultation in May 2005. The strategy is being revised and was expected to be finalised by the middle of 2006. The strategy takes a comprehensive and intersectoral approach to suicide prevention, incorporating both public health and mental health perspectives.
The Ministry of Health's suicide prevention website is www.moh.govt.nz/suicideprevention
The Ministry of Health is responsible for the policy and planning of disability support services, and directly funds disability support services for people with long-term physical, intellectual and sensory disabilities (mostly people under 65 years).
District health boards (DHBs) fund support services for older people with disabilities, those considered ‘close in interest’ to people 65 and over, and people with psychiatric disabilities. DHBs are also responsible for planning and funding health services to people of all ages with disabilities.
To access disability support services, a person must be assessed as having either a physical, intellectual, sensory, psychiatric or age-related disability, or a combination of these, where the disability is likely to continue for a minimum of six months and result in reduction of independent function to the extent that ongoing support is required.
Disability support services aim to promote and maximise the independence of people with disabilities, and provide rehabilitation and support opportunities for people to participate as fully as possible in their community.
Disability support services include:
Home-based support services, such as personal care and home help.
Carer support services, such as respite care and caregiver and family support programmes.
Environmental support services, such as equipment, communication/hearing aids, grants for vehicle purchase and modifications, housing modifications, and subsidised items, such as breast prostheses.
Residential care.
Day services.
Habilitation and rehabilitation, such as deafness and blindness services.
Support services are provided through a variety of voluntary organisations, private businesses such as rest homes, and district health boards, with most services community based.
While the Ministry of Health and district health boards are significant funders of disability support services, other funding agencies include the Ministry of Education, the Accident Compensation Corporation and Work and Income. Although support services are largely funded from taxation revenue, consumers may be required to pay part charges for some services.
In 2004/05, Ministry of Health expenditure on disability support services was approximately $708 million (GST inclusive). About 43 percent of this expenditure was spent on community residential care. The other key areas of expenditure were environmental support services (10 percent), home support (9 percent), high and complex services (7 percent), caregiver support (5 percent), assessment, treatment and rehabilitation (3 percent) and respite care (2 percent).
The health of families in New Zealand is promoted cooperatively by the Ministry of Health, district health boards, government departments, voluntary agencies, hospital and health services and health professionals.
The government has declared its commitment to development of a comprehensive sexual and reproductive health strategy, including HIV/AIDS prevention and control.
Nearly all sexually transmissible infections (STIs) reported on in New Zealand have increased in recent years. Some, such as chlamydia, gonorrhoea and genital warts, are associated with severe, long-term effects, such as infertility, ectopic pregnancy and cancer. Others, including syphilis, genital herpes and gonorrhoea, can facilitate the spread of HIV infection.
In 2001, phase one of the Sexual and Reproductive Health Strategy was released. It provides the overall vision, principles, obligations, strategic context and strategic directions for achieving good sexual and reproductive health for all New Zealanders. It highlights the need to increase knowledge about safer sex and to provide information on sexual health, the risk of STIs and HIV, prevention, early diagnosis and treatment.
Several national health indicators have improved for Māori in recent years, including increases in life expectancy and significant decreases in rates of sudden infant death syndrome, cervical cancer and rheumatic fever.
Māori still face poor health outcomes, however, and on average die eight to nine years earlier than non-Māori.
While access to health services plays a role, health of individuals is generally determined by socioeconomic status, such as employment, housing and education. Behavioural and biological risks are also believed to play a part.
The task of improving Māori health means not only addressing issues of access to effective health services, but also working on underlying social and economic conditions that impact on health.
The government and the Ministry of Health have encouraged Māori to participate in providing their own health services, and at the beginning of 2006 there were about 230 providers helping to make services more accessible and culturally appropriate for Māori.
Priority areas identified for Māori health include those outlined in the New Zealand Health Strategy, such as reducing cardiovascular disease and reducing cancers. Specific Māori issues have been identified as immunisation, child hearing, smoking cessation, diabetes, asthma, oral health, mental health, injury prevention, sexual and reproductive health, youth health, and disability services.
The Ministry of Health provides policy advice on a range of issues of particular relevance to women. These include contraception, sexual and reproductive health, infertility, pregnancy and childbirth, abortion services and breast and cervical cancer screening.
Women's health services are provided by district health boards, health professionals and a large number of community and consumer groups.
Cervical screening. International evidence suggests morbidity and mortality from invasive cervical cancer can be reduced with an organised screening programme aimed at detecting and treating pre-cancerous changes to the cervix. New Zealand's National Cervical Screening Programme was established in 1990 and is targeted at women aged 20–69. Women are encouraged to have a cervical smear test every three years. Since introduction of the programme in 1990, New Zealand has seen a reduction in incidence of cervical cancer by approximately 40 percent and a decline in mortality rates of 60 percent.
Breast screening. Established in 1998, the BreastScreen Aotearoa (BSA) programme provides two-yearly mammographic screening and follow-up assessment and treatment services to asymptomatic women. In July 2004, the programme was extended to include women aged 45–49 and 65–69. By the end of August 2005, BSA had screened 163,878 women in 14 months, an increase of 23.4 percent on the number of women screened in the 14 months ending 31 August 2004. Breast cancer is the leading cause of cancer deaths in New Zealand women. Between 1998 and July 2005, BSA detected breast cancer in 4,228 women.
The Ministry of Health's Child Health Strategy continues to provide direction to the health and disability sector on overall improvement in child health and disability outcomes. The strategy recognises that improving child health and disability outcomes requires a comprehensive approach involving:
Greater focus on health promotion.
Disease prevention and early intervention.
Better coordination of resources.
Development of a national Child Health Information Strategy.
Child health workforce development.
Improved child health research and evaluation.
Leadership in child health.
The strategy emphasises the need to reduce inequalities in health and disability outcomes by focusing on Māori children, Pacific children, children whose families experience multiple social and economic disadvantages, and children with high health and disability support needs.
District health boards and the Ministry of Health purchase a comprehensive range of health services, including high quality secondary and tertiary pediatric services, primary care and well-child services that focus on disease prevention and health promotion.
Boards are developing strategies incorporating local concerns and demographics.
New Zealand also has a comprehensive and free well-child service which includes newborn screening; developmental, vision and hearing screening for children aged 0–4; and immunisation. Well-child services for this age group are provided by a range of providers, including hospitals, Plunket and Māori and Pacific providers. The service recommends examination by family doctors at about six weeks of age and whenever there is anxiety over acute or chronic illness or development.
Infant mortality was 5.6 deaths per 1,000 live births in 2004, continuing the reduction that began in the early 1990s following release of the New Zealand Cot Death Study.
Figure 8.03 shows the downward trend in infant mortality rates since 1983.
Youth Health Action Plan. A Youth Health Action Plan was published in 2002 following extensive consultation with the health, social services and education professions and young people. The plan identifies the need to improve young people's mental and physical health, with special reference to Māori and Pacific youth and those with disabilities and chronic illness. Participation by young people in development of policy, programmes and the running of health services was emphasised.
New Zealand's dental health services combine a school dental service for children, publicly-funded dental services for adolescents and private practice services for adults.
Major hospitals also provide dental services for in-patient and other special groups.
Emergency dental care for low-income adults is provided by some hospital dental services, by contracts with private dentists in some district health boards and by Work and Income support to eligible people.
School dental service. The school dental service works to maintain a high standard of dental health for preschool and school children, up to the highest class at primary or intermediate school. Dental therapists provide children with routine dental care. Care includes examination, disease prevention measures, fillings, extraction of primary (‘baby’) teeth and dental health education. Some children are referred to dentists for care beyond the scope of dental therapists. The school dental service is funded by district health boards. Treatment requiring a general anaesthetic is performed at a hospital. Orthodontic treatment and some other specialist services can be obtained privately only.
Dental services for teenagers. People up to the age of 18 can access free basic and restorative dental care from dentists.
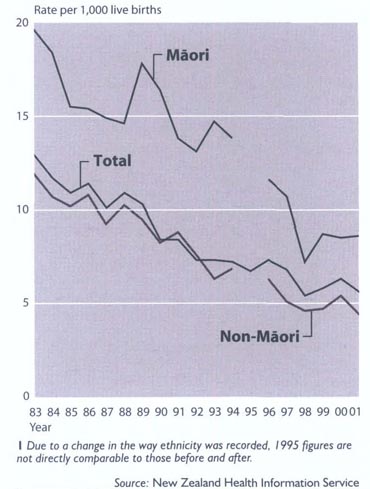
Dental research. The bulk of dental research in New Zealand is undertaken by the School of Dentistry at the University of Otago. Health Research Council-funded dental research is undertaken by a number of investigators.
Fluoridation. More than 60 percent of New Zealanders on reticulated water supplies live in areas with fluoridated water. Water fluoridation is a proven public health measure to reduce dental decay. The benefit of fluoridation in preventing dental decay is greatest for those in low socio-economic groups, for Māori and for children. In 2004, 59 percent of five-year-olds living in fluoridated areas showed no dental decay. By contrast, only 45 percent of five-year-olds in non-fluoridated areas were free of decay.
In the year ending 30 June 2005, there were 545,720 inpatient and day case medical and surgical discharges from publicly-funded district health board hospitals in New Zealand.
This number does not include directly-purchased Accident Compensation Corporation elective cases and maternity cases.
At 30 June 2005, 19,757 people aged 65 and over were receiving full or partial age-related subsidies from district health boards for rest homes or continuing care hospitals.
During the month of May 2005, the Ministry of Health was funding care in community homes for approximately 6,472 people with intellectual and physical disabilities.
Most people who attend a hospital are ‘ambulatory’ (not confined to a bed) and do not require constant hospital care. These people receive treatment in outpatient and community settings.
In the year ending 30 June 2004, 480,517 people attended a specialist medical or surgical clinic at a hospital for diagnosis, treatment and pre and post-operative care, typically on two or more occasions.
In the same year, health professionals assessed, treated and rehabilitated approximately 400,000 people in clinical and home-based settings; 66,134 people attended educational programmes for diabetes and cardiac conditions; 2,182 people received dialysis treatment; and 14,785 people received specialist outpatient dental treatment.
In the year ending 30 June 2003,425,367 people attended a hospital emergency department for treatment and 47,715 patients received 201,445 chemotherapy and radiotherapy treatments for cancer.
Table 8.03 shows outpatient services utilised during 2003 and 2004.
Table 8.03. Hospital-based outpatient and community services
| Clients1 | Events | |||
|---|---|---|---|---|
| 2002/03 | 2003/04 | 2002/03 | 2003/04 | |
Ssuppressed because of poor statistical quality. 1Accuracy of client counts is limited by the accuracy of health care user identification (National Health Index). 2Treatment by allied health professionals relates to treatment by professionals such as dietitians and physiotherapists. It excludes treatment in support of inpatient and other outpatient events. 3Community services provided by hospitals include district nursing and school dental services. Services are also provided as part of a rehabilitation service as an alternative to inpatient or outpatient care. 4Blood products includes blood transfusions and blood products such as Factor VIII. It excludes transfusions occurring as part of inpatient or other outpatient attendances. 5Scopes are minor diagnostic procedures performed on a day-patient or outpatient basis. This excludes scopes performed as part of an inpatient stay. 6Spinal procedures are inpatient events that are recorded here because they are excluded from the National Minimum Data Set. ...not applicable Source: Ministry of Health | ||||
| Allied health2 | 133,701 | 159,635 | 518,157 | 527,849 |
| Community events (client based)3 | 222,764 | 233,604 | ... | ... |
| Community events (event based) | 2,902 | 2,923 | 45,423 | 45,752 |
| Blood products4 | 2,130 | 3,297 | 3,396,656 | 3,485,665 |
| Chemotherapy | 5,286 | 5,976 | 47,248 | 51,362 |
| Outpatient dental | 15,936 | 14,785 | 41,024 | 40,279 |
| Diagnostic tests | 223,503 | 251,067 | S | S |
| Dialysis | 2,125 | 2,182 | S | S |
| Emergency department events | 425,367 | S | 788,097 | 844,023 |
| Education-related programmes | 54,535 | 66,134 | 91,133 | 129,928 |
| Radiotherapy | 42,429 | S | 154,197 | 205,672 |
| Scopes5 | 50,580 | 58,554 | 77,616 | 75,369 |
| Spinal procedures6 | 401 | 352 | 500 | 415 |
| Other procedures and therapies | 35,039 | 42,301 | 94,091 | 98,109 |
| Medical specialist (first assessment) | 112,514 | 132,765 | 182,456 | 189,228 |
| Medical specialist (subsequent assessment) | 194,306 | 197,632 | 553,598 | 500,287 |
| Surgical specialist (first assessment) | 196,685 | 223,161 | 268,491 | 268,178 |
| Surgical specialist (subsequent assessment) | 251,271 | 282,885 | 596,332 | 577,758 |
| Total first assessments | 309,200 | 355,926 | 450,947 | 457,406 |
| Total subsequent assessments | 445,577 | 480,517 | 1,149,930 | 1,078,046 |
| Total assessments | 754,777 | 836,443 | 1,600,877 | 1,535,452 |
Length of stay in public hospitals. People are spending less time in hospital for medical and surgical treatment than previously. The average length of stay in hospitals fell by 50 percent to 3.2 days in the decade to 30 June 2004. Shorter hospital stays are the result of advances in medical technology, such as new medical treatments and more effective drugs; improved community and follow-up care; and more effective hospital administration.
Mental health services. Specialist teams provide mental health services in the community, backed up where necessary by inpatient care. Table 8.04 shows numbers seen by the various mental health teams in the year ending 30 June 2005, while Table 8.05 shows numbers seen by district health board mental health services in the year ending 30 June 2004.
Table 8.04. Clients seen by mental health teams
Year ending 30 June 2005
| Team type | Clients seen1 | Bed nights | Average bed nights |
|---|---|---|---|
1Clients may be seen by more than one team type. Source: Ministry of Health | |||
| Community | 48,994 | 6,417 | 0.1 |
| Alcohol and drug | 17,664 | 14,400 | 0.8 |
| Child, adolescent and family | 14,441 | 6,700 | 0.5 |
| Inpatient | 8,307 | 271,840 | 32.7 |
| Psychogeriatric | 5,938 | 18,443 | 3.1 |
| Forensic | 3,616 | 50,723 | 14 |
| Kaupapa Māori | 3,592 | 184 | 0.1 |
| Residential | 1,573 | 169,105 | 107.5 |
| Other | 13,796 | 21,211 | 1.5 |
| Total | 89,488 | 559,023 | 6.2 |
Table 8.05. Clients seen by district health board mental health (including alcohol
and drug) services1,2
By age
group
Year ending 30 June
2004
| 0–9 | 10–19 | 20–29 | 30–39 | 40–49 | 50–59 | 60–69 | 70–79 | 80+ | Total | |
|---|---|---|---|---|---|---|---|---|---|---|
1Excludes data from non-government organisations. 2Clients are counted only once in any one month regardless of the number of contacts with a mental health service. Source: New Zealand Health Information Service | ||||||||||
| Male | 2,533 | 8,706 | 8,123 | 9,693 | 7,782 | 3,939 | 1,754 | 1,344 | 1,048 | 44,922 |
| Female | 1,066 | 6,989 | 6,988 | 9,568 | 7,538 | 4,259 | 2,313 | 1,864 | 2,154 | 42,739 |
| Total | 3,599 | 15,694 | 15,112 | 19,261 | 15,320 | 8,198 | 4,067 | 3,208 | 3,202 | 87,661 |
Malignant neoplasms (cancer), ischaemic heart disease and cerebrovascular disease were the leading causes of death in New Zealand in the year ending 30 June 2001, the most recent year for which statistics are available. Collectively, they accounted for 63.4 percent of all deaths.
Cancer was the cause of 29.2 percent of deaths, ischaemic heart disease 23.8 percent and cerebrovascular disease 10.4 percent.
Table 8.06 lists the major causes of death in New Zealand in 2000 and 2001.
Table 8.06. Major causes of death
2000–011
| Cause of death | Number of deaths | Crude rate per million of mean population | ||
|---|---|---|---|---|
| 2000 | 2001 | 2000 | 2001 | |
1Due to changes in the international classification system used to record the causes of death, these figures are not comparable with previous years Source: New Zealand Health Information Service | ||||
| Malignant neoplasms | 7,620 | 7,810 | 1,988 | 2,010 |
| Diabetes mellitus | 802 | 782 | 209 | 201 |
| Chronic rheumatic heart diseases | 171 | 141 | 45 | 36 |
| Hypertensive diseases | 219 | 231 | 57 | 59 |
| Ischaemic heart diseases | 5,973 | 6,371 | 1,558 | 1,639 |
| Other forms of heart disease | 1,243 | 1,245 | 324 | 320 |
| Cerebrovascular diseases | 2,668 | 2,784 | 696 | 716 |
| Diseases of arteries, arterioles and capillaries | 552 | 596 | 144 | 153 |
| Influenza and pneumonia | 347 | 412 | 91 | 106 |
| Bronchitis, emphysema and asthma | 171 | 197 | 45 | 51 |
| Other diseases of respiratory system | 1,535 | 1,822 | 400 | 469 |
| Diseases of the liver | 129 | 130 | 34 | 33 |
| Peptic ulcer | 108 | 80 | 28 | 21 |
| Congenital anomalies | 191 | 166 | 50 | 43 |
| Conditions of peri natality mortality | 152 | 129 | 40 | 33 |
| Transport accidents | 573 | 538 | 149 | 138 |
| Intentional self-harm | 458 | 507 | 119 | 130 |
| Other injury and poisoning | 582 | 608 | 152 | 156 |
| All other diseases | 3,229 | 3,585 | 842 | 923 |
| Total | 26,723 | 28,134 | 6,972 | 7,240 |
In 2001, 95.2 percent of cancer deaths occurred at age 45 and over, with 70.9 percent occurring at 65 years and over. Table 8.07 compares male and female deaths from malignant cancer.
Table 8.07. Deaths from malignant cancer
Year
ending 31 December 2001
| Age group | Number | Males | Number | Females | ||
|---|---|---|---|---|---|---|
| Rate per 100,000 of population at ages given | Percentage of total deaths at ages given | Rate per 100,000 of population at ages given | Percentage of total deaths at ages given | |||
Source: New Zealand Health Information Service | ||||||
| Under 5 | 6 | 4.2 | 0.1 | 6 | 4.4 | 0.2 |
| 5–14 | 13 | 4.2 | 0.3 | 14 | 4.8 | 0.4 |
| 15–24 | 26 | 9.6 | 0.6 | 16 | 6.1 | 0.4 |
| 25–44 | 121 | 21.6 | 2.9 | 174 | 29.2 | 4.8 |
| 45–64 | 948 | 223.3 | 22.8 | 951 | 219.5 | 26.1 |
| 65 and over | 3,052 | 1,515.0 | 73.3 | 2,483 | 958.5 | 68.1 |
| Total | 4,166 | 218.6 | 100.0 | 3,644 | 184.0 | 100.0 |
| Totals in 2000 | 4,120 | 218.2 | 100.0 | 3,500 | 180.0 | 100.0 |
Perinatal deaths. The term perinatal deaths covers fetal deaths of 20 or more weeks gestation, or 400 grams birthweight, and infant deaths within 168 hours of birth (early neonatal deaths).
Late neonatal death. A late neonatal death occurs when a liveborn infant dies after seven days and before 28 completed days after birth.
Post-neonatal death. A post-neonatal death is when a liveborn infant dies after 28 completed days and before the first year of life is completed.
Infant death. An infant death is the death of a liveborn infant before the first year of life is completed.
Table 8.08 shows fetal and infant mortality rates in New Zealand by ethnicity.
Table 8.08. Fetal and infant mortality rates1
By ethnicity
Year ending 31 December 2001
| Category of death | Māori | Pacific peoples | Other | Total | ||||
|---|---|---|---|---|---|---|---|---|
| Number | Rate | Number | Rate | Number | Rate | Number | Rate | |
1Rate per 1,000 live or total births. Source: New Zealand Health Information Service | ||||||||
| Total fetal | 92 | 5.8 | 41 | 6.6 | 236 | 6.7 | 369 | 6.4 |
| Early neonatal | 48 | 3.0 | 32 | 5.2 | 95 | 2.7 | 175 | 3.1 |
| Late neonatal | 12 | 0.8 | 9 | 1.5 | 20 | 0.6 | 41 | 0.7 |
| Post-neonatal | 75 | 4.7 | 22 | 3.6 | 46 | 1.3 | 143 | 2.5 |
| Total infant | 135 | 8.5 | 63 | 10.2 | 161 | 4.6 | 359 | 6.3 |
Table 8.09 compares New Zealand's mortality rate with selected Organisation for Economic Co-operation and Development countries.
Table 8.09. Infant mortality rates for selected OECD
countries1
Years ending 31 December
| Country | 1988 | 1998 | 1999 | 2000 | 2001 | 2002 |
|---|---|---|---|---|---|---|
1Rate per 1,000 live births. Source: OECD | ||||||
| Greece | 11.0 | 6.7 | 6.2 | 5.9 | 5.1 | 5.9 |
| United Kingdom | 9.0 | 5.7 | 5.8 | 5.6 | 5.5 | 5.3 |
| New Zealand | 10.9 | 5.4 | 5.8 | 6.3 | 5.6 | 5.2 |
| Australia | 8.7 | 5.0 | 5.7 | 5.2 | 5.3 | 5.0 |
| Portugal | 13.0 | 6.0 | 5.6 | 5.5 | 5.0 | 5.0 |
| Switzerland | 6.8 | 4.8 | 4.6 | 4.9 | 5.0 | 4.5 |
| Germany | 7.5 | 4.7 | 4.5 | 4.4 | 4.8 | 4.3 |
| Austria | 8.1 | 4.9 | 4.4 | 4.8 | 4.8 | 4.1 |
| Japan | 4.8 | 3.6 | 3.4 | 3.2 | 3.1 | 3.0 |
| Iceland | 6.2 | 2.6 | 2.4 | 3.0 | 2.7 | 2.2 |
Abortion is permitted by New Zealand law under the Contraception, Sterilisation and Abortion Act 1977 in circumstances where strict criteria are met. The criteria are that continuation of the pregnancy would result in serious danger (not being danger normally associated with childbirth) to the life, or to the physical or mental health of the woman or girl; or that there is a substantial risk that the child, if born, would be so physically or mentally abnormal as to be seriously handicapped.
The grounds are stricter when the gestation of the pregnancy is more than 20 weeks. Then, an abortion will be authorised only to save the life of the mother, or to prevent serious, permanent injury to her physical or mental health.
The Crimes Act 1961 sets out when an abortion would be unlawful.
The Contraception, Sterilisation and Abortion Act 1977 sets out the referral procedure where a woman seeks an abortion. It also sets out the criteria when a case is determined.
If, after consideration of a case, two certifying consultants establish that the case meets the criteria of the act, they will each issue an authorising certificate.
The act also created a three-member Abortion Supervisory Committee. Among the committee's functions is to keep provisions of the act under review, grant licences to institutions, both private and public, for the performance of abortions, appoint certifying consultants and collate and disseminate information relating to the performance of abortions in New Zealand. The committee also appoints counselling advisors to monitor counselling services for women seeking advice about their pregnancy.
Table 8.10 shows abortions performed in New Zealand in the years 1998–2004 by age group.
Table 8.1. Abortions1
By age group
Years
ending 31 December
| Age group (in years) | 1998 | 1999 | 2000 | 2001 | 2002 | 2003 | 2004 |
|---|---|---|---|---|---|---|---|
1New Zealand-registered induced abortions. Source: Abortion Supervisory Committee | |||||||
| 11–14 | 65 | 56 | 74 | 66 | 78 | 89 | 85 |
| 15–19 | 2,832 | 2,846 | 3,107 | 3,240 | 3,602 | 3,757 | 3,758 |
| 20–24 | 4,355 | 4,477 | 4,548 | 4,728 | 5,124 | 5,670 | 5,528 |
| 25–29 | 3,381 | 3,447 | 3,399 | 3,450 | 3,450 | 3,619 | 3,501 |
| 30–34 | 2,368 | 2,435 | 2,496 | 2,555 | 2,676 | 2,800 | 2,644 |
| 35–39 | 1,559 | 1,642 | 1,823 | 1,730 | 1,715 | 1,846 | 1,916 |
| 40–14 | 444 | 560 | 613 | 593 | 686 | 692 | 721 |
| 45 and over | 25 | 38 | 43 | 48 | 49 | 38 | 58 |
| Total | 15,029 | 15,501 | 16,103 | 16,410 | 17,380 | 18,511 | 18,211 |
Table 8.11 compares New Zealand's abortion rate with other low fertility countries.
Table 8.11. Abortion rates
New Zealand and other
low fertility countries
Latest
available year ending 31 December
| Country | Year | Crude abortion rate1 | General abortion rate2 |
|---|---|---|---|
1Per 1,000 estimated mean population. 2Per 1,000 estimated mean number of women aged 15–44. 3Includes abortions performed in hospitals but not counted by Medicare. 4Residents only. 5Includes most clinic abortions and abortions in the United States for Canadian residents. 6Abortion reporting incomplete and rates at least 20 percent higher than those stated. 7Includes abortions for foreign women living in the Netherlands Pprovisional .. figures not available Sources: Abortion Supervisory Committee Statistics New Zealand | |||
| New Zealand | 2003 | 4.6 | 21.0 |
| United States | 2002 | .. | 20.9P |
| Sweden | 2003 | 3.8 | 20.1 |
| Australia3 | 2003 | .. | 19.7 |
| England and Wales4 | 2003 | 3.4 | 16.6 |
| Norway | 2003 | 3.0 | 15.1 |
| Canada5 | 2002 | .. | 14.9 |
| Denmark | 2003 | 2.9 | 14.7 |
| Japan6 | 2001 | 2.7 | 13.8 |
| France6 | 1997 | .. | 13.1 |
| Scotland4 | 2003 | 2.4 | 11.5 |
| Finland | 2003 | 2.1 | 10.7 |
| Netherlands7 | 2003 | 1.8 | 8.6 |
| Germany | 2004 | .. | 7.7 |
Motor vehicle crashes involving death or personal injury are required by law to be reported to the police. During the year ending 31 December 2004, there were 14,326 reported crashes, resulting in 436 fatalities and injuries to 13,890 individuals.
Table 8.12 classifies these crashes by cause.
Table 8.12. Classification of motor vehicle crashes
Years ending 31 December
| Classification of crashes | 2003 | 2004 | ||||||
|---|---|---|---|---|---|---|---|---|
| Killed | Serious | Minor | Total | Killed | Serious | Minor | Total | |
Source: Ministry of Transport | ||||||||
| Overtaking or lane change | 32 | 124 | 409 | 565 | 19 | 79 | 381 | 479 |
| Head on (not overtaking) | 140 | 460 | 1,077 | 1,677 | 128 | 443 | 1,012 | 1,583 |
| Lost control or ran off road on straight | 53 | 284 | 1,086 | 1,423 | 54 | 304 | 1,124 | 1,482 |
| Lost control or ran off road while cornering | 113 | 661 | 2,535 | 3,309 | 118 | 635 | 2,474 | 3,227 |
| Collision with obstruction | 5 | 66 | 343 | 414 | 3 | 64 | 357 | 424 |
| Rear end | 2 | 90 | 1,330 | 1,422 | 6 | 78 | 1,256 | 1,340 |
| At intersections or driveways – | ||||||||
| Turning versus same direction | 12 | 75 | 594 | 681 | 5 | 81 | 633 | 719 |
| Crossing no turn | 11 | 110 | 932 | 1053 | 21 | 137 | 818 | 976 |
| Crossing vehicle turning | 6 | 147 | 906 | 1,059 | 14 | 130 | 892 | 1,036 |
| Vehicles merging | 2 | 33 | 214 | 249 | 2 | 24 | 222 | 248 |
| Right turn against | 19 | 161 | 969 | 1,149 | 4 | 160 | 936 | 1,100 |
| Vehicles manoeuvring | 6 | 69 | 503 | 578 | 11 | 86 | 469 | 566 |
| Pedestrian crossing road | 38 | 211 | 678 | 927 | 23 | 192 | 621 | 836 |
| Pedestrian – other | 16 | 45 | 105 | 166 | 15 | 46 | 101 | 162 |
| Miscellaneous | 6 | 42 | 113 | 161 | 13 | 32 | 103 | 148 |
| Total | 461 | 2,578 | 11,794 | 14,833 | 436 | 2,491 | 11,399 | 14,326 |
Figure 8.04 shows contributing factors, by proportions, for fatal and injury crashes on New Zealand roads for the year ending 31 December 2004.
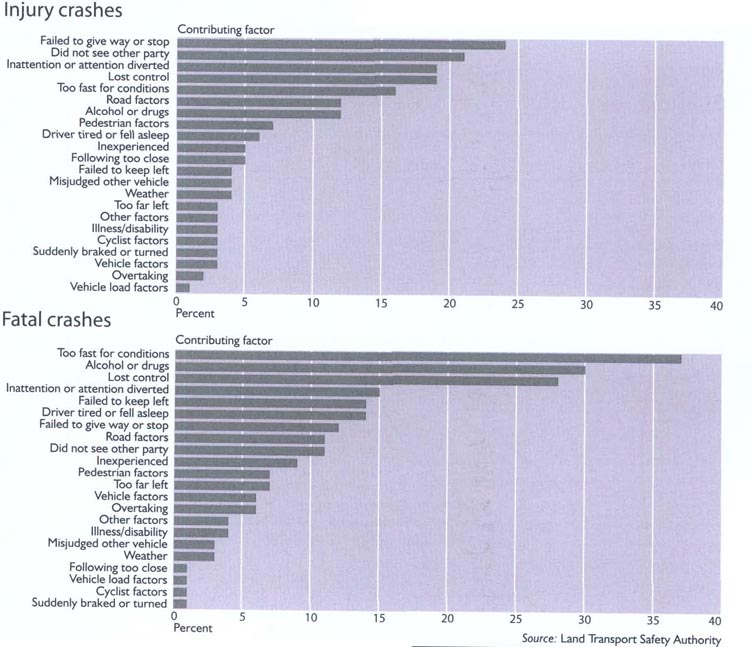
New Zealand's road safety strategy involves reducing road deaths to no more than 300 by 2010.
Road safety. The Road Safety to 2010 Strategy provides the direction for road safety in New Zealand and describes the results the government wants to achieve by 2010. The goal is to reduce road casualties to no more than 300 deaths and 4,500 hospitalisations a year.
Road safety is built around engineering, education and enforcement, and this requires coordination among agencies such as the Ministry of Transport, Transit New Zealand, the Land Transport Safety Authority, the New Zealand Police and local authorities. The National Road Safety Committee and a number of other bodies, including local road safety committees, provide advice and coordination among road safety partners.
There has been considerable progress in reducing road deaths given the road toll was 745 in 1985, 582 in 1995 and, provisionally, 405 for 2005.
The government's key priorities for road safety include engineering safer roads, reducing speed, combating drink driving, dealing with serious offenders, encouraging the use of seat belts, improving safety for pedestrians and cyclists, improving the vehicle fleet and providing new and better-targeted education initiatives.
Table 8.13 shows the age groups of people killed or injured in motor crashes in New Zealand from 2000 to 2004.
Table 8.13. People killed or injured in motor crashes
By age group
Years
ending 31 December
| Age group (in years) | Killed1 | Injured | ||||||||
|---|---|---|---|---|---|---|---|---|---|---|
| 2000 | 2001 | 2002 | 2003 | 2004 | 2000 | 2001 | 2002 | 2003 | 2004 | |
1Killed immediately or died within 30 days of accident. Source: Ministry of Transport | ||||||||||
| Under 5 | 14 | 10 | 8 | 10 | 10 | 221 | 207 | 204 | 198 | 157 |
| 5–9 | 11 | 8 | 8 | 8 | 10 | 387 | 359 | 386 | 363 | 355 |
| 10–14 | 16 | 15 | 15 | 9 | 5 | 573 | 550 | 639 | 650 | 567 |
| 15–19 | 62 | 66 | 54 | 73 | 81 | 1,860 | 2,218 | 2,506 | 2,541 | 2,575 |
| 20–24 | 50 | 52 | 47 | 56 | 56 | 1,473 | 1,692 | 1,867 | 1,978 | 1,862 |
| 25–29 | 44 | 37 | 38 | 41 | 26 | 1,125 | 1,167 | 1,265 | 1,236 | 1,180 |
| 30–34 | 43 | 33 | 37 | 45 | 33 | 894 | 1,107 | 1,152 | 1,253 | 1,134 |
| 35–39 | 32 | 27 | 27 | 40 | 24 | 847 | 890 | 1,082 | 1,074 | 991 |
| 40–14 | 34 | 31 | 22 | 28 | 34 | 737 | 846 | 947 | 1,013 | 1,007 |
| 45–19 | 25 | 21 | 19 | 25 | 26 | 531 | 616 | 719 | 761 | 826 |
| 50–54 | 21 | 35 | 29 | 20 | 16 | 462 | 553 | 619 | 685 | 615 |
| 55–59 | 21 | 16 | 18 | 15 | 30 | 342 | 345 | 471 | 532 | 521 |
| 60–64 | 12 | 16 | 15 | 18 | 13 | 281 | 337 | 396 | 401 | 394 |
| 65–69 | 19 | 14 | 13 | 16 | 12 | 231 | 251 | 306 | 302 | 294 |
| 70–74 | 24 | 18 | 15 | 14 | 16 | 227 | 255 | 261 | 254 | 258 |
| 75–79 | 18 | 15 | 15 | 14 | 16 | 169 | 218 | 226 | 223 | 238 |
| 80 and over | 15 | 23 | 18 | 22 | 17 | 182 | 238 | 253 | 258 | 264 |
| Age unknown | 1 | 18 | 7 | 7 | 11 | 420 | 519 | 619 | 650 | 652 |
| Total | 462 | 455 | 405 | 461 | 436 | 10,962 | 12,368 | 13,918 | 14,372 | 13,890 |
Table 8.14 shows road crash casualty rates since 1991.
Table 8.14. Road crash casualties and rates
| Year | Persons killed | Persons killed per 100,000 population | Persons injured | Persons injured per 100,000 population | Total casualties per 100,000 population |
|---|---|---|---|---|---|
Source: Ministry of Transport | |||||
| 1991 | 650 | 18.8 | 16,767 | 486.0 | 504.8 |
| 1992 | 646 | 18.5 | 16,121 | 462.5 | 481.0 |
| 1993 | 600 | 17.0 | 15,108 | 428.6 | 445.6 |
| 1994 | 580 | 16.2 | 16,600 | 464.1 | 480.3 |
| 1995 | 582 | 16.0 | 16,870 | 463.1 | 479.1 |
| 1996 | 514 | 13.8 | 14,796 | 398.0 | 411.8 |
| 1997 | 539 | 14.4 | 13,375 | 355.6 | 370.0 |
| 1998 | 501 | 13.2 | 12,412 | 327.5 | 340.7 |
| 1999 | 508 | 13.3 | 11,999 | 315.5 | 328.8 |
| 2000 | 462 | 12.1 | 10,962 | 286.2 | 298.3 |
| 2001 | 455 | 11.8 | 12,368 | 321.2 | 333.0 |
| 2002 | 405 | 10.3 | 13,918 | 353.3 | 363.6 |
| 2003 | 461 | 11.5 | 14,372 | 358.5 | 370.0 |
| 2004 | 436 | 10.7 | 13,890 | 342.0 | 352.7 |
Table 8.15 compares New Zealand road death statistics with selected other countries.
Table 8.15. International comparison of motor crash death
rates1
Years ending 31 December
| 2002 | 2003 | |||||
|---|---|---|---|---|---|---|
| Persons killed | Persons killed per 100,000 population | Persons killed per 10,000 vehicles | Persons killed | Persons killed per 100,00 population | Persons killed per 10,000 vehicles | |
1Data is for countries that contribute data to the International Road Traffic and Accident Database and is the most recent available. .. figures not available Source: Ministry of Transport | ||||||
| United States | 42,815 | 14.9 | 1.9 | 42,815 | 14.9 | 1.9 |
| France | 7,655 | 12.9 | 2.2 | 6,058 | 10.2 | 1.7 |
| New Zealand | 405 | 10.3 | 1.5 | 461 | 11.5 | 1.6 |
| Australia | 1,723 | 8.8 | 1.4 | 1,633 | 8.2 | 1.2 |
| Canada | 2,930 | 9.3 | 1.6 | .. | .. | .. |
| Germany | 6,842 | 8.3 | 1.3 | 6,613 | 8.0 | 1.2 |
| Japan | 9,575 | 7.5 | 1.2 | 8,877 | 7.0 | 1.1 |
| Sweden | 532 | 6.0 | 1.1 | 529 | 5.9 | 1.1 |
| Norway | 312 | 6.9 | 1.1 | 280 | 6.1 | 1.0 |
| United Kingdom | 3,581 | 6.1 | 1.2 | 3,658 | 6.1 | 1.1 |
Figure 8.05 shows the road toll trend in recent years.
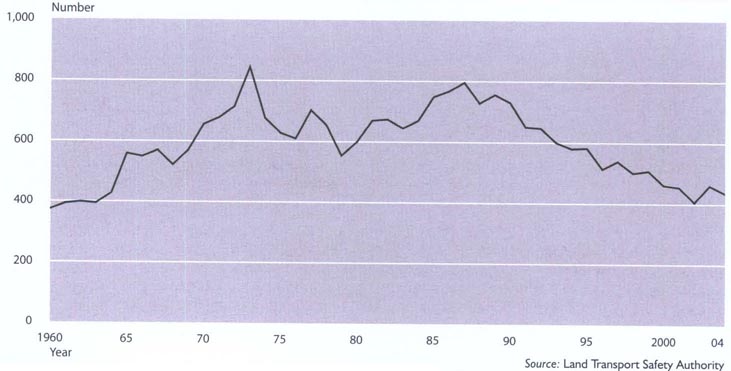
Water Safety New Zealand is responsible for water safety education in New Zealand, ensuring safe participation of New Zealanders in all types of water activity. Formed in 1949, Water Safety New Zealand represents the interests of 31 aquatic sports and recreational organisations. It is funded by the New Zealand Lottery Grants Board and through sponsorship of specific programmes by organisations such as the Accident Compensation Corporation.
Water Safety New Zealand ensures the water safety needs of the community are met through public education, information and statistics, research and advice and consultancy. Water Safety New Zealand runs its own programmes and promotions, as well as supporting and funding water safety educational activities by member organisations, such as Swimming New Zealand, Surf Life Saving New Zealand, the Coastguard Boating Education Service, the New Zealand Outdoor Instructors' Association and the New Zealand Underwater Association.
Water Safety New Zealand's website is www.watersafety.org.nz
Table 8.16 shows drownings in New Zealand from 1996 to 2005 by type of activity.
Table 8.16. Drownings
Years ending 31
December
| Activity | 1996 | 1997 | 1998 | 1999 | 2000 | 2001 | 2002 | 2003 | 2004 | 2005 |
|---|---|---|---|---|---|---|---|---|---|---|
Source: Water Safety New Zealand | ||||||||||
| Recreational | ||||||||||
| Non-powered boat | 4 | 8 | 2 | 3 | 8 | 13 | 11 | 7 | 8 | 8 |
| Powered boat | 16 | 5 | 13 | 10 | 14 | 10 | 13 | 11 | 7 | 6 |
| Sailing | 3 | 4 | 2 | 2 | 2 | 1 | 2 | 1 | 1 | 0 |
| Land-based fishing | 1 | 13 | 5 | 10 | 5 | 10 | 14 | 8 | 13 | 14 |
| Underwater sports | 7 | 10 | 8 | 4 | 10 | 4 | 8 | 10 | 3 | 6 |
| Swimming | 19 | 18 | 27 | 18 | 10 | 9 | 13 | 18 | 13 | 9 |
| Other water sport | 2 | 5 | 7 | 5 | 5 | 6 | 2 | 5 | 7 | 3 |
| Total recreational | 52 | 63 | 64 | 52 | 54 | 53 | 63 | 60 | 52 | 46 |
| Non-recreational | ||||||||||
| Accidental immersion | 35 | 33 | 38 | 33 | 33 | 32 | 40 | 30 | 27 | 22 |
| Non-water related recreation | 5 | 1 | 1 | 2 | 3 | 0 | 1 | 3 | 0 | 1 |
| Road vehicle | 15 | 12 | 12 | 12 | 10 | 15 | 12 | 18 | 17 | 15 |
| Commercial fishing | 18 | 9 | 4 | 4 | 3 | 1 | 1 | 4 | 3 | |
| Other commercial | 1 | 2 | 2 | 1 | 4 | 3 | ||||
| Rescuing others | 1 | 2 | 3 | 2 | 4 | 2 | 5 | 1 | 3 | 2 |
| Suicides and homicides | 13 | 25 | 15 | 18 | 19 | 16 | 15 | 12 | 15 | 11 |
| Other transportation | 4 | 2 | 1 | 1 | 2 | |||||
| Total non-recreational | 88 | 75 | 84 | 74 | 78 | 68 | 75 | 65 | 68 | 57 |
| Total | 140 | 138 | 148 | 126 | 132 | 121 | 138 | 125 | 120 | 103 |
Accidents, poisoning and violence caused 5.9 percent of deaths from all causes in New Zealand in 2001 (the latest New Zealand Health Information statistics available), compared with 6.1 percent in 2000, 5.6 percent in 1999 and 6.3 percent in 1998.
The largest single external cause of death was transport accidents (573 deaths in 2001, compared with 538 in 2000, 533 in 1999 and 529 in 1998), followed by suicide (507 deaths in 2001, compared with 458 in 2000, 516 in 1999 and 577 in 1998). Accidental falls accounted for 290 deaths in 2001, compared with 251 in 2000, 269 in 1999 and 199 in 1998.
Table 8.17 shows the cause, number and rate per million population of deaths from external causes in New Zealand for 2000 and 2001.
Table 8.17. Deaths from external causes
Years
ending 31 December
| Cause | 2000 | 2001 | ||
|---|---|---|---|---|
| Number | Crude rate per million population | Number | Crude rate per million population | |
1Includes falls aboard ships and from horseback. 2Includes drowning from water transport. Source: New Zealand Health Information Service | ||||
| Transport accidents | 573 | 149 | 538 | 138 |
| Intentional self-harm | 458 | 119 | 507 | 130 |
| Assault | 54 | 14 | 53 | 14 |
| Event of undetermined intent | 44 | 11 | 33 | 8 |
| Accidental falls1 | 251 | 65 | 290 | 75 |
| Accidental drowning and submersion2 | 58 | 15 | 48 | 12 |
| Exposure to smoke, fire and flames | 19 | 5 | 24 | 6 |
| Accidents caused by machinery | 4 | 1 | 6 | 1 |
| Accidental poisoning | 31 | 8 | 30 | 8 |
| Accidents caused by firearms | 4 | 1 | 2 | 1 |
| Other external causes of injury | 117 | 31 | 122 | 3 |
| Total deaths from external causes | 1,613 | 421 | 1,653 | 425 |
Male deaths by external causes. Males accounted for 67.6 percent of deaths from external causes in 2001 (the latest New Zealand Health Information Service statistics available). Males aged 15–24 had the highest number of deaths for any age group of any sex, with transport accidents being the most common cause of death, followed by intentional self-harm.
Accidents – preschoolers. The mortality rate for children aged 1–4 from accidents and injury in 2001 was 14.7 per 100,000 population. In 2000 it was 14.9 per 100,000 population. In 1999 it was 15.6per 100,000 population, in 1998 14.2per 100,000 and in 199722.1 per 100,000. In 2000, the system of coding deaths in New Zealand was changed, so comparison with earlier years should be treated with caution.
Table 8.18 classifies 2001 deaths from leading external causes by age and sex.
The Ministry of Health and a number of other agencies fund injury prevention activities throughout New Zealand. Injury prevention activities are guided by the New Zealand Injury Prevention Strategy.
The strategy sets out a number of priority action areas for the years 2005–2008. These include motor vehicle crashes, suicide and deliberate self-harm, falls, workplace injuries, assault, and drowning and near drowning.
Table 8.18. Deaths from external causes
By sex
and age
Year ending 31 December
2001
| Transport accidents | Intentional self-harm | Assault | Event of undetermined intent | Accidental falls | Accidental drowning and submersion | Exposure to smoke, fire and flames | Accidents caused by machinery | Accidents caused by firearms | Accidental poisoning by and exposure to noxious substances | Other external causes of injury | Total | ||||||||||||
|---|---|---|---|---|---|---|---|---|---|---|---|---|---|---|---|---|---|---|---|---|---|---|---|
| Age group | M | F | M | F | M | F | M | F | M | F | M | F | M | F | M | M | F | M | F | M | F | M | F |
- nil or zero Source: New Zealand Health Information Service | |||||||||||||||||||||||
| 0–14 | 25 | 19 | 1 | 2 | 4 | 4 | - | - | 3 | - | 9 | 6 | 5 | 5 | - | - | - | - | 1 | 62 | 4 | 62 | 41 |
| 15–24 | 106 | 27 | 87 | 23 | 7 | 7 | 5 | 1 | 6 | - | 6 | - | - | - | 1 | - | - | 2 | 2 | 224 | 1 | 224 | 61 |
| 25–34 | 73 | 20 | 92 | 29 | 5 | 1 | 5 | 2 | 7 | - | 12 | - | - | 1 | 3 | 1 | - | 11 | 1 | 219 | 4 | 219 | 58 |
| 35–44 | 55 | 19 | 96 | 22 | 5 | 6 | 5 | 3 | 5 | 1 | 6 | - | 4 | - | 1 | - | - | 3 | 2 | 194 | 4 | 194 | 57 |
| 45–54 | 48 | 23 | 33 | 17 | 1 | 2 | 4 | 4 | 6 | 3 | 4 | - | 2 | 1 | 1 | 1 | - | 3 | 1 | 118 | 2 | 118 | 53 |
| 55–64 | 27 | 18 | 31 | 10 | 6 | 1 | 2 | - | 8 | 2 | 1 | - | 1 | - | - | - | - | 2 | - | 83 | 1 | 83 | 32 |
| 65–74 | 28 | 11 | 23 | 7 | 2 | - | 1 | - | 12 | 12 | 2 | - | - | 1 | - | - | - | 1 | - | 76 | 2 | 76 | 33 |
| 75+ | 17 | 22 | 25 | 9 | 1 | 1 | - | 1 | 82 | 143 | 1 | 1 | 1 | 3 | - | - | - | - | 1 | 141 | 20 | 141 | 201 |
| Total | 379 | 159 | 388 | 119 | 31 | 22 | 22 | 11 | 129 | 161 | 41 | 7 | 13 | 11 | 6 | 2 | 22 | 8 | 84 | 38 | 1,117 | 536 | |
| Totals in 2000 | 403 | 170 | 375 | 83 | 32 | 22 | 34 | 10 | 111 | 140 | 46 | 12 | 13 | 6 | 4 | 3 | 1 | 20 | 11 | 83 | 34 | 1,124 | 489 |
The Ministry of Health and the Ministry of Youth Affairs are the lead agencies for suicide and deliberate self-harm.
Activities connected with the strategy involve national coordination contracts, resource development and information sharing through regional support networks, and working with local communities and local government agencies to ensure injury prevention issues achieve the right emphasis in public health promotion.
The ministry also runs two violence prevention programmes, the first in hospitals and primary health care settings to ensure that victims of violence are supported by health professionals; and the second in workplaces, marae, schools and communities to change social norms that tolerate violence.
New Zealand was the first country more than 30 years ago to introduce comprehensive 24-hour, no-fault personal accident insurance cover for people injured in accidents.
Legislation creating the accident compensation scheme took effect on 1 April 1974, replacing a statutory workers' compensation scheme, compulsory third-party motor vehicle accident insurance and a criminal injuries compensation scheme. The new scheme also removed the common law right to sue for damages, in return for support for all people injured, regardless of fault.
Essentially, the scheme covers all New Zealand residents, New Zealand residents temporarily overseas and overseas visitors in New Zealand.
The scheme is managed by a statutory corporation, the Accident Compensation Corporation (ACC), formerly the Accident Compensation Commission.
The scheme has been amended from time to time, mainly to keep its entitlements in line with social changes. The Injury Prevention, Rehabilitation and Compensation Act, which came into effect from 1 April 2002, reintroduced lump sum payments for injuries resulting in permanent impairment, required ACC to develop a code of claimant rights, and made a number of changes to entitlements for injured people.
The Accident Compensation Corporation (ACC) is a Crown entity with a board of directors appointed by the Minister for the Accident Compensation Corporation.
A service agreement between the board and the minister specifies ACC's desired outcomes and objectives, and acts as an accountability mechanism.
In the year ending 30 June 2005, ACC accepted 1.52 million claims, a 1.3 percent increase on those accepted in the previous year. About 103,000 of the 2005 claims involved moderate or serious injury, with the rest involving basic medical attention only.
In addition to new claims, ACC continued to provide support to people with ongoing effects of injuries received in previous years.
The Accident Compensation Corporation meets the cost of retrieval by ambulance from an accident scene.
Services. The main services ACC provides to injured people are:
Cost of retrieval from accident scene when ambulance or air transport is necessary.
Cost of physical rehabilitation, including cost of some public hospital and private hospital treatment; contribution to costs of ‘primary health care provider’ (such as general practitioners) for consultation and treatment relating to minor injury; and some contribution to cost of travel for treatment.
Compensation for loss of earnings. Weekly payments of up to 80 percent of a claimant's pre-injury income for the period during which the claimant is unable to work as a result of the accident. Abated compensation is available if the claimant is able to resume work on reduced earnings.
Vocational support through the provision of retraining to enable claimants to return to their previous employment, or to take up alternative employment.
Personal support designed to make living with the results of an accident more comfortable. This can include payment of an independence allowance, modification of homes and vehicles for those with lasting incapacity, and a range of care services for those unable to manage the normal routine of daily life.
Lump sum compensation. A one-off payment to compensate for permanent impairment resulting from injury. The lump sum is paid in addition to any other entitlements or assistance a claimant may receive from ACC. The amount of the payment depends on the level of permanent impairment.
Funding. ACC is funded by all New Zealanders, with the funding reserves policy moving in 1998 from a ‘pay-as-you-go’ basis to a ‘fully-funded’ basis. This change required ACC to set levies today to cover the full future cost of each claim, and to establish reserves to meet the full future entitlement of people injured in the past. This brought ACC into line with usual insurance practice and means that each generation pays the cost of its own accidents, rather than passing the cost on to future generations.
ACC receives income from:
Earners who pay levies based on their earnings, collected with PAYE tax.
Motor vehicle owners and users who pay part of their annual motor vehicle licence fee and a 5.78 cents-a-litre petrol levy.
The government on behalf of non-income earners.
Employers and the self employed.
Investment earnings on funds held to cover claims costs.
Costs. Injury costs are assigned to one of seven separate accounts:
The employers' account meets the cost of all work-related injuries to employees (except those involving motor vehicles on public roads). The account is funded from employer levies based on industry risk.
The self-employed work account meets the cost of all work-related injuries to self-employed people (except those involving motor vehicles on public roads). The account is funded from levies on the self employed based on industry risk.
The residual claims account meets the cost of work injuries (except those involving motor vehicles on public roads) occurring before July 1999 and non-work injuries (except those involving motor vehicles on public roads) occurring before 1 July 1992 to all earners, including the self employed. The account is funded by employers and from levies on the self employed based on industry risk.
The earners' account meets the cost of injuries (except those involving motor vehicles on public roads) occurring to all earners, including the self employed, outside of their workplace after 1 July 1992. These injuries are often the result of accidents in the home or while engaged in sport or recreation. The account is funded from earners' levies paid through PAYE and from levies on the self employed.
The non-earners' account meets the cost of all injuries (except those involving motor vehicles on public roads) to people who are not in the workforce. This account is funded by contributions from the government.
The motor vehicle account meets the costs of all personal injuries involving motor vehicles on public roads. It is funded by vehicle owners and users from motor vehicle licence levies and petrol levies.
The medical misadventure account meets the cost of treatment injuries from medical or surgical procedures. The account is funded from the earners' or non-earners' accounts depending on whether the injured person is an earner or non-earner.
In the year ending 30 June 2005, ACC's net levy income totalled $3.52 billion and total expenditure was $4.3 billion.
Table 8.19 shows claims registered from 1999 to 2005.
Table 8.19. ACC claims registered1
By account
Years ending 30 June
| Account | 1999 | 2000 | 2001 | 2002 | 2003 | 2004 | 2005 |
|---|---|---|---|---|---|---|---|
1Figures for all years have been revised to take account of new information, change of definition, legislation change or claim status change. ... not applicable Source: Accident Compensation Corporation | |||||||
| Non-earners | 799,180 | 711.794 | 732,312 | 723,108 | 780,940 | 717,896 | 734,147 |
| Earners | 413,873 | 401,106 | 449,762 | 458,864 | 541,199 | 529,645 | 529,533 |
| Employers | ... | 781 | 154,971 | 158,103 | 179,963 | 167,388 | 169,736 |
| Self-employed work | ... | 34,986 | 50,433 | 49,153 | 52,200 | 45,086 | 44,923 |
| Motor vehicle | 43,707 | 33,676 | 32,469 | 34,896 | 40,205 | 39,561 | 40,946 |
| Medical misadventure | 580 | 753 | 841 | 663 | 738 | 823 | 939 |
| Residual claims | 242,329 | 9.073 | 1,293 | 853 | 665 | 1.592 | 816 |
| Total | 1,499,669 | 1,192,169 | 1,422,081 | 1,425,640 | 1,595,910 | 1,501,991 | 1,521,040 |
The Ministry of Civil Defence and Emergency Management Te Rākau Whakamarumaru leads the way in making New Zealand and its communities resilient to hazards and disasters.
The overarching strategy for achieving this is through a risk management approach to the four ‘Rs’ – reduction, readiness, response and recovery. This approach starts with recognising hazards and the vulnerability of communities and infrastructure to those hazards.
By addressing the possible effects of these hazards, the focus can move to measures for reducing risks and managing potential impacts.
The ministry aims to put the right tools, knowledge and skills in the hands of those responsible for designing and implementing solutions at the local level.
It does this by working closely with local government, utilities and emergency services involved in civil defence emergency management.
The Ministry of Civil Defence and Emergency Management website is www.civildefence.govt.nz
Fire protection involves fire safety and operational firefighting.
These services are managed nationally by the New Zealand Fire Service on behalf of the New Zealand Fire Service Commission.
The primary emphasis on fire safety is determined by legislation in the Fire Service Act 1975.
New Zealand Fire Service Commission. The New Zealand Fire Service Commission is responsible for ensuring statutory requirements set out in the Fire Service Act 1975 are met. The commission consists of five members appointed by the government and is the national purchasing and policy-setting agency. The commission, established under the Forest and Rural Fires Act 1977 as the National Rural Fire Authority, is responsible for coordinating 112 rural fire authorities operating in areas outside designated fire districts, where operational firefighting is provided by the New Zealand Fire Service. The net cost of funding the commission, after allowing for miscellaneous income, is met by a levy on insured property collected by the insurance industry. For the year ending 30 June 2005, the levy produced $249.04 million, compared with $234.98 million in the year ending 30 June 2004.
New Zealand Fire Service. The New Zealand Fire Service aims to reduce the incidence and consequence of fires. The service has an operating structure designed to deliver decision-making response and resources to frontline operations. Senior managers are specifically responsible for fire safety and enhancement of fire safety technology. Eight fire regions are responsible for fire safety programmes, fire fighting resources and the training and operational efficiency of brigades within their fire districts. Thirty of 348 fire districts are served mainly by career firefighters, with some stations augmented by volunteers, while the remaining 318 districts are staffed by volunteers. Nationally in 2005, there were 1,621 career firefighters, compared with 1,575 in 2004 and 1,569 in 2003. There were more than 7,500 volunteers and 3,000 volunteer rural firefighters in 2005, numbers similar to the previous year. There were 561 support staff in 2005 (including those at communications centres in Auckland, Wellington and Christchurch). The New Zealand Fire Service has the responsibility of fighting fires in all urban fire districts and, to the extent that its ability to fight fires is not compromised, of responding to other emergencies at which its fire fighting resources can be utilised.
Table 8.20 shows the number and nature of incidents attended by fire brigades in recent years.
Table 8.2. Incidents attended by fire brigades
Years ending 30 June
| 2001 | 2002 | 2003 | 2004 | 2005 | |
|---|---|---|---|---|---|
Source: New Zealand Fire Service | |||||
| Fires | |||||
| Structure fire | 5,608 | 6,547 | 6,865 | 6,567 | 6,450 |
| Mobile property fire | 2,651 | 3,198 | 3,212 | 3,131 | 3,274 |
| Vegetation fire | 4,379 | 3,579 | 4,751 | 4,279 | 4,117 |
| Chemical, flammable liquid or gas fire | 80 | 73 | 78 | 132 | 138 |
| Miscellaneous fire | 6,804 | 7,015 | 7,866 | 7,767 | 7,706 |
| Total fires | 19,522 | 20,412 | 22,772 | 21,876 | 21,685 |
| Fatalities from fires | 38 | 37 | 39 | 47 | 32 |
| Hazardous emergencies | 1,676 | 2,149 | 2,094 | 2,505 | 2,355 |
| Incidents relating to mobile property accidents | 5,205 | 5,785 | 5,955 | 5,323 | 5,704 |
| Rescue, emergency, medical call | 1,012 | 965 | 1,088 | 3,018 | 2,753 |
| Assist other emergency services | 3,243 | 3,784 | 3,589 | 2,844 | 3,779 |
| High winds | 759 | 391 | 320 | 1,341 | 832 |
| Natural disasters | |||||
| Flood | 683 | 1,049 | 523 | 1,170 | 1,344 |
| Other natural hazard emergencies | 13 | 6 | 6 | 29 | 25 |
| Other services | 2,299 | 2,603 | 2,490 | 2,608 | 2,370 |
| False alarms | |||||
| Good intent calls | 6,929 | 6,651 | 6,623 | 4,734 | 4,661 |
| False and malicious alarms | 17,954 | 19,359 | 19,377 | 21,261 | 20,176 |
| All incident types | 59,295 | 63,154 | 64,837 | 66,709 | 65,684 |
Primary responsibility for provision of occupational safety and health policy advice and services rests with the Department of Labour.
The Maritime Safety Authority and Civil Aviation Authority have responsibility for administration and enforcement of legislation in their respective sectors.
The Accident Compensation Corporation (ACC) also plays a major role in workplace injury prevention.
Principal legislation is the Health and Safety in Employment Act 1992, the object of which is to promote prevention of harm in the workplace.
To achieve this, the legislation:
Defines hazards and places of work.
Promotes excellence in health and safety management.
Imposes enforceable duties on those responsible for work, and those who do the work.
Provides for making regulations and codes of practice dealing with particular hazards or types of work.
Encourages employee participation and a cooperative approach between employers and employees to workplace health and safety.
The act sets out responsibilities of employers, employees, principals to contracts and others who exercise control of places of work. It provides for detailed guidance material to be created by either mandatory regulations, or by codes of practice approved by the Minister of Labour, after consultation with industry. Approved codes are not mandatory, but are recognised statements of good practice.
Other good practice guidelines are also developed by the Department of Labour, in conjunction with industry.
The department focuses on supporting safe and healthy workplace practices and reducing work-related illness, injury and deaths through:
Working with other government agencies in promoting and supporting health and safety in the workplace.
Providing information and advice to help workplaces self-manage health and safety.
Identifying changes and risks in workplaces through environmental scoping.
Promoting research and influencing society's attitudes towards workplace health and safety.
Investigating workplace accidents and complaints and enforcing health and safety legislation.
The department investigates all workplace fatalities and works closely with emergency services, local authorities and defence forces in the area of explosives and dangerous goods, and hazardous substances affecting public safety. The department also surveys agents certifying the safety of hazardous equipment, and audits workplaces for compliance with the law.
The department has 14 regional health and safety offices and a Wellington national health and safety office. Of 225 staff employed at October 2005, 193 were field staff, including health and safety inspectors or occupational medicine specialists.
During 2004/05, field staff carried out 8,936 visits to workplaces to provide information or advice, and visited another 8,492 workplaces to assess compliance with legislation. In addition, 6,290 investigations were carried out in response to 10,818 notifications or complaints.
In the 2004/05 financial year, investigations led to the commencement of 108 prosecutions. During the year, of the 149 cases determined, 119 resulted in convictions.
Funding is through a levy on employers, collected with ACC levies. At 1 January 2005, the levy was 5c per $100 of wages paid. The department's budgeted Crown funding for the 2004/05 year was $25.815 million.
Table 8.21 lists fatal accidents, by industry, investigated in recent years.
Table 8.21. Fatal accidents investigated by the Occupational Safety and Health
Service
By industry
Years ending 30 June
| Industry | 1995 | 2000 | 20011 | 20021 | 20031 | 20041 |
|---|---|---|---|---|---|---|
1Includes bystanders killed as a result of workplace accidents – none in 2001, five in 2002, 16 in 2003 and 8 in 2004. 2Includes fatalities in extractive industries, e.g. mining – two in 2001, five in 2002, one in 2003 and 1 in 2004. Source: Department of Labour | ||||||
| Agriculture and hunting | 4 | 18 | 17 | 25 | 22 | 23 |
| Forestry and logging | 11 | 4 | 7 | 2 | 7 | 1 |
| Construction | 16 | 17 | 9 | 12 | 14 | 5 |
| Other | 14 | 18 | 72 | 342 | 302 | 182 |
| Total | 45 | 57 | 40 | 73 | 73 | 47 |
Occupational disease. The Department of Labour maintains a Notifiable Occupational Disease System (NODS), with voluntary reporting of suspected cases by health professionals. Departmental medical officers investigate all notifications of suspected occupational disease or illness. As Table 8.22 shows, this involved 1,119 cases in the year ending 30 June 2004 and 824 cases in the June 2005 year
Table 8.22. Occupational disease notifications
Years
ending 30 June
| Disease category | 2001 | 2002 | 2003 | 2004 | 2005 |
|---|---|---|---|---|---|
Source: Department of Labour | |||||
| Occupational noise-induced hearing loss | 441 | 521 | 860 | 475 | 284 |
| Occupational cancer | 29 | 205 | 120 | 254 | 225 |
| Occupational respiratory disease | 109 | 101 | 100 | 72 | 80 |
| Occupational disease due to chemical exposure | 70 | 58 | 63 | 40 | 33 |
| Occupational injury to muscles, tendons or joints | 81 | 60 | 66 | 20 | 24 |
| Occupational illness due to infection | 41 | 64 | 56 | 47 | 23 |
| Occupational disease affecting the brain, spinal cord or peripheral nerves | 17 | 13 | 29 | 32 | 14 |
| Occupational skin disease | 27 | 27 | 22 | 16 | 12 |
| Psychological disorders or psychiatric disease | 18 | 6 | 4 | 20 | 18 |
| Other | 33 | 45 | 29 | 143 | 111 |
| Total | 866 | 1,100 | 1,349 | 1,119 | 824 |
8.1 Ministry of Health; Health Research Council of New Zealand; Malaghan Institute of Medical Research; Medical Council of New Zealand; Dental Council of New Zealand; Nursing Council of New Zealand; Registration Boards Secretariat Ltd; Physiotherapy Board; Dental Technicians' Board; Midwifery Council of New Zealand; Occupational Therapy Board; Pharmacy Council of New Zealand.
8.2 Ministry of Health; PHARMAC.
8.3 Ministry of Health; New Zealand Food Safety Authority.
8.4 Ministry of Health.
8.5 Ministry of Health; Ministry of Justice.
8.6 Ministry of Transport; Water Safety New Zealand; Ministry of Health.
8.7 Accident Compensation Corporation.
8.8 Ministry of Civil Defence and Emergency Management; New Zealand Fire Service Commission.
8.9 Occupational Safety and Health Service.
www.acc.co.nz – Accident Compensation Corporation
www.dentalcouncil.org.nz – Dental Council of New Zealand
www.dentaltec.org.nz – Dental Technicians' Board
www.hrc.govt.nz – Health Research Council of New Zealand
www.malaghan.org.nz – Malaghan Institute of Medical Research
www.mcnz.org.nz – Medical Council of New Zealand
www.midwiferycouncil.org.nz – Midwifery Council of New Zealand
www.civildefence.govt.nz – Ministry of Civil Defence and Emergency Management
www.moh.govt.nz – Ministry of Health
www.justice.govt.nz – Ministry of Justice
www.transport.govt.nz – Ministry of Transport
www.fire.org.nz – New Zealand Fire Service Commission
www.nzfsa.govt.nz – New Zealand Food Safety Authority
www.nzhis.govt.nz – New Zealand Health Information Service
www.nursingcouncil.org.nz – Nursing Council of New Zealand
www.osh.dol.govt.nz – Occupational Safety and Health Service
www.otboard.org.nz – Occupational Therapy Board
www.pharmac.govt.nz – PHARMAC
www.pharmacycouncil.org.nz – Pharmacy Council of New Zealand
www.physioboard.org.nz – Physiotheraphy Board
www.regboards.co.nz – Registration Boards Secretariat Ltd
www.stats.govt.nz – Statistics New Zealand
www.watersafety.org.nz – Water Safety New Zealand
Table of Contents
Girls are now staying at school longer and are more likely than their male counterparts to leave school with a qualification.
The New Zealand Curriculum Framework sets out the policy direction for learning and teaching in New Zealand state and state-integrated schools. It describes a range of principles which underpin and give direction to the curriculum.
The principles state that the curriculum will be broad, balanced and common; be inclusive of all students; foster success and achievement for all students; enable students to become independent and life-long learners; ensure that learning progresses coherently throughout schooling; recognise New Zealand's bicultural identity; reflect the multicultural nature of New Zealand society; be cooperatively designed; and relate to the wider world.
The framework specifies seven essential learning areas which describe in broad terms the knowledge and understandings which all students will learn. These are:
Language and languages (Te kōrero me nga reo).
Mathematics (Pangarau).
Science (Putaiao).
Technology (Hangarau).
Social sciences (Tikanga-a-iwi).
The arts (Nga toi).
Health and physical well-being (Hauora).
The framework also sets out essential skills to be developed by all students through a range of learning experiences across the whole curriculum. These skills are communication; numeracy; information; problem solving; self management and competitive; social and cooperative; physical; and work and study.
The framework also outlines commonly-held attitudes and values which should be developed and reinforced in the curriculum.
The framework is supported by more detailed national curriculum statements. Teaching and learning programmes based on these statements for each of the seven essential learning areas are mandatory for state and state-integrated schools to the end of Year 10.
The curriculum provides flexibility to enable teachers to develop classroom programmes to meet diverse needs. Classroom planning is supported through assessment tools, which provide information on the achievement and progress of students.
While literacy and numeracy continue to be priorities, the curriculum supports learning that encourages creative thinking, problem solving, a love of learning and healthy attitudes to oneself and others.
A stocktake of the national curriculum completed in 2003 found the structure to be sound, but recommended changes so that the curriculum better articulates expectations of teaching and learning.
A major recommendation of the stocktake was that all Year 7 to 10 students have the opportunity of learning a second language.
Recommendations of the stocktake are being implemented through the New Zealand Curriculum Marautanga Project. The goals are to:
Clarify and refine outcomes.
Focus on effective teaching.
Strengthen school ownership of curriculum.
Support communication and strengthen partnerships with parents, whānau and communities.
The draft revised curriculum was to be distributed to all schools during 2006. Following this, the project will enter a consultation phase in which the Ministry of Education will be seeking feedback, with the final curriculum published in 2007.
Science is one of seven essential learning areas specified in the New Zealand Curriculum Framework.
The National Qualifications Framework (NQF) brings qualifications for senior secondary education, industry training and tertiary education into one system.
Coordinated and administered by the New Zealand Qualifications Authority (NZQA), the NQF is based on nationally-agreed unit standards, achievement standards and national qualifications. Each standard belongs to one of 10 framework levels, has a credit value associated with it, and may be used to meet the requirements of registered national qualifications.
National certificates awarded at Levels 1–7 include the senior secondary education qualification, the National Certificate of Educational Achievement (NCEA), at Levels 1, 2 and 3.
National diplomas are awarded at Levels 5, 6 and 7; national graduate diplomas and certificates at Levels 6 and 7; national bachelor degrees at Level 7; national postgraduate diplomas and certificates, and national bachelor degrees with honours, at Level 8; national masters degrees at Level 9; and doctorates at Level 10.
As at 31 December 2005, only national certificates, national diplomas and a national postgraduate certificate had been registered on the NQF.
The NQF enables students to continue their studies and trade training wherever they wish – at school, university, polytechnic, private or government training establishment, wānanga, or in the workplace.
Each student receives a Record of Learning – a personalised list of credits achieved. NZQA updates the learner's Record of Learning when it receives results from training organisations.
National certificates and national diplomas are developed by Industry Training Organisations or other approved standard-setting bodies. Training for these qualifications occurs on the job, off the job, or in a mixture of these, depending on the qualification.
National certificates (and in a few cases national diplomas) have replaced Trade Certificates and Advanced Trade Certificates in nearly every industry.
In the year ending 30 June 2005, 137,143 NQF qualifications were awarded.
 -->
-->Success in National Certificate of Educational Achievement is assessed against nationally-agreed standards, developed in line with both English and Māori language curricula to ensure equity of access to the qualification.
The National Certificate of Educational Achievement (NCEA) is designed to acknowledge achievement across a range of learning fields, particularly those identified in the New Zealand Curriculum Framework; to act as a learning goal; and to attest to a student's ability to participate in, and benefit from, further study, thereby promoting lifelong learning.
The NCEA allows recognition of a broad range of student achievements, such as performance ability, research measurement and laboratory skills.
Success in NCEA is assessed against nationally-agreed standards of achievement. These standards have been developed in line with both English and Māori language curricula to ensure equity of access to the qualification.
The NCEA shows differences between ‘achieving the standard’, ‘achieving the standard with merit’ and ‘achieving the standard with excellence’.
Candidates, while working towards the NCEA, are also able to work towards other national certificates and qualifications.
NCEA Level 1. Holders of NCEA Level 1 have typically shown themselves able to work at directed activities, with limited responsibility for decisions about the organisation of their work. The qualification is available mainly to Year 11 school students and is awarded to those credited with a minimum of 80 credits at Level 1 or above who have met literacy and numeracy requirements. A minimum of eight credits is required from specified literacy subfields and/or listed standards, and a minimum of eight credits from specified numeracy subfields and/or domains.
NCEA Level 2. NCEA Level 2 is designed to enable access to the foundation skills required for employment. People certificated at Level 2 have typically shown themselves able to integrate knowledge and skills to solve familiar problems; access and use available sources of information; and work in directed activity. The qualification also provides a foundation for further study and knowledge. This qualification is mainly available to Year 12 school students and is awarded to those credited with a minimum of 80 credits, of which a minimum of 60 credits is at Level 2 or above, from achievement standards and/or unit standards anywhere on the National Qualifications Framework.
NCEA Level 3. NCEA Level 3 is designed to enable access to the skills required for employment. People certificated at Level 3 have typically shown themselves able to integrate knowledge and skills to solve unfamiliar problems; access, analyse and use available sources of information; and work independently in undirected activity. The qualification also provides a more advanced foundation for further study and knowledge. NCEA Level 3 is available mainly to Year 13 school students and is awarded to those credited with a minimum of 80 credits at Level 2 or above, of which a minimum of 60 credits is at Level 3 or above, from achievement standards and/or unit standards anywhere on the National Qualifications Framework.
New Zealand Scholarship. New Zealand Scholarship, an award not a qualification, extends the best secondary school students, and enables top scholars to be identified and acknowledged. New Zealand Scholarship candidates are expected to have completed a full year of study of courses at Level 3 of the NQF. New Zealand Scholarship holders will have demonstrated high-level critical thinking, abstraction and generalisation, and an ability to integrate, synthesise and apply knowledge, skills, understanding and ideas to complex situations. Depending on the subject, effective communication, original or sophisticated solutions, performances or approaches, critical evaluation, and flexible thinking in unfamiliar or unexpected situations will also have been displayed. Substantial monetary awards are made for individual performances of a high level in each subject, overall high performance in three scholarship subjects, and outstanding performance in at least two scholarship subjects. Students who receive the Premier Award are identified from those students who demonstrate outstanding performance in at least three scholarship subjects.
The Ministry of Education Te Tāhuhu o te Mātauranga provides funding to early childhood centres, schools, universities, polytechnics, colleges of education and wānanga, ensuring distribution matches government policy. It approves charters in all of these institutions and also negotiates funding bids by tertiary institutions. Since February 2002. the ministry has provided special education services previously provided by Specialist Education Services. The ministry administers legislation and manages all education property owned by the Crown.
It is responsible for developing national guidelines on all aspects of education, including national curriculum objectives. It also conducts research and collects educational statistics. The ministry ensures delivery of education advisory services, curriculum and early childhood development through contractual arrangements with other agencies.
The Ministry of Education website is www.mined.govt.nz
Special education. The aim of the government's special education policy is to improve learning opportunities for all children and young people with special educational needs at their place of learning. Children and young people with special educational needs include students with disabilities, learning difficulties, communication or behavioural difficulties, and sensory or physical impairments. Resources provided include funding, therapy, staffing, specialised programmes, equipment and other materials, transport, advice and support. The policy encourages schools and early childhood centres to work closely with students, their families, whānau, communities and specialists to identify needs and together make the best decisions to meet these needs. The Ministry of Education and other providers delegated by the ministry provide specialist advice and support directly to children and young people, and their teachers, schools and families. This is likely to involve a combination of specialised services, tailored educational programmes, in-classroom teacher support and equipment.
Future needs. A key planning role for the Ministry of Education is assessing the need for new schools and classrooms. The primary school age population (5–12 year olds) peaked at 480,000 in 2003 and is now in decline. The secondary school age population (13–18 year olds) is experiencing significant growth, which is expected to continue to 2006 or 2007, after which it will also decline. While these are national projections, there are significant local variations, with some areas already in heavy decline and others sustaining long-term growth. Based on the current profile, more than 80 new classrooms were planned in the 2005/06 financial year, as well as the purchase of nine new school sites, plus the building of four new schools and several kura kaupapa Māori.
The Education Review Office Te Tari Arotake Mātauranga (ERO) is a government department that reports publicly on the quality of education and the care of students in schools and early childhood services. ERO findings help decisions and choices made by parents, educators, managers and others.
The ERO's Chief Review Officer formally accredits review officers to carry out reviews in schools and early childhood services. There are approximately 150 review officers in nine local offices, a national evaluation unit that reviews in kura and kōhanga reo, and a Pacific evaluation unit.
In an education review, the ERO investigates and reports to boards of trustees, early childhood service managers and the government on the quality of education provided for students in individual services and schools.
Reviews of individual schools and early childhood services are scheduled, on average, once every three years. The review schedule is based on previous performance and current risk analysis. Reviews are more frequent in particular cases, such as low quality performance, or where there are major risks to students and their safety.
The ERO also publishes national reports that evaluate specific educational issues, using information from its reviews. National reports cover areas such as curriculum, assessment, principals and teachers, early childhood education, management, school types, cluster reports and good practice reports.
ERO reports on individual schools and services are available to the public. They can be obtained from the individual school or service, from any ERO office, or from the ERO website, www.ero.govt.nz
The New Zealand Qualifications Authority Mana Tohu Mātauranga o Aotearoa is a Crown agency reporting directly to the Minister of Education. Its aim is to promote improvement in the quality of education and training in New Zealand. Its main functions are to develop and maintain a comprehensive, flexible and accessible National Qualifications Framework; oversee the setting of standards for qualifications; ensure New Zealand qualifications are recognised overseas and overseas qualifications are recognised in New Zealand; and administer national examinations, both secondary and tertiary.
The New Zealand Qualifications Authority's website is www.nzqa.govt.nz
The New Zealand Teachers' Council Te Pouherenga Kaiako o Aotearoa is a Crown entity established under the Education Standards Act 2001. It maintains an on-line register of teachers who meet the requirements of the act, are of good character, are fit to be teachers, are satisfactorily trained to teach, are satisfactory teachers in practice and who hold a current practising certificate.
Teacher registration is compulsory for teachers employed as supervisors in early childhood centres and in private and state schools. Teachers are issued with a practising certificate valid for three years. There were just over 85,000 teachers with current practising certificates at 30 June 2005, compared with 67,000 two years earlier. Renewal of practising certificates depends on teachers demonstrating they remain satisfactory teachers. Teachers who do not meet registration requirements can be employed temporarily with a limited authority to teach.
Names of teachers who have their registrations cancelled, or have conditions placed on renewal of their practising certificates, are placed on the council's publicly-accessible web register.
The council operates reciprocal registration with Australia under the Trans-Tasman Recognition Agreement and links are also maintained with the General Teaching Council for Scotland and other teacher registration bodies in other overseas jurisdictions.
The council is primarily funded from practising certificate fees paid by teachers.
The New Zealand Teachers' Council website is www.teacherscouncil.govt.nz
Boards of trustees. All state and state-integrated schools are governed by boards of trustees. Boards include three to seven parent representatives, the principal of the school and a staff representative. Parent representatives are elected by parents of students enrolled at the school. Where there are students enrolled full time in Year 9 or above, a student representative must also be elected to the board. Boards may co-opt additional members to ensure, for instance, that there is a sex balance and that the board reflects the ethnic and socio-economic diversity of the student body of the school. The proprietors of integrated state schools have the right to appoint up to four representatives to boards of trustees. Boards of trustees work in partnership with their communities, principals, staff and the government to ensure the best possible educational outcomes for their students. In consultation with its community, each board develops a school charter, which communicates the vision and direction of the school, its goals for the long and short term and its approach to meeting legal responsibilities. Boards of trustees are accountable for meeting objectives in their charter and for managing funds they receive from the government to run the school. They are required to present an annual report to their community and the Ministry of Education in April/May of each year.
Tertiary councils. Under the Education Act 1989, polytechnics are controlled by councils, members of which represent business, industry, local authorities, universities, women's and ethnic groups, as well as other educational and community interests. Colleges of education councils include representatives from universities and teacher organisations, while wānanga have their own councils, made up of representatives from their communities. Universities are established under their own acts of parliament and the council of each university is the governing body.
New Zealand Register of Quality Assured Qualifications. The New Zealand Register of Quality Assured Qualifications Te āhurutanga provides a comprehensive list of all quality assured qualifications (40 credits and over). It includes all qualifications on the National Qualifications Framework, as well as qualifications developed by tertiary education organisations. Key purposes of the register, administered by the New Zealand Qualifications Authority, are to identify all quality assured qualifications in New Zealand; ensure that all qualifications have a purpose and a relation to each other that students and the public can understand; maintain and enhance learners' ability to transfer credits by establishment of a common system of credit; and enhance and build on the international recognition of New Zealand qualifications. Register requirements ensure a level of consistency of description across all quality assured qualifications, regardless of whether they are awarded by a school or university, are academic or vocational, or are a six-month or three-year qualification. The public face of the register is the website www.kiwiquals.govt.nz
Learning Media Ltd Te Pou Taki Korero is a state-owned enterprise whose services and products contribute significantly to education in New Zealand and internationally.
In New Zealand, Learning Media Ltd produces many of the educational resources the Ministry of Education provides to teachers and students, as well as designing and delivering key professional development programmes. It is the world's largest publisher of te reo Māori resources and publishes in six Pasifika languages.
Learning Media Ltd also produces educational resources in a variety of media for other New Zealand Government, local government, commercial and not-for-profit organisations.
Learning Media Ltd exports to Asia, Africa, Australia, Canada, Scandinavia, the Pacific, the United Kingdom and the United States. Export sales of educational resources and professional development services make up about 20 percent of Learning Media Ltd's annual revenue of more than $25 million. The Learning Media Ltd website is www.learningmedia.co.nz
 -->
-->The New Zealand School Journal celebrates 100 years of continuous publication in 2007.
Table 9.01 shows that government spending on education from 1992/93 to 2005/06 increased steadily, both in dollar terms and as a proportion of government expenses.
Table 9.01. Government expenditure on education
| Year | Education expense | Gross domestic product1 | Education expenses as a percentage of GDP | Total government expenses | Education expenses as a percentage of government expenses |
|---|---|---|---|---|---|
1This is the expenditure measure of GDP and may differ slightly from figures published previously, which were based on the production measure of GDP. 2Education and total government expenses from 1997/98 exclude GST on Crown spending. 3Forecast – 2005 Pre-election Economic and Fiscal Update. Sources: Ministry of Education, Statistics New Zealand. The Treasury | |||||
| $(million) | Percent | $(million) | Percent | ||
| 1992/93 | 4,539 | 75,246 | 6.0 | 31,429 | 14.4 |
| 1993/94 | 4,627 | 81,387 | 5.7 | 29,639 | 15.6 |
| 1994/95 | 4,803 | 87,052 | 5.5 | 30,400 | 15.8 |
| 1995/96 | 4,949 | 92,679 | 5.3 | 31,743 | 15.6 |
| 1996/97 | 5,335 | 96,911 | 5.5 | 32,953 | 16.2 |
| 1997/982 | 5,162 | 97,107 | 5.3 | 32,852 | 15.7 |
| 1998/99 | 5,337 | 98,277 | 5.4 | 34,367 | 15.5 |
| 1999/2000 | 5,712 | 103,798 | 5.5 | 34,536 | 16.5 |
| 2000/01 | 6,136 | 106,183 | 5.8 | 36,699 | 16.7 |
| 2001/02 | 6,473 | 110,097 | 5.9 | 37,970 | 17.0 |
| 2002/03 | 7,016 | 128,810 | 5.4 | 41,749 | 16.8 |
| 2003/04 | 7,585 | 140,273 | 5.4 | 41,608 | 18.2 |
| 2004/053 | 8,119 | 149,196 | 5.5 | 46,317 | 18.0 |
| 2005/063 | 8,683 | 156,481 | 5.5 | 48,449 | 17.9 |
Early childhood education funding is payable to chartered early childhood service providers. To be chartered, a service must be licensed under the Education (Early Childhood Centres) Regulations 1998, or comply with the Education (Home-based Care) Order 1992.
To receive government funding, a service must be open continuously for at least two and-a-half hours a day. Each service can claim funding for a maximum of six hours a child place a day, up to 30 hours a child place a week.
The funding subsidy is not intended to cover the full cost of providing early childhood education. It is expected that parents will contribute to the cost of services by way of fees, donations or fund-raising activities.
A new early childhood education funding system was introduced on 1 April 2005. The new system is based on the cost drivers of providing early childhood education, and subsidy rates now more accurately reflect the costs of providing early childhood education. Funding rates for teacher-led, centre-based services depend on whether the service is all-day or sessional (all-day funding rates are higher because of higher staff:child ratio requirements); the proportion of registered teacher hours; and the age of children attending the service. Funding rates for teacher-led, home-based care and parent/whānau-led services depend on whether the home-based care network or parent/whānau-led service meets the standard or quality rate requirements; and the age of children attending the service.
Other funding streams available to early childhood education services are:
Equity funding (available for chartered community-based early childhood services that meet criteria set out by the Ministry of Education).
Support grant for provisionally-registered teachers (available to teacher-led services).
An annual top up for isolated services (available to isolated services generating between $5,000 and $20,000 in funding subsidy and equity funding between 1 June and 31 May each year).
Limited funding is also available for licence-exempt services as a contribution towards the basic costs of operating such services.
Compulsory schooling in New Zealand is funded for state and state-integrated schools at levels adequate to ensure delivery of the curriculum to all students entitled to attend school. State and state-integrated schools receive funding from the Ministry of Education for operational funding, staffing entitlement, school property and school transport assistance. Expenditure is controlled by each school's board of trustees, with the board's financial management audited by the Audit Office.
Private schools receive a government subsidy and charge student fees.
For all schools, education provision, school management and governance are reviewed by the Education Review Office.
Operational funding. Operational funding levels vary according to school type, student numbers and year levels, and the school's property profile. State and state-integrated schools receive operational funding on an entitlement and a targeted basis. Many boards of trustees choose to supplement this resourcing with funds raised by the local community to provide for extra activities and staffing. Schools may also receive the following targeted funding entitlements:
Māori language resourcing – levels of funding depend on the level of Māori immersion contained in the programme.
Targeted funding for educational achievement – funds to address barriers to learning associated with socio-economic factors, based on the school's roll and the location of students' homes.
Targeted funding for isolation – to recognise the additional costs of accessing the goods and services needed to operate an isolated school and to deliver the curriculum.
Careers information grant – to provide school-based careers information for secondary students.
Secondary Tertiary Alignment Resource (STAR) – for senior programmes in area and secondary schools.
Special education grant and learning support funding – to assist with support for students with moderate special education needs.
Supplementary funding is also available to support students with verified high and very high special education needs and for students needing programmes of English for speakers of other languages.
Staffing entitlement. Schools receive a formula-driven entitlement to employ teachers. This provides schools with a measure of security and stability, enabling them to make long-term decisions about students' curriculum and pastoral care needs. Above entitlement, additional staffing is provided in response to specifically identified needs. Teachers' salary funding is managed centrally and accessed through the Ministry of Education's education service payroll.
School property. New Zealand's state school property portfolio consists of about 2,300 schools and 1,300 houses. There are also more than 300 state-integrated schools which, although part of the state network, are not owned by the Ministry of Education, but by individual proprietors, mainly representing the Catholic church. These proprietors may charge attendance dues to finance capital work, whereas this is the responsibility of the Ministry of Education for full state schools. Of the full state school portfolio, 70 percent of schools are located in urban areas and 30 percent in rural areas. There are nearly 21,000 individual buildings, of which 90 percent were constructed after 1950. Replacement value of the portfolio, excluding state-integrated schools, is $11 billion. Managing state school property is a shared responsibility between the ministry and each school's board of trustees. The ministry represents the owner, provides advice to both schools and the government on property management policies, and allocates capital funding to schools for property-related works. The ministry also maintains a database of all land and buildings, arranges insurance, town-planning designations, building warrants of fitness, the sale of surplus property, and administers housing for some teachers and caretakers. Boards of trustees for both state and integrated schools manage schools on a daily basis, ensuring all building, health and safety laws are met, as well as planning and implementing property-related works to maintain and improve the teaching and learning environment of schools. Ownership of approximately 1,000 houses has transferred to boards of trustees.
School transport. School children in New Zealand who have to travel long distances to school in areas where there is no public transport may be entitled to use a government-subsidised school bus, or get financial help for transport. Special education students also receive transport assistance, usually in the form of taxis. Around 100,000 children use school buses each year. Bus operators are contracted to the Ministry of Education and to schools. About another 9,000 students receive transport allowances because they cannot use a school bus or need to travel long distances to do so. Approximately 2,300 school bus services carry students to and from school each day.
School boarding bursaries. Boarding assistance is available to school pupils who need to live away from home in order to receive their education. The annual value of a school boarding bursary is $2,725, paid to the school in equal amounts at the end of each term.
The biggest share of the funding of tertiary education is the student component of the integrated funding framework. The student component is largely demand driven – meaning that additional enrolments in most areas generate extra funding.
This student component of the funding system funds tertiary institutions in bulk according to the number of equivalent full-time students and the fields of study those students undertake. Each provider describes its planned tertiary education provision in an annual profile, which is subject to approval for funding purposes by the Tertiary Education Commission.
In 2004, 247,733 equivalent full-time students (EFTS) were funded at a cost of $1.883 billion. The number of funded EFTS rose by 117 percent between 1991 and 2004. In 2002, the 220,340 EFTS were funded at a cost of $1.617 billion, while two years earlier, in 2000, 177,847 EFTS were funded with $1.274 billion. Government funding is supplemented by student fees.
Research activities of the tertiary education sector are funded through the Performance Based Research Fund.
Private training establishments (PTEs). In 2004, the government provided $126 million to 236 private providers to subsidise tertiary tuition costs for more than 20,500 equivalent full-time students (EFTS). The government reduced the tuition subsidy by 9.5 percent in 2003 and also capped EFTS-based funding for PTEs at $146 million. The role of PTEs is to provide niche education that complements public providers.
Rural children who have to travel long distances to school are able to use a government-subsidised school bus.
StudyLink is a service of the Ministry of Social Development and provides financial support for students aged 18 and over attending a secondary school or tertiary education provider. Some students aged 16 and 17 may also be eligible to receive assistance.
Types of financial assistance available include Student Allowance, Accommodation Benefit. Student Loans, Unemployment Benefit Student Hardship, Accommodation Supplement, Disability Allowance and other non-beneficiary support. StudyLink also administers Step Up Scholarships and manages payment for Top Scholar Scholarships.
The StudyLink website is www.studylink.govt.nz
Student Allowance. Student Allowance is a weekly payment to help students with living costs while they are in full-time study. Students must meet specific eligibility criteria, and for some students under the age of 25, there is a parental income test. Students eligible for a Student Allowance may also be eligible for an Accommodation Benefit, which assists with accommodation costs. Student Allowance and Accommodation Benefit rates are reviewed annually. Table 9.02 overleaf shows recent trends in the number of students receiving Student Allowance, Accommodation Benefit and Bursary payments, and levels of expenditure on these programmes.
Table 9.02. Student Allowance, Accommodation Benefit, Bursary
By student numbers and amounts
paid
Years ending 31
December
| 2000 | 2001 | 2002 | 2003 | 2004 | |
|---|---|---|---|---|---|
1A student is a person who received at least one payment in the calendar year specified. Source: Ministry of Social Development | |||||
| Number of students1 | |||||
| Student Allowance | 68,084 | 70,231 | 68,869 | 64,036 | 60,826 |
| Accommodation Benefit | 53,255 | 54,366 | 53,508 | 50,429 | 48,183 |
| Bursary | 14,773 | 14,603 | 14,199 | 14,060 | 14,841 |
| Amounts paid | $ | ||||
| Student Allowance | 397,235,377 | 367,453,027 | 366,745,446 | 350,563,532 | 341,091,714 |
| Accommodation Benefit | 41,723,972 | 42,655,284 | 42,378,868 | 42,035,984 | 42,623,300 |
| Bursary | 2,338,200 | 2,310,800 | 2,245,200 | 2,210,900 | 2,341,400 |
| Average | $ | ||||
| Student Allowance | 5,834 | 5,232 | 5,325 | 5,474 | 5,608 |
| Accommodation Benefit | 783 | 785 | 792 | 834 | 885 |
Student loans. The Student Loan Scheme was established in 1992 to assist students to participate in tertiary education. The scheme allows students to borrow for study fees, course-related costs and living costs. The amount and component borrowed is dependent on the course undertaken and the full or part-time nature of the course. StudyLink is responsible for delivery and administration of student loans, including payment of compulsory fees to education providers, and payment of living expenses and course-related costs to students. Living expenses are a maximum of $150 a week and course-related costs cannot exceed $1,000 a year. Students are charged an administration fee of $50 for each loan account accessed. Levels of repayment are based on taxable income. Table 9.03 shows loan money drawn by students, repayments or refunds, and administration fees for recent years.
Table 9.03. Student loans, repayments, administration fees
Years ending 31 December
| 2000 | 2001 | 2002 | 2003 | 2004 | |
|---|---|---|---|---|---|
1A student is a person who received a least one payment in the calendar year specified. 2Standard administration fee is $50. Averages are higher because of a small number of students who have more than one loan in a year. Source: Ministry of Social Development | |||||
| Number of students1 | |||||
| Fees | 122,833 | 138,334 | 139,323 | 144,678 | 145,549 |
| Course-related costs | 72,591 | 94,319 | 96,563 | 101,664 | 98,506 |
| Living costs | 70,982 | 77,405 | 77,699 | 79,373 | 77,507 |
| Repayments or refunds | 41,087 | 35,586 | 37,474 | 38,278 | 42,079 |
| Administration charges | 128,104 | 143,703 | 144,952 | 150,754 | 150,899 |
| Amounts paid | $ | ||||
| Fees | 468,864,957 | 551,265,300 | 560,550,975 | 593,922,339 | 589,607,800 |
| Course-related costs | 65,008,000 | 88,177,896 | 90,810,508 | 95,143,228 | 92,390,309 |
| Living costs | 241,736,567 | 268,628,200 | 281,638,016 | 297,737,889 | 292,994,326 |
| Repayments or refunds | -35,943,724 | -39,310,502 | -43,808,978 | -51,210,852 | -58,160,065 |
| Administration charges | 6,498,450 | 7,334,350 | 7,418,150 | 7,717,100 | 7,713,100 |
| Average | $ | ||||
| Fees | 3,817 | 3,985 | 4,023 | 4,105 | 4,051 |
| Course-related costs | 896 | 935 | 940 | 936 | 938 |
| Living costs | 3,406 | 3,470 | 3,625 | 3,751 | 3,780 |
| Repayments or refunds | -875 | -1,105 | -1,169 | -1,338 | -1,382 |
| Administration charges2 | 51 | 51 | 51 | 51 | 51 |
Unemployment Benefit – Student Hardship. The Unemployment Benefit – Student Hardship is available to some students for breaks in study that are more than three weeks when they have been unable to find employment. Specific eligibility criteria must be met for this form of assistance.
Scholarships. StudyLink administers Step Up Scholarships for students studying certain human and animal health courses. These were introduced in September 2003 for study in 2004. The scholarships contribute towards a student's compulsory study fees only. At 31 December 2004, the average value of the 214 scholarships awarded was $3,695.
Other financial assistance. StudyLink also administers a range of supplementary assistance for students, such as help with childcare, accommodation expenses, or disability costs. Eligibility is dependent on individual circumstances.
The Rural Education Activities Programme is a community-managed package of educational resources operating in 13 rural communities. These range from the Far North to Southland, plus the Eastern Bay of Plenty, Tairawhiti (East Coast), Central Plateau. Central King Country, Ruapehu, Tararua (Southern Hawke's Bay), Wairarapa, Marlborough, Buller, Westland and Central Otago.
Each programme provides educational support and assistance across all education sectors, from early childhood and primary and secondary education to adult and community education.
The adult and community education sector has a range of activities and programmes, including access to information about adult learning opportunities and assistance with meeting adult education needs identified by the community, along with information and advice on community development, piloting new learning methods and managing projects and programmes.
In January 2005, the Tertiary Education Commission took over Rural Education Activities Programme funding for adult and community education from the Ministry of Education. The ministry continues to fund the early childhood, primary and secondary education sectors covered by the programme.
By 2021, the Māori population will have grown by 30 percent on the 2001 figure and Māori will make up more than 16 per cent of the total New Zealand population.
The majority of Māori students are in mainstream education, although there has been a steady increase in the number of Māori participating in kaupapa Māori education. Kōhanga reo, kura kaupapa Māori, wharekura and wánanga have all grown from Māori initiatives and their success and growth is in part due to the fact that they have been designed and delivered to meet Māori needs.
The government has a number of programmes in place focussing specifically on Māori learners within early childhood education, compulsory schooling and tertiary education.
Ensuring Māori participate and achieve in the education system involves:
Building strong early learning foundations for Māori through participation in quality early childhood education services.
Supporting provision of strong Māori language education options, such as kōhanga reo, kura kaupapa Māori and bilingual education.
Raising the success of Māori in mainstream education.
Building Māori involvement and authority in education through partnerships with Māori organisations and iwi.
Recognising the important role that parents and whānau play in supporting their children's education.
The purpose of the Māori Education Trust Te Tari O Te Kaitiaki Mo Ngā Take Mātauranga Māori is to promote and encourage the better education of Māori and to provide financial assistance for that purpose.
The trust assists all Māori, regardless of age, sex, tribal affiliation or geographic location, with income derived from two dairy farms, from investment interest and from contracts for services (scholarship administration) with the Ministry of Education and other organisations.
The trust administers and co-sponsors several scholarships, bursaries and grants for Māori attending secondary and tertiary (undergraduate and postgraduate) courses, both in New Zealand and overseas.
The trust has been the major sponsor of the Ngā Manu Korero speech competitions for secondary school students. These competitions allow Māori students to participate in either te reo Māori or English. Taonga awarded give both successful students and their schools considerable mana.
The trust also administers the Ngarimu VC and 28th (Maori) Battalion Memorial Essay Competition, and several past contestants have become leaders in Māori and New Zealand society.
The trust distributes approximately $6.8 million for Māori education annually.
The Māori Education Trust website is www.maorieducation.org.nz
Early childhood education refers to the non-compulsory provision of education and care for infants, toddlers and young children before they begin school.
Early childhood education is available in New Zealand to children under the age of six through a wide range of services, many of which are administered by voluntary agencies with government assistance.
Many early childhood services have evolved from individual and community initiatives, resulting in a diverse system of education with a high degree of autonomy. Early childhood education programmes are based on a wide range of philosophies framed by the early childhood education curriculum document Te Whāriki.
All early childhood services wishing to receive government funding must be licensed and chartered. Licensing ensures that minimum standards of quality are maintained. A charter contains both mandatory and optional objectives and practices related to the provision of learning opportunities. Chartered groups receive funding direct from the government in the form of a bulk grant. The main licensed providers of early childhood education are education and care services, kindergartens, te kōhanga reo and playcentres. Licensed centres and home-based care networks (excluding kōhanga reo and playcentres) are required to have a coordinator or a person responsible with a Diploma of Teaching (ECE).
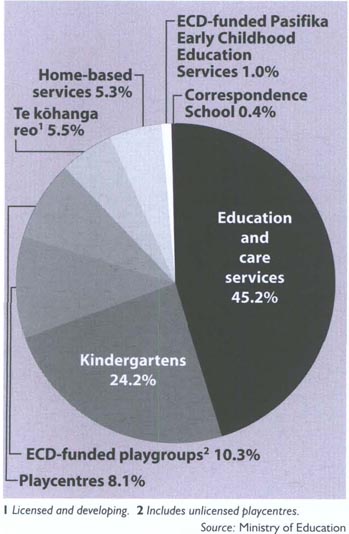
The main licence-exempt providers are playgroups, including groups with a focus on Māori immersion, Pasifika Early Childhood Education Services and general playgroups.
Figure 9.01 shows the percentage of children enrolled in each early childhood education provider.
Kindergartens. Kindergartens are a type of education and care centre run by a kindergarten association. All kindergarten teachers must be registered teachers and hold at least a Diploma of Teaching (ECE). Most kindergartens offer services to children aged between two and-a-half and five. Older children attend morning sessions five days a week and younger children attend afternoon sessions three days a week. Some kindergartens offer all-day sessions and may take children under two years. Each kindergarten is run by a committee of parents and people from the community. Each committee reports to a kindergarten association. Kindergartens usually ask for a parent donation or fee. As at 1 July 2005, 44,920 children were enrolled in 618 kindergartens.
Playcentres. In playcentres, parents, whānau and caregivers support their children's early learning. Most playcentres are licensed and/or chartered services that offer learning through play for children from birth to school age. Each playcentre sets times for its own sessions and children can attend up to five sessions a week. People become members of a playcentre when they enrol their child. They are then involved in running the centre and take part in the daily programme. Each centre is linked to a regional association, which belongs to the New Zealand Playcentre Federation. Parents, whānau and caregivers are encouraged to work towards a playcentre qualification. Playcentres usually charge fees. As at 1 July 2005. 15,059 children were enrolled in 482 playcentres.
Kōhanga reo. Kōhanga reo build young children and their parents' knowledge of te reo Māori (language) and tikanga (culture), with parents and whānau closely involved in the child's learning and development. Children can be part of the kōhanga reo total immersion environment, where te reo is the only language used, from birth to five years of age. Parents are responsible for management and operation of their kōhanga reo and are encouraged to take part in the daily programme. Kōhanga reo have a whānau contribution system, which may vary according to the needs of the whānau. This contribution can be koha, donations for food and/or paying fees. At 1 July 2005, 10,070 children were enrolled in 501 kōhanga reo.
Parents as First Teachers. Based on programmes developed in the United States by the Missouri State Department of Education, Parents as First Teachers (PAFT) programmes provide a series of regular home visits by early childhood educators to parents with children from birth to three years. The programmes were developed in the belief that parents are their children's first and most important teachers, and that by empowering them in their parenting role, parents will become more confident, and participate more effectively, in development and education of their children. Core elements of the programme provide individualised support through a structured learning series on child development and the fostering of early learning. Programmes are funded directly by the government and cover most regions of New Zealand, involving around 8,000 families. A range of organisations are contracted to provide PAFT programmes.
Pasifika Early Childhood Education Services. Pasifika Early Childhood Education Services offer programmes based on the values and languages of Pasifika cultures. The services cover Samoan, Cook Islands Maori, Niuean, Tongan, Tokelauan, Tuvaluan and Fijian nationalities. Services range from licence-exempt groups (playgroups) meeting once or twice a week to licensed and chartered education and care centres meeting all day, five days a week. Programmes have high parental involvement and emphasise language development, both in Pacific languages and English, and increased parental knowledge in early childhood care and education. Nearly all Pasifika Early Childhood Education Services are community owned and operated. At 1 July 2005, there were 96 Pasifika education and care centres, mostly in the Auckland region.
Education and care services. Education and care services are licensed and/or chartered early childhood centres offering all-day or part-day services. Education and care services include church, workplace and childcare centres that may be run by either community or private owners, and may be based on a specific culture. Some services may be based around certain beliefs about, or methods of, education, such as Montessori or Rudolph Steiner centres. Teachers in charge must be registered teachers holding a Diploma of Teaching (ECE) or similar qualification. At 1 July 2005, nearly half of all teachers in education and care services held a Diploma of Teaching (ECE) or higher qualification. Depending on the centre, children may be accepted from birth to school age. Casual services, such as those in shopping malls and gyms, where children stay for only a short time, are included in this service type. In most education and care services, children need to be enrolled for a set period of time. Education and care services usually charge fees. Parents, whānau or caregivers can be involved with management committees, or act as voluntary helpers or fundraisers. At 1 July 2005, 83,889 children were enrolled in 1,754 education and care services.
Home-based education and care services. Home-based services involve a caregiver providing education and care for small groups of young children in their home as part of a chartered home-based education and care network. Caregivers in home-based networks provide full-day or part-day education and care. They may also provide emergency care. The work of the caregiver is supported by a registered teacher (coordinator) from the network. The coordinator helps parents choose the right caregiver for their child and supports the child's learning programme. The coordinator visits the home-based caregiver regularly to check on the child's safety, well-being and learning progress. Home-based care services usually charge fees. At 1 July 2005, 9,770 children were enrolled across 201 home-based networks.
Playgroups. Playgroups are licence-exempt, community-based, non-profit groups of parents who meet to provide early childhood education for their children. Funded community playgroups are exempt from licensing, but must meet criteria set down by the Ministry of Education. Active participation of parents is required at all sessions. Many licence-exempt groups work with Ministry of Education staff to develop the programmes of learning they offer. There were 21,007 children enrolled in playgroups at 1 July 2005.
Compulsory education in New Zealand is divided into primary, intermediate and secondary schooling.
Primary schools cater for children from the age of five (Year 0) to the end of Year 6. Children in Years 7 and 8 may either go to a separate intermediate school, or to part of a primary, secondary or composite/area school. Secondary schools usually provide for students from Year 9 until the end of Year 13. Adult students who return to school enter in the year of the majority of their subjects. Composite/area schools, usually based in rural areas, combine primary, intermediate and secondary schooling at one location.
A child aged between five and six, starting primary school for the first time between July (when the school roll is counted) and the end of that school year, is classed as Year 0. Children who begin school for the first time between 1 January and before the July roll count, are classed as Year 1. Children who start school for the first time after the age of six, are placed in the same year as other children of the same age.
Primary schools are required to be open for at least 394 half days each year and secondary schools for at least 380 half days. The New Zealand school year is divided into four terms of approximately even length.
Table 9.04 shows the level of highest achievement, the sex and the ethnicity of secondary school leavers in 2004.
Table 9.04. Secondary school leavers in 2004
By
level of highest attainment, sex and ethnic
identification
| Highest attainment | European/Pākeha | Māori | Pacific Island | Asian | Other | Total | ||||||||||||
|---|---|---|---|---|---|---|---|---|---|---|---|---|---|---|---|---|---|---|
| Male | Female | Total | Male | Female | Total | Male | Female | Total | Male | Female | Total | Male | Female | Total | Male | Female | Total | |
– nil or zero Source: Ministry of Education | ||||||||||||||||||
| NZ Scholarship or other NQF Qualification at Level 4 or higher | 56 | 35 | 91 | 1 | 4 | 5 | – | – | – | 20 | 9 | 29 | 2 | 1 | 3 | 79 | 49 | 128 |
| NCEA Level 3 or other Level 3 NQF Qualification | 4,698 | 6,833 | 1,153 | 380 | 628 | 1,008 | 170 | 260 | 430 | 1,033 | 1,286 | 2,319 | 127 | 148 | 275 | 6,408 | 9,155 | 15,563 |
| 42+ credits at Level 3 or above (with University Entrance requirements) | 791 | 657 | 1,448 | 96 | 132 | 228 | 51 | 92 | 143 | 166 | 142 | 308 | 13 | 19 | 32 | 1,117 | 1,042 | 2,159 |
| 30+ credits at Level 3 or above | 1,435 | 1,274 | 2,709 | 319 | 349 | 668 | 193 | 273 | 466 | 284 | 264 | 548 | 65 | 67 | 132 | 2,296 | 2,227 | 4,523 |
| NCEA Level 2 or other Level 2 NQF qualification | 3,948 | 3,579 | 7,527 | 1,006 | 1,055 | 2,061 | 528 | 554 | 1,082 | 358 | 310 | 668 | 125 | 103 | 228 | 5,965 | 5,601 | 11,566 |
| 30+ credits at Level 2 or above | 1,544 | 1,060 | 2,604 | 493 | 553 | 1,046 | 217 | 170 | 387 | 145 | 93 | 238 | 47 | 35 | 82 | 2,446 | 1,911 | 4,357 |
| NCEA Level 1 or other Level 1 NQF Qualification | 2,151 | 1,391 | 3,542 | 759 | 709 | 1,468 | 241 | 205 | 446 | 150 | 100 | 250 | 53 | 40 | 93 | 3,354 | 2,445 | 5,799 |
| 40+ credits at any level including literacy and numeracy for NCEA Level 1 | 185 | 117 | 302 | 96 | 87 | 183 | 23 | 14 | 37 | 4 | 5 | 9 | 1 | – | 1 | 309 | 223 | 532 |
| 40+ credits at any level without literacy and numeracy for NCEA Level 1 | 582 | 400 | 982 | 229 | 233 | 462 | 72 | 71 | 143 | 18 | 18 | 36 | 16 | 7 | 23 | 917 | 729 | 1646 |
| 14–39 credits at any level including literacy and numeracy for NCEA Level 1 | 63 | 50 | 113 | 27 | 44 | 71 | 50 | 10 | 60 | 11 | 8 | 19 | 1 | 12 | 152 | 113 | 265 | |
| 14–39 credits at any level without literacy and numeracy for NCEA Level 1 | 610 | 375 | 985 | 344 | 354 | 698 | 138 | 101 | 239 | 38 | 23 | 61 | 14 | 5 | 19 | 1,144 | 858 | 2002 |
| 1–13 credits at level 1 | 352 | 254 | 606 | 255 | 250 | 505 | 89 | 53 | 142 | 32 | 24 | 56 | 22 | 8 | 30 | 750 | 589 | 1339 |
| No formal attainment | 1,618 | 1,155 | 2,773 | 1,131 | 1,049 | 2,180 | 301 | 204 | 505 | 113 | 76 | 189 | 68 | 40 | 108 | 3,231 | 2524 | 5755 |
| Total | 18,033 | 17,180 | 35,213 | 5,136 | 5,447 | 10,583 | 2,073 | 2,007 | 4,080 | 2,372 | 2,358 | 4,730 | 554 | 474 | 1,028 | 28,168 | 27,466 | 55,634 |
While most students in New Zealand attend state-funded schools, parents or caregivers and students have the choice of a number of schooling options.
State schools. State schools are co-educational (mixed sexes) at primary and intermediate level, but some offer single-sex education at secondary level. Lessons are based on the New Zealand curriculum. Some state schools offer special programmes for adult students, or run community education classes.
Integrated schools. Integrated schools are those that used to be private and have now become part of the state system. They teach the New Zealand curriculum, but keep their own special character (usually a philosophical or religious belief) as part of their school programme. Integrated schools receive the same government funding for each student as state schools, but as their buildings and land are privately owned, they charge attendance dues to meet property costs.
Kura kaupapa Māori. Kura kaupapa Māori are state schools where teaching is in the Māori language (te reo Māori) and is based on Māori culture and values. The curriculum is the same as at other state schools. Kura kaupapa cater for students from Years 1–8 or Years 1–13. The schools build on kōhanga reo (Māori language early childhood education centres). A key goal of kura kaupapa is to produce students who are equally skilled in both Māori and English.
Independent schools. Independent (or private) schools are governed by their own independent boards, but must meet certain standards in order to be registered. Independent schools may be either co-educational or single sex. They charge fees, but also receive government funding.
Boarding schools. Boarding schools may either be independent or part of a state-funded school. All charge boarding fees.
The Correspondence School. The Correspondence School Te Kura ā Tuhi is a national state school funded by the Ministry of Education and administered by a board of trustees. The school has a roll of about 20,000 students in New Zealand and overseas. It provides a mixture of full-time, part-time and dual-enrolment courses for early childhood, primary, secondary and adult students. The school offers a wide range of courses, including a number at National Certificate of Educational Achievement level, in addition to practical subjects, such as art, computing and science. The Correspondence School website is www.correspondence.school.nz
Home-based schooling. Home-based schooling is available for parents and caregivers who want to educate their children at home. Parents and caregivers need approval from the Ministry of Education and must educate their children at least as regularly and as well as at a registered school. Home-based schooling parents and caregivers are given an annual grant to help with the cost of learning materials and can choose to purchase teaching services from the Correspondence School. Home-schooled children in New Zealand account for approximately 1 percent of total school enrolments.
Designated character schools. Designated character schools are state schools that teach the New Zealand curriculum, but have been allowed to develop their own set of aims, purposes and objectives to reflect their particular values.
Special schools. Special schools are state schools that provide education for students with special education needs. The curriculum is the same as at other state schools. New Zealand has eight residential special schools.
Assessment information gathered about the progress and achievement of students is used to improve the quality of teaching programmes. Most assessment information comes from ongoing classroom assessment.
Students' strengths and weaknesses identified as a result of assessment are shared with students and parents. Parents are also entitled to ask for meetings with teachers to talk about their child's progress.
Table 9.05 shows years in attendance, the sex and the ethnicity of those who left secondary school during 2004.
Table 9.05. Secondary school leavers in 2004
By
year of schooling, sex and ethnicity
| Year of Schooling | European/Pakeha | Māori | Pacific Island | Asian | Other | Total | ||||||||||||
|---|---|---|---|---|---|---|---|---|---|---|---|---|---|---|---|---|---|---|
| Male | Female | Total | Male | Female | Total | Male | Female | Total | Male | Female | Total | Male | Female | Total | Male | Female | Total | |
Source: Ministry of Education | ||||||||||||||||||
| Year 9 | 33 | 18 | 51 | 39 | 23 | 62 | 5 | 1 | 6 | 3 | 1 | 4 | 1 | 1 | 2 | 81 | 44 | 125 |
| Year 10 | 423 | 216 | 639 | 255 | 183 | 438 | 56 | 22 | 78 | 19 | 10 | 29 | 12 | 4 | 16 | 765 | 435 | 1,200 |
| Year 11 | 2,526 | 1,587 | 4,113 | 1,183 | 1,193 | 2,376 | 287 | 189 | 476 | 89 | 70 | 159 | 38 | 30 | 68 | 4,123 | 3,069 | 7,192 |
| Year 12 | 4,789 | 3,804 | 8,593 | 1,525 | 1,540 | 3,065 | 463 | 386 | 849 | 327 | 238 | 565 | 115 | 88 | 203 | 7,219 | 6,056 | 13,275 |
| Year 13 | 9,783 | 11,174 | 20,957 | 1,962 | 2,335 | 4,297 | 1,152 | 1,345 | 2,497 | 1,824 | 1,966 | 3,790 | 360 | 326 | 686 | 15,081 | 17,146 | 32,227 |
| Year 14 | 428 | 331 | 759 | 154 | 153 | 307 | 101 | 57 | 158 | 100 | 60 | 160 | 24 | 23 | 47 | 807 | 624 | 1,431 |
| Year 15 | 51 | 50 | 101 | 18 | 20 | 38 | 9 | 7 | 16 | 10 | 13 | 23 | 4 | 2 | 6 | 92 | 92 | 184 |
| Total | 18,033 | 17,180 | 35,213 | 5,136 | 5,447 | 10,583 | 2,073 | 2,007 | 4,080 | 2,372 | 2,358 | 4,730 | 554 | 474 | 1,028 | 28,168 | 27,466 | 55,634 |
Achievement by primary students across New Zealand is monitored on a four-year rolling cycle by assessing around 3 percent of eight and 12-year-olds. The National Education Monitoring Project covers all New Zealand curriculum learning areas. At secondary school level, results from the National Certificate of Educational Achievement are used to provide national information about student achievement. A sample of New Zealand students also participate in international assessment studies to measure achievement levels against those of other Organisation for Economic Co-operation and Development countries.
Table 9.06 shows grades earned by students in NCEA Level 3 and Scholarship in 2004.
Table 9.06. NCEA Level 3 and Scholarship results
By subject
Year ending
31 December 2004
| Subject | Not achieved | Achieved | Merit | Excellence | Scholarship/distinction1 |
|---|---|---|---|---|---|
1Scholarship results are expressed as a percentage of students entering that subject at level 3. Distinction was a one-off award for 2004. Note:The above results are for major subjects taken by more than 2,000 candidates from a total candidature of approximately 29.400 Year 13 students. Source: New Zealand Qualifications Authority | |||||
| Percent | |||||
| Accounting | 26.5 | 34.2 | 24.0 | 15.4 | 4.4 |
| Biology | 35.8 | 39.0 | 18.8 | 6.4 | 0.9 |
| Chemistry | 36.8 | 32.9 | 16.2 | 14.1 | 2.7 |
| Classical studies | 31.6 | 31.6 | 26.0 | 10.7 | 2.4 |
| Design | 5.9 | 47.9 | 28.0 | 18.1 | 2.5 |
| Economics | 43.2 | 38.6 | 13.4 | 4.7 | 0.6 |
| English | 28.7 | 43.9 | 20.2 | 7.2 | 1.5 |
| Geography | 21.8 | 44.0 | 24.3 | 10.0 | 1.8 |
| History | 27.0 | 37.1 | 24.1 | 11.8 | 2.3 |
| Mathematics with calculus | 32.8 | 45.2 | 17.6 | 4.4 | 2.7 |
| Media studies | 19.7 | 42.4 | 25.3 | 12.6 | 1.0 |
| Painting | 4.8 | 52.2 | 26.8 | 16.1 | 2.3 |
| Photography | 16.8 | 44.7 | 23.5 | 14.9 | 2.8 |
| Physical education | 0.0 | 55.6 | 30.6 | 13.8 | 0.7 |
| Physics | 30.2 | 41.1 | 18.9 | 9.8 | 1.6 |
After finishing compulsory schooling, many New Zealanders continue their education at tertiary level. The tertiary sector encompasses adult and community education, industry training, foundation education (basic skills usually acquired at school) and study at tertiary institutions, such as universities, colleges of education, polytechnics, wānanga and private training establishments. Ministry of Education figures for 2004 showed around 670,000 New Zealanders participating in tertiary education. This included 139,600 in industry training and Modern Apprenticeship programmes, 30,000 in targeted training and 455,000 in other formal tertiary education. Figure 9.02 shows attendance figures for selected tertiary institutions.
The number in industry training was up 75 percent on those involved in 2000, while other formal enrolments by domestic students rose by more than 40 percent in the same period. Figure 9.02 shows attendance at tertiary institutions in 2004.
Qualifications gained are part of the 10-level New Zealand Register of Quality Assured Qualifications, which provides a common basis for the level, naming and size of qualifications. The register facilitates transfer between qualifications, so enabling people to build their skills over a lifetime, using a range of delivery options.
In May 2002, the government produced its Tertiary Education Strategy 2002–2007, which set a new direction in tertiary education, explicitly linking learning and research with New Zealand's economic and social development goals and priorities.
The Tertiary Education Commission (TEC) was established in January 2003 under the provisions of the Education (Tertiary Reform) Amendment Act 2002. It is responsible for funding all post-compulsory education and training offered by universities, polytechnics, colleges of education, wānanga, private training establishments, foundation education agencies, industry training organisations and adult and community education providers.
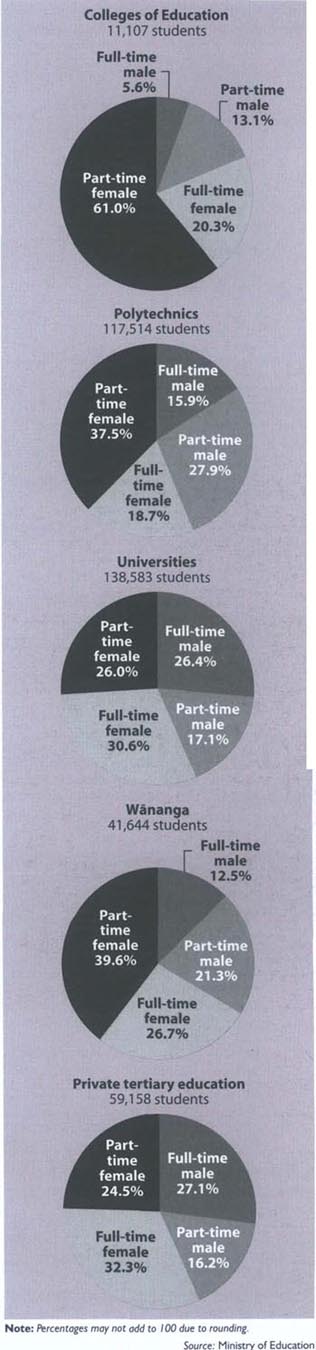
In April 2005, the government produced a Statement of Tertiary Education Priorities 2005–07, which articulated priorities for implementing the Tertiary Education Strategy in the short term. The statement focused on increasing the quality of tertiary education provision and its relevance to the identified national and regional needs of stakeholders. The TEC's key role is to given effect to the priorities in line with the six strategies outlined in the Tertiary Education Strategy:
Strengthen system capability and quality.
Contribute to the achievement of Māori development aspirations.
Raise foundation skills so that all people can participate in the knowledge society.
Develop the skills New Zealanders need for the knowledge society.
Educate for the development and success of Pacific peoples.
Strengthen research, knowledge creation and uptake for the knowledge society.
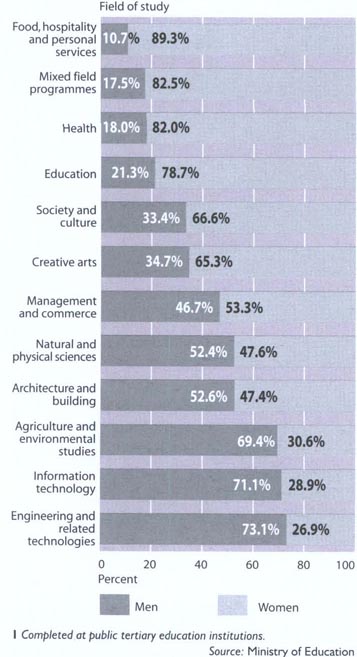
New initiatives to improve student access to tertiary education include the fee and course cost maxima policy that limits increases in course fees.
In addition, in December 2005, the government legislated to remove interest from student loan borrowers while in New Zealand.
Improvements in collaboration and coordination of public tertiary education institutions to offer more effective and diverse education services include mergers between tertiary education institutions and accords and working alliances between education institutions and industry bodies.
The Tertiary Education Commission's website is www.tec.govt.nz
There are eight universities in New Zealand – the University of Auckland, Auckland University of Technology, the University of Waikato, Massey University, Victoria University of Wellington, the University of Canterbury, Lincoln University and the University of Otago.
Universities are controlled by their own councils, established under legislation that maximises their autonomy, consistent with normal requirements of accountability for public funding.
Each university sets its own academic programmes, which are then subject to external quality assurance, and each university council sets dates for terms or semesters.
Councils, which represent the interests of staff, students and the community, set the strategy of the institution, employ the chief executive officer and oversee management of the university.
Councils are also responsible for approving course regulations and for maintaining the equivalences of courses for degrees and other qualifications.
Figure 9.03 illustrates the sex ratio and field of study of selected bachelor degrees completed in 2004.
Polytechnics and Institutes of Technology provide a diverse range of academic, vocational and professional programmes, including trades training, and cover an increasing number of subjects at various levels of specialisation.
There are 20 polytechnics in New Zealand – Northland Polytechnic, UNITEC New Zealand, Manukau Institute of Technology, Waikato Polytechnic, Bay of Plenty Polytechnic, Waiariki Institute of Technology, Tairawhiti Polytechnic, Eastern Institute of Technology, Western Institute of Technology, Universal College of Learning (UCOL), Whitireia Polytechnic, The Open Polytechnic of New Zealand, Wellington Institute of Technology, Nelson Marlborough Institute of Technology, Tai Poutini Polytechnic, Christchurch Polytechnic Institute of Technology, Aoraki Polytechnic, Otago Polytechnic, Telford Polytechnic and Southland Institute of Technology.
Wānanga (Māori tertiary institutions) provide tertiary education and training while assisting the application of knowledge regarding ahuatanga Māori (Māori tradition) in accordance with tikanga Māori (Māori custom). Te Wānanga o Aotearoa in Te Awamutu, Te Wānanga o Raukawa in Otaki and Te Wānanga o Awanuiarangi in Whakatane are governed in the same way as other tertiary institutions.
The Open Polytechnic of New Zealand is the country's only broad-based national polytechnic and the specialist tertiary institution in open and distance learning. In 2004, it had 526 on-campus staff and 36,094 enrolled students. Nearly all students are part-time learners.
The Open Polytechnic is a major educator of people in the workforce. A large proportion of its students are adult learners in paid employment who study in their own time to enhance their career opportunities.
In 2004, The Open Polytechnic received the Commonwealth of Learning's Award for Institutional Excellence in Distance Education and, in 2005, the Vero Award for Excellence in Business Support for its contribution to business education and training.
The Schools of Business, Information and Social Sciences, and Workplace Learning and Development are integrated within a single faculty at the polytechnic's Lower Hutt campus.
The Open Polytechnic offers more than 1,300 courses and 150 programmes, ranging from national certificate to diploma and degree level. It consults closely with industry and other stakeholders to ensure qualifications are directly related to the requirements of the workplace now and in the future. All degrees and their majors are approved by the New Zealand Qualifications Authority.
As well as supporting individual learners, The Open Polytechnic is leading a major ongoing project supporting eLearning development in New Zealand's tertiary education sector.
The Open Polytechnic of New Zealand website is www.openpolytechnic.ac.nz
There are large numbers of private training establishments (PTEs) in New Zealand, of which about 800 are registered with the New Zealand Qualifications Authority (NZQA).
PTEs that enrol foreign students are required by law to have course approval and accreditation from NZQA. Legislation provides protection for foreign students who pay tuition fees in advance.
PTEs offer a wide range of courses, often in niche markets.
PTE courses that receive state funding are subject to similar standards of accountability as state-funded courses at universities, polytechnics and colleges of education.
Tables 9.07, 9.08 and 9.09 show enrolments at tertiary institutions and qualifications obtained by students in 2004.
Table 9.07. Enrolments at tertiary institutions
By field of study, level of education and
sex
At 31 July 2004
| Field of study | Certificate level | Degree level | Diploma level | Post-graduate level | Total | ||||||||||
|---|---|---|---|---|---|---|---|---|---|---|---|---|---|---|---|
| Male | Female | Total | Male | Female | Total | Male | Female | Total | Male | Female | Total | Male | Female | Total | |
Note:Students max be enrolled in more than one qualification. Source: Ministry of Education | |||||||||||||||
| Natural and physical sciences | 354 | 817 | 1,171 | 7,261 | 6,738 | 13,999 | 160 | 211 | 371 | 1,465 | 1,483 | 2,948 | 9,240 | 9,249 | 18,489 |
| Information technology | 3,740 | 6,121 | 9,861 | 3,028 | 852 | 3,880 | 2,025 | 760 | 2,785 | 282 | 120 | 402 | 9,075 | 7,853 | 16,928 |
| Engineering and related technologies | 9,628 | 1,284 | 10,912 | 5,392 | 1,424 | 6,816 | 4,240 | 536 | 4,776 | 586 | 164 | 750 | 19,846 | 3,408 | 23,254 |
| Architecture and building | 2,938 | 926 | 3,864 | 1,149 | 756 | 1,905 | 1,662 | 582 | 2,244 | 59 | 55 | 114 | 5,808 | 2,319 | 8,127 |
| Agriculture and environmental studies | 4,843 | 2,123 | 6,966 | 728 | 560 | 1,288 | 1,544 | 770 | 2,314 | 291 | 310 | 601 | 7,406 | 3,763 | 11,169 |
| Health | 4,412 | 7,033 | 11,445 | 2,661 | 10,119 | 12,780 | 624 | 3,155 | 3,779 | 756 | 3,015 | 3,771 | 8,453 | 23,322 | 31,775 |
| Education | 1,257 | 3,027 | 4,284 | 2,076 | 9,474 | 11,550 | 1,071 | 6,187 | 7,258 | 514 | 1,844 | 2,358 | 4,918 | 20,532 | 25,450 |
| Management and commerce | 6,437 | 15,069 | 21,506 | 15,157 | 17,476 | 32,633 | 7,497 | 12,048 | 19,545 | 3,277 | 3,258 | 6,535 | 32,368 | 47,851 | 80,219 |
| Society and culture | 4,463 | 8,939 | 13,402 | 11,405 | 20,633 | 32,038 | 6,551 | 12,280 | 18,831 | 2,099 | 4,002 | 6,101 | 24,518 | 45,854 | 70,372 |
| Creative arts | 1,173 | 1,906 | 3,079 | 3,173 | 5,664 | 8,837 | 1,933 | 3,103 | 5,036 | 336 | 491 | 827 | 6,615 | 11,164 | 17,779 |
| Food, hospitality and personal services | 1,459 | 3,922 | 5,381 | 54 | 145 | 199 | 411 | 1,595 | 2,006 | 0 | 0 | 0 | 1,924 | 5,662 | 7,586 |
| Mixed field programmes | 14,967 | 27,724 | 42,691 | 1,705 | 2,797 | 4,502 | 479 | 653 | 1,132 | 2,097 | 2,138 | 4,235 | 19,248 | 33,312 | 52,560 |
| Total enrolments | 55,671 | 78,891 | 13,4562 | 53,789 | 76,638 | 130,427 | 28,197 | 41,880 | 70,077 | 11,762 | 16,880 | 28,642 | 149,419 | 214,289 | 363,708 |
| Adjustment for multiple enrolments | 2,853 | 3,721 | 6,574 | 807 | 1,245 | 2,052 | 1,089 | 1,670 | 2,759 | 122 | 151 | 273 | 4,871 | 6,787 | 11,658 |
| Total | 52,818 | 75,170 | 12,7988 | 52,982 | 75,393 | 128,375 | 27,108 | 40,210 | 67,318 | 11,640 | 16,729 | 28,369 | 144,548 | 207,502 | 352,050 |
Table 9.08. Qualification completions in 2004
By
award level, sector and sex
| Sector | Total | ||||||||||
|---|---|---|---|---|---|---|---|---|---|---|---|
| Colleges of Education | Polytechnics | Universities | Wānanga | ||||||||
| Qualification awarded | Male | Female | Male | Female | Male | Female | Male | Female | Male | Female | Total |
... not applicable Source: Ministry of Eduction | |||||||||||
| Doctorate | ... | ... | ... | ... | 293 | 239 | ... | ... | 293 | 239 | 532 |
| Masters/honours | 6 | 39 | 54 | 44 | 2,071 | 2,663 | 5 | 5 | 2,136 | 2,751 | 4,887 |
| Post-graduate diploma/certificate | 17 | 27 | 55 | 185 | 1,540 | 2,559 | 7 | 12 | 1,619 | 2,783 | 4,402 |
| Degree | 587 | 2,033 | 1,173 | 2,644 | 7,885 | 11,052 | 30 | 131 | 9,675 | 15,860 | 25,535 |
| Diploma | 107 | 589 | 2,406 | 3,789 | 826 | 1,341 | 1,350 | 3,162 | 4,689 | 8,881 | 13,570 |
| Certificate | 46 | 316 | 11,577 | 10,410 | 2,376 | 3,168 | 1,638 | 6,538 | 15,637 | 20,432 | 36,069 |
| Total qualifications completed | 763 | 3,004 | 15,265 | 17,072 | 14,991 | 21,022 | 3,030 | 9,848 | 34,049 | 50,946 | 84,995 |
| Adjustment for multiple awards | 19 | 106 | 493 | 613 | 860 | 1,207 | 175 | 489 | 1,547 | 2,415 | 3,962 |
| Total graduates | 744 | 2,898 | 14,772 | 16,459 | 14,131 | 19,815 | 2,855 | 9359 | 32,502 | 48,531 | 81,033 |
Table 9.09. Qualification completions in 2004
By
field of study, award level and sex
| Qualification award category | |||||||||||||||
|---|---|---|---|---|---|---|---|---|---|---|---|---|---|---|---|
| Doctorate | Masters/honours | Post-graduate diploma/certificate | Degree | Diploma | Certificate | Total | |||||||||
| Field of Study | Male | Female | Male | Female | Male | Female | Male | Female | Male | Female | Male | Female | Male | Female | Total |
– nil or zero Source: Ministry of Education | |||||||||||||||
| Natural and physical sciences | – | – | 408 | 468 | 212 | 173 | 1,324 | 1,202 | 35 | 39 | 46 | 145 | 2,025 | 2,027 | 4,052 |
| Information technology | – | – | 33 | 14 | 44 | 26 | 520 | 211 | 354 | 181 | 1,355 | 1,994 | 2,306 | 2,426 | 4,732 |
| Engineering and related technologies | – | – | 198 | 73 | 42 | 21 | 828 | 304 | 275 | 86 | 1,700 | 267 | 3,043 | 751 | 3,794 |
| Architecture and building | – | – | 23 | 7 | – | – | 209 | 188 | 127 | 97 | 821 | 77 | 1,180 | 369 | 1,549 |
| Agriculture and environmental studies | – | – | 64 | 62 | 60 | 32 | 152 | 67 | 184 | 103 | 840 | 353 | 1,300 | 617 | 1,917 |
| Health | – | – | 54 | 155 | 258 | 938 | 535 | 2,439 | 102 | 615 | 3,966 | 2,612 | 4,915 | 6,759 | 11,674 |
| Education | 2 | 3 | 44 | 181 | 132 | 362 | 912 | 3,372 | 336 | 1,378 | 35 | 493 | 1,461 | 5,789 | 7,250 |
| Management and commerce | – | – | 603 | 532 | 615 | 750 | 2,719 | 3,102 | 1,022 | 1,672 | 790 | 2,553 | 5,749 | 8,609 | 14,358 |
| Society and culture | – | 3 | 603 | 1,125 | 137 | 302 | 1,858 | 3,701 | 1,660 | 3,562 | 2,039 | 2,962 | 6,297 | 11,655 | 17,952 |
| Creative arts | 1 | – | 101 | 126 | 15 | 28 | 587 | 1,106 | 411 | 689 | 496 | 933 | 1,611 | 2,882 | 4,493 |
| Food, hospitality and personal services | – | – | – | – | – | – | 6 | 50 | 62 | 283 | 829 | 1,331 | 897 | 1,664 | 2,561 |
| Mixed field programmes | 290 | 233 | 5 | 8 | 104 | 151 | 25 | 118 | 121 | 176 | 2,720 | 6,712 | 3,265 | 7,398 | 10,663 |
| Total qualifications completed | 293 | 239 | 2,136 | 2,751 | 1,619 | 2,783 | 9,675 | 15,860 | 4,689 | 8,881 | 15,637 | 20,432 | 34,049 | 50,946 | 84,995 |
| Adjustment for multiple awards | – | – | 4 | 11 | 42 | 67 | 642 | 889 | 140 | 315 | 719 | 1,133 | 1,547 | 2,415 | 3,962 |
| Total graduates | 293 | 239 | 2,132 | 2,740 | 1,577 | 2,716 | 9,033 | 14,971 | 4,549 | 8,566 | 14,918 | 19,299 | 32,502 | 48,531 | 81,033 |
Career Services Rapuara assists people to maximise their potential by encouraging and supporting them to make informed career and learning decisions.
Career Services works with other government agencies and organisations advising them on incorporating career information into their work, based on research evidence and practical industry experience.
Career Services' consultants work with clients to identify skills, investigate career and training options, develop career plans, teach interview and job search techniques and prepare CVs.
The Career Services website provides free, impartial and up-to-date information on jobs, industries, training, qualifications and the labour market. This resource is also supported by Pathfinder, a free, online career guidance programme. Pathfinder generates career options based on an individual's profile, compiled through completion of a range of activities and questionnaires.
In the year to 30 June 2005, more than 576,000 people accessed career information and advice from Career Services, and more than 6,000 individuals received government-funded career guidance and planning assistance.
The Career Services website is www.careers.govt.nz
New Zealand Certificates in Engineering. New Zealand Certificates in Engineering (NZCE) are in the process of being phased out and have been replaced by National Diplomas. No new enrolments are being accepted for NZCE, but existing candidates can complete their qualification. Certificates require students to complete three years' suitable work experience. The New Zealand Qualifications Authority is responsible for maintenance of the national database of results, evaluation and approval of work experience, and for certification of the qualification.
New Zealand Certificates. A number of other New Zealand Certificates have now been replaced by National Diplomas. Courses for these qualifications are no longer available, but subjects may be completed through processes such as recognition of prior learning. A diploma can be awarded when a student completes requirements for the qualification – usually work experience. However, there is a final date for the awarding of each of these diplomas.
New Zealand Diploma in Business. The New Zealand Diploma in Business (NZDipBus) is a generic business qualification, endorsed by a number of industries, including accounting, marketing, tourism, banking and management. Courses for the qualification are available at a number of accredited tertiary education providers. Most papers are of one semester (half year) duration and may be completed through full or part-time study. The New Zealand Qualifications Authority (NZQA) is the owner of NZDipBus and is responsible for establishing and maintaining regulations for the qualification; maintaining a national database of results and issuing results notices; maintaining national records; development and maintenance of prescriptions; management of the national external moderation system; and certification of the qualification. Accredited training providers may award the NZDipBus in conjunction with the NZQA.
Other qualifications. A wide range of other vocational qualifications are available, including qualifications developed and administered by polytechnics and other tertiary training providers, national bodies, such as the New Zealand Institute of Management and the Royal New Zealand Air Force, and private training providers. Responsibility for all aspects of these qualifications lies with the appropriate bodies, which are quality assured by the New Zealand Qualifications Authority or a delegated quality assurance body.
New Zealand educational institutions enrolling international students must be a signatory to the Code of Practice for the Pastoral Care of International Students.
The code sets requirements for education providers which protect and promote the interests, welfare and safety of international students.
The code sets minimum requirements for the recruitment and enrolment of students, and standards for accommodation and support services. The code is implemented by the Ministry of Education.
Education providers are also required to ensure that international students have adequate medical and travel insurance cover.
Chinese and Malaysian students celebrate after a Victoria University graduation ceremony.
International students intending to enrol with a New Zealand education institution or private training establishment should ensure that their chosen courses and providers have been approved by the New Zealand Qualifications Authority (NZQA). This information is available from KiwiQuals, a database list of all quality assured qualifications in New Zealand posted on the NZQA website, www.nzqa.govt.nz
Information for international students about New Zealand courses of study, academic entry requirements and costs is available from the website www.newzealandeducated.com
Other information channels are New Zealand Government offices in the student's home country, or direct correspondence with the educational institution students wish to attend.
A student visa is required for any course of study longer than three months. Student visas and permits are issued for the period for which fees have been paid.
Educational institutions set their own academic entrance requirements and fees. Some allow payment of annual fees by instalment. International students are not entitled to New Zealand student allowances or loans.
Table 9.10 shows numbers of international students studying in New Zealand from 1999 to 2004.
Table 9.1. International students studying in New Zealand1,2
| Category | 1999 | 2000 | 2001 | 2002 | 2003 | 2004 |
|---|---|---|---|---|---|---|
1All figures independently rounded. 2Regardless of length of stay. 3Ministry of Education, as at 1 July. 4Ministry of Education, as at 31 July. 5Survey of English Language Providers, Statistics New Zealand; year ending 30 June for 1999 and 2000, year ending 31 March from 2001. .. not available. Sources: Ministry of Education Statistics New Zealand | ||||||
| Primary and secondary students3 | 6,030 | 8,150 | 11,330 | 16,010 | 18,080 | 15,050 |
| Tertiary students4 | 9,030 | 11,640 | 17,660 | 26,880 | 34,910 | 39,000 |
| Students at English language providers5 and on study tours | 21,000 | 23,400 | 31,500 | 47,000 | 74,800 | .. |
| Total | 36,060 | 43,190 | 60,490 | 89,890 | 127,790 | .. |
Table 9.11. Full-time equivalent teaching staff at educational institutions
At 1 July
| Institution | 1998 | 1999 | 2000 | 2001 | 2002 | 2003 | 2004 |
|---|---|---|---|---|---|---|---|
.. not available ... not applicable Source: Ministry of Education | |||||||
| Licensed early childhood services | |||||||
| Kindergartens | 1,607 | 1,625 | 1,617 | 1,643 | 1,644 | 1,663 | 1,673 |
| Playcentres (includes unpaid adults on duty) | 1,336 | 1,314 | 1,251 | 1,182 | 1,174 | 1,204 | 1,280 |
| Education and care services – regular and casual | 6,841 | 7,344 | 7,854 | 8,212 | 8,734 | 9,362 | 9,875 |
| Home-based services – coordinators | 236 | 242 | 271 | 258 | 265 | 307 | 305 |
| Correspondence School | 24 | 24 | 20 | 25 | 29 | 32 | 33 |
| Te kōhanga reo | .. | .. | .. | .. | .. | .. | .. |
| Primary schools | |||||||
| State | 22,681 | 22,740 | 22,957 | 23,362 | 23,358 | 23,611 | 23,583 |
| Private | 438 | 397 | 401 | 452 | 465 | 450 | 464 |
| Composite schools | |||||||
| State | 1,158 | 1,311 | 1,406 | 1,485 | 1,572 | 1690 | 1,795 |
| Private | 920 | 981 | 937 | 959 | 1,016 | 1,093 | 1,186 |
| Secondary schools | |||||||
| State | 14,663 | 14,842 | 15,083 | 1,5374 | 15,596 | 16,488 | 17,279 |
| Private | 565 | 482 | 512 | 596 | 615 | 651 | 732 |
| Special schools | |||||||
| State | 491 | 556 | 663 | 743 | 764 | 801 | 834 |
| Private | 11 | .. | .. | .. | .. | ... | ... |
| Correspondence School | |||||||
| Primary and secondary | 413 | 357 | 299 | 318 | 290 | 290 | 285 |
| Tertiary education providers – academic staff | |||||||
| Public tertiary education institutions | |||||||
| Polytechnics | 4,849 | 4,932 | 4,035 | 3,999 | 4,323 | 4,223 | 4,405 |
| Colleges of education | 481 | 497 | 505 | 475 | 485 | 491 | 450 |
| Universities | 4,973 | 5,008 | 5,936 | 6,103 | 6,365 | 6,562 | 6,678 |
| Wānanga | 107 | 109 | 156 | 237 | 526 | 781 | 987 |
| Private tertiary education providers | 2,816 | 2,836 | 3,290 | 3,753 | 4,119 | 4,186 | 4,187 |
Table 9.12. Formal educational institutions and students enrolled
At 1 July
| Institutions | 2003 | 2004 | ||
|---|---|---|---|---|
| Number | Students | Number | Students | |
1Early Childhood Development. 2Counts only institutions with students formally enrolled. ... not applicable Source: Ministry of Education | ||||
| Licensed early childhood education services | ||||
| Kindergartens | 609 | 45,109 | 614 | 45,287 |
| Playcentres | 482 | 15,200 | 481 | 15,440 |
| Education and care services | 1,673 | 78,967 | 1,730 | 81,096 |
| Casual education and care (no regular roll) | 42 | ... | 43 | ... |
| Home-based services | 190 | 9,587 | 192 | 9,922 |
| Te kōhanga reo | 526 | 10,319 | 513 | 10,418 |
| Correspondence School 1 | 991 | 1 | 992 | |
| 3,523 | 160,173 | 3,574 | 163,155 | |
| License-exempt early childhood education services | ||||
| ECD1 funded playgroups | 563 | 16,296 | 599 | 17,744 |
| ECD1 funded Nga puna kohungahunga | 32 | 408 | 43 | 571 |
| ECD1 funded Pacific peoples language groups | 122 | 2,606 | 113 | 2,392 |
| ECD1 funded playcentres | 30 | 466 | 32 | 530 |
| Te kōhanga reo | 12 | 130 | 13 | 191 |
| 759 | 19,906 | 800 | 21,428 | |
| Total early childhood education | 4,282 | 180,079 | 4,374 | 184,583 |
| Primary schools State full primary | 1,175 | 172,200 | 1,139 | 169,839 |
| State contributing | 829 | 213,959 | 816 | 212,360 |
| State intermediate | 130 | 64,517 | 125 | 61,908 |
| Private primary and intermediate | 45 | 6,106 | 44 | 6,089 |
| 2,179 | 456,782 | 2,124 | 450,196 | |
| Composite schools | ||||
| State composite | 94 | 22,974 | 97 | 24,452 |
| State correspondence | 1 | 7,872 | 1 | 7,996 |
| Private composite | 49 | 13,936 | 50 | 14,816 |
| 144 | 44,782 | 148 | 47,264 | |
| Secondary schools | ||||
| State Year 9–15 | 239 | 206,337 | 242 | 210,650 |
| State Year 7–15 | 87 | 42,432 | 90 | 45,627 |
| Private Year 7–15 and Year 9–15 | 17 | 8,818 | 20 | 8,245 |
| 343 | 257,587 | 352 | 264,522 | |
| Special schools | ||||
| State | 46 | 2,574 | 46 | 2,646 |
| Other Vote: Education | 1 | 31 | 1 | 26 |
| 47 | 2,605 | 47 | 2,672 | |
| Total compulsory schooling | 2,713 | 761,756 | 2,671 | 764,654 |
| Home schooling | ... | 37 | ... | 6,506 |
| Tertiary education providers2 | ||||
| Public tertiary education institutions | ||||
| Polytechnics | 20 | 98,072 | 20 | 117,514 |
| Universities | 8 | 137,007 | 8 | 138,583 |
| Colleges of education | 4 | 10,828 | 4 | 11,107 |
| Wānanga | 3 | 41,200 | 3 | 41,644 |
| 35 | 287,107 | 35 | 308,848 | |
| Private tertiary education providers | 525 | 49,897 | 536 | 59,158 |
| Tertiary total | 560 | 337,004 | 571 | 368,006 |
Table 9.13. Education 1875–2004
| Year1 | Early childhood education providers2 | Students | Primary schools3, 4 | Students | Secondary schools5, 6 | Students | University students | Polytechnic students7 | College of education students | Wānanga students | Private raining establishment students |
|---|---|---|---|---|---|---|---|---|---|---|---|
1Year ending 31 December until 1925, thereafter as at 1 July. Figures from 1994 on have been revised and are not comparable with previous years. 2Early childhood figures include only playcentres and kindergartens until 1990. after which they also include childcare, kōhanga reo and Pacific peoples language groups. 3Primary includes Year 1–8 students at all schools. 4Includes full primary, contributing. intermediate and special schools. Special schools can contain Year 9–15 students. 5Secondary includes Year 9–15 students at all schools. 6Includes secondary and composite schools and the Correspondence School. Some of these schools also have Year 1–8 students 7 Prior to 1990, polytechnic figures included all students attending polytechnic. From 1990, they include only those attending on 31 July. .. not available ... not applicable Source: Ministry of Education | |||||||||||
| (000) | (000) | (000) | |||||||||
| 1875 | .. | .. | 830 | 54.2 | 4 | .. | ... | ... | ... | ... | ... |
| 1880 | .. | .. | 1,171 | 95.2 | 14 | 1.6 | 211 | ... | ... | ... | ... |
| 1885 | .. | .. | 1,363 | 116.5 | 24 | 2.6 | 442 | ... | ... | ... | ... |
| 1890 | .. | .. | 1,566 | 134.1 | 22 | 2.1 | 596 | ... | ... | ... | ... |
| 1895 | .. | .. | 1,831 | 145.8 | 24 | 2.5 | 742 | ... | ... | ... | ... |
| 1900 | .. | .. | 2,157 | 149.4 | 86 | 6.9 | 805 | ... | ... | ... | ... |
| 1905 | .. | .. | 2,192 | 158.1 | 86 | 6.9 | 1,153 | ... | 211 | ... | ... |
| 1910 | .. | .. | 2,508 | 179.6 | 94 | 9.1 | 1,862 | ... | 380 | ... | ... |
| 1915 | .. | .. | 2,765 | 210.8 | 129 | 11.5 | 2,039 | ... | 390 | ... | ... |
| 1920 | .. | .. | 2,777 | 225.3 | 131 | 15.4 | 3,822 | ... | 680 | ... | ... |
| 1925 | .. | .. | 2,995 | 247.3 | 181 | 23.2 | 4,442 | ... | 1,271 | ... | ... |
| 1930 | .. | .. | 3,045 | 252.6 | 209 | 31.0 | 4,801 | ... | 1,155 | ... | ... |
| 1935 | .. | .. | 2,950 | 232.3 | 216 | 31.9 | 5,101 | ... | 429 | ... | ... |
| 1940 | .. | .. | 2,656 | 243.3 | 234 | 36.1 | 5,528 | ... | 1,457 | ... | ... |
| 1945 | .. | .. | 2,874 | 252.5 | 248 | 46.9 | 8,425 | ... | 1,431 | ... | ... |
| 1950 | .. | .. | 2,377 | 304.6 | 269 | 53.7 | 11,515 | ... | 2,684 | ... | ... |
| 1955 | .. | .. | 2,423 | 365.4 | 313 | 80.8 | 10,851 | ... | 2,847 | ... | ... |
| 1960 | .. | .. | 2,517 | 425.0 | 354 | 111.4 | 15,809 | 7,663 | 3,828 | ... | ... |
| 1965 | .. | 27.8 | 2,594 | 472.9 | 376 | 157.9 | 22,145 | 29,074 | 4,790 | ... | ... |
| 1970 | .. | 41.1 | 2,595 | 516.7 | 386 | 186.8 | 31,908 | 43,204 | 7,587 | ... | ... |
| 1975 | 1,098 | 54.8 | 2,542 | 525.3 | 408 | 219.7 | 35,499 | 56,098 | 8,004 | ... | ... |
| 1980 | 1,208 | 56.9 | 2,595 | 507.9 | 394 | 226.3 | 43,933 | 73,067 | 5,919 | ... | ... |
| 1985 | 1,389 | 60.7 | 2,641 | 452.4 | 403 | 230.9 | 59,123 | 76,054 | 2,703 | ... | ... |
| 1990 | 2,890 | 118.4 | 2,460 | 420.4 | 400 | 230.2 | 78,919 | 56,771 | 5,766 | ... | ... |
| 1995 | 3,824 | 159.4 | 2,368 | 448.2 | 430 | 236.6 | 104,389 | 95,664 | 10,156 | 726 | ... |
| 2000 | 4,175 | 174.2 | 2,268 | 484.2 | 456 | 245.5 | 122,727 | 87,436 | 12,045 | 2,972 | 39,173 |
| 2001 | 4,213 | 171.3 | 2,256 | 484.1 | 462 | 249.9 | 125,668 | 87,965 | 10,884 | 11,278 | 51,666 |
| 2002 | 4,228 | 175.0 | 2,235 | 488.7 | 464 | 259.7 | 132,396 | 95,782 | 10,788 | 27,535 | 53,385 |
| 2003 | 4,280 | 180.0 | 2,224 | 492.9 | 469 | 268.8 | 137,007 | 98,072 | 10,828 | 41,200 | 49,897 |
| 2004 | 4,374 | 184.5 | 2,171 | 488.1 | 500 | 276.6 | 138,583 | 117,514 | 11,107 | 41,644 | 59,158 |
9.1 Ministry of Education.
9.2 Ministry of Education; New Zealand Qualifications Authority.
9.3 Ministry of Education; New Zealand Qualifications Authority; Education Review Office; Learning Media Ltd; New Zealand Teachers' Council.
9.4 Ministry of Education; Ministry of Social Development; Statistics New Zealand; Tertiary Education Commission.
9.5 Ministry of Education; Māori Education Trust.
9.6 Ministry of Education.
9.7 Ministry of Education; Correspondence School; New Zealand Qualifications Authority.
9.8 Ministry of Education; The Open Polytechnic of New Zealand; New Zealand Qualifications Authority; Career Services Rapuara.
9.9 Ministry of Education.
9.10 Ministry of Education.
www.careers.govt.nz – Career Services Rapuara
www.correspondence.school.nz – The Correspondence School
www.ero.govt.nz – Education Review Office
www.learningmedia.co.nz – Learning Media Ltd
www.maorieducation.org.nz – Māori Education Trust
www.minedu.govt.nz – Ministry of Education
www.msd.govt.nz – Ministry of Social Development
www.nzqa.govt.nz – New Zealand Qualifications Authority
www.teacherscouncil.govt.nz – New Zealand Teachers' Council
www.tec.govt.nz – Tertiary Education Commission
Table of Contents
Road laws in New Zealand are enforced by the New Zealand Police who must also investigate serious and fatal accidents.
New Zealand is an independent state, with both a constitutional monarchy and a parliamentary democracy. The Queen, as Head of State, is the source of legal authority, but she and her representative, the Governor-General of New Zealand, act on the advice of the democratically-elected government in all but the most exceptional circumstances.
New Zealand has inherited from the United Kingdom the ‘Westminster’ system of parliamentary government and, as part of that system, the doctrine of the separation of powers. The doctrine provides that the three branches of government – parliament, the executive and the judiciary – have different functions which act as a check on the others.
In the case of parliament, the function is the formal act of law-making, carried out through scrutiny, amendment and passage of bills introduced by government ministers or individual Members of Parliament.
The executive determines government policy, is responsible for the administration of law, and carries out all the powers and functions of organised central government through ministers directly and through the public service and other bodies.
The judiciary makes binding determinations of disputes between private individuals and between individuals and the state, including determining the application and meaning of relevant laws.
Judges are appointed by the governor-general on the advice of the attorney-general. No person may be appointed a judge unless he or she has held a practising certificate as a barrister or solicitor for at least seven years. In practice, those appointed to the judiciary have practised law for longer than seven years.
Judges in the New Zealand High Court, the New Zealand Court of Appeal and the Supreme Court of New Zealand can be removed from office only by the governor-general acting upon an address of the House of Representatives on the grounds of misbehaviour or incapacity. District court judges may be removed from office by the governor-general on the grounds of inability or misbehaviour.
Passage of the Judicial Conduct Commissioner and Judicial Conduct Panel Act 2004 established a statutory complaints process for complaints about judges.
Ministry of Justice. The Ministry of Justice delivers the following services on behalf of the government:
Administration, case management and support services for the Supreme Court of New Zealand, the New Zealand Court of Appeal, the New Zealand High Court and district courts, including the Family Court and Youth Court.
Administration, case management and support services to specialist jurisdictions, including the Māori Land Court, the Māori Appellate Court, the Environment Court, the Employment Court and a range of authorities, committees and tribunals.
Administration, inquiry management and support services to the Waitangi Tribunal, negotiations for settlement of historical claims arising from the Treaty of Waitangi and management of land for use in settlements.
Administration of parliamentary elections, by-elections and referendums.
Collection and enforcement of court-imposed monetary penalties and infringement fines, and enforcement of civil court orders.
The ministry provides policy advice to a number of ministers and select committees and works with a range of non-government organisations in crime prevention and other activities. Three key areas of the ministry's current focus are development and implementation of the managing for outcomes framework, strengthening the sector budget process and progressing the Justice Sector Information Strategy.
How we measure up – imprisonment rates At 155 prisoners per 100,000 of population, New Zealand rates seventh-highest among OECD countries in the numbers of people it holds in prison, just below Mexico. Prison rates vary considerably across OECD countries. Iceland, Japan and northern European countries have some of the lowest rates – between 37 and 73 per 100,000 population. Western and southern European countries are higher, with most between 80 and 100 per 100,000, while some of the highest prison population rates in the OCED are in central and eastern Europe. However, these rates are far exceeded by the United States, which has 701 prisoners per 100,000 population, and accounts for two-thirds of the 3 million people held in prison throughout OECD countries. Imprisonment ratePrison population per 100,000 total population Latest year available 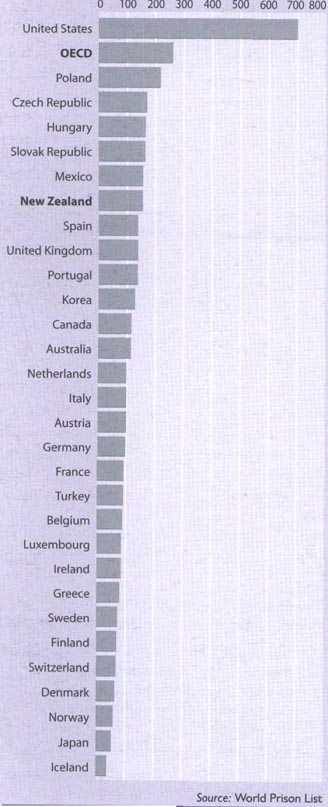 |
The Supreme Court of New Zealand is the country's court of final appeal, replacing appeals to the Judicial Committee of the Privy Council in London.
The court was set up under the Supreme Court Act 2003 and hearings began on 1 July 2004.
The Chief Justice of New Zealand presides over the court, with four other judges.
The court heads the hierarchy of New Zealand courts. Below the Supreme Court of New Zealand is the New Zealand Court of Appeal, the New Zealand High Court and district courts, being the main courts that exercise general criminal and civil jurisdiction.
There are also a number of courts and tribunals that have jurisdiction over specific areas of law, with rights of appeal to one or more of the four main courts.
The right to appeal from New Zealand-based courts to the United Kingdom-based Judicial Committee of the Privy Council was abolished as from 1 January 2004 with establishment of the Supreme Court of New Zealand. However, certain appeals active before 1 January 2004 continue to be determined by the privy council.
The Court of Appeal hears civil and criminal appeals from proceedings heard in the High Court and indictable criminal proceedings in district courts. Matters appealed to the High Court from a district court can be taken to the Court of Appeal with leave if they are considered to be of sufficient significance to warrant a second appeal.
The Court of Appeal may hear appeals against pre-trial rulings in criminal cases. The court also hears appeals on questions of law from the Employment Court.
The Court of Appeal is New Zealand's principal intermediate appellate court and is located in Wellington. Its full-time membership is made up of six appellate judges and a president.
The High Court of New Zealand has jurisdiction over serious crimes, civil claims involving more than $200,000, judicial reviews of administrative action, admiralty proceedings, and appeals from tribunals and lower courts, including the district court.
Judges of the High Court comprise the Chief Justice of New Zealand, 43 judges (including judges of the Supreme Court and the Court of Appeal) and six associate judges. They are led by the Chief Judge of the High Court, who is responsible to the Chief Justice of New Zealand for administration of the court.
Judges are based in Auckland. Wellington and Christchurch and travel on circuit to centres throughout the country. In addition, associate judges of the High Court supervise the court's preliminary processes in most civil proceedings and have jurisdiction to deal with summary judgement applications, company liquidations, bankruptcy proceedings and some other types of civil proceedings.
District courts hear the majority of minor criminal offences and civil claims up to $200,000. There are 63 district courts throughout New Zealand. Many have resident judges, with the others being visited by judges on circuit. The District Courts Act 1947 sets jurisdiction for Table 10.01 lists judges of the Supreme Court and Court of Appeal and judges and associate judges of the High Court.
Table 10.01. Judges of the Supreme Court and Court of Appeal, and judges and associate judges of the High Court1
1As at 31 December 2005. Source: Ministry of Justice | |
|---|---|
| Judges of the Supreme Court | Rt Hon Dame Sian Elias, Chief Justice of New ZealandRt Hon Justice GaultRt Hon Justice BlanchardRt Hon Justice TippingHon Justice McGrath |
| Judges of the Court of Appeal | Hon Justice Anderson (President)Hon Justice GlazebrookHon Justice HammondHon Justice William YoungHon Justice ChambersHon Justice O'ReganHon Justice Robertson |
| Judges of the High Court | WellingtonHon Justice GoddardHon Justice GendallHon Justice WildHon Justice Durie (Law Commission)Hon Justice Ronald Young (list judge)Hon Justice MacKenzieHon Justice MillerHon Justice Doogue (Acting Judge) |
| Associate Judges of the High Court | Associate Judge D I Gendall |
| Judge of the High Court | AucklandHon Justice Randerson (Chief High Court Judge)Hon Justice WilliamsHon Justice BaragwanathHon Justice PotterHon Justice Rodney HansenHon Justice Priestley (liaison judge, Hamilton/Rotorua)Hon Justice HarrisonHon Justice HeathHon Justice Ellen FranceHon Justice Venning (civil list judge)Hon Justice FraterHon Justice KeaneHon Justice Cooper (criminal list judge)Hon Justice WinkelmannHon Justice AllanHon Justice CourtneyHon Justice Simon FranceHon Justice AsherHon Justice LangHon Justice Nicholson (Acting Judge) |
| Associate Judges of the High Court | Associate Judge J A FaireAssociate Judge H SargissonAssociate Judge D AbbottJudge J P Doogue |
| Judges of the High Court | ChristchurchHon Justice John Hansen (list judge)Hon Justice PanckhurstHon Justice ChisholmHon Justice Fogarty |
| Associate Judge of the High Court | Judge A P Christiansen |
Led by Chief Justice Dame Sian Elias, members of the judiciary arrive for the opening of the 48th New Zealand Parliament on 7 November 2005.
New Zealand has a number of courts with specialist functions.
Employment Court. The Employment Court hears cases concerned with the employment of employees by employers and injunctions arising out of unlawful strikes, lockouts and pickets. Judges of the court must have held a practising certificate as a barrister or solicitor for not less than seven years. The Employment Court consists of a chief judge and at least two other judges.
Normally, the court's jurisdiction is exercised by a judge sitting alone, but on occasions of appropriate significance, it will sit as a full bench of at least three judges. The Employment Court exercises jurisdiction under the Employment Relations Act 2000, the State Sector Act 1988 and other acts. Support for the Employment Court transferred from the Department of Labour to the Ministry of Justice on 1 December 2004.
Family Court. The Family Court is a specialist division of district courts. It deals with family and relationship matters, including adoption; care of children; care and protection of children who are abused or neglected; inter-country child abduction; consents for minors to marry; protection from domestic violence; separation; divorce; matrimonial/relationship property; compulsory mental health assessment and treatment; protection of personal and property rights for people who are incapacitated; claims for maintenance and support; and bequests from estates. The Family Court was established under the Family Courts Act 1980.
Youth Court. The Youth Court is part of district courts. It hears all criminal cases where the alleged offender is aged 14 to 16, except murder, manslaughter or when a young person chooses to have a jury trial. It has its own judges. The Youth Court is closed to the public, but accredited reporters can attend. The court was established under the Children. Young Persons, and Their Families Act 1989.
Māori Land Court. The Māori Land Court makes decisions on applications relating to the ownership. occupation, utilisation and development of Māori land. The court also hears applications under new jurisdictions arising from the Māori Fisheries Act 2004, the Foreshore and Seabed Act 2004 and the Māori Commercial Aquaculture Claims Settlement Act 2004. The court has eight judges, including a chief judge and a deputy chief judge. The court was established under the Native Lands Act 1865 and continued under Part 1 of Te Ture Whenua Māori Act 1993.
Māori Appellate Court. The Māori Appellate Court hears appeals from orders or preliminary determinations of the Māori Land Court, as well as cases stated by the Māori Land Court, the High Court and the Waitangi Tribunal. Any three or more Māori Land Court judges have power to act as the Māori Appellate Court. The court was established under the Native Land Court Act 1894 and continued under Part 2 of Te Ture Whenua Māori Act 1993.
Environment Court. The Environment Court considers appeals about regional and district statements and plans and from resource consent applications for land use, subdivision, water or discharge permits, or a combination of those. The Environment Court is constituted by the Resource Management Amendment Act 1996. The court has environment judges who are also district court judges and environment commissioners. The court has registries in Auckland, Wellington and Christchurch. Sittings are held throughout the country, usually with one judge and two commissioners.
Coroner's Court. The role of the Coroner's Court is to establish the cause and circumstances of sudden or unexplained deaths and deaths in other special circumstances. The Coroner's Court may also authorise post-mortem examinations. Coroners, judicial officers appointed under the Coroners Act 1988, may make recommendations or comments on ways of avoiding future deaths.
More than 100 tribunals, authorities, committees or related boards exist in New Zealand to deal with matters such as environmental planning, abortion supervision, taxation reviews, deportation reviews, land valuations and occupational licensing.
Disputes tribunals. Disputes tribunals, established under the Disputes Tribunals Act 1988, are a division of district courts. They provide resolution of civil disputes up to a value of $7,500, or $12,000 by agreement of the parties. Disputes referees preside over each tribunal.
Human Rights Review Tribunal. The Human Rights Review Tribunal hears civil proceedings brought by individuals or by the Director of Human Rights Proceedings for alleged breaches of the Privacy Act 1993, the Human Rights Act 1993 and the New Zealand Bill of Rights Act 1990. It also hears proceedings brought by the Director of Proceedings in the Office of the Health and Disability Commissioner under the Health and Disability Commissioner Act 1994. The tribunal has a chairperson, a barrister or solicitor of the High Court of not less than five years practice, who sits with two members appointed from a panel of not more than 20.
Tenancy Tribunal. Tenancy adjudicators make decisions on disputes up to a value of $12,000 brought to the Tenancy Tribunal by landlords or tenants in relation to residential tenancies. The tribunal was established under the Residential Tenancies Act 1986.
Waitangi Tribunal. The Waitangi Tribunal is a permanent Commission of Inquiry. It makes recommendations on claims brought by Māori relating to actions or omissions of the Crown that allegedly breach promises made in the Treaty of Waitangi. It also examines and reports on proposed legislation referred to it by the House of Representatives or a minister of the Crown, and makes recommendations or determinations regarding certain Crown forest land, railway land, state-owned enterprise land and land transferred to educational institutions. The tribunal has a chairperson who is a High Court judge, a retired High Court judge, or the Chief Judge of the Māori Land Court, and a deputy chairperson who is a judge of the Māori Land Court. It also has up to 16 members appointed by the governor-general on the recommendation of the Minister of Māori Affairs. The tribunal was established by the Treaty of Waitangi Act 1975.
The Law Commission Te Aka Matua o te Ture, established by the Law Commission Act 1985, is an independent, government-funded organisation which reviews areas of the law that need updating, reforming or developing.
The commission helps ensure that laws provide effectively for the current and future needs of New Zealand's changing society. Its goal is to achieve law that is just, principled, accessible and reflects the heritage and aspirations of the people of New Zealand.
Under the act, up to six commissioners (one of them the president) can be appointed by the governor-general on the recommendation of the Minister Responsible for the Law Commission.
The commission is funded through Vote: Justice and employs legal researchers and support staff.
The Law Commission's website is www.lawcom.govt.nz
The Legal Services Agency is a Crown entity established by the Legal Services Act 2000. The agency replaced the Legal Services Board and its task is to promote access to justice for those who have the greatest need and least capacity to pay for legal services. It does this by administering, funding or sponsoring a range of legal services, including:
Legal advice and representation through legal aid, duty solicitor and Police Detention Legal Assistance schemes.
Community legal services, such as those provided by community law centres.
Production of information and educational resources, targeting those with unmet legal needs.
Research into the unmet legal needs of communities and how those needs might be met.
The agency is assisted by a public advisory committee, which advises on community concerns about legal aid, legal aid access, unmet legal needs, community law centre funding, legal information and law-related educational needs, and areas in need of research.
Decisions on legal aid made by the agency may be referred back to the agency for reconsideration, or to the independent Legal Aid Review Panel.
Criminal legal aid. People charged with criminal offences may apply for legal aid. Not all criminal matters qualify for legal aid, as some are not considered serious enough because they do not have serious or long-lasting consequences for defendants (e.g. some driving offences). People may be asked to contribute towards their legal aid, depending on their financial circumstances.
Duty solicitors. The duty solicitor scheme ensures solicitors are available at every district court to help people charged with an offence who do not have a solicitor. The service is free. The duty solicitor ensures the person charged understands basic court procedures. They also make sure the case is dealt with satisfactorily. They give advice on pleas, bail and sentencing options available to the court. They also advise on how to arrange private legal representation or legal aid.
Police Detention Legal Assistance. The Police Detention Legal Assistance scheme enables anyone being questioned or detained by the police to obtain advice or assistance by telephone or in person from a lawyer. The service is free. The scheme ensures the New Zealand Bill of Rights Act 1990 is given practical effect, so that those who are detained for questioning are able to obtain legal advice without delay.
Civil legal aid. Civil legal aid applies to all family matters and to civil matters encompassing the Waitangi Tribunal and other civil proceedings, including immigration and employment. People may be asked to contribute to the cost of their legal aid, depending on their financial circumstances.
Grants and payments. In the year ending 30 June 2005, 61,392 legal aid grants were made and legal aid payments totalled $91.0 million (excluding GST). Payments made can relate to grants approved in previous years. Of these payments, $40.7 million went on criminal cases, $26.0 million on family law cases, $11.1 million on Waitangi Tribunal matters and $6.5 million on civil actions. A further $6.3 million was spent on the duty solicitor scheme and $0.5 million on the Police Detention Legal Assistance scheme. Legal aid recovered from imposed contributions totalled $9.0 million. Legal aid is demand driven. Once an entitlement to assistance is established, aid must be provided and no direct control can be exercised over the number of applications submitted.
Community law centres. Community law centres provide legal services to those in communities with unmet legal needs, particularly those who cannot afford to pay for legal services. There were 27 centres in 2005. including two newly-established pilot centres in Waitakere and the Bay of Plenty. The centres provide free legal advice and sometimes representation, law-related education and legal information, and may work on law reform. The centres are funded mostly from a special fund (administered by the New Zealand Law Society) which earns revenue from interest income from nominated lawyers' trust accounts, plus some government funding.
Public Advisory Committee. The Legal Services Agency's Public Advisory Committee represents a range of groups, including women, Māori, Pacific peoples, young people, older people, people with disabilities, consumers, community law centres, the legal profession and refugees and migrants. The committee provides advice to the agency on a number of matters, including feedback and concerns about legal aid schemes and other services funded or delivered by the agency, unmet legal needs, funding of community law centres, research and law-related education.
Every person registered on the electoral roll is eligible for jury service, subject to some exceptions. Members of Parliament, members of the judiciary, those involved in certain justice-related occupations and people who have been sentenced to certain prison sentences are not eligible to serve on a jury. A person may be excused from jury service if attendance would cause serious inconvenience or hardship.
Crown Law is a government agency providing legal advice and representation services to the government, particularly in areas of criminal, public and administrative law.
Crown Law has two primary objectives in providing these services:
To ensure that the operations and responsibilities of the executive government are conducted lawfully.
To ensure that the government is not prevented, through legal process, from lawfully implementing its policies and discharging its governmental responsibilities.
The Solicitor-General of New Zealand is Chief Executive of Crown Law and is the chief legal adviser to the government, subject to any views expressed by the attorney-general. In this capacity, the solicitor-general is the government's chief advocate in the courts. In addition, the solicitor-general is responsible for conducting the prosecution of indictable crime and also has a number of specific statutory duties and functions.
Crown Law is organised into three practice groups, which bring together specialist teams enabling clients to address key issues in the areas of:
Constitutional advice and litigation, including Treaty of Waitangi matters, advice on international human rights obligations, bill of rights and constitutional conventions.
Conduct of Crown prosecutions and criminal appeals.
Public law arising, for example, out of the exercise and control of governmental power and public sector governance.
The criminal process group has responsibility for supervision and conduct of the nationwide network of Crown solicitors. Crown solicitors, private legal practitioners in the main centres of New Zealand, conduct prosecutions for indictable crime on behalf of the Crown. Crown solicitors are appointed by the governor-general on the recommendation of the attorney-general.
The Crown Law website is www.crownlaw.govt.nz
The most serious crimes in New Zealand are defined in the Crimes Act 1961, the International Crimes and International Criminal Court Act 2000 and the Misuse of Drugs Act 1975.
Other acts, such as the Aviation Crimes Act 1972 and the Maritime Crimes Act 1999, also outline serious indictable offences.
The Summary Offences Act 1981 provides for a wide variety of less serious (summary) offences, including offences against public order, such as disorderly behaviour and fighting in a public place, and offences against people or property, such as common assault and wilful damage.
A conviction is the most frequent outcome of a prosecution.
The proportion of all prosecutions resulting in a conviction decreased a little in the decade to 2004. In 1995, 70 percent of prosecutions resulted in conviction, but by 2000 the proportion had fallen to 66 percent. Between 2000 and 2003, the proportion remained at 66 percent, before decreasing slightly to 65 percent in 2004.
Figure 10.01 shows the proportion of convictions for each type of offence from 1997 to 2004.
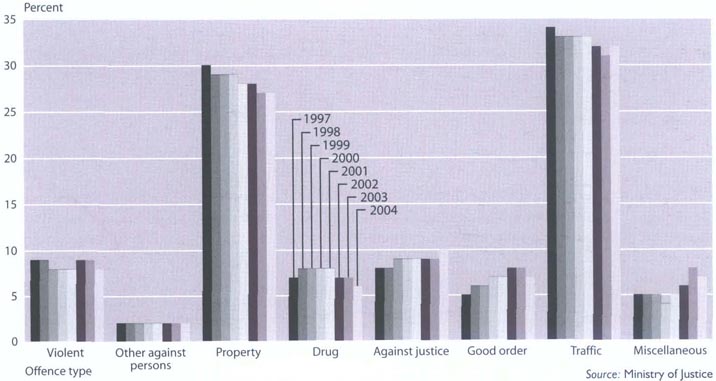
Total convictions. The number convicted annually fell continuously between 1998 and 2002. However, numbers increased again in 2003 and 2004 to around the 1998 figure.
Robbery. The number of convictions for robbery has fluctuated in recent years around an annual average of approximately 210. The number of convictions for aggravated robbery peaked at 582 in 1997 and dropped each year after that to 349 in 2002. Numbers rose again in 2003 and 2004 but were still below the average for the decade.
Non-sexual assaults. The number of convictions for non-sexual assaults decreased by 6 percent between 1995 and 2004. The number of ‘male assaults female’ convictions decreased from 4,091 in 1995 to 2,625 in 2002, before increasing in the next two years, reaching 3,116 in 2004.
Violent offences. The number of convictions for violent offences generally showed a decreasing trend, from 16,714 to 14,427, between 1995 and 2002, before increasing in the next two years, reaching 15,643 in 2004. In each of the 10 years to 2004, violent offences averaged between 8 and 9 percent of all convictions.
Table 10.02 shows annual convictions by type of offence from 1995 to 2004.
Table 10.02. Convictions By type of offence Years ending 31 December
| Offence type | 1995 | 1996 | 1997 | 1998 | 1999 | 2000 | 2001 | 2002 | 2003 | 2004 |
|---|---|---|---|---|---|---|---|---|---|---|
| Source: Ministry of Justice | ||||||||||
| Violent | 16,714 | 16,497 | 15,683 | 16,131 | 15,287 | 14,577 | 14,692 | 14,427 | 15,224 | 15,643 |
| Other against persons | 3,708 | 3,785 | 3,496 | 3,706 | 3,686 | 3,682 | 3,702 | 3,771 | 4,164 | 4,249 |
| Property | 56,972 | 56,702 | 53,674 | 53,295 | 51,178 | 49,635 | 48,715 | 47,546 | 49,021 | 49,869 |
| Drug | 11,792 | 11,594 | 12,997 | 14,168 | 14,021 | 13,649 | 12,555 | 12,272 | 12,359 | 11,666 |
| Against justice | 13,521 | 13,902 | 14,819 | 15,685 | 15,306 | 15,465 | 15,017 | 14,972 | 16,034 | 19,095 |
| Against good order | 9,284 | 9,732 | 9,927 | 10,552 | 11,062 | 11,586 | 12,400 | 12,842 | 13,987 | 13,956 |
| Traffic | 64,024 | 63,183 | 60,502 | 62,201 | 58,785 | 57,018 | 56,573 | 54,538 | 55,847 | 59,340 |
| Miscellaneous | 16,393 | 17,001 | 9,706 | 10,101 | 9,437 | 7,663 | 9,296 | 10,150 | 13,516 | 13,515 |
| Total | 192,408 | 192,396 | 180,804 | 185,839 | 178,762 | 173,275 | 172,950 | 170,518 | 180,152 | 187,333 |
Violent sex offences. Convictions for violent sex offences (rape, unlawful sexual connection, attempted sexual violation and indecent assault) peaked at 2,084 in 1996, then averaged just under 1,500 annually from 1996 to 2004. In 2004, there were 1,361 convictions for violent sex offences. The number of convictions for rape showed a generally decreasing trend, from 327 to 131, between 1995 and 2000. Convictions increased to 181 in 2004, but were still much lower than earlier in the decade. Convictions in the decade to 2004 for unlawful sexual connection fluctuated from year to year around an annual average of 360. Convictions for attempted sexual violation and indecent assault decreased by 44 percent and 29 percent respectively in the decade to 2004.
Table 10.03 shows the number of convictions for violent offences in the years 1995 to 2004.
Table 10.03. Convictions for violent offences Years ending 31 December
| Offence type | 1995 | 1996 | 1997 | 1998 | 1999 | 2000 | 2001 | 2002 | 2003 | 2004 |
|---|---|---|---|---|---|---|---|---|---|---|
1Includes convictions for manslaughter involving the use of a motor vehicle. 2Includes both robbery and assault with intent to rob. 3Mostly assault with a weapon, wounding with intent, and injuring with intent, but also includes aggravated wounding or injury, disabling, doing dangerous act with intent, acid throwing, and poisoning with intent to cause grievous bodily harm. These offences have maximum penalties of at least five years imprisonment. 4Mostly common assault under the Crimes Act 1961, but also includes assault with intent to injure, injuring by unlawful act, and aggravated assault. 5Offences under section 194(b) of the Crimes Act 1961. 6Assault on a child under the age of 14 under section 194(a) of the Crimes Act 1961. 7Offences under section 195 of the Crimes Act 1961. Source: Ministry of Justice | ||||||||||
| Murder | 34 | 27 | 39 | 24 | 25 | 31 | 19 | 31 | 24 | 30 |
| Manslaughter1 | 38 | 36 | 28 | 45 | 28 | 23 | 31 | 30 | 35 | 57 |
| Attempted murder | 6 | 13 | 19 | 5 | 6 | 9 | 11 | 16 | 5 | 16 |
| Kidnapping/abduction | 112 | 142 | 112 | 149 | 81 | 107 | 114 | 117 | 176 | 117 |
| Rape | 327 | 302 | 210 | 253 | 207 | 131 | 169 | 168 | 213 | 181 |
| Unlawful sexual connection | 380 | 410 | 279 | 349 | 361 | 310 | 384 | 343 | 414 | 345 |
| Attempted sexual violation | 73 | 82 | 58 | 56 | 58 | 42 | 59 | 36 | 48 | 41 |
| Indecent assault | 1,112 | 1,290 | 947 | 1,054 | 968 | 794 | 818 | 957 | 935 | 794 |
| Aggravated burglary | 96 | 74 | 102 | 83 | 77 | 71 | 76 | 67 | 69 | 86 |
| Aggravated robbery | 479 | 456 | 582 | 555 | 523 | 423 | 363 | 349 | 398 | 390 |
| Robbery2 | 204 | 213 | 258 | 278 | 233 | 171 | 155 | 172 | 207 | 205 |
| Grievous assault3 | 1,157 | 1,222 | 1,209 | 1,335 | 1,258 | 1,320 | 1,303 | 1,296 | 1,372 | 1,470 |
| Serious assault4 | 2,993 | 2,964 | 3,031 | 3,239 | 3,090 | 3,247 | 3,364 | 3,341 | 3,458 | 3,801 |
| Male assaults female5 | 4,091 | 3,753 | 3,335 | 3,145 | 3,043 | 2,916 | 2,916 | 2,625 | 2,870 | 3,116 |
| Assault on a child6 | 302 | 326 | 298 | 294 | 304 | 280 | 294 | 291 | 253 | 312 |
| Minor assault | 4,688 | 4,462 | 4,432 | 4,516 | 4,245 | 3,959 | 3,848 | 3,763 | 3,800 | 3,783 |
| Threaten to kill/do grievous bodily harm | 511 | 585 | 602 | 633 | 641 | 628 | 626 | 697 | 771 | 776 |
| Cruelty to a child7 | 24 | 17 | 17 | 17 | 40 | 21 | 23 | 19 | 27 | 28 |
| Other violence | 87 | 123 | 125 | 101 | 99 | 94 | 119 | 109 | 149 | 95 |
| Total | 16,714 | 16,497 | 15,683 | 16,131 | 15,287 | 14,577 | 14,692 | 14,427 | 15,224 | 15,643 |
Assaults on children. The number of convictions for assaults on children aged less than 14 under s. 194(a) of the Crimes Act 1961 was stable between 1995 and 2002 at approximately 300 convictions a year, before decreasing to 253 in 2003 – the lowest figure recorded in the decade. In 2004, however, convictions rose to 312.
Assault. The number of convictions in the two most serious categories of assault – grievous assault and serious assault – showed almost identical slowly-increasing trends in the decade to 2004.
Convictions for minor assault decreased slowly, from 4,688 in 1995 to 3,783 in 2004.
Other convictions. Convictions for threatening to kill or do grievous bodily harm showed a strong upward trend between 1995 and 2004, with the 776 convictions in 2004, 52 percent higher than the 511 in 1995.
Convictions for non-violent sexual offences decreased 26 percent during the decade, to 454 in 2004.
Table 10.04 shows convictions for other offences against the person for the years 1995 to 2004.
Table 10.04. Convictions for other offences against the person Years ending 31 December
| Offence type | 1995 | 1996 | 1997 | 1998 | 1999 | 2000 | 2001 | 2002 | 2003 | 2004 |
|---|---|---|---|---|---|---|---|---|---|---|
1Mainly unlawful sexual intercourse or doing an indecent act with or upon another person. Sex offences reported in the violent offences category are not included in the figures for this category. 2Obstructing or resisting a police officer, traffic officer, or other official. 3Excludes threatening to kill or do grievous bodily harm which is classified as a violent offence. Source: Ministry of Justice | ||||||||||
| Non-violent sexual1 | 614 | 638 | 579 | 492 | 474 | 495 | 415 | 447 | 468 | 454 |
| Obstruct/resist2 | 2,412 | 2,471 | 2,269 | 2,493 | 2,405 | 2,376 | 2,289 | 2,377 | 2,556 | 2,563 |
| Threats/intimidation3 | 440 | 412 | 466 | 477 | 549 | 560 | 618 | 653 | 772 | 931 |
| Other | 242 | 264 | 182 | 244 | 258 | 251 | 380 | 294 | 368 | 301 |
| Total | 3,708 | 3,785 | 3,496 | 3,706 | 3,686 | 3,682 | 3,702 | 3,771 | 4,164 | 4,249 |
Property. Property offences are the second largest group of offences resulting in conviction. In 2004, 27 percent of all convictions were for offences against property.
The number of convictions for property offences decreased by 12 percent between 1995 and 2004. Numbers showed a slightly decreasing trend each year between 1995 and 2002, but increased slightly in the following two years. However, the 2004 figure of 49,869 was still lower than earlier in the decade.
Most of the decrease in property offences during the decade was due to a decrease in the number of convictions for fraud.
In 1995 and 1996, there were between 21,000 and 22,000 convictions for fraud each year, but in the three years up to 2004 there was an annual average of just over 13,000 convictions. This finding, however, needs to be treated with caution.
Many offenders convicted of fraud face a large number of charges, so the total number of fraud charges could change considerably without the number of people being convicted of fraud necessarily changing too much. In fact, the number of cases where the most serious offence was fraud was only about 700 lower in 2004 than it had been in 1995.
Table 10.05 lists convictions for property offences in the years 1995 to 2004.
Table 10.05. Convictions for property offences Years ending 31 December
| Offence type | 1995 | 1996 | 1997 | 1998 | 1999 | 2000 | 2001 | 2002 | 2003 | 2004 |
|---|---|---|---|---|---|---|---|---|---|---|
1Includes fraud, false pretences and forgery. 2Mostly unlawfully interfering with or getting into/onto a motor vehicle or motorcycle, unlawfully taking a bicycle, entering with intent, possessing instruments for burglary or conversion, providing misleading information to obtain a benefit, or misleading a social welfare officer. Source: Ministry of Justice | ||||||||||
| Burglary | 6,712 | 6,684 | 6,719 | 6,374 | 5,938 | 6,339 | 5,502 | 5,711 | 5,424 | 6,409 |
| Theft | 12,780 | 13,332 | 13,208 | 13,793 | 13,720 | 13,246 | 14,145 | 13,921 | 14,269 | 14,275 |
| Receiving stolen goods | 3,118 | 3,148 | 3,084 | 3,374 | 3,000 | 3,010 | 2,827 | 2,437 | 2,611 | 2,732 |
| Motor vehicle conversion | 2,810 | 2,831 | 2,793 | 2,538 | 2,431 | 2,173 | 2,053 | 2,093 | 2,130 | 2,108 |
| Fraud1 | 21,960 | 21,336 | 18,661 | 17,124 | 15,078 | 14,394 | 14,220 | 12,765 | 13,629 | 13,551 |
| Arson | 191 | 165 | 198 | 313 | 209 | 170 | 198 | 213 | 212 | 220 |
| Wilful damage | 5,177 | 4,838 | 4,800 | 5,087 | 5,156 | 5,232 | 5,065 | 5,103 | 5,285 | 5,550 |
| Other2 | 4,224 | 4,368 | 4,211 | 4,692 | 5,646 | 5,071 | 4,705 | 5,303 | 5,461 | 5,024 |
| Total | 56,972 | 56,702 | 53,674 | 53,295 | 51,178 | 49,635 | 48,715 | 47,546 | 49,021 | 49,869 |
A police constable with a haul of 30.3 kilograms of cannabis heads with a street value of more than $100,000 after a raid on a Taupo house in September 2005.
Drug offences. Seventy-eight percent of drug convictions in 2004 involved cannabis. As Table 10.06 shows, annual convictions for drug offences fluctuate around an average of 13,000. Six percent of all convictions in 2004 were for drug offences.
Table 10.06. Convictions for drug offences Years ending 31 December
| Offence type | 1995 | 1996 | 1997 | 1998 | 1999 | 2000 | 2001 | 2002 | 2003 | 2004 |
|---|---|---|---|---|---|---|---|---|---|---|
1Mostly offences relating to the possession of pipes, needles, syringes or other drug-related utensils. The category also includes offences where the offender permitted his or her premises or motor vehicle to he used for a drug offence, or where the offender made a false statement in relation to the Misuse of Drugs Act. Source: Ministry of Justice | ||||||||||
| Use cannabis | 5,926 | 5,652 | 6,459 | 6,970 | 6,761 | 6,131 | 5,541 | 4,988 | 4,856 | 4,273 |
| Deal in cannabis | 3,437 | 3,459 | 3,708 | 3,977 | 3,916 | 3,884 | 3,589 | 3,305 | 3,125 | 2,681 |
| Other cannabis1 | 1,469 | 1,477 | 1,730 | 2,172 | 2,255 | 2,186 | 2,183 | 2,072 | 2,240 | 2,093 |
| Use other drug | 389 | 350 | 444 | 412 | 493 | 676 | 544 | 668 | 733 | 851 |
| Deal in other drug | 380 | 497 | 496 | 415 | 405 | 459 | 403 | 772 | 631 | 593 |
| Other drug1 | 191 | 159 | 160 | 222 | 191 | 313 | 295 | 467 | 774 | 1,175 |
| Total | 11,792 | 11,594 | 12,997 | 14,168 | 14,021 | 13,649 | 12,555 | 12,272 | 12,359 | 11,666 |
Driving convictions. Convictions for driving offences resulting in the death or injury of another person tended to decrease between 1995 and 2002, but increased slightly in the next two years. The 2004 figure of 1,575 was the same as the 1999 figure, but 11 percent lower than the 1995 figure. Between 2000 and 2004, the annual number of convictions for driving with excess alcohol averaged approximately 21,700. This was a much lower level than between 1995 and 1998, when the annual average number of convictions was 25,100. The number of convictions for driving while disqualified decreased considerably from 10,451 in 1999 to 7,862 in 2000. From then till 2004, the number of such convictions fluctuated at the lower level, with an annual average of approximately 7,400. The 2004 figure of 7,736 was 26 percent lower than the 1995 figure of 10,451. It is likely that the roadside impoundment of a large number of vehicles driven by disqualified drivers following introduction of the Land Transport Act 1998 had an impact on the number of convictions for driving while disqualified. Convictions for reckless or dangerous driving showed a generally increasing trend across the decade, from 2,443 in 1995 to 4,230 in 2004, an increase of 73 percent. This category includes offences related to unauthorised street or drag racing introduced in May 2003 and the increases in 2003 and 2004 may be related to this. In 2004, there were 1,439 such convictions. There was a downward trend during the decade in the number of careless driving convictions, with the 2004 figure of 7,493 being 39 percent lower than the 1995 figure.
Motor vehicle conversion. The number of convictions for motor vehicle conversion averaged about 2,800 between 1995 and 1997, but in the five years to 2004 the annual average dropped to 2,100.
Traffic offences. As Table 10.07 shows, the number of convictions for all traffic offences decreased from 64,024 in 1995 to 54,538 in 2002. In 2003 and 2004, the numbers increased, reaching 59,340 in 2004, but still less than the number at the beginning of the decade. Despite the 7 percent decrease in convictions during the decade, traffic offences still comprised the largest group of offences resulting in conviction (32 percent in 2004).
Table 10.07. Convictions for traffic offences Years ending 31 December
| Offence type | 1995 | 1996 | 1997 | 1998 | 1999 | 2000 | 2001 | 2002 | 2003 | 2004 |
|---|---|---|---|---|---|---|---|---|---|---|
1Charges involving driving with excess alcohol, reckless/dangerous driving, or careless driving where death or injury occurred. It is no longer possible to distinguish in the data between charges resulting in injury and charges resulting in death. A small number of people who kill a person while driving a motor vehicle are charged with manslaughter rather than driving causing death. 2Mostly charges where the person was driving with excess alcohol, but also includes charges where the offender refused to supply a blood specimen, or was convicted for driving under the influence of drink or drugs. Charges where a person was driving with excess alcohol and caused death or injury are included in the first category in this table. Source: Ministry of Justice | ||||||||||
| Driving causing death or injury1 | 1,739 | 1,654 | 1,556 | 1,679 | 1,575 | 1,446 | 1,422 | 1,403 | 1,528 | 1,575 |
| Driving with excess alcohol2 | 25,456 | 25,427 | 24,672 | 24,819 | 23,101 | 21,601 | 22,363 | 20,811 | 21,078 | 22,596 |
| Driving while disqualified | 10,451 | 10,948 | 10,746 | 11,605 | 10,451 | 7,862 | 7,399 | 6,861 | 7,036 | 7,736 |
| Reckless/dangerous driving | 2,443 | 2,521 | 2,611 | 2,881 | 2,939 | 2,691 | 2,773 | 3,014 | 3,468 | 4,230 |
| Careless driving | 12,345 | 11,139 | 9,639 | 10,248 | 9,177 | 8,417 | 7,961 | 8,248 | 7,529 | 7,493 |
| Other traffic | 11,590 | 11,494 | 11,278 | 10,969 | 11,542 | 15,001 | 14,655 | 14,201 | 15,208 | 15,710 |
| Total | 64,024 | 63,183 | 60,502 | 62,201 | 58,785 | 57,018 | 56,573 | 54,538 | 55,847 | 59,340 |
Offences against administration of justice. As shown in Table 10.08, the number of convictions for offences against the administration of justice increased by 41 percent in the decade to 2004, with a particularly large increase between 2003 and 2004. The 2004 figure of 19,095 was the highest recorded in the decade. Offences against the administration of justice accounted for 10 percent of all convictions in 2004, compared with 7 percent in 1995.
Table 10.08. Convictions for offences against the administration of justice Years ending 31 December
| Offence type | 1995 | 1996 | 1997 | 1998 | 1999 | 2000 | 2001 | 2002 | 2003 | 2004 |
|---|---|---|---|---|---|---|---|---|---|---|
1A dash (-) indicates that the offence was not legislated for in that particular lime period. 2Community work is a new sentence introduced on 30 June 2002 by the Sentencing Act 2002. 3The sentence of periodic detention was abolished by the Sentencing Act 2002 on 30 June 2002. 4Failure, without reasonable excuse, to comply with any condition of release from prison. In previous reports this was called ‘breach of parole’. 5The sentence of community service was abolished by the Sentencing Act 2002 on 30 June 2002. 6Failure by a person on bail to appear in court at a specified time and place. 7Non-molestation orders were replaced by protection orders under the Domestic Violence Act 1995. 8Mostly escaping from custody in a penal institution, or escaping from police custody. Also includes a small number of charges of escaping from another type of institution, such as a psychiatric hospital. Source: Ministry of Justice | ||||||||||
| Breach community work1,2 | - | - | - | - | - | - | - | 522 | 5,251 | 7,929 |
| Breach periodic detention3 | 7,302 | 7,552 | 7,318 | 7,532 | 7,011 | 6,623 | 6,257 | 5,551 | 1,090 | 339 |
| Breach supervision | 678 | 558 | 634 | 601 | 553 | 502 | 577 | 500 | 566 | 743 |
| Breach conditions of release4 | 194 | 208 | 180 | 202 | 199 | 235 | 267 | 309 | 567 | 939 |
| Breach community service5 | 403 | 335 | 326 | 282 | 220 | 246 | 219 | 277 | 144 | 28 |
| Failure to answer bail6 | 3,380 | 3,622 | 3,959 | 4,013 | 4,124 | 4,285 | 4,307 | 4,393 | 5,104 | 5,753 |
| Breach non-molestation/protection order7 | 421 | 496 | 1,223 | 1,881 | 2,117 | 2,257 | 2,360 | 2,027 | 2,254 | 2,265 |
| Escape custody8 | 424 | 387 | 380 | 424 | 406 | 372 | 292 | 285 | 332 | 322 |
| Obstruct/pervert course of justice | 88 | 122 | 155 | 152 | 132 | 143 | 115 | 128 | 149 | 175 |
| Other | 631 | 622 | 644 | 598 | 544 | 802 | 623 | 980 | 577 | 602 |
| Total | 13,521 | 13,902 | 14,819 | 15,685 | 15,306 | 15,465 | 15,017 | 14,972 | 16,034 | 19,095 |
Protection orders. The number of breaches of protection orders increased dramatically between 1996 and 1999, from 496 to 2,117. From then until 2004, the number of convictions stabilised, averaging approximately 2,200 a year.
Offences against good order. Offences against good order showed a strongly increasing trend in the decade to 2004, rising 50 percent from 9,284 in 1995 to 13,956 in 2004, as shown in Table 10.09. Convictions for disorderly behaviour nearly doubled in the decade, from 4,284 in 1995 to 7,976 in 2004. Convictions for trespassing offences also showed an increasing trend during the decade, from 2,737 in 1995 to 3,405 in 2004.
Table 10.09. Convictions for offences against good order Years ending 31 December
| Offence type | 1995 | 1996 | 1997 | 1998 | 1999 | 2000 | 2001 | 2002 | 2003 | 2004 |
|---|---|---|---|---|---|---|---|---|---|---|
1Mostly behaving in a disorderly or offensive manner (s.4 Summary Offences Act 1981), disorderly or threatening behaviour (s.3 Summary Offences Act 1981), and fighting in a public place (s.7 Summary Offences Act 1981). Source: Ministry of Justice | ||||||||||
| Riot | 7 | 8 | 7 | 2 | 5 | 23 | 15 | 6 | 4 | 15 |
| Unlawful assembly | 64 | 33 | 69 | 40 | 21 | 23 | 17 | 30 | 53 | 72 |
| Possessing offensive weapon | 1,197 | 1,257 | 1,259 | 1,417 | 1,417 | 1,310 | 1,444 | 1,537 | 1,650 | 1,782 |
| Offensive language | 675 | 663 | 598 | 650 | 699 | 681 | 645 | 581 | 551 | 495 |
| Disorderly behaviour1 | 4,284 | 4,612 | 4,661 | 5,130 | 5,645 | 6,149 | 6,933 | 7,151 | 8,114 | 7,976 |
| Trespassing | 2,737 | 2,859 | 2,997 | 3,028 | 3,006 | 3,135 | 3,092 | 3,288 | 3,393 | 3,405 |
| Other | 320 | 300 | 336 | 285 | 269 | 265 | 254 | 249 | 222 | 211 |
| Total | 9,284 | 9,732 | 9,927 | 10,552 | 11,062 | 11,586 | 12,400 | 12,842 | 13,987 | 13,956 |
Miscellaneous offence convictions. The wide variety of offences included in this category makes it difficult to explain total annual fluctuations in the number of convictions for these offences.
Legislative amendments to the Dog Control Act 1996 led to large decreases in the number of convictions under this act, as shown in Table 10.10.
Legislative amendments to the Sale of Liquor Act 1989 also led to large decreases in the number of convictions under this act between 2000 and 2002.
The number of these convictions then increased in 2003 and 2004 as convictions for breaching local liquor bans were included in this category.
Prior to April 2003, these convictions were not recorded in this category but were included in the category of other miscellaneous offences, as the exact number of such convictions could not be determined.
Table 10.1. Convictions for miscellaneous offences Years ending 31 December
| Offence type | 1995 | 1996 | 1997 | 1998 | 1999 | 2000 | 2001 | 2002 | 2003 | 2004 |
|---|---|---|---|---|---|---|---|---|---|---|
1Excludes a small number of offences prosecuted under this act which were categorised as violent offences against the person. 2The Dog Control Act 1996 replaced the Dog Control and Hydatids Act 1982. 3Offences under the Income Tax Act 1976, the Income Tax Act 1994, the Goods and Services Tax Act 1985, or the Tax Administration Act 1994. 4Includes convictions under the Sale of Liquor Act 1962 and the Sale of Liquor Act 1989 (from 1 April 1990). 5This category comprises convictions under the Fisheries Act 1983 and related regulations, e.g. commercial fishing regulations and freshwater fisheries regulations. 6Includes a wide variety of offences such as breaches under the Health and Safety in Employment Act 1992; the Insolvency Act 1967; the Resource Management Act 1991; the Films, Videos, and Publications Classification Act 1993; the Building Act 1991, the Telecommunications Act 1987; the Medicines Act 1981; and the Conservation Act 1987. Source: Ministry of justice | ||||||||||
| Arms Act1 | 826 | 866 | 880 | 952 | 921 | 857 | 705 | 737 | 808 | 885 |
| Dog Control Act2 | 6,828 | 7,440 | 1,641 | 885 | 592 | 432 | 491 | 346 | 551 | 290 |
| Tax acts3 | 4,389 | 3,710 | 2,471 | 2,464 | 2,105 | 2,269 | 3,773 | 4,161 | 5,313 | 5,182 |
| Liquor-related4 | 940 | 928 | 957 | 1,200 | 1,181 | 223 | 190 | 251 | 1,242 | 3,232 |
| Fisheries Act5 | 453 | 310 | 319 | 714 | 455 | 750 | 762 | 719 | 792 | 859 |
| Other6 | 2,957 | 3,747 | 3,438 | 3,886 | 4,183 | 3,132 | 3,375 | 3,936 | 4,810 | 3,067 |
| Total | 16,393 | 17,001 | 9,706 | 10,101 | 9,437 | 7,663 | 9,296 | 10,150 | 13,516 | 13,515 |
Characteristics of convicted offenders. Male offenders accounted for 82 percent of all cases that resulted in conviction in 2004 for which the gender of the offender was known. Forty-five percent of all convicted cases in 2004 for which the ethnicity of the offender was known involved Europeans, 43 percent involved Māori, 9 percent involved Pacific peoples and 3 percent involved offenders of some other ethnicity.
New Zealand's light-handed approach means competing domestic and foreign telecommunications companies can offer the whole range of information and communication technologies, including television.
Rapid expansion in the use of computers, the internet and mobile and digital technology has blurred the traditional distinction between communications – telephone, television, radio, broadcasting, facsimile and film – and information processing and storage.
Consequently, information and communications technologies (ICTs) have transcended their infrastructural role and have emerged as facilitators and enablers for complementary innovations. As such, they function primarily as ‘general purpose technologies’ and have a key role in both enhancing the lives of individuals and communities and accelerating economic growth.
The rapid expansion of the internet has probably caused more social and economic change than any other aspect of ICT. The internet gives individuals, communities, businesses and governments the ability to communicate with millions of others almost instantaneously and at low cost.
However, as full participation by local, national and international communities becomes increasingly predicated upon both access to ICTs and the skills to use them, the need to ensure ‘digital inclusion’ is a constant challenge.
New technologies also bring new problems, and concerns over ‘cultural colonisation’ through globalisation, new copyright applications, privacy, security, the spread of pornography and spam need to be addressed.
New Zealand's small size, geographic isolation and technologically-aware population have all contributed to the widespread and rapid uptake of ICTs. Electronic activities such as EFTPOS transactions, automatic teller machines and internet banking, digital photography, mobile phone text messaging and email are now well established in the economic and social lives of most New Zealanders.
New Zealand's relatively cheap dial up internet access facilitated the rapid adoption and diffusion of internet use. However, it may also have been responsible for a slower uptake of broadband services, since the expense of the latter is still comparatively high and telecommunications companies provide few opportunities for uncapped data options.
Nationwide availability of broadband to 100 percent of schools and communities throughout New Zealand has been achieved as a result of a joint government and private sector initiative called Project PROBE. The most remote schools and communities, including those in the Chatham Islands, are serviced by the satellite IPStar.
The government has implemented a wide range of other ICT initiatives in e-government, health, commerce and education. In May 2005, the Digital Strategy, a whole-of-government strategy providing a unifying framework for ICT-related policies and initiatives over the following five years, was launched.
The strategy identifies three key enabling conditions – content, confidence and connection – necessary to facilitate the transition to a ‘knowledge-based society’, where all New Zealanders can access and confidently use appropriate, affordable digital technologies to find the information they need.
The strategy also focuses on building partnerships between the key user groups – individuals and their communities, businesses and government.
The government is providing $60 million over four years to implement the Digital Strategy, including $44.7 million contestable seed funding through the Broadband Challenge Fund and the Community Partnership Fund for partnership-driven activity.
The $24 million Broadband Challenge Fund will assist development of open access networks to offer affordable broadband to urban areas, where the objective is high-speed connectivity for urban and regional centres; and remote communities, where the objective is to address the lack of access of rural and under-served communities and businesses to affordable broadband.
The Community Partnership Fund of $20.7 million funding over four years is for initiatives that will improve people's capability and skills to use ICT and develop digital content. The government has also committed funds to an advanced network for research and educational institutions.
New Zealand's light-handed regulatory approach means there are no specific licensing requirements to begin business as a telecommunications carrier, and no foreign ownership restrictions. This has allowed competing telecommunications companies to offer the whole range of ICT services, including television, telephony and internet access.
At the beginning of 2006, there were eight carriers offering services under the Telecommunications Service Obligation (TSO), of which the main ones were Telecom, TelstraClear and Vodafone. A small number of companies, such as Woosh Wireless and Team Talk, offer telecommunication services outside the TSO.
At March 31 2005, there were 66 Internet Service Providers (ISPs) operating in New Zealand, with around 1.24 million active subscribers. Internet cafes are common throughout the country.
In line with OECD guidelines, Statistics New Zealand, in collaboration with the Ministry of Economic Development, is developing a suite of surveys to measure the impact of ICTs across the economy. These surveys include ICT use and uptake for business, government and households, as well as ICT industry surveys, including a twice-yearly ISP census survey and an ICT supply survey.
The government was indirectly involved in establishing the internet through its funding of universities and other research institutions, but commercial internet services in New Zealand have been developed entirely by the private sector.
Responsibility for domain name registrations in the .nz domain (for example, stats.govt.nz) lies with Internet NZ (formerly the Internet Society of New Zealand).
The Māori Internet Society, established with help from the Māori Language Commission among others, promotes a strong Māori presence on the internet and has successfully established the .maori.nz internet domain name.
In general, there are minimal restrictions on New Zealand organisations registering a domain name in the .nz domain.
At 31 October 2005, there were 203,994 active registrations in the .nz domain. During the month of October 2005, 5,407 new domain names were created, compared with 4,351 in October 2004 and 3,828 in October 2003. In the same month, there were 71 active registrations in the .maori.nz domain and 12 in the .iwi.nz domain.
There are four moderated second level domains in the .nz domain name space – .govt.nz, .iwi.nz, .cri.nz and .mil.nz.
Following a decision made early in 2005, Internet NZ is implementing a dispute resolution service for .nz domain names based on the Nominet UK system, which has been in place successfully for a number of years. The dispute resolution service provides an alternative to court action, giving parties another mechanism to resolve disputes.
Of New Zealand's 1.24 million internet subscribers at 31 March 2005, residential (household) subscribers accounted for 80 percent and provided 63 percent of the revenue. Business/government subscribers were 20 percent of the total and provided 37 percent of revenue. There were 30 subscribers per 100 inhabitants in New Zealand, compared with 29 subscribers per 100 inhabitants in Australia.
Analog is the predominant connection technology in New Zealand, with 869,000 subscribers, or about two-thirds of the total.
There are nearly 440,000 non-analog (broadband) subscribers, with digital subscriber line (DSL) being the most common connection technology within this category. Broadband subscribers increased 15 percent in the year to 31 March 2005.
About 800,000 subscribers used a download speed of less than 64 kbps. Download speeds of 64kbps to 10mbps or greater are used by 430,000 subscribers. A download speed of 64kbps to 128kbps is the most common.
In a 2003 e-government survey carried out by the State Services Commission, more than 75 percent of New Zealanders had used the internet in the previous month, a higher proportion than in any other country.
In the 10 years to 2004, the number of homes with a computer more than doubled, with 52 percent having at least one. While it is true that there is a strong relationship between internet usage and income, New Zealanders have a high level of accessing the internet on computers other than their own.
Figure 11.01 tracks growth in the number of New Zealanders with internet access at any location.
Figure 11.01. Growth in internet access
Proportion
of New Zealanders with internet access at any
location
Years ending 30
September
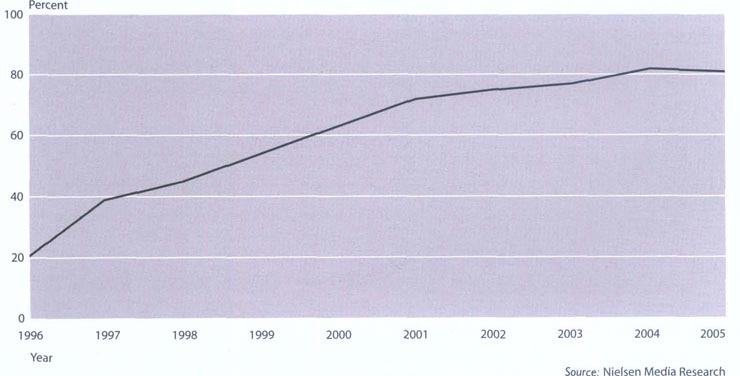
Figure 11.02 shows that sending and receiving email is the predominant internet activity.
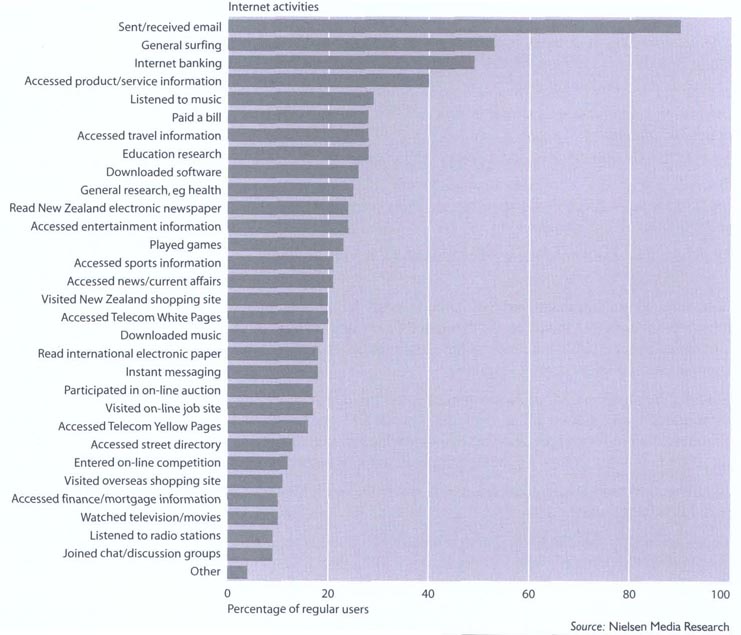
The E-Government Unit (EGU) is responsible for implementing the government's vision to enable all New Zealanders to use information and communications technologies (ICTs) to access government information and services and to participate in democratic processes.
A four-phase strategy for the integration of information, service delivery and government processes from a single point by 2010 is being implemented.
A comprehensive report on progress towards e-government, the 2004 Achieving E-Government Report, had as one of its conclusions that ‘all agencies use the internet, including websites and records on the government portal, to provide a good level of ready access to government information and services.’
A single point of online access, the government portal (.govt.nz), enabled convenient public access at June 2004 to more than 300 agencies and 1,500 services.
The portal allows agencies to network their information with other agencies, especially those with related information and services. Metadata records can be used simultaneously in other government portals, further enabling services to be bundled for different audiences. Most agencies are providing good metadata records, and often provide significantly more information and services than people are aware of.
Agencies are increasingly sharing electronic data through the use of the internet and CDs. The number of data-sharing agreements permitted by the Privacy Commissioner increased from 28 in 1995 to 70 in June 2004.
Widespread adoption of information-sharing standards, such as the e-Government Interoperability Framework (e-GIF) developed by the EGU, is helping to make information-sharing easier and less expensive for agencies. The use of the e-GIF is mandatory for all public service departments.
The EGU is developing other standards to help agencies integrate information and services. These include a standard for recording names and addresses, and a standard for news feeds. The provision of many online integrated services will be feasible once online authentication is available.
Indications are that e-government is welcomed by New Zealanders, with ACNielsen research showing that government websites as a whole group are in the top five accessed by New Zealanders.
People contact government most frequently to complete a form and an increasing number of forms can be fully completed online.
Information and communications technologies (ICT) were targeted as one of three significant high-growth, high-value areas in the government's 2002 Growth and Innovation Framework (GIF).
A number of initiatives followed the report of an ICT taskforce charged with setting a vision for ICT development and cross-sector enablement. These were aimed at increasing expertise in the ICT area, raising awareness of ICT and improving business capability in the ICT sector.
HiGrowth, a joint industry/government initiative, is strongly focussed on increasing capability of the ICT sector.
Seventy-nine percent of New Zealand businesses have internet access, higher than comparable Organisation for Economic Co-operation and Development countries such as Australia and Canada. Eighty-seven percent of large businesses operate websites, though this figure drops to 44 percent for the smallest companies, which comprise the bulk of New Zealand businesses.
Employment in ICT industries (excluding telecommunications services) reached 36,440 in 2002, more than double the 1988 figure.
New Zealand has a highly competitive ICT market, with a range of equipment and software companies supplying both the domestic market and niche markets overseas.
Total sales of information technology goods and services (excluding communication services) were valued at $7.015 billion in the year ending 30 June 2004, according to Statistics New Zealand's Information Technology Survey. This was a 0.6 percent increase on the value of sales recorded in the 2003 financial year, mainly due to higher sales of software, offset by a 10.7 percent decrease in the sale of communications hardware and cables.
A 14.9 percent decrease in total exports of information technology goods and services (excluding communication services) of $576.3 million was mainly the result of a 42.7 percent decrease in exports of communication hardware and cables and a 4.6 percent decrease in exports of software.
The export fall off was more than offset by a 2.2 percent increase in sales of information technology goods and services to domestic customers, which reached $6.439 billion. The increase was mainly the result of a $126.5 million increase in software sales (17.4 percent) and an $18.2 million (3 percent) increase in sales of communications hardware and cables. Sales of other information commodities (excluding communication services) decreased 17.9 percent to $1.586 billion. Total communication services sales decreased $1.7 million to $5.256 billion (0.03 percent) in the 2004 financial year.
Spam. Spam is a term generally used in relation to unsolicited and unwelcome electronic messaging, normally in the form of unsolicited bulk emails marketing products. Spam uses up network resources and the productive time of computer users, is a vehicle for viruses and scams and undermines user confidence in the use of electronic communications. The government has recommended a multilateral strategy to combat spam, including legislation expected to be introduced during 2006, self-regulation in the form of industry codes of practice, technical measures, education and awareness-raising for users, and international cooperation. An industry code of practice has been developed by service providers for text messaging and a similar code is being developed for email. The Direct Marketing Association has also developed a code of practice for e-marketing.
The current government has given renewed priority to the role of broadcasting in contributing to the nation's culture and identity and to the promotion of a well-informed participatory democracy.
In July 2000, the government formulated a set of broadcasting content objectives that guided subsequent decisions, such as reorientation of Television New Zealand's (TVNZ) direction and the allocation of non-commercial spectrum. The objectives are designed:
To ensure that all New Zealanders have reasonable and regular access to broadcasting that represents the uniqueness and diversity of New Zealand life, recognising that the histories and stories of whānau, hapū and iwi are integral to any description of that life.
To meet the information and entertainment needs of as many interests as reasonably possible, including those that cannot be met by commercial broadcasting.
To contribute to public awareness of, and participation in, the political and social debates of the day.
To provide for minority interests and increased choice.
To encourage innovation and creativity in broadcasting, while aiming to continually increase audience satisfaction with quality of content.
One of the most significant changes resulting from these objectives was the Television New Zealand Act 2003, which transformed TVNZ from a state-owned enterprise into a Crown company. Its charter sets out, in broad terms, the kind of programming it is to provide. The act requires TVNZ to keep a balance between giving effect to the public broadcasting objectives embodied in the charter and maintaining its commercial performance. In 2003/04, the government granted direct funding of $15 million to TVNZ for charter purposes.
In February 2005, the government published a broadcasting programme of action setting out a series of priority areas for broadcasting policy to the end of the decade. The programme encompasses work on the funding of broadcasting, the future role of public broadcasters, the transition to digital transmission, and the enhancement of regional broadcasting, among other tasks.
The role of NZ On Air is to promote cultural and social objectives in broadcasting that are seen as unlikely to receive sufficient commercial provision.
Members of the commission are appointed by the Minister of Broadcasting. The statutory objectives of NZ On Air are to:
Reflect and develop New Zealand identity and culture by promoting programmes about New Zealand interests and by promoting Māori language and culture.
Maintain and, where considered appropriate, extend radio coverage to New Zealand communities that otherwise would not receive a commercially-viable signal.
Ensure programmes are available to provide for the interests of women, youth, children, people with disabilities, and minorities in the community, including ethnic minorities, and encourage broadcasts that reflect the diverse religious and ethical beliefs of New Zealanders.
Encourage the archiving of programmes likely to be of historical interest to New Zealand.
NZ On Air fulfils these objectives by providing funds for the broadcasting, production and archiving of programmes.
When allocating funds for programme production, NZ On Air is required to take into account such factors as availability of other sources of funding, likely audience size and the likelihood of a programme being broadcast.
Funding of NZ On Air's activities is a charge against Vote: Culture and Heritage. In the 2004/05 financial year, NZ On Air spent $60.4 million on production of television programmes and $26.7 million on National Radio and Concert FM. It also spent $4.2 million on New Zealand music projects, $1.1 million on broadcasting archives and $654,000 on a variety of programmes for commercial radio.
The NZ On Air website is www.nzonair.govt.nz
The Broadcasting Standards Authority is a Crown entity set up by the Broadcasting Act 1989, reporting to parliament through the Minister of Broadcasting.
The authority's mission is to encourage broadcasters to develop and maintain programme standards which respect human dignity, current social values and research findings, while providing an independent process for determining complaints about alleged breaches of those standards.
The authority does not deal with complaints about advertisements, except for party political and parliamentary candidate advertising on radio and television during the lead up to an election. Under the Broadcasting Amendment Act 1996, the Electoral Commission is responsible for allocation to political parties of free broadcasting time and funding for party political advertising broadcast before an election.
The authority consists of four members, one of whom is appointed after consultation with broadcasters and another after consultation with public interest groups.
Of the 214 decisions issued by the authority in the year ending 30 June 2005, 40 were upheld in total or in part, 166 were not upheld and eight were interlocutory or unable to be determined. Of the complaints upheld, 63 percent related to balance, fairness and accuracy and 11 percent related to matters of good taste and decency (including language).
Twenty complaints were upheld against Television New Zealand Ltd broadcasts, eight against TV3 Network Services Ltd, two against Radio New Zealand and one against Sky Network Television Ltd. Nine complaints were upheld against other radio and television broadcasters.
The Broadcasting Standards Authority website is www.bsa.govt.nz
Under the Radio Communications Act 1989, frequencies suitable for radio and television were reserved throughout New Zealand for the promotion of Māori language and culture.
From 1989 to 1994, NZ on Air provided public funding for operating and capital costs of Māori radio stations and for the production of Māori programmes broadcast on network television.
The Broadcasting Amendment Act 1993 established the Māori broadcasting funding agency Te Māngai Pāho with the function of promoting Māori language and Māori culture by making funds available for broadcasting and the production of programmes to be broadcast.
On 1 January 1995, Te Māngai Pāho assumed primary responsibility for allocation of public funding for Māori broadcasting. This includes the purchase of Māori language programming broadcast on national television and Māori language content from 21 iwi radio stations. Māori radio programming is also purchased from programme providers through contestable funding rounds and the programmes made available to iwi stations by means of a nationwide radio programme distribution service.
In 2001. the government confirmed its intention to establish a Māori television channel, and the Māori Television Service Act was passed in 2003. The channel, known as Māori Television, began transmission on 28 March 2004 on free to air digital and UHF frequencies.
Principal function of the television service is to promote te reo Māori me nga tikanga Māori through provision of a high-quality, cost-effective Māori television service, in both Māori and English, which informs, educates and entertains, and in doing so enriches New Zealand's society, culture and heritage.
Television programme funding is provided by Te Māngai Pāho through direct funding to Māori Television (for in-house production and acquisitions), a contract with TVNZ for specific Māori language programmes and through contestable funding to independent production houses for programmes destined for Māori Television or the other national networks.
In the year ending 30 June 2006, appropriation for Te Māngai Pāho's broadcasting funding for television was $40.3 million and $11.6 million for radio.
Telecom New Zealand Ltd, provider of the most extensive range of telecommunication services throughout the country, was established as a state-owned enterprise on 1 April 1987 following break up of the New Zealand Post Office.
On 1 April 1989, the telecommunications market in New Zealand was opened fully to competition.
Companies offering telecommunication services in addition to Telecom include TelstraClear, Vodafone, WorldxChange, TeamTalk, Compass, Call Plus and Ihug.
The main competitive telecommunication services are international, national and cellular telephone calls. There is competition in the supply of local telephone and data services to businesses in central business districts. The number of areas where there is residential telephone service competition is increasing, with TelstraClear initially offering fixed line telephone services in Wellington and Christchurch. Woosh Wireless and Compass are deploying wireless solutions for fixed line access to offer competitive telephone and data access services. Telecom and Vodafone provide cellular mobile phone services, with their networks giving extensive coverage of New Zealand.
A particular feature of New Zealand's residential toll service market are calls and off-peak calls up to a set duration, e.g. two hours, that have a capped charge applied, such as $3 capped national calls, $4 capped calls to Australia and $8 capped calls to the United States and Canada and the United Kingdom and Ireland. A $5 capped call option for national peak calls is also available to residential users.
A Telecommunications Commissioner within the Commerce Commission administers regulated telecommunication services that include network interconnection, telephone number portability and wholesale telecommunication services. The commissioner's key functions are to resolve disputes over regulated services, to report to the Minister of Communications on the desirability of regulating additional services, and to calculate and allocate the net cost of telecommunication service obligations.
Telephone density is high in New Zealand, with more than 96 percent of households having access to a telephone. The number of mobile phones has increased in recent years and at the beginning of 2006, nearly 70 percent of the population had a mobile phone. Fifty-eight percent of all homes had mobile phones.
Telecommunications relay service. The government has established a telecommunications relay service to help ensure that the telephone communication needs of deaf, hearing-impaired and speech-impaired New Zealanders are met.
Telecom Corporation of New Zealand Ltd. Telecom Corporation of New Zealand Ltd, through the Telecom group, provides a full range of internet, data, voice, mobile and fixed line calling services to customers in New Zealand and Australia. Privately owned since September 1990, Telecom has New Zealand's most extensive telecommunications network. Nearly half of Telecom's shareholding is now held in Australasia. Telecom invested $3 billion in upgrading its New Zealand network in the five years to June 2005 and is investing a further $1.4 billion in development of a next generation network to deliver voice, video and data over one connection. In late 2004, Telecom launched New Zealand's first third generation mobile phone network at a cost of $58 million. At 30 June 2005, Telecom had 1.6 million mobile connections, 1.8 million fixed line residential and business customers in New Zealand; and 260,000 total broadband customers – 205,927 of whom were residential customers. Telecom's internet access, navigation and content service, Xtra, had approximately 374,000 active dial-up customers at 30 June 2005. Telecom's global partners include Alcatel, Lucent Technologies, EDS and Sprint. Telecom provides trans-Tasman solutions through Gen-I, Computerland and, in Australia, AAPT. The Telecom website is www.telecom.co.nz and the XTRA website www.xtramsn.co.nz.
TelstraClear Ltd. TelstraClear is a voice and data company providing innovative products and services to the business, government, wholesale and residential sectors. TelstraClear has a customer base of around 400,000, made up of residential users in Wellington, Christchurch and Kapiti and business clients in every major central business district and in more than 30 regional centres. TelstraClear Ltd is wholly owned by Telstra Corporation Ltd, Australia's largest telecommunications company. TelstraClear Ltd's website is www.telstraclear.co.nz
Vodafone New Zealand. Vodafone is New Zealand's leading mobile operator, providing a wide range of services, including voice and data solutions, to more than 2 million customers. Vodafone Group acquired its New Zealand business (previously known as BellSouth New Zealand) in November 1998. At the time of purchase, Bellsouth had 138,000 customers. As of 31 December 2005, Vodafone New Zealand had 2,024,000 customers and a 53 percent share of the New Zealand mobile market. Vodafone has more than 1,500 mobile phone sites around New Zealand making up its GSM digital network, covering 97 percent of the population. Since its arrival in New Zealand, Vodafone has brought competition to the mobile market and introduced a raft of products and services for business and consumers, including Prepay, TXT, PXT, video PXT, the BlackberryTM handheld device and international voice and data roaming. In August 2005, Vodafone launched its new 3G network, which supports real-time, face-to-face video calling, full-track music downloads to mobile, mobile television and the high-speed Vodafone Mobile Connect datacard. Vodafone planned to launch 3G broadband on its mobile network by the end of 2006, offering New Zealanders an affordable, viable alternative to fixed line options. Vodafone has invested more than $2 billion in New Zealand since 1998 and supports a wide range of community, sporting and charitable initiatives, including the Vodafone New Zealand Foundation. It employs around 1,400 people, the majority of whom are based in Auckland.
TUANZ. The Telecommunications Users’ Association of New Zealand (TUANZ) recognises the value of effective and efficient use of information technology in business and is committed to leading the innovative use of e-commerce in New Zealand. The purpose of TUANZ is to lead informed and sophisticated usage of technology-based communications by New Zealand businesses. TUANZ has an interactive group involved in raising awareness of, and developing, interactive multimedia, an education group working with the teaching fraternity, and a contact centre group, which works to raise the standard and develop the potential of the contact centre industry in New Zealand.
Broadband. Broadband (high speed internet) data services share the characteristics of high speed and being ‘always on’ (i.e. it is unnecessary for users to establish specific connections to a service provider). Almost nationwide broadband coverage is available either through terrestrial wire and wireless services, accounting for approximately 95 percent (predominantly DSL), or via satellite technologies. Residential uptake is relatively low in comparison to OECD countries, but is accelerating quickly as prices reduce following decisions made by the Telecommunications Commissioner in regard to regulating an unbundled bit stream service. A number of relatively small, localised wireless operators have entered the telecommunications market offering broadband wireless services using general user radio licence spectrum (2.4 and 5 GHz bands), including Cafenet in Wellington, Hawke's Bay Internet, The Pacific. Net (Tasman and Buller districts) and South Waikato Networks Limited. In addition, there are many private or semi-private networks using general user licence spectrum. Since operators are not required to obtain permits or to register services, the number of such networks is not known.
Advanced Network. The New Zealand Government has committed to development and construction of an Advanced Network for New Zealand. The Advanced Network will comprise an optical network ‘backbone’ linking research and educational institutions in Auckland, Hamilton, Palmerston North, Wellington, Christchurch and Dunedin, with regional connections to Hawke's Bay, Nelson and Rotorua. Its members will include New Zealand's tertiary education institutions, Crown Research Institutes and the National Library. The Advanced Network is focused on the specific needs of the research, education and innovation communities. The network will deliver at least 1 gigabit/second data to research institutions, with backbone speeds expected to exceed 40 gigabit/second within a few years.
High Performance Computing Centres. There are several High Performance Computing Centres (HPCC) in the North Island of New Zealand, and the Canterbury Development Corporation (CDC) is developing a proposal for another in the South Island. The National Institute of Water and Atmospheric Research has a CRAY 3TE parallel supercomputer (Maui) with 17.6 terabytes of storage capacity. When first installed in 1999, it was ranked as the 64th most powerful computer in the world. It has very-high-speed interconnection between 32 powerful microprocessors and its theoretical peak performance after a 2004 upgrade is 638 gigaflops (638 x 109 operations a second). It is mainly used for climate, ocean, fisheries and atmospheric modelling. The University of Auckland has an IBM eServer POWER4-based supercomputer, the Regatta H 32 processor with 32 gigabytes of operating memory. It is mainly used for biological modelling and bioengineering, such as that used for the Physiome Project, the world's first accurate computer model of a human heart that behaves like a human heart when subjected to chemical or electrical changes, drugs or other influences. The New Zealand Supercomputing Centre (NZSC) in central Wellington is one of the world's largest commercially-available supercomputing clusters and is a joint venture between Weta Digital and Telecom subsidiary Gen-i. The servers were originally set up for use by Weta Digital to help create special effects for The Lord of the Rings film trilogy. The NZSC can provide up to 5.6 teraflops of pure processing power for high-intensity computing applications and projects. Victoria University of Wellington has implemented a computational grid consisting of 175 Unix workstations any or all of which can be brought to bear on a single problem, such as gravitational lens and random evolution modelling. VUW is in the process of expanding the grid to include 900 Windows workstations located in various student computing suites. Sun's Grid Engine has been used to implement the Unix Grid and Condor has been used to build the Windows-based grid. Globus will be used to integrate the two into a single computational resource.
Television New Zealand Ltd. Television New Zealand Ltd (TVNZ) operates two national, free-to-air television channels, TV ONE and TV2. TVNZ's activities include programme production, interactive services, licensing, teletext and captioning services and creative and technical production services. TVNZ's primary purpose is to maintain its commercial performance and to meet its charter objectives, which are to inform, educate and entertain all New Zealanders, reflecting and fostering New Zealand's identity and culture. Both TV ONE and TV2 broadcast 24 hours a day, seven days a week. TV ONE offers a broad range of programming, including news and current affairs, sport, documentaries, drama and comedy. It also features a full entertainment schedule, and screens more New Zealand programmes than any other channel. TV2 focuses on entertainment and delivers a strong line-up of comedies, drama, movies and local programming. In 2005, 19 of the top 20 programmes were broadcast by TVNZ. TVNZ group revenue for the financial year ending 30 June 2005 was $437 million. The year's trading result provided the ability to absorb a one-off non-recurring charge relating to programming stock. This accounting adjustment brought net operating surplus to $6.2 million. The TVNZ website is www.tvnz.co.nz
TV3 Network Services Ltd. TV3 is a private sector, free-to-air national television network, on air since November 1989. Headquarters are in Auckland, with offices and studio facilities in Wellington, Hamilton, Christchurch and Dunedin. TV3 is owned by CanWest Global Communications Corporation, a Canadian communications company, and reaches 98 percent of New Zealand's population. The network, a broad-based entertainment channel, primarily targets viewers aged 18–49, with a strong emphasis on news, current affairs, sport and local programming. Internationally-sourced programmes come primarily from the United States. TV3 has exclusive agreements with FOX and Universal, as well as the ability to source drama and comedy from many other international distributors. In June 1997, TV3 launched a second free-to-air channel on VHF frequency, TV4. TV4 was relaunched as the free-to-air music channel C4 in October 2003.Targeting young, urban Kiwis aged 15–29, C4 runs daily from 4pm to midnight and to lam on Fridays and Saturdays. Twenty-five percent of videos played on C4 are local. C4 operates from TV3 studios in Auckland.
Table 11.01 shows local content programming by free-to-air television networks from 1990 to 2004
Table 11.01. Hours of local content on network television
| Year | TV ONE | TV2 | TV3 | Total |
|---|---|---|---|---|
1From 2004, in line with the Television Local Content Group agreement, local content on television is being measured on an 18-hour clock (6am to midnight) basis. Previously, a 24-hour clock had been measured. Source: NZ On Air | ||||
| 1990 | 2,474 | 772 | 1,003 | 4,249 |
| 1991 | 1,811 | 1,016 | 1,212 | 4,039 |
| 1992 | 2,526 | 1,227 | 1,962 | 5,715 |
| 1993 | 2,005 | 1,042 | 1,741 | 4,788 |
| 1994 | 2,210 | 1,041 | 1,718 | 4,969 |
| 1995 | 2,532 | 1,113 | 1,373 | 5,018 |
| 1996 | 2,407 | 1,255 | 1,404 | 5,066 |
| 1997 | 2,638 | 1,324 | 1,639 | 5,601 |
| 1998 | 3,503 | 1,307 | 1,487 | 6,297 |
| 1999 | 3,516 | 1,334 | 1,292 | 6,142 |
| 2000 | 3,544 | 1,158 | 1,484 | 6,186 |
| 2001 | 3,587 | 1,298 | 1,305 | 6,190 |
| 2002 | 4,003 | 1,758 | 1,439 | 7,200 |
| 2003 | 3,586 | 1,742 | 1,347 | 6,675 |
| 20041 | 3,401 | 1,603 | 1,420 | 6,424 |
Prime Television. In 1997, Prime Television acquired 34 UHF licences covering all major cities and towns in New Zealand and commenced broadcasting in August 1998. Prime Television is a free-to-air terrestrial broadcaster with its main office in Albany, Auckland, and regional sales offices in Hamilton, Tauranga, Wellington, Christchurch and Dunedin. An initial potential reach of 65 percent of the population had been expanded to 71 percent (2.1 million) by the end of 2001 and to more than 90 percent by November 2003. In March 2002, Prime Television began broadcasting an entertainment-based programme schedule following a joint venture agreement with the Nine Network of Australia, departing from its initial British programming line-up. In February 2006, the Commerce Commission approved a $30.26 million takeover of Prime by SKY Network Television.
SKY Network Television Ltd. SKY Network Television Ltd is primarily a pay television company which began broadcasting in May 1990 using scrambled UHF channels. At 16 February 2006, SKY had 640,521 subscribers. SKY's UHF signal reaches more than 83 per cent of New Zealand households. In December 1998, SKY launched its digital direct broadcast satellite service, which reaches all of New Zealand's estimated 1.4 million television households. SKY broadcasts more than 70 entertainment channels on its digital satellite platform and five on its UHF terrestrial platform. SKY owns and operates seven of its channels, including SKY Sports channels, SKY 1, the Rugby Channel and SKY Movie channels. In February 2006, the Commerce Commission approved a $30.26 million takeover bid by SKY for the free-to-air channel operated by Prime Television.
Regional and local television services. A number of small regional television services operate throughout New Zealand, providing programmes ranging from music television to mixed local and international news and entertainment. Other services provide information about local events and attractions, targeted primarily at tourists. Local television services operating in 2006 included Family Television Network (Warkworth), Triangle Television (Auckland), Big TV (Hamilton), Geyser Television (Rotorua), Eastland Television (Gisborne), Channel 61 (Taupo). Channel 51 (Hawke's Bay), Taranaki Community Television Trust (Taranaki), Mainland Television (Nelson), CTV (Christchurch), Shine TV (Christchurch), Channel 5 (Queenstown), Channel 9 (Dunedin) and Mercury Television (Invercargill).
Trackside. Trackside broadcasts live racing, race results and programmes about racing on a nationwide basis, using UHF and satellite frequencies. It is owned by the New Zealand Racing Board.
Non-commercial television. The government has reserved UHF frequencies nationwide for the provision of non-commercial (community access) television services. Since 1998, the Ministry of Economic Development, latterly on the recommendation of the Ministry for Culture and Heritage, has offered licences for non-commercial use to broadcasters in the Far North, Auckland, Waikato, Bay of Plenty, Taranaki, Wellington, the Wairarapa, the East Coast, Nelson/Marlborough, Christchurch and Oamaru regions. In the 2005 budget, public funding was made available for regional television for the first time, and funding support was significantly increased for non-commercial local radio. This funding is channelled through NZ On Air.
The radio broadcasting sector consists of public radio service Radio New Zealand, which broadcasts National Radio and the Concert Programme; two major private owners of radio networks; other private stations; a publicly-funded Pacific radio service, Niu FM; a series of non-profit community stations; student radio stations; and a network of 21 iwi radio stations.
In November 2001, the government gave priority to reserving frequencies for:
National Radio to be simulcast on reserved FM frequencies.
Concert FM to migrate to a designated group of frequencies in the upper FM band. Following a decision that Concert FM will not now make use of these frequencies, they remain in reserve pending future decisions on the nature of youth radio services.
Establishment of a national service for promotion of Māori language and culture. Further decisions on the use of these frequencies are pending.
Establishment of a national service for Pacific peoples in New Zealand. The National Pacific Radio Trust has been established and government funding provided for a Pacific radio network, Niu FM. Following a pilot period, Niu FM was reconfirmed as the provider by the government in 2005. Long-term objectives and arrangements for its organisational form were to be decided by the government early in 2006, following consultation with Pacific communities.
Radiocommunications. The radio spectrum is an important resource managed by the Crown, through the Ministry of Economic Development, on behalf of the people of New Zealand. The efficient use of this resource to provide telecommunications and broadcasting services is essential to the functioning of a modern economy. The main legislative vehicle for managing the radio spectrum in New Zealand is the Radiocommunications Act 1989, which provides for a market-based system of spectrum management. with up to 20-year tradeable spectrum access rights. The Radiocommunications Amendment Act 2000 allows greater flexibility in the Crown's management of the radio spectrum.
Allocation by tender/auction. The Radiocommunications Act 1989 heralded a new era for radio spectrum management, enabling use of market-driven allocation mechanisms for distribution of spectrum rights. Radio spectrum was initially sold in 1989 and 1990 using a second-price tender system, then later by first-price tender. In 1996, an internet-based computer system was developed for the sale of spectrum by auction. There were six rounds of tenders and seven auctions between 1989 and 2005. Frequencies auctioned included bands suitable for UHF television, AM and FM radio broadcasting, mobile telephony (including 3G) and fixed wireless telecommunications. Once spectrum rights have been sold by the Crown, the purchaser has the right to resell and transfer these rights to other parties.
Other allocation methods. The administrative licensing regime that existed before 1989 still exists in many bands. These bands are planned for various services, and licences are available on application by people wanting to utilise these frequencies in accordance with these plans. Examples include land mobile and various public safety and civil aviation agencies. Spectrum rights will begin to expire from 2010 and the government agreed in 2003 on a policy regarding renewal of commercial rights. The policy creates a presumption that current rightholders will receive an offer for the renewal of their rights for a further 20 years at a price to be determined by a price-setting formula being developed by the Ministry of Economic Development. Finally, not all use of the spectrum is on an individually-licensed basis. There are also spectrum ‘public parks’, which anyone may use in accordance with terms of the corresponding general user licence. These are often used for consumer devices such as garage door openers.
Radio New Zealand. Radio New Zealand (RNZ), a Crown entity established by the Radio New Zealand Act 1995, is the country's public radio broadcaster. The act established the Radio New Zealand Charter, which sets out the company's broadcasting functions. RNZ receives annual funding of about $29.5 million (including GST) from NZ On Air to maintain and enhance its services. Funding for Radio New Zealand International, which broadcasts primarily to the Pacific region, is provided through the Ministry for Culture and Heritage. RNZ operates three non-commercial radio networks (National Radio. Concert FM and the AM Network), a shortwave service (Radio New Zealand International), a news service (Radio New Zealand News and Current Affairs) and Sound Archives Ngā Taonga Kōrero. National Radio and Concert FM began to be carried by SKY Network Television's digital satellite in 2000.
Radio New Zealand receives annual funding of about $29.5 million to maintain and enhance its services.
National Radio focuses primarily on news and information, with a mix of features, drama and entertainment programmes. Broadcasting 24 hours a day, the network reaches most New Zealanders on the AM band and FM in all main metropolitan centres and several provincial areas.
Concert FM is Radio New Zealand's fine music network, broadcasting a programme of mainly classical music and spoken features about music 24 hours a day on the FM band.
The AM Network broadcasts all sittings of parliament from transmitters in Auckland, Napier, Wellington, Christchurch and Dunedin. When not used for parliament, the network is leased out.
Radio New Zealand International is the country's international shortwave service, providing news and information programmes to listeners in the Pacific 24 hours a day. Radio New Zealand International's 100-kilowatt signal is beamed to the South Pacific, but can be heard by listeners as far away as Japan, North America, the Middle East and Europe.
Radio New Zealand News and Current Affairs provides news coverage, current affairs and specialist reporting for National Radio and Concert FM. International news services, correspondents overseas and reporters throughout New Zealand deliver news to listeners throughout the day.
Sound Archives Ngā Taonga Kōrero is a subsidiary of Radio New Zealand which gained archive status under s.90 of the Copyright Act in 1998/99, allowing material broadcast by any New Zealand network or station to be archived without breaching copyright. This enabled Sound Archives Ngā Taonga Kōrero to become a national collection, representing all broadcast radio providers in New Zealand, as well as preserving existing collections largely created during the era of state-owned radio.
The Radio New Zealand website is www.radionz.co.nz
The Radio Network of New Zealand Ltd. The Radio Network of New Zealand Ltd (TRN) owns 116 radio stations operating in 26 markets across New Zealand. TRN was formed following the sale of Radio New Zealand Commercial (a state-owned enterprise) by the New Zealand Government in 1996. TRN is a wholly-owned subsidiary of Australian Radio Network (ARN). Shareholders in ARN are Clear Channel Communications (US) and APN News & Media (Australia), TRN's programme brands are Classic Hits (26 stations), Newstalk ZB (23 stations), Radio Sport (20 stations), ZM (17 stations), Radio Hauraki (13 stations), Coast (10 stations), Viva (4 stations), Flava (2 stations) and Hokonui Gold (1 station). TRN stations reach a listening audience of 1.35 million New Zealanders aged 10+ on a weekly basis. TRN is a joint venture partner in The Radio Bureau, which represents nearly all of the radio industry to advertising agencies and their clients. The TRN website is www.radionetwork.co.nz
Non-commercial radio broadcasting. The Crown has reserved AM and FM radio frequencies throughout New Zealand for use by non-commercial broadcasters. AM frequencies have been reserved in all communities with populations of 10,000 or more. Broadcasters may have access to reserved spectrum for non-profit, community purposes. Licences are allocated to appropriate community organisations, who are responsible for ensuring that all interested groups have access to airtime on the frequencies. Access radio stations operating on reserved frequencies provide airtime on a non-profit basis to a range of minority groups in the community. In 2004/05, there were 11 access radio stations in New Zealand. All were assisted by NZ On Air, whose funding for access radio in 2004/05 was $1.6 million. Applications for frequencies are received by the Ministry of Economic Development and allocated on the advice of the Ministry for Culture and Heritage.
Nearly 1.6 million New Zealanders aged 15 and over read a newspaper on a typical day.
New Zealand has a high number of daily newspapers in relation to its population. There are 24 daily newspapers, of which 16 are afternoon papers published in provincial towns and cities.
The Auckland-based New Zealand Herald had the largest 2005 audited net circulation of a daily newspaper, with a circulation of 201,254. The biggest provincial paper in 2005 was Hamilton's Waikato Times, with an audited net circulation of 41,891. Other daily newspapers have circulations ranging from about 2,000 to nearly 100,000.
Table 11.02 shows daily newspaper circulation figures for the years 2001–05.
Table 11.02. Newspaper circulation
At 31
March
| Paper (date founded) | 2001 | 2002 | 2003 | 2004 | 2005 |
|---|---|---|---|---|---|
1Formed from integration of The Evening Post (1865) and The Dominion (1907). 2Latest audit. ... not applicable Source: Audit Bureau of Circulations | |||||
| The New Zealand Herald – Auckland (1863) | 209,898 | 210,841 | 210,910 | 211,490 | 204,549 |
| The Dominion Post1 – Wellington (2002) | ... | 101,511 | 99,089 | 99,123 | 98,232 |
| The Press – Christchurch (1869) | 91,003 | 92,713, | 91,111 | 92,436 | 92,458 |
| Otago Daily Times – Dunedin (1861) | 43,350 | 44,352 | 44,546 | 45,400 | 44,928 |
| Waikato Times – Hamilton (1872) | 40,427 | 41,121 | 40,970 | 41,009 | 41,017 |
| Hawke's Bay Today – Hastings (1998) | 31,787 | 31,665 | 30,079 | 30,197 | 30,073 |
| The Southland Times – Invercargill (1862) | 30,922 | 30,840 | 29,928 | 29,557 | 29,567 |
| Taranaki Daily News – New Plymouth (1857) | 26,579 | 26,784 | 26,687 | 26,749 | 26,754 |
| Bay of Plenty Times – Tauranga (1872) | 22,450 | 22,726 | 23,285 | 22,726 | 23,919 |
| Manawatu Standard – Palmerston North (1880) | 20,861 | 20,840 | 20,357 | 20,566 | 20,576 |
| The Nelson Mail (1866) | 18,102 | 18,274 | 18,312 | 18,425 | 18,437 |
| The Northern Advocate – Whangarei (1871) | 15,042 | 15,319 | 15,112 | 15,321 | 14,890 |
| The Timaru Herald (1864) | 14,004 | 14,308 | 14,360 | 14,329 | 14,335 |
| Wanganui Chronicle (1856) | 13,772 | 14,059 | 13,103 | 12,483 | 12,652 |
| The Daily Post – Rotorua (1885) | 11,866 | 11,955 | 11,979 | 12,120 | 12,063 |
| The Marlborough Express – Blenheim (1866) | 10,326 | 10,113 | 10,173 | 10,296 | 10,362 |
| The Gisborne Herald (1874) | 8,669 | 8,623 | 8,573 | 8,620 | 8,631 |
| Wairarapa Times-Age – Masterton (1878) | 8,061 | 7,713 | 7,585 | 7,619 | 7,664 |
| Ashburton Guardian (1879) | 5,610 | 5,497 | 5,554 | 5,525 | 5,460 |
| The Greymouth Evening Star (1866) | 4,606 | 4,266 | 4,219 | 4,303 | 4,289 |
| Horowhenua–Kapiti Chronicle – Levin (1893) | 3,663 | 3,789 | 3,7892 | 3,7892 | 2,868 |
| The Oamaru Mail (1876) | 3,728 | 3,644 | 3,464 | 3,545 | 3,561 |
| The Westport News (1872) | 2,167 | 2,010 | 2,010 | 2,016 | 2,0162 |
The majority of daily newspapers are owned by two major publishing groups, Fairfax New Zealand Ltd and APN New Zealand Ltd. Between them, these groups account for just over 90 percent of New Zealand's aggregate daily newspaper circulation of about 740,000. The largest independent newspaper is the Otago Daily Times in Dunedin.
Daily newspapers are widely read. On a typical day, nearly 1.6 million New Zealanders aged 15 and over read a newspaper and New Zealanders spend nearly $6 million a week on daily and Sunday newspapers.
Figure 11.03 shows total newspaper (dailies and Sundays) circulation trends since 1967.
At 30 June 2005, there were three Sunday newspapers, the Sunday Star-Times and Sunday News, both published by Fairfax New Zealand Ltd, and the Herald on Sunday, published by APN New Zealand Ltd. All three newspapers are distributed nationwide.
There are also approximately 120 community newspapers in New Zealand, the great majority of which are tabloid in format. Many of these are owned by the two big newspaper publishing groups, or by publishers of other newspapers outside the groups. Some are owned by individuals or small companies.
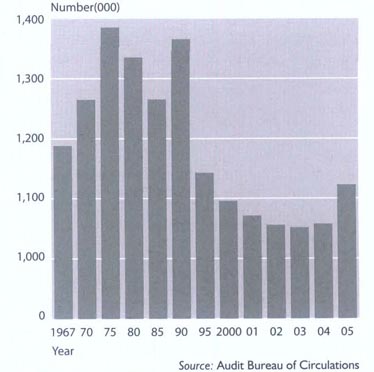
There are more than 6,000 magazines available in New Zealand on a regular basis, 650 of which are published in New Zealand. Table 11.03 shows the most popular magazines for the years 2001–05.
Table 11.03. Magazine circulation1
| Publication | Circulation | ||||
|---|---|---|---|---|---|
| 2001 | 2002 | 2003 | 2004 | 2005 | |
1Audit period: January–June. 2Family Times now appears as Auckland Family Times (78,500), Wellington Family Times (45,277), Christchurch Family Times (43,472) and Dunedin Family Tunes (13,347). Source: Audit Bureau of Circulation | |||||
| AA Directions (quarterly) | 566,750 | 542,219 | 540,395 | 573,864 | 548,327 |
| Sky Watch (monthly) | 342,064 | 358,589 | 390,571 | 416,290 | 455,411 |
| TV Guide (weekly) | 229,126 | 225,648 | 222,931 | 217,492 | 203,456 |
| New Zealand Woman's Day (weekly) | 146,237 | 141,781 | 147,124 | 142,610 | 151,074 |
| New Zealand Woman's Weekly (weekly) | 95,918 | 97,013 | 101,397 | 97,769 | 102,542 |
| Australian Woman's Weekly NZ (monthly) | 82,764 | 92,627 | 98,888 | 97,342 | 93,698 |
| Reader's Digest NZ (monthly) | 105,000 | 101,756 | 92,258 | 85,036 | 88,267 |
| Rural News (fortnightly) | 83,622 | 84,607 | 86,134 | 87,854 | 85,888 |
| Straight Furrow (monthly) | 79,895 | 80,006 | 85,231 | 85,009 | 84,741 |
| Agtrader (monthly) | 78,790 | 77,723 | 85,241 | 84,665 | 81,036 |
| NZ House & Garden (monthly) | 75,556 | 80,669 | 79,299 | 77,655 | 75,619 |
| New Zealand Listener (weekly) | 81,761 | 76,844 | 76,171 | 75,177 | 73,034 |
| Cuisine (alternative months) | 60,061 | 79,760 | 76,977 | 75,810 | 71,030 |
| Next (monthly) | 61,267 | 63,070 | 67,471 | 66,836 | 70,606 |
| New Idea (weekly) | 55,283 | 54,427 | 57,408 | 58,591 | 61,484 |
| Your Home & Garden (monthly) | 41,988 | 50,382 | 50,073 | 47,179 | 46,769 |
| Little Treasures (alternative months) | 49,700 | 46,184 | 43,974 | 45,196 | 45,581 |
| That's Life (weekly) | 41,636 | 44,366 | 45,640 | 46,134 | 44,919 |
| New Zealand Gardener (monthly) | 54,756 | 50,619 | 45,094 | 38,196 | 37,734 |
| Family Times (quarterly) | 40,148 | 41,558 | 41,996 | 42,795 | 180,5962 |
New Zealand Press Association. Through international agreements with Reuters, Australian Associated Press and other news organisations, the cooperatively-owned New Zealand Press Association (NZPA) provides an international and domestic news service to all daily and Sunday newspapers. A major change in 2005 was that the NZPA newswire was no longer exclusive to daily and Sunday newspapers, but available for sale to broadcast and electronic media as well.
New Zealand Press Council. The New Zealand Press Council is a self-regulatory body founded in 1972 with the primary function of investigating and adjudicating on complaints against newspapers and other publications. Its constituent members are the Newspaper Publishers Association (NPA) and the New Zealand Engineering, Printing and Manufacturing Union (EPMU). The council consists of an independent chairman, five members representing the public and five representing the industry. Two of the five industry representatives are nominated by the NPA, two are nominated by the EPMU and one by magazine publishers. A panel including the Chief Ombudsman appoints public members.
The principal objects of the press council are to:
Consider complaints against the editorial content of newspapers and other publications (a separate body deals with complaints against advertising). The council may also consider complaints about the conduct of people and organisations towards the press.
Promote freedom of speech and freedom of the press in New Zealand.
Maintain the New Zealand press in accordance with the highest professional standards.
The council does not set standards for newspapers, but from time to time it issues recommendations to editors in general terms. To make a complaint to the council, complainants are first required to complain in writing to the editor of the publication concerned. This allows the editor the opportunity of righting a possible wrong. If complainants are still not satisfied, they can then approach the council. There is no charge for the council's service. In circumstances where legally actionable issues may be involved, complainants are required to provide a waiver that, having referred the matter to the press council, no legal proceedings will be taken against the newspaper or journalist concerned. The council is funded entirely by the industry. The New Zealand Press Council website is www.presscouncil.org.nz
Table 11.04 shows New Zealand Press Council statistics from 2000 to 2004.
Table 11.04. New Zealand Press Council statistics
Years ending 31 December
| 2000 | 2001 | 2002 | 2003 | 2004 | ||||||
|---|---|---|---|---|---|---|---|---|---|---|
- nil or zero Source: New Zealand Press Council | ||||||||||
| Adjudications issued | 45 | 47 | 48 | 52 | 45 | |||||
| Upheld | 9 | 1 | 8 | 14 | 9 | |||||
| Part upheld | 9 | 3 | 2 | 5 | 3 | |||||
| Not upheld with dissent | - | - | 1 | 2 | 0 | |||||
| Not upheld | 27 | 43 | 36 | 31 | 33 | |||||
| Declined | - | - | 1 | - | - | |||||
| Not adjudicated | 31 | 59 | 39 | 27 | 30 | |||||
| Mediated/resolved | - | 1 | 3 | 3 | 3 | |||||
| Withdrawn | - | 3 | 1 | 2 | 1 | |||||
| Withdrawn at late stage | 8 | 2 | 1 | 2 | 1 | |||||
| Not followed through | 13 | 18 | 16 | 9 | 12 | |||||
| Out of time | 1 | 5 | 2 | 2 | - | |||||
| Not accepted | 1 | 4 | 3 | 2 | 2 | |||||
| Outside jurisdiction | 1 | 9 | 3 | - | 3 | |||||
| In action at end of year | 7 | 17 | 10 | 7 | 8 | |||||
| Total complaints | 76 | 106 | 87 | 79 | 75 | |||||
Table 11.05. Advertising expenditure
By consumer
sector
Year ending 31 December
2005
| Section | Total media |
|---|---|
| Source: Nielsen Media Research | |
| $(000) | |
| Foodstuffs | 305,395 |
| Leisure, entertainment | 300,520 |
| Retail | 277,527 |
| Government departments, services and community | 189,855 |
| Automotive | 184,160 |
| Investment, finance, banking | 163,963 |
| Toiletries, cosmetics | 150,136 |
| Home improvements | 117,029 |
| Telecommunications | 110,284 |
| Beverages | 104,613 |
| Pharmaceuticals, health | 96,684 |
| Travel | 87,391 |
| Household electrical products | 80,930 |
| Household furnishings | 75,059 |
| Computers | 74,794 |
| Clothing | 48,419 |
| Business services | 41,184 |
| Insurance | 32,801 |
| Agricultural | 25,239 |
| Real estate | 25,195 |
| Total | 2,491,178 |
Approximately 1,000 people are employed in New Zealand advertising agencies and 2,500 in advertising-related services. Advertising revenue also contributes to the employment of another 10,000 people in the publishing, radio and television industries.
At the beginning of 2005, there were approximately 200 advertising agencies, most of them New Zealand-owned, but with 25 percent (mostly larger agencies) affiliated to multinationals by total or partial ownership.
Mainstream media advertising for the year ending 31 December 2004 totalled approximately $2 billion.
Table 11.05 shows total advertising expenditure, by consumer sector, for the year ending 31 December 2005.
As Table 11.06 shows, approximately 38.1 percent of media expenditure was on newspapers, 31 percent on television, 11.9 percent on radio, 10.7 percent on magazines, 2.8 percent on unaddressed mail, 2.5 percent on outdoor, 1.6 percent on addressed mail, 0.7 percent on online and 0.6 percent on cinema.
Industry organisations and self regulation. The Communication Agencies Association of New Zealand (CAANZ) is an incorporated body representing the interests of members on issues affecting the advertising industry and agencies. There are 73 member agencies, who collectively represent between 85 and 90 percent of agency billings in New Zealand, with combined turnover of about $900 million. The Association of New Zealand Advertisers (ANZA) represents the interests of advertisers and has 100 members. ANZA administers two pre-placement vetting systems – one for liquor advertising and one for therapeutic advertising. The advertising industry has a self-regulatory system managed by the Advertising Standards Authority (ASA) and the Advertising Standards Complaints Board. The authority's function is to promulgate codes of practice and develop policies on advertising standards. The board's function is to adjudicate on complaints and advise the ASA on codes and public issues. The Advertising Standards Authority website is ww.asa.co.nz
Table 11.06. Advertising expenditure in media1
Years ending 31 December
| 1999 | 2000 | 2001 | 2002 | 2003 | 2004 | |||||||
|---|---|---|---|---|---|---|---|---|---|---|---|---|
| Expenditure | Share | Expenditure | Share | Expenditure | Share | Expenditure | Share | Expenditure | Share | Expenditure | Share | |
1All cash advertising revenue, plus agency commission where applicable. 2Includes daily and community newspapers. 3Advertising mail originating in New Zealand 2004 is an actual return. The 2003 figure was an estimate. 4Separated from outdoor medium 2001. Note: Figures may not add to stated totals due to rounding. .. figure not available Source: Communication Agencies Association of New Zealand | ||||||||||||
| Medium | $(million) | percent | $(million) | percent | $(million) | percent | $(million) | percent | $(million) | percent | $(million) | percent |
| Newspapers2 | 566 | 39.8 | 596 | 40.1 | 606 | 40.7 | 628 | 40.1 | 689 | 37.1 | 790 | 38.1 |
| Television | 487 | 34.3 | 501 | 33.7 | 479 | 32.2 | 516 | 33 | 592 | 31.9 | 643 | 31.1 |
| Radio | 178 | 12.6 | 190 | 12.8 | 196 | 13.2 | 203 | 13 | 224 | 12.1 | 247 | 11.9 |
| Magazines | 159 | 11.2 | 157 | 10.6 | 166 | 11.1 | 173 | 11 | 194 | 10.4 | 223 | 10.7 |
| Unaddressed mail | .. | .. | .. | .. | .. | .. | .. | .. | 56 | 3.1 | 59 | 2.8 |
| Outdoor and cinemas | 30 | 2.1 | 41 | 2.8 | 32 | 2.2 | 37 | 2.4 | 47 | 2.5 | 51 | 2.5 |
| Addressed mail3 | .. | .. | .. | .. | .. | .. | .. | .. | 35 | 1.9 | 34 | 1.6 |
| Online | .. | .. | .. | .. | .. | .. | .. | .. | 8 | 0.4 | 15 | 0.7 |
| Cinema4 | .. | .. | .. | 9 | 0.6 | 8 | 0.5 | 12 | 0.6 | 13 | 0.6 | |
| Total | 1,420 | 100 | 1,485 | 100 | 1,488 | 100 | 1,565 | 100 | 1,857 | 100 | 2,075 | 100 |
The Postal Services Act 1998 permitted full competition in all areas of the postal services market. All mail must carry a mark to identify the postal operator that carried it.
Postal operators have the right to open mail in certain circumstances (e.g. so it can be returned to the sender when an address is illegible). They also have the right to erect letterboxes.
To carry out a business involving carriage of letters, a person or company must be registered as a postal operator with the Ministry of Economic Development. At 1 December 2005. there were 25 registered postal operators.
Under a deed of understanding with the government, New Zealand Post Ltd is required to meet certain social obligations, including maintaining a minimum number of delivery points and postal outlets, maintaining five or six-day-a week delivery to 99.88 percent of delivery points, not reintroducing the rural delivery fee abolished in 1995, and providing competitors with access to its network on terms and conditions no less favourable than terms and conditions offered to equivalent customers.
New Zealand Post Ltd is the sole operator designated as New Zealand's ‘postal administration’ to the Universal Postal Union (UPU) and therefore has the exclusive right to issue ‘official’ UPU-stamps. The government has the power to designate additional operators to fulfil New Zealand's international postal obligations.
New Zealand Post Ltd is a state-owned enterprise which has been operating in a deregulated postal environment since 1998. The Postal Services Act of that year removed New Zealand Post's monopoly on the standard letter, allowing full competition in postal services.
The price of standard letter postage was reduced from 45 cents to 40 cents on 2 October 1995 and was maintained at that level till 5 April 2004, when it returned to 45 cents.
By comparison, Australia's basic postage price is the equivalent of 57 cents, Canada's 55 cents, the United Kingdom's 76 cents, Ireland's 90 cents, Germany's $1, Japan's $1.15 and Norway's $1.30.
New Zealand Post's Fast Post service also increased in price from 5 April 2004, from 80 cents to 90 cents.
New Zealand Post's service delivery – the independent measure of mail delivered on time – was 94.8 percent for the year to 30 June 2005, putting its service standards among the best in the world.
While it continues the tradition of carrying and delivering letters and parcels, New Zealand Post has responded to customers’ growing communications needs by providing electronic solutions to residential, business and international markets.
Its business activities include letters, courier services, financial transactions, mail and stamp production, as well as data processing and electronic billing, commerce and messaging. The New Zealand Post website is www.nzpost.co.nz
Recent performance. New Zealand Post reported a profit of $137.2 million after tax for the 2004/05 financial year, compared with $36.5 million in 2003/04, $27.1 million in 2002/03, $21.9 million in 2001/02 and $21.0 million in 2000/01.
Postal services offered by CourierPost include urgent, overnight and economy delivery.
Inland services. Fast Post or standard post can be used in New Zealand to send letters up to 20 millimetres thick and up to 1 kilogram in weight. Fast Post targets next working day delivery between major towns and cities, with standard post targeting next working day delivery across town, and two to three working days across New Zealand. For parcels, Packet Post is used to send parcels up to 1.5 kilograms at either Fast Post or standard post. Parcel Post is used for parcels up to 25 kilograms, targeting next working day for delivery across town and two to three working days nationwide. Other services include BoxLink, Volume Post, Registered Post and Postage-Included Envelopes. On 1 January 2005, New Zealand Post entered into a 50/50 joint venture with DHL for the express and logistics business of New Zealand Post. The joint venture was for Express Couriers Limited, which includes the CourierPost, Pace and Contract Logistics brands, as well as road and air linehaul operations. CourierPost offers urgent, overnight and economy delivery services. Pace provides a specialist round-the-clock solution for time critical courier services. New Zealand Post also provides discounts for bulk mail and offers direct mail services. New Zealand Post subsidiary the Letterbox Channel handles delivery of unaddressed mail (circulars).
Table 11.07 shows the number of New Zealand Post delivery points.
Table 11.07. Delivery points
Years ending 30
June1
| 1999 | 2000 | 2001 | 2002 | 2003 | 2004 | 2005 | |
|---|---|---|---|---|---|---|---|
1Years ending 31 March for 1999 and 2000. Source: New Zealand Post | |||||||
| Number | |||||||
| Residential | 1,181,141 | 1,240,263 | 1,283,261 | 1,253,693 | 1,243,613 | 1,258,302 | 1,319,017 |
| Business | 51,590 | 54,750 | 56,045 | 57,314 | 59,508 | 58,270 | 114,773 |
| Private box and bag | 174,074 | 204,942 | 188,044 | 181,999 | 189,244 | 202,278 | 205,642 |
| Rural delivery | 162,347 | 168,096 | 175,127 | 177,727 | 180,495 | 191,363 | 200,673 |
| Other | 13,915 | 10,825 | 22,392 | 23,837 | 25,096 | 14,752 | 13,501 |
| Total | 1,583,067 | 1,678,876 | 1,724,869 | 1,694,570 | 1,697,956 | 1,724,965 | 1,853,606 |
Overseas services. New Zealand Post International operates several overseas mail services. International Express is a track and trace courier service to more than 220 countries, with next-morning delivery to Australian centres and targeting delivery within days to the rest of the world, including built-in insurance cover and additional cover options. International Air offers delivery in approximately one to two weeks, with built-in insurance cover and the option of additional cover and/or track and trace facilities to selected countries. International Economy offers cost-effective delivery to anywhere in the world within approximately three to five weeks.
Table 11.08 shows changes in the cost of sending one page of material from New Zealand to London.
Table 11.08. Cost of sending one page of material from New Zealand to London
1938, 2003 and 2005
Real (inflation adjusted) costs
| Cost (1999 dollars) for 300 words | 1938 | 2003 | 2005 |
|---|---|---|---|
1Telegraph service not available after 2000. 2Standard envelope (28 grams) by airmail. 3Cost of a five-minute call in peak hours inclusive of GST. 4Based on one minute of transmission time in peak hours. 5Marginal costing only. Does not include cost of a personal computer and assumes flat rate charges from domestic site. .. figures not available ... not applicable Sources: New Zealand Post Telecom | |||
| $ | $ | $ | |
| Telegraph1 | 1,315.00 | .. | .. |
| Letter post2 | 0.88 | 2.00 | 2.00 |
| Telephone3 | 438.00 | 3.25 | 3.25 |
| Facsimile4 | ... | 0.65 | 0.65 |
| Email5 | ... | <0.02 | <0.02 |
Retail network. At 30 June 2005, New Zealand Post's retail network consisted of 323 PostShops (including franchises), with postal services available at a further 672 Post Centres. Stamps were available from a further 1,601 retailers. Financial transaction services, including motor registration, ticketing for certain events and bill payment services were available at all PostShops and Books & More stores.
Table 11.09 shows postal outlet changes between 2000 and 2005.
Table 11.09. Postal outlets
Years ending 30
June1
| Year | 2000 | 2001 | 2002 | 2003 | 2004 | 2005 |
|---|---|---|---|---|---|---|
12000 figures for years eliding 31 March. Source: New Zealand Post | ||||||
| Post Shops (including franchises) | 315 | 314 | 313 | 315 | 323 | 323 |
| Post Centres | 714 | 705 | 699 | 697 | 698 | 672 |
| Stamp resellers | 2,994 | 2,940 | 2,877 | 2,735 | 2,647 | 1,601 |
| Total | 4,023 | 3,959 | 3,889 | 3,747 | 3,668 | 2,596 |
New Zealand Post's stamp unit produces around 12 commemorative stamp issues each year and one to three definitive stamp issues. Table 11.10 lists stamps issued from 28 January 2004 to 1 December 2005. A variety of products, including commemorative coins on behalf of the Reserve Bank of New Zealand, are sold by mail order through the Philatelic Bureau at Wanganui, at stamp sales centres, through PostShops and from the stamps website www.stamps.co.nz
Table 11.1. 2004–05 Stamp issues
| Date of issue | Issue name | Denominations |
|---|---|---|
| Source: New Zealand Post | ||
| 2004 | ||
| 28 January | Year of the Monkey | 40c x 2, 90c, $1.30, $1.50, $2.00 |
| 25 February | Rugby Sevens | 40c, 90c, $1.50, $2.00 |
| 3 March | 150 Years of Parliament | 40c, 45c, 90c, $1.30, $1.50, $2.00 |
| 22 March | Scenic Definitives | 45c, $1.35 |
| 5 April | historic Farm Equipment | 45c, 90c, $1.35, $1.50, $2.00 |
| 5 May | World of Wearable Art | 45c, 90c, $1.35, $1.50, $2.00 |
| 2 June | Garden Flowers II | 45c, 90c, $1.35, $1.50, $2.00 |
| 7 July | Scenic 2004 – Home of Middle Earth | 45c x 2, 90c x 2, $1.50 x 2, $2.00 x 2 |
| 2 August | Olympic Games 2004 | 45c, 90c, $1.50, $2.00 |
| 1 September | Health – A Day at the Beach | 45c x 2, 90c |
| 3 November | Ross Dependency 2004 – Penguins | 45c, 90c, $1.35, $1.50, $2.00 1 |
| September | Tourism | $1.50x6 |
| 4 October | Christmas 2004 | 45c, 90c, $1.35, $1.50, $2.00 |
| 1 December | Extreme Sports | 45c, 90c, $1.35, $1.50, $2.00 |
| 2005 | ||
| 12 January | Farmyard Animals | 45c, 90c, $1.35, $1.50, $2.00 |
| 2 February | 2005 Commemorative | 45c x 3, $1.50 x 3 |
| 2 March | 150 Years of Stamps, 1855–1905 | 45c, 90c, $1.35, $1.50, $2.00 |
| 6 April | 150 Years of Stamps, 1905–1955 | 45c, 90c, $1.35, $1.50, $2.00 |
| 4 May | Café Culture | 45c, 90c, $1.35, $1.50, $2.00 |
| 1 June | 150 Years of Stamps, 1955–2005 | 45c, 90c, $1.35, $1.50, $2.00 |
| 1 June | DHL Lions New Zealand Tour | 45c x 2, $1.50 x 2 |
| 6 July | Personalised Stamps | 45c x 7, $1.50, $2.00 x 2 |
| 3 August | Health Stamps | 45c x 2,90c |
| 3 August | WWF – The Kakapo | 45c x 4 |
| 19 October | King Kong Stamp Issue | 45c, 90c, $1.35, $1.50, $2.00 |
| 2 November | Ross Dependency 2005 | 45c, 90c, $1.35, $1.50, $2.00 |
| 2 November | Christmas 2005 | 45c, 90c, $1, $1.35, $1.50, $2.00 |
| 1 December | The Lion, the Witch and the Wardrobe | 45c, 90c, $1.35, $1.50, $2.00 |
Personalised stamps, launched by New Zealand Post in 2005, let customers add a personal touch to their mail.
11.1 Ministry of Economic Development.
11.2 NZ On Air; Broadcasting Standards Authority; Electoral Commission; Te Māngai Pāho. Ministry for Culture and Heritage; Telecommunications Users’ Association of New Zealand.
11.3 Ministry of Economic Development; Telecom Corporation of New Zealand Limited.
11.4 TelstraClear; Vodafone.
11.5 Television New Zealand; TV3 Network Services Limited; SKY Network Television Ltd; Prime Television; Ministry for Culture and Heritage; New Zealand On Air.
11.6 Ministry for Culture and Heritage; Radio New Zealand Limited; The Radio Network; NZ On Air; Ministry of Economic Development.
11.7 New Zealand Audit Bureau of Circulations; New Zealand Press Council.
11.8 Communications Agencies Association of New Zealand (CAANZ); AGB Nielsen Media Research Ltd.
11.9 Ministry of Economic Development; New Zealand Post Limited.
www.abc.org.nz – New Zealand Audit Bureau of Circulations
www.bsa.govt.nz – Broadcasting Standards Authority
www.caanz.co.nz – Communication Agencies Association NZ
www.elections.org.nz – Electoral Commission
www.mch.govt.nz – Ministry for Culture and Heritage
www.med.govt.nz – Ministry of Economic Development
www.nielsenmedia.co.nz – AGB Nielsen Media Research Ltd
www.nzonair.govt.nz – NZ On Air
www.presscouncil.org.nz – New Zealand Press Council
www.nzpost.co.nz – New Zealand Post Ltd
www.primetv.co.nz – Prime Television
www.radio.nz.co.nz – Radio New Zealand Ltd
www.radionetwork.co.nz – The Radio Network of New Zealand
www.skytv.co.nz – SKY Network Television Ltd
www.telecom.co.nz – Telecom Corporation of New Zealand
www.tvnz.co.nz – Television New Zealand Ltd
www.telstraclear.co.nz – TelstraClear Ltd
www.tmp.govt.nz – Te Māngai Pāho
www.tuanz.org.nz – Telecommunications Users’ Association of New Zealand
www.tv3.co.nz – TV3 Network Ltd
www.vodafone.co.nz – Vodafone New Zealand
Table of Contents
More than 100,000 people in 50 centres attended performances by the Royal New Zealand Ballet in 2005, including this production of The Nutcracker.
Increasing recognition by government of the strategic and intrinsic importance of arts, cultural and heritage activities has been reflected in greater investment in these areas. Central government spending on culture, adjusted for inflation, rose from $388 million in 1990/1991 to $675 million in 2003/2004, an increase of 74 percent.
A small and increasingly diverse population and the relative absence of private patronage make this government assistance necessary if all New Zealanders are to have access to meaningful cultural experiences.
A Cultural Experiences Survey in 2002 provided a snapshot of New Zealanders’ engagement with cultural activities as diverse as listening to popular music, visiting museums and art galleries, visiting marae and buying original art works and craft objects.
The survey revealed that 93 percent of New Zealand's population aged 15 and over had participated in at least one cultural activity during the survey period, and confirmed a high level of interest in New Zealand content in a range of activities, including theatre, music and literature.
Cultural activities are an essential component in developing strong but overlapping cultural identities, and in promoting a cohesive society that accepts and encourages diversity. Creative talent and cultural industries also play an important part in enhancing economic growth.
Worldwide, these sectors are among the key growth industries for the 21 st century and New Zealand is following this trend, with cultural activity contributing around 3 percent of total industry contribution to GDP.
Nga taonga tuku iho no nga tupuna, or the treasures handed down by our ancestors, make New Zealand's cultural heritage unique, and successive governments have made special provision for their support.
The government supports taonga tuku iho through a number of agencies, including the Museum of New Zealand Te Papa Tongarewa which actively promotes the significance of Māori cultural heritage through its collections and programmes.
The government also provides capital funding, from time to time, to regional museums which have nationally significant Māori taonga collections.
The Māori Heritage Council (part of the New Zealand Historic Places Trust) registers and protects wāhi tapu areas, provides assistance to whānau, hapū and iwi to preserve heritage resources and makes recommendations on archaeological sites.
Te Waka Toi fulfils Creative New Zealand's statutory responsibility to ‘recognise in the arts the role of Māori as tangata whenua.’
Te Puia Māori Arts and Crafts, based at Whakarewarewa (Rotorua), trains students in traditional skills, such as carving and weaving, as well as promoting Māori culture.
The Māori Language Commission Te Taura Whiri i te Reo Māori promotes the use of Māori as a living language and promotes Māori–English bilingualism as a valued part of New Zealand culture.
Te Māngai Pāho provides broadcasting funding for production of Māori language television programmes, Māori music and the national network of Māori radio stations. Māori Television provides a high-quality bilingual broadcasting service.
The government also supports the Te Matatini Society Inc which focuses on Māori performance arts, including national kapa haka competitions, the South Pacific Arts Festival and the biennial Te Matatini National Festival.
Further support for taonga tuku iho comes from the Lottery Grants Board, which allocates profits to community enterprises, including restoration of marae.
The Antiquities Act 1975 regulates the export of antiquities, including taonga, and provides protection for newly-discovered artefacts.
Māori Language Week is celebrated in the children's section of the Napier Public Library.
The Museum of New Zealand Te Papa Tongarewa is New Zealand's national museum. Since opening on the Wellington waterfront in February 1998, it has established a national and international reputation as New Zealand's ‘must-see’ visitor attraction. By 30 June 2005, more than 10.46 million visits had been made to Te Papa.
Te Papa's founding concept was developed through an extensive national consultative process and was adopted by the government in 1990. It introduced the concepts of unified collections, the narratives of culture and place, the idea of forum, the bicultural partnership between tangata whenua and tangata tiriti, and a multidisciplinary approach to delivering a national museum for diverse audiences.
Its mission, to be a forum for the nation to explore and preserve its unique cultural and natural heritage, is underpinned by the principles of the bicultural partnership; being a waharoa or entry way to exploring and reflecting on cultural identity; acknowledging and recognising the role of communities in the care, management and understanding of taonga and collections; speaking with authority; being committed to providing excellent services; and being commercially positive.
The museum contains 19 major long-term constructed exhibitions and features a programme of innovative and exciting exhibitions that both draw on the richness of its collections and bring to New Zealand the best of the rest of the world.
Permanent exhibitions include Bush City, an outdoor space that recreates distinctive aspects of the New Zealand landform and its associated plant life, and The Time Warp, a dynamic interactive zone that uses motion-simulator technology and cinema effects to project visitors into New Zealand's distant past and near future.
Te Papa is the only museum in the world with its own living, functioning marae, Rongomaraeroa, Te Marae ō Te Papa Tongarewa.
Central to Te Papa's existence are its collections, which span five main areas: art, natural history, New Zealand history and heritage, Pacific, and taonga Māori. Te Papa has particularly rich collections of New Zealand plants and animals, taonga Māori and Pacific treasures.
In its capacity as the national museum, Te Papa operates various services for audiences and communities outside its premises. These include National Services Te Paerangi, through which Te Papa works with other museums, iwi and related organisations on projects to build capacity and enhance sustainability of the services they provide in their local communities.
Other services include Te Papa Press, touring exhibitions, a collections loans service, a programme of iwi partnership projects, and the Te Papa website, www.tepapa.govt.nz
There is evidence that the existence of Te Papa has changed national and international tourism patterns. More than 30 percent of New Zealand visitors to Te Papa in the 2004/05 financial year came from outside the Wellington region and more than 50 percent were from overseas.
Te Papa's audience closely approximates the New Zealand population at large. For example, the proportion of Māori visitors equates roughly with the percentage of people identifying themselves as Māori in the 2001 Census. A similar pattern is apparent for Pacific peoples and other ethnicities.
There are between 500 and 600 public museums and art galleries in New Zealand, ranging from small local museums housing collections of local importance, to larger institutions housing collections of national and regional significance. The larger museums carry out research, print catalogues and research papers, and provide educational programmes.
Many museums and art galleries are funded by local government. Funding for capital works may be provided by the Lottery Grants Board, community trusts, electricity trusts or other funding bodies.
The Public Trust Office was one of the few buildings to survive the 1931 Napier earthquake and is now registered as a Category 1 Historic Place.
The New Zealand Historic Places Trust Pouhere Taonga is New Zealand's national historic heritage agency. It is an autonomous Crown entity established under the Historic Places Act 1993.
Its board of trustees is assisted in governance matters by the Māori Heritage Council, ensuring that the trust reflects a bicultural view in the exercise of its powers and functions.
The trust's role in identification, protection, preservation and conservation of historical and cultural heritage is extensive and nationwide. This role includes:
Leadership on heritage issues important to New Zealand.
Assisting Māori communities identify and recognise wāhi tapu and restore historic marae-related buildings and structures.
Management, administration and control of some 60 nationally-significant heritage properties.
Provision and distribution of advice and information on protection and conservation of heritage places.
Establishment and maintenance of a register of historic places, historic areas, wāhi tapu and wāhi tapu areas.
Monitoring of archaeological authorities with regard to activities that may destroy, damage or modify archaeological sites.
Statutory advocacy for the protection of historic and cultural heritage, including issuing heritage orders and negotiating and executing heritage covenants.
Provision of grants or advances to property owners for the restoration and protection of heritage places under the National Heritage Preservation Incentive Fund.
The national office of the trust is in Wellington and it has regional offices in Auckland, Wellington and Christchurch, and area offices in Kerikeri, Tauranga and Dunedin. The trust has more than 26,000 members who elect district committees that operate at the local level. Their voluntary activities include historical research, heritage promotion and fundraising.
Māori communities are increasingly concerned with, and active in. protection and management of their heritage and the trust provides a programme of conservation and funding advice, and practical training, to support whānau, hapū and iwi in management of their heritage.
The trust is custodian of a portfolio of heritage properties of importance to the nation, such as the Kerikeri Stone Store, Pompallier at Russell, Alberton in Auckland, Te Porere Redoubt in the Ruapehu District, Old St Paul's in Wellington, Timeball Station in Lyttelton and Totara Estate near Oamaru.
New Zealand has a rich archaeological resource and many archaeological sites are of importance to the nation. These sites may include shipwrecks, historic pa and villages, battle sites, rock art sites, stone walls, gardens, whaling stations and gold mining landscapes. The trust administers the archaeological authority process in a way that protects archaeological sites wherever possible and, where they are to be destroyed, damaged or modified, ensures that significant information is retained and documented in a credible, consistent and coherent fashion.
Incentive funds are a critical component for achieving positive heritage outcomes by assisting private owners to maintain historic buildings and structures. The trust administers the National Heritage Preservation Incentive Fund of $500,000 annually to encourage conservation of nationally significant heritage in private ownership.
Protection of antiquities and archaeological and traditional sites. New Zealand has a number of legal provisions to protect items and sites of historical and cultural significance. The Antiquities Act 1975, administered by the Ministry for Culture and Heritage, includes provisions controlling the sale of Māori artefacts in New Zealand. Artefacts found after 1976 are deemed to be Crown property. There are export controls on a range of items of cultural significance: Māori artefacts; chattels relating to European discovery, settlement or development of New Zealand; written and printed matter; works of art, reproductions, prints, films and sound recordings; specimens of animals, plants and minerals; meteorites; remains of extinct fauna; and shipwreck items. The Historic Places Act 1993 defines an archaeological site as a place associated with pre- 1900 human activity, where there may be evidence relating to the history of New Zealand. The Historic Places Act 1993 makes it unlawful for any person to destroy, damage or modify the whole or any part of an archaeological site (including archaeological investigations) without an archaeological authority from the New Zealand Historic Places Trust.
Archives New Zealand has three roles:
To preserve and provide access to the archived records of government.
To ensure government records are created and maintained.
To provide leadership and advice to the New Zealand record-keeping and archiving community.
Archives are important both as the raw material for the history of New Zealand and for ensuring citizens can hold the government to account for its actions. In addition, a verifiable record provides the government with the protection that comes from its citizens trusting it to be truthful and accountable in its dealings.
Archives New Zealand stores, arranges, describes and provides access to records from government agencies (past and present), and provides standards and advice to government agencies regarding best practice in record-keeping. It has repositories and reading rooms in Dunedin, Christchurch, Wellington and Auckland. The Wellington repository includes the Constitution Room, which houses some of New Zealand's most significant documents, such as the Treaty of Waitangi, the Women's Suffrage Petition and the Declaration of Independence.
In its leadership role, Archives New Zealand advises and assists local bodies and community groups in the care, preservation and disposal of their records.
It is also responsible for administration of the National Register of Archives and Manuscripts and has developed partnerships with other repositories to promote the use and awareness of archives generally and to support development of professional skills in record-keeping and archiving throughout New Zealand.
Newspaper and magazine cartoons are important historical records because they capture the values and attitudes of the day, providing an extra dimension to our understanding of past events.
The New Zealand Cartoon Archive, founded by Ian F Grant as a result of researching his cartoon history of New Zealand, The Unauthorized Version, was launched on April Fool's Day 1992, The archive's purpose is to collect historical and contemporary New Zealand editorial cartoons and to promote the collection to the New Zealand public. Cartoon images are increasingly used by teachers, researchers, writers, publishers and film makers.
The New Zealand Cartoon Archive has become New Zealand's principal cartoon collection and research institution. More than 25,000 cartoons – originals and copies – have been bequeathed to the archive by cartoonists and their relatives, collectors, politicians and organisations.
Since 1992, the archive has received, by arrangement, copies and some originals of cartoons that appear in New Zealand newspapers and periodical press. Many are now received electronically.
In 2005, the New Zealand Cartoon Trust, which had run the cartoon archive in tandem with the Alexander Turnbull Library for its first 13 years, was wound up and the archive fully integrated into the Turnbull, retaining its name and identity within the drawings and prints department.
The cartoon archive collection includes the work of more than 60 New Zealand and expatriate New Zealand cartoonists.
The collection is indexed on the National Library's TAPUHI website and the archive now has several hundred cartoon images on the National Library's Timeframes website.
By the end of 2005, the archive had curated 13 cartoon exhibitions, most touring to a number of New Zealand centres, and published five books.
The National Library of New Zealand Te Puna Mātauranga o Aotearoa was established in 1965 by an act of parliament, which also incorporated the Alexander Turnbull Library into the National Library.
The National Library of New Zealand (Te Puna Mātauranga o Aotearoa) Act 2003 replaced the earlier act and confirmed the Crown's undertaking to preserve, protect, develop and make accessible the collections of the Alexander Turnbull Library forever. The 2003 act also created an independent advisory body to the government, the Library and Information Advisory Commission.
The National Library is a key adviser to the government on library and information issues. The library holds in its general collections 908,480 books, 7,749 periodical titles, 10 main microfilm collections, 8,201 audiobook titles and 518,746 items in the schools collections.
Family history, music and children's literature are strengths within the collections.
The Alexander Turnbull Library holds 354,000 volumes, including 44,000 rare books, chiefly in English literature. Special collections include New Zealand and Oceania, Milton, Katherine Mansfield and oral history. There are 8,000 linear metres of manuscripts, 78,000 drawings, paintings and prints, 2.6 million photographic prints, negatives and albums, 54,000 maps, 40,379 sound recordings, 2,678 videos, 579 computer files and 140,000 items of ephemera, including 17,000 posters.
The National Library provides access to its general collections on site and by lending to other libraries through the interloans system.
Collections of the Alexander Turnbull Library are not available for borrowing, but material can be selected and used in special areas of the library. Some items, such as microform copies of serials, newspapers, books and manuscripts, some oral history interviews and other unpublished sound recordings, may be available through inter-library lending.
Access to the records of most collections is available through the internet.
The National Library gallery, through a programme of exhibitions and public events, provides access to, and interpretation of, the heritage collections held by the Alexander Turnbull Library.
Services available from the National Library include:
Collection and reference services – Under the National Library Act 2003, publishers are required to deposit copies of every publication produced in New Zealand, including electronic published material. The library lists these publications in the New Zealand National Bibliography, published monthly and often used by buyers to order new titles. The general collection includes the family history area, where people trace their family tree using books, CD-ROMs and microfiche information from New Zealand and overseas.
Te Puna – This is the web-based gateway to the library's online collections, catalogues and directories.
School Services – Located in 13 centres around the country, this service is available to all New Zealand schools. School Services provides advisory support on school library management and development through a programme of courses, seminars and consultancy services. Curriculum Information Service provides reference services and loans of curriculum-related resources to teachers and home-schoolers from the schools collection and a developing range of online information resources.
Services to Māori – This unit helps Māori gain optimum use of the library's resources and services.
National Preservation Office – The National Library and National Archives established New Zealand's National Preservation Office Te Tari Tohu Taonga in 1997. This provides a national advisory service, including training in preservation management and conservation assessments.
Print Disabilities Service – This service provides audio books (cassettes and CDs) to people with print disabilities who cannot independently obtain access to information in a print form.
The National Library website is www.natlib.govt.nz
The Alexander Turnbull Library. Part of the National Library of New Zealand, the Alexander Turnbull Library holds collections of books, photos, manuscripts and archives, letters, drawings and prints, music, newspapers, maps and sound recordings that document the history of New Zealand and the Pacific. Other significant holdings are the major research collection on John Milton and his times, a selection of illuminated manuscripts, and New Zealand's largest collection of early printed books and fine printing. The library was started by Alexander Horsburgh Turnbull, a wealthy Wellington merchant who died in 1918 and bequeathed to the nation 55,000 volumes, as well as manuscripts, photographs, paintings and sketches collected during his lifetime.
Oral History Centre. The many different voices of New Zealanders are recorded by the Alexander Turnbull Library's Oral History Centre. The recordings provide valuable information about language, accent, inflection, emphasis and tone. The centre conducts weekly or monthly interviews with people such as leading politicians or the long-term unemployed. With more than 12,000 hours of spoken recording on discs, reels and cassette tape, the Alexander Turnbull Library has the most extensive collection of oral history recordings in the country.
The Parliamentary Library provides information, research and reference services for parliament as required by the Parliamentary Service Act 2000.
The library also provides Members of Parliament with desktop access to electronic resources, such as legislative, statistical, legal and news databases.
The library's print collection of more than 500,000 volumes is strongest in economics, politics, public administration, law, social sciences and New Zealand serials and newspapers.
International documents include government and parliamentary publications from a wide range of countries, with Australia, Canada, the United Kingdom and the United States particularly well covered. Publications from many inter-government agencies, such as the United Nations, the Organisation for Economic Co-operation and Development and the World Bank, are also held.
The international documents collection is available for public use, as is the Parliamentary Information Service, which responds to public enquires on all aspects of the New Zealand Parliament.
The Parliamentary Library building, which marked its centenary in 1999, is a striking example of 19th century Gothic architecture. Extensive refurbishment and earthquake strengthening took place from 1992 to 1996.
Founded in 1910 through a gift from Dr T M Hocken, Dunedin physician, bibliographer and collector, the Hocken Collections contain major research collections of New Zealand, Pacific and early Australia.
Administered in trust by the University of Otago, the library includes more than 231,150 books and periodicals; 2,750 linear metres of newspapers; 12,930 sound recordings; 2,350 pieces of sheet music; 440 videos; 16,220 microforms; 11,040 maps; 1,079,250 photographs; 17,670 posters; and 13,610 paintings, including modern works of art.
Archives and manuscripts total 8,113 linear metres and are rich in sources for early missionary history; literary study; Otago businesses, local government, education, health, sport, community organisations and churches; and the University of Otago.
The library needs of the majority of New Zealanders are met through public libraries provided by local authorities.
Since local authority amalgamation, most cities and districts provide a coordinated library service to the whole district population. There is usually one central district or city library and a number of other service points.
At the end of 2006, there were more than 400 libraries in New Zealand covering public, specialist, government and educational needs, with a stock of more than 12 million volumes.
There are more than 70 libraries in tertiary education institutions, including specialist department libraries within universities, all of which have major collections.
New Zealand universities finance their libraries largely from government funding. They have developed research collections and some share an on-line public access catalogue system.
There is provision for a library or library room in every New Zealand school.
Developments in information technology, including easy access to the internet, have enabled much more intensive use of remote electronic databases and sourcing of material from external databases and collections.
More than 200 specialist libraries and information centres serve government departments, businesses and other organisations.
A cooperative inter-library lending system allows resource sharing among libraries.
The New Zealand Society of Authors (PEN NZ Inc) is the principal advocate for the professional interests of writers, protecting basic rights to freedom of expression, working to improve income and conditions, and promoting New Zealand writing and literary culture.
Membership is open to anyone interested in writing. The society had a membership of about 1,200 at 31 December 2005.
As well as providing a range of professional development leaflets, contracts, publications, programmes and communications services, the society represents writers on boards and committees of industry partners in publishing, bookselling and audience development, and with Creative New Zealand and government departments.
New Zealand was one of the first English-speaking countries to compensate writers for lost royalties on books held in public libraries, and the society continues to advocate on their behalf.
The society's mentor and manuscript assessment programmes provide emerging writers with qualified professional feedback on their writing, while contract and publishing advisory services provide advice on all aspects of the publishing process.
The society maintains an involvement with International PEN, which works on behalf of writers whose lives and freedoms are endangered.
PEN NZ Inc has representatives on the New Zealand Book Council, The Montana New Zealand and New Zealand Post Children's Book Awards management committees, Whitireia Polytechnic, the Audience & Market Development Reference Group, The Author's Fund Advisory Group, the Robert Burns Fellowship selection committee and has three board members on Copyright Licensing Ltd, which distributes fees to authors and publishers for institutional photocopying of their work.
The society also administers three awards – The Ashton Wylie Charitable Trust Awards, The Foxton Fellowship and the Lillian Ida Smith Award – and provides the three Best First Book Awards (fiction, poetry and non-fiction) at the Montana New Zealand Book Awards each year.
Administered by Creative New Zealand, the New Zealand Authors’ Fund compensates authors for loss of earnings when their books are held by public libraries. Every year, approximately $1.5 million is distributed among more than 1,400 New Zealand writers.
Book marketing in the form of national promotions is undertaken by Booksellers New Zealand, an organisation representing booksellers and publishers. Booksellers New Zealand organises the Montana New Zealand Book Awards, Montana Poetry Day and the New Zealand Post Book Awards and Festival.
The Montana New Zealand Book Awards recognise excellence and provide recognition for the best books published annually in New Zealand. In 2005, the winner of the Deutz Medal for Fiction was Tu by Patricia Grace. Winner of the Montana Medal for Non-Fiction was At Home, by Douglas Lloyd Jenkins. Winner of the New Zealand Society of Authors Hubert Church Best First Book of Fiction Award was My Real Life, by Julian Novitz, while the New Zealand Society of Authors Jessie Mackay Best First Book of Poetry Award was won by Clung, by Sonja Yelich. Winner of the New Zealand Society of Authors E H McCormick Best First Book of Non-Fiction Award was Ghost Dance, by Douglas Wright.
The New Zealand Post Book Awards for Children and Young Adults recognise the best in books for children and teens. In 2005, Clubs: A Lolly Leopold Story, by Kate De Goldi and Jacqui Colley, won New Zealand Post Book of the Year and was also the winner of the picture book category. The non-fiction category was won by Welcome to the South Seas, by Gregory O’Brien. The young adult fiction category was won by Malcolm and Juliet, by Bernard Beckett, and the junior fiction category was won by Aunt Effie and the Island that Sank, by Jack Lasenby. The Children's Choice Award was won by The Other Ark, by Lynley Dodd, and the Best First Book Award went to Cross Tides, by Lorraine Orman.
The Book Publishers’ Association of New Zealand's annual book design awards (sponsored by Spectrum Print) recognise excellence in book design and aim to increase public awareness of the quality of New Zealand books.
A number of other book-related festivals and events are organised throughout New Zealand by independent groups. These include the Māori Writers Festival (Wellington), New Zealand Post Writers and Readers’ Week (Wellington), Going West (Auckland) and the Auckland Writers’ Festival.
Publishers have mounted collective stands at five major international book fairs since 2003. Attendance at the Frankfurt Book Fair is facilitated by the New Zealand Publishers’ Export Joint Action Group and attendance at the London Book Fair is facilitated by Booksellers New Zealand.
The Booksellers New Zealand website is www.booksellers.co.nz
It is estimated there are around 600 book publishers in New Zealand, with most of them New Zealand-owned and employing one or two people.
A survey commissioned by the Book Publishers Association of New Zealand showed that in 2005 there were 2,240 new book titles published in New Zealand. Education comprised the largest category (41 percent), followed by technical/professional (18 percent) and children's (7 percent).
Total New Zealand publishing industry turnover in 2005 was $264 million, of which $62 million was derived from export sales. New Zealand titles generated turnover of $148 million in 2005, against $116 million derived from sales of imported published titles. The bulk of revenue (85 percent) was generated by the 21 largest companies.
Forty-four percent of publishers surveyed considered their businesses to be growing, while 8 percent considered business stable.
The New Zealand Music Industry Commission was established in June 2000 as a government-funded charitable trust to facilitate growth in the New Zealand music industry through specific projects, such as New Zealand Music Month.
One of its main functions is to help the information flow among different facets of the industry, which it does through its website (www.nzmusic.org.nz) where music companies can register, gain information about projects, and get advice on matters such as tours, media and taxation.
The New Zealand Symphony Orchestra, founded in 1946, is the country's premier professional orchestra. Administered by Radio New Zealand until 1989, it now functions as a government-owned Crown entity. It has an establishment of 90 players and performs more than 100 concerts a year.
All the orchestra's main symphonic programmes are presented in Auckland and Wellington, but the orchestra visits about 30 New Zealand towns and cities each year.
Given New Zealand's geographical isolation, overseas tours are relatively infrequent. The orchestra played at the World Expo in Seville in 1992 and since then it has appeared in Australia (Brisbane in 1998 and Sydney in 2000), New Caledonia (1998) and Osaka, Japan, where it opened Asia Orchestral Week in 2003.
In 2005, the orchestra made its first visit to the prestigious BBC Proms: played at one of Europe's most highly-regarded concert halls, the Concertgebouw in Amsterdam; and then represented New Zealand at the World Expo in Aichi, Japan. This was the largest tour outside New Zealand the NZSO had undertaken and featured two of New Zealand's most prominent music ambassadors, Dame Kiri Te Kanawa and Jonathan Lemalu.
The New Zealand Symphony Orchestra has an establishment of 90 players and performs more than 100 concerts a year.
James Judd was appointed Music Director of the NZSO in 1999 and Franz Paul Decker is Conductor Laureate. The NZSO has an extensive catalogue of CD recordings, making one CD of New Zealand music each year as part of a commitment to promote and encourage music by New Zealand composers.
The NZSO Foundation Charitable Trust was established in 1996 to aid the long-term funding needs of the orchestra. The foundation's endowment fund grows through contributions by individuals, corporations and associations interested in supporting the NZSO.
The New Zealand Symphony Orchestra website is www.nzso.co.nz
The National Youth Orchestra, administered and funded by the New Zealand Symphony Orchestra, brings together about 100 young instrumental musicians each year for an intensive week of rehearsal, culminating in a public concert.
In 2001, due to increased sponsorship, the NZSO National Youth Orchestra performed for the first time in Wellington and Auckland and also travelled to Christchurch in 2004.
Selected from nationwide auditions, players aged between 13 and 25 receive coaching from NZSO principals, while gaining experience of professional symphony orchestra conditions. Many become NZSO and regional orchestra players.
Chamber Music New Zealand is the major presenter of chamber music concerts in New Zealand. International and New Zealand artists perform in Celebrity Season concerts in nine centres, with additional concerts in 23 smaller cities and towns. There were more than 100 concerts and events in 2005.
With more than 50 years experience, Chamber Music New Zealand has strong ties with artist management and concert presenters worldwide. This offers the opportunity of touring the best of both established and emerging international ensembles, but there is also a strong commitment to development of New Zealand musicians and composers.
Chamber Music New Zealand established the New Zealand String Quartet in 1987, a professional, full-time quartet which has developed an international reputation.
Chamber Music New Zealand organises contests for secondary school students in both instrumental performance and composition, and many contestants have subsequently enjoyed distinguished international careers. The 2005 contest attracted more than 560 group entries comprising 2,100 young musicians from throughout New Zealand. Ticket sales are the major source of Chamber Music New Zealand's funding, with the rest coming from grants from Creative New Zealand and sponsorship. The Chamber Music New Zealand website is www.chambermusic.co.nz
The New Zealand Choral Federation Te Kotahitanga Manu Reo o Aotearoa (NZCF) is an incorporated society representing the interests of its 390 member choirs. It is served by a national executive of 16 members.
The NZCF, whose Māori name means ‘the assembly of the chorus of birds of New Zealand’, promotes choral music in all its forms and aims to ensure that the experience of singing in a group is available to all New Zealanders.
Its long-term goal is to develop a unique New Zealand ‘voice’, a distinctive choral sound which amalgamates the singing traditions of Māori, Polynesian and western music.
Formed in 1985, NZCF provides advisory and information services on all group singing matters, and is the link to the International Federation for Choral Music.
NZCF income is derived from membership fees, event management, sponsorship and Creative New Zealand.
The NZCF has developed a family of national events to promote group singing and to raise its profile. These showcase events encourage participation and promote excellence in group singing from an early age through The Kids Sing (young voices group singing awards) and The Big Sing (secondary schools choral festivals). In 2005, 200 choirs from 127 schools entered the secondary school festival, which culminated in 20 choirs attending the national final in Palmerston North.
The NZCF holds the Sing Aotearoa Festival every three years, a multi-cultural, multi-art festival first held in 1990 to commemorate the 150th anniversary of the signing of the Treaty of Waitangi. Sing Aotearoa brings together singers, writers, composers and dancers from all over New Zealand for an intensive weekend of workshops, performances, forums and cultural exchange.
The Royal New Zealand Ballet is one of New Zealand's largest performing arts organisations, comprising 32 dancers and 25 staff in artistic support, production, marketing and management.
Established in 1953, it is the oldest professional ballet company in Australasia.
With a strong classical base, and a healthy attitude towards innovation, the company regularly presents an eclectic repertoire of choreographic styles – from 19th century classics to 21st century contemporary works.
Dancers of the Royal New Zealand Ballet possess a unique physical strength and versatility, and a well-developed sense of individuality. New international and New Zealand choreography expresses these qualities, and features prominently in the company's repertoire.
The Royal New Zealand Ballet tours New Zealand more extensively and more frequently than any other major performing arts organisation. In 2005, more than 100,000 people attended performances in 50 centres across the country. International tours have taken the ballet to the United States, Europe, Asia and Australia.
The company receives 40 percent of its income directly from central government through Vote: Arts Culture and Heritage and 60 percent from box office sales and sponsorship.
The Royal New Zealand Ballet website is www.nzballet.org.nz
The New Zealand School of Dance in Wellington trains about 60 students a year, offering a two-year National Certificate and a three-year National Diploma in Dance Performance. Students come from New Zealand, Australia and a small number of other countries.
Founded in 1967, the school has a close relationship with the Royal New Zealand Ballet and students are often seconded to the company for performances. Students are also given the opportunity of working each year with a number of artists in residence. The school also offers a Junior Associate programme for aspiring young dancers.
The New Zealand School of Dance is principally funded by the Tertiary Education Commission, and from tuition fees, sponsorships and grants. Fees for dance courses in 2005 were $3,750 (inc GST).
The New Zealand School of Dance website is www.tewhaea.org.nz
More than 370 actors, entertainment technology production specialists and directors have graduated from the New Zealand Drama School Te Kura Toi Whakaari O Aotearoa since its establishment in 1970.
The Wellington-based school offers a three-year Bachelor of Performing Arts (Acting), a two-year Diploma in Entertainment Technology, a one-year Advanced Diploma in Entertainment Technology, a two-year Master of Theatre Arts (Directing) offered jointly with Victoria University, and a four-year Bachelor of Performance Design offered jointly with Massey University.
The school is principally funded by the Tertiary Education Commission, tuition fees, sponsorship and grants. In 2005, annual fees for the diploma courses and the Bachelor of Performing Arts (Acting) were $4,612 (inc GST) and for the Bachelor of Performance Design approximately $3,500 (inc GST). Papers for the applied Master of Theatre Arts (Directing) started at $43 per point of the paper's worth.
The New Zealand Drama School website is www.tewhaea.org.nz
New Zealand Opera Limited was formed in 2000 with merging of the National Opera of Wellington and Auckland's Opera New Zealand.
The aim of the company is to widen the reach and to raise the standard of opera production in New Zealand.
In its first six years, the company significantly grew its audiences throughout the country through both mainstage and national touring productions.
It has won critical acclaim for its world-class productions, which include several New Zealand premieres and involve talented New Zealand opera performers and creative teams.
In 2006 the company staged The Magic Flute, Faust, and embarked upon a national tour of Don Pasquale. The company does not confine itself to staging productions, however. Concerts and collaborations with regional orchestras and festivals around New Zealand are also among its activities.
Through the PricewaterhouseCoopers Dame Malvina Major Emerging Artists Programme, talented young singers receive practical assistance and experience. Development training is focused on all aspects of building a career in opera, including voice and performance, with regular tuition from leading opera professionals.
Opera Outreach is an initiative designed to make opera more accessible to young people. This is achieved by hosting creative workshops that give school students the chance to create and perform in their own opera or musical drama, and by having school children attend the final dress rehearsals of each opera season.
New Zealand Opera Limited, a merger between the National Opera of Wellington and Auckland's Opera New Zealand, has won critical acclaim for its world-class productions.
The New Zealand Film Commission (NZFC) finances distinctly New Zealand films with the aims of reaching significant New Zealand audiences and producing high returns on investment, both in cultural and financial terms.
More than 200 feature films have been made in New Zealand since the film commission was established in 1978. Approximately 100 of these features have had NZFC finance and five have also had finance from the New Zealand Film Fund.
The functions, powers and duties of the NZFC are defined in the New Zealand Film Commission Act 1978. The commission receives funding from central government and from the Lottery Grants Board.
The NZFC budget for the 2005/06 financial year was $22 million, of which 70 percent came from the Lottery Grants Board, 17 percent from the government, and the remainder from film investments and sales. The budget varies from year to year according to public funding and returns on film investments.
A scene from the film The World's Fastest Indian shot in Invercargill.
Film-going peaked at 40.6 million admissions in 1960–61, but declined dramatically after the introduction in 1961 of television and, later, home videos.
However, as Figure 12.01 shows, cinema admissions have shown steady growth in recent years, from 6.1 million in 1991 to a latter-day peak of more than 18.3 million in 2003, dropping to around 15.5 million in 2005.
According to Motion Picture Distributors’ Association figures, box office takings in 2005 were $146.8 million, compared with $152.8 million in 2004 and $156.1 million in 2003.
The New Zealand Film Archive Ngā Kaitiaki O Ngā Taonga Whitiāhua has three principal functions – to collect, protect and project New Zealand's moving image heritage.
Established in Wellington in 1981, the archive's collections reflect the breadth of New Zealand's moving image history, from the earliest days of cinema to contemporary film, video and digital productions.
The film and video collection includes features and short films, newsreels, documentaries, home movies, music videos, broadcast programmes, commercials and video art.
The archive also maintains the national television collection on behalf of NZ On Air. This collection represents a diverse range of broadcasters and programming, including television news, dramas, documentaries, game shows, music videos, infomercials, youth programming and sport.
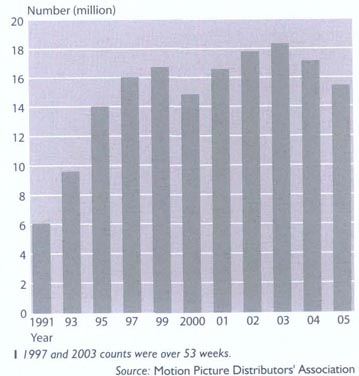
The documentation collection includes promotional, critical and historical materials from 1896 to the present. The collection also includes stills, posters, scripts, clippings, programmes, publicity material, production records and files, personal records, storyboards, props and costumes, animation cels, taped interviews and equipment.
While based in central Wellington, the archive has a national focus. In addition to screenings and exhibitions in Wellington, the archive has an Auckland branch and video access sites in art galleries and museums in Dunedin, Christchurch, Hamilton, Otaki, Palmerston North, New Plymouth and Whangarei.
The New Zealand Film Archive website is www.filmarchive.org.nz
The Films, Videos, and Publications Classification Act 1993, which covers a range of media, defines a ‘publication’ as:
Any film, book, sound recording, picture, newspaper, photograph, photographic negative, photographic plate or photographic slide.
Any print or writing.
A paper or other thing that has printed or impressed upon it, or otherwise shown upon it, one or more (or a combination of one or more) images, representations, signs, statements or words.
A thing (including, but not limited to, a disc, or an electronic or computer file) on which is recorded or stored information that, by the use of a computer or other electronic device, is capable of being reproduced or shown as one or more (or a combination of one or more) images, representations, signs, statements or words.
Film is further defined as including cinematographic film, video recordings, DVDs, computer games and any other material record of visual moving images.
Administration. The Films, Videos, and Publications Classification Act 1993 established the following bodies:
Office of Film and Literature Classification – an independent Crown entity made up of a chief censor, a deputy chief censor, classification officers, an information unit and support staff. The office classifies publications likely to be restricted or objectionable, provides information on the classification system to the public and conducts research.
The Film and Video Labelling Body – an industry-based body responsible for rating unrestricted films and videos and issuing labels. It bases many of its ratings for New Zealand consumers on the ratings and classifications assigned by Australian or British authorities. Ratings are consumer guides not legal restrictions. If a film is likely to be restricted or objectionable, or if the labelling body is having difficulty assigning a rating, the film must be referred to the Office of Film and Literature Classification. The labelling body is responsible for the labelling of films and submits publications to the Office of Film and Literature Classification for classification on behalf of distributors.
Film and Literature Board of Review – comprises members of the public appointed by the governor-general on the recommendation of the Minister of Internal Affairs. The act provides for the original applicant, the owner, maker, publisher or authorised distributor, or any other person given leave by the Secretary for Internal Affairs, to submit a publication to the board for a review of its classification. The board conducts the review by way of re-examination without regard to the decision of the Office of Film and Literature Classification. The president of the board also has the power to make a decision on any application for an interim restriction order in respect of any publication referred or submitted to the board. An interim restriction order prevents a publication being made available to the public prior to the board issuing its decision. The board is an independent statutory body and is serviced by the Department of Internal Affairs.
Classification. The Films, Videos, and Publications Classification Act 1993 established a legal test which considers whether availability of a publication would be injurious to the public good. This test is applied to publications in order to ascertain whether restriction is required, and what level of restriction might be appropriate. Publications classified by the office deal with matters such as sex, horror, crime, cruelty or violence. The office can restrict the availability of a publication to people over a certain age (up to 18 years), to a person or class of persons, or to a specified purpose. It can ban a publication that is injurious to the public good. It can also place no restriction on a publication. Following classification, films are issued labels by the Film and Video Labelling Body. Films rated G (suitable for general audiences) are issued with green labels. Yellow labels (PG and M) are issued for unrestricted films recommended for a certain age or group. A PG rating means that younger persons may require parental guidance. An M rating means that a film is recommended for mature audiences 16 years and over. Red labels signify a restricted film. Computer games fall under the definition of films, and the act requires that films intended for supply to the public must be labelled. However, section 8(1) (q) of the act exempts games from labelling unless they are likely to be restricted. Restricted computer games must also carry a red New Zealand classification label. Publications other than films are not required to be labelled before being supplied to the public. However, distributors or publishers can request leave from the chief censor to submit publications such as magazines and books for classification. If the chief censor grants leave, the Office of Film and Literature Classification will classify such material as unrestricted, restricted or objectionable. In addition, display conditions may be imposed and the publication may be required to be labelled. Apart from the Film and Video Labelling Body, publications can also be submitted to the Office of Film and Literature Classification by the Secretary for Internal Affairs, the Comptroller of Customs, Commissioner of Police or by any other person with leave of the chief censor. The chief censor can also ‘call in’ publications on his or her own motion. Classifications assigned are legally enforceable. Under the act, it is illegal to possess or supply an objectionable publication. This applies whether or not the publication has been classified. It is illegal to supply or to exhibit a restricted publication to people under the age of the restriction. The Office of Film and Literature Classification website is www.censorship.govt.nz
Enforcement. The Censorship Compliance Unit of the Department of Internal Affairs enforces the Films, Videos, and Publications Classification Act 1993. The unit's objective is to increase compliance with New Zealand's censorship laws. The unit ensures that the film and video industry, magazine distributors and shops adhere to decisions of the Office of Film and Literature Classification. This is done through an inspection programme that checks compliance with the legislation, ensuring that restricted material is correctly labelled and displayed and that objectionable material is not made available to the public. The unit inspects New Zealand websites to ensure they comply with legislation. It also is the primary agency responsible for monitoring, investigating and prosecuting offences involving objectionable material across all publication formats. The unit has a particular focus on investigating the making and distribution of child pornography on the internet. The unit has strong links with overseas law enforcement agencies and regularly exchanges intelligence on offenders with those agencies. The New Zealand Police are also inspectors of publications under the act, with the same powers as inspectors employed in the Censorship Compliance Unit. The New Zealand Customs Service is responsible for ensuring that material imported into New Zealand complies with the law. Material seized by customs may be referred to the Office of Film and Literature Classification by customs. The Censorship Compliance Unit website is www.censorship.dia.govt.nz
Copyright in New Zealand is based on the Copyright Act 1994, administered by the Regulatory and Competition Policy branch of the Ministry of Economic Development.
Copyright law is complex and only the essential aspects are discussed here. Copyright protection in New Zealand comes into existence automatically on the creation of any original literary, dramatic, musical and artistic work (including photographs), sound recording, film, broadcast, cable programme and typographical arrangement of published editions.
Computer programs gain copyright protection under the definition ‘literary work’.
No registration is necessary (or even possible), nor is any other formality required for securing copyright protection.
Duration of copyright. For literary, dramatic, musical and artistic works (including photographs), copyright continues for the lifetime of the author, plus 50 years after the end of the calendar year in which the author dies. For sound recordings and films, copyright generally continues for 50 years from the end of the calendar year in which they were made or made available (whichever is later). For broadcasts and cable programmes, copyright continues for 50 years from the end of the calendar year in which they were made (broadcasts), or included in a cable programme service (cable programmes). Copyright in typographical arrangements of published editions is for 25 years from the end of the calendar year in which they were first published. Shorter periods of protection apply to works that are industrially applied.
Ownership of copyright. The first owner of copyright is usually the author of a work. The author is the person who creates the work. However, if this person was employed and created the work in the course of employment, then the employer is the first owner. If the author of some kinds of work (such as sound recordings, films, photographs and computer programs) was commissioned to make that work, the first owner is the person who commissioned the work. For works commissioned or created by an employee, the parties can agree to vary the first ownership rule. Ownership of copyright can also be assigned in writing to another person.
Moral rights. Authors and directors have certain ‘moral rights’ in addition to the economic rights provided under the Copyright Act. These rights include the right to be identified as the author of a work; the right to object to derogatory treatment of the work (prejudicial to their honour or reputation); and the right not to have a work falsely attributed to them. Moral rights cannot be assigned to another person except upon the death of the author.
Exclusive rights of copyright owners. The owner of the copyright for a work has the exclusive right to do, and authorise others to do, a number of ‘restricted acts’ in relation to the work or an adaptation of that work in New Zealand. These include rights to make copies; issue copies to the public, including the rental of films, computer programs and sound recordings; perform, play or show the work in public; broadcast the work or include the work in a cable programme service; and make an adaptation of the work. Copyright infringement occurs when a person undertakes a restricted act without the permission of, or a licence from, the copyright owner.
Exceptions to copyright. There are a number of exceptions to exclusive rights, called ‘permitted acts’, that allow copyright works to be used without the permission of the copyright owner. These permitted acts include fair dealing for criticism, review, and news reporting; fair dealing for research and private study; recording of broadcasts or cable programmes for the purposes of time shifting of (that is to listen to or watch them at a more convenient time); and backing up computer programs.
There are also specific exceptions for libraries, archives and educational institutions.
Performers’ rights. Performers have certain 1imited rights to control exploitation of their performances where they have not given consent to that exploitation. This includes, for example, the right to control the recording, broadcast or inclusion in a cable programme of a live performance. Protected performances include dramatic performances, musical performances, readings and recitations of literary works and performances of a variety act. The term of protection provided to performers is 50 years from the end of the calendar year in which the performance takes place.
Enforcement of copyright. Action for copyright infringement in New Zealand is generally by way of civil action by the copyright owner. Remedies from civil action include damages, injunctions, or an order for delivery up. Criminal offences apply to certain commercial activities concerning infringing copies and can result in fines up to $150,000, or five years imprisonment.
Copyright Tribunal. The role of the Copyright Tribunal is to resolve disputes regarding licences or proposed licences for the copying, performing or broadcasting of copyright works.
Protection overseas. New Zealand is a signatory to various international copyright agreements. Participation in these agreements means that when an original work is created in New Zealand, it is not only protected by copyright in New Zealand, but also automatically protected under the copyright laws in other countries that are signatories to these agreements. It is not necessary to register for copyright protection in these countries – copyright protection arises automatically upon the creation of any original work. This means that when original works are created in other countries, they are also protected in New Zealand.
The role of the Ministry for Culture and Heritage is to support government participation in the cultural sector by providing strategic advice to the government on arts, culture, heritage, sports and broadcasting matters. The ministry also provides a cultural and heritage perspective in other areas of government activity.
The ministry monitors the work of various agencies that deliver cultural and broadcasting services with government funding. These range from major Crown entities, such as the Museum of New Zealand Te Papa Tongarewa and NZ On Air, to small, independent, single-focus organisations like the Antarctic Heritage Trust. The ministry monitors governance and performance of each agency to confirm that government funding is used to support agreed outcomes and also assists with agency planning and development.
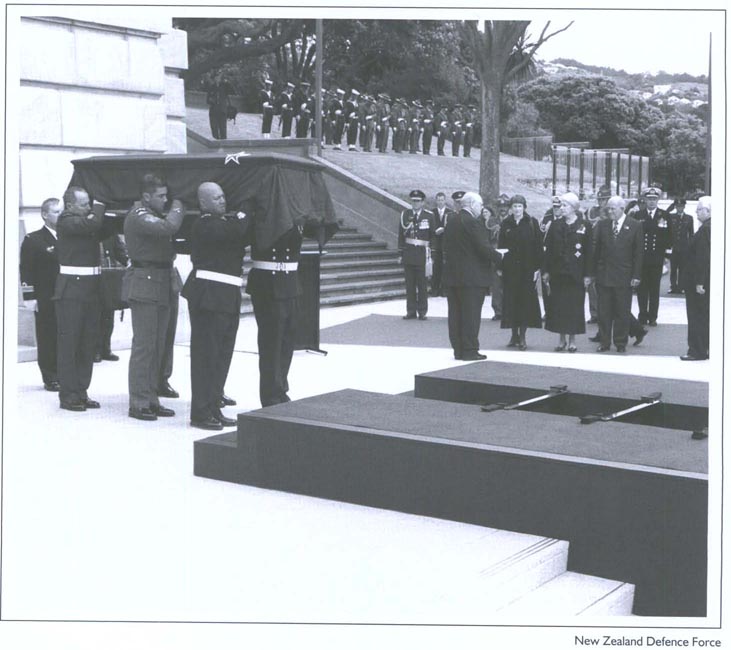
The Tomb of the Unknown Warrior at the National War Memorial in Wellington is managed and maintained by the Ministry for Culture and Heritage.
The ministry also implements a number of history and heritage programmes with the aim of making New Zealand history available in media such as books, websites, television programmes, seminars and oral histories.
Development of the Dictionary of New Zealand Biography, NZHistory.net.nz and Te Ara – The Encyclopedia of New Zealand, all web-based resources, are examples of the drive to make New Zealand's historical and cultural information easily accessible.
The ministry manages and maintains a number of heritage properties, including the National War Memorial, the Tomb of the Unknown Warrior and war graves throughout the country. It also commissions new memorials, such as those in Korea and in London.
Preservation of heritage also extends to the protection of antiquities and artefacts through administration of the Antiquities Act 1975; and administration of the Flags, Emblems and Names Protection Act 1981 and the Waitangi Day Act 1976.
The work of the ministry in the 2005/06 financial year was budgeted to cost $12,293 million (excluding GST). Of this, $11.819 million was made available through Vote: Arts, Culture and Heritage. Vote: Sport and Recreation provided $98,000 and $376,000 was contributed by third parties (e.g. from the writing of commissioned histories).
The ministry's statement of intent for the five years from 2005 outlines key priorities, including the launch of further stages of Te Ara – The Encyclopedia of New Zealand and enhanced delivery of historical information in print and digital media; enhanced teaching and learning opportunities through NZHistory.net.nz; completion of the Korean War Memorial; further development of memorials in London and Wellington; implementation of the Cultural Diplomacy International Programme, advancement of the cultural well-being and cultural portal projects and progression of the Broadcasting Programme of Action.
The ministry aims to continue enhancing cultural agency governance and active development of strong relationships with its stakeholders in the culture and heritage sector, with emphasis given to building the confidence of Māori in the work of the ministry.
The Ministry for Culture and Heritage website is www.mch.govt.nz
Table 12.01 shows government funding of the arts, culture and heritage sector for the year ending 30 June 2005.
Table 12.01. Funding to the arts, culture and heritage sector
Year ending 30 June 2005
| Group | Government funding $(000) |
|---|---|
| Source: Ministry for Culture and Heritage | |
| Te Papa | 20,506 |
| New Zealand Film Archive | 704 |
| Regional museums (advice on antiquities) | 21 |
| New Zealand Historic Places Trust | 7,547 |
| New Zealand Archaeological Association | 135 |
| Ministry for Culture and Heritage | 12,237 |
| New Zealand Music Industry Commission | 600 |
| Creative New Zealand | 16,728 |
| New Zealand Film Commission | 12,232 |
| New Zealand Symphony Orchestra | 11,390 |
| Te Matatini | 1,103 |
| Royal New Zealand Ballet | 3,695 |
| Television New Zealand | 30,119 |
| NZ On Air | 105,989 |
| Radio New Zealand International | 1,716 |
| Broadcasting Standards Authority | 685 |
| National Pacific Radio Trust | 2,109 |
| Radio New Zealand International (capital contribution) | 3,849 |
| Museum of New Zealand Te Papa Tongarewa (capital contribution) | 10,868 |
| Antarctic Heritage Trust | 100 |
| Pukaki Trust | 8 |
| Commonwealth War Graves Commission | 2,305 |
| War graves, historic graves and monuments | 631 |
| Gallipoli Memorial projects | 113 |
| Kerikeri heritage bypass | 1,712 |
| Regional museums (capital construction) | 12,300 |
| Theatre Royal, Christchurch | 1,688 |
| Treaty of Waitangi celebrations | 324 |
| Waitangi National Trust Board | 200 |
| National Memorial Park, Wellington | 6,000 |
| Tomb of the Unknown Warrior | 1,806 |
| Archives New Zealand | 23,835 |
| National Library of New Zealand | 55,948 |
Creative New Zealand is the main arts development organisation in New Zealand, established as a crown entity under the Arts Council of New Zealand Toi Aotearoa Act 1994. It works in a range of ways to develop and promote New Zealand arts and artists, both at home and internationally, All of Creative New Zealand's work is guided by its strategic plan, Te Mahere Rautaki 2004–2007. Its strategic priorities include rewarding and sustainable careers for professional artists; thriving and well-resourced professional arts organisations; cultural diversity; and international growth.
Creative New Zealand's work includes arts advocacy, a range of funding programmes, special initiatives, and research. It works in partnership with the arts sector, central and local government, the business sector and communities to achieve its vision of New Zealand arts as excellent, distinctive and essential in the lives of all New Zealanders.
Its governing body is the New Zealand Arts Council and its decision-making bodies are the arts board, Te Waka Toi and the Pacific arts committee.
Staff in Wellington, Christchurch and Auckland offer a range of services, including specialist artform and funding advice, professional development opportunities, arts advocacy, research, communications and information services.
Creative New Zealand's funding comes from the government through Vote: Arts, Culture and Heritage and from the Lottery Grants Board.
The Creative New Zealand website is www.creativenz.govt.nz
Advocacy. Creative New Zealand's aim is to ensure that New Zealanders value the arts as an integral part of everyday life. Creative New Zealand supports several awards to acknowledge the contribution of other sectors to the arts. For instance, the annual Creative Places Awards recognise local government innovation and investment in the arts. The 2005 Premier Creative Places Award was won by the New Plymouth District Council for its successful development of the city's Govett-Brewster Art Gallery. Creative New Zealand also supports awards that celebrate New Zealand artists and their achievements. These include the Te Waka Toi Awards, Arts Pasifika Awards, the Prime Minister's Awards for Literary Achievement and the Montana New Zealand Book Awards.
Arts development. Creative New Zealand supports 36 professional arts organisations on an annual or multi-year basis, monitors their funding, and works with them to provide capability-building opportunities and play a leadership role for the arts sector. These organisations include the New Zealand String Quartet; the New Zealand International Arts Festival; national advocacy and service organisations such as Arts Access Aotearoa, Toi Māori Aotearoa and the New Zealand Book Council; regional theatre companies and orchestras; galleries and opera companies. These organisations were offered $13.21 million for their programmes of activities in 2006. Creative New Zealand's strategic priority supporting rewarding and sustainable careers for professional artists is achieved through project funding, residencies, fellowships, partnerships and its work in audience and development. The organisation receives approximately 1,500 applications a year for grants through its two project funding rounds. It is able to support approximately 480 of these through its three funding bodies – the arts board, Te Waka Toi and the Pacific arts committee. Creative New Zealand's work in audience and market development is about increasing audiences, markets and professional development opportunities for artists and arts organisations, both in New Zealand and internationally. Recent initiatives include New Zealand's inaugural presence at the Asian Arts Mart 2005 in Singapore, a New Zealand homepage (www.fuel4arts.co.nz) on the international online arts marketing community www.fuel4arts.com, and publication of a CD ROM and rights catalogue to help build international markets for New Zealand literature.
The creator of this work, Peter Lange, was the 200S recipient of the Creative New Zealand Craft/Object Art Fellowship.
Wild Creations is a residency programme partnership between Creative New Zealand and the Department of Conservation which fosters links between conservation and the arts. Auckland multimedia artist Tabatha Forbes (above) spent six weeks in 2005 as a guest of the department's Otago conservancy working on a botanical-based painting project.
Special initiatives. Creative New Zealand identifies opportunities and areas of concern in the arts sector and responds by developing appropriate initiatives. These include fellowships, such as the annual Creative New Zealand Craft/Object Art Fellowship and the Creative New Zealand Michael King Writers’ Fellowship. Another initiative is the Smash Palace Fund, a partnership between Creative New Zealand and the Ministry of Research, Science and Technology aimed at encouraging and supporting collaborations between the arts and sciences as a building block for innovation and creativity, with the potential to increase public understanding of these two disciplines. In 2005, the Smash Palace Fund supported projects as varied as finding new uses for augmented reality technology, adapting traditional musical instruments for use in a computer age and explaining water quality, physics and volcanology to the wider community. The registered trademark toi ihoTM, denoting authenticity and quality of Māori arts, was launched in 2002. By June 2005, there were 149 Māori artists and 25 stockists licensed to use toi ihoTM. This initiative was developed by Creative New Zealand through Te Waka Toi. Creative New Zealand offers a range of international residencies in Antarctica, Berlin, Hawaii, New York City, Washington State and the Cook Islands. These residencies provide opportunities for New Zealand artists to develop their practice, build international networks and enhance their careers. In 2004, the organisation offered its first residencies in Asia in partnership with the Asia New Zealand Foundation. Visual artist Simon Kaan undertook a three-month residency at the Red Gate Gallery in Beijing, while textile artist Kelly Thompson completed a residency at the Sanskriti Foundation Kendra Campus. The 2005 recipients were Ri Williamson (Red Gate Gallery) and Prakash Patel (Sanskriti Foundation). Te Waka Toi offered its first international pilot residencies, including the Toi Oahu Residency, in 2005. Carver Lyonel Grant spent three months at the Kamakakuokalani Centre for Hawaiian Studies at the University of Hawaii as the inaugural recipient of the Toi Oahu Residency.
Research. Creative New Zealand carries out research to inform its strategic planning and policy development, to support its advocacy work and to provide information of value to the wider arts sector. In 2005, Creative New Zealand commissioned market research company Colmar Brunton to undertake a national research project called Arts Attendance, Attitudes and Participation. A national sample of 1,000 general public households, which included 100 respondents aged 10 to 14, were surveyed. Face-to-face, in-depth interviews were conducted with the sample, as well as booster interviews with Māori and Pacific peoples and children aged 10 to 14. Results will provide a rich source of data for both Creative New Zealand and the arts sector.
Regional arts development. Creative New Zealand's support for regional arts development is delivered through its partnerships, funding programmes, initiatives and advocacy work. Fifteen partnerships throughout New Zealand are undertaking regional activity with funding through Regional Strengths Maurangi Toi and the Ministry of Social Development through its Enterprising Communities Fund. Regional Strengths Maurangi Toi supports regional partnerships that position creative enterprise within regional development strategies, providing economic benefits to the creative sector and enhancing social and cultural well-being. The Creative Communities Scheme, a long-standing partnership with all 74 territorial authorities, distributes grants from the Far North to Southland and the Chatham Islands. Established in 1995, the scheme is administered by local authorities and funded by Creative New Zealand. Every year, approximately 2,600 grants to local arts projects are allocated and distributed by assessment committees made up of representatives from iwi and the local arts sector, including community arts councils and local government.
Introduction Ministry for Culture and Heritage
12.1 Ministry for Culture and Heritage.
12.2 Museum of New Zealand Te Papa Tongarewa; New Zealand Historic Places Trust; Archives New Zealand; New Zealand Cartoon Archive; Ministry for Culture and Heritage.
12.3 National Library of New Zealand; Parliamentary Library; Hocken Collections; New Zealand Library and Information Association of New Zealand (LIANZA); Alexander Turnbull Library.
12.4 New Zealand Society of Authors; Creative New Zealand; Booksellers New Zealand; Book Publishers’ Association of New Zealand; Ministry for Culture and Heritage; Copyright Licensing Limited.
12.5 New Zealand Symphony Orchestra; Royal New Zealand Ballet; Chamber Music New Zealand; New Zealand School of Dance/School of Drama; New Zealand Choral Federation; Statistics New Zealand; New Zealand Opera Limited.
12.6 New Zealand Film Archive; New Zealand Film Commission; Motion Picture Distributors Association.
12.7 Office of Film and Literature Classification.
12.8 Ministry of Economic Development.
12.9 Ministry for Culture and Heritage; Creative New Zealand.
www.arachna.co.nz/nzsa – New Zealand Society of Authors
www.archives.govt.nz – Archives New Zealand
www.booksellers.co.nz – Booksellers New Zealand
www.bpanz.org.nz – Book Publishers Association of New Zealand
www.censorship.govt.nz – Office of Film and Literature Classification
www.copyright.co.nz – Copyright Licensing Ltd
www.chambermusic.co.nz – Chamber Music New Zealand
www.creativenz.govt.nz – Creative New Zealand
www.historic.org.nz – New Zealand Historic Places Trust
www.lianza.org.nz – New Zealand Library and Information Association of NZ
www.matapihi.org.nz – Matapihi
www.mch.govt.nz – Ministry for Culture and Heritage
www.med.govt.nz – Ministry of Economic Development
www.natlib.govt.nz – National Library of New Zealand
www.nzballet.org.nz – Royal New Zealand Ballet
www.nzcf.org.nz – New Zealand Choral Federation
www.nzfa.org.nz – New Zealand Film Archive
www.nzfilm.co.nz – New Zealand Film Commission
www.nzmusic.org.nz – New Zealand Music Industry Commission
www.nzopera.com – New Zealand Opera Limited
www.nzso.co.nz – New Zealand Symphony Orchestra
www.otago.ac.nz – Hocken Collections
www.parliament.govt.nz – Parliamentary Library
www.stats.govt.nz – Statistics New Zealand
www.tepapa.govt.nz – Museum of New Zealand Te Papa Tongarewa
www.tewhaea.org.nz – New Zealand School of Dance/School of Drama
Table of Contents
International tourists have traditionally been drawn to New Zealand to experience the unpolluted air and water, open spaces and unique flora and fauna.
Physical recreation and sport play an important role in the lives of New Zealanders. Our diverse natural environment, rich in scenic beauty and accessible to most, ensures that outdoor recreation is popular with all ages.
The benefits of participation in physical recreation and sport are clear. Physical recreation and sport have a significant positive impact on the nation's health, provide opportunities for New Zealanders to express and reinforce their cultural identities, and contribute to the development of New Zealand's communities and economic growth.
Accordingly, government objectives, as set out in the vision statement of Sport & Recreation New Zealand, are to ensure that ‘all New Zealanders have a right to enjoy participating and reaching their potential in sport and physical recreation, are proud of their own active healthy lifestyles, and are proud of their achievements as a nation in sport.’
Sport & Recreation New Zealand (SPARC) was established on 1 January 2003 following passage of the Sport and Recreation New Zealand Act 2002. Establishment followed recommendations of the Ministerial Taskforce on Sport, Fitness and Leisure which proposed that the functions of the Hillary Commission for Sport, Fitness and Leisure; the New Zealand Sports Foundation; and the sports policy arm of the Office of Tourism and Sport be integrated into one agency.
SPARC aims to get more New Zealanders more active, more often. To this end, SPARC works with national sports organisations, national recreational organisations, regional sports trusts, local authorities, schools and iwi to create opportunities for all New Zealanders to be active and to reach their potential in their chosen sport or physical activity.
The bulk of SPARC'S expenditure is direct investment into sports and recreational organisations. In 2005/06, $59,803 million (71 percent of total expenditure) was spent on direct programme investment. This included investment in national organisations to support their regional and club structures, and to develop both grassroots sport and high performance programmes.
Targeted grants were also made to athletes, coaches and support personnel through Performance Enhancement Grants and Prime Minister's Scholarships.
In the year ending 30 June 2006, SPARC spent $9,157 million (11 percent of total expenditure) on indirect support for the sport and recreation sector, including Push Play advertising, sector training (e.g. governance and capability programmes), programmes (e.g. Green Prescriptions) and supporting resources (e.g. preschool and primary school resources).
The remaining 18 percent of SPARC'S expenditure was spent on policy advice and programme support services to the sport and recreation sector.
With around 70 staff, SPARC works to ensure that all New Zealanders recognise the value of, and have access to, an active lifestyle that will lead to a healthier and more socially cohesive nation.
Continuous monitoring of the levels of physical activity of New Zealanders has shown that 55 percent of adults aged 75 and over are physically active.
In SPARC'S Continuous Monitor research programme, a random sample of adults aged 15 and over is interviewed by telephone on a weekly basis.
Continuous Monitor measures the levels of physical activity of the New Zealand population over time, as well as evaluating the effectiveness of SPARC'S social marketing initiatives.
Continuous Monitor findings from December 2004 to June 2005 were:
Fifty-five percent of adults aged 15 or over are physically active and have been so for six months or more.
Fifty-nine percent of males and 51 percent of females are physically active and have been so for six months or more.
Those who are regularly active and have been so for more than six months are more likely to be aged 50–64 (61 percent) than 15–24 (48 percent).
Two-thirds of active adults (68 percent) are either highly or sufficiently active. Males (54 percent) are more likely than females (37 percent) to be highly active.
Levels of high activity drop from 66 percent for those aged 15–24 to 24 percent for those aged 65 and over.
Fifty-two percent of the population are aware of the need to be physically active 30 minutes a day to stay healthy.
Categories of physical activity are defined as:
Sedentary – doing no physical activity during a week.
Insufficiently active – doing less than 2.5 hours of physical activity a week, or doing fewer than five sessions a week.
Sufficiently active – doing 2.5 hours or more of physical activity a week and doing five or more sessions a week.
Highly active – doing 2.5 hours or more of physical activity a week, doing five or more sessions a week and doing some vigorous physical activity each week.
SPARC'S high performance network, the New Zealand Academy of Sport (NZAS), provides a comprehensive network of world-class expertise, services and facilities for New Zealand's best athletes, promising young athletes and their coaches.
The NZAS provides technical support and targeted financial resources for national sporting organisations’ high performance programmes. It also provides a range of support services in sports science, sports medicine and athlete and career education to carded national sports organisations, athletes and coaches.
Specific services provided by the NZAS are determined by agreements between national sports organisations and the NZAS. These agreements are sport-specific and are integrated into the individual sport's high performance plan. To access services, athletes are recognised at one of four levels – world, international, development and junior. Athletes receive a card which identifies them as being an athlete at one of these levels and which entitles them to access services from the academy in accordance with their sport's service agreement.
In 2005, there were approximately 1,420 carded athletes in New Zealand representing 21 sports.
The NZAS is funded by the government, with SPARC spending more than $25 million in 2004/05 on achieving one of SPARC'S three missions: winning in events that matter to New Zealanders.
There is also a separate Prime Minister's Scholarship fund. This programme is a government initiative managed by the NZAS. The programme's goal is to assist talented and elite athletes achieve tertiary qualifications while pursuing excellence in sport. The fund has increased from $1 million in 2001/02 to nearly $3 million in 2004/05. The scholarships are also available to coaches and officials to help them with professional development. In 2005, 104 coaches and officials from 35 national sports organisations received scholarships.
The NZAS also offers Performance Enhancement Grants to New Zealand's elite athletes to provide financial support for costs associated with training, equipment and day-to-day living. The grants range from $6,000 to $40,000 depending on the athlete's performance and are awarded for a 12-month period.
Young people are a major priority for SPARC, and a focus in the preschool and primary education sector during 2004/05 was on raising awareness of the need for fundamental movement skills and equipping caregivers and teachers with the skill to encourage physical activity.
Active Movement physical activity guidelines for under-fives were launched in May 2004 and progressed in the 2004/05 year with the launch of 14 ‘how to’ brochures. These resources target parents and caregivers and highlight the crucial role movement plays in human development. They recommend appropriate ways to incorporate movement into young children's daily lives.
The Active Schools programme was launched in October 2004. Active Schools is about getting children more active, more often. It aims to increase awareness, skills and education regarding quality physical activity and physical education within school communities, and to enhance student physical activity and overall well-being.
At the next level, SPARC is undertaking a best-practice review of sport and physical activity for young people aged 13–18. SPARC aims to develop innovative and relevant sport and physical activity initiatives to increase participation pathways for young people.
Green Prescriptions. A Green Prescription is a health professional's written advice to a patient to be physically active as part of the patient's health management. Sixteen area managers located within regional sports trusts and Primary Health Organisations promote the scheme. The scheme's key players are general practitioners, practice nurses, patients and activity providers. The Green Prescription initiative is partly funded by Pharmac. More than 14,000 patients were given a Green Prescription in the year ending 30 June 2005 and 51 percent reported remaining active six to eight months after receiving the advice.
He Oranga Poutama. He Oranga Poutama aims to increase and maintain physical activity levels of Māori. A network of regional sports trusts and iwi organisations provide support and facilitate physical activity initiatives with Māori at a regional and local level. He Oranga Poutama is linked with other SPARC programmes, such as Push Play, Active Schools and Green Prescriptions, to provide broad approaches to increasing and maintaining physical activity levels of Māori.
Coaching. Coaching is vital to the development of any athlete and SPARC is committed to supporting and developing New Zealand's coaches at a national, regional and local level. A National Coaching Strategy was developed in 2004 to help coaches throughout New Zealand. It lays the foundation for developing a world-class coaching environment. One outcome of this strategy was development of Coach Force. This programme focuses on participation, and ensures that as many people as possible have access to coaching services throughout New Zealand. Coach Force is a nationally-driven, regionally-delivered programme involving SPARC, national sports organisations, regional sports trusts and funding partners, such as community and gaming trusts. At 1 January 2006, there were 89 Coach Force regional coordinators working to raise the skill level of coaches. Coach Corp is another strategy initiative aimed at creating relationships between companies and community sports organisations to get more people involved in sport and physical activity. Companies participating in the programme allow employees paid flexi-time to be coaches, managers and officials in schools and sports clubs.
No Exceptions. No Exceptions is a programme of action for the whole sport and recreation sector designed to make sport and physical recreation fully accessible to disabled people. SPARC is leading implementation of No Exceptions across the sector, in partnership with key agencies, including national sport and recreation organisations, regional sports trusts, territorial authorities, the Halberg Trust, Paralympics NZ, Special Olympics NZ, and various disability agencies. No Exception's vision is increased participation of disabled people in sport and recreational activity. It is based on the belief that sport and physical activity can be welcoming and inclusive of disabled people, and by contributing to their quality of life can significantly benefit New Zealand society.
Other central government bodies. Various government departments, ministries and Crown entities are involved in sport and physical recreation. SPARC has close relationships with the Ministries of Health and Education who share the objectives of helping New Zealand to be a healthy, physically-active nation.
Active Communities. SPARC supports local government with its work in community development, recreation and transportation planning. SPARC'S Active Communities initiative provides investment which enables communities to become more active, more often. Nearly 70 territorial authorities receive investment and services from SPARC through Active Communities investment, peer review advisory services, regional and district physical activity planning services or the rural travel fund.
Sport & Recreation New Zealand's Push Play programme aims to get more people more active more often.
Push Play. Push Play is a nationwide SPARC campaign to get more people, more active, more often. The campaign aims to increase awareness about the benefits of regular, moderate physical activity – and how easy it is to get active. Push Play is based on the fact that even small amounts of activity – as long as they are regular – give health benefits. The National Health Committee recommends 30 minutes of moderate physical activity on most days of the week. The Activator initiative, launched in July 2005 as part of the Push Play campaign, is a two-tier wheel that lets the user ‘dial up’ physical activity options. The inner wheel provides ‘snacktivity’ suggestions – easy ways to build up to 30 minutes of activity a day – while the outer wheel provides examples for a full 30 minutes. Suggestions vary from walking while talking on your phone at work, to working out in front of the television at home.
Fishing. Rainbow and brown trout are found in most lakes and rivers of the North and South Island. The South Island also has sea-run brown trout in western coastal rivers, sea-run Quinnat salmon in eastern coastal rivers, and land-locked salmon in several waterways. Average sizes of trout vary from district to district depending on environment, climate, food and the number of anglers. With the exception of the Lake Taupo fishery, which is managed by the Department of Conservation, all trout and salmon fisheries are managed by Fish and Game New Zealand and a licence is required for all sport fishing. Fish and Game New Zealand has a statutory responsibility to protect, manage and enhance freshwater sport fishing and gamebird hunting on behalf of anglers and hunters. The Fish and Game New Zealand website is www.fishandgame.org.nz
Big-game fishing. The warm waters off the east coast of the North Island provide some of the best surf, line and spear fishing in the world. The main bases for line fishing from charter boats are at Whangaroa, Bay of Islands (Russell, Otehei Bay and Waitangi), Tutukaka, Mercury Bay (Whitianga) and Tauranga (Mayor Island). The most-prized catches are broadbill, black marlin, striped marlin and blue marlin, while other types of big-game fish found in New Zealand waters are tiger shark, hammerhead shark, mako shark, thresher shark, kingfish (yellow tail) and tuna. Best catches are usually made in February, but fishing is good from December to April.
Shooting and hunting. New Zealand's principal game birds are duck, swan, pheasant, quail, geese and chukor. The season traditionally starts on the first weekend in May and usually extends for six to eight weeks for most species, depending on the region. Special seasons for paradise shelduck and geese are run on a regional basis. Game bird hunting is managed by Fish and Game New Zealand and a licence is required to hunt game birds. Daily bag limits apply in most regions. Deer of several species, chamois, thar, wild pigs, goats and wallaby are numerous in several areas. There are few restrictions on big-game hunting and generally speaking there is no limit on the number of big-game animals that can be taken. Permits are required to hunt in some areas. The season is open for most species all year round. For tourists and inexperienced hunters, the service of an experienced guide is recommended.
Skiing and snowboarding. The skiing and snowboarding season in New Zealand extends from June to late October/early November, with many ski areas in both the North and South Island having snow-making equipment to ensure reliable snow depth and quality. New Zealand has 14 commercial ski areas, 10 club ski fields, one commercial cross-country ski area and a commercial indoor ski slope at Albany. In the North Island, the main snow sports centre is Mt Ruapehu in the Tongariro National Park. There are two commercial ski areas, Whakapapa and Turoa, and one club field, Tukino. The Maunganui Ski Club operates on Mt Taranaki or Egmont. In the South Island, the commercial ski areas are Coronet Peak, The Remarkables, Cardrona, Treble Cone, Snow Park and Snow Farm (Queenstown/Wanaka); Ohau, Mt Dobson and Round Hill (Aorangi); Porter Heights, Mt Hutt and Mt Lyford (Canterbury). There are eight club fields in the South Island. The Snow Farm, on the Pisa Range near Queenstown/Wanaka, offers 50 kilometres of cross-country skiing. Glacier skiing on the Tasman and Fox Glaciers, with access via ski-planes and helicopters, is also available, while guided heli-skiing and ski touring gives access to the Ben Ohau Ranges, the Harris Mountains, the Two Thumb Range, the Aoraki/Mt Cook/Tasman Glacier area, Mt Hutt and Queenstown in the South Island. The International Ski Federation has sanctioned annual international snow sports competitions at Mt Hutt, Whakapapa, Coronet Peak, Cardrona and Turoa.
Tramping. The closeness of mountains and forests to the main centres of population in New Zealand gives the opportunity for adventures away from civilisation. In the Waitakere and Hunua Ranges, near Auckland, in the many national and forest parks and reserves of the North Island, and through the extensive parks and protected natural areas of the South Island, there are many tracks through beautiful scenery. Tramping tracks range from half-day, family-oriented walks to challenging tramps in back-country and alpine isolation. The Great Walks are New Zealand's most famous tramping tracks. They include Lake Waikaremoana, Urewera National Park; Tongariro northern circuit, Tongariro National Park; Abel Tasman Coastal Track, Abel Tasman National Park; Heaphy Track, Kahurangi National Park; Routeburn Track, Mt Aspiring and Fiordland National Parks; Milford and Kepler Tracks, Fiordland National Park; and Rakiura Track, Rakiura National Park. Most of these tracks take two to four days to complete and are well marked. Huts and campsites are provided for overnight accommodation. The Abel Tasman Coastal Track is the most popular, with about 30,000 overnight visitors a year. Information on tramping is available through commercial guiding companies and the Department of Conservation.
Walking. New Zealand's walkways system offers walking opportunities over primarily private land and is a complementary system to the network of back-country tramping tracks. Walkways vary from half-hour walks to four or five days for the St James Walkway in North Canterbury. In addition to walkways, government agencies and local authorities develop and maintain public walking tracks throughout New Zealand.
Cycling. Bike NZ Inc represents the interests of several cycling organisations, including Cycling New Zealand, Mountain Bike NZ, BMX New Zealand, Cycling Advocates Network, the Masters Cycling Association and the Schools Cycling Association. Bike NZ Inc is affiliated to international cycling body UCI and has an affiliated membership of approximately 5,000 athletes and officials. This figure does not include those taking part in school competitions.
Mountaineering. New Zealand provides a superb environment for mountaineering. Its mountains are a dominant feature of the landscape, with both islands providing opportunities for climbers of all abilities. The South Island is well known for its spectacular Southern Alps, forming the backbone of the island. The alps offer an impressive selection of challenging climbs, with 19 peaks more than 3,000 metres high – including Aoraki/Mt Cook, at 3,754 metres New Zealand's highest mountain. Most mountain tracks can be walked year-round, although some of the high altitude tracks in the South Island are restricted by winter weather. Commercial guides are available and specialist companies run courses covering a range of climbing experiences. The climbing season is generally November to March, but for experienced climbers the winter months can also produce extended calm, fine spells.
Racing is a long-established sport in New Zealand, with a tradition stretching back to colonial times. Today it is a major industry within the New Zealand economy and an important component of the entertainment sector.
Racing generates more than $1.5 billion a year and creates approximately 18,300 full-time jobs, generating more than $679 million in salaries and wages.
There are 68 thoroughbred, 48 harness and 12 greyhound clubs licensed to race in New Zealand and 69 racecourses.
In the racing year from 1 August 2004 to 31 July 2005, 297 gallops, 226 harness and 274 greyhound races were scheduled, attended by 1.04 million patrons.
The bloodstock industry is of international importance to New Zealand, with the export of horses -mainly to Australia and Asia – worth around $130 million a year. New Zealand-bred runners compete very well overseas and regularly win major races.
A major source of funding for the racing industry is returns from betting on racing and sports, which is conducted by the Totalisator Agency Board, the retail arm of the New Zealand Racing Board.
New Zealand Racing Board. The New Zealand Racing Board controls all racing and betting in New Zealand. The board was set up under the Racing Act 2003 to bring together the running of betting on racing and sports in New Zealand and stewardship of the New Zealand racing industry. The board is the coordination point for:
The Totalisator Agency Board (TAB), which runs all betting on racing and sport in New Zealand.
The three racing codes, New Zealand Thoroughbred Racing (gallops), Harness Racing New Zealand (trotting and pacing) and New Zealand Greyhound Racing (greyhounds).
The Judicial Control Authority, the legal body that administers the rules of racing and conducts inquiries into breaches of the rules for all three codes.
The board is charged under statute to operate the industry to the benefit of these organisations and the thousands of people who derive their livelihood from it. Responsibilities of the board under the act are to run the TAB, to maximise betting profits for the long-term good of New Zealand racing and to promote the racing industry.
Totalisator Agency Board. The New Zealand Racing Board's income comes from Totalisator Agency Board (TAB) betting revenue. The TAB is a nation-wide operation that includes a network of retail outlets, betting services at racecourses, phone betting services, a wagering website and betting via digital television. Outlets offer a wide range of totalisator and fixed odds betting products. The TAB also runs a television channel and a radio station dedicated to races and racing information. Just over 80 percent of the betting dollar is returned to the customer. The rest is returned to the racing and sporting codes, after tax and racing board costs. In the 2004/05 racing year, $82.1 million was returned to the racing industry and $1.8 million to New Zealand sporting bodies.
Table 13.01 shows expenditure on gaming, including racing, lotteries commission products, gaming machines and casinos, from 1980 to 2004.
The Gambling Act 2003 came fully into force on 1 July 2004. Its purpose is to:
Facilitate and control the growth of responsible gambling.
Prevent and minimise the harm caused by gambling, including problem gambling.
Authorise some gambling and prohibit the rest.
Ensure the integrity and fairness of games.
Limit opportunities for crime or dishonesty.
Ensure profits from gambling benefit the community.
Facilitate community involvement in decisions about the provision of gambling.
All of the act's objectives relate to harm prevention and/or harm minimisation in some way.
The act adopts a risk-based approach to gambling regulation in that it is harder to get licences to operate forms of gambling that are more harmful, and there are additional obligations imposed in relation to those forms. Harm is defined in the act as harm or distress of any kind, including personal, social or economic harm which arises from, is caused or exacerbated by, a person's gambling.
The Department of Internal Affairs is responsible for licensing, auditing, reporting and other controls on gaming machines in pubs and clubs to ensure that profits go to community groups.
Territorial authorities (i.e. city and district councils) control the number of gaming machines in their area and decide the location of venues.
Problem gambling is recognised as a public health issue and the sector is required to pay a levy to cover the cost of a problem gambling strategy.
The Gambling Act established a gambling commission, which has an appeal function and a role in regulating casinos. The act prohibits any new casino licences being issued and prevents existing casinos from expanding their gambling operations.
The New Zealand Lotteries Commission (NZLC) is responsible for promoting and conducting New Zealand lotteries. Net profits from NZLC games are distributed to arts, sports, charitable and community causes by the New Zealand Lottery Grants Board.
In the year ending 30 June 2004, the NZLC transferred $118.45 million to the grants board, compared with $107.8 million in the previous year.
For every dollar spent on lotteries, 55 cents is paid in prizes, 21 cents is transferred to the grants board. 11 cents is paid in taxes, 7 cents is paid in retail commission and 6 cents covers operating costs.
In the year ending 30 June 2004, sales were $628.8 million. Of this, $333.7 million became payable in prizes, $118.45 million was transferred to the grants board, tax paid was $66.2 million and $44.1 million was paid in retail commission. Operating expenses for the year totalled $41.9 million after allowing for transfers to the Prize Reserve Fund.
New Zealand Lottery Grants Board. The purpose of the New Zealand Lottery Grants Board Te Puna Tahua, governed by the Gambling Act 2003, is to benefit the New Zealand community by distributing profits of state lotteries run by the New Zealand Lotteries Commission. It does this through a system of distribution agencies and committees that support a wide range of community purposes. Social, community, arts, heritage, sport, recreation and health research services and projects are funded through 18 lottery distribution committees and three statutory bodies, Creative New Zealand, the New Zealand Film Commission and Sport & Recreation New Zealand. The board has six members, including three community members appointed by the governor-general. The Minister of Internal Affairs chairs the board, which also includes representatives of the prime minister and the leader of the opposition.
The Gambling Act 2003 prohibits any new casino licences being issued and prevents existing casinos from expanding their gambling operations.
Table 13.02 shows allocation of lottery profits from 1998 to 2006.
Table 13.02. Allocation of lottery profits
Years
ending 30 June
| Recipient | 1998 | 1999 | 2000 | 2001 | 2002 | 2003 | 2004 | 2005 | 2006 |
|---|---|---|---|---|---|---|---|---|---|
1Pacific Provider Development Fund - nil or zeroNote: Figures may not add to stated totals due to rounding. Source: New Zealand Lottery Grants Board | |||||||||
| $(million) | |||||||||
| Creative New Zealand | 20.25 | 20.25 | 20.31 | 20.31 | 20.31 | 18.55 | 18.55 | 18.55 | 18.60 |
| Arts Foundation | - | 1.00 | 1.00 | 0.10 | 1.00 | 0.91 | 0.91 | - | - |
| SPARC (Hillary Commission) | 27.00 | 27.00 | 27.08 | 27.08 | 27.08 | 24.74 | 24.74 | 24.74 | 28.22 |
| High performance sports | 3.72 | 3.78 | 3.81 | 3.81 | 3.81 | 3.48 | 3.48 | 3.48 | - |
| NZ Film Commission | 8.78 | 8.78 | 8.80 | 8.80 | 8.80 | 8.04 | 8.04 | 8.04 | 8.10 |
| NZ Film Archives | 0.67 | 0.68 | 0.68 | 0.65 | 0.65 | 0.59 | 0.59 | 0.59 | 0.60 |
| Total | 60.41 | 61.48 | 61.68 | 60.75 | 61.65 | 56.32 | 56.32 | 55.40 | 55.52 |
| National community committees | - | - | - | - | - | - | - | 10.8O | 10.80 |
| Outdoor Safety Committee | - | - | - | - | - | - | - | 6.00 | 6.65 |
| Regional community committees | - | - | - | - | - | - | - | 15.02 | 17.81 |
| Environment and heritage | 8.50 | 8.00 | 7.45 | 7.19 | 6.63 | 5.49 | 5.49 | 6.63 | 7.35 |
| Marae heritage and facilities | 6.00 | 6.00 | 6.00 | 5.79 | 4.99 | 4.14 | 4.14 | 4.99 | 5.53 |
| Health research | 3.50 | 3.45 | 3.22 | 3.11 | 2.31 | 1.91 | 1.91 | 2.31 | 2.56 |
| Individuals/disabilities | 3.20 | 3.20 | 3.20 | 3.20 | 3.20 | 3.03 | 3.03 | 3.20 | 3.55 |
| Minister's Fund | 0.28 | 0.28 | 0.28 | 0.35 | 0.10 | 0.08 | 0.15 | 0.15 | 0.15 |
| Lottery Community PPDF1 | - | - | - | - | - | - | - | - | 0.20 |
| Lottery General PPDF1 | - | - | - | - | 0.50 | 0.41 | 0.41 | - | - |
| Community facilities | 12.00 | 11.40 | 10.62 | 10.25 | 9.44 | 4.49 | - | - | - |
| Lottery general | 13.80 | 12.50 | 11.03 | 10.93 | 9.40 | 5.12 | 5.58 | - | - |
| Museum of New Zealand | 1.25 | 1.25 | 1.25 | 1.25 | - | - | - | - | - |
| Compulsive gambling | 1.46 | 0.80 | 0.95 | 0.32 | 0.62 | 0.59 | 0.60 | - | - |
| Drug Education Fund | 1.00 | 0.70 | 0.40 | - | - | - | - | - | - |
| International Year of Volunteers | - | - | - | 0.50 | 0.25 | - | - | - | - |
| Millennium subcommittee | 2.00 | 2.00 | 4.00 | - | - | - | - | - | - |
| Science research | 1.00 | - | - | - | - | - | - | - | - |
| Lottery Seniors | 3.40 | 3.60 | 3.12 | 3.12 | 3.12 | 2.96 | 2.96 | - | - |
| Lottery Welfare | 12.00 | 11.90 | 11.08 | 11.08 | 11.08 | 10.51 | 10.51 | - | - |
| Lottery Youth | 5.00 | 5.60 | 5.22 | 5.22 | 5.22 | 4.95 | 4.95 | - | - |
| Total | 74.39 | 70.68 | 67.82 | 62.31 | 56.86 | 43.68 | 39.74 | 49.10 | 54.60 |
| Grand total | 134.80 | 132.16 | 129.50 | 123.06 | 118.51 | 100.00 | 96.05 | 104.50 | 110.12 |
Gambling Commission. The Gambling Commission was established under the Gambling Act 2003. Main functions of the commission are to:
Consider and determine applications for casino operators’ licences and the renewal of casino venue licences.
Approve agreements and changes to agreements between casino operators and casino venue licence holders.
Consider and deal with complaints about the way the Department of Internal Affairs has handled complaints in relation to Class 4 gambling.
Specify, vary and revoke casino licence conditions.
Advise ministers and facilitate consultation on setting of the problem gambling levy.
Consider and determine appeals against regulatory and licensing decisions made by the Department of Internal Affairs.
Problem gambling. Gambling-related harm has emerged worldwide as a significant social and health issue. New Zealand has seen a marked increase in the consumption of gambling products and player losses in recent years, with a parallel increase in the number of people seeking help for problem gambling. This has produced an increased awareness of the risk of gambling-related harm to various population groups, including Māori, Pacific and Asian people and women. On 1 July 2004, the Ministry of Health assumed responsibility for funding and coordinating services and activities pertaining to gambling-related harm. The Strategic Plan for Preventing and Minimising Gambling Harm 2004–2010 includes primary prevention and population approaches, through to more selected intervention services for individuals, their families and significant others. The services are funded through a levy on gaming operators.
As well as its landscape and its sense of adventure, New Zealand has become internationally renowned for its distinctive culture and people.
As a land at the edge of the Pacific, New Zealand's positioning is an attraction that has made tourism one of the country's biggest foreign exchange earners.
New Zealand has become internationally renowned for its landscape, for its sense of adventure and for its distinctive culture and people.
Traditionally, international tourists have been drawn to New Zealand to experience unpolluted air and water, open spaces and unique flora and fauna.
Today, however, as well as these traditional attractions, the international traveller is looking for adventure, sophistication and cultural activity.
New Zealand's tourism product has developed to meet these needs.
Recognition of the fact that New Zealand is a small player in the global tourism market and the importance of sustainability, resulted in a group consisting of the tourism industry, local and central government, Māori and conservation interests joining together to formulate the New Zealand Tourism Strategy 2010.
This document has far-reaching implications for the structure of the tourism industry and should ensure the sustainability of the industry into the future.
The tourism market. The term ‘New Zealand tourism’ describes a market that caters for international travellers and New Zealanders. The tourism industry meets their needs, providing, among other things, accommodation, food, tours, activities and transport. A tourist includes anyone travelling for pleasure, business or education. Tourism is an important source of income for New Zealand, so it is imperative the industry works together to provide a rewarding experience for travellers. New Zealand has two government-funded tourism organisations: Tourism New Zealand and the Ministry of Tourism. Tourism New Zealand is the marketing agency, and works with the tourism industry to take a cohesive, coordinated approach to marketing New Zealand overseas.
Attractions. It is not only New Zealand's landscape, but its people, its culture and its sense of adventure that attract overseas visitors. Visitors to New Zealand discover an island nation full of drama and discovery – a land of spiritual places where they can feel free. New Zealand's culture has come of age as a form of Pasifika, with a new wave of thinking reflecting this. This is evidenced by New Zealand's culinary culture and sport, and its contemporary and wearable art all taking a distinctly New Zealand flavour. New Zealanders themselves are also part of what makes up the attraction to New Zealand and completes the visitor experience. Ingenious, passionate, inspiring yet straightforward people, New Zealanders are famous for looking at things in new ways and doing things with an attitude and an eye for adventure. These adventures are world-renowned for being innovative and intense. With a breathtaking landscape and an adventurous soul, Kiwis have a love of exploring new ways to be touched by nature – inventing the ski plane and the jet boat, and popularising activities such as bungy jumping.
Events. Sporting and cultural events, such as wine, food, art and flower festivals, Māori cultural competitions, triathlons, fashion events and rugby matches put New Zealand in the international spotlight, and, together with conferences and conventions, help to promote New Zealand as a tourist destination.
The Tourism Strategy Group, made up of representatives from the tourism industry, local and central government, Māori and conservation interests, in May of 2001 released the New Zealand Tourism Strategy 2010, a 10-year strategy for sustainable tourism development.
Development of the document was driven by the strong growth in tourism in New Zealand in the preceding 10 years and the need to ensure that this growth continued without risking the integrity of communities, the environment, the economy, or the cultures that exist within New Zealand.
A review of the strategy's implementation was undertaken by the Ministry of Tourism and other stakeholders two years after its inception. The review demonstrated areas in which progress had been made and highlighted challenges still to be faced. Significant advances made to date, include:
Structure and alignment – The Ministry of Tourism was formed on 1 January 2002. Regional tourism organisations created Regional Tourism Organisations New Zealand to enhance collective activity, ensure consistency and raise capability among members. Several additional Māori regional tourism groups have been formed since the strategy's release. There is greater alignment of agencies and goals, roles have been clarified, inter-agency communication has been enhanced and funding in a number of areas has been boosted.
Quality – Qualmark has been expanded and repositioned as New Zealand tourism's official quality mark. The visitor information network has been upgraded and rebranded as i-SITE. Toi IhoTM has been developed and strengthened as the trademark to promote authentic, quality Māori arts and crafts.
Marketing – Tourism New Zealand continues to promote New Zealand through its 100% Pure campaign and to conduct research into New Zealand's target market.
Sustainability and the environment – A study of tourism demands on, and financial contribution to, local water and sewerage infrastructure is continuing. The Ministry of Tourism is working closely with the Ministry for the Environment, the Department of Conservation and other agencies on a number of environment-related issues.
Capability – The Tourism Industry Association of New Zealand (TIANZ) has made a substantial effort to support members in adopting business best practice across their operations. TIANZ is also working with training and educational agencies to ensure that New Zealand is able to produce the skills the tourism industry will need in the next decade. The Tourism Research Council New Zealand (TRCNZ) has cemented its position as the central point of access for quality information, research and forecasts.
The Ministry of Tourism, in partnership with other stakeholders, will continue to drive implementation of the strategy's recommendations.
Tourism New Zealand. Tourism New Zealand is responsible for the coordinated marketing and promotion overseas of New Zealand as a tourist destination. Tourism New Zealand's objective is to ensure that New Zealand is developed and marketed as a tourism destination to maximise the long-term benefits to New Zealand.
Tourism New Zealand's marketing campaign, introduced in 1999, works on the basis of a single, concise brand position across all its offshore markets – a truly global marketing campaign.
Tourism New Zealand works with the tourism industry to develop quality systems, new tourism products and on international marketing to encourage international visitors to come now, do more and come back again. Tourism New Zealand maintains a network of offices in Sydney, Bangkok, Mumbai, London, Los Angeles. New York, Tokyo, Osaka, Singapore and Shanghai, and has general service agents in Taipei, Seoul and Johannesburg.
Tourism Industry Association New Zealand. The Tourism Industry Association New Zealand (TIA) is the largest representative body of tourism operators in the country. It is the champion and advocate for those who deliver the visitor experience in New Zealand. The tourism industry in New Zealand is diverse in size and location, but TIAs aim is to use the industry's collective strength to create the world's best environment for tourism. TIA is a membership-based, independent organisation representing more than 2,000 businesses and organisations – from small operators through to large companies – who collectively represent 85 percent of the country's tourism turnover.
Established in 1953 as the New Zealand Travel and Holiday Association, the functions of TIA have evolved as the New Zealand tourism industry has increased in economic importance. The organisation champions the interests of its members with government and other decision makers. It builds partnerships between the tourism industry, government and key stakeholders, and works with all organisations involved in tourism.
TIA also provides resources and information to assist members build and maintain successful businesses. TIA manages New Zealand's three major national tourism industry events each year -the Tourism Industry Conference, the Tourism Industry Awards and TRENZ (Tourism Rendezvous New Zealand), New Zealand's largest annual international business event.
The Tourism Industry Association New Zealand website is www.tianz.org.nz
Many other government agencies are involved in the tourism sector.
New Zealand Customs and the Ministry of Agriculture and Forestry's quarantine service screen all visitors entering New Zealand to ensure that no prohibited or restricted materials are brought into the country.
Statistics New Zealand is a key provider of data needed for the management of tourism.
New Zealand Police investigate crimes committed by or against visitors and the Foundation for Research, Science and Technology allocates funds for tourism research.
The number of tourists visiting New Zealand from the United Kingdom in 2005 was boosted by the rugby tour of the British and Irish Lions.
Tourism is an important industry throughout the world, with the World Tourism Organisation reporting that the total number of travellers exceeded 800 million for the first time in 2005.
Since 2002, New Zealand has hosted more than 2 million international visitors each year.
In the 20 years up to 2005. the proportion of international visitors travelling to New Zealand for a holiday dropped – from almost 60 percent in 1986 to 51 percent in 2005. The proportion of visitors coming to stay with friends and relatives increased in the same period, from 20 to 29 percent.
Table 13.03 shows the number of international visitors to New Zealand, by reasons for visit, from 1986 to 2005.
Tourism is an important foreign exchange earner for New Zealand, with international tourism revenue rising from $4.7 billion in 1999 to $7.4 billion in 2004.
The Tourism Satellite Account, compiled by Statistics New Zealand, measures the contributions international and domestic tourism make to the New Zealand economy. The account estimated that international tourism expenditure was $7.44 billion (18.5 percent of total export earnings) for the year ending 31 March 2004. Direct tourism value added was $6.2 billion, or 4.9 percent of New Zealand's total industry contribution to gross domestic product.
An estimated 103,000 full-time equivalent employees were directly engaged in producing goods and services purchased by tourists in the year ending 31 March 2004. This is equal to 5.9 percent of total employment in New Zealand.
Total tourism expenditure in New Zealand increased from $12.1 billion in 1999 to $17.2 billion in 2004.
As well as being a popular holiday destination, New Zealand is also chosen by many overseas students as a place to study. International student expenditure added $688,000 to total international tourism expenditure in 2004.
Tourism New Zealand's website, www.purenz.com, is New Zealand's ‘voice’ on the world wide web and is of increasing importance to New Zealand's international marketing. As a comprehensive consumer website, the site features travel journals, planning tips, accommodation, activities and transport and gives potential visitors to New Zealand an insight into the country.
Tourism New Zealand also has a corporate website, www.tourisminfo.govt.nz, which contains helpful information for visitors, tourism research, data and publications.
The Tourism Research Council of New Zealand's website, www.trcnz.govt.nz, brings together tourism information and is a repository for tourism statistics collected from a number of sources.
Tourism Satellite Account figures, and other tourism sector information, are available on Statistics New Zealand's website, www.stats.govt.nz
Table 13.03. International visitors
By reasons
for visit
Years ending 31
March
| Year | Holiday | Stay with friends and relatives | Business | Other1 | Total2 |
|---|---|---|---|---|---|
1Includes conferences and conventions, work and working holidays, education, medical, stopover and unspecified. 2Sum of individual sampled counts. Source: Statistics New Zealand | |||||
| 1986 | 404,036 | 140,481 | 74,661 | 69,895 | 689,073 |
| 1987 | 441,081 | 157,619 | 76,087 | 88,422 | 763,209 |
| 1988 | 455,834 | 194,932 | 88,215 | 116,511 | 855,492 |
| 1989 | 439,249 | 207,333 | 100,224 | 120,716 | 867,522 |
| 1990 | 464,545 | 224,875 | 109,110 | 134,901 | 933,431 |
| 1991 | 491,591 | 238,034 | 103,899 | 133,538 | 967,062 |
| 1992 | 519,274 | 245,845 | 106,238 | 128,357 | 999,714 |
| 1993 | 593,415 | 255,149 | 114,183 | 123,810 | 1,086,557 |
| 1994 | 702,945 | 272,507 | 121,925 | 115,941 | 1,213,318 |
| 1995 | 773,379 | 282,565 | 139,221 | 147,838 | 1,343,003 |
| 1996 | 811,194 | 319,350 | 156,018 | 155,276 | 1,441,838 |
| 1997 | 860,208 | 354,226 | 163,976 | 172,931 | 1,551,341 |
| 1998 | 765,077 | 355,260 | 173,629 | 170,800 | 1,464,766 |
| 1999 | 766,897 | 392,296 | 179,661 | 178,470 | 1,517,324 |
| 2000 | 841,033 | 431,312 | 196,784 | 179,859 | 1,648,988 |
| 2001 | 973,760 | 482,268 | 203,290 | 189,136 | 1,848,454 |
| 2002 | 1,009,814 | 515,211 | 206,465 | 224,048 | 1,955,538 |
| 2003 | 1,086,051 | 521,956 | 216,884 | 236,241 | 2,061,132 |
| 2004 | 1,105,344 | 601,803 | 224,061 | 230,091 | 2,161,299 |
| 2005 | 1,208,329 | 676,027 | 249,164 | 233,871 | 2,367,391 |
Table 13.04 shows international visitor spending in 2004 by country of origin.
Table 13.04. International visitor spending
Year
ending 31 December 2004
| Country of last permanent residence | Total foreign exchange earnings (excluding international airfares) | Average expenditure per person per visit | Average expenditure per person per day |
|---|---|---|---|
| Source: Ministry of Tourism | |||
| $ (million) | $ | $ | |
| Japan | 649 | 4,056 | 161 |
| United States | 611 | 3,083 | 170 |
| Hong Kong | 124 | 4,684 | 225 |
| Malaysia | 98 | 4,262 | 156 |
| Taiwan | 87 | 3,428 | 96 |
| Singapore | 74 | 2,677 | 136 |
| Netherlands | 141 | 4,688 | 113 |
| Canada | 130 | 3,371 | 97 |
| Australia | 1,437 | 1,867 | 146 |
| China | 409 | 4,883 | 147 |
| United Kingdom | 887 | 3,335 | 115 |
| Thailand | 65 | 3,995 | 95 |
| Nordic countries | 109 | 3,441 | 110 |
| Germany | 199 | 3,644 | 95 |
| South Korea | 325 | 3,281 | 148 |
| Switzerland | 49 | 3,969 | 101 |
| Other Central Europe | 214 | 3,685 | 104 |
| Other South-east Asia | 41 | 2,853 | 86 |
| Other countries | 647 | 2,990 | 91 |
| Total | 6,298 | ||
Nearly 2.4 million overseas visitors arrived in New Zealand in the year ending 31 March 2005, an increase of 10 percent on the previous year.
The number of countries from which overseas visitors originate has grown in recent years, with around 200 represented in 2005. Seven of these countries – Australia, the United Kingdom, the United States, Japan, Korea, China and Germany – contributed three quarters of the visitors.
Table 13.05 shows the country of last permanent residence of New Zealand's international visitors from 2003 to 2005.
Table 13.05. International visitors1
By country of last permanent
residence
Years ending 31
March
| Country of last permanent residence | 2003 | Year 2004 | 2005 |
|---|---|---|---|
1Intended length of stay in New Zealand less than 12 months. 2Includes unspecified. 3Actual counts. These may differ from summed country data. Source: Statistics New Zealand | |||
| Australia | 638,354 | 743,388 | 875,337 |
| United Kingdom | 240,029 | 276,372 | 293,554 |
| United States | 205,796 | 209,516 | 220,004 |
| Japan | 172,716 | 150,215 | 163,293 |
| Korea, Republic of | 115,317 | 114,101 | 112,676 |
| China, People's Republic of | 79,766 | 64,402 | 84,226 |
| Germany | 50,441 | 54,906 | 57,233 |
| Canada | 39,670 | 39,609 | 41,627 |
| Singapore | 33,752 | 32,882 | 32,586 |
| Hong Kong | 26,658 | 27,158 | 28,006 |
| Taiwan | 34,800 | 24,889 | 27,562 |
| Netherlands | 27,085 | 26,065 | 25,916 |
| Malaysia | 22,490 | 23,775 | 24,508 |
| Thailand | 24,315 | 18,474 | 20,337 |
| Ireland | 14,290 | 15,874 | 18,204 |
| Fiji | 15,863 | 15,488 | 18,149 |
| French Polynesia | 17,062 | 17,695 | 17,541 |
| France | 14,087 | 15,073 | 16,367 |
| India | 16,956 | 14,639 | 16,359 |
| South Africa | 15,481 | 16,296 | 15,848 |
| Switzerland | 16,111 | 15,229 | 14,974 |
| Samoa | 13,672 | 15,124 | 14,710 |
| Sweden | 12,966 | 12,390 | 13,014 |
| Tonga | 10,074 | 10,079 | 10,495 |
| New Caledonia | 8,475 | 9,701 | 10,323 |
| Denmark | 8,393 | 9,237 | 9,461 |
| Cook Islands | 7,932 | 8,554 | 8,968 |
| Indonesia | 8,227 | 8,821 | 7,855 |
| Italy | 9,219 | 6,770 | 7,346 |
| Israel | 6,962 | 6,470 | 6,888 |
| Austria | 5,074 | 5,213 | 6,665 |
| Spain | 5,252 | 5,411 | 6,334 |
| Brazil | 5,495 | 5,526 | 6,252 |
| Philippines | 4,991 | 4,554 | 5,666 |
| Belgium | 4,059 | 4,100 | 4,711 |
| United Arab Emirates | 2,593 | 3,579 | 4,273 |
| Norway | 4,225 | 4,175 | 4,028 |
| Other2 | 122,484 | 125,549 | 116,095 |
| Total3 | 2,062,423 | 2,163,427 | 2,387,663 |
Transport. In the year ending 31 March 2005, an estimated 28 percent of all international visitors aged 15 and over took a domestic air trip at some stage of their New Zealand visit; 20 percent took a coach tour; 20 percent used a ferry; and 6.5 percent used a train.
Accommodation. A wide range of accommodation is available in New Zealand. Tourism New Zealand supports third-party endorsed quality accreditation of tourism products in New Zealand. Qualmark New Zealand Ltd has developed a comprehensive independent rating system for assessing hotels, self-contained and serviced accommodation, holiday parks and backpacker accommodation. Qualmark's website is www.qualmark.co.nz. Statistics New Zealand's Accommodation Survey showed that in the month of September 2005, 37 percent of travellers stayed in motels, motor inns or apartments; 35 percent in hotels and resorts; 15 percent in caravan parks or camping grounds; 12 percent in backpacker accommodation or hostels; and 1 percent in hosted accommodation.
Table 13.06 shows the use made of various accommodation types.
Table 13.06. Commercial accommodation use1,2
Years
ending 31 March
| Accommodation type | 2002 | 2003 | 2004 | 2005 |
|---|---|---|---|---|
1Excludes establishments temporarily closed for more than 14 days during a month. 2Excludes establishments primarily offering accommodation for one month or more. 3Includes private hotels, guest houses, bed and breakfasts and homestays. Note:Figures may not add to slated totals due to rounding. Source: Statistics New Zealand | ||||
| Hotels/resorts | ||||
| Number of establishments | 576 | 579 | 547 | 567 |
| Capacity (stay unit nights) (000) | 9,817 | 10,049 | 10,155 | 10,358 |
| Guest nights (000) | 8,822 | 9,346 | 9,341 | 9,861 |
| Occupancy rate (percent) | 54.7 | 56.7 | 56.2 | 58.2 |
| Average stay (nights) | 1.8 | 1.8 | 1.8 | 1.8 |
| Motels/motor inns/apartments | ||||
| Number of establishments | 1,600 | 1,626 | 1,630 | 1,683 |
| Capacity (stay unit nights) (000) | 8,631 | 8,791 | 8,990 | 9,230 |
| Guest nights (000) | 9,535 | 9,840 | 10,336 | 10,677 |
| Occupancy rate (percent) | 53.8 | 54.7 | 56.1 | 56.7 |
| Average stay (nights) | 1.8 | 1.8 | 1.8 | 1.8 |
| Hosted accommodation3 | ||||
| Number of establishments | 630 | 624 | 519 | 626 |
| Capacity (stay unit nights) (000) | 1,086 | 1,104 | 990 | 1,037 |
| Guest nights (000) | 522 | 541 | 538 | 564 |
| Occupancy rate (percent) | 27.2 | 27.6 | 30.4 | 29.5 |
| Average stay (nights) | 1.9 | 1.9 | 1.9 | 1.8 |
| Backpackers/hostels | ||||
| Number of establishments | 315 | 318 | 343 | 410 |
| Capacity (stay unit nights) (000) | 6,012 | 6,351 | 6,702 | 7,687 |
| Guest nights (000) | 3,126 | 3,441 | 3,693 | 4,057 |
| Occupancy rate (percent) | 46.8 | 48.8 | 49.7 | 47.2 |
| Average stay (nights) | 2.0 | 2.0 | 2.0 | 1.9 |
| Caravan parks/camping grounds | ||||
| Number of establishments | 425 | 414 | 399 | 411 |
| Capacity (stay unit nights) (000) | 19,018 | 18,676 | 18,350 | 18,762 |
| Guest nights (000) | 5,894 | 5,808 | 6,078 | 6,360 |
| Occupancy rate (percent) | 13.3 | 13.6 | 14.3 | 14.6 |
| Average stay (nights) | 2.2 | 2.1 | 2.1 | 2.1 |
| Total | ||||
| Number of establishments | 3,546 | 3,561 | 3,438 | 3,697 |
| Capacity (stay unit nights) (000) | 44,563 | 44,971 | 45,187 | 47,075 |
| Guest nights (000) | 27,899 | 28,976 | 29,986 | 31,519 |
| Occupancy rate (percent) | 35.1 | 36.6 | 37.6 | 38.1 |
| Average stay nights | 1.9 | 1.9 | 1.9 | 1.9 |
The increasing importance of tourism has led to a strong interest in the concept of sustainable tourism, both internationally and within New Zealand.
In order to be sustainable, tourism must provide satisfying and distinctive experiences for visitors and reasonable returns for investors.
It must also protect and develop the environmental, cultural and social values on which tourism depends.
Finally, it must be acceptable to host communities and provide them with real economic and social benefits.
Local government plays several vital roles in developing sustainable tourism. It is responsible for enforcing laws and rules associated with managing the effects of tourism. It contributes to the marketing of the region as a tourist destination. It must also plan for, and in some cases fund, much of the infrastructure on which tourism depends, ensuring that water supply and sewerage systems, roads and carparks can cope with additional demands.
Many natural areas enjoyed by visitors are managed by the Department of Conservation (DOC).
Private sector firms provide a variety of facilities or services for visitors, including ski fields, scenic flights and guiding services, to complement those provided by the department.
These firms must comply with strict statutory procedures, strategies and plans introduced to protect the natural and historical features of conservation areas and the recreational experiences of other visitors. Firms also pay concession fees, which help DOC protect conservation values.
13.1 Sport & Recreation New Zealand; New Zealand Olympic Committee; Statistics New Zealand; Fish and Game New Zealand; New Zealand Snowsports Council; Department of Conservation; Bike NZ Inc; New Zealand Racing Board; Totalisator Agency Board; New Zealand Lotteries Commission; New Zealand Lottery Grants Board; Department of Internal Affairs; Gambling Commission; Ministry of Health.
13.2 Tourism New Zealand; Statistics New Zealand; Tourism Industry Association New Zealand; Ministry of Tourism.
www.bikenz.org.nz – Bike NZ Inc
www.doc.govt.nz – Department of Conservation
www.dia.govt.nz – Department of Internal Affairs
www.fishandgame.org.nz – Fish and Game New Zealand
www.gamblingcom.govt.nz – Gambling Commission
www.nzlotteries.co.nz – New Zealand Lotteries Commission
www.olympic.org.nz – New Zealand Olympic Committee
www.nzracingboard.co.nz – New Zealand Racing Board
www.gosnow.co.nz – New Zealand Snowsports Council
www.moh.govt.nz – Ministry of Health
www.qualmark.co.nz – Qualmark New Zealand Ltd
www.sparc.govt.nz – Sport & Recreation New Zealand
www.stats.govt.nz – Statistics New Zealand
www.tab.co.nz – Totalisator Agency Board
www.tianz.org.nz – Tourism Industry Association New Zealand
www.trcnz.govt.nz – Tourism Research Council of New Zealand
www.tourism.govt.nz – Ministry of Tourism
www.tourisminfo.govt.nz – Tourism New Zealand
www.newzealand.com – Tourism New Zealand
Table of Contents
Statutory minimum entitlements applying to all New Zealand employees include a minimum wage for those aged 18 and over and a youth minimum wage for those aged 16 and 17.
New Zealand has a range of legislation dealing with the employment relationship, with the main framework set out in the Employment Relations Act 2000. Other employment legislation sets out minimum statutory conditions of employment, including minimum entitlements to wages and leave. Legislation is administered by the Department of Labour.
The Employment Relations Act 2000 has good faith as its central principle, requiring employers, employees and unions to deal with each other honestly and openly. Specifically, the act:
Promotes good employment relations and mutual respect and confidence among employers, employees and unions.
Sets the environment for individual and collective employment relationships.
Sets out requirements for negotiation of collective and individual employment agreements.
Provides prompt and flexible options for resolving problems in employment relationships.
Key objective of the act is to build productive employment relationships through promotion of mutual trust and confidence in all aspects of the employment environment and the employment relationship. In particular, the act aims to promote productive employment relationships by:
Recognising that employment relationships must be built on good faith.
Acknowledging and addressing the inherent inequality of bargaining power in employment relationships.
Promoting collective bargaining.
Protecting the integrity of individual choice.
Promoting mediation as the primary problem-solving mechanism, reducing the need for judicial intervention.
The act also aims to promote observance in New Zealand of the principles underlying International Labour Organisation Convention 87 on Freedom of Association and Convention 98 on the Right to Organise and Bargain Collectively.
The act affirms the right of employees to have the freedom to choose whether or not to form a union, or be a member of a union, for the purpose of advancing their collective employment interests.
Unions are legally recognised by the act, and collective agreements can be negotiated only between unions and employers.
In formally recognising the role of unions in promoting their members’ collective employment interests, the act views unions as providing a counterbalance to power imbalances in direct bargaining between employees and employers.
Minimal barriers to the formation of unions allow employees to form their own unions to represent their collective interests when bargaining, and provide protection to union and non-union members.
No one may, in relation to an employment issue, give any preference or apply any undue influence on another because that person is or is not a member of a union.
Union representatives are entitled to enter a workplace, within certain limitations, for purposes related to employment of union members or for purposes related to the union's business.
The act recognises that despite the requirement for all parties to an employment relationship to act in good faith, certain employment relationship problems will require specialised assistance and institutions to promote and restore productive employment relationships.
An underlying assumption of the Employment Relations Act 2000 is that if problems in employment relationships are to be resolved promptly, expert problem-solving support, information and assistance needs to be available at short notice. The act accordingly established the Mediation Service and the Employment Relations Authority, while maintaining the Employment Court.
Mediation Service. The Mediation Service is part of the Department of Labour and ensures that expert and flexible problem-solving assistance is available to assist parties at short notice. Mediation services are provided from offices in Auckland, Hamilton, Napier, Palmerston North, Wellington, Christchurch and Dunedin and staff involved can provide services in other locations. Mediation focuses on helping parties solve problems in a balanced and fair way. Once parties reach a settlement in mediation, they can agree to ask the mediator to sign it. Once signed, the settlement cannot be challenged and is enforceable in the Employment Relations Authority or the district court. If the employer and employee cannot reach agreement in mediation, they can agree, in writing, to the mediator making a final and binding decision, which, likewise, is enforceable in the authority or the court. If either or both parties do not want the mediator to make a decision, the problem may be taken to the authority. Employees and employers can reach a settlement without using mediation and make it binding by having the written settlement signed by a mediator. Once the settlement is certified, it is enforceable in the authority or the court. In the year ending 30 June 2005, the mediation service received 11,203 new application types, of which 9,649 were completed. Settlements were achieved in 3,844 cases, with a further 72 achieving partial settlement, while 1,371 were not settled. A further 2,634 recorded settlements were dealt with. Of the settlements achieved in mediation, 51 percent involved personal grievances alleging unjustified dismissal, while 27 percent involved personal grievances alleging disadvantage.
Employment Relations Authority. The Employment Relations Authority consists of the Chief of the Employment Relations Authority and 15 other members. The authority was established as an investigative body with the role of resolving employment relationship problems by establishing the facts and making a determination according to the substantial merits of the case, without regard to technicalities. The authority's jurisdiction includes:
Disputes about interpretation, application or operation of an employment agreement.
Matters relating to a breach of an employment agreement.
Making determinations of unresolved personal grievances.
Matters relating to registration of unions, such as whether a person is entitled to be a member of a union, or whether the rules of a union or a prospective union comply with provisions of the Employment Relations Act.
Any outstanding matters within jurisdiction of the former Employment Tribunal established under the repealed Employment Contracts Act 1991.
The authority is supported by the Department of Labour and operates from offices in Auckland, Wellington and Christchurch, although it can travel to other locations. Challenges to authority determinations can be taken to the Employment Court. In the year ending 30 June 2005, the authority received 3,282 application types, of which 2,410 were completed, with the authority making 730 determinations. Sixty-one percent of determinations involved personal grievances alleging unjustified dismissal, while 25 percent involved applications for recovery of wages. Compliance orders made up another 10 percent of determinations.
Employment Relations Service. The Employment Relations Service is increasingly moving towards a responsive focus using targeted education in key areas, such as conflict resolution, decision making and negotiation. Free training programmes endeavour to improve practices and systems within workplaces.
Statutory minimum entitlements apply to all employees. These include:
An adult minimum wage for employees aged 18 and over and a youth minimum wage for people aged 16 and 17.
Protection from unlawful deductions from wages.
Eleven paid public holidays, where the holiday would otherwise be a working day.
Time and-a-half payment for all employees who work on public holidays and, where the holiday would otherwise be a working day, arrangement for an alternative holiday to be taken.
Three weeks paid annual holiday after 12 months employment, changing to four weeks from 1 April 2007.
Paid parental leave and employment protection for employees on parental leave.
Equal pay for men and women doing substantially the same work.
Minimum wage. The Minimum Wage Act 1983 determines national minimum wages for adults and young people, below which wages cannot generally fall. The Minimum Wage Order 2006, effective from 27 March 2006, set the adult minimum wage for those aged 18 and over at $10.25 an hour. $82.00 for an eight-hour day and $410.00 for a 40-hour week. The youth minimum wage for people aged 16 and 17 is $8.20 an hour. $65.60 for an eight-hour day and $328.00 for a 40-hour week. Those not entitled to the minimum wage are those under the age of 16, people doing recognised industry training (undertaking at least 60 credits a year), holders of minimum wage exemptions (issued by the Department of Labour to those with recognised disabilities who are incapable of earning the minimum wage) and employees with disabilities in sheltered workshops. People doing recognised industry training are paid the minimum training wage.
Legislative changes. A review of the Holidays Act 1981 resulted in new legislation governing minimum entitlements to annual, sick and bereavement leave; arrangements for those who work on public holidays; and the calculation of holiday pay entitlements. The new legislation also introduced a minimum of four weeks annual leave for all employees, effective from 1 April 2007. A review of the Employment Relations Act's operation led to the Employment Relations Law Reform Bill, which aims to strengthen the act's key objectives of promoting good faith collective bargaining and effective resolution of employment relationship problems.
Hours of work. Hours are generally negotiated into employment agreements. However, the employer may not unilaterally impose more than 40 hours of work (exclusive of overtime) a week.
The Holidays Act 2003 contains minimum rights and obligations concerning annual leave and public holidays. These apply to employees whether they are full time, part time, permanent, casual or temporary. Employers and employees cannot contract out of the Holidays Act, but can agree to better terms and conditions.
Public holidays. Legislation ensures that all employees receive 11 paid public holidays as of right if they fall on days which would otherwise be working days for them. The statutory and public holidays are New Year's Day (1 January), 2 January (or another day in its place), Waitangi Day (6 February), Anzac Day (25 April), Good Friday, Easter Monday, Queen's Birthday, Labour Day, Christmas Day (25 December), Boxing Day (26 December) and the anniversary of the province where the employee is employed. Where employees work on a public holiday, and that public holiday falls on a day they would normally work, they are entitled to be paid at time and-a-half for the time they work, and to an alternative holiday. If it is not a normal holiday, the employee is entitled to be paid at time and-a-half, but is not given an alternative holiday. In the case of the Christmas/New Year period falling on either a Saturday or Sunday, the holidays are transferred to a Monday or Tuesday.
Table 14.01. Movable public holidays
| Holiday | 2007 | 2008 | 2009 |
|---|---|---|---|
1The Queen's actual birth date was 21 April 1926. Source: Statistics New Zealand | |||
| Good Friday | 6Apr | 21 Mar | 10 Apr |
| Easter Monday | 9 Apr | 24 Mar | 13Apr |
| Queen's Birthday1 | 4 Jun | 2 Jun | 1 Jun |
| Labour Day | 22 Oct | 27 Oct | 26 Oct |
Table 14.01 lists dates of movable public holidays in New Zealand for 2007–2009.
Annual holidays. After one year's continuous service with the same employer, an employee is entitled to three weeks paid annual leave. The employee must be given the opportunity to take at least two uninterrupted weeks holiday. Annual holidays are additional to public holidays. From 1 April 2007, employees will be entitled to four weeks paid annual holidays.
Parental leave. An employee may be entitled to up to 52 weeks leave for parental leave. There are several different types of parental leave, each with its own entitlements and requirements. Parental leave is available to employees having a child and to their partners and also to employees, male or female, adopting a child under five years of age. A certificate of pregnancy may be required by the employer to ensure eligibility for leave, or, in the case of adoption, a letter from Child, Youth and Family Services. To apply for parental leave under the act, an employee must have worked at least an average of 10 hours a week for the same employer for the preceding 6 or 12 months up to the expected date of delivery. Applications for parental leave should, in most cases, be made in writing at least three months before the expected date of delivery.
Sick and bereavement leave. Employees are entitled to sick and bereavement leave whether they are full time, part time, permanent, casual or temporary. On completion of six months employment with an employer, an employee is entitled to five days sick leave on pay for each subsequent 12 months of employment. Unused sick leave can be carried over, to a maximum of 20 days. Sick leave can be taken if an employee is sick, or if an employee's spouse, dependent child, or dependent parent of an employee or an employee's spouse is sick. In addition, after six months employment, an employee is entitled to paid bereavement leave. On the death of an employee's spouse, parent, child, sibling, grandparent, father-in-law or mother-in-law, the employee is entitled to three days paid leave. The employee is also entitled to one day of paid leave on any occasion on which the employer accepts that by reason of the death of any person, an employee has suffered a bereavement.
Under the Equal Pay Act 1972, employers cannot differentiate in pay rates between employees on the basis of their sex.
An equal employment opportunities (EEO) environment helps ensure employers tap the full potential of a diverse workforce. EEO principles are supported in New Zealand by antidiscrimination legislation.
Under the Human Rights Act 1993, an employer cannot discriminate in hiring, training, promoting or dismissing because of an employee's sex, marital status, religious or ethical belief, colour, race, ethnic or national origins, disability, age, political opinion, employment status, family status or sexual orientation.
Discrimination in terms and conditions of employment, training, promotion and dismissal because of an employee's colour, race, ethnic or national origins, sex, age, marital status, or religious or ethical belief, and sexual harassment, are also grounds for taking a personal grievance under the Employment Relations Act 2001.
The Equal Pay Act 1972 provides that employers cannot differentiate in pay rates between employees on the basis of their sex.
Employees may make a complaint under the Human Rights Act, or may use personal grievance procedures under the Employment Relations Act. to enforce their rights in cases of alleged discrimination or sexual harassment.
Where both procedures are available, the employee must choose one or the other.
Table 14.02 shows proportions of EEO groups in the public service and in the general labour force.
Table 14.02. EEO groups represented in the public service and the employed labour force
| EEO groups1, 2 | 1998 | 1999 | 2000 | 2001 | 2002 | 2003 | 2004 | 2005 | |
|---|---|---|---|---|---|---|---|---|---|
1Ethnicity data from 2000 to 2004 was revised in 2005 due to substantial amendments made by one department to its data. 2State Service Commission Human Resource Capability Survey of Public Service Departments as at 30 June 2005. 3Public service ethnicity data double-counts people with more than one ethnicity, so that a person who is Māori and Samoan will be counted as both Māori and Pacific peoples. The labour force figures shown, which are sourced from Statistics New Zealand's Household Labour Force Survey (HLFS), use a priority reporting system that has the effect of slightly reducing the figure for Pacific peoples. Asian figures are not available from the HLFS. The figures shown are a percentage of people whose ethnicity is known, rather than the total population. 4Labour force figures are based on the number of employees in the labour force (i.e. excluding self-employed). This provides a more direct comparator to employees in the public service. It is the same as the group used in the New Zealand Income Survey and various consultants’ reports which provide comparative wage and salary data. 5The collection of disability data in the public service is currently under review and disability statistics collected by the Human Resource Capability survey have not been published since 2002 because of concerns about data quality. The 2005 Career Progression and Development Survey indicates that the proportion of people who self-identified as having a disability was 7 percent, compared with 8 percent in the 2000 Career Progression and Development Survey. These figures are not comparable with Statistics New Zealand's figures because of different definitions and collection methods. ..figures not available Source: State Services Commission | |||||||||
| Ethnicity3 | Percent | ||||||||
| Māori | Public service | 15.5 | 16.1 | 16.9 | 17.0 | 17.6 | 17.6 | 17.4 | 17.5 |
| Employed labour force4 | 9.2 | 8.7 | 10.2 | 9.8 | 10.7 | 10.6 | 9.8 | 9.8 | |
| Pacific peoples | Public service | 5.9 | 6.2 | 6.6 | 6.6 | 6.8 | 7.1 | 7.1 | 7.3 |
| Employed labour force | 4.3 | 4.8 | 4.8 | 4.5 | 5.2 | 5.2 | 5.2 | 4.6 | |
| People with disabilities5 | Public service | .. | .. | .. | 18.5 | .. | .. | .. | .. |
| Employed labour force | .. | .. | .. | 14.6 | .. | .. | .. | .. | |
| Women | Public service | 54.5 | 56.3 | 56.2 | 56.5 | 57.5 | 57.8 | 59.0 | 59.1 |
| Employed labour force | 48.5 | 49.1 | 49.0 | 49.3 | 49.1 | 49.2 | 48.5 | 48.9 | |
The New Zealand Council of Trade Unions Te Kauae Kaimahi (CTU) is the national voice and advocate of worker interests.
The CTU is made up of unions representing workers in all sectors of the workforce and unites private and public sector unions.
The CTU promotes a wide economic and social development agenda, as well as organising around core issues such as collective bargaining and health and safety.
The CTU has active local and representative structures and represents New Zealand workers internationally.
The New Zealand Council of Trade Unions website is www.union.org.nz
Business New Zealand is New Zealand's largest business advocacy body, representing the combined members of five regional business organisations and more than 50 national business organisations.
Business New Zealand promotes public policy that supports an open, competitive economy and private enterprise.
Business New Zealand was the result of a merger between the New Zealand Employers’ Federation and the New Zealand Manufacturers’ Federation.
The Business New Zealand website is www.business.nz.org.nz
Since 1986, the number of work stoppages in New Zealand has fallen to levels not recorded since the early 1930s.
Work stoppage information is used as an indicator of the state of industrial relations in New Zealand. It focuses particularly on the economic impact of events such as strikes and lockouts, but does not cover stop-work meetings, strike notices, protest marches and public rallies. Demarcation and coverage disputes are included only where participants are on strike or locked out.
For statistical purposes, work stoppages are defined not only as those disputes which result in the complete withdrawal of labour by workers, or a lockout by employers, but also disputes in which there is an organised ‘go-slow’, refusal to work overtime, or other methods of passive resistance.
Table 14.03 shows that since 1986 the number of work stoppages has fallen to levels not recorded since the early 1930s.
There were 34 work stoppages in the year ending 31 December 2004, compared with 71 in 1991 and 215 in 1986 (pre-Employment Contracts Act). The number of employees involved in work stoppages has also decreased. In 2004, 6,127 people were involved, fewer than the 23,309 people in 2002 and considerably lower than the hundreds of thousands involved in stoppages during the 1970s and 1980s.
The manufacturing industry accounted for around 38 percent of the 34 stoppages in 2004. The manufacturing industry also had the greatest number of employees involved (2,325) and the greatest number of days lost (2,044). The transport and storage industry had the greatest estimated loss in wages and salaries ($292,000). Figure 14.01 plots work stoppages from 1921 to 31 December 2004.
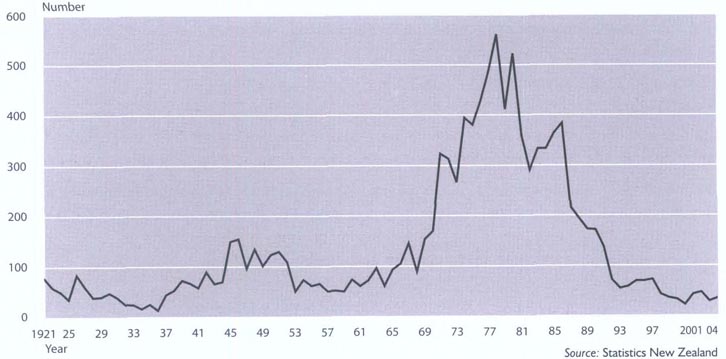
Table 14.03. Work stoppages
Years ending 31
December
| Year | Stoppages | Employees involved | Person-days of work lost | Average person-days lost per employee involved | Estimated loss of wages and salaries |
|---|---|---|---|---|---|
| Sources: Department of Labour Statistics New Zealand | |||||
| Number | $(000) | ||||
| 1921 | 77 | 10,433 | 119,208 | 11.43 | 180 |
| 1926 | 59 | 6,264 | 47,811 | 7.63 | 65 |
| 1931 | 24 | 6,356 | 48,486 | 7.63 | 89 |
| 1936 | 43 | 7,354 | 16,980 | 2.31 | 26 |
| 1941 | 89 | 15,261 | 26,237 | 1.72 | 69 |
| 1946 | 96 | 15,696 | 30,393 | 1.94 | 80 |
| 1951 | 109 | 36,878 | 1,157,390 | 31.38 | 6,223 |
| 1956 | 50 | 13,579 | 23,870 | 1.76 | 168 |
| 1961 | 71 | 16,626 | 38,185 | 2.30 | 299 |
| 1966 | 145 | 33,132 | 99,095 | 2.99 | 878 |
| 1971 | 313 | 86,009 | 162,563 | 1.89 | 2,109 |
| 1976 | 487 | 201,085 | 488,441 | 2.43 | 10,840 |
| 1981 | 291 | 135,006 | 388,086 | 2.87 | 20,411 |
| 1986 | 215 | 100,633 | 1,329,054 | 13.21 | 119,496 |
| 1991 | 71 | 51,962 | 99,032 | 1.91 | 11,577 |
| 1992 | 54 | 26,803 | 113,742 | 4.24 | 19,372 |
| 1993 | 58 | 21,303 | 23,770 | 1.12 | 2,863 |
| 1994 | 69 | 16,042 | 38,263 | 2.39 | 4,580 |
| 1995 | 69 | 32,048 | 53,352 | 1.66 | 6,813 |
| 1996 | 72 | 42,307 | 69,514 | 1.64 | 9,768 |
| 1997 | 42 | 7,646 | 24,616 | 3.2 | 3,126 |
| 1998 | 35 | 15,205 | 11,778 | 0.8 | 1,886 |
| 1999 | 32 | 10,747 | 16,674 | 1.6 | 3,343 |
| 2000 | 21 | 2,632 | 11,495 | 4.4 | 2,272 |
| 2001 | 42 | 22,022 | 54,440 | 2.5 | 7,682 |
| 2002 | 46 | 23,309 | 34,398 | 1.5 | 4,979 |
| 2003 | 28 | 5,098 | 19,463 | 3.8 | 4,250 |
| 2004 | 34 | 6,127 | 6,162 | 1.0 | 1,025 |
In general terms, the labour force includes members of the working-age population who are either ‘employed’ or ‘unemployed’.
The ‘employed’ category includes all people in the working-age population who work for one hour or more a week for pay or profit, either as an employee or self-employed, or who work without pay for one hour or more in a family business.
The ‘unemployed’ category includes all people in the working-age population who are without a paid job, available for work and have either actively sought work in the past four weeks, or have a new job to start within the next four weeks.
These definitions are used by Statistics New Zealand's Quarterly Household Labour Force Survey and conform closely to standard definitions specified by the International Labour Organisation.
Table 14.04 overleaf shows that between September 2002 and September 2005, the number of people in employment increased by 179,700. At the same time, the number of people unemployed decreased by 29,600.
The total labour force grew by 150,100 (7.5 percent) in the three years to reach 2,154,200 in the September 2005 quarter. The working age population (the usually resident non-institutionalised civilian population of New Zealand aged 15 and over) increased by 153,300 (5.1 percent) in the same period.
Between the September 2002 and September 2005 quarters, the male labour force increased by 6.1 percent, while the female labour force increased by 9.1 percent. Both male and female unemployment rates decreased between the September 2002 and September 2005 quarters.
Female participation in New Zealand's labour force is lower than male participation across all age groups.
Table 14.04. Labour force1
September quarter 2002—September quarter
2005
| Quarterly | Employed | Unemployed | Total labour force | Not in the labour force | Working age population2 | Labour force participation rate | Unemployment rate | |
|---|---|---|---|---|---|---|---|---|
1Unadjusted figures. 2The civilian, non-institutionalised, usually resident New Zealand population aged 15 and over. Source: Statistics New Zealand | ||||||||
| (000) | Percent | Percent | ||||||
| Male | ||||||||
| 2002 | September | 1,030.2 | 56.9 | 1,087.1 | 378.6 | 1,465.7 | 74.2 | 5.2 |
| December | 1,050.2 | 51.2 | 1,101.3 | 373.2 | 1,474.5 | 74.7 | 4.6 | |
| 2003 | March | 1,051.7 | 53.8 | 1,105.6 | 379.1 | 1,484.7 | 74.5 | 4.9 |
| June | 1,047.3 | 47.4 | 1,094.7 | 398.2 | 1,492.9 | 73.3 | 4.3 | |
| September | 1,055.2 | 44.9 | 1,100.1 | 399.2 | 1,499.3 | 73.4 | 4.1 | |
| December | 1,072.9 | 46.1 | 1,119.0 | 387.7 | 1,506.7 | 74.3 | 4.1 | |
| 2004 | March | 1,081.4 | 42.9 | 1.124.3 | 389.4 | 1,513.8 | 74.3 | 3.8 |
| June | 1,088.8 | 39.3 | 1.128.1 | 391.4 | 1,519.4 | 74.2 | 3.5 | |
| September | 1,089.5 | 38.7 | 1,128.3 | 395.8 | 1.524.1 | 74.0 | 3.4 | |
| December | 1,119.4 | 37.2 | 1.156.7 | 373.5 | 1,530.2 | 75.6 | 3.2 | |
| 2005 | March | 1,112.4 | 45.5 | 1,157.9 | 378.6 | 1,536.6 | 75.4 | 3.9 |
| June | 1,105.3 | 40.4 | 1,145.7 | 395.3 | 1,541.0 | 74.3 | 3.5 | |
| September | 1,116.7 | 36.8 | 1,153.5 | 391.3 | 1,544.7 | 74.7 | 3.2 | |
| Female | ||||||||
| 2002 | September | 868.7 | 48.4 | 917.1 | 639.9 | 1,557.0 | 58.9 | 5.3 |
| December | 885.4 | 45.3 | 930.8 | 634.3 | 1,565.1 | 59.5 | 4.9 | |
| 2003 | March | 877.0 | 52.8 | 929.8 | 644.2 | 1,574.1 | 59.1 | 5.7 |
| June | 884.5 | 46.1 | 930.6 | 650.4 | 1,581.1 | 58.9 | 5.0 | |
| September | 903.0 | 42.6 | 945.5 | 641.9 | 1,587.4 | 59.6 | 4.5 | |
| December | 913.2 | 46.4 | 959.6 | 635.2 | 1,594.8 | 60.2 | 4.8 | |
| 2004 | March | 906.6 | 51.8 | 958.3 | 643.4 | 1,601.7 | 59.8 | 5.4 |
| June | 903.3 | 42.7 | 946.0 | 660.9 | 1,606.9 | 58.9 | 4.5 | |
| September | 925.0 | 37.6 | 962.5 | 648.9 | 1,611.4 | 59.7 | 3.9 | |
| December | 954.4 | 37.7 | 992.1 | 625.9 | 1,618.0 | 61.3 | 3.8 | |
| 2005 | March | 942.4 | 44.2 | 986.6 | 636.8 | 1,623.5 | 60.8 | 4.5 |
| June | 947.3 | 35.7 | 983.0 | 644.5 | 1,627.5 | 60.4 | 3.6 | |
| September | 961.9 | 38.9 | 1,000.7 | 630.6 | 1,631.3 | 61.3 | 3.9 | |
| Total | ||||||||
| 2002 | September | 1,898.9 | 105.2 | 2,004.1 | 1,018.5 | 3,022.7 | 66.3 | 5.3 |
| December | 1,935.6 | 96.5 | 2,032.1 | 1,007.5 | 3,039.7 | 66.9 | 4.7 | |
| 2003 | March | 1,928.7 | 106.7 | 2,035.4 | 1,023.3 | 3,058.7 | 66.5 | 5.2 |
| June | 1,931.8 | 93.5 | 2,025.3 | 1,048.6 | 3,074.0 | 65.9 | 4.6 | |
| September | 1,958.2 | 87.4 | 2,045.6 | 1,041.1 | 3,086.8 | 66.3 | 4.3 | |
| December | 1,986.1 | 92.5 | 2,078.6 | 1,022.8 | 3,101.4 | 67.0 | 4.5 | |
| 2004 | March | 1,988.0 | 94.7 | 2,082.7 | 1,032.8 | 3,115.5 | 66.8 | 4.5 |
| June | 1,992.1 | 81.9 | 2,074.1 | 1,052.2 | 3,126.3 | 66.3 | 4.0 | |
| September | 2,014.5 | 76.3 | 2,090.8 | 1,044.7 | 3,135.5 | 66.7 | 3.6 | |
| December | 2,073.8 | 75.0 | 2,148.8 | 999.4 | 3,148.2 | 68.3 | 3.5 | |
| 2005 | March | 2,054.8 | 89.7 | 2,144.6 | 1,015.5 | 3,160.1 | 67.9 | 4.2 |
| June | 2,052.6 | 76.2 | 2,128.7 | 1,039.8 | 3,168.5 | 67.2 | 3.6 | |
| September | 2,078.6 | 75.6 | 2,154.2 | 1,021.8 | 3,176.0 | 67.8 | 3.5 | |
Labour force participation rates for both males and females increased in the three years ending 30 September 2005.
The female rate increased more than the male rate, but there was still a large gap between male and female participation rates.
For the year ending 30 September 2005, the overall labour force participation rate for males was 75.0 percent and for females 61.0 percent.
Table 14.05 shows female participation in the labour force is lower than male participation at every age group, most markedly in the 25–39 year group, which includes the main childbearing ages.
For the year ending 30 September 2005, 1,610,100 people in New Zealand were employed in full-time work and 454,900 in part-time work.
Full-time work involves working 30 or more hours a week.
Table 14.06 shows that between the years ending 30 September 1991 and 30 September 2005, part-time employment growth was stronger than full-time employment growth.
Full-time employment increased by 33.5 percent and part-time by 42.6 percent.
Women made up the bulk of part-time workers, 337,700 in 2005 compared with 117,100 males.
Table 14.05. Labour force participation rates in 20051
By sex and age group
Average for year ending 30 September
| Age group | Male | Female | Total |
|---|---|---|---|
1Unadjusted figures Source: Statistics New Zealand | |||
| Percent | |||
| 15–19 | 54.7 | 53.6 | 54.1 |
| 20–24 | 78.0 | 66.8 | 72.5 |
| 25–29 | 89.1 | 73.3 | 81.0 |
| 30–34 | 93.0 | 70.4 | 81.1 |
| 35–39 | 93.6 | 73.5 | 83.1 |
| 40–44 | 93.4 | 79.7 | 86.3 |
| 45–49 | 92.7 | 81.5 | 87.0 |
| 50–54 | 90.3 | 79.5 | 84.8 |
| 55–59 | 86.7 | 71.8 | 79.2 |
| 60–64 | 70.7 | 48.7 | 59.5 |
| 65 and over | 16.2 | 8.3 | 11.9 |
| All ages | 75.0 | 61.0 | 67.8 |
Table 14.06. Full and part-time employment1
By sex
Average for year ending 30 September
| Year | Employed full time | Employed part time | Employed total | ||||||
|---|---|---|---|---|---|---|---|---|---|
| Male | Female | Total | Male | Female | Total | Male | Female | Total | |
1Unadjusted figures. Note:Figures may not add to staled totals due to rounding. Source: Statistics New Zealand | |||||||||
| (000) | (000) | (000) | |||||||
| 1991 | 774.0 | 432.4 | 1,206.4 | 79.4 | 239.5 | 318.9 | 853.4 | 671.9 | 1,525.3 |
| 1996 | 865.6 | 491.7 | 1,357.3 | 98.4 | 287.4 | 385.8 | 964.0 | 779.1 | 1,743.2 |
| 2001 | 887.8 | 539.4 | 1,427.2 | 113.7 | 302.5 | 416.1 | 1,001.5 | 841.8 | 1,843.3 |
| 2002 | 912.7 | 549.1 | 1,461.8 | 118.6 | 316.7 | 435.3 | 1,031.3 | 865.8 | 1,897.1 |
| 2003 | 935.3 | 564.9 | 1,500.2 | 115.8 | 322.5 | 438.4 | 1,051.1 | 887.5 | 1,938.6 |
| 2004 | 964.8 | 590.3 | 1,555.1 | 118.3 | 321.8 | 440.1 | 1,083.1 | 912.0 | 1,995.2 |
| 2005 | 996.3 | 613.8 | 1,610.1 | 117.1 | 337.7 | 454.9 | 1,113.5 | 951.5 | 2,064.9 |
Up to 30,000 skilled or business immigrants and their families are accepted into New Zealand under the government's immigration programme each year.
Table 14.07 shows that the majority of employed people (81.2 percent) were employees (wage or salary earners) in their main job in the year ending 30 September 2005. The next largest category was the self-employed (and not employing others), accounting for 11.5 percent of the employed.
While the number of employees are similar for males and females, males dominate the employer and self-employed categories, comprising 69.5 percent and 67.1 percent respectively in the year ending 30 September 2005. The unpaid relative assisting category is dominated by females, who make up 68.4 percent of this group.
There were a number of shifts in employment status between 2000 and 2005 when the total number of employed people increased by 266,000 (14.8 percent). The number of employees increased by 259,000 (18.3 percent) and the number of employers grew by 9,100 (7.1 percent). There was an increase of 6,200 (2.7 percent) in the number of self-employed (and not employing others), while the number of unpaid relatives assisting fell by 4,500 (28.1 percent).
Table 14.07. People employed in 2000 and 20051,2
By employment status
| Status | Male | Female | Total | ||||||
|---|---|---|---|---|---|---|---|---|---|
| 2000 | 2005 | Change | 2000 | 2005 | Change | 2000 | 2005 | Change | |
1Average fur year ending 30 September. 2Unadjusted figures. – estimates are fewer than 1,000 and subject to sampling error too great for most practical purposes. Note:Figures may not add to stated totals due to rounding. Source: Statistics New Zealand | |||||||||
| (000) | Percent | (000) | Percent | (000) | Percent | ||||
| Employee | 723.3 | 854.1 | 18.1 | 694.5 | 822.7 | 18.5 | 1,417.8 | 1,676.8 | 18.3 |
| Employer | 91.2 | 95.5 | 4.7 | 37.1 | 42.0 | 13.1 | 128.4 | 137.5 | 7.1 |
| Self employed | 159.8 | 159.8 | 0.0 | 72.2 | 78.5 | 8.7 | 232.0 | 238.2 | 2.7 |
| Unpaid relative assisting | 5.1 | 3.6 | -28.3 | 10.8 | 7.8 | -28.0 | 15.9 | 11.4 | -28.1 |
| Not specified | 2.9 | – | – | 2.1 | – | – | 4.9 | – | – |
| Total | 982.3 | 1,113.5 | 13.4 | 816.7 | 951.5 | 16.5 | 1,798.9 | 2,064.9 | 14.8 |
The changing New Zealand economy of recent years has resulted in more people being employed in the services sector (wholesale and retail trade, restaurants and hotels; finance and insurance, property and business services; education, health and community, and other services) and fewer in manufacturing. Table 14.08 shows the average number of employed people by industry and by sex in the year ending 30 September 2005. The largest number of employed people worked in the education, health and community, and other services area (28.1 percent); followed by wholesale and retail trade, restaurants and hotels (22.3 percent); and finance and insurance, property and business services (14.3 percent). Industries that employed the least number of people were mining; and electricity, gas and water supply; which each employed less than one percent of the total employed.
More than 8,000 Modern Apprentices were involved in structured workplace learning programmes at 30 June 2005.
Male employment was highest in the wholesale and retail trade, restaurants and hotels area (which employed 20.7 percent of males), followed by manufacturing (18.4 percent) and education, health and community, and other services (16.6 percent). Combined, those industries accounted for 55.7 percent of male employment.
Female employment was highest in education, health and community, and other services (41.6 percent), and wholesale and retail trade, restaurants and hotels industries (24.2 percent).
Table 14.08. People employed in 20051
By industry and sex
Average for year ending 30 September
| Industry group | Numbers | Proportion of total employed | ||||
|---|---|---|---|---|---|---|
| Male | Female | Total | Male | Female | Total | |
1Unadjusted figures – estimates are fewer than 1,000 and subject to sampling error too great for most practical purposes. Note: Figures may not add to staled totals due to rounding. Source: Statistics New Zealand | ||||||
| (000) | Percent | |||||
| Agriculture, forestry and fishing | 99.8 | 47.7 | 147.5 | 9.0 | 5.0 | 7.1 |
| Mining | 4.9 | – | 5.5 | 0.4 | – | 0.3 |
| Manufacturing | 204.6 | 80.4 | 285.0 | 18.4 | 8.4 | 13.8 |
| Electricity, gas and water supply | 5.9 | 2.5 | 8.4 | 0.5 | 0.3 | 0.4 |
| Construction | 142.0 | 17.3 | 159.3 | 12.8 | 1.8 | 7.7 |
| Wholesale and retail trade, restaurants and hotels | 230.5 | 230.0 | 460.4 | 20.7 | 24.2 | 22.3 |
| Transport, storage and communications | 83.8 | 36.1 | 119.8 | 7.5 | 3.8 | 5.8 |
| Finance and insurance, property and business services | 155.5 | 139.9 | 295.4 | 14.0 | 14.7 | 14.3 |
| Education, health and community, and other services | 184.3 | 395.7 | 580.1 | 16.6 | 41.6 | 28.1 |
| Not specified | 2.2 | 1.4 | 3.6 | 0.2 | 0.1 | 0.2 |
| Total | 1,113.5 | 951.5 | 2,064.9 | 100 | 100 | 100 |
Statistics New Zealand classifies occupations into nine major groups for the purpose of statistical collection and reporting.
Table 14.09 shows the spread of employed people across these groups.
In the year ending 30 September 2005, proportions of people employed by occupation remained relatively constant compared with previous years. The largest occupational groups in the year ending 30 September 2005 were service and sales workers, and professionals. Together, these groups accounted for 31 percent of all employed people. The smallest occupational group was elementary occupations, accounting for 6.3 percent of all employed people. The largest occupational group for males was trades workers, where 17.0 percent of males were employed. The largest group for women was service and sales workers, accounting for 23.4 percent of female employment.
So-called ‘male’ and ‘female’ occupations continue to exist in the New Zealand labour force. Males are over-represented compared with females as trades workers; and plant and machine operators and assemblers. Women are over-represented in the service and sales; and clerk occupations.
Table 14.09. People employed in 2005
By
occupation and sex
Average for
year ending 30 September
| Major occupational group | Numbers | Proportion of total workforce | ||||
|---|---|---|---|---|---|---|
| Male | Female | Total | Male | Female | Total | |
Note: Figures may not add to stated totals due to rounding. Source: Statistics New Zealand | ||||||
| (000) | Percent | |||||
| Legislators, administrators, managers | 160.9 | 91.0 | 251.9 | 14.4 | 9.6 | 12.2 |
| Professionals | 147.5 | 166.2 | 313.8 | 13.3 | 17.5 | 15.2 |
| Technicians and associate professionals | 117.1 | 127.4 | 244.5 | 10.5 | 13.4 | 11.8 |
| Clerks | 51.2 | 204.2 | 255.4 | 4.6 | 21.5 | 12.4 |
| Service and sales workers | 103.5 | 222.3 | 325.8 | 9.3 | 23.4 | 15.8 |
| Agriculture and fishery workers | 106.2 | 47.5 | 153.7 | 9.5 | 5.0 | 7.4 |
| Trades workers | 189.2 | 10.9 | 200.1 | 17.0 | 1.1 | 9.7 |
| Plant and machine operators and assemblers | 153.8 | 33.4 | 187.2 | 13.8 | 3.5 | 9.1 |
| Elementary occupations | 82.8 | 47.2 | 130.1 | 7.4 | 5.0 | 6.3 |
| Not specified | 1.2 | 1.4 | 2.6 | 0.1 | 0.1 | 0.1 |
| Total | 1,113.5 | 951.5 | 2,064.9 | 100 | 100 | 100 |
The official measure of unemployment in New Zealand is derived from the Household Labour Force Survey in which unemployed people are defined as all people in the working age population (15 years and over) who, during the reference week, were without a paid job, were available for work and had actively sought work in the past four weeks, or had a new job to start within four weeks.
A person whose only job search method in the previous four weeks has been to look at job advertisements in newspapers is not considered to be actively seeking work.
Figure 14.02 shows the unemployment rate in New Zealand from the March quarter of 1986 to the September quarter of 2005.
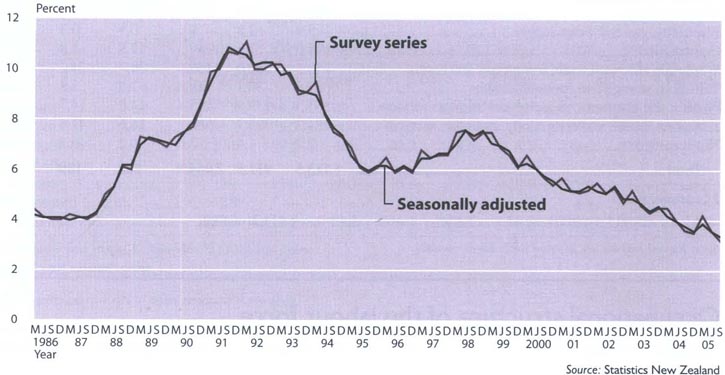
An average 79,100 people (3.7 percent of the labour force) were estimated to be unemployed in New Zealand in the year ending 30 September 2005. The male unemployment rate was 3.5 percent and the female rate 4.0 percent.
Table 14.10 shows the average number of unemployed in the year ending 30 September 2005 by educational attainment and by sex. The unemployment rate is highest for those with no qualifications (6.1 percent) and lowest for those with post-school and school qualifications (2.4 percent).
Table 14.11 compares the number of unemployed people by educational attainment in the years ending 30 September 2002 to 2005 and for census years 1991, 1996 and 2001.
Table 14.1. People unemployed in 20051
By educational attainment and
sex
| Educational attainment | Number of unemployed | Unemployment rate | ||||
|---|---|---|---|---|---|---|
| Male | Female | Total | Male | Female | Total | |
1Average for the year ending 30 September. – estimates are fewer than 1,000 and subject to sampling errors too great for most practical purposes. Note: Figures may not add to stated totals due to rounding. Source: Statistics New Zealand | ||||||
| (000) | Percent | |||||
| No qualifications | 13.0 | 11.7 | 24.8 | 5.7 | 6.7 | 6.1 |
| School qualification | 10.8 | 10.4 | 21.1 | 4.3 | 3.9 | 4.1 |
| Post-school but no school qualification | 4.2 | 4.4 | 8.6 | 3.1 | 6.0 | 4.1 |
| Post-school and school qualification | 11.8 | 12.4 | 24.3 | 2.2 | 2.6 | 2.4 |
| Not specified | – | – | – | – | – | – |
| Total | 40.0 | 39.1 | 79.1 | 3.5 | 4.0 | 3.7 |
Table 14.11. People unemployed 1991–20051
By educational attainment
| Year | No qualification | School qualification | Post-school but no school qualification | Post-school and school qualification | Not specified | Total unemployed |
|---|---|---|---|---|---|---|
1Averages for years ending 30 September. – estimates are fewer than 1,000 and subject to sampling errors too great for most practical purposes. Note: Figures may not add to stated totals due to rounding. Source: Statistics New Zealand | ||||||
| (000) | ||||||
| 1991 | 68.5 | 42.5 | 17.7 | 35.7 | 1.6 | 166.0 |
| 1996 | 44.3 | 28.8 | 11.5 | 29.1 | – | 114.1 |
| 2001 | 34.0 | 28.1 | 10.1 | 31.6 | – | 104.1 |
| 2002 | 33.0 | 27.4 | 13.2 | 31.3 | – | 105.5 |
| 2003 | 28.1 | 25.5 | 11.6 | 30.3 | – | 96.0 |
| 2004 | 25.9 | 22.4 | 10.3 | 27.6 | – | 86.4 |
| 2005 | 24.8 | 21.1 | 8.6 | 24.3 | – | 79.1 |
Table 14.12 shows that unemployment was highest in the younger age groups of the working-age population in the year ending 30 September 2005. The unemployment rate for the 15–19 year group was 12.8 percent, compared with the overall unemployment rate of 3.7 percent. The lowest unemployment rate recorded (1.8 percent) was for the 60–64 year group.
Table 14.12. People unemployed in 20051
By age group and sex
| Age group (in years) | Number unemployed | Unemployment rate | ||||
|---|---|---|---|---|---|---|
| Male | Female | Total | Male | Female | Total | |
1Average for year ending 30 September. – estimates are fewer than 1,000 and subject to sampling errors too great for most practical purposes. Note: Figures may not add to stated totals due to rounding. Source: Statistics New Zealand | ||||||
| (000) | Percent | |||||
| 15–19 | 10.9 | 10.1 | 21.1 | 12.9 | 12.8 | 12.8 |
| 20–24 | 7.4 | 6.6 | 14.1 | 6.6 | 7.0 | 6.8 |
| 25–29 | 4.6 | 4.1 | 8.6 | 4.2 | 4.3 | 4.2 |
| 30–34 | 2.7 | 4.3 | 6.9 | 2.1 | 4.0 | 3.0 |
| 35–39 | 3.1 | 3.7 | 6.8 | 2.3 | 3.2 | 2.7 |
| 40–44 | 2.4 | 3.0 | 5.4 | 1.7 | 2.3 | 2.0 |
| 45–49 | 2.1 | 2.7 | 4.8 | 1.6 | 2.2 | 1.9 |
| 50–54 | 3.2 | 1.8 | 5.0 | 2.8 | 1.8 | 2.3 |
| 55–59 | 2.0 | 1.8 | 3.8 | 2.0 | 2.1 | 2.1 |
| 60–64 | 1.1 | – | 1.9 | 1.8 | – | 1.8 |
| 65 and over | – | – | – | – | – | – |
| Total | 40.0 | 39.1 | 79.1 | 3.5 | 4.0 | 3.7 |
Table 14.13 shows what proportion of total unemployed is represented by each age group. The trend in recent years has been for the highest proportion of unemployed to be in the 15–19 year group. In general, the older the age group the less it contributes to total unemployment. The 15–19 year group has shown increases in its proportion of unemployed over time, while most of the other age groups have shown decreases.
Table 14.13. Proportions of people unemployed1
1991–20052
By age group
| Year | 15–19 | 20–24 | 25–29 | 30–34 | 35–39 | 40–44 | 45–49 | 50–54 | 55–59 | 60–64 | 65 and over |
|---|---|---|---|---|---|---|---|---|---|---|---|
1Proportions are calculated by dividing the number of unemployed in each age group by total unemployed. 2Averages for years ending 30 September. – estimates are fewer than 1,000 and subject to sampling errors too great for most practical purposes. Source: Statistics New Zealand | |||||||||||
| Percent | |||||||||||
| 1991 | 21.1 | 20.4 | 14.8 | 12.2 | 8.8 | 7.8 | 5.7 | 4.7 | 3.4 | – | – |
| 1996 | 21.7 | 17.4 | 12.1 | 10.8 | 10.2 | 9.3 | 7.6 | 5.2 | 3.7 | 1.5 | – |
| 2001 | 22.2 | 16.7 | 10.2 | 10.0 | 9.4 | 9.7 | 6.7 | 6.8 | 5.2 | 2.9 | – |
| 2002 | 22.4 | 16.1 | 11.1 | 10.3 | 9.8 | 9.3 | 6.7 | 6.6 | 3.9 | 3.1 | – |
| 2003 | 23.6 | 15.0 | 10.4 | 10.9 | 9.9 | 9.2 | 5.2 | 6.1 | 5.3 | 3.9 | – |
| 2004 | 24.1 | 16.6 | 10.4 | 10.0 | 9.0 | 8.0 | 6.3 | 5.9 | 5.8 | 3.3 | – |
| 2005 | 26.6 | 17.8 | 10.9 | 8.8 | 8.6 | 6.9 | 6.1 | 6.3 | 4.8 | 2.4 | – |
The unemployment rate for New Zealand Europeans is lower than that for all other ethnic groups. Table 14.14 shows that the average unemployment rate for the year ending 30 September 2005 was 2.6 percent for New Zealand Europeans, 8.9 percent for Māori, 6.2 percent for Pacific peoples and 6.6 percent for the Other ethnic group.
Table 14.14. People unemployed in 20051
By
ethnicity2and sex
| Number unemployed | Unemployment rate | |||||
|---|---|---|---|---|---|---|
| Male | Female | Total | Male | Female | Total | |
1Average for year ending 30 September. 2Ethnic origin is self determined by respondents. They can choose up to three different ethnic origins, which are then prioritised. – estimates are fewer than 1,000 and subject to sampling errors too great for most practical purposes. Note: Figures may not add to stated totals due to rounding. Source: Statistics New Zealand | ||||||
| (000) | Percent | |||||
| New Zealand European | 22.0 | 20.6 | 42.6 | 2.5 | 2.7 | 2.6 |
| Māori | 8.4 | 9.7 | 18.1 | 8.0 | 9.9 | 8.9 |
| Pacific peoples | 2.8 | 2.9 | 5.8 | 5.6 | 7.0 | 6.2 |
| Other | 6.7 | 5.8 | 12.6 | 6.5 | 6.8 | 6.6 |
| Not specified | – | – | – | – | – | – |
| Total | 40.0 | 39.1 | 79.1 | 3.5 | 4.0 | 3.7 |
One of the roles of the Ministry of Social Development is to provide employment assistance to New Zealanders. These services are provided from more than 190 locations throughout the country. including seven contact centres and 11 regional offices.
Work and Income provides a range of services to assist job seekers into paid employment, including information services, job search skills, work confidence programmes and Ministry of Youth Affairs development programmes.
Decreasing use of employment assistance in recent years reflects the lower number of registered job seekers.
Information services and work confidence – These programmes help with motivation and confidence when seeking paid work, and provide information on job search techniques and job search resources. In the year ending 30 June 2005, clients participated in information services programmes 3,171 times, compared with 4,955 times in the year ending 30 June 2004. Clients also participated in work confidence courses 4,684 times in the year ending 30 June 2005, compared with 7,107 in the year ending 30 June 2004.
Work experience – These programmes provide unpaid experience in a workplace or in a situation resembling work that helps develop or maintain self-esteem, motivation, work discipline, work ethic and dignity. In the year ending 30 June 2005, clients participated in these programmes 1,336 times, compared with 2,305 times in the year ending 30 June 2004.
Work transition grants – These grants help remove small financial barriers preventing job seekers from making the transition to unsubsidised employment. In the year ending 30 June 2005, 28,157 grants were made, compared with 36,452 in the year ending 30 June 2004.
Wage subsidies – These subsidies act as incentives for employers to provide work for job seekers. In the year ending 30 June 2005, 13,386 subsidies were paid, compared with 18,994 in the year ending 30 June 2004.
Skills training – These programmes aim to improve job-related skills, increasing the client's chances of finding employment. In the year ending 30 June 2005, clients participated in these programmes 3,883 times, compared with 5,865 times in the year ending 30 June 2004.
Self-employment assistance – These programmes provide financial help and advice for long-term unemployed people moving into self-employment. In the year ending 30 June 2005, clients participated in these programmes 3,242 times, compared with 3,899 times in the year ending 30 June 2004.
Innovation and market responsiveness – These programmes have been developed by Work and Income to respond to local labour markets, to meet the emerging needs of job seekers, employers and communities, to trial employment services, and to promote learning and awareness of best practice in the design and delivery of work services. In the year ending 30 June 2005, clients participated in these programmes 25,891 times, compared with 26,230 times in the year ending 30 June 2004.
Job search skills – These programmes assist clients in developing the skills required to seek paid work and in identifying the types of work they may find most suitable. In the year ending 30 June 2005, clients participated in these programmes 52,461 times, compared with 74,796 times in the year ending 30 June 2004.
Job placements. Work and Income placed 49,141 people into work in the year ending 30 June 2005, compared with 87,027 people in the previous June year. The decrease reflects the lower number of job seekers registered during the year ending 30 June 2005 and strong economic conditions which made it easier for Work and Income clients to obtain paid work through their own efforts without being placed by Work and Income.
Income strongly influences people's well-being and life circumstances. It is a means of achieving many economic and social objectives in people's lives. Information on income source and distribution trends, for both individuals and households, is vital for monitoring social change.
Personal income is an individual's pay, profit or other receipts received on an occasional or regular basis.
People receive personal income from various sources, such as wages and salaries, self-employment, investments, government transfers and private superannuation.
The major component of income is what an individual earns from employment.
In the 10 years ending 31 March 2005, Statistics New Zealand's Quarterly Employment Surveys recorded a 33.8 percent increase in average weekly earnings, from $594.11 to $794.83.
Table 14.15 shows that male average weekly earnings increased 32.2 percent to $889.15, while female earnings rose 38.3 percent to $688.36. At 31 March 2005, female average weekly earnings were 77.4 percent of male average weekly earnings, compared with 74.0 percent in March 1995.
Table 14.15. Average weekly earnings
By
sex
Years ending 31 March
| Year | Males | Females | Total | ||||||
|---|---|---|---|---|---|---|---|---|---|
| Ordinary time | Overtime | Total | Ordinary time | Overtime | Total | Ordinary time | Overtime | Total | |
Note: Figures may not add to stated totals due to rounding. Source: Statistics New Zealand | |||||||||
| $ | |||||||||
| 1991 | 577.40 | 45.00 | 622.40 | 450.63 | 15.76 | 466.40 | 521.45 | 32.10 | 553.55 |
| 1992 | 599.16 | 40.93 | 640.09 | 466.27 | 13.10 | 479.37 | 539.84 | 28.50 | 568.34 |
| 1993 | 607.15 | 40.20 | 647.35 | 468.66 | 11.68 | 480.33 | 545.06 | 27.41 | 572.47 |
| 1994 | 615.24 | 39.05 | 654.29 | 474.58 | 11.72 | 486.30 | 551.98 | 26.76 | 578.73 |
| 1995 | 631.12 | 41.65 | 672.77 | 485.48 | 12.26 | 497.75 | 565.67 | 28.44 | 594.11 |
| 1996 | 652.55 | 40.00 | 692.55 | 500.35 | 11.15 | 511.49 | 583.70 | 26.95 | 610.65 |
| 1997 | 676.18 | 38.01 | 714.18 | 521.88 | 11.13 | 533.02 | 606.66 | 25.90 | 632.56 |
| 1998 | 689.12 | 35.82 | 724.94 | 536.06 | 11.09 | 547.15 | 619.19 | 24.52 | 643.71 |
| 1999 | 711.94 | 31.85 | 743.79 | 554.04 | 9.69 | 563.73 | 638.79 | 21.59 | 660.38 |
| 2000 | 725.19 | 31.74 | 756.93 | 563.05 | 11.03 | 574.07 | 649.46 | 22.07 | 671.53 |
| 2001 | 751.71 | 31.65 | 783.36 | 574.57 | 10.82 | 585.40 | 667.95 | 21.80 | 689.75 |
| 2002 | 776.57 | 32.85 | 809.42 | 614.09 | 10.78 | 624.87 | 700.80 | 22.56 | 723.36 |
| 2003 | 802.93 | 35.91 | 838.84 | 633.20 | 11.16 | 644.36 | 722.64 | 24.20 | 746.84 |
| 2004 | 827.77 | 33.99 | 861.76 | 657.62 | 11.74 | 669.36 | 747.44 | 23.48 | 770.93 |
| 2005 | 853.82 | 35.33 | 889.15 | 676.33 | 12.03 | 688.36 | 770.44 | 24.38 | 794.83 |
In Table 14.16, data from the New Zealand Income Survey compares median male and female earnings for full-time wage and salary workers and shows the median is higher for males than females across all age groups.
Table 14.17 shows that according to the New Zealand Income Survey for the quarter ending 30 June 2005, people in the Canterbury region had the highest median annual income ($25,100), followed by the Wellington ($25,000) and Auckland ($24,700) regions.
The Auckland region had the highest proportion of people (1 in 25) earning annual incomes greater than $100,000.
Table 14.16. Median weekly earnings
Full-time
wage and salary/workers
By age and
sex
Quarter ending 30 June
2005
| Age group (in years) | Males | Females | Difference |
|---|---|---|---|
| Source: Statistics New Zealand | |||
| $ | |||
| 15–19 | 450 | 440 | 10 |
| 20–24 | 608 | 588 | 20 |
| 25–29 | 750 | 680 | 70 |
| 30–34 | 825 | 748 | 77 |
| 35–39 | 920 | 704 | 216 |
| 40–44 | 900 | 646 | 254 |
| 45–49 | 950 | 673 | 277 |
| 50–54 | 928 | 674 | 254 |
| 55–59 | 853 | 690 | 163 |
| 60–64 | 880 | 634 | 246 |
| 65 and over | 750 | 600 | 150 |
| All ages | 800 | 661 | 139 |
Table 14.17. Median annual income
By
region
Quarter ending 30 June
2005
| Region | Median |
|---|---|
Note: These figures are an estimate of annual income only, calculated by multiplying reported weekly income by 52.14 to get an annual figure. Source: Statistics New Zealand | |
| $ | |
| Canterbury | 25,100 |
| Wellington | 25,000 |
| Auckland | 24,700 |
| Nelson/Tasman/Marlborough/West Coast | 24,100 |
| Taranaki | 24,000 |
| Waikato | 24,000 |
| Southland | 22,900 |
| Marlborough | 17,000 |
| Gisborne/Hawke's Bay | 22,000 |
| Manawatu-Wanganui | 21,800 |
| Northland | 20,500 |
| Bay of Plenty | 19,900 |
| Otago | 19,800 |
Table 14.18. Proportions of gross income received and tax paid
By household gross income
decile
Year ending 30 June
2004
| Decile | Gross income | Tax paid1 |
|---|---|---|
1Includes personal income tax, family support and rebates. Note: Figures may not add to stated totals due to rounding. Source: Statistics New Zealand | ||
| Percent | ||
| 1 (Under $15,700) | 1.5 | 1.0 |
| 2 ($15,700 to $22,199) | 3.1 | 1.3 |
| 3 ($22,200 to $27,699) | 4.1 | 2.2 |
| 4 ($27,700 to $36,399) | 5.4 | 3.6 |
| 5 ($36,400 to $45,999) | 6.9 | 5.4 |
| 6 ($46,000 to $57,699) | 8.7 | 7.5 |
| 7 ($57,700 to $70,499) | 10.8 | 10.2 |
| 8 ($70,500 to $87,399) | 13.1 | 12.7 |
| 9 ($87,400 to $119,299) | 16.7 | 17.6 |
| 10 ($119,300 and over) | 29.6 | 38.5 |
It is commonly assumed that income is shared within households. On this basis, it can be argued that income and income inequality is best analysed at a household level, as opposed to an individual level. Data from the Household Economic Survey is used to analyse income at a household level.
Table 14.18 shows the proportion of gross income received, and tax paid, by each household gross income decile. This shows that the top 10 percent of households receive 29.6 percent of total gross income and pay 38.5 percent of personal income tax.
Table 14.19 shows that in the year ending 30 June 2004, fewer females (35.6 percent) than males (39.4 percent) lived in households that received $71,300 or more.
Table 14.19. Annual household income deciles
By
sex
Year ending 30 June
2004
| Decile | Males | Females | Males | Females |
|---|---|---|---|---|
Note: Figures may not add to stated totals due to rounding. Source: Statistics New Zealand | ||||
| (000) | Percent | |||
| 1 (Under $15,900) | 104.9 | 119.5 | 5.4 | 5.9 |
| 2 ($15,900 to $22,999) | 92.1 | 149.9 | 4.7 | 7.4 |
| 3 ($23,000 to $28,799) | 155.7 | 171.3 | 8.0 | 8.5 |
| 4 ($28,800 to $37,899) | 188.4 | 201.0 | 9.7 | 10.0 |
| 5 ($37,900 to $47,299) | 198.1 | 213.0 | 10.2 | 10.6 |
| 6 ($47,300 to $58,899) | 221.3 | 209.5 | 11.4 | 10.4 |
| 7 ($58,900 to $71.299) | 217.7 | 231.2 | 11.2 | 11.5 |
| 8 ($71,300 to $87,599) | 241.8 | 220.5 | 12.4 | 11.0 |
| 9 ($87,600 to $119,999) | 250.6 | 225.9 | 12.9 | 11.2 |
| 10 ($120,000 and over) | 274.7 | 270.5 | 14.1 | 13.4 |
| 11 All income groups | 1,945.1 | 2,012.4 | 100.0 | 100.0 |
Surveyed salary and wage rates (including overtime) for the June 2005 quarter were 2.7 percent higher than a year earlier, as shown in Table 14.20.
This was the largest annual increase since the survey began in the December 1992 quarter and followed an annual increase of 2.5 percent in the March 2005 quarter.
Pay rates for the private sector for the year to the June 2005 quarter increased by 2.6 percent, while those for the public sector increased by 2.9 percent. Fifty-nine percent of surveyed salary and ordinary time wage rates increased in the year ending 30 June 2005. Sixteen percent of these reported an increase of more than 5 percent, the highest proportion recorded since the survey began in the December 1992 quarter.
Table 14.2. Salary and wage rates index (including
overtime)1
By sector
| Local government sector | Central government sector | Total public sector | Private sector | All sectors combined | ||
|---|---|---|---|---|---|---|
1Base: December 1992 quarter (=1000). Source: Statistics New Zealand | ||||||
| Quarters | ||||||
| 2003 | –Sep | 1057 | 1062 | 1062 | 1049 | 1052 |
| –Dec | 1062 | 1069 | 1068 | 1055 | 1058 | |
| 2004 | –Mar | 1067 | 1073 | 1072 | 1060 | 1062 |
| – Jun | 1071 | 1078 | 1078 | 1066 | 1068 | |
| – Sep | 1079 | 1087 | 1087 | 1073 | 1075 | |
| – Dec | 1082 | 1097 | 1096 | 1081 | 1084 | |
| 2005 | –Mar | 1088 | 1102 | 1100 | 1086 | 1089 |
| – Jun | 1094 | 1111 | 1109 | 1094 | 1097 | |
| Percentage change from same quarter of previous year | ||||||
| 2003 | –Sep | 2.0 | 3.1 | 3.0 | 2.1 | 2.3 |
| – Dec | 1.8 | 3.0 | 2.8 | 2.2 | 2.4 | |
| 2004 | –Mar | 1.9 | 2.8 | 2.6 | 2.1 | 2.2 |
| – Jun | 2.0 | 2.7 | 2.7 | 2.2 | 2.3 | |
| – Sep | 2.1 | 2.4 | 2.4 | 2.3 | 2.2 | |
| – Dec | 1.9 | 2.6 | 2.6 | 2.5 | 2.5 | |
| 2005 | –Mar | 2.0 | 2.7 | 2.6 | 2.5 | 2.5 |
| – Jun | 2.1 | 3.1 | 2.9 | 2.6 | 2.7 | |
The Labour Cost Index (LCI) measures movements in base salary and ordinary time wage rates, overtime wage rates and non-wage labour costs.
The index began in the December 1992 quarter and replaced the Weekly Wage Rates Index.
The LCI is a quality-controlled measure, meaning only changes in salary and wage rates for the same quality and quantity of work are reflected in the index. Increases due to service increments and merit promotions are excluded.
Each quarter, businesses in the sample are asked to provide information about wage and salary costs for specific job descriptions in a variety of occupations. Businesses are also asked to provide information on non-wage labour costs in the June quarter of each year.
Salaries and wages account for the majority of labour costs. Labour costs increased overall by 2.7 percent from the June 2004 quarter to the June 2005 quarter. This increase was due to increases in salary and wage rates (including overtime) of 2.7 percent and in non-wage labour costs of 3.0 percent.
The increase in non-wage labour costs was due to rises in the cost of annual leave and statutory holidays, superannuation and workplace accident insurance, and was partly offset by an overall fall in other non-wage labour costs.
Workplace accident insurance costs increased 7.2 percent from the June 2004 quarter to the June 2005 quarter and employer superannuation costs increased 7.3 percent.
The increase in superannuation costs was influenced by a 2.6 percent increase in salary and ordinary time wage rates.
The cost to employers of annual leave and statutory holidays rose by 2.9 percent from the June 2004 quarter to the June 2005 quarter. In the same period, salary and wage rates (including overtime) increased by 2.7 percent.
The number of paid statutory holidays was 10 during this period, the same number recorded in 2004. Waitangi Day did not fall on a weekday in 2005 so was not a paid holiday for most employees.
The other surveyed non-wage costs (which include motor vehicles available for private use, medical insurance and employer-related low interest loans) are subject to fringe benefit tax. These costs fell by 2.8 percent from the June 2004 quarter to the June 2005 quarter
The cost of providing motor vehicles available for private use and medical insurance fell, while the cost of providing employer-related low interest loans rose.
Table 14.21 shows movements in the LCI since 1997.
Table 14.21. Labour Cost Index1
By type of cost
| June quarter | Salary and ordinary time wage rates | Overtime wage rates2 | All salary and wage rates3 | All non-wage labour costs4, 6 | All labour costs5, 6 |
|---|---|---|---|---|---|
1Base: June 2001 quarter (=1000). 2Measures changes in rates paid for actual hours worked as overtime in the base period. Some of these pay rates have fallen to ordinary time levels in subsequent quarters. 3Including overtime. 4Measures changes in all surveyed non-wage labour costs fie annual leave and statutory holidays, superannuation, workplace accident insurance, medical insurance, motor vehicles available for private use and low interest loans). 5Measures changes in all surveyed labour costs (i.e. all salary and wage rates and all non-wage labour costs). 6Revisions to series were made in the June 2005 quarter as the result of quality improvement to the non-wage labour cost indexes. Source: Statistics New Zealand | |||||
| 1997 | 934 | 967 | 936 | 1020 | 949 |
| 1998 | 952 | 974 | 954 | 1002 | 962 |
| 1999 | 966 | 975 | 967 | 962 | 966 |
| 2000 | 983 | 983 | 983 | 978 | 982 |
| 2001 | 1000 | 1000 | 1000 | 1000 | 1000 |
| 2002 | 1021 | 1023 | 1021 | 1005 | 1018 |
| 2003 | 1044 | 1048 | 1044 | 1019 | 1040 |
| 2004 | 1068 | 1077 | 1068 | 1013 | 1059 |
| 2005 | 1096 | 1109 | 1097 | 1043 | 1088 |
| Percentage change from June quarter of previous year | |||||
| 1997 | 2.5 | 2.2 | 2.5 | 3.0 | 2.5 |
| 1998 | 2.0 | 0.8 | 2.0 | -1.8 | 1.3 |
| 1999 | 1.5 | 0.1 | 1.4 | -4.0 | 0.5 |
| 2000 | 1.7 | 0.9 | 1.6 | 1.6 | 1.6 |
| 2001 | 1.8 | 1.7 | 1.8 | 2.3 | 1.9 |
| 2002 | 2.1 | 2.3 | 2.1 | 0.5 | 1.8 |
| 2003 | 2.3 | 2.4 | 2.3 | 1.4 | 2.2 |
| 2004 | 2.3 | 2.8 | 2.3 | -0.6 | 1.8 |
| 2005 | 2.6 | 3.0 | 2.7 | 3.0 | 2.7 |
14.1 Department of Labour; Equal Employment Opportunities Trust; New Zealand Council of Trade Unions; Business New Zealand; State Services Commission; Statistics New Zealand.
14.2–14.4 Statistics New Zealand.
14.5 Ministry of Social Development; Statistics New Zealand.
14.6 Statistics New Zealand.
www.businessnz.org.nz – Business New Zealand
www.dol.govt.nz – Department of Labour
www.ers.dol.govt.nz – Employment Relations Service
www.eeotrust.org.nz – Equal Employment Opportunities Trust
www.lmpg.govt.nz – Labour Market Policy Group
www.msd.govt.nz – Ministry of Social Development
www.ssc.govt.nz – State Services Commission
www.stats.govt.nz – Statistics New Zealand
www.union.org.nz – New Zealand Council of Trade Unions
Table of Contents
Waikato University scientists have developed an enzyme-based product that can extract DNA from smaller samples three times faster and cheaper than existing methods. It was released onto the billion-dollar world market early in 2006.
New Zealand's science sector consists of many organisations with specialised roles. These include a policy agency, research-funding agencies and a number of organisations carrying out research. Research organisations include universities and polytechnics, Crown Research Institutes, private companies and research associations.
The Ministry of Research, Science and Technology Te Manatū Pūtaiao (MoRST) is the main policy agency for research, science and technology in New Zealand. MoRST's major outcome for the next 10 to 15 years is: ‘Science and technology transforming New Zealander's lives’. The ministry's main roles are:
Providing policy advice to the government on research, science and technology, including investment priorities, science matters and international science issues.
Applying research, science and technology policies for sustainable development and economic growth.
Managing contracts on behalf of the Minister of Research, Science and Technology with agencies that directly invest in research, science and technology and evaluating how various funding schemes are performing.
Promoting positive relationships between the research, science and technology sector, the business community and others so that ideas generated by researchers are passed on to those who can use them to generate new products, services and processes.
Promoting New Zealand research, science and technology internationally.
Raising the profile of research, science and technology within New Zealand to those making career choices and with the social, environmental and business sectors.
The Ministry of Research, Science and Technology website is www.morst.govt.nz
The Crown Company Monitoring Advisory Unit (CCMAU) provides ownership monitoring advice to, and manages issues on behalf of, shareholding ministers of Crown Research Institutes, state-owned enterprises and other Crown companies. In addition, the unit is responsible for ensuring the best qualified candidates are recommended to ministers for appointment as directors of these companies. The Crown Company Monitoring Advisory Unit website is www.ccmau.govt.nz
Scientific and technological research in New Zealand is funded by the government, by universities and by the private sector. Total government funding of research and development (R&D) in 2004, including general university funds and local government, was $718 million, equivalent to 0.52 percent of gross domestic product. Government funds account for 45 percent of total R&D funding. Major government investments related to research, science and technology include Vote: Research, Science and Technology ($599.85 million in 2005/06); Vote: Crown Research Institutes ($3.14 million in 2005/06); and Vote: Education.
The 2005 Budget included a $203.56 million increase to Vote: Research, Science and Technology over the following four years. There was $45.04 million in new funding for the 2005/06 financial year, main areas being:
Boosting the commercial value of science – for Technology New Zealand, the International Investment Opportunities Fund and research consortia.
Promoting excellence and talent in research, science and technology – for the Marsden Fund, Fulbright Scholarships, Crown Research Institute Capability Fund and Technology for Industry Fellowships.
Enhancing health and well-being – for health, marine, and information and environmental research.
Shaping the system – for policy advice and contract management.
How we measure up – research and development Research and development expenditure – At 1.16 percent of gross domestic product, New Zealand's research and development (R&D) expenditure in 2004 was well below the OECD average of 2.24 percent of GDR. However, the New Zealand Government's share of R&D spending was 0.34 percent of GDR higher than the OECD government average of 0.25 percent. Research and development expenditure As percentage of GDP
Number of researchers – New Zealand is eighth among OECD countries in terms of the number of researchers per 1,000 people employed. This places New Zealand (7.8 per 1,000) behind Belgium (8.7 per 1,000), but ahead of Australia (7.6 per 1,000). Finland has the highest number of researchers, 17.7 per 1,000 people employed. Number of researchers Per 1,000 people employed Latest year available 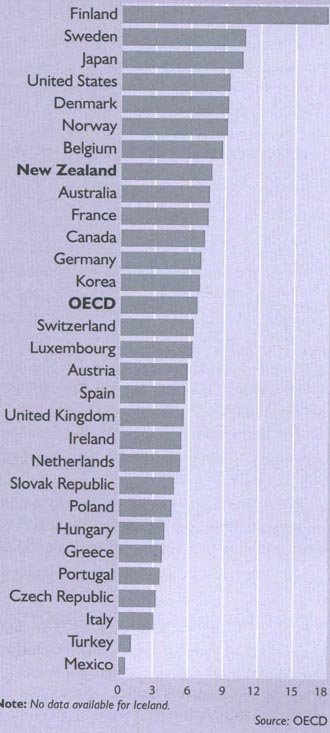 | ||||||||||||||||||||||||||||||||||||||||||||||||||||||||||||||||||
Vote: Research, Science and Technology invests in four major goal areas: economic (44.4 percent), knowledge (29.8 percent), environmental (15.2 percent) and social (10.6 percent). These proportions are illustrated in Figure 15.01.
Knowledge ($168.94 million in the 2005/06 financial year). This goal is to accelerate knowledge creation and develop people, learning systems and networks to enhance New Zealand's capacity to innovate.
The Marsden Fund encourages excellence in the advancement of knowledge by supporting research exploring the frontiers of new knowledge. In the 10 years it has been in operation, the fund has supported research that has opened up new insights in biology, mathematics, astrophysics, geology, ecology, humanities and the social sciences. For example, it has funded research to investigate proteins that affect ovulation and fertility in mammals. The research has led to development of a vaccine that can be adjusted so that sheep either increase their rate of ovulation or do not ovulate at all. This has implications for the control of fertility in some mammals, including humans. The Marsden Fund Council allocated a budget of $33.93 million in the 2005/06 financial year.
The New Economy Research Fund develops research capability and knowledge in areas of science and technology where new industries and enterprises are emerging. For example, the fund has helped AgResearch develop a joint venture in the United States that allows it to produce and license commercial products from its plant gene research. This research is primarily to improve pastoral production in New Zealand, but also has applications in other plant species, including major crop plants, and has potential in other areas, such as biomedical diagnostics or animal vaccines. The fund had a budget of $61.59 million in the 2005/06 financial year.
The Crown Research Institute Capability Fund helps Crown Research Institutes retain and develop research programmes they identify as important, including new areas of science. For example, the Institute of Environmental Science and Research (ESR) has expertise in both forensics and microbiology, but now a new area of forensic science is emerging – microbial forensics. It emerged following the deliberate release of anthrax (bacillus anthracis) in the United States in 2001 and ESR will use the fund to develop capabilities in this new area of forensic science. In the 2005/06 financial year, $38.11 million was available for this type of funding.
Supporting Promising Individuals makes awards and fellowships available to people needed to sustain future development of the innovation system in New Zealand. For example, Shelley Scott was supported by a Post-Doctoral Fellowship to continue her award-winning nanotechnology research, based on borrowing ideas from nature, such as the spontaneous pattern formation of snowflakes, to develop methods that force tiny atoms to assemble themselves into required shapes or nanostructures. Driving her research was global demand to break through the restrictive size barrier of conventional technology and allow smaller, more powerful components for computers and other devices. A range of awards and fellowships worth $16.97 million were available under this fund in the 2005/06 financial year.
Promoting an Innovation Culture supports activities that strengthen and encourage a culture of innovation in New Zealand. This includes promoting positive attitudes to, and raising awareness of, science and technology, and engaging with New Zealanders over issues associated with new and emerging scientific and technological developments. For example, this fund has contributed to www.joule.org.nz, a website dedicated to helping promote science and technology. It gives advice on promotion, contact details for people and venues, event information and encourages science and technology communicators and promoters to share their ideas. Funds totalling $3.44 million were available in the 2005/06 financial year.
Developing International Linkages promotes and supports New Zealand research, science and technology internationally by accessing and utilising the best global ideas and encouraging New Zealanders to use international linkages to enhance our knowledge base and innovative capacity. It funds activities such as a programme to build science and technology partnerships with North Asian countries. This programme saw the Ministry of Research, Science and Technology sign a science collaboration agreement with the Japan Society for the Promotion of Science in June 2005. The Foundation for Research, Science and Technology has also signed a Memorandum of Understanding with the Korean Science and Engineering Foundation and a joint programme of activity is now being developed to be supported by investment from both parties. Total funding of $2.36 million was available in the 2005/06 financial year.
International Investment Opportunities Fund supports research providers and research funders' participation in international research collaborations and the recruitment of highly experienced researchers from overseas. This fund has allowed Dr Chris Miles, of AgResearch, to work with a range of European nations to develop cost-effective tools for tracing and managing the risk of marine biotoxins in seafood. Funding of $7.68 million was available in 2005/06.
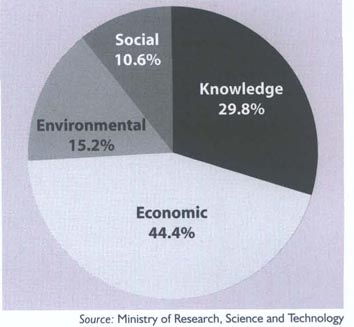
Economic ($258.58 million in the 2005/06 financial year). The goal is to increase the contribution knowledge and technology make to the competitiveness of New Zealand enterprises.
Research for Industry provides research funds to increase the competitiveness of sectors such as the food and fibre industries, manufacturing and services industries and infrastructures such as communications, energy, water and waste. An example is the collaborative approach of Beacon Pathway Ltd, which is working with a group of funding and research partners, including Landcare Research and Victoria University, on a programme to raise the environmental and sustainable standard of New Zealand homes by 2012. This involves reducing the demand for resources such as water and energy while improving safety and health. Research for Industry had a budget of $188.00 million in the 2005/06 financial year.
Technology New Zealand supports businesses by improving their ability to adopt and to use new technology and innovation. For example, it has helped a New Zealand company, PowerShield, develop one of the world's first automatic monitoring systems to measure, record and analyse back-up battery systems. This development means an end to laborious manual testing of emergency battery systems for businesses that must have a continuous power supply, such as airlines, traffic control, power, telecommunications and data processing companies. Technology New Zealand had a budget of $54.40 million in the 2005/06 financial year.
The Pre-Seed Accelerator Fund aims to increase the rate of commercialisation of innovations from publicly-funded research by Crown-owned research providers. It assists Crown Research Institutes and tertiary education institutes to develop a discovery to the point where its commercial potential is apparent and private sector investors are willing to invest the further funds required for full commercialisation. For example, investment through this fund has fast-tracked the commercialisation of leading-edge wireless devices for monitoring heart, brain and nerve signals in laboratory animals. The system is unique in that it measures the signals from nerves as well as the heart and brain and, because the devices can transmit signals to receivers on different frequencies, multiple units can operate at the same time in the one room. The Pre-Seed Accelerator Fund was $4.27 million in the 2005/06 financial year.
National Measurement Standards funds the Measurement Standards Laboratory to provide specified national measurement standards and related services to satisfy the need for accurate measurement and internationally accepted standards for New Zealand products, processes and services, as well as obligations of the Minister of Research, Science and Technology under the Measurement Standards Act 1992. In 2005/06, $4.90 million was allocated to measurement standards.
Environmental ($86.38 million in the 2005/06 financial year). The goal is to increase understanding of the environment and factors that affect it in order to establish and maintain a healthy environment.
Environmental Research builds understanding of the environment through public good research in areas such as New Zealand's ecosystems, the biophysical and human environments, and in sustainable management of the environment by the production sector. For example, the National Institute of Water and Atmospheric Research, in conjunction with the United Kingdom Met Office, has developed models using information on climate – including rainfall – and river flows that allow it to provide earlier, more accurate predictions of where flooding could occur and how serious it might be. The system is now being trialled in some of New Zealand's most flood-prone areas, including the Bay of Plenty and Gisborne.
Social ($59.93 million in the 2005/06 financial year). The goal is to increase knowledge of what constitutes well-being so as to build a society in which all New Zealanders enjoy health and independence, with a strong sense of belonging, identity and partnership.
Health Research supports public good research, science and technology to improve the health of New Zealanders. For example, the Health Research Council and the Ministry of Health are currently funding Professor David Simmons to trial a major community-based diabetes intervention in Māori communities in the Waikato. The prevalence of diabetes among the Māori community, along with people of Pacific origin, is three times higher than among other New Zealanders. More than 5,000 participants have been enrolled to trial a regime of lifestyle changes aimed at reducing their risk of developing type 2 diabetes. Health Research funding of $54.07 million was available in the 2005/06 financial year.
Social Research supports public good research, science and technology to improve social well-being. For example, Victoria University is currently investigating initiatives to better develop and use the talent available in the New Zealand workforce and to create work environments where employees are keen to learn and where their talents are used to the full. Funds available under Social Research totalled $5.86 million in the 2005/06 financial year.
Shaping the system. About five percent ($32.18 million in the 2005/06 financial year) of the government's total investment is spent on ‘shaping the system’. This funding supports agencies that advise the government on its policies for innovation, and provides for management and monitoring of the government's investment in research, science and technology. It also allows the Minister of Research, Science and Technology to take a wider view across the entire research, science and technology system.
The Foundation for Research, Science and Technology Tūāpapa Rangahau Pūtaiao is a Crown entity with an independent board reporting to the Minister of Research, Science and Technology.
It is responsible for investing in research, science and technology on behalf of the government so as to enhance the wealth and well-being of New Zealanders; for providing independent policy advice on science and technology to the government; for encouraging technological innovation through the Technology New Zealand scheme; and for administering various scholarship schemes.
‘Investing in innovation for New Zealand's future’ is the mission statement of the foundation, which considers innovation a key to a prosperous and productive future for New Zealand.
The foundation sees innovation as providing organisations and the nation with fundamental competitive advantages and considers innovation to be just as applicable in the social and environmental arenas as it is in the commercial world.
The foundation receives applications from Crown Research Institutes, research associations, government departments, incorporated societies, non-profit private trusts, private individuals, state-owned enterprises and universities to undertake agreed research programmes which contribute to the achievement of the government's science goals. The Foundation for Research, Science and Technology website is www.frst.govt.nz
The Royal Society of New Zealand is an independent, statutory body incorporating the National Academy of Sciences and scientific and technological societies. It encourages professional development through research grants, fellowships, communications courses, awards and prizes.
The society advances and promotes science and technology in New Zealand, recognises and encourages excellence in research, establishes ethical standards, supports science and technology education and publishes scientific journals, reports and educational resources.
Established in 1867 as the New Zealand Institute, the society is incorporated under The Royal Society of New Zealand Act 1997. It is charged with the statutory responsibility of fostering a culture supportive of science and technology in New Zealand and of initiating appropriate international linkages. It also provides expert advice on important public issues to the government and the community.
Membership comprises elected fellows, regional branches, constituent scientific and technological societies and more than 15,000 professional people in New Zealand and overseas. The Royal Society of New Zealand website is www.rsnz.org
The New Zealand Venture Investment Fund (NZVIF) was established as part of the government's 2001 Budget and on 1 July 2002 it became a Crown-owned company, the New Zealand Venture Investment Fund Ltd. The fund administers two equity investment programmes on behalf of the New Zealand government: the VIF Venture Capital Fund and, more recently, the Seed Co-investment Fund.
The Venture Capital Fund is a $100 million investment programme designed to accelerate development of the venture capital market in New Zealand. NZVIF invests its capital, alongside private investors, in selected venture capital investment funds operated by professional fund managers. Each fund operates for 10 years, investing in a portfolio of New Zealand companies with high growth potential, assisting those companies to build and develop successful commercialisation strategies. The programme targets early stage venture capital investment, and a buy-out option for investors is an integral aspect of the programme.
The Seed Co-investment Fund aims to provide seed funding for early stage businesses with strong potential for high growth. The fund is managed by NZVIF and has $40 million of seed funding available for co-investment alongside selected private investor groups. There is an upper funding cap of $250,000 per investment, with a requirement for at least 50:50 matching funding from private investors. The New Zealand Venture Investment Fund website is www.nzvif.co.nz
GNS Science (the former Institute of Geological and Nuclear Sciences) is one of nine Crown Research Institutes which receives research funding through the Foundation for Research, Science and Technology.
In 2004, expenditure by New Zealand universities on research and development (R&D) was estimated at $454.8 million – 29 percent of New Zealand's total expenditure on R&D. Of this, $121.8 million (ex-GST) was general university funds from Vote Education, while $169 million came from government research contracts – of which $117 million came from Vote: Research, Science and Technology. R&D expenditure totalling $114 million originated from universities' own funds (which include student fees), while the remainder came from business, overseas and other sources.
Figure 15.02 illustrates government funding of scientific research.
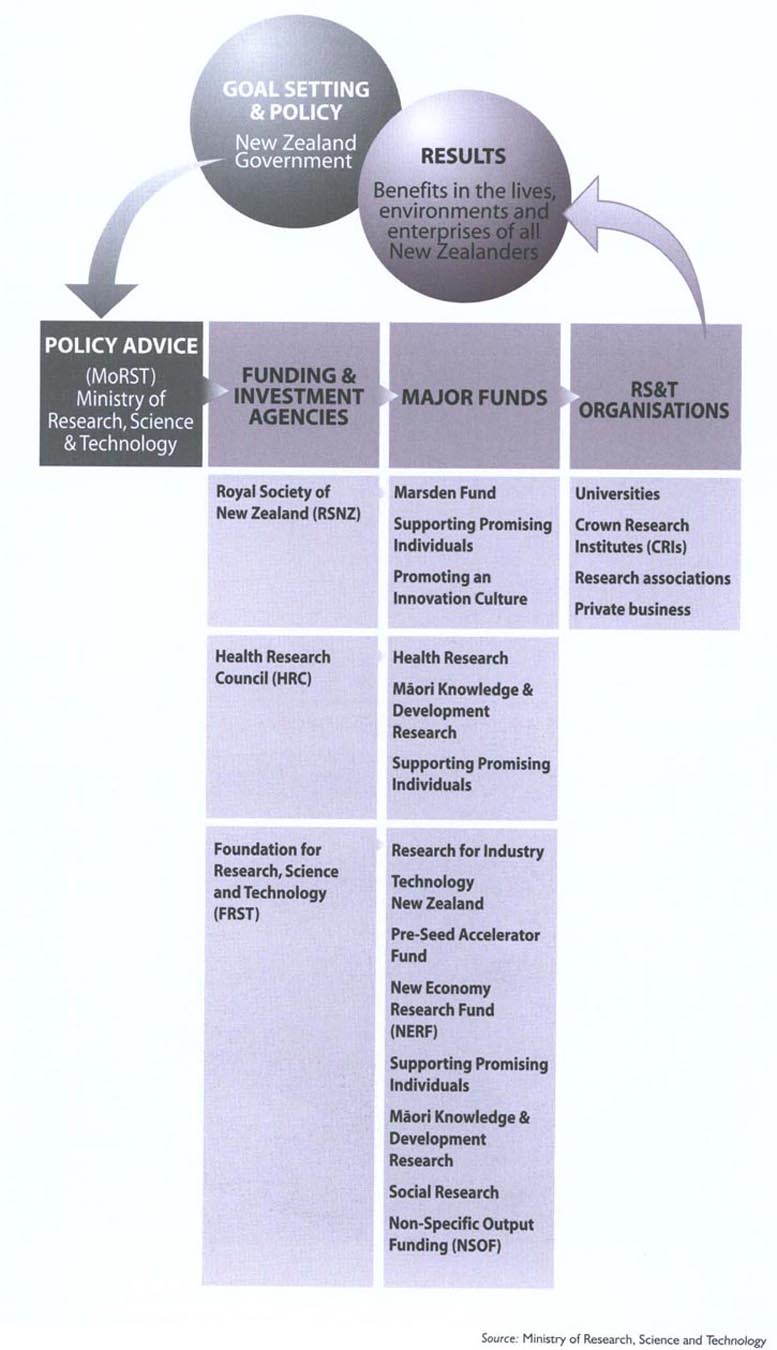
There are nine autonomous Crown Research Institutes (CRIs). Government-owned, they are collectively New Zealand's largest science enterprises. Each manages its own assets and has its own independent board of directors reporting to shareholding ministers. Their purpose is to do research of benefit to New Zealand, while remaining financially viable.
Ownership of the institutes remains with the government, represented by two shareholding ministers, the Minister for Crown Research Institutes and the Minister of Finance.
The nine CRIs employ more than 4,230 staff and directly generate revenues of more than $550 million, gained by competing for public and private sector business. Additionally, their research and commercialisation activity underpins the economic, environmental and social values being created by businesses, departments and central and local government agencies.
The nine CRIs returned an after-tax and non-operating items surplus of $7.8 million for the year ending 30 June 2005 and paid dividends of $15 million.
The Association of Crown Research Institutes (ACRI) coordinates policy and advocacy on matters of shared interest among members and liaises with other science enterprises, such as businesses and universities. The association's website is www.acri.cri.nz
Scion. New Zealand Crown Research Institute Scion, formerly the Forest Research Institute, has been recognised as a leader in forestry science since its inception in 1947. The company recently expanded its research capabilities to meet the growing consumer demand for renewable materials and products from plants. Researchers concentrate on research and development in the areas of cellwall biotechnology, biomaterials engineering, eco-smart technologies and sustainable consumer products. Ensis is an unincorporated joint venture between Scion and Australia's Commonwealth Scientific and Industrial Research Organisation. The partnership is the largest provider of research and development services to the forestry, wood and fibre industries in Australasia. With approximately 350 staff, Scion operates from its headquarters in Rotorua and offices in Christchurch and Australia. The Scion website is www.scionresearch.com
AgResearch Ltd. AgResearch Ltd is New Zealand's largest Crown Research Institute – a combination of research centres such as Ruakura, Grasslands, Wallaceville, Lincoln and Invermay, and individual scientists and teams whose work is at the heart of pastoral industries, food processing and innovative products that benefit all New Zealanders. AgResearch's operations are critical to ensuring the prosperity, security and ecological sustainability of New Zealand's pastoral sector. The sector is the backbone of New Zealand's economy and its continued success is essential to the living standards of all New Zealanders. AgResearch was established in 1992 as a government-owned company charged with operating on a full commercial basis. The company has about 950 permanent staff members, nearly 300 of whom hold PhDs. Corporate office is at Ruakura, Hamilton. AgResearch owns or jointly owns a number of subsidiary companies. Its website is www.agresearch.co.nz
More than 1,200 species were recovered in a 24-hour search in Waitakere for every kind of life – from plants to fungi to fish to animals – in the 2006 version of the Landcare Research programme ‘BioBlitz—finding nature in the city.’
HortResearch. HortResearch (Horticulture and Food Research Institute of New Zealand Ltd) is New Zealand's largest horticulture and food research organisation, helping to grow exports and develop new markets. HortResearch scientists work alongside some of New Zealand's largest plant-based and food processing industries. Their research spans genomics, molecular biology, plant and tree breeding, crop production, food processing, fruit storage and transport, and evaluation of consumer preferences. New fruits developed from HortResearch's breeding programmes to meet consumer requirements include yellow-fleshed kiwifruit, a red-fleshed apple and blueberries with a longer fruiting season. HortResearch has more than 500 science and support staff in 10 regional research centres and orchards throughout New Zealand. HortResearch aims to support sustainable production systems and the purity, safety and customer acceptability of plant-based products. Research and development covers a large range of crops of economic importance to New Zealand, including fruit, cut flowers, forest trees, ornamentals and vegetables. The HortResearch website is www.hortresearch.co.nz
New Zealand Institute for Crop & Food Research Ltd. Crop & Food Research is a New Zealand-based biological science company that carries out both government-funded research and work for commercial clients. Research is organised under five centres of innovation – sustainable land and water use, high performance plants, personalised foods, high value marine products, and biomolecules and biomaterials. To promote the application of science, the company undertakes research in partnership with a range of national and international industry and government clients. Many research collaborations are commercialised with business partners. Employing 360 staff, the Crown Research Institute is based at Lincoln, Canterbury, with research stations in Auckland. Hawke's Bay, Palmerston North, Nelson, Dunedin, Invermay, Gore and Albury, Australia. The Crop & Food Research website is www.crop.cri.nz
Landcare Research New Zealand Limited. Landcare Research Manaaki Whenua has about 400 staff working on all aspects of resource management – sustainability of land-use practices; documenting indigenous biodiversity; enhancing natural habitats; low impact urban design and development; urban ecology; restoration projects; managing weeds, pests and biosecurity risks; maintaining quality of soil, land, air and water resources; reducing pollution and mitigating contamination; sustainable business; minimising waste and using resources more efficiently; and reducing greenhouse gas emissions and enhancing carbon sinks. The company also develops innovative applications for technology (e.g. satellite imagery and remote sensing radio telemetry equipment, and geographic information systems) to assist resource management. It maintains a wide range of analytical laboratories, including environmental health and toxicology services. Landcare Research is a strong proponent of collaboration with scientists in other Crown Research Institutes, universities and overseas research agencies. It works closely with end-users, such as the New Zealand and overseas governments, local and regional authorities, corporates, industry, tourism, iwi and other land-owners. Landcare Research science programmes contribute to global research projects and international sustainable development aid projects. The Landcare Research website is www.landcareresearch.co.nz
GNS Science is New Zealand's leading supplier of earth and isotope scientific research and consultancy services. As well as public-good research, activities include resource evaluation for the petroleum exploration industry; assessment and mitigation of natural hazards; geological mapping; engineering geology; geophysical surveys; assessment and development of geothermal fields; assessment of groundwater quality and quantity; environmental chemistry; marine geology; and the application of isotope sciences to age dating and to the medical, environmental and manufacturing industries. GNS Science has a 130-year history in earth sciences. It has 285 staff and its library, databases and fossil collections are of national importance. GNS Science has 10 sections – geological time; mapping; hydrocarbons; geothermal and minerals; earthquakes, volcanoes, tectonics; geohazards monitoring; geohazards solutions; ISOSCAN, the National Isotope Centre: ocean exploration; and information technology. It has offices in Wellington, Wairakei and Dunedin. GNS Science research and commercial services benefit a wide range of private sector companies and government organisations in New Zealand and overseas. To strengthen effectiveness, GNS Science has developed many partnerships with private sector companies, state owned enterprises, universities and international research organisations. The GNS Science website is www.gns.cri.nz
Industrial Research Ltd's purpose is to create value for New Zealand through world-class science and technology. The company has approximately 400 staff in Auckland, Wellington and Christchurch. Activities are focused around three market sectors – health, energy and information and communication technologies. The Industrial Research website is www.irl.cri.nz
National Institute of Water and Atmospheric Research Ltd. The National Institute of Water and Atmospheric Research Limited Taihoro Nukurangi (NIWA) is an environmental science research organisation creating and delivering science-based products and services that enable people and businesses to make the best use of the natural environment and its living resources, and to derive benefit from them in a sustainable manner. NIWA's science provides the basis for sustainable resource management, and its consultancy services help clients solve problems on the use and management of:
Atmosphere, natural hazards and energy – the physical and chemical processes affecting the atmosphere and climate, including global effects, stratospheric research and atmosphere-ocean interactions, sea level rise, glaciers, ozone, UV, rainfall, drought, climate change; floods and droughts, extreme weather, coastal erosion, undersea earthquakes and landslides, tsunamis; renewable energy, energy efficiency, greenhouse gases, vehicle emissions, air quality, hydro inflows.
Freshwater – the chemistry, physics and biology of lakes, rivers and wetlands; the complex interactions influencing these ecosystems and their response to environmental disturbances; water quality and quantity, algal blooms.
Coasts and oceans – the geological, biological and physical properties of oceans, coastal waters, estuaries and harbours; seafloor mapping, coastal development and pollution, sediment, wave forecasting, tides, currents, continental shelf, submarine volcanoes, algal blooms.
Fisheries – fisheries stock assessment, fisheries modelling and population dynamics; fish biology, ecology, genetics and pathology.
Aquaculture and marine natural products – all species breeding, early life history, growth and survival, hatchery technology, and other research designed to lead to commercial development; biotechnology, bioactive compounds including anti-inflammatories, anti-cancer, probiotics, skincare, anti-fouling.
Aquatic biodiversity and biosecurity – biodiversity surveys, aquatic pests, introduced species, toxic algae, ecosystems including seamounts, DNA analysis.
NIWA was established as a Crown Research Institute in 1992. It operates as a stand-alone company with its own board of directors. In 2005, NIWA had 611 staff at 15 sites around New Zealand, re venue of $91 million, and assets of $70 million. The corporate office is in Auckland, the main research campuses are in Auckland, Hamilton, Wellington, Nelson, Christchurch and Lauder, and there are field offices in smaller centres. The company has subsidiaries in Australia and the United States, and a vessel company which owns and operates the deepwater research vessel Tangaroa and the coastal research vessel Kaharoa, NIWA's website is www.niwa.co.nz
ESR (Environmental Science & Research) provides science-related research and consulting services in public health, environmental health and forensic sciences to the public and private sectors in New Zealand and the Asia-Pacific region. ESR employs 350 staff who work from the Mt Albert Science Centre in Auckland, the Kenepuru Science Centre in Porirua and the Christchurch Science Centre. Corporate headquarters is at Kenepuru. Each science centre is equipped with advanced technologies and information systems to support teams of nationally and internationally-recognised scientists. The ESR (Environmental Science & Research) website is www.esr.cri.nz
Carter Observatory. Carter Observatory was established by act of parliament in 1938 and is named after Charles Rooking Carter, a prominent pioneer in Wellington and the Wairarapa. The act was amended in 1977 to recognise Carter Observatory as the National Observatory of New Zealand. The Wellington-based observatory has a full-time permanent staff of four, plus seven permanent part-time and eight casual staff. In addition, it can call upon specialist honorary consultants and honorary research associates. The observatory has four distinct functions: public astronomy, astronomical education, facilitating astronomical research and heritage preservation. The observatory hosts about 50,000 visitors and 10,000 students a year at its site in the Wellington Botanic Gardens. It makes its own planetarium programmes, audio-visual shows and displays and offers a public information service in astronomy. Carter Observatory offers a National Certificate of Educational Achievement-accredited computer-based course in astronomy. This augments on-site teaching programmes for class groups, which attract students from throughout New Zealand. As the national repository for astronomical heritage, the observatory has collections of instruments and archives relating to important New Zealand amateur and professional astronomers. The Carter Observatory website is www.carterobservatory.org
Cawthron Institute. The Cawthron Institute, a private scientific research centre with 150 staff, was established in 1924. Operations are based in central Nelson, with an aquaculture research field station near the city. Its testing laboratories are IANZ registered and accredited by the United States Food and Drug Agency for biotoxin monitoring of shellfish. The institute undertakes research into marine and freshwater biology and ecology. Much of this work is funded through government scientific research programmes. Research interests include aquaculture (particularly shellfish), shellfish selective breeding and husbandry, microalgea culturing and biochemistry. Biosecurity is another area of interest, with invasions by foreign marine organisms representing a threat to New Zealand's biosecurity. Joint projects with other laboratories and shipping companies have examined the efficiency of ballast water exchange practices, and methods of treatment to remove unwanted organisms. Recent work has centred on hull fouling as a source of introduction and dispersal. The institute also provides commercial services to industry, specialist scientific advice to resource managers and users on environmental issues, and analytical laboratory testing services for a wide range of New Zealand clients. This work includes resource surveys and impact assessments, such as the effects of discharges and land use on the aquatic environment, baseline surveys, monitoring of coastal and freshwater environs and oil spill contingency planning. Cawthron Institute scientists work closely with other research organisations and have good links with overseas groups. Research on toxic algal blooms has resulted in a close relationship with researchers at Tohoku University, Japan; the Japan National Fisheries Agency in Sendai; the Monterey Bay Aquarium Research Institute, California; the Florida Marine Institute; the Cork Institute of Technology, Ireland; and the Irish Marine Institute, Dublin. The Cawthron Institute website is www.cawthron.org.nz
Government departments. Several government departments carry out research and development to support their own activities, including development and implementation of policy. Departments with a substantial research interest include the Ministry of Fisheries, the Ministry of Social Development, the Department of Conservation, the Ministry of Agriculture and Forestry (in particular Biosecurity New Zealand), the Ministry of Education, the Ministry of Health and the Ministry of Justice. Government agencies such as the Accident Compensation Corporation, the Earthquake Commission, Land Transport New Zealand and the Museum of New Zealand Te Papa Tongarewa are other important funders of research. In local government, regional councils contract significant amounts of environmental research as part of their role in managing the environment.
Higher education sector. Universities and polytechnics offer a broad range of tertiary education services that include science in all cases and aspects of technology in most. As well as this education and training function, these institutions carry out basic and strategic research and make substantial contributions in applied science and technology fields. The majority of this work is performed by the eight universities. Several universities have formal links with Crown Research Institutes.
A Victoria University researcher is the first scientist since Charles Darwin in 1859 to observe and record an insect (the New Zealand tree weta) eating and spreading seeds intact.
Centres of Research Excellence. Centres of Research Excellence were introduced during 2002/03 and are funded through Vote: Education to encourage development of world-class research in New Zealand. There are seven Centres of Research Excellence, each of them hosted by a university and comprising a number of partner organisations, including other universities, Crown Research Institutes and wānanga. They cover fields as diverse as bio-protection. Māori development, nanotechnology and molecular ecology.
Research consortia. Research consortia funding was introduced in 2002/03 to bring researchers and end users closer together and to promote collaboration among universities, Crown Research Institutes and businesses. There are 10 research consortia, many of them carrying out research related to New Zealand's primary production sector.
Whare wānanga. There are three Crown-funded Māori tertiary education institutions (whare wānanga) whose purpose is to create a significant entry point for Māori into tertiary education by providing education services and curriculum tailored toward Māori aspirations and needs. The whare wānanga all enjoy key relationships with iwi, hapū and whanau and with other education and research providers, including universities.
Research associations. Research associations are non-government, industry-linked institutions that provide research and technology transfer capabilities that may be beyond the reach of individual companies. Major research associations include the Building Research Association of New Zealand, the Cement and Concrete Association of New Zealand, the Heavy Engineering Research Association, the New Zealand Fertiliser Manufacturers' Research Association, the New Zealand Leather and Shoe Research Association and the Wool Research Organisation of New Zealand. Other research associations are private sector organisations that focus on specific areas of expertise. These include the Malaghan Institute (medical research), the Cawthron Institute (aquaculture and marine and freshwater ecology), the New Zealand Council for Educational Research and the New Zealand Institute for Economic Research. Research is also carried out by commercial market research firms, private research consultancies and research or analysis units within private enterprises, and by voluntary agencies.
Intellectual Property Office of New Zealand. The Intellectual Property Office of New Zealand (IPONZ) is a business unit of the Ministry of Economic Development and operates under the Patents Act 1953, the Trade Marks Act 2002 and the Designs Act 1953. These acts place statutory obligations on IPONZ and the Commissioner of Patents, Trade Marks and Designs in relation to the filing, examination, registration, grant and renewal of intellectual property rights. IPONZ also maintains registers of these rights and interests for searching by clients. IPONZ is a receiving office for applications filed under the Patent Cooperation Treaty (PCT), administered by the World Intellectual Property Organisation (WIPO).
Patents. The owner of an invention may apply to the Intellectual Property Office of New Zealand (IPONZ) to patent it under the New Zealand Patents Act 1953. A patent grants the owner the exclusive right to exploit the invention commercially in New Zealand for a maximum of 20 years. After the patent expires, anyone may make use of the invention. The Patents Act 1953 was recently reviewed and a new Patents Bill drafted to ensure that New Zealand's patent legislation reflects developments in international patent practice and continues to promote innovation and competition within New Zealand. IPONZ holds a comprehensive collection of patent specifications from a number of countries. It receives newly-published patents from New Zealand and other industrialised countries on CD-ROM. Available to the public, these patents describe the latest advances worldwide in every field of manufacture and have the potential to save New Zealand manufacturers substantial amounts of time and money in research and development. In the year ending 30 June 2005, letters patent were sealed on 4,479 applications. The IPONZ patent database can be searched at www.iponz.govt.nz
Trademarks. The owner of a trademark may apply to register it under the New Zealand Trade Marks Act 2002. Once the trademark is registered, the owner has the exclusive right to use it in New Zealand for the goods or services covered by the registration. If anyone else copies a registered mark without permission, the owner has a legal remedy. Trademarks may remain registered indefinitely by the payment of a renewal fee every 10 years. Anyone may search the online trademark database at www.iponz.govt.nz. Anyone planning to apply to register a trademark may request IPONZ, for a fee, to conduct a search of its records and report if someone else has already registered a similar mark, or request an official opinion on whether the mark is eligible for registration. There were 13,071 trademarks (21,089 classes) registered in the year ending 30 June 2005.
Designs. The owner of an industrial design (a novel shape or surface pattern on a manufactured article) may apply to register it under the New Zealand Designs Act 1953. Registration protects the design from unauthorised copying in New Zealand for a maximum of 15 years. The Intellectual Property Office of New Zealand (IPONZ) maintains a public register of designs, which anyone may search. There were 889 designs registered in the year ending 30 June 2005.
Patent, trademark and design applications in recent years are shown in Table 15.01. Not all applications result in registration.
Table 15.01. Applications for patents, trademarks and
designs
Years ending 30
June
| Year | Patents | Trademarks1 | Designs |
|---|---|---|---|
1The Trade Marks Act 2002, which came into force in August 2003, introduced a provision for filing multi-class applications. The trademark statistics from 2003 onward reflect these changes. Source: Intellectual Property Office of New Zealand | |||
| 1997 | 5,230 | 14,998 | 903 |
| 1998 | 5,557 | 15,529 | 850 |
| 1999 | 5,725 | 17,364 | 887 |
| 2000 | 6,269 | 22,771 | 967 |
| 2001 | 6,622 | 22,620 | 886 |
| 2002 | 6,718 | 19,173 | 937 |
| 2003 | 6,632 | 21,256 | 919 |
| 2004 | 6,334 | 16,604 (25,687)1 | 1,366 |
| 2005 | 6,397 | 16,641 (27,937)1 | 1,321 |
Plant variety rights. Plant variety rights are intellectual property rights provided under the Plant Variety Rights Act 1987. A plant variety right gives the breeder of a new plant variety the exclusive right to sell, or license others to sell, reproductive material of the variety. The Plant Variety Rights Office of the Ministry of Economic Development administers the act from Christchurch.
Copyright. Copyright is granted automatically upon the creation of any original literary, dramatic, musical or artistic work, sound recording, film, broadcast, cable programme or published edition. The Copyright Act 1994 is administered by the regulatory and competition policy branch of the Ministry of Economic Development.
Layout designs. The Layout Designs Act 1994 provides protection for the designs of integrated circuits. The act protects layout designs from unauthorised copying in New Zealand for up to 15 years. The act is administered by the regulatory and competition policy branch of the Ministry of Economic Development.
Telarc Limited is a registered company owned by the Testing Laboratory Registration Council. Telarc provides recognition and assessment services for management systems, and operates from Auckland. Hamilton, Tauranga, Wellington and Christchurch.
Telarc Limited's website is www.telarc.co.nz
Recognition services. Telarc provides recognition of achievement of quality and environmental management systems to the following standards:
Quality management systems certification to ISO 9001 standard. Telarc has provided the ISO 9000 certification service since 1983, being the first organisation in New Zealand to achieve formal accreditation by the Joint Accreditation System – Australia and New Zealand (JAS–ANZ).
Telarc Q-Base. A basic, entry-level management system based on the ISO 9001 standard, Telarc Q-Base identifies the basic quality management disciplines essential for managing the quality of small to medium size enterprises.
Environmental management systems certification to ISO 14001 standard. Telarc has provided this service since 1994 and was the first organisation in New Zealand to be accredited, in 1996, by JAS–ANZ to certify ISO 14001.
Customer 1st. For approving an organisation's commitment to its customers.
Assessments. Telarc provides assessment services for a wide range of management systems, including occupational health and safety, Accident Compensation Corporation Workplace Safety Management Practices, food safety, health and disability, and rail safety.
Training. Telarc works closely with the New Zealand Quality College to provide training courses to promote excellence in management system practices.
International Accreditation New Zealand monitors New Zealand's adherence to international principles of good laboratory practice.
International Accreditation New Zealand (IANZ) is the national body for the accreditation of testing and calibration laboratories, radiology services and inspection services. It is part of the Testing Laboratory Registration Council, a user-funded statutory body established by an Act of Parliament in 1972.
IANZ's functions include:
Laboratory and calibration accreditation – assessing the technical competence of testing, measurement and calibration laboratories in all fields of science and technology, including biological, chemical, dairy, water, electrical, gas cylinder, mechanical, medical, physical and wool testing; and metrology and calibration. All categories are accredited to NZS ISO/IEC 17025 standard, except medical testing, which is accredited to NZS/ISO 15189.
Inspection body accreditation – providing formal recognition that an inspection body or food safety assessment body is capable of meeting standards of quality, performance, technical expertise and competence. Accreditation is to AS/NZS ISO/IEC 17020 standard.
Radiology service accreditation – providing radiology services with formal recognition of their skills, expertise, competence, systems, procedures and facilities, based on independent peer group assessment. Accreditation is to a version of the ISO/IEC 17025 standard.
Good laboratory practice – The government has designated IANZ as the compliance monitoring authority in New Zealand for the Organisation for Economic Co-operation and Development's principles of good laboratory practice. This programme is relevant to research laboratories undertaking non-clinical safety trials for new veterinary pharmaceuticals and agricultural chemicals.
CE marking – The government has appointed IANZ as the designating authority for conformity assessment bodies approved as competent to undertake testing or inspection against European directives for CE product standard marking purposes. This appointment is under the New Zealand/European Union Governmental Mutual Recognition Agreement.
Meat industry laboratory approval – IANZ has been appointed by the New Zealand Food Safety Authority to assess meat industry laboratories under the Meat Industries Laboratories Registration scheme.
The International Accreditation New Zealand website is www.ianz.govt.nz
International agreements. IANZ represents New Zealand at international conformity assessment forums and maintains mutual recognition arrangements with other national laboratory accreditation bodies. The economies involved include: Australia, Austria, Belgium, Brazil, Canada, Hong Kong China, People's Republic of China, Cuba, Czech Republic, Denmark, Egypt, Finland, France, Germany, Greece, India, Indonesia, Ireland, Israel, Italy, Japan, Republic of Korea, Lithuania, Malaysia, Mexico, Netherlands, Norway, Philippines, Poland, Romania, Singapore, Slovakia, Slovenia, South Africa, Spain, Sweden, Switzerland, Chinese Taipei, Thailand, United Kingdom, United States and Vietnam.
Training. The New Zealand Quality College is the training division of IANZ and provides training in association with IANZ and Telarc Limited, together with organisations recognised as national experts in their fields. The college is registered as a private training establishment with the New Zealand Qualifications Authority.
Standards New Zealand is the trading arm of the Standards Council, a Crown entity operating under the Standards Act 1988. The council, an appointed body with representatives from all sectors of the community, oversees development and adoption of standards and standards-related products.
Standards New Zealand has a full-time staff of 55 and is supported by more than 2,000 New Zealanders who voluntarily serve on boards and committees. Its revenue comes from contracts with industry and government organisations for development and support of standards and from the sale of standards and standards-related publications.
Standards New Zealand acts as the New Zealand enquiry point for the World Trade Organisation and supplies specialist advice on overseas standards, regulations, codes of practice, and testing and approval procedures in foreign markets.
Standards New Zealand is closely involved in development and application of national, regional and international standards, many of which are developed in partnership with Australia. It represents New Zealand on the International Organisation for Standardisation and on the International Electrotechnical Commission.
The Standards New Zealand's website is www.standards.co.nz
15.1 Ministry of Research, Science and Technology; Crown Company Monitoring Advisory Unit.
15.2 Ministry of Research, Science and Technology; Foundation for Research, Science and Technology; Royal Society of New Zealand; New Zealand Venture Investment Fund Ltd.
15.3 AgResearch Ltd; Association of Crown Research Institutes; Carter Observatory; Cawthron Institute; ESR; HortResearch; Institute for Crop & Food Research; GNS Science; Industrial Research Ltd; Landcare Research New Zealand Ltd; Ministry of Research, Science and Technology; National Institute of Water and Atmospheric Research New Zealand Ltd; Scion; Statistics New Zealand.
15.4 Intellectual Property Office of New Zealand; Ministry of Economic Development; Telarc Ltd; International Accreditation New Zealand; Plant Varieties Rights Office; Standards New Zealand; Statistics New Zealand.
www.agresearch.co.nz – AgResearch Ltd
www.acri.cri.nz – Association of Crown Research Institutes
www.carterobs.ac.nz – Carter Observatory
www.cawthron.org.nz – Cawthron Institute
www.crop.cri.nz – Institute for Crop & Food Research
www.ccmau.govt.nz – Crown Company Monitoring Advisory Unit
www.frst.govt.nz – Foundation for Research, Science and Technology
www.hrc.govt.nz – Health Research Council
www.hortresearch.co.nz – HortResearch
www.irl.cri.nz – Industrial Research Ltd
www.esr.cri.nz – Institute of Environmental Science and Research Ltd
www.gns.cri.nz – GNS Science
www.iponz.govt.nz – Intellectual Property Office of New Zealand
www.ianz.govt.nz – International Accreditation New Zealand
www.landcareresearch.co.nz – Landcare Research New Zealand Ltd
www.med.govt.nz – Ministry of Economic Development
www.morst.govt.nz – Ministry of Research, Science and Technology
www.niwa.cri.nz – National Institute of Water and Atmospheric Research Ltd
www.nzvif.com – New Zealand Venture Investment Fund Ltd
www.pvr.govt.nz – Plant Varieties Rights Office
www.rsnz.govt.nz – The Royal Society of New Zealand
www.scionresearch.com – Scion
www.standards.co.nz – Standards New Zealand
www.telarc.co.nz – Telarc Ltd
www.stats.govt.nz – Statistics New Zealand
Table of Contents
Relative to other countries, New Zealand has abundant fresh water, of pristine quality in the upper reaches of streams and rivers.
New Zealand has a unique environment, the health of which is dependent upon a balance between interacting systems of living and non-living parts.
As the population grows and technology advances, the relationship between humans and the environment continually changes, and the potential exists for increased pressures to be placed on these systems and New Zealand's natural and physical resources.
Human settlement, with its consequent deforestation and introduction of exotic species, impacted greatly upon New Zealand's biodiversity and affected many aspects of the natural environment.
Native forest covered 75 percent of New Zealand's land area prior to human arrival in the 13th century, but had been reduced to 53 percent by 1840.
With the arrival of Europeans, the rate of deforestation increased as early settlers sought to re-create familiar European landscapes.
By the mid-20th century, forest cover had dropped to less than 25 percent of New Zealand's land area, as productive and accessible land was sought for fanning.
Farming expanded rapidly between 1885 and 1935, with the area of land under cultivation rising from 2.6 million hectares to 7.9 million hectares. Sown grass covered nearly 90 percent of cultivated land by the end of this period.
Burgeoning pastures supported an equally rapid rise in livestock numbers.
In 1886, about 16 million sheep grazed New Zealand pastures. Numbers increased rapidly in the 20th century, eventually peaking at more than 70 million in 1982. Cattle numbers increased from 853,000 to nearly 8 million during the same period.
By the 1930s, decades of overgrazing land and clearing forests caused large-scale erosion and degradation of soils, which hastened the demand for manufactured fertilisers.
Concern about the decline in native forests grew, resulting in the formation of various lobby groups.
Increasing pressure by lobby groups eventually resulted in the decline in native deforestation and establishment of a number of protected native forests.
Today, only 0.1 percent of New Zealand's total forest production is harvested from indigenous forests. Native and plantation forests now cover approximately 23 percent and 7 percent respectively of New Zealand's total land area (see Figure 16.01).
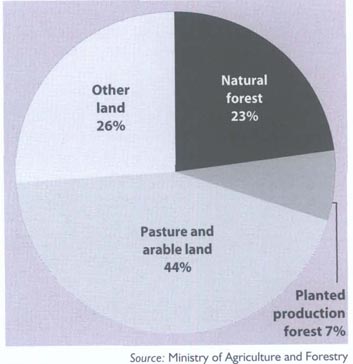
New Zealand has a unique biodiversity resulting from geographic isolation for more than 80 million years.
All four frog species, 60 reptiles, two bats, more than 90 percent of insects and marine molluscs, approximately 80 percent of vascular plants, and a quarter of all bird species are found only in New Zealand.
Maintaining biodiversity helps ensure continuation of natural ecological processes on which life in New Zealand depends.
Sustainable development requires consideration of both indigenous and introduced biodiversity because much of New Zealand's economy relies on plants and animals introduced from overseas for farming, forestry and other primary industries. Generally, no native plants or animals are used in New Zealand's primary industries, except for fish, limited felling of trees, and some flaxes and mosses.
In the past 700–800 years, two-thirds of New Zealand's land has been extensively modified and humans and their accompanying animals and pests have caused the extinction of 32 percent of indigenous land and freshwater birds; 18 percent of endemic seabirds; three of seven species of frogs; and at least 12 invertebrates, such as snails and insects. Today, about 1,000 of New Zealand's known animal, plant and fungus species are considered threatened.
Although a third of the country is protected through a network of parks and reserves, most of this is in upland areas and mountains. Lowlands, river margins, wetlands, dunelands and coastal areas remain under-represented in the protected areas network. Little intact forest remains in lowland areas, where the predominant land cover is pastoral or urban open space.
Introduced animals, particularly those that have gone feral (e.g. stoats, ferrets, weasels, Australian brush tailed possums, deer, goats, rabbits, rats, cats, dogs, pigs, hedgehogs and mice), and weeds pose the greatest threats to remaining native species and ecosystems.
New Zealand's conservation lands represent 30 percent of total land area and are managed by the Department of Conservation.
As part of its core work, the department carries out animal pest and weed control to help manage the impact that introduced species have had on native plants and animals.
The department also carries out work to protect particular ecosystems and the species they support, both on the mainland and offshore.
Indigenous forest cover was one of the classes mapped in the first land cover database, developed with the use of satellite imagery. The database will be updated every five years, with each new version allowing changes in indigenous forest cover to be tracked.
Many initiatives to help conserve indigenous biodiversity are undertaken on private land and the number of legally protected areas continues to increase through Queen Elizabeth II National Trust and Nga Whenua Rahui covenant schemes. Many private landowners also undertake pest and weed control and engage in preservation work, such as fencing off native areas to stop livestock from grazing native plant communities.
Since the launch in 2000 of the New Zealand Biodiversity Strategy, Campbell Island has been declared pest free, two new marine reserves have been established and a joint-agency biodiversity website (www.biodiversity.govt.nz) has been launched.
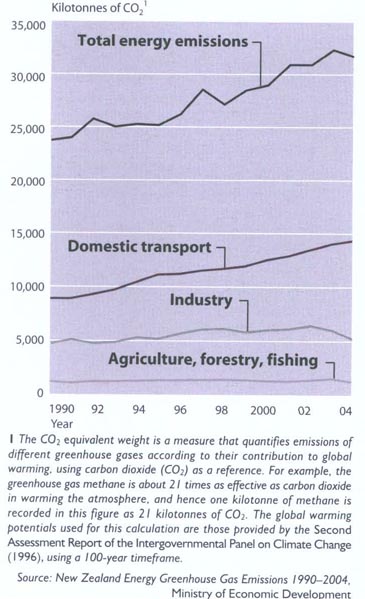
Compared with other countries, New Zealand has relatively good air quality because of its small population, its limited heavy industry, its distance from other countries and regular westerly winds in most places.
Nevertheless, air pollution gets high enough to cause health problems in many urban areas.
Common pollutants are particulate matter, sulphur dioxide, nitrogen oxides, carbon monoxide, benzene and polyaromatic hydrocarbons.
Main contributors to air pollution in New Zealand are the transport industry, home heating fires and other energy sectors.
New Zealand has a small and dispersed population and therefore relies heavily on private transport. Motor vehicle emissions are a significant source of air pollution, emitting pollutants such as carbon monoxide, dioxins, nitrogen oxides, volatile organic compounds and particulate matter.
Increased vehicle numbers, larger average engine sizes, traffic congestion and lower proportions of vehicles using alternative energy supplies relative to previous years all contribute to increasing pressures on air quality.
Home heating, particularly domestic fires, is a large contributor to air pollution in residential areas, particularly through the burning of coal and wood, which are major sources of particulate matter and sulphur dioxide.
The number of households with open fires has decreased in recent years, while the proportion of homes with slow-combustion fires, such as woodburners, has increased.
All New Zealand's 16 regional councils undertake air quality monitoring.
Typical programmes monitor levels of pollutants, including particulate matter, carbon monoxide and sulphur dioxide.
Complex and sophisticated meteorological systems complement the information supplied by air quality monitors, providing an overall increase in the quality of information available.
Part of the atmosphere is made up of so-called greenhouse gases (carbon dioxide – CO2, methane – CH4 and nitrous oxide – NO). These gases help keep the temperature near the Earth's surface within a stable range – around 30 degrees Celsius higher than it would be without them – providing climate conditions suitable for human and most other life.
A number of human activities contribute to air pollution and increase the concentration of greenhouse gases. The result is a temperature build-up creating the ‘greenhouse effect'.
Burning fossil fuels for electricity generation, heating and transport, and clearing forests increase carbon dioxide levels in the atmosphere.
Biological processes involved in keeping livestock and in treating sewage and other material increase methane concentrations.
There is a strong body of scientific opinion that suggests as greenhouse gas concentrations increase, temperatures rise as more heat is trapped.
When atmospheric temperatures change, local climates change.
Figure 16.02 shows changes in levels of greenhouse gas emissions by source from 1990 to 2004.
The results could be far-reaching – flooding; drought; rising sea-levels causing coastal erosion and threatening inundation; and pests and diseases spreading to new areas threatening human health and economic production, as well as ecosystems and animal and plant distribution patterns.
Warmer temperatures may have some positive offsets, such as allowing extended agricultural activities in temperate and colder climates, but most scientists believe the overall weight of any significant climate change is likely to be negative.
Depletion of the ozone layer, caused primarily by anthropogenic emissions of gases containing chlorine and bromine (chlorofluorocarbons or CFCs), is of significant concern to New Zealand.
The ozone layer, between 15 and 30 kilometres above the Earth's surface, shields the Earth from the sun's ultraviolet radiation.
While global-average ozone between 1997 and 2004 was three percent below pre-1980 levels, the ozone layer above New Zealand decreased by around six percent between 1980 and 2004.
A declining ozone layer has serious implications for New Zealand, as ultraviolet radiation can cause skin cancer, damage the marine environment and distort plant growth.
International efforts to halt production of ozone-depleting substances led to formation of the Montreal Protocol in 1987 and it is now expected that the ozone layer will be restored eventually, with first indications of recovery becoming apparent in some regions of the atmosphere. The period over which recovery to 1980 ozone levels will occur is still uncertain and it is possible that increased emissions of greenhouse gases will affect the timing of full recovery.
Figure 16.03 shows changes in the mean levels of ozone measured at Lauder, Central Otago.
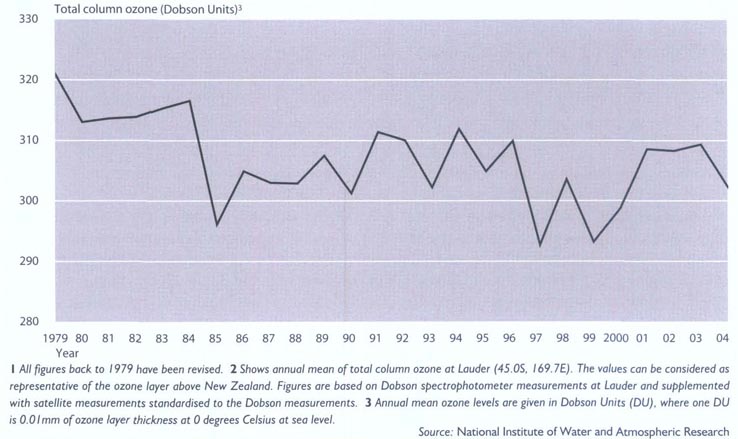
Relative to other countries, New Zealand has abundant fresh water, with most areas of New Zealand having between 600 and 1,600 millimetres of rainfall a year.
Although well endowed with water, availability varies significantly among regions, with the amount of annual rainfall generally decreasing as one moves east.
While water in New Zealand is considered plentiful, rising demand and competing uses are increasingly placing pressure on both availability and quality of the resource.
Much of New Zealand has pristine water quality. However, urban development clearance of land and intensification of agriculture has created a number of threats to lowland water quality.
These include sedimentation, nutrients and harmful micro-organisms in streams from erosion and farm and road run-off.
The need for enhanced soil quality for pasture production calls for application of fertilisers, with nitrogen sales more than trebling between 1990 and 1997. The environmental effects associated with fertiliser application can include soil acidification and eutrophication of waterbodies.
Coastal water quality. A survey during the summer of 2004/05 showed that 78 percent of New Zealand's coastal beaches monitored were safe for swimming and other forms of recreation 95 to 100 percent of the time. In some places, however, coastal water quality was affected by activities such as intensified rural land use and rapid urban development.
Common sources of coastal water contamination include sewage and storm water outfalls, septic tanks, sanitation discharges from boats and effluent run-off from agricultural areas.
Generally, concentrations of contaminants are lower at sites on the open coastline than at inland freshwater sites, with coastal beaches more frequently flushed by tides and currents.
River water quality. When compared internationally, New Zealand rivers have very high water quality because they contain low concentrations of dissolved material and nutrients. Exceptions are rivers in some highly eroding areas, such as the East Coast of the North Island.
In general, the upper reaches of most rivers have high water quality, while the middle and lower reaches tend to have elevated turbidity and nutrient levels, especially in agricultural and large urban catchments. Contamination is usually from pasture runoff, but also occurs downstream of towns and industrial sites with sewage and stormwater discharges.
Pollution discharges have reduced considerably in the past 10 years, however.
The marine environment within New Zealand's exclusive economic zone harbours a diverse range of ecosystems and covers an area approximately 15 times bigger than New Zealand.
New Zealand has the eighth longest coastline of any nation in the world, the fourth largest area for fishing and its exclusive economic zone covers approximately 4 million square kilometres.
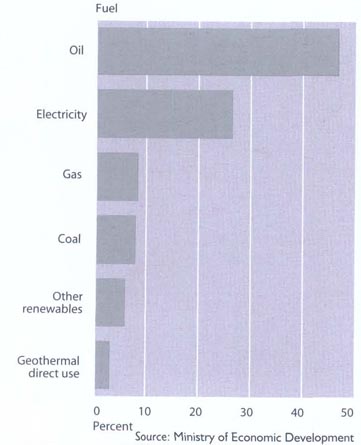
Most of New Zealand's population lives close to the coast. Construction, land reclamation, drainage, urban infrastructure and shoreline developments can affect the coastal environment through alteration of physical characteristics of shorelines and discharge of pollutants into the sea. Nevertheless, New Zealand's small population has meant that impact on the marine environment has been minor compared with other developed countries.
As a trading nation, New Zealand is vulnerable to introduction of exotic species. Introduction of species such as the clubbed tunicate sea squirt, which threatens New Zealand's aquaculture industry, led to improved procedures and standards for marine biosecurity in June 2005. Because New Zealand is an island nation, there are many competing users of its marine environment and there is a need for effective environmental management. Fishing activities are widespread throughout New Zealand and affect virtually every habitat type, except the deepest sea floors.
Marine farming can also have important impacts on the coastal environment. Regional councils manage marine farming under the Aquaculture Reform Act 2004 and discharge of contaminants into coastal marine areas under the Resource Management Act. Good environmental management requires ecosystem science, combined with management, decision making and planning.
A committee of ministerial representatives is developing a comprehensive national oceans policy for management of the marine environment, and the New Zealand Marine Environment Classification was released in 2005. Released by the Ministry for the Environment, the classification provides spatial frameworks for structured and systematic management of New Zealand's exclusive economic zone through increased understanding of its environmental and biological character. Marine models are able to represent the complex interactions that occur within the environment, enabling changes in physical and biogeochemical aspects of the marine environment to be predicted, thus providing early warning of potentially harmful ecological effects.
New Zealand has many energy sources, including fossil fuels, water, geothermal steam and wind. As technology has developed, alternative energy sources are also being harnessed. Coal is one of New Zealand's oldest sources of energy, with coal-produced electricity peaking in the 1920s and remaining high until the 1960s. Rapid increases in the number of motor vehicles and development of technology increased the consumption of oil and hydroelectricity and by 1980 they had become the dominant sources of energy.
In 2004, oil and gas were the major sources of New Zealand's energy, accounting for approximately 36 and 21 percent respectively of total primary energy supply. Total primary energy is the amount of energy available for use in New Zealand for energy transformation and end use. Consumer energy is energy used by final consumers, and excludes energy used or lost in transformation and in bringing the energy to the final consumers.
Figure 16.04 shows proportions of consumer energy by fuel for 2004.
New Zealand's gas, which accounted for only 3.3 percent of total primary energy supply in 1974, is produced in Taranaki, with the primary natural gas field – offshore south-west of New Plymouth – supplying 66 percent of the country's natural gas requirements in March 2005. This figure was down from 75 percent three years earlier. Although self-sufficient in electricity, gas and coal, New Zealand relies on imported oil to meet domestic oil demand. Oil comprises about 48 percent of total energy consumption.
The largest energy consumer is the domestic transport sector, the dominant user of oil products, taking approximately 84 percent during the year ending 31 March 2005, according to the Ministry of Economic Development's Energy Datafile. This can largely be attributed to New Zealand's small and sparsely-distributed population. Renewable resources, such as hydro generation, geothermal, biomass, wind and sun, accounted for approximately 72 percent of electricity generation in New Zealand at 31 March 2005. Hydro generation is the major supplier of electricity, producing about 64 percent.
Energy is an essential element of life, but its production and use have varying impacts on the environment. Growth in greenhouse gas emissions is largely attributable to the energy sector, in particular electrical generation from coal, and transport. Geothermal production has the potential to cause land subsidence and releases sulphur into the atmosphere, which leads to pollution and the creation of unpleasant odours. Construction of dams has a transforming effect on the landscape and alters river systems and aquatic life. Environmental impacts from thermal, geothermal and hydroelectric generation set limits for future development.
Potential for energy generation in the future lies in advanced and innovative renewable technologies and in energy sources that are still considered alternative, such as solar and wind generation. As technology develops, many of these alternative sources will become economically and commercially viable in New Zealand and more competitive with fossil fuels.
New Zealand has a large variety of mineral deposits and is well known for its production of gold and coal.
The mineral industry is a significant contributor to the New Zealand economy, not only in terms of export revenues, but also as a substantial employer of a highly skilled work force. More than 4,600 are employed directly, with another 13,100 jobs indirectly related to the mining and minerals industry.
Some minerals are also of cultural importance to New Zealanders. For example, pounamu, or New Zealand greenstone, is of particular significance to Māori, specifically Ngai Tahu who have ownership of the resource.
Gold was first discovered in New Zealand in the 1850s and was retrieved either by washing alluvial gravels, silts and sands, by crushing gold-bearing veins of quartz, or by hydraulic sluicing. In 1881, the first dredge was used to work riverbeds to recover gold.
Currently, there are two large open-cast goldmines in New Zealand, with a number of medium and small-sized mines. A third open cast mine is proposed at Reefton, on the West Coast of the South Island. Mining is subject to strict environmental standards.
Coal is New Zealand's largest energy resource, with recoverable reserves of approximately 8.6 billion tonnes. New Zealand coal is valued for its special qualities, particularly its low ash and phosphorus content, its suitability for steel making and high heating value.
While coal has a long history of use in New Zealand, quantities exported have increased markedly in the past decade, with Japan, India, China and South Africa the main markets. The largest domestic users of coal are the electricity and steel production industries.
Aerial photography, photogrammetric mapping and use of geographic information systems (GIS) in digital terrain modelling, and three-dimensional modelling of subsurface ore bodies, are now being used as tools for exploration, mine design and measurement.
Remote sensing is being used to provide high-resolution images of the earth's crust, which, when combined with other information, can identify targets for detailed ground investigation.
Advances in technology have meant that minerals once inaccessible now have the potential to be extracted.
Soil provides a wide range of benefits to the environment and humans, including absorption of waste, supply of nutrients to plants and regulation of water.
Soil quality varies throughout New Zealand, as does land-use type. The type of land use occurring in an area is directly affected by the soil quality of that area. To alter the quality of soil, fertiliser can be applied. However, excessive fertiliser use can result in adverse effects on downstream rivers and streams.
Every landslip requires about 20 years to recover within 70 to 80 percent of its original productivity.
Erosion, although a natural process, has been accelerated by human activities, particularly by deforestation of land. It is estimated that approximately 10 percent of the country has severe to extreme erosion, with each landslip requiring approximately 20 years to recover to within 70 to 80 percent of its original productivity level.
Approximately 30 percent of the country is able to sustain pastoral farming without significant erosion problems.
Land-based industries are a central part of New Zealand's economy and a major generator of export income. Soil erosion, therefore, has many implications for New Zealand, including loss of productive capacity, reduced fertility, loss of water-holding capacity and decreased water quality.
To address soil quality problems, the government has encouraged development of practical indicators of soil quality, as well as on-ground techniques and monitoring tools which farmers can use to improve sustainable management of soils.
These tools are promoted through the New Zealand Landcare Trust, regional council land management officers, industry field officers and other advisers.
Advanced spatial analysis tools enable areas at high risk of soil degradation to be identified by analysing the soil properties of each area, as well as an area's susceptibility to degradation and pressures from land-use types and land-use intensity.
Results from these tools are being used to assist in decision making with respect to the appropriateness of land-use change and land-use intensity.
A New Zealand land cover database is being used for a range of purposes, including assessing the amount of carbon stored in indigenous forests, identifying change in areas at risk from soil erosion, assessing rural fire risks and monitoring general land-use change.
As the population of New Zealand increases, pressures on natural resources – especially energy, air and water – also increase.
In order to decrease the impact of population growth on these resources, levels of use that are sustainable need to be identified.
Energy – Renewable energy is energy that is self-restoring, for example wind, solar energy, hydro energy and biological materials that store energy from the sun. Renewable energy resources have a major role to play in meeting future demands for energy. Between 60 and 70 percent of New Zealand's electricity is generated by hydro systems, with between 23 and 30 percent coming from gas or coal. There is also some wind and geothermal generation, as well as a small amount from biomass. Nearly all transport in New Zealand relies on fossil fuels, with the exception of electric trains and buses. Renewable transport fuels are expected to find their way into niche markets in coming years. E5, a petrol product with 5 percent bioethanol, could soon be available, and biodiesel is very close to being commercially viable.
Air – Main pressures on air quality will be meeting Kyoto Protocol requirements for gas emissions. Latest greenhouse gas inventories show carbon dioxide emissions in 2003 were about 37 percent higher than they were in 1990. Transport sector emissions continue to grow rapidly and now make up nearly 19 percent of total greenhouse gas emissions. If we did nothing to reduce emissions, they could be 30 percent over target by 2012. If New Zealand has emissions above its target, it can purchase emission units on the international market or use forest sink credits. As a result of the Kyoto Protocol and earlier climate change initiatives, the New Zealand Government has a range of programmes to reduce emissions already in place or being developed.
Water – By world standards, New Zealand has an abundance of freshwater resources, including rivers, streams, lakes and underground aquifers. However, a large amount of water is ‘locked-up’ in glacial ice and snow. As the population increases, pressure on water increases. The amount of ground water available decreased by 5.23 billion cumecs between 1995 and 2001, according to the Statistics New Zealand publication Water Physical Stock Account 1995–2001. The legislative foundation for water management is the Resource Management Act 1991. This places most water management under the control of regional councils, making them responsible for sustainable management of all water resources, including surface water, ground water, geothermal water and coastal water. Regional councils are obliged to maintain water quality and supply, taking into account the variety of values and uses that water may hold for various groups. Regional councils also have the responsibility of issuing resource consents for abstraction and use of water, and discharge of waste into water bodies. Consents are not needed for household abstractions of water, consumption by livestock, fire-fighting uses and Māori use of geothermal waters.
The Bioethics Council Toi te Taiao was established in October 2002 following recommendations from a Royal Commission of Inquiry into Genetic Modification. The goal of the council – established as a ministerial advisory committee – is to enhance New Zealand's understanding of the cultural, ethical and spiritual aspects of biotechnology and to ensure that the use of biotechnology has regard for values held by New Zealanders. In this role, the council provides information, promotes and participates in public discussion and gives advice to the government.
New Zealand's 26.9 million hectares are predominantly mountainous and hilly. More than two-thirds (18.5 million hectares) of the land slopes at greater than 12 degrees and nearly half at greater than 28 degrees.
Nearly three-fifths of the country (16 million hectares) is more than 300 metres above sea level, with one-fifth above 900 metres.
Extensive changes have occurred in New Zealand's land cover since human occupation. The cover of indigenous forest has declined to 29 percent of its former extent and scrub and tussock have nearly doubled in area. Greatest losses of land cover have occurred in warm, dry environments, particularly those with soils and landforms suited to intensive agriculture.
Table 16.01 shows approximate distribution of land use.
Coordination of New Zealand's international response to environmental issues is carried out by the environment division of the Ministry of Foreign Affairs and Trade.
The division manages New Zealand's participation in the work of a large number of international forums, including the Commission on Sustainable Development, the United Nations Environment Programme, the Global Environment Facility and the International Whaling Commission.
The division has responsibility for coordinating international aspects of issues such as climate change, biosafety, oceans, atmosphere, transboundary movement of hazardous substances, natural resource management, biodiversity and endangered species, marine pollution, and a range of sustainable development issues.
It provides leadership and support for New Zealand's participation in international discussions on these issues at regional and international meetings and handles negotiations on related international legal instruments.
The division works closely with other government departments and domestic agencies, in particular the Ministry for the Environment, the Ministry for Economic Development, the Ministry of Agriculture and Forestry, Treasury, NZAID, the Ministry of Fisheries, the Environmental Risk Management Authority and the Department of Conservation, to identify, protect and advance New Zealand's interests in these negotiations.
In addition, the division consults with a large number of stakeholders, including Māori, and a range of public interest groups, including non-government organisations and businesses, as it seeks to project environmental values held by New Zealanders, such as conservation of whales.
Table 16.01. Land use1
| Type of land | Approximate area | Proportion of total area |
|---|---|---|
1Total area measured at mean high tide mark an 21 September 2001. 2National Exotic Forestry Description information at 1 April 2002 Source: Ministry of Agriculture and Forestry | ||
| Hectares (million) | Percent | |
| Pasture, tussock and arable | 11.8 | 43.9 |
| Total forested2 | 8.0 | 29.7 |
| Shrub and other | 7.1 | 26.4 |
| Total land area of New Zealand | 26.9 | 100.0 |
New Zealand is a signatory to several international conventions aimed at protecting wildlife, plants and ecosystems.
The Resource Management Act 1991 is a means of planning how the people of New Zealand are going to use, distribute or preserve natural and physical resources.
Resources include rivers, lakes, coastal and geothermal areas; land, including soils, forests and farmlands; the air; and the built environment, such as buildings, bridges and other structures in cities and towns.
The purpose of the act is to promote sustainable management of natural and physical resources. This means the environment is looked at as a whole when local authorities are planning and making decisions. The focus of the legislation is on effects proposed activities will have on the environment.
Local authorities prepare plans to help them manage natural and physical resources. Members of the community have the opportunity, during formulation of these plans and policies, to say what they want to happen in their communities.
National policies. In preparing plans to manage natural and physical resources, local authorities must recognise and provide for:
Preservation of the natural character of the coastal environment (including the coastal marine area); wetlands, lakes and rivers and their margins; and protection of them from inappropriate subdivision, use and development.
Protection of outstanding natural features and landscapes from inappropriate subdivision, use and development.
Protection of areas of significant indigenous vegetation and significant habitats of indigenous fauna.
Protection of heritage areas from inappropriate subdivision, use and development.
Maintenance and enhancement of public access to the coastal marine area, lakes and rivers.
The relationship of Māori and their culture and traditions with their ancestral lands, water, sites, waahi tapu and other taonga.
Those exercising functions and powers are required to have particular regard to kaitiakitanga; the ethic of stewardship; efficient use and development of natural and physical resources; maintenance and enhancement of amenity values; intrinsic values of ecosystems; maintenance and enhancement of the quality of the environment; any finite characteristics of natural and physical resources; and protection of the habitat of trout and salmon.
Sustainable management. Under the Resource Management Act 1991, sustainable management means managing the use, development and protection of natural and physical resources in a way which enables people to provide for their social, economic and cultural well-being and for their health and safety, while sustaining the potential of natural and physical resources (excluding minerals) to meet the reasonably foreseeable needs of future generations; safeguarding the life-supporting capacity of air, water, soil and ecosystems; and avoiding, remedying or mitigating any adverse effects of activities on the environment.
Regional policies and plans. Regional councils have a pivotal role in integrated management of natural and physical resources. Regional councils must prepare regional policy statements and regional coastal plans and may prepare plans to manage other natural and physical resources. Regional councils have primary responsibility for management of water, soil, geothermal resources, pollution control and strategic integration of infrastructure with land use. In addition, regional councils have joint responsibility with territorial authorities for natural hazard mitigation, hazardous substances, contaminated land, maintaining indigenous biodiversity, and a joint responsibility with the Minister of Conservation for the coastal marine area.
District planning. District and city councils have primary responsibility for land use management. District and city councils also manage noise and activities on the surface of water. They have joint responsibility with regional councils for natural hazard mitigation, hazardous substances and indigenous biodiversity. Each district and city council must prepare a district plan, which includes rules prohibiting, managing or allowing activities.
Resource consents. A resource consent gives a person or organisation permission to use or develop a natural or physical resource and/or carry out an activity that affects the environment in some way. Under the Resource Management Act 1991, there are five types of resource consent:
Land use (granted by district, city and, sometimes, regional councils).
Subdivision (district councils).
Water permit (regional councils).
Discharge permit (regional councils).
Coastal permit (regional councils).
Applicants for consents need to assess potential impacts the proposal is likely to have on the environment and submit this assessment to the consent authority. The applicant must also explain what consultation, if any, has taken place with anyone who may be affected by the proposal. Some resource consent applications require public notification, which gives members of the public a chance to consider the application and make submissions if they wish.
Public involvement. The Resource Management Act 1991 provides for members of the public to take part in managing the resources of their area. Members of the public can have input into preparation of regional policy statements and regional and district plans and any changes to these by making submissions to local authorities after they have notified the public about proposed plans or plan changes. Members of the public can also make submissions on publicly-notified applications for resource consents. The Environmental Legal Assistance Fund was established in 2001 to provide community, environmental and iwi and hapū groups with financial assistance to participate in the Environment Court and other courts.
Use of land. The Resource Management Act requires councils to address effects of activities rather than the activity itself. The presumption is that people can use their land in the way they wish, provided there are no adverse environmental effects, unless there is a rule in the plans that constrains that use. Constraints must be clearly identified in policy statements and plans.
Hazardous substances and new organisms. The Hazardous Substances and New Organisms Act 1996, administered by the Environmental Risk Management Authority (ERMA), protects the environment and the health and safety of people and communities by preventing or managing adverse effects of hazardous substances and new organisms. Hazardous substances managed under the act are substances which are explosive, flammable, oxidising, corrosive, toxic or ecotoxic. Radioactive substances are managed under the Radiation Protection Act. Controls are contained in a set of regulations which ERMA uses to set requirements for specific substances or groups of substances. The controls are designed to set consistent national minimum standards for resource consents involving hazardous substances. In addition, the controls are designed to provide consistent standards in workplace and transport legislation relating to hazardous substances. The act is also designed to work closely with regulations for specific use, for example when hazardous substances are also medicines, agricultural components or veterinary medicines. The act covers deliberate introduction of new species, such as for primary production or for biological control of pests, and development of genetically-modified organisms. Development, testing or release of genetically-modified organisms all require separate approvals. This part of the act stands alongside the Biosecurity Act, which aims to prevent unintended introduction of unwanted species into New Zealand. Principles of the new legislation require that all hazardous substances and new organisms are assessed before introduction, development or manufacture in New Zealand, and that they all follow a similar assessment process. Most assessments are publicised and open to public comment, and the final decision is also made public.
Exploration of Crown-owned minerals is governed by the Crown Minerals Act 1991, administered by the Ministry of Economic Development.
Under the act, the Minister of Energy is required to prepare minerals programmes that establish policies, procedures and provisions to be applied to management of Crown minerals.
The minerals programme for petroleum came into effect on 1 January 2005. The mineral programmes for coal, and for minerals other than coal and petroleum, came into effect on 1 October 1996 and were due for replacement no later than 1 October 2006.
Using procedures established in the minerals programmes, the Minister of Energy issues permits allocating Crown-owned minerals, or the rights to search for them. Permits have conditions relating to management of the mineral resource and royalties.
In addition to a minerals permit, the act provides that anyone prospecting, exploring or mining Crown minerals must also make land access arrangements with the surface landowner and/or occupier.
The Crown issues three types of permits:
Prospecting permits for the purpose of identifying land likely to contain mineral, coal or petroleum deposits. Permitted activities are very low impact, such as geological mapping, literature search, hand sampling and aerial surveys.
Exploration permits for the purpose of identifying mineral, coal or petroleum deposits and evaluating the feasibility of mining. Permitted activities include drilling, bulk sampling, trenching and mine feasibility studies.
Mining permits for the purpose of economic recovery of an identified resource.
The environmental impact of prospecting, exploration and mining of minerals, whether Crown or private, is controlled through the Resource Management Act 1991 by local authorities. The act controls the environmental impact of all mining activities, including rehabilitation of land.
New Zealand's water and soil resources are administered in accordance with the Resource Management Act 1991, with maintenance and construction of flood protection structures and soil conservation measures covered by the Soil Conservation and Rivers Control Act 1941. Both acts are administered by the Ministry for the Environment.
Under the Resource Management Act, regional councils are responsible for managing, monitoring and controlling wetlands and fresh water bodies, and issuing permits for abstraction, discharge and damming of water. Regional councils also develop policies and plans which prevent erosion, landslip and flooding, and protect scenic and recreational waterways.
Water resources. It has been estimated that New Zealand's consumption of water approaches 2 billion cubic metres a year, with households using 210 million cubic metres, industry 260 million cubic metres, livestock 350 million cubic metres and irrigation 1.1 billion cubic metres. About 87 percent of the population is supplied from public water supply systems, while the rest rely on independent domestic supplies, such as rainwater collection or aquifer bores. Industry obtains about 33 percent of its requirements from public supply systems and 66 percent from its own sources. These figures do not include water for hydroelectric generation, which exceeds 100 billion cubic metres a year. Water flowing through hydro station turbines can be used again. On the Waikato River, including its tributaries, 10 state-owned hydroelectric stations, and a number owned by local authorities, use and reuse a flow which, at Karapiro (the final station), is more than 7 billion cubic metres a year.
In terms of total water resources, New Zealand has an estimated 300 billion cubic metres a year, although these are by no means evenly distributed. High mountains, especially in the South Island, create substantial rain-shadow areas (relatively dry areas sheltered from rain-bearing winds by hills). In a few areas, such as Milford Sound, annual rainfalls of more than 10,000 millimetres have been measured, while in others, such as Alexandra, as little as 340 millimetres may fall in a year. In some parts of New Zealand, including the Canterbury Plains, the Heretaunga Plains in Hawke's Bay, and the Waimea Plain near Nelson, underground water is an important resource. The cities of Christchurch, Lower Hutt, Napier and Hastings draw at least some of their domestic and industrial supplies, as well as irrigation water, from such sources. Management of underground water, and its protection from contamination, is an increasing concern for regional councils in these areas.
Water quality. Maintenance of water quality is the responsibility of regional councils under the Resource Management Act 1991. The act controls discharges into water (as well as discharges onto or into land and into the air) through resource consents. Regional policy statements and regional plans are the statutory vehicle for water quality policies, objectives and rules.
The Resource Management Act continues earlier legislation which provided for water conservation orders to be placed over rivers, streams, wetlands and lakes that have outstanding amenity or intrinsic values. An order can preserve a water body in its natural state, or it can protect certain features by placing restrictions on the future issue of water permits.
River control. River control projects carried out by local authorities are usually designed to prevent damage by erosion and protect property from flood damage. River training works are designed to give the river channel a stable alignment to prevent bank erosion. Stopbanks are constructed to provide flood protection to communities, infrastructure and to low-lying and highly-productive agricultural lands.
A catchment-wide approach to water and soil problems is encouraged. District councils, through their district plans, control subdivision and other urban development in designated flood hazard zones. Increasingly, flood plain management planning is being adopted to identify and mitigate risks associated with flooding.
Soil conservation. The change from forest cover to pastoral land use in many parts of New Zealand has resulted in changed soil conditions over time. The protective, stabilising and water-controlling combination of vigorous native vegetation, litter and spongy soil has given way to a shallow-rooted, less protective carpet of grass, growing in compacted soils.
Natural erosion, caused by climatic factors such as high-intensity rainfall and the inherent instability of surface rock types for much of the country, has been aggravated by human activities. Nearly 10 percent of land is classified as having severe to extreme erosion problems.
Successful techniques developed to reduce the frequency of erosion and the severity of erosion impacts include control of tussock burning and animal pests, oversowing, topdressing, strict grazing control, soil conservation fencing and gully control, open and close-tree planting, and permanent retirement (and planting) from productive uses.
Water pollution. Water pollution problems are addressed by regional councils under the Resource Management Act 1991. Pollution of rivers and lakes can be caused by soil erosion, farm run-off, industrial waste, domestic sewage or urban runoff. The Resource Management Act provides for the control of waste discharges through resource consents and rules in plans. These include conditions ensuring that the discharge is of a sufficient quality to protect receiving waters. Diffuse forms of pollution, such as erosion and farm run-off, require different approaches, such as changing land-use practices or fencing streams.
The Ministry for the Environment has developed a sustainable land management strategy which, in part, addresses the impact of agriculture on aquatic ecosystems and water quality. Regulations under the Resource Management Act control dumping of waste and other matters and discharge of contaminants from ships and offshore installations within the coastal marine area (12 nautical mile limit). Ballast water discharges are controlled by the Biosecurity Act 1993.
Waste and landfills. The Ministry for the Environment's New Zealand Waste Strategy includes targets for central government, local government and industry to reduce waste and improve waste management. The majority of solid waste in New Zealand has been disposed of in historically poorly-managed ‘rubbish tips'. However, many of the substandard landfills of the past have now closed and there is a move towards appropriately-sited, designed and operated landfills.
In many areas, regional landfills have been developed with a variety of ownership arrangements, ranging from full local authority ownership to fully commercial operations. In working to reduce waste, the Ministry for the Environment is working with producers and importers of used oil and tyres to identify appropriate solutions for collection and management of these wastes; identifying and addressing barriers to the diversion of organic waste from landfill disposal; supporting business in implementing eco-efficiency concepts into everyday business; and funding specific waste minimisation projects in the construction, demolition and agricultural sectors.
Contaminated sites. According to national estimates, New Zealand has about 1,500 contaminated sites and thousands more which have some level of contamination. The Resource Management Act 1991 provides controls to activities that have the potential to contaminate land. Land may be contaminated from a number of historical activities, including uncontrolled landfills, underground petroleum storage at service stations, chemical treatment of timber and chemical manufacture.
The Ministry for the Environment is working with other departments, local government and industry to develop guidelines for managing and cleaning up contaminated sites. Guidelines have been produced covering chemicals found on sawmills and timber treatment sites, petrol stations and oil storage depots, and old gasworks sites. The ministry also provides guidance for local government on collecting and managing information on contaminated land, and protocols for keeping communities informed about contaminated land.
A fund has been established by the government to assist regional councils investigate and clean up high-risk contaminated sites within their regions. In the three years from 2003, $2 million a year was made available to assist:
Tasman District Council clean up the former Fruitgrowers Chemical Company site at Mapua. The site is heavily contaminated with the organochlorine pesticides DDT and dieldrin and has adversely affected the marine environment nearby.
Environment Waikato to clean up the historical Tui mine site on Mt Te Aroha, which is leaching contaminants into local rivers and streams.
A number of regional councils to investigate and clean up about 25 high-risk contaminated sites.
Some of the most pressing environmental problems extend beyond national borders. Two of these issues are climate change as a result of the enhanced greenhouse effect and ozone depletion.
The main method available under international law for countries to work together on global environmental issues is through Multilateral Environmental Agreements (MEAs). These formal agreements may take the form of ‘soft law', setting out non legally-binding principles that parties will regard when considering actions which affect particular environmental issues, or ‘hard law', which specify legally-binding actions to be taken to work towards an environmental objective.
New Zealand is a signatory to many MEAs and its interest in international environmental work is wide ranging.
Priority issues in recent years have included sustainable development, biodiversity, ocean management and protection of marine mammals, South Pacific environmental issues, climate change and ozone depletion.
New Zealand is also involved in the work of international environmental institutions, such as the United Nations Environment Programme (UNEP).
Environment issues are also a consideration in the country's trade policies.
International environmental policy. International environmental policy development involves a wide range of government agencies. The environment division of the Ministry of Foreign Affairs and Trade advises the government on international aspects of global environmental issues. The Ministry for the Environment provides advice on domestic matters. A key partner is the Department of Conservation, the central government organisation charged with conserving the natural and historic heritage of New Zealand.
Sustainable development. Greater awareness of the importance of global action on environmental matters has led to increasing international activity. Much of the international debate involves striking the right balance between the imperatives of environmental protection, economic activity and social development to provide for future generations and to protect the earth's resources and biodiversity. The goal is to achieve sustainable development. A World Summit on Sustainable Development in August 2002 in Johannesburg examined progress on sustainable development issues adopted at the Rio Earth Summit in 1992. Its aim was also to reinvigorate global commitment to sustainable development. The major outcome was a ministerial declaration that focussed on actions for sustainable development in the following 10 years – referred to as the Johannesburg Programme of Implementation (JPOI). The Commission for Sustainable Development, which meets annually, is responsible for implementing the JPOI. The government's Sustainable Development Programme of Action released in 2003 was New Zealand's response to the JPOI. It provides a set of guiding principles for policy and decision making across the government sector. These principles require the government to take account of the economic, social, environmental and cultural consequences of its decisions.
Climate change. The 1992 United Nations Framework Convention on Climate Change (UNFCCC) developed a global response to stabilising greenhouse gas concentrations in the atmosphere. New Zealand ratified the UNFCCC in 1993 and, in December 2002, ratified the Kyoto Protocol, which builds on the concerns of the UNFCCC and makes new commitments that are stronger and more detailed.
Biodiversity. New Zealand ratified the Convention for Biological Diversity in 1994 and produced a National Biodiversity Strategy in 2000. New Zealand has also ratified several conventions that aim to protect specific animals, plants and ecosystems, including the Convention on International Trade in Endangered Species of Wild Fauna and Flora (CITES), the Ramsar Convention, and the Convention on the Conservation of Migratory Species of Wild Animals (CMS), signed by New Zealand in September 1999 with the Department of Conservation the key implementing agency. New Zealand has five sites on the Ramsar list of wetlands of international importance. New Zealand is a signatory to the Cartagena Protocol on Biosafety, which aims to protect biodiversity and human health from potential risks arising from the import and export of living modified organisms developed by modern biotechnology. New Zealand has also ratified the Agreement on the Conservation of Albatrosses and Petrels, which came into force on 1 February 2004. This agreement focuses on the effects of incidental capture in fishing operations.
Ocean management. New Zealand participated actively in negotiations on amendments to the London Convention on the Prevention of Marine Pollution by Dumping of Wastes 1972, and ratified the Basel Convention on the Control of Transboundary Movements of Hazardous Wastes and their Disposal in 1995. New Zealand was active in the United Nations Conference on Straddling Fish Stocks and Highly Migratory Fish Stocks, which, in 1995, resulted in agreement on a new convention to complement existing provisions of the United Nations Convention on the Law of the Sea. The convention contains innovative provisions on enforcement of conservation and management measures on the high seas. New Zealand plays an active conservationist role in the International Whaling Commission. The Ministry of Foreign Affairs and Trade cooperates closely with the Department of Conservation in developing policy on whale conservation. New Zealand played a major role in founding the United Nations Informal Consultative Process on Oceans and Law of the Sea, recognising that sustainable management of the oceans is vital to New Zealand and its neighbouring South Pacific countries. The government is currently reviewing management of New Zealand's oceans to the extent of the exclusive economic zone and extended continental shelf to improve and integrate decisions about use of marine space and resources. The outcome of this review will be the New Zealand Oceans Policy.
International environmental institutions. New Zealand participates in the governance and operation of several international environmental bodies. New Zealand is a member country of the United Nations Environment Programme (UNEP) and was a member of the governing council from 2000 to 2003. New Zealand attends the Global Ministerial Environmental Forum, where environmental issues of contemporary interest are discussed by environment ministers from around the world. The Global Environmental Facility (GEF) is an international body which provides finance to developing countries to help them address critical threats to the global environment. New Zealand is a donor country and a member of one of the constituencies of the GEF council. New Zealand has contributed about $20 million since 1994 and pledged another $12 million to the third replenishment of the facility. New Zealand is also involved in the South Pacific Regional Environment Programme (SPREP) and the Environment Policy Committee (EPOC) of the Organisation for Economic Co-operation and Development. The Ministry for Environment represents New Zealand on EPOC.
South Pacific environment issues. New Zealand recognises the special vulnerability of South Pacific countries to global environmental problems. New Zealand has sought to support Pacific Island countries and to ensure their concerns are heard through the South Pacific Environment Programme, the South Pacific Forum and other international environmental negotiations. This is exemplified by New Zealand's involvement in the Global Conference on the Sustainable Development of Small Island Developing States in Barbados in 1994 and in the 1999 United Nations special session to review the Barbados Programme of Action. In 1995, New Zealand signed the Waigani Convention to ban importation into South Pacific Forum countries of hazardous and radioactive wastes and to control transboundary movement and management of hazardous wastes within the South Pacific region.
Trade and the environment. The New Zealand Government has made it clear there must be environmental and labour elements to all bilateral and regional trade agreements negotiated by New Zealand. The Ministry for the Environment has undertaken with the Ministry of Foreign Affairs and Trade to lead negotiations on environmental provisions in these agreements. The World Trade Organisation's (WTO) Doha Development Agenda is the government's top trade priority. Environment issues were on the agenda for the first time at the fourth ministerial conference in Doha in November 2001 and some progress had been made before talks collapsed at the ministerial conference in Cancun in September 2003. Main environmental issues for New Zealand are:
The relative standing of WTO rules and potentially conflicting measures in multilateral environmental agreements that can be used to protect the environment by restricting trade in certain goods.
The use of labelling schemes for environmental purposes. Development of universal standards for labelling could yield benefits for New Zealand goods and services, particularly in niche markets such as organic produce, but there is a risk that labelling schemes might be used as technical barriers to trade.
The role of environmental aspects in negotiations on sustainable development.
The Ministry for the Environment has been actively involved with the Ministry of Foreign Affairs and Trade and the Ministry of Agriculture and Forestry in progressing these issues, both domestically and at the WTO.
Climate change policies. Climate models indicate that because of past and present greenhouse gas emissions, some degree of climate change will occur in New Zealand, even if global greenhouse gas emissions are reduced under international frameworks. Having ratified the United Nations Framework Convention on Climate Change (UNFCCC) in September 1993 and the Kyoto Protocol in December 2002, New Zealand has an obligation to reduce its greenhouse gas emissions and to protect and enhance forest sinks. During the latter half of 2005, the government carried out a review of climate change policies. The review concluded that the existing policy package would not significantly reduce New Zealand's carbon dioxide emissions and announced that no broad-based tax would be introduced before 2012, which is the final year of the first commitment period under the Kyoto Protocol. The government directed officials to report back on a number of policy options that may reduce greenhouse gas emissions, including alternative measures to the carbon tax (e.g. emissions trading, a narrow carbon tax and voluntary agreements), incentives for renewable energy, options for managing deforestation and encouraging afforestation, links between forestry and agriculture policies, incentives or disincentives for purchase and use of transport modes and vehicle efficiency, and the need for and future shape of cross sectoral incentive programmes. Other policies, such as the National Energy Strategy, the National Energy Efficiency and Conservation Strategy (to promote energy efficiency, energy conservation and renewable energy) and waste and transport strategies, also support the government's climate change objectives. New Zealand remains committed to meeting its international obligations under the Kyoto Protocol.
Land Information New Zealand (LINZ) advises the government, administers the Crown's interests in land and makes government-held land information available to the public.
LINZ is the government spatial referencing authority and the steward and standard setter for core national land databases, including the spatial referencing system, cadastral system, land titles, topography, hydrography and Crown property (excluding the conservation estate).
The valuer-general, whose office is established within LINZ, sets standards for rating valuations carried out by local authorities.
LINZ has two broad focuses – policy and regulatory responsibilities and standards for land-related and seabed information; and services to the public, such as the state-guaranteed issue of land titles, availability of land information and approval of survey plans.
Specifically, LINZ undertakes to:
Provide expert advice to the government on land-related laws and policies.
Provide a secure environment for buying, selling and subdividing property.
Administer the Crown's interests in land through acquisition, disposal and administration of Crown land and management of Crown land liabilities.
Assist the government and its agencies address Treaty of Waitangi issues through provision of information on land history and status.
Ensure New Zealand has high-quality databases for its survey, topographic, hydrographic and property activities.
Acts administered by LINZ include the Crown Grants Act 1908; Deeds Registration Act 1908; The Hunter Gift for the Settlement of Discharged Soldiers Act 1921; Land Act 1948 and regulations; Land Transfer Act 1952 and regulations; New Zealand Geographic Board Act 1946; Public Works Act 1981 and regulations; Rating Valuations Act 1998 and regulations; various reserves and other lands disposal acts; Survey Act 1986 and regulations; and the Unit Titles Act 1972.
The chief executive has statutory functions under the Public Works Act relating to disposal of surplus land. More than 450 other statutes give LINZ specific responsibilities for land transactions.
The Land Information New Zealand website is www.linz.govt.nz
Surveying infrastructure. The New Zealand survey system provides a national spatial reference framework for accurate location of land and seabed rights and resources. The spatial reference framework is based on a national network of survey control marks, including trig stations, connected to tidal gauges and to the global reference framework. Land Information New Zealand (LINZ) administers the survey system, primarily to provide reliable identification and definition of land boundaries for recording land rights for Crown, Māori, leasehold and freehold tenures. Associated with and supporting these systems is a database of all land parcels, together with street addresses and place names. The system also makes it possible to integrate other land and geographic information for activities such as defining electoral and other administrative boundaries, land development, resource management, granting mining and marine licences, locating utilities, engineering and construction, topographic mapping and hydrographic charting, scientific studies, location of marine and air navigation aids, both nationally and internationally, and determination of New Zealand's national and economic zone boundaries. The extent and location of boundaries and interests in land are defined and documented by licensed cadastral surveyors, mainly in the private sector. They submit records of surveys to LINZ for validation against existing records. LINZ maintains registers of rights and interests in land and undertakes checks to ensure new rights do not conflict with existing rights. This ensures certainty and security as to the extent of land rights and interests, irrespective of tenure. LINZ has completed conversion of its survey and title records and processes to a computerised system known as Landonline. The new system provides for semi-automated processing of survey and title transactions, for on-line access to survey and title records, and enables surveyors and conveyancers to lodge transactions with LINZ digitally.
Aerial photography. Extensive use is made of aerial photography to support revision of New Zealand's national mapping programme. Land Information New Zealand holds and maintains a national air photo library, which makes a comprehensive national source of land information data available to the public. Mapping companies also receive and hold multi-spectral imagery collected by earth resource satellites.
Topography and hydrography. National topographic information, which consists of 1:50,000 and other core topographic maps (including maps of the Pacific and the Antarctic), the digital topographic database, and Crown copyright aerial photographs provide a reliable and authoritative record of New Zealand's land form and its features. This information has many uses, including planning, construction, development, environmental assessment, local government administration, emergency services, search and rescue and defence. Hydrographic charts and publications must be carried by commercial ships navigating New Zealand waters. This is a statutory requirement contributing to safety at sea. Recreationalists are encouraged to use the information for small craft navigation. Charts range from detailed representations of harbours and their entrances to depictions of deep-sea passages. The National Topographic/Hydrographic Authority of LINZ regulates national topography and hydrography.
Nearly all privately-owned land in New Zealand is held under the land title system under authority of the Land Transfer Act 1952. Registered land ownership details are a matter of public record. The objective of the system is primarily to provide state-guaranteed certainty of title to land. LINZ provides land title registration services from regional offices in Dunedin, Christchurch, Wellington, Hamilton and Auckland. Most of LINZ's professional customers access this information through the Landonline system, which allows conveyancers to electronically submit title transactions for registration. Mandatory use of this system is to be phased in between May 2007 and July 2008. A computer register for a piece of land provides ownership details and a record of any registered interests. Most land is defined by reference to a survey plan. Documents listed on a computer register may include mortgages, leases, various types of charges, and rights and restrictions affecting the land in some way. Table 16.02 lists sales of freehold rural land for each half year from 31 December 1995 to 30 June 2005.
Table 16.02. Market sales of freehold rural land
| Half year ending | Number of sales | Total sale price | Index number1 | Change from previous half year |
|---|---|---|---|---|
1Base 1000 for half year ending 31 December 2003. Note:From June 2000 half year onwards, sales collated by sale date. Prior to that, sales collated by date sale notice received by Quotable Value. Source: Quotable Value | ||||
| $(million) | Percent | |||
| December 1995 | 1,153 | 483.0 | 678 | +1.0 |
| June 1996 | 2,006 | 1,133.9 | 686 | +1.2 |
| December 1996 | 1,121 | 452.7 | 690 | +0.6 |
| June 1997 | 1,365 | 635.0 | 671 | -2.8 |
| December 1997 | 1,023 | 411.5 | 671 | 0.0 |
| June 1998 | 1,160 | 559.2 | 648 | -3.4 |
| December 1998 | 718 | 299.0 | 657 | +1.4 |
| June 1999 | 1,347 | 701.9 | 663 | +0.9 |
| December 1999 | 952 | 438.0 | 666 | +0.5 |
| June 2000 | 1,298 | 720.4 | 670 | +0.6 |
| December 2000 | 1,192 | 737.8 | 700 | +4.5 |
| June 2001 | 1,712 | 1.179.4 | 726 | +3.7 |
| December 2001 | 1,534 | 1,036.6 | 780 | +7.4 |
| June 2002 | 1,484 | 1,118.7 | 802 | +2.8 |
| December 2002 | 1,235 | 883.3 | 835 | +4.1 |
| June 2003 | 1,442 | 1,215.8 | 906 | +8.5 |
| December 2003 | 839 | 645.4 | 1000 | +10.4 |
| June 2004 | 1,677 | 1,672.6 | 1117 | +11.7 |
| December 2004 | 1,323 | 1,451.3 | 1228 | +9.9 |
| June 2005 | 1,622 | 2,175.9 | 1324 | +7.8 |
Table 16.03 shows land transfer documents processed by LINZ from 1994 to 2005.
Table 16.03. Land transfer documents processed
Years ending 30 June
| Year | Instruments received | Certificates of title | Plans lodged | Guaranteed searches | Title searches | Document searches |
|---|---|---|---|---|---|---|
| Source: Land Information New Zealand | ||||||
| 1994 | 863,743 | 42,947 | 16,019 | 137,713 | 1,024,426 | 282,013 |
| 1995 | 873,883 | 48,839 | 17,726 | 145,773 | 982,846 | 273,784 |
| 1996 | 925,263 | 50,665 | 16,462 | 182,394 | 1,048,717 | 287,394 |
| 1997 | 859,162 | 63,012 | 18,995 | 184,995 | 948,565 | 257,638 |
| 1998 | 799,370 | 56,643 | 16,866 | 183,275 | 861,720 | 226,624 |
| 1999 | 777,236 | 53,143 | 13,610 | 195,974 | 862,449 | 195,088 |
| 2000 | 759,003 | 52,983 | 13,455 | 195,125 | 838,453 | 197,993 |
| 2001 | 662,945 | 46,803 | 11,700 | 181,618 | 824,708 | 179,417 |
| 2002 | 705,590 | 41,897 | 10,016 | 215,337 | 968,391 | 194,737 |
| 2003 | 818,225 | 45,571 | 10,836 | 195,791 | 1,317,569 | 268,501 |
| 2004 | 931,734 | 51,219 | 11,489 | 229,304 | 1,671,056 | 312,709 |
| 2005 | 891,778 | 54,510 | 12,809 | 260,609 | 2,066,238 | 351,197 |
The Overseas Investment Act 2005 and Overseas Investment Regulations 2005 govern acquisition of certain classes of New Zealand land by overseas parties.
The Overseas Investment Office (a regulatory unit within Land Information New Zealand) administers the legislation. The Minister of Finance is the minister responsible for the act.
Consent is required by an overseas person wanting to purchase or acquire an interest (for greater than three years) in land, either directly or by the purchase of shares in a company that owns land, that together with any associated land:
Exceeds five hectares in area (and is not urban land).
Is or includes part of the foreshore or seabed.
Is or includes an island (other than the North or South Island or certain specified islands).
Exceeds 4,000 metres squared and is held for conservation purposes; is provided as a reserve, a public park for recreation purposes or as a private open space; is subject to a heritage order or a requirement for a heritage order; is a registered historic place, historic area, wahi tapu (sacred to Māori) site or area, or for which there is an application or proposal for registration as such; is or includes the bed of a lake; is or includes part of certain specified islands
Exceeds 2,000 metres squared and adjoins the foreshore.
Exceeds 4,000 metres squared and adjoins the bed of a lake, a regional park or a class of land listed under section 37 of the act.
Exceeds 4,000 metres squared and adjoins land which exceeds 4,000 metres squared that is held for conservation purposes, or is provided as a scientific, scenic, historic or nature reserve; is subject to a heritage order or a requirement for a heritage order; is a registered historic place, historic area, wahi tapu site or area for which there is an application or proposal for registration as such; adjoins the sea or lake and is an esplanade reserve or strip, recreation reserve, a road or Māori reservation.
The Minister of Finance and the Minister for Land Information decide most land investment applications by overseas people. In considering whether or not to grant consent to an investment transaction, ministers must have regard to relevant criteria and factors in the act and regulations. The act also provides for conditions to be imposed on any consent granted and for those conditions to be monitored and enforced.
Before European settlement, all land was held by various groups and tribes of Māori in accordance with traditional customs and usage. Land remaining in this tenure is termed ‘Māori customary land'.
By the Treaty of Waitangi, the right to purchase land from Māori was reserved to the Crown.
Almost all of what had been ‘Māori customary land’ was converted to other forms of title by one or other of the following processes:
Purchase or other acquisition by the Crown, from whom European settlers obtained land.
Issue of a Crown grant to a Māori owner on recommendation of the Māori Land Court.
Issue of a freehold order by the Māori Land Court in favour of the Māori individual found entitled upon investigation of title. This process was used instead of the second process after introduction of the land transfer system into New Zealand.
Land in the titles issued under the latter two processes became known as ‘Māori freehold land.’ Because Māori can buy or otherwise acquire land which is not ‘Māori freehold land,’ there is a considerable amount of general land owned by Māori, in addition to holdings of ‘Māori freehold land.'
‘Māori freehold land’ is subject to jurisdiction of the Māori Land Court, pursuant to the Te Ture Whenua Māori Act 1993. Some general land owned by Māori is also subject to certain provisions of that act.
Māori Land Court. The purpose of the Māori Land Court Te Kooti Whenua Māori is to contribute to administration of Māori land and preservation of taonga Māori, and to promote management of Māori land by its owners. The court maintains records of title and ownership of Māori land, provides accurate and accessible information from court and Crown records, and provides support and services through its business unit within the Ministry of Justice. One of the strategic goals of the court is to make its services, in particular provision of title and ownership information, easily accessible to Māori. The court's website provides email access to all court offices and answers to frequently-asked questions about succession, trusts, Māori reservations and court processes. An online search tool provides title and ownership details. Table 16.04 lists blocks administered by the Māori Land Court in each district.
Table 16.04. Land administered by Māori Land Court
By land court district
At 30 November 2005
| District | Blocks administered | Total area |
|---|---|---|
| Source: Ministry of Justice | ||
| Number | Hectares | |
| Tai Tokerau | 5,366 | 151,860 |
| Waikato | 3,793 | 142,304 |
| Waiariki | 5,238 | 393,525 |
| Tai Rawhiti | 5,420 | 293,926 |
| Aotea | 3,957 | 417,328 |
| Takitimu | 1,352 | 88,664 |
| Te Wai Pounamu | 1,914 | 120,212 |
| Total | 27,040 | 1,607,819 |
Crown-owned land was administered before 1987 by various Crown agencies pursuant to the Public Works Act 1981, the Land Act 1948, the Reserves Act 1977, the National Parks Act 1980 and the Forests Act 1949.
Reconstruction of the public sector which began in 1987 included reorganisation of the government's environmental and public works administrations, and much of the Crown's commercial or productive land was subsequently transferred to state-owned enterprises.
Land remaining in Crown ownership is administered by service delivery departments where the land is required for the running of the business, the Department of Conservation in the case of reserves, and Land Information New Zealand in the case of residual Crown-owned land.
Land administered by Land Information New Zealand. Land Information New Zealand (LINZ) oversees management and disposal of the Crown's interest in land and property outside the conservation estate. LINZ administers 3 million hectares of Crown land pursuant to:
The Land Act 1948 and various endowment acts, comprising unalienated Crown land (3,366 properties).
The Crown Pastoral Land Act 1998, comprising 2.1 million hectares of South Island high country Crown pastoral leasehold land (304 properties).
The Crown Forest Assets Act 1989, comprising Crown forest land over which Crown forestry licences have been issued (71 licences).
The Public Works Act 1981, comprising land no longer required to be held by the Crown for the public work purpose for which it was acquired (127 properties).
The Railways Corporation Restructuring Act 1990, comprising land no longer required for railway operations (850 properties).
The department manages the process and policy for review of South Island high country Crown pastoral leasehold land. This tenure review process provides opportunities for better land use and sustainable land management objectives. All Crown forest land administered by the department is required to be held in Crown ownership pending the Crown's resolution of Māori land claims lodged pursuant to the Treaty of Waitangi Act 1975, or the completion of direct negotiations between the Crown and claimants. The department also administers an estimated 400 Crown land-related liabilities, such as contaminated sites, subsidence areas and residual issues concerning Crown land. The department also controls pest plants and animals on its land and on Crown-owned river and lake beds.
Land administered by service delivery Crown agencies. A significant quantity of Crown-owned land is held by service delivery Crown agencies. This land is held for government works pursuant to the Public Works Act 1981 and other legislation, including education, defence and law and order.
Land administered by the Department of Conservation. The Department of Conservation administers national and forest parks, world heritage areas, wilderness areas, marginal strips around lakes and rivers and more than 1,000 other reserves. It also protects privately-owned land under special arrangements with landowners. The department is responsible for conservation in New Zealand's subantarctic islands.
Landcorp Farming Ltd (Landcorp), formerly known as Land Corporation Ltd, is a state-owned enterprise and a company formed and registered under the Companies Act 1993.
Among assets purchased from the Crown following establishment in 1987 were 177 farms, along with about 20,000 leases, licences and loans, all of which have now been purchased by the lessees, redeemed or otherwise disposed of by the company.
Landcorp is New Zealand's largest agricultural enterprise, farming nearly 900,000 animals on 112 farming units totalling 368,948 hectares. Its operations include production of livestock, meat, wool, milk and other products. The company markets its products in New Zealand and overseas. It conducts continuing research into genetic improvement and animal nutrition.
Business functions of Landcorp are:
Sustainable management of a profitable farming business and its continued development and growth.
Sale of land identified as having a higher value for uses other than farming.
Landcorp Group is structured into a parent company, Landcorp Farming Ltd, with its head office in Wellington and two business centres at Rotorua and Christchurch. Landcorp Farming Ltd has three wholly owned subsidiaries – Landcorp Developments Ltd and Landcorp Pastoral Ltd, which lease and develop former forestry land in the central North Island, and Landcorp Estates Ltd, which develops and sells land suitable for higher value use than farming.
The Landcorp Farming Ltd website is www.landcorp.co.nz
Equitable land values are needed for levying rates by local authorities; for apportioning rating levies across contributing local authorities; for assessing stamp, estate and gift duties; and for fixing prices for transfers of land to or from the Crown.
Quotable Value (QV) competes with other providers to gain contracts with local authorities to assess values of real estate for local rating purposes. The valuer-general audits the work of QV and other providers.
Valuers are required to determine the capital value of the whole property (land and buildings, plus improvements), the value of the land as if it were vacant, and the value of improvements (if any) upon the land. Improvements on land are defined as items of work done or structural additions resulting from materials used on, or for the benefit of, the land.
Valuation rolls. Valuation rolls are prepared for all districts over which a territorial local authority sets rates. The rolls show ownership, description and valuation of each property. District valuation rolls are revised at least once every three years. Objections can be lodged against revaluations and taken to the Land Valuation Tribunal.
Rating valuations. The Local Government (Rating) Act 2002 makes provision for real estate valuation as a basis for equitable adjustment of rates and levies among a number of local authorities or between parts of a territorial or regional authority if they have been revalued at different times.
Valuers’ Registration Board. The Valuers’ Act 1948 provides for protection of the public through registration of valuers of land. The Valuers’ Registration Board, chaired by the valuer-general, sets standards of education and practical experience required for registration. The board maintains a register of valuers who meet required standards and issues annual practising certificates to public valuers. In addition, the board exercises disciplinary power when a valuer is charged with incompetent, improper or unethical behaviour. In the year ending 31 December 2004, there were 26 complaints against valuers, which led to five inquiries. Outcomes of the inquiries were not available when this edition was published. Of the approximately 1,300 valuers registered at 31 December 2004, 893 held annual practising certificates. A year previously, 867 valuers held annual practising certificates.
The Department of Conservation administers the majority of publicly-owned land in New Zealand protected for scenic, scientific, historic and cultural reasons, or set aside for recreational purposes. More than 8 million hectares – nearly 30 percent of New Zealand's total area – are administered by the department.
There are 14 national parks, covering more than 3 million hectares; nearly 170 forest and conservation parks, covering about 1.3 million hectares; and about 3,500 reserves, including marine reserves. Additionally, more than 61,000 hectares of protected private land and covenants have been set aside for scenic, scientific or ecological reasons.
The department also has responsibility for preservation and management of wildlife, and has a role in management of the coastal marine area.
The National Parks Act 1980 provides for establishment of national parks in areas where the scenery is of such distinctive quality, or the natural features or ecological systems are so important scientifically, that their preservation is in the national interest.
The act also provides for the public to have access to the parks, though this is subject to conditions and restrictions necessary for preservation of native plants and animals, or for welfare of the parks in general. Access to specially protected areas, which total 55,000 hectares, is by permit only.
The act states that national parks are to be maintained as far as possible in their natural state so that their value as soil, water and forest conservation areas is maintained. Native plants and animals are to be preserved, and introduced plants and animals are to be removed if their presence conflicts with aims of the act.
Development in wilderness areas within national parks is restricted to foot tracks and huts essential for wild animal control or scientific research. The act allows the Department of Conservation to provide houses for park staff, accommodation houses and other buildings, hostels, huts, camping grounds, ski tows and similar facilities, parking areas and reading and tracks within the parks.
Accommodation, transport and other services at entry points to parks are provided by the department, other government agencies, voluntary organisations and private enterprise. Some services within parks, such as guided walks and skiing instruction, are provided by private firms under concessions from the department.
Trampers on the Tongariro Crossing in the Tongariro National Park.
Figure 16.05 shows parks and land administered by the Department of Conservation.
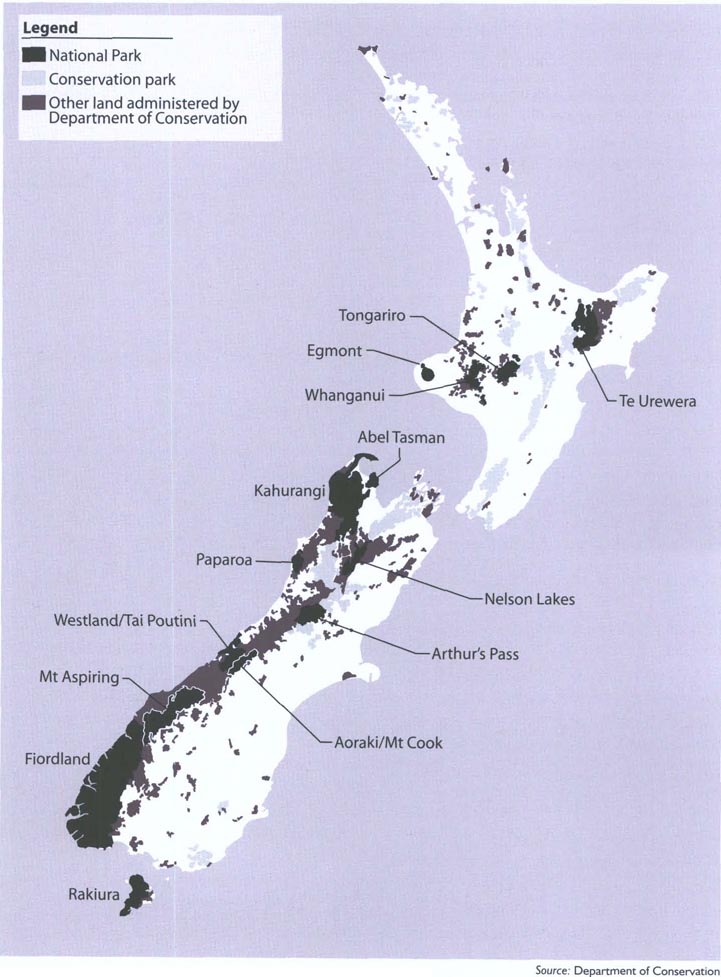
New Zealand has three sites in the World Heritage List under provisions of the United Nations Economic, Scientific and Cultural Organisation's World Heritage Convention. They are Te Wahipounamu (southwest New Zealand), Tongariro National Park and New Zealand's subantarctic islands.
In 2004, the World Heritage List contained 754 world heritage properties in the territories of 129 states. These properties have been recognised as the most outstanding natural and cultural places on earth.
Te Wahipounamu is one of the world's great forest and mountain wildernesses. It consists of 2.6 million hectares (10 percent of the area of New Zealand) of the south-west of the South Island. It includes Fiordland, Mt Aspiring, Westland/Tai Poutini and Aoraki/Mt Cook National Parks and coastal swamp kahikatea forests of south Westland.
Tongariro National Park is one of a limited number of sites accorded World Heritage status for both its natural and cultural values. It contains some of the most continuously active stratovolcanoes in the world and was the first national park in the world to be freely gifted to the nation by an indigenous people, the Ngāti Tūwharetoa, to whom the mountains are sacred.
New Zealand's subantarctic islands consist of five island groups (the Snares, Bounty Islands, Antipodes Islands, Auckland Islands and Campbell Island) in the Southern Ocean south-east of New Zealand. The islands have a high level of productivity, biodiversity, wildlife population densities and endemism among birds, plants and invertebrates. They are particularly notable for the large number and diversity of pelagic seabirds and penguins that nest there. There are 126 bird species in total, including 40 seabirds, of which five breed nowhere else in the world.
The Department of Conservation administers about 20 forest parks throughout New Zealand.
Primary purpose of the parks, in most cases, is to protect catchments of forested mountain ranges.
Forest parks provide a less restricted range of recreational activities than national parks and reserves, including tramping, camping, fishing and shooting for a variety of game.
Forest parks include coastal areas, lakes, mountains, tablelands and tussock grasslands with an approximate total area of 1.8 million hectares.
Reserve land includes scenic, nature, scientific, historic, national and recreational reserves, wildlife reserves, protected private land and land protected under various conservation and open space covenants.
Scenic reserves – About 382,000 hectares are classified scenic reserves. They include areas of scenic interest, such as native forests, limestone and glow worm caves, thermal areas, coastal areas, lakes, rivers, waterfalls and scenic vantage points.
Nature reserves – These reserves are established for preservation of native plants and animals. They generally consist of areas where rare plants are growing or which supply a suitable habitat for rare birds or other animals. Some of the 50-odd reserves (109,400 hectares) in this category are on the mainland, but most are on offshore or outlying islands.
National reserves – National reserves protect areas of outstanding natural beauty or scientific or ecological importance. They are second only to national parks in the degree of protection they offer. The Snares Islands, Auckland Islands, Campbell Island, Antipodes Island and the Bounty Islands together form the Subantarctic Islands National Reserve of approximately 74,885 hectares. The islands are major breeding places for several species of birds and animals, including the yellow-eyed penguin, the royal albatross and the Hooker's sea lion. The threat of rats or other predatory animals accidentally being introduced to the islands has led the Department of Conservation to allow access by permit only. Previous experience has shown that one pregnant rat arriving on a previously rat-free island could lead to extinction of a vulnerable species. Total area of national reserves is 96,300 hectares.
Scientific reserves – These are generally smaller areas reserved to protect examples of rare or endangered plants, animals or unique geographical features for scientific research or education. Entry may be prohibited if considered necessary to prevent disturbance. Their total area is 15,200 hectares.
Historic reserves – These reserves include Māori rock drawings, sites of prehistoric fortifications, landing places of Captain Cook, sites of engagements during the New Zealand wars and buildings of historic importance. The Department of Conservation and the New Zealand Historic Places Trust cooperate in investigation and administration of reserve sites and buildings. There are 16,122 hectares of historic reserves.
Recreation reserves – These include public domains, camping grounds and other public recreational areas administered by the Department of Conservation. Their total area is 60,261 hectares.
Wildlife reserves – Wildlife reserves may be proclaimed over land of any tenure, prohibiting certain actions in respect of wildlife, but without affecting land ownership. Their total area is just more than 19,000 hectares.
There are about 400 different fish in the waters around New Zealand, as well as various species of seals, cetaceans (whales and dolphins) and seabirds. More species of albatross breed in New Zealand than anywhere else in the world.
Thirty-five cetacean species have been recorded in New Zealand waters, and four of the largest whales (sperm, humpback, Bryde's and southern right whale) are regular visitors.
New Zealand has been actively promoting a South Pacific whale sanctuary to provide long-term protection for the breeding grounds of the region's great whales. The proposal has regularly received the support of a significant majority of members of the International Whaling Commission (IWC), but has not achieved the 75 percent majority required for establishment of sanctuaries under IWC rules.
Two whale sanctuaries have been established by the IWC in the Southern Hemisphere, the Indian Ocean sanctuary (established in 1978), and the Southern Ocean sanctuary (1994). All New Zealand waters south of 40° are included within the latter.
New Zealand sponsored a regional workshop to progress a South Pacific whale sanctuary in Apia, Samoa, in April 2001, attended by 15 Pacific Island nations and territories. The meeting strongly endorsed the sanctuary proposal. Since then, approximately 11 million square kilometres of the South Pacific have been declared whale sanctuaries by the governments of French Polynesia, Cook Islands, Niue, Fiji, New Caledonia, Samoa and American Samoa.
Figure 16.06 shows the Indian Ocean and Southern Ocean sanctuaries.
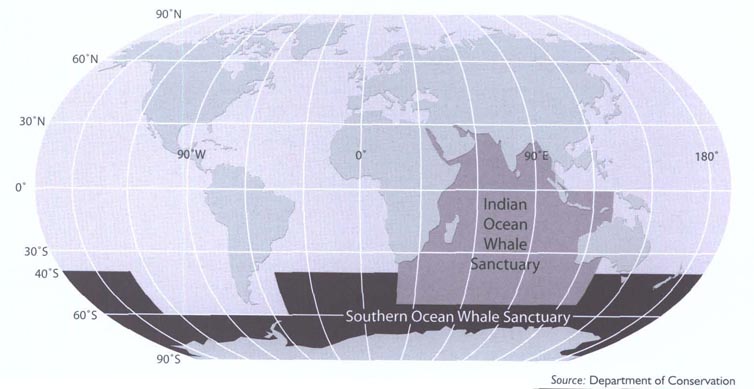
New Zealand has 27 marine reserves, with the Kermadec Islands Reserve the largest at 748,000 hectares. The Cape Rodney–Okakari Point Marine Reserve (547 hectares) was the first gazetted, in 1975, followed by the Poor Knights Islands Reserve (1,990 hectares) in 1981.
All the remaining reserves have been gazetted since 1990: Wanganui-A-Hei (840 hectares), Tuhua/Mayor Island (1,060 hectares), Kapiti (2,167 hectares), Long Island (619 hectares), Westhaven–Te Tai Tapu (536 hectares), Tonga Island (1,835 hectares), Te Awaatu Channel (93 hectares), Piopiotahi (690 hectares), Pohatu (215 hectares), Te Angiangi (446 hectares), Motu Manawa–Pollen Island (500 hectares), Long Bay–Okura (980 hectares), Te Tapuwae o Rongokako (2,452 hectares), Auckland Islands (484,000 hectares), Te Matuku (Waiheke Island), Ulva Island/Te Wharawhara (1,075 hectares) and eight marine reserves (totalling 9,520 hectares) recently established by special legislation in Fiordland.
Two other marine reserves, Horoirangi (North Nelson) and Whangarei Harbour, are in the final process of being gazetted. Several applications for new marine reserves are part way through the statutory process.
Marine parks can be established through a range of different statutory processes. New Zealand has four such marine parks protected and managed under different legislation, Mimiwhangata and Tawharanui, Sugar Loaf Islands and the Hauraki Gulf Marine Park.
New Zealand has two marine mammal sanctuaries, Auckland Islands and Banks Peninsula.
The Department of Conservation is responsible for fire control in state areas, which include national parks and reserves, forest parks and unalienated Crown land, together with a one-kilometre fire safety margin adjoining all these lands.
Preservation of all classes of natural ecosystems and landscapes which give New Zealand its natural character is required by the Reserves Act 1977, and the Protected Natural Areas Programme has been developed to help achieve this goal.
The programme operates in two phases: an ecological survey to identify unprotected areas that best represent a wider area (generally using the framework of ecological regions and districts), and negotiation with landowners of effective forms of protection for proposed representative areas.
Most programme surveys are carried out by the Department of Conservation or local government councils.
The Nature Heritage Fund and Ngā Whenua Rahui were established as part of New Zealand's indigenous forest policy. Both funds aim to permanently protect conservation value forest on general and Māori land. With the Nature Heritage Fund, this is achieved through gifting, covenanting and outright purchase. The Ngā Whenua Rahui fund uses a range of mechanisms to achieve protection, with covenanting being the most suitable. Iwi perceive covenants acceptable in lessening the sense of alienation from the land.
Both funds are contestable. Anyone can apply to the Nature Heritage Fund, but Ngā Whenua Rahui is restricted to Māori landowning interests. Applications for funds are considered by the advisory committees of the funds, who make recommendations to the Minister of Conservation.
New Zealand Conservation Authority. The New Zealand Conservation Authority provides advice to the Minister of Conservation on departmental policy development, including customary Māori use, Treaty of Waitangi issues and other conservation matters of national importance.
The authority, established in 1990 under the Conservation Act 1987, approves conservation management strategies and maintains close involvement in ecosystem protection, including animal and weed pests and the use of 1080 in animal control, and in development of strategies and plans to protect New Zealand's biodiversity.
It also has a particular interest in recreation and tourism, and is concerned that the Department of Conservation plans for tourism, develops performance measures and carries out research on physical and social impacts. Under the National Parks Act 1980, the authority approves national park management plans and investigates new national parks and additions to existing parks.
Conservation boards. New Zealand has 14 conservation boards serviced by the Department of Conservation. Conservation boards are statutory bodies providing advice on conservation areas, policies, activities and responsibilities of the department. They ensure the community has a voice in conservation management and represent the long-term public interest in conservation.
New Zealand Fish and Game Council. The New Zealand Fish and Game Council represents nationally the interests of anglers and hunters and provides coordination of management, enhancement and maintenance of sports fish and game. The council advises the minister and, together with regional fish and game councils, develops national policies for carrying out its functions. Other functions include an advocacy role in statutory planning processes and fair distribution of revenues among regional fish and game councils. The council's website is www.fishandgame.org.nz
Regional fish and game councils. There are 12 regional fish and game councils throughout New Zealand whose functions include assessing and monitoring fish and game, promotion and education, planning, representing interests of anglers and hunters in planning processes, and issuing licences to fish or hunt.
Taupo Fishery Advisory Committee. The Taupo Fishery Advisory Committee advises the Department of Conservation and the minister on day-to-day management by the department of the Taupo Fishing District and on allocation and expenditure of funds.
Queen Elizabeth II National Trust. The Queen Elizabeth II National Trust promotes and enables private conservation of open space in New Zealand, including natural features, landscapes and cultural and historic sites. Landowners voluntarily protect in perpetuity features on their land through the trust's open space covenants or protection agreements. The land remains in private ownership but, once the covenant is registered on the land title, existing and subsequent landowners are bound by the covenant's protection requirements. The trust acts as perpetual trustee. At 30 June 2005, there were 2,113 registered covenants over 71,648 hectares of land throughout New Zealand and a further 609 covenants covering 20,492 hectares had been approved for registration. The trust also owns property, most of which has been gifted or bequeathed, where a range of natural, cultural, scientific and aesthetic values are protected. In the year ending 30 June 2005, the trust received a base funding grant of $1.318 million and a biodiversity funding grant of $1.333 million from the government. It also generated funds from its own activities and investments.
New Zealand Historic Places Trust. The New Zealand Historic Places Trust is a non-profit organisation which exists to identify, record and preserve New Zealand's historic buildings, archaeological sites and wāhi tapu, and to encourage public interest in the nation's past. The trust's website is www.historic.org.nz
Waitangi National Trust Board. The Waitangi National Trust Board administers the Waitangi National Reserve, which includes the Treaty House at Waitangi. The reserve was gifted to the nation in 1932 by then Governor-General of New Zealand Viscount Bledisloe. The Minister of Conservation is administrator of the trust and is an ex-officio member of the board. Other members of the board are the governor-general (chairman), the prime minister, the Minister of Māori Affairs and nine others representing those with a close association to the Treaty of Waitangi.
Boards with specific responsibilities. A number of boards have been set up to help the government and the Department of Conservation administer specific responsibilities. These include the Lakes Rotoiti and Okataina Scenic Reserve Boards; Guardians of Lakes Manapouri, Monowai and Te Anau; Guardians of Lake Wanaka; Whitireia Park Board; Te Roaroa Waipoua; and the Archaeological Advisory Committee.
New Zealand Game Bird Habitat Trust Board. The New Zealand Game Bird Habitat Trust Board is a small public entity of six people appointed to a three-year term by the Minister of Conservation to administer and distribute funds derived from the sale of habitat stamps and artwork, primarily to improve game bird habitat, and, secondarily, to improve the habitat of other wildlife. It is serviced by the New Zealand Fish and Game Council.
New Zealand has many private organisations involved in conservation and environmental issues. These vary from local clubs concerned with protection or restoration of the local environment to national and international groups concerned about preserving the environment for its ecological, scientific, recreational or scenic value.
Environment and Conservation Organisations of New Zealand (ECO) is a network of about 70 organisations concerned about the environment. Members range from large international organisations, such as Greenpeace, to small local groups. The Environment and Conservation Organisations of New Zealand website is www.eco.org.nz
Federated Mountain Clubs is a national organisation of more than 100 tramping, mountaineering, skiing, mountainbiking and deerstalking clubs. It has approximately 14,000 members and promotes rights of access, preservation and sound management of the backcountry. The federation's website is www.fmc.org.nz
16.1 Statistics New Zealand; Ministry of Economic Development; Bioethics Council; Ministry for the Environment.
16.2 Ministry for the Environment; Ministry of Agriculture and Forestry; Ministry of Economic Development; Ministry of Foreign Affairs and Trade.
16.3 Land Information New Zealand; Quotable Value New Zealand; Ministry of Justice; Department of Conservation; Land Corporation Limited; Valuers’ Registration Board.
16.4 Department of Conservation; Queen Elizabeth II National Trust.
www.doc.govt.nz – Department of Conservation
www.eco.org.nz – Environment and Conservation Organisations of New Zealand
www.fmc.org.nz – Federated Mountain Clubs
www.linz.govt.nz – Land Information New Zealand
www.landcorp.co.nz – Landcorp Farming Ltd
www.maorilandcourt.govt.nz – Māori Land Court
www.maf.govt.nz – Ministry of Agriculture and Forestry
www.med.govt.nz – Ministry of Economic Development
www.mfe.govt.nz – Ministry for the Environment
www.mfat.govt.nz – Ministry of Foreign Affairs & Trade
www.justice.govt.nz – Ministry of Justice
www.qe2.org.nz – Queen Elizabeth II National Trust
www.qv.co.nz – Quotable Value New Zealand
www.stats.govt.nz – Statistics New Zealand
Table of Contents
Strong employment and earnings boosted consumer spending in the year ending 31 March 2005, with increases also recorded in non-residential building.
New Zealand has a mixed economy that operates on free market principles. It has a sizeable service sector, which complements a highly efficient agricultural sector and related manufacturing industries. The economy is strongly trade oriented, with exports of goods and services accounting for just under a third of real expenditure gross domestic product (GDP).
From around 1984 onwards, the direction of economic policy in New Zealand turned away from intervention toward elimination of many forms of government assistance. On the macroeconomic level, policies were aimed at achieving low inflation and a sound fiscal position, while microeconomic reforms were introduced to open the economy to competitive pressures and world prices. Reforms included floating the exchange rate; abolition of controls on capital movements; ending industry assistance; removal of price controls; deregulation across a number of sectors of the economy; corporatisation and privatisation of state-owned assets; and labour market legislation aimed at facilitating more flexible patterns of wage bargaining. More recently, the reform process has shifted from one of rapid change to one of fine tuning.
After a period of weak growth in the late 1980s, New Zealand's economic performance improved significantly during the 1990s. From mid-1991, the economy grew strongly, with particularly strong output growth from 1993 to 1996. Annual average growth in real GDP peaked at 6.8 percent in June 1994. Growth slowed during 1997 and 1998 due to a slowdown in key Asian trading partner economies, together with a drought that affected large parts of the country in the summers of 1997/98 and 1998/99.
In recent years, the economy has performed strongly, with the exception of a short weaker period during 2001 when growth slowed to around 2 percent, much lower than the 5.5 percent peak reached in the year ending 30 June 2000. However, the economy regained momentum, with a combination of two good agricultural seasons, relatively high world prices for New Zealand's export commodities, a low exchange rate and a robust labour market contributing to strong income flows throughout the economy.
From 2002 to 2004, growth was generally in the 3.5 percent to 4.5 percent range, peaking just above this at 4.8 percent annual average growth in December 2002.
This period of strong growth included a period in which the economy was subject to several negative temporary events. These included travel disruptions and uncertainty due to the conflict in Iraq, the outbreak of Severe Acute Respiratory Syndrome (SARS) and the effects of dry weather on hydro-electricity production and farm output.
New Zealand's annual average growth has been fuelled in recent years by household spending and business investment.
More recently, growth appears to be easing. Annual average growth slowed to 3.1 percent in the June 2005 quarter, down from 4.4 percent at the end of 2004. Quarterly growth of 1.1 percent recorded for the June 2005 quarter, followed growth of 0.7 percent and 0.2 percent in the previous two quarters. The main sources of recent growth have been household spending and business investment.
The demand for imports associated with a strong domestic economy, together with relatively weak export growth, resulted in net exports subtracting from growth.
Strength in household spending was supported by relatively low interest rates, a strong labour market and rising house prices. Strong employment growth contributed to the unemployment rate falling to 3.4 percent in the September 2005 quarter.
Growth in export earnings was fairly modest, with the high exchange rate offsetting the impact of relatively high world prices for a number of New Zealand's key exports. In addition, relatively weak agricultural production affected export earnings.
Weak export earnings, together with the impact of strong domestic growth on import demand, and an increase in investment income deficit due to strong profits of foreign-owned firms, saw an increase in the annual current account deficit to 8.0 percent of nominal gross domestic product (GDP) in the June 2005 quarter.
Annual Consumers Price Index (CPI) inflation increased to 3.4 percent in the September 2005 quarter. Behind the headline number there were diverging trends between tradeable and non-tradeable inflation. Strength in the domestic economy, particularly in the housing market, resulted in an increase in non-tradeable inflation, with an annual 4.4 percent recorded in the September 2005 quarter.
In contrast, strength in the currency and discounting in international airline travel resulted in relatively low tradeable inflation, with tradeable prices recording an annual increase of 1.9 percent in the September 2005 quarter.
The fiscal responsibility provisions of the Public Finance Act 1989 are intended to assist in achieving consistent, good-quality fiscal management, enabling the government to make a major contribution to the economic health of the country and be better positioned to provide a range of services on a sustained basis.
The act requires the Crown's financial reporting to be in accordance with New Zealand Generally Accepted Accounting Practice.
The primary fiscal indicators are the operating balance, gross-sovereign issued debt, net debt and net worth.
The government is required to pursue its policy objectives in accordance with the principles of responsible fiscal management as set out in the act.
These include:
Reducing debt to prudent levels to provide a buffer against future adverse events.
Maintaining operating balances once prudent debt levels are reached, i.e. the government is to live within its means over time, with some scope for flexibility through the business cycle.
Achieving and maintaining levels of net worth to provide a buffer against adverse events.
Managing risks facing the Crown.
Pursuing policies consistent with a reasonable degree of predictability about the level and stability of future tax rates.
Operating balance. Following a prolonged period of fiscal deficits, New Zealand achieved surpluses in 1993/94. The initial improvement in the operating balance from 1993/94 onwards reflected a growing economy, increasing tax revenues and firm expense control. Reductions in the operating balance in the late 1990s largely reflected two rounds of tax reductions and lower nominal economic growth that reduced tax revenue growth. Strong growth in the past few years has seen operating balances recovering. The operating balance, excluding revaluations and accounting policy changes, reached $8.9 billion in 2004/05. Government operating expenses (core Crown) have been reduced as a percentage of gross domestic product (GDP), from around 40 percent in 1992/93 to 31 percent in 2004/05. Core Crown expenses as a percentage of GDP are expected to rise to around 32.4 percent by 2008/09. Operating surpluses are expected to continue. Forecasts for 2005/06, 2006/07, 2007/08 and 2008/09 are $7.3 billion, $6.3 billion, $4.2 billion and $5.5 billion respectively.
Net debt. Net core Crown debt has fallen from 49 percent of gross domestic product (GDP) in 1992/93 to 7.2 percent in 2004/05. Debt repayments have been financed from asset sales proceeds (during the 1990s) and operating surpluses. Looking forward, net debt is projected to fall to around 6.3 percent of GDP in 2008/09. However, surpluses are also being used to build up financial assets in the New Zealand Superannuation Fund (NZSF) to partially pre-fund future superannuation costs, rather than solely paying down debt. These assets do not form part of reported net debt. The NZSF is forecast to contain assets of around 11.1 percent of GDP by 2008/09.
Net worth. Net worth was $50.0 billion in 2004/05. With operating surpluses forecast to continue, net worth is projected to reach $65.2 billion in 2008/09.
Before March 1985, the government borrowed externally to finance the balance of payments deficit and maintain a fixed exchange rate.
Since adoption of a freely floating exchange rate, the government has borrowed externally only to finance foreign-exchange reserves. All other borrowing has been in the domestic market.
Net foreign-currency debt was eliminated in September 1996, largely through proceeds from asset sales and, since 1994, sizeable fiscal surpluses.
Proceeds from the 2005/06 domestic bond programme are being used to finance maturing domestic term debt and to partially pre-fund the 2006/07 borrowing requirement. Gross sovereign-issued debt amounted to 23.5 percent of gross domestic product in the year ending 30 June 2005.
Objectives. The Reserve Bank of New ZealandAct 1989 requires the bank to formulate and implement monetary policy with the objective of achieving and maintaining stability in the general level of prices. The act requires an agreement between the Minister of Finance and the Governor of the Reserve Bank (the Policy Targets Agreement) more precisely specifying the objective. Initially, the agreement required the bank to maintain Consumers Price Index (CPI) inflation in the range of 0 to 2 percent in any 12-month period. The range was changed to 0 to 3 percent in December 1996. In September 2002, a new PTA was signed requiring the bank to keep inflation within the 1 to 3 percent range ‘on average over the medium term'. The Reserve Bank of New Zealand has noted that the requirement to deliver price stability ‘on average over the medium term’ means monetary policy can be a little more flexible than previously. The medium-term target allows inflation to be briefly above or below the target range. In certain circumstances, this allows a more gradual policy response, while in others a more pre-emptive approach can be taken. A more gradual approach may help in situations where the effects of interest rate changes are uncertain, or where sharp changes in interest rates to bring inflation back quickly within the target range would be economically disruptive. A more pre-emptive approach may be helpful in circumstances where the bank is reasonably confident that the economy has passed a turning point in terms of inflation pressures. Then, even if inflation is still comparatively high or low, an early change to policy settings can help the economy return to more normal conditions. This flexibility is expected to help the bank meet a requirement in the agreement that in aiming to deliver price stability it should ‘seek to avoid unnecessary instability in output, interest rates and the exchange rate'. The bank has noted that its ability to use this extra flexibility is contingent on inflation expectations remaining well anchored at low levels. The Reserve Bank Act contains certain provisions that enable the government to override the price stability objective and the Policy Targets Agreement, but this can be done only for periods not exceeding 12 months (but capable of further extension) and must be disclosed in parliament and publicly.
Implementation. Under the Reserve Bank Act, the Reserve Bank of New Zealand acts with a considerable degree of autonomy in formulating and implementing monetary policy. The bank controls the cost of liquidity by setting an Official Cash Rate (OCR). The bank stands ready to lend cash overnight at 25 basis points above the OCR and will take deposits at 25 basis points below the OCR. By controlling the cost of liquidity for financial institutions, the bank has leverage over interest rates faced by households and firms. There are pre-announced dates (eight each year) at which the bank may reset the OCR. Four of the dates coincide with publication of the bank's Monetary Policy Statements, which contain projected paths for future conditions and the bank's policy response. As a small, open economy, both interest rates and the exchange rate can influence New Zealand's economic activity and inflation. The Reserve Bank of New Zealand, therefore, takes the influence of both of these into account when setting the OCR. Other important factors to consider include credit conditions, inflation expectations and external conditions. The bank has noted that it is generally looking at the inflation outlook up to three years ahead when formulating policy response.
Prices influence choices consumers make about which goods and services they buy.
Prices are a key factor in the operation of the New Zealand economy. Prices consumers pay for goods and services affect their purchasing power, that is, the quantity of goods and services they can buy.
Prices also influence choices consumers make about which goods and services they buy.
Prices are a factor of supply and demand. If a commodity is limited in supply, the price to be paid will increase. Examples of commodities which are often limited in supply include petrol, property and construction trade services.
Similarly, if demand for commodities increases, due, for example, to population growth or higher disposable incomes, prices will also generally rise.
In general, population and incomes rise over time, and so demand for goods and services rises. This leads to inflation, or the upward movement of prices over time.
Price indexes provide a measure of inflation by measuring changes in prices over time and can be constructed for any given commodity or group of commodities.
The Consumers Price Index (CPI) is the official measure of inflation in the New Zealand economy and, as such, is a widely-used statistic.
The CPI measures changes in the prices of goods and services purchased by private New Zealand households. It is the best available measure of the effect of changes in retail prices on the average household budget.
Statistics New Zealand endeavours to keep the basket of goods and services, for which prices are regularly surveyed, constant in quantity and quality over time so that only ‘pure’ price movements are recorded.
Price collection. More than 100,000 individual prices are collected each quarter. Prices are gathered via the internet, through postal and email surveys and by collectors in the field. The frequency with which prices are collected for each item depends on how volatile the price of that item is, For example, petrol prices can rise and fall quite significantly from week to week, so petrol prices are collected weekly. Prices are collected monthly for food items and quarterly for most other commodities. A, weighted average of all the prices collected within the quarter is then calculated. Index values are constructed for each item, then compared against the previous period's index value. The change in the index value reflects the change in the average price of the item.
Expenditure weights. Each item in the Consumers Price Index (CPI) is assigned an expenditure weight, which reflects the percentage of total expenditure by private New Zealand households on that item. For example, the expenditure weight given to vehicles is 4.48, meaning that 4.48 percent of total household expenditure is on the purchase of vehicles. By comparison, the expenditure weight given to medical insurance is 0.15. A change in the average price of a vehicle will have a far greater impact on households than a change in the price of medical insurance, and this is reflected in the CPI. Expenditure weights assigned to each item in the CPI are reviewed about every three years to ensure that changes in consumer spending and consumption behaviours are accurately reflected in the CPI basket. Every six years (at every second re-weight), the items themselves are reviewed to ensure that any new or superseded items are either added to or removed from the basket. Items such as DVDs, portable MP3 players and digital cameras need to be included in the CPI basket when they become available to consumers, while items no longer purchased by private households, such as tapes and records, need to be removed. Item expenditure weights are derived from the Household Economic Survey, conducted every three years.
Table 17.01 shows expenditure weights assigned to nine groups, as derived from the 1999 and 2002 Household Economic Surveys.
The main uses of the CPI include indexation of contracts, setting of monetary policy and as a deflator of other economic series.
Indexation of contracts. There are a number of situations where indexes are used to adjust payments. The following indexation arrangements can apply to both public sector and private sector arrangements:
Adjusting for changes in the cost of living – Many public sector arrangements are based on ensuring a sufficient level of income for people to enable them to continue to buy a range of goods and services. In the context of income support, much depends on whether the objective is to maintain the spending power of a benefit, or to match changes in the average wage. In the first case, the tendency is to use the CPI to adjust payments, while in the latter it is more useful to use a measure of an average wage.
Table 17.01. Consumers Price Index expenditure
weights1
Quarter ending 30 June
| Group | 1999 | 2002 |
|---|---|---|
1Values may not add to stated totals due to rounding. Source: Statistics New Zealand | ||
| Food | 18.17 | 17.21 |
| Housing | 23.04 | 19.63 |
| Household operation | 14.79 | 15.35 |
| Apparel | 3.73 | 4.69 |
| Transportation | 15.43 | 16.90 |
| Tobacco and alcohol | 9.25 | 8.72 |
| Personal and health care | 6.07 | 8.37 |
| Recreation and education | 8.82 | 8.56 |
| Credit services | 0.69 | 0.58 |
| All groups | 100.00 | 100.00 |
Compensating businesses for costs beyond their control – A common situation in business contracts is service providers wanting to be compensated for changes in input costs that they have little or no control over. In determining which index to use in adjusting a contract, firms typically use either an index that is closely related to the cost concerned, or use a more general measure that the parties agree would give a picture of relevant price pressures.
Ensuring regular payments maintain their value – There is a range of regular payments, for example rents, that need to be adjusted from time to time. Adjustment methods used are varied and a wide variety of indexation practices are used.
Monetary policy. Maintaining a stable general level of prices is seen as fundamental to a well-performing economy. The government aims to avoid large increases in the overall level of prices, because this causes erosion in the value of money and consequently consumers’ purchasing power. In the context of the CPI, this means maintaining inflation within a defined range. The Reserve Bank of New Zealand has a formal agreement (the Policy Targets Agreement) with the government that it will use monetary policy to maintain inflation between 1 and 3 percent over the medium term. The bank uses a mechanism called the Official Cash Rate (OCR) to achieve this outcome. The OCR is the benchmark interest rate from which all borrowing and savings interest rates are set in New Zealand. By adjusting the OCR up or down, the bank can influence the cost to consumers of borrowing money for goods and services. The higher the OCR, the greater the cost of borrowing money. This increased cost results in a reduction in consumer demand for goods and services and therefore reduces inflationary pressures. Conversely, if inflation pressures are low, the bank can lower the OCR, therefore reducing the cost to consumers of borrowing money, which will have an upward influence on demand and inflation. The Reserve Bank of New Zealand reviews the OCR approximately every six weeks to ensure that the cost of consumer borrowing is having the desired influence on demand and inflation. Between December 2003 and December 2005, the bank made nine incremental increases to the OCR. At December 2005, the OCR was 7.25 percent, the highest since its introduction in 1999.
Deflator. Many economic series, such as the value of retail sales, can be deflated using the CPI, or a similar index, to produce constant price series. The purpose of a constant prices series is to compare values between different periods, with the effect of price changes removed. For example, if the total value of retail sales increased 47 percent between the June 1999 and June 2005 quarters, some of this increase could be attributed to price changes. Say we find that, after deflation using an appropriate price index, the total value of retail sales increased 34 percent over this same period, then this is the change in the volume of retail sales. In other words, 34 percent of the increase is due to changes in volume (or the number of sales transactions) and the remaining 13 percent is due to price changes. Other economic series which are deflated using price indexes include gross domestic product (GDP), business investment and household consumption expenditure.
The CPI is divided into nine groups of items, each weighted according to the expenditure on those items by private New Zealand households. Each group is made up of one or more subgroups which, in turn, are made up of sections, subsections and, finally, individually priced items. The expenditure weight assigned to each group is equivalent to the sum of the expenditure weights for all of the items in that group.
Food. All items within the food group are priced monthly. Items priced are mostly those available in supermarkets, including fruit and vegetables, meat, fish and poultry, and grocery foods, soft drinks and confectionery. Prices for restaurant meals and ready-to-eat food are also collected. Food prices increased by an average of 5 percent a year between the June 2000 and June 2002 quarters, then just 2 percent a year from the June 2002 quarter to the June 2005 quarter.
Housing. The housing group includes rents, costs of purchasing and constructing new dwellings, legal and real estate expenses, home maintenance costs, insurance and local authority rates. Housing prices rose consistently between 1999 and 2005, except for a slight decline in the March 2001 quarter.
Household operation. The household operation group includes electricity, household appliances and furnishings, household supplies and services and water and refuge charges. Household operation prices have been historically stable. Prices fell slightly between the June 2000 and June 2001 quarters and then, except for two quarters, had risen slightly up to the December 2005 quarter.
Apparel. The apparel group includes clothing and footwear. Apparel prices have been flat since 1999, increasing only 1.9 percent between the June 1999 and June 2005 quarters.
Transportation. The transportation group includes public and private transportation costs, including taxi, bus, train and ferry fares, purchase of vehicles, and motor vehicle running and maintenance costs. Transportation prices have been historically volatile. Significant increases in transportation costs were recorded between the June 1999 and December 2000 quarters, and between the March and December 2005 quarters.
Tobacco and alcohol. The tobacco and alcohol group includes cigarettes, tobacco, beer, spirits and liqueurs and wine. The tobacco and alcohol group has recorded the strongest increase in prices since the June 1999 quarter, with growth of 9.6 percent recorded for the year to the March 2001 quarter.
Personal and health care. The personal and health care group includes personal goods and services such as personal care supplies and hairdressing services, and medical and health services and supplies. Personal and health care prices have risen consistently since the June 1999 quarter.
Recreation and education. The recreation and education group includes stationery, books, magazines and newspapers, leisure and recreation supplies and services, accommodation and board, tuition and examination fees and child care costs. As at the December 2005 quarter, the recreation and education group had risen consistently, except for three quarters, since the June 1999 quarter.
Credit services. The credit services group includes bank fees and credit service charges, such as loan application fees. Prices for credit services fell 8.5 percent for the year to the December 2001 quarter before stabilising. Prices began rising again in the December 2004 quarter, and were up 9.8 percent for the year to the December 2005 quarter.
Figure 17.01 compares price movements for each of the nine groups since the June 1999 quarter.
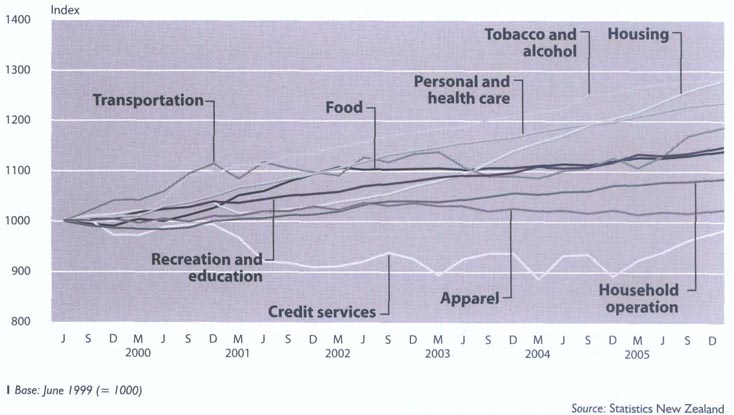
Table 17.02 shows weighted average prices of goods and services in each of the June quarters from 2002 to 2005. These weighted average prices of selected items are used in the calculation of the Consumers Price Index and provide reliable movements in price levels when compared with average prices for earlier periods. The quantity and price of any goods or service will differ from shop to shop and over time, so these prices are not designed to give a statistically accurate measure of absolute transaction prices.
Table 17.02. Retail prices of selected items
June quarter
2003–2005
| Item | Unit | 2003 | 2004 | 2005 |
|---|---|---|---|---|
| Source: Statistics New Zealand | ||||
| $ | ||||
| House paint – acrylic, white | 41 | 80.50 | 82.23 | 84.00 |
| Concrete blocks | per 100 | 279.65 | 286.48 | 291.96 |
| Plasterboard | per sheet | 19.44 | 19.37 | 19.84 |
| Spouting/guttering – plastic | per 3 m | 22.55 | 22.02 | 27.92 |
| Bleach | 1.5 1 | 2.12 | 2.14 | 2.22 |
| Detergent – dishwashing | 900 ml | 3.21 | 3.32 | 3.28 |
| Soap powder | 1 kg | 4.60 | 4.70 | 4.91 |
| Cling food wrap – refill roll | 15 m | 1.69 | 1.68 | 1.68 |
| Electric light bulb, 100 watt | each | 0.98 | 1.00 | 1.01 |
| Batteries – heavy duty, size D | twin pack | 4.15 | 4.20 | 4.20 |
| Veterinary services – speying a cat | 81.25 | 85.92 | 95.32 | |
| Postage – standardpost, medium size | each | 0.40 | 0.45 | 0.45 |
| Socks – mens's, wool/nylon | pair | 8.46 | 8.50 | 8.76 |
| Pantyhose – 15 denier, average size | pair | 4.38 | 4.34 | 4.38 |
| Wool – hand knitting, double crepe | 50g | 5.60 | 5,82 | 5.77 |
| Warrant of fitness – private car | 35.42 | 37.99 | 40.20 | |
| Petrol – 91 octane | 101 | 9.93 | 11.84 | 12.68 |
| Beer – 355ml cans | 1 dozen | 16.76 | 16.82 | 17.47 |
| Whisky – scotch | 1,125 ml | 41.04 | 41.90 | 42.41 |
| Tissues – facial | box of 200 | 2.54 | 2.57 | 2.55 |
| Toilet paper | 4 rolls | 2.95 | 3.03 | 3.04 |
| Hairdressing – men's, dry cut | 17.93 | 18.54 | 19.63 | |
| Hairdressing – woman's, wet cut | 44.64 | 47.08 | 48.54 | |
| Soluble aspirin | pkt of 24 | 3.13 | 3.21 | 3.30 |
| Envelopes – 90mm x 152mm | pkt of 20 | 1.43 | 1.45 | 1.49 |
| Compact disc – current top 10 album | each | 29.20 | 27.68 | 28.21 |
| Developing and printing film, 35mm colour film | 24 prints | 17.36 | 17.33 | 17.04 |
Inflation, as measured by consumer prices indexes, rose in 29 of the 30 Organisation for Economic Co-operation and Development (OECD) countries in 2004.
Japan was the only country in the OECD to experience no change between 2003 and 2004.
The New Zealand Consumers Price Index (CPI) saw a slightly larger increase in 2004 (2.3 percent) than in 2003 (1.7 percent). This still left New Zealand below the OECD average, which increased 2.4 percent in 2004, down slightly from 2003 when prices increased 2.5 percent.
Figure 17.02 compares New Zealand's CPI with that of its major trading partners, Australia, United States, United Kingdom and Japan. The graph shows that compared with the June 1999 quarter, New Zealand recorded the third largest increase in prices, behind Australia and the United States.
Figure 17.02. Consumers Price Index international comparisons 1999–2005
Excludes housing and credit
services
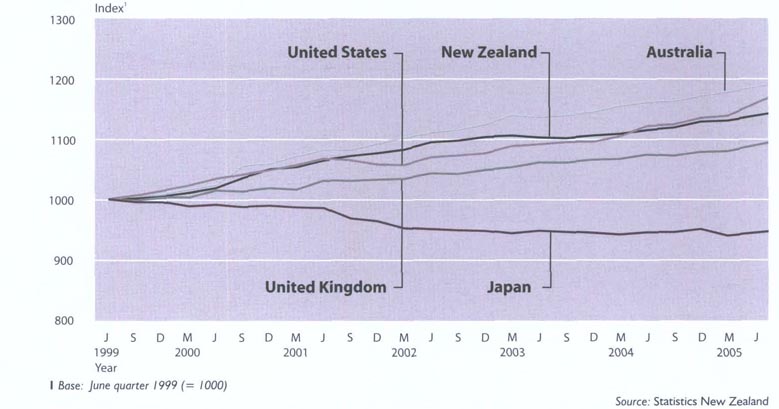
From deflation to inflation New Zealand's inflation rate, as measured by the Consumers Price Index (CPI), has been calculated since 1925. Historical results of interest include the depression years of the early 1930s, when significant negative inflation (deflation) was recorded, and the high inflation years of the 1970s and 1980s. The CPI recorded a 9.2 percent decrease in the year ending 31 December 1932. By contrast, CPI inflation for the year ending 30 June 1987 was 18.9 percent. More recently, CPI inflation for the year ending 31 December 2005 was 3.2 percent. Significant upward contributions to this increase came from higher construction costs (up 6.4 percent) and petrol prices (up 17.4 percent). Figure 17.03 shows the annual rate of inflation (from June quarter to June quarter), as measured by the CPI from 1975 to 2005. Source: Statistics New Zealand |
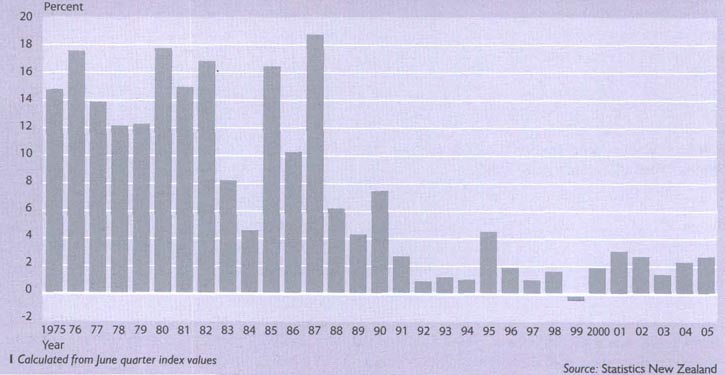
The Producers Price Index (PPI) compiled by Statistics New Zealand is a series of quarterly economic indicators designed to measure price changes in the production sector of the economy. The Consumers Price Index (CPI), on the other hand, measures price changes in the household sector of the economy.
The PPI has two types of indexes – ‘outputs’ measure changes in prices received by producers for the products and services they provide, while ‘inputs’ measure changes in prices for inputs used in the production process, excluding capital and labour costs.
Sharply declining export log prices throughout 2002 and 2003 were influencing factors on movements in the Producers Price Index.
Uses of the PPI. The PPI can be used in analysis of inflationary trends and in economic forecasting and is a key input for the calculation of national accounts and real gross domestic product (by measuring changes in production at a constant price). The indexes that form the PPI are also widely used to determine increases allowable under escalation clauses and in commercial contracts.
Influences on the PPI. Two distinct issues have had major impacts on the Producers Price Index in recent years. The New Zealand dollar has appreciated against the country's major trading partners, which exerts a downward influence on prices, while increasing domestic consumption (fuelled by rising house prices and labour shortages leading to higher incomes) has put upward pressure on prices. Producers output prices rose 1.1 percent during 2003, 2,6 percent during 2004 and 3.9 percent in 2005. Input prices were steady in 2003 (down 0.1 percent), but rose during 2004 and 2005 (3.4 percent and 6.5 percent respectively). Some of the commodities significantly influencing these figures were:
Crude oil. Between the December 2003 and December 2005 quarters, the price New Zealand paid for imported crude oil rose 80.8 percent. Major factors in this rise were the rapidly increasing demand for fuel by developed and developing nations, Middle East conflict and extreme weather conditions. Had the New Zealand dollar not appreciated over the same period, increases in the price paid for oil (in New Zealand dollar terms) would have been even larger.
Electricity. Prices for electricity generation and supply showed strong increases in 2005 as demand continued to increase toward full supply capacity. In the year ending 31 December 2005, electricity generation and supply prices rose 28.9 percent.
Forest products. Sharp declines in exported log prices throughout 2002 and 2003 had not recovered by the end of 2005. Prices showed inconsistent movements during 2004 and 2005 and largely remained around the same level as the fourth quarter of 2003. Prices for domestic log sales showed a steady decline from 2003 through to 2005.
Livestock and meat production. Higher world prices led to small increases in livestock and meat prices throughout 2004 and 2005. Concerns over animal health in some countries contributed to tight supply to the benefit of New Zealand exporters.
Dairy products. Prices for dairy products rose throughout 2004 and 2005 as international demand increased.
Construction. The construction sector has experienced a period of sustained growth since 2003, with consistently rising prices for both construction and the services related to construction, Increasing raw material prices (especially steel) and the cost of labour have been major contributors to rising output prices.
Gross domestic product represents income earned from production in New Zealand.
Countless transactions take place within the New Zealand economy every day. Businesses and individuals buy and sell goods and services, the government collects taxes and pays beneficiaries, and individuals are paid for their labour and buy groceries or pay the rent. Measuring all these transactions is a complex task, but essential to understanding how the economy operates.
In New Zealand, as in most other countries, myriads of transactions are classified, measured and recorded in the national accounts, which provide a convenient summary of key economic and financial flows, Moreover, they provide a framework in which to analyse and compare important economic variables, such as household consumption and savings.
The national accounts capture all types of transactions. They do so for the economy as a whole, or for certain groups or sectors within it, such as business, government or households.
Gross domestic product (GDP) represents income earned from production in New Zealand, whether that is carried out by New Zealanders or foreign firms operating within New Zealand. It does not measure final incomes which New Zealand residents earn.
Gross national income (GNI) is a better measure of New Zealanders’ income, as it excludes income remitted abroad (dividends, interest and other transfers) and includes similar income earned by New Zealanders from overseas investments. Further adjustments to take account of depreciation and transfers from the rest of the world give an even better measure of income (national disposable income).
Table 17.03 shows that in the year ending 31 March 2005, GDP in current prices rose by 6.7 percent. When the effects of inflation are removed, there was an increase of 3.7 percent in constant price GDP for the March 2005 year. Strong employment and earnings boosted consumer spending, and there was a significant increase in business investment on fixed assets, such as plant, machinery and equipment, although these were largely imported. Increases were also recorded in government spending, residential buildings and non-residential buildings.
Table 17.03. Principal aggregates: 1993–2005
Years ending 31 March
| Year | Gross domestic product (GDP) | Gross national income (GNI)1 | National disposable income (NDI)2 | GDP in constant prices3 |
|---|---|---|---|---|
1GNI = GDP plus net investment income from the rest of the world. 2NDI = GNl less consumption of fixed capital plus net current transfers from the rest of the world. 3Chain-volume series expressed in 1995/96 prices. Chain-volume series are not additive. Source: Statistics New Zealand | ||||
| $(million) | ||||
| 1993 | 75,787 | 71,084 | 59,429 | 79,959 |
| 1994 | 81,990 | 76,238 | 64,514 | 85,108 |
| 1995 | 87,908 | 81,953 | 69,729 | 89,644 |
| 1996 | 93,387 | 87,388 | 74,522 | 93,386 |
| 1997 | 97,952 | 90,688 | 77,859 | 96,674 |
| 1998 | 101,589 | 95,190 | 81,693 | 98,138 |
| 1999 | 103,430 | 98,451 | 83,977 | 98,556 |
| 2000 | 109,696 | 103,091 | 88,077 | 103,745 |
| 2001 | 115,941 | 108,361 | 92,287 | 105,975 |
| 2002 | 124,875 | 117,784 | 100,637 | 110,147 |
| 2003 | 130,856 | 123,813 | 105,538 | 115,290 |
| 2004 | 139,225 | 131,819 | 113,154 | 119,401 |
| 2005 | 148,558 | 138,593 | 119,013 | 123,841 |
The consolidated accounts of the nation consist of four accounts:
Gross domestic product and expenditure account. Gross domestic product is a measure of the value added from all economic activity in New Zealand. The account shows the various forms of income generated by production, and the categories of final expenditure on available goods and services.
Table 17.04 shows the gross domestic product expenditure account for the years 2000–05.
Table 17.04. Gross domestic product and expenditure account
Years ending 31 March
| Item | 2000 | 2001 | 2002 | 2003 | 2004 | 2005 |
|---|---|---|---|---|---|---|
Note: Figures may not add to stated totals due to rounding. - nil or zero Source: Statistics New Zealand | ||||||
| $(million) | ||||||
| Compensation of employees | 45,834 | 48,163 | 51,539 | 54,904 | 58,693 | 62,918 |
| Gross operating surplus | 50,051 | 53,505 | 58,273 | 59,555 | 63,022 | 66,954 |
| Taxes on production and imports | 14,143 | 14,653 | 15,444 | 16,810 | 17,950 | 19,170 |
| Less subsidies | 333 | 379 | 381 | 412 | 440 | 485 |
| Gross domestic product | 109,696 | 115,941 | 124,875 | 130,856 | 139,225 | 148,558 |
| Final consumption expenditure | ||||||
| Private households | 64,458 | 67,087 | 70,772 | 74,987 | 79,921 | 85,633 |
| Private non-profit organisations serving households | 1,527 | 1,605 | 1,663 | 1,721 | 1,807 | 1,898 |
| Central government | 17,832 | 17,917 | 19,260 | 20,157 | 21,432 | 23,343 |
| Local government | 2,299 | 2,379 | 2,530 | 2,706 | 2,875 | 3,140 |
| Change in inventories | 1,537 | 1,419 | 1,888 | 769 | 1,159 | 1,638 |
| Gross fixed capital formation | 22,888 | 23,595 | 25,846 | 27,749 | 31,527 | 34,923 |
| Gross national expenditure | 110,541 | 114,002 | 121,959 | 128,090 | 138,721 | 150,574 |
| Exports of goods and services | 33,526 | 41,159 | 43,694 | 42,339 | 40,455 | 43,142 |
| Less imports of goods and services | 34,371 | 39,219 | 40,778 | 40,095 | 40,159 | 44,732 |
| Balance on external goods and services | -845 | 1,939 | 2,915 | 2,244 | 295 | -1,591 |
| Expenditure on gross domestic product.. | 109,696 | 115,941 | 124,874 | 130,334 | 139,016 | 148,984 |
| Statistical discrepancy | - | - | - | 523 | 209 | -426 |
National income and outlay account. National disposable income is the value of income available to New Zealanders, consisting mainly of incomes generated in New Zealand. Adjustments are made for income paid to, and received from, the rest of the world, The account also shows the part of disposable income spent by New Zealanders on current consumption, and the portion of income that was saved.
Table 17.05 shows the national income and outlay account for the years 2000–05.
Table 17.05. National income and outlay account
Years ending 31 March
| Item | 2000 | 2001 | 2002 | 2003 | 2004 | 2005 |
|---|---|---|---|---|---|---|
Note: Figures may not add to stated totals due to rounding. - nil or zero Source: Statistics New Zealand | ||||||
| $(million) | ||||||
| Use of income | ||||||
| Final consumption expenditure | ||||||
| Private households | 64,458 | 67,087 | 70,772 | 74,987 | 79,921 | 85,633 |
| Private non-profit organisations serving households | 1,527 | 1,605 | 1,663 | 1,721 | 1,807 | 1,898 |
| Central government | 17,832 | 17,917 | 19,260 | 20,157 | 21,432 | 23,343 |
| Local government | 2,299 | 2,379 | 2,530 | 2,706 | 2,875 | 3,140 |
| Total final consumption expenditure | 86,116 | 88,988 | 94.224 | 99,572 | 106,035 | 114,013 |
| Saving | 1,961 | 3,299 | 6,413 | 5,966 | 7,118 | 5,000 |
| Use of national disposable income | 88,077 | 92,287 | 100,637 | 105,538 | 113,154 | 119,013 |
| Income | ||||||
| Compensation of employees | 45,834 | 48,163 | 51,539 | 54,904 | 58,693 | 62,918 |
| Compensation of employees from the rest of the world (net) | - | - | - | - | - | - |
| Gross operating surplus | 50,051 | 53,505 | 58,273 | 59,555 | 63,022 | 66,954 |
| Taxes on production and imports | 14,143 | 14,653 | 15,444 | 16,810 | 17,950 | 19,170 |
| Less subsidies | 333 | 379 | 381 | 412 | 440 | 485 |
| Investment income from the rest of the world (net) | -6,605 | -7,580 | -7,091 | -7,043 | -7,406 | -9,965 |
| Gross national income | 103,091 | 108,361 | 117,784 | 123,813 | 131,819 | 138,593 |
| Current transfers from the rest of the world (net) | 427 | 483 | 246 | 113 | 391 | 494 |
| Gross national disposable income | 103,517 | 108,844 | 118,030 | 123,926 | 132,210 | 139,087 |
| Less consumption of fixed capital | 15,440 | 16,558 | 17,393 | 18,388 | 19,056 | 20,074 |
| National disposable income | 88,077 | 92,287 | 100,637 | 105,538 | 113,154 | 119,013 |
National capital account. The national capital account (Table 17.06) records capital expenditure. The difference between the accumulation of capital assets and the sources of funds (mainly savings and the income set aside for the replacement of capital equipment) gives a residual to be borrowed from (or lent to) the rest of the world.
Table 17.06. National capital account
Years
ending 31 March
| Item | 2000 | 2001 | 2002 | 2003 | 2004 | 2005 |
|---|---|---|---|---|---|---|
1Includes all government-owned producer enterprises. Note: Figures may not add to stated totals due to rounding. Source: Statistics New Zealand | ||||||
| $(million) | ||||||
| Change in inventories | 1,537 | 1,419 | 1,888 | 769 | 1,159 | 1,638 |
| Gross fixed capital formation | ||||||
| Private | 18,913 | 20,102 | 20,498 | 22,501 | 25,384 | 28,263 |
| Central government1 | 2,063 | 2,212 | 3,212 | 3,089 | 4,072 | 4,358 |
| Local government 1 | 1,912 | 1,281 | 2,136 | 2,159 | 2,071 | 2,301 |
| Purchase of non-produced non-financial assets from the rest of the world (net) | 4 | -1 | -7 | -47 | 3 | -6 |
| Net lending to the rest of the world | -7,436 | -5,339 | -2,414 | -3,101 | -5,997 | -10,953 |
| Capital accumulation | 16,992 | 19,675 | 25,314 | 25,370 | 26,692 | 25,602 |
| Saving | 1,961 | 3,299 | 6,413 | 5,966 | 7,118 | 5,000 |
| Consumption of fixed capital | 15,440 | 16,558 | 17,393 | 18,388 | 19,056 | 20,074 |
| Capital transfers from the rest of the world (net) | -409 | -182 | 1,508 | 1,538 | 726 | 102 |
| Finance of capital accumulation | 16,992 | 19,675 | 25,314 | 25,892 | 26,901 | 25,176 |
| Statistical discrepancy | - | - | - | -523 | -209 | 426 |
The two key components of national income, employment income and business profits, both increased in the March 2005 year, with the largest contributor being compensation of employees. National disposable income, which measures the income available to New Zealand residents for current consumption or saving, rose 5.2 percent. However, with final consumption expenditure (private and government) up 7.5 percent, national saving declined from $7.118 billion to $5.000 billion. As a proportion of national disposable income, saving was 4.2 percent in the March 2005 year, down from the 6.3 percent recorded in the March 2004 year. Investment in fixed assets grew strongly for the third successive year, up $3.396 billion in the March 2005 year. Much of this reflected the buoyant property market, with investment in new housing up $1.083 billion and non-residential buildings up $872 million. The strong New Zealand dollar encouraged fixed asset investment in plant machinery and equipment, which was up $997 million. With the decline in domestic saving, much of the increase in investment was financed externally. Net borrowing from the rest of the world increased from $5.997 billion (4.3 percent of GDP) to $10.953 billion (7.4 percent of GDP).
Figure 17.04 shows national saving and overseas borrowing from 1996 to 2005.
External account. The external account (Table 17.07) brings together all transactions with the rest of the world. The residual ‘balance on the external current account', when adjusted for net capital transfers, records New Zealand's net lending/borrowing to the rest of the world. In the year ending 31 March 2005, the strengthening New Zealand dollar had a marked impact on the external account. Export volumes continued to grow (up 3.9 percent). Other food, beverages and tobacco increased 20.2 percent and metal products, machinery and equipment increased 9.7 percent. Dairy commodity volumes decreased 9.3 percent, compared with increases of 21.5 percent and 5.2 percent in the March 2003 and 2004 years respectively. Export receipts increased 6.6 percent, while the merchandise trade export price index increased 3.7 percent for the year ending March 2005, the first increase since the year ending March 2001. While import volumes were up strongly (by 13.7 percent), import payments increased 11.4 percent, reflecting the stronger New Zealand dollar and demand for cheaper imports. Flowing on from the strengthening New Zealand dollar, the balance on the external current account rose from $6.7 billion to $11.1 billion, or 7.4 percent of GDP.
Table 17.07. External account
Years ending 31
March
| Item | 2000 | 2001 | 2002 | 2003 | 2004 | 2005 |
|---|---|---|---|---|---|---|
- nil or zero Note: Figures may not add to stated totals due to rounding. Source: Statistics New Zealand | ||||||
| $(million) | ||||||
| CURRENT | ||||||
| Income from the rest of the world | ||||||
| Exports of goods | 24,872 | 31,073 | 32,867 | 30,648 | 29,054 | 31,114 |
| Exports of services | 8,654 | 10,085 | 10,827 | 11,690 | 11,400 | 12,028 |
| Compensation of employees | - | - | - | - | - | - |
| Investment income | 2,899 | 1,819 | 2,173 | 2,596 | 2,663 | 2,848 |
| Current transfers | 1,262 | 1,358 | 1,332 | 1,376 | 1,431 | 1,556 |
| Total | 37,688 | 44,336 | 47,198 | 46,311 | 44,548 | 47,546 |
| Payments to the rest of the world | ||||||
| Imports of goods | 25,573 | 29,008 | 30,533 | 29,982 | 30,130 | 33,516 |
| Imports of services | 8,799 | 10,211 | 10,245 | 10,113 | 10,029 | 11,216 |
| Compensation of employees | - | - | - | - | - | - |
| Investment income | 9,504 | 9,399 | 9,263 | 9,639 | 10,069 | 12,813 |
| Current transfers | 836 | 875 | 1,086 | 1,263 | 1,040 | 1,063 |
| Balance on the external current account | -7,024 | -5,158 | -3,929 | -4,686 | -6,720 | -11,061 |
| Total | 37,688 | 44,336 | 47,198 | 46,311 | 44,548 | 47,546 |
| CAPITAL | ||||||
| Capital transfers from the rest of the world | 484 | 779 | 2,278 | 2,337 | 1,774 | 1,347 |
| Less capital transfers to the rest of the world.. | 893 | 961 | 769 | 799 | 1,047 | 1,244 |
| Capital transfers from the rest of the world, net | -409 | -182 | 1,508 | 1,538 | 726 | 102 |
| Balance on the external current account | -7,024 | -5,158 | -3,929 | -4,686 | -6,720 | -11,061 |
| Capital receipts | -7,433 | -5,340 | -2,421 | -3,148 | -5,994 | -10,959 |
| Purchase of non-produced non-financial assets from the rest of the world, net | 4 | -1 | -7 | -47 | 3 | -6 |
| Net lending to the rest of the world | -7,436 | -5,339 | -2,414 | -3,101 | -5,997 | -10,953 |
| Capital disbursements | -7,433 | -5,340 | -2,421 | -3,148 | -5,994 | -10,959 |
| MEMORANDUM: Investment income | ||||||
| Investment income from the rest of the world.. | 2,899 | 1,819 | 2,173 | 2,596 | 2,663 | 2,848 of which: |
| Reinvested earnings on overseas direct investment | 546 | -1,222 | 123 | 446 | 797 | 629 |
| Investment income to the rest of the world of which: | 9,504 | 9,399 | 9,263 | 9,639 | 10,069 | 12,813 |
| Reinvested earnings on direct investment in New Zealand | 250 | 925 | 1,924 | 2,357 | 2,429 | 4,426 |
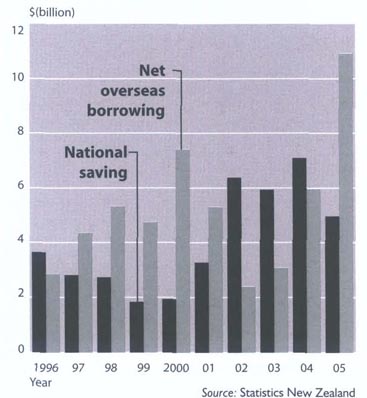
The ‘value added’ component of industrial production is measured by taking the value of goods and services produced by an industry (output) and deducting the cost of goods and services used by the industry in the production process (intermediate consumption).
Gross domestic product (GDP) is then obtained by totalling the value added for all industries.
GDP by industry is calculated annually in current and constant prices, and quarterly in constant prices.
Industries are combined to form the following broad groupings:
Primary industries (agriculture; fishing; forestry; mining and quarrying).
Goods-producing industries (manufacturing; electricity, gas and water; construction).
Service industries (wholesale trade; retail trade, accommodation and restaurants; transport and communications; finance, insurance, real estate and business services, including owner-occupied dwellings; government administration and defence; personal and community services).
A mixed season over much of the country limited growth in agricultural production, which was up by only 0.3 percent for the year ending 31 March 2005.
Milk production decreased as a result of the difficult growing season, although losses in production were offset by improved dairy prices. Meat production and exports were not affected, with production up and stronger export volumes and prices.
Retail trade was a major contributor to increased activity in the service industry sector in the year ending 31 March 2005.
Tables 17.08 and 17.09 detail production-based GDP statistics.
The increase in building investment was reflected in strong growth in the construction industry, which was up 7.1 percent in the March 2005 year.
The growth in household expenditure was also shown in increased activity in service-based industries, up 4.4 percent for the March 2005 year, with the wholesale trade, transport and communications, retail trade, accommodation and restaurant sectors being major contributors.
Table 17.08. Gross domestic product in constant
prices1
By broad industry group
| Year | Primary industries | Goods-producing industries | Service industries | Gross domestic product | ||||
|---|---|---|---|---|---|---|---|---|
| $(million) | Percentage change | $(million) | Percentage change | $(million) | Percentage change | $(million) | Percentage change | |
1Chain-volume series expressed in 1995/96 prices. Chain volume series are not additive. Rrevised Source: Statistics New Zealand | ||||||||
| Years ending | 31 March Actual annual values and percentage change from the previous year | |||||||
| 1993 | 6,227 | -9.5 | 18,667 | 1.7 | 51,369 | 2.6 | 79,959 | 1.1 |
| 1994 | 7,141 | 14.7 | 19,985 | 7.1 | 53,908 | 4.9 | 85,108 | 6.4 |
| 1995 | 7,066 | -1.1 | 21,400 | 7.1 | 56,675 | 5.1 | 89,644 | 5.3 |
| 1996 | 7,518 | 6.4 | 22,006 | 2.8 | 59,239 | 4.5 | 93,386 | 4.2 |
| 1997 | 8,315 | 10.6 | 22,521 | 2.3 | 61,170 | 3.3 | 96,674 | 3.5 |
| 1998 | 8,373R | 0.5 | 22,688R | 0.2 | 63,309R | 2.5 | 98,138R | 1.5 |
| 1999 | 8,050R | -3.9 | 21,847R | -3.7 | 64,805R | 2.4 | 98,556R | 0.4 |
| 2000 | 8,321R | 3.4 | 23,184R | 6.1 | 67,968R | 4.9 | 103,745R | 5.3 |
| 2001 | 8,520R | 2.4 | 23,321R | 0.6 | 69,839R | 2.8 | 105,975R | 2.1 |
| 2002 | 8,608R | 1.0 | 23,737R | 1.8 | 73,463R | 5.2 | 110,147R | 3.9 |
| 2003 | 8,574R | -0.4 | 25,688R | 8.2 | 76,499R | 4.1 | 115,290R | 4.7 |
| 2004 | 8,513R | -0.7 | 26,552R | 3.4 | 79,508R | 3.9 | 119,401R | 3.6 |
| 2005 | 8,486R | -0.3 | 27,379R | 3.1 | 82,996R | 4.4 | 123,841 | 3.7 |
| Quarters ending | Seasonally adjusted values and percentage change from the previous quarter | |||||||
| 2003 Mar | 2,107R | -1.5 | 6,515R | -0.2 | 19,393R | 0.9 | 29,129R | 0.2 |
| Jun | 2,106R | -0.1 | 6,426R | -1.4 | 19,547R | 0.8 | 29,185R | 0.2 |
| Sep | 2,136R | 1.4 | 6,597R | 2.7 | 19,740R | 1.0 | 29,680R | 1.7 |
| Dec | 2,112 | -1.1 | 6,667R | 1.1 | 20,014R | 1.4 | 29,987R | 1.0 |
| 2004 Mar | 2,146 | 1.6 | 6,885R | 3.3 | 20,295R | 1.4 | 30,522R | 1.8 |
| Jun | 2,136R | -0.5 | 6,869R | -0.2 | 20,449R | 0.8 | 30,729R | 0.7 |
| Sep | 2,122R | -0.6 | 6,892R | 0.3 | 20,621R | 0.8 | 30,918R | 0.6 |
| Dec | 2,112R | -0.5 | 6,798R | -1.4 | 20,852R | 1.1 | 30,978R | 0.2 |
| 2005 Mar | 2,119R | 0.3 | 6,816R | 0.3 | 21,089R | 1.1 | 31,203R | 0.7 |
| Jun | 2,144R | 1.2 | 6,839R | 0.3 | 21,299R | 1.0 | 31,570R | 1.2 |
| Sep | 2,137 | -0.3 | 6,753 | -1.3 | 21,457 | 0.7 | 31,632 | 0.2 |
Figure 17.05 shows the contributions of primary, goods-producing and service industries to annual changes in GDP in constant prices.
Figure 17.05. Business activity
Industry
contributions to annual change in GDP in constant
prices
Years ending 31
March
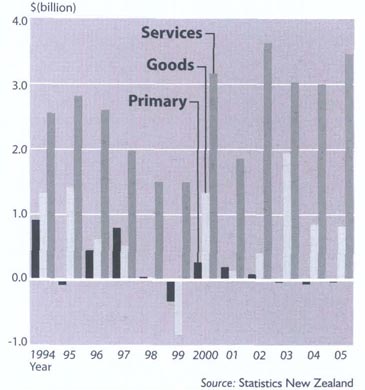
Table 17.09. Gross domestic product in constant
prices1
By industry
Years
ending 31 March
| Year | Agriculture | Fishing, forestry and mining | Manufacturing | Electricity gas and water | Construction | Wholesale trade | Retail, accommodation and restaurants | Transport and communication | Finance insurance and business services | Government administration and defence | Personal and community services | Gross domestic product |
|---|---|---|---|---|---|---|---|---|---|---|---|---|
1Chain-volume series expressed in 1995/96 prices. Chain-volume series are not additive. Source: Statistics New Zealand | ||||||||||||
| $(million) | ||||||||||||
| 1993 | 3,775 | 2,487 | 13,837 | 2,056 | 2,835 | 6,317 | 5,849 | 5,635 | 20,997 | 4,211 | 8,947 | 79,960 |
| 1994 | 4,588 | 2,562 | 14,749 | 2,182 | 3,134 | 6,694 | 6,185 | 6,154 | 21,729 | 4,279 | 9,431 | 85,107 |
| 1995 | 4,555 | 2,521 | 15,728 | 2,260 | 3,520 | 7,183 | 6,694 | 6,851 | 22,279 | 4,250 | 9,977 | 89,644 |
| 1996 | 4,955 | 2,576 | 16,027 | 2,389 | 3,710 | 7,374 | 6,891 | 7,701 | 23,127 | 4,344 | 10,374 | 93,384 |
| 1997 | 5,486 | 2,841 | 16,282 | 2,210 | 4,150 | 7,368 | 7,004 | 8,071 | 24,107 | 4,337 | 10,905 | 96,676 |
| 1998 | 5,496 | 2,877 | 16,166 | 2,229 | 4,289 | 7,570 | 7,120 | 8,385 | 24,684 | 4,282 | 11,276 | 98,132 |
| 1999 | 5,221 | 2,827 | 15,599 | 2,290 | 3,928 | 7,725 | 7,173 | 8,893 | 24,932 | 4,271 | 11,861 | 98,555 |
| 2000 | 5,377 | 2,944 | 16,370 | 2,189 | 4,605 | 8,545 | 7,557 | 9,786 | 25,735 | 4,209 | 12,321 | 103,748 |
| 2001 | 5,525 | 2,991 | 16,791 | 2,218 | 4,293 | 8,887 | 7,704 | 10,452 | 26,129 | 4,290 | 12,686 | 105,971 |
| 2002 | 5,579 | 3,024 | 17,067 | 2,151 | 4,515 | 9,350 | 8,001 | 11,121 | 27,596 | 4,38 | 13,390 | 110,150 |
| 2003 | 5,499 | 3,112 | 18,209 | 2,321 | 5,138 | 9,724 | 8,418 | 11,720 | 28,650 | 4,571 | 13,842 | 115,288 |
| 2004 | 5,589 | 2,872 | 18,466 | 2,344 | 5,718 | 10,113 | 8,860 | 12,260 | 29,566 | 4,835 | 14,338 | 119,392 |
| 2005 | 5,606 | 2,799 | 18,760 | 2,451 | 6,123 | 10,769 | 9,393 | 12,945 | 30,394 | 5,122 | 4,918 | 123,797 |
Another way of measuring gross domestic product (GDP) is to total all final domestic expenditures on goods and services, add the value of exports and subtract the value of imports.
There are three broad categories of final domestic expenditures:
Final consumption expenditure of households, private non-profit institutions serving households, and general government.
Gross fixed capital formation by producers.
Change in inventories, which consist of increases/decreases in producers’ stockholdings of raw materials, work in progress and finished goods.
Conceptually, both the production and expenditure-based GDP series are the same.
However, as each series uses independent data and estimation techniques, some differences between the alternative measures do arise.
Expenditure on GDP is calculated annually and quarterly in current and constant prices.
It is summarised in Table 17.10.
Growth in the economy for the year ending 31 March 2005 was driven by domestic demand. Investment in fixed assets grew strongly, with significant spending on plant machinery and equipment, together with non-residential building and new residential housing.
Consumer spending was buoyant and government spending also rose, largely because of increased expenditure on defence equipment and increased employment within law, order and public safety.
Table 17.1. Expenditure on gross domestic product
Years ending 31 March
| Year | Private final consumption expenditure | General government final consumption expenditure | Change in inventories | Gross fixed capital formation | Gross national expenditure | Exports of goods and services | Less imports of goods and services | Expenditure on gross domestic product |
|---|---|---|---|---|---|---|---|---|
Note:Figures may not add to stated totals due to rounding. Chain-volume series are not additive. Source: Statistics New Zealand | ||||||||
| $(million) | ||||||||
| Current prices | ||||||||
| 1991 | 44,640 | 14,058 | -154 | 14,421 | 72,965 | 19,755 | 19,569 | 73,152 |
| 1992 | 44,494 | 14,319 | -88 | 11,973 | 70,696 | 21,488 | 19,248 | 72,936 |
| 1993 | 45,357 | 14,843 | 624 | 13,092 | 73,918 | 23,700 | 21,859 | 75,758 |
| 1994 | 47,441 | 15,041 | 1,432 | 15,564 | 79,481 | 25,085 | 22,688 | 81,876 |
| 1995 | 51,192 | 15,267 | 1,166 | 18,355 | 85,984 | 26,951 | 25,296 | 87,639 |
| 1996 | 54,546 | 16,303 | 1,182 | 20,600 | 92,634 | 27,125 | 26,373 | 93,386 |
| 1997 | 58,079 | 16,933 | 809 | 21,539 | 97,367 | 27,528 | 26,943 | 97,952 |
| 1998 | 60,565 | 18,364 | 817 | 21,408 | 101,157 | 28,531 | 28,100 | 101,589 |
| 1999 | 63,461 | 18,653 | 270 | 20,742 | 103,126 | 30,394 | 30,091 | 103,429 |
| 2000 | 65,985 | 20,131 | 1,537 | 22,889 | 110,541 | 33,526 | 34,371 | 109,696 |
| 2001 | 68,692 | 20,296 | 1,419 | 23,595 | 114,002 | 41,159 | 39,219 | 115,941 |
| 2002 | 72,436 | 21,789 | 1,888 | 25,846 | 121,959 | 43,694 | 40,778 | 124,875 |
| 2003 | 76,710 | 22,864 | 771 | 27,749 | 128,090 | 42,339 | 40,095 | 130,334 |
| 2004 | 81,728 | 24,307 | 1,162 | 31,527 | 138,731 | 40,455 | 40,159 | 139,026 |
| 2005 | 87,531 | 26,483 | 1,690 | 34,923 | 150,628 | 43,142 | 44,733 | 149,036 |
| Chain-volume series expressed in 1995/96 prices | ||||||||
| 1991 | 48,242 | 15,124 | 317 | 15,628 | 79,245 | 20,152 | 19,412 | 80,086 |
| 1992 | 47,504 | 15,062 | -154 | 12,861 | 75,447 | 22,147 | 18,711 | 79,163 |
| 1993 | 47,709 | 15,177 | 762 | 13,656 | 77,432 | 22,868 | 20,059 | 80,417 |
| 1994 | 49,513 | 15,396 | 1,350 | 16,043 | 82,402 | 24,445 | 21,584 | 85,430 |
| 1995 | 52,596 | 15,537 | 1,292 | 18,543 | 88,006 | 26,522 | 24,694 | 89,882 |
| 1996 | 54,547 | 16,304 | 1,182 | 20,600 | 92,633 | 27,125 | 26,373 | 93,385 |
| 1997 | 57,000 | 16,566 | 830 | 21,644 | 96,037 | 28,401 | 28,072 | 96,367 |
| 1998 | 58,266 | 17,899 | 691 | 21,693 | 98,556 | 29,505 | 28,776 | 99,240 |
| 1999 | 60,069 | 17,799 | 393 | 21,158 | 99,430 | 30,356 | 29,367 | 100,381 |
| 2000 | 62,074 | 18,810 | 1,575 | 23,403 | 105,742 | 32,591 | 32,694 | 105,593 |
| 2001 | 62,950 | 18,424 | 1,207 | 23,565 | 106,104 | 34,648 | 32,478 | 108,209 |
| 2002 | 64,969 | 19,266 | 1,282 | 25,041 | 110,487 | 35,702 | 33,784 | 112,300 |
| 2003 | 67,734 | 19,673 | 934 | 26,892 | 115,093 | 38,495 | 36,214 | 117,309 |
| 2004 | 72,028 | 20,290 | 1,195 | 30,943 | 124,104 | 39,121 | 40,871 | 121,862 |
| 2005 | 76,202 | 21,352 | 1,611 | 33,372 | 132,167 | 40,660 | 46,452 | 126,098 |
Households consist of New Zealand resident individuals and families. Income is earned from businesses, as wages and salaries and entrepreneurial income, or from investments, as interest and dividends.
Households buy goods and services from businesses and incur interest charges to service borrowing.
Consumer spending on goods and services (such as motor vehicles, food, recreation, health and education) is by far the largest part of household outlays.
Indirect taxes (such as GST) are included in the value of consumer spending on goods and services.
Household consumption expenditure increased by 7.1 percent in the year ending 31 March 2005, following an increase of 6.6 percent in the previous March year. This reflected increased household incomes from both higher employment levels and earnings for paid employees.
Table 17.11 shows household spending by the use made of goods and services purchased. Accordingly, a mixture of goods and services may be combined in a single category. For example the hotel and restaurants item includes expenditure on food, alcohol and accommodation.
As Figure 17.06 shows, the increase in household spending was most noticeable in purchases of services, which rose 6.5 percent in the year ending 31 March 2005. Significant purchases were transport services and big ticket items, such as furniture and appliances.
Spending by households on non-durable goods also rose, by 6.7 percent, as did spending on durable goods, by 6.2 percent.
There has been consistent positive growth in the volume of household consumption spending since the year ending 31 March 2001.
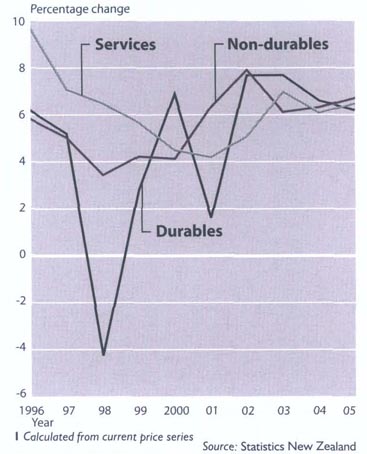
Table 17.11. Household consumption expenditure
By
purpose
Years ending 31
March
| Year | Food and beverages | Clothing and footwear | Housing | Household goods and services | Health and medical | Transport | Recreation and education | Hotels and restaurants | other goods and services | Net tourist expenditure | Total household consumption |
|---|---|---|---|---|---|---|---|---|---|---|---|
.. figures not available Note:Figures may not add to stated totals due to rounding. Source: Statistics New Zealand | |||||||||||
| $ (million) | |||||||||||
| Current prices | |||||||||||
| 1990 | 7,143 | 2,233 | 8,443 | 4,608 | 1,268 | 6,949 | 3,664 | 3,056 | 4,758 | -405 | 41,718 |
| 1995 | 8,843 | 2,511 | 10,313 | 5,932 | 1,646 | 7,712 | 5,344 | 3,810 | 5,340 | -1,245 | 50,206 |
| 2000 | 10,939 | 3,038 | 13,925 | 6,982 | .. | 9,167 | .. | 4,945 | 7,215 | -2,009 | 64,458 |
| 2003 | 13,518 | 3,598 | 14,933 | 8,363 | .. | 10,896 | .. | 5,910 | 8,776 | -3,894 | 74,987 |
| 2004 | 14,357 | 3,879 | 15,705 | 8,958 | .. | 11,639 | .. | 6,256 | 9,184 | -3,899 | 79,921 |
| 2005 | 15,092 | 4,132 | 16,439 | 9,743 | .. | 12,604 | .. | 6,762 | 9,698 | -3,627 | 85,633 |
| Actual chain-volume series expressed in 1995/96 prices | |||||||||||
| 1990 | 7,617 | 2,376 | 10,395 | 5,055 | 1,195 | 8,105 | 4,318 | 3,488 | 5,559 | -483 | 47,460 |
| 1995 | 8,952 | 2,486 | 11,083 | 5,913 | 1,723 | 7,934 | 5,553 | 3,908 | 5,472 | -1,386 | 51,614 |
| 2000 | 10,207 | 2,977 | 11,969 | 7,031 | .. | 9,517 | .. | 4,561 | 7,125 | -2,075 | 60,576 |
| 2003 | 11,454 | 3,411 | 12,513 | 8,207 | .. | 10,388 | .. | 4,966 | 7,861 | -3,530 | 66,026 |
| 2004 | 12,133 | 3,709 | 12,731 | 8,917 | .. | 11,449 | .. | 5,103 | 8,087 | -3,221 | 70,242 |
| 2005 | 12,633 | 3,971 | 12,966 | 9,693 | .. | 12,187 | .. | 5,320 | 8,376 | -2,718 | 74,351 |
Table 17.12 overleaf records outlays of producers on durable real assets, such as buildings, motor vehicles, plant and machinery, roading and improvements to land.
In measuring outlays, sales of similar goods are deducted. Land is excluded from gross fixed capital formation, but the value of construction work done by a firm's own employees is included. The term ‘gross’ indicates that consumption of fixed capital (economic depreciation) has not been deducted from the value of the outlays.
Capital investment grew by 10.8 percent in the year ending 31 March 2005, following a 13.6 percent increase in the previous year.
There was significant spending on new housing, which was up by 11.7 percent in the year ending 31 March 2005. The volume measure of new housing increased 2.3 percent, reflecting strengthening property prices.
Business investment in fixed assets rose 10.4 percent. When changes in prices are removed, the volume of investment increased 9.8 percent, with spending on plant machinery and equipment particularly strong (up 16.8 percent).
Table 17.12. Gross fixed capital formation
By asset type
Years ending 31 March
| Residential buildings | Non-Residential buildings | Other construction | Land improvements | Transport equipment | Plant machinery and equipment | Intangible assets | Total | |
|---|---|---|---|---|---|---|---|---|
Note:Figures may not add to stated totals due to rounding. Chain-volume series are not additive. Source: Statistics New Zealand | ||||||||
| $(million) | ||||||||
| Current prices | ||||||||
| 1990 | 3,369 | 2,839 | 1,408 | 197 | 1,812 | 4,774 | 850 | 15,249 |
| 1995 | 4,815 | 2,502 | 1,226 | 221 | 2,473 | 6,106 | 1,011 | 18,355 |
| 2000 | 6,222 | 2,736 | 2,807 | 319 | 2,444 | 6,505 | 1,854 | 22,889 |
| 2003 | 7,424 | 3,365 | 2,865 | 401 | 3,547 | 7,928 | 2,217 | 27,749 |
| 2004 | 9,240 | 3,535 | 3,193 | 426 | 4,525 | 8,265 | 2,343 | 31,527 |
| 2005 | 10,323 | 4,407 | 3,817 | 426 | 4,077 | 9,262 | 2,611 | 34,923 |
| Chain-volume series expressed in 1995/96 prices | ||||||||
| 1990 | 4,482 | 3,110 | 1,588 | 230 | 2,229 | 4,380 | 638 | 16,413 |
| 1995 | 5,158 | 2,574 | 1,245 | 222 | 2,443 | 5,913 | 1,006 | 18,543 |
| 2000 | 5,838 | 2,700 | 2,702 | 308 | 2,526 | 7,262 | 2,085 | 23,403 |
| 2003 | 6,355 | 3,160 | 2,470 | 332 | 3,194 | 8,932 | 2,606 | 26,892 |
| 2004 | 7,358 | 3,174 | 2,703 | 343 | 4,281 | 10,310 | 2,889 | 30,943 |
| 2005 | 7,526 | 3,627 | 3,070 | 322 | 3,926 | 12,039 | 3,198 | 33,372 |
Table 17.13. Capital stock
Years ending 31 March
| Year | Net capital stock1 | Productive capital stock2 |
|---|---|---|
1Current prices (replacement cost). 2Chain-volume series expressed in 1995/96 prices. Source: Statistics New Zealand | ||
| $(million) | ||
| 1999 | 292,492 | 348,364 |
| 2000 | 302,884 | 357,757 |
| 2001 | 318,512 | 366,489 |
| 2002 | 332,938 | 375,762 |
| 2003 | 351,502 | 386,787 |
| 2004 | 377,831 | 400,769 |
| 2005 | 418,850 | 415,987 |
Statistics New Zealand produces two measures of capital stock:
Net capital stock is a wealth measure of the current value of the stock of fixed assets still in use in New Zealand.
Productive capital stock is a volume measure of the stock of fixed assets in New Zealand, adjusted for the decline in efficiency as the assets age.
The capital stock series, shown in Table 17.13, are calculated using a perpetual inventory model. Briefly, this involves progressively building up capital stock estimates using the following equation:
opening stock + acquisitions - disposals - consumption of fixed capital = closing stock
Consumption of fixed capital at replacement cost (economic depreciation in the national accounts) is an important output from the model.
Exports.Table 17.14 records the export values of goods and services. Export volumes rose 3.9 percent in the year ending 31 March 2005. Detracting from growth was a 9.3 percent fall in dairy products.
Table 17.14. Exports of goods and
services12
Years ending 31 March
| Year | Agriculture and fishing primary products | Forestry primary products | Coal, crude petroleum and ores, minerals and gases | Meat products | Dairy products | Other food, beverages and tobacco | Textiles apparel and leather products | Wood and paper products | Chemicals, rubber, plastic and other non-metallic products | Metal products, machinery and equipment | Total exports of goods | Exports of services | Total |
|---|---|---|---|---|---|---|---|---|---|---|---|---|---|
1All commodity groupings have different coverage to those published in Yearbook 2004. 2The Australian and New Zealand Standard Product Classification (ANZSPC) has been used to calculate values from the year ending March 2001 onwards, and consequently the time series are relatively short. Prior to the year ending March 2001, the aggregate export series are calculated using a different commodity breakdown. Note:Figures may not add to stated totals due to rounding. Chain-volume series are not additive. Source: Statistics New Zealand | |||||||||||||
| $(million) | |||||||||||||
| Current prices | |||||||||||||
| 2001 | 2,923 | 721 | 881 | 4,031 | 6,306 | 2,875 | 1,657 | 2,966 | 2,825 | 5,888 | 31,074 | 10,085 | 41,159 |
| 2002 | 2,931 | 718 | 902 | 4,604 | 7,466 | 3,216 | 1,709 | 2,883 | 2,732 | 5,707 | 32,867 | 10,827 | 43,694 |
| 2003 | 2,899 | 750 | 764 | 4,404 | 6,002 | 3,027 | 1,704 | 2,956 | 2,712 | 5,430 | 30,648 | 11,690 | 42,339 |
| 2004 | 2,944 | 627 | 580 | 4,378 | 5,836 | 2,852 | 1,609 | 2,495 | 2,285 | 5,448 | 29,054 | 11,400 | 40,455 |
| 2005 | 2,987 | 414 | 727 | 4,872 | 5,784 | 3,369 | 1,593 | 2,839 | 2,561 | 5,967 | 31,114 | 12,028 | 43,142 |
| Chain-volume series expressed in 1995/96 prices | |||||||||||||
| 2001 | 2,701 | 754 | 469 | 2,833 | 5,297 | 2,151 | 1,801 | 2,646 | 2,162 | 5,031 | 25,753 | 8,815 | 34,648 |
| 2002 | 2,637 | 919 | 526 | 2,865 | 5,658 | 2,354 | 1,731 | 2,769 | 2,178 | 4,759 | 26,348 | 9,281 | 35,702 |
| 2003 | 2,611 | 1,011 | 464 | 2,978 | 6,876 | 2,484 | 1,855 | 2,987 | 2,118 | 4,990 | 28,318 | 10,104 | 38,495 |
| 2004 | 2,741 | 907 | 393 | 3,212 | 7,233 | 2,625 | 1,835 | 2,870 | 1,816 | 5,393 | 29,074 | 9,952 | 39,121 |
| 2005 | 3,036 | 650 | 397 | 3,323 | 6,559 | 3,154 | 1,901 | 3,256 | 1,998 | 5,916 | 30,258 | 10,301 | 40,660 |
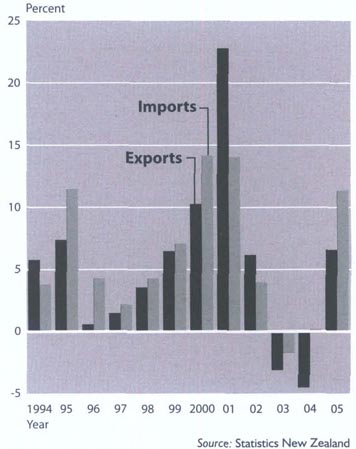
New Zealand spent $636 million on motor spirit imports in the year ending 31 March 2005, a 33 percent increase on the previous year's spend.
Imports. Import volumes for the year ending 31 March 2005 increased 13.7 percent. As shown in Table 17.15, cheaper imports on a strengthening New Zealand dollar showed capital equipment as the largest contributor, increasing 16.8 percent (up $1.481 billion on the year ending 31 March 2004).
Annual percentage changes in the current price value of exports and imports since 1994 are shown in Figure 17.07.
Table 17.15. Imports of goods and
services12
Years ending 31 March
| Year | Motor spirit | Passenger motor cars | Military and other goods | Consumption goods34 | Intermediate goods4 | Capital equipment3 | Total goods | Total services | Total imports of goods and services |
|---|---|---|---|---|---|---|---|---|---|
1All commodity groupings have different coverage to those published in Yearbook 2004. 2The Broad Economic Categories (BEC) classification has been used to calculate values from the year ending March 2001 onwards, and consequently the time series are relatively short. Prior to the year ending March 2001, the aggregate import series are calculated using a different commodity breakdown. 3Excludes imports of passenger motor vehicles. These can be either capital of consumption goods, and are therefore recorded separately. 4Excludes imports of motor spirit. These can be either intermediate or consumption goods, and are therefore recorded separately. Note:Figures may not add to stated totals due to rounding. Chain-volume series are not additive. Source: Statistics New Zealand | |||||||||
| $ (million) | |||||||||
| Current prices | |||||||||
| 2001 | 492 | 2,189 | 31 | 7,054 | 14,041 | 5,201 | 29,008 | 10,211 | 39,219 |
| 2000 | 482 | 2,551 | 248 | 7,303 | 13,810 | 6,139 | 30,533 | 10,245 | 40,778 |
| 2003 | 471 | 2,881 | 49 | 7,620 | 13,291 | 5,669 | 29,982 | 10,113 | 40,095 |
| 2004 | 478 | 3,111 | 107 | 7,650 | 12,585 | 6,199 | 30,130 | 10,029 | 40,159 |
| 2005 | 636 | 3,125 | 474 | 8,125 | 14,531 | 6,626 | 33,517 | 11,216 | 44,733 |
| Chain-volume series expressed in 1995/96 prices | |||||||||
| 2001 | 219 | 2,234 | 19 | 6,016 | 11,071 | 5,190 | 24,674 | 7,880 | 32,478 |
| 2002 | 239 | 2,542 | 151 | 6,069 | 11,121 | 6,324 | 26,224 | 7,690 | 33,784 |
| 2003 | 250 | 2,925 | 36 | 6,858 | 11,550 | 6,703 | 28,001 | 8,339 | 36,214 |
| 2004 | 261 | 3,347 | 94 | 7,588 | 12,228 | 8,827 | 31,712 | 9,315 | 40,871 |
| 2005 | 284 | 3,573 | 415 | 8,417 | 13,620 | 10,308 | 35,975 | 10,645 | 46,452 |
New Zealand's international accounts consist of balance of payments (BOP) and international investment position (IIP) statistics.
BOP statistics are statements of New Zealand's transactions in goods, services, income and transfers with the rest of the world, net flows of foreign investment in New Zealand, and New Zealand investment abroad. IIP statistics show the value of foreign investment in New Zealand and the value of New Zealand investment abroad at specific points in time.
The IIP statement includes statistics measuring New Zealand's gross and net overseas debt for both the government and private sectors.
Statistics New Zealand publishes BOP and IIP statements for each quarter within 13 weeks of the end of the reference quarter. For example, statistics for the March quarter are published in the last week of June. The level of detail in the quarterly series is sufficient to provide a useful basis for analysis and assessment of the country's external financial situation.
Annual BOP and IIP statements are published using a March reference period and feature country breakdowns of the source of foreign investment into New Zealand, and destinations of New Zealand investment abroad. The annual statements are published within six months of the end of the March year.
BOP statistics are presented in a set of accounts consisting of two main groups, the current account and the capital and financial account.
To aid analysis, each of the BOP accounts is further subdivided into major components and balances. A component ‘balance’ is the inflows (credits) less the outflows (debits) for a particular component.
Table 17.16 presents these accounts for the five years to 2005.
The current account records New Zealand's transactions in:
Goods, with the balance on goods being the value of exports, less the value of imports. The primary source of data is export and import entry documents lodged with the New Zealand Customs Service by importers, exporters and their agents.
Table 17.16. Balance of payments – major
components1
Years ending 31 March
| Years | 2001 | 2002 | 2003 | 2004 | 2005 |
|---|---|---|---|---|---|
1Tables presented in general accordance with principles laid down by the International Monetary Fund in the fifth edition of the Balance of Payments Manual. 2Due to methodology and data collection changes, financial account statistics for 2001 are not directly comparable with statistics for earlier periods. Rrevised Note:Figures may not add to stated totals due to rounding. Source: Statistics New Zealand | |||||
| $(million) | |||||
| Current account summary | |||||
| Balance on goods | 2,213 | 2,451 | 714R | -1,027R | -2,411 |
| Exports (free on board) | 31,221 | 32,984 | 30,695 | 29,103R | 31,109 |
| Imports (free on board) | 29,008 | 30,533 | 29,982R | 30,130 | 33,520 |
| Balance on services | -232 | 436R | 1,504R | 1,272R | 978 |
| Exports | 10,063 | 10,628R | 11,436R | 11,079R | 11,648 |
| Imports | 10,295 | 10,192R | 9,933R | 9,806R | 10,670 |
| Balance on income | -7,580R | -7,091R | -7,043R | -7,406R | -9,965 |
| Income from investment abroad | 1,356R | 2,042R | 2,299R | 2,376R | 2,513 |
| Income from foreign investment in New Zealand | 8,936R | 9,133R | 9,342R | 9,782R | 12,478 |
| Balance on current transfers | 483 | 246R | 113R | 391R | 494 |
| Inflow | 1,358 | 1,332R | 1,376R | 1,431R | 1,556 |
| Outflow | 875 | 1,086R | 1,263R | 1,040R | 1,063 |
| Current account balance | -5,117R | -3,957R | -4,713R | -6,770R | -10,903 |
| Capital account summary | |||||
| Balance on capital account | -181 | 1,516R | 1,585R | 723R | 108 |
| Inflow | 782 | 2,287R | 2,384R | 1,774R | 1,354 |
| Outflow | 963 | 772R | 799R | 1,051R | 1,246 |
| Financial account summary2 | |||||
| New Zealand investment abroad | 11,486R | 8,817R | 5,008R | 8,469R | 3,069 |
| Direct investment | 971R | -2,452R | 336R | 1,621R | -452 |
| Portfolio investment | 4,662R | 3,565 | 1,319R | 3,322R | 1,426 |
| Reserve assets | 8 | -85 | 2,596 | 2,327 | -913 |
| Foreign investment in New Zealand | 16,328R | 12,972R | 7,238R | 14,556R | 15,503 |
| Direct investment | 10,935R | -595R | 3,532R | 6,596R | 4,027 |
| Portfolio investment | 3,909R | 4,081R | 6,653R | 7,414R | 4,184 |
| Other investment | 1,484R | 9,486R | -2,947R | 546R | 7,307 |
| Net errors and omissions | 456R | -1,713R | 898R | -40R | -1,639 |
Services, which include transportation of exports and imports, passenger airfare revenue and expenditure, spending by New Zealand tourists abroad and overseas tourists in New Zealand, telecommunications, insurance and financial services, and other business services. Royalties and licence fees are also included.
Income, which encompasses income earned by foreign investors in New Zealand and income earned by New Zealand investors abroad. Income from investments includes operating profits and losses, earnings retained in the business or distributed as dividends, and interest on debt instruments.
Current transfers, which include benefits and pensions received and paid, foreign aid and withholding tax. Transfers are classified into either current transfers (which affect the level of disposable income of the donor and recipient), or capital transfers (which involve transfers in ownership of fixed assets or forgiveness of financial liabilities and are included in the capital account).
Goods dominate New Zealand's current account. Exports of goods accounted for approximately 66 percent of total current account inflows (credits), and imports accounted for approximately 58 percent of total current account outflows (debits) for the year ending 31 March 2005.
Table 17.17 presents New Zealand's international trade in services for the five March years to 2005 and shows that the value of trade in services increased significantly during the period.
The balance on services moved from a deficit of $232 million in the year ending 31 March 2001 to a surplus of $978 million in the year ending 31 March 2005.
Exports of services rose $1.587 billion (15.8 percent) in the five years, more than offsetting an increase of $375 million (3.6 percent) in imported services.
Earnings from travel services showed strong growth in the five years, illustrating the importance of international tourism to the New Zealand economy.
Table 17.17. Trade in services
Years ending 31
March
| Service | Year | ||||
|---|---|---|---|---|---|
| 2001 | 2002 | 2003 | 2004 | 2005 | |
Note:Figures may not add to stated totals due to rounding. Source: Statistics New Zealand | |||||
| $(million) | |||||
| Exports | |||||
| Transportation | 2,820 | 2,589 | 2,470 | 2,233 | 2,230 |
| Travel | 5,078 | 5,928 | 6,850 | 6,954 | 7,395 |
| Business | 570 | 666 | 766 | 745 | 712 |
| Personal | 4,508 | 5,262 | 6,083 | 6,209 | 6,683 |
| Education | 597 | 927 | 1,467 | 1,581 | 1,483 |
| Health | 11 | 11 | 11 | 11 | 11 |
| Other | 3,900 | 4,323 | 4,605 | 4,616 | 5,189 |
| Communication | 424 | 441 | 368 | 294 | 274 |
| Construction | 24 | 32 | 47 | 45 | 71 |
| Insurance | 30 | 34 | 38 | 43 | 42 |
| Financial | 59 | 37 | 26 | 37 | 43 |
| Computer and information | 187 | 182 | 207 | 165 | 183 |
| Royalties and licence fees | 124 | 113 | 161 | 162 | 142 |
| Other business services | 877 | 882 | 939 | 813 | 885 |
| Personal, cultural and recreational | 325 | 255 | 196 | 202 | 239 |
| Government services not included elsewhere | 115 | 135 | 139 | 129 | 143 |
| Total exports of services | 10,062 | 10,628 | 11,437 | 11,077 | 11,649 |
| Imports | |||||
| Transportation | 3,232 | 3,479 | 3,516 | 3,471 | 3,888 |
| Travel | 3,397 | 3,142 | 3,104 | 3,115 | 3,630 |
| Communication | 457 | 417 | 329 | 277 | C |
| Construction | 7 | 11 | 8 | 3 | C |
| Insurance | 228 | 244 | 284 | 317 | 327 |
| Financial | 81 | 63 | 110 | 79 | 117 |
| Computer and information | 223 | 217 | 212 | 182 | 234 |
| Royalties and licence fees | 732 | 736 | 738 | 749 | 725 |
| Other business services | 1,729 | 1,654 | 1,385 | 1,370 | 1,277 |
| Personal, cultural and recreational | 73 | 76 | 90 | 84 | 36 |
| Government services not included elsewhere | 137 | 152 | 155 | 159 | 142 |
| Total imports of services | 10,296 | 10,192 | 9,932 | 9,807 | 10,671 |
| Balance on services | -232 | 437 | 1,504 | 1,272 | 978 |
Current account earnings from travel services have shown strong growth in recent years, illustrating the importance of international tourism to the New Zealand economy.
The capital account records debt forgiveness, migrant transfers, and sales and purchases of intangible assets, such as licences, patents, copyrights and franchises.
The financial account records capital transactions between New Zealand residents and the rest of the world.
These transactions increase or decrease the level of foreign investment in New Zealand and the level of New Zealand investment abroad.
Investment instruments include equity capital (shares in companies), debt instruments (bonds and notes), money market instruments, loans, deposits and trade credits and debits.
Figure 17.08 shows how net flows of investment into and out of New Zealand decreased substantially in the two years following peaks in the year ending 31 March 2001.
Classification of investment categories in the financial account is further determined by the relationship between transactors, and is presented as direct, portfolio and other investment.
Direct investment is all financial capital transactions occurring between parties where there is an ownership relationship of 10 percent or more. For example, where a foreign investor owns 10 percent or more of the equity capital of a New Zealand company, then all the financial capital transactions between the New Zealand company (the direct investee) and the overseas investor (the direct investor) are classified as direct investment. These transactions increase or decrease the level of foreign direct investment in New Zealand.
Direct investment transactions include transactions in equity capital and debt instruments, including bonds, loans, trade credits and debits. Income from the foreign direct investor's investment in New Zealand is recorded in the current account as income from foreign investment in New Zealand; direct investment income.
Portfolio investment is those transactions in equity and debt instruments where the ownership relationship between the transactors does not meet the criteria for direct investment. Therefore, in addition to equity securities, this category includes marketable debt instruments – bonds and notes and money market instruments.
Banking sector funding transactions in marketable debt instruments between direct investors and direct investees are included where these transactions are defined as being in the nature of usual banking business (financial intermediation), rather than transactions aimed at increasing or decreasing the direct investor's ownership role.
Main contributors to New Zealand portfolio equity investment abroad are New Zealand resident fund managers. Foreign portfolio equity investment in New Zealand is dominated by investment into New Zealand companies via New Zealand resident nominees.
New Zealand portfolio investment abroad in the form of debt securities is dominated by banks and fund managers. Foreign portfolio investment in New Zealand in the form of debt securities is spread more widely across the sectors, with banks and governments significant in the statistics.
Other investment is a residual component of financial assets and liabilities not classified as direct or portfolio, such as loans, deposits, trade finance (trade credits and debits) and other instruments.
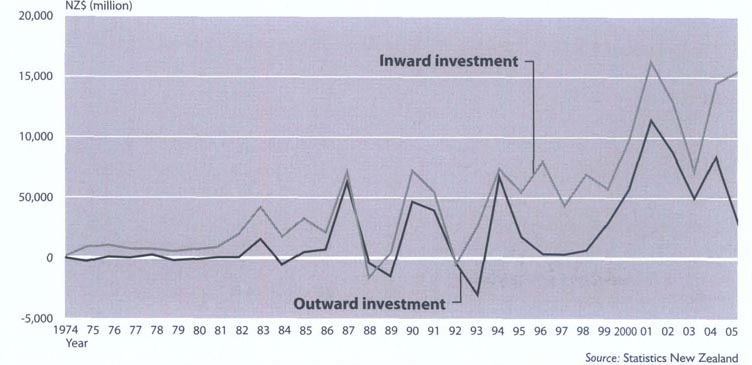
The international investment position (IIP) records the level of an economy's international financial assets and liabilities at a particular point in time. These are shown in Figure 17.09.
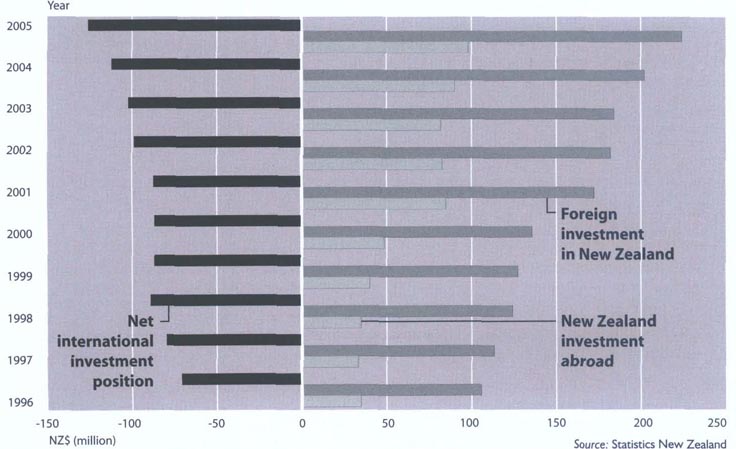
Balance of payments (BOP) and IIP statistics are closely related, with BOP measuring transaction flows and IIP measuring stock positions.
The difference in the level of international financial assets and liabilities between two points in time is due to BOP financial account transactions and other non-transaction changes that occur during the reference period.
Non-transaction changes are revaluations of assets and liabilities, changes in market prices and other adjustments, such as write-offs.
Table 17.18 shows New Zealand's international investment position at 31 March from 2001 to 2005.
The statistics show that the value of New Zealand's investments abroad is much smaller than the value of foreign investment in New Zealand.
Table 17.18. International investment position1
At 31 March
| Investment | Year | ||||
|---|---|---|---|---|---|
| 2001 | 2002 | 2003 | 2004 | 2005 | |
1Due to methodology and data collection changes, international investment position statistics for 2001 are not directly comparable with statistics for earlier periods. 2Annual managed funds survey data estimates of funds invested abroad via smaller fund managers were $992 million at 31 December 2004, $897 million at 31 December 2003, $2.187 million at 31 December 2002 and $2.365 million at 31 December 2001. These estimates are not included in this table. 3Changes during the March 2004 year to the managed funds survey population have affected the level of portfolio investment abroad. 4Statistics New Zealand has updated its estimates of the value of overseas shares held directly by New Zealand individuals. The estimate at 31 December 2004 is $4.9 billion and at 31 December 2003 the estimate is $5.4 billion. These estimates are not included in this table. Cconfidential Rrevised Source: Statistics New Zealand | |||||
| $(million) | |||||
| New Zealand investment abroad | |||||
| Direct | 21,198R | 17,402R | 17,507R | 17,413R | 18,984 |
| Equity capital and reinvested earnings | 17,034R | 14,556R | 15,970R | 16,362R | 16,590 |
| Other capital | 4,163 | 2,846R | 1,537R | 1,051R | 2,394 |
| Claims on affiliated enterprises | 6,751 | 5,630 | 4,479 | 4,134 | 5,612 |
| Liabilities to affiliated enterprises | -2,588 | -2,784 | -2,942 | -3,083 | -3,217 |
| Portfolio23 | 26,191R | 28,857R | 24,882R | 33,254R | 35,140 |
| Equity securities4 | 15,264 | 17,419 | 13,637 | 22,911R | 24,822 |
| Debt securities | 10,927R | 11,438R | 11,245R | 10,342R | 10,318 |
| Other | 16,322R | 22,702R | 23,425R | 23,289R | 27,164 |
| Trade credits | 2,181R | 2,865 | 2,817R | C | 2,399 |
| Loans | 11,427R | 17,169R | 16,829R | 18,286R | 21,290 |
| Currency and deposits | 2,323R | 2,135R | 3,193R | 2,762R | 3,278 |
| Other assets | 392 | 533 | 586R | C | 196 |
| Financial derivatives | 12,476R | 6,074 | 6,781 | 6,081 | 7,841 |
| Reserve assets | 8,566 | 7,723 | 9,115 | 10,093 | 8,828 |
| Total New Zealand investment abroad | 84,753R | 82,757R | 81,710R | 90,130R | 97,957 |
| Foreign investment in New Zealand | |||||
| Direct | 56,897R | 57,967R | 60,183R | 72,314R | 77,223 |
| Equity capital and reinvested earnings | 37,513R | 39,047R | 39,783R | 46,651R | 50,087 |
| Other capital | 19,384R | 18,920R | 20,401R | 25,663R | 27,135 |
| Claims on direct investors | -3,472 | -4,619 | -6,459 | -4,582 | -5,607 |
| Liabilities to direct investors | 22,855 | 23,539 | 26,859 | 30,245 | 32,742 |
| Portfolio | 60,591R | 62,326R | 65,292R | 73,340R | 78,432 |
| Equity securities | 9,396 | 9,675 | 11,251R | 14,700R | 16,894 |
| Debt securities | 51,195R | 52,650R | 54,041R | 58,640R | 61,538 |
| Other | 46,238R | 55,367R | 49,778R | 47,975R | 58,238 |
| Trade credits | 2,239R | 2,559 | 2,745R | 2,273R | 2,773 |
| Loans | 34,087R | 40,997R | 33,604R | 30,477R | 38,171 |
| Currency and deposits | 9,175R | 11,232R | 13,022R | 14,874R | 16,795 |
| Other liabilities | 738R | 579R | 407R | 350R | 499 |
| Financial derivatives | 8,487R | 6,111 | 8,774 | 8,591R | 10,186 |
| Total foreign investment in New Zealand | 172,214R | 181,770R | 184,028R | 202,220R | 224,078 |
| Net international investment position | -87,461R | -99,013R | -102,318R | -112,090R | -126,121 |
The balance on the current account is the sum of the balances on goods, services, income and current transfers. Because they involve the exchange of resources, current account surpluses and deficits have financial implications. Surpluses (net outflows of resources) result in increases in New Zealand's net financial claims over the rest of the world. Conversely, deficits (net inflows of resources) translate into reductions in New Zealand's net financial claims over the rest of the world.
Figure 17.10 shows the current account balance as a proportion (ratio) of gross domestic product (GDP), from 1955 to 2005. This ratio measures New Zealand's net provision or acquisition of resources to or from abroad as a proportion of the value of New Zealand's annual output. The use of the ratio is an indication of the ability of the economy to sustain a current account imbalance. For example, an increasing current account deficit has different implications for a growing economy than for one where GDP is static or falling. New Zealand has incurred persistent current account deficits since the mid-1970s. These have ranged between -13.4 percent of GDP in 1975 at the height of the oil crisis, to -0.7 percent in 1989. More recently, the ratio has risen consistently from -3.2 percent for the March 2002 year to -7.4 percent for the March 2005 year.
Table 17.19 shows the main countries, economic groupings and regions which are the sources of foreign direct investment into New Zealand, and the destinations of New Zealand direct investment abroad. Direct investment occurs where there is an ownership relationship of 10 percent or more.
Australia is New Zealand's single most important direct investment partner country in terms of both New Zealand direct investment abroad, and foreign direct investment in New Zealand.
The United States and the United Kingdom are significant sources of foreign direct investment in New Zealand.
New Zealand's most significant direct investment economic region or grouping partners are Asia Pacific Economic Cooperation (APEC), the Organisation for Economic Co-operation and Development (OECD) and the European Union (EU).
Table 17.19. Direct
investment123
By selected countries and regional
groupings
At 31 March
| Countries and regions | Year | ||||
|---|---|---|---|---|---|
| 2001 | 2002 | 2003 | 2004 | 2005 | |
1Because only selected countries and regions are shown, and because some countries are also included in regional groupings, figures do not add to stated totals. 2Tables presented in general accordance with principles laid down by the International Monetary Fund in the fifth edition of Balance of Payments Manual. 3Due to methodology and data collection changes, foreign direct investment statistics for 2001 are not directly comparable with statistics for earlier periods. Cconfidential. Rrevised Source: Statistics New Zealand | |||||
| $(million) | |||||
| New Zealand direct investment abroad | |||||
| OECD | 13,624R | 10,362R | 11,150R | 10,506R | 11,525 |
| APEC | 16,124R | 13,491R | 13,670R | 13,328R | 15,123 |
| Australia | 9,243R | 8,396R | 8,882R | 9,020R | 9,847 |
| EU | 908 | 642 | 314R | 532R | 248 |
| ASEAN | 605 | 497 | 851R | 553R | 586 |
| United States | 2,228R | 1,116R | 657R | 859R | 1,257 |
| Canada | C | C | C | C | 38 |
| Germany | C | C | C | C | C |
| Netherlands | C | C | C | -1,190 | C |
| Hong Kong | -69 | 443R | 347 | 34 | 188 |
| Japan | 14 | 84 | 71 | 20 | 91 |
| Singapore | 320 | 140 | 467 | 198 | C |
| United Kingdom | C | 584 | 504R | 867R | 822 |
| Total direct investment abroad | 21,198R | 17,402R | 17,507R | 17,413R | 18,984 |
| Foreign direct investment in New Zealand | |||||
| OECD | 42,036R | 42,207R | 37,966R | 54,631R | 61,675 |
| APEC | 31,594R | 30,280R | 33,866R | 46,221R | 52,409 |
| Australia | 17,779R | 17,693R | 21,084R | 31,017R | 35,220 |
| EU | 14,207R | 13,339R | 13,799R | 12,590R | 13,664 |
| United Kingdom | 6,139R | 5,891R | 6,370R | 5,021R | 4,392 |
| United States | 7,479R | 8,873R | 5,905R | 7,695R | 9,207 |
| Netherlands | 7,078R | 5,946R | 5,794R | 5,564R | 6,300 |
| Japan | 825R | 1,191R | 1,292R | 1,535R | 1,642 |
| ASEAN | 1,090R | 1,227R | 961R | 1,082R | 1,169 |
| Singapore | 1,081R | 1,225R | 986R | 1,226R | 1,259 |
| Canada | C | 458 | 792R | 889R | 1,100 |
| Hong Kong | 1,054 | 738 | 772 | 757 | 689 |
| Germany | 343 | C | C | 1,194R | 1,343 |
| Switzerland | 211R | 174R | 190R | 161R | 114 |
| Total foreign direct investment | 56,897R | 57,967R | 60,183R | 72,314R | 77,223 |
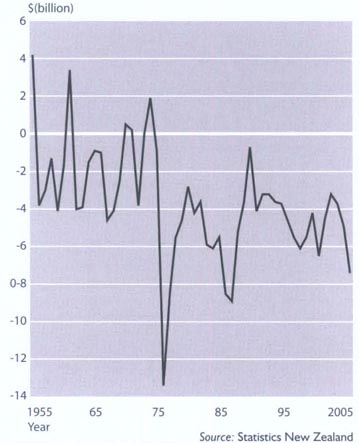
Table 17.20 shows New Zealand industries which hold international assets and New Zealand industries in which foreign investors have invested (New Zealand's international liabilities) at 31 March 2003 to 2005.
The finance and insurance industry accounts for the largest proportion of New Zealand's international assets and liabilities.
Government administration, the defence industry and the manufacturing industry each made significant contributions to New Zealand's international assets and liabilities.
At 31 March 2005, the finance and insurance industry held 63.1 percent of New Zealand's international assets. The main contributions were from banks and funds invested abroad by fund managers on behalf of individuals.
The finance and insurance industry was the recipient of 59.5 percent of total funds invested in New Zealand by overseas investors (New Zealand's international liabilities).
The manufacturing industry held 16.9 percent of New Zealand's total international assets and received 10.4 percent of total foreign investment in New Zealand.
The main contributions were from paper and paper product manufacturing, publishing, beverage and malt manufacturing, cement/lime/plaster/concrete product manufacturing, basic chemical manufacturing, and iron and steel manufacturing.
The international investments held by government administration and defence industry (7.8 percent of New Zealand's total international assets) are predominantly reserve assets held by The Treasury.
Table 17.2. International assets and liabilities
By industry
At 31
March
| Year | |||
|---|---|---|---|
| 2003 | 2004 | 2005 | |
Cconfidential Rrevised - nil or zero Source: Statistics New Zealand | |||
| $(million) | |||
| New Zealand's international assets | |||
| Finance and insurance | 53,441R | 61,416R | 67,383 |
| Manufacturing | 16,358R | 15,616R | 18,047 |
| Government administration and defence | 5,887R | 7,120R | 8,381 |
| Retail trade | 329R | 260R | 409 |
| Property and business services | 595R | 809R | 1,591 |
| Wholesale trade | 1,030R | 1,136R | 1,152 |
| Construction | C | 90R | 166 |
| Agriculture, forestry and fishing | C | C | C |
| Mining | C | 1,344R | 357 |
| Electricity, gas and water supply | C | C | C |
| Accommodation, cafes and restaurants | C | C | C |
| Transport and storage | C | -67R | C |
| Communication services | C | C | C |
| Cultural and recreational services | C | C | C |
| Personal and other services | C | C | C |
| Education | - | -R | C |
| Health and community services | - | - | - |
| Unallocated to industry | 5,471R | 4,211R | 2,878 |
| Total international assets | 91,110R | 97,794R | 106,781 |
| New Zealand's international liabilities | |||
| Finance and insurance | 100,102R | 115,424R | 138,593 |
| Manufacturing | 24,119R | 23,478R | 24,185 |
| Government administration and defence | 17,223R | 17,681R | 16,932 |
| Retail trade | 4,088R | 2,891R | 3,100 |
| Wholesale trade | 2,622R | 4,135R | 4,763 |
| Electricity, gas and water | C | C | 2,576 |
| Cultural and recreational services | 1,510R | 1,655R | 2,164 |
| Property and business services | 4,521R | 4,853R | 3,992 |
| Transport and storage | 1,673R | C | 2,184 |
| Accommodation, cafes and restaurants | 696R | 922R | 1,025 |
| Construction | C | 422R | 576 |
| Personal and other services | C | C | C |
| Agriculture, forestry and fishing | C | 1,827R | 2,105 |
| Mining | 4,185R | 4,244R | 4,451 |
| Communication services | C | C | C |
| Education | C | C | C |
| Health and community services | C | C | C |
| Unallocated to industry | 15,798R | 13,601R | 11,120 |
| Total international liabilities | 193,429R | 209,885R | 232,903 |
Annual and quarterly surveys conducted by Statistics New Zealand provide comprehensive information about businesses in New Zealand.
The Annual Enterprise Survey, which covers most industries, collects information on the financial performance and position of New Zealand businesses.
Quarterly business surveys, such as the Economic Survey of Manufacturing and Distribution, provide information on short-term activity, while the Quarterly Employment Survey offers a broad picture of employment across the economy.
In addition to these financial surveys, Statistics New Zealand also produces business demographic statistics, sourced from Statistic New Zealand's Business Frame, a register primarily used to select businesses for inclusion in surveys.
The Business Frame records names and addresses, predominant type of industrial activity, business size (indicated by employment count) and the degree of overseas ownership. This information can also be used to produce statistics on changes in the number, type and location of businesses in New Zealand.
Analyses can be undertaken using a range of variables, including geographic area, industry, institutional sector, business type, overseas ownership and employment levels. Business demographic statistics are produced annually from the Business Frame.
Until 1994, business demographic statistics included businesses that compulsorily registered for GST. Since then, statistics have been based on economically significant enterprises. These are generally defined as those with annual GST expenses or sales greater than $30,000, or those in a GST-exempt industry.
Statistics in Table 17.21, which shows enterprises and employment count (wage and salary earners), are derived from a snapshot of the Business Frame. A ‘geographic unit’ is a separate operating unit engaged in one (or predominantly one) kind of economic activity from a single physical location.
Table 17.21. Businesses1and employee count2in economically significant enterprises, 2005
| Geographic units | Employee count | |
|---|---|---|
1Generally defined as those enterprises with greater than $30,000 annual GST expenses or sales, or in a GST-exempt industry. 2The employee count (EC) is defined as a count of all persons who are paid a salary or wage, and pay tax to the Inland Revenue. It is mostly comprised of employees, but also includes a small number of working proprietors who pay themselves a taxable salary or wage. The employee count replaces all previous employment measures used by Statistics New Zealand. Numbers have been rounded and sums of component items may not match totals. Source: Statistics New Zealand | ||
| Services to agriculture, hunting and trapping | 6,327 | 24,440 |
| Forestry and logging | 5,921 | 7,630 |
| Commercial fishing | 1,831 | 2,200 |
| Total agriculture, forestry and fishing | 14,079 | 34,270 |
| Coal mining | 44 | 990 |
| Oil and gas extraction | 24 | 570 |
| Metal ore mining | 55 | 400 |
| Other mining | 343 | 1,860 |
| Services to mining | 97 | 700 |
| Total mining | 563 | 4,500 |
| Food, beverage and tobacco | 2,000 | 74,300 |
| Textile, clothing, footwear and leather manufacturing | 2,005 | 18,640 |
| Wood and paper product manufacturing | 2,393 | 26,300 |
| Printing, publishing and recorded media | 2,296 | 21,480 |
| Petroleum, coal, chemical and associated product manufacturing | 1,353 | 21,510 |
| Non-metallic mineral product manufacturing | 941 | 7,730 |
| Metal product manufacturing | 3,636 | 29,950 |
| Machinery and equipment manufacturing | 5,750 | 43,710 |
| Other manufacturing | 3,138 | 14,050 |
| Total manufacturing | 23,512 | 257,670 |
| Electricity and gas supply | 241 | 5,920 |
| Water supply, sewerage and drainage services | 193 | 1,560 |
| Total electricity, gas and water supply | 434 | 7,470 |
| General construction | 16,111 | 46,980 |
| Construction trade services | 26,752 | 60,460 |
| Total construction | 42,863 | 107,440 |
| Basic material wholesaling | 4,801 | 29,360 |
| Machinery and motor vehicle wholesaling | 6,830 | 37,820 |
| Personal and household good wholesaling | 9,208 | 47,230 |
| Total wholesale trade | 20,839 | 114,420 |
| Food retailing | 10,681 | 81,500 |
| Personal and household good retailing | 21,276 | 97,350 |
| Motor vehicle retailing and services | 11,343 | 47,690 |
| Total retail trade | 43,300 | 226,540 |
| Accommodation, cafes and restaurants | 13,330 | 109,660 |
| Total accommodation, cafes and restaurants | 13,330 | 109,660 |
| Road transport | 8,203 | 33,530 |
| Rail transport | 84 | 1,790 |
| Water transport | 369 | 3,000 |
| Air and space transport | 538 | 9,900 |
| Other transport | 257 | 390 |
| Services to transport | 3,182 | 20,620 |
| Storage | 671 | 5,420 |
| Total transport and storage | 13,304 | 74,650 |
| Communication services | 3,739 | 27,830 |
| Total communication services | 3,739 | 27,830 |
| Finance | 7,643 | 32,330 |
| Insurance | 1,120 | 8,550 |
| Services to finance and insurance | 4,414 | 11,160 |
| Total finance and insurance | 13,177 | 52,040 |
| Property services | 71,146 | 26,400 |
| Business services | 50,592 | 198,680 |
| Total property and business services | 121,738 | 225,080 |
| Government administration | 1,902 | 56,820 |
| Defence | 99 | 11,950 |
| Total government administration and defence | 2,001 | 68,770 |
| Education | 8,163 | 128,830 |
| Total education | 8,163 | 128,830 |
| Health services | 13,094 | 116,850 |
| Community services | 3,511 | 61,210 |
| Total health and community services | 16,605 | 178,070 |
| Motion picture, radio and television services | 2,597 | 8,730 |
| Libraries, museums and the arts | 3,432 | 10,630 |
| Sport and recreation | 6,665 | 27,770 |
| Total cultural and recreational services | 12,694 | 47,130 |
| Personal services | 8,902 | 21,970 |
| Other services | 6,885 | 39,800 |
| Private | ||
| Total personal and other services | 15,787 | 61,770 |
| Total | 366,128 | 1,726,130 |
17.1 The Treasury; Reserve Bank of New Zealand; Statistics New Zealand.
17.2–17.4 Statistics New Zealand.
Table of Contents
With production per ewe on the increase, sheep have been a success story for New Zealand farmers in recent years.
Farming, forestry and horticulture continue to be significant export earning industries for New Zealand. In the year ending 31 March 2005, the agricultural, horticultural and forestry sectors provided more than 60 percent of New Zealand's export earnings. In the past few years, dairy and wine have been the fastest growing industries.
Dairying has been expanding since 1996 in response to product price signals. Many farms have been converted to dairying, especially in Canterbury and Southland, and dairy farms across New Zealand have increased in size.
While the number of traditional sheep and cattle farms has decreased through conversion and amalgamation, productivity has increased through improved breeds and strains of livestock and plant cultivars and their management.
Cereal crops and horticultural products were traditionally grown mainly for the home market, but horticulture is now an important export earner.
New Zealand has considered the strategic opportunities offered by genetic modification. Following a Royal Commission of Inquiry, the government accepted its recommendation to proceed with caution and preserve those opportunities. New Zealand researchers have developed genetically-modified potatoes resistant to pests, and genetically-modified cattle to produce therapeutic proteins in their milk.
Rural produce makes up more than half of New Zealand's merchandise exports. Uniquely among developed countries, New Zealand farmers are almost totally exposed to world market forces. They receive no subsidies from the government and have to compete with subsidised production from other countries.
The GATT Uruguay Round Agriculture Agreement imposes progressive reductions on subsidies other countries can give to agricultural production and exports. One effect has been to increase access opportunities for New Zealand's exports into overseas markets. The current Doha Development Round under the auspices of the World Trade Organisation will eventually deliver further trade benefits to New Zealand.
New Zealand's total milk production (including domestic market milk) for the season to 31 May 2005 was 1.213 billion kilograms of milk solids (kgMS). This was down 3.3 percent on the previous season due to adverse climatic conditions. The number of dairy cows in milk was estimated at 4.10 million at 30 June 2005, the same as for the previous year.
Table 18.01. Farm types
By number and
hectarage
At 30 June 2003
| Farm type | Farms | Hectares |
|---|---|---|
Note: Figures may not add to stated totals due to rounding. Source: Statistics New Zealand | ||
| Plant nurseries | 1,057 | 10,240 |
| Cut flower and flower seed growing | 999 | 4,870 |
| Vegetable growing | 2,275 | 114,191 |
| Grape growing | 1,215 | 28,773 |
| Apple and pear growing | 1,232 | 24,026 |
| Stone fruit growing | 292 | 3,428 |
| Kiwifruit growing | 2,247 | 26,152 |
| Citrus growing | 320 | 2,806 |
| Berry growing | 340 | 4,538 |
| Other fruit growing | 1,961 | 13,101 |
| Grain growing | 501 | 68,366 |
| Grain-sheep and grain-beef farming | 248 | 52,893 |
| Sheep/beef farming | 1,514 | 864,791 |
| Sheep farming | 12,407 | 7,264,081 |
| Beef farming | 13,092 | 2,185,717 |
| Dairy farming | 12,952 | 1,971,442 |
| Poultry farming (meat) | 180 | 1,977 |
| Poultry farming (eggs) | 155 | 1,985 |
| Pig farming | 414 | 14,649 |
| Horse farming | 2,241 | 43,027 |
| Deer farming | 2,087 | 340,869 |
| Mixed livestock farming | 844 | 100,692 |
| Other livestock farming | 652 | 32,898 |
| Other crop and plant growing | 1,150 | 43,957 |
| Other services to agriculture | 952 | 45,441 |
| Forestry | 4,491 | 2,167,795 |
| Other | 238 | 2,814 |
| Total | 66,057 | 15,435,517 |
The Fonterra Co-Operative Group Ltd processes 95.6 percent of milk solids from New Zealand dairy farms.
The average dairy company payout for the year ending 31 May 2005 rose 8.1 percent to $4.55 per kgMS due to rising international prices and favourably-hedged exchange rates.
Total sheep numbers were estimated at 39.9 million at 30 June 2005 (up from 39.3 million the previous year) and sheep meat production for the year ending 30 September 2005 was 543,000 tonnes, up 5 percent. The quantity of wool sold fell 4 percent to 158,000 clean tonnes for the year ending 30 June 2005.
The New Zealand beef cattle herd was estimated at 4.43 million at June 2005 (4.45 million the previous year). Beef and veal production fell by 8.2 percent to 652,000 tonnes for the year ending 30 September 2005.
After two decades of strong growth, total deer numbers are estimated to have peaked at 1.76 million at 30 June 2004. Numbers have subsequently declined due to weak international prices and appreciating exchange rates.
Table 18.01 shows New Zealand farm types by number and hectarage.
New Zealand remains a world leader in agricultural research, reflecting the importance of agriculture to the country.
There is also a broad range of administrative and special interest organisations in the sector.
Ministry of Agriculture and Forestry. The mission of the Ministry of Agriculture and Forestry Te Manatu Ahuwhenua, Ngaherehere (MAF) is to contribute to the prosperity of New Zealand through its focus on land-based industries and rural communities; biosecurity in support of economic, environmental, health, lifestyle and cultural outcomes; food and other biologically-based products; and sustainability of the production systems upon which primary production industries are based. The organisation has a staff of about 1,380 spread nationally.
MAF Policy provides information, analysis and advice to the government on issues affecting the economic and environmental performance of the agriculture and forestry sectors.
MAF Quarantine Service identifies and manages potential risks at the border and provides domestic and offshore technical inspection.
Biosecurity New Zealand is the lead agency in New Zealand's biosecurity system, encompassing economic, environmental, social and cultural outcomes. It also has international trade and animal welfare responsibilities.
The Crown Forestry Group manages the Crown's interest in a number of commercial forests and forestry-related leases. Operational management of the forest estate is contracted to forest management companies, with audit, strategic planning and administration carried out by Crown forestry staff.
Corporate Assurance and Risk leads a broad programme of both traditional internal audit functions, with enhanced integration of the various audit, compliance and investigative functions carried out within MAF's business groups, and a higher level overview of risk assessment and risk mitigation.
The Māori Strategy Unit's primary role is to promote a greater awareness by MAF of Māori issues and concerns, increase MAF's understanding of the Treaty of Waitangi and help MAF develop more effective relationships with Māori.
The Corporate Services Group contributes to organisational governance and supports other business groups through delivery of a range of administrative, human resources and legal services.
Asure New Zealand Ltd. Asure New Zealand Ltd is a state-owned enterprise providing frontline meat inspection services; solutions to food safety issues; responses after detection of pests and diseases; and other services to the meat processing industry.
AgriQuality New Zealand Ltd. AgriQuality New Zealand Ltd is a state-owned enterprise providing services covering farm quality and animal health; quality assurance for food products; and biosecurity and food safety services.
New Zealand Food Safety Authority. The New Zealand Food Safety Authority is a semi-autonomous body attached to the Ministry of Agriculture and Forestry. The authority exists to protect and promote public health and safety, and facilitate access to markets for New Zealand food products and by-products.
New Zealand livestock are predominantly grass-fed, but feeding of hay, silage and other fodder crops occurs in winter and during dry periods.
Pastoral agriculture is practised throughout New Zealand, with beef cattle predominating in Northland, dairying in Waikato and Taranaki and sheep farming with cattle in the hills in the south of the North Island.
In the South Island, sheep farming (both intensive and extensive) is the main form of pastoral agriculture, with a sprinkling of beef cattle farmed in the high and hill country and wetter flat areas. An increasing amount of dairying is carried out on the flat land of Southland, Canterbury and Otago, particularly in areas with irrigation.
New Zealand livestock are predominantly grass-fed, but feeding of natural grass-based supplements, such as hay and silage, occurs in winter and during very dry periods. Grass growth is seasonal, largely dependent on location and climatic fluctuations, peaks in the spring and is at a minimum in winter. Feed surpluses are harvested and stored for feeding out during winter or in times of feed shortages.
Stock is grazed in paddocks, often with movable electric fencing, which allows rotation of grazing. Lambing and calving are carefully managed to take full advantage of spring grass growth. New Zealand has one major feed-lot enterprise that produces table beef for export to Japan.
Probably New Zealand's best known statistic was that it once had more than 20 times as many sheep as people. As at 30 June 2005, however, the ratio had dropped to around 10.
Climatic conditions, soil types and contours determine stocking rates for New Zealand farms. Finishing sheep and beef land in both islands carry around 11 to 12 stock units a hectare, while South Island high country farms average around one stock unit a hectare. The average dairy farm carries 2.5 cows a hectare at peak milk.
Trends in livestock numbers are largely determined by world market prices for farm products, including meat, wool and dairy products.
The sheep population has declined from 70.3 million at 30 June 1982 to 39.9 million at 30 June 2005. The beef cattle population fell 9 percent in the same period to 4.43 million. The number of dairy cattle at 30 June 2005 was 5.10 million, up 2.10 million on the 30 June 1982 total. Total deer numbered 1.76 million at 30 June 2004 compared with just 0.15 million in 1982.
Deer. Deer farming in New Zealand has developed since the early 1970s to become an important livestock industry. New Zealand is the world's largest exporter of farmed venison. In the year ending 30 June 2005, 25,400 tonnes product weight of chilled and frozen venison, valued at $202 million, was exported. New Zealand has developed more than 30 export markets, with the highest returning ones being Germany, Belgium, France and the United States. Deer farming is generally permitted in most regions, but some species may be farmed in specified areas only. Red, wapiti and fallow deer are the predominant farmed species.
Sheep. Sheep have been a success story for New Zealand farmers in recent years. Production per ewe has improved through higher lambing percentages and higher lamb slaughter weights. The special quota arrangement New Zealand has with the European Union underpins the sector, while China has emerged as a high-volume, low-value market for lamb cuts. In the year ending 30 September 2005, 300,000 tonnes product weight of lamb, valued at $2.11 billion, was exported. Mutton export value amounted to $263 million for the same period. Chilled lamb contributed 25 percent by value. New Zealand lamb is exported to 95 overseas markets, with the highest returning markets being the United Kingdom, Germany, the United States and France. Many farmers use exotic breeds to introduce hybrid vigour and better meat production characteristics. Coarse wool has become a byproduct to meat production.
Table 18.02 shows sheep numbers from recent agricultural surveys.
Table 18.02. Sheep categories
At 30
June
| Breeding ewes and hoggets | Other sheep | Total2 | |
|---|---|---|---|
1Changes in survey population definition introduced in 1994. 2Figures may not equate to totals due to estimates for components of livestock types being calculated independently from estimates for the totals. 3Caution should be used when making comparisons between 1999 and earlier years because of changes to the survey populations. 4An agriculture census of farms involved in livestock, cropping, horticulture, cropping and forestry was conducted in 2002. Rrevised Note: Sheep numbers were not counted in the 1997, 1998, 2000 and 2001 agricultural surveys. Source: Statistics New Zealand | |||
| (000) | |||
| 1990 | 42,097 | 15,756 | 57,852 |
| 1991 | 39,833 | 15,329 | 55,162 |
| 1992 | 38,399 | 14,169 | 52,568 |
| 1993 | 36,638 | 13,661 | 50,298 |
| 19941 | 35,754 | 13,618 | 49,466 |
| 1995 | 34,999 | 13,619 | 48,816 |
| 1996 | 34,392 | 13,002 | 47,394 |
| 19993 | 32,234 | 13,446 | 45,680 |
| 20024 | 29,159R | 10,413R | 39,571R |
| 2003 | 29,358 | 10,194 | 39,552 |
| 2004 | 29,404R | 9,867R | 39,271R |
| 2005 | 29,632 | 10,296 | 39,928 |
Export volumes of beef and veal totalled 391,000 tonnes, valued at $1.76 billion, in the year ending 30 September 2005.
Beef cattle. The major traditional beef cattle breeds in New Zealand are the Angus and the Hereford. However, around 20 percent of adult cattle slaughter comes from bull beef production which originates from dairy calves of Holstein-Friesian and crosses. Approximately 75 percent of beef numbers are located in the North Island, with about 25 percent of the beef herd run on small non-commercial farms. In the year ending 30 September 2005, export volume of beef and veal was 391,000 tonnes, valued at $1.76 billion. A special quota arrangement ensures the United States takes 45 percent by volume and 48 percent by value of beef and veal exports. The main export category is manufacturing beef. Other significant export destinations are South Korea, Japan, Taiwan and Canada, which together contribute 39 percent of beef and veal export value.
Dairy cattle. The main dairy cow breed in New Zealand is the Holstein-Friesian, followed by the Holstein-Friesian/Jersey cross and the Jersey. Eighty-two percent of dairy herds are in the North Island, with 48 percent located in the Waikato and Taranaki regions. The South Island has 18 percent of the dairy herds and 27 percent of the dairy cows. Dairy exports comprise whole milk powder, skim milk powder, cheese, casein, butter and other manufactured products. In the year ending 30 June 2005, export value of dairy products was $5.54 billion to 141 countries. Forty-four percent by value was derived from exports to the United States, the European Union, Philippines, Japan, Saudi Arabia and China. Whole milk powder made the largest contribution, making up 31 percent of dairy export value.
Table 18.03 shows numbers of dairy and beef cattle.
Table 18.03. Cattle categories
At 30
June
| Category | 1996 | 19991 | 20021 | 2003 | 2004 | 2005 |
|---|---|---|---|---|---|---|
1Caution should be used when making comparisons between these reference years because of changes to the survey populations. R revised Source: Statistics New Zealand | ||||||
| Dairy cows and heifers in milk or calf | 3,219,546 | 3,337,486 | 3,841,553 | 3,928,140 | 4,103,319 | 4,105,989 |
| Dairy cows and heifers not in milk or calf | 182,158 | 170,227 | 221,539 | 149,190 | 174,124 | 212,042 |
| Dairy heifer yearlings and calves (including bobby) | 730,994 | 769,039 | 1,044,470 | 980,566 | 830,388 | 713,349 |
| Dairy bulls for breeding | 32,400 | 39,657 | 54,027 | 43,707 | 44,661 | 38,536 |
| Total dairy | 4,165,098 | 4,316,409 | 5,161,589 | 5,101,603 | 5,152,492 | 5,069,916 |
| Beef cows and heifers | 2,123,403 | 1,979,517 | 2,325,173R | 2,391,779 | 2,326,624 | 2,337,545 |
| Bulls – all ages | 548,201 | 841,287 | 1,066,208R | 1,046,411 | 911,054 | 869,817 |
| Other beef cattle | 2,180,575 | 1,822,901 | 1,099,900R | 1,188,426 | 1,209,722 | 1,223,852 |
| Total beef | 4,852,179 | 4,643,705 | 4,491,281R | 4,626,616 | 4,447,400 | 4,431,214 |
| Total cattle | 9,017,277 | 8,960,114 | 9,652,870R | 9,728,219 | 9,599,892 | 9,501,130 |
Goats. Goats are farmed commercially in New Zealand for their milk, mohair and meat production, as well as for weed control. Goat numbers have declined in recent years, but niche markets for milk products and fibres have been developed.
Table 18.04 shows distribution of livestock by region.
Table 18.04. Distribution of livestock
By
region
At 30 June 2005
| Region | Dairy cattle | Beef cattle | Sheep | Deer | Pigs |
|---|---|---|---|---|---|
CconfidentialSsuppressed because of poor statistical quality Note: Figures may not add to stated totals due to rounding. Source: Statistics New Zealand | |||||
| Northland | 343,195 | 469,262 | 553,239 | S | 7,052 |
| Auckland | 122,015 | 169,777 | 333,312 | S | S |
| Waikato | 1,701,018 | 679,066 | 2,555,163 | 141,515 | 50,310 |
| Bay of Plenty | 337,821 | 108,344 | 356,859 | 58,785 | S |
| Gisborne | S | 300,670 | 1,717,266 | 30,381 | C |
| Hawke's Bay | 82,772 | 526,604 | 4,048,499 | 120,027 | 4,754 |
| Taranaki | 615,592 | 130,935 | 678,700 | 4,772 | 16,057 |
| Manawatu-Wanganui | 410,765 | 696,501 | 6,738,633 | 147,638 | 21,762 |
| Wellington | 95,274 | 171,035 | 2,043,663 | S | C |
| Total North Island | 3,714,448 | 3,252,194 | 19,025,333 | 551,964 | 129,479 |
| Tasman | 67,535 | 45,222 | 325,874 | 31,748 | 494 |
| Nelson | C | 3,665 | 17,138 | S | C |
| Marlborough | 30,604 | 63,620 | 638,031 | S | S |
| West Coast | 142,370 | 32,275 | 74,988 | S | S |
| Canterbury | 604,756 | 539,297 | 7,655,945 | 482,605 | 189,427 |
| Otago | 161,616 | 281,842 | 6,185,038 | 198,704 | 15,123 |
| Southland | 348,075 | 202,326 | 5,950,627 | 371,374 | 2,734 |
| Chatham Islands | C | S | S | S | C |
| Total South Island | 1,355,468 | 1,179,020 | 20,902,579 | 1,153,120 | 211,986 |
| Total New Zealand | 5,069,916 | 4,431,214 | 39,927,912 | 1,705,084 | 341,465 |
Meat products are New Zealand's second largest export income earner behind dairy products, accounting for 16 percent of total New Zealand-produced merchandise exports in the year ending 30 September 2005.
New Zealand's main meat exports are lamb, mutton and beef. Ninety-one percent of lamb, 89 percent of mutton and 82 percent of beef produced in New Zealand were exported in the year ending 30 September 2005.
The domestic market takes all the pig meat and poultry produced in New Zealand.
Per capita meat consumption of 100.47 kilograms in the year ending 30 September 2005 was 3 percent more than that consumed in the 1995 year. Lamb held a similar share of total consumption, while mutton and beef consumption declined. Red meat consumption, at 43.51 kilograms per capita, dropped 22.7 percent during the decade. Per capita poultry consumption increased 51.2 percent to 38.8 kilograms, while pigmeat consumption increased 15.2 percent to 18.17 kilograms. Figure 18.01 compares proportions of meat consumption for the year ending 30 September 2005 with the same period 10 years earlier.
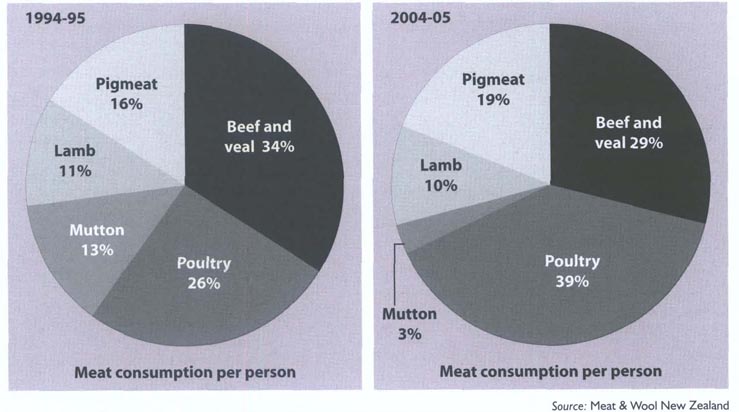
The New Zealand Meat Board is empowered by the Meat Board Act 2004 to establish and operate meat export quota management systems and, among other functions, is also required to make provision for ownership and use of the board's assets.
In relation to the quota management system, responsibilities involve administration of the European Union (EU) sheepmeat and goatmeat, EU high quality beef and United States beef and veal tariff rate quotas granted to New Zealand as a result of the GATT Uruguay Round.
Lamb – a sheep under 12 months, or one that does not have permanent incisor teeth in wear.
Hogget – a young male sheep or maiden ewe having no more than two permanent incisors in wear.
Ram – an adult uncastrated male sheep having more than two permanent incisors in wear.
Mutton – ewes and castrated males (wethers) with more than two permanent incisors in wear. A wether must not show any ram characteristics.
Steers, heifers, cows and bulls – A steer is a male bovine castrated when young. A heifer is a female bovine, with no more than six permanent incisors. Cows have more than six permanent incisors. A bull is an entire bovine with masculine characteristics.
Bobby calves – Bobby veal carcasses are derived from milk-fed bovine calves generally less than two weeks old.
Veal – Veal is no longer an export meat type, as numbers are now insignificant. Previously, veal was defined as maiden female, castrated male, or entire males (not showing masculine characteristics) up to 14 months old.
New Zealand produced more than 300,000 tonnes of export lamb in the 2004/05 season, with most of it going to European Union countries.
Some meat processors publish their schedules for stock purchase prices in the weekly Agrifax publication, daily newspapers and in company newsletters.
Producers can sell their stock on schedule, on a pool account system, on the hoof, on contract, or by auction.
Season average net schedules are compiled by Meat & Wool New Zealand and are shown in Table 18.05. Schedule prices quoted are inclusive of pelt, slipe wool and hide payments. The New Zealand production season runs from 1 October to 30 September.
Table 18.05. Average net schedule prices
| Classification | 1995–96 | 1996–97 | 1997–98 | 1998–99 | 1999–00 | 2000–01 | 2001–02 | 2002–03 | 2003–04 | 2004–05P |
|---|---|---|---|---|---|---|---|---|---|---|
1Includes skin and one kilogram wool pull. Pprovisional Source: Meat & Wool New Zealand | ||||||||||
| Lamb | ($/head)1 | |||||||||
| YL (9.1–13.2kg) | 26.61 | 31.38 | 27.85 | 25.98 | 33.50 | 41.94 | 43.88 | 42.73 | 39.81 | 43.38 |
| YM (13.3–17.0 kg) | 37.90 | 44.45 | 39.91 | 41.00 | 47.48 | 61.99 | 66.76 | 59.93 | 59.15 | 61.79 |
| YX (17.1–21.3 kg) | 44.70 | 52.82 | 49.57 | 54.00 | 57.93 | 70.17 | 79.26 | 71.73 | 72.76 | 71.34 |
| Mutton | ($/head)1 | |||||||||
| MX1 (< 23kg) | 24.80 | 31.53 | 28.29 | 23.54 | 25.56 | 39.60 | 47.65 | 43.21 | 41.98 | 42.80 |
| MX2 (> 23kg) | 28.18 | 36.92 | 33.57 | 27.91 | 29.92 | 47.61 | 57.90 | 54.16 | 52.76 | 54.04 |
| Beef | (cents/kg) | |||||||||
| P2 Steer (270.5–295kg) | 184.0 | 188.3 | 214.3 | 248.8 | 311.6 | 367.3 | 386.8 | 306.8 | 313.1 | 326.3 |
| M Cow (170.5–195kg) | 125.5 | 146.4 | 185.6 | 206.2 | 267.4 | 331.5 | 314.8 | 211.0 | 212.2 | 229.8 |
| M Bull (270.5–295kg) | 183.7 | 187.1 | 229.0 | 262.6 | 325.0 | 372.7 | 385.4 | 277.3 | 288.2 | 303.5 |
New Zealand accounts for 1 percent of global beef and veal production and 8 percent of global lamb and mutton production. Table 18.06 shows recent meat production volumes.
Table 18.06. Meat production1
Years ending 30 September
| Carcasses | 1992 | 1994 | 1996 | 1998 | 2000 | 2001 | 2002 | 2003 | 2004 | 2005P |
|---|---|---|---|---|---|---|---|---|---|---|
1Inspected meat production at meat export works and abattoirs. 21992–1994 old series, 1996 onwards new series. 3Not including deer. ..figures not available Pprovisional Rrevised Source: Ministry of Agriculture and Forestry | ||||||||||
| Tonnes (000) | ||||||||||
| Beef | 522 | 523 | 606 | 609 | 552 | 570 | 554 | 633 | 686 | 629 |
| Veal | 14 | 14 | 27 | 25 | 20 | 20 | 22 | 27 | 24 | 23 |
| Mutton | 158 | 125 | 134 | 129 | 106 | 129 | 107 | 113 | 107 | 105 |
| Lamb | 400 | 398 | 375 | 416 | 433 | 434 | 414 | 433 | 411 | 438 |
| Pigmeat | 47 | 49 | 50 | 48 | 46 | 44 | 45 | 47 | 52 | 50 |
| Deer | 10 | 22 | 16 | 24 | 22 | 28 | 26 | .. | .. | .. |
| Poultry2 | 64 | 78 | 91 | 99 | 110R | 119 | 135R | 143 | 154 | 110 |
| Total | 1,215 | 1,209 | 1,299 | 1,350 | 1,289R | 1,344 | 1,303R | 1,3963 | 1,4343 | 1,3553 |
Meat & Wool New Zealand is a levy-funded, industry-good organisation charged with furthering the interests of New Zealand red meat and wool producers. It works to ensure that New Zealand farmers obtain the best possible long-term return on their investment.
Meat & Wool New Zealand is involved in market access, market development and international promotion, providing market support through offices in Wellington, Brussels, London, Tokyo, Washington and Seoul.
It is also involved in commissioning or funding research and development activities, with a major focus on on-farm activities designed to help livestock farmers increase the profitability of their farms.
Meat & Wool New Zealand provides funding for a number of organisations, including the beef, sheep and goat councils, and provides partial funding for the New Zealand Beef and Lamb Marketing Bureau.
Meat & Wool New Zealand's funding comes from all New Zealand beef, sheep, goat and wool producers, who pay a levy on all stock slaughtered and on every kilogram of wool harvested.
Lamb exports totalled 301,759 tonnes (shipped weight) in the 2004/05 season, an increase of 7,117 tonnes on the previous season.
The European Union (EU) took 181,882 tonnes (shipped weight) of sheepmeat in the 2004/05 season and was New Zealand's largest market, followed by North Asia (50,928 tonnes). North America (47,214 tonnes), the Pacific (25,178 tonnes) and the Middle East (19,957 tonnes).
Under a World Trade Organisation agreement, New Zealand's sheepmeat exports to the EU are subject to a tariff rate quota of 226,700 tonnes carcass weight equivalent. Agreement between New Zealand and the EU on compensation for the EU's enlargement in 2004 provided for an additional allocation from 1 January 2006 of 1,154 tonnes carcass weight equivalent for sheepmeat and goatmeat.
Mutton exports in the 2004/05 season totalled 59,156 tonnes and were up 3.7 per cent on the previous year. The largest markets for mutton were the United Kingdom (19.6 percent), Germany (14.7 percent) and Taiwan (11.6 percent).
New Zealand's largest market for beef and veal is North America, which took 227,978 tonnes in the 2004/05 season, down 11.9 percent on the previous year. Beef and veal exports to the United States were down 31,639 tonnes on the previous year to 191,168 tonnes.
Beef and veal exports to North Asia, the second largest market region, increased 1.8 percent on the 2003/04 season to 115,592 tonnes.
Under World Trade Organisation agreements, 213,402 tonnes (product weight) of New Zealand beef and veal may be exported to the United States annually at a tariff rate of US4.4c/kg on most beef products. Also under the agreements, 300 tonnes (product weight) of New Zealand high-quality beef may be exported to the European Union annually at a 20 percent ad valorem duty.
Agreement between New Zealand and the European Union (EU) on compensation for the EU's enlargement in 2004 provided for an additional allocation to New Zealand from 1 January 2006 of 1,000 tonnes product weight of high quality beef.
Lamb exports to Europe accounted for 51 percent of total lamb exports in the 2004/05 season.
Table 18.07 shows the dollar value per shipped tonne of lamb exports to the European Union. In 2004/05, the dollar per shipped tonne reached $8,859, double the value obtained in 1994/95.
Table 18.08 gives a measure of New Zealand export beef prices derived from Meat & Wool New Zealand's weekly price series for imported manufacturing beef in the United States.
New Zealand beef and lamb is exported to more than 100 countries by around 300 companies registered by the New Zealand Meat Board.
New Zealand is a major exporter of sheepmeat, accounting for 55 percent of the world export trade. New Zealand's major sheepmeat markets are the European Union, North America and the Middle East.
Compared with sheepmeat, New Zealand is a smaller but significant player in the global market for beef, accounting for 8 percent of all world export beef trade. North America and North Asia are New Zealand's major markets for beef.
Table 18.09 shows numbers of livestock slaughtered at meat export works and abattoirs.
Table 18.07. Lamb exports to EU
($ per shipped tonne)
Years ending 30 September
| $ | |
|---|---|
| Source: Meat & Wool New Zealand | |
| 1995 | 4,400 |
| 1996 | 4,844 |
| 1997 | 5,339 |
| 1998 | 5,701 |
| 1999 | 5,869 |
| 2000 | 6,461 |
| 2001 | 7,581 |
| 2002 | 8,330 |
| 2003 | 8,211 |
| 2004 | 8,280 |
| 2005 | 8,859 |
Table 18.08. United States beef prices
Mid-March
| Year | Manufacturing bull | Manufacturing cow |
|---|---|---|
Pprovisional Source: Meat & Wool New Zealand | ||
| US cents/kg | ||
| 1992 | 271.0 | 257.8 |
| 1993 | 266.6 | 256.6 |
| 1994 | 285.3 | 282.0 |
| 1995 | 215.9 | 209.3 |
| 1996 | 176.2 | 165.2 |
| 1997 | 220.3 | 208.2 |
| 1998 | 198.3 | 182.8 |
| 1999 | 198.3 | 184.0 |
| 2000 | 215.9 | 202.7 |
| 2001 | 229.1 | 207.1 |
| 2002 | 245.7 | 239.0 |
| 2003 | 211.5 | 193.9 |
| 2004 | 257.8 | 235.7 |
| 2005P | 295.2 | 282.0 |
Table 18.09. Livestock slaughter
At meat export
works and abattoirs1
Years ending 30 September
| Animals | 1992 | 1994 | 1996 | 1998 | 2000 | 2001 | 2002 | 2003R | 2004 | 2005P |
|---|---|---|---|---|---|---|---|---|---|---|
1Excludes condemned carcasses. Rrevised Pprovisional .. figures not available Source: Ministry of Agriculture and Forestry | ||||||||||
| Head of stock (000) | ||||||||||
| Lambs | 28,020 | 26,174 | 24,680 | 27,024 | 26,050 | 26,256 | 24,711 | 25,693 | 23,833 | 25,053 |
| Sheep | 7,682 | 5,796 | 6,280 | 5,761 | 4,583 | 5,507 | 4,654 | 4,880 | 4,446 | 4,312 |
| Adult cattle | 2,133 | 2,042 | 2,436 | 2,462 | 2,172 | 2,184 | 2,224 | 2,486 | 2,670 | 2,422 |
| Calves and vealers | 780 | 814 | 1,389 | 1,381 | 1,126 | 1,212 | 1,356 | 1,607 | 1,460 | 1,380 |
| Pigs | 807 | 822 | 813 | 775 | 714 | 696 | 709 | 748 | 786 | 765 |
| Deer | .. | .. | .. | 412 | 404 | 442 | 465 | .. | .. | .. |
Table 18.10 shows annual export meat production by volume since 1997.
Table 18.1. Export meat production
Years ending
30 September
| 1997 | 1998 | 1999 | 2000 | 2001 | 2002 | 2003 | 2004 | 2005 | |
|---|---|---|---|---|---|---|---|---|---|
1From year ending 30 September 2004, variety meats and inedible meats and offal were combined into one category. ... not applicable Source: New Zealand Meat Board | |||||||||
| Tonnes shipping weight | |||||||||
| Lamb | 298,550 | 291,210 | 281,711 | 289,800 | 298,949 | 270,021 | 309,370 | 294,642 | 301,759 |
| Mutton | 58,505 | 63,260 | 57,585 | 45,932 | 62,023 | 54,784 | 62,940 | 57,034 | 59,156 |
| Beef | 339,204 | 324,611 | 304,341 | 315,211 | 342,237 | 337,788 | 378,581 | 407,584 | 374,264 |
| Bobby veal | 13,250 | 13,507 | 12,933 | 10,876 | 11,490 | 13,577 | 15,551 | 17,249 | 15,943 |
| Goat | 1,567 | 1,405 | 1,406 | 945 | 1,400 | 1,140 | 1,247 | 1,266 | 1,152 |
| Variety meats1 | 50,021 | 50,782 | 49,016 | 54,995 | 58,886 | 58,732 | 59,515 | 71,913 | 67,872 |
| Inedible meats and offal | 15,878 | 22,639 | 21,337 | 20,362 | 18,299 | 2,449 | 4,266 | ... | ... |
| Total | 776,975 | 767,414 | 728,329 | 738,121 | 793,284 | 738,491 | 831,470 | 849,688 | 820,146 |
New Zealand sheep are largely dual-purpose, wool/meat animals and their wool is predominantly strong.
New Zealand is the world's largest producer of crossbred (strong) wool, used mainly for interior textiles, such as carpets, upholstery, furnishings, bedding and rugs. It is also used for hand-knitting yarn, in knitwear and in blankets. It is estimated that, worldwide, 42 percent of New Zealand wool is used in machine-made carpets and 10 percent in hand-knotted and hand-tufted carpets. The rest is used primarily for upholstery and bedding. Uses vary markedly from country to country.
Net domestic consumption of wool in New Zealand is among the highest in the world on a per capita basis.
Wool production. Although New Zealand's sheep flock ranks fifth largest in the world, the country's total wool fibre production is second only to Australia on a clean mass basis. This is due to the high clip yield per head and lower quantities of grease and other contaminants in New Zealand wool.
Table 18.11 shows recent annual wool production figures.
Table 18.11. Wool production
Years ending 30
June
| Years | Flock size | Slipe greasy | Shorn greasy | Total greasy | Shorn greasy yield |
|---|---|---|---|---|---|
1September year wool production. Pprovisional Source: Meat & Wool New Zealand | |||||
| Million | Tonnes (000) | Kg/head | |||
| 2000 | 44,190 | 37.1 | 220.1 | 257.2 | 4.98 |
| 2001 | 42,260 | 34.3 | 202.4 | 236.7 | 4.79 |
| 2002 | 40,033 | 30.2 | 198.7 | 228.9 | 4.96 |
| 2003 | 39,572 | 32.2 | 197.4 | 229.6 | 4.99 |
| 2004 | 39,552 | 25.9 | 191.8 | 217.7 | 4.85 |
| 2005P1 | 39,255 | 30.3 | 200.8 | 231.1 | 5.12 |
Forty-six percent of shorn wool production was sold at auction in the year ending 30 September 2005 and 54 percent by private treaty.
On a clean basis, shorn wool sales totalled 142,727 tonnes (excluding slipe) in the 2005 year. Crossbred wool made up 88.4 percent of sales, Merino wool 5.2 percent, mid-micron wool 4.6 percent and dag wool 1.8 percent.
Wool prices reflected a stronger New Zealand exchange rate. For the year ending 30 September 2005, fine wool prices were down 9.8 percent on the previous year, averaging $9.64 a kilogram on a clean basis. Similarly, crossbred wool prices were down 9.1 percent to average $3.69 a kilogram, while mid-micron wool prices were down 11.9 percent to average $4.92 kilogram.
The New Zealand dollar strengthened 8.8 percent against the United States dollar during the 2004/05 season and as more than 90 percent of wool is exported, the exchange rate alone accounted for most of the decline in wool auction prices for the year.
About 90 percent of the New Zealand clip leaves the country in greasy or scoured form. Of the 10 percent of the clip processed in New Zealand, roughly half is exported in product form, mainly as carpet yarn, carpets or knitted jerseys.
Export destinations for New Zealand wool are shown in Table 18.12.
Table 18.12. Export destinations of New Zealand wool
Years ending 30 September
| Region | 1999 | 2000 | 2001 | 2002 | 2003 | 2004 | 2005 |
|---|---|---|---|---|---|---|---|
| Source: Meat & Wool New Zealand | |||||||
| Clean tonnes | |||||||
| European Union | 60,925 | 70,596 | 67,881 | 58,415 | 56,369 | 57,270 | 57,705 |
| Northern Asia | 42,179 | 40,189 | 44,814 | 39,147 | 36,532 | 37,768 | 35,651 |
| Southern Asia | 26,776 | 27,538 | 24,286 | 17,786 | 18,481 | 18,271 | 19,805 |
| Pacific | 10,199 | 11,620 | 9,082 | 10,944 | 11,486 | 9,557 | 8,489 |
| North America | 8,804 | 7,716 | 8,778 | 5,111 | 6,072 | 6,177 | 5,470 |
| Middle East | 5,128 | 7,207 | 5,046 | 5,147 | 5,543 | 5,153 | 4,950 |
| Mediterranean | 3,039 | 4,969 | 3,262 | 4,190 | 4,113 | 3,964 | 3,272 |
| Africa | 658 | 958 | 898 | 869 | 612 | 421 | 967 |
| Eastern Europe | 235 | 203 | 353 | 269 | 134 | 187 | 558 |
| Western Europe | 217 | 184 | 351 | 319 | 365 | 294 | 161 |
| South America | 69 | 297 | 143 | 98 | 559 | 487 | 129 |
| Total | 158,229 | 171,477 | 164,894 | 142,295 | 140,266 | 139,549 | 137,157 |
Raw wool and wool product export receipts declined from $1.042 billion to $0.972 billion in the year ending 30 September 2005.
Raw wool exports declined $63.2 million to $663 million, the result of a 7.0 percent decline in price and a 1.8 percent decline in shipments.
Wool exports to the European Union remained virtually unchanged, taking 42 percent of shipments. North Asia was the second largest region, taking 26 percent, with the majority (21 percent) destined for China. Shipments to China were down 4 percent on the previous year.
India counted for 9.8 percent of wool exports, with shipments up 4.6 percent on the previous year.
Table 18.13 shows export earnings from wool and wool products from 2000 to 2005.
Table 18.13. Wool export earnings
Years ending 30
September
| Product | 2000 | 2001 | 2002 | 2003 | 2004 | 2005P |
|---|---|---|---|---|---|---|
1Free on board at point of loading. Pprovisional Note: Figures may not add to stated totals due to rounding. Source: Meat & Wool New Zealand | ||||||
| $(million) fob1 | ||||||
| Raw wool | 827.8 | 887.9 | 785.2 | 817.4 | 726.1 | 662.9 |
| Tops, yarns and sliver | 118.9 | 103.1 | 118.0 | 131.5 | 131.1 | 137.2 |
| Carpets and rugs | 119.5 | 133.8 | 143.3 | 155.3 | 138.0 | 131.4 |
| Other final woollen products | 40.5 | 42.5 | 37.5 | 42.4 | 46.4 | 40.3 |
| Total | 1,106.6 | 1,167.3 | 1,083.7 | 1,146.5 | 1,041.6 | 971.8 |
More than 11,000 dairy farmers provided 13 billion litres of milk to Fonterra in the 2004/05 season.
Dairy products, at $6.4 billion, made up 20.7 percent of the value of New Zealand's total merchandise exports in the year ending 31 December 2004.
With the exception of milk and some dairy products for local consumption, the industry is primarily geared towards overseas markets, which account for more than 90 percent of all milk produced.
There are four major product groupings manufactured from liquid whole milk by New Zealand dairy factories:
Milk powders, such as whole milk powder, skim milk powder and buttermilk powder.
Cream products, such as butter, anhydrous milkfat and ghee.
Cheese.
Protein products, such as casein and caseinates.
Liquid whole milk can be broken down into three chief components: milkfat, solids-non-fat (principally protein) and water.
Skim milk powder is made from skim milk after the cream (milkfat) has been separated from the liquid whole milk. Whole milk powder is manufactured directly from the liquid whole milk, without separation of the cream.
Buttermilk powder is made from buttermilk, a by-product of the butter manufacturing process. Most butter produced is of a ‘sweet cream’ type, and anhydrous milkfat and ghee are further refinements of butter.
The predominant cheese variety manufactured in New Zealand is cheddar or cheddar types, although the manufacture of speciality cheese types has shown considerable growth in recent years.
The final product grouping, milk proteins, are derived from the by-products of skim milk and also from the by-products of other dairy product manufactures such as cheese.
Collection and processing of most of New Zealand's milk was being carried out at the end of the 2004/05 dairy season on 31 May by three cooperative manufacturing dairy companies, operating from 24 sites.
Cooperative dairy companies are governed by boards of directors elected by supplying farmers, with provision for the appointment of a small number of non-farmers noted for their commercial expertise.
The cooperatives utilise funds supplied in the form of share capital by their farmers.
The cooperative dairy industry produces nearly all dairy products manufactured in New Zealand. On an annual basis, the companies convert approximately 14 billion litres of milk into nearly 2 million tonnes of dairy products, more than 90 percent of which is exported. The balance is consumed in the relatively small domestic market.
In addition to the three cooperatives, about 20 smaller private dairy companies produce up to 20,000 tonnes of cheese a year. There are also several ice cream manufacturers.
Dairy Companies Association of New Zealand. The Dairy Companies Association of New Zealand was formed in 2003 by New Zealand's leading dairy companies. Its membership includes Fonterra Co-operative Group, Tatua Co-operative Dairy Company, Westland Co-operative Dairy Company, Mainland Products, New Zealand Dairy Foods, Open Country Cheese and Gisborne Milk. It represents the joint interests of New Zealand dairy companies on domestic and international policy issues, a role undertaken by the New Zealand Dairy Board before deregulation of the industry and the formation of Fonterra in 2001. The general activities of the association are funded by membership subscription, with special activities funded according to a proportional funding formula. The Dairy Companies Association of New Zealand's email address is secretariat@dcanz.co.nz
Fonterra. Fonterra Co-operative Group Limited is New Zealand's largest company, earning revenues of $12.3 billion in the year ending 31 May 2005 from national and international marketing of dairy ingredients and branded consumer products. It is the fifth largest dairy company in the world by turnover. The cooperative has assets of $11.8 billion and is owned by around 11,500 dairy farmers who supplied more than 13 billion litres of milk in the 2004/05 season. Payment for milk is made on a per kilogram of milk solids basis and Fonterra paid out $5.3 billion ($4.59 per kilogram of milk solids) to shareholders in the 2004/05 season. Fonterra has four businesses:
Fonterra Ingredients is the world's largest exporter of dairy products, with sales of 2.4 million metric tons in 2004/05 and customers who include the world's largest food manufacturers.
Fonterra Brands is a global producer, marketer and distributor of consumer-branded dairy products. Its $1.1 billion brand portfolio includes Anchor, Soprole, Mainland, Anlene, Tip Top, Peters & Brownes, Anmum and Chesdale.
Fonterra Foodservices is a specialist supplier of ingredients and branded consumer products to the global restaurant, fast food, hospitality and catering industries.
Fonterra Specialty Products develops, manufactures and markets high-value specialist ingredients, such as colostrum, lactoferrin and organics.
Supporting these businesses is Fonterra Innovation, which invests more than $100 million in research and development each year; Fonterra Group Manufacturing, which is responsible for all of Fonterra's New Zealand and global manufacturing sites; Fonterra Milk Supply, which is the interface with shareholders and suppliers, including milk collection and payment; and Fonterra Shared Services, which handles human resource, strategy, finance, legal and communications functions. Fonterra has around 18,000 global employees, 7,000 of whom are based in Australia, the Americas, Asia, Africa and the Middle East. Fonterra is the major contributor to New Zealand's status of being the largest supplier to the globally-traded market for dairy products, ahead of the European Union and Australia. In addition to exporting product from New Zealand, Fonterra also sells product from South America, the United States and Australia through its global supply chain. The Fonterra website is www.fonterra.com
Westland Milk Products. Westland Milk Products is an independent cooperative dairy company owned by 380 farmer shareholders. It is located in Hokitika on the west coast of the South Island. The company processes more than 400 million litres of milk annually into a diverse range of dairy ingredients for nutritional, food and beverage applications. The products include milk powders, milk fat products (butter and anhydrous milkfat) and milk protein products (casein, milk protein concentrate, whey protein concentrate), as well as colostrum powder. The products are marketed both nationally and internationally. The Westland Milk Products website is www.westland.co.nz
Tatua Co-operative Dairy Co Ltd. Tatua is an autonomous, independent dairy company owned entirely by 124 farmer shareholders. The company was established in 1914 and is the only dairy cooperative remaining in New Zealand that has never been part of an amalgamation. Tatua's factory is located at Tatuanui in the Waikato region, 35 kilometres east of Hamilton.
Tatua Foods makes ultra heat treated (UHT) sterilised liquid food products. These include aerosol canned cream, butter oil mist, bag-in-box whipping cream, cheese sauce, liquid pre-mixes (for milkshakes and sundaes) and UHT chocolate milk.
Tatua Nutritional Ingredients' product range includes a variety of proteins, protein hydrolysates and bioactive peptides suitable for applications in specialist nutrition and healthcare products.
Tatua Bionutrient Ingredients specialises in the manufacture of purified proteins and peptones customised for biopharmaceutical applications.
Tatua Flavour Ingredients focuses on the production of specialist dairy flavour ingredients for the global food and beverage industry.
The Tatua Co-operative Dairy Co Ltd website is www.tatua.com
Open Country Cheese Ltd. Open Country Cheese is an independent public company with more than 500 shareholders set up following deregulation of the New Zealand dairy industry in 2001. It produces quality semi-hard to hard dry-salted cheeses for domestic and world markets from its state of the art plant at Waharoa. The company believes a key element in its success is the high-quality milk sourced from farms in the intensive dairy farming area of the Eastern Waikato. The Open Country cheese range includes cheddar, colby, gouda, edam, havarti, kahui and goya, with annual total production of 20,000 tonnes. Export markets include Australia, Asia, Latin America, the United Kingdom, Egypt and Saudi Arabia, in addition to the domestic market. The company has a whey powder plant under construction, which, when running to full capacity, will produce 10,000 tonnes of sweet, non-hygroscopic whey powder a year. The Open Country Cheese Ltd website is www.opencountry.co.nz
The international market for dairy products is characterised by its small size relative to total world milk production, with less than 10 percent of production entering international trade.
Because of this, the market is especially vulnerable to shifts in climatic, commercial and political forces. Marginal production changes by major producers can trigger major shifts in supplies of, and prices for, products on the international market.
The major dairy exporters are the European Union (EU), New Zealand, Australia and, to a lesser degree, the United States and Canada. These five exporters supply about 90 percent of dairy products traded on the international market.
In the year ending 31 December 2004, the United States, the EU, the Philippines, the People's Republic of China, Japan and Malaysia were New Zealand's most valuable markets for dairy produce.
In the year ending 30 September 2005, domestic pork production in terms of the number of pigs slaughtered was 764,746. There was an increase in kill weight, with the average carcase size 66.5 kilograms, compared with 66 kilograms in the 2004 year.
The per capita consumption of pork reached 20.1 kilograms in the 2005 year, an increase of 1.1 kilograms on the previous year.
The demand of 82,707 tonnes of pork in the domestic market (up 6.6 percent on the previous year) was fulfilled by the supply of 50,845 tonnes of domestic pork and 31,862 tonnes of imported pork.
New Zealand Pork Industry Board. The New Zealand Pork Industry Board is a statutory body operating under the Pork Industry Board Act 1997. The board's mission is to secure for the New Zealand producer ‘a profitable premium position for pork products in the food business.’ To achieve this, the board has five key strategic areas of focus: supply chain links; product differentiation; environmental sustainability and animal welfare; research and innovation; and biosecurity and trade. Board income comes from a levy on pigs slaughtered at licensed premises. The board has five directors, four of whom are elected by producers and one appointed by the government. During 2005, the Minister of Agriculture signed off the National Animal Welfare Advisory Committee Code of Welfare for Pigs. The board also contributed to a number of biosecurity initiatives to heighten on-farm biosecurity awareness throughout the pork production industry. Technology transfer and research activities are carried out on behalf of the board by Massey University and other Crown Research Institutes and universities, In 2005, the board became a core participant in the Australian-based Pork Cooperative Research Centre which will result in the New Zealand pork industry gaining access to more than A$81.5 million worth of research in coming years. The New Zealand Pork Industry Board website is www.pork.co.nz
Annual pig numbers since 1990 are shown in Table 18.14.
Table 18.14. Pigs
At 30 June
| Breeding sows and mated gilts | Other pigs of all ages (including boars) | Total pigs | |
|---|---|---|---|
1A shortened agricultural census was undertaken in these years and there was no question on the number of breeding sows. 2Survey population definition changed. 3Survey population definition changed to all farm units on the Agribase known to hold livestock and/or engage in grain/arable cropping. ..figures not available Rrevised Note: Pig numbers were not counted in the 1997, 1998, 2000 and 2001 agricultural surveys. Sources: Statistics New Zealand New Zealand Pork Industry Board | |||
| 1990 | 50,990 | 343,711 | 394,701 |
| 19911 | .. | .. | 407,306 |
| 1992 | 51,324 | 359,824 | 411,148 |
| 19931 | .. | .. | 395,117 |
| 19942 | 58,065 | 364,701 | 422,766 |
| 1995 | 59,250 | 371,755 | 431,005 |
| 1996 | 57,065 | 367,009 | 424,074 |
| 19993 | 60,626 | 308,261 | 368,887 |
| 2002 | 46,706R | 295,309R | 342,015R |
| 2003 | 49,381 | 327,868 | 377,249 |
| 2004 | 48,453 | 340,187 | 388,640 |
| 2005 | 42,598 | 298,867 | 341,465 |
The poultry meat industry continues to expand rapidly and is now the major intensive livestock industry in New Zealand.
Poultry is a favourite meat of New Zealanders, with per capita consumption close to 39 kilograms a year.
In the year ending 31 December 2004, the New Zealand poultry industry produced more than 155.000 tonnes of poultry meat, mainly for the domestic market.
More than 97 percent of 2004 production was chicken meat, produced from 87.5 million broiler chickens, with turkey, duck and roasting fowl making up the remaining 3 percent.
Table 18.15 shows annual chicken production and proportions of fresh and frozen chicken.
Table 18.15. Chicken production
Years ending 31
December
| Year | Birds | Dressed weight | Fresh | Frozen |
|---|---|---|---|---|
| Source: Poultry Industry Association of New Zealand | ||||
| Number | Tonnes | Percent | Percent | |
| 1990 | 43,469,000 | 55,379 | 55.2 | 44.8 |
| 1991 | 45,891,000 | 59,036 | 53.5 | 46.5 |
| 1992 | 48,187,000 | 62,792 | 55.0 | 45.0 |
| 1993 | 51,006,000 | 69,570 | 52.2 | 47.8 |
| 1994 | 55,844,000 | 76,811 | 58.6 | 41.4 |
| 1995 | 63,756,000 | 89,157 | 60.0 | 40.0 |
| 1996 | 60,712,000 | 87,165 | 65.4 | 34.6 |
| 1997 | 60,749,000 | 88,904 | 66.2 | 33.8 |
| 1998 | 64,667,000 | 97,120 | 64.6 | 35.4 |
| 1999 | 63,945,000 | 100,085 | 70.7 | 29.3 |
| 2000 | 67,067,000 | 108,929 | 71.2 | 28.8 |
| 2001 | 69,361,000 | 115,786 | 73.7 | 26.3 |
| 2002 | 77,357,000 | 130,519 | 73.4 | 26.6 |
| 2003 | 80,728,000 | 138,697 | 75.4 | 24.6 |
| 2004 | 87,570,000 | 151,497 | 77.1 | 22.9 |
Poultry Industry Association of New Zealand. The Poultry Industry Association of New Zealand (PIANZ) represents the interests of all poultry processing and livestock breeding companies in New Zealand. Membership is voluntary, but more than 99 percent of New Zealand's primary poultry production is represented by PIANZ. Tegel Foods. Inghams Enterprises and PH van den Brink produce more than 96 percent of New Zealand's broiler chickens. The poultry meat industry earns nearly $530 million in retail sales and provides jobs for about 3,000 people. Cheaper prices in real terms, lifestyle changes and consumer perceptions saw poultry consumption increase from 23 kilograms a person to nearly 39 kilograms a person in the 10 years to 2004. Increases in chicken consumption have been mainly in the fresh and further processed areas, with 77 percent of chicken now sold fresh.
Eggs. New Zealand's estimated 2.9 million laying hens produced around 71 million dozen eggs in 2004. More than 85 percent of eggs are sold as table eggs within the domestic market, with the remainder used in the baking and catering industries. Retail sales of eggs are worth more than $165 million a year. Total egg production increased by approximately 15 percent in the decade to 2004, with annual per capita consumption now around 211 eggs. Most eggs produced in New Zealand are from caged hens, with free-range and barn egg production accounting for 10 percent of the total. New Zealand has around 130 commercial egg producers, with the largest 20 producers accounting for more than half of total production. The Egg Producers’ Federation of New Zealand Inc (EPF), funded via producer levies under the Commodity Levies Act, represents the industry and plays a growing role in research funding and direction. Eggs Incorporated, contracted to the EPF, provides nationwide activities to promote eggs on a generic basis. There are some exports of specialist table eggs to niche markets overseas, in addition to sizeable fertile egg and day-old chick exports to the Pacific.
In the more than 160 years that honey bees have been kept in New Zealand, beekeeping has moved from being a home craft to a progressive industry and New Zealand is now recognised as one of the most advanced beekeeping countries in the world.
Miss Mary Bumby, the sister of an English missionary, was the first person to successfully ship honey bees to New Zealand when she brought two basket hives (skeps) of bees into Northland in 1839. More than 100 years later in 1950, beekeeper numbers peaked at 7,000, although they owned only about 150,000 hives, or half of today's number.
The late 1970s and early 1980s saw large changes in the beekeeping industry. The centralised Honey Marketing Authority ceased operations and private individuals and companies began exporting honey products. The number of hives increased by more than 50 percent to 335,000, spurred on by the demand for paid pollination services, especially from the kiwifruit industry. Since then, however, the number of beekeepers and hives has decreased to the point where, in 2005, there were 2,743 registered beekeepers owning 297,605 hives (see Table 18.16). The trend for fewer beekeepers to own more hives continues.
Table 18.16. Beekeepers, apiaries, hives and honey production
Years ending 31 December
| Year | Beekeepers | Apiaries | Hives | Honey production |
|---|---|---|---|---|
| Source: AgriQuality Limited | ||||
| Number | Tonnes | |||
| 1994 | 5,565 | 25,331 | 289,875 | 11,819 |
| 1995 | 5,409 | 24,764 | 293,080 | 8,047 |
| 1996 | 5,306 | 24,379 | 286,806 | 8,610 |
| 1997 | 5,286 | 23,754 | 287,458 | 8,537 |
| 1998 | 5,356 | 23,027 | 298,921 | 8,081 |
| 1999 | 4,914 | 21,793 | 302,988 | 9,069 |
| 2000 | 4,956 | 22,443 | 320,113 | 9,609 |
| 2001 | 4,539 | 21,304 | 314,094 | 9,144 |
| 2002 | 3,973 | 20,258 | 305,152 | 4,682 |
| 2003 | 3,596 | 20,153 | 300,841 | 12,252 |
| 2004 | 3,211 | 19,592 | 292,530 | 8,888 |
| 2005 | 2,743 | 19,115 | 297,605 | 9,689 |
In April 2000, the serious bee mite varroa destructor was found in Auckland and has since spread throughout the North Island. Attempts were made to keep it out of the South Island but in June 2006 the mite was found in Nelson. The mite, if left untreated, kills honey bee colonies. While it can be controlled using miticide strips and some organic acids, these can be expensive to buy or apply.
The mite has changed New Zealand beekeeping forever and many hobby beekeepers have decided not to continue. The number of registered beekeepers decreased from nearly 5,000 at the time of the varroa outbreak in April 2000 to 2,743 in 2005. All beekeepers in the North Island are levied for an American foulbrood (AFB) disease control programme, while those in the South Island are levied for the AFB programme as well as a strategy to keep varroa out of the South Island and detect varroa if it arrives. The strategy remains in place despite the discovery of the mite in Nelson. These extra fees have also resulted in many hobby beekeepers deciding to exit the industry.
Some commercial beekeepers will also not be able to sustain their businesses in light of the increased costs caused by varroa. On the positive side, increases in the price of honey and other bee products, live bees and pollination services have helped many beekeepers cope with increased costs and loss of hives.
AgriQuality Limited assessed the total saleable honey crop for 2005 at 9,689 tonnes (33.1 kilograms a hive), compared with the six-year average of 9,044 tonnes (29.6 kilograms a hive). The best honey season recorded in recent history was in 2003 when 12,252 tonnes of honey was produced, while the worst was in 2002 with a estimated crop of 4,682 tonnes. Both these seasons have occurred since varroa arrived in New Zealand.
In 1992, Waikato University researchers confirmed that manuka honey was unusually effective as an antiseptic dressing for wounds and burns. As a result, both the demand and the price for manuka honey has risen dramatically.
The marketing of bees and bee products has become more sophisticated, and other products such as deer velvet, bee venom, dried fruits, pollen and royal jelly can be blended with honey to add value. The industry's other main marketable products are beeswax, propolis (an antibiotic gum or resin from plants), pollen and live bees, which include package bees and queen bees. Package bees are ventilated containers with usually 1 kilogram of bees, a queen bee and some food supplies.
Bee pests and diseases, as well as the aggressive Africanised honey bees, have spread throughout many countries where bees are kept, which has increased the demand for bees from countries like New Zealand, Annual exports of live bees are around 20,000 to 25,000 queen bees and 20,000 × 1kg package bees, mainly to Canada.
New Zealand beekeepers provide a commercial pollination service to growers for tree and berry fruits, kiwifruit, cucurbits (squash and melons) and small seeds. About 100,000 hives are moved for pollination each season, and this business is becoming more important each year as feral or wild hives are reduced or eliminated by the varroa mite. The real value of beekeeping is now in pollinating plants rather than producing apiculture products.
The National Beekeepers’ Association (NBA) is a voluntary organisation supported by fee-paying members. The NBA represents the interests of beekeepers to government and coordinates a national response on issues affecting their industry. The NBA also levies all beekeepers under the Biosecurity Act 1993 to pay for its American foulbrood pest management strategy. Another organisation, the Bee Industry Group (BIG), is a member of New Zealand Federated Farmers and also represents beekeeping interests.
The National Beekeepers'Association website is www.nba.org.nz
Kiwifruit is New Zealand's most important horticultural export earner, with more than 80 million trays sold to 60 countries in 2004.
Although pastoral farming is the major land use in New Zealand, there have been significant increases in recent years in areas planted in horticulture and crops.
Major crops for the export market include kiwifruit, pipfruit, stonefruit, onions, squash, flowers and berryfruit.
Increasing volumes of grapes are grown for the rapidly-expanding export wine market.
Table 18.17 shows recent annual values of horticultural exports by type and the proportion of total horticultural exports each type comprises.
Table 18.17. Horticultural exports
By value and as
proportion of total
Years ending 30
June
| 2000 | 2001 | 2002 | 2003 | 2004 | 2005 | |||||||
|---|---|---|---|---|---|---|---|---|---|---|---|---|
| $(million) | Percent | $(million) | Percent | $(million) | Percent | $(million) | Percent | $(million) | Percent | $(million) | Percent | |
1Relocated from ‘seeds and bulbs’ in 2005. 2Value excludes confidential data. Sources: Martech Consulting Group Statistics New Zealand | ||||||||||||
| Fresh fruit | 959,4 | 61.8 | 1,029.8 | 57.4 | 1,147.9 | 60.5 | 1,019.2 | 58.7 | 1,233.5 | 63.5 | 1,189.4 | 63.9 |
| Processed fruit | 76.2 | 4.9 | 111.9 | 6.2 | 87.7 | 4.6 | 80.1 | 4.6 | 89.0 | 4.6 | 101.8 | 5.5 |
| Fresh vegetables | 215.1 | 13.9 | 257.5 | 14.4 | 260.0 | 13.7 | 246.4 | 14.2 | 217.1 | 11.2 | 199.3 | 10.7 |
| Processed vegetables | 197.6 | 12.7 | 274.3 | 15.3 | 284.2 | 15.0 | 274.7 | 15.8 | 284.8 | 14.7 | 257.2 | 13.8 |
| Cut flowers and foliage | 46.8 | 3.0 | 52.4 | 2.9 | 48.9 | 2.6 | 39.8 | 2.3 | 39.5 | 2.0 | 38.5 | 2.1 |
| Seeds and bulbs | 35.2 | 2.3 | 41.6 | 2.3 | 44.2 | 2.3 | 53.6 | 3.1 | 54.9 | 2.8 | 59.3 | 3.2 |
| Plants1 and sphagnum moss | 21.0 | 1.5 | 26.0 | 1.5 | 24.6 | 1.3 | 23.4 | 1.3 | 23.4 | 1.2 | 15.72 | 0.8 |
| Total | 1,551.3 | 100.0 | 1,793.5 | 100.0 | 1,897.5 | 100.0 | 1,737.1 | 100.0 | 1,942.2 | 100.0 | 1,861.2 | 100.0 |
Stock feed. Animals can be grazed in open pasture in New Zealand for the full 12 months of the year. The winter growth of grass, except in certain favoured localities, needs to be supplemented in order to keep stock in good condition during the colder months, and in some districts supplementary fodders are necessary in the drier summer months. Hay and silage crops are grown almost exclusively on the farms where they are consumed, and some districts specialise in the growing of certain other supplementary fodder crops such as maize in the Waikato and Manawatu-Wanganui regions. The bulk of supplementary fodders, other than grass and clover, hay and silage, and maize, are grown in the South Island, since the colder climate necessitates more extensive supplementary feeding than in the North Island.
Wheat. New Zealand wheat is primarily grown for domestic human consumption. The best quality wheat is milled into flour for breadmaking, Other wheat grain is milled for biscuit manufacturing and similar uses. By-products of flour milling, bran and pollard, are used for stock feed. Most wheat is grown in the Canterbury region.
Barley. Most barley grown in New Zealand is used for the manufacture of stock feed and for malting. Exports of malting and feed barley fluctuate in response to price changes, which reflect international supply and demand.
Maize. Primarily grown in the Waikato and eastern North Island, maize grain is used as poultry feed and, increasingly, as a supplementary feed for pigs and other livestock, such as dairy cattle. Maize silage and green feed are used also as supplementary feed for cattle.
Oats. Grown mainly for threshing and green feed, oats are also used to produce milled rolled-oats, oatmeal and oaten foods. The main growing areas for oats are Canterbury and Southland.
Seed certification. AgriQuality operates a seed certification scheme covering all main herbage and arable species, and participates in the Organisation for Economic Co-operation and Development's seed scheme. New Zealand certified seed is exported to European Union countries, countries of the Pacific Basin and North and South America.
Table 18.18 lists recent plantings of fruit, as well as the main growing regions for each type of fruit.
Table 18.18. Areas planted in fruit
At 30
June
| Fruit | 1993 | 19941 | 1995 | 1996 | 20002 | 2002 | 2003 | 2005 | Main regions |
|---|---|---|---|---|---|---|---|---|---|
1Change in survey population definition introduced in 1994. 2The population for the 2000 Agricultural Production Survey – Horticulture differs from that of previous agricultural surveys, so figures for 2000 are not directly comparable with previous years. 3Areas of grapes planted by activities classified to winemaking are not included. Pprovisional Rrevised Ssuppressed because of poor statistical quality Note: Areas planted in fruit not counted in the 1997, 1998, 1999, 2001 and 2004 agricultural surveys. Source: Statistics New Zealand | |||||||||
| Hectares | |||||||||
| Citrus | |||||||||
| Grapefruit/goldfruit | 156 | 117 | 117 | 115 | 117 | 82 | 71 | 48 | Auckland, Bay of Plenty |
| Lemons | 283 | 263 | S | 330 | 339 | 364 | 362 | 334 | Northland |
| Mandarins | 533 | 619 | 654 | 637 | 946 | 914R | 842 | 676 | Northland, Gisborne |
| Oranges | 760 | 789 | 757 | 607 | 597 | 575R | S | 541 | Gisborne, Northland |
| Tangelos | 357 | 295 | 316 | 230 | 167 | 163 | 129 | 103 | Gisborne |
| Pipfruit | |||||||||
| Apples | 12,937 | 15,257 | 15,916 | 15,819 | 14,114 | 11,717R | 12,150 | 10,980 | Hawke's Bay, Tasman |
| Pears | 1,068 | 1,279 | 1,266 | 1,151 | 958 | 952R | 905 | 720 | Hawke's Bay, Tasman |
| Nashi (Asian pears) | 484 | 418 | 413 | 313 | 185 | 119 | S | 112 | Waikato, Tasman |
| Stone fruit | |||||||||
| Apricots | 804 | 844 | 831 | 735 | 759 | 636R | 597 | 487 | Otago |
| Nectarines | 845 | 667 | 705 | 559 | 618 | 528 | 503 | 433 | Otago, Hawke's Bay |
| Peaches | 869 | 714 | 738 | 756 | 725 | 808 | 748 | 548 | Hawke's Bay |
| Plums | 303 | 342 | 336 | 303 | 408 | 394 | 426 | 333 | Hawke's Bay |
| Cherries | 273 | 274 | 353 | 339 | 535 | 550 | 569 | 524 | Otago, Marlborough |
| Berry fruit | |||||||||
| Blackcurrants | 795 | 720 | 714 | 614 | 834 | 1,308 | S | 1,311 | Tasman |
| Blueberries | 340 | 357 | 377 | 280 | 348 | 430 | S | 567 | Waikato |
| Boysenberries | 223 | 231 | 222 | 227 | 263 | 239 | S | 196 | Tasman |
| Raspberries | 224 | 199 | S | S | 254 | 302 | S | 190 | Tasman, Canterbury |
| Strawberries | 247 | 331 | S | S | 384 | 311R | 290 | 219 | Auckland |
| Subtropicals | |||||||||
| Avocados | 1,260 | 1,375 | 1,588 | 1,573 | 2,646 | 3,106R | 3,235 | 3,400 | Bay of Plenty, Northland |
| Feijoas | 226 | 161 | S | 138 | 217 | 198 | S | 181 | Auckland |
| Kiwifruit | 14,099 | 12,174 | 11,873 | 11,640 | 12,184 | 11,964 | 12,357 | 12,030 | Bay of Plenty |
| Tamarillos | 325 | 299 | 249 | 188 | 297 | 270 | 186 | 206 | Northland, Bay of Plenty |
| Passionfruit | 68 | 54 | 54 | 41 | 66 | 70 | S | 66 | Bay of Plenty |
| Grapes (outdoor)3 | 5,663 | 7,160 | 7,382 | 7,627 | 12,665 | 17,300R | 19,646 | 25,030P | Marlborough, Hawke's Bay, Gisborne |
| Persimmons | 400 | 412 | 428 | 361 | 384 | 282 | S | 195 | Auckland |
Summerfruit New Zealand. Summerfruit includes cherries, peaches, nectarines, apricots and plums. The New Zealand industry consists of about 500 growers on 3,000 hectares. The main export region is Central Otago, followed by Marlborough, Hawke's Bay and Canterbury, with North Otago and South Canterbury emerging as cherry producing areas. The domestic market consumes 75 percent of the product, with Taiwan, Australia and the United States taking another 20 percent. Processing of mainly peaches and apricots accounts for approximately five percent of the market. In the 2004/05 season, apricots made up 52 percent of exports, followed by cherries (44 percent), nectarines (3.5 percent) and plums (0.5 percent). Summerfruit New Zealand is funded predominantly by a commodity levy.
Pipfruit. The New Zealand pipfruit industry was deregulated in October 2001, meaning that any company can source pipfruit in New Zealand for export. In January 2003, New Zealand's largest exporter, ENZA, merged with Turners & Growers to create a produce marketer of global significance. While the company retained the Turners & Growers name, exports remain under their own distinctive brands. Turners & Growers exports to more than 50 countries worldwide, with most of its product going to Europe, the United Kingdom and the United States. About 30 varieties of apples and pears are sold under the ENZA brand. Table 18.19 shows pipfruit exports since deregulation.
Table 18.19. Pipfruit exports1
Years ending 30 September
| Pipfruit | 2002 | 2003 | 2004 |
|---|---|---|---|
1Tray carton equivalents. Sources: New Zealand Customs Service Pipfruit New Zealand | |||
| Apples | 18,124,499 | 17,766,789 | 17,899,150 |
| Pears | 400,000 | 300,000 | 292,816 |
| Total pipfruit | 18,524,499 | 18,066,789 | 18,191,966 |
Kiwifruit. Kiwifruit is New Zealand's most important horticultural export earner. New Zealand is a major world supplier of kiwifruit and has led the development of the global industry. ZESPRI International Limited is a consumer-driven, grower-owned company dedicated to the global marketing of kiwifruit. It is one of New Zealand's leading exporters, earning in excess of $1 billion in 2004. With global headquarters in New Zealand and a network of offices in Europe, North America, Asia and the Pacific, ZESPRI is the biggest marketer of kiwifruit in the world and acknowledged as the world leader in innovation, quality and marketing. ZESPRI sold more than 80 million trays of New Zealand kiwifruit in some 60 countries in 2004. Sales were focused in five major markets: Europe (56 percent), Japan (20 percent), East Asia and South-east Asia (13 percent), North America (5 percent) and developing markets, which include Australia, Middle East, the Indian Ocean region, New Zealand and Far East Russia. While New Zealand growers supply about a quarter of world production, kiwifruit generally accounts for less than 1 percent of world fresh fruit production. Other major producers include Italy, France, Greece, Spain, Japan, China, Korea, Chile and the United States. Kiwifruit is produced in many regions of New Zealand's North Island, as well as in the north of the South Island. The Bay of Plenty, with more than 80 percent of production, is the major growing area. There are about 2,600 kiwifruit growers in New Zealand. Annual kiwifruit plantings and sales since 1991 are shown in Table 18.20.
Table 18.2. Kiwifruit production
Years ending 31
March
| Area | Trays submitted1 | Trays sold | |
|---|---|---|---|
1Trays submitted represents the number of trays received from suppliers, while trays sold represents final sales numbers. The difference is the fruit loss which occurs in transit. Source: ZESPRI International Limited | |||
| Hectares | Million | ||
| 1991 | 14,980 | 59.8 | 54.7 |
| 1992 | 14,594 | 67.3 | 52.3 |
| 1993 | 12,265 | 55.3 | 49.2 |
| 1994 | 10,161 | 55.8 | 49.9 |
| 1995 | 10,210 | 58.8 | 48.7 |
| 1996 | 10,329 | 63.1 | 56.2 |
| 1997 | 10,243 | 60.6 | 56.2 |
| 1998 | 10,015 | 60.3 | 59.7 |
| 1999 | 10,234 | 52.3 | 51.8 |
| 2000 | 10,159 | 63.7 | 61.5 |
| 2001 | 10,100 | 66.3 | 65.1 |
| 2002 | 10,376 | 62.2 | 61.3 |
| 2003 | 10,580 | 65.1 | 64.6 |
| 2004 | 10,934 | 81.5 | 79.7 |
The area planted in producing grapevines in New Zealand doubled in the five years to 2005.
Grape growing and wine production. The area planted in producing grapevines increased from 10,197 hectares in 2000 to 20,002 hectares in 2005. Marlborough (9,944 hectares), Hawke's Bay (4,249 hectares) and Gisborne (1,890 hectares) are the major grape-producing areas. The 2005 season produced 142,000 tonnes of grapes. Sauvignon blanc (63,297 tonnes), chardonnay (29,741 tonnes) and pinot noir (14,578 tonnes) were the most popular grapes. Exports of wine increased from 19.2 million litres (worth $169 million) in 2000 to 51.4 million litres (worth $435 million) in 2005. The United Kingdom, which imported 21.1 million litres of wine in the year ending 30 June 2005, was New Zealand's major export market. The United States, which imported 13.0 million litres, was the second-largest export market, with Australia in third position, with 9.8 million litres. The number of wineries in New Zealand increased from 204 in 1995 to 516 in 2005. The New Zealand Winegrowers’ website is www.nzwine.com
Wine industry statistics from 1995 to 2005 are shown in Table 18.21.
Table 18.21. Wine industry statistics
Years
ending 30 June
| Category | Year 2000 | ||||||||||
|---|---|---|---|---|---|---|---|---|---|---|---|
| 1995 | 1996 | 1997 | 1998 | 1999 | 2000 | 2001 | 2002 | 2003 | 2004 | 2005 | |
| Source: Wine Institute of New Zealand | |||||||||||
| Number of wineries | 204 | 238 | 262 | 293 | 334 | 358 | 382 | 398 | 421 | 463 | 516 |
| Producing area (hectares) | 6,110 | 6,610 | 7,410 | 7,580 | 9,000 | 10,197 | 11,648 | 13,787 | 15,800 | 17,809 | 20,002 |
| Average yield (tonnes per hectare) | 12.2 | 11.2 | 8.1 | 10.3 | 8.9 | 7.8 | 6.1 | 8.6 | 4.8 | 9.1 | 6.9 |
| Crushed (tonnes) | 74,500 | 75,300 | 60,000 | 78,300 | 79,700 | 80,100 | 71,000 | 118,700 | 76,400 | 165,500 | 142,000 |
| Total production (million litres) | 56.4 | 57.3 | 45.8 | 60.6 | 60.2 | 60.2 | 53.3 | 89 | 55 | 119.2 | 102 |
| Domestic sales (million litres) | 30.9 | 35.6 | 38.8 | 38.2 | 38.4 | 41.3 | 36.2 | 32.6 | 34.4 | 35.5 | 45 |
| Consumption per capita (litres NZ wine) | 8.7 | 9.9 | 10.4 | 10.1 | 10.1 | 10.6 | 9.3 | 8.2 | 8.6 | 8.8 | 11.2 |
| Stock: sales ratio | 2.14:1 | 2.06:1 | 1.66:1 | 1.72:1 | 1.78:1 | 1.60:1 | 1.72:1 | 2.34:1 | 1.93:1 | 2.6:1 | 1.67:1 |
| Export volume (million litres) | 7.8 | 11 | 13.1 | 15.2 | 16.6 | 19.2 | 19.2 | 23 | 27.1 | 31.1 | 51.4 |
| Export value ($ million) | 40.8 | 60.3 | 75.9 | 97.6 | 125.3 | 168.6 | 198.1 | 246.4 | 281.9 | 302.6 | 434.9 |
18.1–18.2 Ministry of Agriculture and Forestry; Statistics New Zealand.
18.3 Meat & Wool New Zealand; Ministry of Agriculture and Forestry.
18.4 Meat & Wool New Zealand.
18.5 Fonterra; Tatua Co-operative Dairy Company; Westland Milk Products; Dairy Companies Association of New Zealand; Open Country Cheese Ltd.
18.6 New Zealand Pork Industry Board; Poultry Industry Association of New Zealand; AgriQuality New Zealand; Statistics New Zealand; National Beekeepers’ Association.
18.7 Ministry of Agriculture and Forestry; Statistics New Zealand; Summerfruit New Zealand; ZESPRI International Limited; New Zealand Winegrowers; Turners and Growers Ltd; New Zealand Customs Service; Pipfruit New Zealand.
www.agriquality.co.nz – AgriQuality New Zealand Ltd
www.dcanz.co.nz – Dairy Companies Association of New Zealand
www.fonterra.com – Fonterra
www.maf.govt.nz – Ministry of Agriculture and Forestry
www.meatandwoolnz.com – Meat & Wool New Zealand
www.nba.org.nz – National Beekeepers’ Association
www.nzwine.com – New Zealand Winegrowers
www.opencountry.co.nz – Open Country Cheese Ltd
www.customs.govt.nz – New Zealand Customs Service
www.pork.co.nz – New Zealand Pork Industry Board
www.pipfruitnz.co.nz – Pipfruit New Zealand
www.pianz.org.nz – Poultry Industry Association of New Zealand
www.stats.govt.nz – Statistics New Zealand
www.summerfruitnz.co.nz – Summerfruit New Zealand
www.tatua.com – Tatua Co-operative Dairy Company
www.turnersandgrowers.co.nz – Turners and Growers Ltd
www.westland.co.nz – Westland Milk Products
www.zespri.com – ZESPRI International Limited
Table of Contents
Radiata pine makes up 89 percent of New Zealand's planted production forest estate.
Forests cover nearly 30 percent, or 8 million hectares, of New Zealand's land area. Of this, about 6.2 million hectares are indigenous forests and 1.8 million hectares are planted production forests. In addition to tall forests, there are 2.7 million hectares of shrublands, some of which are reverting to indigenous forest.
Of the total planted production forest estate, 89 percent is radiata pine (pinus radiata) and 6 percent is Douglas fir (pseudotsuga menziesii).
Hardwoods comprise about 3 percent of planted production forests, eucalyptus species being the most important.
Although radiata pine is the principal plantation species, its properties mean it is not suitable for all uses, especially where decorative features, dimensional stability and surface hardness are important. This, coupled with the declining supply of timber from indigenous forests, has resulted in special-purpose species, such as blackwood (acacia melanoxylon), macrocarpa (cupressus macrocarpa) and black walnut (juglans nigra), being established to meet specialist markets.
The average new planting rate in the 30 years to 2005 was 43,000 hectares a year. Between 1992 and 1998, new planting rates were high, averaging 69,000 hectares a year. Since 1998, however, new planting has declined, with the 6,000 hectares planted in 2005 the lowest since 1960.
Available wood resources from plantations will rise rapidly in the next two decades. Because the domestic demand for timber is not expected to change significantly, the volume of wood available for export is expected to increase sharply.
Indigenous forests. New Zealand's 6.2 million hectares of indigenous forests are mainly in mountainlands, particularly on the West Coast of the South Island. The forests comprise a mix of more than 2,450 species of trees, shrubs and smaller plants. Major indigenous tree species in these complex forests are beech, rimu, kauri, taraire and tawa. Indigenous forests harbour about 330 species of native birds (some classed as endangered or threatened), two species of bat, reptiles, freshwater fish, amphibians and invertebrates, most notably land snails and giant weta. The forests’ significance includes recreational, scientific, historical and scenic values. Indigenous forests are a key part of New Zealand's environment and help protect natural values of the ecosystem. Main threats to the forests are introduced animals and plants, and an increasing demand for access and recreational opportunities. The Crown owns about 83 percent of indigenous forests, with the rest in private hands.
The Forest Act 1949, amended in 1993, promotes sustainable management of privately-owned indigenous forests. This means the forests are managed in a way that maintains their ability to provide products and amenities in perpetuity. The act does this by requiring private owners to manage their forests through sustainable management plans and permits, by controlling indigenous timber input to sawmills, and by prohibiting indigenous woodchip and log exports.
Less than 1 percent of New Zealand's total forest production is harvested from indigenous forests. Harvesting timber from state-owned indigenous forests, previously confined to the West Coast of the South Island, ceased in accordance with government policy in 2002.
The state-owned indigenous production forests on the West Coast, totalling about 130,000 hectares, are now conservation forests, administered by the Department of Conservation. A further 12,000 hectares of indigenous forests in Southland, set aside for production and managed by state-owned enterprise Crown Forest Management Ltd, were transferred to the Waitutu Incorporation in 1996. These forests are managed under an approved sustainable forest management plan.
Harvesting and milling of ‘salvage’ timber from areas of farmland and non-natural forest, along with windblown and naturally dead trees from indigenous forests not being managed under an approved sustainable forest management regime, is permitted.
Approval is necessary for harvesting and milling timber for a landowner's personal use.
All sawmills milling timber from indigenous forests must be registered and are restricted to processing timber from approved sources.
Exports of indigenous forest products are limited to those sourced from an area managed under an approved sustainable forest management plan or permit, or where the product is manufactured to a finished form.
Planted production forests. Trees planted in the second boom of afforestation (1970 through to the mid 1980s) are now a valuable resource for large-scale utilisation, providing opportunities to maximise the economic return from tree growing. Special-purpose plantation species are being planted by small-scale forest growers on suitable sites. Uses for these timbers include furniture, cabinet work, turnery, joinery, veneers and boat-building.
Figure 19.01 shows wood supply from 1950 and forecasts to 2040.
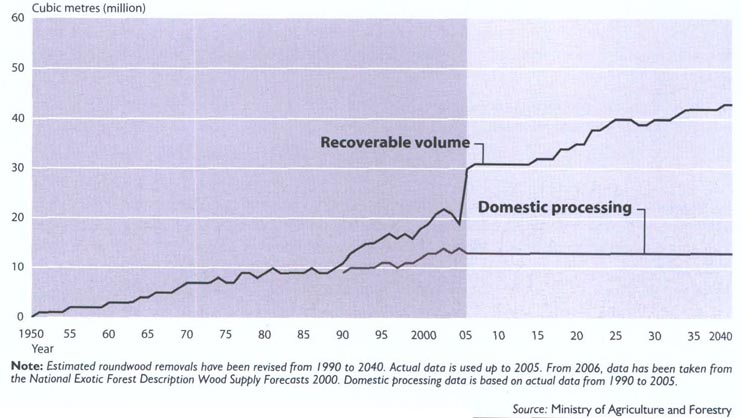
Many early plantation forests were developed by the state, but ownership has since moved increasingly to the private sector. Today, approximately 92 percent of New Zealand's plantation resource is owned by private or publicly-listed companies.
Five percent of the forest area remains in central government ownership, managed primarily by the Ministry of Agriculture.
Local authorities own a further 3 percent of the area, while the remainder is owned by a large number of private owners, including Māori trusts. Small private investors and landowners continue to develop an expanding area of planted production forests.
An agreement among the Crown, the Māori Council and the Federation of Māori Authorities provides security of tenure for purchasers of state plantations and protects the interests of Māori with claims before the Waitangi Tribunal.
Purchasers have the right to use the land for a period sufficient to allow any existing tree crop to reach maturity and be harvested. The right to use the land is automatically extended by one year each year unless notice of termination is given.
If notice of termination is given, the purchaser has time to harvest tree crops planted before the notice.
In the event of a successful Māori claim, the government will issue notice of termination to the purchaser and compensate the claimant for the rights the purchaser retains until the end of the termination period.
Table 19.01 summarises forestry planting and production from 1920.
Table 19.01. Forest planting and production
Years
ending 31 March
| Year | New area planted | Production | |||
|---|---|---|---|---|---|
| State | Private | Rough-sawn timber | Wood pulp1 | Paper and paperboard | |
1Chemical and mechanical wood pulp Pprovisional - nil or zero .. figures not available Source: Ministry of Agriculture and Forestry | |||||
| Hectares (000) | Hectares (000) | Cubic Metres (000) | Tonnes | Tonnes | |
| 1920 | .. | .. | 726 | .. | .. |
| 1925 | 6 | 8 | 812 | .. | .. |
| 1930 | 22 | 15 | 668 | .. | .. |
| 1935 | 5 | 7 | 575 | .. | .. |
| 1940 | 2 | .. | 793 | 221 | 13,079 |
| 1945 | .. | - | 803 | 15,681 | 20,949 |
| 1950 | 2 | 1 | 1,131 | 21,781 | 22,136 |
| 1955 | 3 | 2 | 1,453 | 53,016 | 40,917 |
| 1960 | 4 | 2 | 1,638 | 221,408 | 164,255 |
| 1965 | 8 | 5 | 1,739 | 370,499 | 316,104 |
| 1970 | 15 | 11 | 1,803 | 521,654 | 445,976 |
| 1975 | 22 | 23 | 2,086 | 843,244 | 546,834 |
| 1980 | 17 | 21 | 2,000 | 1,122,456 | 673,853 |
| 1985 | 18 | 30 | 2,306 | 1,144,911 | 770,098 |
| 1990 | - | 16 | 2,121 | 1,233,809 | 757,371 |
| 1995 | - | 74 | 2,955 | 1,360,389 | 876,187 |
| 2000 | - | 34 | 3,806 | 1,527,565 | 829,812 |
| 2001 | - | 30 | 3,848 | 1,572,277 | 871,607 |
| 2002 | - | 22 | 3,864 | 1,523,730 | 846,727 |
| 2003 | - | 20 | 4,436 | 1,512,602 | 851,663 |
| 2004P | - | 11 | 4,209P | 1,462,656 | 845,422 |
More than 90 percent of New Zealand's plantation resource is owned by private or publicly-listed companies.
Scion scientists have developed a biological system for treating low nutrient wastewater from pulp and paper plants.
Pulp and paper. The pulp and paper industry is concentrated mainly near large planted production forests on the volcanic plateau of the North Island. All eight plants are located in the North Island and four of them are integrated with sawmills to fully utilise input of wood.
There are four main pulp and paper companies:
Norske Skog Australasia operates the Tasman pulp and paper mill at Kawerau, in the Bay of Plenty. The plant produces mechanical pulp, newsprint and directory paper.
Carter Holt Harvey operates pulp and paper plants at five sites in New Zealand. The Penrose, South Auckland, plant produces corrugated medium paper from recycled waste paper. At the large Kinleith site, near Tokoroa, bleached and unbleached market kraft pulp, linerboards and corrugated paper mediums are produced. A plant at Whakatane produces paperboard from mechanical pulp, outsourced kraft pulp and waste paper-based pulps. A tissue plant at Kawerau has a chemical thermo-mechanical pulp mill that manufactures a wide range of tissue, towelling and speciality grades. Carter Holt Harvey acquired Norske Skog's Tasman kraft pulp manufacturing business at Kawerau in March 2001.
Pan Pac Forest Products operates an integrated sawmill and thermo-mechanical pulp mill at Whirinaki, near Napier.
Winstone Pulp International has a chemical thermo-mechanical pulp mill at Karioi, near Waiouru. The plant uses wood from surrounding forests, as well as sawmill residues.
Recent annual production volumes of pulp and paper products are shown in Table 19.02.
Table 19.02. Pulp and paper production
Years
ending 31 March
| Year | Wood pulp | Paper and paperboard | ||||
|---|---|---|---|---|---|---|
| Chemical1 | Mechanical2 | Newsprint | Other printing and writing paper | Other paper and paperboard | Total paper and paperboard | |
1Includes semi-chemical pulp. 2Includes groundwood pulp, thermo-mechanical and chemithermo-mechanical pulp. - nil or zero Pprovisional Source: Ministry of Agriculture and Forestry | ||||||
| Tonnes | ||||||
| 1994 | 701,630 | 669,604 | 370,853 | 13,794 | 450,966 | 835,613 |
| 1995 | 684,454 | 675,935 | 374,865 | 14,924 | 486,398 | 876,187 |
| 1996 | 702,575 | 702,732 | 391,436 | 13,084 | 488,449 | 892,969 |
| 1997 | 652,308 | 724,956 | 384,147 | 11,870 | 481,135 | 877,152 |
| 1998 | 675,453 | 736,712 | 393,545 | 13,556 | 472,475 | 879,576 |
| 1999 | 645,032 | 755,707 | 383,372 | 11,586 | 419,356 | 814,314 |
| 2000 | 753,885 | 773,680 | 360,623 | 10,285 | 458,904 | 829,812 |
| 2001 | 744,991 | 827,286 | 380,614 | 4,155 | 486,838 | 871,607 |
| 2002 | 723,054 | 800,676 | 334,058 | - | 512,669 | 846,727 |
| 2003 | 684,187 | 828,415 | 355,569 | - | 496,094 | 851,663 |
| 2004P | 654,291 | 808,365 | 368,421 | - | 477,001 | 845,422 |
Panel products.Table 19.03 shows production volumes of wood panel products since 1994.
Table 19.03. Panel production
Years ending 31
December
| Year | Veneer | Plywood | Particleboard | Fibreboard |
|---|---|---|---|---|
Pprovisional Source: Ministry of Agriculture and Forestry | ||||
| Cubic metres | ||||
| 1994 | 140,516 | 96,953 | 175,786 | 553,670 |
| 1995 | 235,444 | 150,543 | 175,995 | 690,175 |
| 1996 | 259,928 | 160,481 | 159,082 | 632,019 |
| 1997 | 300,648 | 180,713 | 233,988 | 536,831 |
| 1998 | 292,171 | 189,447 | 196,395 | 613,345 |
| 1999 | 285,825 | 192,445 | 169,569 | 600,673 |
| 2000 | 378,282 | 239,947 | 188,054 | 744,879 |
| 2001 | 401,590 | 243,702 | 204,524 | 801,493 |
| 2002 | 460,619 | 263,332 | 198,347 | 821,994 |
| 2003 | 601,600 | 321,655 | 209,977 | 883,117 |
| 2004P | 628,747 | 345,102 | 230,378 | 873,112 |
The Scion-designed E-grader measures lumber on its edge, allowing a more accurate prediction of performance and compliance with structural standards.
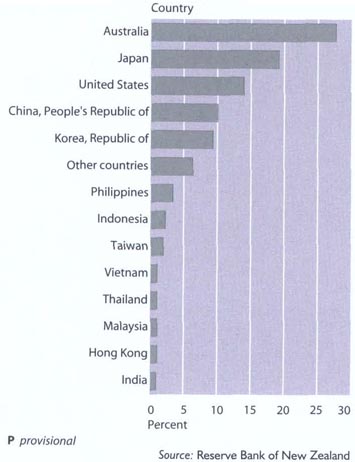
Exports. Forest product exports were provisionally valued at $3.184 billion in the year ending 30 June 2005, compared with $3.224 billion in 2004. Australia took 28 percent by value of exports, mainly in sawn timber, wood pulp, paper and paperboard, and panel products. Japan took 19 percent, mainly logs, panel products, pulp and paper, and paperboard.
Table 19.04 shows annual volumes of timber exports since 1994, while Figure 19.02 shows proportions of exports going to various countries.
Table 19.04. Timber exports By volume
Years ending 30 June
| year | Sawn timber | Logs and poles | ||||
|---|---|---|---|---|---|---|
| From natural forest | Radiata pine | Douglas fir | Other | Total | ||
Pprovisional Rrevised Source: Ministry of Agriculture and Forestry | ||||||
| Cubic metres (000) | ||||||
| 1994 | 2 | 852 | 32 | 35 | 921 | 4,315 |
| 1995 | 1 | 994 | 42 | 28 | 1,065 | 4,802 |
| 1996 | 1 | 897 | 31 | 19 | 948 | 5,460 |
| 1997 | 2 | 1,017 | 41 | 23 | 1,083 | 5,915 |
| 1998 | 1 | 1,105 | 16 | 30 | 1,152 | 4,657 |
| 1999 | 1 | 1,216 | 61 | 21 | 1,299 | 5,194 |
| 2000 | 1 | 1,400 | 26 | 55 | 1,482 | 6,179 |
| 2001 | 1 | 1,353 | 35 | 103 | 1,492 | 6,177 |
| 2002 | 1 | 1,595 | 32 | 96 | 1,724 | 7,604 |
| 2003 | 1 | 1,661R | 18 | 129 | 1,809R | 8,423R |
| 2004 | 1 | 1,556 | 32 | 99 | 1,689 | 6,298 |
| 2005P | 1 | 1,702 | 43 | 91 | 1,837 | 5,083 |
Imports. New Zealand's sawn timber imports are mainly tropical hardwoods, Australian hardwoods and North American softwoods. Imported sawn timbers generally have specialist applications, such as weatherboards with a natural finish, decorative furniture, panelling and boat-building.
Durable Australian hardwoods are imported for use as large poles, cross-arms and wharf, bridge and constructional timbers.
Oregon pine, redwood and western red cedar are imported from North America for structural uses, exterior joinery and weatherboards.
Speciality pulps, manufactured articles of paper and paperboard, together with paper and paperboard not produced in New Zealand, accounted for more than 70 percent of the value of total forest product imports in the year ending 30 June 2005.
Table 19.05 shows annual volumes of timber imported into New Zealand since 1994.
Table 19.05. Timber imports
By
volume
Years ending 30
June
| Year | Hardwoods | Softwoods | Total | Logs and poles |
|---|---|---|---|---|
Pprovisional Source: Ministry of Agriculture and Forestry | ||||
| Cubic metres (000) | ||||
| 1994 | 8 | 23 | 31 | 3 |
| 1995 | 10 | 23 | 33 | 2 |
| 1996 | 13 | 24 | 37 | 2 |
| 1997 | 10 | 21 | 31 | 3 |
| 1998 | 11 | 19 | 30 | 3 |
| 1999 | 12 | 15 | 27 | 4 |
| 2000 | 13 | 20 | 33 | 4 |
| 2001 | 14 | 15 | 29 | 6 |
| 2002 | 17 | 13 | 30 | 6 |
| 2003 | 17 | 17 | 34 | 5 |
| 2004 | 20 | 21 | 41 | 3 |
| 2005P | 22 | 30 | 52 | 3 |
Table 19.06 compares annual values of forest product imports and exports since 1994.
Table 19.06. Overseas trade in forest products
Years ending 30 June
| Year | Wood and wood products | Wood pulp | Paper and paper products | All forest products |
|---|---|---|---|---|
1Imports valued cif (costs including insurance and freight). 2Exports valued free on board at New Zealand ports, re-exports included. Pprovisional Rrevised Source: Ministry of Agriculture and Forestry | ||||
| Imports1 | $(000) | |||
| 1994 | 114,804 | 12,749 | 485,560 | 613,113 |
| 1995 | 136,641 | 14,070 | 565,298 | 716,009 |
| 1996 | 163,355 | 17,655 | 596,785 | 777,795 |
| 1997 | 181,578 | 11,855 | 636,531 | 829,964 |
| 1998 | 202,980 | 8,880 | 666,511 | 878,371 |
| 1999 | 217,648 | 18,710 | 738,154 | 974,512 |
| 2000 | 263,995 | 7,596 | 832,263 | 1,103,854 |
| 2001 | 272,003 | 10,491R | 909,663 | 1,192,157 |
| 2002 | 276,676R | 12,327R | 933,806 | 1,222,809 |
| 2003 | 308,889R | 6,654R | 924,097R | 1,239,640R |
| 2004 | 343,694 | 3,701 | 934,183 | 1,281,578 |
| 2005P | 385,500 | 3,707 | 941,763 | 1,330,970 |
| Exports2 | ||||
| 1994 | 1,738,412 | 326,977 | 403,666 | 2,469,055 |
| 1995 | 1,720,892 | 480,862 | 430,783 | 2,632,537 |
| 1996 | 1,605,232 | 456,788 | 523,437 | 2,585,457 |
| 1997 | 1,625,339 | 344,086 | 409,954 | 2,379,379 |
| 1998 | 1,501,981 | 351,850 | 489,971 | 2,343,802 |
| 1999 | 1,571,928 | 370,892 | 535,816 | 2,478,636 |
| 2000 | 2,104,442 | 609,798 | 631,579 | 3,345,819 |
| 2001 | 2,289,699 | 620,349 | 695,957 | 3,606,005 |
| 2002 | 2,491,276 | 518,188 | 685,278 | 3,694,742 |
| 2003 | 2,475,122R | 433,449R | 597,446R | 3,506,017 |
| 2004 | 2,155,889 | 476,515 | 591,607 | 3,224,011 |
| 2005P | 2,077,278 | 477,610 | 628,750 | 3,183,638 |
Table 19.07 compares annual volumes of pulp and paper imports and exports since 1994.
Table 19.07. Overseas trade in pulp and paper
By
volume
Years ending 30
June
| Year | Wood pulp | Newsprint | Other paper and paperboard1 |
|---|---|---|---|
1Products manufactured from paper and paperboard are excluded Pprovisional Rrevised Source: Ministry of Agriculture and Forestry | |||
| Imports | Tonnes | ||
| 1994 | 17,037 | 87 | 143,912 |
| 1995 | 14,324 | 65 | 174,981 |
| 1996 | 15,299 | 24 | 161,129 |
| 1997 | 18,690 | 1,987 | 226,047 |
| 1998 | 11,209 | 128 | 247,463 |
| 1999 | 21,662 | 105 | 302,973 |
| 2000 | 6,895 | 467 | 339,924 |
| 2001 | 8,654R | 105 | 311,400 |
| 2002 | 12,543 | 321 | 379,506 |
| 2003 | 6,501 | 4,296 | 421,618 |
| 2004 | 4,030 | 8,686 | 441,894 |
| 2005P | 3,399 | 10,437 | 480,369 |
| Exports | |||
| 1994 | 628,928 | 251,712 | 117,029 |
| 1995 | 665,274 | 232,418 | 116,516 |
| 1996 | 654,326 | 245,972 | 121,710 |
| 1997 | 667,682 | 250,910 | 121,914 |
| 1998 | 626,579 | 262,060 | 171,422 |
| 1999 | 622,636 | 246,386 | 201,648 |
| 2000 | 687,624 | 228,022 | 252,070 |
| 2001 | 728,501R | 216,494R | 244,744R |
| 2002 | 783,891 | 205,227 | 293,039 |
| 2003 | 708,298 | 213,374 | 254,433 |
| 2004 | 787,644 | 219,720 | 323,366 |
| 2005P | 857,203 | 291,573 | 350,800 |
Roundwood. In the year ending 31 March 2005, logs from planted production forests supplied 19.23 million cubic metres, or 99.9 percent, of total roundwood removals.
Approximately 390 sawmills, 11 veneer, seven plywood and six fibreboard mills were supported during the year. Roundwood production does not include firewood.
Table 19.08 shows quantities of roundwood removed from New Zealand forests since 1994.
Table 19.08. Roundwood removals from New Zealand forests
Years ending 31 March
| Year | Natural forest removals | Planted production forest removals | |||||
|---|---|---|---|---|---|---|---|
| Saw logs | Pulp logs | Export logs | Other1 | Total | Total removals | ||
1Includes peeler logs, small logs and export chips Rrevised Source: Ministry of Agriculture and Forestry | |||||||
| Cubic metres (000) | |||||||
| 1994 | 204 | 5,171 | 3,781 | 4,253 | 1,462 | 14,667 | 14,871 |
| 1995 | 205 | 5,310 | 4,060 | 4,762 | 1,846 | 15,978 | 16,183 |
| 1996 | 130 | 5,271 | 3,757 | 5,608 | 1,926 | 16,562 | 16,692 |
| 1997 | 110 | 5,459 | 3,142 | 5,469 | 1,894 | 15,964 | 16,074 |
| 1998 | 75 | 5,810 | 3,152 | 5,594 | 2,074 | 16,630 | 16,705 |
| 1999 | 125 | 5,865 | 2,971 | 4,803 | 2,050 | 15,689 | 15,814 |
| 2000 | 76 | 6,985 | 3,049 | 5,806 | 2,280 | 18,120 | 18,196 |
| 2001 | 55 | 7,221 | 3,566 | 5,917 | 2,528 | 19,232 | 19,287 |
| 2002R | 57 | 7,326 | 3,504 | 7,382 | 2,671 | 20,883 | 20,940 |
| 2003R | 38 | 8,349 | 3,288 | 8,087 | 2,689 | 22,413 | 22,451 |
| 2004 | 32 | 7,719 | 3,057 | 7,313 | 2,767 | 20,856 | 20,888 |
| 2005 | 27 | 8,041 | 3,286 | 5,123 | 2,784 | 19,234 | 19,261 |
Logs from planted production forests made up 99.9 percent of roundwood removals in 2005.
Sawn timber. Radiata pine accounts for about 95 percent of the total cut of exotic timber, Douglas fir for 4 percent and other conifers for most of the remainder. Less than 1 percent of New Zealand's sawn timber production comes from indigenous forests and this proportion has reached the point where only a small, sustained yield in native timber is possible for special purposes. Table 19.09 shows sawn timber production by species since 1998.
Table 19.09. Sawn timber production
By
species
Year ending 31
March
| Species | 1998 | 1999 | 2000 | 2001 | 2002 | 2003 | 2004 | 2005 |
|---|---|---|---|---|---|---|---|---|
- nil or zero Note:Figures may not add to stated totals due to rounding. Source: Ministry of Agriculture and Forestry | ||||||||
| Cubic metres (000) | ||||||||
| Natural forest | ||||||||
| Rimu and miro | 28 | 30 | 22 | 17 | 13 | 5 | 5 | 5 |
| Kauri | 2 | 1 | 1 | 1 | 1 | 1 | 1 | 1 |
| Tōtara | 1 | - | - | - | 1 | 1 | - | - |
| Kahikatea | - | - | 1 | - | - | 1 | - | - |
| Tawa | 1 | 1 | 1 | 1 | - | - | - | - |
| Beech | 5 | 4 | 6 | 8 | 13 | 10 | 8 | 7 |
| Other | 1 | 2 | - | 1 | 1 | 2 | 1 | - |
| Total natural forest species | 38 | 38 | 30 | 28 | 28 | 19 | 16 | 13 |
| Planted production forest | ||||||||
| Radiata pine | 2,995 | 2,996 | 3,583 | 3,625 | 3,678 | 4,214 | 3,980 | 4,193 |
| Douglas fir | 105 | 143 | 134 | 136 | 124 | 164 | 178 | 167 |
| Eucalypts | 2 | 3 | 4 | 3 | 3 | 3 | 4 | 3 |
| Other | 56 | 47 | 54 | 56 | 31 | 36 | 32 | 31 |
| Total planted production forest species | 3,157 | 3,188 | 3,776 | 3,820 | 3,836 | 4,417 | 4,194 | 4,394 |
| Total all species | 3,195 | 3,226 | 3,806 | 3,848 | 3,864 | 4,436 | 4,209 | 4,407 |
New Zealand's quarantine and inspection services provide a degree of insurance to primary industries by limiting movement of insects and disease into and out of the country.
Ministry of Agriculture and Forestry (MAF) officers inspect all arriving aircraft and vessels to ensure that passengers, crew, cargo, mail or the craft itself do not pose biosecurity risks. Ships assessed as having called at high-risk countries may be inspected for gypsy moth, a potentially devastating insect for New Zealand's forestry industry.
Where an importing country requires a phytosanitary certificate (to certify pest-free status) for exported New Zealand produce, MAF will inspect primary produce exports, such as fruit, logs and timber.
New Zealand's Exclusive Economic Zone (EEZ) is one of the largest in the world. At 1.3 million square nautical miles, it covers an area 15 times New Zealand's landmass.
In spite of the size of the zone, the waters are relatively deep and are not particularly rich in nutrients. Because of that, the average productivity of fishery resources tends to be low.
Less than one-third of New Zealand's EEZ is shallower than 1,000 metres, the area where most fish resources occur. Only one-twentieth of the EEZ is coastal water shallower than 200 metres.
There are more than 8,000 described marine species in New Zealand waters, about 100 of which are commercially significant. Species include shallow water shellfish, open water migratory pelagic fish, and deepwater species living more than a kilometre below the surface.
Fisheries range from numerous, but mostly small resources of subtropical species in the north, through moderate resources of many warm temperate species on the shelves around the main islands, to large resources of a few cool-water species on the extensive plateau to the south-east and east of the country.
The New Zealand Government has an important role in ensuring fisheries are not overfished while balancing the competing demands of various user groups.
Fisheries within New Zealand's Exclusive Economic Zone (EEZ) are a ‘common property’ resource and the government has an important role in ensuring their use is sustainable. In practice, this means ensuring the fisheries are not overfished, while balancing competing demands of various user groups.
Because most New Zealanders, at some time or other, use the fisheries as a source of food, for work or for relaxation, demands on the fisheries are steadily increasing. In less than 30 years, for example, the commercial fishing industry has expanded from a small, domestic industry to a $1.5 billion-a-year export business.
Main method used to manage fisheries is the Quota Management System (QMS), a system based on controlling levels of catch. Under this system, catch limits are set for each fish stock and rights to harvest fish for sale are acquired by purchasing or leasing quota.
Main goals of the QMS are to set sustainable catch limits and to improve economic efficiency in the fishing industry.
The QMS also provides security for participants in the fishing industry, enabling them to invest in harvesting and processing capacity.
The QMS applies throughout the New Zealand's EEZ for main commercial species. Catch limits, known as Total Allowable Catches (TACs) and Total Allowable Commercial Catches (TACCs), are reviewed annually. The review process involves consideration of latest fisheries research and stock assessments, and consultation with representatives from the commercial fishing industry, Māori, recreational fishing groups and environmental organisations.
Table 19.10 shows TACCs of fish and shellfish as at October 1 for the years 2004 and 2005.
Table 19.1. Total allowable commercial catch
At
1 October
| Species | 2004 | 2005 |
|---|---|---|
- not included in quota Source: Ministry of Fisheries | ||
| Tonnes | ||
| Arrow squid | 127,332 | 127,332 |
| Hoki | 100,010 | 100,010 |
| Jack mackerel | 60,547 | 60,547 |
| Southern blue whiting | 35,648 | 35,648 |
| Barracouta | 32,672 | 32,672 |
| Ling | 21,977 | 21,977 |
| Oreo | 21,143 | 21,143 |
| Red cod | 16,074 | 16,074 |
| Orange roughy | 15,921 | 15,921 |
| Dredge oyster | 15,455 units | 15,483 units |
| Hake | 12,367 | 13,211 |
| Spiny dogfish | 12,660 | 12,660 |
| Blue mackerel | 11,550 | 11,550 |
| Silver warehou | 10,380 | 10,380 |
| Mixed flats | 6,670 | 6,670 |
| Tarakihi | 6,391 | 6,391 |
| Snapper | 6,557 | 6,357 |
| Stargazer | 5,411 | 5,411 |
| Gurnard | 5,047 | 5,047 |
| Blue warehou | 4,512 | 4,512 |
| Trevally | 3,933 | 3,933 |
| Frostfish | 3,858 | 3,858 |
| Cardinalfish | 3,670 | 3,670 |
| School shark | 3,416 | 3,416 |
| White warehou | 3,374 | 3,374 |
| Bluenose | 3,233 | 3,233 |
| Cockle | 3,206 | 3,214 |
| Ghost shark | 2,943 | 2,943 |
| Alfonsino | 2,996 | 2,996 |
| Kahawai | 3,035 | 2,728 |
| Blue cod | 2,681 | 2,681 |
| Spiny rock lobster | 2,726 | 2,589 |
| Pilchard | 2,485 | 2,485 |
| Hapuku/bass/groper | 2,182 | 2,182 |
| Sea perch | 2,155 | 2,155 |
| Rough skate | 1,986 | 1,986 |
| Rig | 2,048 | 2,048 |
| Blue shark | 1,860 | 1,860 |
| Pale ghost shark | 1,780 | 1,780 |
| Green-lipped mussel | 1,720 | 1,720 |
| Leatherjacket | 1,431 | 1,431 |
| Scampi | 1,291 | 1,291 |
| Ribaldo | 1,282 | 1,282 |
| Elephant fish | 1,214 | 1,214 |
| Kina | 1,147 | 1,147 |
| John dory | 1,129 | 1,129 |
| Gemfish | 1,060 | 1,060 |
| Paua (Challenger) | 1,058 | 1,058 |
| Grey mullet | 1,006 | 1,006 |
| Ray's bream | 980 | 980 |
| Swordfish | 885 | 885 |
| Smooth skate | 849 | 849 |
| Scallop | 832 | 841 |
| Ruby fish | 786 | 786 |
| Lookdown dory | 783 | 783 |
| Paddle crab | 765 | 765 |
| Bigeye tuna | 714 | 714 |
| Blue moki (Southland) | 608 | 608 |
| Anchovy | 560 | 560 |
| Moonfish | 527 | 527 |
| Short-finned eel | 467 | 467 |
| Sprat | 450 | 450 |
| Freshwater eel | 420 | 420 |
| Giant spider crab | 419 | 419 |
| Southern bluefin tuna | 413 | 413 |
| Mako shark | 406 | 406 |
| Triangle shell | 406 | 406 |
| Queen scallop | 380 | 380 |
| Yellowfin tuna | 263 | 263 |
| Porbeagle shark | 215 | 215 |
| Pipi | 200 | 204 |
| Kingfish | 200 | 200 |
| Long-finned eel | 194 | 194 |
| Deepwater tuatua | 168 | 168 |
| Butterfish | 162 | 162 |
| Trough shell | 162 | 162 |
| Red snapper | 146 | 146 |
| Trumpeter (Auckland) | 144 | 144 |
| Pacific bluefin tuna | 116 | 116 |
| Ringed dosinia | 112 | 112 |
| Large trough shell | 98 | 98 |
| King crab | 90 | 90 |
| Parore | 84 | 84 |
| Porae | 71 | 71 |
| Yellow eyed mullet | 68 | 68 |
| Garfish | 50 | 50 |
| Red crab | 48 | 48 |
| Tuatua (Auckland) | - | 43 |
| Packhorse rock lobster | 40 | 40 |
| Sea cucumber | 35 | 35 |
| Horse mussel | 29 | 29 |
| Frilled venus shell | 16 | 16 |
| Silky dosinia | 8 | 8 |
The Fisheries Settlement Act 1992 provided a legislated settlement of fishing claims with two main impacts. First, the settlement addressed the right of Māori to a commercial stake in New Zealand's fishing industry and a role in its management. The second part of the settlement was less well known, but no less important. It addressed claims to a non-commercial, customary fishing right.
Kaimoana customary fishing regulations were developed by the Crown and Māori. They aim to provide effectively for customary non-commercial fishing, while ensuring sustainability of the resource.
The definition of customary food gathering in the regulations refers to traditional rights confirmed by the Treaty of Waitangi and the act. Regulations for the South Island were effective from April 1998 and in the North Island from February 1999.
The regulations cover non-commercial customary fishing only and do not remove the right of tangata whenua to catch recreational limits under amateur fishing regulations.
Those given permission to take fish under customary fishing regulations cannot trade the fish, exchange the fish for money, or accept any other form of payment.
The regulations do not provide for commercial fishing. In the North Island, fish taken in freshwater fisheries are not covered by the regulations, but they are in the South Island.
Establishment of mātaitai reserves is also covered by the regulations. These reserves provide a tool for tangata whenua to manage all non-commercial fishing in some of their traditional fishing grounds. Generally, there is no commercial fishing within mātaitai reserves.
The regulations apply only in an area where tangata whenua have appointed tangata kaitiaki/tiaki for North Island areas and tangata tiaki/kaitiaki for areas in the South Island.
Tangata kaitiaki/tiaki and tangata tiaki/kaitiaki are individuals or groups who can authorise customary fishing within their rohe moana, in accordance with tikanga Māori. Their appointments are notified by the tangata whenua of an area.
Tangata whenua is defined in the regulations as the whānau, hapū or iwi which holds manawhenua manamoana over a particular area.
To date more than 80 tangata tiaki/kaitiaki have been appointed in the South Island and 13 tangata kaitiaki/tiaki in the North Island.
The Māori Fisheries Act, passed in September 2004, provides for a method by which fisheries assets handed to Māori to settle Treaty of Waitangi commercial fishing claims can be returned to iwi.
The act put in place the model of allocation devised by the former Treaty of Waitangi Fisheries Commission Te Ohu Kai Moana through almost 12 years of discussion and consultation with iwi.
Te Ohu Kai Moana Trust (Te Ohu Kaimoana) was created under the act to hold the assets until allocation and transfer to iwi. The act also provided for creation of Aotearoa Fisheries Limited (AFL) as the commercial entity for those assets retained and managed centrally. The commercial fishing activities previously owned by the commission were transferred to AFL when the act took effect.
The model allocates to iwi inshore fishstocks, deepwater fishstocks, income shares in AFL and cash previously held by the commission.
Each iwi's share of the Māori fisheries settlement is calculated according to the length of coastline each iwi has within its rohe and the size of its population.
Under the act, iwi must meet certain structural and constitutional requirements before becoming eligible to receive assets. Once these requirements have been met, an iwi organisation is approved as a Mandated Iwi Organisation (MIO) and becomes entitled to receive assets.
Two other trusts also form part of the settlement model – Te Putea Whakatupu Trust, to promote educational advancement of Māori in the fishing industry and wider community, and Te Wai Māori Trust, to advance Māori interests in freshwater fisheries.
Te Ohu Kaimoana also provides an advisory and policy-making role on behalf of iwi for matters relating to marine and freshwater environments.
A role also handed to Te Ohu Kaimoana in 2005 was administration of the Maori Commercial Aquaculture Settlement Trust (Takutai Trust). The aquaculture settlement provided for iwi with a coastal rohe to receive up to 20 percent of new marine farming space approved, from September 1992.
Takutai Trust's role is to hold and distribute to iwi aquaculture organisations assets transferred to it in accordance with the aquaculture settlement.
Since passage of the Māori Fisheries Act, Te Ohu Kaimoana has facilitated the transfer of approximately $100 million worth of fisheries settlement assets to nine MIOs – Ngapuhi, Whaingaroa, Ngati Mutunga (Chatham Islands), Moriori (Chatham Islands), Ngati Rarua, Te Aitanga A Mahaki, Ngai Takoto, Te Atiawa ki Whakarongotai and Ngati Awa. The trust aimed to have all assets transferred by the first quarter of 2007.
Te Ohu Kaimoana website is www.teohu.maori.nz
New Zealanders and New Zealand companies have held control of New Zealand's fisheries resources since introduction of the quota management system.
At 30 September 2005, there were 1,413 domestic-registered commercial fishing vessels.
There were also 32 foreign-registered vessels working under charter to New Zealand companies.
This charter fleet participates in high-volume seasonal fisheries, such as southern blue whiting, jack mackerel and squid.
Table 19.11 lists numbers of registered commercial fishing vessels since 1992.
The seafood industry generated more than $1.2 billion in export receipts in the year ending 31 December 2004, a 5.2 percent increase on the 2003 year.
Shellfish (including squid) was a major contributor to the increase, with export receipts rising 40 percent, from $280 million to $393 million.
Shellfish exports have been taking an increasing share of total seafood exports, while finfish – although still the largest category of the export market – has been falling.
At $1.2 billion, the value of seafood exports in 2004 was down 20 percent on the $1.5 billion worth exported in 2002, largely due to a resurgent New Zealand dollar tracking close to US$0.70c throughout the year.
While export receipts rose 5.2 percent in 2004, the volume of seafood exported rose 12 percent, reflecting a lower dollar yield per tonne across all species ($3,760 a tonne, compared with $4,020 a tonne in 2003).
Squid experienced significant growth in export receipts during 2004, rising to become the second most valuable export species as a result of higher catches and strong market prices.
Hoki has been experiencing a downward trend following reductions in the Total Allowable Commercial Catch in 2003 and 2004.
Table 19.12 shows annual export quantities and values of main fish species exported since 1999.
Table 19.11. Registered commercial fishing vessels
At 30 September
| Year | Foreign licensed | Foreign chartered | Domestic |
|---|---|---|---|
- nil or zero Source: Ministry of Fisheries | |||
| 1992 | 44 | 79 | 2,802 |
| 1993 | 25 | 167 | 2,707 |
| 1994 | 32 | 63 | 2,569 |
| 1995 | 32 | 54 | 2,575 |
| 1996 | 22 | 55 | 2,458 |
| 1997 | 16 | 59 | 2,170 |
| 1998 | 17 | 52 | 1,965 |
| 1999 | 10 | 46 | 1,861 |
| 2000 | - | 37 | 1,752 |
| 2001 | - | 36 | 1,700 |
| 2002 | - | 37 | 1,674 |
| 2003 | - | 38 | 1,566 |
| 2004 | - | 35 | 1,509 |
| 2005 | - | 32 | 1,413 |
Table 19.12. Seafood exports1
By principal species
Years ending 31 December
| Species | 1999 | 2000 | 2001 | 2002 | 2003 | 2004 | ||||||
|---|---|---|---|---|---|---|---|---|---|---|---|---|
| Quantity | Value | Quantity | Value | Quantity | Value | Quantity | Value | Quantity | Value | Quantity | Value | |
1 Valued free on board at New Zealand ports. Source: New Zealand Seafood Industry Council | ||||||||||||
| Tonnes (000) | $ (million) | Tonnes (000) | $ (million) | Tonnes (000) | $ (million) | Tonnes (000) | $ (million) | Tonnes (000) | $ (million) | Tonnes (000) | $ (million) | |
| Hoki | 89.3 | 325.8 | 74.9 | 310.9 | 79.0 | 348.3 | 77.2 | 314.7 | 64.2 | 229.9 | 50.9 | 174.1 |
| Mussels | 29.3 | 116.9 | 28.1 | 169.2 | 20.9 | 157.5 | 28.8 | 185.4 | 27.9 | 133.2 | 30.2 | 141.4 |
| Rock lobster | 3.0 | 115.7 | 2.8 | 128.9 | 2.2 | 124.3 | 2.1 | 128.0 | 2.2 | 112.9 | 2.1 | 101.5 |
| Orange roughy | 6.8 | 103.6 | 5.3 | 85.3 | 4.1 | 74.1 | 8.2 | 127.2 | 5.8 | 78.5 | 6.9 | 89.8 |
| Squid | 23.3 | 41.2 | 13.5 | 41.9 | 21.0 | 61.2 | 41.4 | 86.2 | 35.9 | 68.5 | 69,7 | 171.7 |
| Ling | 8.9 | 60.9 | 9.4 | 78.5 | 7.6 | 74.1 | 7.9 | 65.7 | 9.0 | 51.7 | 8,9 | 47.4 |
| Abalone/paua | 1.0 | 55.8 | 0.9 | 75.8 | 0.8 | 67.7 | 0.8 | 63.0 | 0.7 | 54.5 | 0.7 | 52.3 |
| Salmon | 2.9 | 29.9 | 2.5 | 31.9 | 3.6 | 37.5 | 6.0 | 43.7 | 4.8 | 39.2 | 4,4 | 35.8 |
| Tunas | 9.0 | 32.4 | 15.3 | 43.9 | 7.8 | 46.5 | 8.5 | 42.4 | 10.2 | 32.2 | 15.0 | 35.8 |
| Hake | 7.7 | 40.3 | 6.1 | 39.2 | 5.9 | 34.7 | 6.4 | 35.8 | 6.0 | 32.3 | 8.4 | 44.8 |
| Snapper | 5.5 | 41.1 | 4.6 | 38.9 | 4.1 | 37.4 | 4.0 | 34.0 | 3.8 | 28.8 | 4.1 | 29.0 |
| Oreo dory | 6.6 | 28.1 | 5.2 | 28.6 | 4.4 | 29.5 | 5.1 | 27.8 | 4.2 | 20.5 | 4.5 | 21.8 |
| Scampi | 1.0 | 22.0 | 1.0 | 25.0 | 0.8 | 22.9 | 0.9 | 26.0 | 0.6 | 19.9 | 0.4 | 11.8 |
| Warehou | 7.7 | 28.6 | 8.2 | 34.3 | 7.1 | 33.7 | 5.5 | 23.3 | 7.1 | 22.3 | 8.6 | 21.2 |
| Jack mackerel | 23.2 | 20.0 | 11.4 | 9.8 | 13.7 | 17.4 | 19.6 | 19.6 | 20.2 | 18.6 | 25.2 | 22.3 |
| Barracouta | 10.5 | 13.2 | 9.3 | 12.4 | 10.0 | 12.2 | 9.9 | 10.9 | 11.1 | 10.7 | 10.7 | 10.7 |
| Blue mackerel | 4.5 | 4.1 | 5.6 | 5.3 | 6.5 | 6.7 | 8.2 | 8.5 | 9.6 | 9.3 | 8.1 | 8.4 |
| Southern blue whiting | 4.0 | 5.0 | 4.2 | 6.3 | 8.0 | 4.4 | 4.7 | 7.2 | 6.3 | 12.7 | 6.1 | 8.8 |
| Scallops | 0.5 | 13.0 | 0.4 | 10.4 | 0.5 | 14.7 | 0.3 | 5.9 | 0.2 | 5.9 | 0.1 | 2.5 |
| Gemfish | 0.5 | 5.2 | 0.4 | 6.5 | 0.2 | 4.5 | 0.2 | 2.5 | 0.2 | 2.6 | 0.5 | 3.0 |
Table 19.13 shows the value of seafood exports to main markets between 1999 and 2004.
Table 19.13. Seafood exports1
By destination
Years
ending 31 December
| Destination | 1999 | 2000 | 2001 | 2002 | 2003 | 2004 | ||||||
|---|---|---|---|---|---|---|---|---|---|---|---|---|
| Value | Proportion of total | Value | Proportion of total | Value | Proportion of total | Value | Proportion of total | Value | Proportion of total | Value | Proportion of total | |
1Valued free on board at New Zealand ports. Source: New Zealand Seafood Industry Council | ||||||||||||
| $(million) | Percent | $(million) | Percent | $(million) | Percent | $(million) | Percent | $(million) | Percent | $(million) | Percent | |
| United States | 270.7 | 20.3 | 258.3 | 18.1 | 236.3 | 15.8 | 315.7 | 20.6 | 211.8 | 17.5 | 208.3 | 16.3 |
| Japan | 288.6 | 21.6 | 318.7 | 22.2 | 303.8 | 20.3 | 265.4 | 17.3 | 186.5 | 15.4 | 167.1 | 13.1 |
| Australia | 155.8 | 11.7 | 167.4 | 11.7 | 195.6 | 13.1 | 200.9 | 13.1 | 197.5 | 16.3 | 195.4 | 15.3 |
| Other markets | 619.0 | 46.4 | 687.1 | 48.0 | 759.0 | 50.8 | 748.0 | 49.0 | 611.9 | 50.8 | 700.9 | 55.3 |
| Total | 1,334.1 | 100.0 | 1,431.5 | 100.0 | 1,494.7 | 100.0 | 1,530.0 | 100.0 | 1,207.7 | 100.0 | 1,271.7 | 100.0 |
Table 19.14 shows annual quantities and values for finfish, rock lobster, shellfish and other Crustacea exports in the years 1999–2004.
Table 19.14. Seafood exports
By volume and
value1
Years ending 31 December
| Commodity | 1999 | 2000 | 2001 | 2002 | 2003 | 2004 | ||||||
|---|---|---|---|---|---|---|---|---|---|---|---|---|
| Quantity | Value | Quantity | Value | Quantity | Value | Quantity | Value | Quantity | Value | Quantity | Value | |
1Valued free on board at New Zealand ports. Source: New Zealand Seafood Industry Council | ||||||||||||
| Tonnes (000) | $ (million) | Tonnes (000) | $ (million) | Tonnes (000) | $ (million) | Tonnes (000) | $ (million) | Tonnes (000) | $ (million) | Tonnes (000) | $ (million) | |
| Finfish (wetfish) | 261.50 | 954.20 | 229.60 | 958.80 | 223.20 | 1,017.40 | 242.20 | 1,005.90 | 228.60 | 785.40 | 229.30 | 751.80 |
| Rock lobster | 2.90 | 117.30 | 2.80 | 129.00 | 2.20 | 124.30 | 2.20 | 128.00 | 2.20 | 113.00 | 2.10 | 101.60 |
| Shellfish | 56.60 | 243.20 | 45.10 | 314.30 | 46.10 | 321.30 | 74.10 | 362.20 | 67.90 | 280.30 | 105.00 | 393.20 |
| Other Crustacea | 1.60 | 25.40 | 1.60 | 28.70 | 1.80 | 31.90 | 1.90 | 33.90 | 1.80 | 29.70 | 1.50 | 25.40 |
| Total | 322.60 | 1,340.10 | 279.10 | 1,430.80 | 273.30 | 1,494.90 | 320.40 | 1,530.00 | 300.50 | 1,208.40 | 337.90 | 1,272.00 |
19.1–19.2 Ministry of Agriculture and Forestry.
19.3 Ministry of Fisheries; Te Ohu Kai Moana Māori Fisheries Trust; New Zealand Seafood Industry Council.
19.4 New Zealand Seafood Industry Council.
Table of Contents
Solid Energy exported more than 2 million tonnes of coal in the 2005 financial year. Here a coal train from the West Coast heads for the port of Lyttelton.
New Zealand's energy sector faces major challenges in the years ahead. These include meeting the growth in demand for energy at a time when gas availability from the Maui field is coming to an end and when greenhouse gas emissions are an increasingly important consideration.
The Ministry of Economic Development's Energy Outlook projected in October 2003 that consumer energy demand would grow on average by 0.6 percent a year to 2025. Residential sector consumer energy demand is projected to grow on average at around 1.0 percent a year between 2000 and 2025, the industrial and commercial sector to decline by 0.1 percent and the transport sector to grow by around 1.3 percent a year.
During the same period, consumption is projected to grow on average each year by around 1.2 percent for electricity, 0.6 percent for coal and 1.3 percent for oil, while gas is projected to decline by an average of around 2.6 percent a year. The draw-down of the Maui field in the years to 2008–10 and likely closure of petrochemical plants will significantly affect gas consumption.
Around 3,400 megawatts of new electricity generating capacity is projected to be required by 2025 to meet increasing demand. The composition of electricity generation is changing significantly, with Huntly switching from predominantly gas to a predominantly coal-fired power station and with additional generation expected from a new gas combined cycle plant and from wind generation. Proportions of electricity generation from both the hydro system and from gas will decline in the years to 2025.
The government's National Energy Efficiency and Conservation Strategy (NEECS) sets a direction for better energy choices for New Zealand.
Released in 2001 and reviewed during 2005/06, the strategy details two high-level targets – improving energy efficiency by 20 percent by 2012 and increasing renewable energy production by 30 petajoules in the same period. The goals are for all of New Zealand – individuals, households, businesses and government.
The NEECS outlines economic, social and environmental benefits aimed at the goal of a sustainable energy future. These include a more productive and internationally-competitive economy, a cleaner environment, healthier and happier communities in warmer and drier homes, increased transport choices, industry development and more jobs, and less chance of energy supply disruptions and price shocks. NEECS initiatives target the government and the energy supply, industry, building, appliance and transport sectors. The government's Energy Efficiency and Conservation Authority oversees implementation of the strategy, which relies heavily on policy and resource commitments by the wider public and private sectors.
For example, transport energy efficiency measures support sustainable transport – a concept at the centre of the New Zealand Transport Strategy.
The Energy Efficiency and Conservation Authority website is www.eeca.govt.nz.
New Zealand consumed 516 petajoules of energy in the year ending 31 March 2005, an 11.5 percent increase since 2002. The industrial sector recorded the greatest increase in energy use over this period (16 percent), with growth in most other sectors between 9 and 11 percent. Agriculture and fishing was the only sector to record a drop in energy use, with fishing contributing the entire reduction.
The domestic transport sector is the largest energy-consuming sector, accounting for 41 percent of total consumer energy use. Its growth accounted for nearly 70 percent of total growth between 1996 and 2002. Transport energy use continues to be driven by a wide range of factors, including rapidly-increasing vehicle numbers, larger vehicles, vehicles with more features and increased demand for mobility and freight haulage.
The residential sector consumed 63 petajoules – 12 percent of national consumed energy. Residential energy use increased 11 percent from 2002 to 2005. In recent years, New Zealanders have increased their levels of indoor comfort and amenities in the form of space heating, water heating, electrical appliances and lighting.
The commercial sector consumed 50 petajoules – 10 percent of total national consumed energy. Between 2002 and 2005, commercial sector energy use increased by 9 percent.
How we measure up – energy supply Energy supply – Among OECD countries in 2002, New Zealand had the 11th-highest energy consumption per capita, as expressed in total primary energy supply in tonnes of oil equivalent (TOE) per capita. New Zealand's energy consumption of 4.53 TOE per capita was just below the OECD average of 4.67. Factors contributing to high consumption include a large manufacturing base, a cold climate, a high standard of living, and greater travelling distances due to a low population density. Electricity generation – New Zealand has the third-largest proportion of electricity produced using hydroelectric schemes. In 2002, 72 percent of its electricity came from this source. In addition, it also has the third-highest proportion of electricity generated using alternative methods, primarily geothermal. The two countries that use a higher proportion of alternative methods than New Zealand are Iceland (geothermal) and Denmark (wind farms). New Zealand has the sixth-lowest proportion of electricity generated using combustible fuels such as oil, coal and natural gas. It is one of 13 OECD members that does not operate nuclear power plants. Several of those 13 countries import electricity from countries that do have such plants.
Total primary energy
supply 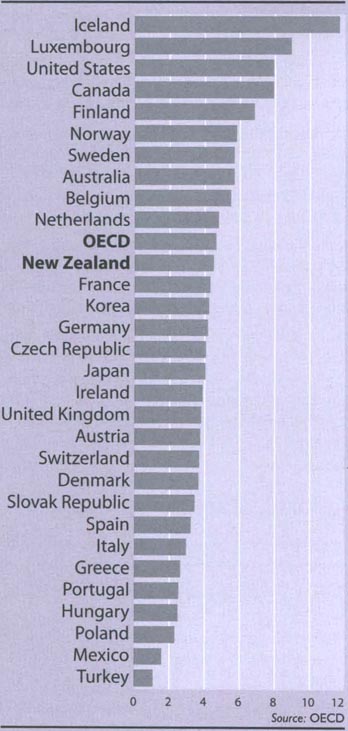 | |||||||||||||||||||||||||||||||||||||||||||||||||||||||||||||||||||||||||||||||||||||||||||||||||||||||||||||||||||||||||||||||||||||||||||||||||||||||||||||||||||||||||||||||
The industrial sector uses around 34 percent of consumer energy. A few large energy users dominate this sector, in particular the basic metals, food and paper products sub-sectors. Industrial sector energy grew by 16 percent to 173 petajoules between 2002 and 2005.
The agriculture and fishing sector includes dairy farming, other agriculture, hunting and fishing. In 2005, it consumed 18.5 petajoules – about 4 percent of the nation's energy. This sector has shown a drop in energy consumption since 2003, mainly as a result of a significant reduction in consumption by the fishing industry.
The following points should be considered when examining Table 20.01, which shows the balance between energy supply and demand:
Supply data is compiled from monthly returns. Figures for geothermal are estimated. Approximately 80 percent of geothermal is used as an input to electric power generation. The rest is used directly as a heat source. Liquefied petroleum gas production is included in indigenous oil production.
Total primary energy supply is the amount of energy available for use in New Zealand for energy conversion and end use.
Transformation of energy from one form to another always results in conversion losses, which are shown as negative entries in the table. Efficiencies for electricity generation are assumed to be 35 percent for coal plants, 50 percent for gas and 30 percent for co-generation. Hydro and wind are taken as being 100 percent efficient and geothermal as 15 percent.
Consumer energy (calculated) = total primary energy supply – total transformation – non-energy used (primary energy used for other purposes, e.g. bitumen for roads, and natural gas as feedstock to produce methanol and ammonia/urea).
Energy demand consumption (observed) data is estimated from information about where and how energy is used. Domestic transport refers to domestic road, rail and air transport. Observed values have been used in this commentary as they provide more detail of sectoral use.
Table 20.01. Energy supply and demand balance
Year ending 31 December 2004
| Supply/demand | Coal | Oil | Gas | Hydro | Geothermal | Other renewables | Electricity | Total |
|---|---|---|---|---|---|---|---|---|
- nil or zero Note: Figures may not add to stated totals due to rounding Source: Ministry of Economic Development | ||||||||
| Petajoules | ||||||||
| Supply | ||||||||
| Indigenous production | 132.0 | 51.7 | 160.6 | 97.3 | 84.9 | 55.1 | - | 581.6 |
| + Imports | 20.3 | 315.8 | - | - | - | - | - | 336.1 |
| - Exports | 60.0 | 37.0 | - | - | - | - | - | 97.0 |
| - Stock change | 6.6 | 0.1 | - | - | - | - | 6.7 | |
| - International transport | 48.4 | - | - | - | - | - | 48.4 | |
| Total primary energy supply | 92.3 | 275.5 | 160.5 | 97.3 | 84.9 | 55.1 | - | 765.6 |
| Transformation | ||||||||
| Electricity generation | -42.6 - | -39.8 | -97.3 | -63.7 | -2.4 | 142.6 | -103.2 | |
| Co-generation | -0.8 - | -20.6 | - | -0.6 | -23.0 | 10.8 | -34.2 | |
| Liquid fuels production | 0.7 | - | - | - | - | - | 0.7 | |
| Losses and own use | -2.0 -9.6 | -7.0 | - | -6.0 | - | -10.8 | -35.4 | |
| Total transformation | -45.4 | -8.9 | -67.4 | -97.3 | -70.3 | -25.4 | 142.6 | -172.1 |
| Non-energy use | -12.8 | -50.6 | - | - | - | - | -63.4 | |
| Consumer energy (calculated) | 46.9 | 253.7 | 42.5 | - | 14.6 | 29.8 | 142.6 | 530.1 |
| Demand | ||||||||
| Agriculture | 0.5 | 12.6 | - | - | - | - | 5.6 | 18.7 |
| Industrial | 31.8 | 16.9 | 26.8 | - | 12.3 | 27.0 | 57.2 | 172.0 |
| Commercial | 6.6 | 6.6 | 8.8 | - | - | 0.1 | 26.6 | 48.7 |
| Residential | 0.9 | 2.2 | 6.7 | - | 2.3 | 2.8 | 47.7 | 62.6 |
| Domestic transport | 0.1 | 210.3 | 0.2 | - | - | - | 2.1 | 212.7 |
| Consumer energy (observed) | 39.9 | 248.5 | 42.5 | - | 14.6 | 29.8 | 139.3 | 514.6 |
| Discrepancies | 7.0 | 5.2 | 0.0 | 0.0 | 0.0 | 3.3 | 15.5 | |
Steam billows from the geothermal power station at Wairakei, near Taupo.
The efficiency with which New Zealand produces and uses energy impacts directly on its international competitiveness, on its economic growth and on the quality of the environment.
New Zealand is self-sufficient in all energy forms apart from oil.
Some coal is imported for electricity generation, but this is balanced by coal exports being about 300 percent greater.
In 2004, New Zealand was 65 percent self-sufficient in its total primary energy needs and 18 percent self-sufficient in oil.
Total primary energy supply in petajoules, from 1980 to 2004, broken into various sources, is shown in Table 20.02.
Table 20.02. Primary energy supply
Years ending 31
December
| Year | Coal | Imported oil & oil products | Indigenous oil (net) | Gas | Hydro | Geothermal | Other renewables | Total | Imported oil as proportion of total |
|---|---|---|---|---|---|---|---|---|---|
| Source: Ministry of Economic Development | |||||||||
| Petajoules | Percent | ||||||||
| 1980 | 49.06 | 148.02 | 15.71 | 35.31 | 69.02 | 57.06 | 30.12 | 404.30 | 36.60 |
| 1985 | 45.57 | 115.36 | 31.38 | 140.56 | 70.24 | 78.93 | 31.07 | 513.11 | 22.50 |
| 1990 | 52.55 | 141.13 | 46.92 | 180.93 | 82.63 | 92.65 | 35.23 | 632.04 | 22.30 |
| 1995 | 48.80 | 189.40 | 31.22 | 179.16 | 98.13 | 93.30 | 36.38 | 676.39 | 28.00 |
| 2000 | 47.98 | 222.29 | 26.41 | 235.18 | 88.67 | 89.94 | 53.43 | 763.90 | 29.01 |
| 2001 | 48.11 | 232.86 | 19.46 | 247.07 | 81.41 | 114.97 | 48.72 | 792.60 | 29.38 |
| 2002 | 60.74 | 234.49 | 21.10 | 234.94 | 90.79 | 85.08 | 52.14 | 779.28 | 30.09 |
| 2003 | 78.30 | 256.60 | 14.88 | 179.27 | 85.28 | 82.67 | 52.18 | 749.18 | 34.25 |
| 2004 | 92.22 | 257.94 | 17.53 | 160.53 | 97.28 | 84.95 | 55.13 | 765.58 | 33.69 |
Environmental impacts. The Resource Management Act 1991 ensures that environmental costs are recognised in the energy production planning process and that local impacts are avoided, remedied or mitigated. Amendments in 2004 required that particular regard be paid to the efficiency of the end use of energy, the effects of climate change and the benefits to be derived from the use and development of renewable energy.
New Zealand is a signatory to the Kyoto Protocol under which emission levels of greenhouse gases during 2008–12 are required to be reduced to levels prevailing in 1990.
Greenhouse gas emissions. Gross CO2, emissions from energy sources and industrial processes were about 32 million tonnes in 2003, compared with about 27 million tonnes in 1998.
A feature of the New Zealand energy sector is the variability in emissions from thermal electricity generation. Emissions from this source declined by 5 percent between 2003 and 2004, making up 19 percent of CO2, emissions. The decline was largely attributable to a comparatively wet year, resulting in a rise in hydroelectricity generation and a fall in thermal generation.
Other greenhouse gases emitted from energy sources include nitrous oxide (N2O) and methane (CH4), although the agriculture sector is the main contributor to emissions of these gases.
Energy research and development. The Foundation for Research, Science and Technology is the main funding body for energy-related research and development, investing about $12 million a year.
Current work includes research on energy efficiency, regulatory issues, renewables from a range of resources, oil and gas prospectivity modelling and carbon sequestration.
Among specific areas identified for funding are those where New Zealand might be able to create long-term sustainable economic advantages for both import substitution and new exports; and the application of new technologies where New Zealand has research strengths, such as superconductors, some aspects of nanotechnology, hydrogen storage and long-life battery technologies.
Depending on demand, rainfall and lake storage conditions, about 71 percent of New Zealand's electricity demand is met by traditional renewable resources, with hydro contributing 65 percent in 2004 and geothermal 6 percent.
More than two-thirds of hydroelectricity is generated in the South Island, with all geothermal generation in the North Island.
Most of the balance of electricity demand in 2004 was met by generation from natural gas (16 percent), with a growing amount from coal (9 percent) and a small but increasing contribution from renewables such as wind, wood and landfill gas (2 percent).
Table 20.03 shows electricity generation in gigawatt hours by fuel type since 1992.
Table 20.03. Electricity generation
By fuel
type
Years ending 31 December
| Years | Hydro | Geothermal | Oil | Coal | Gas | Biogas | Steam2 | Wood | Wind | Total |
|---|---|---|---|---|---|---|---|---|---|---|
1Negative generation due to net import of electricity into the station to maintain station viability and system voltage stability. 2Steam in the form of waste process heat. -nil or zero Note: Figures may not add to stated totals due to rounding. Source: Ministry of Economic Development | ||||||||||
| Gigawatt hours | ||||||||||
| 1992 | 20,882 | 2,180 | 188 | 1,044 | 7,005 | 156 | 63 | 336 | 0.7 | 31,853 |
| 1993 | 23,258 | 2,284 | 59 | 563 | 6,542 | 156 | 63 | 336 | 1.0 | 33,262 |
| 1994 | 25,579 | 2,140 | 10 | 509 | 5,137 | 162 | 63 | 336 | 1.0 | 33,938 |
| 1995 | 27,259 | 2,049 | 47 | 687 | 4,539 | 202 | 63 | 336 | 1.0 | 35,153 |
| 1996 | 25,713 | 2,020 | 15 | 974 | 6,422 | 227 | 63 | 311 | 8.2 | 35,753 |
| 1997 | 23,594 | 2,130 | (14)1 | 1,279 | 8,074 | 139 | 335 | 312 | 13.5 | 35,863 |
| 1998 | 24,165 | 2,386 | (1.0)1 | 1,043 | 8,086 | 137 | 481 | 409 | 21.8 | 36,727 |
| 1999 | 23,221 | 2,637 | - | 1,183 | 8,294 | 114 | 570 | 438 | 38.8 | 36,497 |
| 2000 | 24,387 | 2,756 | - | 940 | 8,941 | 103 | 593 | 447 | 119.0 | 38,285 |
| 2001 | 22,391 | 2,678 | - | 1,279 | 10,882 | 101 | 607 | 361 | 138.0 | 38,437 |
| 2002 | 24,970 | 2,704 | - | 1,341 | 9,530 | 120 | 622 | 412 | 154.0 | 39,853 |
| 2003 | 23,464 | 2,612 | - | 3,108 | 9,597 | 132 | 458 | 362 | 146.0 | 39,879 |
| 2004 | 26,755 | 2,579 | 19 | 3,884 | 6,571 | 114 | 654 | 403 | 354.0 | 41,333 |
Transpower is owner and system operator of New Zealand's high voltage electricity transmission grid.
Generation. When considering plant with capacity of more than 10 megawatts, four electricity generators provided 91 percent of total generation capacity in the year ending 31 December 2004. Meridian provided 31 percent, Contact Energy 26 percent, Genesis 19 percent and Mighty River Power 15 percent. The remainder came mainly from on-site co-generation.
Transmission. Transpower is New Zealand's national grid company. A state-owned enterprise, Transpower is the owner and system operator of New Zealand's high voltage electricity transmission grid, linking generators to distribution companies and major industrial users.
Conveyance. New Zealand is fully reticulated through a national high voltage transmission network and local low voltage distribution networks largely operated by electric power companies. Power transmission between the North and South Islands is via a high voltage direct current link from the Benmore power station in the South Island to Haywards substation just north of Wellington. Part of this link is a submarine cable under Cook Strait, which allows surplus power generated in the South Island to be transmitted to the North Island, where demand is greatest, but also allows transmission from north to south.
Distribution. Line companies are largely owned by local communities, while electricity generation and retailing is largely controlled by three government-owned and two privately-owned integrated energy companies. The Energy Companies Act 1992 required corporatisation of electric power boards and municipal electricity departments of local authorities. The resultant mix of companies included municipal, consumer/community trusts and private owners. Subsequently, the Electricity Industry Reform Act 1998 required all distribution companies to separate ownership and control of line businesses from energy retailing and generation activities. Before this, line companies were rapidly emerging as major investors in new and renewable generation, accounting for two-thirds of load growth between 1996 and 1999. Distribution companies, along with government-owned transmission company Transpower, must meet price thresholds set by the Commerce Commission, which also regulates distribution quality standards. A separate regulator, the Electricity Commission, oversees aspects of distribution pricing and also approves new transmission investments and other transmission functions. There have been several reforms since 2001 aimed at attracting distributors back into generation investment involving renewable resources. However, few line companies are involved in generation today. Other recent distribution reforms have included a requirement to offer a volume-linked pricing option to households, in place of fixed line charges, and a low-cost system to enable domestic and small consumers of electricity to switch suppliers. Such switching has developed steadily, although the main cause of consumer migration has been the purchase of retailing businesses by major generator-retailers. Distributors are required to offer rural customers line charges that are comparable with urban ones, and must also maintain supply to connected customers.
Consumption. The industrial sector, which includes an aluminium smelter, iron and steel works, several pulp and paper mills and large dairy factories, is the largest electricity-using sector in New Zealand. The sector accounted for 45 percent of electricity consumption in the year ending 31 December 2004, followed by the household sector (34 percent) and commercial applications (21 percent).
Table 20.04 shows electricity consumption by sector.
Table 20.04. Electricity consumption
By
sector
Years ending 31 March
| Years | Residential | Commercial | Industrial | Total consumptions | ||||||
|---|---|---|---|---|---|---|---|---|---|---|
| Consumption | Number of consumers | Average price (excl. GST) | Consumption | Number of consumers | Average price (excl. GST) | Consumption | Number of consumers | Average price (excl. GST) | ||
Rrevised Note: Figures may not add to stated totals due to rounding Source: Ministry of Economic Development | ||||||||||
| GWh | (000) | cents/KWh | GWh | (000) | cents/KWh | GWh | (000) | cents/KWh | GWh | |
| 1992 | 10,474 | 1,326 | 8.87 | 5,550 | 148 | 11.54 | 12,584 | 125 | 5.80 | 28,609 |
| 1993 | 10,124 | 1,333 | 9.21 | 5,397 | 145 | 11.47 | 12,265 | 130 | 6.07 | 27,786 |
| 1994 | 10.256 | 1,343 | 9.70 | 5,580 | 146 | 11.04 | 13,392 | 132 | 5.99 | 29,228 |
| 1995 | 10,416 | 1,356 | 10.24 | 5,675 | 139 | 10.86 | 13,834 | 132 | 5.84 | 29,925 |
| 1996 | 10,584 | 1,371 | 10.73 | 5,595 | 141 | 11.12 | 14,342 | 131 | 6.33 | 30,522 |
| 1997 | 10.959 | 1,377 | 11.45 | 6,101 | 138 | 10.99 | 14,200 | 136 | 6.12 | 31,260 |
| 1998 | 10.824 | 1,418 | 12.08 | 7,173 | 137 | 9.98 | 13,937 | 125 | 7.01 | 31,934 |
| 1999 | 11,290 | 1,423 | 11.61 | 7,334 | 140 | 9.72 | 14,010 | 127 | 6.98 | 32,635 |
| 2000 | 11,057 | 1,444 | 11.87 | 6,919 | 138 | 10.11 | 14,759 | 112 | 5.94 | 32,735 |
| 2001R | 11,306 | 1,543 | 11.76 | 6,899 | 137 | 10.31 | 15,142 | 110 | 6.31 | 33,348 |
| 2002R | 11,660 | 1.501 | 12.86 | 6.964 | 129 | 10.16 | 14,525 | 102 | 6.71 | 33,150 |
| 2003 | 11.723 | 1.543 | 13.82 | 7,734 | 138 | 10.79 | 15,431 | 107 | 7.23 | 34,888 |
| 2004 | 12,255 | 1,567 | 14.84 | 7,389 | 138 | 12.01 | 16,151 | 106 | 8.1 | 35,795 |
The Electricity Commission is a Crown entity established under the Electricity Act 2003 to oversee New Zealand's electricity industry operations and markets. The commission is an independent regulatory body whose role is to oversee the governance, operations and development of New Zealand's wholesale and retail electricity markets. It was established after the industry was unable to reach agreement on self-governance arrangements in early 2003.
The commission's principal objectives are to promote and facilitate the efficient use of electricity and to ensure that electricity is produced and delivered to all classes of consumers in an efficient, fair, reliable and environmentally sustainable manner.
The commission is required to operate in a manner consistent with the government's policy statement on electricity governance to ensure the effective operation of electricity markets. The policy statement identifies four priority areas for the commission:
Managing security of supply and reserve generation.
Working with Transpower and other grid users to facilitate priority investment in the transmission grid.
Promoting efficient use of electricity.
Improving hedge market arrangements and demand-side participation.
Operation of electricity markets under the new regime began on 1 March 2004. The markets allow for a number of generators to compete to offer varying amounts of electricity via a pooled arrangement for dispatch and transmission through the national grid operated by Transpower. Buyers compete to buy electricity from the pool for on-sale to retail customers. As with other markets, interaction between supply and demand establishes price.
The Electricity Commission website is www.electricitycommission.govt.nz
Consumption of energy in New Zealand is dominated by oil liquids which accounted for 254 petajoules (48 percent) of total consumer energy in the year ending 31 December 2004.
Oil liquids (which include condensate, crude oil, naptha and liquid petroleum gas) also accounted for 275 petajoules (33.7 percent) of primary energy supplied to New Zealand markets.
Table 20.05 shows production figures for the year ending 31 December 2004 and reserves at 1 January 2005.
Table 20.05. Oil, condensate, naphtha and liquid petroleum gas
Production and reserves
| Field | Reserves | Production | ||
|---|---|---|---|---|
| At 1 January 2005 | 31 December 2004 | |||
| Source: Ministry of Economic Development | ||||
| Barrels (million) | Petajoules | Barrels (million) | Petajoules | |
| Kaimiro | 3.40 | 17.90 | 0.472 | 2.47 |
| Kapuni | 5.03 | 23.20 | 1.466 | 6.75 |
| Maui | 18.25 | 94.30 | 6.004 | 34.07 |
| McKee | 1.89 | 11.40 | 0.503 | 3.06 |
| Mangahewa | 0.19 | 1.30 | 0.101 | 0.64 |
| Tariki/Ahuroa | 1.13 | 6.60 | 0.352 | 2.05 |
| Waihapa/Ngaere | 0.25 | 1.70 | 0.050 | 0.32 |
| Rimu/Kauri | 9.44 | 55.20 | 0.384 | 2.26 |
| Others (onshore) | 10.26 | 60.90 | 0.013 | 0.06 |
| Total | 49.84 | 272.50 | 9.345 | 51.68 |
| Field | Estimated recoverable reserves |
|---|---|
| Barrels (million) | |
| Kupe | 16.30 |
| Pohokura | 42.80 |
| Tui | 26.80 |
| Maari | 49.00 |
| Total | 134.90 |
Mt Taranaki or Egmont forms the backdrop for an oil exploration rig near Hawera.
Reserves. Total remaining reserves of crude oil, condensate and liquid petroleum gas from New Zealand's producing fields at 1 January 2005 were 272.5 petajoules (49.8 million barrels) – 36.6 percent of this from the Maui field. Condensate is reservoir gas that at atmospheric pressure condenses into liquid form. It is typically refined into transport fuels and can be sold at a premium to conventional crude. Four offshore fields are at varying stages of development:
The condensate-rich Pohokura field, expected to achieve first production in late 2006, contains recoverable liquid reserves of 42.8 million barrels.
The Tui field, discovered in 2003, contains recoverable oil reserves of 26.8 million barrels. First production is expected in early 2007.
The Maari field, discovered in 1983, contains recoverable reserves of 49 million barrels.
The Kupe field, discovered in 1986, contains liquid reserves of 16.3 million barrels. First production is expected during 2007.
Production from these fields is expected to more than double New Zealand's production and contribute greatly to self-sufficiency in the short to medium term. The Kapuni, Rimu/Kauri and McKee fields dominate remaining current reserves.
Production. New Zealand's production of crude oil, condensate and naphtha was 42.5 petajoules (7.6 million barrels) in the year ending 31 December 2004, all from onshore and offshore fields in the Taranaki region.
About 68 percent of total production (5.1 million barrels) came from the offshore Maui field. About 52 percent of oil production is in the form of condensate, with 30 percent crude oil and 18 percent naphtha. Average daily production of crude oil and condensate during 2004 was about 20,890 barrels, the lowest level since 1984. About 83 percent of local production was exported, with the remainder used as domestic refinery feedstock.
Liquid petroleum gas (LPG) production totalled 9.2 petajoules (1.7 million barrels) in the year ending 31 December 2004. Production was dominated by the Maui field (51.5 percent), with substantial production from the onshore Kapuni field (33.8 percent) and the onshore Tariki/Ahuroa fields (12.1 percent). Average daily production of LPG during 2004 was 4,690 barrels. Total crude oil, condensate, naphtha and LPG production in the year ending 31 December 2004 was 51.7 petajoules (9.3 million barrels).
Imports. New Zealand imported crude oil in the year ending 31 March 2005 from Saudi Arabia, Oman. Australia, the United Arab Emirates, Malaysia, Brunei, Yemen, Malaysia and Indonesia. To meet demand, oil wholesalers also imported refined petroleum.
Exports. New Zealand exported about 83 percent of its crude oil and condensate production in the year ending 31 March 2005. In addition, about 1.5 percent of refined products were exported and 17.5 percent were used by international transport. Production and trade figures are shown in Table 20.06.
Table 20.06. Crude oil and condensate Production and trade
Years ending 31 December
| Year | New Zealand production | Imports | Refinery intake | Exports |
|---|---|---|---|---|
| Source: Ministry of Economic Development | ||||
| Gross petajoules | ||||
| 1989 | 79.17 | 137.88 | 188.46 | 27.56 |
| 1990 | 81.55 | 143.28 | 188.48 | 40.24 |
| 1991 | 85.28 | 143.84 | 182.52 | 44.88 |
| 1992 | 80.36 | 141.52 | 182.36 | 40.50 |
| 1993 | 84.70 | 158.38 | 192.28 | 47.58 |
| 1994 | 81.51 | 175.84 | 202.02 | 51.35 |
| 1995 | 68.33 | 169.37 | 196.28 | 44.11 |
| 1996 | 90.74 | 165.55 | 189.61 | 56.83 |
| 1997 | 120.56 | 168.30 | 212.29 | 77.70 |
| 1998 | 95.67 | 202.51 | 217.72 | 70.97 |
| 1999 | 84.36 | 198.77 | 212.72 | 63.45 |
| 2000 | 74.96 | 203.30 | 221.03 | 55.07 |
| 2001 | 70.02 | 191.46 | 208.93 | 56.43 |
| 2002 | 63.55 | 205.31 | 219.94 | 50.50 |
| 2003 | 49.20 | 217.66 | 220.10 | 41.85 |
| 2004 | 42.53 | 200.89 | 214.02 | 33.45 |
Self-sufficiency. New Zealand's primary self-sufficiency in oil depends on both local oil production and demand. Self-sufficiency increased dramatically during 1974 to 1986, from below 5 percent to more than 50 percent. In the 1990s, as demand grew faster than production, the figure declined to between 30 and 40 percent. With production also declining in a number of fields, self-sufficiency was down to 18 percent in the year ending 31 March 2005. Self-sufficiency is expected to return to the 50 percent range as a result of expected production from four offshore fields at varying stages of development.
Refinery. New Zealand's only oil refinery is at Marsden Point, near Whangarei. Main feedstocks are imported crude oil (about 99 percent), with local crude oil and condensate making up the rest. The refinery produces petrol, diesel, aviation kerosene, fuel oils and bitumen.
Distribution. A refinery-owned pipeline transports about a third of Marsden Point's refined production to Wiri (South Auckland) to supply the Auckland area. The rest of New Zealand is mostly supplied by coastal tankers supplying port depots, which, in turn, supply road tankers, which then distribute supplies to retailers. Imported refined production is shipped directly to coastal ports.
Retailing. Four major oil suppliers, BP, Caltex, Mobil and Shell, have been the dominant fuel retailers in New Zealand for many years. In 1998, Australian independent Gull began retailing operations. Another independent company, Challenge, was bought by Caltex in 2001.
End use. New Zealand's consumer energy is dominated by oil, comprising 254 petajoules of total consumer energy of 534 petajoules in the year ending 31 March 2005. Domestic transport dominates consumer energy use of petroleum products, with 85 percent of oil consumption being used for transport. Annual per capita end use of petroleum products is about 1,570 litres (10 barrels).
Unleaded petrol. Unleaded regular grade petrol, introduced into New Zealand in 1987, comprised about 82 percent of total unleaded petrol demand in the year ending 31 March 2005. Premium unleaded petrol made up the rest, with the sale of leaded petrol banned since 1 October 1996.
New Zealand's known gas resources are undergoing major changes, with the offshore Maui field, for so long a dominating presence on the local energy scene, now approaching economic depletion. At 1 January 2005, remaining reserves from the Maui field were 346 petajoules (319 billion cubic feet), 36.7 percent of the national total by volume.
Joint venture operators of the Maui field intended in 2006 to drill further production wells from the Maui A platform, originally commissioned in 1979.
Total remaining gas reserves from producing fields at 1 January 2005 were 853 petajoules (869.2 billion cubic feet).
The Pohokura gas-condensate field, discovered offshore near New Plymouth in 2000, is now the largest single reserve of gas, with an estimated 700 billion cubic feet of gas regarded as economically recoverable. Pohokura was scheduled to go into production during the third quarter of 2006.
The offshore Kupe field, containing a recoverable reserve of 309 petajoules (264 billion cubic feet), is also planned for development. First production from the field, off the south coast of Taranaki, is expected during the second half of 2007.
Onshore Taranaki gas fields such as Kapuni, TAWN (the collective name for Tariki, Ahuroa, Waihapa and Ngaere), McKee, Mangahewa and Rimu/Kauri will also play important roles in gas supply.
Exploration and production. Increased demand for natural gas, combined with declining supplies, has stimulated an increase in exploration to help fill the gap left by depletion of the Maui field. Activity has been further bolstered by strong oil prices, which have led many permit operators to revise their exploration programmes.
Thirty-three wells (not including wells for coal bed methane exploration) were drilled in the year ending 31 December 2004 to a total depth of 78,237 metres. This was a substantial increase on 2003 drilling activity, when 16 wells were drilled to a total depth of 35,201 metres.
During 2005, 34 wells were drilled to a combined depth of 88,155 metres. Increased drilling activity has been coupled with a large increase in seismic data acquisition, a precursor to drilling.
In the year ending 31 December 2004, $279.7 million was spent on activities in exploration permits. compared with $159 million in the previous year.
With development of multiple offshore fields and numerous exploration campaigns planned, rates of expenditure and activity are expected to rise in the short to medium term. Most planned exploration is for onshore and offshore Taranaki.
There has been increased permit interest in the Canterbury Basin and numerous permits have been granted for exploration of coal bed methane resources over Waikato and West Coast coal fields and Otago and Southland lignite fields. Substantial areas of offshore Northland. East Coast (North Island) and Western Taranaki have been offered as blocks for competitive bidding by exploration companies and future offerings are scheduled for the Great South Basin and onshore Taranaki.
Table 20.07 shows natural gas production figures for the year ending 31 December 2004 and reserves at 1 January 2005.
Table 20.07. Natural gas
Production and
reserves
| Reserves | Production | |||
|---|---|---|---|---|
| Field | At 1 January 2005 | Year ending 31 December 2004 | ||
1Excludes LPG. 2Net of gas re-injection which occurs only at Kapuni. Note: Figures may not add to stated totals due to rounding. Source: Ministry of Economic Development | ||||
| Cubic feet (billion) | Petajoules | Cubic feet (billion) | Petajoules | |
| Kamiro/Ngatoro | 8.40 | 8.00 | 0.69 | 0.51 |
| Kapuni1 | 339.51 | 258.00 | 33.04 | 25.132 |
| Maui1 | 319.13 | 346.00 | 90.85 | 106.29 |
| McKee | 66.42 | 77.00 | 7.04 | 8.18 |
| Mangahewa | 42.87 | 47.00 | 7.27 | 7.98 |
| Tariki/Ahuroa1 | 34.04 | 43.00 | 8.45 | 9.57 |
| Waihapa/Ngaere | 0.39 | 0.40 | 0.23 | 0.26 |
| Rimu/Kauri | 58.40 | 74.00 | 2.92 | 3.62 |
| Total | 869.16 | 853.40 | 150.48 | 162.00 |
| Field | Estimated recoverable reserves | |
|---|---|---|
| Cubic feet (billion) | Petajoules | |
| Kupe | 264.00 | 309.00 |
| Pohokura | 700.00 | 700.00+ |
| Total | 964.00 | 1,009.00+ |
End use. Around 41 percent of natural gas production was used for electricity generation, including co-generation, in the year ending 31 March 2005. The petrochemical industry used 29 percent of gas production, mainly for chemical methanol plants at Motunui and Waitara. The remaining 30 percent of gas production was reticulated to industry and domestic gas users. Annual per capita end use of gas was about 298 cubic metres in the year ending 31 March 2004, an increase of about 4.6 percent on the previous March year.
Petrochemicals. About 29 percent of New Zealand's natural gas production in the year ending 31 March 2005 was used to produce petrochemicals and chemical methanol at the Waitara and Motunui (Taranaki) methanol plants. Both plants were subsequently closed as a consequence of natural gas supply restraints.
Table 20.08 shows natural gas production and demand figures from 1992 to 2004.
Table 20.08. Gas production and demand
Years ending
31 December
| Year | Total natural gas production | Gas re-injected | LPG extracted | Flared | Production losses and own use | Net natural gas production | Direct sales (est) | Reticulated sales (est) |
|---|---|---|---|---|---|---|---|---|
| Source: Ministry of Economic Development | ||||||||
| Petajoules | ||||||||
| 1992 | 243.23 | 25.15 | 7.69 | 1.88 | 4.30 | 204.21 | 164.82 | 40.32 |
| 1993 | 237.70 | 24.79 | 7.98 | 1.57 | 4.41 | 198.95 | 158.87 | 39.65 |
| 1994 | 227.84 | 28.66 | 8.14 | 1.85 | 4.77 | 184.41 | 142.07 | 41.89 |
| 1995 | 207.67 | 19.41 | 7.61 | 1.24 | 4.72 | 174.68 | 132.03 | 42.18 |
| 1996 | 243.62 | 27.67 | 8.94 | 2.48 | 5.43 | 199.10 | 154.02 | 44.50 |
| 1997 | 253.43 | 20.48 | 9.78 | 3.97 | 5.76 | 213.43 | 161.23 | 51.65 |
| 1998 | 226.85 | 21.12 | 9.54 | 3.09 | 5.57 | 187.53 | 131.15 | 55.93 |
| 1999 | 253.47 | 17.74 | 10.02 | 1.94 | 5.56 | 218.21 | 156.94 | 60.64 |
| 2000 | 254.17 | 6.85 | 10.47 | 1.64 | 5.51 | 229.70 | 170.24 | 58.88 |
| 2001 | 265.25 | 3.59 | 11.54 | 2.59 | 5.83 | 241.70 | 177.53 | 63.11 |
| 2002 | 248.80 | 0.50 | 11.40 | 1.61 | 5.67 | 229.55 | 165.15 | 63.51 |
| 2003 | 189.66 | 0.01 | 9.10 | 1.08 | 5.76 | 173.72 | 106.87 | 65.85 |
| 2004 | 171.30 | 0.62 | 9.13 | 0.91 | 6.30 | 154.34 | 90.38 | 63.12 |
Coal extraction work underway at the Stockton open cast mine, Buller.
Resources. Coal is New Zealand's most abundant fossil fuel.
The main coalfields are in the Waikato (sub-bituminous) and Taranaki (sub-bituminous) regions of the North Island and in the West Coast (bituminous and sub-bituminous). Otago (sub-bituminous and lignite) and Southland (sub-bituminous and lignite) regions of the South Island.
The total in-ground resource for New Zealand is estimated at more than 15 billion tonnes. Of this, 8.6 billion tonnes is judged to be economically recoverable, made up of about 80 percent relatively low grade lignite, 15 percent middle grade sub-bituminous coal and the remaining 5 percent bituminous coal.
About 90 percent of the economically recoverable coal by weight, or 75 percent by energy content, is located in the South Island. Of economically recoverable resources, about one-third is in existing mines, while the remainder could be mined without significant investigatory work.
Production. National coal production increased by 43.7 percent between 2000 and 2003. A drop in production occurred in 2004, with output of 5.155 million tonnes, down from the 2003 record of 5.179 million tonnes. During 2004, national production of sub-bituminous coal dropped 246,463 tonnes. However, this was offset by increases in production of bituminous coal on the West Coast and sub-bituminous coal in Southland.
Export markets for premium grade New Zealand coal dropped slightly, to 2.0 million tonnes, in the year ending 31 March 2005. Most exports are of bituminous coal from Buller and Greymouth fields in the South Island.
A large operation is scheduled to commence production during 2007, mining bituminous coal from the Pike River coal field on the West Coast.
Table 20.09 shows coal production by region, type and mining method for the years 2002–04.
Table 20.09. Coal production By region, type and mining
method
Years ending 31
December
| Type | 2004 | Mining method | Total | ||||
|---|---|---|---|---|---|---|---|
| Bituminous | Sub-bituminous | Lignite | Total | Opencast | Underground | ||
- nil or zero Note: Figures may not add to stated totals due to rounding. Source: Crown Minerals | |||||||
| (Tonnes) | (Tonnes) | ||||||
| Waikato | - | 2,053,707 | - | 2,053,707 | 1,611,739 | 441,968 | 2,053,707 |
| West Coast | 2,526,613 | 100,175 | - | 2,626,788 | 2,359,212 | 267,576 | 2,626,788 |
| Canterbury | - | 3,722 | - | 3,722 | 3,722 | - | 3,722 |
| Otago | - | 57,051 | 1,853 | 58,904 | 58,904 | - | 58,904 |
| Southland | - | 174,698 | 237,576 | 412,274 | 394,988 | 17,286 | 412,274 |
| Total | 2,526,613 | 2,389,352 | 239,429 | 5,155,394 | 4,428,564 | 726,830 | 5,155,394 |
| Type | 2003 | Mining method | Total | ||||
|---|---|---|---|---|---|---|---|
| Bituminous | Sub-bituminous | Lignite | Total | Opencast | Underground | ||
| (Tonnes) | (Tonnes) | ||||||
| Waikato | - | 2,300,170 | - | 2,300,170 | 1,825,204 | 474,966 | 2,300,170 |
| West Coast | 2,351,021 | 101,786 | - | 2,452,807 | 2,188,142 | 264,665 | 2,452,807 |
| Canterbury | - | 984 | - | 984 | 984 | - | 984 |
| Otago | - | 45,666 | 2,788 | 48,454 | 48,454 | - | 48,454 |
| Southland | - | 127,949 | 249,548 | 377,497 | 304,302 | 73,195 | 377,497 |
| Total | 2,351,021 | 2,576,555 | 252,336 | 5,179,912 | 4,367,086 | 812,826 | 5,179,912 |
| Type | 2002 | Mining method | Total | ||||
|---|---|---|---|---|---|---|---|
| Bituminous | Sub-bituminous | Lignite | Total | Opencast | Underground | ||
| (Tonnes) | (Tonnes) | ||||||
| Waikato | - | 1,675,826 | - | 1,675,826 | 1,282,835 | 392,991 | 1,675,826 |
| West Coast | 2,268,906 | 115,039 | - | 2,383,945 | 2,003,503 | 380,442 | 2,383,945 |
| Canterbury | - | 155 | - | 155 | 155 | - | 155 |
| Otago | - | 47,040 | 2,170 | 49,210 | 49,210 | - | 49,210 |
| Southland | 133,734 | 216,069 | 349,803 | 218,255 | 131,548 | 349,803 | |
| Total | 2,268,906 | 1,971,794 | 218,239 | 4,458,939 | 3,553,958 | 904,981 | 4,458,939 |
Table 20.10 shows coal production and export figures for the years 1992 to 2004.
Table 20.1. Coal production and exports1
Years ending 31 December
| Year | Total production | Exports1 | Total production | Exports1 |
|---|---|---|---|---|
1Based on information obtained from Statistics New Zealand (INFOS database). Exports of coal include bituminous and lignite. Source: Ministry of Economic Development | ||||
| Gross petajoules | Tonnes (000) | |||
| 1992 | 73.40 | 24.15 | 2,948.50 | 769.70 |
| 1993 | 79.24 | 24.71 | 3,098.60 | 787.60 |
| 1994 | 76.48 | 32.74 | 2,997.60 | 1,043.60 |
| 1995 | 91.50 | 42.71 | 3,446.00 | 1,333.80 |
| 1996 | 96.21 | 50.90 | 3,610.60 | 1,589.50 |
| 1997 | 86.85 | 38.90 | 3,370.70 | 1,243.60 |
| 1998 | 84.85 | 34.18 | 3,319.20 | 1,092.80 |
| 1999 | 92.13 | 42.27 | 3,505.70 | 1,332.70 |
| 2000 | 95.60 | 48.48 | 3,585.60 | 1,528.50 |
| 2001 | 103.57 | 56.85 | 3,911.40 | 1,792.40 |
| 2002 | 119.32 | 61.27 | 4,458.90 | 1,931.70 |
| 2003 | 136.16 | 69.82 | 5,179.90 | 2,210.10 |
| 2004 | 132.01 | 59.98 | 4,946.50 | 1,908.40 |
End use. Proven indigenous coal resources and dwindling gas supplies mean coal is playing an increasingly important role in New Zealand's energy mix. Coal mines in the Waikato supply New Zealand Steel's Glenbrook mill, as well as the Huntly power station and several other major industrial users. Otago/Southland coals mainly supply local industrial and domestic markets, while most of the output from West Coast mines is exported. The main end use of coal in New Zealand for the year ending 31 March 2005 was for electricity generation (including co-generation), which took 51.6 percent of production. Other end users were the basic metals industry (20.6 percent), other industry (mainly cement, lime and plaster, meat, dairy products, forestry and timber products), which took 17.6 percent, commercial (6.2 percent), and others – mainly agriculture and residential – (4 percent).
Solid Energy New Zealand Ltd. State-owned enterprise Solid Energy New Zealand Ltd produced 4.46 million tonnes of coal in the year ending 30 June 2005 – more than 85 percent of New Zealand's total production. Nearly half (2.18 million tonnes, or 48.8 percent) of the coal produced by Solid Energy was exported. Solid Energy's website is www.solidenergy.co.nz
Renewables are a major part of New Zealand's total primary energy supply, contributing 237 petajoules in the year ending 31 December 2004. Hydro (97 petajoules) and geothermal (85 petajoules) production dominated.
Total biomass and waste (wood and wood products) provided 54 petajoules (35 petajoules from woody biomass and animal products, 17 petajoules from industrial waste and about 1.5 petajoules from biogas and landfill gas).
The use of wind for electricity generation is growing, with the 2004 figure of 1.3 petajoules an increase of 130 percent since 2002.
Table 20.11 shows renewable energy supply and consumption figures from 1995 to 2004.
Electricity generation. The major use of renewable energy resources in New Zealand is for electricity generation. In the year ending 31 March 2005, about 74 percent of New Zealand's electricity was generated from renewable resources, predominantly hydro (64 percent) and geothermal (6.4 percent), with the contribution from wind energy, while growing, still at a negligible level (1.1 percent).
Direct use. Apart from electricity, 9 percent (44 petajoules) of consumer energy is provided by the direct use of renewables. This is dominated by wood (29 petajoules a year). Direct geothermal use for heating contributes 15 petajoules and wastes and biogas provide 0.5 petajoules. Non-traditional renewable sources such as biomass, micro-hydro, wind and solar schemes make a small contribution to overall consumer energy supply.
Landfill gas. Landfill gas is used to produce energy at plants in Auckland, Wellington and Dunedin.
Table 20.11. Renewable energy supply and consumption
Years ending 31 December
| 1995 | 1996 | 1997 | 1998 | 1999 | 2000 | 2001 | 2002 | 2003 | 2004 | |
|---|---|---|---|---|---|---|---|---|---|---|
1Efficiency of geothermal plants for electricity generation was assumed to be 10 percent before 2000. From 2000, it is assumed to be 15 percent. .. figures not available Note: Figures may not add to stated totals due to rounding. Sources: Ministry of Economic Development Statistics New Zealand | ||||||||||
| Petajoules | ||||||||||
| Primary energy supply | ||||||||||
| Hydro | 98.130 | 92.570 | 84.940 | 86.990 | 83.600 | 87.790 | 81.420 | 90.790 | 85.280 | 97.280 |
| Geothermal1 | 93.300 | 91.870 | 95.950 | 105.490 | 115.240 | 85.970 | 87.240 | 85.080 | 82.670 | 84.950 |
| Other renewables | 0.004 | 0.030 | 0.048 | 0.079 | 0.140 | 0.428 | 0.500 | 0.721 0.722 | 1.488 | |
| Solar | .. | .. | .. | .. | .. | .. | .. | 0.160 | 0.190 | 0.200 |
| Wind | 0.004 | 0.030 | 0.048 | 0.079 | 0.140 | 0.428 | 0.500 | 0.561 | 0.532 | 1.288 |
| Biomass and wastes | 36.370 | 38.910 | 41.890 | 48.170 | 50.810 | 52.930 | 47.940 | 50.300 | 51.460 | 53.640 |
| Woody biomass and animal products | 32.370 | 32.090 | 31.710 | 34.530 | 35.210 | 35.880 | 31.460 | 32.190 | 32.710 | 35.000 |
| Biogas and landfill gas | 2.130 | 1.810 | 1.740 | 1.710 | 1.510 | 1.410 | 1.480 1.580 1.590 | 1.470 | ||
| Industrial waste | 1.870 | 5.010 | 8.440 | 11.930 | 14.090 | 15.650 | 15.010 | 16.520 | 17.170 | 17.170 |
| Total | 227.810 | 223.380 | 222.820 | 240.730 | 249.790 | 227.130 | 217.100 | 226.890 | 220.130 | 237.360 |
| Final consumption | Petajoules | |||||||||
| Geothermal | 13.530 | 13.170 | 13.260 | 13.610 | 14.310 | 13.830 | 13.120 | 13.300 | 13.480 | 14.640 |
| Solar | .. | .. | .. | .. | .. | .. | 0.160 | 0.190 | 0.200 | |
| Biomass and wastes | 27.960 | 28.070 | 27.670 | 29.100 | 29.450 | 29.560 | 25.770 | 27.050 | 27.990 | 29.590 |
| Woody biomass and animal products | 27.520 | 27.630 | 27.220 | 28.640 | 28.900 | 29.000 | 25.150 | 26.420 | 27.450 | 29.120 |
| Biogas and landfill gas | 0.060 | 0.060 | 0.070 | 0.070 | 0.140 | 0.150 | 0.180 | 0.190 | 0.170 | 0.110 |
| Industrial waste | 0.370 | 0.380 | 0.390 | 0.400 | 0.410 | 0.420 | 0.440 | 0.440 | 0.370 | 0.370 |
| Total | 41.490 | 41.240 | 40.930 | 42.720 | 43.760 | 43.390 | 38.890 | 40.520 | 41.660 | 44.430 |
New Zealand has one of the best wind resources of any country in the world and is consequently well suited to wind energy development, lying as it does across the prevailing westerly winds in an area long referred to by sailors as the ‘Roaring Forties'.
The country has an excellent wind resource because of its oceanic location and a fairly steady succession of troughs and depressions passing to the east. Each weather system induces a pressure pattern over mountains which can lead to almost continual winds in some parts of the country.
While wind energy developments began in New Zealand with a few tentative projects, installation rates are growing rapidly.
In 1993, a single Vestas 225-kilowatt unit was installed in the Wellington suburb of Brooklyn.
The Hau Nui wind farm, a 3.5-megawatt development in the Wairarapa, saw the installation of seven Enercon 500-kilowatt turbines in 1996. This wind farm was expanded in 2004 with an additional five turbines giving total installed capacity of 6 megawatts.
On the Tararua Ranges, near Palmerston North, a 32-megawatt farm was commissioned in 1999 with 48 Vestas 660-kilowatt turbines. A second stage involving 55 Vestas 660-kilowatt turbines was commissioned in 2004, bringing total capacity to 68 megawatts.
A 500-kilowatt Windflow turbine was installed in 2003 at Gebbies Pass, in the Canterbury region.
The Te Apiti wind farm near the Manawatu Gorge commenced supplying electricity in August 2004 from 55 NEG Micon (now Vestas following the merger of these two companies) 1.65-megawatt turbines with a total generating capacity of 91 megawatts.
This brought New Zealand's total installed capacity at 31 March 2005 to 166 megawatts – estimated to be enough power to meet the needs of about 75,000 households.
By contrast, Denmark, with a land area 16 percent of New Zealand's, has 5,500 turbines with an installed capacity of 3,100 megawatts and generates 20 percent of its total electricity needs from the wind. Germany, which has a land area 50 percent greater than New Zealand's, has around 17,000 turbines with a generation capacity of 15,000 megawatts.
Solar. Solar energy is potentially available throughout New Zealand, although amounts vary according to topography and regional, diurnal and seasonal variations. The amount of solar gain achieved from an installed system is determined by the collector area, by hot storage tank size, by the manner in which hot water is used and by the manner of controlling heat boosting by electricity or gas. Growth of solar water heating system installations in New Zealand in recent years has been consistently between 40 and 60 percent a year, with the main markets being residential and commercial buildings. Flat plate collector systems predominate, but glass tube collectors are also available. During 2004, 2,350 systems, with 8,400 metres square of collector area, were installed.
New Zealand has a wide variety of minerals, reflecting its diverse geology and dynamic tectonic history.
While it is best known for gold production (326,350 ounces in the year ending 31 December 2004), there is also production of silver, ironsand, coal, aggregate, limestone, clay, dolomite, pumice, salt, serpentine, zeolite and bentonite. In addition, there are resources, or potential for deposits, of titanium (ilmenite beachsands), platinum, sulphur, phosphate, silica and mercury.
Mineral legislation. The Crown owns all of New Zealand's petroleum, gold and silver, along with approximately half of in-ground coal, metallic and non-metallic minerals, industrial rocks and building stones. Permits to prospect, explore or mine Crown-owned minerals are issued under the Crown Minerals Act 1991. The relevant minerals programme and regulations are administered by Crown Minerals, a group within the Ministry of Economic Development. The government sees the development of petroleum and minerals resources as a significant contributor to national and regional economic development. A permit from Crown Minerals does not give land access, which is negotiated with each landowner and occupier. Environmental impacts are regulated under the Resource Management Act 1991, with resource consents granted by district or regional councils.
Gold. Gold is present in New Zealand in quartz veins, disseminated or finely dispersed through host rocks, and as alluvial gold in river gravels. The majority of gold production during 2004 came from two hardrock mines, Macraes mine, in east Otago, the largest mine in New Zealand, and the Martha mine, at Waihi, in the Coromandel area. Macraes mine produced more than 186,000 ounces in 2004, while the open pit Martha mine, which began operating in 1987, produced more than 129,000 ounces. Due to depleting gold reserves, the Martha mine is scheduled to cease operations in 2007.
An increased level of exploration for hard-rock gold has occurred in recent years, with permit interests and drilling activity occurring throughout the county. Three new projects are under development. In the Reefton area, the Globe Progress mine will be an open pit operation and the Blackwater mine will be underground, targeting the deep Birthday Reef, mined in the first half of the 20th century.
In Waihi, an underground resource at Favona, near the Martha mine, was due to start production during 2006.
Alluvial gold mining continues in the South Island, predominantly on the West Coast and in Otago. Extraction methods range from sole operator plants to medium and large floating or skid-mounted plants fed by hydraulic excavators.
Production from outside the two major gold mining operations in 2004 amounted to approximately 10,400 ounces.
Silver. Silver is almost always associated with gold in various proportions. Historically, the Coromandel area has produced most of the silver mined in New Zealand. Production in recent years has been mostly from the Martha mine, although production from the Macraes mine has increased sharply. In the year ending 31 December 2004, national silver production totalled 30,084 kilograms, a 154-kilogram increase on 2003 output. Although silver production from the Martha mine fell from 29,677 kilograms in 2003 to 28,642 kilograms in 2004, output from Macraes mine increased from 246 kilograms in 2003 to 1,425.8 kilograms in 2004.
Iron. New Zealand has a large resource of iron ore in the black sands of North Island west coast beaches, especially between Wanganui and Muriwai. Two deposits of titanomagnetite (ironsand) are being mined by Bluescope Steel Ltd. At Waikato North Head, mining has been carried out since 1969 using two bucket-wheel excavators which convey the ore to concentration plants. The titanomagnetite concentrate slurry is then pumped through an 18-kilometre pipeline to the Glenbrook steel mill, where it is reduced in a solid state process and smelted with scrap in an electrical arc furnace to produce a range of steel products. The operation at Taharoa, started in 1972, pumps titanomagnetite concentrate slurry to ships moored offshore for export to Japan, South Korea and China.
In the year ending 31 December 2004, production of ironsands totalled 2,329,417 tonnes, a 382,504 tonne (19.6 percent) increase on 2003 output of 1,946,913 tonnes. Production from the Waikato North Head operation remained high as a result of strong local demand for steel. Production from the Taharoa operation, exclusively for export, totalled 1,000,137 tonnes in 2004. This represented an increase of 348,331 tonnes (53.4 percent) on 2003 output of 651,806 tonnes.
Ilmenite. Ilmenite-bearing sands are present, at beach intervals, over 320 kilometres of the West Coast of the South Island. The largest known ilmenite resource is at Barrytown, where exploration has defined a 50 million-tonne resource. South of Westport, another indicated resource of between 17 and 30 million tonnes contains ilmenite. Ilmenite is a source of titanium dioxide, used as an opacifier and a pigment in paint, paper, plastics, cloth and rubber. Garnet is a major component of the sand and zircon a minor component.
Platinum group metals. A number of areas in the South Island, particularly in Southland, are being explored for platinum group metals. The Longwood Range, in western Southland, consists of a layered gabbro complex and is the only site in New Zealand where platinum has been produced, in association with alluvial gold.
Other metallic minerals. There are small deposits of manganese minerals in many localities. Some areas of Northland. Coromandel, Nelson and Westland have potential for base metals (copper, lead and zinc), but there is little prospecting. Iron ore, stibnite (antimony), orpiment (arsenic), chromite, monazite (rare earths), nickel and rutile have all been mined in the past. Cassiterite (tin) is known in Stewart Island. Bauxite is present in Northland, where reserves of 20 million tonnes have been identified. Cinnabar, the principal ore of mercury, was historically produced in limited quantities from sinter deposits in Northland.
In the year ending 31 December 2004, 44.42 million tonnes of non-metals (industrial minerals) were quarried in New Zealand, a 2.53 million tonne (6 percent) increase on 2003 output of 41.89 million tonnes.
Key increases were made in the production of limestone for marl and cement (up 186,620 tonnes or 11.3 percent on 2003 output); rock, sand and gravel for roading (up 1.2 million tonnes or 5.9 percent); rock, sand and gravel for building (up 2.1 million tonnes or 22.6 percent); rock, sand, gravel and clay for fill (up 245,460 tonnes or 6.5 percent); silica sand (up 11,680 tonnes or 24.1 percent); pumice (up 107,550 tonnes or 62.0 percent); decorative pebbles including scoria (up 13,060 tonnes or 14.6 percent); and perlite (up 600 tonnes or 12.0 percent).
Significant decreases were registered in the production of bentonite (down 890 tonnes or 8.1 percent); building and dimension stone (down 11,200 tonnes or 30.0 percent); dolomite for industry (down 9,920 tonnes or 45.3 percent); limestone for industry and roading (down 170,170 tonnes or 23.3 percent); limestone for agriculture (down 643,990 tonnes or 25.2 percent); sand for industry (down 454,050 tonnes or 20.6 percent): and serpentine (down 8,080 tonnes or 11.7 percent).
Aggregates. Aggregates are produced from a variety of rocks, gravels and sands and are used in road construction and in concrete manufacture. Suitable rocks for aggregate production are found throughout New Zealand.
Clays. Clays are found throughout New Zealand and include bentonite, halloysite and kaolinite. They are used in the manufacture of sanitary ware, ceramics, bricks, tiles, pipes and pottery; as fillers in the manufacture of paper, paint, pharmaceutical and animal health products; and as pelletising agents. White halloysite from Matauri Bay, in Northland, is exported for the manufacture of fine ceramics and porcelain. Bentonite, found in substantial quantities in Hawke's Bay and Canterbury, is used as a bonding agent and for specialist drilling products. Although bentonite is still being imported for drilling operations because long-established overseas sources are commonly preferred, New Zealand bentonite is being used increasingly.
Dolomite. Dolomite rock, used in agriculture, glassmaking and for harbour protection blocks, is produced near Collingwood.
Greenstone. Nephrite and bowenite, popularly known as greenstone or pounamu, are present in north Westland and northern Fiordland. A deposit of nephrite boulders in a tributary of the Arahura River has been the main source of greenstone. Best known occurrences of bowenite, the serpentine variety of greenstone, are in the Griffin range in Westland and in Fiordland. Boulders of greenstone are reduced in size using a portable diamond saw and airlifted by helicopter. Ownership of pounamu has been returned to Ngāi Tahu. the largest Māori iwi in the South Island, as part of its Treaty of Waitangi settlement.
Limestone. Limestone is found throughout New Zealand and is used in cement manufacture, roading, industry and agriculture. High quality limestone from Te Kuiti and Nelson is processed for export. Limestone is also used in New Zealand as a filler in the paint, glass, rubber, plastic and paper industries. Marble, a crystallised form of limestone, is mined in Nelson and is used as a filler and in building construction.
Salt. Salt is produced by the solar evaporation of sea water at Lake Grassmere, in Marlborough. Low rainfall, long hours of sunlight and the right wind conditions make this locality the most suitable in New Zealand for salt production. About 60,000 tonnes are produced each year for domestic consumption.
Serpentine. Serpentine is a magnesium-rich rock used as a fertiliser additive and in the manufacture of decorative tiles. Deposits are mined at Piopio, south of Hamilton, and at Greenhills, in Southland.
Silica sand. Northland and Canterbury have deposits of silica sand, mined for use in glass manufacture, foundry moulds and in the building industry.
Sulphur. Sulphur, used mainly in the production of agricultural fertiliser, is mined at Tikitere, near Rotorua.
Zeolite. Zeolite is mined at Ngakuru, in the central North Island near Rotorua. It is used in horticulture and as animal litter.
Other non-metallic minerals. The following non-metallic minerals, some of which have been mined in the past, are also present in New Zealand: diatomite (industrial filtration), barite (industrial uses, including glassmaking and fillers), asbestos (building material), feldspar (glassmaking, ceramics and enamels), magnesite (agriculture), mica (electronics), phosphate (fertiliser), talc (cosmetics) and wollastonite (paper, asbestos substitute, ceramics, adhesives and plastics).
20.1 Ministry of Economic Development; Energy Efficiency and Conservation Authority.
20.2 Ministry of Economic Development.
20.3 Ministry of Economic Development; Transpower New Zealand Ltd; Electricity Networks Association; Electricity Commission.
20.4–20.8 Ministry of Economic Development.
www.crownminerals.govt.nz – Crown Minerals. Ministry of Economic Development
www.eeca.govt.nz – Energy Efficiency and Conservation Authority
www.electricitycommission.govt.nz – Electricity Commission
www.med.govt.nz – Ministry of Economic Development
www.minerals.co.nz – New Zealand Minerals Industry Association
www.grd.com.au – GRD Macraes Ltd
www.marthamine.co.nz – Newmont Waihi Ltd
www.solidenergy.co.nz – Solid Energy New Zealand Ltd
www.transpower.co.nz – Transpower New Zealand Ltd
Table of Contents
Feltex's woollen spinning plant in Lower Hutt produces 2,820 tonnes of yarn a year.
New Zealand manufacturers have by necessity adapted to the removal of import licensing and tariffs in recent years. Now the future of manufacturing depends upon the sector's ability to innovate and service global markets.
To exceed in the new environment, manufacturers have to create and capitalise on their own initiatives and distinguish themselves from their competitors. Firms have to be innovative, enterprising and able to respond swiftly to market demands.
To achieve this, successful manufacturers encourage high levels of quality in both their operations and their management.
The need to remain ahead of the competition has resulted in increased emphasis on production and technology innovation.
Most Organisation for Economic Co-operation and Development countries have strong policies to increase levels of innovation as a way to remain competitive. The aim is to create new products and services, maximise the resulting economic returns and move into new products before they become ‘standardised’ or ‘commoditised.’ To achieve this successfully, the manufacturing sector needs to be aware of, and closely aligned to, market trends.
The business environment, having changed substantially, is now an element of a more robust and outwardly-focused economy, which provides manufacturers with a strong framework in which to create and capitalise on opportunities. The sector will, however, have to continue to respond to a constantly changing global environment.
The government, through New Zealand Trade and Enterprise (NZTE). provides a range of export development services and programmes to manufacturing firms.
Firms that produce low-volume, high-value niche export market goods have been targeted by NZTE, which works with them to develop manufacturing clusters, long-term growth strategies and access to export markets.
Targeted niche manufacturing areas have included engineering, marine manufacturing, plastics and electronics.
Table 21.01. Manufacturing sector performance
Years ending 31 March
| Year | Contribution to GDP1 | Change from previous year | GDP1 |
|---|---|---|---|
1Chain-volume series expressed in 1995/96 prices. Source: Statistics New Zealand | |||
| $(million) | Percent | $(million) | |
| 1999 | 15,519 | -3.8 | 97,833 |
| 2000 | 16,284 | 4.9 | 102,912 |
| 2001 | 16,701 | 2.5 | 105,062 |
| 2002 | 16,973 | 1.6 | 109,152 |
| 2003 | 18,120 | 6.7 | 114,265 |
| 2004 | 18,378 | 1.4 | 118,342 |
| 2005 | 18,667 | 1.5 | 122,816 |
Table 21.01 shows contributions to gross domestic product made by the manufacturing sector since 1999.
Approximately 95 percent of imports (by value) enter New Zealand free of duty and most dutiable imports face low tariffs of between 5 and 7 percent.
Following a tariff review in 2003 by the Ministry of Economic Development, the government decided on the gradual reduction of ad valorem tariffs from 1 July 2006 until 1 July 2009.
The highest ad valorem tariff rates of between 17 and 19 percent (those that apply to carpet, clothing, headgear, footwear and ambulances and motorhomes) will reduce gradually to 10 per cent by 1 July 2009. Ad valorem tariff rates on all other goods will reduce to 5 percent by July 2008.
Adoption of this programme of tariff reduction was reached after consideration of a wide range of issues raised by many business groups, firms, unions and individuals throughout New Zealand.
The government recognised there were further welfare gains to be had across the economy and within industries from further tariff reduction, and that firms needed to continue to move up the value chain to become more innovative and internationally competitive.
While previous tariff reductions had generated significant productivity and welfare gains, it was recognised they had also imposed significant adjustment pressures on industries, particularly the textile, footwear and clothing industries.
The government is working with this sector to assist adjustment to the lower tariff environment.
Bilateral and regional free trade agreements play an increasingly important role in international trade and are designed to liberalise trade between economies.
In its free trade agreement negotiations, New Zealand seeks the removal of tariffs on all goods on a reciprocal basis.
A Closer Economic Partnership Agreement with Thailand was negotiated in 2004 and implemented in 2005.
Negotiations for a Free Trade Agreement with Chile, Brunei and Singapore, known as the Trans Pacific-Strategic Economic Partnership, were concluded in 2005, and negotiations for further agreements with Malaysia, China and the Association of South-east Asian countries are continuing.
The Ministry of Economic Development works cooperatively with businesses, regions, local government, iwi and other state sector agencies to advise on, coordinate and align activities that stimulate economic development.
The government's Growth and Innovation Framework sets the specific economic objective of returning New Zealand's per capita income to the top half of Organisation for Economic Co-operation and Development rankings, and maintaining that standing.
The ministry has adopted as its major outcome working to ensure that New Zealand's business environment actively promotes and enables a higher rate of sustainable economic development.
The ministry leads the production and coordination of policy advice related to economic, regional and industry development. It also works with New Zealand Trade and Enterprise, designing and implementing programmes to deliver the government's economic development policies.
The ministry is also the government's primary advisor on operation and regulation of specific markets and industries, including energy and telecommunications.
The legal framework the ministry focuses on providing is one that will see New Zealand business flourish now and into the future. This framework means an economy where intellectual property can be protected, where consumers and investors have appropriate rights, and where markets can function effectively. The framework also allows New Zealand business to compete effectively in the international arena.
The Ministry of Economic Development website is www.med.govt.nz
New Zealand Trade and Industry (NZTE), a Crown entity governed under the Crown Entities Act 2004 and the New Zealand Trade and Enterprise Act 2003, was established as the government's national economic development agency on 1 July 2003, following integration of services previously provided by Trade New Zealand and Industry New Zealand.
Through its network of offices worldwide, NZTE aims to grow New Zealand's economy by boosting the capability of businesses and regions and facilitating their sustained and profitable participation in overseas markets.
NZTE expenditure for the year ending 30 June 2005 was $145.4 million, $20.4 million more than the previous year's expenditure.
NZTE's Business Development Programme aims to improve the management capabilities and performances of small to medium-sized enterprises (SMEs) in an increasingly competitive business environment.
The programme comprises a number of key elements:
Business Incubators – this facility is designed to assist businesses to become established and profitable during their start-up phase. The programme does this by providing shared premises, business advice and services, networking, mentoring, and a full time manager. The incubation period for an individual business is normally one to three years. NZTE's Incubator Awards provide financial support to approved New Zealand incubators. So far, $10.426 million has been awarded over five funding rounds since the awards were established.
Enterprise Training Programme – the objectives are to improve the management capability of owners and operators of SMEs, and to increase understanding of the value of expert external assistance in improving management capability and business growth. The programme involves workshops and follow-up coaching delivered by specialist training providers in 18 New Zealand regions.
Exporter Education Programme – the objective is to develop and implement a comprehensive range of relevant, affordable courses designed to stimulate and grow the capability, profitability and international competitiveness of New Zealand businesses. The programme does this by enhancing their ability to become successful exporters and to develop sustainable export earnings. Companies that have not exported can obtain exporter education from Enterprise Training Programme providers, while training for established exporters is available from a national provider.
Business Information Services – the objectives are to be a first point of contact for SME business assistance enquiries; to improve awareness of the availability and value of business assistance; and to increase the provision of information about public and private business assistance. The services are operated through specialist business information centres throughout New Zealand and via freephone 0800 42 49 46. Information is also available at www.biz.org.nz
Escalator Service – designed to fuel business growth by providing innovative SMEs and entrepreneurial New Zealanders with the skills and the assistance needed to access investment opportunities. Eligible participants needing capital to expand, diversify or commercialise a new concept can use the service to develop a greater understanding of funding business growth issues and learn when additional investment is needed and how to access it. Some may also gain assistance from specialist brokers to secure equity investment and/or strategic partnerships. The service offers online information and assistance; assessment of investment potential; investment-specific workshops; brokering expertise and assistance to raise up to $5 million. It also offers expertise in negotiating strategic partnerships, and coordination with appropriate agencies and advisors. The service's website is www.escalator.co.nz
Enterprise Development Grant – The Enterprise Development Grants programme aims to assist New Zealand businesses and entrepreneurs to gain additional skills and abilities to pursue their business development goals by building capability and supporting development initiatives.
The New Zealand Trade and Enterprise website is www.nzte.govt.nz
Tables 21.02 and 21.03 show regional employment numbers for the North and South Islands.
Table 21.02. North Island regional employment in manufacturing
By major types of industry, in employee
count1
| Industry type | Northland | Auckland | Waikato | Bay of Plenty | ||||
|---|---|---|---|---|---|---|---|---|
| Number employed | Proportion of total manufacturing | Number employed | Proportion of total manufacturing | Number employed | Proportion of total manufacturing | Number employed | Proportion of total manufacturing | |
1Employee count (EC) is a head count of all salary and wage earners, including working proprietors who also pay themselves a taxable salary or wage. Note:Figures may not add to totals due to rounding. Source: Statistics New Zealand | ||||||||
| Percent | Percent | Percent | Percent | |||||
| Food, beverage and tobacco manufacturing | 1,760 | 27.2 | 14,920 | 16.8 | 7,480 | 32.4 | 3,000 | 22.1 |
| Textile, clothing, footwear, leather manufacturing | 130 | 2.0 | 7,050 | 7.5 | 550 | 2.4 | 340 | 2.5 |
| Wood and paper product manufacturing | 1,450 | 22.4 | 5,190 | 5.8 | 4,390 | 19.0 | 3,980 | 29.3 |
| Printing, publishing and recorded media | 320 | 4.9 | 10,010 | 11.3 | 980 | 4.2 | 670 | 4.9 |
| Petrol, coal, chemical and associated product manufacturing | 500 | 7.7 | 10,550 | 11.9 | 1,470 | 6.4. | 960 | 7.1 |
| Non-metallic mineral product manufacture | 370 | 5.7 | 3,400 | 3.8 | 680 | 2.9 | 270 | 2.0 |
| Metal product manufacturing | 610 | 9.4 | 12,990 | 14.6 | 3,090 | 13.4 | 1,270 | 9.4 |
| Machinery and equipment manufacturing | 960 | 14.8 | 18,000 | 20.2 | 3,790 | 16.4 | 2,380 | 17.5 |
| Other manufacturing industries | 360 | 5.6 | 6,770 | 7.6 | 640 | 2,8 | 730 | 5.4 |
| Total employed in 2005 | 6,470 | 100.0 | 88,890 | 100.0 | 23,060 | 100.0 | 13,580 | 100.0 |
| Total employed in 2004 | 6,130 | 86,940 | 21,620 | 13,060 | ||||
| Gisborne | Hawke's Bay | Taranaki | Manawatu-Wanganui | Wellington | |||||
|---|---|---|---|---|---|---|---|---|---|
| Number employed | Proportion of total manufacturing | Number employed | Proportion of manufacturing | Number employed | Proportion of manufacturing | Number employed | Proportion of manufacturing | Number employed | Proportion of manufacturing |
| Percent | Percent | Percent | Percent | Percent | |||||
| 1,190 | 52.4 | 6,830 | 57.8 | 4.080 | 49.4 | 4,360 | 34.94 | 3,090 | 17.83 |
| 120 | 5.3 | 1,130 | 9.6 | 55 | 0.7 | 1,920 | 15.38 | 1,310 | 7.56 |
| 420 | 18.5 | 1,050 | 8.9 | 680 | 8.2 | 1,170 | 9.38 | 1,610 | 9.29 |
| 190 | 8.4 | 360 | 3.0 | 310 | 3.8 | 690 | 5.53 | 2.780 | 16.04 |
| 9 | 0.4 | 350 | 3.0 | 380 | 4.6 | 610 | 4.89 | 2,510 | 14.48 |
| 35 | 1.5 | 180 | 1.5 | 110 | 1.3 | 260 | 2.08 | 330 | 1.90 |
| 110 | 4.8 | 650 | 5.5 | 1.390 | 16.8 | 1,120 | 8.97 | 2.220 | 12.81 |
| 160 | 7.0 | 930 | 7.9 | 1,110 | 13.4 | 1,630 | 13.06 | 2.420 | 13.96 |
| 35 | 1.5 | 340 | 2.9 | 160 | 1.9 | 750 | 6.01 | 1,060 | 6.12 |
| 2,270 | 100.0 | 11,820 | 100.0 | 8,260 | 100.0 | 12,480 | 100.00 | 17,330 | 100.00 |
| 2,210 | 11,540 | 8,020 | 12,030 | 16,960 | |||||
Table 21.03. South Island regional employment in manufacturing
2005
By major types of industry, in employee
count1
| Industry type | Tasman | Nelson | Marlborough | |||
|---|---|---|---|---|---|---|
| Number employed | Proportion of total manufacturing | Number employed | Proportion of total manufacturing | Number employed | Proportion of total manufacturing | |
1Employee count (EC) is a head count of all salary and wage earners, including working proprietors who also pay themselves a taxable salary or wage. Note:Figures may not add to totals due to rounding. Source: Statistics New Zealand | ||||||
| Percent | Percent | Percent | ||||
| Food, beverage and tobacco manufacturing | 930 | 36.9 | 1,450 | 45.6 | 2,140 | 58.5 |
| Textile, clothing, footwear, leather manufacturing | 25 | 1.0 | 200 | 6.3 | 60 | 1.6 |
| Wood and paper product manufacturing | 940 | 37.3 | 330 | 10.4 | 260 | 7.1 |
| Printing, publishing and recorded media | 25 | 1.0 | 210 | 6.6 | 180 | 4.9 |
| Petrol, coal, chemical and associated product manufacturing | 80 | 3.2 | 140 | 4.4 | 85 | 2.3 |
| Non-metallic mineral product manufacturing | 130 | 5.2 | 18 | 0.6 | 40 | 1.1 |
| Metal product manufacturing | 150 | 6.0 | 240 | 7.5 | 240 | 6.6 |
| Machinery and equipment manufacturing | 170 | 6.7 | 460 | 14.5 | 510 | 13.9 |
| Other manufacturing industries | 60 | 2.4 | 140 | 4.4 | 150 | 4.1 |
| Total employed 2005 | 2,520 | 100.0 | 3,180 | 100.0 | 3,660 | 100.0 |
| Total employed 2004 | 2,520 | 3,240 | 3,680 | |||
| West Coast | Canterbury | Otago | Southland | ||||
|---|---|---|---|---|---|---|---|
| Number employed | Proportion of total manufacturing | Number employed | Proportion of total manufacturing | Number employed | Proportion of total manufacturing | Number employed | Proportion of total manufacturing |
| Percent | Percent | Percent | Percent | ||||
| 600 | 38.5 | 11,450 | 28.5 | 5,600 | 43.6 | 5,370 | 56.9 |
| 15 | 1.0 | 4,470 | 11.1 | 1,000 | 7.8 | 280 | 3.0 |
| 290 | 18.6 | 2,620 | 6.5 | 1,100 | 8.6 | 820 | 8.7 |
| 150 | 9.6 | 2,690 | 6.7 | 1,580 | 12.3 | 320 | 3.4 |
| 15 | 1.0 | 3,490 | 8.7 | 290 | 2.3 | 85 | 0.9 |
| 200 | 12.8 | 1,200 | 3.0 | 330 | 2.6 | 180 | 1.9 |
| 35 | 2.2 | 3,410 | 8.5 | 870 | 6.8 | 1,580 | 16.7 |
| 150 | 9.6 | 8,560 | 21.3 | 1,800 | 14.0 | 690 | 7.3 |
| 85 | 5.4 | 2,370 | 5.9 | 280 | 2.2 | 100 | 1.1 |
| 1,560 | 100.0 | 40,240 | 100.0 | 12,850 | 100.0 | 9,440 | 100.0 |
| 1,560 | 39,060 | 12,870 | 9,510 | ||||
Following is a brief description of some of the major secondary industries in New Zealand.
Food. The New Zealand food manufacturing industry produces a diverse range of high-quality products for both the domestic and export market.
The industry is advantaged by its natural environment being highly conducive to pastoral agriculture, its disease-free status, the potential for year-round production and its international reputation.
The industry had a wholesale turnover of more than $10 billion in 2005, representing $15 billion in retail sales. Exports totalled $3.5 billion and imports $2.4 billion.
These figures made it slightly larger than the electricity, gas and water sector and slightly smaller than the health sector.
The food manufacturing industry employs more than 35,000 people directly and 150,000 people in the wider sector (including retailing).
Textiles. The New Zealand textiles industry, which consists of four interrelated sectors (textiles, carpet, footwear and apparel) is a significant contributor to the New Zealand economy. The industry employs about 16,000 people in more than 1,750 businesses, many of them small to medium sized. In 2005, the industry had total operating income of around $1.5 billion, including approximately $500 million in exports. Australia was the largest export market by value, accounting for $364.6 million, followed by the United States ($52.3 million), Hong Kong ($14.4 million), the United Kingdom ($14.0 million) and Fiji ($8.2 million). Of the four sectors, textiles was the industry's largest exporter ($192.3 million), followed by apparel ($151.1 million), carpet ($110 million) and footwear ($46.5 million). The industry offers a wide product range and has a major share of world trade in areas such as wool tufted carpet. The industry has developed a reputation for the production and export of high quality wool-based merchandise where it has been able to leverage New Zealand's status as the world's second largest producer of wool and provider of wool services. More recently, the industry has seen a significant shift away from low-value mass categories to high-value niches that rely on competencies in design, branding, market development, improved product and business processes and service offerings. The industry faces many challenges in the next decade as it adjusts to transformations taking place in the world textile industry, such as the end to global trade quotas, China's accession to the World Trade Organisation, free trade agreements and other industry trends. Additionally, it has had to adapt to significant downscaling of domestic infrastructure. To remain competitive, the textiles industry will need to make significant reinvestment in more competitive areas of the industry to maintain and build competitive advantage. Its success will be based on establishing excellence in research and development, technology, business processes and marketing. These challenges are highlighted by the experiences of the footwear sector, which has seen a dramatic drop in production in recent years, to approximately 1.4 million pairs, of which about 1 million pairs are exported. Its share of the domestic market has dropped to around 2 percent, with 19 million pairs of footwear imported each year, 84 percent from the People's Republic of China.
Plastics. The New Zealand plastics industry, excluding composites, has an annual turnover of more than $2 billion and employs around 8,000 people in more than 400 enterprises. The industry is highly productive, with revenue of $250,000 per employee. Approximately half of production is used in the packaging industry and it is therefore a significant enabling industry for New Zealand's agriculture, horticulture and aquaculture sectors. Other significant end users of plastics include home appliance manufacturers, the information technology industry and the building and construction sector. More than 50 percent of production is exported, either directly or indirectly, and the industry has an annual wages and salary bill of about $400 million. More than $60 million is invested each year in research and development. Annual growth in the industry has exceeded 7 percent in recent years. Challenges for the industry in the years ahead include adjusting to international free trade agreements. development of China and India as manufacturing nations and customer demand for shorter lead times to market and quicker replacement of stock as product life cycles get shorter and shorter.
More than 1,300 companies are involved in New Zealand's boatbuilding and marine supply sector, offering employment to about 10,000 people.
Marine. Turnover of the recreational boating sector in the year ending 31 March 2005 exceeded $1.545 billion, of which $535 million was exported. More than 1,300 companies are engaged in boatbuilding and supplying marine goods and services. They employ approximately 9,000–10,000 full-time equivalent people. Traditionally, the marine industry's export successes have been built on excellence in grand prix race yacht and superyacht design and construction, backed up with sporting success in high profile international yachting regattas from the Olympics to the America's Cup. Today's success is based on quality and flexibility. The New Zealand marine industry ‘brand’ is a strong international marketing tool, synonymous with achievement, flexibility and technologically-advanced and innovative production processes.
However, there is still room to grow. New Zealand's marine industry represents just 1.4 percent of global production and the intention is to increase export sales to $624.4 million in the 2007 year, $789.9 million in the 2010 year and $1.184 billion by 2015.
Figure 21.01 shows the proportion of people employed in the various manufacturing industries.
Statistics New Zealand's Quarterly Economic Survey of Manufacturing (QMS) gives a representative survey estimate of economic activity for 17 groups within the manufacturing sector.
The QMS consists of a postal sample of approximately 1,400 firms and a tax strata of approximately 16,000 firms. These vary slightly each quarter.
The survey asks for operating income, purchases and operating expenditure, salaries and wages, closing stocks of material and finished goods, and additions to and disposals of fixed assets.
Tables 21.04 and 21.05 (overleaf) present the data for recent years.
Table 21.04. Manufacturing sector
Years ending 31
March
| Operating income | Purchases and operating expenditure | Salaries and wages | Stocks of raw materials for use in production | Finished goods, work in progress and trading stocks | Additions to fixed assets | Disposals of fixed assets | |
|---|---|---|---|---|---|---|---|
- nil or zero Source: Statistics New Zealand | |||||||
| S(million) | |||||||
| 1998 | 52,678 | 38,376 | 8,547 | 2,447 | 4,034 | 2,975 | - |
| 1999 | 50,896 | 37,043 | 8,356 | 2,259 | 3,897 | 2,242 | - |
| 2000 | 54,147 | 39,103 | 8,583 | 2,350 | 4,126 | 2,314 | - |
| 2001 | 60,537 | 43,698 | 8,797 | 2,636 | 4,585 | 1,950 | - |
| 2002 | 63,396 | 47,163 | 8,961 | 2,618 | 4,945 | 2,806 | 337 |
| 2003 | 65,146 | 47,753 | 9,538 | 2,595 | 6,954 | 2,393 | 327 |
| 2004 | 66,311 | 48,311 | 10,300 | 2,592 | 6,996 | 2,698 | 380 |
| 2005 | 69,643 | 51,426 | 10,844 | 2,980 | 7,352 | 2,685 | 450 |
Figure 21.01. Employment in manufacturing1
By industry type
Year ending 31 December 2005
1Measures full-time equivalent persons engaged (FTE), that
is, the sum of the full-time employees and working proprietors,
plus half the part-time employees and working
proprietors.
Source: Statistics New Zealand
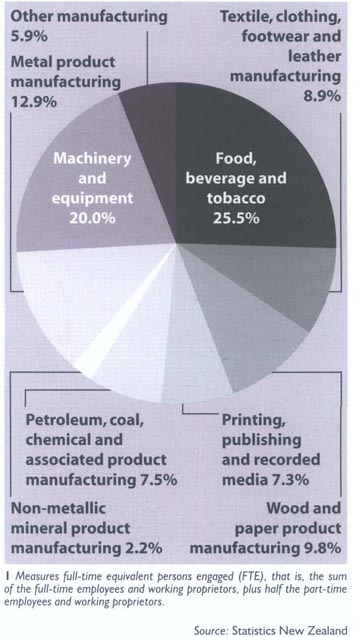
The machinery and equipment sector is one of the manufacturing industry's biggest employers, with a wages and salaries bill of $1.36 billion in the year ending 31 March 2005.
Table 21.05. Manufacturing sector contributors
By industry group
Year ending 31 March 2005
| Industry group | Operating income | Purchases and operating expenditure | Salaries and wages | Stocks of raw materials for use in production | Finished goods, work in progress and trading stocks | Additions to fixed assets | Disposals of fixed assets |
|---|---|---|---|---|---|---|---|
Cconfidential. Source: Statistics New Zealand | |||||||
| S(million) | |||||||
| Dairy and meat products | 17,338 | 15,186 | 1,690 | 425 | 2,931 | C | C |
| Other food | 6,760 | 4,917 | 940 | 259 | 750 | 207 | 28 |
| Beverage, malt and tobacco | 3,123 | 2,115 | 330 | 189 | 462 | 220 | 27 |
| Textile and apparel | 2,861 | 1,925 | 628 | 200 | 342 | C | C |
| Wood products | 4,514 | 3,378 | 754 | 132 | 438 | C | C |
| Paper and paper products | 2,759 | 2,013 | 427 | 107 | 245 | C | C |
| Printing, publishing and recorded media | 3,710 | 2,201 | 879 | 89 | 95 | 115 | 38 |
| Petroleum and industrial chemical | 3,314 | 2,545 | 293 | 215 | 222 | C | C |
| Rubber, plastic and other chemical products | 4,567 | 3,074 | 841 | 254 | 565 | 197 | 59 |
| Non-metallic mineral products | 2,432 | 1,615 | 349 | 50 | 139 | C | C |
| Basic metal | 2,410 | 1,709 | 353 | 128 | 167 | 56 | 5 |
| Structural, sheet and fabricated metal products | 4,734 | 3,158 | 916 | 244 | 246 | 121 | 22 |
| Transport equipment manufacturing | 2,352 | 1,572 | 635 | 207 | 131 | C | C |
| Machinery and equipment | 6,681 | 4,651 | 1,351 | 356 | 497 | 199 | 19 |
| Furniture and other manufacturing | 2,091 | 1,365 | 461 | 123 | 124 | 64 | 5 |
| 21.1 | Ministry of Economic Development; Statistics New Zealand; New Zealand Trade and Enterprise; Business New Zealand. |
Table of Contents
New dwelling authorisations to the value of $5.9 billion were issued throughout New Zealand in the year ending 31 March 2005.
As a physical centre within the environment, a house provides shelter and security for both the family and the individual. A home can fulfil social requirements as well as physical needs, allowing individuals the opportunity to express aspirations and tastes.
Housing is a central part of the domestic economy, since it is a major source of investment for many New Zealanders and provides employment and livelihood for a variety of trades.
Home ownership is seen as a form of investment saving, an expression of independence and a mechanism for achieving security and self-determination. While still the predominant form of tenure, the level of home ownership in New Zealand is experiencing a downward trend. The 2001 Census of Population and Dwellings recorded 1,359,843 occupied private dwellings and 8,364 non-private dwellings. There were 1,344,267 households in occupied private dwellings, and 868,656 of these owned their dwellings, with or without a mortgage.
This level of home ownership was 2.9 percentage points lower than in 1996, down from 70.7 percent to 67.8 percent. The number of households renting their dwellings increased from 290,124 at the 1996 Census to 358,890 in 2001, an increase of 23.7 percent.
The 2001 Census also revealed that the average number of usual residents per household had dropped, from 2.8 in 1996 to 2.7.
Table 22.01. Property prices
Years ending 31
December
| Average sale price | 1997 | 1998 | 1999 | 2000 | 2001 | 2002 | 2003 | 2004 |
|---|---|---|---|---|---|---|---|---|
Note:From 1999 onwards, sales have been collated by sale dale. Prior to that, sales were collated by the date the sale notice was received. Source: Quotable Value | ||||||||
| $ | ||||||||
| Sections (bare land) | 76,410 | 78,562 | 84,467 | 90,472 | 97,539 | 99,309 | 114,971 | 144,172 |
| Houses | 181,372 | 182,969 | 188,316 | 189,032 | 200,670 | 226,941 | 249,039 | 285,158 |
| Owner-occupier flats | 166,679 | 164,900 | 167,719 | 161,743 | 171,701 | 190,137 | 214,479 | 238,100 |
House prices. The average sale price for houses in the year ending 31 December 2004 was $285,158, as shown in Table 22.01. This was 14.5 percent higher than the average price for the previous year ($249,039) and 57.2 percent higher than that recorded seven years previously in 1997 ($181,372). Sale prices exclude chattels and other considerations.
Quotable Value's residential house price index measures changes in the average level of prices paid for residential properties during each quarter. Variations in the average age of properties, as an indicator of the average quality of such properties, are eliminated in the index methodology in order to arrive at a valid index of price level changes. Table 22.02 shows changes in recent years in the house price index, by locality.
Table 22.02. House price index1
Quarters ending 31 December
| Locality | 1995 | 1996 | 1997 | 1998 | 1999 | 2000 | 2001 | 2002 | 2003 | 2004 |
|---|---|---|---|---|---|---|---|---|---|---|
1Base: Quarter ending December 2003 = 1000. 2Includes North Shore City. Waitakere City, Manukau City, Papakura District and Auckland City. 3Includes Porirua City. Upper Hutt City, Wellington City, Hull City. Source: Quotable Value | ||||||||||
| Whangarei District | 669 | 747 | 875 | 836 | 833 | 827 | 827 | 852 | 1000 | 1194 |
| Auckland2 | 603 | 688 | 715 | 676 | 686 | 671 | 695 | 798 | 1000 | 1057 |
| Hamilton City | 752 | 830 | 893 | 848 | 836 | 796 | 796 | 859 | 1000 | 1164 |
| Tauranga District | 599 | 673 | 758 | 714 | 716 | 716 | 724 | 801 | 1000 | 1204 |
| Rotorua District | 753 | 842 | 949 | 889 | 883 | 899 | 892 | 895 | 1000 | 1142 |
| Gisborne District | 886 | 900 | 869 | 813 | 881 | 864 | 836 | 887 | 1000 | 1338 |
| Napier City | 633 | 647 | 652 | 652 | 660 | 668 | 686 | 759 | 1000 | 1174 |
| Hastings District | 616 | 621 | 619 | 609 | 628 | 628 | 660 | 754 | 1000 | 1215 |
| New Plymouth District | 651 | 656 | 635 | 615 | 638 | 641 | 663 | 767 | 1000 | 1303 |
| Wanganui District | 912 | 886 | 878 | 859 | 863 | 820 | 846 | 888 | 1000 | 1379 |
| Palmerston North City | 761 | 754 | 754 | 737 | 786 | 791 | 795 | 844 | 1000 | 1151 |
| Masterton District | 664 | 645 | 649 | 632 | 692 | 731 | 760 | 860 | 1000 | 1138 |
| Wellington3 | 532 | 577 | 651 | 679 | 746 | 757 | 784 | 861 | 1000 | 1114 |
| Nelson City | 527 | 535 | 543 | 518 | 535 | 541 | 558 | 703 | 1000 | 958 |
| Christchurch City | 678 | 739 | 775 | 735 | 753 | 723 | 729 | 778 | 1000 | 1176 |
| Timaru District | 707 | 723 | 715 | 695 | 694 | 665 | 710 | 771 | 1000 | 1291 |
| Dunedin City | 644 | 652 | 615 | 589 | 600 | 612 | 632 | 671 | 1000 | 1214 |
| Invercargill District | 713 | 712 | 662 | 608 | 571 | 546 | 611 | 733 | 1000 | 1118 |
| All New Zealand | 616 | 676 | 713 | 688 | 704 | 696 | 717 | 801 | 1000 | 1122 |
House sales. In the year ending 31 December 2004, 93,938 freehold open market house sales were notified to Quotable Value, a 6.4 percent decrease on the 100,340 sales recorded in the previous year. Freehold open market sales cover about 80 percent of all house sales, but exclude forced sales, sales between family members with a gift element, and sales of leasehold and mixed tenure properties.
Housing New Zealand Corporation modernised 734 of its properties in the year ending 30 June 2005.
Housing New Zealand Corporation, a Crown entity established under the Housing Corporation Act 1974 and the Housing Corporation Amendment Act 2001, provides housing and services related to housing, and ensures that the Minister of Housing receives appropriate policy advice and information on housing issues.
Housing New Zealand owns or manages more than 66,000 properties nationwide for rental to people on low incomes or who are in need of housing, and also offers a range of home ownership options.
A major achievement for the corporation during 2004/05 was the launch of the New Zealand Housing Strategy, a 10-year programme that aims to provide all New Zealanders with access to affordable, sustainable, good-quality housing appropriate to their needs.
The corporation uses a social allocation system to ensure that those with the greatest need are given priority for housing.
In 2004/05, the corporation dealt with 42,183 enquiries and assessed 31,617 applicants for placement in its properties, while 10,093 families, representing nearly 31,400 people, were allocated a state house. Of these, 41 percent were in the Auckland region.
This brought the number of people in corporation homes to about 190,000. At 30 June 2005, 11,458 applicants were on state house waiting lists.
The corporation increased its rental stock by 1,054 homes during 2004/05, bringing the total to 66,354 rental units.
At 30 June 2005, the corporation's property assets were valued at $11.3 billion and returned a surplus of $14 million for that year.
During 2004/05, the corporation modernised 734 properties and installed insulation and other energy efficiency features in 2,317 properties.
Table 22.03 details housing activity in recent years.
Table 22.03. Housing New Zealand Corporation activity
Years ending 30 June
| 1997 | 1998 | 1999 | 2000 | 2001 | 2002 | 2003 | 2004 | 2005 | |
|---|---|---|---|---|---|---|---|---|---|
1Includes non-relocatable units, relocatable units, garages and carparks. 2Figures from 2001 reflect introduction of the social allocation system in December 2000. 3Figures denote percentage of new tenancies receiving an income-related rent, which began in December 2000. 4Figures to 2000 include vacant sales and sales to tenants only, whereas figures for 2001–2005 are for all property disposals, Including sales to non-tenants and lease terminations. 5Includes transfer of properties to Community Housing Ltd. ... not applicable Source: Housing New Zealand Corporation | |||||||||
| Total rental units1 | 65,821 | 63,866 | 60,418 | 59,462 | 59,865 | 62,022 | 64,543 | 65,448 | 66,498 |
| Number of allocations (new tenancies) | ... | 14,619 | 14,107 | 18,927 | 13,417 | 10,494 | 9,885 | 9,453 | 10,093 |
| Number of new tenancies for priority customers2 | ... | ... | ... | ... | 4,830 | 8,670 | 8,031 | 7,977 | 8,428 |
| Percentage of allocation to low-income households3 | ... | ... | ... | ... | 97.5 | 98.0 | 97.0 | 98.3 | 98.0 |
| Property disposals4 | 3,216 | 2,284 | 3,361 | 1,141 | 215 | 339 | 420 | 563 | 510 |
| Properties acquired or contracted (gross)5 | 484 | 1,224 | 662 | 564 | 708 | 1,167 | 2,941 | 1,466 | 1,560 |
The corporation provides ongoing support for households with complex housing and other needs, as well as income-related rents (where eligible tenants pay no more than 25 per cent of their income on rent), tenancy debt management, modified housing for people with disabilities, localised newsletters and support work with migrant communities.
More than 57,400 families, representing about 172,000 people, receive an income-related rent. Table 22.04 details Housing New Zealand Corporation loan approvals in recent years.
At 30 June 2005, the corporation let 1,502 properties to a wide range of community-based groups providing services for people with special health or welfare needs.
Other initiatives include:
Healthy Housing – a joint initiative with district health boards that targets overcrowded state house tenancies in Northland and south and central Auckland to reduce the risks of disease.
Table 22.04. Housing New Zealand Corporation loan approvals
Years ending 30 June
| 2000 | 2001 | 2002 | 2003 | 2004 | 2005 | |||||||
|---|---|---|---|---|---|---|---|---|---|---|---|---|
| Programme | Number | Value | Number | Value | Number | Value | Number | Value | Number | Value | Number | Value |
1Mortgage finance to build on multiple-owned Māori land. 2Low Deposit Rural Lending Programme. 3Loans to cover the cost of urgent and essential repairs and the cost of installing infrastructure services to new homes. 4Borrower has to meet Housing New Zealand Corporation's lending conditions and a deposit of at least 20 percent of the purchase price. 5Mortgage Insurance Scheme. Called Welcome Home Loans from 1 July 2005. .. figures not available Source: Housing New Zealand Corporation | ||||||||||||
| $(m) | $(m) | $(m) | $(m) | $(m) | $(m) | |||||||
| Papakāinga1 | 20 | .. | 7 | 0.40 | 6 | 0.27 | 2 | 0.09 | 1 | 0.18 | 2 | 0.14 |
| LDRL2 | 165 | .. | 130 | 11.00 | 146 | 11.60 | 264 | 19.80 | 224 | 17.45 | 90 | 6.83 |
| Suspensory3 | .. | .. | 54 | 1.08 | 203 | 3.70 | 280 | 4.26 | 388 | 5.13 | 429 | 6.74 |
| General4 | 13 | .. | 12 | 0.60 | 9 | 0.35 | 11 | 0.37 | 6 | 0.45 | 5 | 0.33 |
| MIS5 | .. | .. | .. | .. | .. | .. | .. | .. | 366 | 1.07 | 597 | 2.13 |
| Total | 198 | 37.00 | 203 | 13.08 | 364 | 15.92 | 557 | 24.52 | 985 | 24.28 | 1,123 | 16.17 |
During 2004/05, 1,024 joint assessments and 1,552 interventions were carried out at a cost of $17 million. The initiative won the New Zealand Health Innovations Supreme Award for 2005.
Community Renewal Programme – which operates in areas with both high concentrations of state housing and high levels of disadvantage. The main aims are to address social exclusion, foster strong and sustainable communities and improve the neighbourhood's physical assets and appearance. The programme began in July 2001 and is currently underway in six areas: Aranui in Christchurch, Fordlands in Rotorua. Clendon in South Auckland, Talbot Park in central Auckland, Eastern Porirua in Wellington and Northcote Central in North Shore City.
The Housing Innovation Fund – which encourages not-for-profit, non-government community groups and organisations to increase or develop rental housing and home ownership to low-income earners and those with special needs. During 2004/05, the corporation approved 15 loans to the value of $10.74 million. This provided 126 new units and 185 additional bedrooms in the social housing market.
The Rural Housing Programme – which aims to address substandard housing in rural parts of New Zealand – particularly Northland, East Coast and the eastern Bay of Plenty. In 2004/05, the programme approved 410 essential repair loans, and provided 19 infrastructure loans and 100 additional state houses in these rural areas.
Welcome Home Loans Scheme – which aims to bring home ownership within the reach of modest income earners. The corporation provides mortgage insurance support to lenders to facilitate lending to low-income households. From September 2003, when the scheme began, until 30 June 2005, 963 low to modest-income families purchased houses with the help of such loans.
Low Deposit Rural Lending (LDRL) – which is targeted at low to modest-income earners who want to buy or build in rural areas. Applicants must complete a 12-week home ownership course before becoming eligible for loan assistance with a 3 percent deposit. The corporation approved 90 LDRL loans during 2004/05.
The Department of Building and Housing was established in November 2004, with its primary focus the building and housing sector. The department combined the Ministry of Housing and the Building Industry Authority, together with the building policy functions from the Ministry of Economic Development and related functions from the Ministry of Social Development and Housing New Zealand Corporation.
The Weathertight Homes Resolution Service joined the department from the Department of Internal Affairs on 1 July 2005, and the Electrical Workers Registration Board joined from the Ministry of Economic Development in February 2006.
The department has sole responsibility for:
Ensuring an effective regulatory environment for the housing and building sector.
Regulating the building sector and rental housing sector.
Delivering effective information, advice and dispute resolution services.
Providing purchase and monitoring advice to the government on Housing New Zealand Corporation.
Administering the State Housing Appeals Authority.
It has lead responsibility for providing:
Policy advice on the building sector and residential tenancy market, including emerging trends and issues.
Policy advice on housing and building regulations.
Advice on regulation of the residential rental market.
Occupational licensing within the housing and building sector.
The department also has joint responsibility or a common interest (with Housing New Zealand Corporation) in:
Defining housing outcomes for the sector.
Analysing the housing environment.
Influencing the wider government sector to ensure it meets government goals for housing.
Working within the social services cluster and economic, growth and innovation frameworks to influence and promote delivery of the government's outcomes for the housing and building sector.
Undertaking specific initiatives under the New Zealand Housing Strategy Programme of Action.
Tenancy services. One of the functions of the Department of Building and Housing is to administer the Residential Tenancies Act 1986, which is undergoing a major review. In the year ending 30 June 2005, there were 45,362 applications for dispute resolution, compared with 43,890 in the year ending 30 June 2004. Of these, 67 percent were resolved through mediation. The remaining applications were not resolved or only partially resolved in mediation and were referred to the Tenancy Tribunal. The department received 211,105 bond lodgements and made 200,520 refunds during the year. It received 190,391 telephone calls for bond advice during the year and 207,425 calls for tenancy advice.
State Housing Appeals Service. The Department of Building and Housing also has responsibility for the State Housing Appeals Service. In the year ending 30 June 2005, the department received four applications to the State Housing Appeals Authority, the same as in the year ending 30 June 2004.
Building and housing sector policy. The Department of Building and Housing provides policy advice to the government on regulating and monitoring the building and housing sectors, and provides a regulatory framework for the building industry. In the year ending 30 June 2005, the department supplied 80 draft responses to parliamentary questions, 185 draft responses to ministerials and 46 draft responses to Official Information Act and Privacy Act requests.
The Weathertight Homes Resolution Service provides home owners with advice, and assesses ‘leaky home’ problems.
Weathertight Homes Resolution Service. The Weathertight Homes Resolution Service (WHRS) was transferred to the Department of Building and Housing on 1 July 2005. The service was established by the Weathertight Homes Resolution Services Act 2002 in response to the emerging ‘leaky buildings’ problem. The service provides owners of leaky homes with assessment of their homes and resolution services for their claims. After assessment, if the claim is found eligible, the claimant may elect mediation or adjudication. Mediation is voluntary and confidential. Settlement is reached by agreement among the parties. Adjudication is semi-judicial and the adjudicator makes an enforceable determination on liability. Adjudicators' determinations are publicly available. A review of the WHRS was completed in 2005. The aim of the review was to find ways to strengthen and streamline the WHRS process. In the year ending 30 June 2005, the WHRS received 1,179 claims. At 30 June 2005, there were 2,391 active claims and 1,011 claims awaiting a decision by the claimant as to further action. In addition, 487 claims were undertaking mediation or adjudication. Mediation had produced resolution for 234 claims, while adjudication had produced resolution for 24 claims. A further 94 claims reached resolution prior to mediation or adjudication.
Retirement Villages Act 2003. Responsibility for the Retirement Villages Act 2003 transferred to the Department of Building and Housing on 1 July 2005. The act was introduced to strengthen consumer protection offered to residents and potential residents of retirement villages. While some of the act was already in force, the remaining provisions and the regulations that underpin the act came into force in 2006. These place new responsibilities on retirement village operators to disclose certain information to residents and intending residents, and make provision for a disputes resolution process. They also provide a system for registering retirement villages. The department works alongside the Ministry of Economic Development, which is responsible for registration-related matters, including acting as the Registrar for Retirement Villages. The department also works with the Retirement Commissioner, who is responsible for monitoring the effect of the act and regulations, and for education and information on retirement village issues.
Excluding dwellings on farms and approximately 80,000 residential rental dwellings owned by the public sector, there were an estimated 1.45 million privately-owned residential dwellings in New Zealand at 31 December 2005.
An estimated 800,000 of these dwellings had a loan or loans secured by mortgage (including residential rental properties and second homes). The average outstanding debt secured on residential dwellings at 31 December 2005 was estimated to be in the $140,000 – $150,000 range.
The value of private non-farm residential dwellings doubled to more than $500 billion in the four years to 31 December 2005. Total debt secured on these dwellings increased by 70 percent, or $50 billion. During this period of rising prices, annual sales turnover averaged around 10 percent of the total private sector housing stock.
Figure 22.01 shows mortgages registered and discharged from 1920.
Figure 22.01. Mortgages
Registered and
discharged
Years ending 31
March
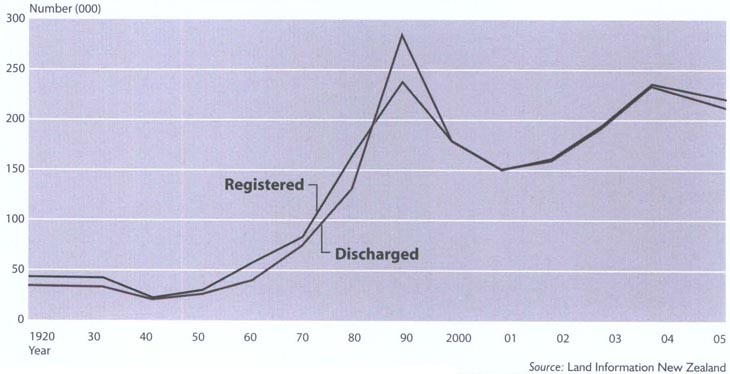
Source: Land Information New Zealand
There were an estimated 1.45 million privately-owned residential dwellings in New Zealand at 31 December 2005.
Figure 22.02 shows that since inflation fell to a low rate in the early 1990s, the average annual rate of interest on new floating rate mortgages has been considerably lower than for the previous two decades.
In the mid-1990s, and again recently, rising floating rate mortgages reflected tightening monetary policy in response to inflationary pressures.
Fixed rate mortgages have been widely available in New Zealand since the mid-1990s, which has meant that most home borrowers have not had to rely on floating rate mortgages, tending to borrow at relatively short (three years or less) fixed-rate terms.
By the end of 2005, more than 80 percent of all mortgage loans by value were at fixed rates, up from 60 percent in the late 1990s. This development has occurred because for most of that period fixed interest rates were lower than floating rates.
While the average floating interest rate during 2005 was 9 percent, weighted fixed interest rates averaged 7.25 percent.
Figure 22.02. Home mortgage rates1
Years ending 31 December
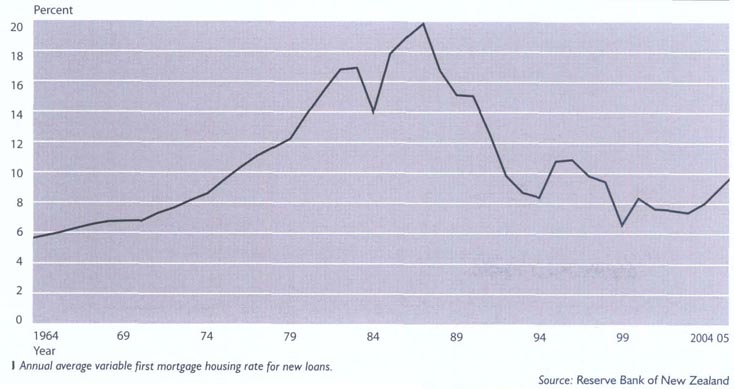
1 Annual average
variable first mortgage housing rate for new loans.
Source: Reserve Bank of
New Zealand
Table 22.05. Household borrowing
By quarterly
average
| Quarter | Reason for borrowing | Total | |
|---|---|---|---|
| Housing | Other | ||
Note: Figures may not add to stated totals due to rounding Source: Reserve Bank of New Zealand | |||
| $(million) | |||
| 1990 December | 22,238 | 2,789 | 25,028 |
| 1991 December | 24,377 | 2,981 | 27,358 |
| 1992 December | 26,895 | 3,197 | 30,092 |
| 1993 December | 30,079 | 3,556 | 33,635 |
| 1994 December | 34,541 | 4,025 | 38,566 |
| 1995 December | 39,364 | 4,651 | 44,015 |
| 1996 December | 45,202 | 5,355 | 50,557 |
| 1997 December | 51,081 | 5,656 | 56,737 |
| 1998 December | 55,364 | 5,815 | 61,179 |
| 1999 December | 61,489 | 6,153 | 67,643 |
| 2000 March | 62,681 | 6,297 | 68,977 |
| 2000 June | 63,762 | 6,400 | 70,162 |
| 2000 September | 64,525 | 6,603 | 71,128 |
| 2000 December | 65,385 | 6,872 | 72,257 |
| 2001 March | 66,360 | 7,072 | 73,432 |
| 2001 June | 67,591 | 7,171 | 74,762 |
| 2001 September | 68,663 | 7,308 | 75,970 |
| 2001 December | 69,884 | 7,591 | 77,475 |
| 2002 March | 71,347 | 7,750 | 79,097 |
| 2002 June | 73,133 | 7,866 | 80,998 |
| 2002 September | 74,509 | 8,094 | 82,603 |
| 2002 December | 76,404 | 8,456 | 84,860 |
| 2003 March | 78,814 | 8,694 | 87,509 |
| 2003 June | 81,596 | 8,842 | 90,438 |
| 2003 September | 84,680 | 9,075 | 93,755 |
| 2003 December | 88,377 | 9,387 | 97,764 |
| 2004 March | 91,900 | 9,529 | 101,429 |
| 2004 June | 95,684 | 9,575 | 105,259 |
| 2004 September | 98,994 | 9,742 | 108,736 |
| 2004 December | 102,512 | 10,033 | 112,545 |
| 2005 March | 106,445 | 10,306 | 116,751 |
| 2005 June | 110,746 | 10,391 | 121,137 |
| 2005 September | 114,615 | 10,489 | 125,103 |
| 2005 December | 119,019 | 10,794 | 129,813 |
Table 22.05 shows household borrowing for housing and other purposes obtained from a Reserve Bank of New Zealand survey. Registered banks are the source of more than 90 percent of the survey's total household debt.
Accommodation Supplements are available to low-income households, irrespective of whether they are renters, mortgagees or boarders, provided they are not living in Housing New Zealand Corporation accommodation.
Accommodation Supplements are cash payments administered by Work and Income and take account of high housing costs in main urban centres.
The low-income threshold depends on circumstances, and an abatement regime assists in targeting the supplements to households on low incomes. The supplements are subject to an asset test.
Table 22.06 shows trends in recent years in the number of clients receiving accommodation assistance.
Reintroduction on 1 December 2000 of income-related rents for Housing New Zealand Corporation tenants resulted in a large number of people losing eligibility for the Accommodation Supplement because of lower rent levels.
Increases between 2004 and 2005 in the number of people receiving Accommodation Supplements reflect the broadening of eligibility to include more low-paid working families, undertaken as part of the Working for Families package.
At 30 June 2005, 242,612 people were receiving an Accommodation Supplement, 5,917 more than the number doing so at 30 June 2004.
During the year ending 30 June 2005, 234,195 applications for the supplement were granted, 6,281 more than during the year ending 30 June 2004.
Table 22.06. Accommodation assistance from Work and Income
| Year | Benefits current at 30 June | Annual assistance, year to 30 June |
|---|---|---|
1Accommodation Benefit until 30 June 1993, subsequently Accommodation Supplement. 2At 31 May. .. not available Source: Ministry of Social Development | ||
| Number | $(million) | |
| Accommodation Benefit1 | ||
| 1990 | 106,408 | .. |
| 1991 | 112,658 | .. |
| 1992 | 140,356 | 180.1 |
| 1993 | 150,6692 | 210.8 |
| Accommodation Supplement | ||
| 1994 | 251,505 | 351.3 |
| 1995 | 266,275 | 491.4 |
| 1996 | 280,369 | 561.8 |
| 1997 | 297,134 | 661.6 |
| 1998 | 305,735 | 792.7 |
| 1999 | 313,042 | 843.3 |
| 2000 | 315,988 | 867.0 |
| 2001 | 265,882 | 795.1 |
| 2002 | 258,034 | 719.6 |
| 2003 | 251,941 | 706.0 |
| 2004 | 236,695 | 702.1 |
| 2005 | 242,612 | 749.7 |
Building and construction is an important part of the New Zealand economy.
For the year ending 31 March 2005, gross fixed capital investment on building and other construction totalled $18.5 billion. For the previous year, the figure was $16.0 billion and in 2003 it was $13.7 billion.
The number of people engaged in the industry at 28 February 2005 was 107,450, or 5.9 percent of those engaged in all industries, including farming. In addition, thousands more were employed supporting the industry in manufacturing, material supplies and transport.
The share of New Zealand's gross domestic product (GDP) contributed by the industry (in constant prices) was 4.9 percent in the year ending 31 March 2005, compared with 4.8 percent in the 2004 March year.
The most common construction systems used in New Zealand are light timber framing for housing, reinforced concrete (pre-cast and in situ) for multi-storey buildings and light steel framing for industrial buildings.
With the introduction of a performance-based building code, traditional systems are slowly being replaced with new methods and products.
With shortages of timber on the domestic market, light steel framing is becoming more common.
New Zealand has developed particular expertise in the design of earthquake-resistant structures and in other specialist areas such as hydro and geothermal power station design and construction.
The Department of Building and Housing manages building controls in New Zealand, and is responsible for writing The New Zealand Building Code.
The code specifies essential requirements for building performance to ensure the health and safety of building users and the protection of other people's property.
The department's operations team writes technical documents (known as the New Zealand Building Code Handbook and Compliance Documents) which provide methods of satisfying the code.
Solutions published in these documents are not mandatory, and the building industry is encouraged to develop new materials and systems as alternatives to traditional methods.
Important requirements of the building code are durability, ease of access for all users, and energy efficiency in buildings.
Day-to-day administration of building controls is the responsibility of territorial authorities, which must confirm that building projects satisfy code provisions.
Building consents are required for new buildings and for alterations to existing buildings. Any such work must also comply with district plans of territorial authorities prepared under the Resource Management Act 1991.
Gold medals for architecture The New Zealand Institute of Architects' gold medal awards honour individuals or practices whose body of work over a period of time has made an exceptional contribution to New Zealand architecture. Gold medal holders are John Scott (awarded posthumously in 1999), Sir Miles Warren (2000), The Architectural Group (2001), Ted McCoy (2002), Peter Beaven (2003), David Mitchell (2004) and Ian Athfield (2005). Supreme awards made by the institute in 2004 and 2005.
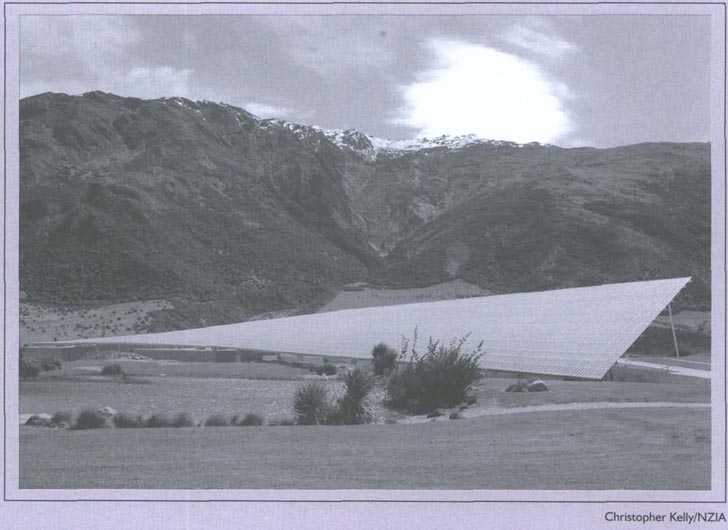 The Peregrine winery building in Central Otago's Gibbston Valley was a supreme winner in the 2005 New Zealand Institute of Architects' awards. | ||||||
For completed buildings, the requirement for regular maintenance of essential systems, such as fire alarms, lifts and air conditioning, is covered by the compliance schedule of the Building Act 2004 and annual building warrant of fitness provisions.
New Zealand is seen as a leader in the worldwide move to performance-based building codes. The New Zealand Building Code was used extensively as the model for the revised Building Code of Australia.
All clauses of the building code and supporting documents are reviewed every five years to ensure the code remains current. The next code review is due to be completed by November 2007.
Safe and healthy buildings are one of the department's goals, and work on the dangerous buildings provisions of the Building Act continues to be a high priority, in particular earthquake-prone buildings.
Other factors, such as fire risks and insanitary conditions, can also make buildings dangerous.
The department is funded by a building consent levy of $1.97 for every $1,000 of building work, applicable to projects exceeding $20,000.
New Zealand's main official building statistics are Statistics New Zealand's monthly compilation of building authorisations and its quarterly survey of the value of work put in place.
The source of these statistics is building consents issued by territorial authorities.
Building authorisations provide the primary indication of future building work to be put in place. As such, published figures on the number and value of building authorisations is of particular interest to economists and the government.
In addition, the Reserve Bank of New Zealand uses the figures to predict the magnitude of inflationary pressures within the building and construction industry and its contribution to overall inflation.
Table 22.07 shows the location and value of building authorisations for the years ending 31 March 2004 and 2005.
Authorisation values shown usually represent the contract price or the estimated cost of the building before starting construction.
The finished cost may be higher or lower due to changes in wage rates, material prices and design.
Table 22.07. Building authorisations1
By location, number and
value
Years ending 31
March
| Region | New dwellings | Residential value | Non-residential value | All buildings value | ||||
|---|---|---|---|---|---|---|---|---|
| 2004 | 2005 | 2004 | 2005 | 2004 | 2005 | 2004 | 2005 | |
1Does not include alterations and additions - nil or zero Note: Figures may not add to stated totals due to rounding. Source: Statistics New Zealand | ||||||||
| Number | $(million) | |||||||
| Northland | 1,327 | 1,411 | 226 | 266 | 62 | 78 | 288 | 344 |
| Auckland | 12,222 | 11,060 | 2,042 | 1,995 | 769 | 1,051 | 2,811 | 3,046 |
| Waikato | 3,535 | 3,302 | 625 | 631 | 196 | 249 | 821 | 880 |
| Bay of Plenty | 2,250 | 2,359 | 438 | 494 | 87 | 160 | 525 | 654 |
| Gisborne | 84 | 138 | 15 | 27 | 13 | 12 | 28 | 39 |
| Hawke's Bay | 716 | 711 | 161 | 154 | 81 | 73 | 242 | 227 |
| Taranaki | 373 | 471 | 75 | 100 | 34 | 73 | 108 | 173 |
| Manawatu-Wanganui | 830 | 910 | 150 | 180 | 64 | 94 | 213 | 274 |
| Wellington | 2,595 | 2,364 | 456 | 442 | 102 | 362 | 559 | 804 |
| Nelson | 402 | 294 | 76 | 63 | 24 | 24 | 100 | 86 |
| Tasman | 528 | 353 | 93 | 76 | 27 | 29 | 121 | 105 |
| Marlborough | 442 | 425 | 78 | 87 | 17 | 35 | 95 | 122 |
| West Coast | 176 | 207 | 25 | 35 | 16 | 27 | 40 | 62 |
| Canterbury | 4,371 | 4,574 | 792 | 952 | 231 | 281 | 1,022 | 1,233 |
| Otago | 1,630 | 1,353 | 341 | 324 | 119 | 132 | 460 | 456 |
| Southland | 339 | 322 | 65 | 69 | 33 | 49 | 98 | 118 |
| Area outside regions | 3 | 1 | - | - | - | - | - | - |
| Total New Zealand | 31,823 | 30,255 | 5,657 | 5,896 | 1,873 | 2,730 | 7,530 | 8,626 |
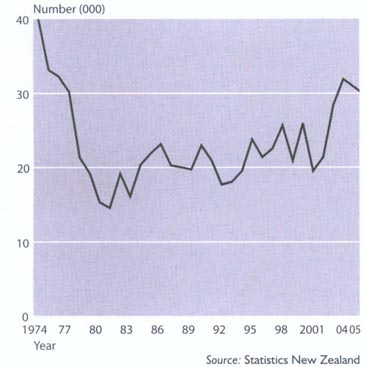
Figure 22.04. Size of new dwellings
By average
floor area
Years ending 31
March
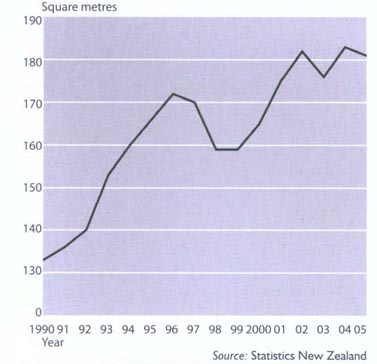
Source: Statistics New Zealand
Table 22.08 shows values of building authorisations by building type for the seven years ending 31 March 2005. Authorisations cover alterations and additions, as well as new buildings.
‘Hostels, boarding houses’ includes barracks, orphanages, nurses' homes and boarding school accommodation. ‘Hotels and short-term accommodation’ includes private and licensed hotels, but excludes taverns. ‘Education buildings’ includes primary and secondary schools, colleges of education, technical institutes, university buildings, kindergartens and playcentres. The broad category of ‘social, cultural, religious and recreational buildings’ includes churches, halls, theatres, cinemas, clubrooms, community centres and grandstands.
Table 22.08. Building authorisations
By type and
value
Years ending 31
March
| Type of building | 1999 | 2000 | 2001 | 2002 | 2003 | 2004 | 2005 |
|---|---|---|---|---|---|---|---|
Note: Figures may not add to stated totals due to rounding. Source: Statistics New Zealand | |||||||
| $(million) | |||||||
| Residential | |||||||
| New dwellings | 2,776 | 3,533 | 2,833 | 3,353 | 4,549 | 5,657 | 5,896 |
| Alterations/additions and outbuildings | 680 | 730 | 711 | 758 | 876 | 1,050 | 1,174 |
| Total residential buildings | 3,456 | 4,263 | 3,544 | 4,111 | 5,425 | 6,707 | 7,070 |
| Non-residential (includes alterations and additions) | |||||||
| Hostels, boarding houses | 101 | 77 | 43 | 86 | 130 | 63 | 279 |
| Hotels and short-term accommodation | 154 | 124 | 134 | 130 | 144 | 238 | 182 |
| Hospitals and nursing homes | 174 | 198 | 219 | 279 | 221 | 208 | 230 |
| Education buildings | 356 | 346 | 312 | 357 | 415 | 425 | 445 |
| Social, cultural, religious and recreational buildings | 320 | 167 | 275 | 242 | 206 | 235 | 291 |
| Shops, restaurants, taverns | 304 | 339 | 372 | 352 | 393 | 500 | 588 |
| Offices and administration buildings | 407 | 337 | 478 | 453 | 304 | 443 | 737 |
| Storage buildings | 155 | 173 | 188 | 176 | 265 | 297 | 413 |
| Factories and industrial buildings | 264 | 315 | 312 | 385 | 352 | 391 | 537 |
| Farm buildings | 93 | 90 | 124 | 181 | 162 | 165 | 175 |
| Miscellaneous buildings | 30 | 41 | 21 | 23 | 25 | 32 | 33 |
| Total non-residential buildings | 2,358 | 2,206 | 2,478 | 2,666 | 2,617 | 2,998 | 3,910 |
| Total all buildings | 5,814 | 6,468 | 6,022 | 6,777 | 8,042 | 9,705 | 10,981 |
Residential and non-residential building authorisations are listed in Table 22.09, while Figure 22.03 shows the number of new dwelling units authorised from 1974 to 2005. New dwelling authorisations in the year ending 31 March 2005 totalled 30,255 units, with a total value of $5.9 billion. In dollar terms, this was a 4.2 percent increase on the previous year.
Figure 22.04 shows how the size of new dwellings has changed since 1990.
Table 22.09. Residential and non-residential building authorisations
By number and value
Years ending 31 March
| Year | New dwellings | Residential buildings1 | Non-residential buildings1 | All buildings | ||
|---|---|---|---|---|---|---|
| Units | Value | Floor area | ||||
1Includes outbuildings, alterations and additions. 2Includes alterations and additions. Note: Figures may not add to stated totals due to rounding. Source: Statistics New Zealand | ||||||
| Number | $(million) | sq m (000) | $(million) | |||
| 1997 | 22,418 | 2,927 | 3,820 | 3,563 | 2,330 | 5,892 |
| 1998 | 25,565 | 3,252 | 4,077 | 3,938 | 2,363 | 6,301 |
| 1999 | 20,766 | 2,776 | 3,310 | 3,456 | 2,358 | 5,814 |
| 2000 | 25,858 | 3,533 | 4,261 | 4,263 | 2,206 | 6,468 |
| 2001 | 19,370 | 2,833 | 3,382 | 3,544 | 2,478 | 6,022 |
| 2002 | 21,262 | 3,353 | 3,876 | 4,111 | 2,666 | 6,777 |
| 2003 | 28,320 | 4,549 | 4,983 | 5,425 | 2,617 | 8,042 |
| 2004 | 31,823 | 5,657 | 5,814 | 6,707 | 2,998 | 9,705 |
| 2005 | 30,255 | 5,896 | 5,465 | 7,070 | 3,910 | 10,981 |
Contrasting with statistics based on building authorisations, surveys of building work put in place show the gross value of actual work done, excluding GST.
There can be varying time lags between issue of a building authorisation and commencement of building.
Table 22.10 shows the value of work put in place in the nine years to 31 March 2005, while Figure 22.05 compares the value of residential and non-residential work put in place since 1974.
Table 22.1. Work put in place
By
value
Years ending 31
March
| Year | Residential buildings | Non-residential buildings (including alterations and additions) | ||||||||||
|---|---|---|---|---|---|---|---|---|---|---|---|---|
| New dwellings | Alterations, additions and outbuildings | Total residential buildings | Hotels and boarding homes | Hospitals and nursing homes | Factories and industrial buildings | Commercial buildings1 | Education buildings | Miscellaneous buildings2 | Total non-residential buildings | Total all buildings | ||
| Government | Other | |||||||||||
1Includes shops, restaurants, taverns, offices, administrative buildings and storage buildings. 2Includes social, cultural, religious, recreational and farm buildings. Note: Figures may not add to stated totals due to rounding. Source: Statistics New Zealand | ||||||||||||
| $(million) | ||||||||||||
| 1997 | 16 | 3,393 | 687 | 4,097 | 244 | 184 | 473 | 754 | 378 | 838 | 2,871 | 6,968 |
| 1998 | 13 | 3,590 | 642 | 4,245 | 206 | 197 | 428 | 763 | 346 | 738 | 2,678 | 6,923 |
| 1999 | 9 | 2,968 | 620 | 3,596 | 276 | 211 | 258 | 746 | 405 | 781 | 2,678 | 6,274 |
| 2000 | 5 | 3,864 | 735 | 4,604 | 304 | 270 | 326 | 777 | 354 | 706 | 2,738 | 7,342 |
| 2001 | 14 | 3,268 | 663 | 3,945 | 213 | 294 | 309 | 921 | 404 | 634 | 2,775 | 6,720 |
| 2002 | 17 | 3,279 | 742 | 4,038 | 231 | 268 | 468 | 866 | 391 | 909 | 3,133 | 7,171 |
| 2003 | 7 | 4,322 | 859 | 5,188 | 242 | 333 | 388 | 853 | 469 | 921 | 3,206 | 8,394 |
| 2004 | 33 | 5,467 | 1,022 | 6,522 | 298 | 330 | 451 | 929 | 540 | 831 | 3,380 | 9,902 |
| 2005 | 56 | 6,265 | 1,075 | 7,396 | 522 | 313 | 467 | 1,285 | 514 | 1,126 | 4,227 | 11,624 |
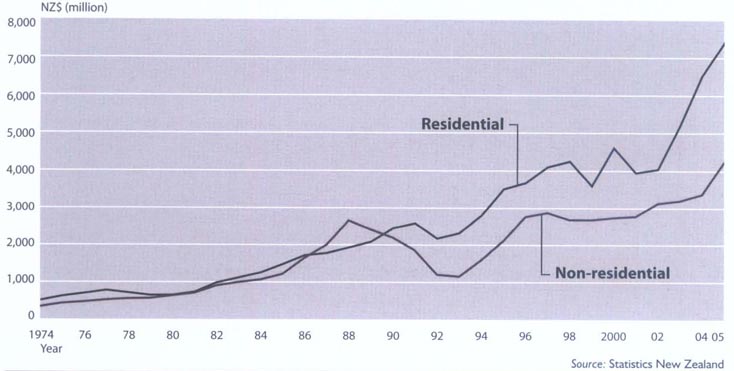
Price indexes for buildings and construction are contained within Statistics New Zealand's Capital Goods Price Index. Two series for residential buildings, four for non-residential buildings, four other construction and four land improvement price indexes have been produced since the December 1989 quarter.
For the year ending with the March 2005 quarter, the indexes recorded increases of 9.1 percent for residential buildings, 9.0 percent for non-residential buildings, 5.0 percent for other construction and 6.1 percent for land improvement. In the March 2005 quarter, the residential buildings index recorded, for the 10th consecutive quarter, the most significant upward contribution to the Capital Goods Price Index. The residential buildings index saw 22 successive quarterly increases prior to the March 2005 quarter, establishing the upward trend in residential building construction costs.
The dwelling rentals component of the Consumers Price Index increased by 2.8 percent in the year ending 31 March 2005.
22.1 Statistics New Zealand; Quotable Value New Zealand; Housing New Zealand Corporation; Department of Building and Housing.
22.2 Reserve Bank of New Zealand; Land Information New Zealand; Ministry of Social Development.
22.3 Statistics New Zealand; Department of Building and Housing.
www.dbh.govt.nz – Department of Building and Housing
www.hnzc.co.nz – Housing New Zealand Corporation
www.linz.govt.nz – Land Information New Zealand
www.msd.govt.nz – Ministry of Social Development
www.qv.co.nz – Quotable Value New Zealand
www.rbnz.govt.nz – Reserve Bank of New Zealand
www.stats.govt.nz – Statistics New Zealand
Table of Contents
Christchurch International Airport, jointly owned by local government and the Crown, is one of New Zealand's three main international air terminals.
While international air and telecommunication links are helping to overcome New Zealand's isolation as a trading nation, there remains a heavy reliance on sea transport for movement of the bulk of the country's exports and imports.
The period from the late 1970s has been marked by ongoing and continuing change in the New Zealand transport sector. Major regulatory changes have encouraged competition within the industry and allowed ongoing introduction of a wide range of new technologies. Organisational changes have seen greater use of commercial structures for publicly-owned transport systems, with some of these being transferred to the private sector.
Comprehensive reforms of New Zealand's waterfront since 1988 have resulted in cost savings and efficiency improvements. Thirteen port companies were established in 1988 to take over ownership and operation of commercial port facilities, and waterfront labour was reformed in 1989. This reform saw the end of the government-managed labour pool system and introduced direct employment and enterprise bargaining to the waterfront.
Since the late 1990s, transport policy has evolved beyond economic and safety issues and now includes environmental, social and public health aspects of transport. This approach was reflected in the government's New Zealand Transport Strategy, published in 2002.
Ninety-nine percent of both New Zealand's exports (22 million tonnes) and imports (around 19 million tonnes) are carried by sea. By value, this represents 83 percent of exports and 75 percent of imports.
These figures clearly illustrate the importance to New Zealand of efficient and cost-competitive international shipping services, especially considering the country's distance from overseas markets.
Coastal shipping provides intra and inter-island links, and plays a key role in distribution of petroleum products and cement.
Since the 1990s, New Zealand shipping policy has reflected the philosophy that the country's interests are best served by being a ship-using, rather than a ship-operating nation. The policy seeks to ensure for New Zealand exporters and shippers unrestricted access to the carrier of their choice, and to the benefits of fair competition among carriers.
The Maritime Transport Act 1994 regulates ship safety, maritime liability and marine environmental protection. The act also made Maritime New Zealand responsible for maritime safety and marine pollution prevention and response functions.
Table 23.01. Registered vessels involved in domestic and overseas trade
At 31 December
| Year | Number of vessels | Net tonnage | Number of crew1 |
|---|---|---|---|
1Crew figures not necessarily up to date .. figures not available Source: Maritime Safety Authority | |||
| Domestic | |||
| 1995 | 12 | 20,221 | 269 |
| 1996 | 12 | 26,048 | 302 |
| 1997 | 12 | 26,048 | 302 |
| 1998 | 8 | 16,875 | 200 |
| 1999 | 8 | 16,875 | 200 |
| 2000 | 8 | 14,580 | 145 |
| 2001 | 9 | 14,406 | 158 |
| 2002 | .. | .. | .. |
| 2003 | 11 | 21,673 | 205 |
| 2004 | 9 | 18,203 | 171 |
| 2005 | 13 | 24,182 | 171 |
| Overseas | |||
| 1995 | 9 | 69,354 | 170 |
| 1996 | 8 | 59,006 | 153 |
| 1997 | 7 | 54,711 | 115 |
| 1998 | 7 | 43,763 | 111 |
| 1999 | 4 | 32,543 | 42 |
| 2000 | 3 | 29,484 | 23 |
| 2001 | 3 | 29,484 | 40 |
| 2002 | .. | .. | .. |
| 2003 | 3 | 23,686 | 48 |
| 2004 | 3 | 23,272 | 40 |
| 2005 | 3 | 23,272 | 40 |
Statistics New Zealand's February 2005 business demographics recorded 760 full-time equivalent people engaged in international sea transport, 1,340 in coastal water transport and 890 in inland water transport. Equivalent figures for February 2003 were 770, 1,350 and 630.
Major trading routes for New Zealand include the United Kingdom and Europe; Africa, India and the Middle East; North Asia, East Asia and South-east Asia; North America, Central America and South America; trans-Tasman and the Pacific.
New Zealand is well provided with international shipping services, with more than 30 global and regional international shipping lines represented in New Zealand. Among them are Maersk Line, Mediterranean Shipping Company, Contship Containerlines, Columbus Line, CMA COM Group, Hamburg Sud, Hapag Lloyd, Wallenius Wilhelmsen, Malaysia International Shipping Corporation Berhad, China Ocean Shipping Company, Far Eastern Shipping Company, Orient Overseas Container Line, Nippon Yusen Kaisha Line, Mitsui OSK Lines, Pacific International Line, Australia New Zealand Direct Line, Chief Container Service, Tasman Orient Line, Pacific Forum Line, Sofrana Unilines and Pacific Direct Line.
Conference lines and vessel sharing agreements (VSAs) are involved in much of New Zealand's overseas shipping. Conferences are associations among shipping companies to provide joint services on several trade routes. VSAs are more limited arrangements than conferences, involving separate services jointly scheduling the same vessels to better utilise vessel capacity.
Increased competition in the shipping industry in recent years, however, has seen greater participation in New Zealand trade by independent carriers.
Interisland Line provides rail and road ferry services across Cook Strait between Wellington and Picton, transporting passengers, vehicles and freight.
Lyttelton-based Pacifica Shipping operates two cargo vessels linking Auckland, Tauranga, Wellington. Nelson, Lyttelton. Timaru and Dunedin.
Strait Shipping operates livestock, roll-on roll-off and passenger services between Wellington, Picton and Nelson.
Auckland-based Sea-Tow operates tugs and barges on tramp services around the New Zealand coast.
Black Robin Shipping operates a general cargo and livestock service between the North and South Islands and the Chatham Islands.
In addition, since 1995, coastal shipping services are also provided by foreign ships transiting the New Zealand coast in the course of their international voyages.
Overseas trade. New Zealand's bulk shipping needs are served in the main by a mix of vessels, few of which operate in fixed services. Imported bulk cargoes include crude oil, phosphate rock, bauxite and petroleum coke. Exports include ironsand, coal, forest products and methanol. Sea-Tow provides tug and barge services to Australia and the South Pacific.
Coastal. Bulk cement distribution is handled by three small cement vessels, two operated by Milburn New Zealand and one by the Golden Bay Cement Company. Two tankers operated by Silver Fern Shipping Ltd distribute petroleum products from the Marsden Point oil refinery.
Ports. Port companies established under the Port Companies Act 1988 operate New Zealand's 13 commercial ports. These companies are predominantly owned by local authorities, although four are partly privatised and listed on the New Zealand Stock Exchange. Two of the port companies, Northland Port Corporation and Port of Tauranga Ltd, have established a new deepwater port (Northport Ltd) at Marsden Point, in Northland. In addition to the 13 commercial ports, there are smaller ports at Westport, Greymouth, Wanganui and Taharoa.
Registration of ships. At 31 December 2005, there were 2,465 ships on the New Zealand Register of Ships, with total gross tonnage of 258,952 and net tonnage of 121,640. This compared with 2,479 ships, with gross tonnage of 264,208 and net tonnage of 125,138, in 2004. Under provisions of the Ship Registration Act 1992, ships not exceeding 24 metres register length are not required to have tonnages registered. New registrations during 2004 included the cargo vessel Kent and the barge Machiavelli. Vessels removed from the register during 2005 included the fishing vessels Aorere and Aoraki.
Table 23.01 shows the number and capacity of registered vessels involved in domestic and overseas trade.
Seafarer qualifications. Maritime New Zealand is the administration and licensing body for all New Zealand Merchant Navy, super yacht, fishing and all other commercial maritime qualifications. After obtaining suitable qualifying sea service followed by further approved training and examinations at teaching institutions, successful seafarers are issued with certificates of competency as master, mate or engineer, as well as deck and engine room ratings. There are different classes of certificates of competency for foreign-going, offshore, fishing or restricted-limit ships. Foreign-going certificates and endorsements for service on special types of ships meet the requirements of relevant United Nations conventions and may be accepted for use in other countries. All certificate of competency holders are required to meet minimum medical standards, including eyesight. The Royal New Zealand Coastguard Federation is the organisation that caters for pleasure-boat mariners on a voluntary basis. The federation holds courses and conducts examinations for certificates as day skipper, boat master, coastal skipper and ocean yachtmaster. The Royal New Zealand Coastguard Federation is also accredited to conduct Royal Yachting Association (UK) certificates.
Maritime New Zealand is responsible for ensuring New Zealand passenger craft meet required safety standards.
Figure 23.01. Marine accidents1
Years ending 30 June
By month1
By ship
category2,3
By type of
accident2,4
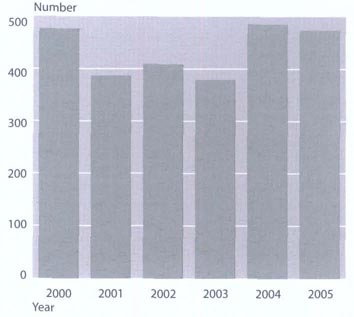
1Includes commercial, recreational and mishap (injury)
accidents.
2Year ending 30 June 2005.
3Mishap (injury) accidents not
included.
4Mishap (injury) accidents not included unless
fatal.
Source: Maritime New Zealand
By month1
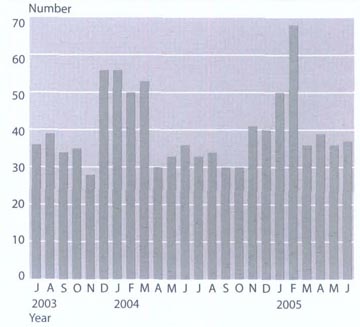
By ship category2,3
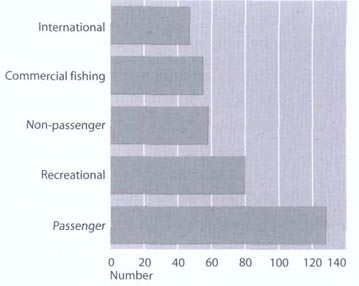
By type of accident2,4
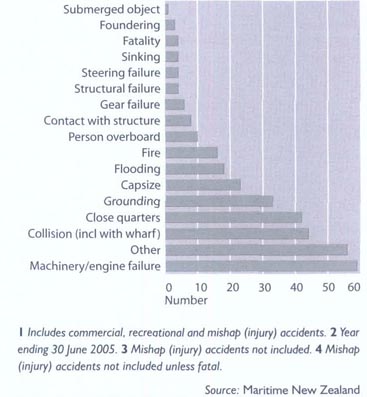
Maritime safety. The New Zealand Government is a signatory to many International Maritime Organisation and International Labour Organisation conventions which specify safety standards for international ships, and health and safety standards for crews. Maritime New Zealand is responsible for administering these conventions and for inspecting foreign and New Zealand ships to ensure they meet required standards.
Marine safety services. There are 142 navigational aids owned and maintained by Maritime New Zealand on headlands, capes, reefs and shoals around 5,400 nautical miles (9,000 kilometres) of New Zealand coastline. The aids consist of 97 automatic lights, 40 day beacons and five navigational buoys. There are no staffed lighthouses in New Zealand. Maritime New Zealand also provides a distress and safety radio communication system for mariners. Radio frequencies dedicated to distress messages are monitored around the clock in the very high, medium and high frequency bands. The system also broadcasts weather reports and warnings of maritime hazards and assists during search and rescue operations and medical emergencies at sea. The cost of providing navigation aids and the distress and safety radio system is met from a marine safety charge levied on all commercial ships (New Zealand and foreign). The government also contributes on behalf of the recreational boating sector.
Wrecks. Where ships are wrecked on the New Zealand coast or in lakes and rivers, the Director of Maritime New Zealand has powers for preserving life and protecting property. Contrary to popular belief, a wreck or an article belonging to it remains the property of the owner and it is illegal for others to take any items of wreckage. People finding or taking possession of wrecks, or articles from wrecks, must notify the police, who may take custody until ownership is resolved.
Maritime accidents. Maritime New Zealand investigates maritime accidents and incidents to identify their cause, analyses trends and makes recommendations as to how similar occurrences can be avoided. Investigators also assess whether there has been any breach of law. Figure 23.01 provides an analysis of marine accidents.
Marine pollution. Maritime New Zealand is required to promote a clean marine environment and is responsible for developing and implementing New Zealand's marine oil spill response strategy. It sets out principles to ensure that New Zealand is prepared for, and can respond to, marine oil spills. A tiered planning and response system for dealing with oil spills has been established at local, regional, national and international levels. While New Zealand's equipment, trained personnel and services are designed to respond to a one in 100-year spill, arrangements are in place to use international assistance when needed. The National Oil Spill Service Centre, at Te Atatu, Auckland, houses equipment which can be mobilised immediately in the event of an oil spill. This national stockpile complements equipment Maritime New Zealand stores in key locations throughout New Zealand.
Shipping industry review. The government and representatives from the maritime transport sector are working through the recommendations of a shipping industry review carried out in 2002. The six-member review team made its recommendations in A Future for New Zealand Shipping, which dealt with shipping taxation issues, pricing by ports, partnership links between merchant shipping and the Royal New Zealand Navy, maritime training, International Labour Organisation conventions, Closer Economic Relations with Australia opportunities, compliance costs and the need for more shipping and cargo-related statistics.
Due to its island status and its distance from other countries, New Zealand is one of the most aviation-oriented nations in the world. In a population of just 4.1 million, there were 8,998 pilot licences on issue at 30 June 2005 and 3,872 aircraft – one pilot licence for every 456 people and one aircraft for every 1,059. The 3,872 aircraft in the New Zealand civil fleet at 30 June 2005 was 169 more than a year before. The number of licensed aircraft engineers increased, from 1,927 at 30 June 2004 to 2,019 a year later.
The rate of increase in the number of hours flown by New Zealand registered aircraft (excluding sport aircraft) between the year ending 31 March 2001 and the year ending 31 March 2005 averaged 2.3 percent a year.
There were 9,170 people (measured on a full-time equivalent basis) working in civil aviation at 28 February 2005, according to business demographic statistics compiled by Statistics New Zealand. Of these, 4,540 were employed in scheduled international air transport and 4,630 in scheduled domestic air transport. In addition to civil aviation, another 1,840 full-time equivalent people were working in other air transport services.
The Civil Aviation Authority (CAA) is New Zealand's aviation safety regulator, with the prime function of promoting civil aviation safety and security and contributing to an integrated, responsive and sustainable transport system.
Specific functions include establishing safety and security standards relating to entry into, and exit from, the civil aviation system; monitoring adherence to safety and security standards within the civil aviation system; ensuring regular review of the civil aviation system to promote improvement and development of its safety and security; investigating and reviewing civil aviation accidents and incidents; providing civil aviation safety and security policy advice to the Minister of Transport; promoting safety and security in the civil aviation system through information, advice and education programmes; and maintaining the New Zealand Register of Aircraft, the Civil Aviation Registry and other records and documents relating to activities within the civil aviation system.
The CAA also acts on behalf of the Crown in respect of the International Civil Aviation Organisation (ICAO). As part of ICAO responsibilities, the CAA is designated the Aviation Security Authority, the Air Traffic Services Authority, the Personnel Licensing Authority, the Meteorological Authority and the Dangerous Goods Authority, and meets New Zealand's ICAO obligations for aeronautical information. It also undertakes ICAO responsibilities of a technical or safety regulatory nature associated with the ICAO Air Navigation Bureau and Technical Assistance Bureau.
The CAA is funded from a number of sources – a domestic passenger levy ($1.77 + GST per passenger, per sector); an international departing passenger levy ($0.89 + GST per passenger); a participation levy based on aircraft weights; an aeronautical information services levy; and fees for services, such as certification, licensing, rules development and policy advice to the government.
In the financial year ending 30 June 2005, the CAA received $26,585 million in income and spent $25.379 million, resulting in a surplus of $1.206 million. Levies totalled more than 75 percent of income.
Figure 23.02 shows the number of notifiable aircraft accidents in New Zealand from 1996 to 2005.
Airways New Zealand (Airways) provides air navigation services for the aviation industry within New Zealand's domestic and oceanic airspace. Established in 1987 as a state-owned enterprise, Airways was the first fully-commercialised air navigation services organisation in the world.
Airways provides air traffic services, including flight information, to civil and military air traffic and is responsible for the planning, provision and maintenance of radar, navigational aids and communications. Air navigation facilities provided in New Zealand include electronic aids, such as non-directional medium frequency beacons (NDB), Doppler very high frequency omni-directional radio ranges (DVOR), instrument landing systems (ILS), primary surveillance radar equipment (PSR), secondary surveillance radar (SSR), distance measuring equipment (DME) and very high frequency direction-finding equipment (VDF).
Airways aims to ensure the safe, orderly and expeditious flow of air traffic within the 34 million square kilometres of Pacific airspace assigned to New Zealand by the International Civil Aviation Organisation (ICAO). Aircraft operators and pilots pay Airways for the services they use. These include radar control, landing charges and aeronautical charts and publications. Airways also assists search and rescue and airport emergency organisations. Its technicians perform installation and maintenance of technical facilities, including runway lighting and navigation aids, for airport companies in New Zealand and overseas.
In its first seven years of existence, Airways completed modernisation of New Zealand's entire air traffic control system, upgrading the nation's network of navigation aids and moving to the next generation of air traffic control technology. The first air navigation services organisation in the world to install a satellite-based Oceanic Control System (OCS) in 1995, Airways has received four major international awards for achievement in infrastructure and for implementation of the OCS. The new system, which can track aircraft across the Pacific, increases airline efficiency and air traffic safety. The second phase of OCS was implemented in early 2000.
Airways assists in discharging operational and technical commitments arising from New Zealand's membership of ICAO. All military air traffic control and radar surveillance is supplied on contract to the Royal New Zealand Air Force. Specialised divisions of Airways provide a range of related aviation services. Aviation Publishing is responsible for producing aeronautical charts and manuals on behalf of the Civil Aviation Authority. The Airways Training Centre, in Christchurch, conducts courses in air traffic services and telecommunications for New Zealand and international students. Airways International has applied New Zealand's domestic expertise internationally in the provision of air navigation services solutions and also with technical and training solutions to more than 40 countries worldwide.
Figure 23.02. Notifiable aircraft accidents1
Years ending 30 June
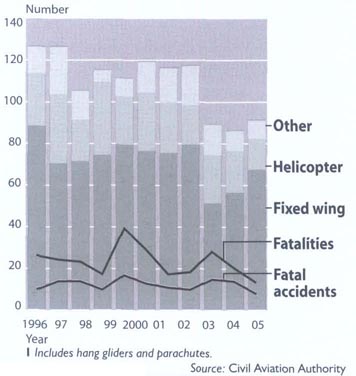
1Includes hang gliders and parachutes.
Source: Civil Aviation
Authority
New Zealand has 26 airport operators certificated to handle flights carrying 30 or more passengers, and several other regional airports with regular smaller scheduled services, as well as numerous smaller airports or airstrips. Most airports are owned wholly or partly by territorial local authorities. The chief international airports are Auckland (which is listed on the New Zealand Stock Exchange), Wellington (co-owned by a listed company and the local authority) and Christchurch (jointly owned by the localauthority and the Crown). International scheduled services also fly to Palmerston North, Hamilton, Dunedin and Queenstown. Several other airports handle international private jet, charter or freight flights from time to time. Airport safety standards, certification and inspection are addressed by the Civil Aviation Authority. The Aviation Security Service provides airport security and passenger and baggage screening at major airports (typically those handling passenger jet aircraft). Air traffic control services are supplied to most airports by the Airways Corporation of New Zealand. These are all agencies of the New Zealand Government.
New Zealand allows up to 100 percent foreign ownership of domestic airlines and there is no domestic air services licensing. Air New Zealand is the major domestic operator and has regional connections through Air New Zealand Link branding of commuter airlines. Qantas provides jet services on the main trunk.
International air services are operated under formal agreements between governments. New Zealand has 40 such agreements and a non-government agreement with Taiwan. Agreements outline routes by which airlines can operate to and from New Zealand and, in some cases, capacity that can be used on those routes. One agreement, the Multilateral Agreement on the Liberalisation of International Air Transportation (MALIAT), provides for New Zealand's air services arrangements with Brunei Darussalam, Chile, Samoa, Singapore, Tonga and the United States. New Zealand's international air transport policy is to maximise economic benefit to New Zealand, including trade and tourism, consistent with foreign policy and strategic considerations.
Air New Zealand operates services to six gateways in Australia (Sydney, Melbourne, Adelaide, Brisbane, Perth and Cairns). In the Pacific, Air New Zealand operates to the Cook Islands, Samoa, Fiji, Tonga, Tahiti, Niue, Norfolk Island and New Caledonia. Services to Europe are offered on both an own-aircraft (London) and code-share basis. Countries to which Air New Zealand code-shares are Austria, Belgium, Denmark, Germany, Ireland, Italy, Netherlands, Sweden, Switzerland and the United Kingdom. Air New Zealand operates to Singapore. Japan (Tokyo, Osaka and Nagoya) and Hong Kong, and offers code-share services to Taipei, Bangkok and Kuala Lumpur. Own-aircraft services are also operated to Honolulu, Los Angeles and San Francisco and code-share services are offered to a variety of other points in the United States, as well as to Montreal, Calgary, Vancouver and Toronto. Code-share services are also offered to Guadalajara and Mexico City. Freedom Air International, an Air New Zealand subsidiary, offers budget services across the Tasman and to Fiji. Pacific Blue Airlines (NZ) Ltd., a subsidiary of Australian-based Virgin Blue Airlines, also offers budget services across the Tasman and to Pacific destinations. There were 874,738 visitor arrivals from Australia in the year ending 31 December 2005 and 941,151 departing New Zealanders who indicated that Australia was the destination in which they expected to spend most time. Table 23.02 lists foreign airlines operating in New Zealand at 1 December 2005.
Table 23.02. Foreign airline operations
By date of commencement and routes
served
At 1 December 2005
| Dale commenced | Airline | Routes now served |
|---|---|---|
1American Airlines (with Qantas): Air Canada, Austrian Airlines, Japan Airlines, Mexicana and United Airlines (with Air New Zealand): British Airways (with Qantas and Cathay Pacific): KLM (with Malaysia Airlines); and Lufthansa (with Air New Zealand and Thai Airways) serve New Zealand on a code-share basis only. Thai Airways and Singapore Airlines operate their own aircraft to New Zealand and also code-share with Air New Zealand, Qantas operates its own aircraft to New Zealand and also code-shares with LAN Airlines, Air Pacific and Air Tahiti Nui. Air Tahiti Nui operates its own aircraft to New Zealand and also code-shares with Qantas to Sydney. 2American Airlines began services to New Zealand in 1970, but ceased operating in 1974. Services were provided again between February 1990 and March 1992. The airline now code-shares with Qantas. Source: Ministry of Transport | ||
| 1 Apr 1961 | Qantas1 | Sydney/Melbourne/Brisbane-Auckland/Christchurch/Wellington |
| Sydney-Queenstown | ||
| Adelaide-Auckland | ||
| Sydney-Auckland-Los Angeles | ||
| Brisbane-Auckland-Los Angeles | ||
| Sydney-Auckland-Santiago | ||
| Auckland-Nadi | ||
| Auckland-Papeete | ||
| 4 Apr 1963 | British Airways1 | London-Los Angeles-Auckland |
| London-Hong Kong-Auckland | ||
| London-Sydney-Auckland/Wellington/Christchurch | ||
| London-Melbourne-Auckland/Wellington/Christchurch | ||
| 1 Oct 1974 | Air Pacific1 | Suva/Nadi-Auckland |
| 1 May 1976 | Singapore Airlines1 | Singapore-Auckland/Christchurch |
| 1 Jul 1980 | Japan Airlines1 | Tokyo-Auckland |
| Tokyo-Christchurch-Auckland | ||
| Osaka-Auckland | ||
| Nagoya-Auckland | ||
| 3 Dec 1985 | Cathay Pacific1 | Hong Kong-Auckland |
| 20 Dec 1985 | Aerolineas Argentinas | Buenos Aires-Auckland-Sydney |
| 11 Feb 1986 | United Airlines1 | Los Angeles-Auckland-Melbourne/Sydney/Brisbane/Cairns/Rarotonga/Nadi/Apia |
| Los Angeles-Auckland-Wellington/Christchurch | ||
| Honolulu-Auckland | ||
| San Francisco-Auckland | ||
| Los Angeles-Christchurch | ||
| Los Angeles-Sydney-Wellington/Christchurch/Queenstown | ||
| 8 Nov 1987 | Air Caledonie International | Noumea-Auckland |
| 5 Nov 1987 | Thai Airways' | Bangkok-Auckland |
| 4 Nov 1988 | Garuda Indonesia | Denpasar-Brisbane-Auckland |
| 1 Nov 1989 | Air Vanuatu | Port Vila-Auckland |
| 5 Dec 1989 | Malaysia Airlines1 | Kuala Lumpur-Auckland |
| 29 Oct 1991 | Lufthansa1 | Frankfurt/Munich-Los Angeles-Auckland |
| Frankfurt-Singapore-Auckland | ||
| Frankfurt-Hong Kong-Auckland | ||
| Frankfurt/Munich-Bangkok-Auckland | ||
| 3 Nov 1993 | Korean Air | Seoul-Auckland |
| 7 Nov 1993 | EVA Air | Taipei-Auckland |
| 1 Nov 1995 | American Airlines1,2 | Los Angeles-Auckland-Melbourne/Sydney/Brisbane |
| Los Angeles-Auckland-Wellington/Christchurch | ||
| Los Angeles-Sydney-Christchurch | ||
| 5 July 1996 | LAN Airlines' (formerly LAN Chile) | Santiago-Auckland-Sydney |
| 27 Mar 1997 | Asian Express | Auckland-Sydney (freight) |
| 1 Sep 1998 | Air Canada1 | Montreal/Calgary/Vancouver/Toronto-Los Angeles/San Francisco-Auckland-Brisbane/Cairns/Perth/Melbourne/Sydney |
| Vancouver-Honolulu-Auckland | ||
| Montreal/Calgary/Vancouver/Toronto-Los Angeles-Christchurch | ||
| Vancouver-Honolulu-Sydney-Auckland/Wellington/Christchurch | ||
| 18 Sep 1999 | Cargolux | Luxembourg-Damascus-Singapore-Melbourne-Auckland- |
| Hong Kong-Abu Dhabi-Barcelona-Luxembourg (freight) | ||
| Luxembourg-Kuala Lumpur-Melbourne-Auckland-Los Angeles-Luxembourg | ||
| 16 Dec 1999 | Mexicana1 | Mexico City/Guadalajara-Los Angeles-Auckland |
| 24 Aug 2000 | Air Tahiti Nui1 | Papeete-Auckland-Sydney |
| 29 Oct 2000 | KLM Royal Dutch Airlines1 | Amsterdam-Kuala Lumpur-Auckland |
| 1 July 2001 | Singapore Airlines Cargo | Singapore-Sydney-Auckland-Singapore (freight) |
| Singapore-Sydney-Auckland-Jakarta-Singapore (freight) | ||
| 1 Aug 2003 | Emirates Airline | Dubai-Bangkok-Sydney-Auckland |
| Dubai-Melbourne-Auckland | ||
| Dubai-Singapore-Brisbane-Auckland | ||
| Dubai-Sydney-Christchurch | ||
| 26 Oct 2003 | Austrian Airlines1 | Vienna-Kuala Lumpur-Sydney-Auckland/Wellington/Christchurch |
| Vienna-Singapore-Melbourne-Auckland/Wellington/Christchurch | ||
| 27 Oct 2003 | Royal Brunei Airlines | Bandar Seri Begawan-Brisbane-Auckland |
| 19 Mar 2005 Pacific Blue Airlines (Aust) | Brisbane-Auckland-Rarotonga | |
| Brisbane-Auckland-Tonga | ||
| Brisbane-Wellington | ||
| Sydney-Auckland-Tonga | ||
| 30 Oct 2005 | Polynesian Blue | Apia-Auckland |
The New Zealand railway network spans 3,898 kilometres, from Otiria in the north to Bluff in the south, and includes 149 tunnels and 2,178 bridges. More than 500 kilometres of the network is electrified. The track is narrow gauge of 1,067 millimetres.
Since 1962, the network has included inter-island rail ferries connecting the North and South Island sections of the network.
The Railways Department was reorganised in 1982 to become a government-owned corporation with a commercial mandate.
The same year, the government began deregulation of the transport industry, removing statutory protections for rail against competition by road.
In 1990, the operating assets of the Railways Corporation were transferred to a limited liability company under government ownership, New Zealand Rail Ltd. In 1993, the company was sold to a private consortium comprising Wisconsin Central Transportation Corporation and two investment groups. Three years later, the new owners made a public offering of shares in Tranz Rail Holdings, listing the company on the New Zealand Stock Exchange and the NASDAQ market in the United States.
The process of deregulation, commercialisation and privatisation saw a reduction in the number of employees, from 21,000 with the Railways Department in 1982 to 3,757 with Tranz Rail in 2002.
After the sale in 1993, the New Zealand Railways Corporation continued as a residual government body with two principal activities: to manage all known litigation, contingent issues and statutory obligations; and to manage the rail corridor lease with Tranz Rail and the lease of other Crown land held for operational rail purposes.
During the 1990s, Tranz Rail expanded into new markets, including movement of bulk milk to dairy processing plants and establishment of New Zealand's first inland port south of Auckland. The new port, a joint development with the Port of Tauranga, is connected by train with Tauranga, creating a significant new line of containerised freight business.
In 2003, Toll Holdings Limited, an Australian-based transportation and logistics operator, acquired approximately 85 percent of the shares in Tranz Rail. As a result of Toll's offer for shares in Tranz Rail becoming unconditional, an agreement between Toll and the Crown was triggered, a key feature of which was the buy-back of track and associated infrastructure by the Crown.
The Crown undertook to invest $200 million in improving rail infrastructure, while Toll undertook to invest $100 million in new rolling stock.
In September 2004, ownership and management of the network and its assets was vested in the existing Railway Corporation of New Zealand, which adopted the trading name ONTRACK.
Under the agreement, Toll retains exclusive rights to the network for freight purposes, subject to meeting minimum tonnage levels annually. ONTRACK's remit is management and development of the network, control of track access to rail operators, and provision of advice to the government on railway matters.
In February 2006, ONTRACK took back control of infrastructure maintenance which had been contracted out. As a result, its staff increased from 150 to approximately 700. ONTRACK is currently a state-owned enterprise, but will become a Crown entity on enabling legislation being passed by parliament.
Haulage of coal is one of the main freight revenue earners for Toll NZ.
Toll NZ operates rail commuter services linking central Wellington with Johnsonville, Paraparaumu, the Hutt Valley, Palmerston North and Master ton.
Passenger services. Toll NZ operates commuter services in Wellington, linking the central city with Johnsonville, Paraparaumu, the Hutt Valley, Palmerston North and Masterton. From August 2004, commuter services in Auckland were provided by Connex Auckland, which was re-branded as Veolia Transport Auckland in March 2006.
Freight transport. Toll NZ's freight business is carried out under the brand name Toll TranzLink. In the 2003/04 financial year, overall trading revenue for Toll NZ was $678 million. The bulk of freight revenue was from agriculture and food products, followed by manufactured products, forest products and coal.
Table 23.03 provides a statistical summary of New Zealand railways.
Table 23.03. New Zealand railways
Statistical
summary
At 30 June
| Category | 1998 | 1999 | 2000 | 2001 | 2002 | 2003 | 2004 |
|---|---|---|---|---|---|---|---|
1As a result of Tranz Rail's sale of the Auckland corridor to the Crown in December 2000. Toll NZ has freight operating rights, but does not own. 91 kilometres of the route. 2Excludes Auckland region. 3Includes the Capital Connection between Palmerston North and Wellington. - nil or zero.. not available Source: Toll NZ | |||||||
| North Island1 | |||||||
| (kilometres) | 2,416 | 2,416 | 2,416 | 2,410 | 2,410 | 2,410 | 2,410 |
| Electrified (kilometres) | 506 | 506 | 506 | 506 | 506 | 506 | 506 |
| South Island | |||||||
| (kilometres) | 1,488 | 1,488 | 1,488 | 1488 | 1,488 | 1,488 | 1,488 |
| Electrified (kilometres) | - | - | - | - | - | - | - |
| Bridges | |||||||
| Number | 2,178 | 2,178 | 2,178 | 2,178 | 2,178 | 2,178 | 2,178 |
| Kilometres | 75 | 75 | 75 | 75 | 75 | 75 | 75 |
| Tunnels, | |||||||
| Number | 149 | 149 | 149 | 149 | 149 | 149 | 149 |
| Kilometres | 87.3 | 87.3 | 87.3 | 87.3 | 87.3 | 87.3 | 87.3 |
| Locomotives | |||||||
| Diesel/diesel-electric... | 218 | 188 | 187 | 184 | 131 | 131 | 144 |
| Electric | 27 | 27 | 27 | 27 | 23 | 14 | 17 |
| Rolling stock | |||||||
| Freight | 6,382 | 6,004 | 5,948 | 5,606 | 4,321 | 4,048 | 4,176 |
| Passenger (including motorised) | 328 | 321 | 321 | 314 | 1772 | 1772 | 1772 |
| Passengers carried | |||||||
| Long distance3 | 458,000 | 466,400 | 465.800 | 513,500 | .. | .. | 560.000 |
| Suburban | 11,293,000 | 11,422,000 | 12,118,000 | 12,577,000 | 12,300,000 | 12,300,000 | 10,300,000 |
| Freight carried | |||||||
| (tonnes) | 11,706,000 | 12,900,000 | 14,699,000 | 14,461,000 | 14,330,000 | 14,822,000 | 14,800,000 |
Central government invests more than $2 billion in land transport each year, mostly through the National Land Transport Fund. Regional and territorial authorities invest a further $400 million, mainly funded from rates.
There are about 92,800 kilometres of formed roads and streets and, as at 30 June 2005, about 3.8 million registered motor vehicles.
Statistics New Zealand estimated that at March 2005 there were 5,020 full-time equivalent people engaged in the provision of road passenger transport and 19,140 people engaged in providing road freight transport. These estimates were provided from the Quarterly Employment Survey, which measures a sample of the population.
Commercial road users are regulated through a system of quality controls which focus primarily on safety regulation, although there is an increasing emphasis on environmental performance as well.
Land Transport New Zealand was established in December 2004 from the merger of Transfund New Zealand and the Land Transport Safety Authority. It is responsible for land transport funding and for managing land transport safety and sustainability.
On 1 December 2004, the Land Transport Management Amendment Act 2004 disestablished Transfund New Zealand and the Land Transport Safety Authority and created Land Transport New Zealand (Land Transport NZ) to take responsibility for land transport funding and to promote land transport safety and sustainability.
Land Transport NZ is charged with helping deliver the government's vision, as set out in the New Zealand Land Transport Strategy, for ‘an integrated, safe, responsive and sustainable land transport system’.
Under the overarching theme of promoting land transport safety and sustainability. Land Transport NZ's functions include managing access through licensing and regulation, monitoring and communicating information, and funding development and operation.
Land Transport NZ works in partnership with the transport sector and other organisations – including industry and other interest groups – to develop an integrated approach to land transport.
Land Transport NZ receives funding from the government's National Land Transport Fund for the National Land Transport Programme (NLTP). The NLTP is the mechanism through which Land Transport NZ allocates funds across construction and maintenance of state highways and local roads; passenger transport; rail freight and barging; travel behaviour change; transport demand management; walking and cycling; projects which support regional development: administration activities; promotion, information and education; and New Zealand Police land transport activities.
Land Transport New Zealand's website is www.landtransport.govt.nz
New Zealand's state highway network of more than 10,800 kilometres includes 173 kilometres of motorways and expressways.
Transit New Zealand, a Crown entity established in October 1989, manages, maintains and develops New Zealand's state highway network with an annual budget of more than $1 billion. The 10,894-kilometre network includes 173 kilometres of motorways and expressways.
With a replacement value of $14.9 billion, Transit's network makes up 12 percent of New Zealand's total road length, but carries 49 percent of the traffic.
The Land Transport Management Act (LTMA), passed in November 2003, sets Transit the objective of operating the state highway system in a way that contributes to an integrated, safe, responsive and sustainable land transport system. The act further states that in meeting its objective, Transit has to exhibit a sense of social and environmental responsibility.
Transit pursues its commitments under the LTMA by being actively involved in policy and plan development at regional and local levels and by contributing to individual development applications. This involves working alongside local authorities, other transportation agencies and local communities on a daily basis.
An annual land transport forecast, covering major regional projects, smaller works, walking and cycling projects and a maintenance programme, is consulted on early in the calendar year. The final, prioritised programme, as approved by Transit's board, is submitted to Land Transport New Zealand for funding approval by the start of each financial year.
Transit does not employ its own construction and maintenance staff directly. Its staff of 360 work through professional consultants and contractors selected by competitive pricing principles to provide development and maintenance services for the state highway network.
Transit, in association with consultants and contractors, has won many awards. They cover international environmental awards, road projects, asset management and project management. Transit regularly hosts, or contributes to, international visits from road and transport agencies and also participates actively in the international arena, both to contribute its expertise and to bring the benefits of international best practice to New Zealand.
The Transit New Zealand website is www.transit.govt.nz
Transit New Zealand, 12 regional councils and 74 provincial road controlling authorities manage New Zealand's land transport network.
Tables 23.04 and 23.05 show expenditure on state highways and public roads respectively.
Table 23.04. Expenditure on state highways
Years
ending 30 June
| Class of expenditure | 1998 | 1999 | 2000 | 20012 | 2002 | 20033 | 2004 | 2005 |
|---|---|---|---|---|---|---|---|---|
1Includes the cost of flood damage repairs. 2From the year ending 30 June 2001, public roading expenditure includes the funding of public transport and alternative-to-road projects. 3From the year ending 30 June 2003. public roading expenditure includes the funding of walking and cycling projects. Source: Land Transport New Zealand | ||||||||
| $(000) | ||||||||
| Construction and improvement | 199,237 | 246,355 | 302,864 | 265,151 | 280,259 | 268,886 | 351,164 | 438,696 |
| Bridges | 13,898 | 6,587 | 6,999 | 10,952 | 3,879 | 7,960 | 7,241 | 8,157 |
| Maintenance, repairs1, etc | 256,643 | 262,742 | 283,270 | 272,447 | 278,503 | 299,267 | 329,310 | 362,474 |
| Total | 469,778 | 515,684 | 593,133 | 548,550 | 562,641 | 576,113 | 687,715 | 809,327 |
Table 23.05. Expenditure on public roads
Years
ending 30 June
| Item | 1998 | 1999 | 2000 | 20012 | 2002 | 20033 | 2004 | 2005 |
|---|---|---|---|---|---|---|---|---|
1Expenditure is the Land Transport New Zealand contribution and does not include the local authority contribution. The rate of assistance to local authorities for construction work varies from 43 to 83 percent. 2From the year ending 30 June 2001, public roading expenditure includes the funding of public transport and alternative-to-roading projects. 3From the year ending 30 June 2003. public roading expenditure includes the funding of walking and cycling projects. Source: Land Transport New Zealand | ||||||||
| $(000) | ||||||||
| State highways expenditure | 469,778 | 515,684 | 593,133 | 548,550 | 562,641 | 576,113 | 687,715 | 809,327 |
| Local authority roading expenditure1 | 287,570 | 297,889 | 290,926 | 297,788 | 319,163 | 371,839 | 423,992 | 497,309 |
| Total | 757,348 | 813,573 | 884,059 | 846,338 | 881,804 | 947,952 | 1,111,707 | 1,306,636 |
As Table 23.06 shows, there were 16,820 kilometres of urban roads, 10,894 kilometres of state highways and 65,434 kilometres of rural roads, making 93,148 kilometres of developed reading at 30 June 2005.
Table 23.06. Formed roads and streets
| Year/nature of surface | Local authority roading | State highways, motorways | Total | |
|---|---|---|---|---|
| Urban roads | Rural roads | |||
| Source: Land Transport New Zealand | ||||
| Kilometres | ||||
| At 30 June 1997 | ||||
| Paved or sealed | 15,128 | 30,845 | 10,365 | 56,338 |
| Metal or gravel | 445 | 35,062 | 121 | 35,628 |
| Total maintained roads | 15,573 | 65,907 | 10,486 | 91,966 |
| At 30 June 1998 | ||||
| Paved or sealed | 15,238 | 30,764 | 10,500 | 56,502 |
| Metal or gravel | 442 | 35,127 | 71 | 35,640 |
| Total maintained roads | 15,680 | 65,891 | 10,571 | 92,142 |
| At 30 June 1999 | ||||
| Paved or sealed | 15,520 | 30,968 | 10,540 | 57,028 |
| Metal or gravel | 442 | 34,540 | 65 | 35,047 |
| Total maintained roads | 15,962 | 65,508 | 10,605 | 92,075 |
| At 30 June 2000 | ||||
| Paved or sealed | 15,590 | 31,474 | 10,707 | 57,771 |
| Metal or gravel | 419 | 33,809 | 54 | 34,282 |
| Total maintained roads | 16,009 | 65,283 | 10,761 | 92,053 |
| At 30 June 2001 | ||||
| Paved or sealed | 15,708 | 31,762 | 10,716 | 58,186 |
| Metal or gravel | 414 | 33,549 | 58 | 34,021 |
| Total maintained roads | 16,122 | 65,311 | 10,774 | 92,207 |
| At 30 June 2002 | ||||
| Paved or sealed | 15,809 | 32,017 | 10,736 | 58,562 |
| Metal or gravel | 418 | 33,354 | 47 | 33,819 |
| Total maintained roads | 16,227 | 65,371 | 10,783 | 92,381 |
| At 30 June 2003 | ||||
| Paved or sealed | 15,929 | 32,258 | 10,750 | 58,937 |
| Metal or gravel | 409 | 33,107 | 41 | 33,557 |
| Total maintained roads | 16,338 | 65,365 | 10,791 | 92,494 |
| At 30 June 2004 | ||||
| Paved or sealed | 16,166 | 32,539 | 10,798 | 59,503 |
| Metal or gravel | 402 | 32,816 | 39 | 33,257 |
| Total maintained roads | 16,568 | 65,355 | 10,837 | 92,760 |
| At 30 June 2005 | ||||
| Paved or sealed | 16,423 | 32,819 | 10,838 | 60,080 |
| Metal or gravel | 397 | 32,615 | 56 | 33,068 |
| Total maintained roads | 16,820 | 65,434 | 10,894 | 93,148 |
Transport licensing provisions are contained in the Transport Services Licensing Act 1989, which provides for a system of road transport licensing that operates on a qualitative basis for goods, passenger, rental and vehicle recovery services.
The act adopts the concept of ‘a fit and proper person’ as the principal criterion for road transport operators. Anyone who enters the industry needs to meet certain minimum standards of quality.
Railway operator licensing requirements are now contained in the Railways Act 2005, which recognises changes in the operation and ownership of rail in New Zealand.
All railway operators, as well as rail access providers, are required to develop a safety case to cover standards, practices and procedures. These safety cases are approved by rail regulator Land Transport New Zealand.
All vehicles using public roads in New Zealand are required to be registered. An annual relicensing charge is payable, which includes a licence fee, accident compensation levy, administration and label fee, goods and services tax and, in some cases, a transport licence fee.
The country's vehicles are relicensed progressively throughout the year.
Annual relicensing charges for petrol-powered vehicles for the year ending 30 June 2005 were:
Motorcars, $217.05.
Motorcycles (private use-60cc or less), $263,80.
Motorcycles (more than 60cc), $275.05.
Rental cars and taxis, $242.55.
Trucks, vans and utilities (private passenger), $217.05 to $218.55.
Trucks, vans and utilities (subject to transport licence fee), $241.05 to $242.55.
Tractors (non-exempt), $90.65.
Motor vehicles exempted from the annual licence fee include a variety of machines such as pedestrian-controlled goods service vehicles, motor vehicles propelled and supported solely by self-laying tracks, vehicles used in a declared road construction zone and vehicles used on a road that is not a public highway. These vehicles are still required to be registered and licensed.
Table 23.07 shows registrations of new commercial vehicles in New Zealand from 1996 to 2005. Not included in the table are new tractors.
Table 23.07. Registration of new commercial vehicles
By gross weight in kilograms
Years ending 31 December
| Year | 2,500 or less | 2,501 to 4,500 | 4,501 to 9,000 | 9,001 to 14,500 | 14,501 and over | Omnibus and service coaches | Total |
|---|---|---|---|---|---|---|---|
| Source: Land Transport New Zealand | |||||||
| 1996 | 10,859 | 12,702 | 2,654 | 882 | 1,747 | 1,000 | 29,844 |
| 1997 | 9,005 | 9,718 | 2,549 | 866 | 1,566 | 816 | 24,520 |
| 1998 | 6,301 | 9,456 | 2,038 | 781 | 1,184 | 780 | 20,540 |
| 1999 | 5,737 | 11,290 | 2,036 | 865 | 1,566 | 834 | 22,328 |
| 2000 | 4,859 | 13,375 | 1,738 | 674 | 1,881 | 764 | 23,291 |
| 2001 | 4,439 | 14,133 | 1,504 | 779 | 1,777 | 839 | 23,463 |
| 2002 | 4,729 | 18,256 | 1,929 | 1,040 | 2,245 | 1,120 | 29,319 |
| 2003 | 4,813 | 20,851 | 2,355 | 1,160 | 2,747 | 1,093 | 33,019 |
| 2004 | 4,669 | 23,997 | 3,140 | 1,566 | 3,168 | 1,329 | 37,869 |
| 2005 | 4,140 | 25,363 | 2,945 | 1,492 | 3,140 | 1,325 | 38,405 |
Table 23.08 shows registrations of new cars and station wagons from 1991 to 2005.
Table 23.08. Registrations of new cars and station wagons
Years ending 31 December
| Year | cc rating | ||||||||
|---|---|---|---|---|---|---|---|---|---|
| 850 and under | 851 to 1300 | 1301 to 1600 | 1601 to 2000 | 2001 to 5000 | 5001 and over | Total | Vehicles previously | New motor cycles | |
1Included in total. Source: Land Transport New Zealand | |||||||||
| 1991 | 806 | 10,523 | 35,361 | 41,601 | 14,497 | 178 | 102,966 | 47,351 | 4,042 |
| 1992 | 592 | 7,209 | 30,241 | 36,679 | 17,174 | 205 | 92,100 | 39,146 | 2,469 |
| 1993 | 453 | 6,674 | 30,943 | 38,701 | 20,734 | 158 | 97,663 | 43,841 | 2,601 |
| 1994 | 494 | 6,676 | 38,936 | 47,744 | 29,691 | 312 | 123,853 | 62,088 | 3,337 |
| 1995 | 579 | 5,246 | 46,952 | 56,035 | 37,375 | 469 | 146,656 | 80,976 | 3,451 |
| 1996 | 586 | 3,799 | 56,066 | 67,402 | 47,829 | 496 | 176,178 | 111,764 | 3,812 |
| 1997 | 694 | 2,680 | 45,275 | 58,379 | 48,256 | 315 | 155,599 | 97,041 | 4,078 |
| 1998 | 608 | 2,685 | 41,669 | 59,868 | 48,932 | 332 | 154,094 | 99,937 | 4,067 |
| 1999 | 118 | 3,949 | 48,418 | 76,899 | 59,208 | 721 | 189,313 | 131,118 | 3,849 |
| 2000 | 120 | 4,120 | 41,114 | 69,834 | 57,146 | 1,408 | 173,742 | 116,124 | 3,598 |
| 2001 | 73 | 4,070 | 41,622 | 76,744 | 62,498 | 1,848 | 186,855 | 128,693 | 3,575 |
| 2002 | 33 | 4,459 | 41,110 | 76,268 | 76,214 | 2,420 | 200,504 | 136,418 | 4,118 |
| 2003 | 106 | 5,790 | 43,228 | 82,869 | 91,752 | 3,680 | 227,425 | 156,972 | 4,967 |
| 2004 | 213 | 5,786 | 41,138 | 79,879 | 98,096 | 3,685 | 228,797 | 154,042 | 6,341 |
| 2005 | 129 | 6,869 | 42,561 | 84,801 | 92,874 | 3,079 | 230,313 | 152,488 | 7,654 |
Table 23.09 shows the number of licensed motor vehicles by vehicle type for the years 1998 to 2005.
Table 23.09. Licensed motor vehicles
At 30
June
| Type of vehicle | 1998 | 1999 | 2000 | 2001 | 2002 | 2003 | 2004 | 2005 |
|---|---|---|---|---|---|---|---|---|
| Source: Land Transport New Zealand | ||||||||
| Cars | 1,762,813 | 1,868,297 | 1,886,982 | 1,916,685 | 1,970,403 | 2,036,804 | 2,118,240 | 2,189,187 |
| Rental cars | 13,154 | 15,117 | 18,022 | 17,178 | 18,119 | 19,775 | 22,128 | 22,604 |
| Taxis | 6,572 | 7,280 | 7,588 | 7,108 | 7,507 | 7,795 | 8,089 | 8,172 |
| Trucks | 359,411 | 371,365 | 368,624 | 363,166 | 366,918 | 374,361 | 386,295 | 399,843 |
| Buses and coaches | 10,950 | 11,748 | 12,397 | 12,709 | 13,379 | 14,107 | 14,932 | 15,671 |
| Trailers | 308,751 | 339,325 | 354,487 | 362,225 | 373,940 | 386,005 | 397,113 | 408,982 |
| Motorcycles | 38,151 | 40,664 | 37,794 | 35,939 | 36,045 | 33,601 | 34,873 | 37,717 |
| Mopeds | 8,034 | 7,495 | 7,253 | 7,364 | 7,395 | 7,881 | 8,617 | 10,282 |
| Tractors | 19,492 | 19,669 | 20,369 | 21,229 | 22,756 | 24,016 | 25,279 | 26,521 |
| Exempt vehicles | 6,348 | 6,628 | 7,369 | 7,706 | 8,195 | 8,825 | 9,708 | 10,328 |
| Miscellaneous | 14,119 | 15,090 | 15,096 | 15,225 | 16,644 | 17,557 | 19,206 | 20,946 |
| Total all vehicles | 2,547,795 | 2,702,678 | 2,735,981 | 2,766,534 | 2,841,301 | 2,930,727 | 3,044,480 | 3,150,253 |
Table 23.10 shows the number of people per licensed car or other motor vehicle in New Zealand. Figure 23.03 plots new tractor registrations since 1950, while Figure 23.04 shows ex-overseas cars as a proportion of total new car registrations.
Table 23.1. Licensed vehicles by population
At
30 June
| Year | Number of people in population per licensed car1 | Number of people in population per licensed motor vehicle2 |
|---|---|---|
1Includes cars and rental cars. 2Excludes trailers and exempt vehicles. Sources: Land Transport New Zealand Statistics New Zealand | ||
| 1998 | 2.15 | 1.71 |
| 1999 | 2.04 | 1.63 |
| 2000 | 2.03 | 1.62 |
| 2001 | 2.01 | 1.62 |
| 2002 | 1.98 | 1.60 |
| 2003 | 1.95 | 1.58 |
| 2004 | 1.90 | 1.54 |
| 2005 | 1.85 | 1.50 |
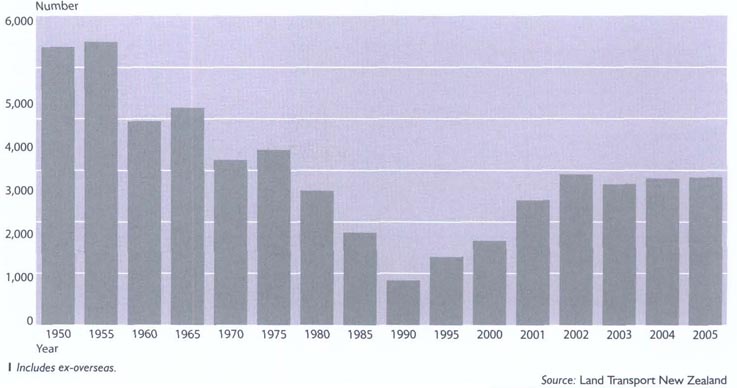
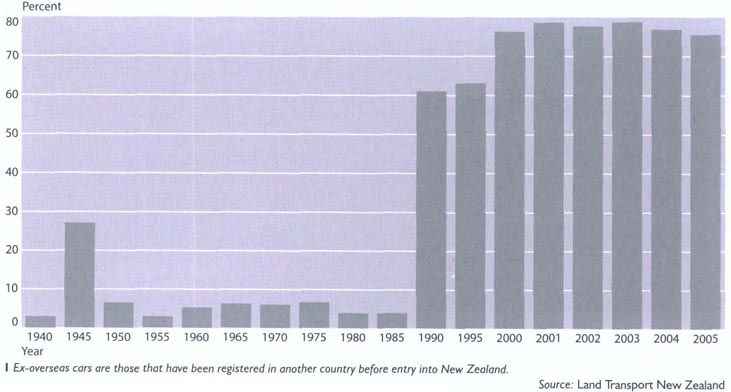
The Ministry of Economic Development operates two registers specifically concerned with motor vehicles – the Personal Property Securities Register (PPSR) under the Personal Property Securities Act 1999 and the Motor Vehicle Traders Register (MVTR) under the Motor Vehicle Sales Act 2003.
The Personal Property Securities Register is a form of electronic notice board where secured parties can record specific details about security interests in personal property, including vehicles. Registration in the PPSR is one way to secure priority over personal property subject to a security interest.
The PPSR was established in 2002 and replaced a number of existing securities registers, including the Motor Vehicle Securities Register and the Chattels Register. Buyers of motor vehicles can search the PPSR to see whether a security interest has been registered (indicating whether money is owed) in respect of a vehicle.
By December 2005, more than 6.2 million searches had been conducted on the PPSR, with around 67 percent of them relating to motor vehicles.
The PPSR includes private and commercial motor vehicles, motorcycles, trucks, trailers, caravans, farm vehicles and aircraft. Boats are also covered, except those exceeding 24 metres. The PPSR can be accessed at www.ppsr.govt.nz
The Motor Vehicle Traders Register – While the PPSR is concerned with security interests in vehicles, the MVTR contains essential information about whether someone is a registered motor vehicle trader. Buying a motor vehicle from a registered motor vehicle trader provides improved protection for consumers.
The MVTR holds information about who is registered and details of each trader's business, such as its physical address. The MVTR includes a list of banned motor vehicle traders. The MVTR was established by the Motor Vehicle Sales Act 2003 (which replaced the Motor Vehicle Dealers Act 1975) on 15 December 2003.
A wider definition of ‘motor vehicle trader’ means more traders must register under the new law. People who import more than three vehicles, or who sell more than six vehicles in a 12-month period, must be registered. The register can be accessed at www.motortraders.med.govt.nz
Buses 10 years old or newer make up 39 percent of the New Zealand fleet.
Land Transport New Zealand is charged with helping deliver the government's vision, as set out in the New Zealand Transport Strategy, for ‘an affordable, integrated, safe, responsive and sustainable land transport system’.
Land Transport New Zealand is the government's chief adviser on land transport safety, and suggests policy, develops standards and reviews land transport safety systems in consultation with industry groups.
Road laws are enforced by the New Zealand Police, who investigate serious and fatal accidents, enforce laws regarding heavy traffic and allowable weights of vehicles and loads, and assist with licensing of road transport services, such as taxis, buses and tow trucks.
In 2005, the road toll dropped to its lowest since 1963, with police maintaining an emphasis on speed, alcohol and restraint use.
Driver licensing. A New Zealand driver's licence is valid for up to 10 years. At ages 75 and 80, and every two years thereafter, the holder is required to undergo a medical check. From 4 December 2006, the previous mandatory older driver test no longer applies. A graduated system for obtaining a driver's licence involves a number of restrictions on learner drivers to ensure they are protected from high-risk situations until they have obtained experience on the road. Incentives to attend driver education courses are available to all first applicants for licences. The system has three stages: learner, restricted and full licence. A full licence test must be passed in order to graduate to a full licence.
Inspection of motor vehicles. All vehicles using New Zealand roads must be inspected regularly to ensure mechanical and structural fitness. They are inspected every six months, except for vehicles first registered after 1 August 1987 and less than six years old, which may be inspected every 12 months. Most lightweight vehicles require a warrant of fitness, which can be issued at approved garages. All heavy vehicles, with minor exceptions, undergo a more exacting examination for a certificate of fitness, which, in respect of passenger service buses, has special regard for the safety and comfort of passengers. Taxicabs and rental vehicles also require a certificate of fitness, which can be issued by approved testing agencies only. Table 23.11 shows the age of major motor vehicle types in New Zealand at 31 December 2005.
Safety belts. Wearing safety belts is compulsory in New Zealand for drivers and front-seat passengers in most classes of light vehicles registered after January 1955. It is compulsory for rear-seat passengers to wear safety belts in all cars. All children under five must be properly restrained by an approved child restraint when travelling in cars and vans. Drivers must make sure that children between the ages of five and seven are safely restrained if there is a child restraint or safety belt in the vehicle. If no restraint is available, children must be seated in the rear of the car. Drivers are also responsible for making sure children between the ages of eight and 14 use safety belts when available. All motor cyclists and pillion riders must wear safety helmets at all speeds. Bicycle helmets are also compulsory.
Alcohol impairment. Police have several tests available to deal with drivers affected by alcohol. Any driver may be required to give a passive test at any time. A breath-screening test may be administered after a police officer has detected alcohol on a driver's breath using a passive alcohol detector. If this screening test is positive, the person may be required to give an evidential breath test. If this is also positive, the person has the option of either accepting the breath test reading or providing a blood sample for analysis. A driver commits an offence and is liable for prosecution if either:
Breath-alcohol concentration as recorded on an evidential breath-testing device exceeds 400 micrograms of alcohol per litre of breath, or 150 micrograms of alcohol per litre of breath in the case of a person under the age of 20.
Blood-alcohol concentration exceeds 80 milligrams of alcohol per 100 millilitres of blood, or 30 milligrams of alcohol per 100 millilitres of blood in the case of a person under the age of 20.
Table 23.11. Age profile of major vehicle types
At 31 December 2005
| Age in whole years | Cars | Trucks | Buses | Motor caravans | Motor-cycles | Mopeds | Trailers |
|---|---|---|---|---|---|---|---|
| Source: Land Transport New Zealand | |||||||
| Under 1 | 76,842 | 22,845 | 5X0 | 555 | 5,058 | 4,192 | 24,675 |
| 1 | 76,345 | 23,130 | 645 | 852 | 4,605 | 2,218 | 24,373 |
| 2 | 73,644 | 20,515 | 490 | 682 | 3,650 | 1,205 | 22,068 |
| 3 | 69,482 | 18,708 | 502 | 399 | 3,215 | 745 | 19,642 |
| 4 | 67,766 | 16,511 | 562 | 750 | 2,889 | 624 | 18,323 |
| 5 | 77,779 | 17,148 | 495 | 430 | 2,759 | 454 | 18,011 |
| 6 | 89,090 | 15,304 | 661 | 560 | 2,769 | 420 | 16,596 |
| 7 | 114,630 | 14,416 | 602 | 295 | 2,856 | 400 | 16,004 |
| 8 | 166,097 | 18,894 | 747 | 261 | 2,504 | 268 | 15,232 |
| 9 | 240,036 | 21,587 | 1,004 | 502 | 1,966 | 263 | 14,881 |
| 10 | 193,679 | 19,869 | 902 | 611 | 1,574 | 290 | 15,090 |
| 11 | 193,592 | 22,796 | 870 | 870 | 1,502 | 222 | 12,979 |
| 12 | 159,718 | 19,918 | 701 | 661 | 1,345 | 176 | 11,417 |
| 13 | 176,581 | 20,844 | 800 | 733 | 1,586 | 439 | 11,111 |
| 14 | 152,503 | 22,105 | 975 | 811 | 2,126 | 364 | 10,416 |
| 15 | 148,834 | 28,169 | 997 | 1,077 | 2,464 | 560 | 17,044 |
| 16 | 130,141 | 24,720 | 956 | 908 | 2,916 | 503 | 13,294 |
| 17 | 90,931 | 20,679 | 793 | 833 | 3,559 | 562 | 12,360 |
| 18 | 67,871 | 17,838 | 722 | 760 | 3,645 | 641 | 11,310 |
| 19 | 53,825 | 15,630 | 751 | 817 | 3,457 | 687 | 11,615 |
| 20 | 44,865 | 14,952 | 557 | 1,187 | 2,295 | 445 | 15,046 |
| 21 | 34,748 | 12,898 | 455 | 610 | 1,873 | 304 | 11,381 |
| 22 | 19,890 | 8,348 | 328 | 540 | 1,733 | 232 | 9,168 |
| 23 | 15,342 | 7,708 | 257 | 361 | 1,800 | 374 | 9,687 |
| 24 | 12,012 | 5,809 | 242 | 281 | 1,761 | 294 | 9,066 |
| 25 | 9,391 | 4,772 | 206 | 272 | 1,584 | 357 | 15,761 |
| 26 | 7,714 | 3,749 | 242 | 227 | 1,290 | 227 | 10,954 |
| 27 | 6,963 | 3,019 | 236 | 208 | 780 | 91 | 13,076 |
| 28 | 5,089 | 2,706 | 173 | 247 | 618 | 92 | 13,247 |
| 29 | 5,010 | 2,404 | 169 | 265 | 719 | 73 | 15,416 |
| 30 | 5,617 | 1,886 | 103 | 271 | 830 | 97 | 14,947 |
| 31 | 8,220 | 1,714 | 75 | 217 | 801 | 101 | 12,280 |
| 32 | 7,564 | 1,572 | 45 | 252 | 1,013 | 74 | 10,010 |
| 33 | 7,180 | 1,424 | 44 | 250 | 625 | 85 | 7,399 |
| 34 | 6,085 | 1,356 | 42 | 250 | 537 | 80 | 5,671 |
| 35 | 5,692 | 1,137 | 53 | 181 | 334 | 63 | 7,438 |
| 36 | 4,151 | 774 | 33 | 153 | 298 | 37 | 4,424 |
| 37 | 3,393 | 551 | 32 | 138 | 243 | 33 | 3,993 |
| 38 | 3,752 | 528 | 34 | 166 | 157 | 43 | 3,742 |
| 39 | 3,774 | 709 | 29 | 166 | 195 | 37 | 4,171 |
| 40 | 3,629 | 578 | 19 | 122 | 162 | 38 | 4,162 |
| 41 to 50 | 17,616 | 3,401 | 123 | 887 | 1,378 | 237 | 15,692 |
| 51 and over | 14,292 | 3,222 | 43 | 378 | 2,694 | 75 | 3,299 |
| Total vehicles | 2,671,375 | 486,843 | 18,295 | 20,996 | 80,165 | 18,722 | 536,471 |
| Mean age (years) | 11.91 | 12.63 | 13.41 | 17.64 | 15.39 | 9.97 | 17.00 |
Speed limits. New Zealand's reading network is essentially a two-way system with one lane each way. Management of speed is, therefore, a critical aspect of traffic safety. Maximum speed limits for highways and motorways are 100 kilometres per hour (km/h) for cars, motorcycles, vans and light vehicles; 90km/h for vehicles towing trailers and all heavy vehicles, including buses. A general speed limit of 50km/h is fixed in all urban traffic areas. In recent years, road controlling authorities have been given more flexibility in setting speed limits and may set limits from 10 to 100km/h provided they are safe and appropriate for particular roads.
Speed cameras, radar and lasers. Under the ‘anywhere/anytime’ policy adopted in December 2003, mobile and fixed speed cameras can be located anywhere and at any time, with all signage removed, excluding hidden or camouflaged cameras. Police also use mobile mode radar and laser speed measuring equipment to supplement speed cameras. The laser equipment is particularly useful in heavy traffic and multi-lane situations, where its ability to isolate and measure individual vehicles permits targeting of speeding vehicles in traffic.
Traffic offences. Penalties are imposed by courts for driving and other offences under the Transport Act 1962, the Land Transport Act 1998 and attendant regulations. Breaches of certain laws are dealt with under an infringement system whereby a driver may pay an infringement fee within a specified time to avoid court proceedings. There is also a system whereby demerit points are automatically registered, according to a fixed scale, against people convicted of driving offences, or people who pay certain infringement fees. The director of Land Transport New Zealand may suspend a driver's licence for three months where 100 or more demerit points are received within two years. Some demerit points are awarded on a graduated scale, based on the speed a driver is detected travelling at above the limit. Table 23.12 shows the number of traffic offences and infringements in New Zealand for the years 2002–2005. Figure 23.05 shows the rate of traffic convictions per 10,000 population.
Figure 23.05. Traffic convictions
Rates per 10,000
of population
Years ending 31
December
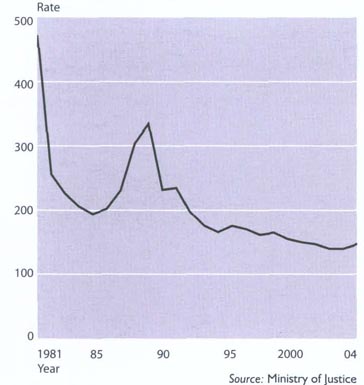
Source: Ministry of justice
Table 23.12. Traffic offences and infringements2
Years ending 30
June
| Category | 2002 | 2003 | 2004 | 2005 | Variance2 |
|---|---|---|---|---|---|
1Data as published in police annual reports. 2Variance refers to changes between years 2004 and 2005. 3Speeding – general is a new category, previously a combination of Speeding (Under 100 kph) and Speeding (Over 100 kph). Source: New Zealand Police | |||||
| Percent | |||||
| Drink/drive offences | 25,348 | 24,744 | 25,496 | 26,697 | 4.7 |
| Dangerous/reckless driving offences | 4,586 | 5,159 | 6,162 | 6,602 | 7.1 |
| Unsafe use of vehicle | 20,675 | 23,805 | 26,522 | 25,206 | -5 |
| Careless/inconsiderate driving or overtaking offences | 12,249 | 11,993 | 11,411 | 11,397 | -0.1 |
| Speeding – general3 | 249,133 | 349,469 | 394,940 | 363,949 | -7.8 |
| Speeding – trailer, towing, heavy motor vehicle | 11,650 | 14,710 | 13,177 | 14,167 | 7.5 |
| Speeding – speed camera | 458,622 | 488,714 | 479,164 | 416,492 | -13.1 |
| Failure to stop/give way | 31,396 | 36,054 | 49,165 | 44,840 | -8.8 |
| Failure to obey officer/fulfill duties | 18,322 | 18,746 | 19,549 | 17,956 | -8.1 |
| Vehicle licence infringement | 19,092 | 19,069 | 18,375 | 18,742 | 2 |
| Driving while disqualified | 8,213 | 8,217 | 8,653 | 9,061 | 4.7 |
| Certificate of fitness infringement | 94,260 | 100,761 | 107,898 | 107,265 | -0.6 |
| Driver licence and vehicle registration infringement | 222,907 | 255,933 | 283,555 | 281,381 | -0.8 |
| Driver hours/log book infringement | 3,626 | 3,783 | 4,594 | 3,375 | -26.5 |
| Seat belt | 40,224 | 66,977 | 89,671 | 77,897 | -13.1 |
| Safety helmet | 414 | 532 | 631 | 676 | 7.1 |
| Passenger/recovery/rental service vehicle | 2,055 | 1,813 | 1,726 | 2,206 | 27.8 |
| Vehicle condition | 16,281 | 21,173 | 26,410 | 26,888 | 1.8 |
| Vehicle noise/loading | 5,488 | 6,280 | 6,468 | 5,606 | -13.3 |
| Bicycle infringement | 2,148 | 2,774 | 3,142 | 3,012 | -4.1 |
| Cycle helmet | 5,399 | 8,673 | 10,038 | 9,551 | -4.9 |
| Pedestrian and other | 391 | 597 | 758 | 850 | 12.1 |
| Stock and vehicle bylaws offences | 234 | 237 | 82 | 56 | -31.7 |
| Local body bylaw infringements | 804 | 1,105 | 1,368 | 958 | -30 |
| Other transport offences | 8,744 | 10,391 | 8,130 | 6,151 | -24.3 |
| Total | 1,262,261 | 1,481,709 | 1,597,085 | 1,480,981 | -7.3 |
| 23.1 | Ministry of Transport; Maritime New Zealand; Statistics New Zealand. |
| 23.2 | Statistics New Zealand; Civil Aviation Authority; Airways New Zealand; Ministry of Transport. |
| 23.3 | Toll NZ; New Zealand Railways Corporation. |
| 23.4 | Statistics New Zealand; Ministry of Transport; Transit New Zealand; Land Transport New Zealand; Personal Properties Securities Register; New Zealand Police. |
www.airways.co.nz – Airways New Zealand
www.caa.govt.nz – Civil Aviation Authority of New Zealand
www.landtransport.govt.nz – Land Transport New Zealand
www.msa.govt.nz – Maritime New Zealand
www.med.govt.nz – Ministry of Economic Development
www.transport.govt.nz – Ministry of Transport
www.motortraders.med.govt.nz – Motor Vehicle Traders Register
www.police.govt.nz – New Zealand Police
www.ppsr.govt.nz – Personal Property Security Register
www.ontrack.govt.nz – New Zealand Railways Corporation
www.stats.govt.nz – Statistics New Zealand
www.tollnz.co.nz – Toll NZ
www.taic.org.nz – Transport Accident Investigation Commission
www.transit.govt.nz – Transit New Zealand
Table of Contents
Laws controlling weekend shop trading hours have been relaxed as the New Zealand economy has become more market oriented.
Rather than relying on traditional marketing alliances and arrangements, New Zealand's export industries in recent years have had to compete in the international marketplace. The emphasis has also been on competitiveness within the New Zealand economy, with the government encouraging structural change through deregulation.
The past two decades have seen across-the-board tariff reductions, the disappearance of import licensing, removal of restrictions on the operation of financial markets, and reorganisation of state trading enterprises on a more competitive basis. Among specific sectors deregulated to allow greater competition have been the telecommunications, transport and petroleum industries.
Withdrawal of subsidies and import controls exposed large areas of the domestic economy to new levels of competition. The result has been reorganisation and, in some cases, attrition, especially in manufacturing.
These policy changes have made it necessary to review the legal environment in which business is conducted. Like virtually every developed market economy, New Zealand has laws aimed at protecting the competitive process. The Commerce Act 1986, the Fair Trading Act 1986 and the Electricity Industry Reform Act 1997 are New Zealand's main competition laws. In general terms, they rest on the premise that open and competitive markets will ensure the efficient allocation of economic resources.
The Commerce Act prohibits anti-competitive, collusive and unilateral behaviour, and mergers that substantially lessen competition in a market. The act also constitutes the Commerce Commission as a public enforcement agency providing scope for private remedies. The Commerce Act was reviewed in 1992 to ensure its provisions were consistent with other government policies promoting economic growth. Several amendments have been made to the act since then, including prohibition of business acquisitions that substantially lessen competition in any market.
The Fair Trading Act protects consumers and competitors from the consequences of inaccurate information. Under the act, a customer, a competitor or the Commerce Commission can take action if they think the act has been breached and, for example, erroneous material has been distributed about a product or a service.
The purpose of the Electricity Industry Reform Act is to separate electricity distribution from electricity generation and retailing to better ensure that costs and prices in the electricity industry are subject to sustained downward pressure.
As the economy has become more market oriented, traditional controls in the retail sector have also been reviewed. Laws controlling shop trading hours and the sale of liquor have been reviewed, and relaxed in some areas, to encourage competition and to provide structures for businesses to compete with imported products and to meet consumer demand.
Fair Trading Act 1986. The Fair Trading Act aims to maximise consumer protection in the period before a purchase is made. The act prohibits misleading and deceptive conduct, false representations and unfair practices by people in trade. The act covers all advertising and selling of goods and services, but does not cover private sales. The act also allows for bans and recalls of unsafe products and imposition of mandatory standards if necessary. The Commerce Commission is responsible for enforcing the act, but anyone – consumers and businesses alike – can take legal action under the act. Criminal court action may result in fines of up to $60,000 for individuals and $200,000 for companies. Both a company and individuals involved in a breach can be prosecuted by the commission.
Under the Consumer Guarantees Act, goods must correspond with any description shown to the consumer.
Consumer Guarantees Act 1993. The Consumer Guarantees Act covers consumer protection in the period after a purchase is made. It creates statutory guarantees automatically conferred whenever a consumer purchases goods or services from a trader. The act also covers items given away by a trader or manufacturer when goods are purchased. The act says, among other things, that goods must be of an acceptable quality, be fit for their particular purpose, match their description, and be of a reasonable price. The act also ensures consumer rights when services paid for are not carried out properly. Services must be provided with reasonable care and skill, be completed within a reasonable time, and be provided at a reasonable price. If a guarantee is not met, consumers may have rights against the trader (or in some cases the manufacturer) for a remedy to put the problem right. The Consumer Guarantees Act also applies to services relating to the supply of electricity, telecommunications, gas and water.
Weights and Measures Act 1987. The Weights and Measures Act 1987 protects New Zealand's system of metric weights and measures, and prescribes their use in the marketplace. It attempts to ensure that goods sold by weight, measure or number are traded fairly and in accordance with internationally-recognised principles. The act is enforced by the Ministry of Consumer Affairs.
Auctioneers Act 1928. The Auctioneers Act 1928 requires all auctioneers to be licensed. Entry to the occupation depends on applicants being able to satisfy a district court judge that they are ‘fit and proper’ and financially secure. This is in accordance with the act's primary objective to protect consumers from reckless/incompetent auctioneers and financial loss. The act is enforced by the New Zealand Police and also allows for private or self-enforcement.
Credit Contracts and Consumer Finance Act 2003. The Credit Contracts and Consumer Finance Act 2003 regulates consumer credit, including home loans, personal loans, credit sales/hire purchase, credit cards, long-term leases and housing buy-back schemes. The act requires disclosure of key information to the debtor, prohibits unreasonable fees, allows for contracts to be varied in cases of hardship and provides for re-opening of oppressive contracts. This act replaces the Credit Contracts Act 1981 and the Hire Purchase Act 1971. These acts apply to credit contracts and hire purchase agreements entered into before 1 April 2005. The Credit Contracts and Consumer Finance Act is enforced by the Commerce Commission.
Credit (Repossession) Act 1997. The Credit (Repossession) Act 1997 standardises procedures relating to the repossession of goods under a security agreement. The act covers the repossession process that a creditor (or agent) must follow for all secured loans and hire purchase agreements over consumer goods. The act is self-enforcing.
Door To Door Sales Act 1967. The Door To Door Sales Act 1967 regulates agreements for the sale of goods and the provision of services on credit, entered into at places other than appropriate trade premises. The act is self-enforcing.
Layby Sales Act 1971. The Layby Sales Act 1971 sets out rules for layby sales – where the goods being bought are not available to the buyer until the purchase price is paid off by instalment. The act does not apply to layby sales over $7,500, or to a motor vehicle being sold by a licensed dealer. The act is self-enforcing.
Motor Vehicle Sales Act 2003. The Motor Vehicle Sales Act 2003 requires that all motor vehicle traders are registered on the Motor Vehicle Traders Register (including car market operators and vehicle auctioneers). Traders are required to display a supplier information notice, in the form prescribed under the Fair Trading Act, with all used motor vehicles for sale. The register is administered by the Ministry of Economic Development, with enforcement carried out by the ministry's National Enforcement Unit. The supplier information notice is enforced by the Commerce Commission.
Unsolicited Goods and Services Act 1975. The Unsolicited Goods and Services Act 1975 provides protection for people who receive unsolicited goods or invoices for unordered goods or services. While the act is self-enforcing, parts of it provide for criminal penalties.
The Ministry of Consumer Affairs Manatū Kaihokohoko is an operating branch of the Ministry of Economic Development, and includes the Energy Safety Service. The ministry is subdivided into several groups:
The Policy Group examines how laws and practices affect consumers, develops consumer information and product safety standards, and monitors industry self-regulation and electricity and gas supply contracts for retail customers.
The Research, Information and Capability Group provides information for consumers and business on consumer rights and obligations, and training for community agencies that provide consumer information to the public. A particular focus is on communities whose members may be disproportionately affected by a ‘bad deal’. The group also conducts research into consumer and supplier behaviour and emerging consumer issues.
The Measurement and Product Safety Service (MAPSS) focuses on product safety and trade measurement. MAPSS can investigate unsafe products, suggest modifications, or request that unsafe products be removed from sale. MAPSS can recommend that the Minister of Consumer Affairs recall or ban unsafe products, and introduce mandatory standards. MAPSS can also carry out spot checks of traders' weighing and measuring equipment, check the weight of packaged goods, and investigate complaints from the public.
The Ministry of Consumer Affairs website is www.consumeraffairs.govt.nz
Energy Safety Service. The Energy Safety Service (ESS) is part of the Consumer Affairs branch of the Ministry of Economic Development. ESS monitors and encourages compliance with laws relating to energy safety, and works to create an environment in which:
People and property are safeguarded from the dangers of gas and electricity; gas and electrical appliances and installations are safe: and electricity supply and generating systems are safe.
The quality and measurement of gas and electricity, and the quality of petrol and diesel, is maintained.
The ESS does this through:
Developing and maintaining consistent and internationally acceptable standards for New Zealand's systems of electricity and gas safety, supply quality and measurement.
Ensuring the quality of petroleum fuels, and the supply quality and measurement of electricity and gas.
Informing consumers and business about energy safety, supply quality and measurement.
Investigating accidents and incidents, educating industry and undertaking enforcement where appropriate.
Administering legislation covering energy safety, supply quality and measurement.
Providing advice to the government and implementing its decisions.
ESS administers the safety, supply quality and measurement requirements of the Electricity Act 1992, the Gas Act 1992 and the Petroleum Products Specifications Regulations 1998; and enforces provisions of the Hazardous Substances and New Organisms Act 1996 for fuel gases.
An energy safety operations team works with industry to promote, and where necessary enforce, safety and quality standards in electricity and gas networks, installation systems and products (including petrol and diesel quality). The team also provides information, education and advice on energy safety issues for consumers and business.
The Energy Safety Service website is: www.ess.govt.nz
The principal aim of the Consumers' Institute is ‘to collect and disseminate information of benefit to consumers; and in doing so to advance the interests of its subscribing members and those of consumers generally’. This is done through research, publication of Consumer magazine and Consumer Online and public advocacy on behalf of all New Zealand consumers.
The institute's work includes comparative tests and surveys of consumer goods and services; research into and advice on financial, food, health, safety, welfare and environmental matters; representation at parliamentary committees and public inquiries; liaison with government, business, trade and safety organisations; and an interest in consumer education and complaints advisory work for members.
Consumer magazine covers a wide range of consumer information and protection material, including results of tests on home appliances and other products. Consumer Online supplements Consumer magazine and, among other things, hosts a product safety recall register.
Funded through membership subscriptions, the sale of publications and contract research, the institute is independent and impartial. It has no financial ties with any commercial organisation. It does, however, have a good relationship with most traders, and liaises with trade and professional associations, as well as government departments, safety organisations and special-interest groups.
The Consumers' Institute website is www.consumer.org.nz
Shops can open in New Zealand every day of the year, 24 hours a day, except on Christmas Day, Good Friday, Easter Sunday and up to 1 pm on Anzac Day.
Exceptions allow dairy/mixed businesses, service stations, takeaway outlets, souvenir and duty-free shops, shops at public passenger transport terminals and genuine exhibitions and shows to open on any day. Garden centres have a specific exemption allowing them to open on Easter Sunday.
In order to sell wine for consumption off their premises, wine resellers are required to have an off-licence.
The minimum legal age at which a person may purchase or consume liquor, or in certain circumstances be on licensed premises, is 18. Under the Sale of Liquor Act 1989, however, a person under 18 may have access to any licensed premises (other than restricted areas), and be supplied liquor, providing he or she is accompanied by a parent or legal guardian and liquor is supplied by the parent or legal guardian.
All on and off-licence premises are permitted to sell liquor on Sundays. However, hotels, taverns and off-licences are prohibited from selling, supplying or delivering liquor on Good Friday, Easter Sunday, Anzac Day (before 1 pm) and Christmas Day.
The law does not apply to people living in a hotel or tavern, or people present dining.
Wineries may sell or deliver wine on Easter Sunday if it is made on their premises or from grapes or fruit harvested from land on which the premises are situated.
Supermarkets and grocers may be licensed to sell beer, wine and any food condiment containing liquor if the food condiment has been prepared for culinary purposes and rendered unsuitable for drinking.
The sale of liquor to any member of the public requires a licence, of which there are four:
On-licences authorise the sale and supply of liquor to any person on the premises or conveyance (such as a ship or aircraft) for consumption on the premises only. Examples include taverns, licensed restaurants and night clubs.
Off-licences authorise the sale or delivery of liquor on or from the premises to any person for consumption off the premises. Examples are wine resellers, supermarkets and bottlestores.
Club licences authorise the sale and supply of liquor on the premises for consumption on the premises by a club member or guest of a member, or members of a club who have reciprocal visiting rights. A ‘club’ means a chartered club; a club that participates in or promotes any sporting or other recreational activity other than for gain; or any group of people combined for any purpose other than gain.
Special licences authorise the sale and supply of liquor on the premises or conveyance to any person attending any occasion or event.
Hours of sale. The hours during which liquor is allowed to be sold, delivered or consumed are not spelt out in legislation. Each application is dealt with on its merits.
Liquor licensing. New Zealand's central liquor licensing body is the Liquor Licensing Authority, consisting of a district court judge as chairperson, together with three or four members appointed by the governor-general on the recommendation of the Minister of Justice. The authority considers and determines applications for on, off and club licences, and for manager's certificates. It also decides on appeals against decisions by district licensing agencies. There are 74 district licensing agencies, which are essentially the local authority in each district or city. District licensing authorities receive applications for liquor licences, gather reports and determine all unopposed applications. Opposed applications are forwarded to the Liquor Licensing Authority. District licensing agencies grant special licences and temporary authorities, whether unopposed or not.
Individuals wishing to start a business can do so by forming a company under the Companies Act 1993, or by trading in their own name or in partnership under the Partnership Act 1908, which covers ordinary partnerships and the more rarely used special partnerships.
Companies. Companies are by far the most usual form of business operation in New Zealand. Incorporating a limited liability company under the Companies Act 1993 limits an individual's liability for any losses the business may suffer. Companies are founded on three concepts:
That the shareholders have limited liability, meaning that their liability is limited to the amount they have agreed to pay for their shares, so that if the company should fail owing money, their other assets are protected from seizure to pay the outstanding debts.
Their shares are transferable.
The company is a separate legal entity from the shareholders.
Companies in which shareholders have limited liability have names ending in ‘Limited’ or ‘Tapui (Limited)’.
Table 24.01 shows the number of new companies registered, companies dissolved or struck off, and the number of registered companies for each year from 1990 to 2005.
Partnerships. A partnership is defined in the Partnership Act 1908 as the relationship between people carrying on a business in common with a view of profit. Partnerships are started by mutual agreement, which can be informal. However, terms are normally contained in a written agreement. Characteristics of a partnership are that each partner is usually under a joint liability for all partnership debts; a partnership will as a rule be dissolved by the death or retirement of a partner; partnership interests are not usually capable of being assigned or transferred; and control and management of a partnership's affairs are (subject to the partnership agreement) vested in all partners. Lastly, a partner is ostensibly an agent for the other partners and can commit the partnership to binding arrangements.
Table 24.01. Company registrations
Years ending
30 June
| Year | New companies registered | Companies dissolved or struck off | Companies on register |
|---|---|---|---|
1Year ending 31 March Rrevised Source: Ministry of Economic Development | |||
| 19901 | 11,289 | 12,377 | 159,922 |
| 1991 | 10,953 | 14,984 | 153,275 |
| 1992 | 12,330 | 11,144 | 154,526 |
| 1993R | 14,160 | 11,884 | 156,925 |
| 1994 | 17,263 | 9,711 | 168,391 |
| 1995 | 16,249 | 11,320 | 170,350 |
| 1996 | 19,863 | 13,101 | 177,093 |
| 1997 | 23,172 | 7,936 | 192,224 |
| 1998 | 24,083 | 14,173 | 202,317 |
| 1999 | 26,502 | 11,861 | 217,000 |
| 2000 | 33,234 | 20,255 | 230,359 |
| 2001 | 35,254 | 20,045 | 249,047 |
| 2002 | 41,996 | 15,509 | 275,813 |
| 2003 | 41,457 | 17,223 | 307,461 |
| 2004 | 53,900 | 19,185 | 345,702 |
| 2005 | 59,744 | 23,037 | 388,846 |
The Commerce Commission enforces a number of general and specific regulatory regimes set out in the Commerce Act 1986, the Fair Trading Act 1986, the Electricity Industry Reform Act 1998, the Dairy Industry Restructuring Act 2001, the Telecommunications Act 2001 and the Credit Contracts and Consumer Finance Act 2003.
The commission, a Crown entity established under the Commerce Act 1986, consists of up to five members appointed by the governor-general on the recommendation of the Minister of Economic Development. Associate members may also be appointed.
A Telecommunications Commissioner was established in 2001.
The commission's revenue is derived mainly from the Crown, supplemented by fees from parties seeking adjudication decisions. In addition, the commission receives some revenue from court costs awarded and from interest.
New responsibilities in the electricity, telecommunications and dairy industries are, for the most part, funded by government-imposed industry levies.
Operational implications of the new responsibilities have seen the commission's budget increase significantly, from $9 million in 2000/01 to $23 million in 2005/06.
In addition, the commission has increased its resources to meet its new responsibilities and had 130 staff at December 2005, compared with 113 in December 2003.
The commission operates from a head office in Wellington and has offices in Auckland and Christchurch that deal with Fair Trading Act responsibilities.
Commerce Act. The aim of the Commerce Act 1986 is to promote efficient operation of markets through promotion of competition for the long-term benefit of consumers. Specifically, the act is designed to prevent or deter abuses of market power, collusion and anti-competitive mergers. The act applies to all individuals and commercial organisations, including local government, state-owned enterprises and government departments insofar as they engage in trade.
The act prohibits restrictive trade practices, including substantially lessening competition, excluding competitors, price fixing, taking advantage of market power, and resale price maintenance. Parties planning to enter arrangements that may be restrictive trade practices can apply to the commission for authorisation, which will be granted if the commission is satisfied the public will ultimately benefit from the business practice, even though there is a lessening of competition. The act prohibits acquisition of assets or shares in a business if the acquisition results in a substantial lessening of competition in a market. Under the act, those acquiring assets or shares can apply to the commission for clearance or authorisation.
The commission will grant a clearance if it is satisfied an acquisition will not substantially lessen competition. It will grant an authorisation, even if the acquisition results in the acquiring or strengthening of a dominant position in a market, if there is sufficient public benefit to outweigh the detriment to competition. If granted, clearance or authorisation exempts the business practice or acquisition from the act's prohibitions and protects the business from action by the commission and private individuals.
The act gives the Minister of Economic Development power to set regulatory control for goods or services. Regulatory control may be imposed only where there is limited competition in the market for particular goods or services and control is seen as necessary or desirable in the interests of acquirers or suppliers. The last regulatory control, on natural gas, was lifted on 1 April 1993. Penalties for breaching the act are fines up to $500,000 for individuals and up to the greater of either $10 million or three times the value of any commercial gain resulting from the breach (or 10 percent of the turnover of the business if the commercial gain is unknown) for companies.
Fair Trading Act. The aim of the Fair Trading Act is to ensure customers receive accurate information about goods and services and to promote product safety. It prohibits traders from engaging in conduct that is misleading or deceptive or is likely to mislead or deceive. It also prohibits certain types of false or misleading representations about goods and services. These include false statements that goods or services are a particular price or involve particular savings; are of a particular kind, standard, quality, grade or origin; are of a particular style or model; are endorsed by an organisation or sponsor; are supplied with particular warranties or guarantees; have a particular history of use; or have particular uses or benefits. The act makes it a criminal offence to engage in certain unfair or misleading practices. These include:
Offering free gifts or prizes when supplying goods or services if those involved do not intend awarding the gift or prize.
‘Bait’ advertising, such as advertising ‘specials’ or ‘loss leaders’ to attract customers into a shop if the advertiser does not intend making the goods or services available for a reasonable time and in reasonable quantities.
Demanding or accepting payment without intending to supply the goods or services ordered.
Making misleading representations about profitability, risk or other matters affecting a business run from a home.
Use of physical force, harassment or coercion when supplying goods or services.
Pyramid selling schemes.
The act gives the Minister of Consumer Affairs the power to make consumer information and product safety standards mandatory.
In December 2003, consumer information standards covered used motor vehicles; country of origin labelling of clothing and footwear; care labelling for textile goods (such as drycleaning, washing and ironing instructions); and fibre content labelling of textile goods. Product safety standards covered baby walkers, cigarette lighters, toys for children aged up to three, bicycles, and night clothes for children from six months to 14 years.
In 2003, the Fair Trading Amendment Act doubled the maximum penalties for offences from $30,000 to $60,000 for individuals and from $100,000 to $200,000 for companies.
Electricity Industry Reform Act 1998. Under the Electricity Industry Reform Act 1998, businesses generating or selling more than a specified amount of electricity cannot also own power lines. Businesses can apply to the Commerce Commission for exemptions from the act.
Dairy Industry Restructuring Act 2001. The Dairy Industry Restructuring Act 2001 provides for regulatory and structural reform of the New Zealand dairy industry. The act authorised the amalgamation of New Zealand's two largest dairy cooperatives, the New Zealand Cooperative Dairy Company Ltd and Kiwi Cooperative Dairies Ltd, into Fonterra Cooperative Group Ltd and the resulting ownership by Fonterra of all the shares in the New Zealand Dairy Board. The resulting cooperative may have a substantial degree of market power in a number of key domestic New Zealand dairy markets. The act provides for a legislative package of measures to mitigate the risks of that market power.
Telecommunications Act 2001. The Telecommunications Act 2001 is aimed at reforming the telecommunications industry so as to deliver a better deal for consumers. The act aims to provide greater certainty, investment, competition, opportunity and consumer benefit. Under the act, the Commerce Commission resolves access disputes between carriers; oversees telecommunications service obligations: apportions the annual net cost between Telecom and liable carriers: and monitors the regulatory regime, recommending to the Minister of Communications changes to the list of regulated services.
Credit Contracts and Consumer Finance Act 2003. The Credit Contracts and Consumer Finance Act 2003 repealed the Credit Contracts Act 1981 and the Hire Purchases Act 1971 and introduced a new legislative framework for regulating credit transactions, consumer leases and property buy-back schemes.
The Serious Fraud Office Te Tari Hara Tāware is a specialist department established by the Serious Fraud Office Act 1990 to facilitate the detection, investigation and expeditious prosecution of serious and/or complex fraud offending.
The office had a staff of 35 at 30 June 2005 (35 at 30 June 2003) comprising forensic accountants, investigators, prosecutors and support staff.
Multi-disciplinary teams are used in the investigation and prosecution of cases.
For the purposes of determining whether an offence involves serious or complex fraud, the act provides that the director may. among other things, have regard to the suspected nature and consequences of the fraud, the suspected scale of the fraud, the legal, factual and evidential complexity of the matter, and any relevant public interest considerations.
The director's decision to investigate or take proceedings is discretionary and not subject to review.
During the 2004/05 financial year, 67 complaints were received and 26 full investigations were concluded. Of these, 16 resulted in prosecution, some with multiple offenders. In addition, 10 investigations were completed, but did not proceed to prosecution. Nineteen cases remained at the full investigation stage at 30 June 2005.
Fourteen prosecutions were concluded during the year ending 30 June 2005. Several of the cases involved a number of defendants. Convictions were obtained in 12 of the cases. One case during the year saw two defendants found guilty, with the jury unable to agree on the guilt of the third defendant. The retrial for this defendant was to occur in the 2005/06 financial year. This case has not been included in the 14 completed prosecutions for the 2004/05 financial year.
Four appeals against conviction and sentence, and one appeal against sentence only, were heard in the 2004/05 year. In all but one instance, the appeals were dismissed. In the other case, a sentence of five years imprisonment was reduced to four years.
The office's statutory powers are the most extensive in the area of criminal investigation in New Zealand. Briefly, they require any person whose affairs are being investigated, or any other person whom the director has reason to believe may have relevant information or documents, to appear before the director to answer questions and produce such documents for inspection.
In the year ending 30 June 2005, 866 notices were issued under these powers (784 requiring documents or information and 82 requiring people to attend interviews), compared with 1,092 in the previous year. Five search warrants were executed, compared with 17 in the year before.
Government funding for the year to 30 June 2005 was $4.769 million.
The Serious Fraud Office website is www.sfo.govt.nz
The Takeovers Panel is a body corporate established by the Takeovers Act 1993. Under the act it must have not less than five and not more than 11 members appointed by the Minister of Commerce. At least one member must be a barrister or solicitor of the High Court of New Zealand of not less than seven years experience. In summary, the functions of the panel are:
To keep under review the law relating to takeovers of specified companies and to recommend to the government any changes to the law it considers necessary.
For the purposes of its review of the law, to keep under review practices relating to takeovers of specified companies.
To investigate any act or omission or practice for the purpose of exercising its powers under the enforcement provisions of the act.
To make determinations and orders and make applications to the court under the enforcement provisions of the act.
To cooperate with any overseas regulator and for that purpose to communicate to that regulator information obtained by the panel in the performance of its functions and powers which the panel considers may assist that regulator in the performance of its functions.
To promote public understanding of the law and practice relating to takeovers.
In exercising its functions and powers, the panel is required to comply with the principles of natural justice.
The Takeovers Panel website is www.takeovers.govt.nz
The purpose of the Securities Commission is to strengthen domestic and overseas confidence in New Zealand's capital markets by promoting the efficiency, integrity and cost-effective regulation of those markets, thereby fostering capital investment in New Zealand.
The commission, New Zealand's main regulator of investments, is an independent Crown entity formed under the Securities Act 1978.
The role and functions of the commission include:
Keeping the law relating to bodies corporate, securities and unincorporated issuers of securities under review and to recommend changes to the Minister of Commerce.
Keeping practices relating to securities under review.
Cooperating with overseas securities commissions.
Keeping the activities of securities markets under review.
Promoting understanding of the law and practice of securities.
Providing administrative and support services to the Takeovers Panel.
To help perform these functions, the commission has the power to, among other things, suspend or cancel a registered prospectus; prohibit advertising of any securities; enforce insider trading and substantial security holder law; administer the law relating to futures contracts; and recommend approval of electronic systems for the transfer of securities.
The Securities Commission website is www.sec-com.govt.nz
The New Zealand Stock Exchange Limited (NZSE), formerly a mutual society with sharebroker members, was demutualised and became a public company on 4 June 2003. As part of that process, the NZSE changed its name to New Zealand Exchange Limited, trading as NZX, in June 2002. NZX is now a company listed on one of its own markets, the NZSX market.
NZX operates and regulates markets in New Zealand for entities to raise capital (for example by issuing shares or debt securities) and for the trading of listed securities. The trading markets are the NZSX (stock market), which had more than 200 quoted securities at 31 December 2005; the NZDX (debt market), where companies and the government list bonds and other fixed interest securities; and the NZAX (alternative market), for small to medium-sized and non-standard entities. There were 194 New Zealand entities and 44 overseas entities listed on NZX's markets at 31 December 2005.
Investors can now trade derivatives (investment products based on an underlying share or index) based on New Zealand securities. Called NZFOX, they are futures and options products listed on the Sydney Futures Exchange. Futures and options allow investors to hedge against risk or speculate (take on extra risk in the hope of making a profit). The NZ FOX website is www.nzfox.com
NZX firms, previously sharebroker members of the NZSE, are accredited to provide investment advice and to buy and sell securities on NZX's markets on behalf of clients. NZX firms also advise entities on listing and assist entities to raise capital by issuing securities. NZX is responsible for regulating the conduct of those that participate in its market, including NZX firms and other market participants and listed issuers.
Under listing rules, listed issuers are required to disclose any information that is relevant for investors. NZX publishes these disclosures of information as market announcements, which ensures the market is kept informed. There are also listing rules relating to appointment of directors, disclosure of financial results and general conduct.
NZX generates revenue from listing fees paid by listed issuers, fees paid by NZX advisors and NZX firms for accreditation, fees for trading activity, and from the sale of market data, such as trading statistics and prices. Revenue is also earned from the sale of exchange-traded funds (ETFs), a type of investment product.
As at 31 December 2005, NZX managed four ETFs – the NZX 10 Fund (or smartTENZ); the NZX MidCap Index Fund (smartMIDZ); the NZX 50 Portfolio Index Fund (smartFONZ); and the NZX Australian MidCap Index Fund (smartMOZY).
Securities trading is facilitated through NZX's FASTER (fully automatic screen trading and electronic registration) trading system. Orders to buy and sell securities are placed into the system by NZX brokers and are matched according to price and time priority. After orders are matched, delivery of securities and payment occurs and securities are registered in the name of the new owner.
NZX calculates a number of share price indexes, including the NZX50. This index tracks the collective movement in market value of the 50 largest listed issuers on the NZSX market.
Figure 24.01 shows movement of the NZX Gross index from 1986 to 2005.
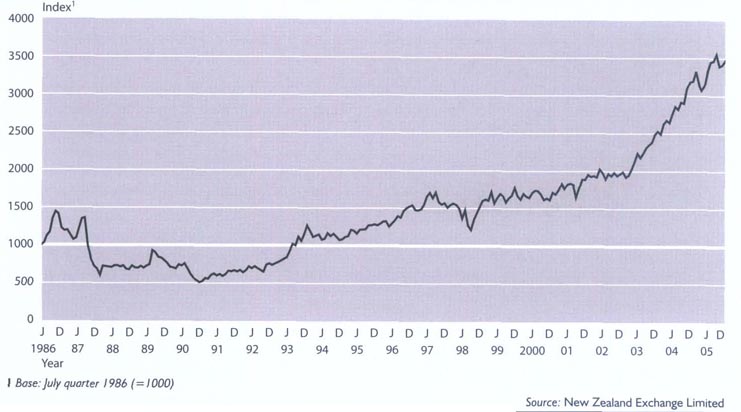
Insolvency of individuals is referred to as bankruptcy.
Laws relating to bankruptcy in New Zealand are contained predominantly in the Insolvency Act 1967, the Insolvency Regulations 1970 and the High Court Amendment Rules (No 2) 1999. Jurisdiction in bankruptcy matters is vested in the High Court of New Zealand.
All proceedings in bankruptcy are commenced by a petition filed in the court by either the debtor or a creditor. Not less than $200 in total must be owing by the debtor to any creditor filing a petition.
An Official Assignee is empowered to sell the bankrupt's property, enforce debts due to the bankrupt's estate, or carry on the business of the bankrupt so far as it is necessary or expedient for its disposal or conclusion.
When all assets are realised, the assignee deducts expenses incurred, pays any debts given statutory priority, and then divides the proceeds among creditors. Secured creditors are paid from the proceeds of the security and other creditors are paid on a pro rata basis.
Creditors may accept a composition (an agreement among all creditors of a debtor to accept a percentage of the debts as full payment) in satisfaction of the debts due to them.
Upon application by the bankrupt, the court is empowered to grant an order of discharge, which can be absolute, conditional or suspended. When an objection to discharge is lodged, the court determines whether a discharge should be granted. In all other cases, a person adjudicated bankrupt is automatically discharged three years after adjudication.
Table 24.02 shows personal bankruptcies in New Zealand and Figure 24.02 overleaf shows the bankruptcy rate per 100,000 of population.
Table 24.02. Bankruptcy
Years ending 30
June
| Year | Number |
|---|---|
1Years ending 31 March. Source: Ministry of Economic Development | |
| 19801 | 530 |
| 19851 | 849 |
| 1990 | 1,900 |
| 1995 | 1,991 |
| 1996 | 2,130 |
| 1997 | 2,458 |
| 1998 | 2,949 |
| 1999 | 3,285 |
| 2000 | 2,675 |
| 2001 | 2,859 |
| 2002 | 2,811 |
| 2003 | 2,800 |
| 2004 | 2,791 |
| 2005 | 2,995 |
Figure 24.02. Bankruptcy
Rate per 100,000
population
Years ending 31
December
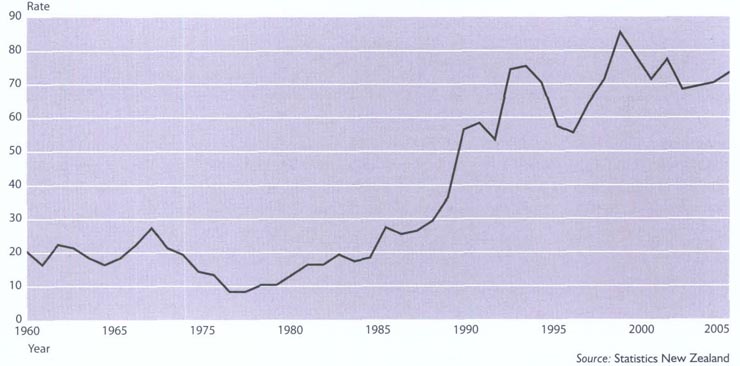
Source: Statistics New Zealand
Company liquidation. Liquidation, sometimes called winding up, is the legal process by which a company's life is ended. The company's assets are realised, its creditors paid to the extent possible, any surplus is distributed to shareholders, and the company is then removed from the register, whereupon it ceases to exist. Liquidation is carried out in accordance with the relevant provisions of the Companies Act 1993.
Company receivership. Companies with heavy debt loads and cash-flow problems can have a receiver appointed over their assets, either by the court, or, more commonly, under an express clause in a security. Securities often contain a lengthy recital of events that will enable the holder to recover the loan if the borrower gets into financial difficulties. One of these provisions is the power of the security holder to appoint a receiver. The function of a receiver is to sell what is necessary to recover the amount owed to the holder (plus costs), or manage the company's business for this purpose, and then retire as receiver. No property of the company is actually vested in the receiver, and although the directors remain in office, the receiver supersedes them and exercises their powers. The receiver's status is one of agent for, not officer of, the company. Receivership is quite distinct from liquidation, as a receiver acts for the benefit only of the debenture-holder who appointed him or her, whereas a liquidator acts for unsecured creditors.
The insurance industry in New Zealand, both life and non-life, has a number of characteristics which make international comparison difficult. In taking an overview of the New Zealand industry, it is necessary to identify and understand these characteristics.
Regulation. The Insurance Companies' (Ratings and Inspections) Act requires fire and general insurance (not life insurance) companies to obtain, register and disclose a claims-paying ability rating. The requirement also applies to any non-life business, such as disability products of life insurance companies. While some insurers not providing property or disaster insurance can apply for an exemption, the legislation effectively introduces a form of market regulation that allows consumers to judge the financial strength of their insurers. The Insurance Companies' Deposits Act 1953 requires any person or company carrying on the business of insurance in New Zealand to lodge approved securities with a market value of not less than $500,000 with the Public Trustee. Insurance companies are also required to provide detailed annual reports and statements of financial condition to the Ministry of Economic Development. Life and general insurance companies are required to comply with consumer protection legislation, such as the Fair Trading Act 1986 and the Consumer Guarantees Act 1993. The size and close-knit nature of the New Zealand insurance market has meant regulation of the industry has proceeded through a combination of loose government supervision, coupled with a measure of self-regulation. Competition has also been an important factor in regulating all parts of the insurance market.
Government involvement. Some classes of insurance which make a substantial contribution to the premium pool of countries overseas do not feature in New Zealand because of the different legal climate and background. For instance, the accident compensation scheme effectively removed many classes of liability insurance in New Zealand. Historically, the government had also been involved in both fire and general and life insurance through government-backed life insurance and mutual funds, but in recent years it has withdrawn from these activities. Fire services in New Zealand are funded through a levy upon all fire insurance policyholders.
Natural disaster insurance. New Zealand is susceptible to damage caused by earthquakes and other geophysical events, and insurance against these events has presented a considerable challenge. The Earthquake and War Damage Commission was established in 1944 to provide a government-guaranteed fund for damage caused by war and earthquakes. The fund was created with premiums collected from fire insurance policy holders. The original act was replaced by the Earthquake Commission Act 1993. which dropped war damage and non-residential property from the cover. Under the act. the Earthquake Commission (EQC)–a Crown entity responsible to the Minister of Finance–provides cover of $100,000 (+ GST) for dwellings and $20,000 (+ GST) for contents. There is also some cover for land. Perils covered are earthquake, natural landslip, volcanic eruption, hydrothermal activity, tsunami, residential land in the case of storm or flood, and fire caused by any of these. Cost of cover is five cents a year for every $100 value of property insured. The maximum premium for one year is $67.50 (including GST). In the year ending 30 June 2004, there were 4,798 earthquake, volcanic and hydrothermal activity claims, totalling $17.8 million. In the previous June year, there were 576 claims, totalling $980,000. In the June 2004 year, slip, storm and flood claims totalled 2,332 (622 in 2003), involving $19.6 million ($4.8 million in 2003). The large increases were due to claims arising from an increase in natural disasters, serious flooding in the Manawatu and an earthquake near Te Anau. EQC premium income for the June 2004 year was $78.4 million ($76.8 million in 2003) and investment income was $204.8 million ($277.8 million in 2003). The Earthquake Commission website is www.eqc.govt.nz
New Zealand is susceptible to damage caused by earthquakes and other natural disasters, which present considerable challenges for the insurance industry.
The life insurance industry has undergone considerable change in recent years, with demutualisations, takeovers and establishment of units to provide staff and services to other units being key contributing factors to the overall performance of the industry.
Statistics New Zealand's business demographic statistics recorded 36 life insurance enterprises at February 2005. up from 35 in February 2003.
The non-life insurance market is divided among 138 enterprises (139 in 2003). including life companies doing non-life business who have made deposits under the Insurance Companies' Deposits Act 1953. Many of these depositors, however, are not active in the New Zealand market. Some deposits are made to support placements overseas by brokers, or by international reinsurers, and some are retained to support the runoff of workers' compensation business by insurers no longer active in New Zealand.
Some New Zealand insurance business is placed directly offshore. The ability to spread risk through international reinsurance markets has allowed New Zealand insurers to absorb large increases in business flowing from the government's decision to remove the Earthquake and War Damage Commission from non-residential disaster insurance.
Business demographic statistics recorded 55 health (63 in 2003) and 83 (76 in 2003) general insurance enterprises in New Zealand at February 2005.
The number of direct underwriters has been reducing, with amalgamations and withdrawals, and this has been accompanied by a decrease in the number of reinsurers establishing a place of business in New Zealand.
While the overall number of enterprises in the insurance industry has been on the decline (872 in 2005. 903 in 2004 and 1,183 in 2003). the number of employees has been relatively constant (8.550 in 2005, 8,070 in 2004 and 8,170 in 2003).
The Accident Compensation Corporation (ACC) has the statutory duty to promote occupational safety and accident prevention, and this activity has had some indirect benefit to the insurance industry. The Insurance Council of New Zealand, along with the Fire Service Commission, is active in fire prevention and fire safety education.
Most other activity in the field of loss prevention and accident prevention is undertaken by the government, or by quasi-government bodies which are wholly or partly public funded.
The Building Research Association of New Zealand (BRANZ) undertakes work in assessing building materials and methods of construction, and the New Zealand Automobile Association and similar organisations are active in the field of prevention of motor vehicle accidents. Much of New Zealand's effort in loss prevention has traditionally been organised and financed through the insurance industry, in areas such as electrical safety and registration, research into fire prevention and fire safety equipment, and approval of passive fire protection and alarm systems.
Retailing embraces retail businesses, hotels, restaurants and businesses providing household and personal services. Retail trade is one of the most important indicators of economic activity, as it constitutes a large proportion of personal expenditure on consumer goods and services. Table 24.03 shows annual retail sales from 1997 to 2005.
Table 24.03. Retail sales
By store
type
Years ending 31 March
| Store type | 1997 | 1998 | 1999 | 2000 | 2001 | 2002 | 2003 | 2004 | 2005 |
|---|---|---|---|---|---|---|---|---|---|
Note:Figures may not add to suited totals due to rounding. Source: Statistics New Zealand | |||||||||
| $(million) | |||||||||
| Supermarkets and grocery stores | 7,257 | 7,561 | 7,957 | 8,347 | 8,817 | 9,453 | 10,052 | 10,794 | 11,325 |
| Fresh meat, fish, poultry, fruit and vegetables | 515 | 518 | 496 | 487 | 491 | 599 | 700 | 787 | 832 |
| Liquor | 824 | 890 | 939 | 919 | 880 | 899 | 899 | 951 | 1,010 |
| Other food | 442 | 530 | 536 | 567 | 622 | 679 | 631 | 659 | 750 |
| Takeaway food | 641 | 617 | 592 | 620 | 615 | 642 | 697 | 801 | 922 |
| Department stores | 1,869 | 1,952 | 2,161 | 2,421 | 2,590 | 2,717 | 2,924 | 3,263 | 3,382 |
| Furniture and floor coverings | 981 | 1,009 | 1,021 | 1,065 | 1,052 | 1,090 | 1,246 | 1,264 | 1,376 |
| Hardware | 808 | 803 | 751 | 769 | 791 | 849 | 919 | 1,029 | 1,141 |
| Appliances | 1,361 | 1,332 | 1,396 | 1,486 | 1,609 | 1,718 | 1,870 | 1,954 | 2,196 |
| Recreational goods | 1,516 | 1,571 | 1,543 | 1,604 | 1,710 | 1,854 | 1,953 | 2,025 | 2,123 |
| Clothing and softgoods | 1,392 | 1,407 | 1,415 | 1,533 | 1,620 | 1,774 | 1,878 | 1,995 | 2,165 |
| Footwear | 230 | 230 | 229 | 226 | 229 | 243 | 259 | 295 | 319 |
| Chemists | 1,077 | 1,203 | 1,142 | 1,180 | 1,193 | 1,223 | 1,297 | 1,407 | 1,563 |
| Household equipment repair services | 214 | 214 | 203 | 229 | 226 | 250 | 299 | 315 | 301 |
| Other retailing | 1,804 | 1,836 | 1,906 | 2,092 | 2,259 | 2,434 | 2,559 | 2,449 | 2,520 |
| Accommodation | 1,563 | 1,608 | 1,616 | 1,644 | 1,670 | 1,780 | 1,931 | 2,056 | 2,283 |
| Bars and clubs | 1,076 | 986 | 957 | 997 | 992 | 1,016 | 1,063 | 1,070 | 1,084 |
| Cafes and restaurants | 1,747 | 1,870 | 1,943 | 2,190 | 2,343 | 2,534 | 2,768 | 2,865 | 3,099 |
| Personal and household goods hiring | 144 | 128 | 123 | 130 | 132 | 148 | 168 | 188 | 213 |
| Other personal services | 883 | 951 | 976 | 1,069 | 1,117 | 1,179 | 1,243 | 1,337 | 1,478 |
| Subtotal (excludes motor vehicles) | 26,343 | 27,214 | 27,899 | 29,574 | 30,957 | 33,080 | 35,355 | 37,505 | 40,079 |
| Motor vehicle retailing | 6,895 | 6,081 | 5,890 | 6,144 | 6,137 | 6,861 | 7,598 | 8,006 | 8,349 |
| Automotive fuel retailing | 3,164 | 3,263 | 3,158 | 3,339 | 3,827 | 3,692 | 3,762 | 3,866 | 4,633 |
| Automotive electrical services, smash repairing and tyre retailing | 966 | 948 | 924 | 984 | 1,019 | 1,094 | 1,166 | 1,259 | 1,346 |
| Automotive repair and services | 982 | 949 | 949 | 1,058 | 1,206 | 1,384 | 1,471 | 1,634 | 1,659 |
| Total | 38,350 | 38,456 | 38,820 | 41,098 | 43,145 | 46,110 | 49,352 | 52,269 | 56,066 |
| Per head of population | 2,454 | 2,473 | 2,524 | 2,680 | 2,779 | 2,962 | 3,091 | 3,304 | 3,463 |
Total actual retail sales increased by 7.3 percent to $56.066 billion in the year ending 31 March 2005. compared with $52.269 billion in the previous March year, according to Statistics New Zealand's Retail Trade Survey. Almost all store types recorded increases in the year ending 31 March 2005 compared with the previous year. The most significant increases were recorded by automotive fuel retailing (up 19.8 percent), takeaway food retailing (up 15.1 percent) and other food retailing (up 13.8 percent).
Retail sales in the North Island in the year ending 31 March 2005 increased by 7.7 percent on the March 2004 year. The South Island recorded an increase of 5.8 percent in the same period. Excluding the remainder of both islands, the Auckland Region recorded the strongest growth in sales, up 8.7 percent or $1.526 billion.
Table 24.04 shows sales by region.
Table 24.04. Retail sales
By
region1
Years ending 31 March2
| Year | North Island | South Island | Total New Zealand | ||||||
|---|---|---|---|---|---|---|---|---|---|
| Auckland | Waikato | Wellington | Remainder of North Island | Total North Island | Canterbury | Remainder of South Island | Total South Island | ||
1Comparisons of regional retail sales should be made with caution, as shoppers from outside their regions also patronise other city stores and make use of mail order services. Figures are exclusive of goods and services tax. 2The Retail Trade Survey was redesigned in October 2003. Years ending March prior to 1997 are not available because data was only backcast to June 1995. Note:Figures may not add to slated totals due to rounding. Source: Statistics New Zealand | |||||||||
| $(million) | |||||||||
| 1997 | 12,752 | 3,579 | 4,573 | 8,312 | 29,216 | 4,920 | 4,214 | 9,134 | 38,350 |
| 1998 | 12,628 | 3,558 | 4,776 | 8,397 | 29,358 | 4,956 | 4,142 | 9,098 | 38,456 |
| 1999 | 12,560 | 3,587 | 4,850 | 8,479 | 29,476 | 5,161 | 4,182 | 9,343 | 38,820 |
| 2000 | 13,506 | 3,706 | 5,075 | 8,849 | 31,136 | 5,578 | 4,384 | 9,962 | 41,098 |
| 2001 | 14,166 | 3,946 | 5,164 | 9,243 | 32,518 | 5,946 | 4,681 | 10,627 | 43,145 |
| 2002 | 15,204 | 4,369 | 5,346 | 9,911 | 34,831 | 6,322 | 4,958 | 11,279 | 46,110 |
| 2003 | 16,287 | 4,717 | 5,565 | 10,692 | 37,261 | 6,656 | 5,436 | 12,091 | 49,352 |
| 2004 | 17,627 | 4,744 | 5,733 | 11,427 | 39,531 | 6,762 | 5,975 | 12,738 | 52,269 |
| 2005 | 19,153 | 4,962 | 5,950 | 12,525 | 42,590 | 6,869 | 6,608 | 13,476 | 56,066 |
The value of advances and purchases on credit cards continues the strong rise of recent years. Increase in credit card usage is partly due to the wider acceptance of the card as a means of payment, for example in supermarkets, and also for services such as paying doctors and dentists, power bills and phone accounts to gain points on loyalty schemes. Growth in credit card usage is shown in Table 24.05.
Table 24.05. Credit card usage1
By value
| Calendar year | Advances | Billings2 | Total | Average monthly retail sales excluding motor vehicle retailing | Card spending in New zealand as proportion of retail sales | |
|---|---|---|---|---|---|---|
| Total outstanding at 31 Dec | New Zealand cardholder spending in New Zealand | Overseas cardholder spending in New Zealand | ||||
1Figures are monthly averages over the complete year. 2Credit card spending includes services and other purchases not included in retail sales. Eestimate Source: Reserve Bank of New Zealand | ||||||
| $(million) | Percent | |||||
| 1998 | 2,067 | 498 | 107 | 606 | 2,721 | 18 |
| 1999 | 2,403 | 656 | 119 | 775 | 2,871 | 23 |
| 2000 | 2,904 | 900 | 142 | 1,042 | 3,046 | 30 |
| 2001 | 3,390 | 1,150 | 165 | 1,315 | 3,219 | 36 |
| 2002 | 3,768 | 1,312 | 199 | 1,511 | 3,429 | 38 |
| 2003 | 3,956 | 1,438 | 217 | 1,655 | 3,615 | 40 |
| 2004 | 4,210 | 1,585 | 235 | 1,820 | 3,914 | 40 |
| 2005 | 4,533 | 1,738 | 240 | 1,978 | 4,213E | 41 |
Figure 24.03 shows the value of personal credit card borrowing and that borrowing as a proportion of total household credit.
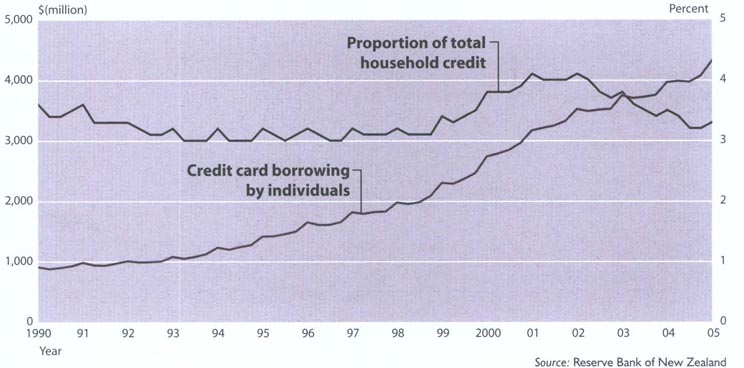
Consumer credit is provided by retailers and finance companies, with finance companies particularly active in financing motor vehicles on hire purchase. The Hire Purchase Act 1971 is the governing legislation in New Zealand. The Credit Contracts Act 1981 reformed the law relating to the provision of credit under contracts of various kinds. Included in this act are provisions which prevent oppressive contracts and ensure disclosure of the cost of credit on a uniform basis.
| 24.1 | Commerce Commission; Ministry of Consumer Affairs; Consumers' Institute; Department of Labour; Ministry of Justice. |
| 24.2 | Ministry of Economic Development; Commerce Commission; Serious Fraud Office; Securities Commission; New Zealand Exchange Limited; Transparency International; Office of the Insurance and Savings Ombudsman. |
| 24.3 | Insurance Council of New Zealand; Earthquake Commission; Statistics New Zealand: Ministry of Civil Defence and Emergency Management; Accident Compensation Corporation. |
| 24.4 | Statistics New Zealand; Ministry of Consumer Affairs; Reserve Bank of New Zealand. |
www.comcom.govt.nz – Commerce Commission
www.consumer.org.nz – Consumers' Institute
www.dol.govt.nz – Department of Labour
www.eqc.govt.nz – Earthquake Commission
www.ess.govt.nz – Energy Supply Service
www.icnz.org.nz – Insurance Council of New Zealand
www.consumeraffairs.govt.nz – Ministry of Consumer Affairs
www.med.govt.nz – Ministry of Economic Development
www.justice.govt.nz – Ministry of Justice
www.nzx.com – New Zealand Exchange Limited
www.iombudsman.org.nz – Office of the Insurance and Savings Ombudsman
www.rbnz.govt.nz – Reserve Bank of New Zealand
www.sec-com.govt.nz – Securities Commission
www.sfo.govt.nz – Serious Fraud Office
www.stats.govt.nz – Statistics New Zealand
www.takeovers.govt.nz – Takeovers Panel
Table of Contents
The Port of Tauranga handled 28.6 percent by weight of all cargo loaded at New Zealand ports in the year ending 30 June 2005.
New Zealand Trade and Enterprise (NZTE) is the New Zealand Government's trade and economic development agency, formed on 1 July 2003 from the merger of Trade New Zealand and Industry New Zealand.
NZTE coordinates public and private sector business initiatives through its network of 48 offices in New Zealand and around the world.
Its mission is to help New Zealand businesses to succeed internationally and to increase their economic contribution to New Zealand by:
Providing a range of high-quality, responsive services and programmes to help stimulate and grow internationally-competitive businesses.
Working in partnership with sectors, regions and businesses, and with private and public sector allies.
Helping businesses build export capability, attract investment and shift to higher value products and services.
NZTE is largely government funded, but has a board of directors appointed predominantly from the private sector.
The New Zealand Trade and Enterprise website is www.nzte.govt.nz
Services in New Zealand. NZTE has staff in 10 offices around New Zealand who work in sector-specific teams, reflecting the focus on industries in which New Zealand has a long-term sustainable advantage. These industries include biotechnology and agritech; creative industries; information and communications technology; food and beverage; wood, building and interiors; specialised manufacturing; education; and tourism. A Māori enterprise team, spanning all sectors, is dedicated to helping Māori and indigenous businesses grow. For start-up clients, services available include training, investment facilitation and incubation. For new exporters, a free-phone business consultancy line is available, along with mentoring, How To guides, networking events and seminars. For high-growth businesses and exporters, client managers provide customised services, such as business appraisals and applications for financing, export market consultancy and access to NZTE's international network of trade commissioners.
Services overseas. NZTE has staff in an international network of 38 offices who understand local business cultures, speak the local language and provide hands-on assistance to New Zealand exporters. They conduct market and product research, identify suitable business partners and arrange visit programmes, interpreters and trade fair promotions. Staff also provide international buyers, importers and distributors with information and intelligence on New Zealand's business capability, enabling them to source quality New Zealand products and services.
Brand New Zealand. NZTE and Tourism New Zealand jointly own the Brand New Zealand visual identity and incorporate the brand into all offshore activities that promote New Zealand and build New Zealand's reputation. NZTE is working to create an image that differentiates New Zealand internationally and enhances New Zealand's established and emerging areas of competitive advantage. The aim is to accelerate global awareness of New Zealand as being innovative, creative and technologically advanced.
The New Zealand Customs Service is a fully participating member of the World Customs Organisation (WCO), established (as the Customs Cooperation Council) in 1952.
The WCO is an intergovernment organisation of 168 member countries with headquarters in Brussels. Its mission is to enhance the effectiveness and efficiency of customs administrations.
To do this the WCO:
Establishes, maintains and promotes international instruments for the uniform application of effective customs procedures governing the movement of commodities, people and conveyances across customs frontiers.
Reinforces members1 efforts to secure compliance with their legislation by encouraging cooperation with each other and with international organisations in order to combat customs and other transnational offences.
Assists members in their efforts to meet the challenges of the modern business environment and adapt to changing circumstances by prompting communication and cooperation among members and with other international organisations, and by fostering integrity, human resources development, transparency, improvements in the management of customs administrations and the sharing of best practices.
The New Zealand Customs Service provides protection at the border by managing the import and export of goods and the movement of international passengers, aircraft and vessels in accordance with customs, immigration, quarantine and other statutory requirements.
Customs seeks to ensure a safe and secure border, with minimum intervention to legitimate trade and travel.
To achieve this, the service employs risk management techniques to monitor and assess the risk of arriving and departing people, craft and goods.
Border operations involve checking and clearing passengers and craft at airports and seaports, surveillance and search for prohibited items and investigation of customs offences and related items.
Underpinning these activities is the collection and processing of intelligence on potential breaches of the legislation that Customs enforces.
Overseas merchandise trade statistics measure in New Zealand dollars the value and volume of New Zealand's exports, imports and overseas cargo.
The statistics are compiled monthly by Statistics New Zealand based on entries lodged with the New Zealand Customs Service by exporters, importers and their agents.
Exports are valued ‘fob’ (free on board), which is the market value of goods at the New Zealand port of loading. It includes the value added in bringing goods to the port, but excludes international freight and associated insurance. Re-exports are included, unless otherwise specified, while goods for repair are excluded.
Imports, which also exclude goods for repair, are valued ‘cif’ (cost, insurance and freight) and ‘vfd’ (value for duty). The cif value is the market value of goods at the New Zealand port of unloading. It includes the value added for the cost of international freight and associated insurance. The vfd value is the value assessed for duty. It is a close approximation of the fob value at the overseas port of loading. Unless otherwise stated, all import values quoted in this chapter are cif values.
An important analytical result of New Zealand's overseas trade is the ‘balance of merchandise trade’.
This is calculated by deducting the merchandise imports value from the merchandise exports value for the same period.
An excess of export values over import values is a ‘surplus’, which is treated as a positive number. Conversely, an excess of import values over export values is a ‘deficit’, which is treated as a negative number.
In the year ending 30 June 2005, New Zealand's balance of merchandise trade was a deficit of $5.18 billion, compared with a deficit of $3.51 billion in the June 2004 year.
Table 25.01 provides overseas merchandise trade figures from 1994 to 2005.
In this chapter, export values include re-exports, which are goods imported into New Zealand and then exported later without being significantly altered. Typical re-exports are aircraft and heavy machinery.
Exports in the year ending 30 June 2005 totalled $30.62 billion, a 2.5 percent increase on the June 2004 year total of $29.86 billion. Dairy produce, birds' eggs and honey (as defined by the New Zealand Harmonised Classification System) and meat and edible offal were New Zealand's two major export commodity categories in the June 2005 year, contributing 16.2 percent and 14.9 percent of total exports respectively.
Table 25.01. Overseas merchandise trade1
Years ending 30 June
| Year | Exports (fob) | Imports (cif) | Balance of merchandise trade (fob - cif) |
|---|---|---|---|
1Exports valued free on board at New Zealand ports, re-exports included. Imports valued cif (cost including insurance and freight). Note:Figures may not add to stated totals due to rounding. Source: Statistics New Zealand | |||
| $(million) | |||
| 1994 | 19,827 | 18,469 | 1,358 |
| 1995 | 20,790 | 21,261 | -471 |
| 1996 | 20,546 | 21,352 | -807 |
| 1997 | 21,033 | 21,324 | -290 |
| 1998 | 21,941 | 22,589 | -648 |
| 1999 | 22,582 | 24,248 | -1,667 |
| 2000 | 26,111 | 29,193 | -3,082 |
| 2001 | 32,000 | 31,927 | 73 |
| 2002 | 32,332 | 31,811 | 521 |
| 2003 | 29,291 | 32,161 | -2,869 |
| 2004 | 29,864 | 33,378 | -3,514 |
| 2005 | 30,618 | 35,793 | -5,175 |
The largest increases in the year ending 30 June 2005 were for preparations of cereals, flour, starch or milk and pastry cooks' products (up $233 million); aircraft, spacecraft and parts thereof (up $207 million); machinery and mechanical appliances (up $158 million); and beverages, spirits and vinegar (up $105 million). The largest falls were for organic chemicals (down $259 million); dairy produce, birds' eggs and honey (down $182 million); albuminoidal substances, modified starches and glues (down $137 million); ships, boats and floating structures (down $123 million); and wood and articles of wood (down $87 million).
Table 25.02 lists major commodities exported for the years 1999 to 2005.
Table 25.02. Major export commodities1
Years ending 30 June
| Commodity | 1999 | 2000 | 2001 | 2002 | 2003 | 2004 | 2005 |
|---|---|---|---|---|---|---|---|
1Exports valued free on board at New Zealand ports, re-exports included. 2As defined by the New Zealand Harmonised Classification System. Source: Statistics New Zealand | |||||||
| $(million) | |||||||
| Dairy produce2; birds' eggs; natural honey | 3,799 | 3,914 | 5,812 | 5,923 | 4,714 | 5,147 | 4,965 |
| Meat and edible meat offal | 2,836 | 3,379 | 4,182 | 4,429 | 4,111 | 4,479 | 4,577 |
| Wood and articles of wood | 1,499 | 2,024 | 2,192 | 2,378 | 2,386 | 2,071 | 1,984 |
| Machinery and mechanical appliances | 1,035 | 1,127 | 1,321 | 1,395 | 1,356 | 1,470 | 1,628 |
| Fruit and nuts (edible) | 1,064 | 972 | 1,045 | 1,159 | 1,032 | 1,255 | 1,212 |
| Fish, crustaceans and molluscs | 1,184 | 1,230 | 1,374 | 1,402 | 1,215 | 1,111 | 1,134 |
| Aluminium and aluminium articles | 958 | 1,116 | 1,295 | 1,176 | 980 | 1,008 | 1,053 |
| Electrical machinery, equipment and parts | 699 | 844 | 1,088 | 1,018 | 938 | 963 | 1,004 |
| Albuminoidal substances; modified starches and glues | 914 | 997 | 1,444 | 1,387 | 1,148 | 959 | 822 |
| Wool, fine or coarse animal hair | 857 | 930 | 1,009 | 944 | 943 | 887 | 813 |
The export value of all dairy products in the year ending 30 June 2005 was $5.575 billion, down 5.5 percent in value on the previous June year. Dairy produce made up 18.2 percent of New Zealand's total merchandise export value. Main dairy products exported were milk powder ($2.563 billion), cheese ($1.052 billion), butter ($858 million) and casein and caseinates ($651 million). Table 25.03 overleaf shows the value of dairy product exports from 1999 to 2005.
Table 25.03. Dairy product exports1
Years ending 30
June
| Product | 1999 | 2000 | 2001 | 2002 | 2003 | 2004 | 2005 |
|---|---|---|---|---|---|---|---|
1Exports valued free on board at New Zealand ports, re-exports included. Note:Figures may not add to stated totals due to rounding. Source: Statistics New Zealand | |||||||
| $(million) | |||||||
| Milk powder, milk, cream | 1,772 | 1,856 | 3,201 | 3,202 | 2,648 | 2,864 | 2,563 |
| Cheese and curd | 984 | 991 | 1,273 | 1,417 | 1,001 | 1,035 | 1,052 |
| Butter and dairy spreads | 915 | 923 | 1,103 | 1,084 | 922 | 1,076 | 858 |
| Casein and caseinates | 764 | 806 | 1,213 | 1,173 | 959 | 782 | 651 |
| Whey and other products | 24 | 41 | 53 | 52 | 27 | 44 | 349 |
| Buttermilk products, yoghurt | 93 | 84 | 160 | 136 | 81 | 96 | 101 |
| Total dairy product exports | 4,551 | 4,701 | 7,003 | 7,064 | 5,638 | 5,897 | 5,575 |
| Percentage of total exports | 20.1 | 18.0 | 21.9 | 21.8 | 19.2 | 19.7 | 18.2 |
Main dairy product export markets in the 2005 June year were the United States ($691 million), the Philippines ($369 million) and Japan ($363 million). Exports to Saudi Arabia (up 46 percent) and Indonesia (up 29 percent) showed strong growth during the year. Largest falls in value were recorded by Belgium (EU), which fell from $331 million in the 2004 year to $166 million in the year ending 30 June 2005, Mexico and the People's Republic of China.
The United States was the main export market for casein and caseinates, accounting for 44.4 percent of the total exported. Japan and Germany were the next largest markets. Table 25.04 shows New Zealand's main dairy product export markets for the years 1999 to 2005.
Table 25.04. Dairy product exports1
By destination
Years ending 30 June
| Country | 1999 | 2000 | 2001 | 2002 | 2003 | 2004 | 2005 |
|---|---|---|---|---|---|---|---|
1Exports valued free on board at New Zealand ports, re-exports included. Note:Figures may not add to stated totals due to rounding. Source: Statistics New Zealand | |||||||
| $(million) | |||||||
| United States | 634 | 707 | 846 | 929 | 679 | 630 | 691 |
| Philippines | 192 | 199 | 337 | 392 | 320 | 345 | 369 |
| Japan | 389 | 363 | 490 | 502 | 314 | 320 | 363 |
| Saudi Arabia | 113 | 123 | 189 | 224 | 171 | 205 | 300 |
| China, People's Republic of | 128 | 100 | 168 | 207 | 316 | 373 | 296 |
| Australia | 185 | 222 | 275 | 280 | 253 | 231 | 259 |
| Mexico | 195 | 137 | 328 | 408 | 310 | 340 | 254 |
| Malaysia | 245 | 272 | 380 | 329 | 262 | 283 | 212 |
| Indonesia | 84 | 139 | 335 | 313 | 201 | 154 | 199 |
| Taiwan | 175 | 188 | 265 | 250 | 191 | 180 | 184 |
| Belgium | 204 | 152 | 227 | 225 | 356 | 331 | 166 |
| Sri Lanka | 113 | 108 | 165 | 150 | 117 | 142 | 162 |
| Thailand | 117 | 119 | 214 | 231 | 182 | 204 | 155 |
| Singapore | 77 | 162 | 84 | 91 | 96 | 104 | 129 |
| Korea, Republic of | 57 | 71 | 118 | 119 | 95 | 100 | 118 |
| Canada | 29 | 48 | 131 | 159 | 176 | 112 | 116 |
| Venezuela | 104 | 103 | 211 | 161 | 89 | 137 | 104 |
| Germany | 87 | 89 | 153 | 144 | 168 | 116 | 100 |
| Egypt | 115 | 91 | 121 | 128 | 100 | 101 | 74 |
| Viet Nam | 79 | 64 | 267 | 184 | 102 | 95 | 73 |
| Other countries | 1,232 | 1,244 | 1,700 | 1,638 | 1,141 | 1,396 | 1,250 |
| Total dairy product exports | 4,551 | 4,701 | 7,003 | 7,064 | 5,638 | 5,897 | 5,575 |
In the year ending 30 June 2005, the value of exports of meat and edible offal rose 2.2 percent to $4.577 billion, 14.9 percent of total merchandise exports. This followed a 9.0 percent rise in the June 2004 year. Main contributor to the increase was offal exports, which rose by 39.6 percent ($68 million). Table 25.05 shows the value of meat and edible offal exports from 1999 to 2005.
Table 25.05. Meat and edible offal
exports1
Years ending 30
June
| Commodity | 1999 | 2000 | 2001 | 2002 | 2003 | 2004 | 2005 |
|---|---|---|---|---|---|---|---|
1Exports valued free on board at New Zealand ports, re-exports included. – nil or zero Note:Figures may not add to stated totals due to rounding. Source: Statistics New Zealand | |||||||
| $(million) | |||||||
| Sheep | 1,509 | 1,699 | 2,126 | 2,259 | 2,257 | 2,259 | 2,305 |
| Beef | 1,091 | 1,404 | 1,678 | 1,820 | 1,570 | 1,854 | 1,809 |
| Offal | 81 | 103 | 128 | 117 | 108 | 172 | 240 |
| Venison | 145 | 165 | 238 | 221 | 166 | 183 | 208 |
| Poultry | 1 | - | 1 | 1 | 3 | 4 | 9 |
| Goat | 6 | 6 | 6 | 5 | 6 | 5 | 5 |
| Other | 3 | 3 | 5 | 4 | 1 | 2 | 2 |
| Total meat and edible offal exports | 2,836 | 3,379 | 4,182 | 4,429 | 4,111 | 4,479 | 4,577 |
| Percentage of total exports | 12.6 | 12.9 | 13.1 | 13.7 | 14.0 | 15.0 | 14.9 |
As Table 25.06 shows, the United States, at $1.048 billion, was the main export market for meat and edible offal. This was a decrease of 16.1 percent ($202 million) on the previous June year. Exports to the United Kingdom, the next largest market, decreased 4.0 percent ($23 million). Increases were recorded for Japan (up $111 million), Germany (up $69 million) and the Republic of Korea (up $30 million), while decreases were recorded for the People's Republic of China (down $16 million), Taiwan (down $10 million) and Hong Kong (down $6 million).
Table 25.06. Meat and edible offal exports1
By destination
Years ending 30 June
| Destination | 1999 | 2000 | 2001 | 2002 | 2003 | 2004 | 2005 |
|---|---|---|---|---|---|---|---|
1Exports valued free on board at New Zealand ports, re-exports included. Source: Statistics New Zealand | |||||||
| $(million) | |||||||
| United States | 786 | 1,082 | 1,220 | 1,313 | 1,149 | 1,250 | 1,048 |
| United Kingdom | 440 | 468 | 541 | 541 | 539 | 580 | 557 |
| Germany | 274 | 301 | 420 | 404 | 369 | 352 | 421 |
| Japan | 159 | 160 | 199 | 168 | 163 | 298 | 409 |
| France | 110 | 150 | 229 | 260 | 261 | 234 | 249 |
| Korea, Republic of | 28 | 49 | 46 | 97 | 111 | 203 | 233 |
| Canada | 131 | 116 | 278 | 335 | 242 | 184 | 211 |
| Taiwan | 87 | 101 | 102 | 123 | 134 | 203 | 193 |
| Belgium | 155 | 168 | 175 | 208 | 182 | 193 | 189 |
| Mexico | 16 | 28 | 77 | 73 | 72 | 71 | 76 |
| Netherlands | 35 | 44 | 45 | 49 | 51 | 47 | 69 |
| Malaysia | 32 | 46 | 57 | 60 | 52 | 70 | 66 |
| Switzerland | 30 | 54 | 55 | 57 | 63 | 61 | 56 |
| Saudi Arabia | 57 | 66 | 82 | 48 | 62 | 52 | 55 |
| Italy | 35 | 38 | 52 | 62 | 57 | 50 | 51 |
| French Polynesia | 28 | 33 | 37 | 50 | 50 | 51 | 50 |
| China, People's Republic of | 14 | 18 | 38 | 58 | 60 | 61 | 45 |
| Hong Kong | 50 | 56 | 64 | 54 | 46 | 48 | 42 |
| Other countries | 369 | 401 | 465 | 469 | 448 | 471 | 557 |
| Total meat and edible offal exports | 2,836 | 3,379 | 4,182 | 4,429 | 4,111 | 4,479 | 4,577 |
The value of forest product exports (excluding newsprint) in the year ending 30 June 2005 was $2.896 billion, down 2.0 percent ($58 million) on the previous June year. Rough wood exports dropped by $169 million (29.9 percent). Sawn wood, at $781 million, was New Zealand's biggest forest product export earner. Board (fibre, veneer, plywood) exports increased by 8.2 percent ($43 million). Table 25.07 overleaf shows the value of forest product exports from 1999 to 2005.
Table 25.07. Forest product
exports1,2
Years ending 30
June
| Commodity | 1999 | 2000 | 2001 | 2002 | 2003 | 2004 | 2005 |
|---|---|---|---|---|---|---|---|
1Excludes newsprint. 2Exports valued free on board at New Zealand ports, re-exports included. Note:Figures may not add to stated totals due to rounding. Source: Statistics New Zealand | |||||||
| $(million) | |||||||
| Wood (sawn) | 558 | 734 | 769 | 864 | 855 | 725 | 781 |
| Wood (rough) | 466 | 655 | 695 | 758 | 722 | 565 | 396 |
| Board (fibre, veneer, plywood) | 333 | 434 | 517 | 516 | 545 | 527 | 570 |
| Wood pulp | 385 | 636 | 643 | 548 | 461 | 507 | 512 |
| Paper and paperboard | 302 | 390 | 419 | 440 | 352 | 377 | 400 |
| Other | 142 | 201 | 211 | 240 | 265 | 253 | 236 |
| Total forest product exports | 2,186 | 3,050 | 3,254 | 3,366 | 3,199 | 2,954 | 2,896 |
| Percentage of total exports | 9.7 | 11.7 | 10.2 | 10.4 | 10.9 | 9.9 | 9.5 |
New Zealand's two main destinations for forest products, Australia ($650 million) and Japan ($610 million), showed decreases of 3.3 percent and 3.5 percent respectively in the year ending 30 June 2005. The value of exports to the United States, the third main destination for forest products, increased 16.1 percent to $439 million. Table 25.08 shows main export destinations of New Zealand forest products in the years 1999–2005.
Table 25.08. Forest product exports1,
2
By destination
Years ending 30 June
| Destination | 1999 | 2000 | 2001 | 2002 | 2003 | 2004 | 2005 |
|---|---|---|---|---|---|---|---|
1Excludes newsprint. 2Exports valued free on board at New Zealand ports, re-exports included. – nil or zero Source: Statistics New Zealand | |||||||
| $(million) | |||||||
| Australia | 555 | 748 | 724 | 708 | 678 | 672 | 650 |
| Japan | 563 | 657 | 821 | 687 | 674 | 632 | 610 |
| United States | 245 | 353 | 427 | 524 | 521 | 378 | 439 |
| China, People's Republic of | 60 | 180 | 215 | 387 | 343 | 356 | 314 |
| Korea, Republic of | 304 | 467 | 443 | 529 | 431 | 394 | 300 |
| Philippines | 35 | 62 | 79 | 79 | 125 | 84 | 109 |
| Indonesia | 60 | 110 | 98 | 73 | 74 | 75 | 75 |
| Taiwan | 84 | 132 | 110 | 92 | 73 | 68 | 64 |
| Viet Nam | 11 | 24 | 27 | 18 | 20 | 26 | 36 |
| Hong Kong | 66 | 67 | 71 | 43 | 40 | 50 | 33 |
| Thailand | 22 | 43 | 38 | 32 | 27 | 25 | 31 |
| India | 32 | 24 | 26 | 23 | 28 | 22 | 30 |
| Malaysia | 33 | 48 | 49 | 51 | 43 | 37 | 29 |
| Fiji | 11 | 19 | 20 | 17 | 17 | 19 | 26 |
| United Arab Emirates | 14 | 11 | 8 | 5 | 8 | 8 | 17 |
| New Caledonia | 8 | 8 | 6 | 8 | 9 | 9 | 12 |
| Samoa | 5 | 6 | 8 | 9 | 8 | 9 | 11 |
| Singapore | 24 | 32 | 18 | 23 | 20 | 14 | 10 |
| Saudi Arabia | - | 2 | 2 | 1 | 9 | 10 | 8 |
| Tonga | 3 | 5 | 5 | 6 | 8 | 6 | 7 |
| Other countries | 51 | 52 | 59 | 51 | 43 | 60 | 85 |
| Total forest product exports | 2,186 | 3,050 | 3,254 | 3,366 | 3,199 | 2,954 | 2,896 |
Fruit, nut and vegetable exports were valued at $1.563 billion in the year ending 30 June 2005, down 4.6 percent ($75 million) on the previous June year. The value of apple exports dropped 20.2 percent, from $485 million to $387 million. Other contributors to the decrease were onions, down $30 million to $63 million, and legumes, down $10 million to $92 million. Kiwifruit and apples contributed 46.1 percent and 24.8 percent respectively to total fruit, nut and vegetable export earnings. Table 25.09 shows the value of fruit, nut and vegetable exports for the years 1999 to 2005.
Table 25.09. Fruit, nut and vegetable
exports1
Years ending 30
June
| Product | 1999 | 2000 | 2001 | 2002 | 2003 | 2004 | 2005 |
|---|---|---|---|---|---|---|---|
1Exports valued free on board at New Zealand ports, re-exports included. Note:Figures may not add to stated totals due to rounding. Source: Statistics New Zealand | |||||||
| $(million) | |||||||
| Kiwifruit | 474 | 459 | 595 | 618 | 539 | 659 | 720 |
| Apples | 489 | 405 | 341 | 421 | 392 | 485 | 387 |
| Legumes | 105 | 97 | 121 | 118 | 106 | 102 | 92 |
| Squash and gourds | 61 | 60 | 72 | 82 | 68 | 54 | 72 |
| Onions, shallots, garlic, leeks etc | 106 | 82 | 101 | 104 | 103 | 93 | 63 |
| Corn | 46 | 48 | 63 | 57 | 52 | 49 | 44 |
| Berry fruit | 30 | 29 | 33 | 24 | 26 | 30 | 34 |
| Avocado | 19 | 25 | 26 | 28 | 26 | 27 | 29 |
| Capsicum | 10 | 15 | 23 | 22 | 24 | 24 | 26 |
| Carrots and other edible roots | 17 | 23 | 20 | 16 | 16 | 10 | 6 |
| Other fruit, nuts and vegetables | 97 | 98 | 100 | 117 | 100 | 104 | 91 |
| Total fruit, nut and vegetable exports | 1,454 | 1,339 | 1,495 | 1,607 | 1,451 | 1,638 | 1,563 |
| Percentage of total exports | 6.4 | 5.1 | 4.7 | 5.0 | 5.0 | 5.5 | 5.1 |
In the year ending 30 June 2005, the main destination for New Zealand's fruit, nut and vegetable exports was Japan, which took $418 million worth. This was a 17.7 percent ($63 million) increase on the previous year. As Table 25.10 shows, Australia ($144 million) and the United Kingdom ($120 million) were the next most valuable markets. A significant proportion of New Zealand's fruit, nut and vegetable exports are sold on consignment and classified as Destination unknown – EU (European Union). In the June 2005 year, $240 million worth was exported in this category.
Table 25.1. Fruit, nut and vegetable exports1
By destination
Years ending 30 June
| Destination | 1999 | 2000 | 2001 | 2002 | 2003 | 2004 | 2005 |
|---|---|---|---|---|---|---|---|
1Exports valued free on board at New Zealand ports, re-exports included. Note:Figures may not add to stated totals due to rounding. Source: Statistics New Zealand | |||||||
| $(million) | |||||||
| Japan | 295 | 319 | 373 | 365 | 366 | 355 | 418 |
| Destination unknown - European Union | 361 | 261 | 293 | 304 | 235 | 328 | 240 |
| Australia | 89 | 89 | 127 | 129 | 121 | 143 | 144 |
| United Kingdom | 182 | 158 | 130 | 176 | 133 | 149 | 120 |
| Netherlands | 31 | 17 | 23 | 61 | 54 | 81 | 95 |
| United States | 138 | 146 | 149 | 144 | 119 | 142 | 82 |
| Spain | 30 | 57 | 51 | 34 | 47 | 63 | 81 |
| Taiwan | 47 | 50 | 56 | 74 | 75 | 69 | 72 |
| Korea, Republic of | 6 | 9 | 14 | 27 | 34 | 49 | 69 |
| Germany | 41 | 20 | 32 | 39 | 44 | 28 | 34 |
| Other countries | 234 | 215 | 247 | 254 | 223 | 231 | 208 |
| Total fruit, nut and vegetable exports | 1,454 | 1,339 | 1,495 | 1,607 | 1,451 | 1,638 | 1,563 |
Exports of fish, crustaceans and molluscs, including extracts and preparations, were worth $1.236 billion in the year ending 30 June 2005. This was an increase of 1.0 percent ($13 million) on the previous year.
Excluding extracts and preparations, the export value of fish, crustaceans and molluscs was $1.134 billion, up 2.1 percent ($23 million) on the June 2004 year.
As Table 25.11 overleaf shows, main contributors to the increase were molluscs, up by $24 million to $340 million, and frozen fish, up by $24 million to $283 million.
Hong Kong took $138 million worth of fish, crustacean and mollusc exports from New Zealand in the year ending 30 June 2005.
Table 25.11. Fish, crustacean and mollusc exports1
Years ending 30
June
| Product | 1999 | 2000 | 2001 | 2002 | 2003 | 2004 | 2005 |
|---|---|---|---|---|---|---|---|
1Exports valued free on board at New Zealand ports, re-exports included. Note:Figures may not add to stated totals due to rounding. Source: Statistics New Zealand | |||||||
| $(million) | |||||||
| Molluscs and aquatic invertebrates | 214 | 204 | 249 | 312 | 251 | 316 | 340 |
| Fish fillets and other fish meat | 499 | 487 | 536 | 508 | 452 | 317 | 301 |
| Frozen fish | 262 | 284 | 325 | 313 | 266 | 259 | 283 |
| Crustaceans | 120 | 153 | 149 | 162 | 146 | 127 | 126 |
| Fresh or chilled fish | 75 | 86 | 94 | 92 | 89 | 80 | 75 |
| Edible fish meal; dried, salted or smoked fish | 11 | 13 | 17 | 12 | 10 | 10 | 7 |
| Live fish | 3 | 3 | 4 | 2 | 2 | 2 | 2 |
| Total fish, crustacean and mollusc exports | 1,184 | 1,230 | 1,374 | 1,402 | 1,215 | 1,111 | 1,134 |
| Extracts and preparations | |||||||
| Prepared or preserved molluscs | 53 | 67 | 87 | 73 | 60 | 64 | 60 |
| Prepared or preserved fish, including fish eggs | 29 | 34 | 40 | 44 | 37 | 36 | 32 |
| Fish or crustacean extracts and juices | 4 | 3 | 8 | 8 | 8 | 12 | 10 |
| Total fish, crustacean and mollusc exports, including extracts and preparations | 1,270 | 1,334 | 1,508 | 1,527 | 1,321 | 1,223 | 1,236 |
| Percentage of total exports | 5.6 | 5.1 | 4.7 | 4.7 | 4.5 | 4.1 | 4.0 |
Table 25.12 shows that fish, crustacean and mollusc exports to the United States rose by 2.5 percent ($5 million) in the June 2005 year.
Export values to Australia fell by 8.9 percent ($18 million) and to Japan by 6.4 percent ($11 million).
Table 25.12. Fish, crustacean and mollusc
exports1
By destination
Years ending 30 June
| Destination | 1999 | 2000 | 2001 | 2002 | 2003 | 2004 | 2005 |
|---|---|---|---|---|---|---|---|
1Exports valued free on board at New Zealand ports, re-exports included. Note:Figures may not add to stated totals due to rounding. Source: Statistics New Zealand | |||||||
| $(million) | |||||||
| United States | 246 | 272 | 254 | 301 | 248 | 203 | 208 |
| Australia | 157 | 166 | 194 | 195 | 207 | 203 | 185 |
| Japan | 263 | 303 | 333 | 283 | 236 | 171 | 160 |
| Hong Kong | 132 | 161 | 180 | 189 | 153 | 138 | 138 |
| China, People's Republic of | 43 | 21 | 43 | 60 | 56 | 69 | 109 |
| Spain | 42 | 42 | 78 | 62 | 58 | 105 | 88 |
| Germany | 62 | 48 | 46 | 58 | 67 | 35 | 41 |
| Korea, Republic of | 42 | 34 | 52 | 77 | 40 | 45 | 41 |
| Singapore | 24 | 35 | 44 | 35 | 29 | 28 | 27 |
| France | 41 | 44 | 44 | 45 | 31 | 23 | 25 |
| Greece | 13 | 13 | 12 | 13 | 15 | 13 | 21 |
| United Kingdom | 29 | 21 | 30 | 27 | 23 | 13 | 20 |
| Taiwan | 22 | 30 | 24 | 19 | 17 | 28 | 19 |
| Italy | 12 | 13 | 22 | 15 | 14 | 15 | 17 |
| Canada | 10 | 13 | 15 | 17 | 14 | 12 | 13 |
| Thailand | 22 | 23 | 17 | 14 | 12 | 12 | 11 |
| Belgium | 24 | 13 | 12 | 11 | 12 | 12 | 11 |
| Netherlands | 15 | 11 | 21 | 18 | 12 | 13 | 9 |
| Malaysia | 12 | 14 | 21 | 16 | 16 | 12 | 6 |
| American Samoa | 2 | 6 | 2 | 4 | 7 | 4 | 1 |
| Other countries | 56 | 52 | 63 | 68 | 54 | 70 | 87 |
| Total fish, crustacean and mollusc exports | 1,270 | 1,334 | 1,508 | 1,527 | 1,321 | 1,223 | 1,236 |
New Zealand's machinery exports were valued at $2.631 billion in the year ending 30 June 2005. This was an increase of 8.1 percent ($198 million) on the previous June year.
Main types of machinery exported were dish washing machines ($143 million); refrigerators and freezers ($142 million); boards, panels, consoles for electricity control ($89 million); electrical machines and apparatus ($88 million); and transmission apparatus ($88 million).
The value of New Zealand's machinery exports for the year ending 30 June 2005 bettered the previous June year by 8.1 percent.
Table 25.13 shows the value of mechanical and electrical machinery exports from 1999 to 2005.
Table 25.13. Mechanical and electrical machinery exports1
Years ending 30
June
| Product | 1999 | 2000 | 2001 | 2002 | 2003 | 2004 | 2005 |
|---|---|---|---|---|---|---|---|
1Exports valued free on board at New Zealand ports, re-exports included. Note:Figures may not add to stated totals due to rounding. Source: Statistics New Zealand | |||||||
| $(million) | |||||||
| Dish washing machines | 60 | 75 | 98 | 125 | 108 | 141 | 143 |
| Refrigerators and freezers | 94 | 114 | 129 | 147 | 156 | 145 | 142 |
| Boards, panels and consoles for electricity control | 79 | 118 | 157 | 145 | 139 | 111 | 89 |
| Transmission apparatus | 124 | 115 | 141 | 112 | 106 | 107 | 88 |
| Electrical machines and apparatus | 55 | 75 | 93 | 104 | 71 | 62 | 88 |
| Mechanical parts and accessories | 111 | 104 | 133 | 124 | 108 | 94 | 77 |
| Insulated wire and cable | 56 | 49 | 64 | 56 | 62 | 53 | 72 |
| Harvesting and threshing machinery | 39 | 43 | 51 | 62 | 76 | 73 | 70 |
| Industrial machinery and laboratory equipment | 47 | 47 | 55 | 61 | 68 | 66 | 55 |
| Telecommunication apparatus | 44 | 41 | 53 | 64 | 75 | 46 | 43 |
| Other | 1,027 | 1,191 | 1,434 | 1,413 | 1,325 | 1,535 | 1,764 |
| Total mechanical and electrical machinery exports | 1,734 | 1,971 | 2,408 | 2,413 | 2,294 | 2,433 | 2,631 |
| Percentage of total exports | 7.7 | 7.5 | 7.5 | 7.5 | 7.8 | 8.1 | 8.6 |
Table 25.14 shows that Australia ($1.063 billion) and the United States ($515 million) were New Zealand's two main destinations for machinery exports, showing dollar increases of 1.9 percent and 13.9 percent respectively.
Table 25.14. Mechanical and electrical machinery exports1
By destination
Years ending 30 June
| Destination | 1999 | 2000 | 2001 | 2002 | 2003 | 2004 | 2005 |
|---|---|---|---|---|---|---|---|
1Exports valued free on board at New Zealand ports, re-exports included. Note:Figures may not add to stated totals due to rounding. Source: Statistics New Zealand | |||||||
| $(million) | |||||||
| Australia | 803 | 897 | 946 | 1,005 | 961 | 1,043 | 1,063 |
| United States | 243 | 327 | 477 | 468 | 454 | 452 | 515 |
| United Kingdom | 108 | 105 | 119 | 122 | 126 | 161 | 149 |
| Singapore | 55 | 52 | 82 | 68 | 68 | 57 | 75 |
| Canada | 33 | 37 | 42 | 46 | 57 | 46 | 67 |
| Fiji | 36 | 34 | 30 | 39 | 43 | 48 | 60 |
| China, People's Republic of | 16 | 15 | 34 | 62 | 40 | 52 | 50 |
| Japan | 19 | 34 | 57 | 29 | 33 | 39 | 50 |
| Hong Kong | 63 | 62 | 98 | 56 | 45 | 30 | 35 |
| South Africa | 17 | 20 | 21 | 29 | 20 | 27 | 34 |
| Germany | 21 | 34 | 38 | 37 | 45 | 38 | 31 |
| Taiwan | 26 | 31 | 49 | 41 | 44 | 28 | 29 |
| Samoa | 19 | 22 | 23 | 27 | 23 | 25 | 28 |
| Malaysia | 15 | 15 | 30 | 40 | 21 | 22 | 26 |
| France | 21 | 16 | 10 | 11 | 13 | 13 | 26 |
| Thailand | 5 | 6 | 9 | 18 | 17 | 23 | 20 |
| Netherlands | 16 | 13 | 19 | 18 | 17 | 23 | 20 |
| Denmark | 5 | 5 | 17 | 10 | 12 | 13 | 17 |
| India | 5 | 11 | 5 | 12 | 12 | 15 | 14 |
| Papua New Guinea | 8 | 7 | 7 | 6 | 11 | 10 | 7 |
| Other countries | 200 | 229 | 295 | 269 | 232 | 268 | 315 |
| Total mechanical and electrical machinery export | 1,734 | 1,971 | 2,408 | 2,413 | 2,294 | 2,433 | 2,631 |
Imports are valued in New Zealand dollars. Foreign currency values are converted to New Zealand dollars when import documents are processed by the New Zealand Customs Service, which sets exchange rates each fortnight. Imports for the year ending 30 June 2005 were valued at $35.8 billion, an increase of 7.2 percent ($2.4 billion) on the previous June year. As Table 25.15 shows, vehicles, parts and accessories accounted for $5.5 billion worth of imports.
Table 25.15. Major import commodities1
Years ending 30 June
| Commodity | 1999 | 2000 | 2001 | 2002 | 2003 | 2004 | 2005 |
|---|---|---|---|---|---|---|---|
1Imports valued cif (cost including insurance and freight). Source: Statistics New Zealand | |||||||
| $(million) | |||||||
| Vehicles, parts and accessories | 2,984 | 3,549 | 3,667 | 4,389 | 4,985 | 5,347 | 5,463 |
| Mechanical machinery and equipment | 3,445 | 3,807 | 4,111 | 4,370 | 4,333 | 4,529 | 4,906 |
| Mineral fuels | 1,378 | 2,319 | 3,560 | 2,870 | 3,152 | 3,129 | 4,149 |
| Electrical machinery and equipment | 2,525 | 2,938 | 3,390 | 2,807 | 2,701 | 3,116 | 3,221 |
| Plastics and plastic articles | 996 | 1,191 | 1,337 | 1,315 | 1,279 | 1,230 | 1,382 |
| Optical, medical and measuring equipment | 762 | 845 | 984 | 987 | 967 | 1,034 | 1,094 |
| Paper, paperboard and paper articles | 739 | 833 | 910 | 934 | 924 | 935 | 942 |
| Aircraft and parts | 801 | 1,503 | 884 | 829 | 804 | 1,131 | 705 |
| Pharmaceutical products | 682 | 724 | 781 | 763 | 747 | 788 | 875 |
| Iron or steel articles | 352 | 402 | 451 | 491 | 497 | 552 | 665 |
| Iron and steel | 370 | 462 | 479 | 529 | 482 | 505 | 625 |
| Apparel – not knitted or crocheted | 330 | 394 | 448 | 437 | 446 | 436 | 451 |
The value of machinery imports totalled $8.1 billion in the year ending 30 June 2005. This was an increase of 6.3 percent ($482 million) on the previous June year. Table 25.16 shows that the main types of machinery imported were automatic data processing machines/computers ($1.069 billion), transmission apparatus ($531 million) and machinery, parts and accessories ($416 million).
Table 25.16. Mechanical and electrical machinery
imports1,2
Years ending 30
June
| Product | 1999 | 2000 | 2001 | 2002 | 2003 | 2004 | 2005 |
|---|---|---|---|---|---|---|---|
1Imports valued cif (cost including insurance and freight). 2Confidential data excluded. Note: Figures may not add to stated totals due to rounding. Source: Statistics New Zealand | |||||||
| $(million) | |||||||
| Automatic data processing machines | 881 | 873 | 1,024 | 938 | 929 | 1,023 | 1,069 |
| Transmission apparatus | 270 | 436 | 461 | 401 | 310 | 469 | 531 |
| Machinery, parts and accessories | 336 | 419 | 498 | 481 | 449 | 465 | 416 |
| Electrical apparatus for line telephony or telegraphy | 454 | 464 | 479 | 313 | 315 | 292 | 343 |
| Bulldozers, graders, levellers, etc | 97 | 170 | 160 | 233 | 269 | 253 | 326 |
| Reception apparatus for television | 115 | 130 | 148 | 154 | 193 | 221 | 247 |
| Records, tapes and other recorded sound | 223 | 205 | 217 | 195 | 202 | 219 | 244 |
| Taps, cocks, valves etc | 111 | 123 | 127 | 140 | 132 | 136 | 148 |
| Electrical apparatus for electrical circuits | 127 | 137 | 144 | 142 | 143 | 142 | 146 |
| Electric water, space and oil heaters | 96 | 109 | 120 | 129 | 129 | 139 | 143 |
| Other | 3,261 | 3,678 | 4,124 | 4,051 | 3,964 | 4,286 | 4,512 |
| Total mechanical and electrical machinery imports | 5,970 | 6,745 | 7,501 | 7,177 | 7,034 | 7,645 | 8,127 |
| Percentage of total imports | 24.6 | 23.1 | 23.5 | 22.6 | 21.9 | 22.9 | 22.7 |
The People's Republic of China was the main source of imported machinery, supplying 14.3 percent ($1.164 billion) of total machinery imports for the year.
The United States supplied 13.9 percent ($1.133 billion).
Table 25.17 shows mechanical and electrical machinery imports by country of origin for the years 1999 to 2005.
Table 25.17. Mechanical and electrical machinery
imports1,2
By country of origin
Years ending 30 June
| Years | |||||||
|---|---|---|---|---|---|---|---|
| Country | 1999 | 2000 | 2001 | 2002 | 2003 | 2004 | 2005 |
1Imports valued cif (cost including insurance and freight). 2Confidential data excluded. Note: Figures may not add to stated totals due to rounding. Source: Statistics New Zealand | |||||||
| $(million) | |||||||
| China, People's Republic of | 240 | 311 | 457 | 582 | 708 | 900 | 1,164 |
| United States | 1,534 | 1,770 | 2,044 | 1,635 | 1,315 | 1,352 | 1,133 |
| Japan | 675 | 805 | 817 | 777 | 816 | 845 | 957 |
| Australia | 651 | 706 | 738 | 784 | 822 | 953 | 956 |
| Germany | 323 | 380 | 411 | 478 | 496 | 463 | 536 |
| Malaysia | 251 | 333 | 356 | 332 | 303 | 337 | 345 |
| Korea, Republic of | 125 | 158 | 181 | 260 | 261 | 313 | 345 |
| Italy | 185 | 206 | 231 | 267 | 294 | 314 | 317 |
| Singapore | 323 | 358 | 321 | 271 | 235 | 237 | 281 |
| Taiwan | 252 | 266 | 295 | 270 | 267 | 260 | 272 |
| Other countries | 1,412 | 1,451 | 1,651 | 1,520 | 1,515 | 1,671 | 1,822 |
| Total mechanical and electrical machinery imports | 5,970 | 6,745 | 7,501 | 7,177 | 7,032 | 7,645 | 8,127 |
Passenger vehicle imports in the year ending 30 June 2005 were valued at $3.4 billion, an increase of 1.7 percent ($57 million) on the previous June year.
Japan was New Zealand's main source of imported passenger vehicles, supplying 48.5 percent by value and 69.9 percent by number during the June 2005 year.
The value of vehicles from Japan was 6.0 percent ($106 million) lower in 2005 than in the previous June year, while the number was down by 3.6 percent.
Table 25.18 shows the country of origin, value and number of passenger vehicles imported into New Zealand in the years 2001 to 2005.
Table 25.18. Passenger vehicle imports1
By country of origin
Years ending 30 June
| Origin | 2001 | 2002 | 2003 | 2004 | 2005 | |||||
|---|---|---|---|---|---|---|---|---|---|---|
1Imports valued cif (cost including insurance and freight). Note: Figures may not add to stated totals due to rounding. Source: Statistics New Zealand | ||||||||||
| $(million) | Quantity | $(million) | Quantity | $(million) | Quantity | $(million) | Quantity | $(million) | Quantity | |
| Japan | 1,333 | 149,963 | 1,538 | 166,167 | 1,711 | 177,230 | 1,761 | 184,422 | 1,656 | 177,818 |
| Australia | 402 | 14,439 | 463 | 15,846 | 566 | 19,061 | 575 | 18,729 | 628 | 20,233 |
| Germany | 248 | 8,873 | 304 | 12,073 | 394 | 12,654 | 472 | 16,497 | 434 | 16,968 |
| United States | 77 | 5,364 | 110 | 6,330 | 136 | 7,061 | 110 | 6,499 | 129 | 9,403 |
| Korea, Republic of | 59 | 4,083 | 28 | 2,043 | 51 | 3,772 | 49 | 4,053 | 93 | 7,172 |
| United Kingdom | 79 | 3,240 | 83 | 3,634 | 131 | 4,733 | 141 | 5,871 | 151 | 5,616 |
| Belgium | 27 | 1,276 | 89 | 3,953 | 83 | 3,655 | 58 | 2,731 | 58 | 2,736 |
| France | 36 | 1,434 | 52 | 2,119 | 63 | 2,743 | 44 | 2,108 | 58 | 2,550 |
| South Africa | 25 | 503 | 37 | 688 | 37 | 677 | 26 | 549 | 59 | 1,669 |
| Italy | 18 | 513 | 28 | 739 | 28 | 735 | 21 | 555 | 25 | 727 |
| Other countries | 114 | 4,776 | 103 | 5,010 | 88 | 4,436 | 101 | 5,189 | 124 | 9,636 |
| Total passenger vehicle imports | 2,417 | 194,464 | 2,834 | 218,602 | 3,289 | 236,757 | 3,360 | 247,203 | 3,416 | 254,528 |
Imports of mineral fuels in the year ending 30 June 2005 were valued at $4.1 billion, up 32.6 percent ($1.020 billion) on the previous June year.
Imports of crude petroleum rose in value by 28.7 percent ($464 million) and imports of non-crude petroleum rose by 39.7 percent ($530 million).
Crude petroleum made up 50.1 percent, by value, of all mineral fuel imports.
Table 25.19 shows the value of mineral fuel imports from 1999 to 2005.
Table 25.19. Mineral fuel
imports1,2
Years ending 30
June
| Product | 1999 | 2000 | 2001 | 2002 | 2003 | 2004 | 2005 |
|---|---|---|---|---|---|---|---|
1Imports valued cif (cost including insurance and freight). 2Confidential data excluded. Note: Figures may not add to stated totals due to rounding. Source: Statistics New Zealand | |||||||
| $(million) | |||||||
| Crude petroleum | 891 | 1,497 | 2,355 | 1,860 | 1,939 | 1,617 | 2,080 |
| Non-crude petroleum | 409 | 737 | 1,044 | 889 | 1,057 | 1,335 | 1,865 |
| Coal, coke, briquettes, etc | 70 | 76 | 147 | 98 | 137 | 151 | 173 |
| Other | 8 | 10 | 13 | 24 | 19 | 26 | 30 |
| Total mineral fuel imports | 1,378 | 2,319 | 3,560 | 2,870 | 3,152 | 3,129 | 4,149 |
| Percentage of total imports | 5.7 | 7.9 | 11.2 | 9.0 | 9.8 | 9.4 | 11.6 |
As Table 25.20 shows, in the year ending 30 June 2005, Australia provided 30.5 percent of New Zealand's mineral fuel imports, compared with 24.8 percent in the previous June year.
Table 25.2. Mineral fuel
imports1,2
By country of origin
Years ending 30 June
| Country | 1999 | 2000 | 2001 | 2002 | 2003 | 2004 | 2005 |
|---|---|---|---|---|---|---|---|
1Imports valued cif (cost including insurance and freight). 2Confidential data excluded. - nil or zero Note: Figures may not add to slated totals due to rounding. Source: Statistics New Zealand | |||||||
| $(million) | |||||||
| Australia | 444 | 690 | 1,002 | 977 | 944 | 777 | 1,267 |
| Singapore | 16 | 25 | 64 | 116 | 172 | 394 | 609 |
| United Arab Emirates | 135 | 168 | 398 | 382 | 333 | 384 | 363 |
| Nigeria | 25 | 79 | 26 | - | 120 | 44 | 200 |
| Saudi Arabia | 241 | 481 | 560 | 394 | 151 | 93 | 177 |
| Indonesia | 10 | 11 | 71 | 26 | 82 | 57 | 177 |
| Brunei Darussalam | 17 | 32 | - | 68 | 216 | 275 | 160 |
| Oman | 66 | 185 | 239 | 322 | 351 | 218 | 152 |
| Qatar | 12 | 32 | 249 | 33 | 124 | 46 | 101 |
| Malaysia | 85 | 145 | 345 | 212 | 252 | 137 | 74 |
| Other countries | 327 | 471 | 606 | 341 | 407 | 704 | 870 |
| Total mineral fuel imports | 1,378 | 2,319 | 3,560 | 2,870 | 3,152 | 3,129 | 4,149 |
In the year ending 30 June 2005, 77.8 percent of New Zealand's merchandise exports went to Northeast Asia, Australia, Europe and Northern America, compared with 78.8 percent in the year ending 30 June 2004 and 79.3 percent in the year ending 30 June 2003. In the June 2005 year, 81.0 percent of New Zealand's merchandise imports came from these same country groups, compared with 83.2 percent in the year ending 30 June 2004 and 82.7 percent in the year ending 30 June 2003.
North-east Asia includes Japan, the People's Republic of China, the Republic of Korea and Taiwan, who are all major trading partners for New Zealand.
New Zealand's top 10 trading partners received 68.3 percent of its merchandise exports and supplied 73.1 percent of its merchandise imports in the year ending 30 June 2005.
The single most important trading partner for merchandise exports and imports was Australia, followed by the United States and Japan.
In the year ending 30 June 2005, these three countries took 46.5 percent of New Zealand's merchandise exports and provided 43.3 percent of imports.
Tables 25.21 and 25.22 show New Zealand's top 10 trading partners in the years 2001–05.
Table 25.21. Merchandise exports1
Top 10 countries of
destination
Years ending 30 June
| Country | 2001 | 2002 | 2003 | 2004 | 2005 |
|---|---|---|---|---|---|
1Exports valued free on board at New Zealand ports, re-exports included. Note: Figures may not add to stated totals due to rounding. Source: Statistics New Zealand | |||||
| $(million) | |||||
| Australia | 6,083 | 6,326 | 6,050 | 6,332 | 6,507 |
| United States | 4,651 | 4,922 | 4,366 | 4,297 | 4,295 |
| Japan | 4,314 | 3,732 | 3,354 | 3,283 | 3,446 |
| China, People's Republic of | 1,126 | 1,434 | 1,457 | 1,617 | 1,587 |
| United Kingdom | 1,538 | 1,580 | 1,361 | 1,449 | 1,436 |
| Korea, Republic of | 1,386 | 1,466 | 1,178 | 1,112 | 1,080 |
| Germany | 843 | 828 | 855 | 710 | 793 |
| Taiwan | 730 | 711 | 667 | 661 | 688 |
| Philippines | 503 | 525 | 490 | 478 | 543 |
| Hong Kong | 848 | 698 | 582 | 556 | 532 |
| Total top 10 countries | 22,022 | 22,222 | 20,360 | 20,495 | 20,905 |
| Other countries | 9,978 | 10,110 | 8,931 | 9,369 | 9,713 |
| Total all countries | 32,000 | 32,332 | 29,291 | 29,864 | 30,618 |
Table 25.22. Merchandise imports1
Top 10 countries of origin
Years ending 30 June
| Country | 2007 | 2002 | 2003 | 2004 | 2005 |
|---|---|---|---|---|---|
1Imports valued cif (cost including insurance and freight). Note: Figures mas not add to stated totals due to rounding. Source: Statistics New Zealand | |||||
| $(million) | |||||
| Australia | 7,010 | 7,188 | 7,278 | 7,364 | 7,933 |
| Japan | 3,427 | 3,618 | 3,876 | 3,849 | 3,924 |
| China, People's Republic of | 2,149 | 2,371 | 2,687 | 3,066 | 3,673 |
| United States | 5,298 | 4,777 | 4,067 | 3,930 | 3,641 |
| Germany | 1,419 | 1,576 | 1,713 | 1,736 | 1,848 |
| United Kingdom | 1,187 | 1,207 | 1,120 | 1,090 | 1,190 |
| Singapore | 578 | 588 | 610 | 828 | 1,120 |
| Korea, Republic of | 700 | 747 | 832 | 897 | 1,018 |
| France | 592 | 594 | 700 | 1,131 | 927 |
| Italy | 676 | 768 | 826 | 810 | 877 |
| Total top 10 countries | 23,037 | 23,436 | 23,710 | 24,700 | 26,152 |
| Other countries | 8,890 | 8,375 | 8,451 | 8,678 | 9,641 |
| Total all countries | 31,927 | 31,811 | 32,161 | 33,378 | 35,793 |
Table 25.23. Trade with Australia1
Years ending 30
June
| Year | Exports (fob) | Imports (cif) | Balance of merchandise trade (fob-cif) |
|---|---|---|---|
1Exports valued free on board at New Zealand ports, re-exports included. Imports valued cif (cost including insurance and freight). Note: Figures may not add to stated totals due to rounding. Source: Statistics New Zealand | |||
| $(million) | |||
| 1992 | 3,388 | 3,427 | -39 |
| 1993 | 3,786 | 3,747 | 38 |
| 1994 | 4,162 | 3,942 | 220 |
| 1995 | 4,342 | 4,444 | -101 |
| 1996 | 4,205 | 4,964 | -759 |
| 1997 | 4,276 | 5,080 | -804 |
| 1998 | 4,589 | 5,579 | -990 |
| 1999 | 4,857 | 5,367 | -510 |
| 2000 | 5,528 | 6,843 | -1,316 |
| 2001 | 6,083 | 7,010 | -927 |
| 2002 | 6,326 | 7,188 | -862 |
| 2003 | 6,050 | 7,278 | -1,228 |
| 2004 | 6,332 | 7,364 | -1,032 |
| 2005 | 6,507 | 7,933 | -1,426 |
Australia is New Zealand's main trading partner, receiving 21.3 percent by value of New Zealand's merchandise exports and supplying 22.2 percent of merchandise imports in the year ending 30 June 2005. The value of exports to Australia increased by 2.8 percent ($175 million) in the year ending 30 June 2004 and imports rose by 7.7 percent ($569 million) in value. Table 25.23 shows the balance of merchandise trade with Australia from 1992 to 2005.
The value of exports of mineral fuels to Australia in the June 2005 year rose by 29.5 percent ($76 million) on the previous year and the value of dairy product exports rose 15.0 percent ($33 million), as shown in Table 25.24.
Table 25.24. Trade with
Australia1,2
By main commodities
exported
Years ending 30 June
| Commodity | 2001 | 2002 | 2003 | 2004 | 2005 |
|---|---|---|---|---|---|
1Exports valued free on board at New Zealand ports, re-exports included. 2Export values exclude confidential data. 3Data no longer confidential assigned to specific commodities. - nil or zero Note: Figures may not add to stated totals due to rounding. Source: Statistics New Zealand | |||||
| $(million) | |||||
| Mechanical machinery and equipment | 630 | 661 | 669 | 740 | 731 |
| Wood and articles of wood | 342 | 380 | 412 | 399 | 376 |
| Precious metals, jewellery and coins | 263 | 291 | 279 | 312 | 337 |
| Mineral fuels | 498 | 435 | 360 | 257 | 333 |
| Electrical machinery and equipment | 316 | 344 | 292 | 303 | 332 |
| Plastics and plastic articles | 255 | 256 | 254 | 270 | 288 |
| Dairy products | 262 | 269 | 243 | 221 | 254 |
| Paper and paperboard articles | 446 | 437 | 177 | 182 | 180 |
| Fish, crustaceans and molluscs | 166 | 162 | 175 | 170 | 153 |
| Wool and animal hair | 112 | 127 | 156 | 158 | 135 |
| Other commodities | 2,794 | 2,964 | 3,034 | 3,318 | 3,387 |
| Confidential data3 | - | 1 | 213 | 199 | 259 |
| Total commodities exported | 6,083 | 6,327 | 6,263 | 6,530 | 6,766 |
Table 25.25 shows that imports of mineral fuels from Australia in the year ending 30 June 2005 rose in value by 63.0 percent ($490 million) on the previous June year.
The value of imports of vehicles, parts and accessories rose by 7.2 percent ($57 million), while imports of paper and paperboard articles fell 10.3 percent ($45 million) in value.
Table 25.25. Trade with
Australia1,2
By main commodities
imported
Years ending 30 June
| Commodity | 1999 | 2000 | 2001 | 2002 | 2003 | 2004 | 2005 |
|---|---|---|---|---|---|---|---|
1Imports valued cif (cost including insurance and freight). 2Import values exclude confidential data. 3Data no longer confidential assigned to specific commodities. - nil or zero Note: Figures may not add to stated totals due to rounding. Source: Statistics New Zealand | |||||||
| $(million) | |||||||
| Mineral fuels | 444 | 690 | 1,002 | 977 | 944 | 777 | 1,267 |
| Vehicles, parts and accessories | 385 | 503 | 514 | 628 | 761 | 796 | 853 |
| Mechanical machinery and equipment | 348 | 353 | 382 | 447 | 509 | 586 | 553 |
| Electrical machinery and equipment | 303 | 353 | 357 | 338 | 312 | 367 | 403 |
| Paper and paperboard articles | 295 | 373 | 415 | 415 | 425 | 435 | 390 |
| Plastics and plastic products | 232 | 266 | 283 | 286 | 266 | 282 | 305 |
| Inorganic chemicals | 278 | 317 | 371 | 325 | 286 | 303 | 285 |
| Pharmaceutical products | 203 | 242 | 238 | 210 | 210 | 236 | 211 |
| Books, newspapers and printed matter | 159 | 173 | 170 | 174 | 186 | 185 | 191 |
| Beverages, spirits and vinegar | 110 | 136 | 158 | 161 | 183 | 189 | 184 |
| Other commodities3 | 2,609 | 3,438 | 3,120 | 3,225 | 3,190 | 3,189 | 3,244 |
| Confidential data | - | 2 | 5 | 18 | 47 | ||
| Total commodities imported | 5,367 | 6,843 | 7,010 | 7,188 | 7,278 | 7,364 | 7,933 |
The United States is New Zealand's second main export destination and its fourth import supplier. As Table 25.26 shows, in the year ending 30 June 2005, the value of merchandise exports remained relatively unchanged (down $2 million), while the value of merchandise imports decreased by 7.4 percent ($289 million).
Table 25.26. Trade with the United States1
Years ending 30
June
| Year | Exports (fob) | Imports (cif) | Balance of merchandise trade (fob-cif) |
|---|---|---|---|
1Exports valued free on board at New Zealand ports, re-exports included. Imports valued cif (cost including insurance and freight). Note: Figures may not add to stated totals due to rounding. Source: Statistics New Zealand | |||
| $(million) | |||
| 1992 | 2,293 | 2,808 | -515 |
| 1993 | 2,257 | 3,199 | -942 |
| 1994 | 2,229 | 3,321 | -1,092 |
| 1995 | 2,142 | 4,274 | -2,132 |
| 1996 | 1,860 | 3,687 | -1,827 |
| 1997 | 2,085 | 3,623 | -1,538 |
| 1998 | 2,589 | 3,974 | -1,385 |
| 1999 | 2,995 | 4,283 | -1,288 |
| 2000 | 3,733 | 5,127 | -1,394 |
| 2001 | 4,651 | 5,298 | -647 |
| 2002 | 4,922 | 4,777 | 145 |
| 2003 | 4,366 | 4,067 | 299 |
| 2004 | 4,297 | 3,930 | 367 |
| 2005 | 4,295 | 3,641 | 654 |
Main commodities contributing to the decrease in export values were meat and edible offal, down 16.2 percent ($202 million), and casein and caseinates, down 20.8 percent ($76 million). As Table 25.27 shows, the value of dairy product exports to the United States was up 50.8 percent ($136 million) on the June 2004 year.
Table 25.27. Trade with the United
States1,2
By main commodities
exported
Years ending 30 June
| Commodity | 1999 | 2000 | 2001 | 2002 | 2003 | 2004 | 2005 |
|---|---|---|---|---|---|---|---|
1Exports valued free on board at New Zealand ports, re-exports included. 2Confidential data excluded. 3Data no longer confidential assigned to specific commodities. - nil or zero Note: Figures may not add to stated totals due to rounding. Source: Statistics New Zealand | |||||||
| $(million) | |||||||
| Meat and edible offal | 786 | 1,082 | 1,220 | 1,313 | 1,149 | 1,250 | 1,048 |
| Logs, wood and wood articles | 212 | 311 | 377 | 494 | 496 | 359 | 420 |
| Dairy produce | 250 | 268 | 260 | 365 | 223 | 268 | 404 |
| Mechanical machinery and equipment | 154 | 180 | 248 | 276 | 258 | 266 | 326 |
| Casein and caseinates | 385 | 443 | 588 | 565 | 458 | 365 | 289 |
| Fish, crustaceans and molluscs | 240 | 263 | 249 | 298 | 245 | 199 | 202 |
| Electrical machinery and equipment | 88 | 147 | 230 | 193 | 196 | 186 | 189 |
| Vehicles, parts and accessories | 42 | 92 | 134 | 121 | 131 | 96 | 108 |
| Optical, medical and measuring equipment | 70 | 70 | 91 | 112 | 124 | 118 | 95 |
| Fruit and nuts | 133 | 143 | 140 | 132 | 102 | 129 | 72 |
| Other commodities | 633 | 735 | 1,701 | 1,619 | 1,436 | 1,426 | 1,428 |
| Confidential data3 | - | - | - | - | 5 | 1 | 3 |
| Total commodities exported | 2,995 | 3,733 | 5,240 | 5,487 | 4,824 | 4,662 | 4,584 |
Main commodities contributing to the decrease in imports from the United States, as shown in Table 25.28, were electrical machinery and equipment, down 27.7 percent ($124 million), aircraft and parts, down 21.0 percent ($96 million), and mechanical machinery and equipment, down 10.4 percent ($94 million).
Table 25.28. Trade with the United
States1,2
By main commodities
imported
Years ending 30 June
| Commodity | 1999 | 2000 | 2001 | 2002 | 2003 | 2004 | 2005 |
|---|---|---|---|---|---|---|---|
1Imports valued cif (cost including insurance and freight). 2Confidential date excluded. - nil or zero Note: Figures may not add to stated totals due to rounding. Source: Statistics New Zealand | |||||||
| $(million) | |||||||
| Mechanical machinery and equipment | 1,043 | 1,079 | 1,114 | 1,025 | 908 | 904 | 810 |
| Aircraft and parts | 738 | 1,191 | 777 | 692 | 586 | 457 | 361 |
| Electrical machinery and equipment | 490 | 691 | 929 | 611 | 408 | 448 | 324 |
| Vehicles, parts and accessories | 154 | 221 | 218 | 279 | 297 | 289 | 306 |
| Optical, medical and measuring equipment | 273 | 282 | 342 | 320 | 268 | 277 | 304 |
| Plastics and plastic articles | 194 | 220 | 248 | 239 | 205 | 191 | 192 |
| Chemical products | 110 | 100 | 116 | 128 | 117 | 109 | 104 |
| Organic chemicals | 119 | 112 | 137 | 124 | 85 | 88 | 80 |
| Pharmaceutical products | 40 | 55 | 65 | 77 | 82 | 81 | 70 |
| Books, newspapers and printed matter | 83 | 85 | 102 | 73 | 68 | 59 | 59 |
| Other commodities | 1,039 | 1,091 | 1,250 | 1,209 | 1,043 | 1,027 | 1,026 |
| Confidential data | - | - | - | - | 1 | 1 | 5 |
| Total commodities imported | 4,283 | 5,127 | 5,298 | 4,777 | 4,067 | 3,930 | 3,641 |
Japan is New Zealand's third main trading partner (after Australia and the United States) for merchandise exports and the second highest supplier of merchandise imports. The value of merchandise exports to Japan in the year ending 30 June 2005, as shown in Table 25.29, was up 5.0 percent ($163 million) from the previous June year, while merchandise imports increased 2.0 percent ($75 million) in value.
Table 25.30 shows that the main contributors to the rise in export values were meat and edible offal (up 37.0 percent or $110 million), fruit and nuts (up 24.0 percent or $52 million) and miscellaneous edible preparations (up 27.6 percent or $30 million).
Table 25.29. Trade with Japan1
Years ending 30
June
| Year | Exports (fob) | Imports (cif) | Balance of merchandise trade (fob-cif) |
|---|---|---|---|
1Exports valued free on board at New Zealand ports, re-exports included. Imports valued cif (cost including insurance and freight). Note: Figures may not add to stated totals due to rounding. Source: Statistics New Zealand | |||
| $(million) | |||
| 1992 | 2,715 | 2,375 | 340 |
| 1993 | 2,759 | 2,653 | 106 |
| 1994 | 2,887 | 2,928 | -41 |
| 1995 | 3,417 | 3,176 | 241 |
| 1996 | 3,302 | 2,885 | 417 |
| 1997 | 3,138 | 2,846 | 292 |
| 1998 | 3,038 | 2,539 | 499 |
| 1999 | 2,894 | 3,056 | -162 |
| 2000 | 3,382 | 3,474 | -93 |
| 2001 | 4,314 | 3,427 | 887 |
| 2002 | 3,732 | 3,618 | 115 |
| 2003 | 3,354 | 3,876 | -522 |
| 2004 | 3,283 | 3,849 | -566 |
| 2005 | 3,446 | 3,924 | -479 |
Table 25.3. Trade with Japan1,2
By main commodities
exported
Years ending 30 June
| Commodity | 1999 | 2000 | 2001 | 2002 | 2003 | 2004 | 2005 |
|---|---|---|---|---|---|---|---|
1Exports valued free on hoard at New Zealand ports, re-exports included. 2Confidential data excluded. 3Data no longer confidential assigned to specific commodities. - nil or zero Note: Figures may not add to stated totals due to rounding. Source: Statistics New Zealand | |||||||
| $(million) | |||||||
| Aluminium and aluminium articles | 501 | 642 | 808 | 642 | 553 | 582 | 565 |
| Logs, wood and wood articles | 480 | 565 | 733 | 602 | 578 | 546 | 513 |
| Meat and edible offal | 159 | 160 | 199 | 168 | 163 | 298 | 409 |
| Dairy produce | 283 | 272 | 350 | 391 | 235 | 242 | 268 |
| Fruit and nuts | 133 | 142 | 176 | 185 | 184 | 216 | 267 |
| Fish, crustaceans and molluscs | 255 | 295 | 321 | 274 | 229 | 164 | 155 |
| Vegetables | 162 | 177 | 197 | 180 | 182 | 139 | 151 |
| Miscellaneous edible preparations | 32 | 63 | 110 | 95 | 138 | 108 | 138 |
| Albuminoidal substances and glues | 130 | 116 | 168 | 155 | 120 | 120 | 133 |
| Mineral fuels | 46 | 144 | 202 | 121 | 138 | 86 | 67 |
| Other commodities | 713 | 805 | 1,049 | 899 | 762 | 714 | 552 |
| Confidential data3 | - | - | - | 21 | 71 | 68 | 228 |
| Total commodities exported | 2,894 | 3,382 | 4,314 | 3,732 | 3,354 | 3,283 | 3,446 |
The main contributor to the rise in import values was mechanical machinery and equipment, which, as Table 25.31 shows, increased 16.9 percent ($85 million).
Table 25.31. Trade with Japan1,2
By main commodities
imported
Years ending 30 June
| Commodity | 1999 | 2000 | 2001 | 2002 | 2003 | 2004 | 2005 |
|---|---|---|---|---|---|---|---|
1Imports valued cif (cost including insurance and freight). 2Confidential data excluded. 3Data no longer confidential assigned to specific commodities. - nil or zero Note: Figures may not add to slated totals due to rounding. Source: Statistics New Zealand | |||||||
| $(million) | |||||||
| Vehicles, parts and accessories | 1,646 | 1,858 | 1,733 | 2,000 | 2,293 | 2,321 | 2,264 |
| Mechanical machinery and equipment | 407 | 496 | 500 | 550 | 561 | 505 | 590 |
| Electrical machinery and equipment | 268 | 310 | 317 | 227 | 257 | 341 | 366 |
| Optical, medical and measuring equipment | 121 | 152 | 158 | 159 | 150 | 142 | 133 |
| Iron and steel | 80 | 89 | 92 | 84 | 93 | 85 | 96 |
| Rubber and rubber articles | 68 | 70 | 75 | 85 | 80 | 83 | 87 |
| Plastics and plastic articles | 63 | 90 | 76 | 68 | 79 | 63 | 82 |
| Photograph film, papers and chemicals | 42 | 50 | 60 | 64 | 56 | 44 | 46 |
| Paper and paperboard articles | 36 | 43 | 37 | 32 | 28 | 31 | 33 |
| Toys, games and sports requisites | 40 | 23 | 33 | 47 | 39 | 7 | 4 |
| Other commodities | 285 | 294 | 346 | 303 | 240 | 225 | 207 |
| Confidential data3 | - | - | - | - | - | 2 | 15 |
| Total commodities imported | 3,056 | 3,474 | 3,427 | 3,618 | 3,876 | 3,849 | 3,924 |
The People's Republic of China became New Zealand's fourth largest trading partner in the year ending 30 June 1999, displacing the United Kingdom, which had been the country's largest trading partner until Australia, Japan and the United States became dominant in the late 1970s. In the year ending 30 June 2005, the People's Republic of China received $1.6 billion worth of New Zealand's merchandise exports, down 1.9 percent ($30 million) from the previous June year. As Table 25.32 shows, main commodities exported were dairy produce ($280 million), wood pulp and waste paper ($145 million) and wool and animal hair ($139 million).
Table 25.32. Trade with the People's Republic of
China1,2
By main commodities
exported
Years ending 30 June
| Commodity | 1999 | 2000 | 2001 | 2002 | 2003 | 2004 | 2005 |
|---|---|---|---|---|---|---|---|
1Exports valued free on board at New Zealand ports, re-exports included. 2Confidential data excluded. 3Data no longer confidential assigned to specific commodities. - nil or zero Note: Figures may not add to staled totals due to rounding. Source: Statistics New Zealand | |||||||
| $(million) | |||||||
| Dairy produce | 123 | 95 | 158 | 195 | 303 | 359 | 280 |
| Wood pulp and waste paper | 22 | 80 | 81 | 119 | 78 | 140 | 145 |
| Wool and animal hair | 122 | 128 | 166 | 220 | 152 | 168 | 139 |
| Logs, wood and wood articles | 27 | 75 | 96 | 199 | 220 | 187 | 137 |
| Fish, crustaceans and molluscs | 43 | 21 | 42 | 59 | 55 | 67 | 109 |
| Animal originated products (except dairy produce) | 33 | 34 | 48 | 59 | 76 | 84 | 88 |
| Raw hides, skins and leather | 19 | 39 | 114 | 111 | 117 | 88 | 88 |
| Animal or vegetable fats and oils | 52 | 44 | 34 | 38 | 48 | 61 | 53 |
| Meat and edible offal | 14 | 18 | 38 | 58 | 60 | 61 | 45 |
| Paper and paperboard articles | 23 | 35 | 45 | 72 | 45 | 29 | 33 |
| Other commodities | 146 | 198 | 303 | 299 | 284 | 365 | 396 |
| Confidential data3 | - | - | - | 6 | 19 | 9 | 74 |
| Total commodities exported | 626 | 766 | 1,126 | 1,434 | 1,457 | 1,617 | 1,587 |
New Zealand imported goods worth $3.7 billion from the People's Republic of China in the year ending 30 June 2005, an increase of 19.8 percent ($607 million), on the previous June year. Main commodities imported were clothing ($677 million), electrical machinery and equipment ($585 million) and mechanical machinery and equipment ($579 million). Table 25.33 shows the value of the main commodities imported from the People's Republic of China between 1999 and 2005.
Table 25.33. Trade with the People's Republic of
China1,2
By main commodities
imported
Years ending 30 June
| Commodity | 1999 | 2000 | 2001 | 2002 | 2003 | 2004 | 2005 |
|---|---|---|---|---|---|---|---|
1Imports valued cif (cost including insurance and freight). 2Confidential data excluded. 3Data no longer confidential assigned to specific commodities. - nil or zero Note: Figures may not add to stated totals due to rounding. Source: Statistics New Zealand | |||||||
| $(million) | |||||||
| Electrical machinery and equipment | 155 | 198 | 298 | 323 | 399 | 490 | 585 |
| Mechanical machinery and equipment | 85 | 113 | 159 | 259 | 309 | 410 | 579 |
| Apparel, knitted or crocheted | 188 | 253 | 319 | 301 | 302 | 327 | 352 |
| Apparel, not knitted or crocheted | 148 | 209 | 278 | 284 | 305 | 308 | 325 |
| Furniture, furnishings, lighting fittings | 37 | 54 | 68 | 76 | 107 | 140 | 194 |
| Toys, games and sport requisites | 98 | 111 | 140 | 128 | 146 | 176 | 177 |
| Footwear | 73 | 95 | 116 | 137 | 132 | 141 | 155 |
| Plastics and plastic articles | 42 | 48 | 65 | 73 | 78 | 83 | 106 |
| Textiles | 36 | 46 | 59 | 65 | 76 | 85 | 104 |
| Optical, medical and measuring equipment | 21 | 33 | 48 | 64 | 76 | 75 | 79 |
| Other commodities | 351 | 471 | 598 | 662 | 757 | 830 | 1,010 |
| Confidential data3 | - | - | - | - | - | 1 | 7 |
| Total commodities imported | 1,234 | 1,630 | 2,149 | 2,371 | 2,687 | 3,066 | 3,673 |
Asia Pacific Economic Cooperation (APEC) provides 21 countries in the region (including New Zealand, Australia, Japan and the United States) with a forum to promote economic interaction and policy coordination to ensure regional economic growth.
As shown in Figure 25.01, APEC countries received 71.1 percent ($21.8 billion) of New Zealand's merchandise exports by value in the year ending 30 June 2005, compared with 71.4 percent ($21.3 billion) in the previous June year.
APEC countries supplied 71.3 percent ($25.5 billion) of the value of New Zealand's merchandise imports in the year ending 30 June 2005, compared with 72.2 percent ($24.1 billion) in the previous June year.
The European Union (EU) was formed in 1993, replacing the former European Economic Community (EEC).
EU founding members were Belgium, Denmark, France, Germany, Greece, Ireland, Italy, Luxembourg, the Netherlands, Portugal, Spain and the United Kingdom.
In 1995, Austria, Finland and Sweden became members.
In 2004, a further 10 Eastern European and Mediterranean countries joined the EU.
As Figure 25.02 shows, in the year ending 30 June 2005, the EU received 15.8 percent ($4.8 billion) of New Zealand's merchandise exports by value and supplied 19.4 percent ($6.9 billion) of the value of New Zealand's merchandise imports.
Due to the negative impacts of Severe Acute Respiratory Syndrome (SARS) and the Iraq war, the value of New Zealand's exports to Asia dropped in the years ending 30 June 2003 and 2004.
In the year ending 30 June 2005, however, the value of exports to Asia increased by 3.6 percent to $10.2 billion, as shown in Figure 25.03 overleaf.
Table 25.34 shows the value of exports to selected country groupings in recent years.
Table 25.34. Merchandise exports1
By country grouping
Years ending 30 June
| Year | Country grouping | ||||||
|---|---|---|---|---|---|---|---|
| Asia | Europe | EU | OECD | APEC | ASEAN | Total exports | |
1Exports valued free on board at New Zealand ports, re-exports included. Source: Statistics New Zealand | |||||||
| $(million) | |||||||
| 1999 | 7,501.0 | 4,203.7 | 3,951.3 | 16,233.7 | 15,743.1 | 1,633.5 | 22,582 |
| 2000 | 9,187.2 | 4,499.4 | 4,257.2 | 18,794.4 | 18,889.1 | 2,080.0 | 26,111 |
| 2001 | 11,747.1 | 5,094.3 | 4,829.1 | 22,454.3 | 23,359.9 | 2,911.0 | 32,000 |
| 2002 | 11,227.0 | 5,186.4 | 4,890.1 | 22,699.9 | 23,465.4 | 2,747.5 | 32,332 |
| 2003 | 9,929.9 | 4,941.5 | 4,660.0 | 20,792.4 | 21,219.1 | 2,291.4 | 29,291 |
| 2004 | 9,870.0 | 5,188.2 | 4,888.5 | 20,995.9 | 21,334.4 | 2,220.9 | 29,864 |
| 2005 | 10,229.0 | 5,138.5 | 4,830.4 | 21,262.8 | 21,762.7 | 2,401.4 | 30,618 |
| Year | Proportion of total exports | |||||
|---|---|---|---|---|---|---|
| Asia | Europe | EU | OECD | APEC | ASEAN | |
| Percent | ||||||
| 1999 | 33.2 | 18.6 | 17.5 | 71.9 | 69.7 | 7.2 |
| 2000 | 35.2 | 17.2 | 16.3 | 72.0 | 72.3 | 8.0 |
| 2001 | 36.7 | 15.9 | 15.1 | 70.2 | 73.0 | 9.1 |
| 2002 | 34.7 | 16.0 | 15.1 | 70.2 | 72.6 | 8.5 |
| 2003 | 33.9 | 16.9 | 15.9 | 71.0 | 72.4 | 7.8 |
| 2004 | 33.0 | 17.4 | 16.4 | 70.3 | 71.4 | 7.4 |
| 2005 | 33.4 | 16.8 | 15.8 | 69.4 | 71.1 | 7.8 |
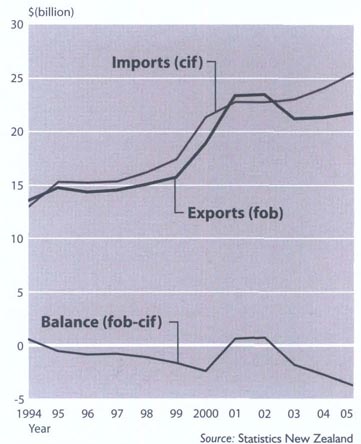
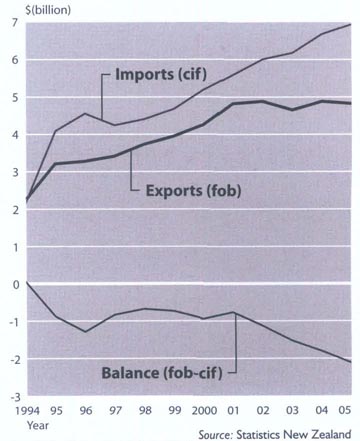
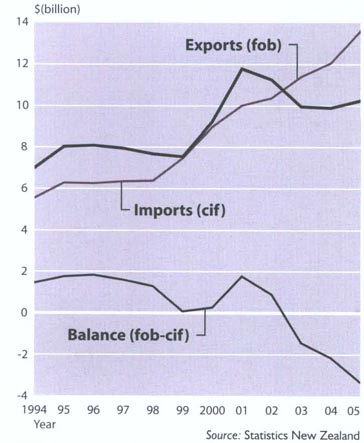
Table 25.35 shows the value of imports from selected country groupings in recent years.
Table 25.35. Merchandise imports1
By court try
grouping
Years ending 30
June
| Year | Country grouping | ||||||
|---|---|---|---|---|---|---|---|
| Asia | Europe | OECD | APEC | EU | ASEAN | Total imports | |
1Imports valued cif (cost including insurance and freight). Note: Figures may not add to stated totals due to rounding. Source: Statistics New Zealand | |||||||
| $(million) | |||||||
| 1994 | 5,552 | 4,050 | 14,521 | 13,002 | 2,184 | 858 | 18,469 |
| 1995 | 6,274 | 4,627 | 16,830 | 15,309 | 4,088 | 1,081 | 21,261 |
| 1996 | 6,250 | 4,839 | 16,829 | 15,239 | 4,560 | 1,301 | 21,352 |
| 1997 | 6,344 | 4,604 | 16,866 | 15,352 | 4,242 | 1,272 | 21,324 |
| 1998 | 6,376 | 4,804 | 17,858 | 16,212 | 4,408 | 1,360 | 22,589 |
| 1999 | 7,460 | 5,120 | 18,823 | 17,420 | 4,681 | 1,716 | 24,248 |
| 2000 | 8,964 | 5,533 | 22,253 | 21,335 | 5,191 | 2,114 | 29,193 |
| 2001 | 10,015 | 5,990 | 23,095 | 22,769 | 5,591 | 2,594 | 31,927 |
| 2002 | 10,370 | 6,395 | 23,295 | 22,738 | 6,008 | 2,534 | 31,811 |
| 2003 | 11,401 | 6,612 | 23,157 | 23,056 | 6,178 | 2,859 | 32,161 |
| 2004 | 12,053 | 7,028 | 23,849 | 24,105 | 6,683 | 3,057 | 33,378 |
| 2005 | 13,598 | 7,296 | 24,414 | 25,527 | 6,940 | 3,592 | 35,793 |
| Year | Proportion of total imports | |||||
|---|---|---|---|---|---|---|
| Asia | Europe | OECD | APEC | EU | ASEAN | |
| Percent | ||||||
| 1994 | 30.1 | 21.9 | 78.6 | 70.4 | 11.8 | 4.6 |
| 1995 | 29.5 | 21.8 | 79.2 | 72.0 | 19.2 | 5.1 |
| 1996 | 29.3 | 22.7 | 78.8 | 71.4 | 21.4 | 6.1 |
| 1997 | 29.8 | 21.6 | 79.1 | 72.0 | 19.9 | 6.0 |
| 1998 | 28.2 | 21.3 | 79.1 | 71.8 | 19.5 | 6.0 |
| 1999 | 30.8 | 21.1 | 77.6 | 71.8 | 19.3 | 7.1 |
| 2000 | 30.7 | 19.0 | 76.2 | 73.1 | 17.8 | 7.2 |
| 2001 | 31.4 | 18.8 | 72.3 | 71.3 | 17.5 | 8.1 |
| 2002 | 32.6 | 20.1 | 73.2 | 71.5 | 18.9 | 8.0 |
| 2003 | 35.5 | 20.6 | 72.0 | 71.7 | 19.2 | 8.9 |
| 2004 | 36.1 | 21.1 | 71.4 | 72.2 | 20.0 | 9.2 |
| 2005 | 38.0 | 20.4 | 68.2 | 71.3 | 19.4 | 10.0 |
Overseas cargo records all goods (by value and gross weight) loaded or unloaded at New Zealand's seaports and airports. Overseas cargo statistics, like overseas merchandise trade statistics, are sourced from customs entries.
However, there are some conceptual differences between overseas trade statistics and overseas cargo statistics.
Some items are included in overseas cargo statistics, but not in overseas merchandise trade statistics. These include goods on short-term loan or lease; service transactions, e.g. computer data tapes and drawings; goods consigned for modification or repair; and returnable containers and samples.
Overseas cargo statistics exclude large self-propelled items, such as aircraft and ships that arrive in or depart from New Zealand using their own power.
Overseas cargo loaded at New Zealand ports in the year ending 30 June 2005 weighed 22 million tonnes, down 3.1 percent on the previous June year. The value of cargo loaded was $31.2 billion, up 2.2 percent. By cargo weight, the main seaport was Tauranga, which handled 28.6 percent of all overseas cargo loaded at New Zealand ports. By value, the main seaports were Tauranga (22.6 percent) and Auckland (18.2 percent).
By weight, air cargo was only 0.5 percent of cargo loaded, but by value it was 16.3 percent, reflecting the comparatively high value and perishable nature of much air cargo.
Table 25.36 shows the value and volume of overseas cargo loaded at New Zealand ports.
Table 25.36. Overseas cargo loaded at New Zealand ports1
Years ending 30
June
| Value | Gross weight | |||||
|---|---|---|---|---|---|---|
| Seaport | 2003 | 2004 | 2005 | 2003 | 2004 | 2005 |
1Includes merchandise freight, goods for repair, loaned and leased goods, military and diplomatic goods and returnable containers and samples. - nil or zero Note: Figures may not add to stated totals due to rounding. Source: Statistics New Zealand | ||||||
| $(million) | (tonnes) | |||||
| Tauranga | 6,415 | 6,691 | 7,060 | 7,865,360 | 6,694,584 | 6,256,421 |
| Auckland | 5,677 | 5,646 | 5,700 | 2,008,910 | 2,016,792 | 1,987,714 |
| Port Chalmers | 2,590 | 2,939 | 3,032 | 1,063,682 | 1,144,572 | 1,107,764 |
| Lyttelton | 2,349 | 2,305 | 2,263 | 2,979,288 | 3,091,605 | 3,086,659 |
| Napier | 2,293 | 2,448 | 2,256 | 1,976,037 | 1,960,741 | 1,794,905 |
| New Plymouth | 2,148 | 1,792 | 1,965 | 3,236.740 | 2,034,146 | 1,889,505 |
| Timaru | 828 | 905 | 1,014 | 385,331 | 397,858 | 398,816 |
| Wellington | 850 | 838 | 922 | 634,727 | 689,982 | 761,049 |
| Bluff | 908 | 830 | 817 | 577,222 | 600,153 | 518,557 |
| Nelson | 760 | 759 | 699 | 1,132,804 | 1,116,514 | 1,187,575 |
| Whangarei | 354 | 329 | 284 | 1,679,017 | 1,204,754 | 941,038 |
| Gisborne | 118 | 98 | 98 | 605,786 | 416,274 | 423,450 |
| Picton | 27 | 29 | 33 | 282,079 | 329,790 | 387,295 |
| Taharoa | 17 | 14 | 17 | 743,492 | 745,268 | 991,385 |
| Not stated | 72 | 5 | 5 | 69,763 | 47,181 | 58,000 |
| Total seaports | 25,407 | 25,629 | 26,165 | 25,240,238 | 22,490,214 | 21,790,133 |
| Value | Gross weight | |||||
|---|---|---|---|---|---|---|
| Airport | 2003 | 2004 | 2005 | 2003 | 2004 | 2005 |
| $(million) | (tonnes) | |||||
| Auckland | 3,894 | 3,852 | 4,080 | 76,116 | 79,655 | 86,804 |
| Christchurch | 1,053 | 1,041 | 991 | 18,286 | 17,217 | 16,245 |
| Wellington | 67 | 60 | 27 | 1,346 | 1,500 | 990 |
| Hamilton | 0 | 0 | 1 | 2 | - | 3 |
| Dunedin | - | - | - | 1 | - | - |
| Not stated | 1 | - | - | 5 | 4 | |
| Total airports | 5,015 | 4,952 | 5,100 | 95,757 | 98,376 | 104,043 |
| Total parcel post | 13 | 17 | 12 | 38 | 22 | 16 |
| Total all cargo | 30,434 | 30,598 | 31,277 | 25,336,032 | 22,588,612 | 21,894,191 |
Overseas cargo unloaded at New Zealand ports in the year ending 30 June 2005 weighed 19.1 million tonnes, up 8.2 percent on the previous June year. The value of cargo unloaded was $35.3 billion, up 8.4 percent.
By cargo weight, the main seaport was Whangarei (which handled 29.5 percent of the total unloaded), followed by Auckland (19.7 percent) and Tauranga (18.5 percent).
By value, the main port was Auckland seaport (41.8 percent), followed by Auckland airport (19.8 percent).
By weight, air cargo was only 0.6 percent of cargo unloaded, but by value it represented 21.5 percent of the total.
Table 25.37 shows the value and volume of overseas cargo unloaded at New Zealand ports.
Table 25.37. Overseas cargo unloaded at New Zealand ports1
Years ending 30
June
| Value | Gross weight | |||||
|---|---|---|---|---|---|---|
| Seaport | 2003 | 2004 | 2005 | 2003 | 2004 | 2005 |
1Includes merchandise freight, goods for repair, loaned and leased goods, military and diplomatic goods and returnable containers and samples. - nil or zero Note: Figures may not add to stated totals due to rounding. Source: Statistics New Zealand | ||||||
| $(million) | (tonnes) | |||||
| Auckland | 14,318 | 14,558 | 14,776 | 3,632,981 | 3,846,103 | 3,783,654 |
| Tauranga | 2,392 | 2,505 | 3,521 | 1,864,193 | 2,780,611 | 3,535,992 |
| Whangarei | 2,253 | 2,006 | 2,817 | 5,444,743 | 5,077,359 | 5,651,163 |
| Lyttelton | 2,085 | 2,169 | 2,304 | 1,268,545 | 1,359,704 | 1,500,907 |
| Wellington | 1,876 | 1,868 | 2,127 | 1,009,075 | 1,231,877 | 1,388,228 |
| Napier | 468 | 722 | 655 | 684,090 | 682,119 | 745,873 |
| Timaru | 259 | 311 | 362 | 287,243 | 303,604 | 336,612 |
| Bluff | 406 | 383 | 356 | 1,048,066 | 1,196,536 | 1,147,312 |
| Port Chalmers | 252 | 265 | 332 | 263,728 | 309,198 | 336,477 |
| New Plymouth | 187 | 222 | 275 | 442,071 | 450,479 | 462,693 |
| Nelson | 196 | 215 | 222 | 98,072 | 113,664 | 139,461 |
| Gisborne | 4 | 1 | 2 | 143 | 5,578 | 6,094 |
| Picton | - | - | - | - | - | - |
| Not stated | 2 | 85 | 2 | 23,805 | 253,491 | 23,040 |
| Total seaports | 24,697 | 25,310 | 27,752 | 16,066,754 | 17,610,323 | 19,057,505 |
| Airport | ||||||
| Auckland | 6,378 | 6,683 | 7,006 | 77,306 | 84,961 | 94,226 |
| Christchurch | 477 | 507 | 483 | 9,432 | 9,519 | 10,212 |
| Wellington | 93 | 87 | 97 | 1,465 | 1,253 | 1,650 |
| Dunedin | - | - | - | - | - | - |
| Hamilton | - | - | - | - | - | - |
| Not stated | - | - | - | - | - | - |
| Total airports | 6,948 | 7,277 | 7,587 | 88,204 | 95,734 | 106,089 |
| Total parcel post | 46 | 31 | 27 | 155 | 96 | 91 |
| Total all cargo | 31,691 | 32,618 | 35,366 | 16,155,113 | 17,706,154 | 19,163,684 |
| 25.1 | New Zealand Trade and Enterprise; New Zealand Customs Service; Statistics New Zealand. |
| 25.2 – 25.5 | Statistics New Zealand. |
Table of Contents
A cooperative company rather than a registered bank, the PSIS delivers a full range of personal banking services. It does not have business customers.
Unlike most other countries, New Zealand has no specific restrictions on the provision of financial services such as deposit taking. Only financial institutions wishing to use the word ‘bank’ (or one of its derivatives) in their name or title are required to obtain authorisation to operate as registered banks.
Nevertheless, in terms of volume, registered banks dominate financial intermediation in New Zealand, although there are a substantial number of small, non-bank financial institutions, such as finance companies, credit unions and building societies.
The majority of New Zealand's registered banks are subsidiaries or branches of overseas banks. Only two of the 16 banks registered at 1 January 2006 were New Zealand owned.
The Reserve Bank of New Zealand is New Zealand's central bank with three main functions: operating monetary policy to maintain price stability; promoting maintenance of a sound and efficient financial system; and meeting the currency needs of the public.
The bank is required to manage monetary policy independently to maintain overall price stability. Price stability is defined in a contract between the bank's governor and the Minister of Finance as keeping inflation between 1 and 3 percent on average over the medium term. This is achieved through influencing short-term interest rates, which, in turn, influence longer-term interest rates and thus spending, saving and borrowing by the public and businesses.
The bank is also responsible for the registration and prudential supervision of registered banks, and the oversight of payment systems, to help ensure a sound and efficient financial system.
The bank issues New Zealand's currency, manages foreign exchange reserves, and provides cash and debt management services to the government.
The Reserve Bank of New Zealand Act 1989 defines the bank's duties and governance arrangements, but makes the bank operationally independent. The bank's chief executive officer, or governor, is accountable for the bank's actions. The bank's performance is monitored by a board of directors on behalf of the Minister of Finance.
The Reserve Bank of New Zealand Act 1989 requires the bank to maintain a sound and efficient financial system and to avoid significant damage to the financial system that could result from the failure of a registered bank.
Accordingly, the bank's supervision and registration framework does not aim to protect depositors or individual banks from loss. Instead, the main focus is on the efficient and effective operation of the banking system as a whole.
A major disruption in the provision of financial services, or lack of efficiency in the delivery of services, could potentially impose significant costs on other sectors of the economy.
In the event that a bank does fail, the Reserve Bank of New Zealand has crisis management powers that allow it to take steps to minimise any flow-on effects to the rest of the financial sector.
There is no upper limit on the number of banks that can be registered in New Zealand. The policy behind this is based on the belief that competitive forces encourage efficiency and innovation, and that overseas banks coming to New Zealand can bring valuable expertise to the local market.
Nevertheless, all applicants for registration must satisfy the Reserve Bank of New Zealand that they can meet minimum prudential requirements. Applicants must satisfy the bank that they are primarily involved in providing financial services.
In addition, when considering an application for registration, the Reserve Bank of New Zealand is required to have regard to:
Incorporation and ownership structure.
Size and nature of the proposed business.
Standing of the applicant in financial markets.
Suitability for their positions of directors and senior managers.
Standing of the owner in financial markets.
Ability to carry on business in a prudent manner.
If the applicant is an overseas bank, the amount and frequency of disclosure in their home jurisdiction.
If the applicant is an overseas bank, the law and regulatory requirements in the home jurisdiction relating to bank registration or authorisation; the priority of claims of creditors in an insolvency; the duties and powers of the applicant's directors; accounting and auditing standards; disclosure of financial and other information.
As at 1 January 2006, there were 16 registered banks. Only two were not wholly overseas owned – TSB Bank Ltd and Kiwibank Ltd (a subsidiary of state-owned enterprise New Zealand Post Ltd).
One of several amendments to the Reserve Bank of New Zealand Act in 2003 was the introduction of a requirement that the bank's consent be obtained before any significant change in bank ownership takes place. This was in recognition of the influence that a bank's owners can have on the operations and health of a bank. The power was exercised in October 2003 when the Australia and New Zealand Banking Group applied to purchase the National Bank of New Zealand – at the time the largest commercial transaction in New Zealand's history.
The Reserve Bank of New Zealand's supervision framework focuses primarily on public disclosure and director attestation requirements. Each bank must publish a quarterly disclosure statement containing a comprehensive range of financial information on the bank, the banking group it heads and, where applicable, the parent company. The bank's directors are required to sign each disclosure statement and a number of attestations about key prudential matters, including one relating to the adequacy of the bank's systems and controls.
The disclosure and attestation requirements strengthen market disciplines on banks and sharpen incentives for directors to take appropriate responsibility for the prudent operation of their bank. The disclosure regime also provides depositors and other creditors with the information they need to make informed decisions on where best to place their money.
Banks are also required to meet regulatory requirements covering several areas, including:
The internationally-agreed minimum capital adequacy ratio of 8 percent.
Exposure to connected persons.
The scope of non-banking business the bank can undertake.
Provisions in the bank's constitution.
The Reserve Bank of New Zealand has a wide range of powers to respond to a bank distress or failure, including the power to give directions to the bank and the ability to recommend to the Minister of Finance that a bank be placed under statutory management.
Tables 26.01 and 26.02 list assets and liabilities of the Reserve Bank of New Zealand.
Table 26.01. Assets of the Reserve Bank of New
Zealand
At 30
June
| Year | Denominated in foreign currency | Denominated in New Zealand dollars | Total assets | |||||||||
|---|---|---|---|---|---|---|---|---|---|---|---|---|
| Advances | Investment in NZ | |||||||||||
| Current account advances | Marketable securities | IMF holdings of SDRs | Foreign assets1 | Settlement institutions2 | Crown settlement account3 | Advances to Treasury | Government securities | Other | Fixed assets and inventories | Other assets4 | ||
1Prior to August 2004, short sales of bonds were netted off against the bonds in marketable securities. From August 2004, short sales are reported as liabilities denominated in foreign currency. 2Repurchase advances, secured loans, overnight advances and accrued interest owing from settlement institutions. 3Net overdrawn balances in the Crown settlement account. 4Includes accounts receivable and sundry assets. - nil or zero Source: Reserve Bank of New Zealand | ||||||||||||
| $(million) | ||||||||||||
| 1994 | 1,254 | 2,900 | - | - | 850 | - | 1,176 | 1,247 | - | 70 | 11 | 7,508 |
| 1995 | 1,113 | 2,889 | - | - | 773 | - | 1,250 | 1,519 | - | 61 | 9 | 7,614 |
| 1996 | 1,297 | 3,056 | 1 | - | 682 | - | 1,249 | 1,982 | - | 61 | 7 | 8,335 |
| 1997 | 1,133 | 3,340 | - | - | 750 | - | 1,236 | 2,041 | - | 58 | 8 | 8,566 |
| 1998 | 1,860 | 4,490 | 2 | 1 | 1,059 | - | 1,204 | 2,149 | - | 58 | 6 | 10,829 |
| 1999 | 2,283 | 3,602 | - | - | 3,064 | - | - | 2,256 | 1 | 56 | 6 | 11,268 |
| 2000 | 2,020 | 4,109 | - | - | 1,600 | - | - | 2,492 | - | 48 | 5 | 10,274 |
| 2001 | 1,810 | 4,056 | - | - | 2,517 | - | - | 2,708 | - | 44 | 4 | 11,139 |
| 2002 | 2,763 | 2,825 | - | 4 | 2,819 | - | - | 3,002 | - | 35 | 6 | 11,454 |
| 2003 | 2,938 | 3,137 | - | 4 | 2,120 | - | - | 3,300 | 10 | 36 | 2 | 11,539 |
| 2004 | 2,057 | 2,824 | - | - | 1,454 | - | - | 3,323 | - | 36 | 4 | 9,698 |
| 2005 | 3,855 | 4,200 | - | - | 265 | - | - | 4,601 | - | 40 | 3 | 12,964 |
Table 26.02. Liabilities of the Reserve Bank of New Zealand
At 30 June
| Year | Denominated in foreign currency | Denominated in New Zealand dollars | Total liabilities | ||||||||
|---|---|---|---|---|---|---|---|---|---|---|---|
| Curent1,8 | Long term2 | IMF allocations of SDRs3 | Deposits | Currency in circulation | Other liabilities7 | Capital reserves | |||||
| Reserve Bank bills4 | Government5 | Settlement institutions | Other6 | ||||||||
1Foreign currency denominated repurchase, secured loan and credit line financing provided by foreign counterparties. 2Foreign currency denominated financing provided by the Treasury (and the Earthquake Commission up to 3 June 1998). 3SDR denominated financing provided by the IMF. In December 1998. SDR assets and liabilities were transferred to the Treasury. SDRs are now directly accounted for on the Crown balance sheet. 4Short-term discount securities issued by the Reserve Bank of New Zealand. The bank ceased issuing Reserve Bank bills on 5 February 1999. All Reserve Bank bills and related advances to the Treasury were repaid by 9 April 1999. 5Net in-funds balance in the Crown settlement and other government accounts held at the Reserve Bank of New Zealand. 6Includes IMF No 1 account, staff deposits and other sundry deposits. 7Creditors and accounts payable. 8Prior to August 2004 short sales of bonds were netted off against the bonds in marketable securities. From August 2004, short sales are reported as liabilities denominated in foreign currency. - nil or zero Source: Reserve Bank of New Zealand | |||||||||||
| $(million) | |||||||||||
| 1994 | 260 | 3,546 | 347 | 1,132 | 264 | 1 | 74 | 1,413 | 30 | 441 | 7,508 |
| 1995 | 72 | 3,596 | 334 | 1,241 | 280 | 3 | 58 | 1,516 | 29 | 485 | 7,614 |
| 1996 | 381 | 3,670 | 301 | 1,249 | 535 | 18 | 28 | 1,599 | 5 | 549 | 8,335 |
| 1997 | 595 | 3,586 | 292 | 1,236 | 608 | 1 | 46 | 1,665 | 143 | 394 | 8,566 |
| 1998 | 1,266 | 4,714 | 370 | 1,203 | 957 | 2 | 25 | 1,733 | 158 | 401 | 10,829 |
| 1999 | 1,474 | 4,405 | - | - | 2,881 | 1 | 55 | 1,885 | 13 | 554 | 11,268 |
| 2000 | 1,541 | 4,589 | - | - | 1,328 | 49 | 36 | 2,160 | 14 | 557 | 10,274 |
| 2001 | 963 | 4,756 | - | - | 2,250 | 66 | 70 | 2,463 | 166 | 405 | 11,139 |
| 2002 | 1,047 | 4,192 | - | - | 2,947 | 4 | 15 | 2,659 | 10 | 580 | 11,454 |
| 2003 | 892 | 4,069 | - | - | 3,143 | 2 | 24 | 2,806 | 7 | 596 | 11,539 |
| 2004 | 945 | 3,828 | - | - | 1,243 | 71 | 70 | 2,920 | 8 | 613 | 9,698 |
| 2005 | 3,220 | 4,057 | - | - | 668 | 57 | 64 | 3,183 | 161 | 1,554 | 12,964 |
Before 1984, a range of regulatory distinctions existed among different types of deposit-taking financial institution in New Zealand. Aside from trading (commercial) banks, there were trustee and private savings banks, building societies, credit unions, merchant banks, stock and station agents and many finance companies. Regulations prescribed the activities each of these institutions could engage in.
Since 1984, however, deregulation has led to a concentration of business in banks.
New Zealand now has two broad categories of deposit-taking financial institutions – registered banks and ‘other financial institutions’.
The number of registered banks in New Zealand increased significantly after the banking industry was deregulated in 1984, partly as a result of non-bank financial institutions obtaining registered bank status and partly because of an inflow of foreign banks.
Non-bank financial institutions declined in importance following deregulation as most of the larger ones became banks, while some banks which owned separate finance companies consolidated these operations within the bank itself. As a result, New Zealand's non-bank financial sector is small compared with other countries, for example, Australia.
Some rationalisation has taken place in the registered bank sector, with a number of banks acquiring others and merging operations. At 1 January 2006, there were 16 registered banks in New Zealand.
In spite of rationalisation, the number of banks per capita is still relatively high by international standards. In part, this reflects the open nature of the registration regime. The New Zealand banking system is characterised by a high degree of foreign, particularly Australian, ownership. Around 99 percent of the assets of the New Zealand banking system are under ownership of a foreign bank parent, with approximately 85 percent under Australian ownership. Registered banks operating in New Zealand at 1 January 2006 were: ABN AMRO Bank NV; ANZ National Bank Limited; ASB Bank Ltd; Bank of New Zealand; Bank of Tokyo-Mitsubishi Ltd; Citibank NA; Commonwealth Bank of Australia; Deutsche Bank AG; Kiwibank Limited; Kookmin Bank; Rabobank Nederland; Rabobank New Zealand Limited; St George Bank New Zealand Limited; The Hong Kong and Shanghai Banking Corporation Limited; TSB Bank Limited; Westpac Banking Corporation.
Table 26.03 lists the liabilities and assets of M3 financial institutions (a group of 13 financial institutions surveyed by the Reserve Bank of New Zealand when compiling monetary aggregates).
Table 26.03. Liabilities and assets of M3 financial institutions
At 30 September
| Item | 1997 | 1998 | 1999 | 2000 | 2001 | 2002 | 2003 | 2004 | 2005 |
|---|---|---|---|---|---|---|---|---|---|
1Includes trade creditors/debtors, accounts payable/receivable, and items in transit, timing and statistical adjustments. 2Any two entities, i.e. companies, organisations or individuals with the same shareholders and/or any company which holds 20 percent or more of the paid up capital of another company (the associated). A subsidiary is an associate. 3The large decline in this category is due to the Reserve Bank of New Zealand no longer issuing Reserve Bank bills since the implementation of the overnight cash rate regime in early 1999. - nil or zero Note: Figures may not add to stated totals due to rounding. Source: Reserve Bank of New Zealand | |||||||||
| $(million) | |||||||||
| Liabilities – | |||||||||
| New Zealand dollar funding – | |||||||||
| New Zealand residents | 83,780 | 87,637 | 93,584 | 93,869 | 104,048 | 107,711 | 116,858 | 122,439 | 139,304 |
| Non-residents | 12,419 | 13,565 | 15,033 | 14,507 | 27,335 | 29,281 | 26,666 | 27,392 | 27,429 |
| Total | 96,199 | 101,203 | 108,617 | 108,376 | 131,383 | 136,991 | 143,524 | 149,831 | 166,733 |
| Foreign currency funding – | |||||||||
| New Zealand residents | 3,381 | 3,624 | 3,022 | 3,726 | 2,750 | 3,377 | 4,348 | 5,654 | 6,054 |
| Non-residents | 13,590 | 21,967 | 26,937 | 39,032 | 37,696 | 34,969 | 34,632 | 45,461 | 46,443 |
| Total | 16,971 | 25,591 | 29,959 | 42,758 | 40,446 | 38,346 | 38,980 | 51,115 | 52,497 |
| Capital and reserves | 6,970 | 7,874 | 9,033 | 10,623 | 11,503 | 12,873 | 14,978 | 17,942 | 18,955 |
| Other liabilities1 | 5,623 | 7,291 | 4,769 | 11,670 | 13,967 | 8,504 | 12,304 | 12,435 | 10,312 |
| Total liabilities | 125,763 | 141,959 | 152,377 | 173,426 | 197,299 | 196,715 | 209,786 | 231,323 | 248,497 |
| Funding from associates2 | 11,304 | 17,646 | 23,001 | 29,800 | 29,792 | 32,330 | 28,537 | 27,950 | 26,462 |
| Assets – | |||||||||
| Government securities | 3,593 | 5,626 | 8,264 | 6,953 | 6,858 | 5,876 | 7,699 | 5,347 | 4,864 |
| New Zealand notes and coin | 279 | 282 | 330 | 452 | 555 | 588 | 599 | 541 | 554 |
| Claims on the Reserve Bank3 | 1,233 | 1,096 | 21 | 2 | 17 | 1 | 1 | 3 | - |
| New Zealand dollar claims – | |||||||||
| New Zealand residents (M3) | 7,193 | 10,719 | 10,602 | 10,419 | 12,460 | 11,458 | 11,768 | 10,276 | 14,405 |
| New Zealand residents (non M3) | 98,528 | 104,637 | 114,158 | 120,693 | 129,579 | 138,612 | 151,751 | 169,207 | 195,523 |
| Non-residents | 3,689 | 4,576 | 6,450 | 8,762 | 16,180 | 16,320 | 14,042 | 21,689 | 11,254 |
| Total | 109,409 | 119,932 | 131,210 | 139,874 | 158,219 | 166,391 | 177,561 | 201,172 | 221,182 |
| Foreign currency claims | |||||||||
| New Zealand residents | 3,245 | 3,407 | 3,366 | 4,010 | 5,767 | 4,286 | 4,363 | 3,014 | 3,743 |
| Non-residents | 1,003 | 817 | 2,764 | 5,664 | 9,047 | 11,160 | 9,004 | 7,736 | 4,020 |
| Total | 4,248 | 4,225 | 6,130 | 9,674 | 14,814 | 15,447 | 13,367 | 10,750 | 7,763 |
| Foreign currency fixed assets and | |||||||||
| equity investment | 4 | 35 | 36 | 41 | 75 | 86 | 74 | 75 | 79 |
| Shares (in New Zealand companies) | 397 | 496 | 294 | 281 | 153 | 529 | 812 | 76 | 204 |
| Other assets1 | 6,600 | 10,268 | 6,092 | 16,148 | 16,609 | 7,798 | 9,674 | 13,358 | 13,851 |
| Total assets | 125,763 | 141,959 | 152,377 | 173,426 | 197,299 | 196,715 | 209,786 | 231,323 | 248,497 |
| Financial claims on associates2 | 1,454 | 1,842 | 4,397 | 6,471 | 13,894 | 15,212 | 12,127 | 17,653 | 8,831 |
Table 26.04. Bank branches and automated teller machines
(ATMs)
At 31 December
| Year | Bank branches | Bank-owned ATMs |
|---|---|---|
| Source: New Zealand Bankers' Association | ||
| 2000 | 849 | 1,692 |
| 2001 | 832 | 1,830 |
| 2002 | 1,098 | 1,889 |
| 2003 | 1,103 | 1,889 |
| 2004 | 1,124 | 2,019 |
By international standards, New Zealand has a relatively high number of banks per capita.
Access to branches and services. The first automated teller machines (ATMs) were introduced to New Zealand in mid-1979 and by the end of 1982 all major trading banks offered ATM services. After declining through a process of rationalisation in the 1990s, the number of ATMs has increased again. Table 26.04 shows the number of bank branches and bank-owned ATMs for the years 2000–04.
Electronic Funds Transfer at Point of Sale (EFTPOS). EFTPOS was introduced to New Zealand in 1984 as a means of paying for retail goods and services. Banks agreed in 1990 to integrate their EFTPOS services and growth of the network has been rapid since. The table below shows the number of EFTPOS terminals in New Zealand supermarkets, service stations, liquor markets and other retail outlets at 31 December for the years 2002–04.
| Year | Terminals |
| 2000 | 84,351 |
| 2001 | 92,840 |
| 2002 | 95,221 |
| 2003 | 98,474 |
| 2004 | 118,174 |
The number of bank-owned automated teller machines (ATMs) in New Zealand passed the 2,000 mark during 2004.
Credit cards. Credit cards are popular for the purchase of goods and services and at 31 December 2004 there were 2.36 million cards on issue nationally, down from the 2.65 million on issue two years earlier. Figure 26.01 shows growth in credit card debt from 1981 to 2005.
Figure 26.01. Credit card debt
Total advances
outstanding
Years ending 31
December
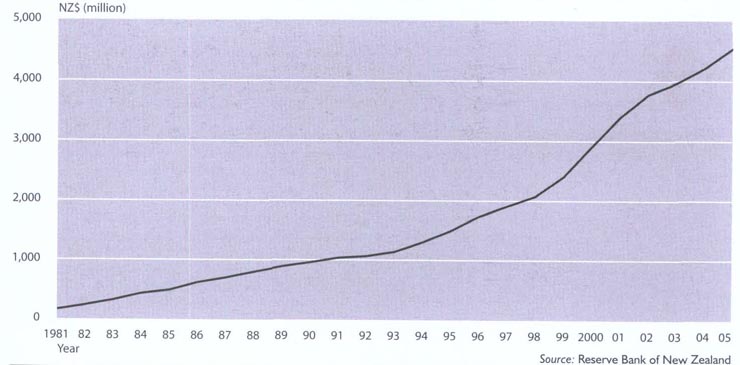
Source: Reserve Bank of New Zealand
Industry self-regulation. The New Zealand Bankers' Association is a professional industry association established in 1891. The association represents and promotes the interests of the banking industry and delivers to its members those services which can be undertaken effectively on an industry basis. The association introduced a Code of Banking Practice in 1992, which established minimum standards of practice to be observed by banks in their dealings with personal customers. The most recent edition of the code was published in 2003 following a comprehensive public consultation process, and is currently under review. The code is linked to an independent external complaints review process, the Banking Ombudsman scheme, established in July 1992.
Notwithstanding the dominance of banks, there remain more than 70 smaller deposit-taking financial institutions in New Zealand and 50 small credit unions. Among them are a medium-sized, nationwide, cooperative savings institution and a large, regionally-based building society continuing to specialise in housing finance, plus nine smaller building societies, most of which since deregulation have diversified their lending portfolios away from reliance on lending for housing.
Credit unions have total loans to members of less than $500 million, or less than 0.5 percent of all loans to households.
Total loans of finance companies nearly trebled in the five years ending 31 December 2005. In the latter part of the period, lending for property development contributed strongly to loan growth, but it was nonetheless well spread across hire purchase for cars and consumer goods, for business leasing and plant and machinery purposes, and for commercial and residential property development.
More recent developments in the ‘other financial institution’ market include the growth of residential mortgage managers – lenders who fund their loans via securitisation in wholesale markets – and the emergence of several ‘non-conforming’ personal lenders. In addition, several retail groups have stepped up their involvement in personal finance, for example by issuing a credit card or offering direct personal loans in addition to providing hire purchase finance.
Since the late 1990s, banks' share of the personal lending market has declined slightly as other institutions have developed a range of niche markets.
New Zealand's decimal currency system was introduced in 1967 when dollars and cents replaced pounds, shillings and pence as monetary units.
One of the key statutory obligations of the Reserve Bank of New Zealand is to provide New Zealand's currency. The total face value of currency in circulation (bank notes and coins) was $3.2 billion at 30 November 2005, a 3 percent increase on the previous November. The currency consisted of about 140 million bank notes and 1.2 billion coins.
The first substantial change to New Zealand's banknotes since the introduction of decimal currency occurred in 1992 when a new series was issued which contained more security features.
Portraits on the notes are: $5, Sir Edmund Hillary; $10, Kate Sheppard; $20, Queen Elizabeth II; $50, Sir Apirana Ngata; and $100, Ernest Lord Rutherford of Nelson. Queen Elizabeth II features on the watermark of all notes. Rare New Zealand birds are featured on the backs of the notes.
The $5 note was released on 10 July 1992, the $20 on 1 September 1992, the $50 and $100 on 3 November 1992 and the $10 on 18 May 1993.
New Zealand's new 50, 20 and 10-cent coins introduced in 2006 are each about half the weight of the ones they replaced.
In 1999, the bank began replacing paper notes with polymer, which are more durable and incorporate additional security features.
Monetary policy is implemented by the Reserve Bank of New Zealand under the terms of the Reserve Bank of New Zealand Act 1989.
The government has given the bank responsibility for keeping average inflation between 1 and 3 percent a year over the medium term. The specific details of the target are set out in a written contract between the Governor of the Reserve Bank of New Zealand and the Minister of Finance called the Policy Targets Agreement (PTA).
The bank changed the way it implements monetary policy in March 1999 when the settlement cash target system, used since the mid-1980s, was replaced by an implementation system based on an official cash rate (OCR). Previously, the bank relied on adjustments to the quantity of settlement cash in the banking system to ensure monetary conditions were appropriate. These adjustments were relatively rare, however, as generally financial markets adjusted monetary conditions in response to the bank's quarterly inflation projections and to emerging economic data.
Under the OCR system, the Reserve Bank of New Zealand influences short-term interest rates by being prepared to lend an unlimited amount of cash overnight, or borrow an unlimited amount of cash overnight, at interest rates fractionally above or below the stated OCR. This influences other interest rates, affecting demand within the economy and therefore inflationary pressures.
The act stipulates that the bank must publish policy statements that specify how it intends to achieve the inflation target defined in the PTA, and the reasons for choosing the policies and means it intends to use to achieve the target. The policy statements must also provide a medium-term policy outlook, and must review and assess the implementation of monetary policy since the previous policy statement.
To meet these requirements, the bank publishes Monetary Policy Statements which provide the economic projections and rationale underpinning its monetary policy decisions and that assess the implementation of monetary policy since the previous publication.
The OCR is reviewed eight times a year – at each of the bank's quarterly Monetary Policy Statements, and approximately halfway between those statements.
Figure 26.02 shows movement in average wholesale interest rates for 90-day bills and 5-year government stock from December 1989 to December 2005.
Figure 26.02. Key market rates
Average wholesale
interest rates
Quarters ending 31
December
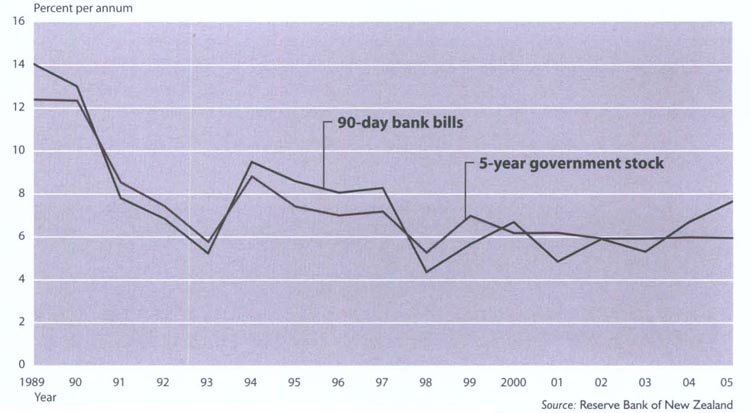
Source: Reserve Bank of New Zealand
The government sells three types of debt instruments to meet its financing requirements:
Government bonds are a medium-term (usually with maturity of one to around 10 years) instrument paying a fixed coupon interest rate and aimed at the wholesale market (mainly institutional investors). Since September 1983, government bonds have been sold through regular, competitive tenders.
Treasury bills are short-term (usually with maturity of up to around 12 months) wholesale debt instruments. Bills have been sold through regular weekly tenders since January 1985 to meet the government's ongoing funding requirements. They are also used to meet the government's seasonal financing needs. Bills do not pay interest, but rather are sold (and subsequently traded) at a discount to their par (maturity) value, producing an effective yield for the holder.
Kiwi Bonds, introduced in 1985, are aimed at retail investors. These bonds are fixed-interest instruments issued on demand in six-month, one, two and four-year maturities. On issue, Kiwi Bond interest rates are related to the current market yields on wholesale government bonds (of comparable maturities). They are transferable and may be sold by the holder to another party.
The Reserve Bank of New Zealand maintains registers of government securities (and those of local authorities and other public bodies and several state-owned enterprises). At December 31 2005, the value of total government securities registered was $34.2 billion. Of this, $5.5 billion comprised Treasury bills. Kiwi Bonds to the value of $399 million were also on issue at this date. (These figures exclude securities issued by state-owned enterprises.)
New Zealand has had a floating exchange rate since 1985. The value of the New Zealand dollar against other currencies is set solely by the market. However, the Reserve Bank of New Zealand retains the capacity to intervene in the foreign exchange market either to counter disorderly conditions in that market or for monetary policy purposes.
Intervention would involve buying or selling New Zealand dollars in exchange for other currencies, with the aim of restoring a smoothly-functioning private market. To maintain a capacity to do this. the Reserve Bank of New Zealand holds and manages the government's foreign exchange reserves, invested in a diversified portfolio of liquid foreign currency assets of about $4.5 billion.
Table 26.05 shows monthly foreign exchange rates from September 1999 to December 2005, while Figure 26.03 shows movements in the trade-weighted index from 1979 to 2005.
Table 26.05. Foreign exchange rates1
TWI percent change
| Month | USA mid-rate | UK mid-rate | Aust. mid-rate | Japan mid-rate | Euro mid-rate | TWI base Jun `07 | Percentage change | |
|---|---|---|---|---|---|---|---|---|
| US$/NZ$1 | Stg/NZ$1 | A$/NZ$1 | Yen/NZ$1 | E$/NZ$1 | 100 | Monthly | Annual | |
1All average exchange rates use representative 11.10 am market mid-rates. Source: Reserve Bank of New Zealand | ||||||||
| 1999 | ||||||||
| September | 0.5224 | 0.3221 | 0.8053 | 56.05 | 0.4978 | 55.70 | -1.9 | -1.0 |
| 2000 | ||||||||
| September | 0.4188 | 0.2922 | 0.7546 | 44.69 | 0.4805 | 48.30 | -4.5 | -13.0 |
| 2001 | ||||||||
| September | 0.4198 | 0.2869 | 0.8280 | 49.86 | 0.4605 | 49.60 | -2.8 | 3.0 |
| 2002 | ||||||||
| September | 0.4699 | 0.3022 | 0.8587 | 56.74 | 0.4793 | 53.80 | 1.3 | 9.0 |
| 2003 | ||||||||
| September | 0.5838 | 0.3627 | 0.8831 | 67.21 | 0.5202 | 62.20 | -0.8 | 16.0 |
| 2004 | ||||||||
| September | 0.6588 | 0.3674 | 0.9384 | 72.49 | 0.5392 | 67.1 | 0.9 | 8.0 |
| 2005 | ||||||||
| January | 0.7040 | 0.3750 | 0.9210 | 72.70 | 0.5375 | 68.5 | -0.7 | 3.0 |
| February | 0.7143 | 0.3787 | 0.9144 | 74.95 | 0.5491 | 69.5 | 1.5 | 2.0 |
| March | 0.7306 | 0.3829 | 0.9295 | 76.80 | 0.5529 | 70.7 | 1.7 | 7.0 |
| April | 0.7185 | 0.3794 | 0.9307 | 77.16 | 0.5555 | 70.4 | -0.4 | 9.0 |
| May | 0.7191 | 0.3871 | 0.9382 | 76.64 | 0.5661 | 70.9 | 0.7 | 12.0 |
| June | 0.7085 | 0.3895 | 0.9242 | 77.01 | 0.5828 | 71.0 | 0.1 | 11.0 |
| July | 0.6794 | 0.3876 | 0.9029 | 76.02 | 0.5641 | 69.0 | -2.8 | 6.0 |
| August | 0.6950 | 0.3877 | 0.9126 | 76.94 | 0.5653 | 69.8 | 1.2 | 5.0 |
| September | 0.6995 | 0.3867 | 0.9144 | 77.68 | 0.5708 | 70.3 | 0.6 | 5.0 |
| October | 0.6978 | 0.3955 | 0.9245 | 80.03 | 0.5799 | 71.1 | 1.2 | 4.0 |
| November | 0.6899 | 0.3972 | 0.9371 | 81.62 | 0.5845 | 71.5 | 0.5 | 5.0 |
| December | 0.6961 | 0.3986 | 0.9368 | 82.68 | 0.5873 | 71.9 | 0.6 | 4.0 |
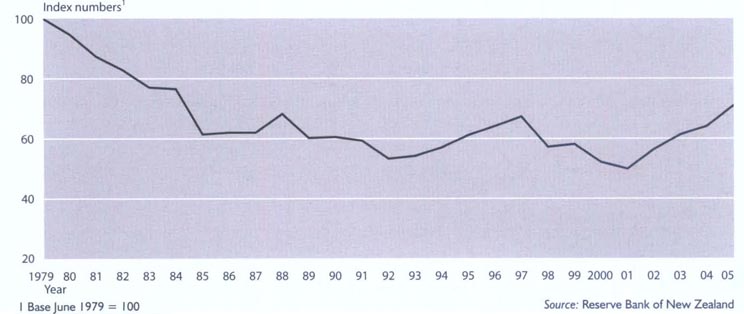
| 26.1 | Reserve Bank of New Zealand; New Zealand Bankers' Association. |
| 26.2 | Reserve Bank of New Zealand; New Zealand Bankers' Association; Office of the Banking Ombudsman. |
Table of Contents
Road user charges are payable by all vehicles of more than 3.5 tonnes and, from 1 April 2006, can be adjusted annually up to the rate of inflation.
The New Zealand public sector management system is concerned with, and seeks to bring together. both the financial and non-financial aspects of public sector performance. Each element of the system is intended to reinforce other elements to provide a comprehensive approach to implementing the government's strategy, facilitating high-quality decision making by management and enabling effective scrutiny by parliament.
The system is designed to help the government translate strategy into action, to promote informed decision making and accountability and to encourage the state sector to be responsive and efficient.
The system achieves these aims through planning, decision-making and scrutiny processes that culminate in passage of the government's Budget; through incentives for managing efficiently; and through reporting and feedback processes. The system emphasises expected performance within the control of managers, delegating authority to achieve high-quality performance, providing incentives to perform to levels expected, and measuring achievements in a timely and consistent manner
The system is examined continuously and refined to meet emerging needs. A number of policy projects and pilots are underway that seek to improve areas such as Crown entity governance and accountability, departmental accountability and reporting, public service senior leadership and management talent, collaboration among departments and relationships with non-government organisations.
Roles and responsibilities. The State Sector Act 1988 sets out the general duties and responsibilities of public service chief executives and processes for their appointment and reappointment. Chief executives have contracts of up to five years, with tenure based on performance. They are recommended, appointed, employed and reviewed by the independent State Services Commissioner, though cabinet (operating through the governor-general in council) may veto the commissioner's appointment recommendation. As the legal employer of staff in their departments, public service chief executives have the power, within the bounds of general employment law, to hire and fire, set salaries and negotiate conditions of employment. Cabinet ministers are formally responsible for specifying performance expectations of departments. Departmental chief executives are, in turn, responsible to relevant ministers for delivering expected services (sometimes referred to as the government's ‘purchase’ interest) and maintaining the department's ability to keep delivering effectively, efficiently and economically (the ‘ownership’ interest). Services are placed firmly in the context of government policy goals. For these purposes, chief executives are given appropriate managerial decisionmaking authority. There are incentives to perform and requirements for presentation of performance information as a basis for monitoring and assessment. The chart overleaf summarises this.
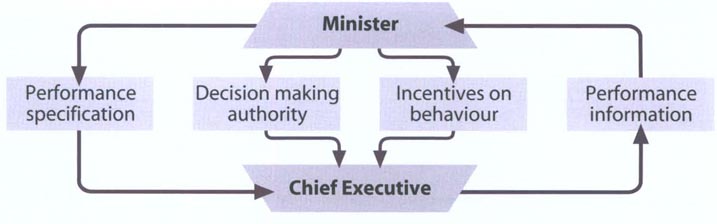
Purchase and ownership interests. Annual performance agreements of chief executives distinguish between the government's interest in the performance of a department, as the owner seeking efficient stewardship of its resources on the one hand, and as the purchaser of services directly to the government or to third parties on the other. The government looks for a balance between strong. healthy departments and value for money in their operations.
Setting objectives. Setting objectives within the public service focuses mainly on outputs, rather than inputs or outcomes. With this focus, the delivery of services is more able to be attributed to chief executives rather than any ultimate consequences (outcomes) of that service delivery. Outputs are placed firmly in the context of government policy goals.
The fiscal responsibility provisions of the Public Finance Act 1989 require clear formulation and reporting by the government on its fiscal policy objectives. Using Generally Accepted Accounting Practice (GAAP), a number of principles have been formulated to define responsible fiscal management. These are that:
Debt should be reduced to prudent levels.
Operating expenses should not exceed operating revenues over a reasonable period.
Crown net worth should be maintained at sufficient levels to counter adverse events.
Fiscal risks facing the government should be managed prudently.
Fiscal policies should be consistent with predictable, stable tax rates.
As part of the Budget process, the Minister of Finance must report on the government's long-term fiscal objectives and short-term fiscal intentions and on the extent to which these are consistent with the above principles, and provide justification for any inconsistencies.
The Budget process involves the Minister of Finance reporting on the government's long-term fiscal objectives and short-term fiscal intentions.
These fiscal objectives must be first presented to parliament by 31 March – three months before the start of the financial year – in the Budget Policy Statement. In practice, the objectives are generally presented in December, allowing debate on them to take place well before the Budget itself.
The government maintains a baseline Budget, projecting policies forward four years. Baseline updates occur regularly as the government makes adjustments in accordance with its strategic and fiscal objectives. Outside these Budget update processes, amendments to the baseline are generally permitted only for fiscally-neutral adjustments, unavoidable or uncontrollable expenses, natural disasters or civil emergencies, recognition of existing liabilities, and capital investments supported by business plans and a sound business case.
The Budget must be introduced to parliament by the end of July and the associated appropriation act must be passed by the end of October.
Revised economic and fiscal forecasts are published half yearly and immediately before a general election. These forecasts must be prepared on a GAAP basis consistent with other reports and must include a statement of specific fiscal risks, including contingent liabilities, which describe, and quantify if possible, all specific and general fiscal risks associated with the forecasts.
Accrual-based appropriations. Parliament authorises expenditure of public money by ministers, departments and offices of parliament through the appropriation process. Appropriations are made separately for expenses incurred on each class of outputs, for benefits or other unrequited expenses, for borrowing expenses, for other expenses, for capital injections, for the purchase or development of capital assets, and for the repayment of debt. This gives parliament control over outputs purchased from departments and others, what size balance sheets it thinks are needed to produce those outputs, and what resources it wants transferred among different groups in the community, but which do not involve production of outputs.
Charging for capital. A common weakness in government financial management systems is the incentive for budget maximisation and for accumulating assets of low utility. To counter this, the government charges departments for the capital they use.
Cost allocations. Focusing on outputs requires cost accounting systems which allocate costs, including the capital charge, to those outputs. Costs can then be compared with similar costs that would be incurred by other suppliers, both in the public and private sectors. These costing systems help ministers reprioritise and choose the appropriate mix of outputs to achieve desired outcomes. The systems also identify opportunities for improving output performance and to facilitate cost recovery where there are recognisable recipients of the service or output.
Cash management. Before the start of each year, each department negotiates with Treasury a profile of cash payments to the department during the year (updated as needs alter). Treasury operates a central cash management system which sweeps all departmental bank accounts each night and invests spare funds in the overnight money market.
Table 27.01 shows actual government expenses for 2005 and forecasts for 2006–2009.
Table 27.01. Government expenses Years ending 30 June
| 2005 | 2006 | 2007 | 2008 | 2009 | |
|---|---|---|---|---|---|
| Actual | Forecast | Forecast | Forecast | Forecast | |
.. figures not available Source: The Treasury | |||||
| ($ million) | |||||
| Subsidies and transfer payments | 15,844 | 16,969 | 18,068 | 19,106 | 19,805 |
| Personnel expenses | 13,562 | 14,483 | 14,855 | 15,123 | 15,231 |
| Operating expenses | 25,314 | 27,385 | 28,457 | 29,382 | 29,736 |
| New operating spending up to Budget 2006 | .. | 150 | 250 | 256 | 269 |
| Forecast new operating spending | .. | .. | 1,249 | 3,006 | 4,851 |
| Finance costs | 2,760 | 2,792 | 2,624 | 2,739 | 2,658 |
| Net foreign-exchange (gains)/losses | (17) | .. | .. | .. | .. |
| Movement in total GSF liability | 1,410 | (24) | (58) | (93) | (125) |
| Movement in total ACC liability | 2,037 | 597 | 596 | 604 | 601 |
| Total Crown expenses | 60,910 | 62,352 | 66,041 | 70,123 | 73,026 |
| Analysis of subsidies and transfer payments | |||||
| Social assistance grants: | |||||
| New Zealand superannuation | 6,083 | 6,419 | 6,802 | 7,185 | 7,547 |
| ACC payments | 1,549 | 1,687 | 1,830 | 1,933 | 2,053 |
| Unemployment benefit | 831 | 780 | 888 | 952 | 959 |
| Domestic purposes benefit | 1,547 | 1,490 | 1,498 | 1,534 | 1,558 |
| Family support | 846 | 1,312 | 1,469 | 1,683 | 1,688 |
| Student allowances | 359 | 353 | 366 | 380 | 394 |
| Other social assistance grants | 4,182 | 4,446 | 4,717 | 4,903 | 5,070 |
| Subsidies | 118 | 125 | 128 | 128 | 128 |
| Other transfer payments: Official development assistance | 297 | 320 | 333 | 371 | 371 |
| Other | 32 | 37 | 37 | 37 | 37 |
| Total subsidies and transfer payments | 15,844 | 16,969 | 18,068 | 19,106 | 19,805 |
| Analysis of personnel expenses | |||||
| GSF pension costs (excluding liability movement) | 1,032 | 1,043 | 1,077 | 1,104 | 1,125 |
| Other pension expenses | 108 | 123 | 124 | 126 | 127 |
| Other personnel expenses | 12,422 | 13,317 | 13,654 | 13,893 | 13,979 |
| Total personnel expenses | 13,562 | 14,483 | 14,855 | 15,123 | 15,231 |
| Analysis of operating expenses | |||||
| Depreciation expense (by class of asset): | |||||
| Buildings | 793 | 857 | 863 | 877 | 877 |
| Electricity distribution network | 106 | 111 | 101 | 104 | 118 |
| Electricity generation assets | 166 | 212 | 236 | 257 | 258 |
| Specialist military equipment (SME) | 189 | 191 | 213 | 247 | 271 |
| State highways | 225 | 265 | 297 | 325 | 356 |
| Aircraft (ex SME) | 101 | 187 | 239 | 271 | 234 |
| Other plant and equipment | 850 | 856 | 921 | 965 | 978 |
| Other assets | 98 | 65 | 72 | 80 | 82 |
| Total depreciation costs | 2,528 | 2,744 | 2,942 | 3,126 | 3,174 |
| Other operating items: | |||||
| Rental and leasing costs | 789 | 754 | 785 | 818 | 830 |
| Change in provision for doubtful debts | 984 | 512 | 538 | 616 | 633 |
| Write off of bad debts | 93 | 63 | 63 | 70 | 73 |
| Goodwill amortised | 97 | 94 | 92 | 92 | 90 |
| Grants paid | 1,267 | 350 | 367 | 378 | 379 |
| Lottery prize payments | 350 | 337 | 362 | 375 | 390 |
| Loss/(gain) on sale of assets | 2 | .. | .. | .. | .. |
| Other operating | 19,204 | 22,531 | 23,308 | 23,907 | 24,167 |
| Total operating expenses | 25,314 | 27,385 | 28,457 | 29,382 | 29,736 |
Parliament's scrutiny of the government's financial performance involves the Budget and several reporting events through the year. Budget documents incorporate:
The government's Budget speech and fiscal strategy for the medium term (10 years).
An economic and fiscal outlook, including the government's forecast financial statements.
Estimates of the appropriations ministers seek from parliament.
Statements of intent for each government department.
Progress against the Budget is reported monthly from the end of the first quarter. These reports are prepared on a Generally Accepted Accounting Practice basis, consistent with the forecasts, and must be published within six weeks of the end of the month. Annual financial statements must be prepared and audited within three months. Parliament and its committees scrutinise financial management of the executive, comparing actual performance with planned performance, in three ways:
Scrutiny of the government's intentions for the current year, as expressed in its Budget proposals, and scrutiny of its actual performance, reported in the financial statements of the government.
Examination of the actual performance of departments, as reported in their annual reports and financial statements, compared with plans laid a year earlier.
Examination of the performance of state-owned enterprises and other non-departmental government entities.
Figure 27.01 illustrates the relationship between revenue and expenses as a proportion of gross domestic product.
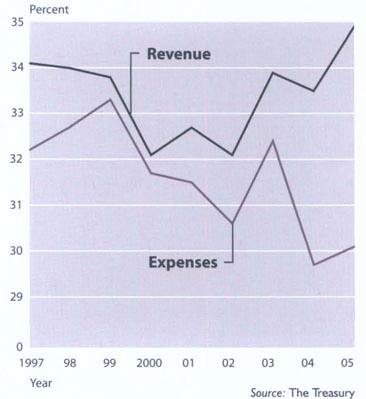
Changes to accounting standards introduced from the 2002 Budget meant changes to the way Crown financial statements are prepared. The changes were required for consistency with Generally Accepted Accounting Principles and did not affect fiscal policy. Crown financial statements now record the revenues, expenses, assets and liabilities of all Crown-controlled entities (e.g. departments, state-owned enterprises and Crown entities) except tertiary educational institutions. Previously, only the net surplus, net investment and net worth of state-owned enterprises and Crown entities were recorded. Goods and services tax (GST) on Crown expenses has also been removed. Net worth and the operating balance are largely unaffected.
The Crown publishes fully consolidated (‘total Crown') accounts as described above, but splits out ‘core Crown’ information. Core Crown revenues and expenses are similar to the previous presentation of the accounts, except that they remove GST on Crown expenses.
The changes result in some of the historical data contained in this Yearbook being restated from that contained in previous yearbooks. This is because, where possible, historical data has been recast to be consistent with current treatment.
The Financial Statements of the Government of New Zealand include the following key statements:
Statement of financial performance.
Statement of financial position.
Statement of movements in equity.
Statement of cash flows.
Statement of borrowings.
Statements of commitments.
Statement of contingent liabilities.
Statement of unappropriated expenditure, expenses or liabilities.
Departmental financial statements contain the same key statements, as well as a statement of objectives and a statement of service performance.
Publication of financial statements, with an audit opinion attached, within three months of the end of the financial year for the whole of government is an important feature of the New Zealand financial management system. Very few countries account for government operations under accrual accounting rules.
Valuation problems are generally dealt with in conventional and pragmatic ways that provide a good estimate of net current value by using a realisable value, or a depreciated replacement cost approach.
The underlying information systems provide new and superior information to the national statistical data collection for the system of national accounts.
The balance sheet can also indicate movements in net worth caused by the relationship between capital consumption and new investment. It can provide an indicator of whether the government is running down its estate to maintain current consumption.
In a real economic sense, the power of the government to tax its citizens provides a guarantee of revenue which is not available to a private sector company.
This power can, however, be viewed as analogous to mutual or cooperative organisations that levy their members. This is not treated as an asset, as members want to know the financial position of the organisation before exercise of the power to levy. Further, it is impossible to value this ‘asset’ with sufficient reliability, and any attempt to do so would drown other information in the balance sheet.
On the liabilities side, the value of future social welfare obligations is a similarly large item over which the government has significant discretion and which is very difficult to quantify.
Figure 27.02 shows operating balances from 1992 to 2005.
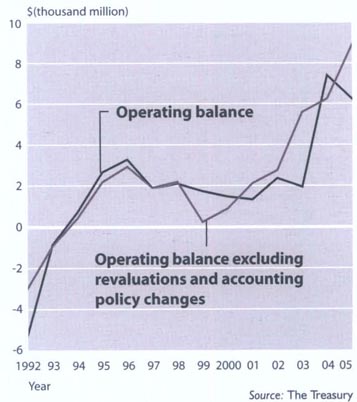
Table 27.02 shows the government's statement of financial performance for 2005 and forecasts for 2006–2009.
Table 27.02. Statement of financial performance Years ending 30 June
| Revenue and Expenses | 2005 | 2006 | 2007 | 2008 | 2009 |
|---|---|---|---|---|---|
| Actual | Forecast | Forecast | Forecast | Forecast | |
.. figures not available Source: The Treasury | |||||
| S(million) | |||||
| Crown revenue | |||||
| Taxation revenue | 46,624 | 48,833 | 50,443 | 51,418 | 54,567 |
| Levies, fees, fines and penalties | 3,115 | 3,206 | 3,311 | 3,416 | 3,517 |
| Total revenue levied through the Crown's sovereign power | 49,739 | 52,039 | 53,754 | 54,834 | 58,084 |
| Sales of goods and services | 11,331 | 11,850 | 12,558 | 12,984 | 13,506 |
| Investment income | 3,814 | 3,327 | 3,668 | 4,094 | 4,531 |
| Other revenue | 2,181 | 2,290 | 2,266 | 2,289 | 2,278 |
| Total revenue earned through the Crown's operations | 17,326 | 17,467 | 18,492 | 19,367 | 20,315 |
| Total Crown revenue | 67,065 | 69,506 | 72,246 | 74,201 | 78,399 |
| Crown expenses | |||||
| Social security and welfare | 18,522 | 18,199 | 19,352 | 20,474 | 21,185 |
| GSF pension expenses | 2,442 | 1,019 | 1,019 | 1,011 | 1,000 |
| Health | 8,444 | 9,370 | 9,825 | 9,893 | 9,946 |
| Education | 8,619 | 9,164 | 9,691 | 9,946 | 9,929 |
| Core government services | 2,085 | 2,038 | 2,032 | 2,077 | 2,106 |
| Law and order | 2,131 | 2,376 | 2,446 | 2,462 | 2,469 |
| Defence | 1,229 | 1,310 | 1,380 | 1,445 | 1,524 |
| Transport and communications | 5,948 | 6,533 | 6,554 | 6,812 | 7,006 |
| Economic and industrial services | 4,859 | 5,461 | 5,620 | 5,923 | 5,940 |
| Primary services | 1,128 | 1,239 | 1,232 | 1,245 | 1,261 |
| Heritage, culture and recreation | 2,032 | 1,845 | 1,850 | 1,901 | 1,951 |
| Housing and community development | 697 | 739 | 800 | 816 | 814 |
| Other | 31 | 117 | 117 | 117 | 117 |
| Finance costs | 2,760 | 2,792 | 2,624 | 2,739 | 2,658 |
| Net foreign-exchange (gains)/losses | (17) | .. | .. | .. | .. |
| New operating spending for the 2004 Budget | .. | 150 | 250 | 256 | 269 |
| Forecast new operating spending | .. | .. | 1,249 | 3,006 | 4,851 |
| Total Crown expenses | 60,910 | 62,352 | 66,041 | 70,123 | 73,026 |
| Revenues less expenses | 6,155 | 7,154 | 6,205 | 4,078 | 5,373 |
| Net surplus of tertiary education institutes | 133 | 139 | 139 | 139 | 139 |
| Operating balance (including minority interest) | 6,288 | 7,293 | 6,344 | 4,217 | 5,512 |
| Minority interest | (41) | .. | .. | .. | .. |
| Operating balance | 6,247 | 7,293 | 6,344 | 4,217 | 5,512 |
Table 27.03 shows the government's statement of financial position for 2005 and forecasts for 2006–2009.
Table 27.03. Statement of financial position At 30 June
| 2005 | 2006 | 2007 | 2008 | 2009 | |
|---|---|---|---|---|---|
.. figures not available Source: The Treasury | |||||
| Actual | Forecast | Forecast | Forecast | Forecast | |
| $(million) | |||||
| Assets | |||||
| Cash and bank balances | 3,710 | 2,446 | 2,611 | 3,040 | 3,341 |
| Marketable securities, deposits & equity investments | 33,062 | 34,775 | 36,225 | 38,669 | 41,843 |
| Advances | 8,536 | 10,227 | 11,431 | 12,068 | 12,700 |
| Receivables | 10,883 | 10,169 | 10,329 | 10,484 | 10,660 |
| Inventories | 946 | 1,020 | 1,047 | 1,077 | 1,126 |
| Other investments | 221 | 221 | 221 | 221 | 221 |
| Property, plant and equipment | 67,494 | 65,048 | 67,286 | 68,703 | 69,969 |
| Tertiary education institutes investment | 232 | 4,657 | 4,796 | 4,935 | 5,074 |
| Commercial forests | 5,010 | 232 | 232 | 232 | 232 |
| Intangible assets (including goodwill) | 737 | 633 | 554 | 481 | 412 |
| Forecast new capital spending | .. | 56 | 625 | 1,281 | 1,858 |
| Total | 130,831 | 129,484 | 135,357 | 141,191 | 147,436 |
| Liabilities | |||||
| Payables and provisions | 14,451 | 14,008 | 14,508 | 14,758 | 14,929 |
| Currency issued | 3,197 | 3,197 | 3,197 | 3,197 | 3,197 |
| Borrowings – sovereign guaranteed | 28,645 | 26,250 | 24,046 | 24,536 | 24,224 |
| Borrowings – non-sovereign guaranteed | 8,219 | 9,976 | 10,671 | 11,037 | 11,435 |
| Provision for government superannuation fund pension liability | 14,952 | 14,922 | 14,864 | 14,771 | 14,646 |
| Provision for ACC outstanding claims liability | 11,384 | 11,981 | 12,577 | 13,181 | 13,782 |
| Total | 80,848 | 80,334 | 79,863 | 81,480 | 82,213 |
| Assets less liabilities | 49,983 | 49,150 | 55,494 | 59,711 | 65,223 |
| Crown balance | |||||
| Taxpayer funds | 21,780 | 28,692 | 35,036 | 39,253 | 44,765 |
| Revaluation reserve | 27,988 | 20,458 | 20,458 | 20,458 | 20,458 |
| Minority Interest | 215 | .. | .. | .. | .. |
| Crown balance | 49,983 | 49,150 | 55,494 | 59,711 | 65,223 |
Table 27.04 shows the government's cash flows for 2005 and forecasts for 2006–2009.
Table 27.04. Statement of cash flows Years ending 30 June
| 2005 | 2006 | 2007 | 2008 | 2009 | |
|---|---|---|---|---|---|
| Actual | Forecast | Forecast | Forecast | Forecast | |
.. figures not available Source: The Treasury | |||||
| $(million) | |||||
| Cash flows from operations | |||||
| Cash was provided from | |||||
| Total tax receipts | 46,867 | 48,686 | 50,467 | 51,455 | 54,607 |
| Total other sovereign receipts | 2,974 | 2,995 | 3,115 | 3,197 | 3,271 |
| Interest | 1,642 | 1,351 | 1,418 | 1,535 | 1,633 |
| Dividends | 66 | 73 | 80 | 89 | 96 |
| Sales of goods and services | 11,517 | 12,118 | 12,787 | 13,237 | 13,740 |
| Other operating receipts | 2,186 | 2,194 | 2,188 | 2,241 | 2,226 |
| Total cash provided from operations | 65,252 | 67,417 | 70,055 | 71,754 | 75,573 |
| Cash was disbursed to | |||||
| Subsidies and transfer payments | 15,717 | 17,203 | 18,353 | 19,423 | 20,124 |
| Personnel and operating payments | 35,052 | 38,023 | 39,418 | 40,727 | 41,078 |
| Finance costs | 2,294 | 2,471 | 2,332 | 2,370 | 2,425 |
| Forecast new operating spending | .. | 150 | 1,499 | 3,262 | 5,120 |
| Total cash disbursed to operations | 53,063 | 57,847 | 61,602 | 65,782 | 68,747 |
| Net cash flows from operations | 12,189 | 9,570 | 8,453 | 5,972 | 6,826 |
| Cash flows from investing activities | |||||
| Cash was provided from | |||||
| Sale of physical assets | 316 | .. | .. | .. | .. |
| Total cash provided from investing activities | 316 | .. | .. | .. | .. |
| Cash was disbursed to | |||||
| Purchase of physical assets | 4,862 | 6,701 | 4,903 | 3,939 | 4,373 |
| Net increase in advances | 1,061 | 1,943 | 1,423 | 1,446 | 690 |
| Net purchase/(sale) of marketable securities, deposits and other equity investments | 6,677 | 3,073 | 1,293 | 1,639 | 2,234 |
| Forecast new capital spending | .. | 56 | 569 | 656 | 577 |
| Total cash disbursed to investing activities | 12,600 | 11,773 | 8,188 | 7,680 | 7,874 |
| Net cash flows from investing activities | (12,284) | (11,773) | (8,188) | (7,680) | (7,874) |
| Net cash flows from operations and investing activities | (95) | (2,203) | 265 | (1,708) | (1,048) |
| Cash flows from financing activities | |||||
| Cash was provided from | |||||
| Issue of circulating currency | 188 | .. | .. | .. | .. |
| Net issue/(repayment) of government stock | 1,913 | (647) | (341) | 2,356 | (187) |
| Total cash provided from financing activities | 2,101 | (647) | (341) | 2,356 | (187) |
| Cash was disbursed to | |||||
| Net repayment/(issue) of foreign-currency borrowing | 829 | (1,527) | 330 | (381) | (1,725) |
| Net repayment/(issue) of other | |||||
| New Zealand-dollar borrowing | 951 | (488) | (571) | 600 | 189 |
| Total cash disbursed to financing activities | 1,780 | (2,015) | (241) | 219 | (1,536) |
| Net cash flows from financing activities | 321 | 1,368 | (100) | 2,137 | 1,349 |
| Net movement in cash | 226 | (835) | 165 | 429 | 301 |
| Opening cash balance | 3,450 | 3,281 | 2,446 | 2,611 | 3,040 |
| Foreign-exchange gains on opening cash balances | 34 | .. | .. | .. | .. |
| Closing cash balance | 3,710 | 2,446 | 2,611 | 3,040 | 3,341 |
The New Zealand tax year is from 1 April to 31 March. The Inland Revenue Department administers three principal acts – the Income Tax Act 2004, the Tax Administration Act 1994 and the Goods and Services Tax Act 1985.
Taxpayers who earn income solely from salary, wages, dividends and interest no longer have to file annual tax returns.
The New Zealand Government deducts taxes at income source, with a graduated-scale, pay-as-you-earn (PAYE) tax deducted from salaries and wages, and withholding tax deducted from various other specified categories of income.
The tax system has been simplified for most individual taxpayers – those who earn income solely from salary, wages, dividends and interest – by removing the requirement to file annual income tax returns. In certain circumstances, taxpayers receive a personal tax summary showing whether they have tax to pay or will receive a refund.
The PAYE system requires employers to provide the Inland Revenue Department with a monthly schedule detailing each employee's salary or wage income, PAYE deductions and other information, such as student loan and child support payments.
Income tax is deducted under the Income Tax Act 2004 and is charged on most income, including business profits, employment income, royalties, interest, dividends and pensions.
Rates of income tax for individual taxpayers in the 2005/06 tax year were:
Income up to and including $38,000 – 19.5 cents for every dollar of taxable income.
Income over $38,000 and not exceeding $60,000 – 33 cents for every dollar of taxable income.
Income over $60,000 – 39 cents for every dollar of taxable income.
Rates used for assessment are based on annual income (normally from 1 April to 31 March).
Resident withholding tax (RWT) is tax deducted from interest and dividend income. For example, when banks pay interest they deduct resident withholding tax before paying the recipient.
Individual taxpayers can elect to have RWT deducted at a rate of 19.5 percent, 33 percent or 39 percent.
If the recipient does not provide the interest payer with a taxpayer identification number, a non-declaration rate of 39 percent applies. Certain recipients of interest or dividends (such as charitable or non-profit organisations, sports clubs and others) may apply for exemption from RWT.
Dividends received from a New Zealand company may have imputation credits and/or withholding payment credits attached. An imputation credit is a tax credit received from a company for tax it has already paid on its profits. It therefore avoids the double payment of tax (by the company and its shareholders) on the same income.
Withholding payment credits arise when a New Zealand company has paid dividend withholding payments on foreign dividends received.
The imputation system integrates personal and business tax for company income distributed as dividends and allows the benefit for tax paid by the company to be passed on to the shareholder.
From April 2003, eligible Australian companies have been able to elect to be a New Zealand imputation credit account company. Effective from October 2003, New Zealand shareholders in these Australian companies are then able to claim imputation credits allocated for their share of New Zealand tax paid by the company.
Rebates are deductions from the amount of tax to be paid. The Inland Revenue Department administers several types of rebates for personal taxpayers. These include:
A rebate for low-income New Zealand resident taxpayers.
A transitional tax allowance for certain full-time employees.
A child rebate for taxpayers aged 18 or under provided they turned 18 after 1 January of the preceding tax year and that they attended school.
A housekeeper/childcare rebate for working parents who pay for childcare, or for disabled people who pay for help with childcare or housekeeping. The maximum rebate is $310.
A rebate for charitable donations, which is 33.3 percent of all qualifying donations. The minimum qualifying charitable donation is $5 and the maximum rebate is $630.
Company taxation is deducted under the Income Tax Act 2004. The company rate of taxation differs from that of individuals in that a company does not get any of the exemptions or rebates individuals are entitled to, and a flat tax rate of 33 percent applies. Certain companies can, however, get a rebate for gifts of money to charitable organisations, but there is a threshold to the amount they can claim.
Company taxation in the year ending 30 June 2005 produced $8.299 billion.
A company resident in New Zealand is assessable on all income whether earned in New Zealand or elsewhere. A company is a New Zealand resident if it is incorporated in New Zealand, if it has its head office in New Zealand, if it has its centre of management in New Zealand, or if control of the company by its directors is exercised in New Zealand.
Companies that maintain imputation accounts receive a tax credit when they pay tax on their taxable income under the Income Tax Act 2004, and these credits are attached to dividends paid to shareholders.
A company not resident in New Zealand is liable for tax only on income earned in New Zealand. Nonresident companies are taxed at 33 cents in the dollar for any activity they conduct in New Zealand. For most non-residents who simply earn interest or dividend income, non-resident withholding tax is the final New Zealand tax on that income.
Private use of a motor vehicle by an employee makes the employer liable for fringe benefit tax.
Fringe benefit tax (FBT) is a tax on certain non-monetary benefits employees receive from their employer as part of their employment, e.g. a company car. It is payable at the rate of 64 percent. However, employers have the option of using the multi-rate calculation process, which reflects the remuneration level of those employees receiving benefits. FBT is payable by the employer on an annual or quarterly basis.
Taxable fringe benefits include private use of a motor vehicle by an employee; low-interest loans; free, subsidised or discounted transport and other goods and services; and the employer's contribution to accident, sickness or death benefit fund and insurance policies.
Total FBT collected in the year ending 30 June 2005 was $431.42 million.
Goods and services tax (GST) is a value-added tax charged at 12.5 percent on supplies of most goods and services made or provided in New Zealand. GST was introduced at a rate of 10 percent in 1986 and increased to 12.5 percent in 1989.
All companies and individual traders with an annual turnover of $40,000 or more must register for GST.
People registered for GST must charge GST on the goods and services they supply. GST-registered suppliers of goods and services pay GST on purchases and expenses made in the course of their business, but may claim it back later. Registered persons must pay the GST they have collected, less the GST on their purchases, to the Inland Revenue Department.
Some activities, such as salaries and wages, hobby activities and private sales of personal and domestic items, are not taxable supplies.
GST is not charged on exempt supplies. Exempt supplies include residential property rentals and the sale of donated goods and services by non-profit organisations.
Total GST assessed in the year ending 30 June 2005 was $8.64 billion.
The Customs and Excise Act 1996 provides for the imposition of excise duty on alcoholic beverages, tobacco products, super and regular grade petroleum, liquefied petroleum gas and compressed natural gas when compressed by a natural gas fuelling facility for use as a motor vehicle fuel. Similarly, excise-equivalent duty is levied on the same goods imported into New Zealand.
The excise regime is dependent on the licensing of areas within which excisable goods may be manufactured or stored and within which customs powers may be exercised. These customs-controlled areas may be licensed for the purpose of:
The manufacture of excisable goods (breweries, wineries, tobacco manufacturing plants, distilleries, petrol refineries etc).
The deposit, keeping or securing of imported goods, without payment of duty on the goods, pending export of those goods (e.g. ships’ provedores).
Storage by or for the manufacturer or the first owner of wine manufactured in New Zealand, where the wine cannot be physically accommodated within the area in which it was manufactured (i.e. off-site storage of wine).
Storage of imported goods or goods manufactured in a manufacturing area, of a kind that are subject to duty and on which duty has not been paid, pending the sale of those goods to people departing to or arriving from a country outside New Zealand, or to people exercising an entitlement to the supply of goods free of duty. These premises are usually duty-free shops.
Liability for excise duty arises at the time of removal of the excisable product from the place of manufacture or, in the case of wine, from the off-site storage area, other than to an export warehouse or to another customs-controlled area for further manufacture. Liability for excise-equivalent duty is triggered by importation of the goods.
Excise duty on alcoholic beverages is due for payment by the last working day of the month following the month in which the liability was triggered.
Excise duty on tobacco products and fuels is payable within 15 working days after the last day of the month in which the goods were removed from the customs-controlled area.
Excise-equivalent duty is payable in accordance with the customs-deferred payment system, or prior to the delivery of the goods from customs control.
Rates of excise duty and excise-equivalent duty are contained in the third schedule to the act. The legislation provides discretionary authority for the government to apply increases to the rates of excise and excise-equivalent duties on alcoholic beverages and tobacco products in accordance with movement in the consumers’ price index. Adjustments may be made to alcoholic beverage rates on 1 June of any year and to rates of duty on tobacco products on 1 December in any year. Excise-equivalent duty rates are similarly adjusted.
Similar provision exists in respect of the rates of excise and excise-equivalent duty on petroleum, with adjustments in accordance with movement in the consumers’ price index able to be applied on 1 April of any year.
Figure 27.03 shows customs and excise receipts from 1960 to 2005 as a proportion of consolidated account taxation.
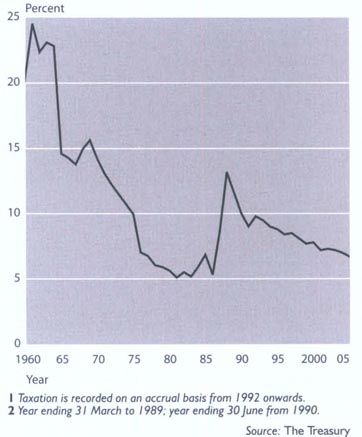
Excise and excise-equivalent duty is paid on all purchases of petrol, liquid petroleum gas (LPG) and compressed natural gas (CNG).
The excise duty on petrol is 41.2 cents a litre (excluding GST). The duty on LPG is 10.4 cents a litre and the duty on CNG is 10.5 cents a litre.
The Road User Charges Act 1977 provides for payment of road user charges by all vehicles of more than 3.5 tonnes and smaller vehicles powered by diesel. Road user charges vary depending on the number of axles, the number of wheels and the weight of the vehicle.
In the case of petrol excise duty, 22.492 cents per litre of the duty, and the total excise duty for LPG and CNG, is paid into the national land transport fund (NLTF). All road user charges are paid into the NLTF, as are vehicle registration fees paid by motorists. Since 2004, appropriations are also made to the NLTF from general Crown revenue, on a case by case basis.
The Customs and Excise Act 1996 has been amended to allow the annual option of increasing, by any rate up to the rate of inflation, the road user charges for 1 to 6-tonne vehicles and that portion of petrol excise duty that is paid into the NLTF. The first opportunity to implement such increases was 1 April 2006.
The fund contributes to the maintenance and construction of New Zealand's roading network; alternatives to roading such as public passenger transport; administration; traffic enforcement; and road safety education and publicity.
Gift duty is paid by a person giving someone else property. It is charged at progressive rates according to the total value of gifts given by a donor within a 12-month period. Dutiable gifts with a total combined value of $27,000 in any 12-month period do not have gift duty charged on them. From there, the gift duty rate rises progressively, from 5 percent to a top rate of 25 percent on gifts exceeding $72,000 in any 12-month period.
A gift duty statement must be provided to the Inland Revenue Department when the value of the gift exceeds $12,000, or when the value of gifts within the previous 12 months exceeds $12,000.
Stamp duty was abolished from 21 May 1999, but remains payable on the sale and lease of commercial land by transfer or by lease if the transaction was completed before that date.
Bills of exchange are liable for cheque duty (with exceptions) and banks are required to forward quarterly statements containing particulars of all bill of exchange forms to the Inland Revenue Department. Licensed printers who print prepaid bills of exchange are required to forward statements to the Inland Revenue Department monthly.
Cheque duty is set at the rate of 5 cents a bill of exchange, or 5 cents a form when the duty is prepaid.
Gaming duty consists of totalisator duty, lottery duty, gaming machine duty and casino duty.
Totalisator duty is payable at the rate of 20 percent of the betting profits of a racing club (horses and greyhounds) or the Totalisator Agency Board (TAB). Statements must be forwarded to the Inland Revenue Department by the 20th of the month following the event. Totalisator duty totalled $70.45 million for the year ending 30 June 2005.
Lottery duty is payable at the rate of 5.5 percent of the nominal value of all tickets in the drawing of a lottery, including instant games, lotteries and prize competitions promoted by the New Zealand Lotteries Commission. Organisers of a lottery are required to supply the Inland Revenue Department with a statement of lottery duty payable and pay it within 14 days of drawing the lottery. Lottery duty totalled $34.33 million in the year ending 30 June 2005.
Gaming machine duty is payable at the rate of 20 percent on profits from dutiable games played on gaming machines. Gaming machine operators are required to send a statement to the Inland Revenue Department each month setting out the gaming machine duty, and pay the duty by the due date.
Gaming duty totalled $211.12 million in the year ending 30 June 2005.
Casino duty is payable at the rate of 4 percent on the casino wins of any casino. Casino operators are required to send a statement of the casino win to the Inland Revenue Department and pay casino duty on a monthly basis.
The government introduced a levy on player expenditure from 1 October 2004. The purpose of the levy is to recover the cost of developing, managing and delivering an integrated problem gambling strategy.
The levy is payable on gaming profits and is collected through monthly returns filed by gaming machine operators, casino operators, the New Zealand Racing Board and the New Zealand Lotteries Commission. The rates of the levy (GST exclusive) were set initially for a three-year period. They are:
Casino operators 0.51 percent.
Non-casino gaming machine operators 1.11 percent.
The New Zealand Racing Board 0.57 percent.
The New Zealand Lotteries Commission 0.14 percent.
The levy rate is determined using the formula set out in the Gambling Act 2003, which factors the level of attributable harm and total revenue for each sector. Revenue collected for the year ending 30 June 2005 was $9.26 million, made up of:
Casino operators $1,539,883.
Non-casino gaming machine operators $6,607,938.
The New Zealand Racing Board $830,298.
The New Zealand Lotteries Commission $280,432.
Non-residents. Non-residents are taxed in New Zealand only if their income is from a New Zealand source. If the income is interest, dividends or royalties, a person is liable for non-resident withholding tax (NRWT). NRWT is deducted by a payer of non-resident withholding income. Provided certain criteria are met, the resident payer of interest can seek registration as an approved issuer and pay an approved issuer levy (AIL) of 2 percent. NRWT may be able to be claimed as a credit by the non-resident in the country of residence subject to the tax regime in that country, but AIL is not able to be claimed as a credit as it is not a tax and has not been deducted from the interest. For tax purposes, individuals are considered to be resident in New Zealand when they fulfil one or more of the following criteria:
They have an enduring relationship with New Zealand, i.e. strong financial, personal or other ties with New Zealand. Each case is considered on its facts.
They have been in New Zealand for more than 183 days in any 12-month period.
They are away from New Zealand in the service of the New Zealand Government.
Individuals cease to be New Zealand residents if they are absent from New Zealand for more than 325 days (about 11 months) in any 12-month period and they do not have an enduring relationship with New Zealand during that time.
Pensions. Pensions received by New Zealand residents from foreign countries, including those with which New Zealand has a double tax agreement, are generally subject to tax in New Zealand. If the person receiving the pension is taxed in the country of origin, credit is generally allowed against New Zealand income tax for the overseas tax paid, up to the amount of New Zealand tax on that income.
Double tax agreements. New Zealand has agreements to avoid double taxation with Australia, Belgium, Canada, China, Denmark, Fiji, Finland, France, Germany, India, Indonesia, Ireland, Italy, Japan, Korea, Malaysia, Netherlands, Norway, Philippines, Russia, Singapore, South Africa, Sweden, Switzerland, Taiwan, Thailand, United Arab Emirates, United Kingdom and the United States. A visitor from one of these countries who received income from New Zealand sources should refer to the relevant agreement.
Family assistance. Family assistance is financial help for low to middle-income families with children under 18 years living at home, or aged 18, not financially independent and attending school or a tertiary establishment. Entitlement is based on combined family income and the number and age of children. Family assistance consists of family support, parental tax credit, child tax credit (which was replaced for the most part by the in-work payment from 1 April 2006) and family tax credit. Child tax credit, parental tax credit and family tax credit are paid by the Inland Revenue Department (IRD). These can be received when a family's income does not include income-tested benefits from the Ministry of Social Development, New Zealand Superannuation, Veteran's Pension, accident insurance payments for more than three months, or a student allowance.
Family support is the main part of family assistance and involves a payment to low to middle-income families for each child living at home up to the age of 18. How much is paid depends on how many children are living at home, how old they are and the combined family income. If the family receives an income-tested benefit, family support is paid by the Ministry of Social Development. Otherwise it is paid by the IRD.
The child tax credit is payment of up to $15 a week for each child aged 18 or under.
The new in-work payment is $60 for up to three children and a further $15 for each additional child.
The parental tax credit provides extra financial support to a maximum of $150 a child a week for the first eight weeks after a child is born.
The family tax credit tops up a family's total income to at least $21,658 a year before tax ($340 after tax each week). If either partner has been injured and is receiving accident compensation payments, but would usually be working, they can still be eligible for the family tax credit.
For the family tax credit, and the in-work payment from 1 April 2006, at least one parent must work for salary or wages. The combined weekly hours of work in a two-parent family must be at least 30 hours and in a single-parent family, weekly hours of work must be at least 20 hours.
Child support. Inland Revenue Child Support was established in 1991 to administer the Child Support Act 1991. Child support is money paid by parents not living with their children to help financially support those children. To qualify for child support, the child must be under the age of 19, be a New Zealand citizen or ‘ordinarily resident’ in New Zealand, be not married or in a civil union or relationship, and be financially dependent.
The person caring for the child (the custodian) generally applies for child support. Custodians are sometimes people other than parents, such as grandparents, a member of the whānau, or Child Youth and Family. In these cases, both parents may be required to pay child support. Custodians receiving a sole parent benefit must apply for child support.
A four-step calculation (the child support formula) is used to work out how much child support a paying parent needs to pay. The formula uses a process which works out the paying parent's child support income, takes away a set living allowance from that income (the amount of which depends on their living arrangements, e.g. whether they have a partner and/or children living with them) and multiplies the result by a percentage based on the number of children the paying parent pays child support for.
The Child Support Act 1991 sets a minimum annual rate of child support and the paying parent must pay the greater of this or the rate as calculated under the child support formula. The Inland Revenue Department collects payments from the paying parent and passes them on to the custodian to assist with care of the child, or to the government to help offset the cost of the benefit if the custodian is receiving a sole parent benefit. The payment is passed on only when it has been received from the paying parent.
There are approximately 142,700 paying parents, 144,680 custodians and 238,200 children in the scheme. The overall debt collection rate (excluding penalties) is approximately 86.4 percent. In the year ending 30 June 2005, the Inland Revenue Department collected $317.7 million from paying parents, of which $136.2 million was paid to custodians and $181.5 million to the government.
With effect from 1 April 2006, student loans became interest free for borrowers living in New Zealand for 183 or more consecutive days.
Student loans. The Ministry of Education manages policy aspects of the student loan scheme and StudyLink processes loan applications and administers payments to borrowers. Loans are transferred to the Inland Revenue Department on 28 February following the end of the calendar year in which a borrower was studying. The Inland Revenue Department assesses and collects loan repayments until the loan is repaid. Interest rates and repayment thresholds are reviewed annually and are effective from 1 April to 31 March. The student loan total annual interest rate for the 2006 financial year was 7 percent and the repayment threshold $16,588. Borrowers earning over the repayment threshold are legally required to repay 10 cents in the dollar of every dollar earned over the repayment threshold.
Those on salary and wages generally have their loan repayments deducted at source, along with PAYE deductions. From 1 April 2006, student loans for borrowers living in New Zealand for 183 or more consecutive days (with some exceptions to this requirement) were interest-free. The interest-free policy is being administered by a write-off at the end of the tax year.
Table 27.05 is from the government's accounts. As well as taxes and duties collected by the Inland Revenue Department, the accounts also include taxes and duties collected by the New Zealand Customs Service.
Table 27.05. Breakdown of tax revenue Years ending 30 June
| 1997 | 1998 | 1999 | 2000 | 2001 | 2002 | 2003 | 2004 | 2005 | |
|---|---|---|---|---|---|---|---|---|---|
| Source: The Treasury | |||||||||
| $(million) | |||||||||
| Direct income tax revenue | |||||||||
| Individuals | |||||||||
| Source deductions | 12,264 | 12,773 | 12,295 | 12,972 | 13,703 | 14,600 | 15,933 | 16,908 | 18,324 |
| Other persons | 3,382 | 3,243 | 3,024 | 3,123 | 3,871 | 4,019 | 4,195 | 4,027 | 4,103 |
| Refunds | (658) | (687) | (701) | (625) | (790) | (836) | (834) | (860) | (876) |
| Fringe benefit tax | 336 | 340 | 323 | 306 | 342 | 361 | 375 | 410 | 441 |
| Total | 15,324 | 15,669 | 14,941 | 15,776 | 17,126 | 18,144 | 19,669 | 20,485 | 21,992 |
| Corporate tax | |||||||||
| Gross companies tax | 2,946 | 3,469 | 3,471 | 3,960 | 4,621 | 4,517 | 5,245 | 6,099 | 7,537 |
| Refunds | (99) | (98) | (157) | (112) | (123) | (224) | (191) | (180) | (232) |
| Non-resident withholding tax | 824 | 662 | 717 | 735 | 760 | 664 | 732 | 800 | 927 |
| Foreign-source dividend withholding payments | 35 | 42 | 8 | 58 | 83 | 141 | 154 | 139 | 188 |
| Total | 3,706 | 4,075 | 4,039 | 4,641 | 5,341 | 5,098 | 5,940 | 6,858 | 8,420 |
| Other income tax | |||||||||
| Resident withholding tax on interest income | 1,001 | 961 | 864 | 723 | 990 | 1,000 | 1,111 | 1,188 | 1,501 |
| Resident withholding tax on dividend income | 72 | 205 | 63 | 47 | 71 | 20 | 57 | 49 | 59 |
| Estate and gift duties | 0 | 0 | 2 | 2 | 2 | 1 | 1 | 2 | 2 |
| Total | 1,073 | 1,166 | 929 | 772 | 1,063 | 1,021 | 1,169 | 1,239 | 1,562 |
| Total direct income tax revenue | 20,103 | 20,910 | 19,909 | 21,189 | 23,530 | 24,263 | 26,778 | 28,582 | 31,974 |
| Indirect income tax revenue | |||||||||
| Goods and services tax | |||||||||
| Gross goods and services tax | 10,867 | 10,830 | 11,295 | 12,360 | 13,472 | 14,638 | 14,959 | 16,603 | 17,378 |
| Refunds | (4,512) | (4,271) | (4,440) | (5,214) | (6,007) | (6,642) | (6,221) | (6,885) | (7,180) |
| Total | 6,355 | 6,559 | 6,855 | 7,146 | 7,465 | 7,996 | 8,738 | 9,718 | 10,198 |
| Other indirect taxation | |||||||||
| Petroleum fuels excise | 692 | 786 | 802 | 808 | 810 | 874 | 995 | 947 | 823 |
| Tobacco excise | 666 | 681 | 714 | 777 | 764 | 815 | 850 | 819 | 842 |
| Customs duty | 909 | 750 | 528 | 612 | 648 | 666 | 750 | 720 | 947 |
| Road user charges | 426 | 466 | 468 | 507 | 532 | 580 | 621 | 667 | 713 |
| Alcohol excise | 438 | 439 | 432 | 442 | 436 | 452 | 465 | 476 | 491 |
| Gaming duties | 129 | 139 | 155 | 176 | 206 | 210 | 248 | 261 | 281 |
| Motor vehicle fees | 155 | 158 | 174 | 177 | 181 | 188 | 197 | 211 | 217 |
| Energy resources levies | 104 | 87 | 96 | 108 | 111 | 111 | 94 | 75 | 73 |
| Approved issuer levy and cheque duty | 183 | 186 | 94 | 58 | 61 | 60 | 49 | 56 | 65 |
| Total | 3,702 | 3,692 | 3,463 | 3,665 | 3,749 | 3,956 | 4,269 | 4,232 | 4,452 |
| Total indirect taxation | 10,057 | 10,251 | 10,318 | 10,811 | 11,214 | 11,952 | 13,007 | 13,950 | 14,650 |
| Total tax revenue collected | 30,160 | 31,161 | 30,227 | 32,000 | 34,744 | 36,215 | 39,785 | 42,532 | 46,624 |
Table 27.06 provides a comparison of public account taxation and national disposable income in New Zealand for the years 1987 to 2005.
Table 27.06. Public account taxation and national disposable income Years ending 31 March
| Year | Public account taxation | ||
|---|---|---|---|
| National disposable income1,3 | Total2,4,5 | Percentage of national disposable income | |
1National disposable income is calculated on the year ending 31 March, From 1990, public account taxation is calculated on the year ending 30 June on a 30 June year basis. 2Data from 1994 to 2003 has been revised. 3Data from 1987 to 2003 has been revised. 4From 1992 accounts prepared on an accrual basis. 5From 1994, the public account taxation series includes the removal of GST on Crown expenses. This creates a discontinuity in this series which should be taken into account when viewing this table. Source: Statistics New Zealand | |||
| $(million) | Percent | ||
| 1987 | 44,923 | 17,408.10 | 38.8 |
| 1988 | 50,814 | 21,528.10 | 42.4 |
| 1989 | 55,459 | 22,863.90 | 41.2 |
| 1990 | 58,644 | 26,198.10 | 44.7 |
| 1991 | 60,240 | 25,797.60 | 42.8 |
| 1992 | 57,466 | 23,901.00 | 41.6 |
| 1993 | 59,429 | 25,812.00 | 43.4 |
| 1994 | 64,514 | 26,542.00 | 41.1 |
| 1995 | 69,729 | 29,026.00 | 41.6 |
| 1996 | 74,522 | 30,973.00 | 41.6 |
| 1997 | 77,859 | 30,546.00 | 39.2 |
| 1998 | 81,693 | 31,511.00 | 38.6 |
| 1999 | 83,977 | 30,525.00 | 36.3 |
| 2000 | 88,077 | 32,248.00 | 36.6 |
| 2001 | 92,287 | 34,995.00 | 37.9 |
| 2002 | 100,637 | 36,459.00 | 36.2 |
| 2003 | 105,538 | 40,168.00 | 38.1 |
| 2004 | 113,154 | 43,008.00 | 38.0 |
| 2005 | 119,013 | 47,118.00 | 39.6 |
The Taxation Review Authorities Act 1994 established one or more taxation review authorities.
There are two authorities, each consisting of one person who is either a district court judge or a barrister or solicitor of the High Court of no fewer than seven years practice. They are appointed by the governor-general.
The authorities sit as judicial authorities for hearing and determining objections to assessments of tax or duty, or to decisions or determinations of the Commissioner of Inland Revenue.
The New Zealand Debt Management Office (NZDMO) is responsible for managing the government's New Zealand-dollar and foreign currency debt, some liquidity assets and overall net cashflows within an appropriate risk management framework.
Principal risks managed are market, credit, liquidity, funding, concentration and operational risk.
In 1988, NZDMO introduced reform of public sector cash management involving centralisation of surplus cash funds for investment and cash management, and decentralisation to departments of responsibility for payments and other banking operations.
Separation of the government's financial management from monetary policy implementation, which is the responsibility of the Reserve Bank of New Zealand, enables NZDMO to focus on defining a low-risk net liability portfolio for the government and implementing it in a cost-effective manner.
Before March 1985, the government borrowed externally to finance the balance of payments deficit and maintain a fixed exchange rate.
Since the adoption of a freely floating exchange rate, the government has borrowed externally only to finance foreign-exchange reserves. All other borrowing has been in the domestic market.
Net foreign-currency debt was eliminated in September 1996, through the proceeds from asset sales and, since 1994, fiscal surpluses.
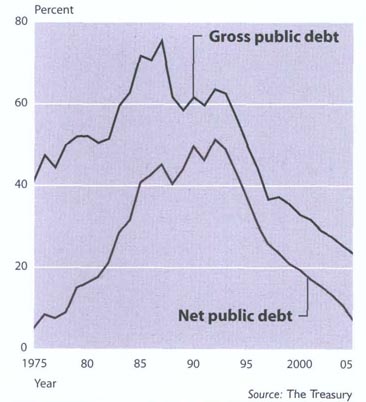
New Zealand has always paid, when due, the full amount of principal, interest and amortisation requirements upon its external and internal debt, including guaranteed debt. The government's long-term fiscal objectives include running operating surpluses on average over the economic cycle to allow a build-up of assets to meet future New Zealand Superannuation costs. Total debt is to be managed at prudent levels, with gross sovereign issued debt as a percentage of gross domestic product (GDP) slowly reducing over the longer term and passing through 20 percent of GDP before 2015. Quantifiable contingent liabilities of the government, including the Reserve Bank of New Zealand, state-owned enterprises and Crown entities, amounted to approximately $4.470 billion at 30 June 2005. Figure 27.04 illustrates gross and net public debt as a proportion of GDP for the years 1975 to 2005.
Table 27.07 is one of the key statements from the government's financial statements, the Statement of borrowings.
Table 27.07. Statement of borrowings At 30 June
| 2005 | 2006 | 2007 | 2008 | 2009 | |
|---|---|---|---|---|---|
| Actual | Forecast | Forecast | Forecast | Forecast | |
1Sovereign issued debt is debt issued by the New Zealand Debt Management Office (NZDMO) and also includes the Reserve Bank of New Zealand, given it is integral to the debt management of the Crown. It excludes debt issued by state-owned enterprises (SOEs) and Crown entities and any sovereign-guaranteed debt of SOEs and Crown entities. Gross sovereign issued debt includes any New Zealand Government stock held by the Government Superannuation Fund and the New Zealand Superannuation Fund. 2Net core Crown debt is a core Crown measure calculated as gross sovereign issued debt less financial assets (excluding the net assets of the Government Superannuation Fund and the New Zealand Superannuation Fund due to their restricted nature). .. figures not available Source: The Treasury | |||||
| $(million) | |||||
| Sovereign guaranteed debt | |||||
| New Zealand-dollar debt | |||||
| Government stock | 16,058 | 14,758 | 13,257 | 14433 | 13049 |
| Treasury bills | 5,245 | 4,242 | 4,150 | 3906 | 5265 |
| Loans and foreign exchange contracts | (6,123) | (7,099) | (8,150) | (8,657) | (8,904) |
| Retail stock and other | 583 | 619 | 559 | 519 | 479 |
| Total | 15,763 | 12,520 | 9,816 | 10,201 | 9,889 |
| Foreign-currency debt | |||||
| United States dollars | 7,906 | 8,809 | 9,309 | 9,510 | 9,510 |
| Japanese yen | 252 | 252 | 252 | 252 | 252 |
| European and other currencies | 4,724 | 4,669 | 4,669 | 4,573 | 4,573 |
| Total | 12,882 | 13,730 | 14,230 | 14,335 | 14,335 |
| Total sovereign guaranteed debt | 28,645 | 26,250 | 24,046 | 24,536 | 24,224 |
| Non-sovereign guaranteed debt | |||||
| New Zealand | 5,601 | 7,259 | 7,753 | 8,182 | 8,825 |
| United States dollars | 1,541 | 2,221 | 2,421 | 2,364 | 2,254 |
| Japanese yen | 324 | .. | .. | .. | .. |
| European and other currencies | 753 | 496 | 497 | 491 | 356 |
| Total non-sovereign guaranteed debt | 8,219 | 9,976 | 10,671 | 11,037 | 11,435 |
| Total borrowings (gross debt) | 36,864 | 36,226 | 34,717 | 35,573 | 35,659 |
| Less | |||||
| Financial assets (including restricted assets, marketable securities, deposits and equity investments) | |||||
| New Zealand dollars | 6,487 | 4,825 | 2,924 | 2,145 | 1,897 |
| United States dollars | 9,733 | 10,981 | 11,814 | 12,380 | 12,789 |
| Japanese yen | 789 | 789 | 789 | 789 | 789 |
| European and other currencies | 4,455 | 4,381 | 4,374 | 4,271 | 4,263 |
| Reserve position at International Monetary Fund | 702 | 710 | 719 | 729 | 741 |
| New Zealand equity investments | 2,385 | 2,805 | 3,197 | 3,601 | 4,010 |
| Foreign equity investments | 8,511 | 10,284 | 12,408 | 14,754 | 17,354 |
| Total | 33,062 | 34,775 | 36,225 | 38,669 | 41,843 |
| Advances and cash | |||||
| Student loans | 6,465 | 7,077 | 7,684 | 8,304 | 8,928 |
| Other advances | 2,071 | 3,150 | 3,747 | 3,764 | 3,772 |
| Cash | 3,710 | 2,446 | 2,611 | 3,040 | 3,341 |
| Total advances and cash | 12,246 | 12,673 | 14,042 | 15,108 | 16,041 |
| Total financial assets | 45,308 | 47,448 | 50,267 | 53,777 | 57,884 |
| Borrowings less financial assets | (8,444) | (11,222) | (15,550) | (18,204) | (22,225) |
| Net New Zealand-dollar debt | (13) | (795) | (2,866) | (2,744) | (3,507) |
| Net foreign currency debt | (8,431) | (10,427) | (12,684) | (15,460) | (18,718) |
| Borrowings less financial assets | (8,444) | (11,222) | (15,550) | (18,204) | (22,225) |
| Gross sovereign issued debt1 | 35,045 | 33,628 | 32,177 | 33,473 | 34,019 |
| Net core Crown debt2 | 10,771 | 8,987 | 8,570 | 10,314 | 11,123 |
Table 27.08 shows central government debt from 1991 to 2005.
Table 27.08. Gross indebtedness of central government
| Year | Amount | Per head of population |
|---|---|---|
| Source: Statistics New Zealand | ||
| At 30 June | $(million) | |
| 1991 | 43,935 | 12,570.46 |
| 1992 | 46,674 | 13,215.73 |
| 1993 | 47,478 | 13,290.97 |
| 1994 | 46,429 | 12,825.34 |
| 1995 | 44,096 | 12,004.14 |
| 1996 | 41,500 | 11,120.04 |
| 1997 | 35,972 | 9,512.88 |
| 1998 | 37,892 | 9,932.37 |
| 1999 | 36,712 | 9,572.63 |
| 2000 | 36,041 | 9,342.37 |
| 2001 | 36,761 | 9,473.26 |
| 2002 | 36,202 | 9,190.42 |
| 2003 | 36,086 | 9,000.80 |
| 2004 | 35,527 | 8,747.48 |
| 2005 | 35,045 | 8,549.85 |
Table 27.09 shows the maturity profile of New Zealand Government debt at 30 June 2005.
Table 27.09. Refinancing/repricing risk
| Assets and liabilities | Total at 30 June 2005 | 0–12 months | 1–2 years | 2–5 years | 5–10 years | More than 10 years |
|---|---|---|---|---|---|---|
- nil or zero Source: The Treasury | ||||||
| $(million) | ||||||
| Domestic assets | ||||||
| Cash and deposits | 3,505 | 3,505 | - | - | - | - |
| Marketable securities | 5,872 | 1,070 | 328 | 2,001 | 2,467 | 6 |
| Others | 2,386 | 1,625 | 574 | 29 | 31 | 127 |
| Domestic liabilities | ||||||
| Government stock | 16,058 | 2,343 | 2,668 | 3,742 | 6,506 | 799 |
| Treasury bills | 5,245 | 5,245 | - | - | - | - |
| Retail stock | 582 | 476 | 68 | 38 | - | - |
| Others | (521) | (1,550) | 218 | 859 | 1 | (49) |
| Foreign assets | ||||||
| Cash and deposits | 775 | 775 | - | - | - | - |
| Marketable securities | 15,541 | 10,706 | 1,056 | 1,485 | 1,570 | 724 |
| Others | 8,693 | 8,686 | 2 | - | - | 5 |
| Foreign liabilities | ||||||
| Foreign currency debt | 15,500 | 9,866 | 1,589 | 1,875 | 1,295 | 875 |
The government's long-term fiscal objectives include running operating surpluses to build up assets to meet future New Zealand Superannuation costs.
27.1 The Treasury.
27.2 Inland Revenue Department; The Treasury; New Zealand Customs Service; Ministry of Transport; Statistics New Zealand; Taxation Review Authority.
27.3 The Treasury; Statistics New Zealand.
www.acc.co.nz – Accident Compensation Corporation
www.ird.govt.nz – Inland Revenue Department
www.ltsa.govt.nz – Land Transport New Zealand
www.localgovtnz.co.nz – Local Government New Zealand
www.msd.govt.nz – Ministry of Social Development
www.transport.govt.nz – Ministry of Transport
www.customs.govt.nz – New Zealand Customs Service
www.rbnz.govt.nz – Reserve Bank of New Zealand
www.ssc.govt.nz – State Services Commission
www.stats.govt.nz – Statistics New Zealand
www.treasury.govt.nz – The Treasury
www.winz.govt.nz – Work and Income New Zealand
Statistical terms defined here are a selection of those frequently used in censuses, surveys and series referred to in this book.
- Abortion.
Foetal loss excluding stillbirths, usually during the first 20 weeks of gestation. ‘Induced’ abortions are those initiated voluntarily with the intention of terminating a pregnancy. All other abortions are called ‘spontaneous’, even if an external cause is involved such as injury or high fever. All abortion statistics and derived abortion rates released by Statistics New Zealand are based on the number of legally induced abortions. No information is available on spontaneous or illegal abortions.
- Additions to fixed assets.
Purchases of new and second-hand fixed assets and the cost of work done by a firm's own employees in producing, constructing and installing fixed assets for its own use.
- ANZSIC.
The Australia New Zealand Standard Industry Classification is a hierarchical industrial classification which groups businesses based on the types of economic activities they carry out. ANZSIC is closely based on the International Standard Industrial Classification Revision 3 (United Nations 1990).
- Assumption.
A statement about a future course of behaviour from which demographic projections are derived.
- Baby boom.
Usually the period 1946–65 associated with high fertility rates and high numbers of births.
- Balance of payments.
A statistical statement that systemically summarises, for a specific time period, the economic transactions of an economy with the rest of the world.
- Balance of payments conceptual adjustments.
Adjustments to international trade statistics to bring the value of exports and imports into line with balance of payments concepts. Imports are adjusted to free on board (fob) value. Exports are adjusted for goods shipped and sold on consignment.
- Balance on current account.
A balance of payments statement is presented as a series of accounts – current, capital and financial. The current account records the export and import of goods and services, income earned and paid and, under current transfers, offsetting entries to resources supplied or received from non-residents. The sum of the exports of goods and services, earnings and resources received (inflows), less imports of goods and services, income paid and resources supplied (outflows) is the balance on current account. The account is usually in either surplus (inflows exceed outflows) or deficit (outflows exceed inflows).
- Balance on current transfers.
This is calculated by deducting total debit entries from total credit entries for all current transfers components, e.g. income tax and international aid.
- Balance on goods.
This is calculated by deducting the total imports of goods from the total exports of goods. The balance is in surplus when exports of goods exceed imports.
- Balance on income.
This is calculated by deducting the total income accruing to foreign investors from their investments in New Zealand from the total income earned by New Zealand investors from their investments abroad. Income includes profits, dividends and interest.
- Balance on services.
This is calculated by deducting total imports of services from total exports of services. Services include transportation, travel and insurance.
- Balance on the external current account
(national accounts). The residual item for the external account, this is the excess of income from the rest of the world over payments to the rest of the world. A negative value indicates payments exceed income.
- Banking sector.
All units engaging in financial intermediation as a principal activity and having liabilities in the form of deposits or financial instruments.
- Birth rate
(crude). The number of live births per 1,000 mean estimated population.
- Births.
Include live births and stillbirths. A change in definition in the Births, Deaths and Marriages Registration Act 1995 means stillbirths from September 1995 onwards are not directly comparable with earlier years.
- BPM5.
Balance of Payments Manual, edition 5.
- Bonds and notes.
Financial instruments that give the holder the unconditional right to a fixed money income or a contractually-determined variable money income.
- Capital account.
This account records all transactions that involve the receipt or payment of capital transfers and acquisition or disposal of non-produced, non-financial assets, e.g. patents and copyrights. The balance is equal to debit entries (inflows) minus credit entries (outflows).
- Capital transfers to/from the rest of the world
(national accounts). The excess of capital transfers by non-residents to New Zealand residents over the value of similar transfers by residents to non-residents. Capital transfers are unrequited transfers in cash or in kind which are not considered by the recipient as adding to current income, nor by the donor as reducing current income. Examples are unilateral transfers of capital goods, legacies, investment grants and transfers of migrants' funds. In the New Zealand System of National Accounts, it has been possible to separately identify some of these flows only since 1984/85. Otherwise, they have been included in current transfers to/from the rest of the world.
- Census.
A survey of the total population of interest. The Census of Population and Dwellings, carried out at five-yearly intervals, is an example of a census. (See also sample survey).
- Census night population count.
A count of all people present in a given area on a given census night. The census night population count of New Zealand includes visitors from overseas who are counted on census night, but excludes residents who are temporarily overseas on census night. For a subnational area, the count includes visitors from overseas and elsewhere in New Zealand (people who do not usually live in that area), but excludes residents of that area who are temporarily elsewhere on census night (people who usually live in that area but are absent).
- Census undercount/overcount.
Census undercount is the number of people missed by a census who were meant to be counted. Census overcount is the number of people counted by a census who should not have been counted, or who were counted more than once. Net census undercount is the difference between undercount and overcount, usually expressed as a percentage of what should have been the complete count, rather than as a percentage of what was counted.
- Census usually resident population count.
A count of all people who usually live in a given area, and are present in New Zealand, on a given census night. The census usually resident population count of New Zealand excludes visitors from overseas and excludes residents who are temporarily overseas on census night. For a subnational area, this count excludes visitors from overseas and elsewhere in New Zealand (people who do not usually live in that area), but includes residents of that area who are temporarily elsewhere in New Zealand on census night (people who usually live in that area but are absent).
- Change in inventories
(national accounts). This consists of changes in:
Stocks of outputs that are still held by the units that produced them prior to their being further processed, sold or delivered to other units.
Stocks of products acquired from other units that are intended to be used for intermediate consumption or for resale without further processing.
They are measured by the value of the entries into inventories, less the value of withdrawals and the value of any recurrent losses of goods held in inventories, and include work in progress.
- cif
(cost including insurance and freight). A basis for valuation of merchandise imports, representing the cost to the importer of buying the goods and bringing them to the wharfside or airport in the importing country.
- Compensation of employees
(national accounts). Total remuneration, in cash or in kind, payable by enterprises to employees. It includes contributions paid on an employee's behalf to a superannuation fund, a private pension scheme, the Accident Compensation Corporation, a casualty and life insurance scheme and other fringe benefits.
- Compensation of employees to/from the rest of the world
(national accounts). In principle, these items cover the compensation residents of one country earn from employment in another, where, because their stay is for a period of less than 12 months, they are classed as nonresidents. In practice, data available does not permit estimates of these items.
- Consensual union
(de facto union). Two people usually living in the same dwelling, but not in a registered marriage to each other, who share mutual concern for each other, have a degree of economic, social and emotional interdependence, and consider their relationship to be akin to marriage.
- Consumers price index.
See indexes.
- Consumption of fixed capital
(national accounts). This represents the reduction in the value of fixed assets used in production during the accounting period resulting from physical deterioration, normal obsolescence or normal accidental damage. It is valued at replacement cost.
- Current account.
This account records all transactions (other than those in financial items) that involve economic values and occur between resident and non-resident entities. Also recorded are offsets to current economic values provided or acquired without a quid pro quo. The major classifications are goods, services, income and transfers.
- Current transfers to/from the rest of the world
(national accounts). These refer to current transfers which take place between residents and non-residents. Examples include government aid in the form of food, clothing and medical supplies; social contributions and/or benefits; and personal transfers such as gifts.
- Death rate
(crude). The number of deaths per 1,000 mean estimated population.
- Density
(of population). The average number of people per square kilometre (or hectare) in a particular locality.
- Depreciation.
As charged in books of account on fixed tangible assets owned by establishments and ancillary units.
- Direct investment.
Investments made to acquire a lasting interest in an enterprise located in an economy other than the resident economy of the investor, the investor's purpose being to have a significant influence in the management of the enterprise. The criterion set out by the International Monetary Fund to determine ‘significant influence’ in the direct investment enterprise is that the investor must hold at least 10 percent of the voting capital of the enterprise. Once the direct investment relationship has been established, all forms of financial capital investment between the direct investor and direct investment enterprise are classed as direct investment, i.e. equity and debt.
- Direct investment income.
Income earned by investors from their direct investment relationship with an enterprise. The income includes dividends (including bonus issues of shares), interest, and earnings of branches and direct investors' portions of the earnings of direct investment enterprises that are not distributed.
- Divorce
(dissolution of marriage). The process by which the legal relationship of husband and wife is dissolved.
- Divorce rate.
The number of divorces per 1,000 estimated existing marriages.
- Domestically-issued securities.
Domestically-issued securities consist of domestically-issued bonds and notes taken up directly by non-resident organisations and individuals, or through New Zealand organisations acting as nominees.
- Dwelling.
A structure, part of a structure, or a group of structures used, or intended to be used, as a place where people live.
- Economically-significant enterprise.
An enterprise which meets at least one of the following criteria:
Has greater than $30,000 annual GST expenses or sales.
Has at least three for its rolling mean employment (rolling mean employment is the average employee count over the previous 12 months).
Is in a GST-exempt industry, except residential property leasing and rental.
Is part of a group of enterprises.
Is a new GST registration that is compulsory, special or forced (this means the business is expected to exceed the $30,000 limit).
Is registered for GST and is involved in agriculture or forestry.
- Employed.
All people in the working-age population who, during the reference week, worked for one hour or more for pay or profit in the context of an employee/employer relationship or self-employment; or worked without pay for one hour or more in work which contributed directly to the operation of a farm, business or professional practice owned or operated by a relative; or had a job but were not at work due to: own illness or injury, personal or family responsibilities, bad weather or mechanical breakdown, direct involvement in an industrial dispute, or leave or holiday.
- Employee count
(EC). The count of all persons who are paid a salary or a wage, and pay tax on it. The EC refers mostly to employees, but includes a small number of working proprietors who also pay themselves a taxable salary or wage. Employee count data is derived from the Employer Monthly Schedule – introduced in 1999 – which is provided by employers to the Inland Revenue Department. Also see full-time equivalents.
- Employer contributions.
Payments by employers to superannuation, pension and welfare schemes and accident compensation levies.
- Employment, Status in.
A respondent's employment status within the labour force. Classifies employed people aged 15 years or over according to whether they work for themselves or other people. Applies to people in full and part-time employment. Employment status categories are: paid employee; selfemployed and without employees; employer; and unpaid family worker.
- Enterprise.
A business or service entity operating in New Zealand. It can be a company, a partnership, a trust, an estate, an incorporated society, a local or central government organisation, a voluntary organisation or a self-employed individual.
- Estimated resident population.
An estimate of all people who usually live in a given area at a given date. The estimated resident population of New Zealand includes all residents present in New Zealand and counted by the census (census usually resident population count), residents who are temporarily overseas (who are not included in the census), and an adjustment for residents missed or counted more than once by the census (net census undercount). Visitors from overseas are excluded. For a subnational area, the estimate excludes visitors from elsewhere in New Zealand (people who do not usually live in that area), but includes residents of that area who are temporarily elsewhere on census night (people who usually live in that area but are absent). The estimated resident population at a given date after census includes births, deaths and net migration (arrivals less departures) of residents during the period between census night and the given date.
- Ethnicity.
An ethnic group is made up of people who have some or all of the following characteristics: a common proper name, one or more elements of common culture which need not be specified, but may include religion. customs or language, unique community of interests, feelings and actions, a shared sense of common origins or ancestry, and a common geographic origin. Ethnicity is self-perceived and people can belong to more than one ethnic-group. People can identify with an ethnicity even though they may not be descended from ancestors with that ethnicity. Conversely, people may choose to not identify with an ethnicity even though they are descended from ancestors with that ethnicity.
- Ex-nuptial birth.
A child born to parents who are not legally married at the time of birth. Ex-nuptial births include births to parents in a consensual union.
- Ex-nuptial birth rate.
The number of ex-nuptial births per 1,000 000 mean estimated not-married women aged 15–49 years.
- Exports of goods and services.
All goods and services produced by New Zealand residents and purchased by non-residents.
- External migration.
The short-term and long-term movement of overseas and New Zealand travellers into and out of New Zealand. External migration statistics are compiled from individual migration forms filled in by passengers arriving in and departing from New Zealand. The various classes of arrival and departure are: overseas visitor, New Zealand resident departing from New Zealand or returning after a short-term absence, permanent and long-term arrival, permanent and long-term departure.
- Family.
A couple, with or without children, or one parent with children, usually living together in a household.
- Fertility.
The actual level of reproduction of a population based on the number of live births that occur. Fertility is normally measured in terms of women of childbearing age.
- Final consumption expenditure
(national accounts). Expenditure, including imputed expenditure, on goods and services according to which sector (private and government) actually pays for the goods and services and therefore makes the decision on the expenditure.
- Financial account.
This account records transactions associated with changes in ownership of the foreign financial assets and liabilities of an economy. For example, foreign investors' purchases and sales of equity (shares) issues by resident New Zealand companies, and the borrowing overseas, and lending overseas, by New Zealand entities.
- Financial derivatives.
Financial derivatives are based on other products, either financial or real, or prices associated with financial products, and which involve:
Future delivery, receipt or exchange of financial items such as cash or another derivative instrument.
Future exchange of real assets for financial items where the contract may be tradeable and have market value.
Financial derivatives include such things as currency swaps, interest rate swaps, futures, forward foreign exchange contracts, options (put and call) and warrants.
- Financial performance.
The broad heading for variables which measure the financial performance of a unit or group of units, including variables for such things as income, expenditure, profit and stocks.
- Financial position.
The broad heading for variables which measure the financial position of a unit or group of units. Previously called the balance sheet, it includes assets, liabilities, equity and investment in fixed assets.
- Foreign direct investment in New Zealand.
Investment in New Zealand-located enterprises by non-resident investors which meets the direct investment criteria. The financial account measures transactions which increase and decrease these investments. The international investment position (IIP) statement measures the value of this investment at points in time.
- fob
(free on board). The current market value of goods in the country of origin, including all costs necessary to get them on board a ship or aircraft, but excluding freight, insurance and other costs involved in transporting them between countries.
- Full-time employed.
People working 30 hours or more a week.
- Full-time equivalents.
The number of full-time equivalent persons engaged equals the number of full-time employees, plus half the part-time employees. Also see employee count.
- General government sector.
Central and local government units, other than the monetary authority.
- General marriage rate.
The number of marriages per 1,000 of the mean estimated not-married population aged 16 and over.
- Geographic unit.
A separate operating unit engaged in New Zealand in one or predominately one kind of economic activity from a single physical location or base.
- Gross
(national accounts). Used to denote values before deducting consumption of fixed capital.
- Gross domestic product
(GDP, national accounts). The total market value of goods and services produced in New Zealand after deducting the cost of goods and services utilised in the process of production, but before deducting allowances for the consumption of fixed capital.
- Gross fixed capital formation
(national accounts). Measured by the total value, less disposals, of a producer's purchases of fixed assets, plus certain additions to the value of non-produced assets (such as subsoil assets or major improvements in the quantity, quality or productivity of land) realised by the productive activity of institutional units. The term ‘gross’ indicates that consumption of fixed capital has not been deducted from the value of the outlays.
- Gross national expenditure
(national accounts). The total expenditure within a given period on final goods and services by New Zealand residents, i.e. excluding goods and services used up during the production process.
- Gross national income
(national accounts). The income accruing within a given period to New Zealand residents from their services in supplying factors of production in New Zealand and overseas, plus net taxes on production and imports, and before the deduction of allowances for the consumption of fixed capital. Previously referred to as gross national product.
- Gross operating surplus
(national accounts). The surplus or deficit accruing from production. The residual item to the gross domestic product and expenditure account, obtained after deducting compensation of employees and taxes on production, less subsidies, from value added.
- Gross reproduction rate.
The average number of daughters that a woman would have during her life if she experienced the age-specific fertility rates of that year. It excludes the effect of mortality.
- Gross tonne.
The unit of actual weight of cargo, including packaging, but not including the weight of reusable containers.
- Harmonised system.
The New Zealand Harmonised System Classification was adopted from the January 1988 reference month for processing customs entries and publishing statistics on external trade. It replaced the Customs Cooperation Council Nomenclature (CCCN) commodity classification and the Standard International Trade Classification (SITC).
- Household.
Either one person usually living alone, or two or more people usually living together and sharing facilities, in a private dwelling.
- IMF.
International Monetary Fund.
- Imports of goods and services.
All goods and services produced by non-residents and purchased by New Zealand residents.
- Indexes.
Indexes are used to measure the total impact of changes in the attributes of commodities which cannot be compared directly. In New Zealand, the most common use of index numbers is to measure changes in prices, volumes or money values over time. When calculating a price index, the type, quantity and quality of each commodity is held constant so that the price movement can be measured. The most frequently quoted index in New Zealand is the consumers price index, which reports quarterly changes in price levels of goods and services purchased by private New Zealand households during a specified base period. By expressing the changes in index form, price changes in commodities as diverse as beef, hairdressing and club subscriptions can all be aggregated to produce a measure of overall price change.
- Indirect taxes.
Taxes assessed on producers in respect of the production, sale, purchase and use of goods and services, and which add to the market prices of those goods and services. They includes sales tax, local authority rates, import and excise duties, fringe benefit tax and registration fees such as motor vehicle registration paid by producers.
- Insurance
(balance of payments). This covers the provision of various types of insurance by non-residents to residents, and vice versa. All types of insurance and reinsurance are included, including freight insurance on goods, reinsurance and other forms of direct insurance, such as life, marine, general and fire and accident. Also included are commissions related to insurance transactions earned by agents.
- Intermediate consumption
(national accounts). The value of goods and services used as inputs in production.
- International investment position.
A statistical statement of:
The value and composition of the stock of an economy's financial assets, or the economy's claims on the rest of the world.
The value and composition of the stock of an economy's liabilities to the rest of the world.
- Investment income.
Income earned by foreign investors from their equity and financial assets invested in New Zealand (the debit or expenditure item), and the income New Zealand investors earn from their equity and financial assets invested abroad (the credit or income earned item).
- Investment income to/from the rest of the world
(national accounts). This consists of:
Investment income, which represents transfers of income accruing to the owners of financial assets (mainly from earning interest and dividends) and tangible non-produced assets (from owning natural assets such as land, subsoil assets and water resources). This now includes reinvested earnings on overseas direct investment, where the retained earnings of a direct foreign investment enterprise are treated as if they were distributed and remitted to foreign direct investors in proportion to their ownership of the equity of the enterprise and then reinvested by them in the enterprise.
Entrepreneurial income, which refers to actual withdrawals of income from enterprises operating overseas, such as branches of foreign companies.
- Kind of activity unit.
A subdivision of an enterprise consisting of a set of one or more activity units for which a single set of accounting records is available.
- Labour force.
The labour force consists of people aged 15 and over who regularly work for one hour or more a week for financial gain, or who work without pay in a family business, as well as those who are not working, are actively seeking, and are available for work.
- Labour force participation rate.
The total labour force expressed as a percentage of the working-age population.
- Labour income
(total). Income before tax which people aged 15 and over receive in a financial year from all sources, e.g. wages, salary, government benefits, interest, dividends, commission, pre-tax business or farming income (less expenses).
- Life expectancy at birth.
The average length of life of a newborn baby, assuming they experience the age-specific mortality rates of a given period throughout their life. Life expectancy represents the average longevity of the whole population and does not necessarily reflect the longevity of an individual.
- Loans.
Direct agreements between borrowers and lenders, involving the transfer of funds to the borrower and the repayment to the lender over time. Loans include secured and unsecured loans, trade related loans, overdrafts, roll-over loans, revolving credit advances, advances from overseas parent and/or subsidiary companies, the use of swingline facilities and non-market debentures and notes.
- Long term.
Refers to financial instruments with an original maturity of more than one year.
- Marriage rate
(crude). The number of marriages per 1,000 mean estimated population.
- Marriage
(registered). The act, ceremony or process by which the legal relationship of husband and wife is constituted. In New Zealand, marriage must be solemnised by a celebrant or before a registrar of marriages.
- Maturity profile.
Time to run to scheduled maturity, i.e. the residual maturity at the survey time point.
- Mean population.
The average number of people in an area during a given period, usually a year. This measure may be estimated in terms of a simple or weighted arithmetic mean of monthly or quarterly population during the reference period.
- Median.
A value with an equal number of items on either side of it.
- Median age.
Half the population is younger, and half older, than this age.
- Merchandise exports.
Goods of domestic origin, and re-exports, sent from New Zealand to other countries, including goods leased for a year or more, but excluding goods for repair.
- Merchandise imports.
Goods from other countries landed in New Zealand, including goods leased for a year or more, but excluding goods for repair.
- Merchandise trade.
All goods which add to or subtract from the stock of material resources in a country as a result of their movement in or out of it, including goods leased for a year or more, but excluding goods for repair.
- Monetary authorities sector.
New Zealand's monetary authority is the Reserve Bank of New Zealand.
- Money market instruments.
Securities generally giving the holder the unconditional right to receive a stated fixed sum of money on a specified date. These instruments are usually traded at a discount in organised markets. The predominant money market instruments in New Zealand are treasury bills, reserve bank bills, bills of exchange and certificates of deposit.
- National disposable income
(national accounts). The total income of New Zealand residents from all sources available for either final consumption (current spending) or saving.
- Natural increase.
The excess of live births over deaths. When deaths exceed births, this is described as a natural decrease or a negative natural increase.
- Net errors and omissions.
A balancing item. The balance of payments statement employs a double entry system and so in the accounting sense it should always balance. In practice, this seldom occurs due to factors such as the variety of data sources used, the probability that some transactions will not be captured, and the possibility of errors in reporting and compilation. Net errors and omissions (or residual) is used to balance the accounts.
- Net lending to the rest of the world
(national accounts). The residual item for the national capital account. If the nation's savings are insufficient to pay for all capital investment needed for production, the shortfall must be borrowed from overseas. Net lending to the rest of the world is then a negative item.
- Net reproduction rate.
The average number of daughters that a woman would have during her life if she experienced the age-specific fertility and mortality rates of that year.
- New Zealand direct investment abroad.
Investment by New Zealand investors in overseas-located enterprises which meets the direct investment criteria. The balance of payments financial account measures transactions which increase and decrease these investments. The international investment position statement measures the value of this investment at points in time.
- New Zealand residents departing temporarily or returning after a short-term absence.
A New Zealand resident whose absence from New Zealand is intended to be, or was, less than 12 months.
- Not in the labour force.
Any person in the working-age population who is neither employed nor unemployed. For example, this residual category includes: retired persons; persons with personal or family responsibilities such as unpaid housework and childcare; persons attending educational institutions; persons permanently unable to work due to physical or mental disabilities; persons who were temporarily unavailable for work in the survey reference week and persons who are not actively seeking work.
- NZSNA.
New Zealand System of National Accounts.
- Operating expenditure.
Expenditure from the main activities of a unit, usually directly incurred from sales of goods and services. Excludes salaries and wages, interest, donations and extraordinaries.
- Operating income.
Income incurred from the main activities of a unit, usually from the sales of goods and services. Generally excludes extraordinaries, interest, dividends and subsidies.
- Operating surplus
(financial accounts). Surplus or deficit of total income less total expenditure, before direct tax, payments to owners and stock change.
- Other investment.
A residual category encompassing all forms of financial capital not included elsewhere, i.e. direct, portfolio or reserves. Types of capital include trade finance (trade creditor and debtor accounts), loans and deposits.
- Other sectors.
Includes non-financial corporations, insurance companies, pension funds, other non-depository financial intermediaries, private non-profit institutions and households.
- Output
(national accounts). Output represents the value of total production, including intermediate inputs. Deduction of intermediate inputs from output gives value added.
- Overseas trade – exports and imports.
Customs entries relating to goods cleared. Overseas trade statistics show exports valued free on board (fob), and imports valued cost including insurance and freight (cif) and value for duty (vfd).
- Paid employees.
People who have an employment agreement and who receive remuneration for their work in the form of wages, salary, commission, tips, piece rates, or pay in kind.
- Part-time employed.
People who usually work fewer than 30 hours a week.
- Permanent and long-term arrivals.
People who have spent the previous 12 months or more overseas and who have arrived in New Zealand intending to stay 12 months or more.
- Permanent and long-term departures.
People who have spent the previous 12 months or more in New Zealand and who have departed for an intended absence of 12 months or more.
- Population estimate.
Data from the most recent Census of Population and Dwellings updated with estimates of births, deaths and net migration since the census.
- Population projection.
Indication of the future demographic characteristics of a population based on an assessment of past trends and assumptions about the future course of demographic behaviour of fertility, mortality and migration.
- Portfolio investment.
Investment in equity securities of less than 10 percent of the voting stock of an enterprise; and investment in debt securities, such as bonds and notes and money market instruments.
- Provisional
(statistics). Statistics which are derived using preliminary or incomplete data and released before final data becomes available.
- Purchase of non-produced non-financial assets to/from the rest of the world net
(national accounts). This refers to assets (tangible and intangible) that come into existence other than through processes of production. Also included are the costs of ownership transfer on, and major improvements to, such assets.
- Re-exports.
Merchandise exports that were earlier imported into New Zealand and comprise less than 50 percent New Zealand content by value. Examples are computer hardware, machinery and aircraft.
- Re-imports.
Goods, materials or articles imported in the same condition as they were exported from New Zealand. (One-third of New Zealand re-imports are made up of live animals, principally racehorses and dogs).
- Replacement level fertility.
The average number of children a woman needs to have to produce one daughter who survives to childbearing age. It is also described as the total fertility rate required for the population to replace itself, without migration. The internationally accepted replacement level is 2.1 births per woman. It allows for the mortality of females between birth and childbearing and the birth of more boys than girls. On average, throughout the world, 105 boys are born for every 100 girls. The actual replacement level will vary slightly among countries depending on child mortality rates. In countries with high child mortality, the total fertility rate will need to be higher than 2.1 births per woman to achieve replacement level.
- Reserve assets.
External financial assets denominated in foreign currencies that are readily available to, and controlled by, monetary authorities.
- Resident population.
In census statistics, a resident is a person who self-identifies that they usually live in an area. In external migration statistics, a resident is a person who self-identifies on a departure card that they have lived in New Zealand for 12 months or more, and on an arrival card that they live in New Zealand and have been away for less than 12 months and that they intend to stay in New Zealand for 12 months or more.
- Resident population concept.
A statistical basis for a population in terms of those who usually live in a given area at a given time. The census usually resident population count is a census measure, and the estimated resident population is a demographic measure, of the resident population concept.
- Residents and non-residents.
An individual or enterprise is a resident of New Zealand when their centre of economic interest is in New Zealand. Broadly, an individual is resident in New Zealand if they live in New Zealand for one year or more and their general centre of interest is determined to be New Zealand. This can apply to people who spend much of their time outside New Zealand, but still retain ‘permanent’ links with New Zealand. Resident individuals include people whose usual place of living is New Zealand, New Zealanders living, travelling or working abroad for less than a year, New Zealanders living abroad studying, and New Zealand diplomatic or military personal. An entity is resident in New Zealand if it engages in production of goods or services in New Zealand. Resident entities include New Zealand-located subsidiaries of overseas companies and New Zealand-located branches or partnerships of overseas entities. Individuals and entities not regarded as residents of New Zealand are defined as non-residents. Non-resident entities include overseas-located subsidiaries, associates and branches of New Zealand companies.
- Revised
(statistics). In this volume, any data different from that printed in previous editions.
- Rural areas.
Those areas not specifically designated as ‘urban’. They include towns of fewer than 1,000 population plus administrative district territory where this is not included in an urban area. Rural areas include offshore islands.
- Salaries and wages.
Gross earnings during the accounting year of all paid employees (full time, part time and casual). Included are such items as overtime, sick and holiday pay, bonuses, payments under penal-rate schemes, severance pay, value of free supplies and sales commission paid to own employees. Excluded are drawings of working proprietors or partners.
- Sample survey.
A type of survey in which only a representative part of the population of interest provides detailed information. The sample statistics are summarised and are used to estimate statistics for the full population.
- Saving
(national accounts). The residual item in the national income and outlay account. It is the amount of national disposable income left after current spending.
- Seasonal adjustments.
Adjustments made to statistical time series (usually monthly or quarterly) to provide a refined series in which the estimated fluctuations due to seasonal variations have been removed.
- Short term.
Financial instruments with an original maturity of less than one year.
- Statistical discrepancy.
In the New Zealand System of National Accounts, items making up gross domestic product (GDP) and expenditure on GDP are estimated independently, using diverse data sources. The combination of survey and other measurement and timing errors in the various components results in a difference between the estimates, known as the statistical discrepancy.
- Stocks.
Materials such as components, stores, fuels, containers and other packaging materials, as well as finished goods and work in progress, such as goods purchased for resale without further processing.
- Subsidies
(national accounts). Current unrequited payments made by governments to enterprises on the basis of the levels of their production activities, or the quantities or values of the goods and services that they produce, sell or import.
- Taxes on production and imports
(national accounts). Taxes payable on goods and services when they are produced, delivered, sold, transferred or otherwise disposed of by their producers. Also included are taxes and duties on imports that become payable when goods enter the economic territory by crossing the frontier or when services are delivered to resident units by non-resident units. They also include other taxes on production, which consist mainly of taxes on the ownership or use of land, buildings or other assets used in production, or on the labour employed, or compensation of employees paid.
- Total fertility rate.
The average number of live births that a woman would have during her life if she experienced the age-specific fertility rates of a given period (usually a year). It excludes the effect of mortality.
- Trade credits.
Accounts payable to, and prepayments received from, non-residents for imports and exports of goods and services.
- Transfers
(balance of payments). Special counter entries for one-sided transactions such as gifts of goods, services and financial assets.
- Transportation
(balance of payments). Exports and imports of services associated with the international carriage of goods and passengers, including freight, air fares, freight insurance, port services and stevedoring.
- Travel
(balance of payments). The expenditure of foreign travellers in New Zealand and New Zealanders travelling overseas.
- Unemployed.
All people in the working-age population who during the reference week were without a paid job, available for work and had either actively sought work in the past four weeks, or had a new job to start within the next four weeks.
- Unemployment rate.
The number of unemployed people expressed as a percentage of the labour force.
- Urban areas.
Non-administrative areas with urban characteristics and a high to moderate concentration of population. Main, secondary and minor urban areas are differentiated by population size. Urban areas are currently defined on the basis of the 1996 Census usually resident population count as: main urban areas – centres with populations of 30,000 or more; secondary urban areas – centres with populations between 10,000 and 29,999.; minor urban areas – centres with populations of 1,000 or more not already classified as urban.
- vfd
(value for duty). The assessed value of merchandise imports on which duty is based. It approximates the current domestic value of goods in the exporting country.
- Visitor from overseas.
In census statistics, a visitor from overseas is a person who self-identifies that they usually live overseas. In external migration statistics, a visitor from overseas is a person who self-identifies on an arrival card that they intend to stay in New Zealand less than 12 months.
- Vital statistics.
Statistics of events such as births, deaths and marriages which influence the numbers of a population.
- Value added
(national accounts). The value added to goods and services by the contributions of capital and labour (i.e. after the costs of bought-in materials and services have been deducted from the total value of output).
- Working-age population.
Generally refers to the population aged 15 years and over.
All the statistics in this volume are in metric (SI) units, except for ship tonnages (not cargo).
| Metric To Imperial | Metric Multiples | ||
|---|---|---|---|
| Length | |||
| 1 millimetre (mm) | = 0.04 inches (in.) | 1 centimetre (cm) | = 10 millimetres (mm) |
| 1 centimetre (cm) | = 0.39 inches (in.) | 1 metre (m) | = 100 centimetres (cm) |
| 1 metre (m) | =39.37 inches (in.) | 1 metre (m) | = 1 000 metres (m) |
| = 1.09 yards (yds) | |||
| 1 kilometre (km) | = 0.62 miles | ||
| Area | |||
| 1 square metre (m2) | = 10.76 square feet (sq. ft.) | 1 hectare (ha) | = 10 000 square metres (m2) |
| = 1.20 square yards (sq. yd) | 1 square kilometre (km2) | = 100 hectares (ha) | |
| 1 hectare (ha) | 2.47 acres | ||
| 1 square kilometre (km2) | = 247 acres | ||
| = 0.39 square miles | |||
| Volume and capacity | |||
| 1 cubic centimetre (cm3 | = 0.06 cubic inches (cu.in.) | 1 cubic metre (m3) | = million cubic centimetres (cc) |
| 1. cubic metre (m3) | = 35.31 cubic feet (cu. ft.) | 1 litre (l) | = 10 000 000 cubic |
| = 1.31 cubic yards | = 1 millimetres (ml) | 1 cubic centimeter (cc) | |
| 1 litre (l) | = 1.76 pints | 1 cubic metre (cm3) | = 1 000 litres (l) |
| = 0.22 gallons | |||
| Mass (weight) | |||
| 1 gram (g) | 0.04 ounces (oz) | ||
| 1 kilogram (kg) | = 2.20 pounds (lb) | 1 kilogram (kg) | = 1 000 gram (g) |
| 1 tonne (t) | = 2 204.62 pounds (lb) | 1 tonne (t) | = 1 000 kilograms (kg) |
| = 0.98 tons | |||
| Velocity | |||
| 1 kilometre per hour (km/h) | |||
| Pressure | |||
| 1 kilopascal (kPa) | = 0.15 pounds per square inch (psi) | 1 megapascal (MPa) | = 1 000 kilopascals (kPa) |
| 1 megapascal (MPa) | = 0.06 tons per square inch (tons psi) | ||
Temperature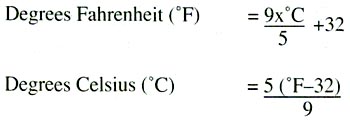 | |||
| Energy | |||
| 1 kilojoule (kJ) | = 0.95 British thermal units (Btu) | 1 megajoule (MJ) | 1 000 kilojoules (kJ) |
| 0.24 calories (cal) | 1 kilowatt hou(kWh) | = 3.6 megajoules (MJ) | |
| 1 gigajoule (GJ) | = 1 000 megajoules (MJ) | ||
| 1 terajoule (TJ) | = 1 000 gigajoules (GJ) | ||
| 1 petajoule (PJ) | = 1 million gigajoules (GJ) | ||
| Power | |||
| 1 kilowatt (kW) | = 1.34 UK horsepower | 1 kilowatt (kW) | = 1 000 watts |
| 1 megawatt (MW) | = 1 000 kilowatts (kW) | ||
| 1 gigawatt (GW) | = 1 000 megawatts (MW) | ||
In all cases in this index, New Zealand has been abbreviated to NZ to save space. Similarly, United Nations has been abbreviated to UN.
Names of organisations starting with National or NZ may also be found in an inverted form (eg String Quartet, NZ), or in a particular subject area (eg Department of Conservation listed under the main heading Conservation).
Ministries, departments, government agencies and other organisations cited in the Yearbook with a Māori name may be accessed by that name.
Acts of parliament are included in the index when there is a major reference.
A
- AANZFTA (ASEAN-Australia/NZ Free Trade Agreement), 56, 57
- Abortion, 159
- Abuse of children, 133
- Academy of Sport, NZ, 257–258
- Access PHOs, 145
- Access radio stations, 227
- Accident Compensation Corporation (ACC), 165–167, 458
- Accident insurance, 165–167
- Accidents
- air, 432, 433
- external causes, 163–164
- injury statistics, collection of, 163
- marine, 431
- occupational safety and health, 168–169
- preschoolers, 164
- prevention, 164–165
- road crashes, 160–162
- water, 163
- Accommodation
- employee count in sector, 355
- tourist, 268
- Accounts
- International accounts
- National accounts
- Accreditation services
- Standards and accreditation services
- Administrative boundaries of NZ, 1
- Adoption services, 135
- Adult and community education, 185
- Advanced Network, 218, 224, 298
- Advertising industry, 230
- Advertising Standards Authority, 230
- Advisory Committee on Assisted Human Reproduction (ACART), 140
- Aerial photography, 318
- Afghanistan, deployment in, 58, 59, 61, 71, 215
- Africa
- development assistance, 61
- relationship with, 58, 59
- AFTA agreement (ASEAN Free Trade Area), 57
- Age
- deaths from external causes by, 164
- age-sex profile, 98–99
- Asian people, 99, 102, 120
- European, 99, 102
- Māori, 99, 102, 111–112
- mortality, 95–96
- Pacific peoples, 99, 102, 117
- projections, 81, 82–83, 84
- first marriage, median age, 92
- age-sex profile, 98–99
- Asian people, 99, 102, 120
- European, 99, 102
- Māori, 99, 102, 111–112
- mortality, 95–96
- Pacific peoples, 99, 102, 117
- projections, 81, 82–83, 84
- labour force participation, 279
- age-sex profile, 98–99
- Asian people, 99, 102, 120
- European, 99, 102
- Māori, 99, 102, 111–112
- mortality, 95–96
- Pacific peoples, 99, 102, 117
- projections, 81, 82–83, 84
- population
- age-sex profile, 98–99
- Asian people, 99, 102, 120
- European, 99, 102
- Māori, 99, 102, 111–112
- mortality, 95–96
- Pacific peoples, 99, 102, 117
- projections, 81, 82–83, 84
- prisoners, 212
- unemployment by, 282, 283
- weekly earnings by, 285
- Aged residential care, 152, 156
- Aggregates, minerals, 407
- AgResearch Ltd, 9, 295
- Agricultural sector
- bees and beekeeping, 370–371
- dairy products, 361, 367, 369, 463–464
- horticultural, 372
- meat, 360–361, 364–365, 464–465
- wine, 375
- wool, 366–367
- farming, 361
- meat exports, 365
- biosecurity, 385
- dairy products, 361, 367, 369, 463–464
- horticultural, 372
- meat, 360–361, 364–365, 464–465
- wine, 375
- wool, 366–367
- farming, 361
- meat exports, 365
- Crop & Food Research, 296
- dairy products, 361, 367, 369, 463–464
- horticultural, 372
- meat, 360–361, 364–365, 464–465
- wine, 375
- wool, 366–367
- farming, 361
- meat exports, 365
- crops, 372–375
- dairy products, 361, 367, 369, 463–464
- horticultural, 372
- meat, 360–361, 364–365, 464–465
- wine, 375
- wool, 366–367
- farming, 361
- meat exports, 365
- current situation and trends, 357–358
- dairy products, 361, 367, 369, 463–464
- horticultural, 372
- meat, 360–361, 364–365, 464–465
- wine, 375
- wool, 366–367
- farming, 361
- meat exports, 365
- dairy industry
- dairy products, 361, 367, 369, 463–464
- horticultural, 372
- meat, 360–361, 364–365, 464–465
- wine, 375
- wool, 366–367
- farming, 361
- meat exports, 365
- deer farming, 332, 360, 361
- dairy products, 361, 367, 369, 463–464
- horticultural, 372
- meat, 360–361, 364–365, 464–465
- wine, 375
- wool, 366–367
- farming, 361
- meat exports, 365
- eggs, 370
- dairy products, 361, 367, 369, 463–464
- horticultural, 372
- meat, 360–361, 364–365, 464–465
- wine, 375
- wool, 366–367
- farming, 361
- meat exports, 365
- employee count in sector, 355
- dairy products, 361, 367, 369, 463–464
- horticultural, 372
- meat, 360–361, 364–365, 464–465
- wine, 375
- wool, 366–367
- farming, 361
- meat exports, 365
- energy use, 393
- dairy products, 361, 367, 369, 463–464
- horticultural, 372
- meat, 360–361, 364–365, 464–465
- wine, 375
- wool, 366–367
- farming, 361
- meat exports, 365
- exports
- dairy products, 361, 367, 369, 463–464
- horticultural, 372
- meat, 360–361, 364–365, 464–465
- wine, 375
- wool, 366–367
- farming, 361
- meat exports, 365
- farm types by number and hectarage, 358
- farming, 361
- meat exports, 365
- foot and mouth disease, 362
- farming, 361
- meat exports, 365
- GATT Uruguay Round, 357, 358
- farming, 361
- meat exports, 365
- GDP and, 342–343, 364
- farming, 361
- meat exports, 365
- generally, 357
- farming, 361
- meat exports, 365
- genetic modification, 357
- farming, 361
- meat exports, 365
- goats
- farming, 361
- meat exports, 365
- horticulture, 372–375
- international policy, 358
- livestock, 360–361
- MAF, 358–359
- meat products, 362–365
- organisations, 358–359
- pastoral agriculture, 359–361
- pigs, 369
- poultry, 370
- prices, 337
- research consortia, 298
- strength of primary sector, 364
- subsidies, 359
- veal, 360–361, 362, 364
- wool, 365–367
- Agriculture and Forestry, Ministry of, 358–359
- AgriQuality NZ Ltd, 359
- Aid
- Defence and security
- Emergency and disaster relief
- International development assistance
- AIDS Foundation, NZ, 152
- Air Force, Royal NZ, 75–76
- Air NZ Ltd, 38
- Air quality, 306, 310
- Air Training Corps, 71
- Air transport
- Civil aviation
- Airports, 433–434
- Alcohol
- consumption, 148
- driving and, 444–445
- sale of, 450–451
- wine industry, 375
- Alcohol Advisory Council of NZ (ALAC), 148
- Alexander Turnbull Library, 239, 240
- Allowances
- disability, 129
- Student Allowance, 179–180
- Animal health services, 359
- Animal species, 11, 12
- Annual holidays, employee entitlements, 273, 274
- Antarctica
- Defence Force assistance, 71–72
- environmental protection, 315
- fisheries, 67, 315
- Operation Antarctica, 71–72
- ozone hole, 7, 9–10
- Ross Dependency, 1, 66–67
- subantarctic islands, conservation in, 321, 324
- treaty system, 66
- Anthems, national, 50
- Antiquities, protection of, 238, 251
- ANZAC (Australian and NZ Army Corps), 15, 66
- ANZCERTA (Closer Economic Relations), 55
- ANZUS Treaty, 55, 69
- Aoraki/Mt Cook, 1
- Aotearoa Fisheries Ltd, 388
- Aotearoa Youth Voices, 123
- APEC (Asia Pacific Economic Cooperation), 55, 479
- Apparel industry, 414
- Apples, 374, 375
- Apprenticeships, 281
- Aquaculture industry, protection of, 308
- Arab-Israeli conflict, 58
- Arabian gulf, deployment in, 71
- Archaeological sites, protection of, 238
- Architecture awards, 424
- Archive
- Archives NZ, 238
- cartoons, 239
- films, 247–248
- Hocken Collections, 240
- radio, 227
- Area of NZ, 1–2
- Argentina, relationship with, 57
- Armed forces
- Defence Force
- Armed offenders squads, 214
- Arms control, 76–77
- Arms, convictions for offences, 204
- Army, NZ, 74–75rmy, NZ, 74–75
- Arrivals and departures, 97–98
- Art galleries, 237
- Artificial aids, 146, 153
- Arts and cultural heritage
- administration, 250–254
- Authors' Fund, 241
- generally, 252–254
- Māori arts, 236
- Archives NZ, 238
- Authors' Fund, 241
- generally, 252–254
- Māori arts, 236
- art galleries, 237
- Authors' Fund, 241
- generally, 252–254
- Māori arts, 236
- Cartoon Archive, 239
- Authors' Fund, 241
- generally, 252–254
- Māori arts, 236
- censorship, 248–249
- Authors' Fund, 241
- generally, 252–254
- Māori arts, 236
- copyright, 249–250
- Authors' Fund, 241
- generally, 252–254
- Māori arts, 236
- Creative NZ
- Authors' Fund, 241
- generally, 252–254
- Māori arts, 236
- employee count in sector, 356
- film and video, 246–248
- government expenditure, 235
- Historic Places Trust, 237–238, 327
- household expenditure, 236
- international residencies, 253
- kiwi sculpture, Berlin zoo, 251
- library services, 239–241
- literature, 241–242
- Matapihi, 237
- Ministry for Culture and Heritage, 250–251
- museums, 236–237
- performing arts, 242–246
- research, 253
- taonga tuku iho, 235–236, 252
- Te Papa Tongarewa, 236–237
- Wild Creations, 253
- workers in sector, 238
- World of Wearable Art, 244
- ASEAN (Association of South-East Asian Nations), 56, 57, 69
- ASEAN-Australia/NZ Free Trade Agreement (AANZFTA), 56, 57
- ASEAN Free Trade Area (AFTA), 57
- ASEAN Regional Forum, 56
- Asia
- Boxing Day 2004
- tsunami, 56, 60
- defence and security, 55, 56, 57
- development assistance, 55, 57, 61
- diplomatic and consular representation, 56
- relationship with, 55–56, 57
- trade with, 55, 56, 57, 477–478, 479
- Asia NZ Foundation (Asia 2000 Foundation), 56
- Asia Pacific Economic Cooperation (APEC), 55, 479
- Asian Development Bank, contributions to, 62
- Asian populationsian population
- age distribution, 99, 102, 120
- ethnicities, 121
- fertility rate, 92
- generally, 56, 83, 84
- geographical distribution, 121
- growth, 101, 102
- migration to NZ, 120
- Assaults
- convictions, 199, 200–201
- on police, 215
- Assets
- international, 354
- privatisation of state assets, 16
- Assisted reproductive technology
- Human assisted reproductive technology
- Associate Judges, list of, 195
- Association of NZ Advertisers (ANZA), 230
- Association of South-East Asian Nations (ASEAN), 56, 57, 69
- Asure NZ Ltd, 359
- Attorney-general, 198
- Auckland region, population growth, 87
- Auctioneers Act 1928, 448
- Auditor-general, 38, 40
- Australia
- ASEAN-Australia/NZ Free Trade Agreement (AANZFTA), 56, 57
- business law coordination, 55
- CER Agreement, 55
- Closer Economic Partnership agreement (AFTA and CER), 57
- defence relationship, 55, 69
- FRANZ arrangement, 53
- ‘open skies’ agreement, 55
- police deployment in, 215
- relationship with, 55
- social security agreements, 132
- trade with, 55, 474–475
- Australia NZ Food Standards Code, 55
- Australia NZ Leadership Forum, 55
- Australian and NZ Army Corps (ANZAC), 15, 66
- Authors' Fund, NZ, 241
- Automobile Association, NZ, 458
- Automobiles
- Motor vehicles
- Avian influenza, pandemic plan, 150
- Aviation
- Civil aviation
- Awards
- architecture, 424
- books, 241–242
- bravery, 36
- EEO Trust, 122
- exporters, 464
- gallantry, 36
- honours, 23, 25
- tourism, 265
B
- Bachelor degrees, 186
- Balance of payments, 348–351
- Ballet, Royal NZ, 244
- Bank notes, 439
- Bankers' Association, NZ, 488
- Banking Ombudsman, 488
- Bankruptcy, 455–456
- Banks and banking
- Financial institutions
- Reserve Bank of NZ
- Beef cattle breeds, 360
- farming, 359
- Meat & Wool NZ, 364
- meat exports, 360–361, 364, 365, 465
- meat products, 362
- number of, 358, 360, 361
- Bees and beekeeping, 370–371
- Benefits and pensions
- Social development
- Bereavement leave, employee entitlements, 274
- Bestselling books, 242
- Bibliography, national, 239
- Bike Wise, 155
- Biketawa Declaration, 53
- Biodiversity, 304–305, 316
- Bioethics Council, 310
- Biosecurity NZ, 305, 358, 385
- Biotechnology strategy, 294
- Bird flu, pandemic plan, 150
- Birds
- Forest & Bird, 327
- kākāpō, 304
- threatened native species, 309
- tui, 309
- Births
- Childbirth
- Births, Deaths and Marriages (BDM) registers, 93
- Blood Service, NZ, 141
- Boarding school bursaries, 178
- Boarding schools, 184
- Boards of trustees, schools, 175
- Books, 241–242ooks, 241–242
- Booksellers NZ, 241–242
- Border operations, 462
- Border security
- counter-terrorism, 77
- Defence Force assistance, 72
- Borrowing
- credit cards, 459–460, 488
- credit contracts and consumer finance, 448–449, 453
- government securities, 490
- housing loans, 421–422
- mortgages, 421–423
- Bosnia, deployment in, 61, 70
- Bougainville, deployment in, 53, 215
- Boxing Day 2004
- tsunami, 56, 60
- BRANZ (Building Research Association of NZ), 298, 458
- Bravery awards, 36
- Brazil, relationship with, 57
- Breast screening, 155
- British sovereignty, 14
- Broadband services
- Internet
- Broadcasting
- Broadcasting Commission (NZ On Air), 222
- Broadcasting Standards Authority, 222
- Māori, 222–223, 236
- policy, 221–222
- radio, 226–227
- television, 221–222, 225–226
- Brunei, free trade agreement with, 410
- Buddhist faith, 104
- Budget, 494–497
- Building and construction
- awards, 424
- expenditure on, 345
- size of, 426
- units authorised, 426
- building authorisations, 425–426
- expenditure on, 345
- size of, 426
- units authorised, 426
- building code, 424–425
- expenditure on, 345
- size of, 426
- units authorised, 426
- construction law, 424–425
- expenditure on, 345
- size of, 426
- units authorised, 426
- employee count in sector, 355
- expenditure on, 345
- size of, 426
- units authorised, 426
- generally, 424
- expenditure on, 345
- size of, 426
- units authorised, 426
- new dwellings
- expenditure on, 345
- size of, 426
- units authorised, 426
- price indexes, 427
- prices, 337
- work put in place, 427
- Building and Housing, Department of, 420–421, 424
- Building exterior maintenance units, 410
- Building Research Association of NZ (BRANZ), 298, 458
- Business
- statistics, 355–356
- visas, long-term, 110
- Business law coordination with Australia, 55
- Business NZ, 275
- Business services, employee count in sector, 356
- Butter, 367
C
- CAB (Citizens Advice Bureau), 136
- Cabinet, 31, 32–33abinet, 31, 32–33
- Cabinet Office, 32
- Cadet forces, 71
- Campbell Island, 1,305
- Canada
- relationship with, 56
- social security agreement with, 132
- Canberra Pact (1944), 55
- Cancer
- control of, 151
- deaths, 158
- screening programmes, 154–155
- Cancer Control Committee, 140
- Cane toads, 305
- Capital account
- International accounts
- National accounts
- Capital formation, 345–346
- Capital Goods Price Index, 427
- Capital stock, 346
- Carbon dioxide emissions, 304, 310, 317
- Greenhouse gas emissions
- Care and protection services, 133–134
- Cargo, overseas, 480–482argo, overseas, 480–482
- Caribbean, relationship with, 57
- Carpet industry, 414
- Cars
- Motor vehicles
- Carter Observatory, 297
- Cartoon Archive, NZ, 239
- Casein, 367
- Casinos, 261, 262, 263
- Cattle
- Beef cattle
- Dairy cows
- Caves, 1, 2
- Cawthron Institute, 297, 298
- CCMAU (Crown Company Monitoring Advisory Unit), 38, 40, 289
- Cellular service providers, 223, 224
- Censorship, 248–249
- Census of Population and Dwellings
- census, 81
- counting the population, 85
- ethnicity question, 101
- population growth, 1858–2001, 80
- rounding and random rounding, 85
- Census of prisoners, 212
- CensusAtSchool project, 188
- Central government
- Government
- Centres of Research Excellence, 298
- CER Agreement (Closer Economic Relations), 55
- Cervical screening, 154–155
- Chamber Music NZ, 243
- Chatham Islands
- Chatham Islands
- Council, 45
- land area, 1
- time zone, 12
- Cheese, 367
- Cheque duty, 503
- Chicken production, 370
- Chief executives, government departments, 39, 493–494
- Chief Justice of NZ, 194
- salary and allowances, 195
- Child abuse, 133
- Child and Youth Mortality Review Committee, 140
- Child Disability Allowance, 129
- Child support payments
- administration of, 505
- collection of, 130
- Child tax credits, 504–505
- Child, Youth and Family adoption services, 135
- care and protection, 133–134
- establishment of, 132
- guiding principles, 133
- social services funding, 136
- youth justice services, 134–135
- Childbirth
- birth rate, 100
- ex-nuptial births, 92, 93
- fertility rate, 80, 91–93
- Human Assisted Reproductive Technology register, 92
- median age of childbearing, 92–93
- registration, 93
- vital statistics, 94
- Childcare centres, 182
- Childcare Subsidy, 128
- Children and young people
- adoption, 135
- Young offenders
- care and protection, 133–134
- Young offenders
- child abuse, 133
- Young offenders
- dental services, 155
- Young offenders
- family group conferences, 134
- Young offenders
- family/whānau agreements, 133–134
- Young offenders
- health services, 155
- Young offenders
- immunisation, 150, 154
- Young offenders
- literacy and numeracy, 172
- Young offenders
- minimum wage, 273
- Young offenders
- offenders
- Young offenders
- preschoolers, accident and injury rates, 164
- sport, 258–259
- Chile, relationship with, 57, 410
- China, trade with, 478
- Chiropractors, 144
- CHOGM (Commonwealth Heads of Government), 64
- Choral Federation, NZ, 244
- Christian denominations, 104
- Christian missionaries, 14
- Chronology of events, c1300–2005, 17–22
- Chunuk Bair, 66
- Churches, religious affiliation and, 104
- Cinema
- Film and video
- Citizens Advice Bureau (CAB), 136
- Citizenship, 104–107itizenship, 104–107
- Civil aviation
- accidents, 433
- aircraft, number of, 432
- airports, 433–434
- airspace capacity, 433
- Airways NZ, 433
- baggage screening, 434
- Civil Aviation Authority, 433
- domestic air services, 434
- flight path management, 433
- full-time equivalent persons working in sector, 432
- generally, 432
- international air services, 434–435
- ‘open skies’ agreement with Australia, 55
- tracking passengers and crews, 434
- Civil Defence and Emergency Management, Ministry of, 6, 167
- Civil legal aid, 198
- Civil unions
- celebrants, 93
- generally, 93
- relationship property legislation, 123
- Clark, Helen, 26
- Clays, 407
- Clerk of the Executive Council, 32
- Clerk of the House of Representatives, 28, 30
- Climate
- changes, 7, 9–10, 304, 306, 315, 316, 317
- climate norms, 8, 9, 11
- extremes, 10
- flooding, 10, 11
- fog, 11
- rain days, 8
- rainfall, 8, 9, 10, 11
- sunshine hours, 8, 10
- temperatures, 8, 9–10, 11
- tornadoes, 11
- weather in 2005, 11
- wind, 9
- Clinical dental technicians, 145
- Clinical Training Agency, 139
- Closer Defence Relations, 55, 69
- Closer Economic Partnership agreement (AFTA and CER), 57
- Closer Economic Relations (CER), 55
- Clothing industry, 414
- Clutha River, 1
- Coal, 309, 313, 395, 402–404, 406
- Coalition government, 28
- Coastal environment
- foreshore and seabed, 320
- length of coastline, 1, 2
- Queen's Chain, 325
- water quality, 307
- Coastal shipping, 429, 430
- Coat of arms, 48
- Coins, 489
- Colleges of Education
- governance, 175
- number of, 38
- Colonial government, 14
- Commerce and services
- Auctioneers Act 1928, 448
- cheque duty, 503
- Commerce Act 1986,452
- Commerce Commission, 452–453
- companies, 451
- consumer affairs, 448–450
- corruption, international comparisons, 453
- Credit (Repossession) Act 1997, 449
- Credit Contracts and Consumer Finance Act 2003, 448–449, 453
- Dairy Industry Restructuring Act 2001, 453
- Door to Door Sales Act 1967, 449
- Electricity Industry Reform Act 1998, 453
- Fair Trading Act 1986, 448, 452–453
- insolvency, 455–456
- insurance industry, 456–458
- Layby Sales Act 1971, 449
- legal environment, generally, 447
- Motor Vehicle Sales Act 2003, 449
- NZX Gross index, 454
- partnerships, 451
- sale of liquor, 450–451
- Securities Commission, 454
- Serious Fraud Office, 453
- shop trading hours, 450
- stock exchange, 454–455
- Takeovers Panel, 454
- Telecommunications Act 2001, 453
- trading controls, 448–451
- Unsolicited Goods and Services Act 1975, 449
- Weights and Measures Act 1987, 448
- Commissioner of Police, 214
- Commodities, exports and imports
- Exports and imports
- Commonwealth, 64
- Commonwealth Heads of Government (CHOGM), 64
- Commonwealth of Independent States, relationship with, 58
- Communicable disease control, 150
- Communication Agencies Association of NZ (CAANZ), 230
- Communications
- advertising, 230
- carriers, 223–224
- relay service, 224
- services, 223–224
- broadcasting policy, 221–222
- carriers, 223–224
- relay service, 224
- services, 223–224
- Digital Strategy, 217–218
- carriers, 223–224
- relay service, 224
- services, 223–224
- employee count in sector, 356
- carriers, 223–224
- relay service, 224
- services, 223–224
- generally, 217–218
- carriers, 223–224
- relay service, 224
- services, 223–224
- internet
- carriers, 223–224
- relay service, 224
- services, 223–224
- mobile service providers, 223, 224
- carriers, 223–224
- relay service, 224
- services, 223–224
- newspapers, 228–229
- carriers, 223–224
- relay service, 224
- services, 223–224
- postal services, 231–233
- carriers, 223–224
- relay service, 224
- services, 223–224
- radio, 226–227
- carriers, 223–224
- relay service, 224
- services, 223–224
- telecommunications
- carriers, 223–224
- relay service, 224
- services, 223–224
- television, 221–222, 225–226
- wireless service providers, 223
- Community and voluntary sector
- employee count in sector, 356
- Family and Community Services, 133
- Office for the Community and Voluntary Sector, 125, 132
- police and, 216
- public health services, 152
- social services funding, 136
- sport and recreation, 255
- youth development programmes and services, 123
- Community-based sentences, 208–209
- Community boards, 46
- Community constables, 216
- Community education, 185
- Community law centres, 198
- Community Services Card, 129
- Companies
- generally, 451
- liquidation, 456
- receiverships, 456
- registrations, 451
- taxation, 501
- Computers
- High Performance Computing Centres, 224
- number per capita, 218
- Concert FM, 227
- Conservation
- biodiversity, 304–305, 316
- conservation boards, 327
- land administered by, 321
- national parks and reserves, 322–327
- recreation promotion, 259
- Department of Conservation
- conservation boards, 327
- land administered by, 321
- national parks and reserves, 322–327
- recreation promotion, 259
- forest funds, 326–327
- Kākāpō, 305
- non-government organisations, 328
- Protected Natural Areas Programme, 326
- tourism and, 269
- Wild Creations, 253
- Conservation Authority, NZ, 327
- Conservation Corps, NZ, 123, 124
- Consolidated accounts
- National accounts
- Constables, community, 216
- Constitution
- British sovereignty, 14
- Declaration of Independence, 1835, 23
- electoral system, 25
- executive, role of, 193
- governor-general, 24
- history, 23
- judiciary, role of, 193
- nature of, 23
- parliament, role of, 193
- parliamentary tradition, 25
- Premiers and Prime Ministers, 26
- Queen of NZ, 23, 193
- separation of powers, 193
- sources of, 23–24
- Construction
- Building and construction
- Consular representation
- Diplomatic and consular representation
- Consumer affairs, 448–450
- Consumer Affairs, Ministry of, 449–450
- Consumer finance, regulation of, 448–449, 453
- Consumer Guarantees Act 1993, 448
- Consumers' Institute, 450
- Consumers Price Index (CPI)
- Prices
- Contaminated sites, 315
- Contracts, indexation of, 333–334ontracts, indexation of, 333–334
- Controller and Auditor-General, 38, 40
- Convention on the Conservation and Management of Highly Migratory Fish Stocks in the Western and Central Pacific Ocean (WCPFC), 52
- Convictions
- Criminal justice
- Cook Islands
- migration to NZ from, 119
- special relationship with, 51–52
- Cook, James, 13
- Cook Strait inter-island ferries, 430
- Copyright, 249–250, 299
- Coroner's Court, 197
- Corrections system
- community-based sentences, 208–209
- Community Probation Service, 208
- courtroom custodial services, 207
- crime reduction, 207
- Department of Corrections, 207
- extended supervision orders, 209
- home detention, 209
- imprisonment rates, 194
- parole, 209, 211–212
- prisoner escort services, 207
- prisoners, 211–212
- Probation and Offender Services, 208–209
- proceeds of crime, 210–211
- Psychological Service, 208
- Public Prisons Service, 209–210
- restorative justice scheme, 201
- sentence of imprisonment, 211
- victims' rights, 211
- Correspondence School, The, 184
- Corruption, international comparisons, 453
- Council for International Development, 61
- Council of Trade Unions, NZ, 275
- Counter-terrorism, 68, 77
- Court of Appeal
- generally, 194
- Judges, 195
- Courtroom custodial services, 207
- Courts system, 194–197
- CPI (Consumers Price Index)
- Prices
- Craft/Object Art Fellowship, 253
- Creative NZ
- Authors' Fund, 241
- generally, 252–254
- Māori arts, 236
- Credit cards, 459–460, 488
- Credit Contracts and Consumer Finance Act 2003, 448–449, 453
- Credit rating, 496
- Credit Reporting Privacy Code 2004, 42
- Credit (Repossession) Act 1997, 449
- Crime
- proceeds of, 210–211
- reduction, 207
- Criminal Investigation Branch, NZ Police, 215
- Criminal justice
- convictions, 199–205
- arms, 204
- Young offenders
- by offence type, 199–200
- Young offenders
- dog control, 204
- Young offenders
- driving/traffic, 202–203, 213, 446
- Young offenders
- drug offences, 202
- Young offenders
- fisheries, 204
- Young offenders
- liquor licensing, 204
- Young offenders
- miscellaneous, 204
- Young offenders
- motor vehicle conversion, 203
- Young offenders
- offences against administration of justice, 203
- Young offenders
- offences against good order, 204
- Young offenders
- other offences against the person, 201
- Young offenders
- property offences, 201
- Young offenders
- tax-related, 204
- Young offenders
- violent offences, 200–201
- Young offenders
- DNA profiles, 204
- Young offenders
- fines, enforcement of, 206
- Young offenders
- fingerprints, 204
- Young offenders
- legal aid, 198
- Young offenders
- offences recorded and resolved, 199
- Young offenders
- proceeds of crime, 210–211
- Young offenders
- protection orders, 204
- Young offenders
- sentences and sentencing, 205–206, 208–209, 211
- Young offenders
- Victim Support, 206–207
- Young offenders
- young offenders
- Young offenders
- CRIs (Crown Research Institutes), 295–297
- Crop & Food Research, 296
- Crown Company Monitoring Advisory Unit (CCMAU), 38, 40, 289
- Crown entities, 37
- Crown Forestry Group, 359
- Crown Law Office, 198–199
- Crown-owned land, 320–321
- Crown-owned minerals, 405
- Crown Research Institutes (CRIs), 37, 295–297
- Cultural heritage
- Arts and cultural heritage
- Culture and Heritage, Ministry for, 250–251
- Currency
- Money
- Current account
- International accounts
- Curriculum, schools, 171–172
- Customs and excise, 462, 502–503
- Customs Service, NZ
- border security, 434, 462
- censorship law, enforcement of, 249
- drug seizures, 215
- Cycling, 155, 260, 438
D
- Dairy Companies Association of NZ, 368
- Dairy cowsairy cows
- breeds, 361
- dairy organisations, 368–369
- exported products, 361, 367, 369
- farming, 357, 359
- Fonterra, 367, 368
- methane gas emissions, 9
- milk production and processing, 357–358, 367–369
- number of, 360, 361
- product prices, 337
- Dairy Industry Restructuring Act 2001, 453
- Dance
- NZ School of Dance, 244
- Royal NZ Ballet, 244
- Day education and care services, 182–183
- Daylight saving, 12
- De facto relationships
- generally, 92
- relationship property legislation, 123
- Deaths
- air accidents, 432
- cancer, 158
- Defence Force personnel in UN missions, 71
- drownings, 163
- earthquakes, 4
- external causes, 163–164
- major causes, 157
- notification, 93
- road accidents, 161–162
- suicides, 152–153
- volcanic areas, 7
- workplace fatalities, 169
- Debt
- government debt instruments, 490
- public, 331, 507–508
- Declaration of Independence, 1835, 23, 49
- Deep sea fishing, 386
- Deep sea volcanoes, 7
- Deer farming, 358, 360, 361
- Defence and security
- Africa, 58, 59
- Defence Force
- ANZUS treaty, 69
- Defence Force
- Asia, 55, 56, 57
- Defence Force
- Australia, relationship with, 55, 69
- Defence Force
- counter-terrorism, 68, 77
- Defence Force
- disarmament, 76–77
- Defence Force
- employee count in sector, 356
- Defence Force
- expenditure, 72
- Defence Force
- intelligence and security, 77–78
- Defence Force
- Middle East, 58–59
- Defence Force
- NZ Defence Force
- Defence Force
- Pacific region, 53, 69
- personnel, number of, 73
- policy, 67–68
- UN, involvement in, 61, 62
- UN Security Council, 61
- United States, relationship with, 56, 69
- Defence Force
- Air force, 75–76
- Army, 74–75
- casualties, overseas, 71
- community assistance, 71–72
- emergency and disaster relief, 71
- gallantry awards, 36
- hydrographic survey work for, 73
- international relationships, 69–70
- locations, NZ, 68
- Mutual Assistance Programme, 69, 70
- Navy, 73–74
- Operation Antarctica, 71–72
- personnel constituting, 67
- policy, 68
- Defence, Ministry of, 67
- Demography
- Asian population, 120–121
- Māori, 111–114
- Pacific peoples, 117–119
- Denmark, social security agreement with, 132
- Dental care, subsidised services, 146
- Dental health services, 155
- Dental research, 156
- Dental technicians, 145
- Dental therapists and hygienists, 57
- Dentists, 143
- Department of Building and Housing, 420–421, 424
- Department of Conservation
- Conservation
- Department of Corrections
- Corrections system
- Departments, generally
- State sector
- Departures and arrivals, 97–98
- Deportation, 111
- Depression era, 15
- Designated character schools, 184
- Designs, registration of, 299
- Detached Hydrographic Survey Unit, 73
- Development assistance (aid)
- International development assistance
- Development Resource Centre (Dev-Zone), 61
- Dictionary of NZ Biography, 251
- Didymo, 305
- Dietary supplements, regulation of, 151
- Dietitians, 144
- Digital Strategy, 217–218
- Diplomatic and consular representation, 54
- Asia, 56
- European Union, 58
- Middle East, 59
- military representatives, 69–70
- North Africa, 59
- Pacific region, 51
- Russia and CIS, 58
- Director of Human Rights Proceedings, 42, 43, 122
- Disabled people
- advisory committee, 140
- Child Disability Allowance, 129
- Disability Allowance, 129
- environmental support services, 146, 153
- Office for Disability Issues, 125, 129
- special education policy, 174
- sport and physical recreation, 258
- support services, 153
- Disarmament, 76–77
- Disaster insurance, 457
- Disaster relief
- Emergency and disaster relief
- Discovery of NZ, 13–14
- Discrimination, 42, 122, 274–275
- Disease
- communicable disease control, 150
- immunisation, 150, 154
- occupational disease notifications, 169
- Dispensing opticians, 144
- Disputes tribunals, 197
- District courts
- generally, 194
- list of, 195
- salaries and allowances, 195
- Judges
- list of, 195
- salaries and allowances, 195
- District health boards, 139–140
- DNA Profile Databank, 204
- Doctors, 142–143
- Dogs
- dog control offence convictions, 204
- police, 215
- Doha Development Round (WTO), 63, 317, 357, 358
- Dolomite, 407
- Domain names, 219
- Domestic air services, 434
- Domestic Purposes Benefit (DPB), 126, 127, 128, 130, 131
- Domestic retail trade
- Retail trade and services
- Domestic violence
- immigration and, 111
- legislation, 123
- Door to Door Sales Act 1967, 449
- Double tax agreements, 504
- DPB
- Domestic Purposes Benefit (DPB)
- Drama School, NZ, 244–245
- Drinking water, 147
- Driving
- alcohol impairment, 444–445
- convictions for offences, 202–203
- licences, 444
- motor vehicle running costs, 443
- offences, 213
- seat belts, 444
- speed cameras, 215
- speed limits, 445
- traffic offences and infringements, 202–203, 213, 445–446
- Drownings, 163
- Drug Intelligence Bureau, 215
- Drugs
- misuse, 147
- offences, 202, 213
- prescription charges, 145, 146
- seizures, 215
- Duties (tax), 462, 502–503
- Duty solicitor scheme, 198
- Dwellings
- Housing
E
- E-commerce, 221
- E-Government Unit, 220-Government Unit, 220
- EAB (External Assessments Bureau), 78
- Early childhood education
- administration, 177
- attendance, 182
- curriculum, 181
- enrolments, 191–192
- full-time equivalent teaching staff, 190
- funding, 177
- institutions, number of, 191–192
- licensing, 181–182
- Māori language, 182
- Pacific children, 177, 182
- physical activity, 258
- providers, 182–183
- services, 181–189
- Te Whāriki, 181
- Earthquake Commission (EQC), 5, 6, 7, 457
- Earthquakes, 3, 4, 5–6arthquakes, 3, 4, 5–6
- East Asia Summit, 56, 57
- East Timor, deployment in, 61, 69, 70
- E-commerce, 221
- Economic Development, Ministry of, 411
- Economic research, 291–292
- Economy
- business statistics, 355–356
- key market rates, 490
- International accounts
- National accounts
- Prices
- monetary policy and, 332, 490
- International accounts
- National accounts
- Prices
- mortgages and, 423
- International accounts
- National accounts
- Prices
- exchange rates, 330, 332, 491
- key market rates, 490
- International accounts
- National accounts
- Prices
- monetary policy and, 332, 490
- International accounts
- National accounts
- Prices
- mortgages and, 423
- International accounts
- National accounts
- Prices
- fiscal indicators, 331
- key market rates, 490
- International accounts
- National accounts
- Prices
- monetary policy and, 332, 490
- International accounts
- National accounts
- Prices
- mortgages and, 423
- International accounts
- National accounts
- Prices
- fiscal policy, 330–331
- key market rates, 490
- International accounts
- National accounts
- Prices
- monetary policy and, 332, 490
- International accounts
- National accounts
- Prices
- mortgages and, 423
- International accounts
- National accounts
- Prices
- foreign currency credit rating, 496
- key market rates, 490
- International accounts
- National accounts
- Prices
- monetary policy and, 332, 490
- International accounts
- National accounts
- Prices
- mortgages and, 423
- International accounts
- National accounts
- Prices
- GDP per capita, 330
- key market rates, 490
- International accounts
- National accounts
- Prices
- monetary policy and, 332, 490
- International accounts
- National accounts
- Prices
- mortgages and, 423
- International accounts
- National accounts
- Prices
- generally, 329
- key market rates, 490
- International accounts
- National accounts
- Prices
- monetary policy and, 332, 490
- International accounts
- National accounts
- Prices
- mortgages and, 423
- International accounts
- National accounts
- Prices
- growth rate, 329, 330
- key market rates, 490
- International accounts
- National accounts
- Prices
- monetary policy and, 332, 490
- International accounts
- National accounts
- Prices
- mortgages and, 423
- International accounts
- National accounts
- Prices
- inflation rate, 330, 336
- key market rates, 490
- International accounts
- National accounts
- Prices
- monetary policy and, 332, 490
- International accounts
- National accounts
- Prices
- mortgages and, 423
- International accounts
- National accounts
- Prices
- inflation target, 331
- key market rates, 490
- International accounts
- National accounts
- Prices
- monetary policy and, 332, 490
- International accounts
- National accounts
- Prices
- mortgages and, 423
- International accounts
- National accounts
- Prices
- interest rates
- key market rates, 490
- International accounts
- National accounts
- Prices
- monetary policy and, 332, 490
- International accounts
- National accounts
- Prices
- mortgages and, 423
- International accounts
- National accounts
- Prices
- international accounts
- International accounts
- National accounts
- Prices
- monetary policy, 331–332, 334, 489–490
- National accounts
- Prices
- national accounts
- National accounts
- Prices
- net debt, 331
- Prices
- net worth, 331
- Prices
- Official Cash Rate, 332, 334, 490
- Prices
- operating balance, 331
- Prices
- prices
- Prices
- public debt, 331, 507–508
- recent developments, 330
- reforms of 1980s, 329
- Education
- administration, 174–176
- Schools
- Early
- Tertiary education
- Advanced Network, 218, 224, 298
- Schools
- Early
- Tertiary education
- boards of trustees, 175
- Schools
- Early
- Tertiary education
- compulsory schooling
- Schools
- Early
- Tertiary education
- curriculum, 171–172
- Early
- Tertiary education
- early childhood education
- Early
- Tertiary education
- childhood education
- Tertiary education
- Education Review Office, 174–175
- Tertiary education
- funding, 177–181
- Tertiary education
- High Performance Computing Centres, 224
- Tertiary education
- international students, 189–190
- Tertiary education
- Learning Media Ltd, 176
- Tertiary education
- literacy and numeracy, 172
- Tertiary education
- Māori, 181
- Tertiary education
- National Qualifications Framework, 172–174
- Tertiary education
- NCEA, 173–174, 185
- Tertiary education
- NZ Qualifications Authority, 175
- Tertiary education
- NZ Scholarship, 174, 185
- Tertiary education
- NZ Teachers' Council, 175
- Tertiary education
- Project PROBE, 217
- Tertiary education
- Rural Education Activities Programme, 180–181
- Tertiary education
- school age population, 82–83, 174
- Tertiary education
- School Journal, 176
- Tertiary education
- services, 181–189
- Tertiary education
- special education policy, 174
- Tertiary education
- teacher registration, 175
- Tertiary education
- tertiary councils, 175
- Tertiary education
- tertiary education
- Tertiary education
- unemployment by level of attainment, 282, 283
- Education and care services, 182–183
- Education, Ministry of, 174
- Education Review Office (ERO), 174–175
- EEO Trust, 122
- Eggs, 370
- E-Government Unit, 220-Government Unit, 220
- Egypt, deployment in, 58, 61, 70
- Elderly people
- Older people
- Elections
- local government, 47
- observer missions overseas, 64
- parliamentary
- Parliamentary elections
- Electrical machinery
- exports, 469–470
- imports, 471–472
- Electricity, 391, 392, 395–397
- employee count in sector, 355
- Electricity Commission, 397
- Electricity Industry Reform Act 1998, 453
- Electronic commerce, 221
- Elizabeth II, Queen, 23, 193
- Internet
- Embassies, overseas, 54, 58, 59
- Emblems, national, 47
- Emergency and disaster relief
- civil defence, 6, 167
- NZAID programmes and expenditure, 60, 61
- Pacific region, 53, 60, 61
- Defence Force assistance, 71
- NZAID programmes and expenditure, 60, 61
- Pacific region, 53, 60, 61
- insurance, 457
- NZAID programmes and expenditure, 60, 61
- Pacific region, 53, 60, 61
- overseas
- NZAID programmes and expenditure, 60, 61
- Pacific region, 53, 60, 61
- Emergency hospital treatment, 156
- Emissions
- Air quality
- Greenhouse gas emissions
- Employment
- assistance, 283, 284–285
- bereavement leave, 274
- civil aviation sector, 432
- discrimination, 274–275
- EEO Trust, 122
- employee count by sector, 355–356
- employers' advocacy, 275
- equal employment opportunities, 274–275
- health and safety, 168–169
- holidays, 273–274
- hours of work, 273
- insurance industry, 356, 458
- labour relations, 271–273, 276–277
- legal framework, 271–275
- manufacturing sector, 355, 412–413, 415
- minimum entitlements, 273–274
- minimum wage, 273
- Modern Apprenticeships, 281
- parental leave, 274
- PAYE, 500
- Quarterly Employment Survey, 355
- sick leave, 274
- smoke-free workplaces, 149
- teaching staff, 190
- union membership, 275
- work permits, 109–110
- work stoppages, 276–277
- workers' advocacy, 275
- working-age population, 82
- Employment Court
- generally, 196
- Judges' salaries and allowances, 195
- Employment Relations Act 2000, 271–272
- Employment Relations Authority, 273
- Employment Relations Service, 273
- Encyclopedia of NZ (Te Ara), 16, 251
- Energy
- coal, 309, 313, 395, 402–404, 406
- employee count in sector, 355
- consumer demand, 391
- employee count in sector, 355
- consumption, 392–393
- employee count in sector, 355
- electricity, 391, 392, 395–397
- employee count in sector, 355
- Energy Safety Service, 449–450
- environment and, 308, 395
- gas, 391, 395, 400–401
- geothermal, 395, 404
- greenhouse gas emissions, 395
- high temperature superconductivity, 395
- hydro, 395, 404
- hydrogen, 405
- national strategy, 391–392
- oil, 391, 397–400
- petroleum exploration, 313, 391
- prices, 337
- renewables, 310, 395, 404–405
- research and development, 395
- self-sufficiency, 394
- solar, 405
- sources, 308
- supply, 392, 394
- supply and demand balance, 393
- usage by fuel type, 308
- wind energy, 405
- Energy Safety Service, 449–450
- Environment
- air quality, 306, 310
- Environment, 38, 43
- biodiversity, 304–305, 316
- Environment, 38, 43
- biosecurity, 305
- Environment, 38, 43
- climate change, 7, 9–10, 306, 315, 316, 317
- Environment, 38, 43
- coastal
- Environment, 38, 43
- emissions of carbon dioxide, 304
- Environment, 38, 43
- energy and, 308, 395
- Environment, 38, 43
- forest funds, 326–327
- Environment, 38, 43
- forest parks, 325
- Environment, 38, 43
- generally, 303
- Environment, 38, 43
- genetic modification, 357
- Environment, 38, 43
- hazardous substances, 313
- Environment, 38, 43
- international coordination, 311
- Environment, 38, 43
- international initiatives, 315, 316–317
- Environment, 38, 43
- land use, 303, 311
- Environment, 38, 43
- marine environment, 307–308, 431
- Environment, 38, 43
- marine reserves and parks, 326
- Environment, 38, 43
- MFAT, role of, 311, 315
- Environment, 38, 43
- minerals, 308–309, 313
- Environment, 38, 43
- national parks, 322–323
- Environment, 38, 43
- new organisms, 313
- Environment, 38, 43
- ozone layer, 7, 9–10, 306–307, 315
- Environment, 38, 43
- Parliamentary Commissioner for the
- Environment, 38, 43
- protected areas, OECD comparisons, 304
- Protected Natural Areas Programme, 326
- Queen's Chain, 325
- reserves, 325
- soil quality, 309–310
- sustainable development, 310
- tourism and, 269
- trade and, 317
- water quality, 307
- whale sanctuaries, 325–326
- World Heritage Areas, 324–325
- Environment and Conservation Organisations of NZ (ECO), 328
- Environment Court
- generally, 197
- Judges' salaries and allowances, 195
- Environmental research funding, 292
- Environmental Risk Management Authority (ERMA), 313
- Environmental Science and Research (ESR), 297
- Environmental support services for disabled people, 146, 153
- Equal employment opportunities (EEO), 274–275
- Equal Employment Opportunities Commissioner, 122
- Equal Employment Opportunities (EEO) Trust, 122
- ERMA (Environmental Risk Management Authority), 313
- ERO (Education Review Office), 174–175
- Esplanade reserves, 325
- ESR (Environmental Science & Research), 297
- Estate administration, Public Trust, 44
- Ethics Committee on Assisted Reproductive Technology, 140
- Ethnic Affairs, Office of, 119
- Ethnic groups
- age distribution, 102
- attainment, 183
- by year of schooling, 184
- Asian
- attainment, 183
- by year of schooling, 184
- census question, 101
- attainment, 183
- by year of schooling, 184
- composition of population, generally, 83–84, 101–102
- attainment, 183
- by year of schooling, 184
- convicted offenders, 204
- attainment, 183
- by year of schooling, 184
- country of birth, 103
- attainment, 183
- by year of schooling, 184
- European
- attainment, 183
- by year of schooling, 184
- life expectancy, 95
- attainment, 183
- by year of schooling, 184
- Māori
- attainment, 183
- by year of schooling, 184
- Modern Apprenticeships, 281
- attainment, 183
- by year of schooling, 184
- Pacific peoples
- attainment, 183
- by year of schooling, 184
- population projections, 84
- attainment, 183
- by year of schooling, 184
- school leavers
- attainment, 183
- by year of schooling, 184
- unemployment, 284
- Europe, relationship with, 57–58
- European ethnic group
- convicted offenders, 204
- age distribution, 99, 102
- census of 1871, 15
- fertility rate, 92
- growth, 99, 100
- projections, 84
- proportion of total, 84
- population
- age distribution, 99, 102
- census of 1871, 15
- fertility rate, 92
- growth, 99, 100
- projections, 84
- proportion of total, 84
- unemployment, 284
- European Union (EU), 57–58, 479
- European Union Force Command (Bosnia), 61, 70
- Events, c1300–2005, 17–22
- Ex-nuptial births, 92, 93
- Exchange rates, 330, 332, 491
- Excise duty, 502–503
- Exclusive Economic Zone, 385, 386
- Executive governmentxecutive government
- cabinet, 31, 32–33
- Executive Council, 31, 32
- function, 193
- make up of, 33
- ministers, appointment of, 31
- Exercise
- Sport and physical recreation
- Exports and imports
- annual percentage change in value, 347
- coal, 403
- dairy products, 361, 367, 369, 463–464
- forest products, 382–383, 465–466
- fruit, 372, 466–467
- horticultural exports, 372
- information technology goods and services, 221
- machinery, 469–470
- major commodities, 463
- marine industry, 414–415
- meat, 360–361, 364–365, 464–465
- minerals, 406
- nuts, 466–467
- oil, 399
- plastics, 414
- seafood, 389–390, 467–469
- seeds, 372, 373
- textiles, 414
- vegetables, 372, 466–467
- wine, 375
- wool, 366–367, 414
- machinery, 471–472
- major commodities, 471
- mineral fuels, 473
- oil, 399
- vehicles, 472
- balance of, 463
- by country grouping, 479–480
- countries of destination and origin, 474
- award winners, 464
- coal, 403
- dairy products, 361, 367, 369, 463–464
- forest products, 382–383, 465–466
- fruit, 372, 466–467
- horticultural exports, 372
- information technology goods and services, 221
- machinery, 469–470
- major commodities, 463
- marine industry, 414–415
- meat, 360–361, 364–365, 464–465
- minerals, 406
- nuts, 466–467
- oil, 399
- plastics, 414
- seafood, 389–390, 467–469
- seeds, 372, 373
- textiles, 414
- vegetables, 372, 466–467
- wine, 375
- wool, 366–367, 414
- machinery, 471–472
- major commodities, 471
- mineral fuels, 473
- oil, 399
- vehicles, 472
- balance of, 463
- by country grouping, 479–480
- countries of destination and origin, 474
- balance of payments, 348–351
- coal, 403
- dairy products, 361, 367, 369, 463–464
- forest products, 382–383, 465–466
- fruit, 372, 466–467
- horticultural exports, 372
- information technology goods and services, 221
- machinery, 469–470
- major commodities, 463
- marine industry, 414–415
- meat, 360–361, 364–365, 464–465
- minerals, 406
- nuts, 466–467
- oil, 399
- plastics, 414
- seafood, 389–390, 467–469
- seeds, 372, 373
- textiles, 414
- vegetables, 372, 466–467
- wine, 375
- wool, 366–367, 414
- machinery, 471–472
- major commodities, 471
- mineral fuels, 473
- oil, 399
- vehicles, 472
- balance of, 463
- by country grouping, 479–480
- countries of destination and origin, 474
- exported goods and services
- coal, 403
- dairy products, 361, 367, 369, 463–464
- forest products, 382–383, 465–466
- fruit, 372, 466–467
- horticultural exports, 372
- information technology goods and services, 221
- machinery, 469–470
- major commodities, 463
- marine industry, 414–415
- meat, 360–361, 364–365, 464–465
- minerals, 406
- nuts, 466–467
- oil, 399
- plastics, 414
- seafood, 389–390, 467–469
- seeds, 372, 373
- textiles, 414
- vegetables, 372, 466–467
- wine, 375
- wool, 366–367, 414
- machinery, 471–472
- major commodities, 471
- mineral fuels, 473
- oil, 399
- vehicles, 472
- balance of, 463
- by country grouping, 479–480
- countries of destination and origin, 474
- imported goods and services
- machinery, 471–472
- major commodities, 471
- mineral fuels, 473
- oil, 399
- vehicles, 472
- balance of, 463
- by country grouping, 479–480
- countries of destination and origin, 474
- merchandise trade
- balance of, 463
- by country grouping, 479–480
- countries of destination and origin, 474
- values of goods and services, 346–347
- External Assessments Bureau (EAB), 78
- External migration, 96–97
- Immigration
- External trade
- Exports and imports
- Overseas trade
- Extinct species, 11, 12
F
- Fair Trading Act 1986, 448, 452–453
- Families
- definition, 85
- health of, 153
- issues, 123
- population projections, 85
- Family and Community Services, 133
- Family assistance provisions, 128–129
- Family Benefit, 130, 131
- Family Court
- generally, 196
- Judges' salaries and allowances, 195
- Family group conferences, 134
- Family Planning Association, NZ, 152
- Family Support, 128
- Family tax credits, 504–505
- Family/whānau agreements, 133–134
- Farming
- Agricultural sector
- Farra Engineering Ltd, 410
- Feature films, 246
- Federated Mountain Clubs, 328
- Ferries, inter-island, 430
- Fertility rate
- generally, 80, 91–93
- Māori, 114
- Fetal mortality rate, 158
- Fiji
- migration to NZ from, 119
- police deployment in, 215
- Film and Literature Board of Review, 248
- Film and video
- censorship, 248–249
- cinema admissions, 247
- distribution and exhibition, 247
- feature films, 246
- Film Archive, 247–248
- Film Commission, 247
- Film and Video Labelling Body, 248
- Finance
- local government, 47–48
- Government finance
- public sector
- Government finance
- Financial Account
- International accounts
- Financial Action Task Force (FATF), 65
- Financial institutions
- Asian Development Bank, contributions to, 62
- Reserve Bank of NZ
- Banking Ombudsman, 488
- Reserve Bank of NZ
- banking services, 487–488
- Reserve Bank of NZ
- cashless society, 487
- Reserve Bank of NZ
- categories of deposit-taking institutions, 485–486
- Reserve Bank of NZ
- employee count in sector, 356
- Reserve Bank of NZ
- generally, 483
- Reserve Bank of NZ
- international, 62, 64
- Reserve Bank of NZ
- other deposit-taking institutions, 488–489
- Reserve Bank of NZ
- ownership of banks, 484
- Reserve Bank of NZ
- registered banks, 483, 486–488
- Reserve Bank of NZ
- Reserve Bank of NZ
- Reserve Bank of NZ
- World Bank, 62, 64
- Fines, 206
- Fingerprints, 204
- Fire brigades, incidences attended by, 168
- Fire protection and control, state areas, 326
- Fire Service, 167
- Fire Service Commission, 167, 458
- Firearms, convictions for offences, 204
- First past the post (FPP) voting system, 28
- Fiscal indicators, 331
- Fiscal policy, 330–331
- Fish, 11
- Fish and game councils, 37, 327
- Fishing and fisheries
- Antarctica, 67, 315
- generally, 386
- Pacific region, 52
- quota management, 386–387
- convictions for offences, 204
- generally, 386
- Pacific region, 52
- quota management, 386–387
- deep sea, 386
- generally, 386
- Pacific region, 52
- quota management, 386–387
- employee count in sector, 355
- generally, 386
- Pacific region, 52
- quota management, 386–387
- energy use, 393
- generally, 386
- Pacific region, 52
- quota management, 386–387
- exclusive economic zone, 385, 386
- generally, 386
- Pacific region, 52
- quota management, 386–387
- management
- generally, 386
- Pacific region, 52
- quota management, 386–387
- Māori interests, 388
- NZ control, 389
- protection, Defence Force assistance, 71
- recreational fishing, 259
- registered commercial vessels, 389
- resources, 385
- seafood exports, 389–390, 467–469
- Five Power Defence Arrangements, 56, 67, 69
- Fixed capital formation, 345–346
- Flags
- first, 49
- national, 48
- Flooding, 10, 11
- Fluoridation of water, 156
- Fog, 11
- Fonterra Co-operative Group Ltd, 367, 368
- Food and Agricultural Organisation (UN), 62, 358
- Food exports and imports
- Exports and imports
- Food industry, 413
- Food safety and quality, 150–151, 359
- Food Safety Authority, NZ, 359
- Food Standards Australia and NZ, 151
- Food Standards Code, 55
- Foot and mouth disease, 362
- Footwear industry, 414
- Foreign Affairs and Trade, Ministry oforeign Affairs and Trade, Ministry of
- environment division, 311, 315
- functions, 51
- Foreign aid
- International development assistance
- Foreign-born residents, 102, 103
- Foreign currency credit rating, 496
- Foreign exchange rates, 330, 332, 491
- Foreign investment in NZ, 348, 351–354
- Foreshore and Seabed Act 2004, 320
- Forest and Bird Protection Society of NZ Inc, Royal, 327
- Forest parks, 325
- Forests and forestry
- biosecurity, 385
- Forest & Bird, 327
- forest funds, 326–327
- forest parks, 325
- conservation
- Forest & Bird, 327
- forest funds, 326–327
- forest parks, 325
- Crown Forestry Group, 359
- Crown forestry licences, 321
- employee count in sector, 355
- exports and imports, 382–383, 465–466
- generally, 377
- Māori interests, 378, 379
- ownership, 378–379
- panel production, 381
- planting and production, 379
- prices, 337
- pulp and paper, 380–381, 383
- resources, 11, 377–378
- Scion, 295
- timber, 382, 383, 384–385
- wood supply, 378
- Forum Fisheries Agency (FFA), 53
- Foundation for Research, Science and Technology, 292–293
- FPP (first past the post) voting system, 28
- France, Australia, NZ (FRANZ) arrangement, 53
- Franz Josef Glacier, 2, 3
- Free trade, 52, 56, 57, 63, 317, 357, 358, 410
- Fringe benefit tax (FBT), 502
- Fruit
- exports, 372, 466–467
- plantings, 373
- Fuel excise, 503
- Fuels
- Energy
- Minerals
- Petroleum
G
- Gallantry awards, 36
- Galleries, art, 237
- Gallipoli, 15, 66
- Gambling Commission, 263
- Gambling, problem, 155, 263, 504
- Game Bird Habitat Trust Board, NZ, 327
- Game fishing, 259
- Game hunting, 260
- Gaming, 261, 262, 263
- Gaming duty, 503–504
- Gas, 391, 395, 400–401
- GATT (General Agreement on Tariffs and Trade) Uruguay Round, 57, 63, 357, 358
- GCSB (Government Communications Security Bureau), 77
- GDP
- Gross domestic product (GDP)
- General elections
- Parliamentary elections
- Genetic modification, 357
- Genetic origins, information about, 92
- Geographic Board, NZ, 318
- Geography
- climate
- Climate
- earthquakes, 3, 4, 5–6
- extremes, 1
- geology, 3–7
- landscape, 3–5
- physical features, 1–3
- place names, 318
- vegetation, 11–12
- volcanoes, 3, 4–5, 6–7
- wildlife, 11, 12
- GeoNet project, 5–6, 7
- Geospatial Support Facility, 73
- Geothermal energy, 395, 404
- Gift duty, 503
- Glaciers, 1, 2, 3
- Global Environmental Facility, 317
- Global warming, 7, 304, 306, 315, 316, 317
- GNI
- Gross National Income (GNI)
- GNS Science, 4, 5–6, 296
- Goats
- farming, 361
- meat exports, 365
- God Defend NZ (national anthem), 50
- God Save the Queen (national anthem), 50
- Gold, 309, 405–406
- discoveries, 19th century, 14
- Goods and services tax (GST), 502
- Goods, exports and imports
- Exports and imports
- Government
- constitution
- cabinet, 31, 32–33
- Government finance information-sharing, 220
- Local government
- Parliament
- State sector
- Executive Council, 31, 32
- Government finance information-sharing, 220
- Local government
- Parliament
- State sector
- make up of, 33
- Government finance information-sharing, 220
- Local government
- Parliament
- State sector
- ministers, appointment of, 31
- Government finance information-sharing, 220
- Local government
- Parliament
- State sector
- departments, generally
- cabinet, 31, 32–33
- Government finance information-sharing, 220
- Local government
- Parliament
- State sector
- Executive Council, 31, 32
- Government finance information-sharing, 220
- Local government
- Parliament
- State sector
- make up of, 33
- Government finance information-sharing, 220
- Local government
- Parliament
- State sector
- ministers, appointment of, 31
- Government finance information-sharing, 220
- Local government
- Parliament
- State sector
- Digital Strategy, 217–218
- cabinet, 31, 32–33
- Government finance information-sharing, 220
- Local government
- Parliament
- State sector
- Executive Council, 31, 32
- Government finance information-sharing, 220
- Local government
- Parliament
- State sector
- make up of, 33
- Government finance information-sharing, 220
- Local government
- Parliament
- State sector
- ministers, appointment of, 31
- Government finance information-sharing, 220
- Local government
- Parliament
- State sector
- E-Government Unit, 220
- cabinet, 31, 32–33
- Government finance information-sharing, 220
- Local government
- Parliament
- State sector
- Executive Council, 31, 32
- Government finance information-sharing, 220
- Local government
- Parliament
- State sector
- make up of, 33
- Government finance information-sharing, 220
- Local government
- Parliament
- State sector
- ministers, appointment of, 31
- Government finance information-sharing, 220
- Local government
- Parliament
- State sector
- executive
- cabinet, 31, 32–33
- Government finance information-sharing, 220
- Local government
- Parliament
- State sector
- Executive Council, 31, 32
- Government finance information-sharing, 220
- Local government
- Parliament
- State sector
- make up of, 33
- Government finance information-sharing, 220
- Local government
- Parliament
- State sector
- ministers, appointment of, 31
- Government finance information-sharing, 220
- Local government
- Parliament
- State sector
- finance
- Government finance information-sharing, 220
- Local government
- Parliament
- State sector
- local
- Local government
- Parliament
- State sector
- national anthems, 50
- Parliament
- State sector
- national emblems, 48
- Parliament
- State sector
- parliament
- Parliament
- State sector
- securities market, 490
- State sector
- State sector
- State sector
- Government bonds, 490
- Government Communications Security Bureau (GCSB), 77
- Government finance
- accounting practice, 497
- Budget, 494–497
- chief executives, duties and responsibilities, 493–494
- external reporting, 497–499
- foreign currency credit rating, 496
- generally, 493
- government expenses, 494, 496
- operating balance, 497
- public account taxation and national disposable income, 507
- public debt, 331, 507–508
- revenue and expenses as proportion of GDP, 497
- statement of cash flows, 499
- statement of financial performance, 498
- statement of financial position, 498–499
- tax revenue, 506
- Governor-general
- former representatives, 24
- functions and powers, 24, 29, 31
- Judge Anand Satyanand, PCNZM, 24
- Royal Assent, 29
- Grain crops, 373
- Grapes, 375
- Greece, social security agreement with, 132
- Green Party, cooperation agreement with government, 28
- Greenhouse gas emissions, 9, 304, 306, 310, 316, 317, 395
- Greenstone, 309, 407
- Greymouth tornado, 11
- Gross domestic product (GDP)
- agricultural sector and, 364
- by industry, 342–343
- definition, 338
- expenditure account, 339
- expenditure on, 339, 344
- government revenue and expenses as proportion of, 494, 497
- manufacturing sector and, 410
- per capita, OECD comparisons, 330
- principle aggregates, 339
- research and development expenditure and, 290
- Gross fixed capital formation, 345–346
- Gross national income (GNI)
- definition, 338
- principle aggregates, 339
- Guardian visas, 109
H
- Hailstorms, 11
- Hazardous substances, 313
- Health
- accidents
- Accidents
- Deaths
- Public health
- Health services
- death, causes of
- Deaths
- Public health
- Health services
- occupational safety and health, 168–169
- Public health
- Health services
- problem gambling, 155, 263
- Public health
- Health services
- public health
- Public health
- Health services
- research, 141, 292
- Health services
- services
- Health services
- Health and Disability Commissioner, 142
- Health Information Privacy Code 1994, 42
- Health Information Service, NZ, 139
- Health Information Standard Organisation, 140
- Health, Ministry of, 137–139
- Health Research Council of NZ, 141, 292
- Health services
- advisory committees, 140
- Public health
- benefits and subsidies, 145–146
- Public health
- Blood Service, 141
- Public health
- complaints, 142
- Public health
- district health boards, 139–140
- Public health
- employee count in sector, 356
- Public health
- expenditure, 141–142
- Public health
- hospital services, 145, 156–157
- Public health
- mental health, 145
- Public health
- Ministry of Health, 137–139
- Public health
- organisation of, 137–145
- Public health
- Primary Health Organisations, 145
- Public health
- professionals, regulation of, 142–145
- Public health
- public health
- Public health
- therapeutic products control, 55, 145
- Health Sponsorship Council, 155
- Health Workforce Advisory Committee, 140
- HealthPAC, 139, 146
- Healthy Eating — Healthy Action (HEHA) strategy, 153
- Herald of Arms, NZ, 25
- Heritage
- Arts and cultural heritage
- Heritage areas, world, 324–325
- High Court of NZ
- generally, 194
- Judges, 195
- High Performance Computing Centres, 224
- High temperature superconductivity, 395
- Highways, state, 439
- Hindu faith, 104
- Hire purchase, 448–449, 453, 460
- Historic Places Trust, NZ, 237–238, 327
- Historic reserves, 325
- History
- 20th century, 15–16
- British sovereignty, 14
- Christian missionaries, 14
- chronology of events, 17–22
- discovery, 13–14
- economic depression, 15
- Labour governments, 16
- politics, 15–16
- HMNZS Resolution, 73
- Hocken Collections, 240
- Holidays, employee entitlements, 273–274
- Home-based early childhood care, 182–183ome-based early childhood care, 182–183
- Home-based schooling, 184
- Home detention, 209
- Home nursing and home help, 146
- Home ownership
- Housing
- Honey bees, 370–371
- Honours system
- generally, 25
- Order of NZ, holders of, 23
- Horticulture, 372–375
- HortResearch Ltd, 296
- Hospital services, 145, 156–157
- Hospitality industry, employee count in sector, 355
- Hotels
- employee count in sector, 355
- use, 268, 269
- House of Representatives
- Parliament
- Household Labour Force Survey
- definitions used, 277
- unemployment, measurement of, 282
- Households
- borrowing, 423
- cultural goods and services expenditure, 236
- definition, 85
- energy use, 392
- expenditure, 345
- income, 286
- population projections, 85
- Housing
- assistance, 423
- generally, 417
- number of privately-owned dwellings, 421
- construction
- generally, 417
- number of privately-owned dwellings, 421
- Department of Building and Housing, 420–421
- generally, 417
- number of privately-owned dwellings, 421
- home ownership
- generally, 417
- number of privately-owned dwellings, 421
- house prices, 417–418
- house sales, 418
- Housing NZ Corporation, 418–420
- loan approvals by Housing NZ, 419
- loans and mortgages, 421–423
- new dwellings
- expenditure on, 345
- size of, 426
- units authorised, 426
- Human assisted reproductive technology
- Advisory Committee on Assisted Human
- Reproduction (ACART), 140
- Technology, 140
- Ethics Committee on Assisted Reproductive
- Technology, 140
- HART Register, 92
- Human rights
- complaints, 42–43, 122
- landmark developments, 122
- National Plan of Action, 42, 122
- UN reporting requirements, 62
- UN resolutions, support of, 62
- unlawful discrimination, 42, 122, 274–275
- Human Rights Commission, 42, 121–122
- Human Rights Review Tribunal, 43, 122, 197
- Hunting and shooting, 260
- Hydro energy, 395, 404
- Hydrogen energy, 405
- Hydrographic survey work for Defence Force, 73
- Hydrography, national, 318
I
- ICTs (Information and communication technologies), 217–221
- ILO (International Labour Organisation), 62, 272
- Immigration
- Asian population, 120
- approvals by country of birth, 107
- grant of, 106
- citizenship
- approvals by country of birth, 107
- grant of, 106
- domestic violence policy, 111
- family sponsored stream, 108
- international/humanitarian stream, 110–111
- job fairs, 279
- net migration, 97–98
- overseas-born residents, 102, 103
- Pacific access, 111
- Pacific peoples, generally, 119
- partnership policy, 108
- Pitcairn Islanders, 111
- policy, 97, 106
- refugees, 97, 110–111
- removal and deportation, 111
- residence streams, 106, 108
- Samoan quota, 111
- Skill Shortage List, 109
- skilled/business stream, 108
- sources of migration, 108–109
- temporary entry, 109–110
- Immigration NZ, 106
- Immunisation, 150, 154, 296
- Imports
- Exports and imports
- Overseas trade
- Imprisonment
- Prisons
- Income
- annual, 285
- Taxation weekly earnings, 285
- by region, 285
- Taxation weekly earnings, 285
- changes over time, 284
- Taxation weekly earnings, 285
- gross income and tax paid, 286
- Taxation weekly earnings, 285
- household, 286
- Taxation weekly earnings, 285
- personal income, 285
- Taxation weekly earnings, 285
- salary and wage rates, 286
- Taxation weekly earnings, 285
- taxation
- Taxation weekly earnings, 285
- Income support, 126–128
- Independent schools, 184
- Independent Youth Benefit, 127
- Indexation of contracts, 333–334
- Indonesia, police deployment in, 214
- Industrial designs, registration of, 299
- Industrial Research Ltd, 296
- Industry
- energy use, 393
- Manufacturing sector
- Service industries
- fatal accidents, 169
- Manufacturing sector
- Service industries
- manufacturing sector
- Manufacturing sector
- Service industries
- Modern Apprenticeships, 281
- Service industries
- national certificates and diplomas, 173
- Service industries
- research associations, 298
- Service industries
- service industries
- Service industries
- Infant mortality rate, 155
- Inflation
- CPI inflation rate, 330, 336
- target, 331
- Information and communication technologies (ICTs), 217–221
- Information privacy principles, 41
- Information technology goods and services, sales of, 221
- Information Technology Shared Services, 139
- Injuries
- prevention, 164–165
- statistics, collection of, 163
- Inland Revenue Department (IRD)
- child support payments, collection of, 130, 505
- Taxation
- student loan repayments, administration of, 506
- Taxation
- taxation, generally
- Taxation
- Inmates
- Prisons
- Insects, 11
- Insolvency, 455–156nsolvency, 455–156
- Inspector-General of Intelligence and Security, 77
- Insurance, accident, 165–167nsurance, accident, 165–167
- Insurance and Savings Ombudsman, 456
- Insurance Council of NZ, 458
- Insurance industry
- employee count in sector, 356, 458
- generally, 456–158
- Integrated circuits, layout designs, 300
- Integrated schools, 184
- Intellectual Property Office of NZ (IPONZ), 299
- Intellectual property rights, 249–250, 299–300
- Intelligence and security agencies, 77–78
- Inter-island ferries, 430
- Interest rates
- key market rates, 490
- monetary policy and, 332, 490
- mortgages, 423
- Interfaith Dialogue (IFD), 77
- Intergovernmental Panel on Climate Change, 9
- International accounts
- balance of payments, 348–351
- balance as proportion of GDP, 353
- deficits and surpluses, 330, 353
- generally, 348–349
- trade in services, 349
- capital account, 350
- balance as proportion of GDP, 353
- deficits and surpluses, 330, 353
- generally, 348–349
- trade in services, 349
- current account
- balance as proportion of GDP, 353
- deficits and surpluses, 330, 353
- generally, 348–349
- trade in services, 349
- financial account, 350–351
- generally, 348
- international assets and liabilities, 354
- international investment position, 348, 351–352
- sources of international investment, 353
- International Accreditation NZ (IANZ), 300
- International air services, 434–435
- International Civil Aviation Organisation (ICAO), 433
- International Court of Justice, 61
- International development assistance
- Afghanistan, 59
- Africa, 59, 61
- Asia, 55, 57, 61
- international agencies, 60, 61–62
- Iraq, 59
- Latin America, 61
- NZ non-government organisations, 60, 61
- NZAID programmes and expenditure, 59–62
- Occupied Palestinian Territories, 58
- OECD comparisons, 52
- Pacific region, 52, 53, 60–61, 65
- International Development Association, 64
- International Energy Agency (IEA), 65
- International Epizootics Organisation, 358
- International financial institutions, 62, 64
- International investment, 348
- International Labour Organisation (ILO), 62, 272
- International Plant Protection Convention, 358
- International relations
- Africa, 58, 59
- International development assistance
- Asia, 55–56, 57
- International development assistance
- Australia, 55
- International development assistance
- Canada, 56
- International development assistance
- Caribbean, 57
- International development assistance
- development assistance
- International development assistance
- diplomatic and consular representation, 54
- Europe, 57–58
- generally, 51
- international organisations, 62–65
- Latin America, 57
- Middle East, 58–59
- NZ territories, 65–67
- Pacific region, 51–53
- United States, 56
- International Security Assistance Force (Afghanistan), 58, 61
- International students
- generally, 189–190
- visas, 109
- International tourism, 266–269
- International Whaling Commission, 315, 316
- Internet
- access and use, 217–221
- services, 217, 218
- subscribers, 219
- activities, 220
- services, 217, 218
- subscribers, 219
- broadband
- services, 217, 218
- subscribers, 219
- domain names, 219
- e-commerce, 221
- E-Government Unit, 220
- service providers, 218, 223, 224
- spam, 221
- subscribers, 218, 219
- tourism marketing and travel planning, 266–267
- Internet NZ, 219
- Invalid's Benefit, 127, 128, 130, 131
- Investment, international, 348, 351–354
- IPONZ (Intellectual Property Office of NZ), 299
- Iraq, deployment in, 58–59, 61, 71
- IRD
- Inland Revenue Department (IRD)
- Ireland, social security agreement with, 132
- Iron, 406
- Islamic faith, 104
- Islands, outlying, 1
- ISO certification service, 300
- Israel, deployment in, 58, 61, 70
- Israeli-Arab conflict, 58
J
- Japan, trade with, 477
- Jersey and Guernsey, social security agreement with, 132
- Jim Anderton's Progressive Party, coalition agreement, 28
- Jobs
- Employment
- Labour force
- Joint Geospatial Support Facility, 73
- Jordan, deployment in, 58, 61, 70
- Judges
- appointment, 193
- list of, 195
- removal from office, 193
- role, 193
- salaries and allowances, 195
- Judicial Committee of the Privy Council, 194
- Jury service, 198
- Justice, Ministry of, 193–194
- Justice system
- corrections
- Corrections system
- Criminal justice
- Young offenders
- courts system, 194–197
- Criminal justice
- Young offenders
- criminal justice
- Criminal justice
- Young offenders
- young offenders
- Young offenders
K
- Ka Roimata o Hine Hukatere (Franz Josef Glacier), 2, 3
- Kākāpō, 304ākāpō, 304
- Kindergartens, 182
- Kiwi Bonds, 490
- Kiwi sculpture, Berlin zoo, 251
- Kiwifruit, 374
- Knowledge creation funding, 291
- Kōhangareo, 116–117, 182ōhangareo, 116–117, 182
- Korean peninsula, UN Command Military Armistice Commission, 61
- Kosovo, deployment in, 61, 70
- Kupe, 13
- Kura kaupapa Māori, 116, 184
- Kyoto Protocol, 310, 315, 316, 317
L
- Laboratory scientists and technologists, 145
- Labour force
- 2002–2005, 277–279
- definition of, 277
- employment status, 280
- full and part-time employment, 279
- industry structure, 280–281
- job fairs, 279
- Modern Apprenticeships, 281
- occupational structure, 281
- participation rates by sex and age, 279
- unemployment, 282–284
- Labour governments, 15, 16
- Labour market
- discrimination, 274–275
- Labour force
- employers' advocacy, 275
- Labour force
- employment assistance, 283, 284–285
- Labour force
- equal employment opportunities, 274–275
- Labour force
- income, 285–287
- Labour force
- international organisations, 272
- Labour force
- Labour Cost Index, 287
- Labour force
- labour force
- Labour force
- labour relations, 271–273, 276–277
- minimum entitlements, 273–274
- unemployment, 282–284
- union membership, 275
- work stoppages, 276–277
- workers' advocacy, 275
- Labour Party, coalition government, 28
- Labour relations, 271–273, 276–277
- Lahar risk, 6
- Lakes, 1, 3, 5
- Lamb exports, 360, 364, 365
- Land
- area, 1–2
- Crown-owned, 320–321
- foreshore and seabed, 320
- Geographic Board, 318
- Māori land, 320
- overseas parties, acquisition by, 319–320
- rural sales, 319
- stamp duty, 503
- survey system, 318–319
- title registration, 318–319
- use, 303, 311
- valuation, 321–322
- Land Information NZ (LINZ)
- generally, 317–318
- land administered by, 320–321
- Land transport
- Railways
- Road transport
- Land Transport NZ, 395, 400
- Land wars, 19
- Landcare Research NZ Ltd, 296
- Landcorp Farming Ltd, 321
- Landfill gas, 404
- Landfills, 314–315andfills, 314–315
- Landonline, 318
- Landscape, 3–5andscape, 3–5
- Languages, official, 116
- Latin America
- development assistance, 61
- relationship with, 57
- Law centres, 198
- Law Commission, 197
- Lawyers, duty solicitor scheme, 198
- Layby Sales Act 1971, 449
- Layout designs, 300
- Leader of the Opposition, 30
- Leap seconds, 12
- Learning Media Ltd, 176
- Lebanon, deployment in, 58, 61, 70
- Legal aid, 197–198
- Legal deposit system, 239
- Legal Services Agency, 197–198
- Legal system
- Attorney-general, 198
- Judges
- Chief Justice of NZ, 194
- Judges
- salary and allowances, 195
- Judges
- community law centres, 198
- Judges
- courts system, 194–197
- Judges
- Crown Law Office, 198–199
- Judges
- Judges
- Judges
- jury service, 198
- Law Commission, 197
- legal aid, 197–198
- legal authority, source of, 193
- Legal Services Agency, 197–198
- Ministry of Justice, 193–194
- separation of powers, 193
- Solicitor-general, 198
- tribunals, 197
- Leisure
- gaming, 261, 262, 263
- lotteries, 261, 262–263
- outdoor activities, 259–260
- racing, 260–261
- sport, 255–259
- Liabilities, international, 354
- Liberal governments, 15
- Library services
- Hocken Collections, 240
- legal deposit system, 239
- National Library, 239–240
- NZ National Bibliography, 239
- Parliamentary Library, 240
- public libraries, 240–241
- specialist library and information centres, 241
- universities, 241
- Life expectancy, 95
- Life insurance, 456, 457
- Limestone, 407
- Limited Service Volunteer Scheme, 71
- LINZ (Land Information NZ)
- generally, 317–318
- land administered by, 320–321
- Liquidation, 456
- Liquor, sale of
- convictions for offences, 204
- generally, 450–451
- Literacy of students, 172
- Literature, 241–242iterature, 241–242
- Livestock
- generally, 360–361
- prices, 337
- Loans
- housing, 421–422
- regulation of, 448–449, 453
- Local government
- boundaries, 44
- categories of local authorities, 44
- community boards, 46
- decision-making, 44
- elections, 47
- finance, 47–48
- functions and powers, 44, 45–46
- income, 44
- local bills, 44
- new cities, constitution of, 46
- organisation of, 45–46
- population estimates, 89–90
- rates, setting of, 44
- regional councils, 45
- review authority, 44
- sources of power, 44
- special purpose local authorities, 46
- territorial authorities, 45–46
- unitary authorities, 46
- Local Government Commission, 47
- Local Government Official Information and Meetings Act 1987, 40, 41, 44
- Local television services, 225–226
- Lockouts, 276–277ockouts, 276–277
- Lotteries, 261, 262–263
- Lottery Grants Board, NZ, 262–263
M
- Machinery
- exports, 469–470
- imports, 471–472
- MAF (Ministry of Agriculture and Forestry), 358–359
- Magazines, 229
- Mail services, 231–233
- Malaghan Institute of Medical Research, 141, 298
- Mana Tohu Mātauranga o Aotearoa (NZ Qualifications Authority), 175
- Manaaki Whenua (Landcare Research NZ Ltd), 296
- Manatū Kaihokohoko (Ministry of Consumer Affairs), 449–450
- Manufacturing sector
- business development, 411–412
- contribution to GDP, 410
- economic activity survey, 415–416
- employment, 355, 412–413, 415
- energy use, 393
- food industry, 413
- GDP by industry, 342–343
- general environment, 409
- major industries, 412–415
- marine industry, 414–415
- tariffs, 410
- textiles, 414
- wine industry, 375
- Māori
- 20th century history, 16
- generally, 181
- Māori population
- kōhanga reo, 116–117, 182
- Māori population
- kura kaupapa Māori, 116, 184
- Māori population
- wānanga, 38, 175, 186, 298
- Māori population
- wharekura, 116
- Māori population
- broadcasting, 222–223, 236
- generally, 181
- Māori population
- kōhanga reo, 116–117, 182
- Māori population
- kura kaupapa Māori, 116, 184
- Māori population
- wānanga, 38, 175, 186, 298
- Māori population
- wharekura, 116
- Māori population
- convicted offenders, 204
- generally, 181
- Māori population
- kōhanga reo, 116–117, 182
- Māori population
- kura kaupapa Māori, 116, 184
- Māori population
- wānanga, 38, 175, 186, 298
- Māori population
- wharekura, 116
- Māori population
- cultural heritage, 235–236, 252
- generally, 181
- Māori population
- kōhanga reo, 116–117, 182
- Māori population
- kura kaupapa Māori, 116, 184
- Māori population
- wānanga, 38, 175, 186, 298
- Māori population
- wharekura, 116
- Māori population
- Declaration of Independence, 1835, 23, 49
- generally, 181
- Māori population
- kōhanga reo, 116–117, 182
- Māori population
- kura kaupapa Māori, 116, 184
- Māori population
- wānanga, 38, 175, 186, 298
- Māori population
- wharekura, 116
- Māori population
- demography, 111–114
- generally, 181
- Māori population
- kōhanga reo, 116–117, 182
- Māori population
- kura kaupapa Māori, 116, 184
- Māori population
- wānanga, 38, 175, 186, 298
- Māori population
- wharekura, 116
- Māori population
- discovery and settlement of NZ, 13
- generally, 181
- Māori population
- kōhanga reo, 116–117, 182
- Māori population
- kura kaupapa Māori, 116, 184
- Māori population
- wānanga, 38, 175, 186, 298
- Māori population
- wharekura, 116
- Māori population
- early society, 13–14
- generally, 181
- Māori population
- kōhanga reo, 116–117, 182
- Māori population
- kura kaupapa Māori, 116, 184
- Māori population
- wānanga, 38, 175, 186, 298
- Māori population
- wharekura, 116
- Māori population
- education
- generally, 181
- Māori population
- kōhanga reo, 116–117, 182
- Māori population
- kura kaupapa Māori, 116, 184
- Māori population
- wānanga, 38, 175, 186, 298
- Māori population
- wharekura, 116
- Māori population
- fishing and fisheries, 388
- Māori population
- foreshore and seabed, rights in relation to, 320
- Māori population
- forestry interests, 378, 379
- Māori population
- health services, 154
- Māori population
- iwi fisheries assets, 388
- Māori population
- land wars, 14
- Māori population
- physical activity, 258
- Māori population
- population
- Māori population
- religious affiliation, 104
- sport and physical recreation, 258
- taonga tuku iho, 235–236
- te reo Māori, 116–117, 236
- unemployment, 284
- writers' competition, 241
- Māori Appellate Court, 196
- Māori Congress, 116āori Congress, 116
- Māori Council, NZ, 116
- Māori Development, Ministry of, 115āori Development, Ministry of, 115
- Māori Education Trust, 181
- Māori electoral districts, 35āori electoral districts, 35
- Māori electoral option, 25, 34
- Māori Heritage Council, 236āori Heritage Council, 236
- Māori Internet Society, 219
- Māori land, 320āori land, 320
- Māori Land Court
- generally, 196, 320
- Judges' salaries and allowances, 195
- land administered by, 320
- Māori Language Commission, 117, 236
- Māori populationāori population
- age distribution, 99, 102, 111–112
- fertility rate, 92, 114
- geographical distribution, 113
- growth, 101, 102
- infant mortality rates, 155, 158
- life expectancy, 95
- male to female ratio, 112
- pre-European contact, 13
- projections, 84
- proportion of total population, 84, 113
- Māori Television, 223, 236
- Māori Trustee, 116āori Trustee, 116
- Māori Women's Welfare League, 116
- Mapping services, 318–319
- Marginal strips, 325
- Marine environment, 307–308, 431
- Marine industry, 414–415
- Marine reserves and parks, 326
- Maritime NZ, 431
- Marriages
- celebrants, 93
- first marriage, median age, 92
- licences, 93
- rate, 92
- relationship property legislation, 123
- Matapihi, 237
- Maternity services, 146
- Measurement Standards Laboratory, 292
- Measures, metric, 448
- Meat
- consumption, 362
- exports, 360–361, 364–365, 464–465
- inspection services, 359
- NZ Meat Board, 362
- prices, 337
- products, 362–365
- Meat & Wool NZ, 364
- Mechanical machinery
- exports, 469–470
- imports, 471–472
- Mediation Service, 272
- Medical Council of NZ, 142
- Medical education, 142–143
- Medical laboratory scientists and technologists, 145
- Medical professionals and technologists, 142–145
- Medical radiation technologists, 144–145
- Medicines
- misuse, 147
- prescription charges, 145, 146
- Medsafe, 139, 145
- Members of Parliamentembers of Parliament
- Parliament
- Men
- convicted offenders, 204
- labour force participation, 279
- life expectancy, 95
- prisoners, 212
- unemployment, 283, 284
- weekly earnings, 285
- Meningococcal disease, immunisation against, 150, 154
- Mental health services, 145, 152, 157
- Merchandise trade
- Overseas trade
- Metals, 405–407
- Methane gas emissions, 9
- Mexico, relationship with, 57
- MFAT
- Ministry of Foreign Affairs and Trade
- Michael King Writers' Fellowship, 253
- Middle East
- relationship with, 58–59
- UN Truce Supervision Mission, 58, 61, 70
- Midwives, 143, 146
- Migration
- external, 96–97
- internal, 87
- Military
- Defence Force Military Police company, 74
- Milk production and processing, 357–358, 367–369
- Minerals
- Crown ownership, 313, 405
- environment and, 308–309
- exploration and development, 313, 405
- fuel imports, 473
- generally, 308–309, 405
- metals, 405–407
- non-metallic (industrial minerals), 407
- Miner's Benefit, 130, 131
- Minimum wage, 273
- Mining, employee count in sector, 355
- Ministries, generally
- State sector
- Ministry for Culture and Heritage, 250–251
- Ministry of Agriculture and Forestry (MAF), 358–359
- Ministry of Civil Defence and Emergency Management, 6, 167
- Ministry of Consumer Affairs, 449–450
- Ministry of Defence, 67
- Ministry of Economic Development, 411
- Ministry of Education, 174
- Ministry of Foreign Affairs and Trade
- disarmament division, 76
- environment division, 311, 315
- functions, 51
- Ministry of Health, 137–139
- Ministry of Justice, 193–194
- Ministry of Māori Development, 115
- Ministry of Research, Science and Technology (MoRST), 289
- Ministry of Social Development
- Development, Ministry of
- Ministry of Tourism, 265
- Ministry of Women's Affairs, 122
- Ministry of Youth Development, 122–123, 125
- Misuse of drugs, 147
- MMP (mixed member proportional) voting system, 28, 29
- Mobile service providers, 223, 224
- Modern Apprenticeships, 281
- Monetary policy, 331–332, 334, 489–490
- Money
- cashless society, 487
- currency, 489
- foreign exchange rates, 330, 332, 491
- interest rates, 332, 490
- Official Cash Rate, 332, 334, 490
- MoRST (Ministry of Research, Science and Technology), 289
- Mortality
- Child and Youth Mortality Review
- Committee, 140
- 1855–2004, 100
- by age and sex, 95
- Committee, 140
- death rate
- 1855–2004, 100
- by age and sex, 95
- Committee, 140
- fetal mortality rate, 158
- Committee, 140
- infant mortality rate, 155, 158
- Committee, 140
- median age at death, 96
- Committee, 140
- Perinatal and Maternity Mortality Review
- Committee, 140
- vital statistics, 94
- Mortgages, 421–423
- Motor Vehicle Sales Act 2003, 449
- Motor Vehicle Traders Register, 443
- Motor vehicles
- accidents, 160–162
- conversion, 203
- imports, 472
- inspection, 444
- registers, 443
- registration and licensing, 440–442
- running costs, 443
- safety belts, 444
- Motu Ihupuku (Campbell Island), 1, 305
- Mountaineering, 260
- Mountaineering clubs, 328
- Mountains, 1,2ountains, 1,2
- Movies
- Film and video
- Mozambique, deployment in, 59
- MPs
- Parliament
- Mt Cook, 1
- Mt Ruapehu lahar, 6
- Multinational Force and Observers (Sinai), 58, 61, 70
- Murder, sentencing for, 211
- Museums
- generally, 237
- police museum, 216
- Te Papa Tongarewa, 236–237
- Music
- Chamber Music NZ, 243
- Choral Federation, 244
- Māori, 236
- National Youth Orchestra, 243
- NZ Music Industry Commission, 242
- NZ On Air, 222
- NZ Opera Ltd, 245
- Symphony Orchestra, 242–243
- Muslim faith, 104
- Mutton exports, 360, 364, 365
- Mutual Assistance Programme (NZ Defence Force), 69, 70
N
- Naming of places, 318
- National accounts
- capital stock, 346
- external account, 341
- GDP and expenditure account, 339
- national capital account, 340–341
- national income and outlay account, 339–340
- agricultural sector and, 364
- by industry, 342–343
- definition, 338
- expenditure account, 339
- expenditure on, 339, 344
- government revenue and expenses as proportion of, 494, 497
- manufacturing sector and, 410
- principle aggregates, 339
- research and development expenditure and, 339
- definition, 338
- principle aggregates, 339
- consumption expenditure and saving, 341
- definition, 338
- outlay from, 339–340
- principle aggregates, 339
- public account taxation and, 507
- consolidated accounts
- external account, 341
- GDP and expenditure account, 339
- national capital account, 340–341
- national income and outlay account, 339–340
- agricultural sector and, 364
- by industry, 342–343
- definition, 338
- expenditure account, 339
- expenditure on, 339, 344
- government revenue and expenses as proportion of, 494, 497
- manufacturing sector and, 410
- principle aggregates, 339
- research and development expenditure and, 339
- definition, 338
- principle aggregates, 339
- consumption expenditure and saving, 341
- definition, 338
- outlay from, 339–340
- principle aggregates, 339
- public account taxation and, 507
- external trade, 346–347
- agricultural sector and, 364
- by industry, 342–343
- definition, 338
- expenditure account, 339
- expenditure on, 339, 344
- government revenue and expenses as proportion of, 494, 497
- manufacturing sector and, 410
- principle aggregates, 339
- research and development expenditure and, 339
- definition, 338
- principle aggregates, 339
- consumption expenditure and saving, 341
- definition, 338
- outlay from, 339–340
- principle aggregates, 339
- public account taxation and, 507
- generally, 338
- agricultural sector and, 364
- by industry, 342–343
- definition, 338
- expenditure account, 339
- expenditure on, 339, 344
- government revenue and expenses as proportion of, 494, 497
- manufacturing sector and, 410
- principle aggregates, 339
- research and development expenditure and, 339
- definition, 338
- principle aggregates, 339
- consumption expenditure and saving, 341
- definition, 338
- outlay from, 339–340
- principle aggregates, 339
- public account taxation and, 507
- gross domestic product
- agricultural sector and, 364
- by industry, 342–343
- definition, 338
- expenditure account, 339
- expenditure on, 339, 344
- government revenue and expenses as proportion of, 494, 497
- manufacturing sector and, 410
- principle aggregates, 339
- research and development expenditure and, 339
- definition, 338
- principle aggregates, 339
- consumption expenditure and saving, 341
- definition, 338
- outlay from, 339–340
- principle aggregates, 339
- public account taxation and, 507
- gross fixed capital formation, 345–346
- definition, 338
- principle aggregates, 339
- consumption expenditure and saving, 341
- definition, 338
- outlay from, 339–340
- principle aggregates, 339
- public account taxation and, 507
- gross national income
- definition, 338
- principle aggregates, 339
- consumption expenditure and saving, 341
- definition, 338
- outlay from, 339–340
- principle aggregates, 339
- public account taxation and, 507
- household sector, 345
- consumption expenditure and saving, 341
- definition, 338
- outlay from, 339–340
- principle aggregates, 339
- public account taxation and, 507
- national disposable income
- consumption expenditure and saving, 341
- definition, 338
- outlay from, 339–340
- principle aggregates, 339
- public account taxation and, 507
- national saving and net overseas borrowing, 341
- National Advisory Committee on Health and Disability (National Health Committee), 140
- National Advisory Committee on Health and Disability Support Services Ethics, 140
- National anthems, 50
- National assets, privatisation of, 16
- National Beekeepers' Association, 371
- National bibliography, 239
- National Certificate of Educational Achievement (NCEA), 173–174, 185
- National certificates and diplomas, 173, 188
- National Cervical Screening Programme, 154
- National disposable income (NDI)
- National accounts
- National DNA Profile Databank, 204
- National Drug Intelligence Bureau, 147, 215
- National Drug Policy, 147
- National emblems, 48
- National flag, 48
- National governments, 16
- National Health Committee (National Advisory Committee on Health and Disability), 140
- National Health Epidemiology and Quality Assurance Committee, 140
- National Immunisation Register, 150
- National Institute of Water and Atmospheric Research Ltd (NIWA), 9, 296–297
- National Land Transport Programme, 438
- National Library of NZ, 239–240
- National parks, 322–323
- National Preservation Office, 240
- National Qualifications Framework, 172–174
- National Radiation Laboratory, 139
- National Radio, 227
- National reserves, 325
- National Screening Unit, 139
- National Topographic/Hydrographic Authority of LINZ, 318
- National War Memorial, 250, 251
- National Youth Orchestra, 243
- Natural disasters, relief for
- Emergency and disaster relief
- Natural gas, 391, 395, 400–401
- Nature Heritage Fund, 326–327
- Nature reserves, 325
- Nautical charts, 73
- Navigation safety, 73
- Navy, Royal NZ, 73–74avy, Royal NZ, 73–74
- NCEA (National Certificate of Educational Achievement), 173–174, 185
- Neglect of children, 133
- Net migration, 97–98
- Netherlands, The, social security agreement with, 132
- New organisms, 313
- Newspapers, 228–229ewspapers, 228–229
- Ngā Kaitiaki O Ngā Taonga Whitiāhua (NZ Film Archive), 247–248
- Ngā Pou Taunaha o Aotearoa (NZ Geographic Board), 318
- Ngā Taonga Kōrero (Sound Archives), 227
- Ngā Whenua Rahui, 305, 326–327gā Whenua Rahui, 305, 326–327
- Niue
- migration to NZ from, 119
- police deployment in, 215
- special relationship with, 51–52
- NIWA (National Institute of Water and Atmospheric Research Ltd), 9, 296–297
- Non-government organisation (NGO) development community, 61
- Non-resident withholding tax (RWT), 501, 504
- North Island
- land area, 1
- manufacturing, employment in, 412–413
- population, 86, 87
- ‘silent’ land movements, 4
- Notifiable diseases, 150
- Notifiable Occupational Disease System (NODS), 169
- Nuclear disarmament, 76
- Numeracy of students, 172
- Nurses, 143
- Nursing services, home-based, 146
- Nut exports, 466–467
- Nutrition survey, 153
- NZ Academy of Sport, 257–258
- NZ Agency for International Development (NZAID), 52, 53, 57, 59–62
- NZ AIDS Foundation, 152
- NZ Army, 74–75
- NZ Authors' Fund, 241
- NZ Automobile Association, 458
- NZ Bankers' Association, 488
- NZ Blood Service, 141
- NZ Cadet Corps, 71
- NZ Cancer Control Trust, 151
- NZ Cartoon Archive, 239
- NZ Certificates in Engineering (NZCE), 188
- NZ Choral Federation, 244
- NZ coat of arms, 48
- NZ Conservation Authority, 327
- NZ Conservation Corps, 123, 124
- NZ Council of Trade Unions (NZCTU), 275
- NZ Customs Service
- Customs Service, NZ
- NZ Daylight Time, 12
- NZ Defence Force
- Defence Force
- NZ Diploma in Business (NZDipBus), 188
- NZ Drama School, 244–245
- NZ Exclusive Economic Zone, 385
- NZ Family Planning Association, 152
- NZ Film Archive, 247–248
- NZ Film Commission, 247
- NZ Fire Service, 167
- NZ Fire Service Commission, 167
- NZ First, confidence and supply agreement, 28
- NZ Fish and Game Council, 327
- NZ flag
- first, 49
- national flag, 48
- NZ Food Safety Authority (NZFSA), 150–151, 359
- NZ Game Bird Habitat Trust Board, 327
- NZ Geographic Board, 318
- NZ Health Information Service, 139
- NZ Herald of Arms, 25
- NZ Historic Places Trust, 237–238, 327
- NZ Institute for Crop & Food Research Ltd, 296
- NZ Lottery Grants Board, 262–263
- NZ Māori Council, 116
- NZ Meat Board, 362
- NZ Music Industry Commission, 242
- NZ National Bibliography, 239
- NZ On Air, 222
- NZ Opera Ltd, 245
- NZ Order of Merit, 25
- NZ Parole Board, 211
- NZ Police
- Police
- NZ Police International Service Group, 215
- NZ Pork Industry Board, 369
- NZ Positive Ageing Strategy, 131
- NZ Post Ltd, 231–233
- NZ Press Association, 229
- NZ Press Council, 229–230
- NZ Public Service
- State sector
- NZ Qualifications Authority (NZQA), 175
- NZ Register of Quality Assured Qualifications, 175–176
- NZ Scholarship, 174, 185
- NZ School Journal, 176
- NZ School of Dance, 244
- NZ Society of Authors, 241
- NZ Standard Time, 12
- NZ String Quartet, 243
- NZ Superannuation, 127, 130–131, 132
- NZ Symphony Orchestra, 242–243
- NZ Teachers' Council, 175
- NZ Trade and Enterprise, 409, 411–412, 461–462
- NZ Trade Development Board, 51
- NZ Venture Investment Fund Ltd, 293
- NZAID
- NZ Agency for International Development (NZAID)
- NZCE (NZ Certificates in Engineering), 188
- NZCTU (NZ Council of Trade Unions), 275
- NZDipBus (NZ Diploma in Business), 188
- NZHistory.net.nz. 251
- NZQA (NZ Qualifications Authority), 175
- NZSIS (Security Intelligence Service), 77
- NZX, 454–455
O
- Obesity, 153
- Occupational disease notifications, 169
- Occupational Safety and Health Service, 168–169
- Occupational therapists, 144
- Occupied Palestinian Territories, 58
- Ocean management, 316, 386
- Fishing and fisheries
- OECD
- Organisation for Economic Cooperation and Development (OECD)
- Offences
- Criminal justice
- Young offenders
- Office for Disability Issues, 125, 129
- Office for Senior Citizens, 125, 131
- Office for the Community and Voluntary Sector, 125, 132
- Office of Ethnic Affairs, 119
- Office of Film and Literature Classification, 248, 249
- Office of the Insurance and Savings Ombudsman, 456
- Office of Treaty Settlements, 115
- Offices of parliament, 38
- Official Assignee, duties under Proceeds of Crime Act 1991, 210–211
- Official Cash Rate (OCR), 332, 334, 490
- Official Information Act 1982, 40, 41
- Official languages, 116
- Offshore islands, land area, 1
- Oil, 391, 397–400il, 391, 397–400
- Older people
- Office for Senior Citizens, 125, 131
- Positive Ageing Strategy, 131
- public health services, 151–152
- residential care, 152, 156
- University of the Third Age, 184
- Olympic Games, 257
- Ombudsmen, 38, 40, 41
- Open Polytechnic of NZ, The, 186–187
- Opera, NZ, 245
- Operation Antarctica, 71–72
- Opticians, 144
- Optometrists, 144
- Oral History Centre, 240
- Order of NZ, 23, 25
- Organisation for Economic Co-operation and Development (OECD)
- electricity generation methods, 392
- emissions of carbon dioxide, 304
- energy supply, 392
- Environment Policy Committee, 317
- fertility rates, 80
- GDP per capita, 330
- government outlays and receipts, 494
- imprisonment rates, 194
- infant mortality rates, 158
- inflation rate, 336
- internet subscribers, 218
- NZ involvement in, 65, 272
- official development assistance, 52
- population density, 80
- protected areas, 304
- research and development, 290
- student literacy, 172
- Organisation for the Prohibition of Chemical Weapons, 62
- Orphan's Benefit, 127, 129, 130, 131
- OSCAR (Out of School Care and Recreation) Subsidy, 129
- Osteopaths, 145
- Out of School Care and Recreation (OSCAR) Subsidy, 129
- Outdoor leisure activities, 259–260
- Outpatient services, 156
- Overseas-born residents, 102, 103
- Overseas investment in NZ land, 319–320
- Overseas relations
- International relations
- Overseas trade
- Africa, 59
- balance of, 463
- by country grouping, 479–480
- countries of destination and origin, 474
- APEC countries, 479
- balance of, 463
- by country grouping, 479–480
- countries of destination and origin, 474
- Asia, 55, 56, 57, 477–478, 479
- balance of, 463
- by country grouping, 479–480
- countries of destination and origin, 474
- Australia, 55, 474–475
- balance of, 463
- by country grouping, 479–480
- countries of destination and origin, 474
- bulk shipping, 429, 430
- balance of, 463
- by country grouping, 479–480
- countries of destination and origin, 474
- Canada, 56
- balance of, 463
- by country grouping, 479–480
- countries of destination and origin, 474
- cargo, 480–482
- balance of, 463
- by country grouping, 479–480
- countries of destination and origin, 474
- Caribbean, 57
- balance of, 463
- by country grouping, 479–480
- countries of destination and origin, 474
- China, 478
- balance of, 463
- by country grouping, 479–480
- countries of destination and origin, 474
- Customs Service, 462
- balance of, 463
- by country grouping, 479–480
- countries of destination and origin, 474
- development and administration, 461–463
- balance of, 463
- by country grouping, 479–480
- countries of destination and origin, 474
- EU countries, 479
- balance of, 463
- by country grouping, 479–480
- countries of destination and origin, 474
- European Union, 57–58
- balance of, 463
- by country grouping, 479–480
- countries of destination and origin, 474
- exports and imports
- balance of, 463
- by country grouping, 479–480
- countries of destination and origin, 474
- free trade, 52, 56, 57, 63, 317, 357, 358, 410
- balance of, 463
- by country grouping, 479–480
- countries of destination and origin, 474
- Japan, 477
- balance of, 463
- by country grouping, 479–480
- countries of destination and origin, 474
- Latin America, 57
- balance of, 463
- by country grouping, 479–480
- countries of destination and origin, 474
- liberalisation, 63
- balance of, 463
- by country grouping, 479–480
- countries of destination and origin, 474
- major trading partners, 473–474
- balance of, 463
- by country grouping, 479–480
- countries of destination and origin, 474
- merchandise trade
- balance of, 463
- by country grouping, 479–480
- countries of destination and origin, 474
- Middle East, 59
- NZ Trade and Enterprise, 461–462
- Pacific region, 52
- Russia and CIS, 58
- United States, 56, 475–476
- World Customs Organisation, 462
- WTO, 63
- Ozone layer, 7, 9–10, 306–307, 315
P
- Pacific Agreement on Closer Economic Relations (PACER), 52
- Pacific Forum Line (PFL), 53
- Pacific Island Countries Trade Agreement (PICTA), 52
- Pacific Islands Forum, 52, 53
- Pacific Islands Trade and Investment Commission, 52
- Pacific peoples
- convicted offenders, 204
- age distribution, 99, 102, 117
- fertility rate, 92
- geographical distribution, 118–119
- growth, 101, 102
- projections, 84
- proportion of total population, 84
- demography, 117–119
- age distribution, 99, 102, 117
- fertility rate, 92
- geographical distribution, 118–119
- growth, 101, 102
- projections, 84
- proportion of total population, 84
- early childhood education, 177, 182
- age distribution, 99, 102, 117
- fertility rate, 92
- geographical distribution, 118–119
- growth, 101, 102
- projections, 84
- proportion of total population, 84
- infant mortality rates, 158
- age distribution, 99, 102, 117
- fertility rate, 92
- geographical distribution, 118–119
- growth, 101, 102
- projections, 84
- proportion of total population, 84
- migrant quota, 111
- age distribution, 99, 102, 117
- fertility rate, 92
- geographical distribution, 118–119
- growth, 101, 102
- projections, 84
- proportion of total population, 84
- migration to NZ, 119
- age distribution, 99, 102, 117
- fertility rate, 92
- geographical distribution, 118–119
- growth, 101, 102
- projections, 84
- proportion of total population, 84
- population
- age distribution, 99, 102, 117
- fertility rate, 92
- geographical distribution, 118–119
- growth, 101, 102
- projections, 84
- proportion of total population, 84
- unemployment, 284
- Pacific region
- defence and security, 53, 69
- development assistance, 52, 53, 60–61, 69
- diplomatic and consular representation, 51
- emergency and disaster relief, 53, 60, 61
- environmental issues, 317
- radio broadcasting, 226
- relationship with, 51–53
- social security agreements, 132
- trade with, 52
- Pākehā
- European ethnic group
- Palestinian-Israeli conflict, 58
- Pandemic plan, 150
- Parental leave, 274
- Parental tax credits, 504–505
- Parents as First Teachers (PAFT), 182
- Parks
- forest parks, 325
- marine parks, 326
- national, 322–323
- Parliament
- Constitution
- Executive
- government; Parliamentary elections
- Budget, 494–497
- bills, types of, 28
- Clerk, 28, 30
- debates, 29
- eCommittee Project, 28
- freedom of speech, 28
- functions, 28
- Leader of the Opposition, 30
- legislative procedure, 28–29
- make up of 48th Parliament, 30–31
- salaries and allowances, 29
- select committees, 28, 29
- sessions, 28, 29
- Speakers, 27, 28, 30
- representation, 28
- role, 28
- seats held after general elections, 27
- function, 193
- bills, types of, 28
- Clerk, 28, 30
- debates, 29
- eCommittee Project, 28
- freedom of speech, 28
- functions, 28
- Leader of the Opposition, 30
- legislative procedure, 28–29
- make up of 48th Parliament, 30–31
- salaries and allowances, 29
- select committees, 28, 29
- sessions, 28, 29
- Speakers, 27, 28, 30
- representation, 28
- role, 28
- seats held after general elections, 27
- governor-general
- bills, types of, 28
- Clerk, 28, 30
- debates, 29
- eCommittee Project, 28
- freedom of speech, 28
- functions, 28
- Leader of the Opposition, 30
- legislative procedure, 28–29
- make up of 48th Parliament, 30–31
- salaries and allowances, 29
- select committees, 28, 29
- sessions, 28, 29
- Speakers, 27, 28, 30
- representation, 28
- role, 28
- seats held after general elections, 27
- House of Representatives, 26–31
- bills, types of, 28
- Clerk, 28, 30
- debates, 29
- eCommittee Project, 28
- freedom of speech, 28
- functions, 28
- Leader of the Opposition, 30
- legislative procedure, 28–29
- make up of 48th Parliament, 30–31
- salaries and allowances, 29
- select committees, 28, 29
- sessions, 28, 29
- Speakers, 27, 28, 30
- representation, 28
- role, 28
- seats held after general elections, 27
- Offices of parliament, 38
- representation, 28
- role, 28
- seats held after general elections, 27
- political parties
- representation, 28
- role, 28
- seats held after general elections, 27
- Youth Parliament, 123
- Parliamentary Commissioner for the Environment, 38, 43
- Parliamentary elections
- 2005 election, 36
- electoral districts, 34–35
- electoral rolls, 34
- electronic voting, 34
- enrolment, 34
- FPP system, 28
- Māori electoral districts, 35
- Māori electoral option, 25, 34
- MMP system, 28, 29
- voter turnout, 36
- voting patterns, 34
- voting process, 34
- Parliamentary Library, 240
- Parole, 209, 211–212arole, 209, 211–212
- Parole Board, NZ, 211
- Partnerships, 451
- Pasifika Early Childhood Education Services, 182
- Passport Office, 105
- Pastoral agriculture, 359–361
- Pastoral leasehold land, 321
- Patents, 299
- Peacekeeping and peace support missions, 61
- Pears, 374, 375
- PEN NZ Inc, 241
- Penal institutions
- Prisons
- Pensions
- expenditure, 130
- number in force, 131
- NZ superannuation, 127, 130–131, 132
- overseas pensions, taxation of, 504
- Performing arts, 242–246
- Perinatal and Maternity Mortality Review Committee, 140
- Personal accident insurance cover, 165–167
- Personal computers
- Computers
- Internet
- Personal information, disclosure of, 41
- Personal Property Securities Register, 443
- Personal services, employee count in sector, 356
- Peru, relationship with, 57
- Pests and diseases
- management services, 359
- varroa mite, 371
- Petrochemicals, 401
- Petroleum
- exploration and development, 313, 391
- imports, 473
- Pharmaceutical benefits, 145, 146
- Pharmaceutical Management Agency (PHARMAC), 146
- Pharmacists, 144
- Photography, aerial, 318
- Physical recreation
- Sport and physical recreation
- Physiotherapists, 143
- PICTA (Pacific Island Countries Trade Agreement), 52
- Pigs, 369
- Pipfruit, 373, 374
- Pitcairn Islanders, migrant quota, 111
- Place names, 318
- Plant species, 11–12
- Plant variety rights, 299
- Platinum group metals, 406
- Playcentres, 182
- Playgroups, 183
- Plunket Society, 152
- Podiatrists, 144
- Police
- armed offenders squads, 214
- assaults on, 215
- censorship law, enforcement of, 249
- Commissioner, 214
- communities and, 216
- Criminal Investigation Branch, 215
- drug seizures, 215
- fingerprints, 204
- generally, 214
- International Service Group, 215
- museum, 216
- operations, 214–216
- overseas duty, 214
- Police Infringement Bureau, 215
- population per sworn officer, 214
- prosecutors, 214
- search and rescue, 215
- Special Tactics Group, 214–215
- speed cameras, 215, 445
- Youth Education Service, 215–216
- Police Complaints Authority, 214
- Police Detention Legal Assistance, 197
- Police dogs, 215
- Political history, 15–16
- Political parties
- representation, 28
- role, 28
- seats held after general elections, 27
- Pollution
- air, 306
- marine environment, 308, 431
- water, 314
- water quality, 307
- Polynesian discovery and settlement of NZ, 13
- Polynesian peoples
- Pacific peoples
- Polytechnics
- governance, 175
- list of, 186
- number of, 38
- Open Polytechnic of NZ, 186–187
- research, science and technology, 298
- vocational qualifications, 188
- Population
- age-sex profile, 98–99
- age distribution, 99, 102
- Population growth
- Māori population mortality, 95–96
- census of 1871, 15
- Population growth
- Māori population mortality, 95–96
- growth, 99, 100
- Population growth
- Māori population mortality, 95–96
- projections, 84
- Population growth
- Māori population mortality, 95–96
- proportion of total population, 84
- Population growth
- Māori population mortality, 95–96
- age distribution, 117
- geographical distribution, 118–119
- growth, 101, 102
- projections, 84
- proportion of total population, 84
- rounding and random rounding, 85
- Asian
- age distribution, 99, 102
- Population growth
- Māori population mortality, 95–96
- census of 1871, 15
- Population growth
- Māori population mortality, 95–96
- growth, 99, 100
- Population growth
- Māori population mortality, 95–96
- projections, 84
- Population growth
- Māori population mortality, 95–96
- proportion of total population, 84
- Population growth
- Māori population mortality, 95–96
- age distribution, 117
- geographical distribution, 118–119
- growth, 101, 102
- projections, 84
- proportion of total population, 84
- rounding and random rounding, 85
- components of change, 91–98
- age distribution, 99, 102
- Population growth
- Māori population mortality, 95–96
- census of 1871, 15
- Population growth
- Māori population mortality, 95–96
- growth, 99, 100
- Population growth
- Māori population mortality, 95–96
- projections, 84
- Population growth
- Māori population mortality, 95–96
- proportion of total population, 84
- Population growth
- Māori population mortality, 95–96
- age distribution, 117
- geographical distribution, 118–119
- growth, 101, 102
- projections, 84
- proportion of total population, 84
- rounding and random rounding, 85
- counting, 85
- age distribution, 99, 102
- Population growth
- Māori population mortality, 95–96
- census of 1871, 15
- Population growth
- Māori population mortality, 95–96
- growth, 99, 100
- Population growth
- Māori population mortality, 95–96
- projections, 84
- Population growth
- Māori population mortality, 95–96
- proportion of total population, 84
- Population growth
- Māori population mortality, 95–96
- age distribution, 117
- geographical distribution, 118–119
- growth, 101, 102
- projections, 84
- proportion of total population, 84
- rounding and random rounding, 85
- country of birth, 103
- age distribution, 99, 102
- Population growth
- Māori population mortality, 95–96
- census of 1871, 15
- Population growth
- Māori population mortality, 95–96
- growth, 99, 100
- Population growth
- Māori population mortality, 95–96
- projections, 84
- Population growth
- Māori population mortality, 95–96
- proportion of total population, 84
- Population growth
- Māori population mortality, 95–96
- age distribution, 117
- geographical distribution, 118–119
- growth, 101, 102
- projections, 84
- proportion of total population, 84
- rounding and random rounding, 85
- density, 80
- age distribution, 99, 102
- Population growth
- Māori population mortality, 95–96
- census of 1871, 15
- Population growth
- Māori population mortality, 95–96
- growth, 99, 100
- Population growth
- Māori population mortality, 95–96
- projections, 84
- Population growth
- Māori population mortality, 95–96
- proportion of total population, 84
- Population growth
- Māori population mortality, 95–96
- age distribution, 117
- geographical distribution, 118–119
- growth, 101, 102
- projections, 84
- proportion of total population, 84
- rounding and random rounding, 85
- distribution, 86–90
- age distribution, 99, 102
- Population growth
- Māori population mortality, 95–96
- census of 1871, 15
- Population growth
- Māori population mortality, 95–96
- growth, 99, 100
- Population growth
- Māori population mortality, 95–96
- projections, 84
- Population growth
- Māori population mortality, 95–96
- proportion of total population, 84
- Population growth
- Māori population mortality, 95–96
- age distribution, 117
- geographical distribution, 118–119
- growth, 101, 102
- projections, 84
- proportion of total population, 84
- rounding and random rounding, 85
- estimated population, 1885–2004, 86
- age distribution, 99, 102
- Population growth
- Māori population mortality, 95–96
- census of 1871, 15
- Population growth
- Māori population mortality, 95–96
- growth, 99, 100
- Population growth
- Māori population mortality, 95–96
- projections, 84
- Population growth
- Māori population mortality, 95–96
- proportion of total population, 84
- Population growth
- Māori population mortality, 95–96
- age distribution, 117
- geographical distribution, 118–119
- growth, 101, 102
- projections, 84
- proportion of total population, 84
- rounding and random rounding, 85
- ethnic composition, 83–84, 101–102
- age distribution, 99, 102
- Population growth
- Māori population mortality, 95–96
- census of 1871, 15
- Population growth
- Māori population mortality, 95–96
- growth, 99, 100
- Population growth
- Māori population mortality, 95–96
- projections, 84
- Population growth
- Māori population mortality, 95–96
- proportion of total population, 84
- Population growth
- Māori population mortality, 95–96
- age distribution, 117
- geographical distribution, 118–119
- growth, 101, 102
- projections, 84
- proportion of total population, 84
- rounding and random rounding, 85
- European
- age distribution, 99, 102
- Population growth
- Māori population mortality, 95–96
- census of 1871, 15
- Population growth
- Māori population mortality, 95–96
- growth, 99, 100
- Population growth
- Māori population mortality, 95–96
- projections, 84
- Population growth
- Māori population mortality, 95–96
- proportion of total population, 84
- Population growth
- Māori population mortality, 95–96
- age distribution, 117
- geographical distribution, 118–119
- growth, 101, 102
- projections, 84
- proportion of total population, 84
- rounding and random rounding, 85
- ex-nuptial births, 92, 93
- age distribution, 117
- geographical distribution, 118–119
- growth, 101, 102
- projections, 84
- proportion of total population, 84
- rounding and random rounding, 85
- external migration, 96–97
- age distribution, 117
- geographical distribution, 118–119
- growth, 101, 102
- projections, 84
- proportion of total population, 84
- rounding and random rounding, 85
- fertility rate, 80, 91–93
- age distribution, 117
- geographical distribution, 118–119
- growth, 101, 102
- projections, 84
- proportion of total population, 84
- rounding and random rounding, 85
- growth
- age distribution, 117
- geographical distribution, 118–119
- growth, 101, 102
- projections, 84
- proportion of total population, 84
- rounding and random rounding, 85
- internal migration, 87
- age distribution, 117
- geographical distribution, 118–119
- growth, 101, 102
- projections, 84
- proportion of total population, 84
- rounding and random rounding, 85
- life expectancy, 95
- age distribution, 117
- geographical distribution, 118–119
- growth, 101, 102
- projections, 84
- proportion of total population, 84
- rounding and random rounding, 85
- local government areas, 89–90
- age distribution, 117
- geographical distribution, 118–119
- growth, 101, 102
- projections, 84
- proportion of total population, 84
- rounding and random rounding, 85
- Māori
- age distribution, 117
- geographical distribution, 118–119
- growth, 101, 102
- projections, 84
- proportion of total population, 84
- rounding and random rounding, 85
- net migration, 97–98
- age distribution, 117
- geographical distribution, 118–119
- growth, 101, 102
- projections, 84
- proportion of total population, 84
- rounding and random rounding, 85
- North Island, 86, 87
- age distribution, 117
- geographical distribution, 118–119
- growth, 101, 102
- projections, 84
- proportion of total population, 84
- rounding and random rounding, 85
- overseas-born, 102, 103
- age distribution, 117
- geographical distribution, 118–119
- growth, 101, 102
- projections, 84
- proportion of total population, 84
- rounding and random rounding, 85
- Pacific peoples
- age distribution, 117
- geographical distribution, 118–119
- growth, 101, 102
- projections, 84
- proportion of total population, 84
- rounding and random rounding, 85
- school age, 174
- South Island, 86, 87
- urban and rural, 87–88
- vital statistics, 94
- Population growth
- censuses, 1858–2001, 80
- 5 million mark, 100
- age groups, 81, 82–83, 84
- Auckland region, 87
- components of population change, 81
- dependency ratio, 81
- educational age groups, 82–83, 174
- ethnic population, 84
- families and households, 85
- generally, 81
- North Island, 87
- South Island, 87
- territorial authorities, 85
- components of change, 91–98
- 5 million mark, 100
- age groups, 81, 82–83, 84
- Auckland region, 87
- components of population change, 81
- dependency ratio, 81
- educational age groups, 82–83, 174
- ethnic population, 84
- families and households, 85
- generally, 81
- North Island, 87
- South Island, 87
- territorial authorities, 85
- ethnic groups, 83–84, 101–102
- 5 million mark, 100
- age groups, 81, 82–83, 84
- Auckland region, 87
- components of population change, 81
- dependency ratio, 81
- educational age groups, 82–83, 174
- ethnic population, 84
- families and households, 85
- generally, 81
- North Island, 87
- South Island, 87
- territorial authorities, 85
- future demographic trends, 80
- 5 million mark, 100
- age groups, 81, 82–83, 84
- Auckland region, 87
- components of population change, 81
- dependency ratio, 81
- educational age groups, 82–83, 174
- ethnic population, 84
- families and households, 85
- generally, 81
- North Island, 87
- South Island, 87
- territorial authorities, 85
- historical and projected, 79
- 5 million mark, 100
- age groups, 81, 82–83, 84
- Auckland region, 87
- components of population change, 81
- dependency ratio, 81
- educational age groups, 82–83, 174
- ethnic population, 84
- families and households, 85
- generally, 81
- North Island, 87
- South Island, 87
- territorial authorities, 85
- projections
- 5 million mark, 100
- age groups, 81, 82–83, 84
- Auckland region, 87
- components of population change, 81
- dependency ratio, 81
- educational age groups, 82–83, 174
- ethnic population, 84
- families and households, 85
- generally, 81
- North Island, 87
- South Island, 87
- territorial authorities, 85
- Pork industry, 369
- Pork Industry Board, NZ, 369
- Port companies
- generally, 430
- overseas cargo loaded and unloaded, 480–482
- Positive Ageing Strategy, NZ, 131
- Postal services, 231–233
- Pouhere Taonga (NZ Historic Places Trust), 237–238, 327
- Poultry industry, 370
- Poultry Industry Association of NZ (PIANZ), 370
- Pounamu, 309, 407
- Premiers, former, 26
- Prescription charges, 145, 146
- Press Association, NZ, 229
- Press Council, NZ, 229–230
- Preventive detention, 211
- Prices
- building and construction, 427
- deflation uses, 333, 334
- expenditure weights, 333
- generally, 332
- groups of items, 334–335
- indexation of contracts, 333–334
- inflation rate, 330, 336
- inflation target, 331
- monetary policy, 331–332, 334
- price collection, 333
- retail prices of selected items, 335
- Consumers Price Index
- deflation uses, 333, 334
- expenditure weights, 333
- generally, 332
- groups of items, 334–335
- indexation of contracts, 333–334
- inflation rate, 330, 336
- inflation target, 331
- monetary policy, 331–332, 334
- price collection, 333
- retail prices of selected items, 335
- generally, 332
- houses, 417–418
- Producers Price Index, 336–337
- ‘pure price changes’, 332
- share price movement, 455
- Primary Health Organisations (PHOs), 145
- Primary production
- Agricultural sector
- Forests and forestry
- Prime Ministers
- former, 26
- Helen Clark, 26
- Prime Television, 225
- Prisons
- contracted facilities and services, 207
- imprisonment rates, OECD, 194
- new facilities, 209
- parole eligibility and final release, 211–212
- parole, numbers on, 209
- prisoner escort services, 207
- prisoners, 212–214
- Public Prisons Service, 209–210
- sentence of imprisonment, 205, 211
- Privacy commissioner, 41–42
- Private schools, 184
- Private training establishments (PTEs), 179, 187
- Privatisation of state assets, 16
- Privy Council, 194
- Probation and Offender Services, 208–209
- Problem gambling, 155, 263
- Problem gambling levy, 504
- Producers Price Index (PPI), 336–337
- Progressive Party, coalition agreement, 28
- Project PROBE, 217
- Property (Relationships) Act 1976, 123
- Property offences, 201
- Property services, employee count in sector, 356
- Protected areas, OECD comparisons, 304
- Protected Disclosures Act 2000, 41
- Protected Natural Areas Programme, 326
- Protection orders, 204
- Psychologists, 143
- Public Advisory Committee on Disarmament and Arms Control (PACDAC), 76–77
- Public debt, 331, 507–508
- Public health
- alcohol, 147
- cancer control, 151
- child health, 155
- communicable disease control, 150
- complementary service providers, 147
- dental health, 155–156
- disability support services, 153
- drinking water, 147
- drug misuse, 147
- family health, 153
- food safety and quality, 150–151
- generally, 146–147
- immunisation, 150, 154
- Māori health, 154
- mental health, 152, 157
- obesity, 153
- older people, 151–152
- pandemic plan, 150
- reproductive health, 153–154
- sexual health, 153–154
- suicide prevention, 152–153
- tobacco, 148–149
- voluntary welfare organisations, 152
- women's health, 154–155
- Public Health Intelligence, 139
- Public holidays, employee entitlements, 273–274
- Public hospitals, 145, 156–157
- Public libraries, 240–241
- Public Prisons Service, 209–210
- Public radio, 226–227
- Public register privacy principles, 41
- Public sector finance
- Government finance
- Public Service
- State sector
- Public Trust, 43–44
- Publications and publishing
- books, 241–242
- censorship, 248–249
- magazines, 229
- newspapers, 228–229
- NZ National Bibliography, 239
- Pulp and paper industry, 380–381, 383
- Push Play, 259
Q
- Qualifications
- bachelor degrees, 186
- National Qualifications Framework, 172–174
- NCEA, 173–174, 185
- NZ Scholarship, 174, 185
- quality assurance, 175–176
- tertiary qualification completions, 187–188
- vocational, 188–189
- Qualmark NZ Ltd, 265, 268
- Quarantine services, 358, 385
- Queen Elizabeth II National Trust, 305, 327
- Queen of NZ, 23, 193
- Queen's Chain, 325
- Queen's Service Medal, 25
- Queen's Service Order, 25
- Quotable Value (QV), 321
R
- Race Relations Commissioner, 122
- Racing
- broadcasting, 226
- generally, 260–261
- Radiation Protection Advisory Council, 140
- Radiation technologists, 144–145
- Radio
- archives, 227
- broadcasting policy, 221, 222
- commercial radio, 227
- community access, 227
- Māori broadcasting, 222–223, 236
- NZ On Air, 222
- Pacific region, 226
- public radio, 226–227
- Radio Network of NZ Ltd, 227
- Radio NZ, 226–227
- Radioactive substances, regulation of, 313
- Radiocommunications, 226
- Railways
- generally, 436–437
- noise reduction, 439
- Rain days, 8
- Rainfall, 8, 9, 10, 11
- Rakiura, land area, 1
- Raoul Island, land area, 1
- Rates
- rating valuations, 321
- setting of, 44
- Receiverships, 456
- Recreation
- Arts and cultural heritage
- Leisure
- Sport and physical recreation
- Recreation reserves, 325
- Refugee immigration, 97, 110–111
- Regional Assistance Mission to the Solomon Islands (RAMSI), 53, 71, 215
- Regional councils, 45
- Regions
- arts development, 253–254
- Asian population, 121
- fruit plantings, 373
- income by, 285
- livestock distribution by, 361
- Māori population, 113
- Pacific peoples, 118–119
- population estimates, 90
- Project PROBE, 217
- retail sales by, 459
- television services, 225–226
- Registers
- births, deaths, marriages and civil unions, 93
- Register, 92
- Human Assisted Reproductive Technology
- Register, 92
- motor vehicles, 443
- public register privacy principles, 41
- Registration
- banks, 484
- companies, 451
- health service professionals, 142–145
- land titles, 318–319
- motor vehicles, 440–442
- ships, 430
- teachers, 175
- Relationship property legislation, 123
- Religious affiliation, 104
- Removal from NZ, 111
- Reproductive health, 153–154
- Reproductive technology
- Human assisted reproductive technology
- Rescue operations
- Defence Force assistance, 71
- police, 215
- Research, science and technology
- Advanced Network, 218, 224, 298
- biotechnology strategy, 294
- Carter Observatory, 297
- Cawthron Institute, 297, 298
- CCMAU, 289
- Centres of Research Excellence, 298
- Crown Research Institutes, 295–297
- energy sector, 395
- expenditure as proportion of GDP, 290
- Foundation for Research, Science and Technology, 292–293
- funding, 290–294
- generally, 289
- government departments, 297–298
- government research agencies, 295–298
- High Performance Computing Centres, 224
- intellectual property rights, 299–300
- MoRST, 289
- number of researchers, 290
- NZ Venture Investment Fund Ltd, 293
- organisation of, 289
- polytechnics, 294
- research associations, 298
- research consortia, 298
- Royal Society, 293
- Smash Palace Fund, 253
- standards and accreditation services, 300–301
- universities, 294, 298
- Vote: Research, Science and Technology, 291–292
- wānanga, 298
- Reserve Bank of NZ
- as part of state services, 37
- assets and liabilities, 485
- bank registration and supervision, 484
- functions, generally, 483
- government securities registers, 490
- monetary policy, 331–332, 489–490
- Reserve boards, 37
- Reserves, 325
- Resident withholding tax (RWT), 500
- Residential care
- older people, 152, 156
- young offenders, 134–135
- Residential sector
- Households
- Housing
- Resource management
- contaminated sites, 315
- mineral exploration and development, 313
- planning framework, 312–313
- pollution, 314
- soil management, 313, 314
- waste and landfills, 314–315
- water management, 313–314
- Restorative justice scheme, 201
- Retail trade and services
- credit cards, 459–460
- employee count in sector, 355
- information technology goods and services, 221
- retail sales, 458–459
- Retirement
- NZ Superannuation, 127, 130–131, 132
- Retirement Commission, 129
- Transitional Retirement Benefit, 130, 131
- Rivers
- didymo, 305
- generally, 2–3
- greatest flow, 1
- management, 314
- Queen's Chain, 325
- water quality, 307
- Road transport
- accidents, 160–162
- alcohol impairment, 444–445
- cycling, 438
- driver licensing, 444
- formed roads and streets, 440
- fuel excise, 503
- funding, 438
- generally, 438
- Land Transport NZ, 400, 438
- licensing, 440
- motor vehicle registers, 443
- noise reduction, 439
- public roads, expenditure on, 439
- road user charges, 503
- safety, 161, 438, 444–446
- safety belts, 444
- speed cameras, radar and lasers, 445
- speed limits, 445
- state highways, 439
- traffic offences and infringements, 202–203, 213, 445–446
- Transit NZ, 439
- vehicle inspection, 444
- vehicle registration and licensing, 440–442
- walking, 438
- Roads, 439–440
- Ross Dependency, 1, 66–67
- Rounding and random rounding, 85
- Royal Forest and Bird Protection Society of NZ Inc, 327
- Royal Honours, 23, 25
- Royal NZ Air Force, 75–76
- Royal NZ Ballet, 244
- Royal NZ Navy, 73–74
- Royal NZ Plunket Society, 152
- Royal Society of NZ, 293
- Ruapehu lahar, 6
- Rural Education Activities Programme, 180–181
- Rural land sales, 319
- Rural population, 87–88
- Russia, relationship with, 58
S
- Safety
- accident prevention, 164–165
- civil defence emergency management, 167
- fire protection, 167
- occupational safety and health, 168–169
- road, 161, 444–446
- water, 163
- Salaries and allowances
- judicial, 195
- parliamentary, 29
- salary and wage rates, 286
- Sale of liquor
- convictions for offences, 204
- generally, 450–451
- Salt, 407
- Samoa
- citizenship of NZ, 106
- migrant quota, 111
- migration to NZ from, 119
- Satyanand, Judge Anand, 24
- Scenic reserves, 325
- Scholarship, NZ, 174, 185
- School Journal, 176
- Schools
- administration, 174–176
- attainment levels, 183
- year of schooling, 184
- assessment, 184–185
- attainment levels, 183
- year of schooling, 184
- boarding, 184
- attainment levels, 183
- year of schooling, 184
- boarding bursaries, 178
- attainment levels, 183
- year of schooling, 184
- boards of trustees, 175
- attainment levels, 183
- year of schooling, 184
- CensusAtSchool project, 188
- attainment levels, 183
- year of schooling, 184
- Correspondence School, 184
- attainment levels, 183
- year of schooling, 184
- crime prevention programmes, 215–216
- attainment levels, 183
- year of schooling, 184
- curriculum, 171–172
- attainment levels, 183
- year of schooling, 184
- dental service, 155
- attainment levels, 183
- year of schooling, 184
- designated character schools, 184
- attainment levels, 183
- year of schooling, 184
- enrolments, 191–192
- attainment levels, 183
- year of schooling, 184
- full-time equivalent teaching staff, 190
- attainment levels, 183
- year of schooling, 184
- funding, 177–178
- attainment levels, 183
- year of schooling, 184
- governance, 175
- attainment levels, 183
- year of schooling, 184
- home-based schooling, 184
- attainment levels, 183
- year of schooling, 184
- institutions, number of, 191–192
- attainment levels, 183
- year of schooling, 184
- integrated schools, 184
- attainment levels, 183
- year of schooling, 184
- international students, 189–190
- attainment levels, 183
- year of schooling, 184
- kura kaupapa Māori, 116, 184
- attainment levels, 183
- year of schooling, 184
- literacy and numeracy, 172
- attainment levels, 183
- year of schooling, 184
- NCEA, 173–174, 185
- attainment levels, 183
- year of schooling, 184
- NZ Scholarship, 174, 175
- attainment levels, 183
- year of schooling, 184
- physical activity, 258
- attainment levels, 183
- year of schooling, 184
- private schools, 184
- attainment levels, 183
- year of schooling, 184
- Project PROBE, 217
- attainment levels, 183
- year of schooling, 184
- school age population, 82–83, 175
- attainment levels, 183
- year of schooling, 184
- school leavers
- attainment levels, 183
- year of schooling, 184
- services, 183–185
- special education, 174
- special schools, 184
- state schools, 184
- structure of system, 183
- transport, 178
- types, 184
- wharekura, 116
- Science sector
- Research, science and technology
- Scientific reserves, 325
- Scion, 295
- Scott Base, 66
- Sea Cadet Corps, 71
- Sea squirt, 305
- Seabed, ownership of, 320
- Seafood exports, 389–390, 467–469
- Search and rescue
- Defence Force assistance, 71
- police, 215
- Secretariat of the Pacific Community, 53, 60
- Secretary of the Cabinet, 32
- Securities Commission, 454
- Securities market, government, 491
- Securities trading, 455
- Security
- Defence and security
- Security Intelligence Service (NZSIS), 77
- Security interests in vehicles, registration of, 443
- Seed certification, 373
- Seed exports, 372, 373
- Select committees, 28, 29
- Senior citizensenior citizens
- Older people
- Sentences and sentencing, 205–206, 208–209, 211
- Service industries
- employee count in sector, 355–356
- GDP by industry, 342–343
- Services, exports and imports
- Exports and imports
- Sex offences, 200, 213
- Sex offenders, extended supervision, 209
- Sex ratios
- age-sex distribution, 98–99
- by industry, 281
- by occupation, 281
- labour force participation rates, 279
- Modern Apprenticeships, 281
- weekly earnings, 285
- attainment, 183
- by year of schooling, 184
- bachelor degrees, 186
- by industry, 281
- by occupation, 281
- labour force participation rates, 279
- Modern Apprenticeships, 281
- weekly earnings, 285
- attainment, 183
- by year of schooling, 184
- convicted offenders, 204
- by industry, 281
- by occupation, 281
- labour force participation rates, 279
- Modern Apprenticeships, 281
- weekly earnings, 285
- attainment, 183
- by year of schooling, 184
- deaths from external causes, 164
- by industry, 281
- by occupation, 281
- labour force participation rates, 279
- Modern Apprenticeships, 281
- weekly earnings, 285
- attainment, 183
- by year of schooling, 184
- employment
- by industry, 281
- by occupation, 281
- labour force participation rates, 279
- Modern Apprenticeships, 281
- weekly earnings, 285
- attainment, 183
- by year of schooling, 184
- Māori, 112
- attainment, 183
- by year of schooling, 184
- mortality, 95–96
- attainment, 183
- by year of schooling, 184
- prisoners, 212
- attainment, 183
- by year of schooling, 184
- school leavers
- attainment, 183
- by year of schooling, 184
- unemployment, 283, 284
- Sexual health, 153–154
- Share market, 454–455
- Sheep
- breeds, 360
- farming, 359
- Meat & Wool NZ, 364
- meat exports, 360, 364, 365, 465
- meat products, 362
- number of, 358, 360, 361
- wool, 365–367, 414
- Shipping movements, 429–432, 434
- Shooting and hunting, 260
- Shop trading hours, 450
- Sick leave, employee entitlements, 274
- Sickness Benefit, 127, 128, 130, 131
- Sierra Leone, deployment in, 59
- Silica sand, 407
- Silver, 406
- Sinai, Multilateral Force and Observers, 58, 61,70
- Singapore, free trade agreement with, 410
- Single Economic Market (SEM) with Australia, 55
- Single transferable vote (STV) system, 47
- SIS (Security Intelligence Service), 77
- Skiing, 260
- Skilled migrants, 108
- Skills-based work visas and permits, 109
- SKY Network Television Ltd, 225
- Smash Palace Fund, 253
- Smoke-free workplaces, 149
- Smokefree, 155
- Smoking, incidence of, 148–149
- Snowboarding, 260
- Social development
- aims, 125
- Social Development, Ministry of
- Work and Income
- child support payments, collection of, 130
- Social Development, Ministry of
- Work and Income
- Citizens Advice Bureau, 136
- Social Development, Ministry of
- Work and Income
- definition, 125
- Social Development, Ministry of
- Work and Income
- government agencies
- Social Development, Ministry of
- Work and Income
- research, 292
- Work and Income
- StudyLink, 129, 179–180
- Work and Income
- Trans-Tasman Travel Arrangement, 55
- Work and Income
- welfare benefits
- Work and Income
- Social Development, Ministry of, 125–136
- Child, Youth and Family adoption services, 135
- care and protection, 133–134
- Work and Income
- community services funding, 136
- Work and Income
- establishment of, 132
- Work and Income
- guiding principles, 133
- Work and Income
- youth justice services, 134–135
- Work and Income
- policy, 125
- Work and Income
- Work and Income
- Work and Income
- Social framework
- Asian population
- Asian population
- Ethnic groups
- European ethnic group
- Human rights
- Immigration
- Māori
- Pacific peoples
- Social development
- citizenship, 104–107
- Ethnic groups
- European ethnic group
- Human rights
- Immigration
- Māori
- Pacific peoples
- Social development
- ethnicity, generally
- Ethnic groups
- European ethnic group
- Human rights
- Immigration
- Māori
- Pacific peoples
- Social development
- European ethnic group
- European ethnic group
- Human rights
- Immigration
- Māori
- Pacific peoples
- Social development
- human rights
- Human rights
- Immigration
- Māori
- Pacific peoples
- Social development
- immigration
- Immigration
- Māori
- Pacific peoples
- Social development
- Māori
- Māori
- Pacific peoples
- Social development
- Pacific peoples
- Pacific peoples
- Social development
- religious affiliation, 104
- Social development
- social welfare
- Social development
- Social welfare benefits
- Work and Income
- SOEs (State-owned enterprises), 38
- Soil quality and conservation, 309–310, 313, 314
- Solar energy, 405
- Solicitor-General, 198
- Solomon Islands, deployment in, 53, 71, 215
- Sorted (Retirement Commission's website), 129
- Sound Archives, 227
- South Africa, 59, 61
- South Island
- land area, 1
- manufacturing, employment in, 412–413
- population, 86, 87
- South Korea, deployment in, 71
- South Pacific Applied Geoscience Commission (SOPAC), 53
- South Pacific Commission
- Secretariat of the Pacific Community
- South Pacific Forum, 52
- South Pacific Regional Environment Programme (SPREP), 53, 317
- South Pacific Regional Trade and Economic Cooperation Agreement (SPARTECA), 52
- Sovereigns
- Elizabeth II, 23, 193
- former, 23
- governor-general, appointment of, 24
- Spam, 221
- SPARC (Sport & Recreation NZ), 255–259
- Speakers of the House of Representatives, 27, 28, 30
- Special Air Service Group, 74
- Special Benefit, 129
- Special educationpecial education
- policy, 174
- transport assistance, 178
- Special Needs Grant, 129
- Special purpose local authorities, 46
- Special schools, 184
- Specialist Youth Service Corps, 123, 124
- Speed cameras, 215, 445
- Speed limits, 445
- Sport and physical recreation
- Academy of Sport, 257–258
- Active Communities, 259
- coaching, 258
- Conservation Department's role, 259
- disabled people, 258
- employee count in sector, 356
- generally, 255
- Green Prescriptions, 258
- high performance athletes, 257–258
- infrastructure development, 258
- Māori activity initiatives, 258
- Olympic Games, 257
- outdoor leisure activities, 259–260
- physical activity rates, 256
- Push Play, 259
- SPARC, 255–259
- volunteers, 255
- young people, 258–259
- Stamp duty, 503
- Stamp issues, 233
- Standards and accreditation services
- science and technology sector, 300–301
- tourist sector, 265, 268
- Standards NZ, 301
- State and state-integrated schoolstate and state-integrated schools
- Schools
- State assets, privatisation of, 16
- State-owned enterprises (SOEs), 38
- State sector
- CCMAU, 38, 40
- Budget, 494–497
- chief executives, 39, 493–494
- full-time equivalent staff, 37
- list, 36–37
- composition, 36–38
- Budget, 494–497
- chief executives, 39, 493–494
- full-time equivalent staff, 37
- list, 36–37
- Controller and Auditor-General, 38, 40
- Budget, 494–497
- chief executives, 39, 493–494
- full-time equivalent staff, 37
- list, 36–37
- Crown entities, 37
- Budget, 494–497
- chief executives, 39, 493–494
- full-time equivalent staff, 37
- list, 36–37
- employee count in government
- Budget, 494–497
- chief executives, 39, 493–494
- full-time equivalent staff, 37
- list, 36–37
- administration, 356
- Budget, 494–497
- chief executives, 39, 493–494
- full-time equivalent staff, 37
- list, 36–37
- human rights, 42–43
- Budget, 494–497
- chief executives, 39, 493–494
- full-time equivalent staff, 37
- list, 36–37
- offices of parliament, generally, 38
- Budget, 494–497
- chief executives, 39, 493–494
- full-time equivalent staff, 37
- list, 36–37
- official information, 40, 41
- Budget, 494–497
- chief executives, 39, 493–494
- full-time equivalent staff, 37
- list, 36–37
- Ombudsmen, 38, 40, 41
- Budget, 494–497
- chief executives, 39, 493–494
- full-time equivalent staff, 37
- list, 36–37
- Parliamentary Commissioner for the
- Budget, 494–497
- chief executives, 39, 493–494
- full-time equivalent staff, 37
- list, 36–37
- Environment, 43
- Budget, 494–497
- chief executives, 39, 493–494
- full-time equivalent staff, 37
- list, 36–37
- privacy commissioner, 41–42
- Budget, 494–497
- chief executives, 39, 493–494
- full-time equivalent staff, 37
- list, 36–37
- public service departments
- Budget, 494–497
- chief executives, 39, 493–494
- full-time equivalent staff, 37
- list, 36–37
- Public Trust, 43–44
- Reserve Bank of NZ, 37
- state-owned enterprises, 38
- state services, 36–37
- State Services Commission, 39
- State Services Commissioner, 38–39
- tertiary education institutions, 38
- Statistical calculations, rounding and random rounding, 85
- Step Up Scholarships, 179, 180
- Stewart Island, land area, 1
- Stock exchange (NZX), 454–455
- Streets, 440
- Strikes, 276–277trikes, 276–277
- String Quartet, NZ, 243
- Student Allowance, 179–180
- Student loan scheme, 180, 506
- Students
- Early childhood education
- Schools
- Tertiary education
- StudyLink, 129, 179–180
- Sudan, deployment in, 59, 61, 71
- Suicide prevention, 122, 152–153
- Sulphur, 407
- Sunshine hours, 8, 10
- SunSmart, 155
- Superannuation, NZ, 127, 130–131, 132
- Superconductivity, 395
- Supervision, sentence of, 209
- Supreme Court of NZ
- generally, 194
- Judges, 195
- Surveying
- hydrographic survey work for Defence Force, 73
- land, 318–319
- Symphony Orchestra, NZ, 242–243
- Syria, deployment in, 58, 61, 70
T
- Taihoro Nukurangi (NIWA), 296–297
- Takeovers Panel, 454
- Talent-based visas and work permits, 109–110
- Tangiwai rail disaster, 6
- Tariffs
- GATT Uruguay Round, 57, 63, 357, 358
- manufacturing sector, 410
- WTO Doha Development Round, 63, 317, 357, 358
- Tasman, Abel, 13
- Tasman Glacier, 1, 2
- Tatua Co-operative Dairy Co Ltd, 369
- Taupo Fishery Advisory Committee, 327
- Taxation
- cheque duty, 503
- companies, 501
- convictions for offences, 204
- double tax agreements, 504
- excise duty, 502–503
- family assistance payments, 504–505
- fringe benefit tax, 502
- gaming duty, 503–504
- gift duty, 503
- goods and services tax, 502
- gross income and tax paid, 286
- imputation credits, 501
- income tax, 500–501
- individuals, 500
- international tax, 501, 504
- non-residents, 504
- NRWT, 501, 504
- overseas pensions, 504
- public account taxation and national disposable income, 507
- rebates, 501
- resident withholding tax, 500
- revenue from, 506
- review authorities, 507
- road user charges, 503
- stamp duty, 503
- Te āhurutanga (NZ Register of Quality Assured Qualifications), 175–176
- Te Aka Matua o te Ture (Law Commission), 197
- Te Am: The Encyclopedia of NZ, 16, 251
- Te Hakituatahi o Aotearoa (First Flag of NZ), 49
- Te Kāhui Tika Tangata (Human Rights Commission), 42, 122–123
- Te Kaunihera Māori (NZ Māori Council), 116
- Te Komihana Tirotiro Aitua Waka (Transport Accident Investigation Commission), 429
- Te Kooti Whenua Māori (Māori Land Court), 196, 320
- Te Kotahitanga Manu Reo O Aotearoa (NZ Choral Federation), 244
- Te Kura Toi Whakaari O Aotearoa (NZ Drama School), 244
- Te Manatu Ahuwhenua, Ngaherehere (MAF), 358–359
- Te Manatu Whakaiato Taiohi (Ministry of Youth Development), 122–123
- Te Māngai Pāho, 223
- Te Matatini Society Inc, 236
- Te Ohu Kai Moana, 388
- Te Papa Tongarewa (Museum of NZ), 236–237
- Te Pou Taki Korero (Learning Media Ltd), 176
- Te Pouherenga Kaiako o Aotearoa (NZ Teachers' Council), 175
- Te Puia Māori Arts and Crafts, 236
- Te Puna Mātauranga o Aotearoa (National Library of NZ), 239–240
- Te Puna Tahua (NZ Lottery Grants Board), 262–263
- Te Puni Kōkiri, 115
- Te Rākau Whakamarumaru (Ministry of Civil Defence and Emergency Management), 167
- Te reo Māori, 116–117, 236
- Te Reo Whakapuaki Irirangi (Te Māngai Pāho), 223
- Te Roopu Wahine Māori Toko i Te Ora (Māori Women's Welfare League), 116
- Te Rōpū Whakatarairanga Hauora (Health Sponsorship Council), 155
- Te Tāhuhu o te Mātauranga (Ministry of Education), 174
- Te Tari Hara Tāware (Serious Fraud Office), 453
- Te Tari Matawaka (Office of Ethnic Affairs), 119
- Te Tari O Te Kaitiaki Mo Ngā Take Mātauranga Māori (Māori Education Trust), 181
- Te Tari Tohu Taonga (National Preservation Office), 240
- Te Taura Whiri i te Reo Māori (Māori Language Commission), 117, 236
- Te Toihau Hauora Hauātanga (Health and Disability Commissioner), 142
- Te Whakakotahitanga o ngā iwi o Aotearoa (Māori Congress), 116
- Te Whāriki, 181
- Teacher registration, 175
- Teachers' Council, NZ, 175
- Technology sector
- Research, science and technology
- Telarc Ltd, 300
- Telecom Corporation of NZ Ltd, 223
- Telecommunications
- carriers, 218, 223–224
- relay service, 224
- services, 223–224
- Telecommunications Act 2001, 453
- Telecommunications Commissioner, 223
- Telecommunications Users' Association of NZ (TUANZ), 224
- Telephone density, 223
- Telephone number portability, 224
- Television
- broadcasting policy, 221–222
- community access, 226
- local content, 225
- Māori broadcasting, 222–223, 236
- most popular programmes, 225
- NZ On Air, 222
- service providers, 225–226
- TVNZ charter, 221
- Television NZ Ltd (TVNZ), 221, 225
- TelstraClear Ltd, 223–224
- Temperatures, 8, 9–10, 11
- Tenancy Tribunal, 197
- Territorial authorities
- generally, 45–46
- estimates, 89–90
- projections, 85
- population
- estimates, 89–90
- projections, 85
- Terrorism, 68, 77
- Tertiary councils, 175
- Tertiary education
- Accommodation Benefit, 180
- Wānanga
- administration, 175
- Wānanga
- attendance, 185
- Wānanga
- bachelor degrees, 186
- Wānanga
- Bursary, 180
- Wānanga
- enrolments, 191–192
- Wānanga
- enrolments by field of study, 187
- Wānanga
- full-time equivalent teaching staff, 190
- Wānanga
- funding, 178–180, 185
- Wānanga
- health professionals, 142–143, 144, 145
- Wānanga
- institutions, number of, 38, 191–192
- Wānanga
- international students, 189–190
- Wānanga
- Open Polytechnic of NZ, 186–187
- Wānanga
- polytechnics, 186
- Wānanga
- private training establishments, 179, 187
- Wānanga
- qualifications completions, 187–188
- Wānanga
- scholarships, 179, 180
- Wānanga
- scope of, 185
- Wānanga
- services, 185–189
- Wānanga
- Student Allowance, 179–180
- Wānanga
- student loan scheme, 180, 506
- Wānanga
- StudyLink, 129, 179–180
- Wānanga
- tertiary age population, 82–83
- Wānanga
- Tertiary Education Strategy, 185–186
- Wānanga
- universities, 186
- Wānanga
- vocational qualifications, 188–189
- Wānanga
- wānanga
- Wānanga
- Tertiary Education Commission (TEC), 185–186
- Textile industry, 414
- Thailand
- Closer Economic Partnership Agreement, 410
- police deployment in, 215
- Therapeutic products control, 55, 145
- Timber, 382, 383, 384–385imber, 382, 383, 384–385
- Time zone, 12
- Timor-Leste, deployment in, 61, 69, 70
- Tobacco consumption, 148–149
- Toi ihotm, 253, 265
- Toi te Taiao (Bioethics Council), 310
- Tokelau
- migration to NZ from, 119
- NZ jurisdiction, 1
- special relationship with, 51–52, 65–66
- Toll Holdings Ltd, 436
- Toll NZ, 437
- Tomb of the Unknown Warrior, 250, 251
- Tonga, migration to NZ from, 119
- Top Scholar Scholarships, 179
- Topography, national, 318
- Tornadoes, 11
- Tourism
- 100% Pure NZ campaign, 265
- accommodation, 268
- generally, 264
- international visitors, 266–269
- internet-based tools, 266–267
- market, 264
- organisations, 265–266
- Qualmark, 265, 268
- Strategy 2010, 265
- sustainability, 269
- transport, 268
- Tourism Industry Association NZ, 265
- Tourism, Ministry of, 265
- Tourism NZ, 265
- Tourism Research Council of NZ, 265
- Trackside, 226
- Trade
- domestic retail trade
- employee count in sector, 355
- Exports and imports
- Overseas trade
- generally, 458–460
- Exports and imports
- Overseas trade
- environment and, 317
- Exports and imports
- Overseas trade
- overseas
- Exports and imports
- Overseas trade
- wholesale retail trade, employee count in sector, 355
- Trade Aid, 61
- Trade and Enterprise, NZ, 409, 411–412, 461–462
- Trade Development Board, NZ, 51
- Trade union membership, 275
- Trade-weighted index, 491
- Trademarks, 299
- Traditional sites, protection of, 238
- Traffic offences and infringements, 202–203, 213, 445–446
- Training Benefit, 130, 131
- Training Incentive Allowance, 130
- Tramping, 260
- Tramping clubs, 325
- Trans-Pacific Strategic Economic Partnership, 57, 410
- Trans-Tasman Mutual Recognition Arrangement, 55
- Trans-Tasman Travel Arrangement, 55, 97
- Transit NZ, 439
- Transitional Retirement Benefit, 130, 131
- Transport
- civil aviation
- history, 15
- Road transport
- noise reduction, 439
- Road transport
- employee count in sector, 356
- history, 15
- Road transport
- noise reduction, 439
- Road transport
- energy use, domestic sector, 392
- history, 15
- Road transport
- noise reduction, 439
- Road transport
- generally, 429
- history, 15
- Road transport
- noise reduction, 439
- Road transport
- international visitors, 268
- history, 15
- Road transport
- noise reduction, 439
- Road transport
- railways, 436–437
- history, 15
- Road transport
- noise reduction, 439
- Road transport
- road transport
- Road transport
- school children, 178
- shipping, 429–432, 434
- Transport Accident Investigation Commission, 429
- Tranz Rail, 436
- Treasury bills, 490
- Treaty of Waitangi
- claims process, 114
- Office of Treaty Settlements, 115
- significance of, 114
- signing of, 14
- Tribunals, 197
- Trust administration, Public Trust, 44
- Tsunami (Boxing Day 2004), 56, 60
- Tsunami risk, 6
- TUANZ (Telecommunications Users' Association of NZ), 224
- Tuatara, 11
- Tui, 309
- TV
- Television
- TV3 Network Services Ltd, 225
- TVNZ (Television NZ Ltd), 221, 225
U
- UN (United Nations)
- contributions to, 60, 62
- Convention on the Safety of UN and Associated Personnel, 61
- Environment Programme, 62, 317
- Food and Agricultural Organisation, 358
- Framework Convention on Climate Change, 315, 316, 317
- generally, 62
- human rights resolutions, 62
- International Court of Justice, 61
- Security Council, 61
- specialised agencies, 62
- Truce Supervision Mission, 58, 61, 70
- Unemployment
- by age, 282, 283
- by educational attainment, 282, 283
- by ethnicity, 284
- by sex, 283, 284
- demographic and social characteristics, 282–284
- employment assistance, 283, 284–285
- rate, 282
- Work and Income, 126–128
- Unemployment Benefit
- entitlement, 128
- expenditure on, 130
- income adjustment, 127
- income testing, 127
- number in force, 131
- student hardship, 180
- work testing, 126
- UNESCO (UN Educational, Scientific and Cultural Organisation), 62
- Union membership, 275
- Unitary authorities, 46
- United Future, confidence and supply agreement, 28
- United Kingdom
- police deployment in, 215
- social security agreement with, 132
- United Nations
- UN (United Nations)
- United States
- defence relationship, 56, 69
- police deployment in, 215
- relationship with, 56
- trade with, 56, 475–476
- Universities
- bachelor degrees, 186
- governance, 175
- library services, 241
- list of, 186
- number of, 38
- research funding and activities, 294, 298
- University of the South Pacific, 53, 60
- University of the Third Age, 184
- Unsolicited Goods and Services Act 1975, 449
- Unsupported Child Benefit, 127, 129, 130, 131
- Urban design, research initiatives, 296
- Urban population, 87–88
- Uruguay, relationship with, 57
- Uruguay Round, GATT, 57, 63, 357, 358
V
- Vaccination, 150, 154, 296
- Valuation of land, 321–322
- Valuer-general, 318
- Valuers' Registration Board, 322
- Veal, 360–361, 362, 364
- Vegetable exports, 372, 466–467
- Vegetation, 11–12
- Vehicles
- Driving
- Motor vehicles
- Road transport
- Venture Investment Fund Ltd, NZ, 293
- Veteran's Pension, 127, 130, 131, 132
- Vice-regal representatives, 24
- Victim Support, 206–207
- Victims' rights, 211
- Video
- Film and video
- Violent offences, 199–200, 213
- Visitors' permits, 109
- Vital statistics, 94
- Vocational qualifications, 188–189
- Vodafone NZ Ltd, 224
- Volcanoes, 3, 4–5, 6–7olcanoes, 3, 4–5, 6–7
- Voluntary Agencies Support Scheme (VASS), 61
- Voluntary sector
- Community and voluntary sector
- Volunteer Service Abroad (VSA), 59, 61
- Voting
- local government elections, 47
- Parliamentary elections
- parliamentary elections
- Parliamentary elections
W
- Wages
- minimum wage, 273
- salary and wage rates, 286
- Waitangi National Trust Board, 327
- Waitangi, Treaty of
- Treaty of Waitangi
- Waitangi Tribunal, 16, 114, 197
- Walking and walkways, 155, 259, 260, 438
- Wānanga
- generally, 186
- governance, 175
- number of, 38
- research, science and technology, 298
- War memorials and graves, 250, 251
- War pensions, 130, 131, 132
- Wars, involvement in, 15–16
- Waste and landfills, 314–315
- Water
- accidents, 163
- drinking water, 147
- fluoridation, 156
- management, 310, 313–314
- pollution, 314
- quality, 307, 310, 314
- Water Safety NZ, 163
- Weapons, convictions for offences, 204
- Weather
- Climate
- Weights and Measures Act 1987, 448
- Welfare benefits
- Social development
- Westland Milk Products, 368
- Weta, 11
- Whale sanctuaries, 325–326
- Whales, 11
- Whaling Commission, 315, 316
- Whānau agreements, 133–134hānau agreements, 133–134
- Whangaehu Valley, lahar risk, 6
- Wharekura, 116
- Wholesale trade, employee count in sector, 355
- Widow's Benefit, 127, 128, 130, 131
- Wild Creations, 253
- Wildlife, 11, 12
- Wildlife reserves, 325
- Wind, 9, 10, 11
- Wind energy, 405
- Wine industry, 375
- Women
- convicted offenders, 204
- health services, 154–155
- issues, 122
- labour force participation, 279
- life expectancy, 95
- prisoners, 212
- unemployment, 283, 284
- weekly earnings, 285
- Women's Affairs, Ministry of, 122
- Wool, 296, 365–367, 414
- Work and Income
- benefits and pensions
- accommodation assistance, 423
- Unemployment Benefit
- advance payments, 129
- Unemployment Benefit
- continuation after death, 130
- Unemployment Benefit
- CPI-related adjustment of payments, 333
- Unemployment Benefit
- family assistance, 128–129
- Unemployment Benefit
- income support, 126–128
- Unemployment Benefit
- income testing, 127
- Unemployment Benefit
- NZ Superannuation, 127, 130–131, 132
- Unemployment Benefit
- other assistance, 129
- Unemployment Benefit
- payment during hospitalisation, 130
- Unemployment Benefit
- Special Needs Grant, 129
- Unemployment Benefit
- Transitional Retirement Benefit, 130, 131
- Unemployment Benefit
- types, 126
- Unemployment Benefit
- Unemployment Benefit
- Unemployment Benefit
- Veteran's Pension, 127, 130, 131, 132
- war pensions, 130, 131, 132
- work testing, 126
- employment assistance, 283, 284–285
- services, 126–132
- social security agreements, 132
- Work permits, 109–110
- Work stoppages, 276–277
- Working-age population, 82
- Working For Families, 128
- Working holiday schemes, 110
- Workplaces
- safety and health, 168–169
- smoke-free, 149
- World Bank, 62, 64
- World Customs Organisation, 462
- World Health Organisation (WHO), 62, 358
- World heritage areas, 324–325
- World Heritage Committee, 62
- World Meteorological Organisation, 62
- World of Wearable Art (WOW), 244
- World Trade Organisation (WTO)
- Cairns Group, 358
- Doha Development Round, 63, 317, 357, 358
- establishment, 63
- World Wars, involvement in, 15, 66
- Wrecks, 431
- Writers and writing, 241–242
- Writers' Fellowship, Michael King, 253
Y
- Young New Zealanders' Challenge, 123
- Young offenders
- convicted offenders, 205
- dealing with, 203
- diversion, 216
- family group conferences, 134
- home-based care, 134
- offences committed, 203
- residential care, 134–135
- Specialist Youth Service Corps, 123, 124
- youth justice services, 134–135
- Youth aid section, NZ Police, 216
- Youth Court, 196
- Youth Development, Ministry of, 122–123, 125
- Youth Development Partnership Fund, 123
- Youth Development Strategy Aotearoa, 123
- Youth Education Service (YES), 215–216
- Youth Health Action Plan, 155
- Youth issues, 122–123
- Youth minimum wage, 273
- Youth Orchestra, National, 243
- Youth Parliament, 123
- Youth Service Corps, 123, 124
- Youth suicide prevention, 122
Z
- Zeolite, 407