
Table of Contents
Social, economic, administrative, and political organisation is described in the New Zealand Official Yearbook and amplified by a wealth of statistics. Within New Zealand the Official Yearbook is not only a standard reference work for the general public, but is also a source of material for students and research workers. As international relationships grow, the Official Yearbook helps present New Zealand to the world in which this country has expanding interests.
In recent years new introductions have been added to most sections; the aim has been to provide a background guide to which users can relate detailed information.
In this issue all values expressed in New Zealand currency have been converted to decimal currency, which was introduced into New Zealand on 10 July 1967. The pound (£) used in previous issues is equivalent to two dollars ($). At the same time, the opportunity has been taken to round many more figures in the tables to the nearest thousand or some other convenient unit; this aids assimilation and facilitates comparisons.
There is a special article on scientific research included in this issue.
The photographic section features natural attractions of New Zealand.
Additional detail on many subjects may be obtained from publications of the Department of Statistics. These are listed towards the end of this Yearbook and are available from the Government Printer.
I desire to express my appreciation to officers of this and other Government Departments for their assistance in preparing material and to the Government Printer and his staff for co-operation in the printing of this volume. My thanks for their comprehensive contribution to the production of the Yearbook are extended to Mr J. B. McKinney, M.A., ADMIN, PROF. Editor of Publications and members of the Editorial Branch and Statistical Draughting Unit of the Department of Statistics.
 | |
| GOVERNMENT STATISTICIAN | |
| Department of Statistics. Wellington, 10 July 1967. |
SYMBOLS
The interpretation of the symbols used in the tables throughout this publication is as follows:
- nil or zero
. . figures not available
not yet available — space left blank
. . . not applicable
- - amount too small to be expressed
x revised
VALUES
All values are shown in New Zealand currency, unless another currency is specifically stated. The pound (£) in previous issues has been superseded by the dollar ($) two of which are equivalent to the previous pound. The cent is one-hundredth part of the dollar and is equivalent to 1.2 pence.
MEASURES
Unless otherwise stated, a ton is a long ton (2,240 lb).
ROUNDING
On occasions figures are rounded off to the nearest thousand or some other convenient unit. This may result in a total disagreeing slightly with the total of the individual items as shown in tables. Where figures are rounded the unit is in general expressed in words below the table headings, but where space does not allow this the unit may be shown as 000 for thousand, etc.
FISCAL YEARS
Figures for fiscal years ended 31 March (the fiscal year) are indicated in the text and headings of tables; otherwise figures are mainly for calendar years.
ABBREVIATIONS
| bd. ft. | board feet | m | mile |
| ch | chains | min | minute |
| ctd. | continued | mm | millimetre |
| cu. ft. | cubic feet | N | north |
| cwt | hundredweight | n.e.i. | not elsewhere included |
| d. | pence | n.e.c. | not elsewhere classified |
| E | east | oz | ounce |
| ft | feet | $(000) | thousand dollars |
| g | gramme | $(m) | million dollars |
| gal | gallon | c | cent |
| h | hour | S | south |
| h.p. | horsepower | sq. ft. | square feet |
| in. | inch | sup. ft. | super feet |
| kW | kilowatt | W | west |
| kWh | kilowatt-hour | y | yard |
| lb | pound |
STATISTICAL AREAS
The boundaries of statistical areas are shown on the map inside the back cover
Table of Contents
GEOGRAPHICAL POSITION—The islands of New Zealand have been shaped from the projecting crests of earth folds which rise as broad ridges from the floor of the South Pacific Ocean, 1,000 miles east of the continent of Australia. There are three main islands—North, South, and Stewart separated only by relatively narrow straits—with adjacent islets and a small group called Chatham Islands, 530 statute miles to the east of Lyttelton. Dating from 1842 the administrative boundaries of New Zealand, exclusive of island territories, extend from 33 degrees to 53 degrees south latitude and from 162 degrees east longitude to 173 degrees west longitude. Inhabited outlying minor islands are Raoul Island in the Kermadec Group, 620 statute miles north-east of the Bay of Islands, and Campbell Island, 370 statute miles south of Stewart Island.
New Zealand is also responsible for the administration of two island groups in the southwest Pacific—Niue Island and the Tokelau Islands. These are incorporated within the boundaries of New Zealand. Niue Island is 1,540 statute miles north-east of Auckland, while the Tokelau Islands are 704 statute miles further north. The territorial area reaches to within 8 degrees of the Equator. The Cook Islands, previously administered by New Zealand, became self-governing from 4 August 1965, although New Zealand continues to be responsible for their external affairs and defence; the principal island, Rarotonga, is 1,870 statute miles north-east of Auckland.
The Ross Dependency, some 1,500 statute miles to the south, has been under New Zealand's jurisdiction since 1923 and comprises the sector of the Antarctic continent between 160 degrees east and 150 degrees west longitude, together with the islands lying between those degrees of longitude and south of latitude 60 degrees south.
The administrative area of New Zealand can be classified as follows. In this Yearbook, in general, New Zealand refers to the group of islands shown in (a) only, unless it is expressly stated that the other islands as a whole or in part are included.
New Zealand:
| (a) Exclusive of island territories— | Area in Square Miles |
|---|---|
* Situated off North Island. † Situated off South Island. | |
| North Island | 44,281 |
| South Island | 58,093 |
| Stewart Island | 670 |
| Chatham Islands | 372 |
| Minor islands— | |
| Inhabited— | |
| Kermadec Islands* | 13 |
| Campbell Island† | 44 |
| Uninhabited (areas in parentheses) | 263 |
| Three Kings* (3); Snares† (1); Solander† (1/2); Antipodes† (24); Bounty† (1/2); Auckland† (234). | |
| Total New Zealand, exclusive of island territories | 103,736 |
| (b) Island territories— | Area in Square Miles |
|---|---|
| Tokelau Islands, comprised of— | |
| Fakaofo Island, Nukunono Island, Atafu Island | 4 |
| Niue Island | 100 |
| (c) Cook and associated islands, comprised of— | Area in Square Miles |
|---|---|
| Southern Group | 82 |
| Rarotonga, Aitutaki, Mangaia, Mauke, Atiu, Takutea, Mitiaro, Manuae and Te-au-o-tu. | |
| Northern Group | 11 |
| Palmerston, Pukapuka, Penrhyn, Suwarrow, Manihiki, Nassau, Rakahanga. |
| (d) Ross Dependency | (Estimated) 160,000 |
Western Samoa, which had been administered as a trust territory since 1946, became an independent territory from 1 January 1962.
The relevant Proclamations, defining from time to time the administrative area of New Zealand, are briefly referred to in Section 2.
GEOGRAPHICAL FEATURES: Coastline—Since the combined length of the North and South Islands extends just over a thousand miles, and since the width of neither Island exceeds 280 miles at its broadest point, New Zealand possesses a very lengthy coastline in proportion to its area. With the exception of the low-lying North Auckland Peninsula, the New Zealand land mass lies along a south-westerly and north-easterly axis, parallel to the direction of its mountain chains.
By reason of the latter fact the coastline is, on the whole, not greatly indented; and, as a consequence, New Zealand is not well endowed with natural harbours. In the North Island, Auckland and Wellington are two safe natural harbours of which the fullest commercial use is made and the use of Tauranga harbour is expanding. On the east coast of the North Auckland Peninsula several deep and sheltered harbours exist, but production from the hinterland is limited. In the South Island the Marlborough Sounds and the West Coast Sounds form perfect land-locked harbours, but owing to their situations and to the rugged nature of the terrain they have—with the exception of Queen Charlotte Sound—little or no commercial utility. Where vital localities have not been endowed with ideal harbours it has been necessary to improve existing facilities by dredging and by breakwater construction, etc. In this manner efficient ports, capable of accommodating overseas vessels, have been formed in Lyttelton, Otago, and Bluff Harbours. On the west coast of both Islands the strong ocean drifts and high seas cause shoaling at river mouths and harbour entrances, while on the east coast of the South Island similar circumstances prevail, due to the large quantities of shingle brought down by the rivers being spread along the coast by ocean currents. The mountainous nature of the country makes the haulage of goods to and from the better equipped natural harbours both costly and difficult, and the construction and maintenance of further ports at various points along the coasts of both Islands has been necessary, either by dredging river mouths or by harbour-construction work.
Mountains—The mountainous nature of New Zealand is one of its most striking physical characteristics, less than one-quarter of the land surface lying below the 650 ft contour. In the North Island the higher mountains occupy approximately one-tenth of the surface; but, with the exception of the four volcanic peaks of Egmont (8,260 ft), Ruapehu (9,175 ft), Ngauruhoe (7,515 ft), and Tongariro (6,458 ft), they do not exceed an altitude of 6,000 ft. Of these four volcanoes only the first named can be classed as dormant. Ruapehu and Ngauruhoe have been particularly active from time to time. Other volcanoes include Mount Tarawera and White Island, each of which has, upon one occasion within historical times, erupted with disastrous consequences. Closely connected with the volcanic system are the multitudinous hot springs and geysers.
The mountain system of the North Island runs generally in a south-west direction, parallel to the coast, from East Cape to Turakirae Head, and includes the following ranges from the north: Raukumara, Huiarau, Ruahine, Tararua, and Rimutaka. This chain is flanked on the west between the Huiarau and Ruahine by the Ahimanawa, Kaweka, and Kaimanawa Ranges, while west of the Kaimanawa is the National Park volcanic group comprising Mounts Ruapehu, Ngauruhoe, and Tongariro. The Hauhangaroa and Rangitoto Ranges run in a northerly direction from the National Park group. In the east the Moehau Range parallels the length of the Coromandel Peninsula. Mount Egmont forms the only area above 4,000 ft on the west coast of this Island.
The South Island is much more mountainous than the North, but shows fewer manifestations of recent volcanic activity. Along almost the entire length of the Island runs the massive chain known as the Southern Alps, which attains its greatest height in Mount Cook (12,349 ft), while no fewer than 16 peaks exceed 10,000 ft. West and north-west of the main portion of the Southern Alps are the Victoria, Brunner, and Lyell Ranges and the Tasman Mountains, the Victoria Range being flanked by the Paparoa Range. To the north run the St. Arnaud and Richmond Ranges, while to the north-east are the Spenser Mountains and the Kaikoura and Seaward Kaikoura Ranges, the two latter ranges running parallel to the east coast. The south portion of the Southern Alps breaks up into a miscellany of ranges dominating the mountainous Fiord and north-western Southland regions.
As might be expected, the higher mountains of the South Island have exerted a greater influence on the economic development of the country than those of the North Island. For many years the Southern Alps were an effective barrier to communication by land between the east and west coasts, while their climatic effects on the Canterbury plains and Otago plateaus determined the types of cultivation undertaken. Moreover, the existence of much elevated open country led to the development of pastoral holdings on a large scale. While the mountains in the North Island are not as high nor as extensive as those of the South Island, in the early days they effectively isolated various portions of the coastal plains and valleys. Their effect on climatic conditions, however, is considerably less, the rainfall being more evenly distributed. Owing to this more even distribution of the rainfall, and to the existence of considerable areas of lower relief, the foothills of the mountain systems were heavily wooded, and so proved a hindrance to agrarian development.
There are at least 223 named peaks of 7,500 ft or more in altitude. Below is a list of the peaks restricted to the four largest volcanic cones in the North Island and to mountains of a minimum height of 9,000 ft in the South Island.
| Mountain or Peak | Height (Feet) |
|---|---|
| NORTH ISLAND | |
| Ruapehu | 9,175 |
| Egmont | 8,260 |
| Ngauruhoe | 7,515 |
| Tongariro | 6,458 |
| SOUTH ISLAND | |
| Kaikoura Ranges— | |
| Tapuaenuku | 9,465 |
| Alarm | 9,400 |
| Southern Alps— | |
| Cook | 12,349 |
| Tasman | 11,475 |
| Dampier | 11,287 |
| Silberhorn | 10,757 |
| Lendenfeldt | 10,503 |
| St. David's Dome | 10,443 |
| Malte Brun | 10,421 |
| Torres | 10,376 |
| Teichelmann | 10,368 |
| Sefton | 10,359 |
| Haast | 10,295 |
| Elie de Beaumont | 10,200 |
| Douglas Peak | 10,107 |
| La Perouse | 10,101 |
| Haidinger | 10,059 |
| Minarets | 10,058 |
| Aspiring | 9,957 |
| Hamilton | 9,915 |
| Glacier Peak | 9,865 |
| De la Beche | 9,817 |
| Aiguilles Rouges | 9,731 |
| Nazomi | 9,716 |
| Darwin | 9,715 |
| Chudleigh | 9,686 |
| Annan | 9,667 |
| Low | 9,653 |
| Haeckel | 9,649 |
| Goldsmith | 9,532 |
| Conway Peak | 9,519 |
| Bristol Top | 9,508 |
| Walter | 9,507 |
| Grey | 9,490 |
| Green | 9,307 |
| Hutton | 9,297 |
| D'Archiac | 9,279 |
| Ronald Adair | 9,276 |
| Hochstetter Dome | 9,258 |
| Earnslaw | 9,250 |
| Nathan | 9,200 |
| Barnicoat | 9,183 |
| Sibbald | 9,181 |
| Arrowsmith | 9,171 |
| Spencer | 9,167 |
| The Footstool | 9,073 |
| Rudolf | 9,039 |
| The Dwarf | 9,025 |
| Darran Range— | |
| Tutoko | 9,042 |
Glaciers—In keeping with the dimensions of the mountain system, New Zealand possesses, in the South Island, a glacial system of some magnitude. Of the glaciers the largest is the Tasman, which, with others of comparable size, rises in the more elevated area surrounding Mount Cook. Flowing down the eastern slope of the range, the Tasman Glacier has a length of 18 miles and a width of 1 1/4 miles. In common with other glaciers on the eastern slope, of which the more important are the Murchison (11 miles), the Mueller (8 miles), the Godley (8 miles), and the Hooker (7 1/4 miles), its rate of flow is slow, while its terminal face is at an altitude of somewhat over 2,000 ft. On the western slope of the range, owing to the greater snow precipitation, the glaciers are more numerous and descend to lower levels, while the steeper slope gives them a more rapid rate of flow. The two largest of these are the Fox and the Franz Josef, with lengths of 9 3/4 miles and 8 1/2 miles respectively, and terminal faces at altitudes of 670 ft and 690 ft.
As will be realised, these glaciers are an important tourist attraction, and as such have definite economic significance. Moreover, those glaciers on the eastern slopes which feed rivers utilised for irrigation and hydro-electric purposes are valuable in that they help to ensure a steady volume of water throughout the year.
Rivers—Of the numerous New Zealand rivers few are of sufficient length or volume to be navigable. Moreover, owing to the high relief of the country, they are mostly swift-flowing, while, as mentioned previously, nearly all are obstructed at their mourns by bars. For the purpose of internal communication, therefore, they are of little economic utility, and only in two or three isolated instances have they been thus consistently used. With improved roading conditions, however, their traffic has become negligible even in these cases.
As sources of hydro-electric power New Zealand rivers are of considerable importance, since their rapid rate of flow and dependable volume of ice-free water make them eminently suitable for this purpose. At the present time the Waikato and the Mangahao in the North Island and the Waitaki, Cobb, Clutha, and Waipori in the South are used for major hydroelectric schemes. The characteristics just mentioned are also important for purposes of irrigation, but, owing to the country's reliable rainfall, there are few areas other than in Canterbury and Otago where the rivers are so utilised.
Following is a list of the more important rivers. For purposes of uniformity, the length of a river is taken to be the distance from the mouth to the farthest point in the system, whether this should happen to bear the same name or that of an affluent, and is inclusive of the estimated course of a river flowing into and emerging from any lake in the system.
| River | Length (Miles) |
|---|---|
*Cook Strait is defined as
follows: | |
| NORTH ISLAND | |
| Flowing into the Pacific Ocean— | |
| Piako | 65 |
| Waihou (or Thames) | 95 |
| Rangitaiki | 95 |
| Whakatane | 65 |
| Waiapu (from source, Mata River) | 75 |
| Waipaoa (from source, Waipapa Stream) | 70 |
| Wairoa (from source, Hangaroa River) | 85 |
| Mohaka (from source, Taharua River) | 95 |
| Ngaruroro | 90 |
| Tukituki | 70 |
| Flowing into Cook Strait*— | |
| Ruamahanga | 90 |
| Hutt | 35 |
| Flowing into the Tasman Sea— | |
| Otaki | 30 |
| Manawatu | 120 |
| Rangitikei | 130 |
| Turakina | 70 |
| Whangaehu | 100 |
| Wanganui | 180 |
| Waitotara | 55 |
| Patea | 75 |
| Waitara | 85 |
| Mokau | 85 |
| Waikato (from source, Upper Waikato River) | 270 |
| Wairoa (from source, Waiotu Stream) | 115 |
| Hokianga (from source, Waihou River) | 45 |
| SOUTH ISLAND | |
| Flowing into Cook Strait— | |
| Pelorus | 40 |
| Wairau | 105 |
| Awatere | 70 |
| Flowing into the Pacific Ocean— | |
| Clarence | 130 |
| Conway | 30 |
| Waiau-uha (or Waiau) | 105 |
| Hurunui | 90 |
| Waipara | 40 |
| Ashley | 60 |
| Waimakariri | 100 |
| Selwyn | 50 |
| Rakaia | 90 |
| Ashburton | 70 |
| Rangitata (from source, Clyde River) | 75 |
| Opihi | 50 |
| Pareora | 35 |
| Waihao | 45 |
| Waitaki (from source, Hopkins River) | 135 |
| Kakanui | 40 |
| Shag | 45 |
| Taieri | 175 |
| Clutha (from source, Makarora River) | 210 |
| Flowing into Foveaux Strait— | |
| Mataura | 140 |
| Oreti | 120 |
| Aparima (Jacobs River) | 70 |
| Waiau (from source, Clinton River) | 135 |
| Flowing into the Tasman Sea— | |
| Hollyford | 50 |
| Cascade | 40 |
| Arawhata | 45 |
| Haast | 60 |
| Karangarua | 25 |
| Cook | 25 |
| Waiho (from source, Callery River) | 20 |
| Whataroa | 35 |
| Wanganui | 35 |
| Waitaha | 25 |
| Hokitika | 40 |
| Arahura | 35 |
| Taramakau | 50 |
| Grey | 75 |
| Buller (from source, Travers River) | 110 |
| Mokihinui | 35 |
| Karamea | 50 |
| Heaphy | 25 |
| Aorere (from source, Spee River) | 45 |
| Takaka (from source, Cobb River) | 45 |
| Motueka | 70 |
| Waimea (from source, Wai-iti River) | 30 |
The discovery in 1861 that the beds of numerous rivers in the South Island contained extensive deposits of alluvial gold was of considerable importance in the economic development of the country. Not only did it lead to an increase in population and in wealth, but, through the following of the numerous streams to their sources, it also led to the rapid exploration of large tracts of remote country. The exploitation of these deposits has been carried on with varying degrees of success up to the present time by both manual and mechanical means, but the amount of gold now extracted is comparatively small.
A further factor in connection with the rivers is that, owing to the very successful acclimatisation of freshwater fish, notably trout, many of them now provide exceptionally fine fishing.
Lakes—In considering New Zealand's numerous lakes a distinction can be made, especially from the scenic viewpoint, between the lakes of the two Islands. Surrounded by extremely rugged country the larger lakes of the South Island are distinguished by the grandeur of their alpine settings, while those of the North Island, situated on a volcanic plateau, are of interest by reason of the neighbouring thermal activity. Owing to the excellence of their fishing, the North Island lakes possess an added tourist attraction. In both Islands the larger lakes are situated at high altitudes, and their consequent remoteness renders them unsuitable as a means of communication. In their functions as reservoirs the lakes of both Islands are of vital importance for the maintenance of the streams draining them and as a means of flood prevention. More especially is this the case where hydro-electric schemes are involved, Lakes Waikaremoana and Taupo in the North Island, and Lakes Coleridge, Pukaki, Tekapo, Wanaka, Hawea, and Wakatipu in the South Island, being of particular significance in this respect. A series of narrow man-made lakes have been produced in connection with hydro-electric development along some of the rivers. Early in 1965 Lake Benmore, New Zealand's largest artificial lake, was created. This lies on the Waitaki River in North Otago and is the first in a series of lakes to be created along this river in connection with the production of hydro electricity. The lake covers 301 square miles in area and consists of two arms, the main arm being 18 1/2 miles in length and the Ahuriri Arm 11 1/2 miles in length.
Some particulars of the more important lakes are given in the following table.
| Lake | Length, in Miles | Greatest Breadth, in Miles | Area, in Square Miles | Drainage Area, in Square Miles | Approximate Volume of Discharge, in Cubic Feet per Second | Maximum Height Above Sea Level in Feet (Range in Brackets)* | Greatest Depth, in Feet |
|---|---|---|---|---|---|---|---|
* The range in lake levels is not available for all lakes. | |||||||
| NORTH ISLAND | |||||||
| Natural | |||||||
| Taupo | 25 | 17 | 234 | 1,270 | 4,490 | 1,172 (5) | 522 |
| Rotorua | 7 ½ | 6 | 31 | 203 | .. | 920 (2) | 84 |
| Rotoiti | 10 | 3 | 13 | 248 | 852 | 916 (2) | 230 |
| Tarawera | 7 | 5 ½ | 14 | 72 | 273 | 981 (2) | 285 |
| Rotoaira | 3 | 1 ¾ | 5 | 50 | 240 | 1,852 (3) | .. |
| Waikaremoana | 12 | 6 | 21 | 165 | 623 | 2,015 (45) | 840 |
| Wairarapa | 12 | 4 | 31 | 1,236 | .. | 5 | 64 |
| Rotoehu | 3 | 2 | 3 | 17 | .. | 968 (4) | .. |
| Rotoma | 3 ¼ | 2 ¼ | 4 ½ | 12 | .. | 1,036 (6) | .. |
| Okataina | 4 | 3 | 4 | 25 | .. | 1,018 (9) | .. |
| Okareka | 1 ½ | 1 ¼ | 1 ¼ | 8 | .. | 1,160 (4) | .. |
| Rotomahana | 4 | 1 ¾ | 3 ½ | 27 | .. | 1,116 (22) | .. |
| Rerewhakaitu | 2 ½ | 1 ¾ | 3 | .. | .. | 1,441 (4) | .. |
| Tikitapu | 1 | ¾ | ½ | .. | .. | 1,364 | .. |
| Rotokakahi | 2 ½ | 1 | 1 ¾ | 11 | 40 | 1,298 | .. |
| Artificial | |||||||
| Ohakuri | 21 | ¼ | 5 ½ | 1,850 | 5,540 | 942 | .. |
| Atiamuri | 4 | ¼ | ½ | 1,980 | 5,830 | 826 | .. |
| Whakamaru | 13 ½ | ½ | 3 | 2,155 | 6,160 | 742 | .. |
| Maraetai | 4 ½ | ½ | 1 ½ | 2,390 | 6,730 | 618 | .. |
| Waipapa | 6 | ¼ | ½ | 2,500 | 7,010 | 417 | .. |
| Arapuni | 10 | ½ | 5 | 2,655 | 7,310 | 363 (2) | .. |
| Karapiro | 15 | ¼ | 3 | 2,880 | 7,820 | 176 | .. |
| Whakamarino | ½ | ¼ | 1/10 | .. | .. | 900 | .. |
| SOUTH ISLAND | |||||||
| Natural | |||||||
| Rotoiti | 9 | 1 ½ | 4 | 71 | 440 | 2,020 (6) | 250 |
| Rotoroa | 5 ½ | 2 | 9 | 145 | 960 | 1,462 (5) | 499 |
| Brunner | 5 ½ | 5 ½ | 15 | 160 | .. | 280 | 357 |
| Kaniere | 6 | 1 ¼ | 6 | 11 | .. | 429 | 646 |
| Coleridge | 11 | 2 | 14 | 216 | .. | 1,672 | 680 |
| Sumner | 6 | 1 ¼ | 5 ½ | 130 | .. | .. | .. |
| Tekapo | 11 | 3 ½ | 37 | 550 | 3,060 | 2,347 (25) | 620 |
| Pukaki | 9 ½ | 5 | 32 | 523 | 4,520 | 1,640 (30) | .. |
| Ohau | 11 | 3 | 23 | 460 | 2,310 | 1,730 (9) | .. |
| Hawea | 19 | 5 | 46 | 567 | 2,240 | 1,133 (53) | 1,285 |
| Wanaka | 28 | 3 | 74 | 982 | 7,150 | 915 (14) | .. |
| Wakatipu | 48 | 3 | 113 | 1,150 | 6,160 | 1,017 (7) | 1,239 |
| Te Anau | 38 | 6 | 133 | 1,275 | 9,730 | 686 (15) | 906 |
| Manapouri | 18 | 5 | 55 | 1,785 | 13,630 | 608 (21) | 1,455 |
| Monowai | 12 | 1 | 11 | 105 | 495 | 643 (13) | .. |
| Hauroko | 22 | 1 ½ | 27 ½ | 225 | 1,100 | 513 (6) | .. |
| Poteriteri | 18 | 1 ½ | 18 | 160 | 1,050 | 96 | .. |
| Waihola | 4 | 1 ¼ | 3 | 2,200 | .. | (Tidal) | 52 |
| Ellesmere | 14 | 8 | 70 | 745 | .. | (Tidal) | 7 |
| Artificial | |||||||
| Cobb | 3 | ¼ | ¾ | 28 | 198 | 2,650 (50) | .. |
| Waitaki | 3 | ½ | 2 ½ | 3,750 | 12,150 | 753 | .. |
| Roxburgh | 20 | ¼ | 2 ¼ | 6,012 | 17,270 | 430 | .. |
| Mahinerangi | 9 | 1 | 8 | 120 | 230 | 1,282 | .. |
| Benmore— | |||||||
| Ahuriri Arm | 11 ½ | 2 ¾ | 304 | 3,000 | 12,000 | 1,181 | 315 |
| Main Arm | 18 ½ | ||||||
GEOLOGY—The islands of New Zealand are part of the unstable circum-Pacific Mobile Belt; this is a region where volcanoes are active and where the earth's crust has long been buckling and breaking at a geologically rapid rate. The interplay, in the past, of earth movements and erosion has made the sedimentary rocks that cover almost three-quarters of New Zealand. Land areas that the earth movements have raised have been attacked by erosion, and the sand, mud, shingle, and other debris thus formed has been carried away to the sea, where it has accumulated in great thicknesses to form rocks such as sandstone, mudstone, greywacke, and conglomerate; the shells and other skeletons of sea creatures have accumulated to form thick layers of limestone. Many of the sedimentary rocks are in distinct layers called strata; earth movements have later raised them above the sea to form land, and the strata are in many places tilted and folded by pressure. Seas have advanced and retreated over New Zealand many times, and these sedimentary rocks represent almost every geological period since the Cambrian (see Time Scale); their age is revealed by the shells, foraminifera, and other fossils that they contain.
As well as sedimentary rocks, and volcanic rocks of various ages, New Zealand incorporates in its complex structure schist, gneiss, marble and other metamorphic rocks, and granite, diorite, gabbro, serpentine, and other intrusive igneous rocks. Most of these metamorphic and intrusive rocks are hundreds of millions of years old—they were formed at depth in the earth's crust early in New Zealand's history, in the "roots'' of ancient mountain ranges, long ago destroyed, and are visible at the land surface today only because erosion has removed thousands of feet thickness of other rocks that once covered them. The metamorphic rocks developed when huge, elongated sea basins (geosynclines) were formed, in which tens of thousands of feet thickness of sediments accumulated; when these geosynclines were slowly compressed during major mountain-building episodes the deeper sediments were subjected to great pressure and shearing stress, which caused new minerals and structures to develop, changing the sediments into metamorphic rocks. The granites and other instrusive rocks are coarsely crystalline, and are usually considered to have been intruded into the outer crust in molten state during mountain building; some, however, may be the products of intense metamorphism of sediments.
| GEOLOGICAL TIME SCALE | |||
|---|---|---|---|
| Eras | Periods | Approximate Time Since Period Began (Years) | |
| Cenozoic | Holocene (Recent) | Quaternary | 10 thousand |
| Pleistocene | 1 million | ||
| Pliocene | 11 million | ||
| Miocene | Tertiary | 25 million | |
| Oligocene | 20 million | ||
| Eocene | 60 million | ||
| Paleocene | 70 million | ||
| Mesozoic | Cretaceous | 135 million | |
| Jurassic | 180 million | ||
| Triassic | 225 million | ||
| Paleozoic | Permian | 270 million | |
| Carboniferous | 350 million | ||
| Devonian | 400 million | ||
| Silurian | 440 million | ||
| Ordovician | 500 million | ||
| Cambrian | 600 million | ||
Geological History—Evidence of the earliest-known events in New Zealand's history is given by ancient rocks in Nelson, Westland, and Fiordland that were formed in the early Paleozoic era, perhaps as long as 600 million years ago (some in Westland may be older). They include thick, geosynclinal sedimentary rocks; this suggests that a large land mass existed at that time to yield the great volume of sediments, but little has been deduced about its shape or position.
The history of the later part of the Paleozoic era, and the Mesozoic era, is rather better understood; for a vast span of time from the Carboniferous period—probably until the early cretaceous period—an extensive geosyncline occupied the New Zealand region. At first, during much of late Paleozoic time, huge quantities of submarine lava and volcanic tuff were included in the materials that accumulated in the geosyncline, but in the later Permian and Mesozoic times the sediments were mainly sand and mud, derived probably from some land west of present New Zealand; they were compacted into hard greywacke (a type of sandstone) and argillite (hard, dark mudstone).
In the early Cretaceous period one of the main mountain-building episodes in New Zealand's history took place: although geosynclinal sedimentation continued through the Cretaceous period in eastern New Zealand, the geosyncline elsewhere was compressed, and the sediments were intensely crumpled and broken and raised above the sea, probably forming a large, mountainous landmass. Some of the geosynclinal deposits, now exposed over much of Otago, alpine Westland, and parts of Marlborough Sounds, were metamorphosed into schist and gneiss by the tremendous deforming pressures to which the geosyncline was subjected.
The time that has elapsed since the intense folding of the strata in the New Zealand Geosyncline in the mid-Cretaceous period may be considered as the later geological history of this country; it embraces roughly 100 million years.
During the early part of this late history, erosion slowly wore down the mountains that had risen, producing a land of low relief. Over these worn-down stumps of the Mesozoic mountains the sea gradually advanced, beginning its transgression earlier in some areas than in others: in the early Cretaceous period it began to submerge land in the region of present North Auckland and the eastern margins of the North and South Islands, and thick deposits of mudstone and sandstone accumulated in some parts of these areas. At the close of the Mesozoic era, and in the very early Tertiary, land became so reduced in size and relief that little sediment was formed, and only comparatively thin deposits of fine bentonitic and sulphurous muds, and fine, white, foraminiferal limestone accumulated. In some areas New Zealand's main coal deposits accumulated, in swamps on the surface of the old land; these became buried by marine deposits as the sea continued its transgression in the Eocene period.
By the Oligocene period, most of the land was submerged, and in shallow waters free of land sediments thick deposits of shell and foraminiferal limestone accumulated. (Scattered, remnant patches of this Oligocene limestone furnish most of New Zealand's cement and agricultural lime.)
After the Oligocene submergence earth movements became more vigorous; many ridges rose from the sea as islands, and sank or were worn down again; sea basins formed and rapidly filled with sediments. New Zealand's late Tertiary environment has been described as follows: "The pattern of folds, welts and troughs that developed was on a finer scale than in the Mesozoic . . . the land moved up and down as a series of narrow, short, interfingering or branching folds. . . . we can think of Tertiary New Zealand as an archipelago. . . . a kind of writhing of part of the mobile Pacific margins seems to have gone on . . .*'' The thick deposits of soft, grey mudstone and sandstone that now make up large areas of the North Island, and some parts of South Island, are the deposits that accumulated rapidly in the many sea basins, large and small, that developed in the later Tertiary.
*"New Zealand Biogeography'' by Charles A. Fleming. Tuatara Vol. 10, No. 2, June 1962, pp. 53-108.
Very late in the Cenozoic era—in the Pliocene and Pleistocene periods—one of the greatest episodes of mountain building in New Zealand's history took place. Earth movements became intense, and slowly pushed up the Southern Alps and other main mountain chains, and determined the general shape and size of the present islands of New Zealand. Much of the movement during this mountain building period (the Kaikoura Orogeny) took the form of displacement of blocks of the earth's crust along fractures called faults. The total movements of the earth blocks adjacent to major faults amounted to thousands of feet; it must have been achieved very slowly, probably by innumerable small movements, each of a few inches or feet. The blocks adjacent to "transcurrent'' faults moved not only vertically but also laterally along the faults. The New Zealand landscape today in some regions shows well preserved tilted fault blocks bounded by fault-scarps—steep faces hundreds or even thousands of feet high. Fault movements continue to the present day, and have accompanied several major earthquakes of the past century. Many minor but revealing landscape features such as scarplets, fault ponds, and shutter ridges show where movement has been occurring in recent centuries.
Erosion during this time has eaten into the major landscape forms that the earth movements have built, carving the detailed landscape pattern of peaks, ridges, valleys, and gorges, and has built up alluvial plains, shingle fans, and other constructional forms; at the coast, waves have driven back the headlands, and built beaches, spits, and bars. The Pleistocene period was the time of the Ice Age, and in the high mountains of the South Island glaciers carved deep valleys and carried huge loads of rock, dumping them as moraines. The late Pleistocene glaciers carved the fiords of Fiordland and the basins occupied by most South Island lakes; there were small glaciers also on Ruapehu, where remnants survive, and on Mount Egmont and the Tararua Range.
Volcanic activity of the past few million years has played an important part in making the rocks and shaping the landscape of parts of the central and northern North Island; Banks Peninsula, a twin volcanic dome in Canterbury, achieved much of its growth then, too. The largest volcanic outpourings of late geological times in New Zealand have been in the region between Tongariro National Park and the Bay of Plenty Coast: andesite lava, scoria, and ash were erupted in the Pleistocene period and later to build the huge volcanoes, Ruapehu, Tongariro, and Ngauruhoe; more than 2,000 cubic miles of molten rhyolitic magma was erupted in the form of ignimbrite, pumice, and rhyolite lava, building up the Volcanic Plateau.
The Geological Survey, Department of Scientific and Industrial Research, has built up this body of geological knowledge.
Geological Maps—The geological maps show the present distribution of major rock groups in New Zealand, brought about by the events and processes that have been summarised in previous paragraphs. (These maps were originally prepared for the New Zealand Encyclopaedia.)
Older Rocks—Much of the late Cretaceous and Tertiary sedimentary rock that once; must have covered a large part of the South Island has been worn off by erosion since the Kaikoura Orogeny, and the "undermass'' of old rocks has been exposed.
The oldest of these rocks lie to the west: Fiordland is made up mainly of metamorphic diorite, granite, and coarse schist, gneiss, and marble, with Ordovician graptolite-bearing slates in its south-west extremity; greywackes and argillites of possibly pre-Cambrian age occur in Westland and south-west Nelson, and further north in Nelson there are large areas of complexly folded Cambrian and Ordovician sedimentary and metamorphic rocks. Large granitic masses, hundreds of square miles in area, occur in Westland, Nelson, and Stewart Island.
These ancient rocks terminate with an abrupt boundary (which shows clearly even on this small-scale map) extending from Milford Sound along the western margin of the Southern Alps. This boundary is the Alpine Fault, a great fracture that divides the South Island into two areas of dissimilar geological structure: to the west of it, and in Fiordland, are the granites and other ancient rocks just described; to the east, the undermass rocks are predominantly the sedimentary and marine volcanic rocks of the New Zealand Geosyncline, and their metamorphosed forms, of later Paleozoic and Mesozoic age. From Marlborough, through Canterbury to North Otago, the map shows an almost continuous expanse of these rocks; here they are mainly sparsely fossiliferous greywackes and argillite strata of Triassic and Jurassic age. On the western flanks of the Southern Alps, and in Otago, these sedimentary rocks merge gradually with schist and gneiss. Those of the Southern Alps show on the map as a very narrow belt, cut off by the Alpine Fault, but the southern schists form a belt some 60 miles wide extending for about 150 miles across Otago. To the south, also, this schist mass merges gradually with sedimentary rocks of the New Zealand Geosyncline, here of Permian age: these strata, mainly tuffs and tuffaceous greywackes forming a belt that stretches across Southland, are the northern limb of a major downfold or syncline; Triassic and Jurassic strata occupy its core, making up much hill country of Southland. The southern limb rocks include much marine volcanic rock, and in the core of the syncline in western Southland a belt of dunite and serpentine is intruded and is well exposed in the Olivine and Red Hill ranges.
A sequence of rocks very like that of Southland is found also in eastern Nelson; here, fossiliferous Triassic rocks and Permian sedimentary and volcanic rocks closely resembling those of Southland are found, and a belt of dunite and serpentine (the Nelson "mineral belt'') intrudes them. It has been suggested that the Nelson and Southland rocks, which terminate abruptly at the Alpine Fault and its continuation as the Wairau Fault, were originally joined, and have been displaced some 300 miles by lateral movement at the fault. Younger Rocks—On the eastern side of the South Island, upper Cretaceous and Tertiary strata survive only as small patches, the remnants of a once fairly complete cover of younger rocks. Thick geosynclinal Cretaceous strata are found in the Clarence and Awatere Valleys of Marlborough, but elsewhere in the eastern South Island the upper Cretaceous and lower Tertiary strata are thin. They include foraminiferal limestone, greensands, sandstones, and other shell deposits formed during slow transgression by the sea. Oligocene limestone remnants mark the period of maximum transgression.
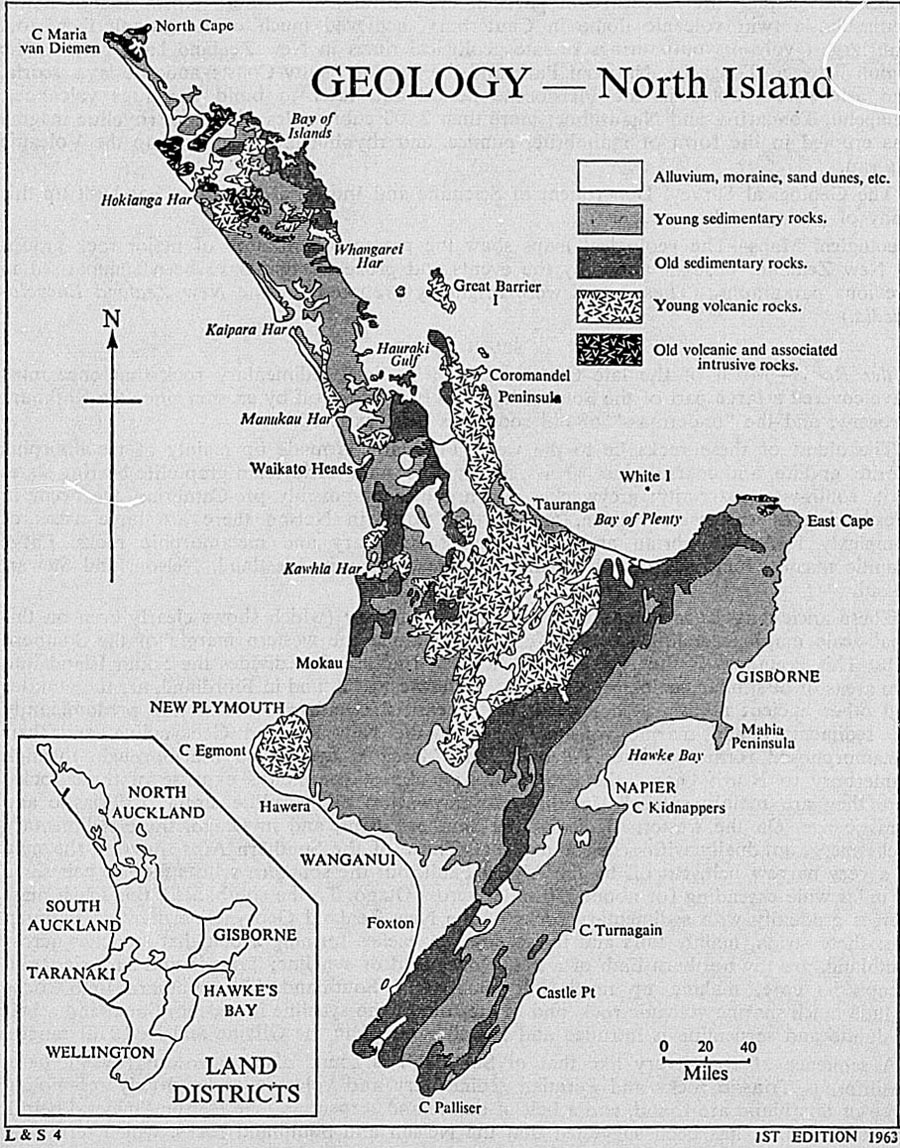
On the western side of the South Island the younger rocks are more widespread, and include some thick sequences that were formed in rapidly sinking basins. The oldest are the coal measures, mainly Eocene in age. They are overlain in some areas by thick lower Tertiary marine strata. In Southland, thick Tertiary strata occupy the Waiau Syncline, between Lake Te Anau and Foveaux Strait.
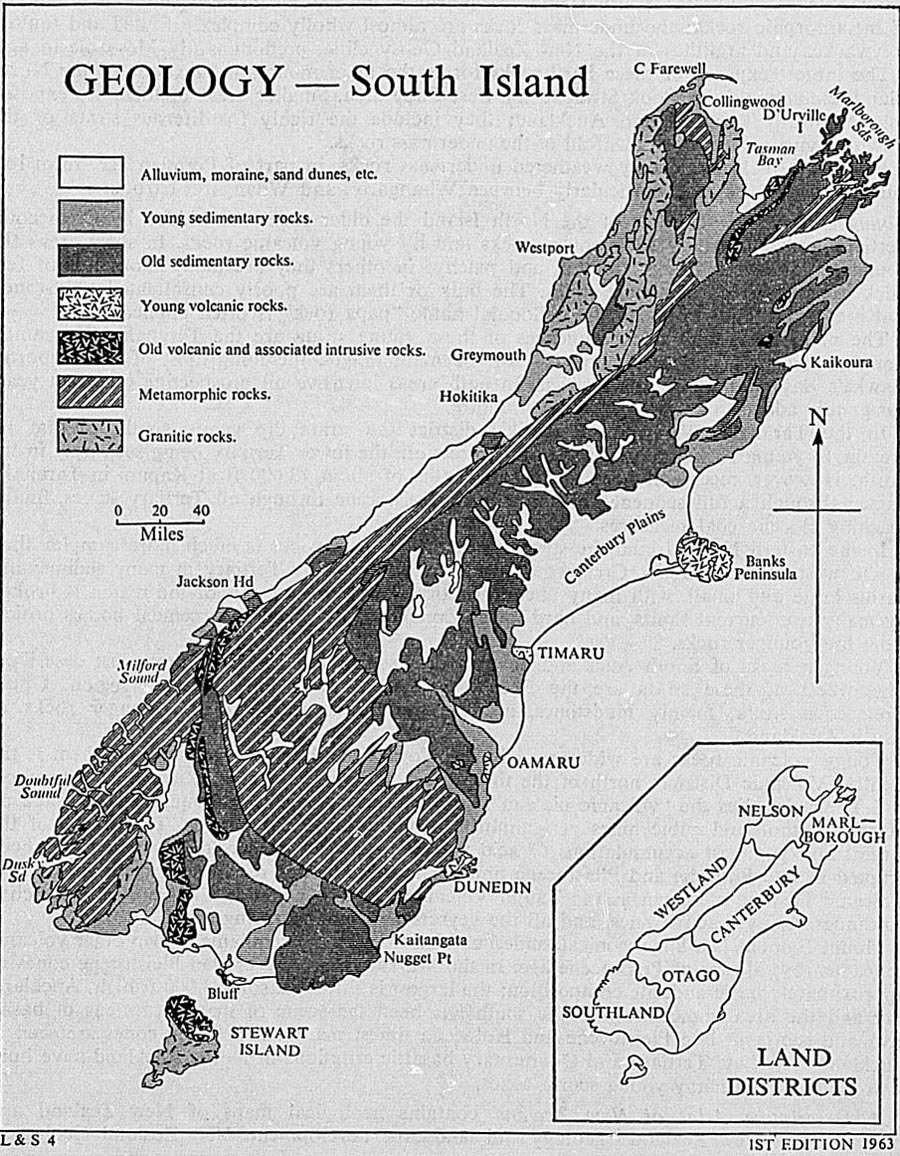
The map shows some large areas of Pleistocene to Recent terrestrial deposits in the South Island. The largest forms the Canterbury Plains, and consists of old shingle deposits of unknown thickness washed from the Southern Alps during the Pleistocene glaciation. Others occupy the Moutere depression of Nelson, and form Southland Plains, and intermontane basins, such as the McKenzie Plains, in the main mountain chains. Thick Pleistocene moraines form the main surface rocks of South Westland.
Banks Peninsula is the only large mass of young volcanic rocks in the South Island; there are smaller areas at Timaru, Oamaru, and in the Dunedin district.
Older Rocks—Unlike the South Island, the North Island has no large expanses of granite or of metamorphic rocks: the undermass rocks are almost wholly complexly folded and faulted greywackes and argillites of the New Zealand Geosyncline, predominantly Mesozoic in age.
The largest expanse of these hard rocks forms the main mountain backbone of the North Island, extending from Cook Strait to the East Cape area. Smaller areas of them are exposed between north Taranaki and Auckland; they include the richly fossiliferous strata of the Kawhia Syncline, a major downfold of the undermass rocks.
In North Auckland, deeply weathered undermass rocks, in part of Permian age, form low hill country in the east, particularly between Whangaroa and Whangarei harbours.
Younger Rocks—Over most of the North Island the older rocks are hidden by Cretaceous, Tertiary and Quaternary sedimentary rocks and by young volcanic rocks. In some areas the younger sedimentary rocks are thin and patchy; in others they are many thousands of feet thick over hundreds of square miles. The bulk of them are poorly consolidated sandstones, and grey mudstones to which the colloquial name "papa rock'' is often applied.
The main areas with thick sequences of these young strata are the Taranaki - Wanganui - Rangitikei district, and the region east of the main ranges, including most of the Gisborne, Hawke's Bay, and Wairarapa districts. In both areas intensive oil prospecting of recent years has greatly added to knowledge of the structure.
In the Taranaki - Wanganui - Rangitikei district the strata dip gently south, so that increasingly young rocks are exposed in this direction, the lower Tertiary being seen only in the north. However, recent oil bores drilled to depths of about 13,000 ft at Kapuni in Taranaki, passed through a full sequence of strata from Pleistocene through all Tertiary stages, finally reaching Eocene coal measures.
In the eastern North Island the structure of the younger rocks is much more complex than in the western area. Upper Cretaceous strata are followed by Tertiary in many sedimentary basins large and small, with many unconformities. The southern part of the region is broken by many transcurrent faults, and hard lower Cretaceous greywacke piercement bodies project from the younger rocks.
Younger rocks of South Auckland do not form such large basins as those just described. The oldest of these strata are the Eocene coal measures of the Waikato region. Upper Cretaceous strata, mainly mudstones, are the most widespread of the younger rocks of North Auckland.
Young volcanic rocks are widespread in the North Island. The largest area of them is the Central Volcanic District: north of the three great andesite volcanoes, Ruapehu, Ngauruhoe, and Tongariro, lies the "volcanic plateau'', an expanse of some 10,000 square miles made up of several thousand cubic miles of ignimbrite, rhyolite lava, and pumice. This is one of the largest and youngest accumulations of acid volcanic rocks in the world. Most of it has been erupted in late Pliocene and Pleistocene times. The belt of most recent activity in the Central Volcanic District is known as the Taupo Volcanic Zone; it contains all this country's active volcanoes, many inactive ones, and all the geysers and boiling springs.
Mount Egmont is a huge, conical, andesite volcano, with the remnants of two other volcanic cones nearby; all are of Pleistocene age. In the Waikato there are eroded Pleistocene cones of approximately basic andesite composition; the largest is Pirongia, some 3,000 ft high. Auckland city and the area immediately to the south has been the scene of many eruptions of basalt lava and scoria in late Pleistocene and Holocene times; many small scoria cones are seen at Auckland city. Late Tertiary and Quarternary basaltic eruptions in North Auckland have built lava plateaus and many young scoria cones.
A Descriptive Atlas of New Zealand contains geological maps of New Zealand and summaries of New Zealand's geology and landscape development. New Zealand Geological Survey Bulletin 66, The Geological Map of New Zealand, 1:2,000,000, is a lengthier summary with a more detailed geological map and cross sections. G.S.C..
EARTHQUAKES: Geophysical Background—Earthquakes are geographically associated with active volcanoes and with major earth movements such as mountain building; these three types of disturbance are confined, for the most part, to certain limited regions of the world. Such disturbed regions, of which New Zealand is one, are evidently the site of some kind of development affecting the outer shell of the Earth. Little is yet known about the internal processes that give rise to these geophysical disturbances, nor are the relations connecting them understood in any detail.
Formerly earthquakes were believed to be caused by volcanic activity, but it is now recognised that volcanic earthquakes are restricted to small shocks in the immediate vicinity of the volcanism. In New Zealand, tremors of this kind are experienced in the zone of active volcanism that extends from Mount Ruapehu to White Island.
In some places geological faulting at the surface gives visible evidence that a major earth movement has occurred. Occasionally movement on a fault has been observed to occur simultaneously with an earthquake in the same vicinity. New Zealand provided one of the earliest examples of this to become generally known, when movement took place on the Wairarapa Fault at the time of the great Wellington earthquake of 1855. Such events as this have led to the idea mat earthquakes in general are caused by fault movements, but it has proved difficult to find convincing evidence in support of this theory. It is noteworthy that there seems to be little earthquake activity along much of the Alpine Fault, which has been traced for 300 miles from Milford Sound to Lake Rotoiti and is classed by geologists as one of the largest and most active faults in the world. The nature of the connection between earthquakes and faulting is still somewhat obscure.
The great majority of the world's earthquakes occur at depths of less man 40 miles, and in many earthquake zones there are no shocks at any greater depth. A moderate number of New Zealand earthquakes are classed as intermediate in depth, i.e., originating at between 40 miles and 190 miles deep. The two deepest New Zealand earthquakes recorded so far occurred four and a half minutes apart on 23 March 1960, with a common focus 370 miles deep under north Taranaki; this is about 80 miles shallower than the deepest earthquake known.
It is difficult to compare the degree of earthquake activity in New Zealand with that in other regions because of the many differences that arise in earthquake type and mode of occurrence. New Zealand and California are often regarded as roughly similar, with an activity very much less than, for example, Japan or Chile.
Regional Distribution—There are two separate regions of earthquake activity in New Zealand. The larger, northern region may be roughly defined as lying between latitude 36 ½°S and 43 ½°S. It thus includes the northern half of the South Island, and all the North Island apart from the North Auckland peninsula; but the area from Kaipara Harbour to the lower Waikato River should be excluded. The southern active region lies to the west of longitude 169 ½°E, and incorporates Southland, western Otago, and southern Westland. Earthquakes have only occasionally been located in the parts of New Zealand lying outside these two regions.
Within the active regions the occurrence of shallow earthquakes is widely scattered. There has been a tendency, however, for the larger shallow earthquakes to lie towards the Pacific side of the northern active region and towards the Tasman side of the southern active region. Earthquakes with deeper foci are mostly confined to a narrow belt in the northern region, extending from the Bay of Plenty south-westwards to Tasman Bay.
The historical record is too brief to support a quantitative assessment of the frequency with which one might expect earthquakes to be felt at a given intensity in various parts of New Zealand. Considering the distances to which major earthquakes can be effective, in relation to the size of New Zealand, it would be imprudent to regard any part of the country as permanently exempt from the possibility of earthquake damage.
Outside the active regions there are many areas, however, where no damaging intensity has actually been experienced in historical times. Moreover, since the major shallow earthquakes on record have been rather widely distributed within the active regions, there appears to be no particular area of markedly intense seismicity.
The Hawke's Bay earthquake of 3 February 1931 resulted directly or indirectly in 255 deaths. The total of deaths that have been recorded as due to other earthquakes since 1848 is 29.
Seismological Observatory—Earthquake recorders are operated continuously at the following stations by the Seismological Observatory, Wellington: Apia and Afiamalu (Western Samoa); Suva (Fiji); Rarotonga (Cook Islands); Raoul Island (Kermadecs); Onerahi, Auckland, East Cape, Karapiro, Wairakei, Gisborne, Tuai, Tarata, Chateau, Bunnythorpe, Mangahao, and Wellington (North Island); Cobb, Kaimata, Gebbies Pass, Mount John, Milford Sound, Roxburgh, Monowai, and Waipapa Point (South Island); Chatham Islands; Campbell Island; and Scott Base (Antarctica). The installations at the following stations include instruments for recording distant earthquakes: Afiamalu, Rarotonga, Wellington, Roxburgh, Scott Base. At the Pacific and Antarctic stations preliminary readings are made locally and notified by radiogram. The analysis of records from all stations is carried out at the Observatory in Wellington.
The Observatory publishes regular reports of all significant earthquakes occurring in the New Zealand region; in a normal year there are about 200 such earthquakes, and about 100 of these are reported felt. The analysis involves using observations from stations in other countries as well as those from the local network, and the Observatory likewise contributes data to the international seismological agencies about distant earthquakes as well as large local ones. Details of tremors felt in New Zealand are supplied to the public and the press. In the study of felt earthquakes the instrumental results are augmented by "felt reports''; these are supplied by a large number of voluntary observers throughout New Zealand in response to a standard questionnaire issued by the Observatory.
Earthquake data are used by the Observatory for studying the fundamental characteristics of the Earth's crust in New Zealand, Antarctica, and the neighbouring oceanic regions, and also for contributing to geophysical knowledge of the Earth's deep interior.
Principal Earthquakes During the Year 1966—The largest earthquake of the year in the New Zealand region was that of 28 August 1966, which originated at sea about 100 miles north of East Cape, at a depth of about 60 miles. It had a magnitude of 6 ½ (Richter scale) and was felt in the Bay of Plenty and as far south as Dannevirke, but caused no damage.
Two shallow earthquakes, of not unusually large magnitude, caused significant damage at Gisborne and Seddon, the severity of the felt effects at these places being largely due to the closeness of the earthquakes. The Gisborne earthquake, on 5 March, had a magnitude of 6.2 and originated within 15 miles of Gisborne, where the cost of damage is estimated at $260,000. The earthquake was felt as far afield as Taupo and central Hawke's Bay. The Seddon earthquake, of magnitude 6.1, occurred on 23 April and had its centre in Cook Strait 25 miles south-west of Wellington and 15 miles from Seddon. The earthquake damaged many chimneys at Seddon and caused minor damage at Blenheim and at Wellington, where it was felt more strongly than any earthquake since the Wairarapa shocks of 1942. The felt area extended from Banks Peninsula to the centre of the North Island.
Two large deep earthquakes occurred 11 ½ hours apart on 27 and 28 June. The first originated 140 miles beneath northern Taranaki and was felt throughout the south of the North Island; its magnitude was 5 ¾. The earthquake of 28 June, of magnitude 6, was centred near Opotiki at a depth of 70 miles and was felt in the Bay of Plenty and East Cape Peninsula.
On 1 December an earthquake occurred beneath Lake Te Anau at a depth of 80 miles, the greatest depth that has yet been established for an earthquake in the southern seismic region of New Zealand. This earthquake had a magnitude of 5.5 and was felt extensively in Otago and Southland. Other earthquakes felt widely in this region took place on 27 February (magnitude 5.7) and 21 March (magnitude 5.4), and on 8 July an earthquake of magnitude 4.8, centred near Omarama was felt in North Otago and the McKenzie Country.
Small earthquakes in areas where they less commonly occur took place on 5 July near Waitakaruru in the Hauraki Plains (magnitude 3 ½), and on 11 May near Waipu in Northland (magnitude 3). Both were felt.
During January there was a swarm of small earthquakes in the Coromandel Peninsula. Over 100 were felt, but few were large enough to be recorded instrumentally.
A steam eruption from Mt. Ruapehu occurred on 24 July. The seismograph at Chateau Tongariro recorded tremor from this event but no increase in earthquake activity.
WEATHER INFORMATION—The collection of weather information and the provision of weather forecasts and climatic data for diverse interests in aviation, shipping, agriculture, Government Departments, and the general public are functions of the New Zealand Meteorological Service. By arrangement with the administrations concerned the Service performs similar functions for British territories in the Pacific.
Weather reports for use in forecasting are made at about 130 places within New Zealand and 50 in Pacific islands and collected by telegraph and radio, along with measurements of winds at upper levels made at eight radar wind-measuring stations and of temperatures made at seven radiosonde stations. Daily observations are made for climatological purposes at about 210 places in New Zealand and 60 in the islands. Rainfall measurements are made at a total of about 1,400 places within New Zealand and 110 outside the country.
Detailed climatological statistics are published annually in the Meteorological Observations. Current statistics appear monthly in a climatological table included in the New Zealand Gazette.
CLIMATE—Situated between 34°S and 47°S the main islands lie within the broad belt of strong westerly winds which encircles the hemisphere south of about latitude 35°S. Just to the north is the high-pressure ridge of the subtropics from which borametric pressure decreases southwards over New Zealand to the deep low-pressure trough located near latitude 60°S.
In the Australasian region there is no semipermanent anticyclone, as exists in subtropical latitudes in the Indian and eastern Pacific Oceans. Instead, a continual eastward migration of anticyclones takes place, roughly at weekly intervals. Most of the centres pass over or to the north of the North Island. The low-pressure troughs which separate successive anticyclones are associated with deep depressions centred far to the south. A period of disturbed weather accompanies the trough with a change to cold southerly or south-westerly winds as it advances north-eastwards over New Zealand. Conditions improve again with the approach of the next anticyclone from the west. While this simple progression dominates the day-to-day weather, the situation frequently becomes much more complex. The troughs are unstable systems where depressions commonly form, some of which develop into vigorous storms that travel south-eastwards across New Zealand.
The anticyclones themselves continually vary in size, intensity, and rate of movement. Their tracks are furthest north in the spring, on the average, and reach their southern limit in late summer or early autumn when most of the centres cross central or southern New Zealand. At this time of the year, too, northern and eastern districts of the North Island occasionally come under the influence of deep cyclones of tropical origin.
The other main factors which influence the climate of New Zealand are, first, its position in the midst of a vast ocean, and second, the shape and topography of the country itself.
Australia, the nearest continent, is 1,000 miles to the west; Antarctica is 1,400 miles to the south. Hot air masses from the interior of Australia in summer, or freezing air masses from the Antarctic, which occasionally reach New Zealand, retain little of their original character after their long ocean passage. Thus, there is an absence of extreme variations of temperature. On the other hand, since abundant supplies of moisture are supplied by evaporation from the oceans, and depressions are frequent and vigorous, the average precipitation is high.
The chain of high mountains, which extends from south-west to north-east through the length of the country, rises as a formidable barrier in the path of the prevailing westerly winds. The effect is to produce much sharper climatic contrasts from west to east than in the north-south direction. In some inland areas of the South Island just east of the mountains the climate is distinctly continental in character, despite the fact that no part of New Zealand is more than 80 miles from the sea.
Winds—Winds from a westerly quarter prevail in all seasons, with a general tendency to increase in strength from north to south. However, considerable local modifications to the general air flow occur during its passage across the mountainous terrain. Approaching the main ranges the flow from the west turns towards the north-east and on descending on the eastern side swings towards the south-east. This results in an increased number of south-westerlies in Westland and a predominance of north-westerlies in inland districts of Otago and Canterbury, where strong gales from this quarter occur at times in the late spring and summer. Daytime sea breezes usually extend from the coast inland for 20 miles or more during periods of settled weather in summer. On the Canterbury coast the wind comes most frequently from the north-east, partly because there is a persistent sea breeze from this quarter, but south of Dunedin south-westerlies predominate. Cook Strait, the only substantial gap in the main mountain chain, acts as a natural funnel for the air flow and is a particularly windy locality afflicted by gales from the south-east as well as the north-west. This "funnel'' effect is also in evidence about Foveaux Strait. North of Taranaki the general air flow is more from the south-west, and there is a noticeable reduction in windiness in the summer.
An indication of the variation in the frequency of strong winds from summer to winter, and in different parts of the country, is given in the next table. These were all obtained by the use of Dines pressure-tube anemometers at well exposed sites, mostly aerodromes.
| Station | Average Number of Days With Gusts Reaching | Years of Data | |||||
|---|---|---|---|---|---|---|---|
| 40 m.p.h. or More | 60 m.p.h. or More | ||||||
| Nov-Apr | May-Oct | Year | Nov-Apr | May-Oct | Year | ||
| Kaitaia | 9 | 23 | 32 | 0.6 | 1.1 | 1.7 | 8 |
| Auckland (Mechanics Bay) | 22 | 30 | 52 | 0.8 | 1.6 | 2.4 | 19 |
| Rotorua | 6 | 7 | 13 | 0.2 | 0.1 | 0.3 | 16 |
| Hamilton | 9 | 13 | 22 | 0.0 | 0.6 | 0.6 | 8 |
| Gisborne | 17 | 24 | 41 | 0.2 | 0.7 | 0.9 | 16 |
| New Plymouth | 35 | 49 | 84 | 2.7 | 5.3 | 8.0 | 19 |
| Palmerston North | 25 | 23 | 48 | 0.7 | 0.8 | 1.5 | 12 |
| Wellington (Kelburn) | 78 | 73 | 151 | 17.4 | 11.2 | 28.6 | 8 |
| Nelson | 21 | 15 | 36 | 0.5 | 0.2 | 0.7 | 18 |
| Blenheim (Woodbourne) | 24 | 17 | 41 | 0.7 | 0.9 | 1.6 | 12 |
| Hokitika | 16 | 19 | 35 | 1.5 | 1.7 | 3.2 | 14 |
| Christchurch | 31 | 26 | 57 | 1.7 | 1.6 | 3.3 | 16 |
| Taieri | 31 | 26 | 57 | 1.6 | 1.2 | 2.8 | 18 |
| Invercargill | 51 | 40 | 91 | 5.2 | 4.4 | 9.6 | 14 |
NOTE—These are all aerodromes, with the exception of Auckland (Mechanics Bay) and Wellington (Kelburn).
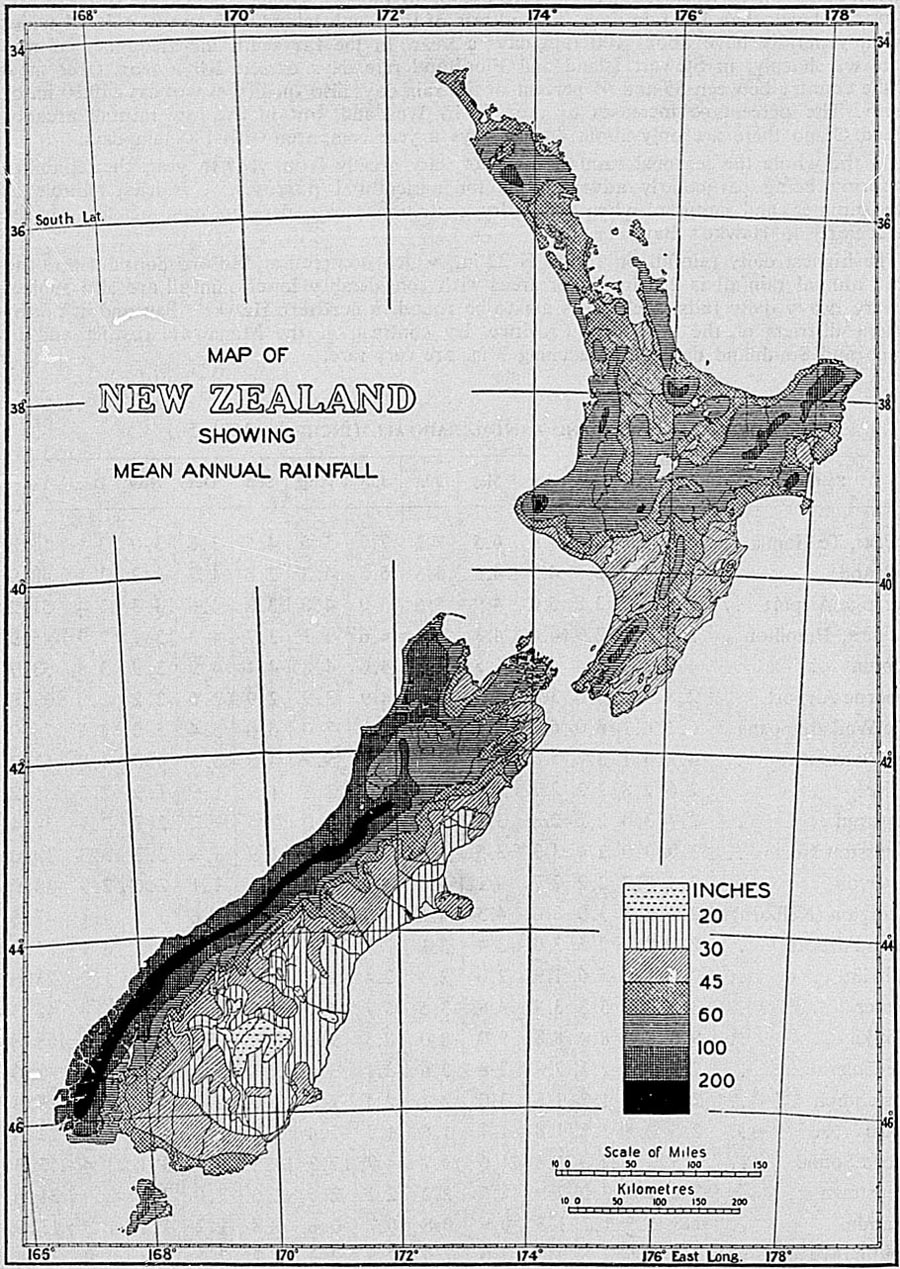
Rainfall—The distribution of rainfall is mainly controlled by mountain features, and the highest rainfalls occur where the mountains are exposed to the direct sweep of the westerly and north-westerly winds. The mean annual rainfall (see map) ranges from as little as 13 in. in a small area of Central Otago to over 300 in. in the Southern Alps. The average for the whole country is high, but for the greater part it lies between 25 and 60 in., a range regarded as favourable for plant growth in the temperate zone. The only areas with under 25 in. are found in the South Island, to the east of the main ranges. These include most of Central and North Otago, and South Canterbury. In the North Island, the driest areas are southern Hawke's Bay, Wairarapa, and Manawatu where the average rainfall is 30-40 in. a year. Of the remainder, much valuable farm land, chiefly in northern Taranaki and Northland, has upwards of 60 in. Over a sizeable area of both Islands rainfall exceeds 100 in. a year but, with the exception of Westland, this is mountainous and unoccupied, much of it being forest covered.
For a large part of the country the rainfall is spread evenly through the year, although its effectiveness in summer is, of course, much reduced. The greatest contrast is found in the north, where winter has almost twice as much rain as summer. This predominance of winter rainfall diminishes southwards. It is still discernible over the northern part of the South Island but, over the southern half, winter is the season with least rainfall, and a definite summer maximum is found inland due to the effect of convectional showers. The rainfall is also influenced by seasonal variations in the strength of the westerly winds. Spring rainfall is increased in and west of the ranges as the westerlies rise to their maximum about October, while a complementary decrease occurs at the same time in the lee of the ranges.
Areas which are exposed to the west and south-west experience much showery weather, and rain falls on roughly half the days of the year. Over most of the North Island rain can be measured on at least 150 days a year except to the east of the ranges where there are, in places, fewer than 125 rain days. Those areas of the South Island with annual rainfall under 25 in. generally have about 100 rain days a year. In the far south the frequency of rain increases sharply; in Stewart Island and Fiordland rain days exceed 200 a year. Over most of the country between 55 and 65 percent of the rain days also qualify as wet days (0.10 in. or more). The percentage increases to over 70 in Westland, but in the low rainfall area of inland Otago there are only about 40 wet days a year compared with 100 rain days.
On the whole the seasonal rainfall does not vary greatly from year to year, the reliability in spring being particularly advantageous for agricultural purposes. It is least reliable in late summer and autumn when very dry conditions may develop east of the ranges, particularly in Hawke's Bay.
The highest daily rainfall on record is 22 in., which occurred at Milford Sound where the mean annual rainfall is 250 in. Other areas with considerably lower rainfall are also subject to very heavy daily falls; such areas are to be found in northern Hawke's Bay and in northeastern districts of the Auckland Province. By contrast, in the Manawatu district and in Otago and Southland daily falls reaching 3 in. are very rare.
| Normal Monthly and Annual Rainfall (Inches) (1921-50) | |||||||||||||
|---|---|---|---|---|---|---|---|---|---|---|---|---|---|
| Station | Jan | Feb | Mar | Apr | May | Jun | July | Aug | Sep | Oct | Nov | Dec | Year |
| Te Paki, Te Hapua | 3.3 | 3.6 | 3.3 | 5.6 | 6.5 | 7.2 | 7.3 | 5.6 | 4.5 | 3.8 | 3.0 | 3.1 | 56.8 |
| Auckland | 3.3 | 4.1 | 2.8 | 4.3 | 4.8 | 5.5 | 5.5 | 4.3 | 3.8 | 4.2 | 3.2 | 3.1 | 48.9 |
| Tauranga Airport | 3.5 | 3.5 | 3.8 | 5.0 | 4.9 | 5.6 | 5.0 | 4.8 | 3.8 | 4.6 | 3.3 | 3.4 | 51.2 |
| Ruakura, Hamilton | 3.3 | 3.2 | 2.9 | 4.0 | 4.3 | 4.9 | 4.6 | 4.1 | 3.7 | 4.3 | 3.7 | 2.9 | 45.9 |
| Rotorua | 4.4 | 3.9 | 3.4 | 4.6 | 5.5 | 5.5 | 4.6 | 4.8 | 4.4 | 4.9 | 3.9 | 3.8 | 53.7 |
| Gisborne Airport | 2.8 | 3.2 | 3.0 | 3.4 | 5.0 | 3.9 | 4.9 | 3.9 | 2.9 | 2.6 | 2.2 | 2.0 | 39.8 |
| Lake Waikaremoana | 6.2 | 6.1 | 6.0 | 6.7 | 8.6 | 7.3 | 7.7 | 7.0 | 6.0 | 5.4 | 5.2 | 4.7 | 76.9 |
| New Plymouth | 4.7 | 4.1 | 3.7 | 5.0 | 5.3 | 6.4 | 6.2 | 5.9 | 4.8 | 5.8 | 4.5 | 4.8 | 61.2 |
| Napier | 2.6 | 2.8 | 2.2 | 2.7 | 3.8 | 3.1 | 3.5 | 2.8 | 1.9 | 1.9 | 1.9 | 2.0 | 31.2 |
| Wanganui | 2.7 | 3.0 | 2.2 | 2.8 | 3.1 | 3.4 | 2.9 | 3.0 | 2.5 | 3.2 | 2.7 | 2.9 | 34.4 |
| Palmerston North | 3.0 | 3.0 | 2.4 | 3.3 | 3.5 | 3.9 | 3.1 | 3.5 | 2.9 | 3.8 | 3.3 | 3.3 | 39.0 |
| Masterton | 2.5 | 2.7 | 2.2 | 2.7 | 4.1 | 4.0 | 3.9 | 4.2 | 3.1 | 3.1 | 2.6 | 2.9 | 38.0 |
| Wellington (Kelburn) | 2.8 | 3.5 | 3.0 | 3.6 | 4.5 | 4.6 | 4.9 | 5.1 | 3.7 | 4.6 | 3.1 | 4.1 | 47.5 |
| Nelson Airport | 2.7 | 2.3 | 2.6 | 3.0 | 3.4 | 3.1 | 2.9 | 3.6 | 2.9 | 3.6 | 2.7 | 3.1 | 35.9 |
| Blenheim | 2.0 | 1.9 | 1.6 | 1.9 | 2.6 | 2.3 | 2.4 | 2.5 | 2.4 | 2.5 | 1.8 | 1.9 | 25.8 |
| Hanmer | 3.5 | 3.7 | 3.3 | 3.4 | 4.8 | 3.5 | 3.7 | 4.0 | 4.0 | 4.3 | 3.3 | 3.8 | 45.3 |
| Hokitika | 9.8 | 8.6 | 8.4 | 8.8 | 9.0 | 8.0 | 8.3 | 9.3 | 8.3 | 10.9 | 9.5 | 9.9 | 108.8 |
| Lake Coleridge | 2.6 | 2.4 | 2.1 | 2.8 | 2.8 | 2.6 | 3.1 | 3.1 | 3.1 | 3.2 | 2.4 | 2.8 | 33.0 |
| Christchurch | 2.2 | 1.8 | 1.7 | 1.8 | 3.0 | 2.7 | 2.4 | 2.3 | 2.0 | 2.0 | 2.0 | 2.4 | 26.3 |
| Timaru | 2.5 | 2.5 | 1.8 | 1.8 | 1.7 | 1.6 | 1.5 | 1.4 | 1.8 | 2.1 | 1.9 | 2.9 | 23.5 |
| Milford Sound | 25.5 | 23.1 | 22.3 | 21.8 | 21.6 | 14.7 | 14.7 | 17.3 | 19.8 | 26.0 | 23.1 | 23.4 | 253.3 |
| Queenstown | 3.2 | 2.5 | 3.0 | 2.9 | 2.6 | 2.2 | 2.2 | 2.5 | 2.6 | 3.0 | 2.5 | 2.4 | 31.6 |
| Alexandra | 1.8 | 1.5 | 1.2 | 1.3 | 0.9 | 0.8 | 0.7 | 0.6 | 0.8 | 1.2 | 1.1 | 1.3 | 13.2 |
| Dunedin (Musselburgh) | 2.8 | 2.5 | 2.5 | 2.5 | 2.6 | 2.9 | 2.5 | 2.3 | 2.2 | 2.5 | 2.8 | 2.9 | 31.0 |
| Invercargill Airport | 3.6 | 3.8 | 4.3 | 3.8 | 3.7 | 3.9 | 2.8 | 3.0 | 3.3 | 3.4 | 3.6 | 3.6 | 42.8 |
Thunderstorms—Thunderstorms are not numerous. Their frequency is greatest in the north and west where thunder is heard on 15 to 20 days a year; east of the ranges (except in Gisborne) the figure is five or less.
Hail—Hail is most frequent in the south-west where it is reported on about 20 days a year, but for the greater part of the country it occurs on about five days a year or less. Most of the hailstones are small, but occasionally large stones cause local damage to glasshouses, and to orchards and market gardens, chiefly in Canterbury and Hawke's Bay.
Temperature—Mean temperatures at sea level decrease steadily southwards from 59°F in the far north to 54° about Cook Strait, then to 49° in the south. With increasing altitude, temperatures drop about 3° per 1,000 ft. January and February, with approximately the same mean temperature, are the warmest months of the year; July is the coldest. Some temperature statistics for selected places are included in the table on climatological averages. Highest temperatures are recorded east of the main ranges, where they rise to the nineties on a few afternoons in most summers, usually in association with a north-westerly Föhn wind. The extremes for New Zealand (measured in a standard thermometer screen) are 101° at Ashburton and -3° at Ophir (Central Otago).
As is to be expected, there is a small annual range of temperature (difference between mean temperature of the warmest and coldest months). In Northland and in western districts of both Islands the annual range is about 15°F. For the remainder of the North Island, and east coast districts of the South Island, it is 17°-19°. Further inland it exceeds 20° in places, reaching a maximum of 25° in Central Otago where there is an approach to a continental type of climate.
Frost—It is well known that local variations in frostiness are considerable, even within quite small areas. On a calm, clear night the cold air in contact with a sloping surface gravitates slowly downhill to collect in valleys and depressions, and it is these "Katabatic'' drifts which are mainly responsible for local temperature variations at night. Gently sloping ground with a northerly aspect tends to be least affected by frost. Favourable sites in coastal areas of Northland are free of frost, although further inland light frosts occur frequently in the winter months. At Albert Park, Auckland, the screen minimum thermometer (4 ft above the ground) has registered below 32°F only once in nearly 50 years, yet across the harbour at Whenuapai Aerodrome there are eight screen frosts per annum on the average. Excluding the uninhabited mountainous areas, the most severe winter conditions are experienced in Central Otago and the Mackenzie Plains of inland Canterbury, and on the central plateau of the North Island. Even in these areas night temperatures as low as 10° are rarely recorded. Elsewhere over the North Island the winters are very mild and pastures maintain continuous growth. In both Islands sheep and cattle remain in the open all the year round.
Snow—The majority of New Zealanders rarely see snow except on the mountains. The North Island has a small permanent snow field above about 8,000 ft on the central plateau, but the snow line rarely descends below 2,000 ft even for brief periods in winter. In the South Island snow falls on a few days a year in eastern coastal districts and in some years may lie for a day or two even at sea level. In Westland it does not lie at sea level. The snow line on the Southern Alps is around 7,000 ft in summer, being slightly lower on the western side where the Franz Josef and Fox Glaciers descend through heavy bush to within 1,000 ft of sea level. In inland Canterbury and Otago, where there are considerable areas of grazing lands above 1,000 ft, snowfalls are heavier and more persistent and have caused serious losses of sheep during severe winters in the past. However, only rarely does the winter snow line there remain permanently below 3,000 ft.
Relative Humidity—Humidity is commonly between 70 and 80 percent in coastal areas and about 10 percent lower inland. It varies inversely to the temperature, falling to a minimum in the early afternoon when temperature is highest and frequently lying between 90 and 100 percent during clear nights. As the following table shows, the diurnal variation is greater than the difference between summer and winter.
| Station | Mean Relative Humidity | |||
|---|---|---|---|---|
| January | July | |||
| 3 a.m. | 3 p.m. | 3 a.m. | 3 p.m. | |
| percent | ||||
| Auckland (Mechanics Bay) | 85 | 63 | 90 | 74 |
| Gisborne | 89 | 62 | 90 | 72 |
| Ohakea Aerodrome | 87 | 62 | 89 | 72 |
| Wellington | 89 | 71 | 87 | 77 |
| Christchurch | 87 | 61 | 89 | 73 |
| Hokitika | 95 | 78 | 93 | 75 |
| Invercargill | 90 | 72 | 91 | 78 |
Very low humidities—between 20 and 30 percent or lower—occur at times in the lee of the Southern Alps where the Föhn effect is often very marked. In summer the hot, dry "Canterbury Norwester'' is generally a most unpleasant wind. Cool south-westerlies are also at times very dry when they reach eastern districts. In Northland the humid mid-summer conditions are inclined to be rather oppressive though temperatures rarely reach 85°. Dull, humid spells are generally not prolonged anywhere, but their frequency shows a marked increase in the south.
Sunshine—The sunniest areas are to be found near Blenheim, Nelson, and Whakatane, where the average duration of bright sunshine exceeds 2,400 hours per annum. The rest of the Bay of Plenty and Napier are only slightly less sunny. A large portion of the country is favoured with at least 2,000 hours. Even Westland, despite its high rainfall, has 1,800 hours. Southland, where sunshine drops sharply to 1,700 hours per annum, lies on the northern fringe of a broad zone of increasing cloudiness. Four hundred miles further to the south at Campbell Island the sunshine has the extremely low value of 650 hours per annum. A pleasant feature of the New Zealand climate is the high proportion of sunshine during the winter months. To eliminate the effect of varying day-length the summer and winter sunshine at a few selected stations have been expressed as a percentage of the possible sunshine.
| Summer | Winter | |
|---|---|---|
| percent | ||
| Auckland | 57 | 49 |
| Hamilton | 52 | 44 |
| New Plymouth | 53 | 47 |
| Napier | 57 | 52 |
| Wellington | 52 | 42 |
| Nelson | 58 | 57 |
| Hokitika | 43 | 44 |
| Christchurch | 46 | 45 |
| Dunedin | 41 | 43 |
| Invercargill | 42 | 35 |
As these figures indicate, there is a marked increase in cloudiness in the North Island in winter, but little seasonal change in the South Island, except in Southland.
Climatological Averages—The following table provides a brief summary of the main climatological elements for selected locations.
| Station | Altitude | Annual Averages | Air Temperature (Degrees Fahrenheit) | |||||||||
|---|---|---|---|---|---|---|---|---|---|---|---|---|
| Rain Days (0.01 in. or More) | Wet Days (0.10 in. or More) | Bright Sunshine | Days of Screen Frost (min. air temp. less than 32° F) | Mean Temp. | Mean Daily Maximum | Mean Daily Minimum | Mean Annual | |||||
| Jan | Jul | Jan | Jul | Maximum | Minimum | |||||||
| ft | hours | |||||||||||
| Te Paki, Te Hapua | 190 | 187 | 112 | 2,140 | 2 | 59·3 | 73 | 60 | 57 | 46 | 78 | 30 |
| Auckland | 160 | 173 | 100 | 2,090 | 0 | 59·5 | 73 | 57 | 60 | 46 | 81 | 37 |
| Tauranga Airport | 12 | 152 | 91 | 2,320 | 9 | 57·2 | 75 | 57 | 55 | 40 | 85 | 29 |
| Ruakura, Hamilton | 131 | 168 | 99 | 1,980 | 29 | 55·4 | 74 | 56 | 52 | 37 | 85 | 23 |
| Rotorua | 1,006 | 151 | 96 | 2,000 | 26 | 53·7 | 74 | 54 | 52 | 36 | 87 | 24 |
| Gisborne Airport | 13 | 158 | 83 | 2,210 | 8 | 56·8 | 76 | 57 | 55 | 40 | 91 | 28 |
| Lake Waikaremoana | 2,110 | 196 | 132 | .. | 5 | 51·7 | 68 | 48 | 52 | 37 | 83 | 30 |
| New Plymouth | 160 | 166 | 113 | 2,110 | 1 | 56·1 | 69 | 55 | 56 | 43 | 78 | 32 |
| Napier | 5 | 124 | 62 | 2,280 | 8 | 57·1 | 74 | 55 | 57 | 39 | 89 | 29 |
| Wanganui | 72 | 146 | 87 | 2,120 | 4 | 56·1 | 71 | 54 | 56 | 41 | 83 | 30 |
| Palmerston North | 110 | 172 | 94 | 1,810 | 16 | 55·0 | 71 | 53 | 55 | 39 | 82 | 27 |
| Masterton | 340 | 172 | 92 | 2,060 | 30 | 53·9 | 74 | 53 | 51 | 36 | 89 | 25 |
| Wellington (Kelburn) | 415 | 158 | 97 | 2,010 | 0 | 54·3 | 68 | 51 | 55 | 42 | 79 | 34 |
| Nelson Airport | 6 | 125 | 74 | 2,410 | 44 | 53·2 | 71 | 53 | 54 | 34 | 82 | 23 |
| Blenheim | 14 | 108 | 59 | 2,430 | 33 | 54·5 | 74 | 55 | 52 | 36 | 89 | 23 |
| Hanmer | 1,270 | 143 | 89 | 1,910 | 88 | 49·6 | 73 | 48 | 48 | 28 | 89 | 15 |
| Hokitika | 12 | 194 | 140 | 1,860 | 19 | 51·6 | 66 | 53 | 51 | 36 | 76 | 27 |
| Lake Coleridge | 1,195 | 118 | 71 | .. | 69 | 50·0 | 71 | 48 | 49 | 30 | 88 | 18 |
| Christchurch | 22 | 116 | 59 | 1,990 | 37 | 52·6 | 70 | 50 | 53 | 34 | 90 | 25 |
| Timaru | 56 | 112 | 57 | 1,910 | 39 | 51·9 | 70 | 50 | 51 | 33 | 90 | 24 |
| Milford Sound | 16 | 193 | 163 | .. | 31 | 50·4 | 65 | 49 | 50 | 34 | 77 | 27 |
| Queenstown | 1,080 | 132 | 75 | 1,980 | 54 | 50·1 | 71 | 46 | 49 | 31 | 86 | 23 |
| Alexandra | 520 | 100 | 39 | 2,080 | 89 | 50·9 | 74 | 45 | 51 | 28 | 90 | 18 |
| Dunedin (Musselburgh) | 5 | 167 | 78 | 1,730 | 12 | 51·6 | 67 | 50 | 52 | 37 | 86 | 28 |
| Invercargill Airport | 0 | 199 | 109 | 1,660 | 53 | 49·1 | 65 | 49 | 48 | 33 | 82 | 22 |
NOTES:
Averages of rain days and wet days 1950-59; sunshine 1935-60; mean temperature 1931-60; other temperature data and days of screen frost, various periods—all exceeding 10 years.
For normal monthly and annual rainfall for these stations, see table under subsection on Rainfall.
Normal Seasonal Temperature Pattern—A feature of the seasonal pattern of temperature for New Zealand is the near symmetry about either the hottest summer months or the coldest winter months. In other words the summer-winter decline is an almost identical reversal of the winter-summer rise. This shows up clearly when temperatures for 100 climatological stations are averaged month by month. The first two months of the calendar year, the summer months of January and February, display the same average temperature, that of 61.3°F. This temperature is the highest average for any month, being approached by only the December average of 59.2°F. Once February is past a decline sets in, the estimated average New Zealand temperature falling by 2.5°F from February to March to give a March average of 58.8°F. Thereafter, successive inter-monthly temperature drops of 4.4°, 5.4°, 4.2°, and 1.2°F finally produce a July average of 43.6°F, which makes this month the coldest of the year. Progressing through and past July the temperature steadily rises, the increments being successively, 1.8°, 3.4°, 3.8°, 3.2°, 3.4°, and 2.1°F, finally returning to the January mark of 61.3°F.
| ESTIMATED NORMAL NEW ZEALAND TEMPERATURE (°F)* | |
|---|---|
| Calendar Month | Mean Temperature |
* Based on temperature normals for 100 climatological stations. | |
| January | 61.3 |
| February | 61.3 |
| March | 58.8 |
| April | 54.4 |
| May | 49.0 |
| June | 44.8 |
| July | 43.6 |
| August | 45.4 |
| September | 48.8 |
| October | 52.6 |
| November | 55.8 |
| December | 59.2 |
The following diagram illustrates the seasonal temperature pattern.
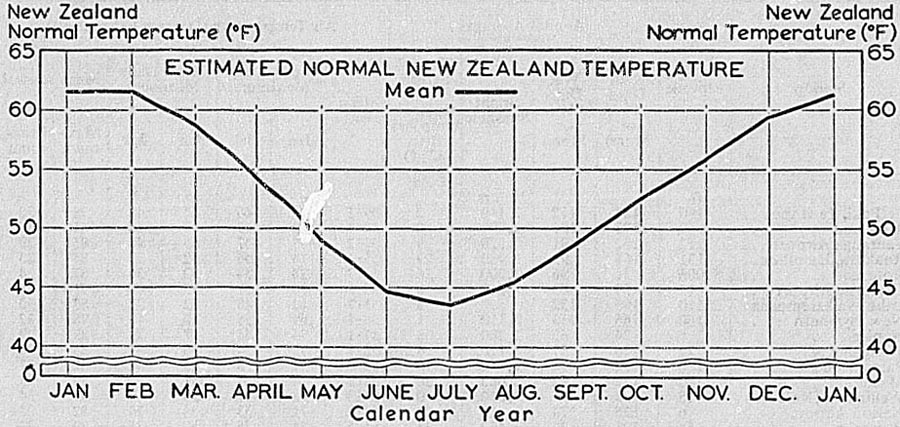
Brief Review of 1966: Year—In the North Island rainfall was mainly above average by 25 percent. In some eastern districts of Northland and Auckland the surplus was as high as 40 percent. On the other hand, in Taihape and on the East Coast rainfall was 10 percent below average. In the South Island, except for Nelson and Marlborough and parts of South Canterbury, rainfall was below average. The deficit was mainly about 20 percent but it was as high as 35-40 percent in parts of Central Otago and inland Canterbury. The year 1966 was a little wetter than 1965 in the North Island but considerably drier than 1965 in the South Island.
The mean annual temperature was half a degree above the 1931-60 average value on the West Coast and in parts of Canterbury, Otago, and Southland. Over most of the North Island temperatures were close to average. For the country as a whole 1966 was appreciably warmer than 1965 and about the same temperature as 1964.
In the South Island sunshine was 50 to 150 hours below average except over most of the West Coast together with the Alps and the Canterbury high country, and also the Southland coast; in these areas it was close to average. The North Island fared a little better; in fact Auckland, Waikato, and parts of Waitomo were favoured with 50 to 100 hours above average. However, eastern districts from Wairarapa to Gisborne together with Bay of Plenty and Wanganui received 50 to 150 hours below the average value. For the country as a whole 1966 was a little sunnier than 1965.
Seasonal Notes—January and February were unusually cloudy, especially in western and northern districts of both islands. These months were also wetter than usual; and in February persistent north-easterly winds brought excessive rain to northern districts of the North Island. January was warmer than usual in the north, while February was about 4 degrees above average over the whole country. Growth was exceptional and stock benefited, except lambs. In Northland, Auckland, and Waikato some very heavy daily falls were recorded on 16 and 28 February in thunderstorms.
Frequent northerly to easterly winds persisted in March, with temperatures still warmer than average, while rainfall was 50 percent above average in most northern and eastern districts. April was a sunny month, but with more than double the average rainfall about Cook Strait. However, in the middle fortnight of both March and April the weather was comparatively settled and favourable for harvesting. Farmers reported good growth for the time of the year, as moisture was mainly adequate.
May was marked by an unusually high frequency of southerly to easterly winds. It was a cold month with exceptionally low rainfall on the West Coast. On the other hand, rainfall was again well above average in Wellington, Wairarapa, and Marlborough.
June was unusually dry in Canterbury. Farmers found it a good month since the weather was rather more settled than usual. July was wet over the North Island but exceptionally dry in Fiordland and Central Otago. The passage of a deep depression over the North Island on 18 and 19 July brought very inclement weather; strong gales caused considerable damage in South Auckland, while snow was reported well down on the hills in the southern half of the North Island. Nevertheless this was a good month for stock, and lambing commenced under favourable conditions. However, in August an unusually high frequency of southeasterly winds brought persistent cloud and rain to eastern districts, especially during the last week, making conditions there unsuitable for lambing. In Canterbury both ewes and lambs were lost, many of them during a fall of snow on the 25th and 26th. It was colder than average, but comparatively sunny in northern and western districts of the North Island, with favourable conditions there for lambing.
September and October were marked by a comparative absence of westerly winds. Both months were cooler than usual in the North Island. They were also drier than usual over most of the South Island. In September persistent north-easterlies brought considerable rain to Northland and Bay of Plenty. It was a cloudy month and exceptionally dry in parts of South Canterbury and North and Central Otago, causing a shortage of feed in some of these areas. October was a sunny month with rainfall mainly about half the average value. In some dairying districts farmers found the weather too dry.
November and December were cloudy and cool, and wetter than usual. November was a good farming month apart from delays to shearing caused by the unsettled weather. December was also mainly favourable; however, in the high rainfall areas it was considered too wet, while in Otago and parts of Canterbury it was too dry.
Summary of Meteorological Observations for 1966—The observations from which the following summary was compiled for the year 1966 were taken at 0900 hours New Zealand standard time, i.e., 2100 hours Greenwich mean time.
| Station | Rainfall | Rain Days (.01 in. or More) | Bright Sunshine | Days of Screen Frost* | Air Temperatures (Decrees Fahrenheit) | ||||||
|---|---|---|---|---|---|---|---|---|---|---|---|
| Mean Temp. | Mean Daily Maximum | Mean Daily Minimum | 1966 Extremes | ||||||||
| Jan | Jul | Jan | Jul | Maximum | Minimum | ||||||
* Minimum air temperature less than 32°F. | |||||||||||
| in. | hours | ||||||||||
| Auckland | 54.59 | 176 | 2,175 | 0 | 59.5 | 73 | 57 | 61 | 46 | 84 | 38 |
| Tauranga | 56.63 | 155 | 2,245 | 6 | 57.2 | 73 | 57 | 58 | 40 | 83 | 30 |
| Ruakura, Hamilton | 55.39 | 159 | 2,100 | 31 | 55.8 | 74 | 56 | 56 | 38 | 83 | 25 |
| Whakarewarewa, Rotorua | 72.48 | 148 | 1,930 | 35 | 54.1 | 72 | 53 | 56 | 38 | 81 | 26 |
| Gisborne Airport | 37.86 | 153 | 2,110 | 5 | 56.8 | 78 | 56 | 58 | 41 | 91 | 28 |
| Lake Waikaremoana | 81.26 | 196 | .. | 9 | 52.2 | 71 | 49 | 54 | 38 | 84 | 29 |
| New Plymouth | 64.09 | 174 | 2,154 | 1 | 56.3 | 69 | 54 | 55 | 44 | 80 | 30 |
| Napier | 34.54 | 129 | 2,176 | 18 | 56.4 | 76 | 56 | 58 | 38 | 89 | 26 |
| Wanganui | 37.62 | 139 | 2,018 | 5 | 56.6 | 70 | 54 | 57 | 40 | 83 | 29 |
| Palmerston North | 42.62 | 154 | 1,840 | 15 | 54.9 | 71 | 53 | 55 | 38 | 83 | 28 |
| Waingawa, Masterton | 41.73 | 172 | 1,889 | 29 | 53.7 | 74 | 52 | 52 | 36 | 89 | 28 |
| Kelburn, Wellington | 56.89 | 169 | 1,872 | 0 | 54.0 | 66 | 51 | 54 | 42 | 82 | 34 |
| Nelson Airport | 40.36 | 119 | 2,297 | 41 | 53.4 | 69 | 53 | 55 | 34 | 81 | 24 |
| Blenheim | 29.47 | 91 | 2,397 | 39 | 54.7 | 73 | 53 | 55 | 35 | 88 | 27 |
| Hanmer Forest | 45.75 | 141 | 1,854 | 89 | 49.9 | 72 | 46 | 48 | 27 | 87 | 12 |
| Hokitika | 103.82 | 180 | 1,844 | 17 | 53.1 | 64 | 52 | 52 | 37 | 78 | 30 |
| Lake Coleridge | 27.37 | 124 | .. | 75 | 50.4 | 69 | 47 | 50 | 30 | 85 | 20 |
| Christchurch | 21.56 | 114 | 1,848 | 33 | 53.2 | 71 | 50 | 53 | 34 | 90 | 26 |
| Timaru | 23.35 | 119 | 1,707 | 36 | 52.9 | 70 | 49 | 52 | 34 | 89 | 23 |
| Milford Sound | 205.88 | 210 | .. | 23 | .. | 64 | 50 | 50 | 36 | 79 | 27 |
| Alexandra | 11.05 | 78 | 2,074 | 89 | 51.3 | 72 | 44 | 51 | 28 | 86 | 16 |
| Queenstown | 21.60 | 120 | 1,825 | 61 | 50.6 | 70 | 47 | 48 | 31 | 82 | 23 |
| Musselburgh, Dunedin | 24.90 | 147 | 1,619 | 11 | 51.9 | 64 | 49 | 51 | 38 | 85 | 29 |
| Invercargill Airport | 34.45 | 192 | 1,658 | 48 | 49.2 | 63 | 48 | 47 | 33 | 82 | 18 |
For 1966 the mean sea-level pressure values in millibars at 0900 hours New Zealand standard time were: Auckland 1017.0; Kelburn, Wellington 1015.9; Nelson Airport 1016.1; Hokitika 1015.8; Christchurch 1014.8; and Dunedin 1014.0.
EARLY HISTORY: General—When New Zealand was discovered by Europeans in 1642 it was found to be inhabited by a race of Polynesians called Maoris, who had migrated to these islands at least 300 years previously. It is generally accepted that the Maoris came originally from South-East Asia, whence, as proto-Polynesians, they moved eastwards from island to island until they reached the eastern Pacific, where they settled the islands now known collectively as Polynesia. From Polynesia the ancestors of the Maori sailed south-west in ocean-going canoes to reach New Zealand and these voyages were probably spread over several generations, perhaps several centuries. Oral Maori history and genealogy support the view that there was a final wave of migration of considerable magnitude about A.D. 1350. Adapting themselves to a new physical environment, in isolation from the outside world, the Maoris produced forms of social and economic organisation and material culture which were significantly different from their Polynesian prototypes.
Coming from tropical latitudes, the Maoris mainly confined themselves to the warmer North Island, and when discovered by Europeans were in a high state of neolithic civilisation, with marked superiority in the arts of wood carving and military engineering. Their principal social unit was the family group, and from combinations of the numerous groups were formed the subtribes and tribes. They had highly developed social and ritualistic customs, and their system of land tenure and methods of cultivation were communal within the subtribes. Inter-tribal and intra-tribal warfare was common, and as individuals they displayed exceptional courage and intelligence.
The immediate effect of European contacts on the Maoris was the outburst of a series of tribal wars waged with greater ferocity and a vastly greater loss of life than was customary in pre-European tribal engagements. The high mortality could, of course, be credited to the acquisition of a more lethal weapon, the musket. The advantage lay originally with the coastal tribes as a result of their earlier contact with Europeans, the wars continuing until all tribes were equally well armed. These wars were later followed by wars against the colonists, but after 1870 the story has been one of unbroken peace between Maoris and Europeans.
The introduction of European diseases and firearms, and the impact of European civilisation on the traditional way of life and customs of the Maoris, had such an adverse effect that their numbers must have been reduced by over half during the nineteenth century. However, the virility of the race gradually asserted itself, and from the beginning of the twentieth century the Maori population has been rapidly increasing.
Other island groups, such as the Cook Islands, Niue Island, and the Tokelau Islands, had also long been inhabited by Polynesians from various successive migrations extending over considerable periods prior to their discovery by Europeans.
Discovery by Europeans—On 13 December 1642, Abel Janszoon Tasman, a navigator of the Dutch East India Company, discovered the country to which he gave the name of Staten Land, and which later became known as "Nieuw Zeeland''. Tasman had left Batavia on 14 August 1642, and, after having discovered Tasmania, he steered eastward and sighted the west coast of the South Island, described by him as a high mountainous country. Sailing north, he had the misfortune to come into conflict with the Maoris at Golden Bay, on the north coast of the South Island, so that, though he continued his northward journey until he reached the northern tip of the country, he did not again attempt to land. His exploration was of necessity very cursory, for having explored only part of one coast he had no knowledge of the country's, extent or shape.
There is no record of any European visit to New Zealand after Tasman's departure until Captain Cook sighted land on 6 October 1769, at Young Nick's Head, near Gisborne. On his first voyage Cook spent six months exploring the New Zealand coastline, and he completely circumnavigated the North and South Islands. His activities can be best described by saying "he found New Zealand a line on the map, and left it an archipelago''. Not only was Cook's ability shown by his cartographical accuracy, but also in his peaceful dealings with the truculent Maoris. He returned to New Zealand again in 1773, in 1774, and in 1777.
Several other explorers also visited New Zealand during the latter portion of the eighteenth century, amongst whom may be mentioned M. de Surville 1769, M. Marion du Fresne 1772, Captains Vancouver and Broughton 1791, Captain Raven 1792-93, Alejandro Malaspina and Jose de Bustamente y Guerra 1793, and Lieutenant Hanson 1793.
The European discovery of many of the islands of the Cook Group was made by Captain Cook in 1773. Rarotonga and Mauke were not officially discovered for another 50 years, although there were records of earlier visits by the Bounty under the control of the mutineers in 1789 and later, in 1814, by the Cumberland. Niue Island was discovered by Cook in 1774. The first recorded discovery of the Tokelau Islands was made by Quiros in 1606. Of the remaining islands of the group, Atafu was discovered in 1765, Nukunono in 1791, and Fakaofa in the 1840s.
European Settlement and Colonisation—So far as is known, the first instance of Europeans being left in New Zealand to their own resources occurred in 1792, when Captain Raven of the Britannia landed a sealing party at Facile Harbour, on the west coast of the South Island, where they remained a little over 12 months before being called for.
In the years that followed, whaling stations sprang up along the coast, and a trade with New South Wales began not only in whale oil and seal skins, but also in flax and timber. Attracted to New Zealand were deserters from whaling vessels and escaped convicts from Australia, who, in the absence of any jurisdiction, soon became notorious for their extreme lawlessness. In 1914 Samuel Marsden, chaplain to the Governor of New South Wales, obtained permission to send two of his protégés, Kendall and Hall, to the Bay of Islands to consider the desirability of establishing a mission station. Later they returned to Sydney for Marsden, who arrived in New Zealand to preach his first sermon at the Bay of Islands on Christmas Day, 1814. Of the many admirable activities undertaken by the missionaries, their action in having the Maori language "reduced to a rational orthography'' deserves special mention.
In 1825 three separate, but abortive, attempts were made to found colonies; however for some years the only settlements were those round the principal whaling stations, although a number of Europeans gradually penetrated inland and resided there permanently, many marrying Maori women.
The first body of immigrants under a definite scheme of colonisation arrived in Port Nicholson in January 1840, there to found the town of Wellington, just one week before Captain William Hobson arrived at the Bay of Islands as Governor to proclaim British sovereignty (see later). These settlers were brought out from England by the New Zealand Company, whose moving spirits was Edward Gibbon Wakefield.
It was hoped that, by producing a proper balance of capitalists and artisans, self-contained communities could be successfully established. However, owing to the unsatisfactory nature of the land purchases, considerable difficulty was experienced in these initial settlements, and friction grew up not only between settlers and the Maoris, but also between the Governor and the settlers. Before his death in 1842 Governor Hobson had transferred his capital from Russell to Auckland, but this transfer was of little assistance to the colonists, who had extended their settlements to Wanganui, New Plymouth, and Nelson.
Following the death of Hobson, the existence of the colony became precarious, for, through lack of funds and weak administration, Maori aggression became a real menace. To cope with the situation, the Colonial Office appointed Captain George Grey as Governor. Being well equipped with troops and funds, as well as being a man of vigour and perception, Grey soon restored order and won the confidence of both the settlers and the Maoris. During Grey's term two further organised settlements were made. In co-operation with the New Zealand Company the Free Church of Scotland sponsored the Dunedin Settlement of 1848, and the Church of England the Canterbury Settlement of 1850. These settlements, owing to their more favoured situations, their satisfactory land-purchase agreements, and their freedom from trouble with the Maoris, achieved a greater measure of success in carrying out the company's avowed aims.
After Grey's departure the question of relationship with the Maoris again came to the fore through the land-purchasing activities of the settlers—a situation aggravated by subsequent lack of consideration for the Maori system of land tenure. Following an incident at Waitara in the Taranaki district, where a dispute arose concerning land titles, war broke out in 1860 and lasted spasmodically till 1870. The recall of Grey did not solve the problem, as Grey, an autocrat, could not work with the elected Ministers, nor did his presence prevent the confiscation of land belonging to the Maoris, whether friendly or hostile. It was under the sympathetic administration of Sir Donald McLean as Minister for Maori Affairs that the dispute finally died down.
These hostilities were confined to the North Island; and, in the meantime, in 1861, large alluvial deposits of gold had been discovered in the South Island—leading to a tremendous influx of population and an alteration of the economic structure of the country.
No organised form of European colonisation has at any time taken place in the Cook Islands, Niue Island, or the Tokelau Islands.
SUBSEQUENT HISTORY AND DEVELOPMENT (1870 ONWARDS)—The discovery of gold, by increasing the wealth of the South Island, allowed it to obtain a lead in commercial and political development which it long maintained. Moreover, with the subsequent agrarian expansion, especially in the development of the large pastoral holdings, the country ceased to be merely self-sufficient agriculturally, but began to develop a substantial export trade, mainly in wool, which it has maintained to the present day.
These factors, together with freedom from strife with the Maori population, led after 1870 to a quickening in political activities. Under the leadership of Sir Julius Vogel a policy of extensive borrowing for railway and road construction was begun. The provincial system, which really commenced in 1853, had largely outlived its usefulness; in fact, the parochialism of the provincial assemblies had frequently proved obstructive, and in consequence the system was abolished in 1875, local administration being provided for by the Counties Act and the Municipal Corporations Act of 1876.
Of great social significance was the passing in 1877 of the Education Act, making education free, compulsory, and secular, while the laying during that decade of the first cable between Australia and New Zealand was a major advance in communications. At this time party politics began to enter into the parliamentary system, and the slump conditions which prevailed in the eighties (due to a fall in the world price level) intensified the political atmosphere. By the abolition of plural voting in 1889, and the introduction of female suffrage in 1893, the way was opened for a practical expression of political convictions by all adult members of the community.
In 1891 Ballance, as Leader of the Liberal Party, became Premier, to be followed on his death in 1893 by Seddon, and during the next decade the legislative essays of this party evoked world-wide interest. The main aim of the legislation was social justice, and its principal manifestations were in land division, the establishment of the Court of Arbitration, and the introduction of old-age pensions. The policy of land division aimed at closer land settlement, and it was achieved by the compulsory subdivision of large estates, with subsequent loans to small independent farmers wishing to establish themselves. In inaugurating the Court of Arbitration the object was to eliminate strikes by giving labour a recognised bargaining status; and the enactment was in accord with the enlightened code of labour legislation passed at that time.
With the commencement of the refrigerated trade in 1882, the policy of closer settlement progressed rapidly, since the production of frozen meat and dairy produce for export encouraged more intensive farming. There thus arose a new farming class which in 1911, some five years after Seddon's death, was mainly responsible for the overthrow of the Liberal regime.
The policy of the succeeding Reform Party under Massey was one favouring agricultural production. Farming interests were given constant encouragement by a series of enactments of which the extension of rural credit was typical. Three years after the advent of the Reform Party the First World War, 1914-18, broke out, leading to the formation of a Coalition Government and an Imperial commandeer of exports. War activities were marked by heavy casualty lists, in proportion to the population, and by enhanced cordiality in Imperial relations. One noteworthy outcome of the war commandeer was the precedent given for the establishment, after the war, of control boards to regulate the export of pastoral products.
Though the effects of the post-war depression during the period 1921-24 showed themselves in an increase in unemployment and slight wage reduction, no drastic legislation was necessary to stabilise economic conditions. During the following years the price level rose; and from the administrative side, the period was characterised by extensive public works expenditure, with particular attention to hydro-electric schemes and highways.
Owing to the encouragement given to farming, pastoral production constantly expanded, so that New Zealand became one of the world's greatest exporters of pastoral produce. As a consequence, her national income was extremely sensitive to price fluctuations of these products; so that, with the advent of the depression in 1930, her economic position became extremely vulnerable. In order to produce balanced budgets, both public and private, various legislative remedies were attempted. In particular, enactments were provided for unemployment relief, for the suspension, in effect, of compulsory arbitration, for the establishment of a Reserve Bank, for a mortgage moratorium, for raising the exchange rate, and for reduction in interest rates and wages. With the recovery in price levels and consequent general economic revival, amendments were made to several of these Acts, removing the more stringent measures. The election of a Labour Government in 1935 led to a change in administrative policy, the preoccupation being mainly with social problems. Further amendments were made to the depression legislation, certain restrictive measures were removed, and other temporary adjustments made permanent.
The general climate of opinion and gradual maturity of outlook furnish the background in which certain distinctive trends appear in legislation passed since 1936.
The first major influence was a humanitarian attitude reinforced by a progressive economic policy. Evidence of this is implicit in the provision for a basic wage, and later for a minimum wage, employment-promotion legislation, amendments to workers' compensation, industrial conciliation and arbitration, mining, etc., legislation, the system of basic prices for certain primary produce, the creation of farm industry reserves, and the rationalisation of production and marketing by the establishment of boards for certain items of primary produce.
The second major influence on legislation was conditioned by the outbreak of the Second World War, 1939-45. A vast body of legislation was placed on the statute book during the war period dealing with the control of manpower and materials, stabilisation of prices, wages, and rents, conditions of employment and suspension of certain peacetime features of industrial activity, discouragement of some industries and diversion to or encouragement of other industries, provision for rehabilitation, etc.
A third dominant trend was the acceptance of the principle that society should take active steps towards the improvement of the working, living, and social circumstances of its members. Foremost in this category was the Social Security Act and its later extensions providing for monetary benefits such as age, superannuation, family allowances, sickness, and unemployment, and by the provision of a system of medical, pharmaceutical, hospital, maternity, and other related benefits.
Other legislative enactments under this heading include the provision for paid annual holidays, reduction of working hours, extension of workers' compensation insurance, improvement in safety and health and welfare conditions in industry, and extension of educational facilities and opportunities.
A fourth approach to law making resulting from maturity of outlook has been the increased participation by New Zealand in international affairs consequent on its acceptance of responsibility in the wider issues of the present era. Legislation authorising participation in United Nations activities generally and in particular emergencies, such as military service in Korea, Malaya, and elsewhere; the extension of New Zealand representation in overseas countries and with the United Nations; the greater frequency of Commonwealth consultation; extension of aid to less developed countries, e.g., participation in the Colombo Plan, all bear witness to this change in outlook.
Another influence on legislation presents some parallels to that last mentioned, but is more concerned with the domestic sphere. It is exemplified in the increasing interest taken in welfare and social development generally of both the rapidly growing Maori population and the inhabitants of New Zealand territory in the islands of the Pacific.
Contemporaneously with the expansion of the field of legislative interest, the economic and industrial development of the country has proceeded with marked impetus in recent years. Expansion and diversification of manufacturing and servicing industries have provided avenues of employment for the growing labour force. At the same time the basic industries of the country, those concerned with primary production, have increased output, assisted by the rapid application of technological improvements and research findings.
The history of New Zealand's overseas territories has been largely one of wise paternal oversight, particularly in the earlier periods, by the New Zealand Government and by the various missions established in the islands. More recently, successive Governments have in various ways encouraged the inhabitants to take an increasing share in the administration of their communities, thus paving the way for some form of self-government. Much attention has been paid to combating tropical diseases and to health problems generally; such island industries as citrus fruit and banana growing have been fostered and encouraged in various ways, with outlets being found for produce available for export. Financial and other assistance has been provided from New Zealand Government sources for the expansion of educational facilities and opportunities, public works such as roading, conservation of water supplies by reservoir construction, communication facilities, etc.
For detailed information, reference should be made to the many excellent books dealing with the subject of New Zealand history, of which the more recent ones are listed in the Select Bibliography in this Yearbook. A useful reference is the Encyclopaedia of New Zealand, published in 1966.
SOVEREIGNTY—Following representations from Maori chiefs for protection from the prevailing turmoil and lawlessness caused by tribal warfare and the rough element around the whaling stations, the New South Wales Government appointed, in 1832, Mr James Busby as British Resident at Russell. Owing to the failure to supply him with any means of exerting authority, his appointment was largely ineffective. Finally the disorder, and the friction between the two races, became so intolerable that even the missionaries, who were opposed to annexation, made representations for British sovereignty.
On 29 January 1840, Captain William Hobson, RN, arrived at the Bay of Islands, empowered, with the consent of the Maoris, to proclaim the sovereignty of Queen Victoria over the Islands of New Zealand, and to assume the government thereof. Hobson formally read his commissions at Kororareka on 30 January 1840, and on 6 February of the same year a compact called the Treaty of Waitangi was entered into, whereby all rights and powers of sovereignty were ceded to the Queen, all territorial rights being secured to the chiefs and their tribes.
On 21 May 1840 Governor Hobson proclaimed British sovereignty in the case of the North Island by virtue of the Treaty of Waitangi, and in the case of the South Island and Stewart Island by right of discovery. New Zealand remained a dependency of New South Wales until 3 May 1841, when it was created a separate colony by Royal Charter dated 16 November 1840. The capital was at first transferred from Russell to Auckland, but in 1865 it was again transferred, on this occasion to Wellington, where the seat of Government has since remained.
During Governor Grey's term, steps were taken to draft a constitution for the colony. An Act granting representative institutions was passed by the Imperial Parliament on 30 June 1852, and was published in New Zealand by Proclamation on 17 January 1853. Under it provision was made for the constitution of a General Assembly consisting of a Legislative Council and a House of Representatives. Provision was also made for the division of the country into provinces, each province having an elected Council and Superintendent. (The provincial system was abolished in 1875 and the Legislative Council in 1950.) In the first General Assembly of 27 August 1854 certain members of this body were associated with the permanent members of the executive but they did not hold any portfolios. It was not until 7 May 1856 that responsible government was actually established.
With the gradual development of the country's economy, the acquisition of political and administrative experience, and the increasing desire for self-reliance in political matters, the degree of self-government became more complete. In recognition of this and of a nascent sense of nationality, New Zealand was given the title of Dominion in lieu of Colony, the new title taking effect on 26 September 1907.
Of the constitutional events in recent years the passing by the United Kingdom Parliament of the Statute of Westminster in December 1931 was of major importance. The draft of this statute was submitted for the confirmation of the various Commonwealth Legislatures before its passage through the United Kingdom Parliament. The statute granted complete autonomy to the various self-governing members countries, but it did not automatically apply to Australia or New Zealand. In other words, its operation in the latter self-governing members of the Commonwealth was declared to require specific adoption by the Legislatures of those countries. It was not until 1947 that the New Zealand Government formally adopted the Statute of Westminster.
As far as the island territories are concerned, the Cook Islands were proclaimed a British protectorate in 1888, and in 1901 were annexed and proclaimed part of New Zealand under the Colonial Boundaries Act 1895. Niue Island is part of the Cook Islands, though separately administered, and became part of New Zealand in 1901 with the extension of boundaries to include the Cook Islands. The Tokelau Islands were placed under the protection of Great Britain in 1877, formally annexed at the inhabitants' request in 1916, and from 1925 were administered by New Zealand at the request of the United Kingdom Government. From 1949 they became part of New Zealand by virtue of the Tokelau Islands Act 1948. Under the Cook Islands Constitution Act 1964, the Cook Islands achieved complete internal self-government on 4 August 1965, but New Zealand remains responsible for external affairs and defence.
NEW ZEALAND'S INTERNATIONAL ACTIVITIES—Though in the nineteenth century Sir Julius Vogel and the Right Hon. R. J. Seddon had original views about the policy which Britain and New Zealand should pursue in the Pacific area—views which they announced with vigour—New Zealand did not acquire the right to conduct an independent foreign policy until the end of the First World War when the full nationhood of the "Dominions'' was recognised. For some years after this, however, successive New Zealand Governments chose not to exercise this right and (pursuing a passive role in the League of Nations and refraining from establishing diplomatic relations with foreign Governments, or with other members of the Commonwealth apart from Britain) preferred to make known any views on matters of foreign affairs only to the British Government and through the confidential channels of intra-Commonwealth consultation.
Few pressures existed in the 1920s and early 1930s to impel New Zealand towards enunciating an independent foreign policy. The population was mainly British in composition and comparatively few were concerned to distinguish between New Zealand's interests and those of Britain. Nor had they much cause to do so: New Zealand had established a fruitful economic partnership with Britain, upon which country nearly all her material and cultural links were centred; and New Zealand's surest protector against dangers which it was incapable of meeting alone was the Royal Navy. It was, moreover, realised that New Zealand in her own right could make little impact on world affairs, whereas Britain was a great power capable of affecting the pattern of world events. New Zealand "foreign policy'' therefore consisted chiefly in seeking to modify British policy in those few cases where New Zealand had a strong interest or a viewpoint rather different from that of Britain. A standing opportunity was provided by the system of confidential intro-Commonwealth consultation whereby Britain provided full information to the Dominions and sought their comments upon issues of international policy as they arose. In this way New Zealand tended to prefer a share of great power status to "independence'' of foreign policy; this sufficed until the middle of the 1930s.
In practice, during the first 16 years after the First World War the New Zealand Government on only a few occasions thought it necessary to make significant efforts to bring about a modification of British policy. This situation resulted chiefly from the factors earlier outlined which made for an identity of interest and viewpoint between Britain and New Zealand. In part also it arose because few problems directly affecting New Zealand remained to be settled; in part it was because of a considered reluctance to give advice when the main consequences of accepting that advice fell upon Britain, not New Zealand; in part it was because New Zealand Governments tended to approach problems pragmatically rather than on grounds of principle, and were conscious of having no expert New Zealand Department organised to collect and appraise the facts on equal terms with the British Foreign Office; in part it was because New Zealand Governments, supplied by the Foreign Office with very much the same information as that on which the United Kingdom Cabinet based its judgments, viewed problems from a similar standpoint to that of the British Government. In short, most New Zealanders thought of external affairs in terms of Imperial unity and relied on British leadership of the Empire.
The emergence of an independent New Zealand foreign policy is usually held to date from 1935. Some Ministers in the new Government were deeply interested in world affairs in general, and the Government's approach was influenced by theory and principle. In particular, they held strong views on the principle of collective security and upon the League of Nations as the embodiment of that principle. In its method of championing the principles of collective security, pressing for the restoration of the authority of the League of Nations and, at a time when the United Kingdom Government was pursuing the policy which came to be known as appeasement, urging positive League action over Abyssinia, Spain, and China, the Government came to depart from the pattern of the previous 16 years: for, in addition to making its views known in confidential communications to the United Kingdom Government, it also stated them with vigour in the international forum of the Council and the Assembly of the League of Nations.
There was, however, no fundamental departure from the traditional policy of association with Britain. Moreover, the course that would be followed in the event of war was never in doubt. As early as 16 May 1938 a leading member of the Government had said, "If the Old Country is attacked, we are too . . . we will assist her to the fullest extent possible.'' When war broke out the Prime Minister, the Right Hon. M. J. Savage, expressed New Zealand's position in terms that were as true in 1939 as they would have been in 1914:
"Behind the sure shield of Britain we have enjoyed and cherished freedom and self-government. Both with gratitude for the past, and with confidence in the future, we range ourselves without fear behind Britain. Where she goes, we go. Where she stands, we stand. We are only a small and young nation, but we are one and all a band of brothers, and we march forward with a union of hearts and wills to a common destiny''.
But the Second World War changed the pattern of power in the world and made it necessary for New Zealand gradually to revise its foreign policy and its method of implementing that policy. Even though the basic attachment of New Zealanders to Britain was little affected, the fact became manifest that Britain was no longer a power able to determine events on a world scale and that, since New Zealand interests could no longer be protected by British actions alone, it did not suffice to confine New Zealand foreign policy to occasional attempts to persuade the British Government to take note of New Zealand views. Japanese aggression and, later, the rise of Communist China forced New Zealand to face the reality of its geographical location in the Pacific and to develop an additional relationship with the only other friendly power capable of protecting New Zealand—the United States of America—with the least possible prejudice to its association with the United Kingdom. To contribute to Anglo-American harmony is therefore a major preoccupation of New Zealand foreign policy.
To be woven into any post-war policy was the now traditional New Zealand belief in the principle of collective security and international justice, especially as symbolised by, though not yet embodied in, the United Nations. This was by no means an easy task in a world where the divisions of the cold war were reflected in competing regional alliances. There had to be a place, too, for belief in the ability of international co-operation to control armaments and to eliminate poverty, disease, and other economic and social causes of international tension.
During the war years New Zealand was admitted to the councils of the Allies and was expected to advance informed views. The Government honoured its responsibility and, having established in wartime the habit of participating in the making of international decisions, accepted it as natural that New Zealand should continue to participate in the development of a post-war world order and in subsequent international consultations. To this end New Zealand established (in effect from 1943) a professional Department of External Affairs and a career foreign service, and proceeded slowly to establish diplomatic missions in countries where New Zealand's interests merited protection. In particular, New Zealand sought increasingly to make its individual contribution to fostering good relationships with its neighbours in the Pacific and to increasing the measure of security and welfare in this area.
The threat to New Zealand's security, posed by the entry of Japan into the war at a time when the United Kingdom was fully committed in Europe, brought New Zealand into the closest relations with two of her Pacific neighbours, Australia and the United States. Recognition of the need for a greater measure of collaboration with Australia resulted in the signing in 1944 of the Canberra Pact which provided machinery for continuing consultation between the two Governments. Upon the entry of Japan into the war both New Zealand and Australia looked principally to the United States for protection. Relations among the three countries thus entered a new phase. The close association of wartime found expression in peacetime in the Anzus Treaty, in which, for the first time, New Zealand and Australia entered into a treaty of alliance and mutual defence with a foreign country. While neither Australia nor New Zealand was in favour of a vindictive or onerously restrictive peace settlement with Japan, they both made clear during the negotiation of the Japanese Peace Treaty their apprehension at the possibility of future aggression in the Pacific. The Anzus Treaty, which came into force in April 1952, was designed to allay these fears at the same time as it achieved the aim of both countries to enter into a close relationship with the major Pacific power. The treaty gives an assurance of United States support in the event of an armed attack from any quarter in the Pacific and so constitutes New Zealand's major safeguard from aggression in the area.
Since the signature of the Anzus Treaty, New Zealand has become a member of another regional defence system, the South-East Asia Treaty Organisation, SEATO. In joining SEATO, a body made necessary by the failure of the Great Powers to co-operate in carrying out the security functions entrusted to them by the United Nations Charter, New Zealand demonstrated further its new awareness of the international and strategic implications of its position in the South Pacific. In 1955, the Minister of External Affairs, the Hon. T. L. Macdonald, discussing New Zealand's foreign policy, said that the only possible threat to New Zealand's security could come from Asia, and in particular from the spread of Communist power in South-East Asia. "New Zealand's foreign policy grows,'' he said, "from the need to reconcile geography and history, economic fact and strategic fact. In practical terms at present this means that, without weakening the many links which bind us to Britain and the whole Atlantic community, we must increase our concern with South-East Asia.''
This regional approach implied no weakening of the belief in the pre-eminent value of collective security organised on a world basis. New Zealand continued to place special importance upon its membership of the United Nations. It has been an active participant in the work of the General Assembly, has been a member of all Councils of the Organisation, has provided troops to the United Nations Force in Korea and military observers in Palestine, Kashmir, and Lebanon, and has endeavoured to assist all efforts to attain the political and social objectives outlined in the Charter.
At the time of the formation of SEATO, New Zealand's interest in South-East Asia had already been expressed in social and economic terms. In 1950, New Zealand, along with a group of other Commonwealth countries, became a member of the Colombo Plan established to assist the countries of South-East Asia to improve their standards of living. To New Zealand, a pioneer in the field of social legislation and a country where wealth is spread throughout all levels of the population, the Colombo Plan has a special significance and contributions, large by New Zealand standards (if small when measured against the potential need), have been made to it. New Zealand's recent accession to regional membership of ECAFE, the Asian Development Bank, and ASPAC (the Council for Asian and Pacific Co-operation) is further demonstration of this country's acceptance that it has a role to play in the Pacific area. Despite this new concentration, however, New Zealand continued and developed its efforts (as will be seen later) to promote action on a world scale to deal with social and economic problems.
New Zealand's geographical position and that of its island territories, the Cook, Niue, and Tokelau Islands, also gives this country a direct interest in political, social, and economic developments in the South Pacific. This is reflected not only in New Zealand's membership of such regional organisations as the South Pacific Commission, but also in a wide and growing range of contacts with island people and an increased sense of involvement in their problems. The evolution of self-government and nationalism in the South Pacific reached a new stage when Western Samoa became the first independent Polynesian state on 1 January 1962. This was followed three years later by the Cook Islands' achievement of internal self-government. New Zealand's own colonial past and her liberal tradition of friendship for emergent peoples, together with the large number of Polynesian people who have settled in this country, mean that the islanders tend to look to New Zealand for leadership and encouragement. In particular, Western Samoa, Tonga, and Fiji already look to New Zealand as an important export market and as a source of administrative and technical assistance. Inevitably, New Zealand is going to be increasingly affected by what happens in the South Pacific region.
If, since the war, the facts of geography have had an important influence on New Zealand's attitudes towards foreign affairs, history and tradition continue nevertheless to mould its outlook. The historic links with the United Kingdom and with Western Europe and North America remain as strong as ever; and the economic links with the United Kingdom, New Zealand's best customer, remain strong. No situation is, however, constant. One of the key problems of external political and economic policy now presented to New Zealand arises out of the movement towards political and economic integration in Europe and the continuing possibility of Britain's membership of the European Economic Community. New Zealand must expand the volume and value of its exports of primary products if the standard of living of its rapidly increasing population is to be maintained and improved. In recent years it has become increasingly apparent, however, that the United Kingdom market is capable of only a limited expansion. The development of new markets in Asia and other less developed countries is hindered by low income levels as well as by consumption patterns in which the type of foodstuff exported by New Zealand does not figure prominently. New Zealand's foreign policy is likely to continue the endeavour to reconcile geography and history, economic fact and strategic fact.
Department of External Affairs—The External Affairs Act 1943 made provisions for the appointment of a Minister of External Affairs charged generally with the administration of external and foreign affairs, including relations with other countries, communications with other Governments, representation abroad, and representation of other countries in New Zealand. The Act also authorised the appointment of a Secretary of External Affairs and (superseding the High Commissioner Act of 1908) dealt with the appointment of High Commissioners and of overseas representatives.
The functions of the Department were defined at its inception as follows:
To act as a channel of communication between the Government and other Commonwealth and foreign Governments on matters relating to external affairs.
To assist in negotiating treaties and international agreements.
To direct New Zealand's overseas diplomatic posts.
To deal with foreign diplomats, and to issue exequaturs to foreign consuls.
The Act thus established the Ministry of External Affairs as the normal channel of communication with the Governments of other countries. As, however, the new Department was in fact still a part of the Prime Minister's Department, no change in procedure, apart from the use of the changed nomenclature, was necessary.
Dealings with overseas Governments usually involve considerable interdepartmental coordination. Since the Prime Minister's Department has always been regarded primarily as a department of co-ordination, an intimate relationship has existed between the two Departments. The Prime Minister has for three periods found it appropriate to assume the portfolio of External Affairs and the Departments have in any case been run as a unit. The staff is held in common and, though some officers are engaged on work peculiar to one Department, the work of the majority involves both Departments. The Secretary of External Affairs is also Permanent Head of the Prime Minister's Department. For the first 23 years of the existence of the Department of External Affairs, until October 1966, the same person, Mr A. D. McIntosh, held the two posts. In defence matters the two Departments have been closely associated. During the war, the Permanent Head was also Secretary of the War Cabinet. In that period the responsibility of the Prime Minister's Department for defence co-ordination was extended and developed; in discharging this responsibility the Permanent Head was assisted by the Defence Secretariat of the Prime Minister's Department. The functions of the Secretariat have been taken over by the unified Ministry of Defence which was established by Act of Parliament in November 1964. A close relationship is still maintained between the Ministry of Defence and the Defence Division of the Department of External Affairs, and the head of that Division is chairman of the body which co-ordinates military and civilian intelligence.
In the formulation and application of external affairs policy, close association with other Government Departments is necessary. Participation in the Colombo Plan entails close liaison with the Treasury and with the many Departments which supply experts and training facilities, consular questions with the Department of Labour, and legal questions with the Department of Justice. Moreover, the Department is a clearing house for a wide variety of material provided by overseas posts for other Departments. As well as fulfilling its major function of acting as a channel of communication with other Governments, the Department thus acts as a co-ordinating centre for other Government Departments. The Department and its network of posts overseas also perform numerous services on behalf of Departments which are without overseas representatives of their own.
In the Official Section at the end of the Yearbook the diplomatic and other New Zealand representation overseas is listed.
New Zealand in the Commonwealth—Despite the emphasis in New Zealand's approach to international affairs resulting from the realities of its geographical position, membership of the Commonwealth remains a significant feature of its policy. Intimate association with the United Kingdom is the historical basis, and remains an important principle of New Zealand's external relations. The ties between New Zealand and the United Kingdom are embodied in the close association of the Commonwealth, membership of which has helped to give New Zealand an international status that such a small and isolated community could not otherwise claim.
Although one of the oldest members, New Zealand, unlike some of its fellow members, did not seek to hasten the process of constitutional transition within the Commonwealth. At the Imperial Conference in 1930 the Prime Minister, the Right Hon. G. W. Forbes, stated that "We have felt that all times within recent years we have had ample scope for our national aspirations and ample freedom to carry out in their entirety such measures as have seemed to us to be desirable''. There was little interest in the adoption of the relevant provisions of the Statute of Westminster enacted in 1931 to give legal endorsement to the transformation that had taken place in the relationship between Britain and the Dominions. It was not, in fact, until 1947 that the necessary formalities were completed in New Zealand by the passing of the Statute of the Westminster Adoption Act.
Since that time there have been many changes in the Commonwealth association both in constitutional respects and in numbers of members. Whereas at the beginning of the Second World War there were only five members, (of whom one, South Africa, withdrew from the association in 1961), at the end of 1966 there were 26. Besides the older Commonwealth countries of Britain, Canada, Australia, and New Zealand, membership now includes India, Pakistan, Ceylon, Malaysia, Ghana, Nigeria, Cyprus, Sierra Leone, Tanzania (formerly Tanganyika and Zanzibar), Jamaica, Kenya, Trinidad and Tobago, Uganda, and five new members, Malawi, Zambia, Malta, Gambia, and Singapore. The Commonwealth has become an entity embracing several continents and its relationships have taken on a new scope and emphasis. New Zealand, itself a country where two races live side by side, sees in the Commonwealth a special opportunity for multiracial co-operation and understanding.
New Zealand has as yet exchanged representatives with only the following members of the Commonwealth: Australia, Canada, India, Ceylon*, Malaysia, Singapore, and Britain.
*The New Zealand High Commissioner in India is also appointed High Commissioner in Ceylon.
The importance New Zealand attaches to the Commonwealth association has been given practical expression in its membership of a number of Commonwealth organisations, including the Commonwealth Air Transport Council, the Commonwealth Telecommunications Board, the Commonwealth Agricultural Bureau, the Imperial War Graves Commission, the Commonwealth Institute, the Commonwealth Economic Consultative Council, the Commonwealth Scientific Committee, and the Commonwealth Education Liaison Committee. New Zealand also contributes to the budgets of the Commonwealth Secretariat and the Commonwealth Foundation, which were both established at the Commonwealth Prime Ministers' meeting in 1965.
New Zealand and the South Pacific—It is not without significance that the first area of the world towards which New Zealanders developed a distinct and characteristic attitude should have been the South Pacific. This is New Zealand's immediate environment, its Polynesian peoples close kin to the New Zealand Maori, its islands nearest and most important in the lines of communication which link New Zealand with America and Europe. New Zealand is, moreover, the largest community in the area and cannot escape either a concern or a responsibility for what goes on there.
Within a decade of New Zealand's establishment as a British colony Bishop Selwyn had made it the base for Anglican missions in the South Pacific and Sir George Grey as Governor had begun to advocate a policy of expansion in the area. The increasing involvement of other powers and a desire to develop trade led Sir Julius Vogel in the 1870s to take up idea and to put forward various schemes for political and commercial expansion, which, however, found no favour in London. In the 1880s New Zealand joined the Australian colonies in an effort to preserve "Oceania for the Anglo-Saxons'', and soon after the movement reached its peak in the robust opposition of Richard John Seddon to the bargaining away of Samoa in 1899.
The meagre fruit of half a century's agitation was the annexation in 1901 of the Cook Islands and their inclusion within the boundaries of New Zealand. Thereafter New Zealand's interest in the South Pacific declined as its trade and its thoughts came to centre more and more on Great Britain. But though declining, the tradition was still strong enough to provide support for the Imperial Federation movement in the first decade of the twentieth century and, more practically, to inspire New Zealand on the outbreak of war in 1914 to occupy Germany's colony of Western Samoa.
At the end of the war Western Samoa, like other former German possessions, was retained by the occupying power under a League of Nations Mandate. New Zealand embarked on its new responsibility with greater enthusiasm than it had shown in the Cook Islands and much effort was devoted to solving the problems of the territory. The rate of change thus created, however, proved too rapid for the tradition-loving Samoans. In the late 1920s a series of unfortunate incidents occurred and, for some time afterwards, the pace slackened. The opening up in the late 1930s of air routes across the Pacific led New Zealand, along with other countries, to take an increased interest in some of the more remote islands in the area, but it was the outbreak of the Second World War which forcibly reminded the country of its situation.
Overnight half-forgotten islands became strategic points for the defence of New Zealand and its allies, and New Zealanders again became aware of the need to prevent them from falling into unfriendly hands. Accordingly, New Zealand joined with Australia in seeking ways to guarantee the future security of the area, and there emerged first the Canberra Pact of 1944 and later the 1947 Agreement to establish the South Pacific Commission.
Through the Commission the Governments administering territories in the South Pacific—Britain, the United States, France, Australia, New Zealand, and (until 1962) the Netherlands—have made a concerted effort to promote the economic and social development of the area and its peoples. In the 17 years of its existence the Commission has, within its budgetary limits (it currently spends about $700,000 annually), done much valuable work, particularly in bringing the islanders together and developing a sense of community amongst them. Originally laying much stress on research, the Commission has come to concentrate mainly on providing technical assistance and on pooling experience of handling common problems of development. It maintains close working links with the United Nations Specialised Agencies which are taking an increasing interest in the region.
But New Zealand has not been content with promoting progress in the economic and social spheres only. At the San Francisco Conference in 1945 it took a leading part in working out the trusteeship system embodied in the United Nations Charter, and subsequently the League of Nations Mandate for Western Samoa was replaced by a trusteeship agreement.
In accordance with the wishes of the Samoan people, a programme of political and constitutional development was launched which continued throughout the 1950s and which culminated in the establishment of the independent State of Western Samoa on 1 January 1962. The transfer of sovereignty did not, however, weaken the close and friendly relationship which had grown up between Western Samoa and New Zealand and this was confirmed in a Treaty of Friendship between the two countries signed in August 1962. In the educational as well as in other fields New Zealand assists Western Samoa.
Whilst Western Samoa was moving towards independence, constitutional development was taking place in New Zealand's other island territories. Following expert surveys a programme of economic and social development for the Cook Islands was formulated in 1955 and legislative assemblies for the Cook Islands and for Niue were set up in 1957. In 1952 the New Zealand Government gave these bodies full responsibility for allocating the large subsidies granted by New Zealand. In the same year possible alternatives concerning constitutional development were submitted to the Legislative Assembly. The Assembly unanimously chose full internal self-government together with a continued association with New Zealand. In 1963 a "Shadow'' Cabinet was set up and a Leader of Government Business elected. The following year the New Zealand House of Representatives passed the Cook Islands Constitution Act, with provision for the Act itself to come into force after a General Election in the Cook Islands. This election was held on 20 April 1965 and after the New Zealand Parliament had at the request of the Cook Islands Government made certain amendments to the Constitution Act, the new Constitution was brought into force on 4 August 1965 and the Cook Islands became a self-governing nation in free association with New Zealand. The new Legislative Assembly, assured of New Zealand's financial assistance, is fully responsible for the internal affairs of the Cook Islands.
The independence of Western Samoa, self-government in the Cook Islands, and the progress of the remaining New Zealand territories are indicative of broader changes in the South Pacific. Economic, social, and educational development has made the peoples of the area more self-conscious and desirous of managing their own affairs. At the same time developments in New Guinea have attracted international attention, and the intensification of interest in colonial questions in the United Nations is likely to bring the South Pacific into yet greater prominence. In the light of these changes New Zealand has taken the lead in proposing that both the organisation and functions of the South Pacific Commission be revised to bring its work more into line with needs and aspirations of the peoples of the area. At the same time the membership of the Commission itself is changing. In 1964 the original South Pacific Agreement was amended to allow the inclusion of independent countries which formerly lay within the Commission's territorial scope. In accordance with this, Western Samoa took its seat at the Twenty-Sixth Session of the Commission in October 1964.
New Zealand in the United Nations—It has been noted earlier that the first significant expression of an independent New Zealand foreign policy occurred in the League of Nations and was directed to supporting the principle of collective security. Support for this principle later and through the United Nations has remained a cornerstone of New Zealand's foreign policy.
The purposes which motivated the policy in 1935 were strongly held beliefs, rather than principles developed from any careful assessments by a national foreign service. The beliefs were nevertheless a reflection of widely held concern over world events, a concern which the succeeding years were to reinforce. It was, therefore, perhaps understandable that at San Francisco in 1945 New Zealand should argue so forcibly, if unsuccessfully, to eliminate the veto and to strengthen the collective security provisions of the United Nations Charter.
Despite its physical isolation New Zealand has felt unable to regard with unconcern the fate of other small countries helpless to defend themselves against a powerful aggressor and thus liable to be picked off one by one.
The United Nations does not, it is true, offer a complete guarantee of New Zealand's or any other small country's security against aggression. Nor has it yet achieved agreement on disarmament; but New Zealand Governments have acted upon the conviction that the United Nations, and it alone, contains the rudiments of a universal collective security system, and that it is through the United Nations, and not through its abandonment in favour of some alternative, that an effective and comprehensive collective security system may eventually be developed and agreement on disarmament achieved.
New Zealand has recognised that this objective must be a long-term one, and that the United Nations in its present form must be buttressed by regional defensive alliances. It has not taken the view that all multilateral diplomacy must be conducted within the United Nations. In general, however, New Zealand has regarded the United Nations as the natural centre of international diplomacy unless there were, in special cases, goods reasons to work outside it.
Within the United Nations the expression of this policy has taken several forms. New Zealand has sought to remove the causes which might produce the need for recourse to collective security action. Its representatives have urged that the Assembly be used as a place for harmonising relations between nations: they have voiced the need for restraint in the pursuit of national objectives; they have consistently sought and supported responsible action in aid of an effective international organisation; they have reiterated the need for the early adoption of a broad programme of supervised disarmament.
New Zealand has at the same time advocated adequate and timely preparations in case aggression should occur and has supported the fullest possible development of the United Nations' capacity for peacekeeping. When occasion has arisen New Zealand has been prepared to play its part: troops were supplied to the United Nations Force in Korea and military observers to the United Nations Observer Groups in Palestine, Kashmir, and Lebanon; a civilian police unit has served in Cyprus; and the Government has indicated to the Secretary-General its intention in principle to designate a stand-by unit which would be available for properly instituted peacekeeping operations of the Organisation in the future.
To maintain the peace is the primary purpose of the United Nations, and for New Zealand the search for effective guarantees of international peace and security continues to be the first object of membership. New Zealand was elected to the Security Council, which is charged with the primary responsibility for the maintenance of international peace and security, for the years 1954 and 1955, and for a second term in 1966. This primary purpose is not, however, the only object of the United Nations, nor is a system of collective security (or disarmament) the only means of giving effect to it.
The state of economic, social, and general political relations goes far to determine the urgency of the need for a collective security system. For New Zealand, geographically isolated and with limited direct diplomatic relations, the United Nations is inevitably one of the most important forums available, not only to influence the course of international events, but also to secure the friendship and understanding of the world community. For any country, its international reputation is a valuable asset. If New Zealand is better known and commands more influence in international affairs than some other small States similarly situated, this is in some measure, at least, due to New Zealand's record of active participation in the United Nations.
Economic and Social Council—New Zealand's interest in economic and social questions—as well as the recognition by other countries that New Zealand has special experience to offer—is illustrated by its membership of the Economic and Social Council (an elective body of the United Nations with an initial membership of 18, recently expanded to 27) from 1947 to 1949 and its re-election in 1958 for a further term for the period 1959 to 1961. New Zealand in 1963 became a full regional member of the Economic Commission for Asia and the Far East (ECAFE), a body of which it had previously been a non-regional member. New Zealand has also served terms of office from time to time on the Technical Assistance Committee and on the Statistical, Social, and Fiscal Commissions and the Commission on the Status of Women. It is currently serving on the Commission on Human Rights for the period 1966-69.
In undertaking these responsibilities New Zealand may to some extent be regarded as "taking its turn''. In few cases, however, are the considerations in favour of representation so simple. New Zealand certainly shares with others an interest in ensuring that economic and social conditions are such as to permit ordered political progress. It is concerned to ensure that, where political principles are in issue, the beliefs which New Zealanders hold as essential should be recognised and, if possible, accepted by the world community. Sometimes there are strong reasons of self-interest; it is important that New Zealand's interests and its special problems be taken into account in the work of these bodies. Moreover, some organs which were first designed to meet the emergency of post-war conditions, such as UNICEF, have developed programmes, e.g., the supply of milk powder and fish-liver oil, which are of economic interest to New Zealand.
The biggest single task now facing the Economic and Social Council is to promote and direct programmes for economic development in underdeveloped countries. New Zealand has always recognised the need for economic development and made its contributions to the appropriate funds, e.g., the Expanded Programme for Technical Assistance and the Special Fund, now merged to form the United Nations Development Programme. It has been concerned to ensure that international programmes in this field should be effective and realistic.
At present New Zealand representatives in the United Nations are called upon to deal with questions of economic development in several different fields. One is in the Economic Committee of the General Assembly, where the economic work of the Organisation is subject to general review; another arises out of New Zealand's membership of ECAFE. In this setting, the detailed study of development programmes is closely related to the work of the Colombo Plan, and provides a significant counterpart to New Zealand's growing political interest in Asia.
Conference on Trade and Development—As a result of the United Nations Conference on Trade and Development held in Geneva in 1964, the General Assembly has agreed to hold a triennial Conference on Trade and Development open to all United Nations members and other States, members of the Specialised Agencies and the International Atomic Energy Agency. It has also established a Trade and Development Board, of which New Zealand is a member in the current period, and functional committees on commodities, manufactures, financing of trade and shipping. New Zealand has seats on the Committees on Commodities and on Shipping.
Specialised Agencies—It is the responsibility of the Economic and Social Council under the Charter to co-ordinate the activities of the Specialised Agencies through consultations and recommendations. New Zealand is a member of all the Agencies except the International Development Association. As a contributor to their budgets, it is concerned to ensure that activities are not duplicated and that the Secretariats of the United Nations and of the Agencies work closely together on matters of common interest. New Zealand has also been concerned to ensure that on political and administrative matters the policies of the Agencies are adjusted to those of the United Nations. As in the case of the different organs and subsidiary bodies of the United Nations, so with the Specialised Agencies, New Zealand's reasons for membership have ranged from motives of self-interest to its conviction of the value of international co-operation. In some cases non-membership would place New Zealand at a distinct disadvantage. Membership of the Universal Postal Union is essential to facilitate the efficient international movement of mails to and from this country. Similarly, the International Telecommunications Union regulates international radio, telephone, and telegraphic traffic, and the need to belong to this body is universally accepted. The World Meteorological Organisation is the medium for setting standards and encouraging the free interchange of meteorological information. Wartime experience emphasised the fact that few countries have as direct an interest in international civil aviation as New Zealand; New Zealand is closely concerned with the efforts of the International Civil Aviation Organisation to foster the planning and development of international air transport and to ensure proper standards for the development of airways, airports, and air navigation facilities.
No clear line can, however, be drawn between the "technical'' Agencies and others, and some degree of technical advantage is to be derived from membership of all the Specialised Agencies. Although its own health standards are high, New Zealand has nevertheless drawn benefits, particularly in its island territories, from its membership of the World Health Organisation. Each in its own field—the Food and Agriculture Organisation, the International Labour Organisation, the United Nations Educational, Scientific, and Cultural Organisation, and the International Atomic Energy Agency—constitutes an important international medium for the free interchange of knowledge and experience.
On occasion the Specialised Agencies provide the forum for advancement of a New Zealand interest. The FAO has played a prominent part in the formulation of measures to encourage the establishment of a stable international market for agricultural commodities, particularly in the enunciation of principles to govern the disposal of surplus commodities. The FAO's interest in the disposal of surplus foodstuffs was increased in December 1961 when the United Nations approved the establishment of a World Food Programme to be administered jointly by FAO and the United Nations. New Zealand was elected to the inter-Governmental Committee charged with the responsibility of supervising the Programme and for the three-year period of the Programme (1963-65) agreed to contribute $U.S.75,000 in cash and $U.S.425,000 in commodities.
New Zealand has served from time to time on the governing bodies of most of the Specialised Agencies. In 1966, for example, it has been a member of the Executive Board of WHO, the Council of FAO, and the Executive Council of UPU.
New Zealand has been a Contracting Party to the General Agreement on Tariffs and Trade (GATT) since its inception in 1947. Although not strictly speaking a Specialised Agency, the GATT has assumed the characteristics of one as its activities have extended into all aspects of international trade including, more recently, measures to liberalise non-tariff barriers to agricultural trade and to provide special export opportunities for the goods of the developing countries.
New Zealand's accession to the International Bank for Reconstruction and Development, the International Monetary Fund, and the International Finance Corporation not only allows this country to participate in measures designed to increase the stability of international trade and promote the economic development of the underdeveloped areas of the world but also serves to strengthen New Zealand's own economic position by providing access to more varied sources of capital.
As well as the Commonwealth organisations mentioned earlier some regional organisations, particularly the South Pacific Commission, are of particular importance to New Zealand. Since the establishment of the Commission in 1947, New Zealand's island territories have derived much benefit from its work on fisheries, co-operatives, control of the rhinoceros beetle, and research upon filariasis.
New Zealand and Collective Defence: South-East Asia Collective Defence Treaty—When, in the years following 1945, it became clear that there were serious obstacles to the effective implementation of those provisions of the United Nations Charter which were designed to establish a universal system of collective security, the alternative of regional arrangements was further developed. In South-East Asia, a few years after NATO was established, the South-East Asia Collective Defence Treaty (also known as the Manila Treaty or Pact) was negotiated.
The idea of such a treaty had been canvassed during the early 1950s. In the early part of 1954, however, a number of governments became greatly concerned at the progress of the war in Indo-China and the deteriorating situation in South-East Asia, and on 29 March the United States called for "united action'' to resist further Communist expansion. Shortly thereafter the United Kingdom and France agreed that consideration should be given to the establishment as soon as possible of a collective security system in the area. The New Zealand Minister of External Affairs stated on 19 April that his Government welcomed this proposal and was prepared to participate.
The Geneva Agreements for Vietnam, Laos, and Cambodia (which were completed on 21 July 1954) were an achievement of considerable importance and value, but they fell short of a fully guaranteed settlement. After a period of consultation eight governments—Australia, France, New Zealand, Pakistan, the Philippines, Thailand, the United Kingdom, and the United States—agreed to attend a conference to consider a system of collective defence for South-East Asia. On 8 September in Manila they signed the South-East Asia Collective Defence Treaty. At the same time they proclaimed the Pacific Charter, in which they set out principles on which they undertook to base their policies for the maintenance of peace and stability. The treaty was ratified by New Zealand on 19 February 1955.
The first meeting of the Council envisaged by the Treaty, comprising the Foreign Ministers of all the allied governments, was held in Bangkok in February 1955. Since then the Council has met at Karachi in 1956, Canberra in 1957, Manila in 1958, Wellington in 1959. Washington in 1960, Bangkok in 1961, Paris in 1963, Manila in 1964, London in 1965, and Canberra in 1966. The Council has overall control of the activities of the alliance. (The name "South-East Asia Treaty Organisation'' was derived by analogy with NATO and CENTO: in practice it refers to the joint activity of the eight allies.)
At that first meeting the Council established a body known as the Council Representatives to carry on its functions between Council meetings. Council Representatives are generally the heads of their countries' diplomatic missions in Bangkok; New Zealand is at present represented by its Ambassador to Thailand. From time to time various expert committees and study groups have been convened to give collective advice to Council Representatives.
The permanent civil Secretariat, consisting at present of an international staff of 40 officers, includes three New Zealanders, one of them the Deputy Secretary-General.
The Council also agreed in February 1955 that the Military Advisers to the Ministers should meet as a group to advise it on measures for common defence. Subsequent in 1957 a Military Planning Office was established in Bangkok and from 1958-60 the position of Chief of this Office was held by a New Zealander. Joint military exercises, in which units of the sea, land, and air forces of all member countries participate, are held regularly.
SEATO is a defensive alliance and neither in concept nor in structure is it fitted for a major role in other spheres. Nevertheless, the true nature of the challenge in South-East Asia was well recognised by the signatory nations and economic, social, and educational objectives were included in the Treaty. Upon these provisions have developed a wide range of activities which reflect the essentially peaceful intent of the allies, and their full awareness that the security and well-being of a nation depend on more than the ability to repel an aggressor.
In the field of education, for example, SEATO sponsors three professorships, post- and under-graduate scholarships, research fellowships, and a number of travelling lectureships. One of the most successful of its educational projects has been the Graduate School of Engineering which was established in Bangkok in September 1959. New Zealand makes an annual contribution to the school's scholarship fund, and provided for a number of years the services of a professor of hydrology. As the result of recommendations made by a commission set up to report on the future development and financing of the school, in February 1967 the school became an independent institution known as the Asian Institute of Technology. The institute is managed by an international Board of Trustees. In 1962 New Zealand contributed a mobile medical unit for a two-year assignment to the first Regional Development Technical Assistance Centre established by SEATO at Ubol, in North-east Thailand. The unit's equipment was subsequently given to the Royal Thai Government. These are only two of a large number of projects sponsored by SEATO and designed to promote economic development and living standards in the Treaty area.
It has become increasingly clear over the years that the principal threat to the Treaty area is from subversion from outside, developing, if unchecked, into insurgency. Action to meet this danger of indirect aggression is primarily a national responsibility, but Council Representatives, in addition to intensifying their economic and social programmes, have helped to identify subversion in its various forms, to assess the nature of the threat which it poses, and to suggest ways in which the threat may be met.
In May 1962, following a serious violation of the cease-fire in Laos by the Communist-directed Pathet Lao and in response to an invitation by the Royal Thai Government, the United States, Australia, the United Kingdom, and New Zealand dispatched forces to Thailand. Each of them made it clear that this was a precautionary move, taken in accordance with their obligations under the Manila Treaty, to enable them to come more speedily to the defence of Thailand should the need arise.
The New Zealand contribution consisted of a Special Air Service detachment of the New Zealand Army and RNZAF transport aircraft. The detachment and the transport aircraft were withdrawn in September 1962. From 1963 to 1965 two further RNZAF transport aircraft were made available to help develop logistic facilities in Thailand, and from March 1964 to June 1965 a detachment of Army engineers was stationed in North-east Thailand to assist in the construction of an airfield. These moves were all indicative of New Zealand's active concern with the course of events in South-East Asia and of a growing sense of involvement.
In more recent years, SEATO member nations have provided an increasing volume and range of military and civilian assistance to the Republic of Vietnam in its struggle against Communist aggression and subversion. In May 1964, at the invitation of the South Vietnamese Government, New Zealand sent a detachment of field engineers to South Vietnam to help in reconstruction and the building of roads and bridges. The detachment won a reputation for efficiency and adaptability in carrying out these priority tasks. At the 1965 SEATO Council meeting in London, Ministers again expressed their concern at continuing Communist aggression against the Republic of Vietnam, and agreed that members of SEATO should remain prepared, if necessary, to take further concrete steps within their respective capabilities in fulfilment of their obligations under the Treaty. Following this Council meeting, and in response to a request from the South Vietnamese Government, the Prime Minister announced in May 1965 that New Zealand would dispatch an artillery battery to South Vietnam in conformity with New Zealand's obligations under the Manila Treaty, of which the Republic of Vietnam is a protocol member. At the same time the Prime Minister announced that the non-combat detachment of Army Engineers would be withdrawn. New Zealand's decision to contribute combat troops to South Vietnam was welcomed by the SEATO Council meeting at Canberra in June 1966, when it was agreed that members should continue and, consistent with their commitments elsewhere, increase their assistance to the Republic of Vietnam.
ANZUS—This is the name given to the tripartite security treaty between Australia, New Zealand, and the United States, which was signed at San Francisco on 1 September 1951 and came into force on 29 April 1952.
The Anzus Treaty was more than a reflection of the close relationship which had developed between the three participants during the Second World War—it was the first formal treaty relationship of New Zealand and Australia with the United States and assured New Zealand and Australia of American support in the event of aggression in the Pacific. The Treaty also provided a basis for periodic discussions of common problems at a ministerial level.
The Treaty is a defensive arrangement of the three parties, and is consistent with United Nations principles and obligations. The keynote of ANZUS is that each party recognised "that an armed attack in the Pacific Area on any of the Parties would be dangerous to its own peace and safety, and declares that it will act to meet the common danger in accordance with its constitutional processes''. In the context of the agreement an armed attack on any of the Parties is deemed to include "an armed attack on the metropolitan territory of any of the Parties, or on the island territories under its jurisdiction in the Pacific or on its armed forces, public vessels or aircraft in the Pacific''.
The first meeting of the ANZUS Council was held at Honolulu from 4-6 August 1952, the three signatory countries being represented by their Foreign Ministers. At this meeting the organisation necessary to carry the Treaty into effect was established. The Ministers agreed that the machinery for consultation should be as simple as possible and that the maximum use should be made of existing channels and agencies. It was decided that the Council of Ministers or their deputies should meet annually, one year in the United States and alternate years in Australia or New Zealand. In practice, this rotation of meetings has not been adhered to and by common consent the United States has acted as host to most meetings of the Council of Ministers. Article III of the Treaty states that "the Parties will consult together whenever in the opinion of any of them the territorial integrity, political independence or security of any of the Parties is threatened in the Pacific''. To ensure that effective measures might be taken to implement this Article, the Council of Ministers agreed to have the advice of military officers of the three Governments.
The Council also agreed that special meetings, normally attended by deputies, would be held La Washington "to provide for continuing consultation and to provide a focus where existing channels and agencies may be used in the implementation of the Treaty''.
Recently the Council has met in Canberra in 1962, in Wellington in 1963, in Washington in 1964 and 1965, and in Canberra in 1966.
New Zealand and the Colombo Plan—Under the Colombo Plan, New Zealand, Australia, Canada, Japan, the United Kingdom, and the United States of America, have joined with the countries of South and South-East Asia to help them improve their standards of living. The Colombo Plan is not a single plan, but a series of separate plans drawn up and administered by each country in the region; the external assistance required and made available to help implement these plans is negotiated on a bilateral basis. The Plan had its origin in, and took its name from, a meeting of Commonwealth Foreign Ministers held in January 1950 in Colombo to exchange views on world problems, particularly on the economic needs of the countries of South and South-East Asia. The meeting established a Consultative Committee to ". . . survey the needs, to assess the resources available and required, to focus world attention on the development problems of the area, and to provide a framework within which an international co-operative effort could be promoted to assist the countries of the area to raise their living standards''. Since then the Consultative Committee has met consecutively in Sydney, London, Colombo, Karachi, New Delhi, Ottawa, Singapore, Wellington (1956), Saigon, Seattle, Jogjakarta, Tokyo, Kuala Lumpur, Melbourne, Bangkok, and London. The 1966 meeting was held in Karachi.
A foundation member of the Plan and an active participant at every meeting, New Zealand has done its utmost, within the scope of its limited resources, to make significant grants of capital and technical assistance to the countries of the area.
Capital Assistance—By 31 March 1966 the New Zealand Parliament had appropriated a total of $30,292,284 for capital and technical assistance under the Colombo Plan. Of this, $17,968,888 in capital aid had been transferred to the Governments concerned or used at their request to buy equipment. Most of New Zealand's capital aid has been given in the form of direct transfers of overseas funds, but in appropriate cases it has been possible to supply equipment manufactured in New Zealand.
In 1966 an additional grant of $300,000 was approved for road construction in North-east Thailand. Further assistance was also provided in planning the Faculty of Agriculture at the new University of the North East, for which New Zealand has promised capital aid of $250,000. Grants totalling $630,000 were approved for two new milk schemes in India. Projects being implemented include aid to the value of $700,000 for the construction of two educational institutions in Malaysia, $140,000 for the construction of a Faculty of Science at the University of Saigon, and $60,000 to equip schools in the Philippines with trade-training equipment. New Projects are under consideration for Afghanistan, Cambodia, Ceylon, India, Indonesia, Laos, Malaysia, Pakistan, and Thailand.
Technical Assistance—By 31 March 1966 New Zealand had spent a total of $8,763,438 on technical assistance. The number of people from Asian countries brought to New Zealand for training under the Colombo Plan had reached 1,977, of whom 559 were still in the country. New Zealand experts serving abroad numbered 57, bringing the total sent under the Plan to 282. A number of those experts and some of the trainees were associated with projects for which New Zealand was also giving capital aid.
Commonwealth Aid Schemes—New Zealand participates in two co-operative aid programmes for Commonwealth members. Under the Commonwealth Scholarship and Fellowship Plan New Zealand offers each year 15 two-year scholarships for post-graduate or undergraduate study, three administrative fellowships, and three prestige fellowships for scholars of high academic standing. The New Zealand annual contribution of up to $2,000,000 to the Special Commonwealth Aid to Africa Plan, under which Commonwealth countries outside Africa provide bilateral assistance to African members, enables up to 80 Africans to study in New Zealand, and several New Zealand experts to work in Africa, as well as providing for small capital or equipment grants in appropriate cases.
Distribution of New Zealand Aid—The distribution of the total aid given by the New Zealand Government to developing countries during the latest three years is shown in the following table. Aid is shown as bilateral where the arrangements were concluded directly between New Zealand and the country or countries assisted, and multilateral where the aid was contributed to an international agency or fund.
| Item | Year Ended 31 March | ||
|---|---|---|---|
| 1964 | 1965 | 1966 | |
* Approximate amounts of New Zealand contributions used for development purposes. † Formerly Special Fund and UN Expanded Programme of Technical Assistance. | |||
| (a) Development | $(000) | ||
| Bilateral— | |||
| South Pacific— | |||
| Cook Islands | 1,637 | 1,741 | 1,906 |
| Niue | 636 | 636 | 695 |
| Tokelaus | 85 | 60 | 76 |
| Western Samoa | 291 | 270 | 206 |
| Miscellaneous | 118 | 116 | 116 |
| South and South-East Asia— | |||
| Colombo Plan | 2,088 | 2,195 | 2,706 |
| SEATO | 30 | 10 | 2 |
| South Pacific and South-East Asia— | |||
| Volunteer Service Abroad | 4 | 22 | 37 |
| Commonwealth— | |||
| African Assistance Plan | 117 | 131 | 188 |
| Commonwealth Education Scheme | 98 | 121 | 118 |
| Total bilateral development grants | 5,108 | 5,303 | 6,050 |
| Multilateral | |||
| Regular budgets*— | |||
| United Nations (UN) | 90 | 78 | 78 |
| International Labour Office (ILO) | 16 | 18 | 21 |
| UN Food and Agriculture Organisation (FAO) | 28 | 34 | 35 |
| UN Educational, Scientific, and Cultural Organisation (UNESCO) | 24 | 30 | 29 |
| World Health Organisation (WHO) | 40 | 46 | 52 |
| South Pacific Commission (SPC) | 76 | 85 | 91 |
| Voluntary programmes for development— | |||
| UN Children's Fund | 150 | 150 | 150 |
| UN Development Fund† | 300 | 300 | 400 |
| World Food Programme | 18 | 152 | 20 |
| N.Z. UNESCO Fellowships for African University Staff | - | - | 3 |
| Total multilateral development grants | 742 | 893 | 879 |
| Total Government grants for development | 5,850 | 6,195 | 6,929 |
| Government Loan Assistance— | |||
| Government loan to India for purchase of wool | - | 500 | - |
| Public loan to Western Samoa, guaranteed by New Zealand Government, for harbour development | - | 2,000 | - |
| Total Government loan facilities | - | 2,500 | - |
| (b) Refugees and Relief | $(000) | ||
| Bilateral— | |||
| Disaster relief | 30 | 30 | 40 |
| Red Cross | 4 | 6 | 6 |
| Vietnam refugee aid | - | - | 20 |
| Multilateral— | |||
| UN Relief and Works Agency for Palestine Refugees (UNRWA) | 100 | 100 | 100 |
| European refugees | 40 | 40 | 40 |
| Total Government assistance for relief | 174 | 176 | 206 |
| Total Government contributions for development and relief— | |||
| Grants | 6,024 | 6,371 | 7,135 |
| Loans | - | 2,500 | - |
The table lists only Government aid. It does not take into account the substantial aid given privately in cash and kind through CORSO, religious missions, the Red Cross, organisations assisting lepers, and by other means.
General Aims—It is clear that, as New Zealand has assumed the international responsibilities appropriate to an independent country, its foreign policy has changed in emphasis and scope. The foundations of New Zealand's pre-war position in international affairs—its identification with Britain and its membership of the Commonwealth—have been modified and extended to meet the demands of an international situation greatly changed from that of 1939. As a country of predominantly European settlement, New Zealand retains its traditional loyalties to the United Kingdom and a sense of identity with Europe and of involvement in its destiny. As a Pacific power, it has sought security in friendship and formal defensive arrangements with Australia and the United States of America. New Zealand's growing involvement in the problems of the South Pacific region and its close ties with the island people are giving rise to a new recognition of the importance of the role it will have to play in this area in the future. New Zealand is in a unique position to encourage the growth of a regional consciousness in the South Pacific which is essential if the problems of the area are to be seen and tackled as a whole. At the same time it has developed its association with Asian countries. As a country concerned with the preservation of world peace and the organisation of defence against aggression it has placed prime importance upon development of the United Nations as an agency for peaceful settlement of international disputes and for the achievement of collective security. Pending the establishment of a broadly based United Nations security system, however, New Zealand has been prepared, in respect of South-East Asia, to participate in a protective grouping concerned with the defence of a single area. Moreover, while it sees aggressive Communism as the greatest threat to individual liberty at the present time, it is well aware of the powerful stirrings of other forces—the yearning for political emancipation, the antagonism to systems of racial discrimination, the demand of underprivileged countries for a greater share of the world's prosperity, for social advancement and opportunity. New Zealand's actions in the international field are designed to take account of these forces and, where possible, to assist the people of other countries in their striving for a better life. The limits of what it is able to do are those imposed by its size and capacity; its disposition is towards peaceful and friendly relations with all nations and (whatever the modifications which the needs of national security may impose) it is to that ultimate goal that its foreign policy is directed.
CONSTITUTION OF NEW ZEALAND: General—New Zealand is a monarchical State; it is also a constituent member of the Commonwealth. It is in this context that the preamble to the Royal Titles Act 1953 is significant ". . . whereas it is expedient that the style and titles at present appertaining to the Crown should be altered so as to reflect more clearly the existing relationships of the Members of the Commonwealth to one another and their recognition of the Crown as the Symbol of their free association and of the Sovereign as the Head of the Commonwealth . . .''
Constitutional elements besides that of the titular head, the Monarch, can be reviewed under the categories of legislative authority, the executive and administrative structure, and the judiciary. This division is a convenient one, even though there is no absolute line of demarcation between the three phases (e.g., legislation may and often does arise through the day-to-day experience of those responsible for administration and execution of policy, or through difficulties or anomalies made explicit in the course of dispensing justice or interpreting law). Conversely, in the exercise of the powers and functions of industrial and other tribunals, commissions, authorities, etc., both administrative and judicial elements may be discerned.
THE MONARCH—The New Zealand Parliament in the Royal Titles Act 1953 gave its assent to the use of the Royal style and titles as follows: Elizabeth the Second, by the Grace of God of the United Kingdom, New Zealand, and Her Other Realms and Territories Queen, Head of the Commonwealth, Defender of the Faith.
While the seat of the Monarch is normally in the United Kingdom, the Queen is represented in New Zealand by the Governor-General appointed by the Crown to the advice of Her New Zealand Ministers. The Governor-General has, however, an official existence, even in the country to which he has been appointed, only in the absence of the Queen from that country. In the island territories the Crown is represented by the Resident Commissioner or Resident Agent. These officials carry out the constitutional functions of the Crown, but they also possess in varying degrees certain executive and legislative powers, being responsible to the New Zealand Government for the administration and good government of the islands concerned.
Many powers held by the Monarch (or her representative) comprise but the means of giving effect to the public will. In New Zealand the Governor-General acts on the advice of the Ministers, which cannot constitutionally be ignored. Despite the long-term trend for powers to be assigned directly to Ministers without any necessity for vice-regal consultation, there are still many phases of Government which require Royal participation.
The Queen (in her absence the Governor-General) gives consent or approval prior to a Minister taking office or the formation of a Ministry; summons, prorogues, and dissolves Parliament; delivers the Speech from the Throne at the opening of a session; gives the Royal Assent to measures which have passed all stages in the House of Representatives, without which they have not the force of laws; makes appointments to most important State offices; confers knighthoods and other honours, etc.; and also provides that background of stability, continuity, and experience in many facets of government which is so desirable whenever there are sweeping changes in the dominance of political parties.
Besides those duties associated with the constitutional role, the Royal personage or representative makes an important contribution to the ceremonial life of the nation. This was particularly well illustrated during the sojourn of the Royal visitors in New Zealand in 1953-54 and in 1963. Both as the symbol of the nation and in virtue of her identification with the life and interests of her people, the Queen becomes the focus for all State occasions, as does the Governor-General in her absence.
LEGISLATIVE AUTHORITY—The supreme law-making body with power to legislate for the whole country is the General Assembly, which now consists of the Governor-General and the House of Representatives, the former Legislative Council having been abolished since the close of 1950.
The powers of Parliament to make laws are legally untrammelled. This was not always so, for prior to the adoption by New Zealand to the Statute of Westminster in 1947 there was incapacity to make laws on certain matters which conflicted with United Kingdom statutes extending to New Zealand. There was also some doubt as to New Zealand's power to make laws possessing extra-territorial effect.
Although they do not limit the legal powers of Parliament as stated above, the provisions of the Electoral Act 1956 creating reserved sections in that Act are of great constitutional significance. The Act provides that certain of its sections may not be repealed except by a 75 percent majority of the House of Representatives or following a referendum. These sections are those relating to:
The constitution and order of reference of the Representation Commission.
The number of European electoral districts and the basing of their boundaries on the total population.
The fixing of the tolerance within which the Commission must work at 5 percent.
The age of voting.
The secret ballot.
The duration of Parliament.
This innovation is not legally effective in the sense that it does not prevent a subsequent Parliament from repealing it, since one Parliament cannot bind its successors. It should not be thought, however, that the provision is a mere gesture. It records the unanimous agreement of both parties represented in Parliament that certain provisions have a fundamental character in the system of Government and should not be altered at the whim of a bare majority. Considered in this light the provision creating reserved sections introduces something in the nature of a formal convention which could not constitutionally be ignored.
While the law-making function is the prerogative of Parliament, it must be remembered that, as in most democracies, laws are passed because of their acceptability to the majority party in Parliament—i.e., the Government party. Furthermore the initial acceptance will have probably been made in the deliberations of Cabinet.
With the increasing range and complexity of the statutory field, the multifarious concerns of a modern twentieth century government, and the necessity of conserving time for consideration of more important issues, much of the detailed procedural steps and other amplifying matter must become the subject of regulations made by Order in Council under the authority of some statute, rather than being incorporated in the statute itself. The power to make such regulations lies with the Executive Council which comprises those senior members of the majority party in Parliament who are appointed thereto, together with the Governor-General. Regulations, though originating in Cabinet and becoming effective in the formal proceedings of the Executive Council, rest fundamentally on the will of Parliament as a whole and are now subject to its supervisory jurisdiction. A general provision contained in the Regulations Amendment Act 1962 requires all such regulations to be laid before Parliament, though most empowering Acts contained a similar provision prior to that date. An amendment to the Standing Orders of the House of Representatives, also passed in 1962, enables the House or any member thereof to refer any regulation to the Statutes Revision Committee, a Select Committee of the House, which is empowered to consider the regulation and to determine whether the special attention of the House should be drawn to it on any of the following grounds: (a) That it trespasses unduly on personal rights and liberties: (b) That it appears to make some unusual or unexpected use of the powers conferred by the statute under which it is made: (c) That for any special reason its form or purport calls for elucidation.
Meeting of Parliament—Parliament is summoned, prorogued, or dissolved by Proclamation issued by the Governor-General. A session is that period between the summoning of Parliament and its prorogation. Its length varies, but it usually occupies the months from June to November. When Parliament is prorogued all the business on hand lapses, and if this is to be proceeded with in the next session it must be re-introduced.
The course of a session may be interrupted by an adjournment.
Parliamentary Privileges—While in session these include freedom of speech and freedom from arrest in civil cases, and also the right to engage in secret debate, if required, etc.
The Party System—The two main political parties represented in Parliament are National and Labour. A third party—Social Credit—obtained a seat for the first time at the 1966 General Election. At any general election these parties, together with any other political parties which may be desirous of so doing and also those candidates standing as independents, state their respective policies before the electors. Each party normally puts forward one candidate for each of the 80 electorates into which the country is divided. The party which wins the majority of seats, although not necessarily the majority of votes, at the general election forms the Government. The leader of the elected members of the majority party becomes the Prime Minister, who makes Ministerial appointments from elected members of his party. The leader of the minority party in Parliament becomes the Leader of the Opposition. The effectiveness of the party system relies largely on the general agreement that the majority party is to govern and the minority is to criticise—so that there is ample time allocated for debate on Government measures in Parliament. While party control is exercised by national and local organisations outside Parliament, within the latter it is maintained by the respective party Whips.
Parliamentary Procedure—The House of Representatives has its Standing Orders, which govern its procedure and which are administered by Mr Speaker in the exercise of his control of the House. Mr Speaker's rulings on interpretation of the Standing Orders are followed in a similar manner to judicial decisions in the ordinary Courts of law. The main means by which Parliament does its work is through the system of debate and committees. The election of a Speaker is the first business of a new House after the members have been sworn. A Chairman of Committees is elected as soon afterwards as is convenient. Twenty members, inclusive of the Speaker, constitute a quorum.
Parliamentary Functions and Control—The Parliament controls the Government in power in the last resort by its power to pass a resolution of no confidence in the Government, or to reject a proposal which the Government considers so necessary that it is made a matter of confidence, and thus force the Government to resign.
Financial control is exercised by the fact that expenditure of public money must be authorised by the House of Representatives in the form of an Appropriation Act, which authorises or grants money to the Government for the purposes approved. The authority for the raising of revenue by taxation or borrowing must also be given by Parliament. The functions of Parliament are, of course, the passing of legislation and taking action to make available finances or funds as required for State expenditure, while it also controls the Government. Legislation can be initiated by any member of Parliament, but in practice almost all Bills are introduced by the Government in power as a result of policy taken in Cabinet, sometimes at the instigation of those Government Departments which will be responsible for their administration when the Bills become law. The chief exceptions are private Bills, which are designed for the particular interest or benefit of a person or body of persons, whether incorporated or not, and local Bills which relate largely to matters of local (as distinct from central) government business. The process of passing a public Bill is as follows: it receives a formal first reading on introduction, is then printed, and after some time it is given a second reading as a result of a debate on its general merits or principles. It may then be referred to one of the Select Committees, for consideration in the closest detail, before being considered by the whole House sitting in Committee. During these stages members have opportunities to suggest amendments which may be incorporated in the Bill if the majority so decide. The Bill is then reported to the House, and later read a third time; debate rarely occurs at these stages. The final stage is to send the Bill to the Governor-General for the Royal Assent and, unless provision is made for commencement on another date, it then becomes law. Bills providing for receipt of moneys, such as the Finance Bill, and expenditure of moneys, such as the Appropriation Bill, are introduced only by a Minister of the Crown, normally the Minister of Finance. No Bill involving an appropriation of public moneys or affecting the rights of the Crown can be passed without the recommendation of the Crown, which is given by Message from the Governor-General.
Duration of Parliaments—Quinquennial Parliaments, instituted under the Constitution Act, were abolished by the Triennial Parliaments Act 1879, which fixed the term at three years. General elections have been held at three-yearly intervals since 1881, with a few exceptions. The term of the nineteenth Parliament was during the First World War extended to five years by special legislation, and that of the twenty-fourth (1931-35) and subsequent Parliaments to four years under the Electoral Amendment Act 1934. By the Electoral Amendment Act 1937 the three-year term was restored, but on account of war conditions the term of the twenty-sixth Parliament was extended to four years by the Prolongation of Parliament Act 1941. The Prolongation of Parliament Act 1942 extended the term still further to one year from the termination of the war, but with a proviso for a motion to be moved in the House of Representatives each year after the year 1942 either approving the continuation of the House or fixing an earlier date for its expiry. During the 1943 session a motion in favour of dissolution was carried, and Parliament was dissolved on 30 August 1943. Since then the duration of Parliaments has been of three years, with the exception that the twenty-ninth Parliament was dissolved after the expiration of approximately 20 months. The three-year limit was re-enacted in the Electoral Act 1956, this being one of the reserved provisions referred to earlier.
Number of Representatives—The number of members constituting the House of Representatives is 80-76 Europeans and four Maoris. They are designated "members of Parliament''. The number was originally fixed by the Constitution Act as not more than 42 and not less than 24, and the first Parliament called together in 1854 consisted of 40 members. Legislation passed in 1858 fixed the number of European members at 41; in 1860, at 53; in 1862, at 57; in 1865, at 70; in 1867, at 72; in 1870, at 74; in 1875, at 84; in 1881, at 91; in 1887, at 70; and in 1900, at 66. Since 1867 there have been four Maori representatives, and provision for this number was retained in the Electoral Act 1956. In 1954 the boundaries of the Maori electoral districts, which had remained unaltered since 1867, were changed by Proclamation so as to give a greater degree of equality of population among the four districts (in effect the Southern Maori Electoral District now includes a considerable area of the North Island). The Electoral Amendment Act 1965 fixed the number of European electorates in the South Island at 25 (an increase of one) and provided that the number of European electorates in the North Island shall be ascertained by the Representation Commission after each quinquennial census of population on the basis of the quota fixed for the South Island, the changes to follow the redrawing of the electoral boundaries after the 1966 census.
Qualifications of Members—Under the Electoral Act 1956 every registered elector of either sex, but no other person, is qualified to be a parliamentary candidate. It is provided, however, that a person shall not be so elected who is disqualified as an elector under any of the provisions of the Act (see under "Franchise'' later); or is an undischarged bankrupt; or is a contractor to the Public Service of New Zealand to whom any public money above the sum of $400 is payable, directly or indirectly (but not as a member of a registered company or incorporated body), in any one financial year. Although women have had the vote since 1893, they were not eligible as parliamentary candidates until the passing of the Women's Parliamentary Rights Act 1919. Prior to 1936 a public servant was prohibited from being elected, but this prohibition was removed by the Political Disabilities Removal Act 1936. The present law is that if a public servant is elected to Parliament he vacates his office forthwith and he cannot resume employment in the Public Service within 12 months of ceasing to be a member of Parliament unless he had previously been a public servant for at least five years.
Salaries, etc.—Section 27 of the Civil List Act 1950 provides that on the recommendation of a Royal Commission the Governor-General may from time to time, by Order in Council, fix the salaries and allowances to be paid to the Prime Minister and other Ministers of the Crown or members of the Executive Council, to Parliamentary Under-Secretaries, and to the Speaker and Chairman of Committees and other members of the House of Representatives, and that a Royal Commission shall be appointed for this purpose within three months after the date of every general election of members of Parliament.
In accordance with the recommendations contained in the report (issued in 1964) of the Royal Commission upon Parliamentary Salaries and Allowances, the Prime Minister's salary, as from 1 July 1964, was increased to $11,500 with a tax-free allowance of $3,200 for the expenses of his office and a Ministerial residence. In addition, while travelling on official business he receives $10.50 per day to meet expenses, and by virtue of his office is entitled to free cars, secretarial assistance, and free postage. The Deputy Prime Minister's salary is $8,500 with a tax-free expense allowance of $1,200. The salary of each other Minister holding a portfolio is $8,000 with a tax-free expense allowance of $1,100, and that of each Minister without portfolio $6,500, with $900 tax-free allowance. Where the office of Minister of External Affairs is held by a Minister other than the Prime Minister the expense allowance is increased by $360. Any Minister not occupying a Ministerial residence receives an allowance in lieu at the rate of $600 a year. This allowance, or the assessed value of the residence where one is provided, is subject to income tax. Ministers also receive an allowance of $10.50 per day when travelling on official business within New Zealand, and in addition are entitled to free cars, secretarial assistance, and free postage. For Parliamentary Under-Secretaries the rate of salary is $6,000, with the same house provision or allowances, and travel allowance while on official business, as for Ministers. An expense allowance of $900 is also payable. After the general election of November 1954 no appointments were made until 1960, when two Parliamentary Under-Secretaries were appointed.
The basic salary paid to members of the House of Representatives is now $4,300 a year. European members are also paid an allowance to provide for expenses incurred in connection with parliamentary duties ranging from $900 to $1,450 a year subject to the classification of their electorates by the Representation Commission into the five classes of (a) a wholly urban electorate, or (b) a substantially urban electorate, or (c) a partially urban and partially rural electorate, or (d) an ordinarily rural electorate, or (e) a predominantly rural electorate. An expense allowance of $1,700 a year is paid to the member for Southern Maori, and an allowance of $1,550 to the members representing the other three Maori Electorates. A sessional accommodation allowance is paid at the rate of $1.50 for each day and $5 for each night on which a member is in Wellington and attends the sittings of Parliament, or of a Select Committee of Parliament of which he is a member. The sessional accommodation allowance is not payable to any member representing a Wellington urban electorate. (For full details see Parliamentary Salaries and Allowances Order 1964 and section 3 of the Finance Act 1962.) Payment to members is subject to certain deductions for absence not due to sickness or other unavoidable cause. In addition to the salary and allowances, member are entitled to certain privileges in respect of air and other forms of travel, a stamp allowance of $14 a month, and certain other concessions regarding telegrams and telephone services. If a member is defeated at an election he continues to receive salary only to the end of the month following the month in which the election took place.
Both the Speaker and Chairman of Committees hold office until a dissolution and receive payment until the first meeting of a new Parliament. The Speaker's remuneration is $6,800 a year in addition to which he receives an expense allowance of $1,550 a year and residential quarters in Parliament House. The salary of the Chairman of Committees is $5,500 a year. In addition, he receives the electoral and sessional allowances appropriate to his electorate, increased by the sum of $400, and is provided with sessional accommodation.
The Leader of the Opposition is paid a salary of $6,800 a year with an expense allowance of $1,100 a year. In addition, a secretary, an assistant secretary, and a typist are provided by the State, and an allowance of $800 is payable for travel outside his electorate. His stamp allowance is $35 per month. In addition, the Leader of the Opposition is entitled to an official residence on the same basis as a Minister, or to an allowance of $600 a year in lieu thereof. The Deputy Leader of the Opposition receives a salary of $4,800 a year in addition to his appropriate electorate allowance and the sessional accommodation allowance where this is payable.
The Chief Whip of each party receives a salary of $4,500 a year, and the Junior Whip of each party receives a salary of $4,430 a year, together with the appropriate expense allowance in each case in accordance with the classification of his electorate and where applicable accommodation allowance.
Former Prime Ministers receive an annual payment of $400 for each full year in office, with a maximum of $2,000 a year, after retirement or when a member only.
Part V of the Superannuation Act 1947, as amended by the Superannuation Amendment Act 1955, consolidated in 1956 and amended in 1961, introduced a compulsory contributory superannuation scheme for members of the House of Representatives. The scheme now provides that a retiring allowance shall be payable to a members after nine years' service and the attainment of 50 years of age, and shall be calculated at the rate of one thirty-second of the basic salary for a member as at the date of his ceasing to be a member, for each year of service with a maximum of two-thirds of that basic salary, or alternatively the member may elect to take a variable retiring allowance so as to secure a level income, or he may elect to receive a refund of his contributions. The annual contribution is 10 percent of an ordinary member's salary, and the Government subsidises the fund by an equal amount. In the case of a male member dying and leaving a widow surviving she becomes entitled during her widowhood to receive an annuity of half of the retiring allowance to which her husband would have been entitled had he retired aged 50 years at the time of his death, or $260 a year, whichever is the greater.
ADMINISTRATION AND EXECUTIVE RESPONSIBILITY—After the election of a new Parliament, the Prime Minister, who is the leader of the majority party in the elected members, is given the task of selecting the members of the Executive Council (i.e., the New Ministry). Each of those members of Parliament to form the Government is normally entrusted by the Prime Minister with responsibility for administration of a specified field or aspect of government. This field is entitled a portfolio, e.g., all relevant matters relating to Customs would be allocated to one member, who is henceforth known as the Minister of Customs. He may also have other portfolios and the supervision of one or more Government Departments in which the activities carried out, though important, either do not rank as portfolios or are subsidiary aspects of the field—in these cases the Minister's responsibility will extend to being in charge of the named Department. One or other of the appointed Ministers in this way is responsible for the direction of activities and executive acts of each of the Government Departments and offices, etc., embracing the entire range of State activities. Thus arises the concept of Ministerial responsibility. Occasionally a Minister is appointed without portfolio.
Executive Council—In the legal sense those members of Parliament who have been appointed Ministers, together with the Governor-General, comprise the Executive Council, The powers, duties, and responsibilities of the Governor-General and the Executive Council under the present system of responsible government are set out in Royal Letters Patent and Instructions thereunder of 11 May 1917, published in the New Zealand Gazette of 24 April 1919. The Royal Powers Act 1953 provides that the statutory powers conferred on the Governor-General may be exercised either by Her Majesty the Queen in person or by the Governor-General. In the Execution of the powers and authorities vested in him the Governor-General must be guided by the advice of the Executive Council; but, if in any case he sees sufficient cause to dissent from the opinion of the Council, he may act in the exercise of his powers and authorities in opposition to the opinion of the Council, reporting the matter to Her Majesty without delay, with the reasons for his so acting.
In any such case any member of the Executive Council may require that there be recorded in the minutes of the Council the grounds of any advice or opinion that he may give upon the question.
A point of interest is that the Civil List Act 1950, in section 6, provided that no person shall be appointed a Minister or a member of the Executive Council unless he is a member of Parliament and that a person who ceases to be a member of Parliament cannot continue to be a Minister or a member of the Executive Council for more than 21 days. This gave statutory recognition for the first time to what had long been the convention.
At February 1967 the Executive Council consisted of 18 members in addition to the Governor-General. Two members, exclusive of His Excellency or the presiding member, constitute a quorum.
Under the Civil List Act 1950 and its amendments, His Excellency the Governor-General receives a salary of $15,000, and an allowance of $11,000 a year for the salaries and expenses of his personal establishment, plus all expenditure incurred in respect of the transport to and from New Zealand and the travel within or outside New Zealand of the Governor-General and his family and staff.
Cabinet—There is a close relationship between the Executive Council and the Cabinet. There are however, significant differences in membership and functions.
The Council consists of all Ministers and is presided over by the Governor-General. Cabinet may or may not comprise all the Ministers, including a Minister without portfolio; the Governor-General is not a member. The Council is one of the instruments for giving the imprint of legal form to policy determined by Cabinet which had been recognised only by constitutional convention until legislative reference to Cabinet was made in the Parliamentary Commissioner (Ombudsman) Act 1962.
Cabinet has been described as the directing body of national policy whose nature is more easily explained by analogy than by definition. It determines the policy to be submitted to Parliament. In it is vested the supreme control of national policy within the limits of Parliamentary approval. It co-ordinates and delineates the activities of the several Departments of State.
The juridical acts which are necessary to give legal force to certain of the decisions of Cabinet are taken by others—the Crown, the Executive Council, a Minister of the Crown, a Statutory Commission and the like. The preliminary review of proposed policy or of current administrative developments, which takes place in the informal atmosphere of Cabinet meetings, implies both deliberative or selective and administrative procedures on the part of this body.
Cabinet discussions are informal and confidential, anonymity being maintained as to the individual advocacy or opposition to particular proposals. The Cabinet system enables general agreement to be reached on any line of action proposed by either an individual Minister or by the Government as a whole. As a result the Executive Council confirmation can proceed smoothly and expeditiously. In Parliament a Minister can be confident that his legislative or other proposals will have the unqualified support of the Government no matter what divergences of opinion may have been apparent before general agreement was reached in Cabinet. A consistent and agreed course of action on any particular issue can be determined. The work of Cabinet thus exemplifies the concept of the collective responsibility of the Government.
Certain questions are considered by committees of Cabinet composed of those Ministers primarily concerned. Some executive action may be undertaken by these committees within the lines of established Government policy. Their work is subject to periodical report to, and overall supervision by, the entire Cabinet. On occasions, ad hoc committees may be established to review or investigate particular questions and to present their conclusions and recommendations to Cabinet.
The Cabinet Secretariat is responsible for the servicing of Cabinet and its committees to ensure their smooth functioning. It is its purpose also to assist in the co-ordination and review of the work of the Departments of State.
Government Departments—The Minister as the political head of a Department of State may in fact have several Departments under his control. There are however some 40 different Departments with separate functions in New Zealand. Each of these had a permanent head who is responsible for the work and administration of the Department. He is of course responsible to the Minister in charge of the Department, while he also acts as adviser to the Minister on all matters within his appointed competence. Besides ensuring that the ministerial policy and directions communicated to him are effectively put into practice, his functions as the adviser include assessing the consequences of any executive action resulting from his departmental activity, evaluating the merits and demerits, whether political, social, or financial, of various modes of action, and making suggestions for improvements and for new policy measures as derived from departmental experience in the day-to-day execution of policy.
Departments can be broadly classified according to the administrative or regulatory, developmental, or social nature of their activities. Within the first group are the servicing subgroup, such as the Legislative, Prime Minister's, External Affairs, Printing Office, Law Drafting, Valuation, Statistics, and Audit; the finance subgroup—Treasury, Customs, Inland Revenue; the regulatory subgroup—State Services Commission, Internal Affairs, Labour, Marine; the defence and law and order subgroup—Ministry of Defence, Justice, Crown Law, and Police; the publicity and research subgroup—Tourist and Publicity, Scientific and Industrial Research.
In the second group are the transport and communications subgroup, such as Transport, Civil Aviation, Post Office, and Railways; the developmental—Ministry of Works, Agriculture, Lands and Survey, Forest Service, Mines, Electricity, Maori Affairs, and Industries and Commerce; the commercial—Public Trust, Government Life Insurance, State Advances Corporation, and State Insurance.
The third group comprises the Education, Health, and Social Security Departments.
This broad division serves merely to indicate the field of the dominant activity or purpose of the particular Department. Most Departments have servicing, informative, and regulatory functions, and many are equally regulatory and developmental in nature.
In addition to the system of direct administration in the form of Government Departments, there are other activities over which the State exercises some ultimate measure of control or ownership, though divorced in varying degrees from immediate supervision. The Reserve Bank of New Zealand (the central bank), and one trading bank, are entirely State-owned, although the actual administration is quite independent, subject in the case of the Reserve Bank to the proviso that it must give effect to the monetary policy of the Government, as communicated to the bank by the Minister of Finance, and to any resolution of Parliament in respect of Government monetary policy.
Further instances of this principle are shown by the National Airways Corporation, which, although owned by the State, is administratively self-contained, and by the Tourist Hotel Corporation. In certain other avenues the type of administration is in between the normal departmental form and that evident in the corporation type; of such is the National Roads Board, which, though determining policy to a large degree, yet makes use of departmental administrative structures for implementation of policy.
Some administrative organisations have also quasi-judicial functions. Examples of this class are the Price Tribunal, Transport Charges Authority, Licensing Control Commission, and Local Government Commission.
JUDICIARY—The hierarchy of Courts in New Zealand comprises the Court of Appeal, the Supreme Court, and the Magistrates' Court. Apart from these Courts of general jurisdiction there are other Courts dealing with specific fields. In the latter category are the Court of Arbitration concerned with awards and general orders governing wage determination and conditions of employment in industry; the Compensation Court dealing with workers' compensation; and the Land Valuation Court, which settles land valuation disputes and compensation claims where land is taken for public works. For further details refer to Section 8 (Justice) of this issue.
ELECTORAL PROVISIONS—The law on these matters is now contained in the Electoral Act 1956. Following each population census, which is normally taken every five years, the boundaries of European electorates are revised. In addition, there are four Maori electoral districts, three in the North Island and one covering a portion of the North Island together with the whole of the South Island, where the Maori population is comparatively small. The Governor-General may at any time by Proclamation alter the boundaries of the Maori electoral districts, and, as in the case of European electoral districts, any alterations are to come into force at the expiry of the Parliament existing when the Proclamation is issued.
The Government Statistician is required to supply population figures to the Surveyor-General as soon as possible after the census. The population used as the basis in obtaining the quota for each European electoral district is defined in section 2 (1) of the Electoral Act 1956.
The term "European population'' means total population with the following exceptions:
Maoris:
Persons residing on board ship, whether as passengers or members of the crew or otherwise:
Persons residing temporarily as guests in any licensed hotel:
Persons residing temporarily in any naval, military, or air force camp, station, or establishment:
Persons residing as patients or inmates in any hospital:
Persons in respect of whom reception orders under the Mental Health Act 1911 are in force:
Persons detained pursuant to convictions in any penal institution.
After the population figures are supplied by the Government Statistician it is then the responsibility of the Representation Commission to define new electoral districts for Europeans. The Commission is constituted by virtue of section 15 of the Electoral Act 1956 and comprises seven members. Four of these, the Surveyor-General, the Government Statistician, the Chief Electoral Officer, and the Director-General of the Post Office, are official members. Two are unofficial members, being persons nominated by the House of Representatives, one nominated to represent the Government, and one to represent the Opposition. The seventh member is appointed, on the nomination of the official and unofficial members of the Commission or a majority of them, to be the Chairman of the Commission. The Chairman and unofficial members cease to be members on the date on which the first periodical census is taken after the date of their appointment.
The European population of the South Island is divided by 25 and the quotient so obtained is the quota for the South Island. Then the European population of the North Island is divided by the quota for the South Island, and the quotient so obtained is the number of European electoral districts in the North Island. The quota for North Island is obtained by dividing the European population of that Island by the number of electoral districts in that Island. In applying the quota the Commission may make an allowance by way of addition or subtraction of 5 percent of the quota to enable districts to be adjusted to meet considerations of topography, community of interest, communications, and existing electoral boundaries.
When the boundaries have been provisionally determined, maps are prepared illustrating the proposed electoral districts, and descriptions of each electoral district are published in the New Zealand Gazette. A time limit of one month is given thereafter in which objections to the proposed boundaries may be lodged. These objections are then considered by the Representation Commission and a final decision reached on boundaries which then become the new electoral districts.
In addition to determining new European electoral districts the Representation Commission is also charged with the responsibility of classifying them for the purpose of allowances as provided by the current Parliamentary Salaries and Allowances Order. Under this order provision is made for an allowance based on the size, topography, and transport facilities of the electorate, the nature of its roads, the distribution of its population, and all other considerations that the Commission deems relevant.
The Act provides that all general elections and by-elections shall be held on a Saturday and for both European and Maori elections to be held on the same day. Polling hours in all electorates are from 9 a.m. to 7 p.m.
The Act provides that, if at any time Parliament is dissolved before it has been two years in existence, the main and supplementary rolls used in the previous general election, together with a further supplementary roll, may be used if in the opinion of the Chief Electoral Officer it is impracticable to print new main rolls. The same rolls, together with a further supplementary roll, are to be used for any by-election occurring before the next following general election.
Provision is made for the voting at elections and licensing polls by servicemen serving overseas, who are or will be of, or over the age of, 21 years before the date of the election or poll, whether or not registered as electors of any electoral district. Each such serviceman shall be qualified to vote as an elector of the electoral district in which he last resided before he left New Zealand.
FRANCHISE—Since the abolition of plural voting in 1889 and the introduction of women's suffrage in 1893, every person 21 years of age or over (with certain obvious exceptions) has had the right to exercise one vote and one vote only in the election of members of the House of Representatives. Some of the more important provisions of the Electoral Act 1956 are now given.
Qualification for Registration as Elector—To be qualified for registration as a parliamentary elector in New Zealand a person must have attained the age of 21 years and must (a) be a British subject or Irish citizen, (b) be ordinarily resident in New Zealand, (c) at some period have resided continuously in New Zealand for at least a year, and (d) except in special cases have resided continuously for three months or more in the electoral district in respect of which application for registration is made, and not have subsequently resided for three months or more in any other electoral district.
The Act defines what is meant by the term "ordinarily resident''. To be ordinarily resident in New Zealand, a person must be or have been actually resident in New Zealand with the intention of residing there indefinitely. If he is absent from New Zealand he must have had, even since he left New Zealand, an intention to return to reside there indefinitely, and (except in the case of a public servant or the wife or husband of a public servant) must not have been absent from New Zealand for more than three years. Broadly speaking, the qualifications restrict the right to vote to permanent residents, the test laid down being similar to the legal concept of domicile.
The following persons are disqualified from registration as electors: (a) Those in respect of whom reception orders under the Mental Health Act 1911 are in force, (b) those detained pursuant to a conviction in any penal institution, and (c) those whose names are on the Corrupt Practices List for any district.
These qualifications and disqualifications apply alike to Maoris and Europeans.
Registration of Electors—A system of compulsory registration of electors has been in operation in respect of Europeans since 1924 and was introduced in respect of Maoris in 1948. Every person qualified to be registered as an elector of any district must, if he is in New Zealand, apply for registration within one month after the date on which he first becomes qualified to be registered as an elector. He must also apply for registration within three months after the issue of every Proclamation proclaiming the names and boundaries of electoral districts or within such later period as may be provided by Order in Council. Qualified electors who are outside New Zealand may apply for registration if they wish.
A European is not entitled to be registered as an elector of a Maori district and a Maori (other than a half-caste) is not entitled to be registered as an elector of a European district. A half-caste Maori may choose to be registered either for a Maori or European district, and special rules are laid down to govern a change from one to the other.
Voting at Elections—Voting at parliamentary elections is by secret ballot, a method which was first introduced in New Zealand in 1870. Recognition of the fundamental character which the secret ballot has attained in New Zealand was given in the Electoral Act 1956, which included the section providing for this method of voting among the reserved sections which may be repealed only by a 75 percent majority vote of all the members of the House of Representatives or following a referendum.
In general, only those persons whose names are lawfully on the main and supplementary rolls of electors compiled prior to an election may vote at that election. The following classes of persons whose names are not on the roll are however entitled to vote:
Those who have applied for registration between writ day and polling day and have satisfied the Registrar that they became qualified for registration not earlier than one month before writ day.
Those who are qualified for registration and were at the last preceding election registered in that district or, where boundary changes have intervened, in some other district in which their then residence within the first-mentioned district was then situated.
Those who are qualified for registration and have since the last election and before 6 p.m. on writ day applied for registration in that district, or where boundary changes have intervened, in some other district in which their then residence within the first-mentioned district was then situated.
Servicemen outside New Zealand, if they are or will be 21 years of age or more on polling day and their place of residence before they left New Zealand is within the district.
Special Voters—A vote is normally cast by the elector at a polling booth within his district. An elector may, however, vote as a "special voter'', either at a polling booth outside his district or by post, in the following cases:
If his name does not appear on the main roll, or any supplementary roll for the district, or has been wrongly deleted from the roll.
If he will be outside New Zealand on polling day.
If he is or will be absent from the district on polling day.
If he will not be within 2 miles by the nearest practicable route of any polling place in the district during the hours of polling.
If he will be travelling during the hours of polling under conditions which will preclude him from voting at a polling place in the district.
If he is ill or infirm.
If, in the case of a woman, she is precluded from attending at a polling place by reason of approaching or recent maternity.
If he is a lighthouse keeper or a member of a lighthouse keeper's staff, or if she is the wife of a lighthouse keeper or of one of his staff.
If he has a religious objection to voting on the day of the week on which polling day falls.
If he satisfies the Returning Officer or Deputy Returning Officer that on any other ground he cannot vote at a polling place in the district without hardship or undue inconvenience.
These latter conditions replace the former classes of absentee, postal, and declaration voters, including servicemen outside New Zealand.
LOCAL GOVERNMENT—In 1876, following the abolition of the provinces, local government assumed the form it still basically retains. The Counties Act of 1876 divided the country into 63 counties, with provision for administration by elective councils having powers considerably less than those enjoyed by the Provincial Councils. In the same year the Municipal Corporations Act provided for the incorporation of the 36 boroughs then in existence and for the creation of new boroughs.
A description of the development of counties, boroughs, and town districts follows.
Counties—Counties are now constituted under the Counties Act 1956, which consolidated under legislation relating to counties and road districts. In general, the county organisation makes provision for the primary needs of a scattered population within a large area. With increasing settlement the original 63 counties were gradually subdivided until in 1920 the maximum of 129 was reached, although the number of councils formed and actively functioning never exceeded 126. The number of counties has been reduced by amalgamations and mergers by the Local Government Commission At September 1966 there were 112 counties constituted, of which 111 were actively functioning, Fiord being a sparsely populated county in which the Counties Act, is not wholly in force. The Local Government Commission operates under the Local Government Commission Act 1961.
County councils may, under the provisions of the Counties Act 1956, declare areas within counties to be county towns. To qualify the areas concerned must have a population of at least 200, with an average density of not less than one person to the acre or not less than 60 houses with an average density of not less than one house to three acres. After the constitution of a county town the county council is required to appoint a county town committee of not less than three nor more than seven members, to advise it on the administration of the county town. Membership is restricted to electors having a ratepayer's or residential qualification in respect of property or an address within the county town, or members of the council for the riding in which the county town is sited.
Boroughs—Dealing with the needs of a concentrated population, the borough organisation is concerned with a wide range of functions of a purely local nature. With the growth and centralisation of population the number of boroughs, despite numerous amalgamations of adjacent boroughs, steadily increased until 1955 when the total was 146. In September 1966 the total was 142.
Under the Municipal Corporations Act 1954 for the constitution of a borough there must be a population of at least 1,500 with an average density of population of at least one person per acre. A borough containing a population of 20,000 or more may be proclaimed a city, although the corporation remains unaltered.
Town Districts—The town district represents a form of local government intermediate between the county and the borough. It implies a certain concentration of population and the presence of interests which, from their purely local nature, cannot be satisfactorily met by the county organisation. In its early stages a town district usually remained subject to county control, although such control was practically confined to the main and county roads in the town district; in such circumstances it was known as a dependent town district. The Town Boards Amendment Act 1908 enabled town districts on reaching a population of more than 500 to become independent. On attaining its independence a town district becomes in all respects a separate entity, and, apart from its smaller population, is not essentially different from a borough. The constitution and powers of town districts have been brought into closer relationship to boroughs over the years, and independent town districts are now constituted under the Municipal Corporations Act 1954. The Act required that the area should not be more than 2 square miles, within which no two points are more than 4 miles distant and with a density of population of not less than one person to the acre. No new dependent town districts can be constituted. The number of town districts in September 1966 was 18 (11 independent and 7 dependent).
General Powers—Local authorities in New Zealand derive their powers from the Acts under which they are constituted, and also from special empowering Acts. In addition to legislation providing for particular types of local authority or for individual local authorities, there are several statutory measures which are more or less applicable to all local authorities, such as the Local Elections and Polls Act 1966 and the Local Authorities Loans Act 1956. For most harbour boards, there is in addition to the general Harbours Act a special Act for each board, which is subordinate to the general Act. Certain types of local authority—urban drainage boards, transport boards, the Auckland Regional Authority, the Auckland Harbour Bridge Authority, the Christchurch-Lyttelton Road Tunnel Authority, and the Waikato Valley Authority—derive their principal powers from special constituting Acts.
Local authorities have general powers of entering into contracts for any of the purposes for which they are constituted; of selling and leasing land; and of taking or purchasing any land which may be necessary or convenient for any public work.
Number of Local Authorities—The number of local authorities actively functioning at 1 September 1966 was 703 made up as follows: County councils, 111, borough (including city) councils, 142; town councils (independent), 11; town councils (dependent), 7; road board, 1; regional authority, 1; river boards (2 boards also have the power of land-drainage boards), 10; catchment boards, 13; catchment commissions, 3; land-drainage boards, 37; electric power boards, 39; water-supply board, 1; urban drainage boards, 4; transport boards, 2; local railway board, 1; electric power and gas boards, 2; independent milk boards, 15; nassella tussock board, 2; harbour bridge authority, 1; road tunnel authority, 1; valley authority, 1; plantation board, 1; underground water authorities, 3; rabbit boards, 179; independent fire boards, 60; independent harbour boards, 18; and hospital boards, 37. Borough and county councils also function as milk boards in 38 cases, as fire authorities in 189 cases, and as harbour boards in 11 cases. In addition, there were 21 district councils of the National Roads Board constituted under the National Roads Act 1954. Although these district roads councils are not local authorities in the strict sense of the term they are intimately connected with certain aspects of local government providing an advisory service to the National Roads Board concerning the roading needs and the allocation of national roading funds within their respective districts.
Administratively, boroughs and independent town districts, which are contained within the areas of the several counties, are regarded as separate entities. From an administrative point of view, therefore, the fundamental districts are counties, boroughs, and independent town districts. Upon this foundation a considerable superstructure of districts of other types has been erected. These overlapping districts may be divided into two broad classes, viz: (1) Districts formed from parts of counties, e.g., road districts; and (2) those which are composed of a group of adjacent districts of other types united for a common purpose, e.g., electric power districts.
Local Government Commission—The Local Government Commission Act 1961, which replaced the Local Government Commission Act 1953, set up a Local Government Commission which is a permanent institution deemed to be a Commission of Inquiry under the Commissions of Inquiry Act 1908.
The Act provides that the Commission shall consist of a Chairman who is a barrister or solicitor of the Supreme Court of New Zealand and two other members having a special knowledge of local government.
The functions of the Commission are to carry out investigations, prepare reorganisation schemes, and make recommendations and reports for the purpose of ensuring that the system of local government in any locality will best provide for the needs and continued development of the locality, that local authorities have such district boundaries and such functions and powers as will enable them to provide most effectively and economically essential or desirable local government services and facilities, and that the provisions of the Act and of other Acts in relation to local government are effectively implemented. Reorganisation schemes may provide for the union of adjoining districts, the merger, constitution, or abolition of districts, the alteration of boundaries, the conversion of a district into one of a different kind, the transfer of functions of one local authority to another or the dissolution of a local authority.
The Act provides for the appointment of a Local Government Appeal Authority whose function is to sit as a judicial authority to determine appeals made from decisions of the Commission. Any decision finally approving a scheme of reorganisation of districts may be appealed against only by the following parties:
The local authority of any district to which the scheme relates;
Any person or body having statutory authority to make decisions or recommendations in respect of the union, merger, constitution, alteration, or abolition of any district to which the scheme relates; and
The Minister, in any case where the scheme affects only one local authority, or only one local authority and an adjoining area that does not form part of a district, or does not affect any local authority.
Franchise—Under the Local Election and Polls Act 1966, elections are held on the second Saturday in October every third year. Enrolment of residential electors is compulsory. On any proposal relating to loans or rates a rate paying or a freehold qualification is necessary. Details of the franchise as it affects each type of local district are now given.
Counties—Any person of 21 years of age and over who possesses either of the following qualification is entitled to be enrolled on the county electors roll:
Rating qualification, which may be held by any person whose name appears in the valuation roll as the occupier of any rateable property within a riding of the county. One vote is allowed where the rateable value does not exceed $2,000, two votes where the value is greater than $2,000 but not in excess of $4,000 and three votes where the value exceeds $4,000.
Residential qualification, which may be held by a person who is or has the status of a British subject or is an Irish citizen, and who has resided for one year in New Zealand and has had permanent residence of not less than three months in the riding of the county to which the roll relates.
Boroughs—Any person of 21 years of age and over who possesses any of the following qualifications is entitled to enrolment:
Freehold qualification—meaning the beneficial and duly registered ownership of a freehold estate in land of a capital value of not less than $50 situated in the borough, notwithstanding that any other person is the occupier thereof.
Rating qualification, which may be held by any person whose name appears in the valuation roll as the occupier of any rateable property within the borough.
Residential qualification, which may be held by a person who is or has the status of a British subject or is an Irish citizen, and who has resided for one year in New Zealand and who has had permanent residence during the last three months in the borough to which the roll relates.
Town Districts—The franchise is the same as for boroughs, except that for county electoral purposes in dependent town districts the county qualification is necessary.
Rabbit Districts—Where the rates of the district are based on the acreage and rateable value of land occupied by the ratepayer, the franchise is the same as that exercised for county council elections. Where the franchise is based on stock ownership, from one to five votes are allowed according to the number of stock units owned.
Other Districts—Road districts, river districts, land-drainage districts, water-supply districts, and the local railway district all have a franchise similar to that of counties except that the residential qualification applies to road districts only.
Districts composed of a grouping of districts of other types united for a common purpose have a franchise as for the component districts. Such districts are urban drainage districts, electric power districts, harbour districts, hospital districts, urban transport districts, and catchment districts. In some cases—e.g., the Auckland Metropolitan and Hutt Valley Drainage Boards—the members are appointed or elected by the territorial local authorities included in the district.
TOWN AND COUNTRY PLANNING—The Town and Country Planning Act 1953 provides for the making and enforcement of regional and district planning schemes, and the detailed procedure to be followed in each case is amplified by the Town and Country Planning Regulations 1960. The Government administers the Act through the Minister of Works who may delegate his authority to the Commissioner of Works.
Regional Planning—Regional Planning Authorities may be established under provisions of the Town and Country Planning Act 1953. As provided in the Act the authorities consist of representatives of the several councils whose districts are wholly or partly within the region. Every local authority within the region, other than the constituent councils, is entitled to be represented by at least one associate member. The Regional Planning Authority may also appoint any person who may be possessed of special knowledge, or representatives of any Department of State, to be associate members. Authorities are now operating in the four main centres and in Northland and Marlborough.
Finance for administration purposes is provided for by way of a maximum rate of one-hundredth of a cent in the dollar on the rateable capital value of those portions of the councils' territories inside the regional area. The Act also makes provision whereby any of the constituent councils may enter into and carry out agreements for the execution of combined works.
Regional planning schemes must be preceded by a comprehensive survey of the natural resources of the areas concerned, and of the present and potential uses and values of all lands in relation to public utilities or amenities. Regional schemes envisage the conservation and economic development of natural resources by classification of lands according to their best uses and by the co-ordination of all such public improvements, utilities, and amenities as are not limited to the territory of any one local authority. Every regional planning scheme is intended to be a guide to councils engaged in the preparation of district planning schemes and to public authorities and all persons in relation to conservation and development within the region. Regional schemes are required to be reviewed at intervals of not more than 10 years.
District Planning—Every district scheme is required to have for its general purpose the development of the area to which it relates (including where necessary the replanning and reconstruction of an area already built on) in such a way as will most effectively tend to promote and safeguard the health, safety and convenience, the economic and general welfare of its inhabitants, and the amenities of every part of the area. The council of every city, borough, county, and independent town district must provide and maintain a district scheme whether or not a regional planning scheme including its district has been prepared or become operative.
While a district scheme is being prepared a council may refuse its consent to the carrying out of any development that would be in contravention of the scheme and falls within the definition of a "detrimental work'', but the owner or occupier affected may appeal against such a decision to the Town and Country Planning Appeal Board. The Minister can require the council to exercise these powers where the development would or might adversely affect Government works or the public interest, and local authorities have similar rights in respect of their works. Any appeal proceedings lie against the Minister or the local authority concerned.
In the period before a district scheme becomes operative, any change of use of land that detracts or is likely to detract from the amenities of the neighbourhood is required to have the prior consent of the council. Where an application is made to the council for consent, the applicant and every person who claims to be affected by the proposed use has a right to be heard by the council and may appeal to the Appeal Board against the council's decision.
When completed and recommended by the council, copies of a district scheme are submitted to the Minister of Works and to adjoining councils and to local authorities within the area covered by the scheme for consideration, particularly in relation to their public works. When the Minister and each local authority is satisfied that all their respective public works have been properly provided for in the scheme and have certified accordingly, the district scheme is publicly notified for inspection for three months. Any owner or occupier of land affected may object to any provision of the scheme, and the Minister, other local authorities, professional, business, sporting or other such organisations, may also object to the scheme on grounds of public interest. In the event of an objection not being sustained by the council the objector may appeal to the Appeal Board whose decision is final.
The Minister of Works may prepare and obtain approval for a district scheme in any case where a local authority under an obligation to prepare such a scheme fails to do so after being notified in writing. The costs and expenses incurred by the Minister are recoverable from the local authority, or they may be deducted from any moneys payable to the local authority by the Crown.
When a district scheme has been finally approved and made operative the council and all local authorities having jurisdiction in the district are bound to observe, and enforce observance of, the requirements of the scheme. The provisions of an operative regional planning scheme are also obligatory, but a constituent council has a right of appeal to the Town and Country Planning Appeal Board where a provision of a proposed or operative district scheme conflicts with the regional scheme; the Minister has, incidentally, a similar right of appeal so far as the regional scheme conflicts with the public interest.
Operative district schemes may be altered at any time, and must be reviewed when any part of the scheme has been operative for a period of five years. In preparing, recommending, and approving a change or a review of a district scheme the proposed change or review is publicly notified for inspection by owners and occupiers of property and simultaneously submitted to the Minister, to the Regional Planning Authority, and to the local authorities within the district for their consideration and objection where necessary in the light of their respective public works and other responsibilities.
Once a district scheme has been made operative it cannot be cancelled unless it is replaced at the same time by another operative district scheme. Furthermore, once a proposed change to an operative district scheme has been publicly notified for inspection and objection by owners and occupiers of property, no development work, subdivision, or change of use of land or buildings that would conflict with the proposed change may be carried out without permission by order of the Appeal Board.
Where a district scheme is operative the local authority may take, under the Public Works Act 1928, any land in its district if in accordance with the scheme it considers it is necessary or expedient to do so for the proper development or use of the land, or for the provision or preservation of amenities, or for the improvement of areas that are too closely subdivided or are occupied by decadent buildings.
POPULATION GROWTH—Throughout the main period of European settlement in New Zealand, which lasted from 1850 to 1880, the rate of population growth was very rapid. The 1858 Census recorded 115,462 inhabitants of whom one-half were Maoris. At the 1886 Census the population had reached 620,487, though the Maori population had in the meantime fallen from 56,049 to 43,927.
Thereafter, as the wave of immigration subsided, the rate of growth slowed down. The average annual increase has varied between 0.8 and 2.8 percent, with low rates during the depression periods of 1886-1891 and 1929-1936, and also during the two World Wars. In the last 20 years the annual rate of growth has been over 2 percent a year. The lower birth rate since 1964 could result in a reduction of the rate of growth, but it is still likely to be about 2 percent a year.
During the present century, natural increase has been the principal element in the growth of population; and in the following table the natural increase of non-Maoris is given.
| Period | Births | Deaths | Natural Increase |
|---|---|---|---|
| (000) | |||
| 1901-1905 | 109.4 | 40.7 | 68.7 |
| 1906-1910 | 127.8 | 46.0 | 81.7 |
| 1911-1915 | 138.0 | 49.0 | 89.0 |
| 1916-1920 | 137.0 | 60.4 | 76.6 |
| 1921-1925 | 141.7 | 55.0 | 86.7 |
| 1926-1930 | 137.1 | 59.8 | 77.3 |
| 1931-1935 | 124.1 | 60.2 | 64.0 |
| 1936-1940 | 139.7 | 69.9 | 69.8 |
| 1941-1945 | 169.6 | 78.4 | 91.2 |
| 1946-1950 | 219.2 | 80.5 | 138.6 |
| 1951-1955 | 235.8 | 87.6 | 148.3 |
| 1956-1960 | 266.2 | 96.2 | 170.1 |
| 1961-1965 | 278.5 | 105.8 | 172.6 |
| 1966 | 60.2 | 23.8 | 36.4 |
| Totals 1901-1966 | 2,284.4 | 913.3 | 1,371.1 |
A comparable table for the Maori population is not available but the following table shows the inter-censal increases in the Maori population. Since the Maori birth rate has exceeded that of the population of European origin very considerably, while the death rate has fallen, the natural increase of Maoris has made an increasingly important contribution to the growth of the total population.
| Period | Increase |
|---|---|
| (000) | |
| 1901-1906 | 4.8 |
| 1906-1911 | 2.4 |
| 1911-1916 | 0.3 |
| 1916-1921 | 4.0 |
| 1921-1926 | 6.7 |
| 1926-1936 | 18.7 |
| 1936-1945 | 16.4 |
| 1945-1951 | 16.9 |
| 1951-1956 | 21.5 |
| 1956-1961 | 29.9 |
| 1961-1966 | 34.1 |
| Total 1901-1966 | 155.6 |
The other element in the population growth—the gains from external migration—is shown in the following table. Movements of the armed forces are not included.
| Calendar Years | Migration Gain |
|---|---|
*Excess of departures. | |
| (000) | |
| 1901-1905 | 45.4 |
| 1906-1910 | 41.0 |
| 1911-1915 | 35.6 |
| 1916-1920 | 14.9 |
| 1921-1925 | 50.1 |
| 1926-1930 | 24.6 |
| 1931-1935 | -9.9* |
| 1936-1940 | 12.4 |
| 1941-1945 | 2.1 |
| 1946-1950 | 32.6 |
| 1951-1955 | 69.1 |
| 1956-1960 | 44.3 |
| 1961-1965 | 70.3 |
| 1966 | 13.3 |
| Total 1901-1966 | 445.8 |
Most of the inward migration has been from the United Kingdom, Australia, and the Netherlands.
CENSUS STATISTICS—Population statistics are based primarily on the five-yearly population census. Intercensal population estimates are based on the most recent census data available, adjusted in accordance with later figures of births, deaths, and migration. Estimates of the populations of particular localities, e.g., cities and boroughs, also take into account local economic developments, housing schemes, the numbers on school rolls, changes in boundaries, and any other factors leading to, or indicating, changes in population.
The basis adopted for the population census, and virtually throughout population statistics in New Zealand, is that of population physically present in the place of enumeration at the time of enumeration.
All references to New Zealand relate solely to geographic New Zealand, i.e., island territories are omitted except where their inclusion is specifically stated. Though Niue Island and Tokelau Islands are constitutionally part of New Zealand, for geographical reasons they are administered separately. The Cook Islands are self-governing but the islanders are New Zealand citizens.
Maoris are included in all population data unless the contrary is stated.
PRESENT POPULATION—At the census of population taken on 18 April 1961, the population of New Zealand, excluding island territories, was 2,414,984; by the latest census on 22 March 1966 the population had risen to 2,676,919.
The following table gives a summary of New Zealand population.
| Territory | Date | Males | Females | Total |
|---|---|---|---|---|
*Includes population of the inhabited
minor islands, †Includes 250 United States personnel stationed in Antarctic. | ||||
| New Zealand* | ||||
| (a) Exclusive of island territories: | ||||
| Total population | 22 March 1966 | 1,343,743 | 1,333,176 | 2,676,919 |
| Maoris (included above) | 22 March 1966 | 102,107 | 99,052 | 201,159 |
| (b) Island territories: | ||||
| Tokelau Islands | 24 September 1966 | 892 | 1,008 | 1,900 |
| Niue Island | 31 December 1966 | 2,537 | 2,654 | 5,191 |
| (c) Cook Islands | 1 September 1966 | 9,741 | 9,510 | 19,251 |
| (d) Ross Dependency† | 22 March 1966 | 262 | — | 262 |
INCREASE OF POPULATION—The growth of population has been substantial in each intercensal period. The lowest rates are those of 1926-36, which included some years of economic depression, and of 1936-45, which included six years of international war.
| Date of Census | Total Population | Intercensal Numerical Increase | Intercensal Percentage Increase | Average Annual Percentage Increase |
|---|---|---|---|---|
*Excludes New Zealand armed forces
personnel overseas; numbers of armed forces †Includes New Zealand armed forces personnel overseas. | ||||
| March 1901* | 815,853 | 72,646 | 9.8 | 1.9 |
| April 1906 | 936,304 | 120,451 | 14.8 | 2.8 |
| April 1911 | 1,058,308 | 122,004 | 13.0 | 2.5 |
| October 1916* | 1,149,225 | 90,917 | 8.6 | 1.5 |
| April 1921 | 1,271,664 | 122,439 | 10.7 | 2.3 |
| April 1926 | 1,408,139 | 136,475 | 10.7 | 2.1 |
| March 1936 | 1,573,810 | 165,671 | 11.8 | 1.1 |
| September 1945* | 1,702,298 | 128,488 | 8.2 | 0.8 |
| September 1945† | 1,747,679 | 173,869 | 11.0 | 1.1 |
| April 1951* | 1,939,472 | 237,174 | 13.9 | 2.4 |
| April 1951† | 1,941,366 | 193,687 | 11.1 | 1.9 |
| April 1956* | 2,174,062 | 234,590 | 12.1 | 2.3 |
| April 1956† | 2,176,224 | 234,858 | 12.1 | 2.3 |
| April 1961* | 2,414,984 | 240,922 | 11.1 | 2.1 |
| April 1961† | 2,417,543 | 241,319 | 11.1 | 2.1 |
| March 1966* | 2,676,919 | 261,935 | 10.8 | 2.1 |
| March 1966† | 2,678,855 | 261,312 | 10.8 | 2.1 |
Population estimates for years between Censuses are given in the first table in the Statistical Summary towards the end of this Yearbook.
COMPARISON WITH OTHER COUNTRIES—The annual average percentage increases of population are given in the following table for certain selected countries.
| Country | Period | Average Annual Percentage Increase |
|---|---|---|
| New Zealand | 1961-66 | 2.1 |
| Australia | 1958-64 | 2.1 |
| Canada | 1958-64 | 2.0 |
| Ceylon | 1958-64 | 2.6 |
| England and Wales | 1958-64 | 0.8 |
| Scotland | 1958-64 | 0.1 |
| Northern Ireland | 1958-64 | 0.7 |
| Republic of Ireland | 1956-61 | -0.6 |
| Austria | 1958-64 | 0.5 |
| Denmark | 1958-64 | 0.7 |
| France | 1958-64 | 1.3 |
| Germany, West | 1958-64 | 1.3 |
| Hungary | 1958-64 | 0.4 |
| India | 1958-64 | 2.3 |
| Japan | 1958-64 | 1.0 |
| Netherlands | 1958-64 | 1.4 |
| Pakistan | 1958-64 | 2.1 |
| South Africa | 1958-64 | 2.4 |
| Sweden | 1958-64 | 0.6 |
| Switzerland | 1958-64 | 2.1 |
| Thailand | 1958-64 | 3.0 |
| United States of America | 1958-64 | 1.6 |
POPULATION PROJECTIONS—An indication of future population growth, including Maoris, in New Zealand is given by the detailed projections for the period 1967-90.
Projections of future population involve an element of uncertainty owing to incomplete knowledge of the factors underlying changes in fertility, mortality, and migration levels, coupled with the difficulty of accurately forecasting the future course of the factors which are known to affect these components of population change. It should be understood, therefore, that these projections merely show the effect of the assumptions stated below the table on the future growth of the existing population. The assumptions, however, have been adopted only after careful studies of trends in the patterns of fertility, mortality, and migration and, in the light of available current information, are regarded as those most likely to produce realistic projections over the length of the projection period.
| PROJECTED NEW ZEALAND POPULATION | ||||||
|---|---|---|---|---|---|---|
| As at 31 December | Assuming Net Immigration of | |||||
| 10,000 per Year | 15,000 per Year | |||||
| Males | Females | Total | Males | Females | Total | |
| (thousand) | ||||||
| 1966 (Base) | 1,361 | 1,351 | 2,712 | 1,361 | 1,351 | 2,712 |
| 1967 | 1,387 | 1,376 | 2,763 | 1,390 | 1,379 | 2,769 |
| 1968 | 1,414 | 1,402 | 2,816 | 1,419 | 1,407 | 2,826 |
| 1969 | 1,441 | 1,429 | 2,870 | 1,450 | 1,437 | 2,887 |
| 1970 | 1,470 | 1,457 | 2,927 | 1,483 | 1,468 | 2,951 |
| 1971 | 1,500 | 1,486 | 2,986 | 1,516 | 1,499 | 3,015 |
| 1972 | 1,532 | 1,515 | 3,047 | 1,549 | 1,532 | 3,081 |
| 1973 | 1,564 | 1,547 | 3,111 | 1,584 | 1,566 | 3,150 |
| 1974 | 1,596 | 1,580 | 3,176 | 1,620 | 1,601 | 3,221 |
| 1975 | 1,631 | 1,613 | 3,244 | 1,657 | 1,637 | 3,294 |
| 1976 | 1,667 | 1,647 | 3,314 | 1,696 | 1,673 | 3,369 |
| 1977 | 1,702 | 1,682 | 3,384 | 1,736 | 1,712 | 3,448 |
| 1978 | 1,739 | 1,718 | 3,457 | 1,775 | 1,751 | 3,526 |
| 1979 | 1,777 | 1,755 | 3,532 | 1,817 | 1,791 | 3,608 |
| 1980 | 1,816 | 1,792 | 3,608 | 1,859 | 1,831 | 3,690 |
| 1981 | 1,855 | 1,831 | 3,686 | 1,902 | 1,872 | 3,774 |
| 1982 | 1,896 | 1,871 | 3,767 | 1,946 | 1,915 | 3,861 |
| 1983 | 1,938 | 1,912 | 3,850 | 1,991 | 1,959 | 3,950 |
| 1984 | 1,979 | 1,953 | 3,932 | 2,036 | 2,003 | 4,039 |
| 1985 | 2,022 | 1,994 | 4,016 | 2,083 | 2,047 | 4,130 |
| 1986 | 2,065 | 2,035 | 4,100 | 2,130 | 2,093 | 4,223 |
| 1987 | 2,109 | 2,078 | 4,187 | 2,176 | 2,139 | 4,315 |
| 1988 | 2,152 | 2,121 | 4,273 | 2,225 | 2,185 | 4,410 |
| 1989 | 2,198 | 2,165 | 4,363 | 2,273 | 2,232 | 4,505 |
| 1990 | 2,243 | 2,209 | 4,452 | 2,323 | 2,281 | 4,604 |
Assumptions—The two projections are linked to actual population numbers as at 31 December 1966. The assumptions on which the projections depend are as follows:
The estimated average 1965 specific age-of-mother and marital status birth-rates continue.
Future age-specific mortality rates will continue in accordance with the New Zealand Life Tables, 1955-57.
The following diagram presented on a ratio scale shows the growth of actual population from 1880 to 1966 and projections through to 1990.
DISTRIBUTION OF POPULATION—Detailed population statistics are compiled for each census. Final figures for statistical areas, urban areas, counties, cities, boroughs, town districts, county towns, extra-county islands, and shipping are published in Volume 1, Increase and Location of Population, of the Census of Population and Dwellings.
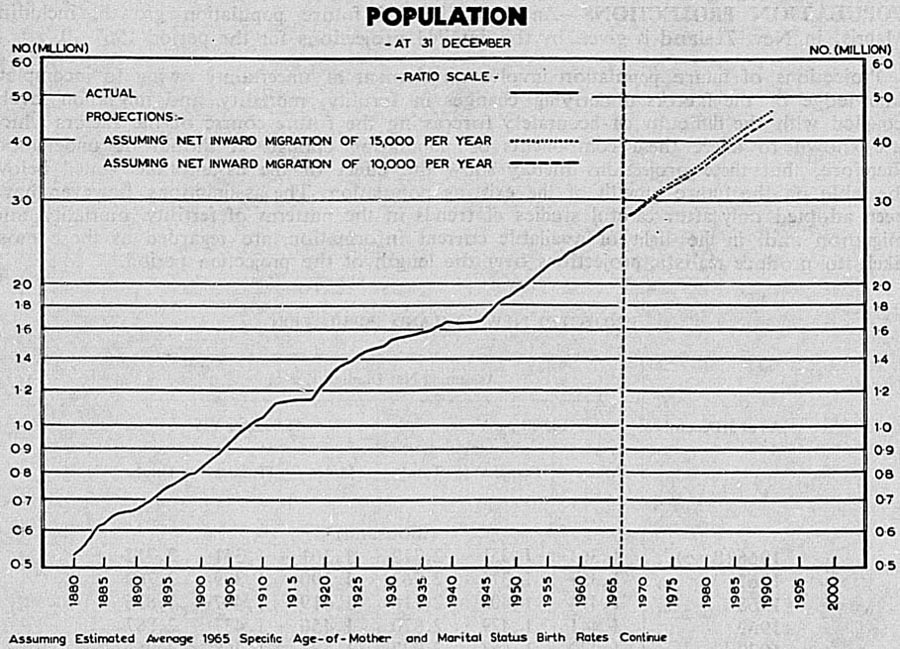
North and South Islands—In 1858 the North Island had a larger population than the South, but this position was reversed at the succeeding enumeration, and the South Island had the larger population (exclusive of Maoris) at each census from 1861 to 1896. In 1901 the North Island was found to have slightly the larger total and since then has steadily increased its lead.
The following table gives the population, excluding Maoris, of the North and South Islands as disclosed by each census since 1901.
| Census Year | Population (Excluding Maoris) | Percentages | |||
|---|---|---|---|---|---|
| North Island | South Island | Total | North Island | South Island | |
| 1901 | 388,626 | 381,678 | 770,304 | 50.5 | 49.5 |
| 1906 | 474,605 | 411,390 | 885,995 | 53.6 | 46.4 |
| 1911 | 561,281 | 444,304 | 1,005,585 | 55.8 | 44.2 |
| 1916 | 648,439 | 447,789 | 1,096,228 | 59.2 | 40.8 |
| 1921 | 741,255 | 477,658 | 1,218,913 | 60.8 | 39.2 |
| 1926 | 831,813 | 512,656 | 1,344,469 | 61.9 | 38.1 |
| 1936 | 938,939 | 552,545 | 1,491,484 | 63.0 | 37.0 |
| 1945 | 1,050,984 | 552,570 | 1,603,554 | 65.5 | 34.5 |
| 1951 | 1,202,357 | 621,439 | 1,823,796 | 65.9 | 34.1 |
| 1956 | 1,365,470 | 671,441 | 2,036,911 | 67.0 | 33.0 |
| 1961 | 1,524,839 | 723,059 | 2,247,898 | 67.8 | 32.2 |
| 1966 | 1,702,802 | 772,958 | 2,475,760 | 68.8 | 31.2 |
The population of the North Island increased at a greater proportionate rate than that of the South Island between the 1961 and 1966 censuses. At the 1966 census the North Island population was 1,893,326, including 190,524 Maoris, and the South Island population 783,593, inclusive of 10,635 Maoris. The increase since the 1961 census was 208,541 for the North Island and 53,394 for the South Island.
The natural increase of population (i.e., excess of births over deaths) for the North Island during the 1961-66 intercensal period was 152,942, and for the South Island the natural increase was 48,312. External migration has also added to the population and there has been population movement between the islands.
Statistical Areas—The boundaries of statistical areas are shown on the map inside the back cover. Northland comprises the northern counties from Mangonui to Otamatea; central Auckland, the counties from Rodney to Franklin (including islands in the Hauraki Gulf); East Coast, the area north of Wairoa; while South Auckland-Bay of Plenty comprises the remainder of the provincial district. Hawke's Bay, Taranaki, and Wellington statistical areas are the same as the provincial districts of the same names.
In the South Island the statistical areas coincide with the provincial district boundaries, except for the transfer of Amuri and Cheviot counties from Nelson to Canterbury, and the transfer of all that area of Grey county north of Grey River from Nelson to Westland.
In the following table the approximate areas and the populations as at the census of March 1966 of the statistical areas are shown.
| Statistical Area | Area (Square Miles) | Total Population Census (18 April 1961) | Total Population Census 22 March 1966 |
|---|---|---|---|
| Northland | 4,880 | 86,391 | 93,514 |
| Central Auckland | 2,150 | 514,507 | 613,671 |
| South Auckland— | |||
| Bay of Plenty | 14,187 | 349,624 | 389,334 |
| East Coast | 4,200 | 46,478 | 46,988 |
| Hawke's Bay | 4,260 | 114,470 | 124,960 |
| Taranaki | 3,750 | 99,774 | 101,104 |
| Wellington | 10,870 | 473,541 | 523,755 |
| Totals North Island | 44,297 | 1,684,785 | 1,893,326 |
| Marlborough | 4,220 | 27,748 | 29,428 |
| Nelson | 6,910 | 62,967 | 67,208 |
| Westland | 6,010 | 24,841 | 24,353 |
| Canterbury | 16,769 | 344,597 | 376,441 |
| Otago | 14,070 | 176,325 | 183,477 |
| Southland | 11,460 | 93,721 | 102,686 |
| Totals South Island | 59,439 | 730,199 | 783,593 |
| Totals New Zealand | 103,736 | 2,414,984 | 2,676,919 |
Urban Areas—Urban areas are statistical conceptions and not administrative units. Their purpose is to provide definite, stable, and comparable boundaries for the larger centres of population. In addition to the central city or borough, they include neighbouring boroughs and town districts and parts of counties which are regarded as suburban to the centre of population. The present boundaries of urban areas have been in use since 1951.
For the 1961 Census, three new urban areas were defined at Whangarei, Tauranga, and Rotorua and comparable figures have been compiled for past years.
In the following table statistics of urban areas are given; 62.5 percent of the population lived in these areas in 1966.
| Urban Area | Total Population | Increase 1961-66 | ||||
|---|---|---|---|---|---|---|
| 1951 | 1956 | 1961 | 1966 | Numerical | Percentage | |
| Whangarei | 15,431 | 18,369 | 21,790 | 29,503 | 7,713 | 35.4 |
| Auckland | 329,123 | 381,063 | 448,365 | 548,293 | 99,928 | 22.3 |
| Hamilton | 33,137 | 40,646 | 50,505 | 63,303 | 12,798 | 25.3 |
| Tauranga | 13,010 | 18,724 | 24,659 | 31,606 | 6,947 | 28.2 |
| Rotorua | 14,693 | 19,004 | 25,068 | 33,229 | 8,161 | 32.6 |
| Gisborne | 19,774 | 22,622 | 25,065 | 27,804 | 2,739 | 10.9 |
| Napier | 24,538 | 27,507 | 32,716 | 38,309 | 5,593 | 17.1 |
| Hastings | 23,797 | 27,787 | 32,490 | 37,466 | 4,976 | 15.3 |
| New Plymouth | 24,923 | 28,292 | 32,387 | 35,280 | 2,893 | 8.9 |
| Wanganui | 29,717 | 32,100 | 35,694 | 38,174 | 2,480 | 6.9 |
| Palmerston North | 32,908 | 37,775 | 43,185 | 49,140 | 5,955 | 13.8 |
| Hutt | 74,878 | 86,053 | 98,988 | 114,628 | 15,640 | 15.8 |
| Wellington | 133,414 | 138,297 | 150,544 | 167,859 | 17,315 | 11.5 |
| Nelson | 20,497 | 22,503 | 25,321 | 27,615 | 2,294 | 9.1 |
| Christchurch | 174,221 | 193,367 | 220,510 | 247,248 | 26,738 | 12.1 |
| Timaru | 22,851 | 24,694 | 26,424 | 27,946 | 1,522 | 5.8 |
| Dunedin | 95,457 | 99,370 | 105,003 | 108,734 | 3,731 | 3.6 |
| Invercargill | 31,613 | 35,107 | 41,088 | 46,016 | 4,928 | 12.0 |
| Totals | 1,113,982 | 1,253,280 | 1,439,802 | 1,672,153 | 232,351 | 16.1 |
In the years 1961-66 Auckland urban area had the greatest numerical growth, while Whangarei, Rotorua, Tauranga, and Hamilton had the highest proportionate increases. Dunedin urban area had the lowest percentage increase (3.6 percent).
In the next table the component parts of the five largest centres of population are given in detail.
| Urban Area | 1966 Census 22 March |
|---|---|
*Proclaimed a city on 28 May 1966. | |
| Auckland | |
| Auckland city | 149,989 |
| East Coast Bays borough | 12,357 |
| Takapuna city | 23,098 |
| Devonport borough | 11,092 |
| Northcote borough | 8,144 |
| Birkenhead borough | 11,388 |
| Henderson borough | 5,604 |
| Glen Eden borough | 6,045 |
| New Lynn borough | 9,957 |
| Newmarket borough | 1,334 |
| Mt. Albert borough | 25,721 |
| Mt. Eden borough | 18,392 |
| Mt. Roskill borough | 33,472 |
| Onehunga borough | 16,238 |
| One Tree Hill borough | 12,905 |
| Ellerslie borough | 4,284 |
| Mt. Wellington borough | 18,857 |
| Howick borough | 9,189 |
| Otahuhu borough | 9,821 |
| Papatoetoe city | 20,576 |
| Manukau city | 73,218 |
| Papakura borough | 11,278 |
| Remainder of urban area | 55,334 |
| Total | 548,293 |
| Hutt | |
| Lower Hutt city | 57,403 |
| Upper Hutt borough* | 19,084 |
| Petone borough | 10,143 |
| Eastbourne borough | 4,545 |
| Remainder of urban area | 23,453 |
| Total | 114,628 |
| Wellington | |
| Wellington city | 131,655 |
| Tawa borough | 9,852 |
| Porirua city | 22,190 |
| Remainder of urban area | 4,162 |
| Total | 167,859 |
| Christchurch | |
| Christchurch city | 161,566 |
| Riccarton borough | 7,253 |
| Lyttelton borough | 3,493 |
| Heathcote county | 7,119 |
| Remainder of urban area | 67,817 |
| Total | 247,248 |
| Dunedin | |
| Dunedin city | 77,149 |
| Port Chalmers borough | 3,071 |
| St. Kilda borough | 6,726 |
| Green Island borough | 5,849 |
| Mosgiel borough | 7,488 |
| Remainder of urban area | 8,451 |
| Total | 108,734 |
Cities and Boroughs—The population of cities and boroughs is now given.
| Borough | 1966 Census 22 March | Approximate Area, in Acres |
|---|---|---|
*Proclaimed a city 28 May 1966. | ||
| North Island: | ||
| Kaitaia | 3,056 | 1,310 |
| Kaikohe | 3,134 | 1,345 |
| Whangarei (city) | 27,560 | 6,510 |
| Dargaville | 3,902 | 2,800 |
| Helensville | 1,305 | 1,315 |
| East Coast Bays | 12,357 | 3,850 |
| Takapuna (city) | 23,098 | 3,280 |
| Devonport | 11,092 | 1,100 |
| Northcote | 8,144 | 1,196 |
| Birkenhead | 11,388 | 3,084 |
| Henderson | 5,604 | 1,278 |
| Glen Eden | 6,045 | 1,244 |
| New Lynn | 9,957 | 1,393 |
| Auckland (city) | 149,989 | 18,498 |
| Newmarket | 1,334 | 182 |
| Mt Albert | 25,721 | 2,430 |
| Mt. Eden | 18,392 | 1,477 |
| Mt. Roskill | 33,472 | 4,604 |
| Onehunga | 16,238 | 1,878 |
| One Tree Hill | 12,905 | 2,430 |
| Ellerslie | 4,284 | 745 |
| Mt. Wellington | 18,857 | 4,075 |
| Howick | 9,189 | 1,534 |
| Otahuhu | 9,821 | 1,345 |
| Papatoetoe (city) | 20,576 | 2,241 |
| Manukau (city) | 73,218 | 1,680 |
| Papakura | 11,278 | 2,022 |
| Pukekohe | 6,547 | 3,471 |
| Waiuku | 1,759 | 1,465 |
| Tuakau | 1,677 | 1,091 |
| Huntly | 5,401 | 1,941 |
| Cambridge | 5,962 | 2,646 |
| Ngaruawahia | 3,769 | 1,112 |
| Hamilton (city) | 63,000 | 13,726 |
| Te Awamutu | 6,719 | 1,762 |
| Otorohanga | 1,951 | 560 |
| Te Kuiti | 4,825 | 1,668 |
| Taumarunui | 5,864 | 3,234 |
| Thames | 5,599 | 2,712 |
| Paeroa | 3,129 | 1,419 |
| Waihi | 3,169 | 1,330 |
| Te Aroha | 3,212 | 2,783 |
| Morrinsville | 4,497 | 1,177 |
| Matamata | 3,810 | 934 |
| Putaruru | 4,435 | 975 |
| Mt. Maunganui | 6,815 | 3,475 |
| Tauranga (city) | 23,390 | 6,576 |
| Te Puke | 2,601 | 1,047 |
| Rotorua (city) | 25,978 | 6,557 |
| Taupo | 7,311 | 2,501 |
| Whakatane | 8,637 | 1,975 |
| Kawerau | 5,826 | 1,818 |
| Murupara | 2,670 | 710 |
| Opotiki | 2,588 | 772 |
| Gisborne (city) | 24,939 | 4,014 |
| Wairoa | 5,100 | 1,603 |
| Napier (city) | 28,645 | 4,361 |
| Taradale | 6,253 | 1,003 |
| Hastings (city) | 26,867 | 4,222 |
| Havelock North | 5,472 | 1,165 |
| Waipawa | 1,848 | 1,710 |
| Waipukurau | 3,569 | 971 |
| Dannevirke | 5,728 | 1,300 |
| Woodville | 1,529 | 1,054 |
| Waitara | 4,790 | 1,587 |
| New Plymouth (city) | 31,843 | 5,722 |
| Inglewood | 2,003 | 703 |
| Stratford | 5,441 | 2,016 |
| Eltham | 2,319 | 1,599 |
| Hawera | 8,142 | 1,270 |
| Patea | 2,013 | 1,420 |
| Ohakune | 1,458 | 2,079 |
| Raetihi | 1,376 | 958 |
| Wanganui (city) | 35,629 | 6,383 |
| Taihape | 2,861 | 1,923 |
| Marion | 4,731 | 1,415 |
| Feilding | 9,031 | 2,031 |
| Foxton | 2,819 | 757 |
| Palmerston N. (city) | 46,832 | 7,190 |
| Shannon | 1,544 | 844 |
| Levin | 11,402 | 2,167 |
| Otaki | 3,573 | 1,639 |
| Porirua (city) | 22,190 | 8,226 |
| Upper Hutt (city)* | 19,084 | 2,165 |
| Lower Hutt (city) | 57,403 | 11,004 |
| Petone | 10,143 | 2,575 |
| Eastbourne | 4,545 | 1,546 |
| Tawa | 9,852 | 1,208 |
| Wellington (city) | 131,655 | 18,329 |
| Pahiatua | 2,597 | 720 |
| Eketahuna | 755 | 948 |
| Masterton | 17,596 | 3,536 |
| Carterton | 3,536 | 1,265 |
| Greytown | 1,715 | 1,093 |
| Featherston | 1,857 | 759 |
| Martinborough | 1,462 | 1,070 |
| Totals, North Island cities and boroughs | 1,325,204 | 261,833 |
| South Island: | ||
| Picton | 2,560 | 1,052 |
| Blenheim | 13,242 | 2,502 |
| Nelson (city) | 26,218 | 8,419 |
| Richmond | 4,574 | 2,600 |
| Motueka | 3,748 | 2,523 |
| Westport | 5,271 | 760 |
| Runanga | 1,683 | 1,204 |
| Greymouth | 8,654 | 2,594 |
| Brunner | 932 | 5,700 |
| Kumara | 379 | 842 |
| Hokitika | 3,258 | 674 |
| Ross | 436 | 3,800 |
| Rangiora | 4,117 | 877 |
| Kaiapoi | 3,528 | 786 |
| Riccarton | 7,253 | 728 |
| Christchurch (city) | 161,566 | 26,178 |
| Lyttelton | 3,493 | 2,560 |
| Ashburton | 12,672 | 2,601 |
| Geraldine | 1,876 | 745 |
| Temuka | 2,703 | 795 |
| Timaru (city) | 27,314 | 4,325 |
| Waimate | 3,300 | 771 |
| Oamaru | 13,186 | 2,836 |
| Hampden | 260 | 630 |
| Palmerston | 826 | 900 |
| Waikouaiti | 761 | 1,958 |
| Port Chalmers | 3,071 | 1,012 |
| Dunedin (city) | 77,149 | 15,473 |
| St. Kilda | 6,726 | 616 |
| Green Island | 5,849 | 1,818 |
| Mosgiel | 7,488 | 970 |
| Milton | 1,861 | 315 |
| Kaitangata | 1,208 | 1,280 |
| Balclutha | 4,419 | 1,258 |
| Tapanui | 844 | 300 |
| Lawrence | 520 | 615 |
| Roxburgh | 754 | 515 |
| Naseby | 120 | 188 |
| Alexandra | 2,979 | 1,116 |
| Cromwell | 1,062 | 972 |
| Arrowtown | 186 | 457 |
| Queenstown | 1,634 | 998 |
| Gore | 8,104 | 2,338 |
| Mataura | 2,629 | 1,272 |
| Winton | 1,740 | 570 |
| Invercargill (city) | 43,572 | 10,489 |
| Bluff | 3,279 | 2,141 |
| Riverton | 1,258 | 997 |
| Totals, South Island cities and boroughs | 490,262 | 125,070 |
| Grand totals, all cities and boroughs | 1,815,466 | 386,903 |
Town Districts—The population of independent town districts—i.e., those contained in section (a) of the following table—is not included with that of the county in which the town district is located, but the population of dependent town districts—section (b)—is included in that of the respective parent county.
| Town District | 1966 Census 22 March | Approximate Area, in Acres |
|---|---|---|
*Parent county shown in parentheses. | ||
| (a) Town Districts not forming parts of Counties | ||
| North Island: | ||
| Kawakawa | 1,032 | 280 |
| Hikurangi | 1,091 | 960 |
| Warkworth | 1,200 | 1,427 |
| Ohura | 648 | 815 |
| Manunui | 959 | 1,251 |
| Manaia | 907 | 510 |
| Waverley | 1,062 | 499 |
| Hunterville | 597 | 791 |
| Totals, North Island | 7,496 | 6,533 |
| South Island: | ||
| Wyndham | 780 | 680 |
| Nightcaps | 604 | 285 |
| Otautau | 823 | 490 |
| Totals, South Island | 2,207 | 1,455 |
| Grand totals | 9,703 | 7,988 |
| (b) Town Districts forming parts of Counties* | ||
| North Island: | ||
| Russell (Bay of Islands) | 618 | 1,066 |
| Te Kauwhata (Waikato) | 738 | 1,290 |
| Ohaupo (Waipa) | 363 | 1,281 |
| Kihikihi (Waipa) | 1,237 | 523 |
| Patutahi (Cook) | 298 | 1,275 |
| Kaponga (Eltham) | 500 | 558 |
| Totals, North Island | 3,754 | 5,993 |
| South Island: | ||
| Edendale (Southland) | 596 | 696 |
| Totals, South Island | 596 | 696 |
| Grand totals | 4,350 | 6,689 |
County Towns—The following table lists those county towns with populations of 1,000 or more at the time of the 1966 census. The parent county is shown in parentheses. The populations of county towns are included in the administrative county populations given previously.
| County Town | Total Population 22 March 1966 | Approximate Area, in Acres |
|---|---|---|
| North Island | ||
| Moerewa (Bay of Islands) | 1,090 | 121 |
| Wellsford (Rodney) | 1,431 | 1,368 |
| Glenfield (Waitemata) | 13,335 | 4,642 |
| Kelston West (Waitemata) | 4,937 | 974 |
| Green Bay (Waitemata) | 2,022 | 471 |
| Titirangi (Waitemata) | 5,568 | 2,299 |
| Orewa (Waitemata) | 1,357 | 915 |
| Raglan (Raglan) | 1,019 | 919 |
| Tokoroa (Matamata) | 11,229 | 1,057 |
| Katikati (Tauranga) | 1,124 | 2,046 |
| Ngongotaha (Rotorua) | 1,994 | 1,242 |
| Mangakino (Taupo) | 1,466 | 644 |
| Edgecumbe (Whakatane) | 1,277 | 274 |
| Bulls (Rangitikei) | 1,803 | 995 |
| Waikanae (Horowhenua) | 1,570 | 2,418 |
| Paekakariki (Hutt) | 1,934 | 1,518 |
| Pukerua Bay (Hutt) | 1,220 | 2,062 |
| Plimmerton-Paremata (Hutt) | 3,774 | 2,651 |
| Wainuiomata (Hutt) | 13,948 | 67,000 |
| Heretaunga-Pinehaven (Hutt) | 4,539 | 12,815 |
| South Island | ||
| Kaikoura (Kaikoura) | 1,571 | 700 |
| Hornby (Paparua) | 6,484 | 1,214 |
| Sockburn (Paparua) | 5,529 | 2,673 |
| Fairfield (Taieri) | 1,106 | 330 |
Extra-county Islands and Shipboard Population—In addition to the populations quoted for administrative counties, cities and boroughs, and independent town districts, the New Zealand totals include shipboard population and persons located on islands not within the boundaries of any county. The two latter categories comprised a total of 7,339 people as at 22 March 1966.
Of the islands concerned, Waiheke, with a population of 2,013, was the only one of any size.
Counties—The following table gives the population of individual counties at 22 March 1966, together with the approximate area of each. It should be noted that "Administrative Counties'' do not include boroughs or town districts independent of county control, but include town districts and county towns which form parts of counties.
| Administrative County | 1966 Census 22 March | Approximate Area, in Square Miles |
|---|---|---|
| North Island: | ||
| Mangonui | 7,058 | 958 |
| Whangaroa | 2,076 | 240 |
| Hokianga | 4,826 | 613 |
| Bay of Islands | 12,971 | 823 |
| Whangarei | 14,192 | 1,039 |
| Hobson | 5,794 | 745 |
| Otamatea | 6,507 | 421 |
| Rodney | 7,113 | 477 |
| Waitemata | 79,215 | 600 |
| Great Barrier Is. | 272 | 110 |
| Franklin | 18,316 | 551 |
| Raglan | 10,226 | 931 |
| Waikato | 15,488 | 639 |
| Waipa | 15,368 | 436 |
| Otorohanga | 8,098 | 762 |
| Waitomo | 7,760 | 1,297 |
| Taumarunui | 7,473 | 1,873 |
| Coromandel | 3,004 | 439 |
| Thames | 3,579 | 419 |
| Hauraki Plains | 5,676 | 233 |
| Ohinemuri | 4,141 | 241 |
| Piako | 12,092 | 451 |
| Matamata | 26,411 | 987 |
| Tauranga | 15,627 | 711 |
| Rotorua | 16,257 | 1,035 |
| Taupo | 11,341 | 2,852 |
| Whakatane | 16,725 | 1,536 |
| Opotiki | 4,562 | 1,339 |
| Waiapu | 5,861 | 1,063 |
| Waikohu | 3,302 | 1,022 |
| Cook | 10,076 | 1,110 |
| Wairoa | 6,613 | 1,530 |
| Hawke's Bay | 20,909 | 1,872 |
| Waipawa | 3,787 | 520 |
| Patangata | 3,343 | 655 |
| Waipukurau | 1,345 | 128 |
| Dannevirke | 4,317 | 546 |
| Woodville | 1,652 | 156 |
| Clifton | 2,335 | 454 |
| Taranaki | 8,080 | 227 |
| Inglewood | 3,160 | 201 |
| Stratford | 5,655 | 833 |
| Egmont | 6,167 | 240 |
| Eltham | 3,357 | 207 |
| Waimate West | 2,675 | 83 |
| Hawera | 4,937 | 190 |
| Patea | 3,298 | 591 |
| Waimarino | 1,888 | 829 |
| Waitotara | 3,355 | 468 |
| Wanganui | 3,168 | 460 |
| Rangitikei | 15,132 | 1,730 |
| Kiwitea | 2,215 | 359 |
| Pohangina | 1,082 | 259 |
| Oroua | 4,601 | 190 |
| Manawatu | 6,852 | 265 |
| Kairanga | 6,446 | 184 |
| Horowhenua | 10,143 | 542 |
| Hutt | 41,284 | 527 |
| Pahiatua | 2,550 | 286 |
| Akitio | 1,034 | 321 |
| Eketahuna | 1,671 | 318 |
| Masterton | 4,236 | 808 |
| Wairarapa South | 2,729 | 440 |
| Featherston | 3,453 | 954 |
| Totals, North Is. counties | 554,876 | 43,328 |
| South Island: | ||
| Marlborough | 8,941 | 1,946 |
| Awatere | 1,805 | 1,030 |
| Kaikoura | 3,086 | 905 |
| Golden Bay | 3,585 | 1,011 |
| Waimea | 16,888 | 2,905 |
| Buller | 3,676 | 1,885 |
| Inangahua | 2,859 | 942 |
| Grey | 4,278 | 1,579 |
| Westland | 4,733 | 4,410 |
| Amuri | 2,940 | 2,285 |
| Cheviot | 1,526 | 327 |
| Waipara | 2,962 | 937 |
| Kowai | 2,239 | 157 |
| Ashley | 605 | 309 |
| Rangiora | 4,008 | 96 |
| Eyre | 2,240 | 175 |
| Oxford | 1,521 | 318 |
| Tawera | 710 | 942 |
| Malvern | 5,667 | 980 |
| Paparua | 18,362 | 133 |
| Waimairi | 52,164 | 43 |
| Heathcote | 7,119 | 12 |
| Halswell | 4,314 | 39 |
| Mt. Herbert | 600 | 66 |
| Akaroa | 1,620 | 170 |
| Chatham Islands | 520 | 372 |
| Wairewa | 756 | 170 |
| Ellesmere | 7,151 | 443 |
| Ashburton | 11,617 | 2,367 |
| Geraldine | 5,057 | 774 |
| Levels | 4,797 | 262 |
| Mackenzie | 3,293 | 2,853 |
| Waimate | 5,926 | 1,383 |
| Waitaki | 12,027 | 2,412 |
| Waihemo | 1,042 | 338 |
| Waikouaiti | 3,551 | 316 |
| Peninsula | 3,499 | 40 |
| Taieri | 8,271 | 901 |
| Bruce | 4,001 | 520 |
| Clutha | 6,060 | 1,045 |
| Tuapeka | 4,445 | 1,388 |
| Maniototo | 2,775 | 1,340 |
| Vincent | 4,240 | 2,922 |
| Lake | 2,458 | 3,871 |
| Southland | 27,396 | 3,703 |
| Wallace | 11,176 | 3,728 |
| Fiord | 697 | 3,035 |
| Stewart Island | 332 | 670 |
| Totals, South Island counties | 289,535 | 58,455 |
| Grand totals, all counties | 844,411 | 101,783 |
Most of those counties showing considerable gains of population are adjacent to large cities.
Population Growth and Urbanisation—With the growth in the efficiency of farming, with increased specialisation, and general development of the economy, urban centres have increased rapidly in size and population has tended to concentrate in them; employment opportunities have been provided in secondary and service industries for the expanding labour force. In 1874 two-thirds of the population lived in settlements of less than 500 persons, that is to say on farms or in hamlets. Under a changed classification in 1900, 54 percent were living in counties and the remainder in boroughs. By 1961 only one-quarter of the population lived in rural areas. The following table indicates the urban movement of the total population; the urban population has been defined as urban area population plus that of all boroughs, town districts, townships, and (for 1961 and 1966) county towns with populations of 1,000 or over.
| Census | Urban | Rural | ||
|---|---|---|---|---|
| Number | Percent | Number | Percent | |
| 1926 | 888,585 | 63.4 | 512,416 | 36.6 |
| 1951 | 1,345,292 | 69.6 | 588,302 | 30.4 |
| 1956 | 1,535,951 | 70.8 | 633,663 | 29.2 |
| 1961 | 1,779,754 | 73.9 | 629,665 | 26.1 |
| 1966 | 2,064,574 | 77.3 | 607,534 | 22.7 |
In recent years urbanisation has helped to absorb the increasing Maori population and likewise rapid expansion in the number of Maoris of working age has contributed to economic growth. The following table indicates the urban movement of the Maori population.
| Census | Counties Including Town Districts | Cities and Boroughs | Extra-county Islands and Ships | Total |
|---|---|---|---|---|
| Numbers | ||||
| 1926 | 57,937 | 5,515 | 218 | 63,670 |
| 1936 | 74,419 | 7,731 | 176 | 82,326 |
| 1945 | 82,762 | 15,758 | 224 | 98,744 |
| 1951 | 93,863 | 21,582 | 231 | 115,676 |
| 1956 | 104,545 | 32,351 | 255 | 137,151 |
| 1961 | 111,188 | 55,681 | 217 | 167,086 |
| 1966 | 100,659 | 100,336 | 164 | 201,159 |
| Percentages | ||||
| 1926 | 91.0 | 8.7 | 0.3 | 100.0 |
| 1936 | 90.4 | 9.4 | 0.2 | 100.0 |
| 1945 | 83.8 | 16.0 | 0.2 | 100.0 |
| 1951 | 81.1 | 18.7 | 0.2 | 100.0 |
| 1956 | 76.2 | 23.6 | 0.2 | 100.0 |
| 1961 | 66.6 | 33.3 | 0.1 | 100.0 |
| 1966 | 50·0 | 49·9 | 0·1 | 100·0 |
In the process of urbanisation some cities and areas have grown more quickly than others. Thus the population of 18 principal urban areas rose from 739,243 in 1926 to 1,672,053 in 1966, more than doubling in this period. This tendency towards concentration of population in the largest centres is associated with a drift of population from the south to the north and where the two tendencies reinforce each other, as they do in the case of Auckland, the rate of growth has been very rapid. In the process some towns in the north which were of negligible size in 1926 have now become of major importance. Thus Whangarei, Hamilton, Tauranga, and Rotorua, which had a combined population in 1926 of 37,000, in 1966 comprised 157,641 inhabitants.
The initial reason for the drift to the north lay in the change in emphasis of farming activities in which the development of dairying played an important part, while in the earliest period the major impetus to development had come from the gold rushes and the settlement of open pastoral lands in the South Island. The expansion of dairying in itself called for the development of factory processing facilities at both ends of the productive process, notably fertiliser industries and dairy factories. The more intensive farming of this subsequent period has also resulted in North Island supremacy in sheep raising, with a particular emphasis on the fat lamb market. (In 1886 there were 9.9 million sheep in the South Island and only 5.3 million in the North Island. In 1965 there were 29.6 million sheep in the North and 24.1 million in the South Island.) These farming trends have been reinforced by the growth of forest processing industries in the North Island.
In the larger cities a notable feature of the past 35 years has been a movement of population from the central or "inner'' areas to the perimeter or "outer'' areas as families in decayed areas have moved to State rental houses and as residential units in the city centres have been replaced by shops, offices, places of entertainment, and other commercial or industrial buildings. In recent years there has been an offsetting movement with the building of multi-storey flats in the inner areas.
The distribution of population by size of centres is shown in the following table.
| Size of Centre (City Borough or Town District) | Number of Centres | Percentage of Population in These Centres | ||||||
|---|---|---|---|---|---|---|---|---|
| 1926 | 1956 | 1961 | 1966 | 1926 | 1956 | 1961 | 1966 | |
| 1,000- 2,499 | 63 | 40 | 33 | 29 | 7.5 | 3.0 | 2.3 | 1.7 |
| 2,500- 4,999 | 23 | 47 | 39 | 38 | 6.2 | 7.3 | 5.7 | 5.0 |
| 5,000- 9,999 | 11 | 19 | 29 | 31 | 5.9 | 6.2 | 8.2 | 8.2 |
| 10,000-24,999 | 12 | 19 | 21 | 20 | 13.3 | 13.7 | 15.0 | 12.1 |
| 25,000 or over | 4 | 11 | 12 | 19 | 24.1 | 32.4 | 32.5 | 40.9 |
| Totals | 113 | 136 | 134 | 137 | 57.0 | 62.6 | 63.7 | 67.9 |
In the South Island a higher proportion of the population is rural, that is, outside urban communities, than in the North Island.
SEX PROPORTIONS—The census of 22 March 1966 shows that males outnumber females by 10,567 in the total population. Females per 1,000 males at the last six censuses have been:
*Including armed forces abroad. | |
|---|---|
| 1936 | 970 |
| 1945 | 1,044 |
| 1945* | 991 |
| 1951 | 991 |
| 1951* | 989 |
| 1956 | 989 |
| 1956* | 987 |
| 1961 | 990 |
| 1961* | 988 |
| 1966 | 992 |
There are marked differences in the sex proportions of the population of different parts of New Zealand, depending largely on educational and employment opportunities. The following figures give the number of females per 1,000 males at the Census of 1966.
| Statistical areas | |
| Central Auckland | 1,019 |
| Otago | 1,014 |
| Hawke's Bay | 1,012 |
| Canterbury | 1,011 |
| Nelson | 1,004 |
| East Coast | 992 |
| Wellington | 986 |
| Taranaki | 991 |
| Northland | 942 |
| Marlborough | 953 |
| South Auckland - Bay of Plenty | 960 |
| Southland | 922 |
| Westland | 947 |
| Urban areas | |
| Timaru | 1,103 |
| Gisborne | 1,083 |
| New Plymouth | 1,0181 |
| Dunedin | 1,077 |
| Palmerston North | 1,059 |
| Hastings | 1,085 |
| Napier | 1,052 |
| Whangarei | 1,010 |
| Christchurch | 1,054 |
| Nelson | 1,077 |
| Hamilton | 1,058 |
| Tauranga | 1,045 |
| Wanganui | 1,062 |
| Auckland | 1,032 |
| Wellington | 1,013 |
| Invercargill | 1,019 |
| Rotorua | 1,019 |
| Hutt | 971 |
DENSITY OF POPULATION—Generally speaking, a dense population must depend upon intensive land utilisation or industrialisation. In New Zealand there is a great area of high mountainous country, particularly in the South Island, while there are also large areas of water or of broken, swampy, or hilly country which cannot be closely settled, while the growth of mechanisation in farming tends to reduce the size of the labour force engaged in farming operations. There are factors unfavourable to the growth of industry to a point where dense populations could be supported—not the least of which are a lack of mineral resources, and distance from export markets.
Nevertheless, economic development is providing employment for a growing labour force. More extensive mechanisation, further advances in science and technology, and increases in productivity, wealth, and consumption have paved the way for further specialisation of production and more concentrated urbanisation.
Within New Zealand there are wide variations in density of population. The following table provides comparative density figures on a statistical area basis from 1926 to 1966 censuses.
| Statistical Area | Area, in Square Miles | Persons per Square Mile | |||||
|---|---|---|---|---|---|---|---|
| 1926 | 1936 | 1945 | 1951 | 1961 | 1966 | ||
| Northland | 4,880 | 11.2 | 13.2 | 13.6 | 15.4 | 17.7 | 19.2 |
| Central Auckland | 2,150 | 109.6 | 123.4 | 154.0 | 177.3 | 238.8 | 285.4 |
| South Auckland-Bay of Plenty | 14,187 | 10.2 | 12.6 | 14.4 | 17.4 | 24.6 | 27.4 |
| East Coast | 4,200 | 8.0 | 8.8 | 9.0 | 9.9 | 11.1 | 11.2 |
| Hawke's Bay | 4,260 | 16.5 | 18.1 | 18.6 | 21.4 | 26.9 | 29.3 |
| Taranaki | 3,750 | 19.2 | 20.7 | 20.5 | 23.2 | 26.6 | 27.0 |
| Wellington | 10,870 | 25.9 | 29.1 | 32.1 | 35.9 | 43.6 | 48.2 |
| Totals, | |||||||
| North Island | 44,297 | 20.2 | 23.0 | 25.9 | 29.7 | 38.0 | 42.7 |
| Marlborough | 4,220 | 4.5 | 4.5 | 4.9 | 5.4 | 6.6 | 7.0 |
| Nelson | 6,910 | 6.0 | 7.0 | 6.8 | 8.2 | 9.1 | 9.7 |
| Westland | 6,010 | 3.6 | 4.3 | 4.0 | 4.2 | 4.1 | 4.1 |
| Canterbury | 16,769 | 13.0 | 14.2 | 14.9 | 16.9 | 20.5 | 22.4 |
| Otago | 14,070 | 10.7 | 10.8 | 10.3 | 11.3 | 12.5 | 13.0 |
| Southland | 11,460 | 5.9 | 6.4 | 6.3 | 6.8 | 8.2 | 9.0 |
| Totals, | |||||||
| South Island | 59,439 | 8.7 | 9.4 | 9.4 | 10.5 | 12.3 | 13.2 |
| Totals, | |||||||
| New Zealand | 103,736 | 13.6 | 15.2 | 16.5 | 18.7 | 23.3 | 25.8 |
MAORI POPULATION—The first official general census of Maoris was taken in 1857-58, and others occurred in regular sequence from 1874 onwards. Owing to inherent difficulties the earlier census records make no pretence towards complete accuracy. All persons with half or more of Maori blood are defined as Maoris.
According to census records the Maori population suffered a period of almost unbroken decline from 1858 to 1896. Among the causes of this were the susceptibility of the Maori to tuberculosis, measles, typhoid, and other diseases introduced by immigrants; the abandonment in some areas of healthy hilltop villages for low, often swampy sites; low birthrates coupled with high child-mortality rates; and a feeling of race-despair engendered by loss of land, defeat in war, and the general breakdown in health.
Since 1896, however, the Maori population has increased continuously, at first steadily and of later years at a very rapid rate. In fact, the vitality exhibited by the Maori race in recent years has been an outstanding demographic feature.
A statement of Maori population is now given for each census from 1901.
| Year | Maori Population | Intercensal Increase | Intercensal Increase | Average Annual Increase |
|---|---|---|---|---|
*Includes members of armed forces overseas at census date. | ||||
| Percent | ||||
| 1901 | 45,549 | 3,436 | 8.2 | 1.6 |
| 1906 | 50,309 | 4,760 | 10.5 | 2.0 |
| 1911 | 52,723 | 2,414 | 4.8 | 1.0 |
| 1916 | 52,997 | 274 | 0.5 | 0.1 |
| 1921 | 56,987 | 3,990 | 7.5 | 1.6 |
| 1926 | 63,670 | 6,683 | 11.7 | 2.2 |
| 1936 | 82,326 | 18,656 | 29.3 | 2.6 |
| 1945 | 98,744 | 16,418 | 19.9 | 1.9 |
| 1945* | 100,044 | 17,718 | 21.5 | 2.1 |
| 1951 | 115,676 | 16,932 | 17.1 | 2.9 |
| 1951* | 115,740 | 15,696 | 15.7 | 2.7 |
| 1956 | 137,151 | 21,475 | 18.6 | 3.5 |
| 1956* | 137,341 | 21,601 | 18.7 | 3.5 |
| 1961 | 167,086 | 29,935 | 21.8 | 4.0 |
| 1961* | 167,390 | 30,049 | 21.9 | 4.0 |
| 1966 | 201,159 | 34,073 | 20.4 | 3.8 |
| 1966* | 201,479 | 34,089 | 20.4 | 3.8 |
Of the 201,159 Maoris at the 1966 census, 190,524 were in the North Island. Maoris have always been resident in rural communities and this was true until recent years. A marked change has, however, taken place during and since the war as a result of employment conditions. As late as the 1936 census only 8,249 Maoris (10.0 percent) dwelt in cities, boroughs, or independent town districts. By the 1966 census the comparative figure was 101,680 (50.5 percent); the largest concentration is in Auckland Urban Area, where 33,926 Maoris were enumerated.
EXTERNAL MIGRATION—In recent years there has been a large increase in New Zealanders going overseas on business, on pleasure trips, and on working holidays, so that arrivals and departures have both been greatly swollen. The arrivals include many New Zealanders returning from travel overseas, as well as growing numbers of tourists from overseas countries.
The numbers of arrivals and departures during the last 11 years are given in the table following. Crews of vessels, through passengers, tourists on cruising liners and members of the armed forces, etc., have not been taken into account in this table.
| Year Ended 31 March | Arrivals | Departures | Excess of Arrivals Over Departures | ||||
|---|---|---|---|---|---|---|---|
| Males | Females | Total | Males | Females | Total | ||
| 1956 | 34,789 | 31,683 | 66,472 | 30,336 | 28,044 | 58,380 | 8,092 |
| 1957 | 40,836 | 35,219 | 76,055 | 34,518 | 30,045 | 64,563 | 11,492 |
| 1958 | 42,859 | 36,807 | 79,666 | 34,464 | 29,794 | 64,258 | 15,408 |
| 1959 | 44,955 | 38,693 | 83,648 | 39,917 | 33,739 | 73,656 | 9,992 |
| 1960 | 47,894 | 41,483 | 89,377 | 46,467 | 39,697 | 86,164 | 3,213 |
| 1961 | 57,306 | 48,932 | 106,238 | 56,423 | 48,195 | 104,618 | 1,620 |
| 1962 | 72,500 | 60,156 | 132,656 | 61,367 | 52,457 | 113,824 | 18,832 |
| 1963 | 78,613 | 65,259 | 143,872 | 71,863 | 58,370 | 130,233 | 13,639 |
| 1964 | 89,870 | 74,776 | 164,646 | 81,956 | 67,206 | 149,162 | 15,484 |
| 1965 | 104,421 | 85,870 | 190,291 | 98,147 | 80,153 | 178,300 | 11,991 |
| 1966 | 121,106 | 98,833 | 219,939 | 114,000 | 93,918 | 207,918 | 12,021 |
In the 10-year period ended 31 March 1966 the net gain from passenger immigration was 113,692.
New Zealand has a lower rate of net immigration than Australia, but New Zealand's rate of natural increase is higher. In spite of popular assumptions to the contrary, the total population of New Zealand grew faster (38.9 percent) than that of Australia (38.0 percent) between 1950 and 1965. Annual percentage increases are shown in the following table.
| New Zealand | Australia | |||||
|---|---|---|---|---|---|---|
| Calendar Years | Natural Increase Rate | Net Immigration Rate | Total Increase Rate* | Natural Increase Rate | Net Immigration Rate | Total Increase Rate |
*Mainly because of movement of armed forces which are allowed for in the "total increase'' but not in "net immigration'' the New Zealand total increase sometimes differs slightly from the sum of the first two columns. This was most marked in 1950 with departures connected with the Korean War. | ||||||
| 1950 | 1.66 | 0.44 | 1.88 | 1.40 | 1.90 | 3.26 |
| 1951 | 1.61 | 0.67 | 2.23 | 1.34 | 1.34 | 2.65 |
| 1952 | 1.68 | 1.08 | 2.74 | 1.41 | 1.10 | 2.48 |
| 1953 | 1.66 | 0.82 | 2.48 | 1.40 | 0.49 | 1.87 |
| 1954 | 1.70 | 0.37 | 2.10 | 1.35 | 0.77 | 2.10 |
| 1955 | 1.72 | 0.50 | 2.19 | 1.38 | 1.07 | 2.44 |
| 1956 | 1.70 | 0.46 | 2.05 | 1.35 | 1.01 | 2.35 |
| 1957 | 1.70 | 0.74 | 2.43 | 1.42 | 0.83 | 2.24 |
| 1958 | 1.78 | 0.55 | 2.35 | 1.42 | 0.67 | 2.09 |
| 1959 | 1.76 | 0.14 | 1.89 | 1.38 | 0.77 | 2.15 |
| 1960 | 1.78 | 0.09 | 1.86 | 1.40 | 0.89 | 2.27 |
| 1961 | 1.82 | 0.69 | 2.48 | 1.45 | 0.59 | 2.04 |
| 1962 | 1.75 | 0.60 | 2.33 | 1.36 | 0.59 | 1.95 |
| 1963 | 1.68 | 0.50 | 2.14 | 1.30 | 0.66 | 1.97 |
| 1964 | 1.54 | 0.55 | 2.05 | 1.17 | 0.90 | 2.07 |
| 1965 | 1.42 | 0.48 | 1.89 | 1.09 | 0.93 | 2.03 |
Classes of Arrivals and Departures—The following table gives an analysis of all classes of arrivals during the last five March years, including through passengers, tourists on cruising liners, and crews. In classifying arrivals or departures as permanent the commonly used international rule is applied—i.e., intended residence or absence of one year or more.
| Class | 1961-62 | 1962-63 | 1963-64 | 1964-65 | 1965-66 |
|---|---|---|---|---|---|
| Immigrants intending permanent residence | 32,769 | 32,589 | 34,234 | 35,446 | 35,299 |
| New Zealand residents returning | 48,199 | 52,398 | 60,708 | 72,810 | 86,624 |
| Visitors— | |||||
| Tourists | 35,169 | 39,499 | 47,978 | 57,498 | 65,039 |
| On business | 5,397 | 6,270 | 7,907 | 8,213 | 9,969 |
| Theatrical, entertaining, etc. | 838 | 1,229 | 1,430 | 1,083 | 1,072 |
| For educational purposes | 338 | 294 | 456 | 348 | 829 |
| On working holidays | 3,695 | 3,562 | 3,573 | 5,995 | 11,905 |
| Other, official, etc. | 5,402 | 7,022 | 7,610 | 8,118 | 7,786 |
| In transit | 849 | 1,009 | 750 | 780 | 1,416 |
| Through passengers, mainly on cruising liners | 38,587 | 38,732 | 39,714 | 40,253 | 55,265 |
| Crews | 111,799 | 104,282 | 103,877 | 106,907 | 120,127 |
| Totals | 283,042 | 286,886 | 308,237 | 337,451 | 395,331 |
The following table gives an analysis of departures.
| Class | 1961-62 | 1962-63 | 1963-64 | 1964-65 | 1965-66 |
|---|---|---|---|---|---|
| New Zealand residents departing— | |||||
| Permanently | 12,691 | 14,454 | 14,903 | 18,159 | 18,589 |
| Temporarily | 47,781 | 53,625 | 62,164 | 74,536 | 88,145 |
| Temporary residents departing | 53,352 | 62,154 | 72,095 | 85,605 | 101,184 |
| Through passengers, mainly on cruising liners | 38,587 | 38,732 | 39,714 | 40,253 | 55,265 |
| Crews | 111,054 | 104,248 | 102,427 | 107,161 | 119,198 |
| Totals | 263,465 | 273,213 | 291,303 | 325,714 | 382,381 |
Ages—The following table gives the age-distribution of permanent arrivals and departures for the year ended 31 March 1966.
| Age, in Years | Permanent Arrivals | Permanent Departures | Excess of Arrivals Over Departures | |||||
|---|---|---|---|---|---|---|---|---|
| Males | Females | Totals | Males | Females | Totals | Number | Percent | |
| 0-14 | 4,102 | 3,821 | 7,923 | 2,018 | 1,931 | 3,949 | 3,974 | 23.8 |
| 15-24 | 4,735 | 5,368 | 10,103 | 3,214 | 3,578 | 6,792 | 3,311 | 20.0 |
| 25-34 | 4,436 | 3,679 | 8,115 | 2,247 | 1,848 | 4,095 | 4,020 | 24.1 |
| 35-44 | 2,271 | 1,817 | 4,088 | 970 | 813 | 1,783 | 2,305 | 13.8 |
| 45-59 | 1,484 | 1,614 | 3,098 | 620 | 633 | 1,253 | 1,845 | 11.0 |
| 60 and over | 781 | 1,191 | 1,972 | 290 | 427 | 717 | 1,255 | 7.5 |
| Totals | 17,809 | 17,490 | 35,299 | 9,359 | 9,230 | 18,589 | 16,710 | 100.0 |
Origin—The following table shows for the last three years the birthplaces of immigrants intending permanent residence and of New Zealand residents departing permanently. ("Permanent'' is defined as 12 months or more.)
| Country of Birth | Immigrants
Intending Permanent Residence | New Zealand
Residents Departing Permanently | ||||
|---|---|---|---|---|---|---|
| 1963-64 | 1964-65 | 1965-66 | 1963-64 | 1964-65 | 1965-66 | |
| Commonwealth Countries | ||||||
| United Kingdom— | ||||||
| England and Wales | 13,478 | 13,633 | 13,089 | 2,832 | 3,820 | 2,945 |
| Scotland | 2,670 | 2,550 | 2,545 | 509 | 662 | 550 |
| Northern Ireland | 421 | 425 | 369 | 98 | 128 | 101 |
| Other or undefined | 123 | 93 | 74 | 23 | 24 | 16 |
| Australia | 4,860 | 5,650 | 5,544 | 1,505 | 1,738 | 1,508 |
| Canada | 679 | 525 | 516 | 233 | 250 | 215 |
| India | 283 | 313 | 253 | 89 | 97 | 81 |
| New Zealand | 5,799 | 5,714 | 6,494 | 7,664 | 9,260 | 10,848 |
| Pacific Islands— | ||||||
| Cook Islands and Niue | 640 | 668 | 621 | 70 | 88 | 80 |
| Western Samoa | 155 | 154 | 184 | 81 | 109 | 92 |
| Fiji | 309 | 334 | 327 | 64 | 87 | 107 |
| Other Pacific | 178 | 228 | 293 | 64 | 75 | 97 |
| Other | 763 | 964 | 806 | 133 | 200 | 250 |
| Totals, Commonwealth countries | 30,358 | 31,251 | 31,115 | 13,365 | 16,538 | 16,890 |
| Other Countries | ||||||
| Austria | 67 | 71 | 64 | 32 | 35 | 24 |
| China | 107 | 106 | 146 | 25 | 43 | 40 |
| Denmark | 72 | 99 | 80 | 41 | 46 | 30 |
| Germany | 198 | 268 | 298 | 84 | 77 | 90 |
| Greece | 235 | 197 | 196 | 12 | 30 | 15 |
| Hungary | 33 | 39 | 66 | 28 | 24 | 27 |
| Ireland, Republic of | 360 | 344 | 310 | 143 | 152 | 123 |
| Italy | 70 | 87 | 97 | 14 | 24 | 20 |
| Indonesia | 81 | 87 | 62 | 26 | 36 | 35 |
| Netherlands | 792 | 951 | 912 | 333 | 352 | 367 |
| Switzerland | 82 | 120 | 111 | 42 | 45 | 44 |
| United States of America | 763 | 688 | 762 | 382 | 406 | 400 |
| Yugoslavia | 121 | 142 | 210 | 20 | 17 | 30 |
| Others | 895 | 996 | 870 | 356 | 334 | 454 |
| Totals, other countries | 3,876 | 4,195 | 4,184 | 1,538 | 1,621 | 1,699 |
| Grand totals | 34,234 | 35,446 | 35,299 | 14,903 | 18,159 | 18,589 |
Assisted Immigration—Various systems of assisted immigration have operated since 1871, with the exception of the period 1892 to 1903 (inclusive). Assistance to immigrants was largely suspended between 1927 and 1947, and only 50 immigrants received financial assistance during the 10 years ended 31 March 1946.
In July 1947 a comprehensive free and assisted-passage scheme was introduced by the Government. Under this scheme certain categories of immigrants were given free passages to New Zealand provided they had served in the United Kingdom armed forces (including the Merchant Navy) during the Second World War, while others selected under the scheme were required to contribute only $20 towards the cost of their fares. Eligibility was confined to single residents of the United Kingdom (with no dependants) between the ages of 20 and 35 years who were willing to accept employment in selected occupations. All assisted immigrants were required to enter into a contract with the New Zealand Government that they would engage in approved employment for two years after their arrival in New Zealand.
In May 1950 a new immigration policy was announced by the Government, the main changes being as follows:
The age limit for unmarried British immigrants was raised to 45 years and no contribution towards cost of travel was required.
The free-passage scheme was extended to certain categories of married British immigrants with up to two children—later extended to up to four dependent children.
The acceptance of a number of single non-British men and women between the ages of 20 and 35 years. Dutch, Danish, Swiss, Austrian, and German nationals were selected.
At the end of 1958, it was decided to cut back assisted immigration by limiting male workers from the United Kingdom to skilled tradesmen, experienced farm workers, and experienced workers required in essential industries. Married workers accepted in these categories were limited to those with not more than two children. At the same time, the recruitment of German, Austrian, Danish, and Swiss migrants was terminated.
In 1960 steps were taken to increase the recruitment of skilled workers required for the expansion of essential industries. These steps included the acceptance of married men in approved categories with up to four dependent children. In March 1961 the Government announced a plan to bring to New Zealand in 1961-62 up to 5,000 assisted immigrants. Changed economic conditions later led to steps being taken to reduce the intake of assisted immigrants.
In August 1963 is was decided, however, to increase assisted immigration from the United Kingdom to 4,500 for the next 12 months and then to reduce it to 3,500 a year. In 1965 the annual target was raised to 4,000.
The numbers of assisted immigrants (excluding displaced persons and Hungarian refugees) arriving in New Zealand in the latest 11 years are as follows.
| Year Ended 31 March | British | Dutch | Austrian | German | Danish | Swiss | Belgian | Spanish | Maltese | Greek | Total |
|---|---|---|---|---|---|---|---|---|---|---|---|
| 1956 | 4,732 | 391 | - | - | - | - | - | - | - | - | 5,123 |
| 1957 | 4,172 | 252 | 139 | 30 | - | - | - | - | - | - | 4,593 |
| 1958 | 4,070 | 245 | 44 | 69 | 106 | 45 | - | - | - | - | 4,579 |
| 1959 | 4,343 | 141 | 36 | 35 | 92 | 31 | - | - | - | - | 4,678 |
| 1960 | 2,360 | 90 | 25 | 39 | 13 | 22 | - | - | - | - | 2,549 |
| 1961 | 2,217 | 12 | 2 | - | - | - | - | - | - | - | 2,231 |
| 1962 | 3,474 | 84 | 14 | - | - | 10 | 2 | - | - | - | 3,584 |
| 1963 | 4,283 | 42 | 33 | 27 | - | - | 10 | - | - | 137 | 4,532 |
| 1964 | 4,171 | - | 6 | 16 | 5 | 14 | 5 | - | - | 130 | 4,347 |
| 1965 | 4,300 | - | 9 | 12 | 5 | 11 | 2 | 1 | 31 | 29 | 4,400 |
| 1966 | 3,999 | - | 19 | 6 | - | - | - | - | 5 | 18 | 4,047 |
In the preceding migration tables assisted immigrants are included in the totals of "Immigrants intending permanent residence''.
Monetary and Economic Council Report No. 12 of November 1966, Increased Immigration and the New Zealand Economy is a useful study in regard to proposals for additional assisted immigrants.
Displaced Persons—Commencing with the year 1949-50 the Government agreed to accept drafts of displaced persons from Europe, who were brought to New Zealand in shipping provided by the International Refugee Organisation. These settlers were chosen by a New Zealand Selection Mission, and arrivals totalled 941 in 1949-50, 978 in 1950-51, and 2,663 in 1951-52.
Hungarian Refugees—Following the uprising in Hungary, the Government agreed to accept Hungarian refugees. The first draft arrived by air in December 1956 and a total of 1,117 reached New Zealand in the next two years.
Other Refugees—Apart from displaced persons, New Zealand has accepted and continues to accept refugees from Europe and the mainland of China. In 1958 it was decided to offer resettlement opportunities to 20 "hard core'' refugee families from Europe who, because of handicapped persons in each family unit, were unacceptable elsewhere. These families arrived during 1959. In 1959 it was decided to accept a further 100 "hard core'' families. This figure was subsequently increased to 200. New Zealand has continued to accept a steady flow of refugees including families sponsored by the Churches who also accepted responsibility for 50 orphan children from Hong Kong, Chinese refugee families, and White Russians.
PASSPORTS—Authority for the issue of passports in New Zealand and by New Zealand representatives overseas is contained in the Passports Act 1946 and the Passport Regulations 1946.
New Zealand passports are issued and renewed within New Zealand by the Department of Internal Affairs at Wellington, Auckland, and Christchurch, at Rarotonga by the High Commissioner, and overseas by the representatives of New Zealand at Apia, Athens, Bangkok, Boan, Brussels, Canberra, Djakarta, Geneva, The Hague, Hong Kong, Kuala Lumpur, London, Los Angeles, New Delhi, New York, Ottawa, Paris, Rome, San Francisco, Singapore, Sydney, Tokyo, and Washington. United Kingdom, Canadian, Australian, and Indian passports are issued and renewed in New Zealand by the respective High Commissioners for those countries.
Entry into New Zealand—Apart from British subjects and the wives of British subjects arriving from Australia, no person 16 years of age or over may land in New Zealand unless he is in possession of a valid passport or other recognised travel document. Exemption from the passport requirement (which is additional to the requirements of the Immigration Act and Undesirable Immigrants Exclusion Act) may be granted in exceptional circumstances by the Minister of Internal Affairs. A British subject who is a master or a member of the crew of the vessel in which he arrives does not need to produce a passport.
With the exception of nationals of those countries with which New Zealand has concluded agreements for the mutual abolition of visas, every alien landing in New Zealand requires a visa.
Persons born in the Cook Islands and the Tokelau Islands are British subjects and New Zealand citizens. They are required to obtain formal exit permission from the High Commissioner or Administrator respectively if they wish to proceed to New Zealand.
Departure from New Zealand—Every person leaving New Zealand, with the exception of a British subject travelling to Australia or making the round trip to New Zealand's island territories, should be in possession of a valid passport or other travel document.
IMMIGRATION—The legislation respecting immigration into New Zealand is contained in the Immigration Act 1964, and the Undesirable Immigrants Exclusion Act 1919. The Immigration Act is administered by the Department of Labour, while the Undesirable Immigrants Exclusion Act is administered by the Department of Justice.
Under the Immigration Act all persons other than New Zealand citizens must be in possession of an entry permit before they may land in New Zealand.
To obtain permission to settle in New Zealand, intending immigrants should first write to or call on the nearest overseas representative of the New Zealand Government or write direct to the Secretary of Labour, P.O. Box 6310, Wellington, New Zealand. The application must be made in the prescribed form and must be supported by documents duly attested in the country of origin. Each application is considered individually on its own merits.
NATIONALITY AND NATURALISATION—The basic nationality law is the British Nationality and New Zealand Citizenship Act 1948. Citizens of all Commonwealth countries are recognised as British subjects.
New Zealand citizenship may be acquired in the following ways: (a) by birth in New Zealand; (b) by descent from a New Zealand-born father; (c) by registration; and (d) by naturalisation. Citizens of other Commonwealth countries and the Republic of Ireland acquire New Zealand citizenship by registration, as do alien wives and children of New Zealand citizens. Other aliens acquire it by naturalisation. To be eligible for New Zealand citizenship, an alien or a citizen of another Commonwealth country (other than a woman married to a New Zealand citizen, or to a minor) must—(a) have resided in New Zealand for the prescribed period, (b) be of full age and capacity, (c) be of good character, (d) have a sufficient knowledge of the English language, and of the responsibilities and privileges of New Zealand citizenship, (e) intend to reside in New Zealand, or to enter or continue Crown service under the New Zealand Government. The residential qualification for naturalisation is five years, for registration it is generally three years but can be reduced to one year.
Alien adults acquiring New Zealand citizenship by naturalisation or registration, and alien minor children over 16 years of age acquiring it by registration, are required to take the oath of allegiance. Ceremonies are held at which applicants, in an atmosphere of dignity and solemnity, take the oath of allegiance and are presented with their certificates of naturalisation or registration as New Zealand citizens. During the 1965-66 year there were 114 such ceremonies, at which 1,280 persons took the oath of allegiance.
New Zealand citizens may be deprived of New Zealand citizenship if they voluntarily acquire a foreign nationality by any formal act other than marriage, or if they voluntarily exercise the privileges or perform any of the duties of a foreign nationality possessed by them. Citizenship obtained by fraud, false representation, or the concealment of any material fact may be withdrawn.
REGISTRATION OF ALIENS—The registration of aliens in New Zealand is provided for by the Aliens Act 1948, which is administered by the Department of Internal Affairs.
The number of aliens on the New Zealand register at 1 April 1966 was 28,247, comprising 16,649 males and 11,598 females. This is not the complete number in New Zealand, as certain classes are not required to register, including the following: (a) children under 16 years of age; (b) persons holding diplomatic status, consuls, or employees of embassies, legations, and consulates who are resident in New Zealand solely for the purpose of performing official duties; (c) certain temporary visitors to New Zealand. Under the British Nationality and New Zealand Citizenship Act 1948 a citizen of the Republic of Ireland, though not possessing the status of British subject (or, in alternative phraseology, Commonwealth citizen), is nevertheless not classed as an alien and is not required to register.
The numbers of naturalisations, registrations, etc., during the year ended 31 March 1966 were as follows.
| Country of Birth | Certificates of Naturalisation (Aliens and British-protected Persons) | Certificates of Registration as a New Zealand Citizen (British Subjects, Irish Citizens, British-protected Persons, and Aliens) | Certificates of Registration as a New Zealand Citizen—Minor Children (British Subjects and Aliens) | |
|---|---|---|---|---|
| Males | Females | Total | Total | |
| Austria | 10 | - | 3 | 4 |
| British Commonwealth | - | - | 261 | 84 |
| China | 90 | 14 | 69 | 4 |
| Czechoslovakia | 9 | 1 | 2 | 7 |
| Denmark | 15 | - | 3 | - |
| Germany | 11 | 5 | 10 | 6 |
| Greece | 8 | 1 | 5 | 4 |
| Hungary | 53 | 6 | 20 | 9 |
| Indonesia | 15 | 1 | 10 | 7 |
| Italy | 6 | 1 | 7 | - |
| Netherlands | 188 | 9 | 95 | 40 |
| Poland | 61 | 5 | 30 | - |
| Rumania | 13 | 3 | 12 | 4 |
| South Africa | 6 | - | 40 | 42 |
| Switzerland | 10 | 2 | 4 | 3 |
| Tonga | 6 | 2 | 9 | 4 |
| Western Samoa | 37 | 5 | 22 | 4 |
| Yugoslavia | 27 | 5 | 9 | 3 |
| Other countries | 39 | 15 | 41 | 9 |
| Totals | 604 | 75 | 652 | 234 |
The certificates of registration granted to adult females included SO to British wives of New Zealand citizens and 350 to alien wives of New Zealand citizens.
The following table shows the numbers on the register of aliens at 1 April 1965 and 1 April 1966.
| Country of Nationality | 1 April 1965 | 1 April 1966 | ||||
|---|---|---|---|---|---|---|
| Males | Females | Total | Males | Females | Total | |
| Austria | 361 | 123 | 484 | 360 | 129 | 489 |
| Belgium | 51 | 31 | 82 | 55 | 35 | 90 |
| Bulgaria | 76 | 5 | 81 | 78 | 5 | 83 |
| Burma | 21 | 4 | 25 | 19 | 4 | 23 |
| China | 1,448 | 1,014 | 2,462 | 1,328 | 941 | 2,269 |
| Czechoslovakia | 71 | 24 | 95 | 62 | 26 | 88 |
| Denmark | 550 | 268 | 818 | 550 | 280 | 830 |
| Estonia | 27 | 33 | 60 | 25 | 29 | 57 |
| Finland | 89 | 74 | 163 | 84 | 73 | 114 |
| France | 81 | 89 | 170 | 86 | 95 | 185 |
| Germany | 459 | 445 | 904 | 493 | 446 | 939 |
| Greece | 660 | 805 | 1,465 | 724 | 858 | 1,582 |
| Hungary | 526 | 295 | 821 | 464 | 264 | 728 |
| Indonesia | 37 | 13 | 50 | 52 | 16 | 68 |
| Italy | 247 | 184 | 431 | 274 | 184 | 458 |
| Japan | 25 | 53 | 78 | 32 | 67 | 99 |
| Latvia | 77 | 76 | 153 | 73 | 71 | 144 |
| Lebanon | 19 | 22 | 41 | 26 | 24 | 50 |
| Lithuania | 27 | 25 | 52 | 25 | 25 | 50 |
| Netherlands | 7,984 | 5,637 | 13,621 | 7,907 | 5,664 | 13,571 |
| Norway | 102 | 42 | 144 | 101 | 53 | 154 |
| Poland | 615 | 438 | 1,053 | 541 | 399 | 940 |
| Rumania | 25 | 23 | 48 | 26 | 20 | 46 |
| South Africa | 26 | 21 | 47 | 55 | 50 | 105 |
| Spain | 17 | 4 | 21 | 28 | 7 | 35 |
| Sweden | 66 | 49 | 115 | 61 | 52 | 113 |
| Switzerland | 464 | 262 | 726 | 486 | 264 | 750 |
| Thailand | 48 | 34 | 82 | 60 | 40 | 100 |
| U.S.A | 1,175 | 614 | 1,789 | 1,363 | 725 | 2,088 |
| U.S.S.R. | 82 | 78 | 160 | 80 | 81 | 161 |
| Vietnam | 40 | 15 | 55 | 49 | 18 | 67 |
| Yugoslavia | 871 | 538 | 1,409 | 952 | 567 | 1,519 |
| Others | 79 | 52 | 131 | 110 | 59 | 179 |
| Stateless | 23 | 15 | 38 | 20 | 17 | 37 |
| Totals | 16,469 | 11,405 | 27,874 | 16,649 | 11,598 | 28,247 |
The number of aliens on the register at 1 April 1966 increased by 373 as compared with 12 months earlier. Countries with the largest net additions to the aliens register during the 1965-66 years were United States (299), Greece (117), and Yugoslavia (110). Decreases in the register related chiefly to China (193), Poland (113), and the Netherlands (50).
STATISTICS OF THE 1961 CENSUS—Publications containing the results of the census of 18 April 1961 are listed towards the back of this Yearbook.
The following pages give details for 1961 census relating to Marital Status, Dependent Children, Religious Professions, Age Distribution, Racial Origins; Birthplaces and Duration of Residence. Information from the 1966 Census will be included in the Latest Statistical Information near the end of this Yearbook.
MARITAL STATUS—The marital status of persons aged 16 years and over as returned at the census of 1961 is summarised in the following tables.
| Age (Years) | Never Married | Married | Legally Separated | Widowed | Divorced | Not Specified | Total |
|---|---|---|---|---|---|---|---|
| Males | |||||||
| 16-19 | 73,209 | 866 | 5 | 5 | 1 | 70 | 74,156 |
| 20 | 17,231 | 1,422 | 9 | - | 2 | 27 | 18,691 |
| 21-24 | 41,064 | 19,921 | 155 | 20 | 26 | 166 | 61,352 |
| 25-29 | 21,821 | 50,784 | 509 | 97 | 193 | 196 | 73,600 |
| 30-34 | 13,806 | 66,487 | 710 | 175 | 560 | 185 | 81,923 |
| 35-39 | 9,994 | 68,825 | 822 | 306 | 889 | 188 | 81,024 |
| 40-44 | 7,000 | 61,718 | 783 | 522 | 1,044 | 165 | 71,232 |
| 45-49 | 6,565 | 61,586 | 734 | 932 | 1,257 | 129 | 71,203 |
| 50-54 | 5,475 | 55,398 | 643 | 1,382 | 1,286 | 123 | 64,307 |
| 55-59 | 4,656 | 45,085 | 474 | 2,020 | 1,090 | 99 | 53,424 |
| 60-64 | 3,781 | 33,889 | 306 | 2,733 | 807 | 57 | 41,573 |
| 65-69 | 2,834 | 24,398 | 232 | 3,332 | 551 | 49 | 31,396 |
| 70-74 | 2,324 | 18,557 | 175 | 4 405 | 423 | 41 | 25,925 |
| 75-79 | 1,775 | 11,849 | 150 | 5,019 | 236 | 25 | 19,054 |
| 80-84 | 1,004 | 5,369 | 3,779 | 109 | 18 | 10,336 | |
| 85-89 | 346 | 1,425 | 21 | 1,901 | 32 | 6 | 3,731 |
| 90 and over | 91 | 263 | 3 | 663 | 9 | 1 | 1,030 |
| Totals, 1961 | 212,976 | 527,842 | 5,788 | 27,291 | 8,515 | 1,545 | 783,957 |
| Totals, 1956 | 200,617 | 482,933 | 5,475 | 27,859 | 7,747 | 657 | 725,288 |
| Females | |||||||
| 16-19 | 64,664 | 5,839 | 37 | 10 | 2 | 10 | 70,562 |
| 20 | |||||||
| 11,908 | 6,028 | 56 | 8 | 9 | 4 | 18,013 | |
| 21-24 | 19,703 | 39,697 | 425 | 73 | 92 | 17 | 60,007 |
| 25-29 | 8,739 | 60,107 | 763 | 233 | 321 | 10 | 70,173 |
| 30-34 | 6,145 | 67,799 | 936 | 472 | 610 | 14 | 75,976 |
| 35-39 | 5,700 | 69,124 | 965 | 1,105 | 940 | 12 | 77,846 |
| 40-44 | 5,442 | 63,169 | 961 | 1,977 | 1,187 | 28 | 72,764 |
| 45-49 | 5,828 | 58,531 | 903 | 3,570 | 1,436 | 22 | 70,290 |
| 50-54 | 5,971 | 48,533 | 696 | 5,260 | 1,351 | 25 | 61,836 |
| 55-59 | 5,474 | 36,724 | 494 | 7,424 | 1,110 | 32 | 51,258 |
| 60-64 | 4,998 | 27,813 | 357 | 10,601 | 895 | 18 | 44,682 |
| 65-69 | 4,726 | 20,345 | 261 | 13,393 | 668 | 20 | 39,413 |
| 70-74 | 3,957 | 12,985 | 190 | 14,974 | 438 | 21 | 32,565 |
| 75-79 | 3,039 | 6,892 | 106 | 13,569 | 229 | 20 | 23,855 |
| 80-84 | 1,838 | 2,662 | 40 | 9,431 | 101 | 20 | 14,092 |
| 85-89 | 744 | 618 | 9 | 4,029 | 17 | 5 | 5,422 |
| 90 and over | 210 | 130 | 3 | 1,479 | 4 | 4 | 1,830 |
| Totals, 1961 | 159,086 | 526,996 | 7,202 | 87,608 | 9,410 | 282 | 790,584 |
| Totals, 1956 | 151,613 | 482,143 | 6,714 | 79,020 | 8,715 | 225 | 728,430 |
The percentage distribution of the population aged 16 years or over according to marital status is given in the following summary.
| Marital Status | 1956 | 1961 | ||
|---|---|---|---|---|
| Males | Females | Males | Females | |
| Never married | 27.7 | 20.8 | 27.2 | 20.1 |
| Married | 66.6 | 66.2 | 67.5 | 66.7 |
| Legally separated | 0.8 | 0.9 | 0.7 | 0.9 |
| Widowed | 3.8 | 10.9 | 3.5 | 11.1 |
| Divorced | 1.1 | 1.2 | 1.1 | 1.2 |
| Totals | 100.0 | 100.0 | 100.0 | 100.0 |
DEPENDENT CHILDREN—Married men, widowers, and widows were asked at the census in 1961 to state the number of their living children under 16 years (including stepchildren and children adopted by them). Married women, divorced and legally separated persons were not asked to supply the information as this would have created the risk of duplication of children counted.
The numbers of persons having dependent children, including Maoris, are now shown. The category "nil'' includes those cases where members of the family were 16 years of age and over, as well as those cases where there were no children in the family.
| Number of
Dependent Children Under 16 Years | 1956 Census | 1961 Census | ||||
|---|---|---|---|---|---|---|
| Married Men | Widowers | Widows | Married Men | Widowers | Widows | |
| Nil | 195,413 | 25,381 | 72,579 | 204,735 | 24,823 | 80,574 |
| 1 | 86,730 | 1,139 | 3,094 | 90,524 | 1,167 | 3,323 |
| 2 | 92,899 | 654 | 1,678 | 99,932 | 601 | 1,790 |
| 3 | 57,937 | 329 | 824 | 68,166 | 329 | 870 |
| 4 | 28,080 | 165 | 407 | 35,450 | 155 | 459 |
| 5 | 11,664 | 84 | 223 | 15,247 | 82 | 203 |
| 6 | 5,253 | 36 | 86 | 6,935 | 37 | 114 |
| 7 | 2,451 | 23 | 41 | 3,166 | 20 | 50 |
| 8 | 1,164 | 15 | 23 | 1,606 | 13 | 21 |
| 9 and over | 988 | 12 | 21 | 1,317 | 8 | 15 |
| Not specified | 354 | 21 | 44 | 764 | 56 | 189 |
| Totals | 482,933 | 27,859 | 79,020 | 527,842 | 27,291 | 87,608 |
The numbers of dependent children in each of the three groups in 1961 were: dependent on married men, 802,711; dependent on widowers, 4,932; and dependent on widows, 13,716; a total of 821,359 dependent children out of a 1961 census total of 840,443 children under 16 years of age. The difference is accounted for mainly by the exclusion of children whose parents were legally separated; those whose parents were divorced and had not remarried; children who had lost both parents; and ex-nuptial children (the last two classes excluding cases of adoption).
Comparable numbers of dependent children in the three groups in 1956 were: dependent on married men, 684,846; dependent on widowers, 5,131; and dependent on widows, 12,862; a total of 702,839 out of a total of 720,190 children under 16 years.
Between the 1956 and 1961 censuses the total number of dependent children of married men increased from 684,846 to 802,711, a rise of 17.2 percent. The number of married men increased by 44,909 or 9.3 percent. Those recording "nil'' dependent children increased by only 4.8 percent, while those with dependent children increased by 12.2 percent.
Married men with three children recorded the largest numerical increase, rising from 57,937 to 68,166, this representing a 17.7 percent increase. The greatest percentage increase, however, was recorded by married men with eight children, this group increasing from 1,164 in 1956 to 1,606 in 1961 a rise of 442 or 38 percent.
The next table shows within each group, the average number of dependent children, firstly for all persons within the group, and then for persons with dependent children in that group.
| Average Number of Dependent Children | 1956 Census | 1961 Census |
|---|---|---|
| Married men | ||
| Per person | 1.42 | 1.52 |
| Per person with dependent children | 2.38 | 2.49 |
| Widowers— | ||
| Per person | 0.18 | 0.18 |
| Per person with dependent children | 2.09 | 2.04 |
| Widows— | ||
| Per person | 0.16 | 0.16 |
| Per person with dependent children | 2.01 | 2.00 |
The most significant point from the table is the marked rise in the average number of dependent children of married men. This is a reflection of the sharp increases recorded, since 1956, in the numbers of married men having two or more dependent children.
RELIGIOUS PROFESSIONS—The following summary presents the main religious professions returned at the 1961 census.
| Religious Profession | Number of Adherents, 1961 Census |
|---|---|
| Church of England (Anglican) | 835,434 |
| Presbyterian | 539,459 |
| Roman Catholic (including Catholic undefined | 364,098 |
| Methodist | 173,838 |
| Protestant (undefined) | 45,100 |
| Baptist | 40,886 |
| Brethren | 25,764 |
| Ratana | 23,126 |
| Latter Day Saints | 17,978 |
| Salvation Army | 15,454 |
| Christian (undefined) | 12,130 |
| Church of Christ | 10,485 |
| Congregational | 9,377 |
| Seventh Day Adventist | 8,220 |
| Jehovah's Witness | 5,944 |
| Ringatu | 5,377 |
| Lutheran | 4,817 |
| Christian Scientist | 3,719 |
| Hebrew | 4,006 |
| Undenominational | 3,684 |
| Eastern Orthodox | 3,328 |
| Atheist | 3,359 |
| Agnostic | 2,288 |
| Hindu | 2,074 |
| Christadelphian | 1,498 |
| Apostolic | 1,399 |
| Assemblies of God | 1,060 |
| Rationalist | 956 |
| Commonwealth Convenant | 875 |
| Society of Friends | 790 |
| Spiritualist | 683 |
| Pentecostal | 659 |
| Dutch Reformed | 644 |
| Non-conformist | 626 |
| Unitarian | 437 |
| Missions | 410 |
| Liberal Catholic | 367 |
| Theosophist | 256 |
| Confucian | 166 |
| No religion (so returned) | 17,486 |
| All other religious professions | 8,473 |
| Object to state | 204,056 |
| Not specified | 14,198 |
| Totals | 2,414,984 |
The four main churches—Church of England, Presbyterian, Roman Catholic, and Methodist—retained the adherence of the great bulk of the population, although their combined percentage fell from 79.9 percent of the total population in 1956 to 79.2 percent in 1961. All four churches increased in numbers, though of these, only the Roman Catholic church increased its ratio to total population—14.3 percent in 1956 to 15.1 percent in 1961.
The category recorded as "Object to state'' represents those persons availing themselves of the special statutory right of objecting to answer a question on this subject. The percentage of the population in this class increased from 8.0 in 1956 to 8.4 in 1961. It is probable that the "not specified'' group includes a number of persons objecting to the question.
The percentage distribution according to number of adherents is as shown below.
| Religious Profession | Percentage of Total Population | |
|---|---|---|
| 1956 | 1961 | |
| Church of England (Anglican) | 35.9 | 34.6 |
| Presbyterian | 22.3 | 22.3 |
| Roman Catholic (including Catholic undefined) | 14.3 | 15.1 |
| Methodist | 7.4 | 7.2 |
| Protestant (undefined) | 2.2 | 1.9 |
| Baptist | 1.6 | 1.7 |
| Brethren | 1.0 | 1.1 |
| Ratana | 0.9 | 1.0 |
| Latter Day Saints | 0.6 | 0.8 |
| Salvation Army | 0.6 | 0.6 |
| Church of Christ | 0.5 | 0.4 |
| No religion (so returned) | 0.6 | 0.7 |
| Object to state | 8.0 | 8.4 |
| All other (including not specified) | 4.1 | 4.2 |
| Totals | 100.0 | 100.0 |
AGE DISTRIBUTION—Census age-group figures are shown in the following table. The low birthrates for the years 1932-36 are reflected in the smaller numbers in the age group of 25-29 years at the 1961 census, and the age group 20-24 years in 1956.
| Age Group (Years) | 1956 Census | 1961 Census | ||||
|---|---|---|---|---|---|---|
| Males | Females | Total | Males | Females | Total | |
| 0-4 | 130,693 | 125,855 | 256,548 | 149,032 | 143,041 | 292,073 |
| 5-9 | 123,145 | 117,438 | 240,583 | 133,880 | 127,821 | 261,701 |
| 10-14 | 95,136 | 90,991 | 186,127 | 125,339 | 119,829 | 245,168 |
| 15-19 | 78,985 | 76,660 | 155,645 | 95,324 | 90,895 | 186,219 |
| 20-24 | 69,180 | 66,491 | 135,671 | 80,043 | 78,020 | 158,063 |
| 25-29 | 79,523 | 73,502 | 153,025 | 73,600 | 70,173 | 143,773 |
| 30-34 | 78,429 | 75,361 | 153,790 | 81,923 | 75,976 | 157,899 |
| 35-39 | 70,913 | 72,441 | 143,354 | 81,024 | 77,846 | 158,870 |
| 40-44 | 70,472 | 70,170 | 140,642 | 71,232 | 72,764 | 143,996 |
| 45-49 | 66,502 | 63,246 | 129,748 | 71,203 | 70,290 | 141,493 |
| 50-54 | 55,535 | 52,690 | 108,225 | 64,307 | 61,836 | 126,143 |
| 55-59 | 46,654 | 47,398 | 94,052 | 53,424 | 51,258 | 104,682 |
| 60-64 | 35,881 | 41,210 | 77,091 | 41,573 | 44,682 | 86,255 |
| 65-69 | 33,116 | 37,918 | 71,034 | 31,396 | 39,413 | 70,809 |
| 70-74 | 27,149 | 30,695 | 57,844 | 25,925 | 32,565 | 58,490 |
| 75-79 | 18,420 | 21,462 | 39,882 | 19,054 | 23,855 | 42,909 |
| 80-84 | 8,676 | 10,625 | 19,301 | 10,336 | 14,092 | 24,428 |
| 85-89 | 3,157 | 4,316 | 7,473 | 3,731 | 5,422 | 9,153 |
| 90-94 | 667 | 1,068 | 1,735 | 897 | 1,542 | 2,439 |
| 95-99 | 103 | 188 | 291 | 121 | 265 | 386 |
| 100 and over | 14 | 21 | 35 | 12 | 23 | 35 |
| Not specified | 861 | 1,105 | 1,966 | - | - | - |
| Totals | 1,093,211 | 1,080,851 | 2,174,062 | 1,213,376 | 1,201,608 | 2,414,984 |
The following table classifies the population in the three broad age groups covering the children (under 15 years) those of working age (15-64 years) and the older age group (65 years and over).
| Age Group (Years) | 1956 Census | 1961 Census | Increase 1956-61 | |||
|---|---|---|---|---|---|---|
| Number | Percent of Total Specified | Number | Percent of Total Specified | Number | Percent | |
| Under 15 | 683,258 | 31.5 | 798,942 | 33.1 | 115,684 | 16.9 |
| 15-64 | 1,291,243 | 59.4 | 1,407,393 | 58.3 | 116,150 | 9.0 |
| 65 and over | 197,595 | 9.1 | 208,649 | 8.6 | 11,054 | 5.6 |
| Not specified | 1,966 | - | - | - | -1,966 | - |
| Totals | 2,174,062 | 100.0 | 2,414,984 | 100.0 | 240,922 | 11.1 |
Between 1956 and 1961 the population in the working age group of 15 to 64 years decreased from 59.4 to 58.3 percent of the population, those in the age group of 65 years and over decreased from 9.1 to 8.6 percent, while the children under 15 years in 1961 comprised 33.1 percent of the population compared with 31.5 percent in 1956.
RACIAL ORIGINS—Between the censuses of 1956 and 1961 the Maori population increased by 29,935, or 21.8 percent, while the non-Maori population increased by 200,599, or 9.9 percent The "other races'' portion of the population showed the highest percentage increase between 1956 and 1961, rising from 20,624 to 31,012, or by 50.4 percent.
A noticeable feature is that, within the "other races'' group the Pacific Island Polynesians again showed a substantial increase from 8,103 to 14,340, immigration from Western Samoa and the Cook Islands contributing fairly large numbers during the period.
| Race | Census | |
|---|---|---|
| 1956 | 1961 | |
| Non-Maori | 2,016,287 | 2,216,886 |
| Maori | 137,151 | 167,086 |
| Other Races— | ||
| Pacific Islands | ||
| Cook Island Maori | 2,320 | 4,499 |
| Samoan | 3,740 | 6,481 |
| Niuean | 848 | 1,728 |
| Tongan | 917 | 1,043 |
| Other | 278 | 589 |
| Subtotals, Pacific Islands | 8,103 | 14,340 |
| Chinese | 6,667 | 8,333 |
| Indian | 3,087 | 4,027 |
| Syrian, Lebanese, and Arab | 1,055 | 1,057 |
| Fijian | 479 | 746 |
| Other races | 1,233 | 2,509 |
| Totals, other races | 20,624 | 31,012 |
| Grand totals | 2,174,062 | 2,414,984 |
COUNTRY OF BIRTH—Since 1945 the New Zealand-born population has remained constant at about 86 percent of the total population.
The following table classifies persons by country of birth.
| Country of Birth | Census | |
|---|---|---|
| 1956 | 1961 | |
| New Zealand (excluding Cook Islands and Niue) | 1,863,344 | 2,074,509 |
| United Kingdom | 206,181 | 218,649 |
| Australia | 35,916 | 35,412 |
| Netherlands | 12,544 | 17,844 |
| Ireland (excluding Northern Ireland) | 8,423 | 8,810 |
| Pacific Islands— | ||
| Cook Islands and Niue | 2,745 | 4,788 |
| Fiji | 2,273 | 3,038 |
| Tonga | 768 | 777 |
| Western Samoa | 2,995 | 4,450 |
| India | 4,468 | 4,753 |
| China | 3,883 | 4,194 |
| Other countries, and born at sea | 30,522 | 37,760 |
| Totals | 2,174,062 | 2,414,984 |
The next table shows the duration of residence in New Zealand of persons born overseas.
| Years of Residence | 1956 Census | 1961 Census | ||
|---|---|---|---|---|
| Number | Percentages Specified Cases | Number | Percentages Specified Cases | |
| 0-4 | 77,545 | 25.6 | 72,685 | 21.7 |
| 5-9 | 42,722 | 14.1 | 64,468 | 19.3 |
| 10-14 | 8,848 | 2.9 | 42,313 | 12.7 |
| 15-19 | 10,811 | 3.6 | 8,147 | 2.4 |
| 20-24 | 5,236 | 1.7 | 10,362 | 3.1 |
| 25-29 | 17,790 | 5.9 | 4,361 | 1.3 |
| 30-34 | 39,094 | 12.9 | 18,381 | 5.5 |
| 35-39 | 20,928 | 6.9 | 32,827 | 9.8 |
| 40-44 | 24,868 | 8.2 | 20,501 | 6.1 |
| 45-49 | 23,410 | 7.7 | 19,303 | 5.8 |
| 50-54 | 13,934 | 4.6 | 20,564 | 6.2 |
| 55 and over | 18,088 | 5.9 | 20,591 | 6.1 |
| Not specified | 7,444 | ... | 5,972 | ... |
| Totals | 310,718 | 100.0 | 340,475 | 100.0 |
STATISTICS OF WORLD POPULATION—The area and estimated population of the continents and some of the principal countries of the world at 1 July 1965 are shown in the following table. (Source: United Nations Population and Vital Statistics Report and Demographic Yearbook.)
| Continents and Countries | Area | Population |
|---|---|---|
* U.N. Estimate. | ||
| sq. miles (000) | million | |
| Continents | ||
| Europe | 1,903 | 444.0 |
| Asia | 10,480 | 1,825.0 |
| U.S.S.R | 8,650 | 231.0 |
| Africa | 11,670 | 310.0 |
| North America | 9,359 | 292.0 |
| Latin America | 6,870 | 165.0 |
| Oceania | 3,304 | 17.5 |
| Totals, world | 52,236 | 3,284,5 |
| Selected Countries | ||
| Europe— | ||
| United Kingdom | 94 | 54.4 |
| Republic of Ireland | 27 | 2.9 |
| Belgium | 12 | 9.5 |
| Denmark | 17 | 4.8 |
| France | 213 | 48.9 |
| Germany, West | 96 | 56.8 |
| Germany, East | 41 | 17.0 |
| Italy | 116 | 51.6 |
| Netherlands | 13 | 12.3 |
| Norway | 125 | 3.7 |
| Spain | 194 | 31.6 |
| Sweden | 174 | 7.7 |
| Switzerland | 16 | 5.9 |
| Oceania— | ||
| Australia | 2,975 | 11.4 |
| New Zealand | 104 | 2.6 |
| Asia— | ||
| China | 3,769 | 700.0* |
| India | 1,267 | 486.8 |
| Japan | 143 | 98.0 |
| Pakistan | 365 | 102.9 |
| Malaysia | 51 | 9.9 |
| Indonesia | 576 | 104.5 |
| Africa— | ||
| South Africa | 472 | 17.9 |
| Congo | 905 | 15.6 |
| Ghana | 92 | 7.7 |
| Nigeria | 339 | 57.5 |
| Zambia | 288 | 3.7 |
| Rhodesia | 150 | 4.3 |
| Malawi | 37 | 3.9 |
| United Arab Republic | 457 | 29.6 |
| North America— | ||
| United States of America | 3,615 | 194.6 |
| Canada | 3,851 | 19.6 |
| South America— | ||
| Argentina | 1,073 | 22.4 |
| Brazil | 3,287 | 82.2 |
Table of Contents
The rate of natural increase (excess of births over deaths) is important to national planning. In recent years the rate of natural increase in New Zealand has been higher than for most other countries of predominantly European stock. The following table shows the numbers and rates of natural increase for the last 11 years, and emphasises the high rate for the Maori component of the population.
| Year | Total Population | Maoris | Natural increase Rates per 1,000 Mean Population | |||||
|---|---|---|---|---|---|---|---|---|
| Births | Deaths | Natural Increase | Births | Deaths | Natural Increase | Total | Maori | |
| 1956 | 56,593 | 19,696 | 36,897 | 6,163 | 1,293 | 4,870 | 16.90 | 35.28 |
| 1957 | 58,484 | 20,862 | 37,622 | 6,632 | 1,451 | 5,181 | 16.85 | 36.16 |
| 1958 | 60,635 | 20,301 | 40,334 | 6,861 | 1,287 | 5,574 | 17.65 | 37.57 |
| 1959 | 61,869 | 21,128 | 40,741 | 7,130 | 1,314 | 5,816 | 17.45 | 37.75 |
| 1960 | 62,850 | 20,892 | 41,958 | 7,415 | 1,368 | 6,047 | 17.65 | 37.85 |
| 1961 | 65,476 | 21,782 | 43,694 | 7,770 | 1,385 | 6,385 | 18.01 | 38.12 |
| 1962 | 65,127 | 22,081 | 43,046 | 7,664 | 1,224 | 6,440 | 17.32 | 36.74 |
| 1963 | 64,675 | 22,416 | 42,259 | 8,127 | 1,198 | 6,929 | 16.66 | 38.01 |
| 1964 | 62,459 | 22,861 | 39,598 | 7,955 | 1,168 | 6,787 | 15.29 | 35.85 |
| 1965 | 60,178 | 22,976 | 37,202 | 7,855 | 1,217 | 6,638 | 14.12 | 33.83 |
| 1966 | 60,188 | 23,778 | 36,410 | 7,848 | 1,291 | 6,557 | 13.57 | 32.33 |
In the 10 years to 31 December 1966 New Zealand has gained by natural increase of population a total of 402,864.
COMPARISON WITH OTHER COUNTRIES—An international comparison of birth and natural-increase rates for certain countries is made in the following table. The rates, which are the average of the five years 1960-64, are taken from the Demographic Yearbook issued by the United Nations.
| Country | Rate per 1,000 of Population | ||
|---|---|---|---|
| Births | Deaths | Natural Increase | |
| Mexico | 45.5 | 10.7 | 34.8 |
| Taiwan | 37.2 | 6.4 | 30.8 |
| Singapore | 35.4 | 5.9 | 29.5 |
| Hong Kong | 32.9 | 5.7 | 27.2 |
| Israel | 25.6 | 6.0 | 19.6 |
| Canada | 25.3 | 7.7 | 17.6 |
| New Zealand | 25.9 | 8.9 | 17.0 |
| Australia | 21.9 | 8.7 | 13.2 |
| Netherlands | 20.9 | 7.8 | 13.1 |
| United States | 22.5 | 9.5 | 13.0 |
| Ireland, Republic | 22.0 | 11.8 | 10.2 |
| Japan | 17.2 | 7.3 | 9.9 |
| Italy | 18.9 | 9.8 | 9.1 |
| Switzerland | 18.1 | 9.6 | 8.5 |
| Norway | 17.4 | 9.5 | 7.9 |
| Denmark | 17.0 | 9.7 | 7.3 |
| Germany, West | 18.2 | 11.2 | 7.0 |
| France | 18.0 | 11.2 | 6.8 |
| England and Wales | 17.9 | 11.8 | 6.1 |
| Austria | 18.5 | 12.5 | 6.0 |
| Belgium | 17.1 | 12.1 | 5.0 |
| Sweden | 14.5 | 10.0 | 4.5 |
The following diagram shows birth and death rates and indicates the relatively high rate of natural increase in New Zealand.
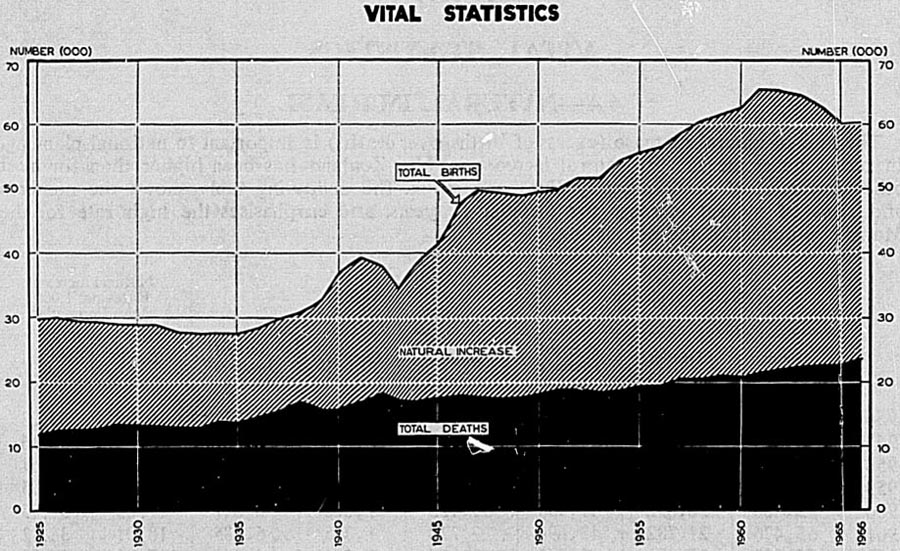
The period since the Second World War was marked by a high birth rate until 1961, since which time there has been a sharp drop, which is an experience also affecting Australia, Canada, and the United States. The decrease in the birth rate has been sufficiently large to result in a decline in the actual numbers added to the population by natural increase. The highest annual increment was that for 1961.
REGISTRATION—The law as to registration of births is contained in the Births and Deaths Registration Act 1951. A birth may be registered within two months without fee at the office of the Registrar nearest the place of birth. After two months a birth is registrable only after a statutory declaration of the particulars required to be registered has been made before the Registrar by the parent or some person present at birth, and on payment of the prescribed fee. The Registrar-General may, however, register an unregistered birth irrespective of the time that may have elapsed.
Birth statistics are compiled from the records of the Registrar-General. The births covered by a year's statistics are those registered during the year. The figures do not include still births, except where multiple births are discussed. A special classification of still births is given later in this subsection.
NUMBERS AND RATES—The following table shows the numbers of births and the rates for the last 11 years.
| Year | Numbers | Rates per 1,000 of Mean Population | ||
|---|---|---|---|---|
| Total | Maori | Total | Maori | |
| 1956 | 56,593 | 6,163 | 25.93 | 44.63 |
| 1957 | 58,484 | 6,632 | 26.20 | 46.29 |
| 1958 | 60,635 | 6,861 | 26.53 | 46.24 |
| 1959 | 61,869 | 7,130 | 26.50 | 46.28 |
| 1960 | 62,850 | 7,415 | 26.44 | 46.41 |
| 1961 | 65,476 | 7,770 | 26.99 | 46.39 |
| 1962 | 65,127 | 7,664 | 26.21 | 43.72 |
| 1963 | 64,675 | 8,127 | 25.49 | 44.58 |
| 1964 | 62,459 | 7,955 | 24.12 | 42.02 |
| 1965 | 60,178x | 7,855 | 22.83 | 40.03 |
| 1966 | 60,188 | 7,848 | 22.43 | 38.70 |
REFINED BIRTHRATE—“Crude” rates of the number of births per 1,000 of the mean population, irrespective of sex or age, do not take account of variations in the proportion of women of the child-bearing ages. Refined rates are provided by computations of the legitimate birthrate per 1,000 married women of 15-44 years of age, or the total birthrate per 1,000 of all women of these ages. The following table gives both rates for census years (on the basis of the births registered in that year and the population as at the census) together with the “crude” rate for the year.
| Census Year | Birthrate per 1,000 Women 15-44 Years | “Crude” Birthrate | |
|---|---|---|---|
| Total Women | Married Women | ||
| 1926 | 176.9 | 92.1 | 21.23 |
| 1936 | 155.1 | 79.0 | 18.07 |
| 1945 | 186.5 | 106.5 | 24.58 |
| 1951 | 190.8 | 123.0 | 25.62 |
| 1956 | 191.7 | 130.2 | 25.93 |
| 1961 | 199.3 | 140.6 | 26.97 |
The percentage of married women in the child-bearing ages was 70.0 in 1961 compared with 51.6 in 1926. A study of the figures for successive censuses reveals considerable changes in the age constitution of married women within the child-bearing ages; as the birthrate varies with age, the change in age constitution over the period is a factor which should be taken into account.
REPRODUCTION INDEX—The reproduction index is based on the fact that the future size of a population is related to the number of women in the reproductive age groups at any given time. The gross rate is based on the number of female children born, and the average number of girls that will be born to a woman during her reproductive period, while the net rate takes into account fertility rates at different ages and the percentages of female survivors at those ages, obtained from life tables. A net rate of 1.0 indicates a stationary population, and a higher rate a rising population.
Reproduction rates during the latest 11 years were as follows.
| Year | Gross Rate | Net Rate |
|---|---|---|
| 1955 | 1.817 | 1.749 |
| 1956 | 1.839 | 1.771 |
| 1957 | 1.893 | 1.822 |
| 1958 | 1.931 | 1.859 |
| 1959 | 1.950 | 1.878 |
| 1960 | 1.968 | 1.905 |
| 1961 | 2.028 | 1.964 |
| 1962 | 1.970 | 1.908 |
| 1963 | 1.855 | 1.796 |
| 1964 | 1.753 | 1.698 |
| 1965 | 1.624 | 1.571 |
It must be remembered that, in New Zealand, population growth has two important components—natural increase and net migration—and that the reproduction index takes into account only natural increase, Statistics of external migration in recent years are included in the section on “Population”.
SEXES OF CHILDREN BORN—The extreme range since 1870 for all births has been from 1,016 male per 1,000 female births in 1878 to 1,081 in 1923. Statistics for the latest six years are given in the following table.
| Year | Number of Births of | Male Births per 1,000 Female Births | |
|---|---|---|---|
| Males | Females | ||
| 1961 | 33,521 | 31,955 | 1,049 |
| 1962 | 33,356 | 31,771 | 1,050 |
| 1963 | 33,287 | 31,388 | 1,060 |
| 1964 | 32,169 | 30,290 | 1,062 |
| 1965 | 31,105x | 29,073x | 1,070 |
| 1966 | 30,879 | 29,309 | 1,054 |
MULTIPLE BIRTHS—The number of cases of multiple births and the proportion per 1,000 of the total (live births only) during the latest six years are shown in the following table.
| Year | Total Births | Total Cases | Cases of Twins | Cases of Triplets | Multiple Cases per 1,000 of Total Cases |
|---|---|---|---|---|---|
* Includes one case of quadruplets. † Includes one case of quintuplets. | |||||
| 1961 | 65,476 | 64,722 | 743 | 5* | 11.56 |
| 1962 | 65,127 | 64,453 | 662 | 6 | 10.47 |
| 1963 | 64,675 | 63,984 | 681 | 5 | 10.72 |
| 1964 | 62,459 | 61,765 | 684 | 5 | 11.10 |
| 1965 | 60,178x | 59,560 | 600 | 8† | 10.21 |
| 1966 | 60,188 | 59,588 | 589 | 5* | 9.97 |
There were 59,560 confinements in 1965 resulting in live births; of these, 608 produced multiple living births and in a further 27 cases one of twins was still-born. The ratio of multiple confinements with live births to total live confinements is 1:94. In six additional cases both twins were still-born.
| Year | Cases of Twins | Cases of Triplets and Quintuplets | Total Multiple Cases | Rate per 1,000 Confinements | ||||||||
|---|---|---|---|---|---|---|---|---|---|---|---|---|
| Both Born Alive | One Born Alive, One Still Born | Both Still Born | Total | All Born Alive | One Born Alive, Two Still Born | Two Born Alive, One Still Born | All Still Born | Quins, All Alive | Total | |||
| * The seven cases of triplets in 1965 comprised two of two females and one male and five of three males. The case of quintuplets comprised one male and four females. | ||||||||||||
| 1961 | 743 | 29 | 10 | 782 | 5 | - | 1 | - | - | 6 | 788 | 12.2 |
| 1962 | 663 | 32 | 9 | 704 | 6 | - | - | - | - | 6 | 710 | 11.1 |
| 1963 | 681 | 33 | 11 | 725 | 5 | - | 1 | - | - | 6 | 731 | 11.3 |
| 1964 | 684 | 24 | 13 | 721 | 5 | - | - | - | - | 5 | 726 | 11.6 |
| 1965 | 600 | 27 | 6 | 633 | 7* | - | - | - | 1 | 8 | 641 | 10.6 |
| Average of five years | 674 | 29 | 10 | 713 | 6 | - | - | - | - | 6 | 719 | 11.4 |
The likelihood of still births occurring is much greater in cases of multiple births than in single cases. This is exemplified in the following table The figures in respect of multiple cases include all cases where one or more of the children were still born.
| Year | Still-birth Cases per 100 of Total Cases (Including Still Births) | |
|---|---|---|
| Single Cases | Multiple Cases | |
| 1961 | 1.27 | 5.08 |
| 1962 | 1.31 | 5.77 |
| 1963 | 1.24 | 6.15 |
| 1964 | 1.24 | 5.06 |
| 1965 | 1.14 | 5.15 |
| Average of five years | 1.24 | 5.44 |
AGES OF PARENTS—Information as to the relative ages of parents of legitimate living children whose births were registered in 1965 is shown in the following table for the total population.
| Age of Mother, in Years | Age of Father, in Years | |||||||||||
|---|---|---|---|---|---|---|---|---|---|---|---|---|
| Under 21 | 21-24 | 25-29 | 30-34 | 35-39 | 40-44 | 45-49 | 50-54 | 55-64 | 65 and Over | Not Stated | Total Cases | |
* Including 20 cases where one of twins was still-born. † Including 1 case of quintuplets, 7 cases of triplets. | ||||||||||||
| Single Births | ||||||||||||
| Under 21 | 1,588 | 3,697 | 1,346 | 259 | 48 | 20 | 4 | 4 | 1 | - | - | 6,967 |
| 21-24 | 303 | 5,317 | 7,783 | 1,768 | 414 | 82 | 27 | 8 | 7 | - | - | 15,709 |
| 25-29 | 14 | 711 | 7,187 | 5,743 | 1,670 | 297 | 74 | 28 | 13 | 2 | 1 | 15,740 |
| 30-34 | 3 | 40 | 692 | 3,527 | 2,863 | 766 | 170 | 63 | 25 | 1 | 1 | 8,151 |
| 35-39 | 2 | 5 | 73 | 507 | 1,940 | 1,309 | 406 | 103 | 46 | 7 | - | 4,398 |
| 40-44 | - | 1 | 7 | 48 | 217 | 579 | 363 | 123 | 41 | 6 | 1 | 1,386 |
| 45 and over | - | - | - | 2 | 3 | 26 | 28 | 24 | 9 | 1 | - | 93 |
| Not stated | - | 1 | - | 1 | - | - | - | 1 | - | - | 7 | 10 |
| Totals | 1,910 | 9,772 | 17,088 | 11,855 | 7,155 | 3,079 | 1,072 | 354 | 142 | 17 | 10 | 52,454* |
| Multiple Births | ||||||||||||
| Under 21 | 13 | 32 | 9 | 1 | - | - | - | - | - | - | - | 55 |
| 21-24 | 1 | 38 | 77 | 18 | 4 | 1 | 1 | - | - | - | - | 140 |
| 25-29 | - | 11 | 69 | 78 | 24 | 2 | 1 | 2 | - | - | - | 187 |
| 30-34 | - | 2 | 8 | 42 | 58 | 8 | 1 | - | 1 | - | - | 120 |
| 35-39 | - | - | - | 14 | 27 | 16 | 6 | - | 1 | - | - | 64 |
| 40-44 | - | - | - | - | 3 | 11 | 5 | 3 | 1 | 1 | - | 24 |
| 45 and over | - | - | - | - | - | - | - | - | - | - | - | - |
| Totals | 14 | 83 | 163 | 153 | 116 | 38 | 14 | 5 | 3 | 1 | - | 590† |
| Grand Totals | 1,924 | 9,855 | 17,251 | 12,008 | 7,271 | 3,117 | 1,086 | 359 | 145 | 18 | 10 | 53,044† |
PREVIOUS ISSUE OF PARENTS—The following table gives for 1965 the number of previous issue, i.e., children born alive, in conjunction with the age of mother.
| Age of Mother in Years | Number of Previous Issue | Total Legitimate Cases | ||||||||
|---|---|---|---|---|---|---|---|---|---|---|
| 0 | 1 | 2 | 3 | 4 | 5 | 6-9 | 10-14 | 15 and Over | ||
| * This number represents 52,454 single cases and 590 multiple cases. | ||||||||||
| Under 21 | 5,069 | 1,631 | 292 | 27 | 1 | - | - | - | - | 7,020 |
| 21-24 | 6,880 | 5,713 | 2,268 | 717 | 203 | 60 | 17 | - | - | 15,858 |
| 25-29 | 3,191 | 4,544 | 4,334 | 2,152 | 883 | 449 | 368 | 6 | - | 15,927 |
| 30-34 | 898 | 1,291 | 2,016 | 1,695 | 984 | 585 | 740 | 64 | 1 | 8,274 |
| 35-39 | 425 | 501 | 748 | 824 | 671 | 446 | 670 | 172 | 5 | 4,462 |
| 40-44 | 115 | 133 | 200 | 231 | 212 | 153 | 280 | 79 | 8 | 1,411 |
| 45 and over | 5 | 9 | 10 | 12 | 5 | 12 | 18 | 18 | 3 | 92 |
| Totals | 16,583 | 13,822 | 9,868 | 5,658 | 2,959 | 1,705 | 2,093 | 339 | 17 | 53,044* |
In the following table the total issue and average issue are shown for mothers by age groups where a birth occurred in 1965.
| Age of Mother, in Years | Total Mothers | Total Issue | Average Issue |
|---|---|---|---|
| Under 21 | 7,020 | 9,371 | 1.33 |
| 21-24 | 15,858 | 29,619 | 1.87 |
| 25-29 | 15,927 | 44,022 | 2.76 |
| 30-34 | 8,274 | 31,478 | 3.80 |
| 35-39 | 4,462 | 20,605 | 4.62 |
| 40-44 | 1,411 | 7,284 | 5.16 |
| 45 and over | 92 | 616 | 6.70 |
| Totals | 53,044 | 142,995 | 2.70 |
It should be stressed that the averages are no more than they purport to be—viz, the average number of children (including those registered in 1965) born up to the present time to those mothers of legitimate children whose births were registered during the year. They do not purport to represent, nor do they represent, the average issue of all women of the ages shown. Furthermore, they include issue born to the existing marriages only. The averages for recent years were as follows: 1960, 2.67; 1961, 2.69; 1962, 2.85; 1963, 2.83; 1964, 2.78; and 1965, 2.70. In 1915, the earliest year for which reliable comparative figures are available, the average issue was 3.11.
FIRST BIRTHS—Statistics of legitimate first confinements indicate that approximately half occur within one year after marriage and over three-quarters within two years after marriage.
| Year | Total Legitimate Cases | Total Legitimate First Cases | Proportion of First Cases to Total Cases | First Cases Within One Year After Marriage | First Cases Within Two Years After Marriage | ||
|---|---|---|---|---|---|---|---|
| Number | Proportion to Total First Cases | Number | Proportion To Total First Cases | ||||
| per cent | per cent | per cent | |||||
| 1962 | 59,885 | 16,856 | 28.49 | 8,349 | 49.53 | 13,069 | 77.53 |
| 1963 | 58,325 | 16,541 | 28.36 | 8,251 | 49.88 | 12,837 | 77.61 |
| 1964 | 55,634 | 16,195 | 29.18 | 8,074 | 49.85 | 12,349 | 76.26 |
| 1965 | 53,044 | 16,538 | 31.18 | 8,145 | 49.25 | 12,414 | 75.06 |
The following table gives the duration-of-marriage factor in first confinements over a longer time-series. Prior to 1962 the statistics concern births of non-Maoris only.
| Duration of Marriage in Years | Percentage of Total First Confinements | ||||||
|---|---|---|---|---|---|---|---|
| 1934 | 1944 | 1954 | 1962 | 1963 | 1964 | 1965 | |
| Under 1 | 46.25 | 38.47 | 42.64 | 49.53 | 49.88 | 49.85 | 49.25 |
| 1 | 26.79 | 26.30 | 30.56 | 28.00 | 27.73 | 26.42 | 25.81 |
| 2 | 10.24 | 11.28 | 11.56 | 10.09 | 10.51 | 11.42 | 12.29 |
| 3 | 6.16 | 7.88 | 5.95 | 4.70 | 4.79 | 5.07 | 5.56 |
| 4 | 3.96 | 7.18 | 3.30 | 2.49 | 2.46 | 2.82 | 2.67 |
| 5-9 | 5.49 | 7.36 | 5.05 | 4.15 | 3.68 | 3.56 | 3.54 |
| 10 and over | 1.11 | 1.53 | 0.94 | 1.04 | 0.95 | 0.86 | 0.88 |
| Totals | 100.00 | 100.00 | 100.00 | 100.00 | 100.00 | 100.00 | 100.00 |
In the following table first confinements occurring to mothers in different age groups are expressed as a percentage of the total first confinements. Prior to 1962 the statistics concern confinements of non-Maoris only.
| FIRST CONFINEMENTS, BY AGE OF MOTHER | |||||||
|---|---|---|---|---|---|---|---|
| Age of Mother, in Years | Percentage of Total First Confinements | ||||||
| 1934 | 1944 | 1954 | 1962 | 1963 | 1964 | 1965 | |
| Under 20 | 8.90 | 7.33 | 9.08 | 16.51 | 18.85 | 19.64 | 20.70 |
| 20-24 | 40.39 | 41.79 | 47.71 | 54.23 | 52.75 | 52.67 | 51.44 |
| 25-29 | 32.79 | 29.54 | 27.79 | 18.58 | 18.52 | 18.28 | 19.25 |
| 30-34 | 13.10 | 14.61 | 10.39 | 6.80 | 6.07 | 6.00 | 5.39 |
| 35-79 | 3.79 | 5.36 | 3.92 | 2.95 | 2.91 | 2.57 | 2.51 |
| 40-44 | 0.99 | 1.34 | 1.02 | 0.86 | 0.82 | 0.81 | 0.68 |
| 45 and over | 0.04 | 0.03 | 0.09 | 0.07 | 0.08 | 0.03 | 0.03 |
| Totals | 100.00 | 100.00 | 100.00 | 100.00 | 100.00 | 100.00 | 100.00 |
The average ages of mothers at the birth of their first child were as follows: 1924, 26.39; 1934, 25.90; 1944, 25.18; 1954, 25.32; 1962, 23.89; 1963, 23.74; 1964, 23.65; and 1965, 23.56 years.
EX-NUPTIAL BIRTHS—The numbers of ex-nuptial births registered during each of the latest 12 years, with the percentages they bear to total births registered, are given in the following table. Statistics prior to 1962 concern non-Maoris only. The percentages in recent years are higher than those for Australia, Canada, United Kingdom and United States but lower than those for Sweden.
| Year | Number | Percentage of Total Live Births |
|---|---|---|
| 1955 | 2,264 | 4.54 |
| 1956 | 2,310 | 4.58 |
| 1957 | 2,549 | 4.92 |
| 1958 | 2,689 | 5.00 |
| 1959 | 2,792 | 5.10 |
| 1960 | 2,911 | 5.25 |
| 1961 | 3,332 | 5.77 |
| 1962 | 5,242 | 8.05 |
| 1963 | 5,698 | 8.81 |
| 1964 | 6.189 | 9.91 |
| 1965 | 6,554 | 10.89 |
| 1966 | 6,960 | 11.56 |
The long-term trend in the rate of ex-nuptial births is indicated by the movement in the proportion of non-Maori ex-nuptial births per 1,000 unmarried women—i.e., spinsters, widows, and divorced women—at the reproductive ages. The figures for census years, are as follows.
| Census Year | Unmarried Women 15-44 Years of Age | Ex-nupital Births | Ex-nuptial Birthrate per 1,000 Unmarried Women |
|---|---|---|---|
| 1911 | 120,778 | 1,078 | 8.93 |
| 1916 | 125,461 | 1,159 | 9.24 |
| 1921 | 136,539 | 1,258 | 9.21 |
| 1926 | 148,551 | 1,473 | 9.92 |
| 1936 | 167,781 | 1,126 | 6.71 |
| 1945 | 156,326 | 1,824 | 11.67 |
| 1951 | 130,343 | 1,935 | 14.85 |
| 1956 | 129,877 | 2,310 | 17.79 |
| 1961 | 138,018 | 3,332 | 24.14 |
Included in the total of 6,554 live ex-nuptial births in 1965, were 38 cases of twins, 7 cases where one of twins was born alive and one stillborn, the number of confinements thus being 6,516. From the following table it will be seen that of the 6,516 mothers, 3,173, or 48.70 percent, were under 21 years of age.
| Age | Number of Mothers |
|---|---|
| 11 | 1 |
| 13 | 6 |
| 14 | 31 |
| 15 | 121 |
| 16 | 351 |
| 17 | 570 |
| 18 | 776 |
| 19 | 715 |
| 20 | 602 |
| 21 | 527 |
| 22 | 409 |
| 23 | 326 |
| 24-29 | 1,184 |
| 30-34 | 490 |
| 35-39 | 285 |
| 40-44 | 109 |
| 45 and over | 13 |
| Total | 6,516 |
The Legitimation Act—The Legitimation Act 1939 stipulates that every ex-nuptial child whose parents have later married shall be deemed to have been legitimated from birth by reason of such marriage. The Act requires the parents or surviving parent of any person legitimated under the Act to register with the Registrar-General the particulars of the birth of that person, showing that person as the lawful issue of the parents. Application for registration must be made within three months after the date of the marriage.
The numbers of legitimations registered in each of the latest four years were as follows: 1963, 1,133; 1964, 1,091; 1965, 1,003; 1966, 1,042.
ADOPTIONS—The Adoption Act 1955 sets out the provisions regarding the adoption of children. The Births and Deaths Registration Act 1951, as amended in 1961, contains provision for the registration of adopted children. The adoption of a Maori child is required to be registered in the same manner as that of a non-Maori child. The Adoption Act 1955 requires interim orders to be made in the first instance, and for these to remain in force for six months before adoption orders become effective.
The following table shows the number of adoptions which have been registered during the latest five years.
| Year | Number | ||
|---|---|---|---|
| Males | Females | Total | |
| 1962 | 1,369 | 1,276 | 2,645 |
| 1963 | 1,422 | 1,421 | 2,843 |
| 1964 | 1,506 | 1,379 | 2,885 |
| 1965 | 1,557 | 1,531 | 3,088 |
| 1966 | 1,747 | 1,715 | 3,462 |
Of the 3,088 adoptions registered in 1965, 1,589 were children under the age of one year, 1,039 were aged one to four years, 257 were aged five to nine years, and 203 were aged 10 years or over. In 1966 the figures were 1,703, 1,174, 295 and 290 respectively.
STILL BIRTHS—Although it is compulsory to effect a birth-registration entry for a still-born child, no entry is made in the register of deaths. The Births and Deaths Registration Act 1951 stipulates, however, that a medical practitioner or a midwife in attendance at the confinement where a still birth occurs must furnish a certificate stating to the best of his or her knowledge and belief the cause of the still birth. Particulars of causes of still births will be found in Section 4C relating to deaths. A stillborn child is defined as one “which has issued from its mother after the expiration of the twenty-eighth week of pregnancy and which was not alive at the time of such issue”. Still births are not included either as births or as deaths in the various numbers and rates shown in this subsection and in that relating to deaths, The sate of 1.18 per 100 total births in 1965 is the lowest rate yet recorded.
The registrations of still births during each of the latest five years were as follows.
| Year | Male Still Births | Female Still Births | Total | Male Still Births per 1,000 Female Still Births | Percentage of Still Births to— | |
|---|---|---|---|---|---|---|
| Living Births | All Births | |||||
| 1962 | 447 | 396 | 843 | 1,118 | 1.29 | 1.28 |
| 1963 | 431 | 393 | 824 | 1,097 | 1.27 | 1.26 |
| 1964 | 420 | 394 | 814 | 1,066 | 1.31 | 1.29 |
| 1965 | 368 | 350 | 718 | 1,051 | 1.19 | 1.18 |
| 1966 | 354 | 314 | 688 | 1,127 | 1.14 | 1.10 |
The rate of masculinity for still births in 1965 was 1,051 males per 1,000 females as compared with 1,070 for living births. This is against the trend in recent years which has shown masculinity in general higher among still births than among living births.
The percentage of ex-nuptial births among still-born infants was, in 1965, 15.60 and among infants born alive 10.89.
Of the living legitimate births registered in 1965, 31 percent were first births, while of legitimate still births 35 percent were first births. Statistics over many years indicate that there is a considerably greater probability of still births at first confinement than subsequent confinements. Of the total of 718 still births in 1965, 609 were non-Maori and 109 Maori; of the Maori total 63 were males and 46 females.
FOETAL DEATHS—The Births and Deaths Registration Act 1951 stipulates that in the case of a foetal death where the child has issued from its mother after the twentieth week, and up to and including the twenty-eighth week of pregnancy, a medical practitioner or a midwife who was in attendance at the confinement shall sign and supply a certificate stating to the best of his or her knowledge and belief the cause of the foetal death, and such other particulars as may be required by the Registrar-General. A foetal death is not required to be registered as in the case of a still-born child.
REGISTRATION—The law as to registration of deaths is contained in the Births and Deaths Registration Act 1951. Deaths of Maoris were recorded separately up to the end of 1961, but under the Births and Deaths Registration Amendment Act 1961 the procedure has been the same as for non-Maoris from 1 January 1962. (Maoris are defined as persons with half or more of Maori blood and the term European or non-Maori covers all other persons.) Particulars required in the registration of a death include date, place of residence and domicile, name, occupation, sex, age, cause of death, birthplace, duration of residence in New Zealand, marital status, living issue of married persons, degree of Maori blood (if any), medical attendant by whom certified, particulars as to burial, and, in the case of the death of a married male, age of widow. Deaths are required to be registered by the funeral director within three days after the day of burial.
Although it is compulsory to effect a birth-registration entry in the case of a still-born child, no entry is made in the register of deaths. The principal Act stipulates, however, that a medical practitioner or a midwife in attendance at a confinement where a still birth occurs must furnish a certificate stating to the best of his or her knowledge and belief the cause of the still birth.
It is incumbent upon a medical practitioner to give the certificate of cause of death of any deceased person to the person required to supply information for the purpose of registering the death (the funeral director in charge of the burial). The practitioner is required to report forthwith to the Coroner any case where, in his opinion, there are any suspicious circumstances.
Deaths of Members of the Forces While Overseas—The Births and Deaths Registration Act 1951 requires the Registrar-General to compile a register containing particulars of all persons who have died while out of New Zealand on service with any Commonwealth force within the meaning of the Army Act 1950 and who at the time of their deaths were domiciled in New Zealand. Deaths registered in the War Deaths Register from 1940 onwards were not taken into account in arriving at the number and rate of deaths in New Zealand, nor were deaths of visiting overseas servicemen or prisoners of war in New Zealand. Deaths of New Zealand servicemen which occurred in New Zealand were, however, included.
NUMBERS AND RATES—New Zealand has had for many years a favourable death rate in its non-Maori population. Despite the ageing of population, the non-Maori crude death rate has remained low and this is undoubtedly due to the introduction of antibiotics and new medical techniques as well as to the expansion of health services. There has, for example, been for some years a low incidence of serious outbreaks of epidemic disease, a reduction in tuberculosis mortality, and a remarkably low non-Maori infant-mortality rate.
The general trend of the crude non-Maori death rate in New Zealand was downward over a long period of years, reaching its lowest level during the early thirties. After that an upward trend was in evidence for some years, the figures recorded during the war years being the highest for a long time. Some of the increase over this period can be attributed to population changes in that numbers of the healthiest of the young male adult population were serving overseas, but on the other hand the strains of wartime did exact a toll on the elderly which was shown in the sharp rise in deaths resulting from diseases of the heart and nervous system.
The following table sets out the numbers of deaths and the crude death rates per 1,000 of mean population over the latest 21 years.
| Year | Numbers | Crude Rate per 1,000 of Mean Population | ||||
|---|---|---|---|---|---|---|
| Non-Maori | Maori | Total | Non-Maori | Maori | Total | |
| 1946 | 16,093 | 1,627 | 17,720 | 9.71 | 16.00 | 10.07 |
| 1947 | 15,904 | 1,538 | 17,442 | 9.39 | 14.63 | 9.70 |
| 1948 | 15,812 | 1,473 | 17,285 | 9.16 | 13.66 | 9.42 |
| 1949 | 16,012 | 1,566 | 17,578 | 9.09 | 14.17 | 9.39 |
| 1950 | 16,715 | 1,369 | 18,084 | 9.31 | 12.09 | 9.47 |
| 1951 | 17,512 | 1,324 | 18,836 | 9.56 | 11.37 | 9.67 |
| 1952 | 17,413 | 1,483 | 18,896 | 9.28 | 12.34 | 9.47 |
| 1953 | 17,009 | 1,345 | 18,354 | 8.84 | 10.84 | 8.96 |
| 1954 | 17,667 | 1,209 | 18,876 | 8.98 | 9.41 | 9.01 |
| 1955 | 17,953 | 1,272 | 19,225 | 8.95 | 9.95 | 8.99 |
| 1956 | 18,403 | 1,293 | 19,696 | 9.00 | 9.36 | 9.02 |
| 1957 | 19,411 | 1,451 | 20,862 | 9.29 | 10.13 | 9.34 |
| 1958 | 19,014 | 1,287 | 20,301 | 8.90 | 8.67 | 8.88 |
| 1959 | 19,814 | 1,314 | 21,128 | 9.09 | 8.53 | 9.05 |
| 1960 | 19,524 | 1,368 | 20,892 | 8.81 | 8.56 | 8.79 |
| 1961 | 20,397 | 1,385 | 21,782 | 9.03 | 8.27 | 8.98 |
| 1962 | 20,857 | 1,224 | 22,081 | 9.03 | 6.98 | 8.89 |
| 1963 | 21,218 | 1,198 | 22,416 | 9.01 | 6.57 | 8.84 |
| 1964 | 21,693 | 1,168 | 22,861 | 9.04 | 6.17 | 8.83 |
| 1965 | 21,759 | 1,217 | 22,976 | 8.92 | 6.20 | 8.72 |
| 1966 | 22,487 | 1,291 | 23,778 | 9.07 | 6.37 | 8.86 |
Maori crude death rates have dropped steadily over the 21-year period surveyed and have become lower than the non-Maori figures over recent years. Crude death rates do not reflect the true levels of mortality which exist in populations which have different age structures. The Maori population has a very much higher proportion of those at younger ages who do not contribute many deaths to the total and conversely relatively few persons at older ages where the rate of dying is high. The effect of this is to produce a very deflated crude rate.
Simple arithmetic can be employed to produce a figure for the Maori which compares directly with the non-Maori crude rate. By applying the Maori death rates at each age to the non-Maori population of this age it is possible to total these and arrive at the number of deaths which would have occurred in the non-Maori population had the Maori rates of dying applied. This figure divided by the total non-Maori population produces a Maori rate which is adjusted to the age structure of the non-Maori in that particular year and which is directly comparable with the non-Maori crude rate. The adjusted Maori rates computed on this system are entered in the following table for 1964 and show in a true comparison Maori mortality to be approximately twice that of the non-Maori. In addition, a comparison is supplied in age-specific rates for the two races in each sex.
| Race | All Ages Rates per 10,000 Mean Population | Age-specific Rates per 10,000 of Population at Ages | ||||||
|---|---|---|---|---|---|---|---|---|
| Crude Rate | Maori Rate Adjusted to Non-Maori Population | Under 5 Years | 5-14 Years | 15-24 Years | 25-44 Years | 45-64 Years | 65 Years and Over | |
| Males | ||||||||
| Maori | 69.5 | 130.1 | 96.7 | 8.4 | 19.5 | 35.5 | 207.9 | 863.0 |
| Non-Maori | 99.0 | ... | 49.1 | 4.1 | 11.3 | 19.4 | 126.6 | 814.9 |
| Females | ||||||||
| Maori | 54.6 | 148.5 | 64.6 | 4.7 | 14.2 | 26.9 | 186.9 | 936.7 |
| Non-Maori | 81.0 | ... | 37.1 | 2.9 | 5.2 | 12.2 | 67.8 | 584.3 |
| Both Sexes | ||||||||
| Maori | 62.1 | 138.6 | 80.9 | 6.6 | 16.9 | 31.2 | 198.0 | 896.2 |
| Non-Maori | 90.0 | ... | 43.3 | 3.5 | 8.3 | 15.9 | 97.1 | 682.9 |
For both Maoris and non-Maoris the death rate in males exceeds the death rate in females by a considerable margin. The following table sets out the respective crude rates for each sex separately for the latest 11 years in the total population.
| Year | Deaths per 1,000 of Mean Population | Male Deaths to Every 100 Female Deaths | ||
|---|---|---|---|---|
| Males | Females | Total | ||
| 1956 | 10.00 | 8.04 | 9.02 | 126 |
| 1957 | 10.39 | 8.28 | 9.34 | 127 |
| 1958 | 9.72 | 8.03 | 8.88 | 123 |
| 1959 | 9.92 | 8.17 | 9.05 | 123 |
| 1960 | 9.66 | 7.90 | 8.79 | 124 |
| 1961 | 9.75 | 8.19 | 8.97 | 120 |
| 1962 | 9.78 | 7.96 | 8.87 | 124 |
| 1963 | 9.72 | 7.90 | 8.81 | 124 |
| 1964 | 9.68x | 7.91x | 8.80x | 124 |
| 1965 | 9.52 | 7.83 | 8.68 | 123 |
| 1966 | 9.81 | 7.90 | 8.86 | 125 |
DISTRIBUTION OF DEATHS OVER THE YEAR—An examination of the total number of deaths registered in each quarter of the last 12 years gives the following averages: March quarter, 4,463; June quarter. 5,266, September quarter, 6,228; and December quarter, 5,135.
A classification according to month of death shows that in 1965 the months during which the greatest number of deaths occurred were July, August, and September, with totals of 2,403, 2,250, and 2,034 respectively. Excluding December (a proportion of deaths occurring in that month not being registered till January) February had the least number of deaths, 1,542, followed by November with 1,714.
AGES AT DEATH—Deaths registered during the year 1965 are shown according to age in the following tables.
| Age, in Years | Males | Females | Total |
|---|---|---|---|
| Under 1 | 698 | 476 | 1,174 |
| 1-4 | 147 | 121 | 268 |
| 5-9 | 71 | 40 | 111 |
| 10-14 | 61 | 46 | 107 |
| 15-19 | 150 | 51 | 201 |
| 20-24 | 136 | 52 | 188 |
| 25-29 | 126 | 60 | 186 |
| 30-34 | 141 | 68 | 209 |
| 35-39 | 186 | 98 | 284 |
| 40-44 | 281 | 201 | 482 |
| 45-49 | 386 | 265 | 651 |
| 50-54 | 653 | 398 | 1,051 |
| 55-59 | 965 | 539 | 1,504 |
| 60-64 | 1,255 | 682 | 1,937 |
| 65-69 | 1,400 | 939 | 2,339 |
| 70-74 | 1,489 | 1,205 | 2,694 |
| 75-79 | 1,743 | 1,594 | 3,337 |
| 80-84 | 1,494 | 1,604 | 3,098 |
| 85-89 | 876 | 1,254 | 2,130 |
| 90-94 | 332 | 480 | 812 |
| 95-99 | 61 | 128 | 189 |
| 100 and over | 8 | 16 | 24 |
| Totals | 12,659 | 10,317 | 22,976 |
The Maori population is a very young one compared with the non-Maori and as a result there is a considerable variation in the proportions of Maori deaths which take place at various ages to the proportions of non-Maori deaths at various ages. Thus it follows that there is a considerable difference in the proportion of Maori deaths in the total of deaths at various ages, and whereas at preschool, school, adolescent, and early working ages the Maori contributes substantially to the total of all deaths, in old age the Maori percentage is almost insignificant. The following table illustrates these points for the year 1965.
| Age, in Years | Number of Deaths | Percentage of Total Deaths | Percentage of Maori Deaths in Total Deaths per Age Group | ||
|---|---|---|---|---|---|
| Non-Maori | Maori | Non-Maori | Maori | ||
| Under 5 | 1,131 | 311 | 5.20 | 25.55 | 21.57 |
| 5-14 | 179 | 39 | 0.82 | 3.20 | 17.89 |
| 15-24 | 323 | 66 | 1.49 | 5.42 | 16.97 |
| 25-44 | 1,025 | 136 | 4.71 | 11.18 | 11.71 |
| 45-64 | 4,790 | 353 | 22.01 | 29.01 | 6.86 |
| 65 and over | 14,311 | 312 | 65.77 | 25.64 | 2.13 |
| Totals | 21,759 | 1,217 | 100.00 | 100.00 | 5.30 |
Considerable changes have taken place over the last 30 years in the age distribution of persons dying. The movement in the proportions of deaths occurring at the different age groups is very striking. The results of three main factors are illustrated, viz, health measures, which have achieved an immense saving of young life; the fluctuations in the birthrate over the period; and the great increase in the proportion of old people in the community.
| Age, in Years | Number of Deaths | Percentage of Total | ||||||
|---|---|---|---|---|---|---|---|---|
| 1935 | 1,945 | 1,955 | 1,965 | 1,935 | 1,945 | 1,955 | 1,965 | |
| Under 1 | 1,128 | 1,449 | 1,365 | 1,174 | 8.25 | 8.19 | 7.10 | 5.11 |
| 1-4 | 429 | 405 | 319 | 268 | 3.14 | 2.29 | 1.66 | 1.17 |
| 5-9 | 198 | 187 | 132 | 111 | 1.45 | 1.06 | 0.69 | 0.48 |
| 10-14 | 170 | 150 | 101 | 107 | 1.24 | 0.85 | 0.53 | 0.47 |
| 15-19 | 254 | 215 | 151 | 201 | 1.86 | 1.22 | 0.79 | 0.87 |
| 20-24 | 355 | 267 | 187 | 188 | 2.60 | 1.51 | 0.97 | 0.82 |
| 25-29 | 324 | 282 | 181 | 186 | 2.37 | 1.60 | 0.94 | 0.81 |
| Age, in Years | Number of Deaths | Percentage of Total | ||||||
|---|---|---|---|---|---|---|---|---|
| 1935 | 1945 | 1955 | 1965 | 1935 | 1945 | 1955 | 1965 | |
| 30-34 | 316 | 243 | 195 | 209 | 2.31 | 1.37 | 1.01 | 0.91 |
| 35-39 | 326 | 363 | 287 | 284 | 2.39 | 2.05 | 1.49 | 1.24 |
| 40-44 | 425 | 396 | 365 | 482 | 3.11 | 2.24 | 1.90 | 2.10 |
| 44-49 | 585 | 638 | 593 | 651 | 4.28 | 3.61 | 3.08 | 2.83 |
| 50-54 | 804 | 761 | 870 | 1,051 | 5.88 | 4.30 | 4.52 | 4.57 |
| 55-59 | 1,008 | 1,144 | 1,094 | 1,504 | 7.38 | 6.47 | 5.69 | 6.55 |
| 60-64 | 1,177 | 1,763 | 1,451 | 1,937 | 8.61 | 9.97 | 7.55 | 8.43 |
| 65-69 | 1,384 | 2,135 | 2,168 | 2,339 | 10.13 | 12.07 | 11.28 | 10.18 |
| 70-74 | 1,374 | 2,328 | 2,745 | 2,694 | 10.06 | 13.16 | 14.28 | 11.73 |
| 75-79 | 1,322 | 2,084 | 3,003 | 3,337 | 9.68 | 11.78 | 15.62 | 14.52 |
| 80 and over | 2,085 | 2,876 | 4,018 | 6,253 | 15.26 | 16.26 | 20.90 | 27.21 |
| Totals | 13,664 | 17,686 | 19,225 | 22,976 | 100.00 | 100.00 | 100.00 | 100.00 |
During the earlier period covered by the next table the fall in the death rate was common to all ages and to both sexes. In more recent years, however, there has been a tendency for the male rates at ages over 65 years to be static or show a slight increase. Of special significance are the low rates recorded in infancy and childhood and in the early adult life age groups in recent years despite the inclusion of Maori figures, which are considerably higher than the non-Maori. The female rate for the various age groups is now lower than the male rate in all instances. The increase in the death rate at successive age groups from 15 years onward is well exemplified.
| Year | Under 1* | 1-4 | 5-14 | 15-24 | 25-34 | 35-44 | 45-54 | 55-64 | 65-74 | 75 and Over |
|---|---|---|---|---|---|---|---|---|---|---|
* Per 1,000 live births in this case. * Non-Maori figures only as Maori deaths at ages not available for these years. | ||||||||||
| (Rates per 1,000 of mean population in each age group) | ||||||||||
| Males | ||||||||||
| 1901† | 78.60 | 6.81 | 1.89 | 3.52 | 3.97 | 6.16 | 11.94 | 23.12 | 50.59 | 141.67 |
| 1911† | 63.48 | 5.36 | 1.91 | 2.42 | 3.87 | 6.27 | 11.02 | 20.83 | 53.22 | 130.58 |
| 1921† | 53.10 | 4.78 | 1.85 | 2.44 | 3.56 | 5.55 | 9.61 | 19.96 | 46.17 | 128.60 |
| 1931† | 38.21 | 2.83 | 1.35 | 2.28 | 2.77 | 4.64 | 8.69 | 18.25 | 44.18 | 130.57 |
| 1941 | 43.65 | 4.39 | 1.36 | 2.53 | 2.93 | 3.95 | 9.20 | 21.13 | 47.44 | 140.27 |
| 1951 | 31.69 | 1.87 | 0.75 | 1.82 | 1.95 | 3.15 | 7.57 | 20.46 | 47.52 | 121.66 |
| 1961 | 25.86 | 1.34 | 0.49 | 1.28 | 1.47 | 2.68 | 7.39 | 19.65 | 47.33 | 126.31 |
| 1964 | 21.90 | 1.33 | 0.45 | 1,20 | 1.43 | 2.63 | 7.58 | 19.97 | 47.97 | 139.85 |
| 1965 | 22.44 | 1.14 | 0.47 | 1.31 | 1.66 | 2.82 | 7.44 | 20.47 | 48.03 | 134.41 |
| Female | ||||||||||
| 1901† | 63.87 | 5.50 | 1.64 | 3.58 | 4.72 | 6.70 | 10.62 | 19.44 | 43.32 | 127.98 |
| 1911† | 48.74 | 5.37 | 1.48 | 2.76 | 4.34 | 4.92 | 8.38 | 17.89 | 40.44 | 119.60 |
| 1921† | 42.31 | 4.49 | 1.31 | 2.34 | 3.38 | 4.46 | 8.00 | 14.88 | 36.81 | 120.23 |
| 1931† | 25.67 | 2.47 | 0.97 | 1.85 | 3.20 | 3.81 | 6.84 | 15.36 | 36.83 | 122.87 |
| 1941 | 37.75 | 3.84 | 1.20 | 1.94 | 2.44 | 3.50 | 6.90 | 15.04 | 38.60 | 118.92 |
| 1951 | 23.09 | 1.59 | 0.54 | 0.89 | 1.30 | 2.27 | 5.67 | 13.85 | 32.80 | 109.79 |
| 1961 | 19.50 | 1.16 | 0.35 | 0.53 | 0.87 | 1.95 | 4.59 | 11.22 | 29.89 | 104.74 |
| 1964 | 16.13 | 1.02 | 0.31 | 0:59 | 0.74 | 1.88 | 4.50 | 10.66 | 28.63 | 105.28 |
| 1965 | 16.37 | 0.98 | 0.32 | 0.49 | 0.83 | 1.90 | 4.71 | 11.22 | 28.17 | 102.94 |
| Both Sexes | ||||||||||
| 1901† | 71.40 | 6.17 | 1.77 | 3.55 | 4.33 | 6.40 | 11.37 | 21.63 | 47.87 | 135.71 |
| 1911† | 56.31 | 5.36 | 1.70 | 2.58 | 4.09 | 5.64 | 9.82 | 19.55 | 47.74 | 126.13 |
| 1921† | 47.82 | 4.64 | 1.58 | 2.39 | 3.47 | 5.10 | 8.85 | 17.59 | 41.90 | 124.84 |
| 1931† | 32.15 | 2.65 | 1.17 | 2.07 | 2.98 | 4.22 | 7.80 | 16.88 | 40.56 | 126.87 |
| 1941 | 39.81 | 4.12 | 1.28 | 2.22 | 2.67 | 3.72 | 8.02 | 18.16 | 43.04 | 129.15 |
| 1951 | 27.54 | 1.73 | 0.65 | 1.36 | 1.63 | 2.71 | 6.67 | 17.03 | 39.93 | 115.26 |
| 1961 | 22.76 | 1.25 | 0.42 | 0.91 | 1.18 | 2.31 | 6.00 | 15.41 | 37.67 | 114.01 |
| 1964 | 19.10 | 1.18 | 0.38 | 0.90 | 1.09 | 2.26 | 6.04 | 15.31 | 37.16 | 119.49 |
| 1965 | 19.51 | 1.07 | 0.39 | 0.91 | 1.26 | 2.37 | 6.07 | 15.84 | 36.94 | 115.68 |
The average (arithmetic mean) age at death of non-Maori persons of each sex at 10-yearly intervals, since 1901 and during each of the latest four years is as follows:
| Year | Males | Females |
|---|---|---|
| age (years) | ||
| 1901 | 41.64 | 37.68 |
| 1911 | 46.17 | 42.37 |
| 1921 | 48.45 | 46.97 |
| 1931 | 54.14 | 55.48 |
| 1941 | 58.65 | 59.60 |
| 1951 | 61.58 | 65.25 |
| 1961 | 63.80 | 67.32 |
| 1962 | 64.35 | 68.77 |
| 1963 | 64.58 | 68.75 |
| 1964 | 64.74 | 69.29 |
| 1965 | 64.24 | 69.28 |
There has been a striking upward movement in the average age at death of non-Maoris since 1901. A noticeable feature is that in the earlier years the age for females was considerably lower than that for males, the margin gradually narrowing until virtual equality was reached in 1927-28, since when the female average age at death has been higher than the male.
The average age at death of Maoris in 1965 was 40.32 and 42.16 years for males and females respectively. The great disparity between Maori figures and those for non-Maoris quoted in the above table is of course due in the main to the small numbers of persons at older ages in the Maori population and the comparatively large numbers at younger ages. This factor combined with high death rates in infancy and childhood produces a low average age at death.
EXPECTATION OF LIFE—Life tables depicting the pattern of mortality over the age span of life for the non-Maori component of New Zealand's population have been constructed at various times since 1880. The most recent tables are based on the 1961 population census, together with mortality statistics for 1960-62. As the pattern of mortality among non-Maoris has stabilised in recent years, these latest life tables give an accurate statistical summary of current mortality experience.
Life tables contain a measure of the degree of longevity of the population called the “expectation of life”. The expectation of life at any age is the average remaining lifetime for persons of this age, assuming that mortality rates at each age continue at the level shown by the life table. The life expectancy at selected ages at the present time, for the non-Maori population in New Zealand, is shown in the table below. The overall longer span of life enjoyed by females, compared with males, is evident, as is the improvement in life expectancy once the first year of life is survived.
| LIFE EXPECTANCY FOR NON-MAORI POPULATION, SELECTED AGES | ||
|---|---|---|
| Exact Age (Years) | Life Expectancy (Years) | |
| Males | Females | |
| 0 | 69.17 | 74.75 |
| 1 | 69.68 | 74.74 |
| 2 | 68.82 | 73.84 |
| 3 | 67.88 | 72.91 |
| 4 | 66.93 | 71.96 |
| 5 | 65.97 | 70.99 |
| 10 | 61.12 | 66.11 |
| 15 | 56.26 | 61.21 |
| 20 | 51.53 | 56.33 |
| 25 | 46.86 | 51.46 |
| 30 | 42.12 | 46.59 |
| 40 | 32.73 | 37.06 |
| 50 | 23.86 | 27.89 |
| 60 | 16.09 | 19.39 |
| 70 | 9.96 | 11.98 |
| 80 | 5.49 | 6.43 |
| 90 | 2.63 | 3.09 |
| 100 | 1.17 | 1.35 |
Improvement in non-Maori life expectancy since 1880, for both sexes, has been most striking for the younger ages, but has been relatively small for the advanced ages. Progress in medical science, coupled with improved social conditions, has resulted in substantial reductions in mortality among infants and children from infectious diseases: on the other hand, diseases of middle and old age are less amenable to control. It is unlikely, therefore, that increases in life expectancy in the future will occur on the scale of the past. The next table displays the life expectancy revealed by each life table compiled since 1880 for the three exact ages of 0, 20, and 60 years.
| IMPROVEMENT IN NON-MAORI LIFE EXPECTANCY SINCE 1880 | ||||||
|---|---|---|---|---|---|---|
| Life Table | Life Expectancy (Years) | |||||
| Males Aged Exactly | Females Aged Exactly | |||||
| 0 | 20 | 60 | 0 | 20 | 60 | |
| 1880-92 | 54.44 | 44.55 | 14.95 | 57.26 | 46.39 | 16.39 |
| 1891-95 | 55.29 | 45.47 | 15.06 | 58.09 | 47.19 | 16.55 |
| 1896-1900 | 57.37 | 46.34 | 15.33 | 59.95 | 47.91 | 16.54 |
| 1901-05 | 58.09 | 46.74 | 15.40 | 60.55 | 48.23 | 16.64 |
| 1906-10 | 59.17 | 47.20 | 15.51 | 61.76 | 48.77 | 16.77 |
| 1911-15 | 60.96 | 47.61 | 15.54 | 63.48 | 49.14 | 16.72 |
| 1921-22 | 62.76 | 48.66 | 16.03 | 65.43 | 50.36 | 17.29 |
| 1925-27 | 63.99 | 48.93 | 15.79 | 66.57 | 50.96 | 17.23 |
| 1931 | 65.04 | 49.61 | 16.22 | 67.88 | 51.28 | 17.30 |
| 1934-38 | 65.46 | 49.89 | 16.06 | 68.45 | 52.02 | 17.49 |
| 1950-52 | 68.29 | 51.15 | 16.19 | 72.43 | 54.64 | 18.53 |
| 1955-57 | 68.88 | 51.44 | 16.19 | 73.88 | 55.87 | 19.16 |
| 1960-62 | 69.17 | 51.53 | 16.09 | 74.51 | 56.33 | 19.39 |
The table below compares the life expectancy at birth for the total population of New Zealand with that for selected overseas countries. In all cases the expectancies are the most recent available. (Source: United Nations Demographic Yearbook 1965).
| LIFE EXPECTANCY AT BIRTH, SELECTED COUNTRIES | |||
|---|---|---|---|
| Country | Period | Life Expectancy at Birth (Years) | |
| Males | Females | ||
| * Excluding full-blooded aborigines. | |||
| Australia* | 1953-55 | 67.14 | 72.75 |
| Canada | 1,961 | 68.35 | 74.17 |
| Denmark | 1962-63 | 70.3 | 74.4 |
| England and Wales | 1961-63 | 68.0 | 75.1 |
| France | 1,962 | 67.29 | 74.14 |
| Netherlands | 1956-60 | 71.4 | 74.8 |
| New Zealand | 1960-62 | 68.44 | 73.75 |
| Norway | 1956-60 | 71.32 | 75.57 |
| Scotland | 1,964 | 66.67 | 72.79 |
| Sweden | 1,962 | 71.32 | 75.39 |
| United States of America | 1,964 | 66.9 | 73.7 |
| U.S.S.R | 1962-63 | 65.0 | 73.0 |
The expectation of life at various ages for the Maori population is shown below. These expectations are taken from Maori Life Tables, 1960-62.
| LIFE EXPECTANCY FOR MAORI POPULATION, SELECTED AGES | ||
|---|---|---|
| Exact Age (Years) | Life Expectancy (Years) | |
| Males | Females | |
| 0 | 59.05 | 61.37 |
| 1 | 61.14 | 62.83 |
| 2 | 60.57 | 62.11 |
| 3 | 59.78 | 61.26 |
| 4 | 58.93 | 60.39 |
| 5 | 58.04 | 59.48 |
| 10 | 53.40 | 54.71 |
| 20 | 44.19 | 45.25 |
| 30 | 35.53 | 36.03 |
| 40 | 27.13 | 27.41 |
| 50 | 19.55 | 19.81 |
| 60 | 13.02 | 14.10 |
| 70 | 8.82 | 9.48 |
| 80 | 5.12 | 5.86 |
Life expectancy at birth for a Maori male increased by 1.82 years in the interval 1955-57 to 1960-62, with that for females increasing by 2.69 years. These increases are large but not as large as those over the period 1950-52 to 1955-57, when the increases were 3.18 years for males and 2.80 years for females. This is evidence that although Maori life expectancy is relatively low, it is improving at a fast though decreasing rate.
The expectation of life of Maoris is much shorter than that of the non-Maori population. A comparison at age 0 shows that life expectancy is 10.12 years greater for non-Maori males and 13.14 years greater for non-Maori females.
DEATHS BY CAUSES—The accuracy of death data even in medically certified deaths will be affected by two factors—the proportion of deaths in hospitals where diagnostic equipment is available and the proportion of deaths in which a post-mortem report is available for reference. In 1965, 62 percent of deaths of non-Maoris and 55 percent of deaths of Maoris took place in a hospital, and in 31 percent of non-Maori and 28 percent of Maori deaths a post-mortem was held. The Maori figure of post-mortems held is a little misleading as deaths from accident and violence form a much higher proportion of Maori deaths and in these circumstances a post-mortem is ordered to be held in almost every case. The lower proportion of deaths followed by an autopsy in Maoris is due to the traditional resistance to interference with a body after death, as well as to the high proportion of Maoris who live in rural areas where the services of a pathologist are not available to conduct post-mortem examinations.
The Seventh (1955) Revision of the International Statistical Classification of Diseases Injuries, and Causes of Death has been in use in New Zealand since 1958. The assignment of the cause of death is to the underlying cause. This is defined as (a) the disease or injury which initiated the train of morbid events leading directly to death, or (b) the circumstances of the accident or violence which produced the fatal injury. Both the terminal or immediate cause of death and the underlying cause are furnished on the death certificate, and the responsibility is on the physician or surgeon signing the medical certificate to indicate the train of events.
Total deaths and the rates per million of total population for the latest three years, classified according to the Abbreviated List of 50 Causes for Tabulation of Mortality, are contained in the following table. Certain diseases (cholera, plague, smallpox, typhus, and malaria) are not listed in the table as there were no deaths from these causes in the years shown. Certain causes of death of special significance and interest are discussed later in this subsection. These are tuberculosis, cancer, heart disease, puerperal causes, and violence, while the causes of infant mortality are surveyed in considerable detail.
| Causes of Death | Number of Deaths | Rate per Million of Mean Population | ||||||
|---|---|---|---|---|---|---|---|---|
| 1962 | 1963 | 1964 | 1965 | 1962 | 1963 | 1964 | 1965 | |
| Tuberculosis of respiratory system | 115 | 78 | 80 | 75 | 46 | 31 | 31 | 28 |
| Tuberculosis, other forms | 20 | 15 | 16 | 11 | 8 | 6 | 6 | 4 |
| Syphilis and its sequelae | 10 | 10 | 9 | 10 | 4 | 4 | 4 | 4 |
| Typhoid fever | - | 1 | 1 | - | - | - | - | - |
| Dysentery, all forms | 1 | - | 3 | 1 | - | - | 1 | - |
| Scarlet fever and streptococcal sore throat | - | 1 | 1 | - | - | - | - | - |
| Diphtheria | 1 | - | - | - | - | - | - | - |
| Whooping cough | 2 | - | 1 | 3 | 1 | - | - | 1 |
| Meningococcal infections | 16 | 10 | 11 | 15 | 6 | 4 | 4 | 6 |
| Acute poliomyelitis | - | - | - | - | - | - | - | - |
| Measles | 5 | 7 | 4 | 11 | 2 | 3 | 2 | 4 |
| All other diseases classified as infective and parasitic | 82 | 80 | 81 | 73 | 33 | 31 | 31 | 28 |
| Malignant neoplasms, including neoplasms of lymphatic and haematopoietic tissues | 3,597 | 3,752 | 3,674 | 3,817 | 1,446 | 1,475 | 1,414 | 1,442 |
| Benign and unspecified neoplasms | 40 | 42 | 30 | 38 | 16 | 17 | 12 | 14 |
| Diabetes mellitus | 277 | 309 | 313 | 261 | 111 | 121 | 121 | 99 |
| Anaemias | 63 | 87 | 63 | 68 | 25 | 34 | 24 | 26 |
| Vascular lesions affecting central nervous system | 2,729 | 2,776 | 2,757 | 2,875 | 1,097 | 1,092 | 1,061 | 1,086 |
| Non-meningococcal meningitis | 45 | 36 | 52 | 40 | 18 | 14 | 20 | 15 |
| Rheumatic fever | 8 | 15 | 9 | 16 | 3 | 6 | 4 | 6 |
| Chronic rheumatic heart disease | 243 | 226 | 209 | 207 | 98 | 89 | 80 | 78 |
| Arteriosclerotic and degenerative heart disease | 6,119 | 6,506 | 6,644 | 6,646 | 2,459 | 2,558 | 2,557 | 2,510 |
| Other diseases of the heart | 845 | 821 | 862 | 886 | 340 | 323 | 332 | 335 |
| Hypertension with heart disease | 394 | 377 | 344 | 365 | 158 | 148 | 132 | 138 |
| Hypertension without mention of heart | 100 | 92 | 94 | 107 | 40 | 36 | 36 | 40 |
| Influenza | 191 | 41 | 149 | 24 | 77 | 16 | 57 | 9 |
| Pneumonia | 1,219 | 1,120 | 1,366 | 1,178 | 490 | 440 | 526 | 445 |
| Bronchitis | 580 | 632 | 731 | 689 | 233 | 249 | 281 | 260 |
| Ulcer of stomach and duodenum | 149 | 157 | 145 | 144 | 60 | 62 | 56 | 54 |
| Appendicitis | 27 | 22 | 16 | 17 | 11 | 9 | 6 | 6 |
| Intestinal obstruction and hernia | 142 | 163 | 123 | 150 | 57 | 64 | 47 | 57 |
| Gastritis, duodenitis, enteritis, and colitis, except diarrhoea of the newborn | 129 | 122 | 109 | 119 | 52 | 48 | 42 | 45 |
| Cirrhosis of liver | 63 | 59 | 74 | 79 | 25 | 23 | 28 | 30 |
| Nephritis and nephrosis | 144 | 144 | 148 | 139 | 58 | 57 | 57 | 53 |
| Hyperplasia of prostate | 117 | 99 | 88 | 73 | 47 | 39 | 34 | 28 |
| Complications of pregnancy, childbirth, and the puerperium | 19 | 26 | 20 | 13 | 8 | 10 | 8 | 5 |
| Congenital malformations | 348 | 353 | 269 | 306 | 140 | 139 | 104 | 115 |
| Birth injuries, post-natal asphyxia, and atelectasis | 270 | 294 | 292 | 244 | 109 | 115 | 112 | 92 |
| Infections of the newborn | 41 | 39 | 33 | 47 | 16 | 15 | 13 | 18 |
| Other diseases peculiar to early infancy and immaturity unqualified | 359 | 305 | 313 | 291 | 144 | 120 | 121 | 110 |
| Senility without mention of psychosis, ill-defined, and unknown causes | 122 | 122 | 128 | 139 | 49 | 48 | 49 | 53 |
| All other diseases | 2,061 | 2,082 | 2,138 | 2,170 | 828 | 819 | 823 | 820 |
| Motor-vehicle accidents | 420 | 420 | 445 | 551 | 169 | 165 | 171 | 208 |
| All other accidents | 738 | 715 | 773 | 804 | 297 | 281 | 298 | 304 |
| Suicide and self-inflicted injury | 208 | 244 | 207 | 242 | 84 | 96 | 80 | 91 |
| Homicide and operations of war | 22 | 16 | 36 | 32 | 9 | 6 | 14 | 12 |
| Totals | 22,081 | 22,416 | 22,861 | 22,976 | 8,874 | 8,814 | 8,799 | 8,679 |
In a variety of conditions and in external causes of death the mortality rate for Maoris is very much higher than the non-Maori experience. Much of this disparity is concealed, however, by crude rates which are calculated by dividing the total population into the number of deaths from any particular disease or circumstance. With two populations so very dissimilar in age structure as are the two races in New Zealand (at ages under five years non-Maoris are seven times more numerous than Maoris, but at ages 75 years and upward they are 83 times as numerous), it is necessary to resort to an adjustment of Maori rates so that the figures for any condition become directly comparable in any particular year. This has been done in the following table by firstly calculating age-specific rates for the Maori and then applying these to the non-Maori population, age group to age group. This computation provides an “expected” number of Maori deaths in each age group and these added together and then divided by the non-Maori population give an adjusted rate. In addition to the rates expressed per million of population the absolute numbers of deaths in the two races are furnished for the same 50 causes.
| Causes of Death | Number of Deaths | Rates per Million of Population (Non-Maori: Crude Rate—Maori: Adjusted Rate) | ||||||
|---|---|---|---|---|---|---|---|---|
| 1964 | 1965 | 1964 | 1965 | |||||
| Non-Maori | Maori | Non-Maori | Maori | Non-Maori | Maori | Non-Maori | Maori | |
| Tuberculosis of respiratory system | 61 | 19 | 62 | 13 | 25 | 312 | 25 | 192 |
| Tuberculosis, other forms | 7 | 9 | 7 | 4 | 3 | 69 | 3 | 40 |
| Syphilis and its sequelae | 9 | - | 7 | 3 | 4 | - | 3 | 33 |
| Typhoid fever | - | 1 | - | - | - | 9 | - | - |
| Dysentery, all forms | 3 | - | 1 | - | 1 | - | - | - |
| Scarlet fever and streptococcal sore throat | 1 | - | - | - | - | - | - | - |
| Diphtheria | - | - | - | - | - | - | - | - |
| Whooping cough | - | 1 | 3 | - | - | 3 | 1 | - |
| Meningococcal infections | 7 | 4 | 12 | 3 | 3 | 12 | 5 | 9 |
| Acute poliomyelitis | - | - | - | - | - | - | - | - |
| Measles | 3 | 1 | 6 | 5 | 1 | 3 | 3 | 15 |
| All other diseases classified as infective and parasitic | 64 | 17 | 62 | 11 | 26 | 99 | 25 | 73 |
| Malignant neoplasms, including neoplasms of lymphatic and haematopoietic tissues | 3,538 | 136 | 3,671 | 146 | 1,468 | 1,935 | 1,497 | 2,081 |
| Benign and unspecified neoplasms of unspecified nature | 26 | 4 | 34 | 4 | 11 | 39 | 14 | 42 |
| Diabetes mellitus | 302 | 11 | 248 | 13 | 125 | 188 | 101 | 218 |
| Anaemias | 61 | 2 | 68 | - | 25 | 6 | 28 | - |
| Vascular lesions affecting central nervous system | 2,685 | 72 | 2,815 | 60 | 1,114 | 1,326 | 1,148 | 1,037 |
| Non-meningococcal meningitis | 40 | 12 | 30 | 10 | 17 | 69 | 12 | 30 |
| Rheumatic fever | 4 | 5 | 10 | 6 | 2 | 20 | 4 | 22 |
| Chronic rheumatic heart disease | 171 | 38 | 169 | 38 | 71 | 438 | 69 | 422 |
| Arteriosclerotic and degenerative heart disease | 6,485 | 159 | 6,445 | 201 | 2,691 | 3,389 | 2,628 | 3,839 |
| Other diseases of the heart | 800 | 62 | 832 | 54 | 332 | 1,364 | 339 | 1,068 |
| Hypertension with heart disease | 324 | 20 | 342 | 23 | 134 | 374 | 139 | 464 |
| Hypertension without mention of heart | 89 | 5 | 100 | 7 | 37 | 52 | 41 | 104 |
| Influenza | 134 | 15 | 23 | 1 | 56 | 197 | 9 | 5 |
| Pneumonia | 1,278 | 88 | 1,069 | 109 | 530 | 907 | 436 | 1,047 |
| Bronchitis | 678 | 53 | 639 | 50 | 281 | 919 | 261 | 838 |
| Ulcer of stomach and duodenum | 139 | 6 | 135 | 9 | 58 | 79 | 55 | 172 |
| Appendicitis | 15 | 1 | 15 | 2 | 6 | 11 | 6 | 19 |
| Intestinal obstruction and hernia | 112 | 11 | 143 | 7 | 46 | 112 | 58 | 60 |
| Gastritis, duodenitis, enteritis, and colitis, except diarrhoea of the newborn | 82 | 27 | 101 | 18 | 34 | 90 | 41 | 54 |
| Cirrhosis of liver | 67 | 7 | 77 | 2 | 28 | 79 | 31 | 50 |
| Nephritis and nephrosis | 135 | 13 | 127 | 12 | 56 | 176 | 52 | 106 |
| Hyperplasia of prostate | 86 | 2 | 73 | - | 36 | 70 | 30 | - |
| Deliveries and complications of pregnancy, childbirth, and the puerperium | 14 | 6 | 9 | 4 | 6 | 40 | 4 | 22 |
| Congenital malformations | 235 | 34 | 273 | 33 | 97 | 115 | 111 | 115 |
| Birth injuries, post-natal asphyxia, and atelectasis | 249 | 43 | 214 | 30 | 103 | 133 | 87 | 90 |
| Infections of the newborn | 26 | 7 | 37 | 10 | 11 | 22 | 15 | 30 |
| Other diseases peculiar to early infancy and immaturity unqualified | 279 | 34 | 242 | 49 | 116 | 105 | 99 | 146 |
| Senility without mention of psychosis, ill defined, and unknown causes | 122 | 6 | 128 | 11 | 51 | 124 | 52 | 247 |
| All other diseases | 2,031 | 107 | 2,060 | 110 | 843 | 1,375 | 840 | 1,300 |
| Motor-vehicle accidents | 389 | 56 | 489 | 62 | 161 | 342 | 199 | 425 |
| All other accidents | 711 | 62 | 722 | 82 | 295 | 378 | 294 | 543 |
| Suicide and self-inflicted injury | 203 | 4 | 238 | 4 | 84 | 44 | 97 | 33 |
| Homicide and operations of war | 28 | 8 | 21 | 11 | 12 | 35 | 9 | 46 |
| Totals | 21,693 | 1,168 | 21,759 | 1,217 | 9,000 | 15,060 | 8,871 | 15,037 |
Age-specific rates and Maori age-adjusted rates have been published for a comprehensive list of diseases in Maori-European Standards of Health, one of a series of special reports issued by the Department of Health.
The comparatively poor state of health of the Maori is shown by the excess in the Maori adjusted rates for most diseases. As can be seen in the table, the absolute numbers of Maoris dying from any cause of death is small. This is because the Maori population has a high proportion of young people, and most diseases which cause death develop at the older ages.
The susceptibility of the Maori to epidemic and communicable disease is well known. Again there is a Maori excess mortality in cancer and diabetes. The disparity is even more marked in acute rheumatic fever and chronic rheumatic heart disease; in certain other forms of degenerative heart disease and hypertension; in both acute and chronic chest conditions, and in gastrointestinal and kidney infections. Recent health surveys have indicated that an inclination towards overnutrition, combined with a racial predisposition to excess weight, may underlie the early development of degenerative conditions and the high incidence of metabolic disorders.
In addition to the greater susceptibility to disease processes, the Maori shows a much higher accident rate. Especially accident prone is the Maori child and young adult, while proportionately many more Maoris are involved in road fatalities.
Tuberculosis—While there has been a remarkable reduction in tuberculosis mortality in recent years due to the introduction of modern drug treatment, this disease is far from eradicated and still takes its toll of life.
The following table shows the numbers of deaths from tuberculosis in 1965 by race, sex, and age groups. The disease has almost entirely disappeared as a cause of death in non-Maori children and 75 percent of the deaths occurred at ages upward of 45 years. In the Maori on the other hand there is a high proportion of the total deaths from tuberculosis occurring at young ages and in early adult life.
Of the 69 non-Maori deaths, 62 were due to respiratory tuberculosis and of the 17 Maori deaths, 13 were from a respiratory form.
| Age, in Years | Non-Maori | Maori | Total Population | ||||||
|---|---|---|---|---|---|---|---|---|---|
| Male | Female | Total | Male | Female | Total | Male | Female | Total | |
| Under 5 | - | 2 | 2 | - | - | - | - | 2 | 2 |
| 5-14 | - | - | - | - | - | - | - | - | - |
| 15-24 | 1 | - | 1 | - | - | - | 1 | - | 1 |
| 25-34 | 1 | 1 | 2 | 1 | 1 | 2 | 2 | 2 | 4 |
| 35-44 | 4 | 8 | 12 | 2 | 2 | 4 | 6 | 10 | 16 |
| 45-54 | 5 | 3 | 8 | 2 | 1 | 3 | 7 | 4 | 11 |
| 55-64 | 9 | 2 | 11 | 3 | 1 | 4 | 12 | 3 | 15 |
| 65-74 | 15 | 2 | 17 | 1 | 2 | 3 | 16 | 4 | 20 |
| 75-84 | 11 | 4 | 15 | 1 | - | 1 | 12 | 4 | 16 |
| 85 and over | 1 | - | 1 | - | - | - | 1 | - | 1 |
| Totals | 47 | 22 | 69 | 10 | 7 | 17 | 57 | 29 | 86 |
| All ages, rates per 100,000 of mean population | 3.8 | 1.8 | 2.8 | 10.1 | 7.3 | 8.7 | 4.3 | 2.2 | 3.2 |
The fall in tuberculosis mortality became steep from. 1945 onwards. The extent of this decline at various age levels in both numbers and rates is shown in the table which follows. All forms of tuberculosis are included and both sexes have been combined in the periods stated.
| Age Groups, in Years | Annual Average Number of Deaths | Rate per Million of Mean Population | ||||||||
|---|---|---|---|---|---|---|---|---|---|---|
| 1953-55 | 1956-58 | 1959-61 | 1962-64 | 1965 | 1953-55 | 1956-58 | 1959-61 | 1962-64 | 1965 | |
| Non-Maori | ||||||||||
| Under 5 | 8 | 3 | 2 | 2 | 2 | 37 | 14 | 8 | 5 | 7 |
| 5-14 | 2 | 2 | 1 | - | - | 6 | 4 | 2 | 1/2 | - |
| 15-24 | 4 | 3 | 1 | 1 | 1 | 16 | 12 | 3 | 1 | 3 |
| 25-44 | 46 | 31 | 13 | 11 | 14 | 84 | 56 | 22 | 17 | 24 |
| 45-64 | 82 | 61 | 39 | 29 | 19 | 212 | 148 | 89 | 57 | 40 |
| 65 and over | 78 | 61 | 36 | 35 | 33 | 415 | 307 | 181 | 175 | 153 |
| All ages | 220 | 161 | 92 | 78 | 69 | 112 | 77 | 42 | 31 | 28 |
| Maori | ||||||||||
| Under 5 | 17 | 10 | 3 | 4 | - | 703 | 354 | 84 | 112 | - |
| 5-14 | 5 | 3 | 1 | - | - | 150 | 83 | 15 | 6 | - |
| 15-24 | 9 | 5 | 2 | 1 | - | 364 | 181 | 77 | 31 | - |
| 25-44 | 28 | 16 | 11 | 8 | 6 | 969 | 515 | 304 | 202 | 141 |
| 45-64 | 25 | 20 | 12 | 15 | 7 | 2,142 | 1,516 | 860 | 881 | 405 |
| 65 and over | 14 | 16 | 7 | 6 | 4 | 4,530 | 5,066 | 2,185 | 1,720 | 1,102 |
| All ages | 98 | 70 | 36 | 34 | 17 | 762 | 491 | 224 | 186 | 87 |
Over a period both the non-Maori and the Maori rates have dropped dramatically; there has been the greatest reduction at ages under 25 years, with the Maori record the more impressive. The more chronic forms of tuberculosis remain a problem in middle and old age.
Latest international statistics from the United Nations Demographic Yearbook 1965 give the following mortality rates per 100,000 population for tuberculosis of the respiratory system for selected countries: Netherlands, 1.5; New Zealand, 3.1; Denmark, 2.7; Canada, 3.1; Australia, 3.5; United States, 4.0; Norway, 3.8; Sweden, 5.2; England and Wales, 4.7. Many other countries have much higher rates.
Cancer—A detailed report on cancer mortality and morbidity in New Zealand was issued in 1965 by the National Health Statistics Centre of the Department of Health. This report covers mortality from cancer from 1941 to 1964, and also surveys all cases reported to the National Cancer Registry by hospitals and by the various cancer clinics established in New Zealand under the auspices of the Cancer Society of New Zealand. In addition to discussion of the total cancer picture in New Zealand, an analysis is made by specific sites broken down under the following subheadings: the age and sex of new cases registered, incidence, survival experience, treatment stage of disease at time of diagnosis, and period elapsing between first symptoms and diagnosis. Under each of these headings a comparison is made of the New Zealand figures with those available from registries in some other countries, while in the principal sites the New Zealand mortality is contrasted with that of some 24 other countries of the world.
Attention is drawn to the transference, under the 1948 Revision of the International Classification, of Hodgkin's disease, leukaemia, etc., into the category of malignant disease. This classification was introduced in New Zealand in 1950, and all cancer figures quoted for that and subsequent years include these conditions.
Cancer is annually responsible for more deaths in New Zealand than any other cause other than diseases of the heart. While it is most prevalent in middle and old age, cancer is a leading cause of death at all ages, even among children and adolescents.
In 1965 there were 3,817 deaths from cancer, of which 146 were of Maoris. While the 1965 non-Maori crude cancer death rate of 149.7 was twice as high as the Maori crude rate of 75.1 (both per 100,000 of population), these figures are misleading as a measure of the incidence of malignant disease in the two races. When allowance is made for the comparatively few persons in the Maori population at older ages where cancer is most frequently diagnosed, it is seen that Maori cancer mortality is markedly higher than non-Maori cancer mortality. This fact is no indication at all that in general the Maori is more prone to cancer (in cancers of the intestines in both sexes and in two sites in the Maori female, the cervix and the lung, the incidence appears to be higher), but that there is more delay in reporting the symptoms of cancer by Maoris and that more cancer in Maoris goes untreated.
A summary for the latest 11 years in numbers and in rates, both crude and standardised, is provided in the following table.
| Year | Number of Deaths from Cancer | Crude Death Rate per 100,000 | Standardised Death Rate per 100,000* | Number of Deaths from Cancer | Crude Death Rate per 100,000 | Standardised Death Rate per 100.000* |
|---|---|---|---|---|---|---|
| * Standard population used for standardised rates—England and Wales, 1901. | ||||||
| Males | Females | |||||
| 1955 | 1,660 | 154.3 | 102.4 | 1,511 | 142.2 | 86.7 |
| 1956 | 1,684 | 153.4 | 105.7 | 1,471 | 135.6 | 83.4 |
| 1957 | 1,752 | 156.1 | 103,2 | 1,461 | 131.6 | 81.3 |
| 1958 | 1,743 | 151.6 | 101.5 | 1,554 | 136.8 | 85.8 |
| 1959 | 1,811 | 154.2 | 103.4 | 1,528 | 131.7 | 82.5 |
| 1960 | 1,724 | 144.3 | 97.6 | 1,566 | 132.5 | 81.3 |
| 1961 | 1,870 | 153.2 | 104.8 | 1,671 | 138.4 | 85.9 |
| 1962 | 1,936 | 154.7 | 107.5 | 1,661 | 134.3 | 83.2 |
| 1963 | 2,044 | 160.0 | 110.4 | 1,708 | 135.0 | 84.1 |
| 1964 | 1,962 | 150.3 | 107.7 | 1,712 | 132.4 | 79.2 |
| 1965 | 2,034 | 153.0 | 108.5 | 1,783 | 135.3 | 84.3 |
Up to 1963 there was a considerable increase in the numbers of persons dying from cancer in both sexes over the period, with an increase in both male and female crude death rates. However, a slight decrease is shown in the number and rates for males during 1964 and 1965.
Standardised rates are adopted to eliminate the distorting effect of the changes which take place over a period in the age constitution of the population. The standardised rate for males has risen from 103.2 in the five years 1955-59 to 107.8 in 1961-65. This would indicate that there has been a real increase in the death toll in the male sex and this, as is discussed later, is attributable to the rise in lung cancer. The average standardised figure for females over 1955-59 was 83.9 and compares with 83.3 in 1961-65, indicating that there has been a slight fall in the death rates during the 10-year period.
A classification of cancer deaths according to age subdivisions, race, and sex is now given. Ninety percent of the deaths from cancer during 1965 were at ages 45 years and upwards, and 55 percent were at ages 65 years and upwards.
| Age Group, in Years | Race | Males | Females | ||||
|---|---|---|---|---|---|---|---|
| Numbers | Rate per 100,000 of Population at Ages | Proportion of Total Deaths at Ages | Numbers | Rate per 100,000 of Population at Ages | Proportion of Total Deaths at Ages | ||
| Under 5 | Non-Maori | 14 | 10.1 | 2.1 | 10 | 7.5 | 2.1 |
| Maori | 2 | 10.5 | 1.1 | 2 | 10.9 | 1.6 | |
| 5-14 | Non-Maori | 18 | 7.1 | 16.8 | 24 | 9.9 | 32.9 |
| Maori | 1 | 3.4 | 4.0 | 4 | 13.9 | 30.8 | |
| 15-24 | Non-Maori | 12 | 6.0 | 5.1 | 12 | 6.3 | 14.0 |
| Maori | 3 | 17.0 | 6.1 | 4 | 22.8 | 23.5 | |
| 25-44 | Non-Maori | 130 | 42.6 | 19.7 | 132 | 45.6 | 36.3 |
| Maori | 8 | 37.5 | 10.7 | 22 | 103.3 | 34.9 | |
| 45-64 | Non-Maori | 637 | 266.5 | 20.9 | 619 | 256.3 | 35.7 |
| Maori | 24 | 263.4 | 11.9 | 28 | 343.1 | 18.5 | |
| 65 and over | Non-Maori | 1,153 | 1256.5 | 16.0 | 910 | 735.4 | 12.8 |
| Maori | 32 | 1616.2 | 17.2 | 16 | 969.7 | 12.7 | |
| All ages | Non-Maori | 1,964 | 159.5 | 16.5 | 1,707 | 139.7 | 17.4 |
| Maori | 70 | 70.9 | 9.7 | 76 | 79.4 | 15.3 | |
| * All ages crude rate. | |||||||
Maori rates specific to age are in general higher than the non-Maori equivalent, and especially is this so at ages between 45 and 64 years. These differences are concealed by the all ages or crude rate which is the lower in the Maori.
Cancer contributes substantially to the total of non-Maori deaths at all ages. At school ages of five to 14 years one non-Maori death in every four is due to cancer (mainly leukaemia and tumours of the brain), while in the non-Maori female from 25 to 64 years over one death in three is a cancer death.
For Maoris the proportions of cancer to total deaths are very much lower than the proportions for non-Maoris, by reason that the competing risks from other diseases are so very much higher. Whereas in the non-Maori easily the highest numbers of cancer deaths occur at ages upwards of 65 years, the highest numbers in the Maori are at ages from 45 to 64 years. This is because of the lower expectation of life which results in few Maoris coming through to old age.
A summary of all cancer deaths occurring in New Zealand during 1965 by location of the disease is shown in the table which follows. Figures by site for Maoris have not been separated as the numbers are so small for most sites. Rates for Maoris tend to be higher in cancers involving the digestive tract, the respiratory organs, and the female genital organs.
| CANCER DEATHS 1965 | ||||||
|---|---|---|---|---|---|---|
| Site of Disease | Numbers | Rates per Million of Mean Population | ||||
| Males | Females | Total | Males | Females | Total | |
| Buccal cavity and pharynx | 38 | 17 | 55 | 29 | 13 | 21 |
| Oesophagus | 48 | 28 | 76 | 36 | 21 | 29 |
| Stomach | 229 | 155 | 384 | 172 | 118 | 145 |
| Intestine, except rectum | 193 | 242 | 435 | 145 | 184 | 164 |
| Rectum | 137 | 76 | 213 | 103 | 58 | 80 |
| Larynx | 27 | 1 | 28 | 21 | 1 | 11 |
| Lung, bronchus, and trachea | 489 | 70 | 559 | 368 | 53 | 211 |
| Breast | 3 | 355 | 358 | 2 | 269 | 135 |
| Cervix uteri | - | 102 | 102 | - | 77 | 38 |
| Other and unspecified parts of uterus | - | 61 | 61 | - | 46 | 23 |
| Prostate | 197 | - | 197 | 148 | - | 74 |
| Skin | 40 | 36 | 76 | 30 | 27 | 29 |
| Bone and connective tissue | 24 | 20 | 44 | 18 | 15 | 17 |
| All other and unspecified sites | 424 | 449 | 873 | 319 | 341 | 330 |
| Leukaemia and aleukaemia | 85 | 89 | 174 | 64 | 68 | 66 |
| Lymphosarcoma and other neoplasms of lymphatic and haematopoietic system | 100 | 82 | 182 | 75 | 62 | 69 |
| Totals | 2,034 | 1,783 | 3,817 | 1,530 | 1,353 | 1,442 |
There is considerable variation in the numbers and rates for different sites in both males and females. The site principally involved in the male is the lung and bronchus and one male cancer death in every four is of this site. Cancer of the stomach is very much more common in the male than the female but the position is reversed in cancer involving the intestines. The leading site in the female is the breast, which also contributes one-fifth to the total female cancer deaths.
The world-wide phenomenal increase over the last 30 years in cancer of the lung and bronchus (excluding trachea and pleura) is accepted as being associated with cigarette smoking and atmospheric pollution. The following table shows the increase in deaths from cancers of this site in each race and in each sex over the latest 11 years.
| Year | Number of Deaths from Cancer of Lung and Bronchus | Crude Rate per 100,000 of Mean Population | ||||||
|---|---|---|---|---|---|---|---|---|
| Non-Maori | Maori | Non-Maori | Maori | |||||
| Male | Female | Male | Female | Male | Female | Male | Female | |
| 1955 | 286 | 36 | 13 | 1 | 28.4 | 3.6 | 19.1 | 1.5 |
| 1956 | 303 | 54 | 11 | 6 | 29.5 | 5.3 | 15.6 | 8.9 |
| 1957 | 345 | 39 | 12 | 7 | 32.9 | 3.8 | 16.4 | 10.0 |
| 1958 | 330 | 52 | 8 | 4 | 30.7 | 4.9 | 10.6 | 5.5 |
| 1959 | 350 | 53 | 13 | 3 | 31.9 | 4.9 | 16.6 | 4.0 |
| 1960 | 328 | 52 | 14 | 11 | 29.5 | 4.7 | 17.2 | 14.0 |
| 1961 | 386 | 70 | 18 | 5 | 34.0 | 6.2 | 21.1 | 6.1 |
| 1962 | 422 | 58 | 17 | 5 | 36.3 | 5.0 | 19.1 | 5.8 |
| 1963 | 448 | 68 | 18 | 12 | 37.8 | 5.8 | 19,5 | 13.4 |
| 1964 | 459 | 71 | 19 | 9 | 37.9 | 5.9 | 19.9 | 9.7 |
| 1965 | 469 | 57 | 20 | 13 | 38.1 | 4.7 | 20.3 | 13.6 |
The crude rates for the Maori conceal the true relative incidence of lung cancer. Adjusted to the non-Maori population structure, the Maori rates exceed the non-Maori rates, the greatest margin being in the female.
While cancer is undoubtedly increasing in numerical incidence it is not doing so out of proportion to the population exposed to the cancer risk. The following table shows the movement in the standardised death rates per 100,000 of population in selected sites averaged over four quinquennia from 1946. The standard population employed is that of England and Wales, 1901.
| Site | 1946-50 | 1951-55 | 1956-60 | 1961-65 | 1946-50 | 1951-55 | 1956-60 | 1961-65 |
|---|---|---|---|---|---|---|---|---|
| Male | Female | |||||||
| Buccal cavity and pharynx | 3.5 | 2.5 | 2.5 | 2.1 | 1.1 | 1.1 | 1.2 | 1.0 |
| Oesophagus | 3.3 | 2.9 | 2.5 | 2.5 | 1.4 | 1.6 | 1.2 | 1.3 |
| Stomach | 18.5 | 16.0 | 13.8 | 12.3 | 10.0 | 9.4 | 7.3 | 5.8 |
| Large intestine | 10.0 | 9.2 | 8.5 | 9.1 | 12.8 | 11.3 | 10.3 | 10.5 |
| Rectum | 5.5 | 5.3 | 5.8 | 5.8 | 4.2 | 3.7 | 3.8 | 4.0 |
| Biliary passages and liver | 1.4 | 2.0 | 2.1 | 2.2 | 1.8 | 2.3 | 2.3 | 2.2 |
| Pancreas | 5.1 | 4.8 | 5.1 | 5.6 | 3.3 | 3.2 | 2.8 | 3.1 |
| Larynx | 1.5 | 1.5 | 1.1 | 0.9 | 0.3 | 0.3 | 0.2 | 0.1 |
| Trachea, lung, bronchus | 10.8 | 16.5 | 20.6 | 24.9 | 1.7 | 2.3 | 2.8 | 3.4 |
| Breast | - | - | 0.1 | 0.2 | 17.7 | 17.6 | 16.2 | 18.0 |
| Uterus, all parts | - | - | - | - | 9.7 | 9.0 | 8.2 | 7.1 |
| Ovary, Fallopian tube | - | - | - | - | 6.0 | 5.4 | 6.1 | 6.0 |
| Prostate | 8.7 | 9.5 | 9.0 | 9.1 | - | - | - | - |
| Kidney | 2.2 | 2.3 | 2.7 | 2.7 | 1.4 | 1.5 | 1.5 | 1.2 |
| Bladder, urinary organs | 2.7 | 3.0 | 3.3 | 3.8 | 1.1 | 1.0 | 1.1 | 1.1 |
| Skin (including melanoma) | 2.6 | 2.4 | 2.3 | 2.4 | 1.6 | 1.5 | 1.7 | 1.9 |
| Brain, nervous system | 3.2 | 3.6 | 4.0 | 4.4 | 2.2 | 2.6 | 3.0 | 3.1 |
| Lymphosarcoma and reticulosarcoma | 2.1 | 2.6 | 3.2 | 2.9 | 1.2 | 1.5 | 1.7 | 2.0 |
| Hodgkin's disease | 1.5 | 1.4 | 1.4 | 1.6 | 0.7 | 0.9 | 0.9 | 1.1 |
| Leukaemia and aleukaemia | 4.9 | 5.3 | 5.4 | 5.8 | 3.6 | 3.7 | 4.5 | 4.3 |
| All sites | 95.1 | 98.6 | 102.3 | 107.8 | 86.5 | 86.3 | 82.8 | 83.3 |
The upward trend in the total male cancer death toll can be ascribed chiefly to the steep rise in lung and bronchus cancer, already commented upon. The total female rate has shown a declining tendency in more recent years although this trend may change as a result of the rise in female lung cancer.
Stomach cancer is clearly on the decline in both sexes and this is in accordance with the experience in several other countries. Some changes in the conditions of living are thought to underlie this drop in incidence.
The large intestine, another leading site, shows declining rates in both sexes. There is also a downward movement in the rates for the uterus. There is a tendency for cancer such as leukaemia and lymphosarcoma to increase slightly and again there has been evidence of this in other parts of the world.
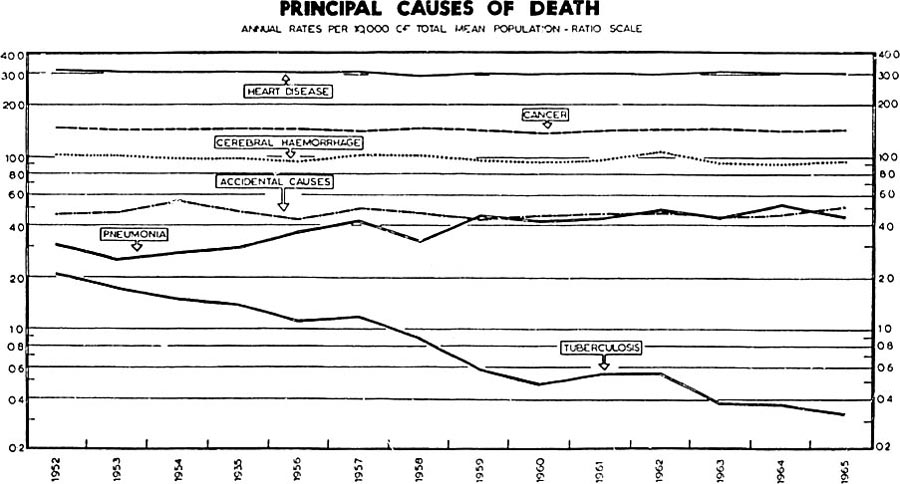
Heart Disease—Diseases of the heart are the leading killer in New Zealand, accounting for 37 percent of all male deaths and 33 percent of all female deaths in 1965. In accordance with the increasing numbers of the population in the older age groups, the total numbers of deaths from heart disease have steadily increased. However, when allowance is made for the general ageing of the population by employing standardised rates, it becomes evident that there has been small increase in the male rate of loss from heart conditions, and in fact in the female sex, there has been a slight fall in the rates for 1961-65 as against those in 1955-59.
A disease phenomenon of recent years has been the rapid increase in deaths assigned to coronary heart disease, and in 1965 no less than 25 percent of all deaths were due to this single disease entity. Comparing standardised rates for 1955-59 with those for the latest quinquennium of 1961-65 (non-Maoris only) the rise in the toll from male deaths assigned to coronary conditions has been 25 percent, with a higher increase still in the female of 27 percent. It is a matter of conjecture as to whether the real incidence of coronary heart disease in the community has risen to this extent or whether it is due in part at least to increased recognition of the condition.
The numbers and death rates for heart disease excluding acute rheumatic forms and congenital malformations for the last 11 years are shown in the following table, males and females separately (non-Maoris only).
| Year | All Forms of Heart Disease | Coronary Heart Disease | ||||||
|---|---|---|---|---|---|---|---|---|
| Males | Females | Males | Females | |||||
| Number | Standardised Rate per 100,000 of Population | Number | Standardised Rate per 100,000 of Population | Number | Standardised Rate per 100,000 of Population | Number | Standardised Rate per 100,000 of Population | |
| 1955 | 3,795 | 215 | 2,769 | 123 | 2,248 | 135 | 1,142 | 55 |
| 1956 | 3,923 | 214 | 2,790 | 117 | 2,450 | 142 | 1,188 | 55 |
| 1957 | 4,006 | 214 | 2,934 | 120 | 2,540 | 144 | 1,347 | 60 |
| 1958 | 3,958 | 210 | 2,887 | 116 | 2,644 | 148 | 1,384 | 61 |
| 1959 | 4,154 | 217 | 3,088 | 120 | 2,812 | 158 | 1,615 | 67 |
| 1960 | 4,172 | 220 | 3,055 | 118 | 2,983 | 165 | 1,681 | 70 |
| 1961 | 4,289 | 223 | 3,223 | 121 | 3,175 | 172 | 1,785 | 74 |
| 1962 | 4,254 | 225 | 3,073 | 115 | 3,124 | 171 | 1,776 | 71 |
| 1963 | 4,472 | 234 | 3,179 | 117 | 3,428 | 186 | 1,935 | 76 |
| 1964 | 4,576 | 238 | 3,204 | 116 | 3,561 | 191 | 2,037 | 78 |
| 1965 | 4,517 | 234 | 3,271 | 117 | 3,518 | 187 | 2,093 | 79 |
Coronary heart disease is predominantly a disease of old age in both sexes, although in the male sex there are appreciable numbers of deaths which occur in middle age. There are marked differences in the mortality from the disease both between the sexes and between the two races at various age periods.
The following table averages both the numbers and the age-specific rates for coronary heart disease in both non-Maori and Maori over the latest five years 1961-65.
| Race | Ages 35 to 44 Years | Ages 45 to 54 Years | Ages 55 to 64 Years | Ages 65 Years and Over | ||||
|---|---|---|---|---|---|---|---|---|
| Average Number of Deaths Each Year | Average Rate per 10,000 of Population at Ages | Average Number of Deaths Each Year | Average Rate per 10,000 of Population at Ages | Average Number of Deaths Each Year | Average Rate per 10,000 of Population at Ages | Average Number of Deaths Each Year | Average Rate per 10,000 of Population at Ages | |
| Males | ||||||||
| Non-Maori | 90 | 5.9 | 368 | 27.9 | 781 | 78.6 | 2,101 | 232.2 |
| Maori | 3 | 3.6 | 13 | 23.5 | 23 | 70.6 | 35 | 185.8 |
| Females | ||||||||
| Non-Maori | 14 | 0.9 | 71 | 5.4 | 245 | 24.4 | 1,587 | 132.7 |
| Maori | 2 | 2.3 | 10 | 20.0 | 13 | 51.2 | 23 | 144.3 |
For non-Maoris at ages 35 to 44 years male coronary heart disease rates exceed female rates by close to 6 to 1, the ratio decreasing as age advances to a ratio of under 2 to 1 at ages 65 years and upwards.
The absolute numbers of Maori deaths from the disease are small but when related to the population at risk produce rates fairly similar to the non-Maori population in the male sex.
Maori women have a very much greater chance of dying from a coronary condition than non-Maori women, the risk being three times greater at ages 35 to 44 years, four times greater at ages 45 to 54, and twice as great at ages 55 to 64 years. Hypertensive forms of heart disease are also very much more common in Maori women in middle age while both sexes in the Maori have a higher mortality from rheumatic valvular heart disease.
INTERNATIONAL COMPARISON OF PRINCIPAL CAUSES OF DEATH—In the following table the rates per million of mean population are given for principal causes of death for selected countries for the latest available year in each case.
| Country | Year | Rates per 1,000,000 of Population | |||||
|---|---|---|---|---|---|---|---|
| Heart Disease | Vascular Lesions of Central Nervous System | Cancer | Pneumonia | Accidental | Total Including Other | ||
| Japan | 1,963 | 794 | 1,716 | 1,057 | 239 | 410 | 6,992 |
| Canada | 1,963 | 2,756 | 816 | 1,327 | 306 | 543 | 7,799 |
| Netherlands | 1,963 | 2,337 | 973 | 1,780 | 156 | 398 | 8,000 |
| Bulgaria | 1,963 | 1,922 | 1,455 | 1,290 | 628 | 399 | 8,177 |
| South Africa | 1,961 | 2,229 | 919 | 1,362 | 481 | 376 | 8,631 |
| Australia | 1,963 | 3,215 | 1,152 | 1,354 | 289 | 491 | 8,693 |
| New Zealand | 1,965 | 3,061 | 942 | 1,442 | 445 | 512 | 8,679 |
| Finland | 1,963 | 3,233 | 1,271 | 1,570 | 201 | 568 | 9,248 |
| Norway | 1,962 | 2,875 | 1,533 | 1,649 | 513 | 484 | 9,431 |
| United States of America | 1,963 | 3,751 | 1,067 | 1,514 | 338 | 534 | 9,619 |
| Switzerland | 1,962 | 2,934 | 1,213 | 1,861 | 220 | 639 | 9,739 |
| Denmark | 1,962 | 3,134 | 1,200 | 2,160 | 318 | 482 | 9,756 |
| Czechoslovakia | 1,962 | 2,072 | 856 | 1,894 | 232 | 489 | 10,008 |
| Italy | 1,962 | 2,824 | 1,376 | 1,550 | 455 | 455 | 10,145 |
| Sweden | 1,962 | 3,600 | 1,314 | 1,909 | 443 | 456 | 10,155 |
| Northern Ireland | 1,963 | 4,204 | 1,532 | 1,627 | 510 | 353 | 10,995 |
| France | 1,963 | 2,221 | 1,392 | 2,032 | 316 | 671 | 11,584 |
| West Germany | 1,963 | 2,494 | 1,782 | 2,213 | 380 | 580 | 11,683 |
| England and Wales | 1,963 | 3,977 | 1,709 | 2,178 | 767 | 395 | 12,183 |
| Belgium | 1,962 | 2,670 | 904 | 2,338 | 267 | 531 | 12,229 |
| Scotland | 1,963 | 4,269 | 1,909 | 2,252 | 574 | 486 | 12,588 |
| Austria | 1,963 | 3,112 | 1,791 | 2,564 | 446 | 664 | 12,769 |
INFANT MORTALITY—Over a long period of years New Zealand has been renowned for the low rate of infant mortality in its non-Maori population, a fact attributable partly to such matters as climate, virility of the race, comparative absence of densely settled areas, etc., and partly to legislative and educative measures—the latter conducted by the State as well as by various organisations (one of the most important of these is the Royal New Zealand Society for the Health of Women and Children which was founded in 1907).
The trend in infant and peri-natal mortality in New Zealand up to the year 1961 and comparisons in causes with the rates of other countries who show improved figures on New Zealand's are contained in one of the Special Report Series issued by the National Health Statistics Centre of the Department of Health.
The infant-mortality rate of the non-Maori population of New Zealand is among the world's lowest, and recently has declined to a particularly low level. The Maori rate has shown a noticeable improvement in recent years. Infant-mortality figures are given in the next table.
| Year | Numbers | Rates per 1,000 of Live Births | ||||
|---|---|---|---|---|---|---|
| Non-Maori | Maori | Total | Non-Maori | Maori | Total | |
| 1940 | 990 | 372 | 1,362 | 30.21 | 87.22 | 36.78 |
| 1945 | 1,036 | 413 | 1,449 | 27.99 | 88.93 | 34.79 |
| 1950 | 1,008 | 356 | 1,364 | 22.75 | 69.74 | 27.60 |
| 1955 | 1,002 | 363 | 1,365 | 20.09 | 62.51 | 24.52 |
| 1960 | 1.090 | 330 | 1,420 | 19.66 | 44.50 | 22.59 |
| 1961 | 1,104 | 386. | 1,490 | 19.13 | 49.68 | 22.76 |
| 1962 | 1,034 | 297 | 1,331 | 17.99 | 38.75 | 20.44 |
| 1963 | 1,004 | 265 | 1,269 | 17.75 | 32.61 | 19.62 |
| 1964 | 954 | 239 | 1,193 | 17.50 | 30.04 | 19.10 |
| 1965 | 940 | 234 | 1,174 | 17.97 | 29.79 | 19.51 |
| 1966 | 844 | 221 | 1,065 | 16.13 | 28.03 | 17.68 |
Male rates of infant loss are about 28 percent above female rates and this tends to counterbalance the male excess in births.
In the following table New Zealand's infant mortality rates, for both races combined, are shown in comparison with the rates for other countries. The figures are averaged over the latest five years for which figures are available and the data has been extracted from the United Nations Demographic Yearbook 1964.
It is interesting to observe that Sweden has the distinction of having the lowest infant death rate in the world. Swedish figures have been based on local definitions of foetal death, livebirth, and infant death which would result in the rates being a slight understatement in a comparison with New Zealand's. Differences in definitions and practices exist also in some other countries.
| Country | Quinquennium | Deaths Under 1 Year per 1,000 Live Births |
|---|---|---|
| Sweden | 1960-64 | 15 |
| Netherlands | 1959-63 | 17 |
| Iceland | 1959-63 | 17 |
| Norway | 1958-62 | 19 |
| Australia | 1960-64 | 20 |
| Finland | 1960-64 | 20 |
| Denmark | 1960-64 | 20 |
| New Zealand | 1961-65 | 20 |
| England and Wales | 1960-64 | 21 |
| Switzerland | 1958-62 | 22 |
| Czechoslovakia | 1960-64 | 22 |
| United States | 1959-63 | 26 |
| Scotland | 1960-64 | 26 |
| France | 1960-64 | 26 |
| Japan | 1960-64 | 26 |
| Northern Ireland | 1960-64 | 27 |
| Canada | 1959-63 | 27 |
| Republic of Ireland | 1960-64 | 28 |
| South Africa (white) | 1959-63 | 29 |
| Belgium | 1959-63 | 29 |
| Cyprus | 1959-63 | 30 |
| China (Taiwan) | 1959-63 | 30 |
| West Germany | 1959-63 | 31 |
| Austria | 1960-64 | 33 |
| Hong Kong | 1960-64 | 35 |
| Bulgaria | 1960-64 | 37 |
| Italy | 1960-64 | 40 |
| Greece | 1959-63 | 40 |
| Hungary | 1960-64 | 45 |
| Poland | 1960-64 | 53 |
| Argentina | 1960-64 | 61 |
| Rumania | 1960-64 | 62 |
| Malaya | 1957-61 | 70 |
| Mexico | 1959-63 | 71 |
| Portugal | 1960-64 | 77 |
| Yugoslavia | 1960-64 | 82 |
| Guatemala | 1959-63 | 90 |
| Chile | 1959-63 | 116 |
One out of every five infant deaths is a Maori infant death and the Maori rate of loss is nearly twice that of the non-Maori. The excess in the Maori rate is very largely due to infants who die between the end of the fourth week of life and the first birthday. This is illustrated in the following table showing numbers and rates by race and age for the year 1965.
| Race | Under 1 Day | 1 Day and Under 1 Week | 1 Week and Under 28 Days | Total Under 28 Days | 28 Days and Under 12 Months | Total Under 1 Year |
|---|---|---|---|---|---|---|
| Non-Maori | 303 | 252 | 72 | 627 | 313 | 940 |
| Maori | 45 | 37 | 18 | 100 | 134 | 234 |
| All races | 348 | 289 | 90 | 727 | 447 | 1,174 |
| Rates per 1,000 Live Births | ||||||
| Non-Maori | 5.8 | 4.8 | 1.4 | 12.0 | 6.0 | 18.0 |
| Maori | 5.7 | 4.7 | 2.3 | 12.7 | 17.1 | 29.8 |
| All races | 5.8 | 4.8 | 1.5 | 12.1 | 7.4 | 19.5 |
The explanation of the higher rate for Maoris between the twenty-eighth day and the end of the first year is the susceptibility of the Maori baby in its generally inferior home environment to forms of infection such as gastro-enteritis and pneumonia.
The rates per 1,000 live births for the two sexes combined at different ages during the first year of life are now given for each of the last 11 years.
| Year | Under 1 Day | 1 Day and Under 2 Days | 2 Days and Under 1 Week | 1 Week and Under 28 Days | 28 Days and Under 12 Months | Under 1 Day | 1 Day and Under 2 Days | 2 Days and Under 1 Week | 1 Week and Under 28 Days | 28 Days and Under 12 Months |
|---|---|---|---|---|---|---|---|---|---|---|
| Non-Maori | Maori | |||||||||
| 1955 | 6.4 | 1.9 | 3.5 | 2.3 | 6.0 | 8.4 | 4.3 | 4.0 | 2.1 | 43.7 |
| 1956 | 6.5 | 1.5 | 3.6 | 1.8 | 6.0 | 9.9 | 2.9 | 4.7 | 2.4 | 34.4 |
| 1957 | 6.9 | 2.3 | 3.1 | 1.5 | 6.1 | 9.2 | 3.3 | 4.4 | 3.5 | 37.5 |
| 1958 | 6.8 | 1.8 | 3.0 | 2.0 | 5.8 | 10.8 | 3.5 | 4.2 | 3.5 | 32.4 |
| 1959 | 7.1 | 1.8 | 3.3 | 1.8 | 6.0 | 8.8 | 3.4 | 2.9 | 4.1 | 35.2 |
| 1960 | 7.5 | 2.2 | 3.2 | 1.6 | 5.2 | 9.8 | 2.6 | 2.6 | 2.3 | 27.2 |
| 1961 | 6.9 | 2.0 | 3.3 | 1.6 | 5.3 | 9.8 | 3.1 | 4.2 | 3.1 | 29.5 |
| 1962 | 6.2 | 2.0 | 3.0 | 1.2 | 5.6 | 6.6 | 3.4 | 2.5 | 2.5 | 23.8 |
| 1963 | 5.8 | 2.4 | 3.0 | 1.3 | 5.3 | 6.3 | 3.4 | 3.0 | 2.5 | 17.5 |
| 1964 | 6.6 | 2.3 | 2.1 | 1.3 | 5.2 | 7.7 | 1.6 | 1.6 | 1.8 | 17.3 |
| 1965 | 5.8 | 2.0 | 2.8 | 1.4 | 6.0 | 5.7 | 2.5 | 2.2 | 2.3 | 17.1 |
The following diagram illustrates infant mortality rates.
The next table shows the movement in the rates since 1922 in eight quinquennia and the period 1962 to 1965.
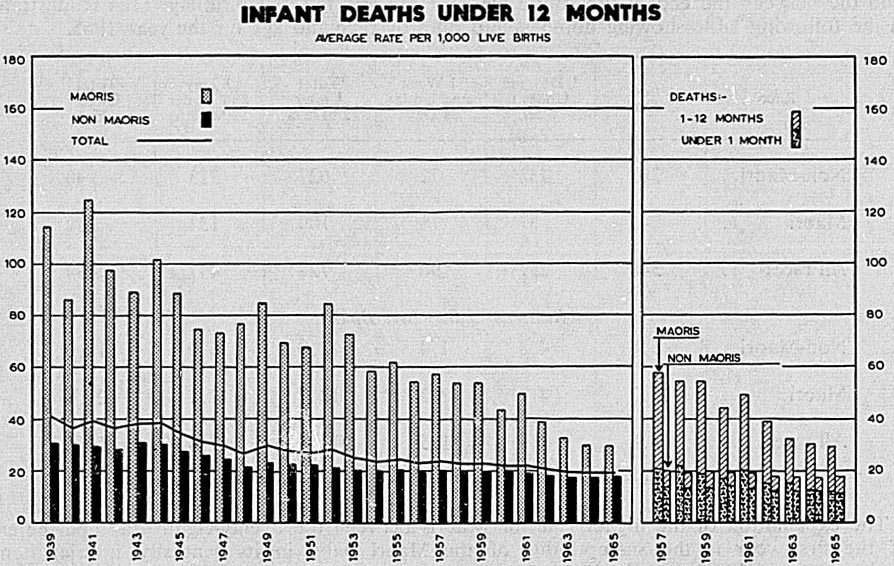
| Period | Neonatal Mortality (Under 28 Days) | Post-neonatal Mortality (28 Days and Under 12 Months) | Infant Mortality (Under 1 Year) | |||
|---|---|---|---|---|---|---|
| Non-Maori | Maori | Non-Maori | Maori | Non-Maori | Maori | |
| 1922-26 | 26.43 | 26.70 | 14.70 | 104.30 | 41.13 | 131.00 |
| 1927-31 | 24.26 | 25.64 | 10.90 | 86.92 | 35.16 | 112.56 |
| 1932-36 | 22.25 | 21.28 | 9.38 | 76.86 | 31.63 | 98.14 |
| 1937-41 | 21.94 | 26.71 | 9.51 | 86.13 | 31.45 | 112.84 |
| 1942-46 | 19.79 | 20.99 | 8.88 | 71.67 | 28.67 | 92.66 |
| 1947-51 | 16.73 | 26.11 | 6.53 | 48.48 | 23.26 | 74.59 |
| 1952-56 | 14.23 | 22.16 | 6.02 | 44.03 | 20.25 | 66.19 |
| 1957-61 | 13.92 | 19.77 | 5.68 | 32.20 | 19.60 | 51.97 |
| 1962-65 | 12.29 | 13.80 | 5.52 | 18.96 | 17.80 | 32.75 |
The sharp drop in rates in the post-war years reflects the general availability of antibiotics. Three conditions, prematurity, birth injury, and post-natal asphyxia, together cause about two-thirds of the total neonatal deaths. Factors which underlie the generally higher rates for Maoris are the higher proportion of Maori confinements outside of hospitals, more frequent child bearing, and a reluctance to seek and heed antenatal advice.
The Maori infant who survives the first month of life is especially susceptible to respiratory infections such as influenza, pneumonia, and bronchitis, and to gastro-intestinal disorders. Environmental factors and circumstances associated with the Maori way of life underlie the onset of these diseases, such as unsatisfactory feeding associated with failure to seek and act upon skilled advice from Plunket and district nurses on matters such as feeding, and also poor housing and sanitary conditions.
Causes of Infant Mortality—In the following table are shown the absolute numbers and the rates per 1,000 live births of the principal causes of infant mortality over the last two years in non-Maori and Maori and in both races combined.
| Cause of Death | Number of Deaths | Rate per 1,000 Live Births | ||||||
|---|---|---|---|---|---|---|---|---|
| 1964 | 1965 | 1964 | 1965 | |||||
| Non-Maori | Maori | Total | Non-Maori | Maori | Total | |||
| Influenza, pneumonia, and bronchitis | 146 | 159 | 1.7 | 6.5 | 2.3 | 2.0 | 7.3 | 2.6 |
| Congenital malformations | 182 | 223 | 2.9 | 3.1 | 2.9 | 3.8 | 3.2 | 3.7 |
| Birth injury | 120 | 95 | 1.9 | 2.3 | 1.9 | 1.6 | 1.4 | 1.6 |
| Asphyxia and atelectasis | 172 | 149 | 2.7 | 3.1 | 2.8 | 2.5 | 2.4 | 2.5 |
| Immaturity, unqualified | 126 | 135 | 2.0 | 2.1 | 2.0 | 2.0 | 3.8 | 2.2 |
| Other and undefined causes | 447 | 413 | 6.3 | 12.8 | 7.2 | 6.1 | 11.7 | 6.9 |
| Total causes | 1,193 | 1,174 | 17.5 | 30.0 | 19.1 | 18.0 | 29.8 | 19.5 |
There has been a considerable saving of life in Maori babies in almost all the leading causes over the last 10 years.
CAUSES OF STILL BERTH—A still-born child or late foetal death is defined in New Zealand as one “which has issued from its mother after the expiration of the twenty-eighth week of pregnancy and which was not alive at the time of such issue”. A certificate of the cause of death is required to be furnished for each still birth and also for cases of intermediate foetal deaths—i.e., deaths after the end of the twentieth but before the end of the twenty-eighth week of pregnancy. The certificates of causes of still birth and foetal death provide for both maternal and foetal causes to be entered.
The following table sets down the causes of the non-Maori still births registered during 1965.
| Causes of Still Birth | Number of Cases | ||
|---|---|---|---|
| Males | Females | Total | |
| Maternal Causes Chronic disease in mother | 14 | 10 | 24 |
| Acute disease in mother | 3 | 9 | 12 |
| Diseases and conditions of pregnancy and childbirth | 66 | 51 | 117 |
| Difficulties in labour | 22 | 13 | 35 |
| Other causes in mother | 3 | 1 | 4 |
| Totals | 108 | 84 | 192 |
| Foetal Causes Placental and cord conditions | 91 | 70 | 161 |
| Birth injury | 6 | 3 | 9 |
| Congenital malformations of foetus | 25 | 63 | 88 |
| Diseases of foetus and ill defined causes | 75 | 84 | 159 |
| Totals | 197 | 220 | 417 |
| Totals, all causes | 305 | 304 | 609 |
PERINATAL MORTALITY—Perinatal deaths comprise still births and deaths in the first week of life. Numbers and rates are shown in the following table. The still births and the perinatal mortality rate are calculated per 1,000 total births (still births plus live births), while the death rate for the first week of life is calculated per 1,000 live births. The rates have decreased steadily in recent years.
| Cause | Number | Rate | ||||||
|---|---|---|---|---|---|---|---|---|
| 1964 | 1965 | |||||||
| 1964 | 1965 | Non-Maori | Maori | Total | Non- | Non-Maori | Total | |
| Still births | 814 | 718 | 12.97 | 12.17 | 12.86 | 13.69 | 11.51 | 11.79 |
| Deaths under 1 week | 686 | 637 | 10.99 | 10.94 | 10.98 | 10.44 | 10.61 | 10.59 |
| Perinatal deaths | 1,500 | 1,355 | 23.81 | 22.97 | 23.71 | 23.98 | 21.99 | 22.25 |
PUERPERAL CAUSES—Improvements in the standard of antenatal care and obstetrical skill, as well as advances in medical science, have reduced the numbers of deaths from septic abortion, puerperal sepsis, and toxaemia, and deaths from complications of childbirth are few. A summary of maternal mortality from all puerperal causes, in triennial periods, is given in the following table together with figures for the latest year.
| Cause of Death | 1941-43 | 1944-46 | 1947-49 | 1950-52 | 1953-55 | 1956-58 | 1959-61 | 1962-64 | 1965 |
|---|---|---|---|---|---|---|---|---|---|
| Non-Maori | |||||||||
| Puerperal sepsis | 39 | 17 | 7 | 4 | 1 | 2 | 3 | 1 | 2 |
| Eclampsia and other toxaemias | 59 | 75 | 38 | 33 | 28 | 24 | 10 | 13 | - |
| Septic abortion | 66 | 42 | 22 | 14 | 9 | 8 | 12 | 7 | 2 |
| Accidents, haemorrhage, and other mortality | 106 | 126 | 82 | 53 | 34 | 43 | 40 | 24 | 5 |
| Total maternal mortality | 270 | 260 | 149 | 104 | 72 | 77 | 65 | 45 | 9 |
| Maternal mortality, excluding septic abortion | 204 | 218 | 127 | 90 | 63 | 69 | 53 | 38 | 7 |
| Maori | |||||||||
| Puerperal sepsis | 6 | 8 | 3 | 3 | 2 | 1 | - | 1 | - |
| Eclampsia and other toxaemias | 8 | 6 | 7 | 5 | 3 | 2 | 5 | 2 | 1 |
| Septic abortion | 8 | 3 | - | 3 | 3 | 2 | - | 1 | - |
| Accidents, haemorrhage, and other mortality | 24 | 30 | 27 | 20 | 21 | 24 | 15 | 16 | 3 |
| Total maternal mortality | 46 | 47 | 37 | 31 | 29 | 29 | 20 | 20 | 4 |
| Maternal mortality, excluding septic abortion | 38 | 44 | 37 | 28 | 26 | 27 | 20 | 19 | 4 |
| All Races | |||||||||
| Puerperal sepsis | 45 | 25 | 10 | 7 | 3 | 3 | 3 | 2 | 2 |
| Eclampsia and other toxaemias | 67 | 81 | 45 | 38 | 31 | 26 | 15 | 15 | 1 |
| Septic abortion | 74 | 45 | 22 | 17 | 12 | 10 | 12 | 8 | 2 |
| Accidents, haemorrhage, and other mortality | 130 | 156 | 109 | 73 | 55 | 67 | 55 | 40 | 8 |
| Total maternal mortality | 316 | 307 | 186 | 135 | 101 | 106 | 85 | 65 | 13 |
| Maternal mortality, excluding septic abortion | 242 | 262 | 164 | 118 | 89 | 96 | 73 | 57 | 11 |
The following table shows the progressive reduction that has been achieved in the rates of deaths due to puerperal causes.
| Year | Rate per 1,000 Live Births | ||
|---|---|---|---|
| Non-Maori | Maori | Total Population | |
| 1944 | 2.71 | 3.26 | 2.77 |
| 1945 | 2.24 | 1.90 | 2.20 |
| 1946 | 2.05 | 4.77 | 2.33 |
| 1947 | 1.07 | 2.21 | 1.18 |
| 1948 | 1.26 | 1.82 | 1.32 |
| 1949 | 1.02 | 3.46 | 1.27 |
| 1950 | 0.90 | 2.35 | 1.05 |
| 1951 | 0.69 | 0.76 | 0.70 |
| 1952 | 0.71 | 2.56 | 0.91 |
| 1953 | 0.54 | 1.45 | 0.64 |
| 1954 | 0.51 | 1.58 | 0.63 |
| 1955 | 0.44 | 2.07 | 0.61 |
| 1956 | 0.40 | 1.78 | 0.55 |
| 1957 | 0.67 | 1.35 | 0.75 |
| 1958 | 0.41 | 1.31 | 0.51 |
| 1959 | 0.49 | 1.26 | 0.58 |
| 1960 | 0.34 | 0.67 | 0.38 |
| 1961 | 0.33 | 0.77 | 0.38 |
| 1962 | 0.17 | 1.17 | 0.29 |
| 1963 | 0.37 | 0.62 | 0.40 |
| 1964 | 0.26 | 0.75 | 0.32 |
| 1965 | 0.17 | 0.51 | 0.22 |
DEATHS FROM EXTERNAL CAUSES—Deaths from external causes, apart from suicide, claim approximately 5 percent of the total deaths and again the Maori rate is higher than the non-Maori. The following table shows deaths from external causes for the three latest years classified according to the Intermediate List of the 1955 Revision of the International Classification. In this table falls on board ship and from horseback are included as transport fatalities.
| Causes of Death | Number of Deaths | Rate per Million of Mean Population | ||||
|---|---|---|---|---|---|---|
| 1963 | 1,964 | 1,965 | 1,963 | 1,964 | 1,965 | |
| Motor-vehicle accidents | 420 | 445 | 551 | 165 | 171 | 208 |
| Other transport accidents | 54 | 48 | 54 | 21 | 18 | 20 |
| Accidental poisoning | 46 | 48 | 67 | 18 | 18 | 25 |
| Accidental falls | 281 | 319 | 321 | 111 | 123 | 121 |
| Accidents caused by machinery | 35 | 57 | 34 | 14 | 22 | 13 |
| Accidents caused by fire and explosion of combustible material | 31 | 36 | 24 | 12 | 14 | 9 |
| Accidents caused by hot substance, corrosive liquid, steam, and radiation | 9 | 10 | 10 | 4 | 4 | 4 |
| Accidents caused by firearms | 18 | 15 | 16 | 7 | 6 | 6 |
| Accidental drowning and submersion | 118 | 114 | 147 | 46 | 44 | 56 |
| All other accidental causes | 123 | 126 | 131 | 48 | 48 | 50 |
| Homicide and injury purposely inflicted by other persons (not in war) | 15 | 33 | 29 | 6 | 13 | 11 |
| Totals | 1,150 | 1,251 | 1,384 | 452 | 481 | 523 |
The number of deaths recorded from all accidental causes in 1965 was 1355 corresponding to a rate of 5.12 per 10,000 of population.
Drownings are a leading cause of accidental death in New Zealand. Included in the preceding table for 1965 are 48 deaths from drowning due to accidents with small boats and five deaths involving principally the larger type of boat.
Transport Accidents—In classifying deaths attributable to transport accidents under the various subheadings shown in the following table the rule of assignment is that in fatalities due to collisions of railway trains and electric tram cars with motor vehicles, the death is assigned to the railway train or electric tram car as being the heavier and more powerful vehicle, For 1965 there were 14 deaths from such accidents, bringing the total number of deaths in cases where a motor vehicle was involved up to 565. In the case of collisions between motor vehicles and horse-drawn vehicles, the death is assigned to the motor vehicle.
The number and rate of deaths resulting from railway, tramway, motor vehicle, and aircraft accidents during each of the last 11 years are as follows.
| Year | Deaths Due to Accident | Rate per 10,000 of Mean Population | ||||||
|---|---|---|---|---|---|---|---|---|
| Railway | Tramway | Motor Vehicle | Aircraft | Railway | Tramway | Motor Vehicle | Aircraft | |
| 1955 | 46 | 2 | 345 | 9 | 0.22 | 0.01 | 1.61 | 0.04 |
| 1956 | 23 | 3 | 320 | 10 | 0.11 | 0.01 | 1.47 | 0.05 |
| 1957 | 35 | 2 | 389 | 22 | 0.16 | 0.01 | 1.74 | 0.10 |
| 1958 | 36 | 1 | 393 | 23 | 0.16 | - | 1.72 | 0.10 |
| 1959 | 28 | 1 | 348 | 9 | 0.12 | - | 1.49 | 0.04 |
| 1960 | 32 | 1 | 340 | 10 | 0.13 | - | 1.43 | 0.04 |
| 1961 | 26 | 2 | 393 | 13 | 0.11 | 0.01 | 1.62 | 0.05 |
| 1962 | 27 | - | 408 | 11 | 0.11 | - | 1.64 | 0.04 |
| 1963 | 16 | - | 416 | 20 | 0.06 | - | 1.64 | 0.08 |
| 1964 | 26 | 3 | 428 | 30 | 0.10 | 0.01 | 1.65 | 0.12 |
| 1965 | 14 | - | 551 | 26 | 0.05 | - | 2.08 | 0.10 |
In recent years the wide use of aircraft in agricultural operations such as aerial topdressing has resulted in a number of deaths from aircraft accidents.
Non-transport Accidents—The 1955 Revision of the International List makes provision for non-transport accidents (excluding therapeutic misadventure in treatment, complications following vaccination or inoculation, and late effects of injury and poisoning) to be grouped according to the place where the accident or poisoning occurred. The following table shows the deaths, both numbers and rates, for the latest three years, according to this classification.
| Place of Occurrence | Number | Rate per Million of Mean Population | ||||
|---|---|---|---|---|---|---|
| 1963 | 1964 | 1965 | 1963 | 1964 | 1965 | |
| Home (including home premises and vicinity and any non-institutional place of residence) | 312 | 316 | 333 | 123 | 122 | 125 |
| Farm (including buildings and land under cultivation, but excluding farm and home premises) | 46 | 63 | 37 | 18 | 24 | 14 |
| Mine and quarry | 6 | 10 | 5 | 2 | 4 | 2 |
| Industrial place and premises | 17 | 20 | 32 | 7 | 8 | 12 |
| Place for recreation and sport | 4 | 9 | 12 | 1 | 3 | 5 |
| Street and highway | 17 | 11 | 12 | 7 | 4 | 5 |
| Public building (building used by the general public or a particular group of the public) | 12 | 12 | 12 | 5 | 5 | 5 |
| Resident institution (homes, hospitals, etc.) | 74 | 87 | 101 | 29 | 33 | 38 |
| Other specified places | 102 | 111 | 105 | 40 | 43 | 39 |
| Place not specified | 19 | 40 | 42 | 7 | 15 | 16 |
| Totals | 609 | 679 | 691 | 239 | 261 | 261 |
One in every two fatal non-traffic accidents occurs in or about the home.
Falls are the chief cause of home fatalities, exacting a heavy toll of the aged and infirm. This is clearly illustrated in a special report on domestic accidents issued by the Department of Health in 1960. The second important cause of death in the home is asphyxia from regurgitation of food and inhalation of other objects, or mechanically from pillows and bedclothes; this is the principal hazard of the first six months of life, though a proportion of these deaths is probably due to some undisclosed respiratory infections. Almost all the home drowning fatalities are amongst toddlers between one and two years of age who fall into rivers, creeks, and ponds in the vicinity of the home.
Twenty of the 37 accidental deaths on farms in 1965 were caused by farm machinery (usually tractors). Further data regarding accidents will be found elsewhere in this volume (see Index). Later sections are devoted wholly to statistics of industrial and farm accidents.
Suicide—There were 238 suicidal deaths of non-Maoris in 1965-159 males and 79 females—the death rates per 100,000 of population being 11.4 for males and 5.6 for females. For Maoris there were four suicidal deaths in 1965-2 males and 2 females, the death rate per 100,000 of population being males 2.0, females 2.1.
Rates per 100,000 of population showing the age distributions, averaged over the years 1963, 1964, and 1965 are shown next for the total population.
| Sex | 10/14 | 15/19 | 20/24 | 25/29 | 30/34 | 35/39 | 40/44 | 45/49 | 50/54 | 55/59 | 60/64 | 65/69 | 70/74 | 75/79 | 80+ |
|---|---|---|---|---|---|---|---|---|---|---|---|---|---|---|---|
| Males | - | 2.3 | 10.4 | 10.1 | 12.1 | 12.3 | 20.6 | 29.0 | 25.8 | 26.8 | 30.4 | 18.7 | 34.5 | 27.2 | 23.6 |
| Females | - | 1.5 | 5.7 | 5.3 | 5.3 | 5.1 | 6.8 | 14.0 | 15.8 | 20.8 | 21.4 | 9.7 | 20.8 | 13.2 | 5.8 |
These figures show the typical increase in the suicide rates with increasing age and the fall in the female rate after the age of 75 years.
The next table presents the average, over three-yearly periods, of standardised non-Maori suicide rates per 100,000 of mean population.
| Annual Average During | Males | Females |
|---|---|---|
| 1924-26 | 17.5 | 4.5 |
| 1927-29 | 20.5 | 5.4 |
| 1930-32 | 20.6 | 4.6 |
| 1933-35 | 15.3 | 4.7 |
| 1936-38 | 13.4 | 4.9 |
| 1939-41 | 13.0 | 4.3 |
| 1942-44 | 10.9 | 4.9 |
| 1945-47 | 10.5 | 4.5 |
| 1948-50 | 11.1 | 4.6 |
| 1951-53 | 11.8 | 4.1 |
| 1954-56 | 10.6 | 4.2 |
| 1957-59 | 11.8 | 3.9 |
| 1960-62 | 11.6 | 4.3 |
| 1963-65 | 10.6 | 5.7 |
The following table provides an international comparison of suicide rates for various countries. The figures have been calculated from material in the United Nations Demographic Yearbooks.
| Country | Triennium | Rate per 100,000 of Population |
|---|---|---|
| Mexico | 1959-61 | 1.9 |
| Republic of Ireland | 1961-63 | 2.5 |
| Guatemala | 1961-63 | 3.0 |
| Northern Ireland | 1961-63 | 5.1 |
| Spain | 1961-63 | 4.2 |
| Italy | 1961-63 | 5.4 |
| Netherlands | 1961-63 | 6.5 |
| Norway | 1961-63 | 7.5 |
| Canada | 1961-63 | 7.4 |
| Bulgaria | 1961-63 | 8.4 |
| Scotland | 1961-63 | 8.5 |
| New Zealand | 1961-63 | 8.8 |
| Ceylon | 1960-62 | 10.4 |
| United States of America | 1961-63 | 10.7 |
| England and Wales | 1961-63 | 11.8 |
| Australia | 1961-63 | 13.8 |
| Belgium | 1961-63 | 14.0 |
| France | 1961-63 | 15.5 |
| Japan | 1961-63 | 17.5 |
| Sweden | 1961-63 | 18.0 |
| Switzerland | 1961-63 | 17.9 |
| Denmark | 1961-63 | 18.3 |
| West Germany | 1961-63 | 18.3 |
| Finland | 1961-63 | 20.6 |
| Austria | 1961-63 | 22.0 |
| Hungary | 1961-63 | 25.7 |
GENERAL—Marriage may be solemnised in New Zealand either by a person whose name is on the list of officiating ministers under the Marriage Act 1955, or before a duly appointed Registrar or Deputy Registrar of Marriages. A licence must be obtained from a Registrar of Marriages before a marriage by an officiating minister can be solemnised. Marriage by on officiating minister may be solemnised at any time between 6 o'clock in the morning and 8 o'clock in the evening. Marriage before a Registrar can be solemnised at any time during the hours the office of the Registrar is open for the transaction of public business; notice of intended marriage must be given to a Registrar of Marriages by one of the parties to the proposed marriage.
In the case of a person under 21 years of age, not being a widow or widower, the consent of parents or guardian is necessary. Consent of a Magistrate may also be given in cases of refusal by any person whose consent is required.
Since 1933 the minimum age for marriage has been 16 years of age. No marriage shall be deemed to be void, however, by reason only of an infringement of the minimum age.
Since 1 April 1952 it has been required under the Maori Purposes Act 1951 that every marriage to which a Maori is a party shall be solemnised in the same manner, and its validity shall be determined by the same law, as if each of the parties was a non-Maori.
Particulars regarding divorce will be found later in this subsection.
NUMBERS AND RATES—The numbers and rates of marriages during the last 20 years are now given.
| Year | Number | Rate per 1,000 of Population |
|---|---|---|
| 1947 | 19,047 | 10.59 |
| 1948 | 17,750 | 9.67 |
| 1949 | 17,354 | 9.27 |
| 1950 | 17,099 | 8.96 |
| 1951 | 16,915 | 8.69 |
| 1952 | 17,061 | 8.55 |
| 1953 | 17,224 | 8.41 |
| 1954 | 17,557 | 8.38 |
| 1955 | 17,795 | 8.32 |
| 1956 | 17,531 | 8.03 |
| 1957 | 17,614 | 7.89 |
| 1958 | 18,305 | 8.01 |
| 1959 | 18,315 | 7.84 |
| 1960 | 18,909 | 7.96 |
| 1961 | 19,426 | 8.01 |
| 1962 | 19,572 | 7.88 |
| 1963 | 19,856 | 7.83 |
| 1964 | 20,720 | 8.00 |
| 1965 | 21,702 | 8.23 |
| 1966 | 22,949 | 8.55 |
The high marriage rate in 1947 was due to the return of many thousands of men from overseas war service in 1945 and 1946.
Comparison with Other Countries—Marriage rates for certain countries for 1965 are given below. (Source: United Nations Monthly Bulletin of Statistics.)
| Country | Rate per 1,000 Mean Population |
|---|---|
| Australia | 8.2 |
| Austria | 7.8 |
| Belgium | 7.0 |
| Canada | 7.3 |
| Denmark | 8.8 |
| France | 7.1 |
| Germany, East | 7.6 |
| Germany, West | 8.3 |
| Hungary | 8.8 |
| Ireland, Republic | 5.8 |
| Israel | 7.7 |
| Italy | 7.7 |
| Japan | 9.7 |
| Mexico | 6.8 |
| Netherlands | 8.8 |
| New Zealand | 8.2 |
| Norway | 6.8 |
| Spain | 7.2 |
| Sweden | 7.8 |
| Switzerland | 7.6 |
| United Kingdom | 7.7 |
| United States | 9.2 |
| Yugoslavia | 8.9 |
MARITAL STATUS PRIOR TO MARRIAGE—The following table gives marital status prior to marriage for the latest five years.
| Year | Single | Widowed | Divorced | Total Persons Married | |||
|---|---|---|---|---|---|---|---|
| Bridegroom | Bride | Bridegroom | Bride | Bridegroom | Bride | ||
| 1961 | 17,368 | 17,346 | 857 | 881 | 1,201 | 1,199 | 38,852 |
| 1962 | 17,529 | 17,546 | 781 | 764 | 1,262 | 1,262 | 39,144 |
| 1963 | 17,796 | 17,797 | 774 | 800 | 1,286 | 1,259 | 39,712 |
| 1964 | 18,551 | 18,582 | 813 | 792 | 1,356 | 1,346 | 41,440 |
| 1965 | 19,531 | 19,580 | 766 | 844 | 1,405 | 1,278 | 43,404 |
The position is more easily seen by studying the percentages given in the next table.
| Year | Bridegrooms | Brides | ||||
|---|---|---|---|---|---|---|
| Single | Widowed | Divorced | Single | Widowed | Divorced | |
| percent | ||||||
| 1961 | 89.41 | 4.41 | 6.18 | 89.29 | 4.54 | 6.17 |
| 1962 | 89.56 | 3.99 | 6.45 | 89.65 | 3.90 | 6.45 |
| 1963 | 89.62 | 3.90 | 6.48 | 89.63 | 4.03 | 6.34 |
| 1964 | 89.53 | 3.92 | 6.55 | 89.68 | 3.82 | 6.50 |
| 1965 | 90.00 | 3.53 | 6.47 | 90.22 | 3.89 | 5.89 |
Divorce statistics at the end of this subsection show the numbers of decrees granted in recent years, the numbers varying from 1,400 to 1,900 a year. Widowed persons remarrying constituted 37 per 1,000 persons married in 1965.
The marital status of persons prior to marriage for each of the latest five years is next given.
| Year | Marriages Between Bachelors and | Marriages Between Widowers and | Marriages Between Divorced Men and | ||||||
|---|---|---|---|---|---|---|---|---|---|
| Spinsters | Widows | Divorced Women | Spinsters | Widows | Divorced Women | Spinsters | Widows | Divorced Women | |
| 1961 | 16,404 | 306 | 658 | 290 | 400 | 167 | 652 | 175 | 374 |
| 1962 | 16,615 | 257 | 657 | 271 | 346 | 164 | 660 | 161 | 441 |
| 1963 | 16,882 | 255 | 659 | 262 | 348 | 164 | 653 | 197 | 436 |
| 1964 | 17,587 | 251 | 713 | 253 | 376 | 184 | 742 | 165 | 449 |
| 1965 | 18,586 | 272 | 673 | 232 | 370 | 164 | 762 | 202 | 441 |
During the years 1938-40 there were 95 male divorcees who remarried for every 100 female divorcees who remarried. In the period 1963-65 more male divorcees that female divorcees remarried.
The number of widows per 100 widowers who remarried was 67 in 1938-40, but with a changed social outlook the position in 1963-65 was that 95 widows remarried for every 100 widowers.
AGES OF PERSONS MARRIED—The proportion of minors among persons marrying has been increasing over a fairly long period. In the latest year three brides in every seven were under 21 years of age, the proportion for grooms being one in seven.
Of the 43,404 persons married in 1965, 12,309 or 28.4 percent, were under 21 years of age; 17,068, or 39.3 percent, were returned as 21-24 years; 6,882, or 15.8 percent, as 25-29 years; 3,640, or 8.4 percent, as 30-39 years; and 3,505, or 8.1 percent, as 40 years of age or over. The following table relates to the year 1965.
| Age of Bridegroom, in years | Age of Bride, in Years | Total Bridegrooms | ||||||
|---|---|---|---|---|---|---|---|---|
| Under 21 | 21-24 | 25-29 | 30-34 | 35-39 | 40-44 | 45 and over | ||
| Under 21 | 2,575 | 332 | 27 | 1 | - | - | - | 2,935 |
| 21-24 | 5,091 | 4,005 | 412 | 31 | 6 | 1 | 1 | 9,547 |
| 25-29 | 1,412 | 2,437 | 792 | 157 | 40 | 12 | 3 | 4,853 |
| 30-34 | 222 | 525 | 426 | 226 | 70 | 27 | 11 | 1,507 |
| 35-39 | 57 | 152 | 241 | 184 | 131 | 78 | 40 | 883 |
| 40-44 | 12 | 45 | 79 | 97 | 93 | 117 | 88 | 531 |
| 45 and over | 5 | 25 | 52 | 75 | 139 | 198 | 952 | 1,446 |
| Total brides | 9,374 | 7,521 | 2,029 | 771 | 479 | 433 | 1,095 | 21,702 |
The recent trend is for persons to marry at younger ages. The following table shows since 1925 the proportions of men and women married at each age group to every 100 marriages.
| Period | Under 21 | 21-24 | 25-29 | 30-34 | 35-39 | 40-44 | 45 and Over | Totals |
|---|---|---|---|---|---|---|---|---|
| * Periods prior to 1950 are for non-Maoris only. | ||||||||
| Males | ||||||||
| 1925-29* | 3.49 | 28.04 | 34.49 | 14.33 | 7.70 | 4.48 | 7.47 | 100.00 |
| 1930-34* | 3.46 | 27.28 | 37.02 | 15.14 | 6.10 | 3.61 | 7.39 | 100.00 |
| 1935-39* | 2.68 | 25.91 | 38.26 | 16.46 | 6.75 | 3.22 | 6.72 | 100.00 |
| 1950-54 | 5.05 | 35.42 | 31.21 | 10.95 | 5.86 | 3.56 | 7.95 | 100.00 |
| 1955-59 | 7.18 | 36.68 | 29.44 | 11.21 | 4.81 | 2.97 | 7.71 | 100.00 |
| 1960-64 | 10.95 | 41.99 | 23.49 | 9.04 | 4.50 | 2.62 | 7.41 | 100.00 |
| 1965 | 13.52 | 43.99 | 22.36 | 6.95 | 4.07 | 2.45 | 6.66 | 100.00 |
| Females | ||||||||
| 1925-29* | 18.61 | 37.88 | 23.67 | 8.93 | 4.65 | 2.82 | 3.44 | 100.00 |
| 1930-34* | 18.67 | 38.51 | 24.79 | 8.22 | 3.85 | 2.40 | 3.56 | 100.00 |
| 1935-39* | 17.10 | 38.26 | 26.30 | 8.86 | 3.91 | 2.02 | 3.55 | 100.00 |
| 1950-54 | 25.78 | 38.65 | 16.85 | 6.96 | 4.12 | 2.59 | 5.05 | 100.00 |
| 1955-59 | 32.99 | 35.71 | 13.76 | 6.11 | 3.65 | 2.49 | 5.29 | 100.00 |
| 1960-64 | 39.63 | 35.19 | 10.13 | 4.42 | 3.05 | 2.21 | 5.37 | 100.00 |
| 1965 | 43.19 | 34.66 | 9.35 | 3.55 | 2.21 | 1.99 | 5.05 | 100.00 |
The average age (arithmetic mean) at marriage for both males and females has decreased fairly steadily in recent years. The figures for each of the latest 11 years are as follows.
| Year | Average Age at Marriage | |
|---|---|---|
| Bridegrooms | Brides | |
| 1955 | 28.99 | 25.67 |
| 1956 | 29.07 | 25.59 |
| 1957 | 28.97 | 25.48 |
| 1958 | 28.76 | 25.30 |
| 1959 | 28.70 | 25.26 |
| 1960 | 28.56 | 25.11 |
| 1961 | 28.29 | 24.90 |
| 1962 | 27.93 | 24.61 |
| 1963 | 27.93 | 24.63 |
| 1964 | 27.74 | 24.45 |
| 1965 | 27.43 | 24.24 |
The average ages of bachelors and spinsters at marriage are considerably lower than those shown in the preceding table, which covers all parties and is naturally affected by the inclusion of remarriages of widowed and divorced persons. The average ages of grooms and brides for each of the latest five years according to marital status were as shown in the next table.
| Year | Bridegrooms | Brides | ||||
|---|---|---|---|---|---|---|
| Bachelors | Divorced | Widowers | Spinsters | Divorced | Widows | |
| Years | ||||||
| 1961 | 25.88 | 42.29 | 57.45 | 22.69 | 38.51 | 49.85 |
| 1962 | 25.61 | 42.18 | 57.00 | 22.54 | 38.03 | 49.84 |
| 1963 | 25.59 | 42.91 | 57.00 | 22.53 | 38.40 | 49.71 |
| 1964 | 25.41 | 41.75 | 57.48 | 22.38 | 37.82 | 50.61 |
| 1965 | 25.17 | 42.39 | 57.48 | 22.21 | 37.46 | 51.11 |
The foregoing figures give the average age at marriage, but these do not correspond with the modal or popular age, if the age at which the most marriages are celebrated may be so termed. The modal age for brides (21) has remained unchanged for very many years, but in the case of bridegrooms the most popular age has varied, and for recent years it has been 21 to 24. The modal age for bridegrooms in 1965 was 23 years.
Marriages of Minors—Of every 1,000 men married in 1965, 135 were under 21 years of age, while 432 in every 1,000 brides were under 21.
In 2,575 marriages in 1965 both parties were given as under 21 years of age, in 6,799 marriages the bride was returned as a minor and the bridegroom as an adult, and in 360 marriages the bridegroom was a minor and the bride an adult.
The proportion of minors among persons marrying has been increasing over a fairly long period, and in the table below figures are given for the last five years.
| Totals | Age in Years | Totals | |||||
|---|---|---|---|---|---|---|---|
| 16 | 17 | 18 | 19 | 20 | Number | Rate per 100 Marriages | |
| Bridegrooms | |||||||
| 1961 | 8 | 98 | 284 | 593 | 1,107 | 2,090 | 10.76 |
| 1962 | 7 | 168 | 348 | 623 | 1,138 | 2,224 | 11.36 |
| 1963 | 8 | 103 | 323 | 691 | 1,082 | 2,207 | 11.12 |
| 1964 | 14 | 129 | 405 | 750 | 1,181 | 2,479 | 11.96 |
| 1965 | 28 | 151 | 503 | 883 | 1,370 | 2,935 | 13.52 |
| Brides | |||||||
| 1961 | 411 | 795 | 1,457 | 2,291 | 2,788 | 7,742 | 39.86 |
| 1962 | 401 | 965 | 1,586 | 2,072 | 2,794 | 7,818 | 39.94 |
| 1963 | 473 | 1,020 | 1,646 | 2,256 | 2,476 | 7,871 | 39.64 |
| 1964 | 506 | 1,124 | 1,733 | 2,443 | 2,661 | 8,467 | 40.86 |
| 1965 | 512 | 1,155 | 2,099 | 2,698 | 2,910 | 9,374 | 43.19 |
MARRIAGES BY MINISTERS OF VARIOUS CHURCHES—Of the 21,702 marriages performed in 1965, Church of England clergymen officiated at 5,579, Presbyterians at 5,126, Roman Catholics at 3,354, Methodists at 1,677, and clergymen of other churches at 1,790, while 4,176 marriages were solemnised by Registrars.
The following table shows the proportions of marriages by ministers of the largest churches and before Registrars in each of the seven latest years.
| Church | Percentage of Marriages | ||||||
|---|---|---|---|---|---|---|---|
| 1959 | 1960 | 1961 | 1962 | 1963 | 1964 | 1965 | |
| Church of England | 24.37 | 25.24 | 25.03 | 25.36 | 24.53 | 25.06 | 25.71 |
| Presbyterian | 25.39 | 25.80 | 24.60 | 24.55 | 24.29 | 23.68 | 23.62 |
| Roman Catholic | 15.29 | 14.93 | 15.11 | 14.81 | 14.87 | 14.95 | 15.45 |
| Methodist | 8.00 | 8.20 | 8.40 | 7.98 | 8.30 | 8.20 | 7.73 |
| Others | 7.24 | 7.51 | 7.70 | 7.80 | 8.32 | 8.36 | 8.25 |
| Before Registrars | 19.71 | 18.32 | 19.16 | 19.50 | 19.69 | 19.75 | 19.24 |
| Totals | 100.00 | 100.00 | 100.00 | 100.00 | 100.00 | 100.00 | 100.00 |
The foregoing figures must not be taken as an exact indication of the religious professions of the parties married, as it does not necessarily follow that both (or even one) of the parties are adherents of the Church whose officiating minister performed the ceremony, and persons married before Registrars may belong, in greater or lesser proportion, to any or none of the churches. Of the total population at the general census of 1961, 34.6 percent were recorded as adherents of the Church of England, 22.3 percent Presbyterian, 15.1 percent Roman Catholic, 7.2 percent Methodist, and 20.8 percent of other religions or of no religion, or who objected to state their religious profession.
NUMBER OF OFFICIATING MINISTERS—The number of names on the list of officiating ministers under the Marriage Act was 3,660 in January 1966 and the churches to which they belong are shown hereunder.
| Church | Number |
|---|---|
| Roman Catholic Church | 842 |
| Church of England | 675 |
| Presbyterian Church of New Zealand | 577 |
| Methodist Church of New Zealand | 355 |
| Salvation Army | 186 |
| Baptist | 180 |
| Ratana Church of New Zealand | 142 |
| Latter Day Saints | 96 |
| Brethren | 71 |
| Seventh Day Adventist | 52 |
| Ringatu Church | 48 |
| Associated Churches of Christ | 48 |
| Congregational Union | 38 |
| Jehovah's Witness | 31 |
| Assemblies of God | 27 |
| Absolute Reformed Maori Church of Aotearoa | 24 |
| Apostolic Church | 23 |
| Liberal Catholic Church | 19 |
| Commonwealth Covenant Church | 18 |
| Christian Revival Crusade | 13 |
| Reformed Churches of New Zealand | 11 |
| Evangelical Lutheran Concordia Conference | 11 |
| Elim Church | 11 |
| Evangelistic Church of Christ | 10 |
| Church of Te Kooti Rikirangi | 10 |
| Others | 142 |
| Total | 3,660 |
The Ratana Church of New Zealand, the Ringatu Church, the United Maori Mission, and the Church of Te Kooti Rikirangi are Maori organisations.
DISSOLUTION OF MARRIAGE AND NULLITY—From 1 January 1965 the Matrimonial Proceedings Act 1963 has been the governing legislation.
Divorce—A petition for divorce may be presented to the Supreme Court on one or more of 15 grounds, which include adultery, desertion, separation by agreement for not less than three years, separation by decree of separation or separation order for not less than three years, and the parties living apart for seven years and not likely to be reconciled. Only a very small percentage of divorces each year are concerned with the other 10 grounds not listed, as a subsequent table shows. Where the parties are separated or living apart one of the parties must have been resident in New Zealand for at least two years immediately preceeding the filing of the petition. The Court is required to give consideration to the possibility of reconciliation of the parties to the marriage.
Dissolution of a Voidable Marriage—Proceedings for the dissolution of a voidable marriage may be instituted by a person domiciled in New Zealand or a person whose spouse is domiciled in New Zealand on any of the following grounds, namely, that at the time of the marriage one of the parties was mentally defective, that the respondent was at that time suffering from communicable venereal disease, that the woman was then pregnant by some other man than the petitioner, or that some woman other than the petitioner was then pregnant by the respondent, or that the marriage has not been consummated because of the incapacity of either party or the respondent's wilful refusal. A decree of dissolution of a voidable marriage puts an end to the marriage from the date of the decree.
Nullity—In certain circumstances a marriage is void, that is it is of no effect whether or not proceedings in respect of it are taken in the Courts. A decree of nullity in respect of a void marriage may, however, be obtained if either party is domiciled or resident in New Zealand or the marriage was solemnised here. The grounds on which a marriage governed by New Zealand law is void are that at the time of the ceremony one of the parties was already married or did not give consent, that the parties were within the prohibited degree of relationship or that the marriage was not solemnised in due form. Any children of a void marriage are legitimate unless at the time of the conception of the child or at the time of the marriage (whichever was later) both parties knew the marriage was void.
Petitions filed and decrees granted by the Supreme Court in recent years are shown in the following table.
| Year | Dissolution or Nullity of Marriage | Judicial Separation | |||
|---|---|---|---|---|---|
| Petitions Filed | Decrees Nisi | Decrees Absolute | Petitions Filed | Decrees for Separation | |
| 1955 | 1,799 | 1,379 | 1,472 | 14 | 3 |
| 1956 | 1,891 | 1,568 | 1,449 | 8 | 5 |
| 1957 | 1,998 | 1,719 | 1,400 | 21 | 10 |
| 1958 | 2,084 | 1,805 | 1,751 | 19 | 13 |
| 1959 | 1,912 | 1,648 | 1,639 | 21 | 6 |
| 1960 | 2,058 | 1,627 | 1,648 | 9 | 5 |
| 1961 | 2,223 | 1,824 | 1,733 | 23 | 3 |
| 1962 | 2,186 | 1,790 | 1,755 | 20 | 6 |
| 1963 | 2,138 | 1,842 | 1,905 | 15 | 7 |
| 1964 | 2,234 | 1,916 | 1,894 | 14 | 5 |
| 1965 | 2,440 | 2,050 | 1,814 | 6 | 1 |
The next table gives the grounds (dissolution or nullity cases) of petitions and decrees during 1964 and 1963.
| Grounds | Petitions Filed | Decrees Absolute Granted | ||||||
|---|---|---|---|---|---|---|---|---|
| Husbands' Petitions | Wives' Petitions | Husbands' Petitions | Wives' Petitions | |||||
| 1964 | 1965 | 1964 | 1965 | 1964 | 1965 | 1964 | 1965 | |
| Separation by agreement for not less than three years | 517 | 542 | 588 | 623 | 360 | 379 | 446 | 415 |
| Separation by Court order or decree for not less than three years | 1 | - | - | - | 13 | 13 | 59 | 49 |
| Living apart for not less than seven years | 77 | 171 | 80 | 144 | 105 | 114 | 97 | 108 |
| Adultery | 429 | 384 | 257 | 273 | 388 | 290 | 198 | 200 |
| Desertion | 137 | 159 | 98 | 89 | 123 | 134 | 79 | 75 |
| Drunkenness with cruelty, failure to maintain, etc. | 3 | 2 | 14 | 16 | - | 1 | 2 | 4 |
| Murder | - | - | 1 | - | - | - | 2 | - |
| Insanity | 3 | 5 | 2 | 2 | 3 | 5 | 2 | 3 |
| Non-compliance with order for restitution of conjugal rights | 4 | - | - | - | 1 | 1 | 1 | - |
| Presumption of death | - | 1 | - | - | 1 | - | - | - |
| Sodomy, etc. | - | - | - | 1 | - | - | - | - |
| Nullity | - | - | - | - | 3 | 2 | - | 2 |
| Non-consummation | 12 | 9 | 8 | 7 | 4 | 7 | 5 | 4 |
| Bigamy | - | 1 | 2 | 3 | - | 1 | 2 | 2 |
| Rape | - | - | 1 | 1 | - | - | - | 3 |
| Conviction | - | - | - | 1 | - | - | - | - |
| Incest | - | - | - | 3 | - | - | - | 1 |
| Pregnant to another man | - | 2 | - | - | - | 1 | - | - |
| Drug addiction | - | - | - | 1 | - | - | - | - |
| Totals | 1,183 | 1,276 | 1,051 | 1,164 | 1,001 | 948 | 893 | 866 |
The figures shown for decrees absolute cover all such granted during the year, whether the antecedent decree nisi was granted in the same or in a previous year.
Over the five-year period 1961-65 inclusive, the average percentage of decrees absolute granted on wives' petitions (83.3), was greater than the percentage granted on husbands' petitions (79.1). It is of interest to point out that 1965 was only the fifth year since 1952 in which the number of decrees absolute granted on husbands' petitions was greater than the total granted on wives' petitions.
In 450 of the 1,814 cases where decrees absolute were granted during 1965 there was no living issue of the marriage. The number of living issue was one in 380 cases, two in 416 cases, three in 278 cases, and four or more in 290 cases.
The table which follows shows the duration of marriage in all cases for which decrees absolute were granted in the latest five years.
| Duration of Marriage, in Years | Husband's Decrees Absolute Granted | Wives' Decrees Absolute Granted | ||||||||
|---|---|---|---|---|---|---|---|---|---|---|
| 1961 | 1962 | 1963 | 1964 | 1965 | 1961 | 1962 | 1963 | 1964 | 1965 | |
| Under 5 | 66 | 78 | 81 | 80 | 73 | 50 | 55 | 55 | 62 | 71 |
| 5-9 | 238 | 237 | 269 | 278 | 236 | 226 | 202 | 222 | 270 | 228 |
| 10-14 | 207 | 225 | 205 | 217 | 178 | 191 | 208 | 254 | 173 | 194 |
| 15-19 | 134 | 155 | 145 | 189 | 178 | 153 | 155 | 188 | 162 | 134 |
| 20-29 | 168 | 174 | 178 | 175 | 203 | 174 | 158 | 203 | 168 | 179 |
| 30 and over | 68 | 61 | 57 | 62 | 80 | 58 | 47 | 48 | 58 | 60 |
| Totals | 881 | 930 | 935 | 1,001 | 948 | 852 | 825 | 970 | 893 | 866 |
The number of living issue affected by the decrees absolute of their parents during each of the last five years was as follows: 1961, 3,052; 1962, 3,041; 1963, 3,356; 1964, 3,503; and 1965, 3,478.
MARRIAGE GUIDANCE—A National Marriage Guidance Council was established in 1950 as a voluntary agency to assist with social problems rising from unhappy and ill-adjusted family units. In 1959 an adviser in marriage guidance was appointed to the staff of the Justice Department, an advisory committee set up, and a training programme for voluntary marriage counsellors commenced with the help of voluntary advisers from professional groups.
By 1966 there were 100 trained counsellors.
There are 20 Councils affiliated with the National Marriage Guidance Council and a full programme of counselling and educational work is followed over the year. Education work has been started in a number of post-primary schools, and courses for engaged couples are regular features of most councils.
GENERAL—Since 1900, when the control and supervision of public health services was centralised in a Department of State, an efficient organisation has been built up throughout New Zealand covering all the traditional areas of environmental health.
In the period following the Second World War services have been extended into newer fields to include radiation protection, occupational health, and health education. Departmental services are provided in all districts, however remote, and free public health information and advice are available to all.
The period 1900 to 1920 saw steady progress in the building up of public health services now that the essential basic structure had been created. Legislation was passed dealing with the sale of food and drugs, the registration of professional groups, and the control of quackery. Sanatoria were established, school medical services developed, and problems of maternal and infant health attacked. The first link between preventive and curative medicine was made in 1909 with the merging of the former Hospital and Charitable Aid Department with the new Department of Public Health.
In this period there was an increasing public interest taken in health matters, and, as a result, a number of voluntary health organisations were established with the objects of promoting better knowledge of infant welfare, first aid, and home nursing.
The influenza epidemic of 1918–19 brought to light a number of defects in the public health organisation, particularly the need for a simplification of legislation and the need for a clear definition of the duties of local authorities, hospitals boards, and the Department of Public Health. The result of this experience was the passing of the Health Act 1920, which established the Department of Health in its present form, returned to local authorities a measure of responsibility for environmental health, and encouraged them to employ appropriate staff. To meet new needs and changing public attitudes, the professional resources of the Department were strengthened. Health education activity was intensified, a Medical Research Council was sponsored, and the number of groups subject to professional registration was extended. New health districts were created, and the existing activities of the Department were expanded. Among the more important of the new activities of the Department was the establishment of a school dental service in 1920 and, in 1937, the institution of the Medical Research Council.
Developments since the Second World War included a more positive attack on tuberculosis marked by the passing of the Tuberculosis Act 1948, the establishment as a Government agency of the National Radiation Laboratory at Christchurch, and the creation of the National Health Institute in Wellington. At the end of 1947 the Mental Hospitals Department ceased to be a separate Government Department, and became the Division of Mental Health of the Department of Health.
The Health Act 1956 consolidated and amended the law relating to public health.
A more detailed outline of the development of public health services in New Zealand up to 1939 will be found in the annual report of the Department of Health for that year, and the best general history may be found in Challenge for Health, by F. S. Maclean; New Zealand, Government Printer, 1964.
ORGANISATION OF PUBLIC HEALTH SERVICES: Local Authorities—Part II of the Health Act 1956 lays definite obligations on local authorities in regard to public health. Each local authority must either appoint its own health inspectors or contribute to the salary of an inspector of the Department of Health. Each inspector must hold a certificate of the Royal Society for the Promotion of Health before he can be appointed. A local authority's responsibility in health matters is wide. It must promote and conserve the public health within its district—a function which includes regular inspections of its district; abatement of nuisances as defined in the Health Act; provision of efficient refuse, nightsoil, and sanitary services; protection and purification of water supplies; closing and demolition of insanitary buildings; registration and regulation of various kinds of premises and the enforcement of certain minimum sanitary requirements for such premises and for residences. It may also make bylaws dealing with public health matters.
Department of Health—The Department is organised into the following Divisions: Public Health, Nursing, Hospitals (described in Section 5B), Clinical Services, Dental Health, and Mental Health (Section 5c).
New Zealand as a whole is divided into 19 health districts, each under the control of a medical officer of health, a medical practitioner with special qualifications in sanitary science.
The Department is required to ensure effective planning, execution, and co-ordination of measures necessary to promote public health. It administers all Acts relating to public health; it advises local authorities on public health; it must do whatever is possible to prevent, limit, or suppress disease; it promotes research into public health fields and the prevention and treatment of disease; it conducts health publicity and organises and controls medical, dental, and nursing services paid for from public funds. With the authority of the Minister, a medical officer of health may exercise very wide powers in the event of an epidemic or serious outbreak of infectious disease, including the requisitioning of land and buildings, prohibition of public gatherings, and controlling the movements of cases and contacts of any infectious disease. Certain diseases, mostly infectious, but including some non-communicable, must be notified by medical practitioners. Provisions relating to quarantine are included in the Health Act; and extensive power is given to make regulations relating to the conservation and promotion of public health.
The Health Act provides for a Board of Health. The Board, in addition to its traditional responsibilities in relation to local authorities and their sanitary works, now has the much wider function of giving the Minister authoritative advice on the broad aspects of public health policy and the relationship between the various health services.
In addition to the Health Act 1956, the following Acts are administered by the Department:
| Burial and Cremation Act 1964 | Narcotics Act 1965 |
| Dentists Act 1936 | Nurses and Midwives Act 1945 |
| Dietitians Act 1950 | Occupational Therapy Act 1949 |
| Food and Drugs Act 1947 | Opticians Act 1928 |
| Hospitals Act 1957 | Physiotherapy Act 1949 |
| Human Tissue Act 1964 | Plumbers and Gasfitters Registration Act 1964 |
| King George the Fifth Memorial Children's Health Camps Act 1953 | Poisons Act 1960 |
| Medical Advertisements Act 1942 | Radiation Protection Act 1965 |
| Medical Practitioners Act 1950 | Social Security Act 1964 (Part II) |
| Medical Research Council Act 1950 | Tuberculosis Act 1948 |
| Mental Health Act 1911 |
A detailed report of the activities of the Department of Health is given in the annual report of the Director-General of Health (parliamentary paper H. 31).
The net expenditure of the Department in the two latest years is given in the following table.
| Item | 1964–65 | 1965–66 | Increase or Decrease |
|---|---|---|---|
| NOTE—Minus sign (-) denotes a decrease. | |||
| $(000) | |||
| Vote: Health— | |||
| General health services | 4,574 | 4,651 | 77 |
| Dental health | 3,373 | 3,633 | 260 |
| Health education | 69 | 68 | -1 |
| Medical Research Council | 267 | 323 | 56 |
| Homes for the aged | 1,266 | 940 | -326 |
| Pensioners' housing: Local authorities | 961 | 883 | -78 |
| Youth hostels | 245 | 236 | -8 |
| Plunket Societies subsidies | 400 | 412 | 12 |
| Miscellaneous grants and subsidies | 276 | 244 | -32 |
| Bursaries | 148 | 153 | 5 |
| Totals | 11,579 | 11,544 | -35 |
| Vote: Health Benefits— | |||
| Maternity, medical, pharmaceutical, etc., benefits | 32,858 | 35,372 | 2,514 |
| Vote: Hospitals— | |||
| Mental hospitals | 13,576 | 14,584 | 1,008 |
| Other departmental hospitals and institutions | 1,045 | 1,123 | 77 |
| Public hospitals: Grants to hospital boards | 73,267 | 83,810 | 10,543 |
| Private hospitals | 3,716 | 4,303 | 587 |
| Totals | 91,604 | 103,819 | 12,214 |
| Grand totals | 136,042 | 150,735 | 14,693 |
| Less Departmental receipts | 1,136 | 1,156 | 19 |
| 134,905 | 149,580 | 14,674 | |
Information on hospitals is given in Sections 5B and 5c, while information on medical, hospital, and other related benefits, which are administered by the Department of Health, is given in Section 6A (Social Security).
PUBLIC HEALTH—The Division of Public Health is responsible for activities under the following headings: Communicable disease and health education, food and drugs (including medical advertisements, poisons, narcotics, nutrition), health protection (including maternal health and child health), environmental health (including food hygiene, plumbing, and drainage), burial and cremation, water supply and sewage disposal, air pollution (including clean air and chemical works), and occupational health.
The Director of the Division is assisted by a Deputy, a Principal Medical Officer, and four Assistant Directors (three medical practitioners and one public health engineer), and a chemical inspector.
Notifiable Diseases—The control of disease is based on a system of notification which has long been in force. The present list of notifiable diseases is as follows.
| Notifiable Infectious Diseases: | |
| Anthrax | Puerperal infection involving any form of sepsis, either generalised or local, in or arising from the female genital tract within 14 days of childbirth or abortion |
| Cholera | |
| Cysticercosis | |
| Diphtheria | |
| Dysentery (amoebic and bacillary) | Rabies |
| Encephalitis lethargica | Relapsing fever |
| Enteric fever (typhoid fever, paratyphoid fever) | Salmonella infections |
| Smallpox (variola, including varioloid and alastrim) | |
| Infective hepatitis | |
| Leprosy | Staphylococcal pneumonia of the newborn infant |
| Leptospiral infections | |
| Meningococcal meningitis | Staphylococcal septicaemia of the newborn infant |
| Ophthalmia neonatorum | |
| Ornithosis (psittacosis) | Taeniasis |
| Pemphigus neonatorum, impetigo, or pustular lesions of the skin of the newborn infant | Trachoma (granular conjunctivitis, granular ophthalmia, granular eyelids) |
| Typhus | |
| Plague (bubonic or pneumonic) | Undulant fever |
| Poliomyelitis | Yellow fever |
| Other Notifiable Diseases: | |
| Actinomycosis | Impaired hearing arising from occupation |
| Anchylostomiasis (hookworm disease) | Malaria |
| Beriberi | Phosphorus poisoning |
| Bilharziasis (endemic haematuria, Egyptian haematuria) | Pneumonic influenza |
| Poisoning from any insecticide, weedicide, fungicide, or animal poison met with at work | |
| Chronic lead poisoning | |
| Compressed-air illness arising from occupation | Poisoning from any gas, fumigant, or refrigerant met with at work |
| Damage to eyesight arising from occupation | Poisoning from any solvent met with at work |
| Dengue | |
| Diseases of the respiratory system arising from occupation | Poisoning from any metal or salt of any metal met with at work |
| Eclampsia | Septicaemic influenza |
| Food poisoning | Skin diseases arising from occupation |
| Fulminant influenza | Tetanus |
| Hydatid disease | Trichinosis |
All forms of tuberculosis are notifiable under the Tuberculosis Act 1948.
Venereal Diseases—Venereal diseases are only notifiable if the patient discontinues treatment before cure is effected. The Venereal Diseases Regulations 1964 give adequate powers for the examination and treatment of persons suspected of suffering from the diseases. Free treatment has been established in the larger cities and treatment is available to seamen at the main ports in accordance with the Brussels Agreement. Restrictions are also placed on the nature of the employment such persons may undertake if they are suffering from the diseases in a communicable form.
In the administration of the regulations, every precaution is taken to ensure the avoidance of publicity.
Tuberculosis Control—The Department's programme for control of tuberculosis is based on adequate case-finding and notification procedures, the proper treatment and surveillance of notified cases, investigation and control of contacts. This calls for close co-ordination of the staff and services of hospital boards (which are responsible for the diagnosis and treatment of tuberculosis) and officers of the Department of Health who deal with the social and epidemiological aspects of the disease. The latter involves supervision of tuberculosis families, tracing of contacts, and the maintenance of tuberculosis statistics.
Mass miniature radiography is now an established and important feature of the Department's case-finding programme, and, during the years 1959 to 1965, 1,816,326 persons were X-rayed in the 10 mass X-ray units then operated by the Department. This resulted in the discovery of 1,423 active cases.
B.C.G. vaccination is also undertaken by the Department and, in particular, is offered to the contacts of registered cases, post-primary-school children, and hospital workers partly exposed to infection.
Over the past decade, there has been a steady decrease each year in new notifications together with a marked decrease in mortality.
Hydatids Eradication—The Hydatids Act 1959 provides positive methods of attack in the campaign for the eradication of hydatid disease. The Act is administered by the Department of Agriculture. Under it there has been set up a National Hydatids Council on which the Department of Health has representation.
Environmental Hygiene is concerned with the provision and proper maintenance of public water supplies and sewerage systems, the disposal of refuse, the condition of dwellinghouses, the control of offensive trades, and the hygiene of premises in which food is manufactured and sold, including eating houses. These matters are primarily the responsibility of the local authorities, but the Department of Health acts in a general advisory capacity. In the case of many of the smaller local authorities the necessary inspections are made by departmental inspectors on behalf of and by arrangement with the local authorities.
Air Pollution—The air pollution provisions of Part V of the Health Act have been enforced since 1958. The chief chemical inspector is resident in Wellington and deputies are in Auckland and Christchurch.
There are 26 classes of process requiring registration and they include, for the control of odours, supervision of rendering processes. Most registrable processes are governed by the requirement to adopt the best practicable means to control noxious discharges and emissions, but there are limiting standards for lead and acid gases. All new installations or extensions of these registrable processes require approval by the Department of Health.
Air pollution committees in Auckland and Christchurch have undertaken surveys to determine the extent of air pollution in these cities and the need for further action.
The Smoke Restriction Regulations 1964 were enacted with a view to giving local authorities stricter control of industrial smoke emissions.
Cemeteries—The law governing burial and cremation in New Zealand is found in the Burial and Cremation Act 1964. The registration by local authorities of funeral directors and mortuaries operated by them is provided for in the Health (Burial) Regulations 1946. Local authorities are charged with ensuring that there exists adequate provision for the disposal of the dead.
Cremation may be carried out if the deceased is not known to have left any written direction to the contrary. Crematoria have been established in Auckland (two), Wellington, Christchurch (two), Dunedin, Hastings, Wanganui, Nelson, Palmerston North, Hamilton, New Plymouth, and Rotorua.
Food and Drugs—The Food and Drugs Act 1947 provides for the analysis, by analysts appointed under the Act, of any article of food or drink, or of any drug, which may be sold, offered for sale, or exposed for sale, and for the inspection of any place where there is any food or drug intended for sale. If any such article is proved to be unfit for human consumption penalties may be inflicted on the person or persons responsible. Stringent measures are provided for the prevention of adulteration of food, drink, or drugs, and for the inspection of places where such goods are manufactured or packed. Control is also established over all utensils and appliances coming into contact with food and drugs. Regular sampling of foods, particularly milk, is undertaken by departmental inspectors, and the samples are analysed in the Dominion Laboratory or its branch laboratories.
An important provision of the Act controls all kinds of publicity concerning any food or drug whereby a purchaser would possibly be deceived in regard to the properties of such food or drug, whether or not it is standardised by regulation. This matter is also covered by the Medical Advertisements Act 1942, which is referred to later.
The definitions of “drug” establish two groups to which differing provisions apply. Anaesthetics, cosmetics, dentifrices, disinfectants, preservatives, and soaps and detergents are usually required to be notified as toxic substances under the Poisons Act (see later) and can, provided the labelling and other requirements of the Food and Drugs Regulations are complied with, be marketed without delay. Therapeutic drugs, that is those substances or mixtures, whether used internally or externally for the diagnosis, prevention, or treatment of any illness or injury of the human body, for altering nutrition or structure, or for modifying physiological processes or desires or emotions, and chemical contraceptives are subject to a notification procedure under the Food and Drugs Act, and normally a delay of 90 days between complete notification and any advertising or distribution of trade information or stocks.
Narcotics—Under the Narcotics Act 1965 and the Narcotics Regulations 1966, the Director-General of Health is the competent authority for the purpose of the international conventions and for the oversight of the legitimate distribution and use of narcotics within the country. Written approval of the Minister of Health is required for the import or export of cannabis desomorphine, heroin, and ketobemidone, including their salts and preparations containing them. The import, export, cultivation, production, possession, distribution, supply, and administration of narcotics is strictly controlled. Balanced quantitative records of transactions and stock are generally required to be kept. There is an extensive system of notification to Medical Officers of Health of narcotics supplied and a system of control of habituated persons.
Poisons—The advertising, distribution, use, labelling, and packing of all poisons and toxic substances is controlled under the Poisons Act 1960 and the Poisons Regulations 1964. A manufacturer or importer must notify the Registrar of Poisons before importing or putting on the market any new substance which might be toxic, be it a chemical, household preparation, cosmetic, or drug. Special safeguards are provided for certain hazardous chemicals used in agriculture or horticulture. Certain drugs may not be sold to the public except on the prescription of a doctor, a dentist, or a veterinary surgeon. It is an offence to pack poisons in bottles that are ordinarily used for food, drink, or medicine. Labels for these “Restricted Poisons” must bear statements of the precautions to be taken in use, the symptoms of poisoning, and the remedial treatment, and must be approved by the Registrar of Poisons.
Medical Advertisements—Under the Medical Advertisements Act 1942 the word “advertisement” is defined broadly, but does not include any advertisement or scientific matter distributed only to members of the medical and allied professions.
The Act set up a Medical Advertisements Board, which was given power as a quasi-judicial body to examine statements made in any medical advertisement. The Board may require the claims or statements made or implied to be substantiated to its satisfaction. Subsequent publication of such an advertisement is prohibited until the Board has notified its decision, and the veto on publication becomes permanent if the Board decides the claim or statement has not been proved.
Regulations issued under the Act limit the claims which may be included in any medical advertisement, and include a list of diseases concerning which no advertisement may make a claim to cure.
OCCUPATIONAL HEALTH—The objective of the occupational health programme is to work with labour, management, the medical profession, and other groups to assist in improving the health of the worker.
The Department of Labour, which is responsible for accident prevention, hours of work, employment of women and children, etc., calls to the attention of the Department of Health any health problems which the factory inspectors may encounter. The Factories Act 1946 gives to medical officers of health or other authorised officers of the Department of Health the same powers and authorities as inspectors of factories with regard to the health and welfare sections of the Act. The suspension of workers on health grounds, approval of respirators and similar protective equipment, and the arrangements for medical examinations are undertaken by the Department of Health. A series of regulations deal with health hazards, many of them being administered by the two Departments, each in its own sphere.
A similar understanding has been established with the Waterfront Industry Commission and New Zealand Railways, and illustrates the general pattern of arrangements between the Department of Health and other Government Departments or agencies concerned with particular aspects of workers' health. An occupational health laboratory was established at Wellington in 1964.
Occupational Disease—The notifiable occupational diseases are scheduled in the Health Act 1956 and details of diseases notified are published annually in the report of the Director-General of Health.
Control of Health Hazards—An increasing number of specific health hazards are coming under formal control, namely lead processes, electroplating, spray painting, sand blasting (siliceous blasting agents in factories are prohibited), fumigation, aerial application of poisons, where in conjunction with the Civil Aviation Department a special rating is required by pilots, and agricultural chemicals. The organisation of radiation protection is dealt with by the National Radiation Laboratory, while a number of other specific hazards are currently receiving consideration.
Medical, Nursing, and First-aid Services—Minimal first-aid requirements have been laid down by the Department, which generally endeavours to encourage both the development of medical and nursing services and the raising of first-aid standards throughout industry generally. While there are no statutory obligations on industry to provide medical and nursing services, an increasing number of factories do provide such services. To meet the needs of small plants the Department has developed and is developing industrial health centres with financial support from the Waterfront Industry Commission in the case of harbour areas, and the Workers' Compensation Board in the case of general industry.
Pre-employment Examinations—Pre-employment medical examinations are required for young workers before entering factory employment.
CHILD HEALTH—The Health Department is responsible for the supervision of all measures for safeguarding the health of preschool and school children, and also for ensuring a satisfactory environment at school. Attention is given to the health of the preschool child.
These services are under the direction of the Assistant Director of the Public Health Division, who is a medical practitioner, with a staff of full-time and part-time medical officers. The medical officer of health in charge of a health district is responsible, within the limits of the policy laid down and the instructions he receives, for the direction and control of all child health work in his district.
An effort is being made to have every child examined in infancy and before school entry. The examination of preschool children is carried out by medical officers of the division in Plunket rooms in conjunction with Plunket nurses, and at kindergartens, day nurseries, and other preschool organisations assisted by public health nurses.
In keeping with modern thought, routine examinations by medical and nursing staff of specific age groups (except the testing of vision and hearing) has been replaced by continuous supervision of all children at school with examination when necessary. This supervision is effected largely by means of consultations between parents, teachers, nurses, and medical staff. These consultations are based on preschool records, questionnaires, and regular visits to the school by medical and nursing staff. The children found to be suffering from defects are kept under observation until the necessary treatment is obtained from the private practitioner or the hospital.
Mentally backward and feeble-minded children are given special attention, arrangements being made in conjunction with the Department of Education for their entry into a special school or other institution as may be necessary. In addition, physically handicapped children enrolled with the Correspondence School are examined. A consultative service is available for post-primary-school children.
Throughout the work in this field officers try to secure the interest and co-operation of parents and family doctors, because only in this way can the work be made effective. With this object in view it is considered of great importance that parents be present at the medical examination of their children, an opportunity of which the majority take advantage.
Prevention of Disease—The activities in this field of child health are not confined to the routine medical examination of school children. In addition, certain positive measures are taken to prevent disease and correct physical defects. The more important of these measures are:
Poliomyelitis Vaccination—Immunisation against poliomyelitis has been carried out by the Division's staff since 1956. The vaccine used initially was an injectable type but in August 1961 an oral vaccine was introduced. A mass vaccination campaign was carried out in 1962. The protection of four doses of the oral vaccine is available to all infants and to all new settlers who have not received it in their countries of origin.
Diphtheria, Whooping Cough, and Tetanus Immunisation—Protection against these diseases is a routine procedure and a triple vaccine is used. It is preferable that immunisation be done by the family doctor, and the course of injections should be commenced as soon as possible after babies are three months old. Arrangements can be made for mothers who are unable to have the immunisation done privately to attend with the infant at a departmental clinic. If necessary in country areas the public health nurse will visit the home to immunise the child. Booster doses (against diphtheria and tetanus) are given at 18 months and after the child's fourth birthday or as soon as possible after the child commences school. Further booster doses (against tetanus only) are recommended at 10-yearly intervals and on injury.
Typhoid Inoculations—Maori children in the North Island are inoculated annually against the typhoid group of diseases.
Health Education—Officers give advice whenever possible and give health education talks. They advocate the use of iodised salt and iodine rich foods to control goitre, and the consumption of milk to maintain nutrition standards.
Health Camps are established to which children are admitted for convalescence or correction of malnutrition and emotional disturbances.
Health camps were originally established to cater for the needs of delicate and undernourished children in the age group of five to 12 years. Now children suffering from minor emotional, psychological, and behaviour problems are also helped by the change in their environment which a camp provides. The service selects the children to attend the camps (which are maintained by an independent organisation—the King George the Fifth Memorial Children's Health Camps Federation) and, as necessary, re-examines them before admission and after discharge. In the camps the children live under an orderly and disciplined routine, they eat plain, well cooked food, and they get plenty of rest, fresh air, and sunshine. In practically all cases a child who attends a health camp benefits both physically and mentally. The opportunity is taken to impart health education by practising healthful living. There are six permanent and two part-time health camps in New Zealand.
For children with emotional or psychological disturbances and behaviour problems, child health clinics have been established in the larger centres and elsewhere. These are staffed by a team consisting of a pediatrician, psychiatrist, psychologist, play therapist, and social worker. Children are referred to these clinics through the family doctor if there is one.
MATERNAL WELFARE—Maternal welfare is the responsibility of an Assistant Director in the Public Health Division. Maternal and infant welfare work in New Zealand is based on co-operation between the Department of Health, hospital boards, the medical and nursing professions, and the Royal New Zealand Society for the Health of Women and Children (Plunket Society).
The Assistant Director is a medical practitioner who, while not concerned with the particulars of day-to-day administration of maternity hospitals, is responsible for maternal welfare generally in its broadest sense. She keeps abreast of overseas and local developments and is regarded as a consultant on matters of national significance. For instance, in the event of an outbreak of infection affecting mothers or infants, she conducts and directs any necessary investigations as to causes and remedial measures required, in consultation with such other divisions as may be necessary.
The Assistant Director has the benefit of the advice of the Maternity Services Committee of the Board of Health, of which she is a member. This committee was formed to advise the Minister on matters relating to obstetric and maternal welfare generally.
The medical officers of health, through their staff of nurse inspectors, exercise a general supervision over the work of midwives and closely control the private hospitals throughout the country. All private hospitals are required to be licensed under the Hospitals Act 1957, and the Department of Health sees that standards regarding buildings, equipment, and staff are observed.
Except in an emergency, no persons other than registered medical practitioners and registered midwives are allowed to conduct confinements, and only registered midwives and registered maternity nurses are permitted to nurse women in childbirth. A large percentage of all confinements (in 1963 approximately 99.3 percent of non-Maori and 98.4 percent of Maori confinements) take place in the various types of maternity hospitals—a maternity annex to a public hospital, a State (St. Helens) hospital, or a private maternity hospital.
Important contributions to maternal welfare are made by the Division of Nursing, which includes in its duties the supervision of the training of midwives and maternity nurses, and by the Hospitals Division, which approves plans for accommodation to be provided by the various types of maternity hospital. The work of these two Divisions is surveyed elsewhere in this section.
HEALTH EDUCATION—The aim is to work with the public and to encourage action that will improve personal, family, and community health. The Health Education Branch is under the control of the Deputy Director, Division of Public Health, who is a medical practitioner with training in health education, a small staff of writers, technicians, and clerks at Head Office, and lay health education officers who are seconded to district offices and are responsible to the Deputy Director through their medical officers of health.
Medical and dental officers, public health nurses, dental nurses, and inspectors of health all devote some of their time to health education. The health education officer acts as a coordinator and stimulates and extends health teaching and health programmes in the district. All the health education officers are women and several hold the diploma in health education issued jointly by Victoria University of Wellington and the Department of Health. All are given special training before taking up their appointments. Various media are used to make the teaching as attractive, as direct, and as acceptable as possible. Daily newspapers and national periodicals carry regular advertisements on health subjects. Radio broadcasts are given at least twice a week and leaflets, pamphlets, and posters are available on many health topics.
The Division also publishes the Department's official bulletin Health which has a circulation of over 65,000 and is issued free to the public four times a year. It gives health information and publishes various aspects of the Department's work.
To assist field officers in their education work, visual aids, displays, and other publicity material is provided and in addition district offices are encouraged to produce their own.
Voluntary organisations, too, are assisted in their work by the supply of teaching aids and other materials and by assistance with their training programmes.
Each district office has a health education committee consisting of senior administrative and professional officers which plans and budgets local health programmes. A central committee at Head Office largely plans and budgets for overall national requirements.
DENTAL HEALTH—The Division of Dental Health, which was instituted in 1921, is concerned with the administration of the various dental activities of the Government, and in particular—(a) The National Dental Service, which comprises (i) the School Dental Service and (ii) the Adolescent Dental Service; (b) the Social Security (Dental Benefits) Regulations; (c) the Dental Act 1963 and regulations; (d) dental bursaries; (e) dental research; (f) dental health education.
The Division of Dental Health has at its head a Director (a dental surgeon), and there is also a Deputy Director, two Assistant Directors, and a dental research officer. The service is organised in 16 units, each of which is controlled by a senior dental officer, who is directly responsible to the Director. These officers are: the principals of the schools for dental nurses at Auckland, Wellington, and Christchurch, and the principal dental officers in charge of the 13 dental districts into which New Zealand is divided.
The School Dental Service staffed by 1,118 trained school dental nurses provided systematic treatment for 488,411 pre-school and primary school children in the year ended 31 March 1966. A further 172,325 children under 16 years of age received regular treatment from private dentists under the Social Security (Dental Benefits) Scheme, and from a limited number of salaried dental officers.
The School Dental Service—Briefly, the functions of the service are to improve the standard of dental health of school children (and of preschool children) by affording them regular and systematic treatment at six-monthly intervals, commencing from the primer classes (or earlier when possible), and continuing through to the highest class of the primary (or intermediate) school. Thereafter they are eligible for enrolment in the Adolescent Service. There has been a rapid increase in the school population as a result of the high birthrate. Until the number of school dental nurses can be increased proportionately, children are being transferred to the “adolescent” service at an earlier stage, in order to enable the dental nurses to maintain six-monthly treatment for the younger children. This is a temporary phase, pending the training of more dental nurses.
Two years are devoted to the theoretical and practical training of school dental nurses. Approximately 525 student dental nurses are in training at the one time. The course is carefully graduated and is in the hands of a staff of dental surgeons and dental tutor sisters. Private dental practitioners are represented on the examining boards for the final examination. During the period of training, student dental nurses reside in hostels owned and controlled by the Department of Health.
On completing her training, a school dental nurse is posted to a school dental clinic, where she becomes responsible to the principal dental officer of her district for the dental treatment of a group of approximately 500 patients. She is visited at regular intervals by the principal dental officer and by a dental nurse inspector who assist the dental nurse to maintain a high standard of performance in all aspects of work.
Dental treatment comprises fillings in both temporary teeth and permanent teeth, cleaning and scaling of the teeth, extractions when necessary, and sodium fluoride treatment. The aim of the service is to promote dental health by conserving the natural teeth and preventing dental decay. Only a small number of teeth have to be extracted as unsavable, slightly more than three for every 100 saved by conservative treatment.
Orthodontic treatment is carried out principally in Wellington and Christchurch, where orthodontic units are established at the Children's Dental Clinics associated with the Schools for Dental Nurses.
Adolescent Dental Service—Dental care for adolescents is provided by private practitioners as a dental benefit under the Social Security Act, the practitioners being reimbursed on a fee-for-service basis.
Eligibility for dental treatment as an adolescent is contingent upon a person's having undergone regular dental care up to within three months of the time of application, either at a school dental clinic or from a private dental practitioner.
Treatment of adolescents, which has been available since 1946, is in effect a continuation of the treatment provided by the School Dental Service, and is continued until a patient has reached his sixteenth birthday.
Treatment is essentially of a nature designed to conserve the natural teeth. Dental supervision of adolescents is on a basis of examination and treatment at six-monthly intervals. There is free choice of dentists, and dentists have the right to decline patients.
The treatment (other than treatment requiring special approval) which may be provided as dental benefits, and the fees payable, are indicated in the Schedule to the Social Security (Dental Benefits) Regulations 1960. Dentists are free to exercise their professional judgment, and, if in their opinion a case demands a form of treatment that is not provided for in the Schedule, there is provision, with certain limitations, for such treatment to be approved as a charge on social security funds.
Dental Health Education—The dental health education activities of the Department include the production of posters, pamphlets, sound films, filmstrips, radio talks, newspaper advertisements, and all other types of advertising media.
Officers of the service are kept in touch with health education and other matters by means of the School Dental Service Gazette, which is published bi-monthly.
Dental officers and school dental nurses are expected to impress on their patients the necessity of maintaining a high standard of oral health. To further this end every opportunity is taken of distributing health educational literature, displaying posters, and devoting reasonable clinical time to instruction in oral hygiene. Opportunities to address meetings of various kinds are availed of whenever possible.
Dental Research—Dental research is directed by the Dental Research Committee of the Medical Research Council. The staff consisting of a director, three professional assistants, and three associated workers are primarily engaged in a long-term programme of research in dental problems.
In addition, a dental research officer is employed by the Department to undertake investigations of operational methods, materials, and equipment, etc., which have a direct bearing on the efficiency and effectiveness of the Division's programme.
Dental Bursaries—The Government grants bursaries each year to selected students to assist them to qualify as dentists. The bursaries are the equivalent of the bursary that would be payable under the University Bursary Regulations plus $200 a year. Students who are granted bursaries must enter into an agreement to pursue their studies diligently and, on graduating, to enter the service of the Crown or of a hospital board appointed by the Crown for a specified period not exceeding three years.
RADIATION PROTECTION—Under the Radiation Protection Act 1965 the protection of the population from radiation hazards is a responsibility of the Department of Health, and the Department established the National Radiation Laboratory (formerly the Dominion X-ray and Radium Laboratory) to provide the administrative and technical services required, and in addition the educational programme, without which effective co-operation in any safety field is not likely to be achieved. An important feature of the Act was the setting up of the Radiological Advisory Council on whose advice the Minister of Health may take action on radiation problems concerning the welfare of the people. Further legislation by way of regulations followed in 1951 and these include the Radiation Protection Regulations and the Transport of Radioactive Substances Regulations.
The National Radiation Laboratory is required to maintain the primary X-ray standard for New Zealand and also reference standards for the accurate measurement of radioactive substances used in clinical work. Control of radiation sources is effectively obtained by licensing operators at each place where ionising sources are used, and the Electrical (X-ray) Wiring Regulations 1944 provide for the compulsory registration of all X-ray plants in the country. The importation and use of radioactive materials is strictly controlled, and requests for such materials on overseas suppliers must be authorised by the laboratory, which acts as the procurement agency for most of the radio-isotopes required.
The laboratory operates a field service whereby trained physicists regularly visit all places where ionising sources are used. During these visits measurements are taken, protection problems discussed, and everything possible is done to ensure that persons associated with the ionising sources adopt safe working habits. Apart from the obvious groups, e.g., medical and dental users, the laboratory is also concerned with specialised equipment, such as mass X-ray units, X-ray apparatus used in schools, radar and television equipment, X-ray diffraction units, electron microscopes, research accelerators, etc. Good protection, of course, depends not only on careful working habits but also on material protection.
In recent years the Department of Health has undertaken responsibility for the monitoring of air, rainwater, and soil for the incidence of radioactive contamination from fall-out.
PHYSICAL MEDICINE—Physical medicine is concerned with potentially disabling conditions such as rheumatic diseases, cerebral palsy, and other disorders of the locomotor system. Physical medicine is the responsibility of a Deputy Director of the Hospitals Division who is a medical practitioner with special training and experience in the field. He is responsible for the general organisation and development of physiotherapy and occupational therapy services throughout the country.
The centre for the treatment of rheumatism is established at the Queen Elizabeth Hospital, Rotorua which has approximately 100 beds set aside for diagnosis, research, and treatment of these diseases. Full hydrotherapy, physiotherapy, occupational therapy facilities are provided and active steps towards rehabilitation of patients are carried out. A large number of outpatients referred from all parts of New Zealand and a few from overseas are seen every year.
Admission of patients to the hospital is arranged with the Medical Superintendent, who also arranges for outpatient consultations. Physiotherapy for preventing and controlling deformity, has been developed considerably at Queen Elizabeth Hospital. Occupational therapy has been developed to teach people how to live with their disabilities. Social workers assist in bridging the gap between rehabilitation and vocational and social resettlement.
A cerebral palsy unit is also situated at Queen Elizabeth Hospital providing residential accommodation for 20 children. At this unit the activities of a team of physiotherapists, occupational therapists, teachers, and speech therapists are co-ordinated by the supervisor of the unit working under a physician. In addition to treatment, post-graduate courses are given to physiotherapists, occupational therapists, teachers, and speech therapists. Patients can be referred by their doctors to the physician in charge of the unit for advice only, or for admission and treatment. Cerebral palsy visiting therapist services are now operating in Auckland, Christchurch, Palmerston North, Wellington, Hutt, and Nelson health districts. These have proved so successful that it is hoped to extend the service to other districts as qualified staff become available.
Cerebral palsy day schools have been established in Auckland, Wellington, Christchurch, Dunedin, and Invercargill. Parents of cerebral palsy cases who seek their children's admission first apply to the appropriate medical officer of health or education board. The schools are administered by education boards under the Department of Education, but close liaison exists between the schools, the Rotorua unit, and the visiting cerebral palsy therapists.
The Department offers annually a limited number of bursaries for training at the New Zealand School of Physiotherapy which is governed by the Physiotherapy Board and administered by the Otago Hospital Board. Applicants for bursaries, if accepted for admission to the school by the Physiotherapy Council of Otago Hospital Board, are selected for award by the Physiotherapy Bursaries Selection Committee. A condition of bursary award is that on qualification the bursar will work for a period of two years in a hospital or institution as directed by the Department. The training period for physiotherapists is three years of which about eight months in the third year is salaried service at a subsidiary training school.
The training school for occupational therapists is situated at Oakley Hospital, Auckland, and is administered by the Mental Health Division. The training period for occupational therapists is three years part of which is spent at the Auckland Hospital Board's general hospitals. Trainees are paid a salary while training, and have to agree to work in a departmental or public hospital for two years after qualification.
REHABILITATION OF DISABLED CIVILIANS—The rehabilitation of disabled and handicapped civilians has received increasing emphasis over recent years in New Zealand. Basically, public hospitals are the hub for development of an adequate rehabilitation service, with co-operation from Government and voluntary agencies in furthering the medical, social, and vocational welfare of the disabled.
A Civilian Rehabilitation Centre has been established at Otara, under the Auckland Hospital Board's administration, for the treatment and overall restoration of those injured in employment or road accidents. For the rehabilitation of persons suffering from spinal injuries and paraplegia, specialist spinal injury centres are in course of development at Auckland and Christchurch. Rehabilitation activities are also being carried out at the Queen Elizabeth Hospital, the Palmerston North Hospital, and in many of the psychiatric and psychopaedic hospitals of the Mental Hospitals Division.
The Disabled Servicemen's Re-establishment League provides trade and vocational training for disabled civilians recommended by district and national selection panels. These panels consist of representatives from the Departments of Labour, Social Security, and Health. For the more severely handicapped, whose productive potential is restricted, the Government has recently approved of a sheltered employment scheme. It is also being operated through the Disabled Servicemen's League and incorporates a pilot occupational workshop. For both the vocational training and sheltered employment schemes, a measure of Government assistance is provided.
A National Civilian Rehabilitation Committee has been set up by Government. This Committee is currently advising Government on steps to co-ordinate and promote rehabilitation in New Zealand.
NURSING SERVICE—The Division of Nursing in the Department of Health is responsible for the maintenance of an adequate and efficient nursing service and the supervision of conditions for nursing staff.
The training of all nurses and midwives is governed by the Nurses and Midwives Act 1945, which is administered by the Nurses and Midwives Board. This Board through the Registrar supervises hospitals and nursing schools in all aspects of training, and also the examination and registration of nurses. The nurse inspector who makes a visit to a hospital carries out the dual purpose, therefore, of making reports both to the Director-General of Health through the Nursing Division, and to the Nurses and Midwives Board through the Registrar. This integration of work is a feature which has preserved good relationships in the hospitals, and has enabled the practical and theoretical training of nurses as well as their conditions to be maintained at a uniformly high standard.
The control of the public health nursing services is exercised from the Division, but the specialised infant-welfare and mothercraft work of the Plunket Society is under the control of that organisation; close co-operation with that Society is, however, maintained.
Another part of the work is the selection and placement of nurses in the various groups of Pacific islands for which the New Zealand Government is responsible. These nurses for hospital and public health work are seconded from the New Zealand service for periods of two years, pension rights being continuous. The supervision of this service is exercised by regular visits to the islands.
Close liaison exists between the nursing services organised for the armed services and the Division, while any organisation for emergency nursing is carried out by the Division.
Educational courses for all groups of registered nurses are organised. A post-graduate diploma programme is controlled by a committee of management on which the Department of Health, universities, teachers' colleges, and Hospital Boards Association are represented. Major areas of study include hospital and nursing school administration, public health nursing, and health education.
Each year up to 65 students take the diploma course of one academic year and, with few exceptions, they are specially selected and attend on bursaries from the Department of Health, hospital boards, and voluntary organisations. During recent years there has been an increasing number from overseas countries. The school has its own building and hostel. Shorter courses are arranged for public health nurses, ward and tutor sisters. Periodically refresher programmes are held for various categories of nursing personnel. The full-time instructors at the school also carry out supervision of hospitals, nursing schools, and public health nursing work, thus keeping up to date with the practical needs of the field.
MEDICAL STATISTICS—The National Health Statistics Centre is responsible for the compilation of the statistics included in the Annual Report on the Medical Statistics of New Zealand. The Branch also prepares special statistics for the various Divisions of the Department and for research workers in different fields both in New Zealand and overseas. A constant liaison is maintained with the World Health Organisation, which is supplied with statistical material giving a picture of health trends in New Zealand. In addition, from time to time special statistical investigations are made into important aspects of public health and diseases that warrant specific study.
NATIONAL HEALTH INSTITUTE—Opened in 1954, the National Health Institute is the Department of Health's centre for the study of public health problems. It contains an Epidemiology Section and Public Health Laboratories.
The Epidemiology Section conducts field research into matters of public health interest and also is responsible for conducting the course of training for the diploma of the Royal Society for the Promotion of Health and, in addition, refresher courses for health inspectors.
The Public Health Laboratories provide diagnostic and reference services in bacteriology and virology for medical officers of health and hospital laboratories as well as for the other sections of the institute. The institute is the national centre for those reference services which are organised on an international basis.
MEDICAL RESEARCH COUNCIL—Under the Medical Research Council Act 1950, as amended, the Medical Research Council of New Zealand was established as a corporate body with the following functions:
To initiate, foster, and support medical research;
To furnish information, advice, and assistance to persons and organisations concerned with medical research;
To collect and disseminate scientific information, including the publication of reports.
This Council took over and developed the work of the departmental committee, bearing the same name, which had been in existence since 1938. At the end of 1965 research in the following fields was in progress: clinical medicine; dentistry; endocrinology; hydatids; virus; Island Territories research; microbiology; physiology; nutrition; obstetrics; surgery; pathology; human genetics; biochemistry; preventive and social medicine.
The Council maintains liaison with the research work being carried out by the Cancer Society of New Zealand and medical research foundations established in Auckland, Wellington, Christchurch, Palmerston North, and Hawke's Bay.
The Council administers the Medical Research Endowment Fund, from which an annual expenditure of $400,000 is incurred in supporting research projects at the University of Otago the University of Auckland, and the institutions of the Auckland, Wellington, and North Canterbury Hospital Boards.
The Council employs a staff of 60 full-time workers, and some 70 associated workers contribute to the activities of the Council. A further 50 workers are employed by the University of Otago and the University of Auckland under project grants from the Council.
The Council is empowered to receive bequests and donations to the fund for furthering the objects of the Council as set out in the Medical Research Council Act 1950.
MEDICAL COUNCIL—The Medical Council of New Zealand, constituted under the Medical Practitioners Act 1950, consists of the Director-General of Health, the Dean of the Faculty of Medicine in the University of Otago, and five other registered medical practitioners. One of the five members is appointed on the recommendation of the Medical Association of New Zealand.
The Council deals with all applications for registration under the Act. The Council may require the holder of a foreign diploma to attend a course and pass an examination in medicine and surgery. Until an applicant is able to satisfy the Council that he has obtained house officer experience, in a resident medical capacity, of not less than 12 months or has otherwise obtained comparable experience, registration is on a conditional basis. Persons registered conditionally may practise only in an approved hospital. The number of medical practitioners on the register at 30 June 1966 was 4,074, and, of this number, approximately 3,116 were actively engaged in medical practice in New Zealand.
The Medical Council is vested with certain disciplinary powers. Right of appeal to the Supreme Court is provided.
REGISTRATION COUNCILS AND BOARDS: Dentists—Under the Dental Act 1963 there is constituted a Dental Council, the functions of which are to examine and approve of the qualifications of applicants desiring registration as dentists and to exercise disciplinary control over registered dentists.
The number of private dental practitioners holding annual practising certificates at 1 September 1966 was 876, and in addition there were 134 dentists in Government, hospital, and university employment.
Nurses and Midwives—Under the Nurses and Midwives Act 1945 is constituted the Nurses and Midwives Board, consisting of the Director-General of Health (Chairman), the Director, Division of Mental Health, the Director, Division of Nursing (Registrar), two registered medical practitioners, a representative of the Hospital Boards Association of New Zealand, three registered nurses, one registered midwife, and one registered psychiatric nurse. Members other than official members are appointed on the recommendation of the Minister of Health, the nursing personnel being nominated by the New Zealand Registered Nurses Association. The Board controls training courses, conducts examinations, and effects registrations.
Provision is made in the Nurses Registration Regulations 1958 for a three-year course of instruction for nurses classified as general and maternity nurses. A similar training period is specified for male nurses, psychiatric nurses, and psychopaedic nurses.
Registration—The Nurses and Midwives Act 1945 requires that the following registers be kept by the Registrar: (a) Nurses, (b) Midwives and Maternity Nurses, (c) Male Nurses, (d) Psychiatric Nurses, (e) Nursing Aids, and (f) Psychopaedic Nurses.
Physiotherapists—Under the Physiotherapy Act 1949 is constituted the New Zealand Physiotherapy Board. The Board's functions are the training, examination, and registration of candidates for physiotherapy practice, the issuing of special licences, the approval of physiotherapy training schools, and the conduct of those registered under the Act.
The training period for physiotherapists is three years. Full-time training is conducted at the New Zealand School of Physiotherapy, Dunedin, administered by the Otago Hospital Board, and eight months of the final year are spent at one of the subsidiary training schools in various parts of New Zealand. All students are required to pass the State Examination in Physiotherapy to qualify for registration. Every person registered under the Act and engaged in the practice of physiotherapy must hold an annual practising certificate.
Occupational Therapists—Under the Occupational Therapy Act 1949 is constituted the Occupational Therapy Board. The Board is concerned with the training, examination, registration, and conduct of persons engaged in the practice of occupational therapy in New Zealand. The training period is three years, and is undertaken at the School of Occupational Therapy, Auckland, and subsidiary training schools.
Every person registered under the Act who is engaged in the practice of occupational therapy in New Zealand must hold a current annual practising certificate.
Dietitians—Under the Dietitians Act 1950 is constituted the Dietitians Board. The functions of the Board are (a) to advise and make recommendations to the Minister of Health in respect of any matter affecting the profession of dietetics, (b) to determine courses of training and instruction to be undergone by candidates for examinations, (c) to approve hospitals and other institutions as training schools, (d) to conduct examinations, and (e) to effect registration.
The training period for a dietitian is, in the case of the holder of a degree of bachelor of home science conferred by the University of Otago or of the holder of a diploma in home science of the University of Otago, 12 months in a hospital training school. In the case of a registered nurse, the training period is two academic years in the School of Home Science, University of Otago, together with two periods totalling 10 months in a hospital training school.
Every practising dietitian must hold an annual practising certificate.
Opticians—The Opticians Act 1928 provides for the constitution of an Opticians Board, consisting of the Director-General of Health (the Registrar), three persons engaged in practice as opticians in New Zealand, and a registered medical practitioner with special knowledge of diseases of the eyes. The Board deals with all applications for registration under the Act.
There are approximately 246 opticians registered, but not all are engaged in active practice.
Plumbers—The Plumbers and Gasfitters Board consists of 11 members—the Director-General of Health as Chairman, and representatives of the Department of Education, the Municipal and Counties Associations, the Gas Association, the Master Plumbers Society (2), the Plumbers, Gasfitters, and Related Trades Industrial Union of Workers (2), and a nominee of a Borough Council or Drainage Board.
The Board is concerned with the examination and registration of plumbers and gasfitters, and once registered they are required to have annual licences.
In New Zealand, except in specially exempted areas, all sanitary plumbing as defined in the Plumbers and Gasfitters Registration Act 1964 must be performed only by registered plumbers. This restriction on the personal qualifications of plumbers is additional to specifications and standards of workmanship, etc., which have been prescribed for sanitary plumbing. Disciplinary action can be taken against a registered plumber who does unsatisfactory work.
Pharmaceutical Chemists—There are about 2,000 names on the Register of Pharmaceutical Chemists in New Zealand. All registered pharmaceutical chemists, except those who notify the Registrar that they have conscientious objection to membership, automatically become members of the Pharmaceutical Society of New Zealand, the society's affairs being managed by the Pharmacy Board constituted by the Pharmacy Act 1939.
The Board consists of 12 members, 11 being chemists, and one a barrister appointed by the Minister of Health. Nine members are elected on a district basis by registered pharmaceutical chemists who are proprietors or enrolled managers of pharmacies and two by members of the Pharmaceutical Society who are not in the previous category. The main function of the Pharmacy Board is to administer the Pharmacy Act and generally to protect and promote the interests of the profession of pharmacy and the public interests.
It is a specific requirement of the Pharmacy Act that pharmacies in New Zealand be at all times maintained under the immediate supervision and control of a registered pharmaceutical chemist, either in the capacity of proprietor or enrolled manager.
The present system for pharmacy education requires a minimum of two years' attendance at the School of Pharmacy, Central Institute of Technology, Petone, at which the pharmacy professional examination is obtained, followed by two years of apprenticeship before becoming eligible for registration. There is also a four-year degree course in pharmacy at the University of Otago. Such graduates are required to serve one year's apprenticeship before becoming eligible for registration as chemists.
Any chemist or company in which not less than 75 percent of the share capital is owned by a chemist or chemists may establish one pharmacy. Unqualified persons or companies in which less than 75 percent of the share capital is chemist-owned must, however, secure the consent of the Pharmacy Authority, set up under the Act, before commencing business, and in all cases the establishment of more than one pharmacy under the same ownership is subject to the consent of the Authority. All pharmacies must be registered with the Board. There are about 1,100 pharmacies in New Zealand.
VOLUNTARY WELFARE ORGANISATIONS—Over the years voluntary welfare organisations have made valuable contributions to certain aspects of the field of public health. In many cases they are encouraged and assisted in their work by grants from public funds. Among the more important of these organisations are the Plunket Society, the King George the Fifth Memorial Children's Health Camps Federation, St. John Ambulance (N.Z.), the New Zealand Red Cross Society, the Crippled Children Society, and the New Zealand Federation of Tuberculosis Associations.
The Plunket Society—the Royal New Zealand Society for the Health of Women and Children—is concerned with the welfare of all babies. The society trains its own infant-welfare nurses, conducts infant-welfare clinics, and maintains Karitane hospitals throughout the country for premature babies or difficult feeders. In rural areas where there is no Plunket clinic, public health nurses do infant-welfare work.
The King George the Fifth Memorial Children's Health Camps Federation maintains a chain of permanent health camps for delicate and undernourished children. The federation works in close co-operation with the Department of Health. It is the means whereby the voluntary nature of the various organisations is preserved, while ensuring that the available resources are utilised to the best advantage. Much of the finance for the federation's activities is derived from the proceeds of the annual health-stamp appeal.
The St. John Ambulance (N.Z.) has divisions throughout the country carrying out free ambulance and first aid work and instruction in first aid and home nursing. It is a branch of the Venerable Order of the Hospital of Saint John of Jerusalem.
The New Zealand Red Cross Society, a part of the International Red Cross Committee, has centres and subcentres throughout the country. It gives training in first aid, home nursing, hygiene and sanitation, and emergency transportation of the injured. Graduates of these classes form voluntary-aid detachments that in peacetime are recruited as aids in hospitals, and in wartime may be recruited for service overseas as well.
The Crippled Children Society keeps a register of all crippled children, helps them to acquire all possible medical treatment, and undertakes vocational training and home education where these are required.
The New Zealand Federation of Tuberculosis Associations looks after the interests of patients suffering from tuberculosis. It assists the Department of Health with health education of the public regarding tuberculosis and concerns itself with after-care and vocational training and guidance of patients.
FINANCIAL ASSISTANCE FOR ACCOMMODATION AND WELFARE SERVICES: (Old People's Flats, Homes, Hospitals, Youth Hostels, and Homes for Intellectually Handicapped Children)—The extent to which Government assistance is offered to religious and voluntary organisations and local authorities in providing housing, accommodation, and services for elderly people and others whom it is considered are in special need, has steadily increased over the past 15 years. Under this partnership with Government, the social service agencies of all the major religious bodies, as well as other welfare organisations, have established additional accommodation for the aged, frail, and sick who need residential care in either an old people's home or a geriatric hospital. Where it is not possible to meet the needs of elderly people through these agencies, the provision of residential care for the aged becomes a hospital board responsibility. Religious and welfare organisations at present provide approximately 4,960 home and hospital beds for the elderly. Hospital boards maintain 1,115 old people's home beds, while approximately 4,000 of their hospital beds (38 percent) are required for care of the elderly sick, either on a short-stay or long-term basis.
For the elderly who are ambulant and able to care for themselves but have a housing need and whose resources are limited, local authorities are encouraged and assisted by Government to build specially designed flats. These flats enable many elderly people to retain their independence for longer than would otherwise be the case.
Other measures which are of importance in assisting elderly people to remain in their homes as long as possible are receiving increased attention. Chief amongst these are the provision of district nursing services, home aid, meals-on-wheels, laundry services, and occupational therapy. In general, the services are provided by hospital boards with voluntary organisations and Old People's Welfare Councils assisting in various ways. The importance of old people's clubs and social centres, with an adequate range of services, is also receiving increasing recognition. Government lottery funds are being used to assist in providing suitable premises.
Old People's Homes and Hospitals—Subject to certain conditions, religious or welfare organisations may be granted 100 percent of the approved capital cost of providing accommodation for old people. In addition, since April 1966, the policy has been widened to provide a 50 percent subsidy towards the cost of approved improvements and the upgrading of existing accommodation. The administration of policy is a Department of Health responsibility.
During the year 1965–66, subsidies amounting to $613,496 were approved to assist in the provision of accommodation for 159 old people. From April 1950 to 31 March 1966, subsidies totalling $11,961,000 have been approved and buildings erected as a result will accommodate 3,738 old people.
Local Authority Pensioner Housing—Since 1950 the Government has offered subsidies and low-interest loan finance to local authorities, towards flats for age beneficiaries or elderly people in comparable circumstances. Under present policy, a subsidy of up to 50 percent on eligible capital costs is offered, subject to a maximum of $1,850 per flat. For the balance of the cost, a State Advances loan is provided at 3 1/2 percent interest. In settlements of 50 or more pensioners' fiats, wardens' residential accommodation may also qualify for subsidy and loan. Up to 31 March 1966, a total of $5,942,000 has been made available as subsidy and as a result suitable housing is being provided for 4,700 old people.
Hostels for Young People—In June 1951, the Government decided that, subject to certain conditions, it would assist religious and welfare organisations to establish hostels for young people by granting subsidies of up to 50 percent of establishment costs. As from April 1966, the rate has been increased to 70 percent, with a limit of $2,000 per young person accommodated. The purpose is to assist young men and women who are living away from their homes in order to study or undertake employment and find it difficult to obtain suitable living accommodation. Under a recent extension to the policy, subsidies of up to 50 percent may also be granted for authorised improvements to existing hostels. The Department of Health is responsible for administering this policy.
Since the policy commenced, subsidies totalling $1,209,000 had been approved up to 31 March 1966 to assist in providing hostel accommodation for 1,114 young people.
Government also helps with subsidies for university halls of residence established by religious and welfare agencies. Administration is handled by University Grants Committee.
Short-stay Homes for Intellectually Handicapped Children—In 1954 the Government approved the payment, under certain conditions, of a subsidy of up to 50 percent on the capital cost of approved buildings and furnishings acquired for the purpose of providing short-stay homes' for intellectually handicapped children. In 1963 Government also extended the capital subsidy to include hostels built by the Intellectually Handicapped Children's Society for children who were attending Occupation Groups run by the Education Department. In 1966, the cost of land and professional fees (architect and quantity surveyor) were included in assessing subsidy on hostels and sheltered workshops. In addition a maintenance subsidy of $1 per day is paid in respect of these children under 16 years of age.
The administration of this policy is the responsibility of the Mental Health Division of the Department of Health.
The total amount expended on special subsidies for short-stay homes, hostels, and sheltered workshops during the year ended 31 March 1966 was $88,700. In addition $21,400 was paid by way of maintenance subsidy during the same period.
PHYSICAL WELFARE AND RECREATION—New Zealand is fortunate in having excellent natural facilities for outdoor pursuits and sports. The climate is temperate and equable. The long coastline and the numerous rivers, lakes, and mountain ranges give full opportunity for yachting and boating, swimming and surfing, and mountaineering and tramping. Outdoor activities such as sea fishing, both by rod and by line, and freshwater fishing, and hunting and shooting introduced game birds and mammals are extremely popular and relatively inexpensive.
Most districts, including the larger cities, are well provided with playing fields for outdoor sports, but even so the available facilities are fully taxed and sometimes overtaxed.
Tennis, cricket, lawn bowls, softball, rowing, and athletics are among the most popular summer games and sports.
Rugby football is probably the leading winter sport, but very many people play hockey, association football, league football, outdoor and indoor basketball, indoor bowls, badminton, and table tennis. Golf is popular both winter and summer. Boxing and wrestling have a small following. Dancing in various forms is a popular indoor pastime.
To some extent participation in indoor sports is restricted by inadequate facilities, the position probably being less satisfactory than in respect of outdoor sports. Local authorities substantially assist improvement of facilities by providing or subsidising suitable buildings and amenities, or by directly assisting sports bodies.
While some sports, for instance rugby football, attract many spectators, the high proportion of persons who actually take part in various sports and games compared with those who merely watch them is a striking characteristic of New Zealand life. In many sports there is a close association between school activities and club activities.
The various sports are also generally organised for the purposes of administration, discipline, and player selection. The organisational structure normally ascends from the clubs at the base through district groupings to the national association or union, which is the ultimate controlling body within New Zealand. Promising players or performers have ample and equal opportunity on merit to represent first their clubs, then the district or provincial associations, and ultimately New Zealand, in competitive play.
In major sports, while each administers its own affairs, competitors to represent New Zealand at Olympic and Commonwealth Games are selected by an Olympic Council, made up of representatives of the various sports associations.
All water sports are extremely popular. All popular beaches are patrolled by surf lifesaving clubs in the summer months. The Department of Education each summer conducts “Learn to Swim” campaigns for school children. The New Zealand Swimming Association also conducts “Learn to Swim” classes for children and adults. The Physical Welfare and Recreation Branch of the Department of Internal Affairs, in association with the National Water Safety Council, its member organisations, and swimming and lifesaving organisations, conducts a national water safety campaign, which includes general instruction in resuscitation procedures. Over recent years these campaigns have been successful in reducing deaths by drowning.
Financial Assistance—Grants are made by the Government to national youth organisations. The purpose of the grants is to assist in the extension of sporting and recreational facilities and in promoting leadership training. Grants are not made where projects of these types can be carried out without financial assistance. Sporting and recreational organisations also receive some financial assistance from lottery profits when there has been a substantial degree of self help.
GENERAL—In recent years the provision by the State of free hospital services has come to occupy a prominent place in the welfare services of the country. In 1939 the fees paid by patients in public hospitals were replaced by the payment by the State to the hospital boards of hospital benefits for each patient. The burden of hospital fees was thus taken from the citizen as an individual, and the cost of public hospitals apportioned between the Government and local authorities. Since then local authority contributions through hospital rating have been abolished, and from 1 April 1958 the cost of hospital treatment in public hospitals has been borne entirely by the State. The Minister of Health is responsible for the provision of a comprehensive and integrated hospital service for the whole country. Private hospitals assist in the provision of hospital services and provide about one-sixth of the available beds. Since 1939 private hospitals have received payment from the Government in respect of hospital treatment supplied by them. This payment does not cover the full cost of treatment, and additional fees may be claimed from the patients. Private hospitals are required to be licensed by the Department of Health and are subject to regular inspection by the Department.
HISTORY—The Government in 1846 granted money for the erection of hospitals in each of the four centres—Auckland, Wellington, Wanganui, and New Plymouth—for the treatment of sick and destitute Europeans and free treatment for all Maoris. The foundation stone of the Wellington Hospital was laid in November 1846, whilst the Auckland Hospital was founded the following year. The first Dunedin Hospital was built in 1851, and Christchurch was first served by a hospital at Lyttelton known to have been operating in 1853. In 1854 control of public hospitals was vested in the six Provincial Councils of Auckland, Taranaki, Wellington, Nelson, Canterbury, and Otago, but in 1876, following the abolition of the provinces, control reverted to the General Government.
Hospitals generally remained under Government control until 1885, when the first Hospitals and Charitable Institutions Act was passed. By it New Zealand was divided into 38 hospital districts, each under the control of its own board. The number of districts gradually increased until by 1926 there were 47; amalgamations since that date have reduced the number to 37, at which it now stands.
A Consultative Committee on Hospital Reform was appointed in May 1953 to inquire into and report on matters affecting the administrative control of public hospitals and other services provided by hospital boards and, after taking evidence, it made recommendations to the Government for the reform of the hospital system. A new Hospitals Act passed in 1957 broke new ground in the central principle of its operation. The Act came into force on 1 April 1958. It incorporated as a basic principle the main recommendation of the Consultative Committee on Hospital Reform that the Minister of Health on behalf of the Government should have the responsibility of ensuring the provision by hospital boards of hospital and associated services. The Government assumed complete financial responsibility for hospitals. Consonant with the new responsibilities the Minister was given wide powers of direction and regulation to ensure the establishment of a comprehensive and integrated hospital service for the whole country. Elected boards were retained to manage institutions and administer the services provided under the Act, and no reduction was made in the number of boards.
HOSPITAL BOARDS—A hospital board of 8 to 14 members is elected every three years for each hospital district, and has power to establish, control, and manage hospitals, relief institutions, maternity homes, convalescent homes, and institutions for children. In recent years there has been a pressure of activity, replanning, and development in all medical services for which hospital boards are responsible. This replanning of medical services has been undertaken against a background of sharp population increases in most urban areas. More rapid and comfortable transport is encouraging the build up of specialist diagnostic and therapeutic resources in regional centres.
AUTHORITY OF MINISTER OF HEALTH—It is the duty of every hospital board to provide and maintain such institutions, hospital accommodation, and medical, nursing, and other services as the Minister of Health considers necessary in any part of the district for the reception, relief, care, treatment, isolation, and removal to hospital or “other place” of persons who are suffering from infectious or other disease or from injury, and for maternity cases. The Minister is specifically charged with the function of ensuring the provision of these services and of co-ordinating, guiding, and supervising the activities of hospital boards.
A board must appoint such number of medical practitioners, dentists, nurses, dental nurses, midwives, and other officers as the Minister may from time to time deem necessary for the efficient performance of the functions of the board, whether within an institution under the control of the board or elsewhere within the district.
The Director-General is authorised to visit and inspect hospitals and to appoint assistant inspectors, and is required to report to Parliament through the Minister on the administration of the Hospitals Act.
PATIENTS: Public Institutions—The number of beds in public institutions available at 31 March 1966 and the average number occupied during the year are set out in the following table. These statistics relate to patients and inmates in all institutions (general, maternity, special hospitals, and old people's homes) including institutions under the control of the Department of Health.
| Type of Bed | Beds Available | Average Number of Occupied Beds per Day | ||
|---|---|---|---|---|
| Number | Proportion per 1,000 of Population | Number | Proportion per 1,000 of Population | |
| General | 13,045 | 4.9 | 10,584.4 | 3.9 |
| Maternity | 2,872 | 1.1 | 1,629.0 | 0.6 |
| Total hospital beds | 15,917 | 6.0 | 12,213.4 | 4.5 |
| Non-hospital beds | 1,118 | 0.4 | 962.3 | 0.4 |
| Totals | 17,035 | 6.4 | 13,175.7 | 4.9 |
In addition to the 15,917 hospital beds in public institutions there were 3,264 (2,992 general and 272 maternity) in the 151 licensed private hospitals. If the beds in licensed private hospitals are included, the ratios of beds per 1,000 of population become 6.0 for general beds and 1.2 for maternity beds.
The average number of occupied hospital beds per 1,000 of population in hospital districts varies from 3.4 to 13.5. This variation can be accounted for in the main by the fact that many hospitals to a varying extent draw patients from other districts. Other factors which influence the figures are the availability of medical practitioners and their habits in sending patients to hospital or retaining them for home treatment, the availability of private-hospital beds, housing facilities, domestic assistance, private or district nursing assistance, and the efficiency of the outpatient departments.
The number of institutions coming under the heading of public institutions for the year ended 31 March 1966 was 211, comprising 80 general hospitals (6 of which were also old people's homes), 2 homes for cripples, 7 non-acute hospitals, 5 convalescent hospitals, 93 maternity hospitals, a hospital for physical disorders (which is under the control of the Department of Health), 22 old people's homes, and 1 children's home.
The following statistics for the latest two years relate to all institutions:
| 1964–65 | 1965–66 | |
|---|---|---|
| Number of beds of all descriptions for patients or inmates in all public institutions, including institutions under the control of the Department of Health | 16,630 | 17,035 |
| Number of such beds per 1,000 of population | 6.3 | 6.4 |
| Average number occupied per 1,000 of population | 4.9 | 4.9 |
| Number of persons who, as inpatients or inmates, availed themselves of institutional services during the year | 289,743 | 296,982 |
| Number per 1,000 of population who, as inpatients or inmates, availed themselves of institutional services during the year | 111.2 | 110.9 |
| Number of attendances by outpatients (including attendances for dental treatment) during the year | 2,770,177 | 2,807,456 |
| Number per 1,000 of population of attendances (including dental) by outpatients | 1,063.5 | 1,048.8 |
The Supplement to the Annual Report of the Director-General of Health on Hospital Statistics contains further detail on public institutions.
General Hospitals—In the following table the figures relate only to general hospitals under the control of hospital boards.
| Year | Inpatients Treated | Average Number of Occupied Beds per Day | Average Turnover of Patients Treated per Occupied Bed | Available Beds | Outpatient Attendances (Including Dental) | ||||
|---|---|---|---|---|---|---|---|---|---|
| Number | Proportion per 1,000 of Population | Number | Proportion per 1,000 of Population | Number | Proportion per 1,000 of Population | Number | Proportion per 1,000 of Population | ||
| 1961–62 | 219,016 | 89.7 | 9,204.8 | 3.8 | 23.3 | 12,067 | 4.9 | 2,096,318 | 858.2 |
| 1962–63 | 228,206 | 91.2 | 9,330.0 | 3.7 | 23.3 | 12,341 | 4.9 | 2,264,330 | 904.8 |
| 1963–64 | 238,290 | 93.2 | 9,595.9 | 3.8 | 23.8 | 12,256 | 4.8 | 2,328,808 | 910.7 |
| 1964–65 | 244,792 | 93.8 | 9,733.9 | 3.7 | 24.3 | 12,490 | 4.8 | 2,580,498 | 990.7 |
| 1965–66 | 251,316 | 93.9 | 9,928.8 | 3.7 | 24.3 | 12,776 | 4.8 | 2,634,880 | 984.3 |
Private Hospitals—The total number of private hospitals licensed in New Zealand at 31 March 1966 was 151, providing 272 maternity, 32 psychiatric, and 2,960 beds for general cases.
STAFF—The numbers of staff employed in public hospitals and other institutions and activities controlled by hospital boards in the latest three years were as follows.
| Category of Staff | At 31 March | ||
|---|---|---|---|
| 1964 | 1965 | 1966 | |
| * Includes part-time staff and duplication where persons provide medical services at more than one institution. At 31 March 1966 there were 661 medical officers employed whole time and it is estimated that the hours of 715 visiting officers were the equivalent of the services of 263 whole time officers. | |||
| Institutional medical | 1,583* | 1,648* | 1,719* |
| Other professional and technical | 2,072 | 2,231 | 2,497 |
| Nursing | 12,012 | 12,646 | 13,290 |
| Other treatment staff | 418 | 411 | 444 |
| Domestic and other institutional staff | 9,429 | 9,812 | 10,030 |
| Administrative staff | 573 | 614 | 642 |
| Domiciliary services | 268 | 777 | 948 |
| Farm and garden | 22 | 24 | 23 |
| Other non-institutional | 575 | 258 | 227 |
| Totals | 26,952 | 28,421 | 29,820 |
MATERNITY SERVICES: Beds—At the end of 1966 available hospital-bed accommodation for maternity cases was 3,163, made up as follows:
| Public hospitals | 2,768 |
| Private hospitals | 272 |
| State (St. Helens) hospitals | 104 |
| Alexandra Home (Wellington) | 19 |
| Total | 3,163 |
The total number of confinements in maternity hospitals in 1965 was 54,578, of which 45,390 were in public maternity hospitals, 6,561 in private hospitals, 2,243 in St. Helens Hospitals, and 384 in the Alexandra Home, Wellington. There were 5,844 admissions for ante-natal treatment. All these figures are inclusive of Maoris.
Domiciliary Midwifery Services—Public health nurses and hospital board district nurses carry out some pre-natal work and a limited amount of obstetrical work in back-country areas. In general, however, most of the population is within reach of a maternity hospital, and home deliveries are not encouraged. There remain, however, a few midwives who contract with the Department of Health to give home maternity service under the Social Security Act.
Ante-natal Services—Medical practitioners give ante-natal, neo-natal, and post-natal attention under the Social Security Act. The doctor's attendance, if desired, is supplemented by that of the midwife in charge of an ante-natal clinic. These free ante-natal clinics are established in connection with the three St. Helens Hospitals, all public maternity hospitals or maternity wards, and a number of clinics conducted by the Plunket Society. Ante-natal classes to prepare mothers for the baby's arrival are also being developed, and doctors can refer patients to these to supplement their own ante-natal instructions. In the case of women living far away from the main centres of population, ante-natal work is supplemented by the public health nurses, employed by the Department of Health, or by district nurses, employed by hospital boards.
FINANCE: Institutional Operating Expenditure—The average operating expenditure per occupied bed, relating to hospitals of all types and to general hospitals, is shown in the following table.
| Year | Treatment | Institutional Administration | Heat Light, Power, and Water | Household Expenses | Buildings and Grounds | Miscellaneous | Total |
|---|---|---|---|---|---|---|---|
| All Institutions | |||||||
| $ | $ | $ | $ | $ | $ | $ | |
| 1961–62 | 1,341.2 | 254.8 | 277.0 | 1,246.8 | 173.8 | 4.0 | 3,297.6 |
| 1962–63 | 1,511.4 | 270.4 | 281.2 | 1,307.4 | 182.0 | 3.6 | 3,556.0 |
| 1963–64 | 1,924.4 | 286.0 | 300.6 | 1,130.0 | 188.8 | 3.4 | 3,833.2 |
| 1964–65 | 2,157.2 | 322.4 | 312.4 | 1,218.6 | 193.6 | 4.4 | 4,208.6 |
| 1965–66 | 2,560.4 | 360.4 | 326.4 | 1,249.4 | 205.6 | 4.6 | 4,706.8 |
| General Hospitals | |||||||
| 1961–62 | 1,473.4 | 292.0 | 291.0 | 1,336.4 | 178.8 | 3.2 | 3,574.8 |
| 1962–63 | 1,664.8 | 308.8 | 299.4 | 1,400.4 | 188.2 | 3.2 | 3,864.8 |
| 1963–64 | 2,108.0 | 325.2 | 319.4 | 1,194.2 | 196.6 | 3.2 | 4,146.6 |
| 1964–65 | 2,355.6 | 362.6 | 330.8 | 1,283.2 | 203.0 | 3.6 | 4,538.8 |
| 1965–66 | 2,799.2 | 405.6 | 342.8 | 1,304.2 | 215.8 | 4.0 | 5,071.6 |
Each of these averages includes the direct expenditure of each activity for labour, materials, and incidental expenses, but excludes overheads such as depreciation and interest on capital.
For 1965–66 the average daily expenditure for individual inpatients treated in hospitals classed as general hospitals was $13.90 and the average total expenditure for each inpatient was $200.40.
Receipts—The following table shows the moneys received by hospital boards from Government funds.
| Year | Grants | Social Security Benefits | Total |
|---|---|---|---|
| * In terms of the Social Security Amendment Act 1963, from 1 April 1964 benefits previously paid from the Social Security Fund are incorporated in grants, with the exception of Dental Benefits and Special Area Medical Services. | |||
| $(000) | |||
| 1961–62 | 40,571 | 14,597 | 55,168 |
| 1962–63 | 45,536 | 14,685 | 60,221 |
| 1963–64 | 50,958 | 15,086 | 66,044 |
| 1964–65 | 73,267 | 69* | 73,335 |
| 1965–66 | 83,808 | 86* | 83,894 |
Loans—Boards have been authorised by the Minister of Health to raise loans to cover a very extensive building programme. The position of loan liability is as under.
| Year | Amount Uplifted | Repayment* | Balance Owing |
|---|---|---|---|
| * Includes payments from Sinking Funds. | |||
| $(000) | |||
| 1961–62 | 6,913 | 3,098 | 58,685 |
| 1962–63 | 10,023 | 3,325 | 65,382 |
| 1963–64 | 14,551 | 6,626 | 73,307 |
| 1964–65 | 11,658 | 6,380 | 78,585 |
| 1965–66 | 10,376 | 7,604 | 81,357 |
Payments—Hospital board expenditure is subject to a measure of control by the Minister of Health. Boards are required in the month of April each year to make an estimate of their payments for both capital and maintenance purposes and to have the estimates confirmed at a special meeting of the board. The Minister may, if he thinks it necessary so to do, require the board to amend the estimate submitted. He may also require a board by notice to limit expenditure of whatever kind he may specify. Payments for the three latest years are now given.
| Item of Expenditure | 1963–64 | 1964–65 | 1965–66 |
|---|---|---|---|
| * Includes payments to Sinking Funds. | |||
| $ (thousand) | |||
| Institutional operating expenses | 52,921 | 59,213 | 67,566 |
| Outdoor relief | 201 | 132 | 86 |
| Grants to private hospitals, etc. | 97 | 103 | 102 |
| Other grants | 10 | 10 | 18 |
| Transport of patients | 602 | 701 | 723 |
| Domiciliary services | 734 | 1,030 | 1,433 |
| Administration | 1,389 | 1,547 | 1,807 |
| Superannuation | 447 | 442 | 494 |
| Other expenses | 834 | 1,202 | 1,715 |
| Interest on loans | 3,355 | 3,695 | 3,968 |
| Repayment of loans* | 6,039 | 5,869 | 6,701 |
| Capital works other than “loan” | 3,464 | 3,395 | 3,139 |
| Totals, excluding loans | 70,093 | 77,339 | 87,752 |
| Loan works | 9,988 | 9,783 | 9,139 |
| Totals | 80,081 | 87,122 | 96,891 |
NOTIFICATION OF DISEASES—The numbers of all notifiable diseases reported during the calendar year 1965 are shown in the following table; the total figures (including Maoris) are given month by month, with the totals for Maoris being shown in the last column.
| Disease | All Cases | Maoris | ||||||||||||
|---|---|---|---|---|---|---|---|---|---|---|---|---|---|---|
| January | February | March | April | May | June | July | August | September | October | November | December | Totals | Totals Only | |
| Meningococcal meningitis | – | 2 | 5 | – | 4 | 5 | 6 | 7 | 11 | 13 | 16 | 9 | 78 | 21 |
| Diphtheria | – | – | – | – | – | 1 | – | – | – | – | – | – | 1 | 1 |
| Dysentery— | ||||||||||||||
| Amoebic | – | – | – | – | – | – | 1 | 1 | 1 | – | – | – | 3 | – |
| Bacillary | 31 | 57 | 43 | 44 | 33 | 47 | 52 | 394 | 267 | 268 | 445 | 296 | 1,977 | 101 |
| Eclampsia | – | 6 | 3 | 4 | 4 | 3 | 2 | 4 | 3 | 1 | 7 | 2 | 39 | 2 |
| Enteric fever— | ||||||||||||||
| Paratyphoid | – | – | – | 1 | – | – | – | 1 | – | – | – | – | 2 | 1 |
| Typhoid | 1 | 2 | 4 | 4 | 5 | 2 | 1 | – | 2 | 2 | 2 | 1 | 26 | 23 |
| Food poisoning | 132 | 5 | 19 | 9 | – | 4 | 17 | 4 | 10 | 2 | 2 | 17 | 221 | – |
| Hydatids | 3 | 1 | 2 | 4 | – | 4 | 2 | 2 | 4 | 1 | 2 | 1 | 26 | 6 |
| Infective hepatitis | 145 | 209 | 171 | 173 | 147 | 157 | 153 | 174 | 241 | 192 | 223 | 202 | 2,187 | 246 |
| Leptospiral infections | 15 | 21 | 10 | 11 | 7 | 8 | 2 | 16 | 24 | 40 | 34 | 22 | 210 | 9 |
| Ophthalmia neonatorum | 7 | 7 | 3 | 2 | 4 | 2 | 4 | 4 | 3 | 5 | 1 | 6 | 48 | 8 |
| Pemphigus neonatorum | 2 | 1 | 3 | 10 | 5 | 2 | 2 | 1 | – | 2 | 4 | 6 | 38 | 5 |
| Puerperal infections | 2 | 4 | 2 | 2 | 3 | – | 1 | 2 | 1 | 2 | 4 | 3 | 26 | 7 |
| Salmonella infections | 15 | 33 | 23 | 25 | 11 | 11 | 10 | 15 | 28 | 9 | 31 | 20 | 231 | 27 |
| Staphylococcal pneumonia and septicaemia of the newborn infant | – | – | – | – | – | – | – | – | – | – | – | 1 | 1 | 1 |
| Tetanus | – | 2 | 2 | 2 | 1 | 2 | 2 | 1 | 1 | 2 | 2 | – | 17 | 6 |
| Tuberculosis— | ||||||||||||||
| Pulmonary | 48 | 44 | 76 | 85 | 66 | 77 | 99 | 86 | 101 | 78 | 77 | 101 | 938 | 307 |
| Other forms | 12 | 14 | 23 | 10 | 8 | 19 | 25 | 20 | 13 | 15 | 25 | 24 | 208 | 96 |
| Undulant fever | 2 | 1 | 3 | – | – | – | – | 7 | 10 | 2 | 5 | 1 | 31 | 2 |
| Actinomycosis | 1 | – | – | – | – | – | – | – | – | – | – | – | 1 | – |
| Anchylostomiasis | – | 2 | 4 | – | 1 | 3 | 3 | – | 1 | 2 | 1 | – | 17 | – |
| Beriberi | – | – | – | – | – | – | 1 | – | – | – | – | – | 1 | – |
| Leprosy | – | 1 | – | – | – | – | – | – | – | – | – | – | 1 | – |
| Lethargic encephalitis | – | – | – | – | – | – | – | – | 1 | – | – | – | 1 | – |
| Malaria | – | 1 | – | – | – | – | 1 | 1 | – | 1 | – | – | 4 | 1 |
| Trachoma | – | – | – | 1 | – | – | – | 1 | – | – | – | – | 1 | – |
| Totals | 416 | 413 | 396 | 387 | 299 | 347 | 384 | 740 | 722 | 637 | 881 | 712 | 6,334 | 870 |
Notifications for some of the notifiable diseases for each of the latest five years are shown in the following table. Attention is drawn to the fact that these figures are not considered to be a complete coverage of the incidence of these diseases as medical practitioners frequently overlook the necessity of notifying the Medical Officer of Health.
| Disease | 1961 | 1962 | 1963 | 1964 | 1965 |
|---|---|---|---|---|---|
| Diphtheria All cases | 5 | 12 | 4 | 1 | 1 |
| Maori | – | 8 | 2 | – | 1 |
| Typhoid and paratyphoid fever All cases | 25 | 52 | 22 | 45 | 28 |
| Maori | 16 | 43 | 13 | 25 | 24 |
| Pulmonary tuberculosis All cases | 1,082 | 1,028 | 984 | 848 | 938 |
| Maori | 386 | 371 | 319 | 300 | 307 |
| Cerebrospinal meningitis All cases | 36 | 36 | 52 | 47 | 78 |
| Maori | 15 | 11 | 13 | 20 | 21 |
| Poliomyelitis All cases | 214 | 5 | – | – | – |
| Maori | 72 | 1 | – | – | – |
| Puerperal fever and septic abortion All cases | 27 | 34 | 41 | 33 | 26 |
| Maori | 2 | 3 | 2 | 4 | 7 |
| Tetanus All cases | 24 | 28 | 24 | 15 | 17 |
| Maori | 3 | 5 | 6 | 4 | 6 |
| Hydatids All cases | 47 | 41 | 38 | 29 | 26 |
| Maori | 12 | 13 | 17 | 12 | 6 |
| Food poisoning All cases | 818 | 462 | 435 | 341 | 221 |
| Maori | 29 | 8 | 45 | 2 | – |
| Bacillary dysentery All cases | 501 | 412 | 489 | 1,123 | 1,977 |
| Maori | 65 | 67 | 96 | 79 | 101 |
| Undulant fever All cases | 39 | 31 | 29 | 18 | 31 |
| Maori | 9 | 1 | 3 | 3 | 2 |
| Infective hepatitis All cases | 3,870 | 2,816 | 2,293 | 2,223 | 2,187 |
| Maori | 342 | 237 | 255 | 283 | 246 |
Poliomyelitis—The wide use of Sabin oral poliomyelitis vaccine has had dramatic results, no confirmed case of poliomyelitis having occurred since 1 April 1962.
Hydatids—The following table gives details of hydatid cases treated in hospitals. It can be seen that the number of new cases exceeds the notifications in the preceding table.
| Year | Number of New Public Hospital Cases | Public Hospital Cases Readmitted | Total Public Hospital Cases | Deaths |
|---|---|---|---|---|
| 1954 | 81 | 62 | 143 | 13 |
| 1955 | 85 | 62 | 147 | 14 |
| 1956 | 80 | 59 | 139 | 14 |
| 1957 | 76 | 69 | 145 | 8 |
| 1958 | 75 | 48 | 123 | 3 |
| 1959 | 77 | 67 | 144 | 5 |
| 1960 | 78 | 88 | 166 | 9 |
| 1961 | 69 | 68 | 137 | 6 |
| 1962 | 68 | 35 | 103 | 10 |
| 1963 | 59 | 57 | 116 | 4 |
| 1964 | 69 | 40 | 109 | 3 |
Tuberculosis—The Department of Health is continuing its efforts to reduce further both incidence and mortality. In fact the mortality per 100,000 of population has decreased from 21.1 in 1952 to 3.1 in 1965. The number of public health nurses available for tuberculosis case-finding work has been increased, and hospital clinics in the charge of chest specialists have been provided to give a wide geographical coverage. The responsibilities of the Department of Health in case finding and domiciliary care are co-ordinated with those of the hospital boards, which are responsible for diagnosis and treatment.
Medical officers of the Department of Health assist the public health nurses in the examination of contacts and arrange tuberculin tests and X-ray examinations. There are at present some 10 mass miniature X-ray units strategically sited throughout the country. In 1965 they carried out a total of 260,354 chest X-ray examinations, and found that 0.49 in every thousand examined required supervision and treatment for tuberculous disease. In addition to tuberculosis, many other conditions of lungs and heart were discovered and, where necessary, were referred to the individual's private doctor for further investigation and follow-up.
As a contribution to prophylaxis, BCG vaccination against tuberculosis, which was commenced on hospital staffs, contacts, and adolescents, is being maintained in these groups. During 1965 vaccinations were performed on 26,127 persons after preliminary Mantoux testing, and the results of this activity should become manifest in the years to come.
The Department of Health maintains a Tuberculosis Register, which classifies all notified cases, and a clearer conception of the type, form, and extent of the disease is being obtained. The number of cases on the Register (inclusive of Maoris) at 31 December 1965 was 7,529. The number of new cases notified in 1965 was 1,146 of which 743 were non-Maori and 403 Maori. Of the non-Maori cases, 631 were respiratory and 112 non-respiratory, and in the Maori cases the figures were 307 and 96 respectively. Some of these cases may have since been proved non-tuberculous and subsequently deregistered.
The total number of non-Maori persons on the Register at the end of 1964 amounted to 18 per 10,000 of the non-Maori population and the Maori rate was 147 per 10,000 of the Maori population. The combined figure was 28 per 10,000.
PUBLIC HOSPITAL PATIENTS—Detailed statistical information is supplied to the Department of Health about every patient, except normal maternity cases, discharged from or dying in public hospitals in New Zealand. After tabulation in accordance with the International Classification of Diseases, this information is published annually in the Department of Health publication Medical Statistics. According to the census of non-psychiatric hospitals conducted by the Department of Health in 1961, patients in public hospitals comprised 82.4 percent of hospital patients.
Patients Treated—The following table shows the number of patients treated in public hospitals for the latest six years.
| Year | Remaining on 1 January from Previous Year | Admissions | Discharges | Deaths | Total Number of Indoor Patients | Remaining on 31 December |
|---|---|---|---|---|---|---|
* Includes 49 patients from Buchanan Ward, Greytown, not previously included. † Includes 28 patients from Wilson Home, Auckland, not previously included. ‡ Provisional. § Includes 46 patients from Jubilee Home, Christchurch, not previously included. ∥ Includes 5 patients from Picton Hospital, not previously included. | ||||||
| 1960 | 8,042 | 183,743 | 173,990 | 9,768 | 191,785 | 8,027 |
| 1961 | 8,076* | 186,795 | 176,215 | 10,289 | 194,871 | 8,367 |
| 1962 | 8,395† | 195,906 | 185,770 | 10,440 | 204,301 | 8,091 |
| 1963 | 8,137§ | 205,490 | 194,321 | 10,784 | 213,627 | 8,522 |
| 1964 | 8,527∥ | 215,181 | 204,158 | 10,883 | 223,708 | 8,667 |
| 1965‡ | 8,667 | 221,796 | 210,420 | 11,265 | 230,463 | 8,778 |
Age and Sex of Patients—The age and sex of patients discharged from or dying in public hospitals during 1964 are shown below.
| Age Groups | Males | Females | Total |
|---|---|---|---|
| Under 1 year | 5,373 | 4,013 | 9,386 |
| 1–4 years | 10,430 | 7,727 | 18,157 |
| 5–9 years | 9,718 | 7,383 | 17,101 |
| 10–14 years | 6,734 | 5,070 | 11,804 |
| 15–19 years | 7,695 | 9,106 | 16,801 |
| 20–24 years | 6,856 | 9,576 | 16,432 |
| 25–29 years | 4,339 | 7,495 | 11,834 |
| 30–34 years | 4,364 | 6,744 | 11,108 |
| 35–39 years | 4,615 | 6,870 | 11,485 |
| 40–44 years | 4,621 | 6,391 | 11,012 |
| 45–49 years | 4,837 | 5,896 | 10,733 |
| 50–54 years | 5,698 | 5,812 | 11,510 |
| 55–59 years | 5,925 | 4,906 | 10,831 |
| 60–64 years | 5,851 | 4,663 | 10,514 |
| 65–69 years | 4,993 | 4,436 | 9,429 |
| 70–74 years | 4,610 | 4,267 | 8,877 |
| 75–79 years | 4,092 | 4,066 | 8,158 |
| 80–34 years | 2,989 | 2,999 | 5,988 |
| 85 years and over | 1,808 | 2,073 | 3,881 |
| Totals | 105,548 | 109,493 | 215,041 |
Although there is little overall difference in the totals of males and females, there is a well defined pattern when figures for each sex are compared, age group by age group. In all ages under 15 years there is a preponderance of males. This difference is common to most disease groups but is more marked in diseases of the digestive, genito-urinary, musculoskeletal, and respiratory systems, in congenital malformations, and in accidental injuries. For the ages between 15 and 50 years there are more females than males. This age group covers the child-hearing ages in women, and the higher proportion of female patients is a reflection of this fact. Apart from conditions associated with pregnancy, abortion, delivery, and the puerperium, female patients considerably outnumbered male patients in both malignant and non-malignant tumours, in diseases of the thyroid gland and the genito-urinary system and in symptomatic conditions. In the age groups from 50 years upwards the males once more predominate, except for 85 years and over, particularly in diseases of the circulatory, respiratory, and digestive systems.
Principal Diseases and Disabilities—The following summary shows the principal diseases and injuries treated, together with the number of deaths and the fatality rate percent of total cases treated, in public hospitals in 1964. The disease headings are the subtitles of the International Classification of Diseases. More detailed information is published annually in Medical Statistics.
It should be noted that the disease or condition for which a patient is admitted to hospital is not necessarily that which would rank as the cause of death in mortality statistics. Congestive heart failure, for instance, is comparatively highly ranked in hospital cases as the condition immediately affecting the patient, but is frequently only the consequence of some underlying disease, which would take precedence over congestive heart failure in the statistics of causes of death. Hospital returns show each disease for which the patient was treated while in hospital, but the classification for statistical purposes has been made on the basis of the principal disease for which the patient was admitted, regardless of what other unrelated diseases may have been present or developed during the stay in hospital. In mortality statistics, on the other hand, the underlying cause of death is of paramount importance. In the summary below a patient admitted on account of an injury is classified according to the nature of the injury. Should the patient die, however, the death would be classified in the mortality statistics according to the cause of the injury, e.g., motor-vehicle accident, accidental fall, etc.
| DISEASES AND DISABILITIES TREATED IN PUBLIC HOSPITALS DURING 1964 | |||
|---|---|---|---|
| Disease or Disability | Total Discharges and Deaths in Public Hospitals | Deaths in Public Hospitals | Fatality Rate Percent |
| Tuberculosis of respiratory system | 1,327 | 51 | 3.8 |
| Tuberculosis, other forms | 409 | 13 | 3.2 |
| Syphilis and its sequelae | 55 | 4 | 7.3 |
| Gonococcal infection and other venereal diseases | 89 | – | – |
| Infectious diseases commonly arising in intestinal tract | 279 | 7 | 2.5 |
| Other bacterial diseases | 546 | 42 | 7.7 |
| Spirochaetal diseases except syphilis | 90 | – | – |
| Diseases attributable to viruses | 1,977 | 25 | 1.3 |
| Malaria | 10 | – | – |
| Other infective or parasitic diseases | 435 | 8 | 1.8 |
| Cancer, malignant disease | 11,073 | 2,242 | 20.2 |
| Benign neoplasm | 4,670 | 18 | 0.4 |
| Neoplasm of unspecified nature | 196 | 8 | 4.1 |
| Allergic disorders | 1,820 | 41 | 2.3 |
| Diseases of thyroid gland | 861 | 12 | 1.4 |
| Diabetes mellitus | 2,009 | 120 | 6.0 |
| Diseases of other endocrine glands | 324 | 10 | 3.1 |
| Avitaminoses and other metabolic diseases | 503 | 19 | 3.8 |
| Diseases of the blood and blood-forming organs | 1,227 | 88 | 7.2 |
| Psychoses | 1,840 | 78 | 4.2 |
| Psychoneurotic disorders | 1,697 | 2 | 0.1 |
| Disorders of character, behaviour, and intelligence | 1,210 | 12 | 1.0 |
| Vascular lesions affecting central nervous system | 3,734 | 1,487 | 39.8 |
| Inflammatory diseases of central nervous system | 737 | 73 | 9.9 |
| Other diseases of central nervous system | 2,880 | 277 | 9.6 |
| Diseases of nerves and peripheral ganglia | 493 | 9 | 1.8 |
| Inflammatory diseases of eye | 631 | 1 | 0.2 |
| Other diseases and conditions of eye | 3,918 | 9 | 0.2 |
| Diseases of ear and mastoid process | 2,462 | 1 | – |
| Rheumatic fever | 501 | 8 | 1.6 |
| Chronic rheumatic heart disease | 537 | 43 | 8.0 |
| Arteriosclerotic and degenerative heart disease | 5,974 | 1,637 | 27.4 |
| Other diseases of heart | 2,643 | 691 | 26.1 |
| Hypertensive heart disease | 327 | 70 | 21.4 |
| Other hypertensive disease | 847 | 31 | 3.7 |
| Diseases of arteries | 1,560 | 304 | 19.5 |
| Diseases of veins and other diseases of circulatory system | 6,384 | 106 | 1.7 |
| Acute upper respiratory infections | 1,966 | 6 | 0.3 |
| Influenza | 624 | 19 | 3.0 |
| Pneumonia | 6,262 | 578 | 9.2 |
| Bronchitis | 3,912 | 288 | 7.4 |
| Other diseases of respiratory system | 13,694 | 98 | 0.7 |
| Diseases of buccal cavity and oesophagus | 2,280 | 20 | 0.9 |
| Diseases of stomach and duodenum | 2,418 | 128 | 5.3 |
| Appendicitis | 6,032 | 13 | 0.2 |
| Hernia of abdominal cavity | 5,327 | 44 | 0.8 |
| Other diseases of intestines and peritoneum | 5,035 | 190 | 3.8 |
| Diseases of liver, gallbladder, and pancreas | 3,802 | 170 | 4.5 |
| Nephritis and nephrosis | 940 | 93 | 9.9 |
| Other diseases of urinary system | 3,488 | 113 | 3.2 |
| Diseases of male genital organs | 2,736 | 88 | 3.2 |
| Diseases of breast, ovary, Fallopian tube, and parametrium | 1,598 | – | – |
| Diseases of uterus and other female genital organs | 8,297 | 11 | 0.1 |
| Complications of pregnancy | 3,395 | 3 | 0.1 |
| Abortion | 4,715 | 1 | – |
| Delivery without mention of complication | 314 | – | |
| Delivery with specified complication | 1,078 | 3 | 0.3 |
| Complications of the puerperium | 558 | – | |
| Infections of skin and subcutaneous tissue | 3,182 | 7 | 0.2 |
| Other diseases of skin and subcutaneous tissue | 1,965 | 17 | 0.9 |
| Arthritis and rheumatism, except rheumatic fever | 3,021 | 79 | 2.6 |
| Osteomyelitis and other diseases of bone and joint | 3,955 | 20 | 0.5 |
| Other diseases of musculoskeletal system | 3,317 | 7 | 0.2 |
| Congenital malformations | 3,725 | 170 | 4.6 |
| Birth injuries, asphyxia, and infections of newborn | 475 | 95 | 20.0 |
| Other diseases peculiar to early infancy | 1,574 | 102 | 6.5 |
| Symptoms referable to systems or organs | 10,775 | 29 | 0.3 |
| Senility and ill defined diseases | 2,119 | 270 | 12.7 |
| Fracture of skull, spine, and trunk | 2,852 | 104 | 3.6 |
| Fracture of upper limb | 3,728 | 12 | 0.3 |
| Fracture of lower limb | 4,899 | 332 | 6.8 |
| Dislocation without fracture | 751 | 1 | 0.1 |
| Sprains and strains of joints and adjacent muscles | 908 | – | – |
| Head injury (excluding skull fracture) | 6,686 | 102 | 1.5 |
| Internal injury of chest, abdomen, and pelvis | 445 | 26 | 5.8 |
| Laceration and open wound of face, neck, and trunk | 1,179 | 4 | 0.3 |
| Laceration and open wound of upper limb | 2,454 | 3 | 0.1 |
| Laceration and open wound of lower limb | 1,127 | 1 | 0.1 |
| Laceration and open wounds of multiple location | 184 | 1 | 0.5 |
| Superficial injury | 283 | – | – |
| Contusion and crushing with intact skin surface | 1,622 | 7 | 0.4 |
| Effects of foreign body entering through orifice | 715 | 4 | 0.6 |
| Burns | 1,700 | 27 | 1.6 |
| Injury to nerves and spinal cord without bone injury | 196 | 1 | 0.5 |
| Effects of poisons | 3,402 | 35 | 1.0 |
| Effects of weather, exposure, and related conditions | 42 | 3 | 7.1 |
| Other and unspecified injuries and reactions | 1,087 | 11 | 1.0 |
| Special conditions and examinations without sickness | 1,851 | – | – |
| Admissions for convalescent care, plastic treatment, and fitting of prosthetic devices | 76 | – | – |
| Totals | 215,041 | 10,883 | 5.1 |
Duration of Slay in Public Hospitals—The average duration of stay of patients in public hospitals is shown in the following table.
| AVERAGE DURATION OF STAY IN PUBLIC HOSPITALS, 1964 | ||
|---|---|---|
| Disease or Disability | Total Discharges and Deaths in Public Hospitals | Average Stay (Days) |
| Tuberculosis—all forms | 1,736 | 79.2 |
| Infective and parasitic diseases (except tuberculosis) | 3,481 | 19.3 |
| Malignant neoplasms | 11,072 | 21.5 |
| Non-malignant neoplasm | 4,866 | 10.1 |
| Allergic disorders | 1,820 | 12.0 |
| Diseases of thyroid gland | 861 | 14.0 |
| Diabetes mellitus | 2,009 | 29.5 |
| Diseases of other endocrine glands and metabolic diseases | 827 | 25.0 |
| Diseases of blood and blood-forming organs | 1,227 | 21.0 |
| Psychosis | 1,840 | 32.7 |
| Psychoneurotic, character, personality, and intelligence disorders | 2,908 | 12.5 |
| Vascular lesions affecting central nervous systems | 3,733 | 65.3 |
| Other diseases of central nervous system, nerves, and peripheral ganglia | 4,110 | 55.9 |
| Diseases of eye | 4,548 | 10.1 |
| Diseases of ear and mastoid process | 2,462 | 11.7 |
| Rheumatic fever and rheumatic heart disease | 1,038 | 35.7 |
| Arteriosclerotic and degenerative heart disease | 5,970 | 29.9 |
| Hypertensive and other diseases of heart | 3,816 | 28.8 |
| Diseases of arteries | 1,559 | 31.3 |
| Diseases of veins and other diseases of circulatory system | 6,383 | 13.2 |
| Acute upper respiratory infections and influenza | 2,590 | 7.2 |
| Pneumonia | 6,262 | 17.4 |
| Bronchitis | 3,912 | 19.6 |
| Hypertrophy of tonsils and adenoids | 10,471 | 3.7 |
| Other diseases of respiratory system | 3,224 | 12.9 |
| Diseases of buccal cavity and oesophagus | 2,280 | 4.5 |
| Diseases of stomach and duodenum | 2,418 | 18.4 |
| Appendicitis | 6,032 | 9.2 |
| Hernia of abdominal cavity | 5,327 | 10.6 |
| Other diseases of intestines and peritoneum | 5,035 | 13.2 |
| Diseases of liver, gallbladder, and pancreas | 3,801 | 15.8 |
| Diseases of urinary system | 4,428 | 16.3 |
| Diseases of male genital organs | 2,736 | 13.5 |
| Diseases of breast and female genital organs | 9,895 | 7.6 |
| Complications of pregnancy | 3,395 | 11.2 |
| Abortion | 4,715 | 4.2 |
| Delivery and complications of the puerperium | 1,950 | 9.6 |
| Diseases of skin and cellular tissue | 5,147 | 13.4 |
| Arthritis and rheumatism, except rheumatic fever | 3,021 | 54.1 |
| Osteomyelitis and other diseases of musculoskeletal system | 7,271 | 19.6 |
| Congenital malformations | 3,725 | 19.5 |
| Certain diseases of early infancy | 2,049 | 17.2 |
| Symptoms, senility, and ill defined conditions | 12,905 | 19.0 |
| Fractures | 11,479 | 22.2 |
| Head injury (except fracture) | 6,685 | 5.1 |
| Laceration and open wound | 4,944 | 8.4 |
| Burns | 1,700 | 21.5 |
| Effects of poisons | 3,402 | 3.5 |
| Other injuries and adverse reactions | 6,049 | 9.0 |
| Special admissions without sickness | 1,927 | 7.0 |
| All conditions | 215,041 | 17.4 |
Accident Cases—A summary is given below of accident cases treated as inpatients in public hospitals during 1964.
| Type of Accident | Total Cases | Percentage of All Accident Cases | Average Stay (Days) | Aggregate Stay (Days) | Aggregate Stay as Percentage of Total |
|---|---|---|---|---|---|
| Transport— | |||||
| Railway | 106 | 0.3 | 17.0 | 1,802 | 0.4 |
| Motor-vehicle traffic | 7,577 | 20.5 | 13.6 | 102,729 | 20.0 |
| Motor-vehicle non-traffic | 199 | 0.5 | 10.9 | 2,172 | 0.4 |
| Other road vehicles | 1,568 | 4.2 | 7.7 | 12,032 | 2.3 |
| Water | 193 | 0.5 | 13.0 | 2,508 | 0.5 |
| Aircraft | 22 | 0.1 | 22.8 | 502 | 0.1 |
| Total transport | 9,665 | 26.1 | 12.6 | 121,745 | 23.7 |
| Non-transport— | |||||
| Accidental poisoning | 2,584 | 7.0 | 2.7 | 6,893 | 1.3 |
| Accidental falls | 8,923 | 24.1 | 23.0 | 204,993 | 40.0 |
| Other accidents | 11,148 | 30.1 | 10.4 | 115,557 | 22.5 |
| Total non-transport | 22,655 | 61.3 | 14.5 | 327,443 | 63.8 |
| Complications due to non-therapeutic medical and surgical procedures | 35 | 0.1 | 4.9 | 173 | – |
| Therapeutic misadventure and late complications of therapeutic procedures | 2,179 | 5.9 | 16.6 | 36,260 | 7.1 |
| Late effects of injury and poisoning | 829 | 2.2 | 19.4 | 16,117 | 3.1 |
| Suicide and self-inflicted injury | 1,060 | 2.9 | 7.2 | 7,608 | 1.5 |
| Homicide and injury purposely inflicted by other persons | 555 | 1.5 | 6.4 | 3,566 | 0.7 |
| Injury resulting from operations of war | 2 | – | 55.0 | 110 | – |
| Grand totals | 36,980 | 100.0 | 13.9 | 513,022 | 100.0 |
Most cases come under the heading “Non-transport—Other accidents”, which includes accidents caused by cutting and piercing instruments, machinery, falling objects, fire and hot objects, and so on. Of these most occurred in the home.
The second largest group is “Accidental falls”, which has an aggregate stay greater than any other group. This is due to the long periods spent in hospital by elderly people who have sustained fractures of the femur in falls.
Motor-vehicle traffic accidents comprise the third largest group, and have the third largest aggregate stay. It is interesting to note that there were three and a third times as many admissions to hospital and three and a third times as many beds occupied by people injured in non-transport accidents as there were for motor-vehicle traffic accidents. Traffic accidents on roads are analysed in tables in Section 11C Roads and Road Transport.
Patients discharged from, or dying in, public hospitals in 1964 after treatment for accidents sustained in the home are given in the following table.
| Cause of Accident | Total Patients | Days Stay |
|---|---|---|
| Accidental poisoning by barbituric acid and derivatives | 201 | 1,200 |
| Accidental poisoning by aspirin and salicylates | 165 | 315 |
| Accidental poisoning by petroleum products | 302 | 741 |
| Accidental poisoning by industrial solvents | 184 | 295 |
| Accidental poisoning by corrosive aromatics, acids, and caustic alkalis | 284 | 538 |
| Accidental poisoning by other and unspecified liquid and solid substances | 1,294 | 2,772 |
| Accidental poisoning by gases and vapours | 19 | 180 |
| Accidental falls | 4,477 | 109,562 |
| Blow from falling object | 210 | 1,733 |
| Accident caused by machinery | 605 | 6,077 |
| Accident caused by cutting and piercing instruments | 1,145 | 8,777 |
| Accidental burns | 1,280 | 29,111 |
| Accident caused by foreign bodies | 566 | 1,713 |
| All other and unspecified accidents | 884 | 7.625 |
| Totals | 11,616 | 170,639 |
Deaths in Public Hospitals—The percentage of deaths in public hospitals to all deaths has increased over the last 12 years. Examination of the following table shows the trend.
| Year | Deaths in Public Hospitals | Total Deaths | Percentage of Deaths in Public Hospitals to Total Deaths |
|---|---|---|---|
| * Provisional. | |||
| 1954 | 8,140 | 18,876 | 43.1 |
| 1955 | 8,410 | 19,225 | 43,7 |
| 1956 | 8,824 | 19,696 | 44.8 |
| 1957 | 9,576 | 20,862 | 45.9 |
| 1958 | 9,248 | 20,301 | 45.6 |
| 1959 | 10,020 | 21,128 | 47.4 |
| 1960 | 9,768 | 20,892 | 46.8 |
| 1961 | 10,289 | 21,782 | 47.2 |
| 1962 | 10,436 | 22,081 | 47.3 |
| 1963 | 10,784 | 22,416 | 48.1 |
| 1964 | 10,883 | 22,861 | 47.6 |
| 1965* | 11,265 | 22,976 | 49.0 |
GENERAL—Mental hospitals are administered under the direction of the Minister of Health by the Mental Health Division of the Department of Health. Hospital boards have no jurisdiction over mental hospitals. There are 11 mental hospitals, four hospitals and training schools for the mentally subnormal, and one hospital for functional nervous disorders.
The newer hospitals are built on the villa system with accommodation provided in pleasant detached units of about 50 beds each. Each villa is surrounded by lawns and gardens and is largely self-contained. There are facilities for recreation and entertainment in addition to provision for modern methods of therapy.
Nursing services are provided in the main by trained staff, both male and female. The training involves three-year courses leading to the State-registered qualifications of psychiatric nurse or psychopaedic (mental deficiency) nurse. In addition to the nursing and medical staff, a wide range of ancillary staff is provided. The Division administers and staffs the Occupational Therapy Training School which provides occupational therapists for all hospitals in the country. In addition, the Division employs clinical psychologists, social workers, recreation officers, welfare officers, and, at the special hospitals and training schools for the mentally subnormal, specially qualified training officers and instructors.
In recent years there have been some important and far-reaching changes in procedure for the admission and discharge of mental hospital patients. These changes are directed towards greater flexibility in the use of mental health services in psychiatric treatment, care, and rehabilitation. They allow for the informal admission of voluntary patients, mentally subnormal persons, and minors. Persons who, by reason of mental infirmity arising from age or from deterioration or disease or injury to the brain, require care and treatment, can now be admitted merely on application accompanied by a letter of recommendation by a medical practitioner. The patient may be discharged at any time on application provided the medical superintendent is satisfied that the arrangements for the care of the patient after discharge are appropriate. Mentally subnormal persons and minors can now be admitted informally in a similar way to that for the mentally infirm. Any mentally subnormal person, with the approval of the medical superintendent, may attend the institution as a voluntary outpatient for training and occupational therapy.
A detailed Report on Mental Health Data is published annually by the National Health Statistics Centre of the Department of Health. The report contains administrative and clinical data about first admissions and readmissions (including replacements from leave), transfers, discharges, and deaths for each mental hospital. The report also presents information about psychiatric disorders in terms of age and sex, etiological factors, country of birth, domicile, race, treatment, response to treatment, and length of stay.
The following statistics refer to mental hospital admissions, discharges, and deaths, and include figures for the mentally subnormal and cases treated at Queen Mary Hospital, Hanmer.
At the end of 1965 there were 10,159 people on the registers of mental hospitals and 1,786 on the registers of hospitals for the mentally subnormal, a total of 11,945. There were 4,430 registrations during the year (excluding transfers) of which 4,430, or 59.9 percent, were voluntary patients. The average number of occupied beds was 10,492, which was only 3 more than for 1964. The average number resident per 100,000 mean population has, however, declined steadily over the last 20 years.
The average number on the registers in 1965 was 1,245 for voluntary patients, and 10,633 for non-voluntary patients. For the previous year the figures were 1,252 for voluntary patients and 10,554 for non-voluntary patients.
In the following table the average number on the registers and the rates per 100,000 mean population are shown for certain years. It can be seen that in spite of the annual increases in the average number resident, the rates have decreased steadily.
| Year | Resident | Absent on Leave | Total | |||
|---|---|---|---|---|---|---|
| Average Number | Rate | Average Number | Rate | Average Number | Rate | |
| Voluntary Patients | ||||||
| 1942 | 293 | 17.9 | 2 | 0.1 | 295 | 18.0 |
| 1947 | 376 | 20.9 | 5 | 0.3 | 381 | 21.2 |
| 1952 | 480 | 24.0 | 11 | 0.6 | 491 | 24.6 |
| 1957 | 661 | 29.6 | 78 | 3.5 | 739 | 33.1 |
| 1961 | 1,042 | 42.9 | 90 | 3.7 | 1,132 | 46.6 |
| 1962 | 1,116 | 44.8 | 114 | 4.6 | 1,230 | 49.4 |
| 1963 | 1,137 | 44.7 | 148 | 5.8 | 1,285 | 50.5 |
| 1964 | 1,111 | 42.8 | 141 | 5.4 | 1,252 | 48.2 |
| 1965 | 1,134 | 42.8 | 111 | 4.2 | 1,245 | 47.0 |
| Non-voluntary Patients | ||||||
| 1942 | 7,633 | 465.5 | 457 | 27.9 | 8,090 | 493.4 |
| 1947 | 8,063 | 448.4 | 586 | 32.6 | 8,649 | 481.0 |
| 1952 | 8,590 | 430.3 | 796 | 39.9 | 9,386 | 470.2 |
| 1957 | 9,189 | 411.6 | 867 | 38.8 | 10,056 | 450.4 |
| 1961 | 9,055 | 373.0 | 1,030 | 42.4 | 10,085 | 415.4 |
| 1962 | 9,151 | 367.8 | 1,121 | 45.0 | 10,272 | 412.8 |
| 1963 | 9,350 | 367.7 | 1,163 | 45.7 | 10,513 | 413.4 |
| 1964 | 9,378 | 360.9 | 1,176 | 45.3 | 10,554 | 406.2 |
| 1965 | 9,358 | 353.5 | 1,275 | 48.2 | 10,633 | 401.7 |
| All Patients | ||||||
| 1942 | 7,926 | 483.4 | 459 | 28.0 | 8,385 | 511.4 |
| 1947 | 8,439 | 469.3 | 591 | 32.9 | 9,030 | 502.2 |
| 1952 | 9,070 | 454.3 | 807 | 40.5 | 9,877 | 494.8 |
| 1957 | 9,850 | 441.2 | 945 | 42.3 | 10,795 | 483.5 |
| 1961 | 10,097 | 415.9 | 1,120 | 46.1 | 11,217 | 462.0 |
| 1962 | 10,267 | 412.6 | 1,235 | 49.6 | 11,502 | 462.2 |
| 1963 | 10,487 | 412.4 | 1,311 | 51.5 | 11,798 | 463.9 |
| 1964 | 10,489 | 403.7 | 1,317 | 50.7 | 11,806 | 454.4 |
| 1965 | 10,492 | 396.3 | 1,386 | 52.4 | 11,878 | 448.7 |
FIRST ADMISSIONS—In 1965 there were 4,083 first admissions to mental hospitals. Of these 2,092 were males and 1,991 were females. The number of voluntary patients (2,161) exceeded the number of non-voluntary patients (1,922).
The numbers and rates of first admissions, together with the percentage of first admissions in total admissions and the percentage of voluntary patients in first admissions, are shown in the next tables.
| Years | Voluntary Patients | Non-voluntary Patients | All Patients | ||||||
|---|---|---|---|---|---|---|---|---|---|
| Male | Female | Total | Male | Female | Total | Male | Female | Total | |
| * Average over five years. | |||||||||
| Numbers | |||||||||
| 1935–39* | 115 | 97 | 212 | 481 | 462 | 943 | 596 | 559 | 1,155 |
| 1940–44* | 110 | 126 | 236 | 470 | 526 | 996 | 580 | 652 | 1,232 |
| 1945–49* | 235 | 267 | 502 | 544 | 607 | 1,151 | 779 | 874 | 1,653 |
| 1950–54* | 349 | 384 | 733 | 625 | 746 | 1,371 | 974 | 1,130 | 2,104 |
| 1955–59* | 489 | 577 | 1,066 | 669 | 731 | 1,400 | 1,158 | 1,308 | 2,466 |
| 1960–64* | 933 | 1,058 | 1,991 | 897 | 836 | 1,733 | 1,830 | 1,894 | 3,724 |
| 1962 | 1,148 | 1,234 | 2,382 | 1,008 | 945 | 1,953 | 2,156 | 2,179 | 4,335 |
| 1963 | 1,041 | 1,175 | 2,216 | 1,020 | 912 | 1,932 | 2,061 | 2,087 | 4,148 |
| 1964 | 912 | 1,079 | 1,991 | 996 | 927 | 1,923 | 1,908 | 2,006 | 3,914 |
| 1965 | 1,033 | 1,128 | 2,161 | 1,059 | 863 | 1,922 | 2,092 | 1,991 | 4,083 |
| Rates per 100,000 of Mean Population | |||||||||
| 1935–39* | 14.2 | 12.4 | 13.3 | 59.5 | 58.9 | 59.2 | 73.7 | 71.3 | 72.5 |
| 1940–44* | 13.7 | 15.0 | 14.4 | 58.5 | 62.8 | 60.8 | 72.2 | 77.8 | 75.2 |
| 1945–49* | 26.2 | 29.6 | 27.9 | 61.1 | 67.5 | 64.5 | 87.3 | 97.1 | 92.4 |
| 1950–54* | 34.6 | 38.5 | 36.6 | 62.2 | 74.9 | 68.5 | 96.8 | 113.4 | 105.1 |
| 1955–59* | 43.4 | 51.7 | 47.5 | 59.6 | 65.8 | 62.7 | 102.9 | 117.5 | 110.2 |
| 1960–64* | 74.5 | 85.3 | 79.9 | 71.5 | 67.4 | 69.5 | 146.0 | 152.7 | 149.3 |
| 1962 | 91.7 | 99.8 | 95.7 | 80.5 | 76.4 | 78.5 | 172.3 | 176.2 | 174.2 |
| 1963 | 81.5 | 92.8 | 87.1 | 79.8 | 72.1 | 76.0 | 161.3 | 164.9 | 163.1 |
| 1964 | 69.9 | 83.5 | 76.6 | 76.3 | 71.7 | 74.0 | 146.2 | 155.2 | 150.6 |
| 1965 | 77.7 | 85.6 | 81.6 | 79.6 | 65.5 | 72.6 | 157.3 | 151.1 | 154.2 |
| Years | Percentage of First Admissions in Total Admissions | Percentage of Voluntary Patients in First Admissions |
|---|---|---|
| * Average over five years. | ||
| 1935–39* | 80.1 | 18.3 |
| 1940–44* | 76.7 | 19.0 |
| 1945–49* | 75.6 | 30.1 |
| 1950–54* | 74.0 | 34.7 |
| 1955–59* | 67.5 | 43.0 |
| 1960–64* | 61.1 | 53.4 |
| 1963 | 60.7 | 53.4 |
| 1964 | 55.4 | 50.9 |
| 1965 | 55.2 | 52.9 |
Diagnosis—The four leading diagnoses in 1965 were: senile psychosis, 456 cases; neurotic-depressive reaction, 596 cases; schizophrenic disorders, 506 cases; manic-depressive reaction, 507 cases. These four diagnoses accounted for about half (50.6 percent) of first admissions.
The number of voluntary patients, informal patients, and formal and other patients, by diagnosis are now shown for 1965.
| Diagnosis | Voluntary Patients | Informal Patients | Formal and Other Patients |
|---|---|---|---|
| Psychoses | |||
| Schizophrenic disorders (dementia praecox) | 218 | 34 | 254 |
| Manic-depressive reaction | 372 | 10 | 125 |
| Involutional melancholia | 43 | – | 4 |
| Paranoia and paranoid states | 20 | – | 7 |
| Senile psychosis | 30 | 331 | 95 |
| Presenile psychosis | 5 | 10 | 1 |
| Psychosis with cerebral arteriosclerosis | 16 | 84 | 28 |
| Alcoholic psychosis | 28 | 8 | 29 |
| Psychosis of other demonstrable etiology | 21 | 32 | 22 |
| Puerperal psychosis | 18 | – | 8 |
| Other and unspecified psychoses | 12 | 14 | 14 |
| Psychoneuroses | |||
| Anxiety reaction | 203 | 2 | 4 |
| Hysterical reaction | 41 | 2 | 6 |
| Neurotic-depressive reaction | 531 | 11 | 54 |
| Other and unspecified psychoneurotic disorders | 116 | 1 | 6 |
| Disorders of Character, Behaviour, and Intelligence | |||
| Pathological and immature personality | 123 | 53 | 121 |
| Alcoholism | 295 | – | 36 |
| Mental deficiency | 23 | 303 | 37 |
| Other and unspecified character, behaviour, and intelligence disorders | 23 | 17 | 17 |
| Other Conditions | |||
| Epilepsy | 15 | 10 | 7 |
| Other defined conditions | 4 | 9 | – |
| Observation | 4 | 5 | 111 |
| Totals | 2,161 | 936 | 986 |
Numbers and rates of first admissions by diagnosis are shown in the following table.
| Diagnosis | Numbers | Rates per Million of Mean Population | ||||
|---|---|---|---|---|---|---|
| 1963 | 1964 | 1965 | 1963 | 1964 | 1965 | |
| Psychoses | ||||||
| Schizophrenic disorders (dementia praecox) | 655 | 518 | 506 | 258 | 199 | 191 |
| Manic-depressive reaction | 523 | 441 | 507 | 206 | 170 | 192 |
| Involutional melancholia | 45 | 51 | 47 | 18 | 20 | 18 |
| Paranoia and paranoid states | 22 | 14 | 27 | 9 | 5 | 10 |
| Senile psychosis | 548 | 573 | 456 | 215 | 221 | 172 |
| Presenile psychosis | 18 | 23 | 16 | 7 | 9 | 6 |
| Psychosis with cerebral arteriosclerosis | 123 | 150 | 128 | 48 | 58 | 48 |
| Alcoholic psychosis | 56 | 52 | 65 | 22 | 20 | 25 |
| Psychosis of other demonstrable etiology | 52 | 75 | 75 | 20 | 29 | 28 |
| Puerperal psychosis | 24 | 20 | 26 | 9 | 8 | 10 |
| Other and unspecified psychoses | 17 | 30 | 40 | 7 | 12 | 15 |
| Psychoneuroses | ||||||
| Anxiety reaction | 209 | 187 | 209 | 82 | 72 | 79 |
| Hysterical reaction | 66 | 45 | 49 | 26 | 17 | 19 |
| Neurotic-depressive reaction | 635 | 558 | 596 | 250 | 215 | 225 |
| Other and unspecified psychoneurotic disorders | 82 | 115 | 123 | 32 | 44 | 46 |
| Disorders of Character, Behaviour, and Intelligence | ||||||
| Pathological and immature personality | 252 | 255 | 297 | 99 | 98 | 112 |
| Alcoholism | 289 | 277 | 331 | 114 | 107 | 125 |
| Mental deficiency | 364 | 346 | 363 | 143 | 133 | 137 |
| Other and unspecified character, behaviour, and intelligence disorders | 46 | 56 | 57 | 18 | 22 | 22 |
| Other Conditions | ||||||
| Epilepsy | 35 | 46 | 32 | 14 | 18 | 12 |
| Other defined conditions | 17 | 14 | 13 | 7 | 5 | 5 |
| Observation | 70 | 68 | 120 | 28 | 26 | 45 |
| All cases | 4,148 | 3,914 | 4,083 | 1,681 | 1,506 | 1,542 |
Etiological Factors—Information about the causes of mental disorders for the first admissions in 1965 is shown in the following table. It should be noted that several factors can be reported for one case. For example, a person might be admitted because of a combination of old age and excessive use of alcohol.
| Etiological Factors | Incidence in First Admissions |
|---|---|
| Organic syndrome | 884 |
| Subnormal intelligence | 520 |
| Other physical illness or impairment | 616 |
| Alcohol | 716 |
| Structure of personality | 3,016 |
| Critical period in life | 1,222 |
| Family relationship | 1,006 |
| Other factors | 545 |
READMISSIONS—A readmission is a person admitted to a New Zealand mental hospital who has previously been in a New Zealand mental hospital.
Diagnosis—In the following table the numbers and rates of readmissions are shown by diagnoses.
| Diagnosis | Numbers | Rates per Million of Mean Population | ||||
|---|---|---|---|---|---|---|
| 1963 | 1964 | 1965 | 1963 | 1964 | 1965 | |
| Psychoses | ||||||
| Schizophrenic disorders (dementia praecox) | 1,048 | 1,022 | 1,001 | 412 | 393 | 378 |
| Manic-depressive reaction | 683 | 705 | 769 | 268 | 271 | 290 |
| Involutional melancholia | 41 | 50 | 57 | 16 | 19 | 22 |
| Paranoia and paranoid states | 23 | 15 | 26 | 9 | 6 | 10 |
| Senile psychosis | 94 | 96 | 71 | 37 | 37 | 27 |
| Presenile psychosis | 13 | 9 | 8 | 5 | 3 | 3 |
| Psychosis with cerebral arteriosclerosis | 20 | 30 | 30 | 8 | 12 | 11 |
| Alcoholic psychosis | 30 | 54 | 64 | 12 | 21 | 24 |
| Psychosis of other demonstrable etiology | 37 | 36 | 39 | 14 | 14 | 15 |
| Puerperal psychosis | 9 | 7 | 18 | 4 | 3 | 7 |
| Other and unspecified psychoses | 7 | 14 | 16 | 3 | 5 | 6 |
| Psychoneuroses | ||||||
| Anxiety reaction | 98 | 100 | 65 | 39 | 38 | 25 |
| Hysterical reaction | 52 | 25 | 21 | 20 | 10 | 8 |
| Neurotic-depressive reaction | 386 | 476 | 447 | 152 | 183 | 169 |
| Other and unspecified psychoneurotic disorders | 55 | 82 | 74 | 22 | 32 | 28 |
| Disorders of Character, Behaviour, and Intelligence | ||||||
| Pathological and immature personality | 142 | 171 | 187 | 56 | 66 | 71 |
| Alcoholism | 259 | 365 | 511 | 102 | 140 | 193 |
| Mental deficiency | 181 | 176 | 186 | 71 | 68 | 70 |
| Other and unspecified character, behaviour, and intelligence disorders | 20 | 30 | 19 | 8 | 12 | 7 |
| Other Conditions | ||||||
| Epilepsy | 18 | 38 | 23 | 7 | 15 | 9 |
| Other defined conditions | 7 | 11 | 6 | 3 | 4 | 2 |
| Observation | 17 | 38 | 44 | 7 | 15 | 17 |
| All cases | 3,240 | 3,550 | 3,682 | 1,274 | 1,366 | 1,391 |
DISCHARGES—There are four principal ways of being discharged from mental hospital; (a) outright discharge, which means being formally discharged at the time of leaving hospital; (b) trial discharge; (c) leave, being authorised leave of more than three months' duration for any other purpose; (d) discharged “not committed”, which means being discharged from a mental hospital on the grounds that the patient's mental condition does not warrant his being detained in a mental hospital.
There were 6,906 discharges in 1965. Of these 4,625 were outright discharges, 1,264 were on trial discharge, 751 were on leave, and 266 were discharged “not committed”.
The principal diagnoses were: schizophrenic disorders, 1,525 cases; manic-depressive reaction, 1,237 cases; neurotic-depressive reaction, 1,028 cases; and all forms of alcoholism, 925 cases.
The following table shows the number of discharges for 1965 by diagnosis.
| Diagnosis | Outright Discharge | Trial Discharge | Leave | Not Committed | Total |
|---|---|---|---|---|---|
| Psychoses | |||||
| Schizophrenic disorders (dementia praecox) | 737 | 459 | 312 | 17 | 1,525 |
| Manic-depressive reaction | 829 | 298 | 103 | 7 | 1,237 |
| Involutional melancholia | 86 | 16 | 3 | – | 105 |
| Paranoia and paranoid states | 34 | 4 | 5 | 1 | 44 |
| Senile psychosis | 73 | 26 | 57 | – | 156 |
| Presenile psychosis | 7 | 4 | 3 | – | 14 |
| Psychosis with cerebral arteriosclerosis | 29 | 6 | 15 | 1 | 51 |
| Alcoholic psychosis | 82 | 14 | 19 | – | 115 |
| Psychosis of other demonstrable etiology | 35 | 30 | 20 | 1 | 86 |
| Puerperal psychosis | 25 | 11 | 4 | – | 40 |
| Other and unspecified psychoses | 21 | 7 | 7 | – | 35 |
| Psychoneuroses | |||||
| Anxiety reaction | 263 | 13 | 5 | 1 | 282 |
| Hysterical reaction | 56 | 10 | 3 | – | 69 |
| Phobic reaction | 4 | – | – | – | 4 |
| Obsessive-compulsion reaction | 17 | 2 | – | – | 19 |
| Neurotic-depressive reaction | 880 | 114 | 21 | 13 | 1,028 |
| Psychoneurosis with somatic symptoms affecting circulation | 2 | – | – | – | 2 |
| Psychoneurosis with somatic symptoms affecting digestive system | 7 | – | 1 | – | 8 |
| Psychoneurosis with somatic symptoms affecting other systems | 10 | 2 | 1 | – | 3 |
| Other and unspecified psychoneurotic disorders | 131 | 18 | 1 | 2 | 152 |
| Disorders of Character, Behaviour, and Intelligence | |||||
| Pathological personality without psychosis | 152 | 30 | 12 | 46 | 240 |
| Immature personality | 129 | 54 | 18 | 39 | 240 |
| Non-psychotic alcoholism | 725 | 48 | 24 | 13 | 810 |
| Drug addiction | 23 | 3 | 2 | 1 | 29 |
| Mental deficiency | 194 | 68 | 94 | 5 | 361 |
| Other and unspecified character, behaviour, and intelligence disorders | 19 | 7 | 5 | 6 | 37 |
| Other Conditions | |||||
| Epilepsy (without psychosis) | 37 | 11 | 11 | 2 | 61 |
| Other conditions | 7 | 7 | 1 | – | 15 |
| Observation without need for further medical care | 11 | 2 | 4 | 111 | 128 |
| Totals | 4,625 | 1,264 | 751 | 266 | 6,906 |
Duration of Stay—Over a third (38.4 percent) of those discharged left hospital within a month of admission. A further 36.7 percent left in the next two months, and a further 11.0 percent were discharged in the subsequent three months. The average stay for all discharges was 28 weeks.
DEATHS—In 1965 there were 859 deaths in menial hospitals. In addition 92 people died while on leave.
The principal diagnosis was senile psychosis, 403 cases. Next came schizophrenic disorders, 108 cases; and mental deficiency, 91 cases.
In 1965, 142 people died during the first month in hospital and a further 92 deaths occurred of people who had been in hospital one but under three months.
EXPENDITURE, ETC.—The total expenditure on public mental hospitals (not including the cost of new buildings and additions) and particulars of receipts during the last 11 financial years are shown in the next table. As from 1 April 1939 free maintenance and treatment of patients have been provided in all public mental hospitals in accordance with the provisions of the Social Security Act 1964.
| Year Ended 31 March | Total Expenditure | Receipts | Net Expenditure | Net Average Cost per Patient |
|---|---|---|---|---|
| * Cost of board and lodging now treated as a receipt instead of a deduction from salaries as in previous years. | ||||
| $(000) | $(000) | $(000) | $ | |
| 1956 | 5,612 | 136 | 5,476 | 568 |
| 1957 | 6,072 | 152 | 5,920 | 624 |
| 1958 | 6,734 | 194 | 6,540 | 690 |
| 1959 | 7,166 | 208 | 6,960 | 712 |
| 1960 | 7,780 | 224 | 7,556 | 786 |
| 1961 | 8,438 | 226 | 8,212 | 824 |
| 1962 | 9,724 | 206 | 9,518 | 912 |
| 1963 | 11,068 | 208 | 10,862 | 1,058 |
| 1964 | 11,904 | 212 | 11,692 | 1,144 |
| 1965 | 13,576 | 686* | 12,890 | 1,228 |
| 1966 | 14,584 | 692* | 13,892 | 1,324 |
As already stated, the expenditure included in the foregoing table does not include amounts spent on new buildings, additions, etc., the cost of which is met by the Ministry of Works. Expenditure for the last five financial years has amounted to $1,473,000 in 1961–62, $1,314,000 in 1962–63, $1,463,000 in 1963–64, $1,625,000 in 1964–65, and $1,810,000 in 1965–66.
Table of Contents
DEVELOPMENT—Social security is a comprehensive plan of State assistance by a system of monetary benefits and free or subsidised medical and hospital provisions for the safeguarding of health. The principal objects of the legislation which came into operation on 1 April 1939 were (a) to substitute a system of extended monetary benefits on a contributory basis for the system of non-contributory civil pensions, e.g., old age, widows', and other pensions; (b) the inauguration of a system of medical and hospital benefits and of other related benefits. The governing legislation is now the Social Security Act 1964.
Universal family benefits were introduced on 1 April 1946, since which date each mother has received a benefit in respect of each of her dependent children irrespective of the family income or property.
There is reciprocity of social security benefits with Australia, and with the United Kingdom and Northern Ireland. Under the Social Security (Reciprocity with Australia) Act 1948 the classes of benefits cover the following: age pensions and age benefits, invalid pensions (including wives' and children's allowances) and invalid's benefits, widows' pensions and widows' benefits, child endowment and family benefits, unemployment benefits, and sickness benefits. The Social Security (Reciprocity with the United Kingdom) Act 1956 provides for reciprocity between the United Kingdom and Northern Ireland and New Zealand to cover age, superannuation, widows', orphans', invalids', sickness, and unemployment benefits. Family benefits have been payable on a reciprocal basis since 1948.
ADMINISTRATION—The Social Security Department, which is under the control of a Commission, administers, under the direction of the Minister of Social Security, Part I of the Act dealing with monetary benefits, while matters concerning medical, hospital, and other related benefits, are administered by the Department of Health under the direction of the Minister of Health.
The War Pensions Act 1954 is also administered by the Social Security Department, one of whose officers is designated Secretary for War Pensions.
Since 1960, the War Pensions Branch of the Social Security Department has handled ex-servicemen's rehabilitation.
FINANCIAL PROVISIONS—Finance to enable the provisions of the Act to be carried out was provided for by the establishment within the Public Account of the Social Security Fund. (On 1 April 1964 the Social Security Fund was absorbed into the Consolidated Revenue Account in connection with a rearrangement of Government accounts.) The principal revenue of the fund was derived from a charge (collected by the Inland Revenue Department) on salaries, wages, and other income, including the income of companies, but the Act also made provision for the payment to the fund of such other moneys as might be appropriated by Parliament from time to time, and a substantial amount was transferred from the Consolidated Fund each year except 1957–58. Social Security income tax is 7 ½ cents in the dollar. This tax has been written into the deduction tables under the PAYE system. It forms part of the pay-period tax. There is credited to the Consolidated Revenue Account as social security income tax an amount computed at the rate of 7 ½ cents for every $1 of national private income for the immediately preceding financial year on which social security income tax is payable. (Since 1962 the first $208 of annual income has been exempt from social security income tax.)
From 1 April 1964 the payment of medical benefits has been made by the Department of Health from money appropriated by Parliament for this purpose. In addition, benefits are no longer paid to public hospitals for treatment of patients.
Payments—Particulars of payments under the Social Security Act during the last five financial years are contained in the following table.
| Item | 1961–62 | 1962–63 | 1963–64 | 1964–65 | 1965–66 |
|---|---|---|---|---|---|
| * Previously included benefits to public hospitals, which are no longer paid; relevant expenditure is now included in general expenditure of public hospitals from 1 April 1964. | |||||
| Monetary benefits— | |||||
| $ (thousand) | |||||
| Superannuation | 46,298 | 50,235 | 54,390 | 59,297 | 62,579 |
| Age | 49,717 | 49,016 | 49,361 | 51,017 | 51,457 |
| Widows' | 8,705 | 9,092 | 9,559 | 10,215 | 10,480 |
| Orphans' | 93 | 92 | 103 | 110 | 116 |
| Family | 66,881 | 64,603 | 68,480 | 65,925 | 70,163 |
| Invalids' | 4,382 | 4,536 | 4,588 | 4,830 | 4,786 |
| Miners' | 201 | 175 | 166 | 153 | 137 |
| Unemployment | 160 | 327 | 322 | 197 | 141 |
| Sickness | 3,410 | 3,125 | 4,509 | 3,914 | 4,076 |
| Emergency | 1,685 | 1,369 | 2,015 | 1,785 | 1,753 |
| Supplementary assistance | 647 | 664 | 1,177 | 1,368 | 1,800 |
| Advances for repairs to homes | 50 | 51 | 48 | 59 | 64 |
| Employment subsidy for disabled civilians | – | 3 | 5 | 5 | 3 |
| Capitalisation of family benefit | 11,524 | 10,302 | 9,085 | 8,840 | 8,596 |
| Total, monetary benefits | 193,752 | 193,590 | 203,808 | 207,715 | 216,151 |
| Medical benefits— | |||||
| Medical | 8,760 | 8,608 | 8,629 | 8,764 | 8,790 |
| Hospital | 12,519 | 12,675 | 13,357 | 3,166* | 3,719* |
| Maternity | 3,510 | 3,717 | 3,607 | 1,556* | 1,519* |
| Pharmaceutical | 15,357 | 16,118 | 15,827 | 17,734 | 19,514 |
| Supplementary | 5,796 | 6,398 | 6,964 | 5,310 | 6,081 |
| Total, medical benefits | 45,942 | 47,516 | 48,384 | 36,530* | 39,622 |
During the year ended 31 March 1966, $141,475,096, or 65.4 percent of the total expenditure ($216,152,010) by the Social Security Department on monetary benefits including supplementary assistance, advances for repairs to homes, and employment subsidy for disabled civilians, was paid without a means test, the remaining amount being subject to a means test.
The administration expenses of the Social Security Department for the year ended 31 March 1966 were $3,959,920 as compared with $4,044,112 the previous year.
The following table gives details of expenditure on the various classes of medical benefits during the last five financial years.
| Item | 1961–62 | 1962–63 | 1963–64 | 1964–65 | 1965–66 |
|---|---|---|---|---|---|
* Previously included benefits to public hospitals, which are no longer paid; relevant expenditure is now included in general expenditure of public hospitals. † Mainly on account of hospital benefits. | |||||
| Maternity benefits— | |||||
| $ (thousand) | |||||
| Public hospital fees | 1,978 | 2,006 | 1,980 | * | * |
| Private hospital fees | 390 | 355 | 397 | 377 | 387 |
| Medical practitioners' fees | 949 | 1,168 | 1,164 | 1,131 | 1,093 |
| Milage fees | 42 | 41 | 39 | 37 | 34 |
| Obstetric nurses' fees | 7 | 6 | 5 | 4 | 5 |
| Private hospital loans | 143 | 142 | 22 | 6 | – |
| Totals | 3,510 | 3,717 | 3,607 | 1,556* | 1,519* |
| Medical benefits— | |||||
| Milage fees | 365 | 338 | 313 | 311 | 287 |
| General medical services | 8,169 | 8,032 | 8,078 | 8,183 | 8,194 |
| Special arrangements | 192 | 209 | 204 | 270 | 309 |
| Purchase of sites and erection of residences for medical officers | 32 | 28 | 35 | ||
| Totals | 8,760 | 8,608 | 8,629 | 8,764 | 8,790 |
| Hospital benefits— | |||||
| Public hospitals— | |||||
| Inpatients | 9,566 | 9,595 | 9,734 | * | * |
| Outpatients | 829 | 826 | 834 | * | * |
| Private hospitals | 1,885 | 1,878 | 2,411 | 2,605 | 3,324 |
| Approved institutions | 160 | 186 | 196 | 233 | 251 |
| Private hospital loans | 51 | 174 | 166 | 301 | 123 |
| Grants towards operating costs of Karitane hospitals | 28 | 16 | 16 | 27 | 21 |
| Totals | 12,519 | 12,675 | 13,357 | 3,166* | 3,719* |
| Pharmaceutical benefits— | |||||
| Chemists | 14,867 | 15,494 | 15,346 | 17,443 | 19,196 |
| Medical practitioners | 148 | 140 | 123 | 143 | 173 |
| Institutions | 341 | 341 | 359 | 27 | 1 |
| Private hospitals | 122 | 144 | |||
| Refund of Customs duty to wholesalers | – | 143 | – | – | – |
| Totals | 15,357 | 16,118 | 15,827 | 17,734 | 19,514 |
| Supplementary benefits— | |||||
| Radiological services | 1,046 | 1,083 | 1,114 | 571* | 600* |
| Laboratory services | 1,765 | 2,105 | 2,361 | 2,062* | 2,377* |
| Physiotherapy services | 128 | 139 | 197 | 211 | 215 |
| Specialist services (neurosurgery) | 12 | 8 | 9 | 9 | 7 |
| District nursing services | 469 | 494 | 593 | * | * |
| Dental services | 2,091 | 2,284 | 2,363 | 2,393 | 2,810 |
| Domestic assistance | 22 | 24 | 28 | 25 | 30 |
| Artificial-aids benefits | 218 | 240 | 275 | 3* | 3* |
| Other | 46 | 21 | 23 | 35 | 40 |
| Totals | 5,796 | 6,398 | 6,964 | 5,310* | 6,081* |
| Grand totals | 45,942 | 47,516 | 48,384 | 36,530 | 39,622 |
| Recoveries† | 7 | 17 | 11 | 21 | 6 |
| Net totals | 45,935 | 47,499 | 48,373 | 36,508* | 39,616* |
The following table summarises social security expenditure according to type of benefit and per head of mean population, and also relates expenditure to national income.
| Year Ended 31 March | Net National Income at Factor Cost | Expenditure* | ||||
|---|---|---|---|---|---|---|
| Medical Benefits | Family Benefits | Other Benefits | Total | Per Head of Mean Population | ||
* Excluding capitalised family benefits. † Benefits no longer paid to public hospitals. | ||||||
| Amount $(million) | $ | |||||
| 1957 | 1,773.4 | 33.4 | 39.0 | 76.2 | 148.6 | 67.70 |
| 1958 | 1,870.2 | 34.2 | 40.4 | 80.4 | 155.0 | 69.00 |
| 1959 | 1,923.4 | 37.4 | 52.0 | 86.8 | 176.2 | 76.60 |
| 1960 | 2,075.0 | 39.8 | 63.6 | 104.0 | 207.4 | 88.40 |
| 1961 | 2,242.4 | 42.4 | 61.8 | 113.2 | 217.4 | 91.00 |
| 1962 | 2,314.2 | 45.9 | 66.9 | 115.4 | 228.2 | 93.50 |
| 1963 | 2,505.8 | 47.5 | 64.6 | 118.6 | 230.7 | 92.40 |
| 1964 | 2,744.8x | 48.4 | 68.5 | 126.2 | 243.1 | 95.20 |
| 1965 | 2,998.6x | 36.5† | 65.9 | 132.8 | 235.3† | 90.50† |
| 1966 | 3,242.6 | 39.6† | 70.2 | 137.3 | 247.0† | 93.30† |
| Percentage of Expenditure to National Income | ||||||
| 1957 | ... | 1.9 | 2.2 | 4.3 | 8.4 | ... |
| 1958 | ... | 1.8 | 2.2 | 4.3 | 8.3 | ... |
| 1959 | ... | 1.9 | 2.7 | 4.5 | 9.2 | ... |
| 1960 | ... | 1.9 | 3.0 | 5.0 | 10.0 | ... |
| 1961 | ... | 1.9 | 2.8 | 5.0 | 9.7 | ... |
| 1962 | ... | 2.0 | 2.9 | 5.0 | 9.9 | ... |
| 1963 | ... | 1.9 | 2.6 | 4.7 | 9.2 | ... |
| 1964 | ... | 1.8 | 2.5 | 4.6 | 8.8 | ... |
| 1965 | ... | 1.2 | 2.2 | 4.4 | 7.8 | ... |
| 1966 | ... | 1.2 | 2.2 | 4.2 | 7.7 | ... |
Benefits and Pensions in Force—The total number of persons in respect of whom social security cash benefits (including dependent wives and children) were payable at 31 March 1966 was 1,205,092, or 4,464 per 10,000 of population. For the previous year the corresponding figures were 1,176,152 and 4,455 respectively. Particulars of the various social security benefits in force at 31 March for the three latest years and the annual value at 31 March 1966 are as follows.
| Class of Benefit or Pension | Number in Force at 31 March | Annual Value at 31 March 1966 | ||
|---|---|---|---|---|
| 1964 | 1965 | 1966 | ||
| Social security benefits— | $(000) | |||
| Monetary— | ||||
| Superannuation | 116,059 | 119,650 | 125,089 | 64,069 |
| Age | 95,836 | 95,009 | 94,249 | 50,661 |
| Widows' | 14,242 | 14,529 | 14,712 | 10,691 |
| Orphans' | 302 | 316 | 316 | 110 |
| Family | 373,775 | 376,824 | 376,593 | 67,943 |
| Invalids' | 8,079 | 7,951 | 8,045 | 4,918 |
| Miners' | 217 | 184 | 169 | 128 |
| Unemployment | 247 | 208 | 133 | ... |
| Sickness | 4,583 | 4,681 | 5,252 | ... |
| Emergency | 2,925 | 2,950 | 3,203 | ... |
| Supplementary assistance | 7,660 | 8,763 | 9,698 | 1,739 |
| Totals | 623,925 | 631,065 | 637,459 | |
MISCELLANEOUS PENSIONS, ETC.—In addition to the various classes of benefits enumerated in the foregoing part of this section there were 819 pensions at 31 March 1966 classed as “sundry pensions and annuities”. This class covers ex-officers of the Legislative Department, ex-members of the defence forces, certain ex-members of the Legislature, and others, by way of compassionate allowance, etc.
MONETARY BENEFITS—A summarised account of the changes in monetary benefits from the inception of the social security scheme to 1957 was given on pages 205–206 of the 1958 issue of the Yearbook. Since 1939 the original provisions have been considerably amended and enlarged to correct anomalies and to cover more comprehensively the needs of the people. In addition the rates of benefits have been increased from time to time, mainly as a result of the increased cost of living.
The rates payable in respect of age, invalids', widows' (and mothers' allowances), and miners' benefits were increased by $26 a year, and sickness and unemployment benefits by 50c a week from 30 March 1960. Legislation also eliminated property from the means test, formerly applicable to age, invalids', orphans', and unemployment benefits, and increased the amount of income allowable before reduction of age, widows', and invalids' benefits from $208 to $312 a year, and the allowable income for sickness and unemployment benefits from $4 to $6 a week from 12 October 1960. From the same date provision was made for an allowable income of $104 a year before reduction in the rate of orphans' benefit which was formerly reducible by $2 for every complete $2 of an orphan's income.
Also from 12 October 1960 the amendment increased the rate payable in respect of a superannuation benefit by $26 a year and gave the Social Security Commission discretionary power to grant on application an additional $52 a year to single, widowed, separated, or divorced superannuation beneficiaries.
The amount of income allowable before reduction of a widow's benefit where the widow is supporting a dependent child or children was increased from $312 to $520 a year from 13 September 1961. From the same date provision was made for up to $104 a year received by an age or invalid's beneficiary as sick benefit from a friendly society or a like benefit from any other source, to be disregarded. This exemption was extended to widow's benefit from 1 April 1965.
The rates of superannuation, age, widows' (and mothers' allowances), orphans', invalids', and miners' benefits were increased by $13 a year and sickness and unemployment benefits by 25c a week from 18 July 1962. Similar increases of 25c a week or $13 a year were made from 17 July 1963.
Increases in the rates of benefits were made from 9 September 1964. The increases were 60c a week or $31.20 a year. The allowable income for widows' beneficiaries with a dependent child was also increased from $520 to $624 a year. An increase of 90c a week or $46.80 a year applied from 18 May 1966. A further increase of 25c a week or $13 a year applied from 25 January 1967.
For the purpose of determining eligibility for benefit on grounds of residence, persons employed outside New Zealand will be deemed to be resident in New Zealand for the purposes of Part I of the principal Act, where liable for the payment of social security income tax on their earnings. In each case the wife and children are also included.
The receipt of a war disablement pension or a basic war widow's pension does not render a person ineligible to receive a social security benefit.
The Commission may, in its discretion, refuse to grant any benefit or terminate any benefit or reduce any benefit on moral grounds, or where the applicant or in the case of family benefit the father or mother of the child, is not ordinarily resident in New Zealand, or has defaulted in payment of social security income tax or has deprived himself of income or property to qualify for a higher rate of benefit than would otherwise have been the case.
SUMMARY OF RATES OF SOCIAL SECURITY BENEFITS—The list below gives a summary of the annual and weekly rates for monetary benefits as from 25 January 1967.
| Benefit | Annual Rate | Weekly Rate |
|---|---|---|
| Superannuation— | $ | $ |
| Unmarried person | 611 | 11.75 |
| Married person | 559 | 10.75 |
| Benefit | Annual Rate | Weekly Rate |
|---|---|---|
| * According to circumstances, but in general, standard rates will be increased by $2 a week for beneficiary, $1 a week for his wife, and 50c a week for each dependent child. | ||
| Age— | $ | $ |
| Unmarried person | 611 | 11.75 |
| Married couple if both eligible (each) | 559 | 10.75 |
| Married woman whose husband is not eligible | 559 | 10.75 |
| Married man whose wife is not eligible | 1,118 | 21.50 |
| Widows'— | ||
| Widow | 611 | 11.75 |
| Additional mother's allowance where widow has— | ||
| One dependent child | 429 | 8.25 |
| Two dependent children | 481 | 9.25 |
| Each additional dependent child | 52 | 1.00 |
| Orphans' (each child) | 312 | 6.00 |
| Family (each child) | 78 | 1.50 |
| Invalids'— | ||
| Unmarried person, 20 years or over | 611 | 11.75 |
| Unmarried person under 20 years | 533 | 10.25 |
| Married man with wife included | 1,118 | 21.50 |
| Married woman | 559 | 10.75 |
| Miners'— | ||
| Unmarried person | 611 | 11.75 |
| Married man with wife included | 1,118 | 21.50 |
| Miner's widow | 546 | 10.50 |
| Sickness or Unemployment— | ||
| Unmarried person under 20 years | ... | 9.25 |
| Unmarried person 20 years and over | ... | 11.75 |
| Married man with wife included | ... | 21.50 |
| Married woman 20 years and over | ... | 10.75 |
| Supplementary Assistance | According to circumstances | |
| Emergency | According to circumstances | |
| Emergency—Sufferers from tuberculosis* | .. | .. |
Superannuation Benefits—Every person over the age of 65 years who satisfies the prescribed residential qualifications is entitled to a superannuation benefit without conditions as to income or property. The superannuation benefit is, however, regarded as assessable income for ordinary income-tax purposes but is exempt from the social security income tax. The residential qualification is, in general, a period of residence in New Zealand of 20 years immediately preceding application for benefit, but in the case of a person who was ordinarily resident in New Zealand on 15 March 1938 the qualifying period is 10 years only. Allowances are made for occasional absences.
For the 10 years' requirement, residence is not deemed to be interrupted by absence—
If the total period of absence from New Zealand does not exceed one year; or
If the total period of absence from New Zealand exceeds one year but does not exceed that period by more than six months for every year of residence in New Zealand in excess of a period of 10 years, and the applicant is ordinarily resident in New Zealand both at the date of application and on the date from which residence is claimed.
A similar proviso for the 20 years' requirement applies—
If the total period of absence from New Zealand does not exceed two years; or
If the total period of absence from New Zealand exceeds two years but does not exceed that period by more than six months for every year of residence in New Zealand in excess of a period of 20 years, and the applicant is ordinarily resident in New Zealand both at the date of application and on the date from which residence is claimed.
Provision is made to disregard absence of a totally blind person for the purpose of vocational training or treatment of the eyes; absence for special medical or surgical treatment or vocational training if there were good and sufficient reasons for leaving New Zealand to obtain that special treatment or training; absence of a seaman serving on board any ship registered or owned in New Zealand and engaged in trading to and from New Zealand; absence with the armed forces of any Commonwealth country or any attachment to such forces in connection with any war. In each case, however, the applicant for benefit must have remained ordinarily resident in New Zealand during the absence. Absence on missionary work may also be disregarded subject to certain conditions.
A superannuation benefit is not payable in addition to any other cash benefit except a family benefit. For example, a superannuation benefit and an invalid's benefit cannot be paid to the one person. Similarly, a superannuation benefit and an age benefit are not payable to the one person concurrently.
At the date of commencement on 1 April 1940, and for the remainder of the year, the rate of benefit was $20 a year, thereafter being increased by $5 a year. As from 1 October 1951, however, the amount payable for the balance of the year 1951–52 was raised from $75 to $150 a year, this amount increasing by $10 a year on 1 April of each succeeding year to $220 a year in 1958. From 1 April 1959 the rate increased to $312 a year, from 30 March 1960 to $416 a year, from 12 October 1960 to $442 a year for a married person and to $494 a year for an unmarried person. Subsequent increases have kept the benefit in line with age benefit rates.
Age Benefits—Every person who has attained the age of 60 years is entitled to receive an age benefit, subject to satisfying certain residential qualifications. The residential qualifications are the same as those set out under the preceding heading in regard to superannuation benefits.
The basic rate of the benefit is $559 a year, subject to certain deductions on account of income. Particulars of additions to and deductions from the basic rate are as follows:
Unmarried applicants: The basic rate is increased to $611, although reduced by $2 for every complete $2 of income in excess of $416 a year.
Married applicants: Where husband and wife are both entitled to the benefit the basic rate is reduced by $1 for every complete $2 of their combined incomes in excess of $416 a year. In cases where only one of them is entitled to the benefit the reduction is at the rate of $2 for every complete $2 of their total income (excluding a family benefit) in excess of $962 a year. A further provision allows of an extra payment, not exceeding $559 a year, to a male recipient when his wife is ineligible for any benefit under the Act. This is payable only up to a limit of the total income of the couple, plus benefit, of $1,534 a year.
For the above purposes, income is deemed not to include amounts received by way of war disablement pension or basic war widow's pension.
From 1 August 1955 age benefit has been payable, in the discretion of the Commission, to unmarried women between 55 and 60 years of age who are unable to engage in regular employment.
Age beneficiaries are entitled to surrender their benefits while their earnings are excessive and to apply for reinstatement immediately the employment ceases. The earnings received during the period that both husband and wife were not in receipt of age benefits are not taken into account.
Any deduction from the maximum rate of benefit because of excess income may be diminished by $13 for each year that an applicant, on having attained the age of 65 years, has deferred applying for a benefit between the ages of 60 and 65 years, provided that he was residentially qualified to receive the benefit during that period.
During 1965–66, 491 existing beneficiaries and new applicants received additional benefit for the first time on account of the deferment concession. The periods of deferment were: one year, 53; two years, 74; three years, 76; four years, 70; and five years, 218.
In computing the allowable income of any female beneficiary or the wife of any beneficiary no account is taken of her personal earnings from domestic or nursing services in private homes or in hospitals or charitable institutions up to $156 a year.
A special allowance of $52 a year may be paid to any person in receipt of an age benefit who served as a member of a New Zealand contingent in connection with the South African War or in any of Her Majesty's forces in that war if he had been born in New Zealand or was domiciled therein at the commencement of the war.
The Commission may also, in its discretion, increase by an amount not exceeding $52 a year the rate of any benefit under Part I of the Act payable to any beneficiary who was one of the parents of a deceased member of any of Her Majesty's forces established in New Zealand whose death was attributable to service with the forces. Similar powers exist in respect of a parent of a deceased member of the New Zealand mercantile marine whose death was attributable to the Second World War. The provision also covers from 1 April 1949 the case of a deceased member of any force or of the mercantile marine of any part of the British Commonwealth other than New Zealand who was domiciled in New Zealand at the commencement of the Second World War and whose death was directly attributable to that war. At 31 March 1966 there were 1,601 of these allowances in force, this representing a decrease of 111 from the figure of 1,712 for 1965.
Where an applicant for an age benefit is totally blind, the rate of the benefit, together with any benefits and allowances payable to or in respect of the wife or husband of the applicant, is not to be less than the total of benefits and allowances that would have been paid if the applicant had been eligible for an invalid's benefit.
The number of age benefits in force at 31 March 1966 was 94,249, a decrease of 760 as compared with the figure at the end of March 1965. The 1966 total was inclusive of 5,766 husbands receiving benefits on account of dependent wives who were not eligible for benefits in their own right, and of 32 males receiving the additional allowance of $52 a year paid to veterans of the South African War.
The following table shows the estimated age distribution of (a) persons who were granted age benefits during the calendar year 1965 (including transfers from widows' and invalids' benefits), and (b) total age beneficiaries at 31 December 1965.
| Age, in Years | Persons Granted Age Benefits During 1965 | Total
Age Beneficiaries at 31 December 1965 | ||||
|---|---|---|---|---|---|---|
| Males | Females | Total | Males | Females | Total | |
| 60 | 1,460 | 2,730 | 4,190 | 947 | 1,583 | 2,530 |
| 61 | 520 | 670 | 1,190 | 1,508 | 3,005 | 4,513 |
| 62 | 390 | 530 | 920 | 1,831 | 3,672 | 5,503 |
| 63 | 380 | 370 | 750 | 2,197 | 3,339 | 5,536 |
| 64 | 210 | 220 | 430 | 2,165 | 3,425 | 5,590 |
| Totals, 60–64 | 2,960 | 4,520 | 7,480 | 8,648 | 15,024 | 23,672 |
| 65–69 | 610 | 280 | 890 | 7,571 | 12,073 | 19,644 |
| 70–74 | 140 | 90 | 230 | 4,437 | 10,479 | 14,916 |
| 75 and over | 130 | 60 | 190 | 11,610 | 24,382 | 35,992 |
| Totals | 3,840 | 4,950 | 8,790 | 32,266 | 61,958 | 94,224 |
Widows' Benefits—Every widow who is the mother of one or more dependent children under 16 years of age is entitled to a benefit in respect of widowhood. In addition, any widow not being the mother of a dependent child under 16 years of age who satisfies the following conditions is also entitled to the benefit, subject to residential qualifications.
A widow who has had one or more children, provided that the duration of her marriage was not less than 15 years or, in the alternative, that the aggregate of the period of the duration of her marriage and any subsequent period during which she had the care of at least one of her children under 16 years of age was not less than 15 years:
A widow who, on the expiration of not less than five years after the date of her marriage, became a widow after she attained the age of 50 years:
A widow of not less than 50 years of age who became a widow after she had attained the age of 40 years, provided that the duration of her marriage was not less than 10 years and that not less than 15 years have expired since the date of her marriage.
It will be noted that no widow under 50 years of age who has not had one or more children can qualify for the benefit. The term “children” does not include illegitimate children, but may include (in the discretion of the of the Commission) any child who is being maintained by the applicant and was at any time maintained by the husband of the applicant.
Provision is also made for other classes of women (not being widows) to receive benefits as if they were widows. Particulars are as follows:
Any married woman who satisfies the Commission that she has been deserted by her husband and has taken proceedings against him for a maintenance order under the Destitute Persons Act 1910 may, in the Commission's discretion, be granted a widow's benefit as though she were a widow, provided that she would have been able to qualify for widow's benefit under the above-mentioned conditions if her husband had died on the date he deserted her. Any moneys paid by a husband, whether by way of a maintenance order or otherwise, are required to be paid to the Department and any balance over and above the amount of the benefit is paid to the beneficiary. Benefits for deserted wives may be continued after divorce, in the discretion of the Commission.
Up to 31 March 1965 similar coverage of widow's benefit was extended to any married woman in respect of whose husband a reception order was in force under the Mental Health Act 1911 (whether or not he was detained in an institution under that Act) or whose husband was for the time being an inmate of an institution under that Act, whether as a voluntary inpatient or otherwise. From 1 April 1965 the nomenclature of benefit granted to the wife of a mental patient was changed from widow's benefit to “special benefit”. Special benefit is granted only where the applicant's husband has been an inmate continuously for a period of at least six months immediately preceding the date of application for benefit. Assistance during the first six months of the husband's hospitalisation is available (where eligible) by way of sickness benefit.
The rate of benefit payable to a widow is $611 a year plus a supplementary benefit (mother's allowance) of $429 a year in cases where there is one dependent child and $481 a year where there are two dependent children under 16 years of age. For each additional dependent child under 16 years the mother's allowance is increased by $52 a year.
Any income received, exclusive of war disablement or basic war widow's pension, is taken into account in computing the benefit payable. Where such income exceeds $416 the annual rate of benefit is reduced by $2 for every complete $2 of such excess, but in the case of a widow supporting a dependent child or children the allowable income without reduction is $624 a year. The maximum of income plus benefit in the case of a widow without dependent children is $1,027 a year and for a widow with one dependent child is $1,664 a year. This maximum is increased by $52 a year for each additional dependent child. A widow with dependent children will, of course, receive in addition the family benefit of $1.50 a week for each child.
The provision relating to the allowable income of $156 a year gained from domestic or nursing services in private homes or in hospitals and charitable institutions without affecting the amount of the benefit payable to women age-beneficiaries also applies to widows' benefits. Widows' benefits cease on remarriage.
The following table affords an analysis of widows' and “special” benefits in force at 31 March 1966.
| Status | With One Dependent Child | With Two or More Dependent Children | Without Dependent Children | Total |
|---|---|---|---|---|
| Widows | 2,447 | 2,752 | 8,122 | 13,321 |
| Deserted wives | 266 | 611 | 393 | 1,270 |
| Totals | 2,713 | 3,363 | 8,515 | 14,591 |
| “Special” benefits | 22 | 47 | 52 | 121 |
| Totals | 2,735 | 3,410 | 8,567 | 14,712 |
Orphans' Benefits—A benefit in respect of complete orphanhood is payable in the case of a child under 16 years of age who was born in New Zealand or whose last surviving parent was ordinarily resident in New Zealand for a period of not less than three years preceding the date of his or her death. A stepchild or an adopted child comes within the definition of the term, and payment may be made to any person for the time being having the care and control of the child. No payment is made on account of any orphan maintained in a State institution, but payment may be made to the governing bodies of homes and orphanages of religious or other organisations.
The maximum rate of an orphan's benefit is $312 a year reduced by $2 for each complete $2 of income received by or for the benefit of the orphan in excess of $104 a year. In any case where the amount of orphan's benefit falls below $78 a year application may be made for a family benefit $1.50 a week in lieu of orphan's benefit. For the purpose of assisting in the further education of any child, the Commission may grant or continue the benefit until the end of the year in which the child reaches the age of 18 years.
The number of benefits in force at 31 March 1966 was 316 (in respect of 397 children).
Family Benefits—As from 1 April 1946 the father or mother of any child or children under 16 years of age may apply for a family benefit, irrespective of the income or property of the parents or children. Prior to 1 April 1946 family benefits were payable subject to a means test.
The rate of the benefit is $1.50 a week for each child, and in every case is paid to the mother of the children, unless in special circumstances the Commission considers that it should be paid to the father or to some other person for the benefit of the children.
If a beneficiary in receipt of an age or other monetary benefit is the parent of dependent children, payment in respect of the children is made by way of a separate family benefit.
The term “children” includes stepchildren, adopted and illegitimate children, but does not include—
Any child who has attained the age of 16 years unless such child is continuing its education as a full-time day pupil at a school or college, in which case the Commission may grant or continue the benefit until the end of the year in which it reaches the age of 18 years.
Any child who is not in fact maintained as a member of the family of the applicant.
Any child in respect of whom any other benefit or pension (other than a war pension or allowance in respect of his own disablement) is payable out of public moneys.
The Commission may regard as a member of the applicant's family any child who, although not a child of the applicant, is being maintained as a member of the family. A benefit may also be continued beyond the age of 16 years in respect of any child who is totally incapacitated from earning a living by reason of some physical or mental defect but not beyond the end of the year in which the child reaches the age of 18 years.
In order to qualify for a family benefit at least one of the following conditions must be satisfied, namely—
The child was born in New Zealand.
The mother of the child was only temporarily absent from New Zealand at the time of its birth.
The Commission is satisfied that the child is likely to remain permanently in New Zealand.
The child has resided continuously in New Zealand for not less than 12 months.
A benefit is not payable in respect of any child committed to the care of the Child Welfare Division of the Department of Education nor in respect of any child residing in an institution under the care of the Division of Mental Health of the Department of Health. Family benefits are payable to children of a member of any of Her Majesty's naval, military, or air forces.
A family benefit or portion of a family benefit may be paid in a lump sum in advance for a period not exceeding 52 weeks in respect of the first child of a marriage or a child who has commenced his first year of post-primary education.
Under the provisions of the Family Benefits (Home Ownership) Act 1964, family benefits may be capitalised and paid in advance to assist parents with the erection or purchase of new home properties or purchase of houses from the Crown, additions or alterations to existing homes, or the repayment of mortgages and other obligations on family homes. In outline, the measure provides for the capitalisation of the family benefit in respect of one or more children from the age of one year up to the age of 16 years, provided that the total of the advance or advances in the case of any one family is not less than $400 or more than $2,000.
Details of family benefit capitalisation are shown in the following table.
| Year Ended 31 March | Applications for Capitalisation Approved | Number of Benefits Concerned | Capitalised Value of Benefits |
|---|---|---|---|
| $(000) | |||
| 1961 | 11,442 | 21,170 | 14,470 |
| 1962 | 9,739 | 16,988 | 11,919 |
| 1963 | 8,884 | 14,931 | 10,503 |
| 1964 | 8,137 | 13,604 | 9,756 |
| 1965 | 8,288 | 14,074 | 10,162 |
| 1966 | 7,485 | 12,986 | 9,250 |
A family benefit may be paid in cash, or to the credit of the Post Office Savings Bank account of the mother. The number of family benefits being paid to Post Office Savings Bank accounts at 31 March 1966 was 138,261 and the amount lodged during the year was $26,283,150. The total number of benefits in force at 31 March 1966 was 376,593 covering 944,461 children, compared with corresponding figures of 376,824 and 921,131 at 31 March 1965. Included in the total were 22 incapacitated children over the age of 16 years; and at the end of the 1965 school year there were 44,221 children over 16 at school in respect of whom benefits were being paid.
The following table gives the number of family benefits in force at 31 March 1966 classified according to the number of children for whom the benefit is paid.
| Number of Children in Each Case | Number of Benefits at 31 March 1966 |
|---|---|
| 1 | 107,602 |
| 2 | 113,644 |
| 3 | 78,363 |
| 4 | 42,262 |
| 5 | 18,181 |
| 6 | 8,388 |
| 7 | 4,208 |
| 8 | 2,058 |
| 9 | 1,035 |
| 10 or over | 852 |
| Total | 376,593 |
The average number of children in respect of whom benefit was paid was 2.25 per family in 1950–51, 2.30 in 1952–53, 2.33 in 1954–55, 2.36 in 1956–57, 2.39 in 1958–59, 2.45 in 1960–61, and 2.51 in 1965–66.
Invalids' Benefits—Subject to certain residential and other qualifications, every person of the age of 16 years and upwards who is not qualified to receive an age benefit is entitled to an invalid's benefit if he—
Is totally blind; or
Is permanently incapacitated for work as the result of an accident or by reason of illness or of any congenital defect.
The other qualifications referred to are as follows:
That he has fulfilled certain residential qualifications, these in the main being the same as for superannuation benefits described earlier unless the disability arose in New Zealand.
That incapacity for work was not self-induced or in any way brought about with a view to qualifying for an invalid's benefit.
Provision is made for a medical examination, when necessary, to determine the extent of incapacity. In the event of an application being declined on medical grounds, the applicant has the right of appeal, within three months after the decision of the Commission has been communicated to him, to a board of three medical practitioners nominated by the Department. An invalid's benefit may be paid in respect of a period of absence from New Zealand not exceeding two years in the aggregate, if the Commission is satisfied that such absence was for the purpose of obtaining any special medical or surgical treatment, or in the case of blindness, for the purpose of undertaking vocational training or treatment of the eyes.
The prescribed rates for invalids' benefits, together with the amounts of allowable income, exclusive of war disablement or basic war widows' pensions, are as follows.
| Class of Person | Annual Rate of Benefit | Annual Income Allowed Without Reduction of Benefit |
|---|---|---|
| $ | $ | |
| Unmarried person under 20 years | 533 | 416 |
| Married man | 559 | 416 |
| Wife | 559 | |
| Married woman | 559 | 962 |
| All other persons | 611 | 416 |
As in the case of other benefits, dependent children are provided for by way of the family benefit at $1.50 a week each.
In each case the amount of the benefit is reduced by $2 for every complete $2 of income, exclusive of war disablement or basic war-widow's pension, in excess of the amounts stated as allowable. In computing the income of any blind person no account is taken of his personal earnings. In addition, the benefit of a totally blind person may be increased by up to 25 percent of his personal earnings provided his total personal income from all sources including the benefit does not exceed $1,339 for an unmarried person and $1,287 for a married person.
Any person in receipt of an invalid's benefit who, on the attainment of age 60, becomes entitled to receive an age benefit is required to relinquish his invalid's benefit and is granted an age benefit in lieu thereof, but the aggregate amount payable for a blind beneficiary and his wife (if any) is not altered by this transfer.
Of 706 new benefits granted in 1965 the marital status was single 342 (185 males, 157 females), married 243 (237 males, 6 females), widowed 41 (29 males, 12 females), and apart, separated, divorced 80 (38 males, 42 females). By far the greatest number were aged 50 years or over, 377, the numbers for other age groups being as follows: under 20 years, 134; 20–39 years, 89; and 40–49 years, 106.
Miners' Benefits—Subject to the qualifications set out hereunder, a miner's benefit is payable to any person who, while engaged as a miner in New Zealand, contracted miner's phthisis and is thereby permanently and seriously incapacitated for work, or to any person who contracted, while engaged as a miner in New Zealand, any other occupational or heart disease and is thereby permanently and totally incapacitated for work, The term “miner's phthisis” means pneumoconiosis or tuberculosis of the lungs. The necessary qualifications are—
Employment as a miner in New Zealand for not less than a total period of two and a half years:
Continuous residence in New Zealand for not less than five years immediately preceding the date of his application for a benefit. Continuity of residence is not deemed to have been interrupted by occasional absences aggregating not more than six months:
That compensation under the Workers' Compensation Act in respect of the same disability is not being received.
The rates of miner's benefits are $559 a year (or $611 if unmarried), increased by $559 a year for a wife. Dependent children under 16 years are provided for by way of family benefit at the rate of $1.50 a week each.
There is no reduction in the benefit on account of the income or property of the applicant and/or his wife.
Provision is made for medical examination where necessary to determine whether the applicant is permanently incapacitated for work, or the extent of his incapacity.
An applicant whose claim has been declined on medical grounds has a right of appeal to a board consisting of three registered medical practitioners appointed by the Department.
A special provision is made for the payment of a reasonable contribution towards the funeral expenses of any person who dies while in receipt of a miner's benefit. The amount to be paid is at the discretion of the Commission.
If a person in receipt of a miner's benefit dies leaving a widow, such widow is entitled to a benefit of $546 a year, during widowhood. This benefit is payable regardless of the circumstances of the widow, her income or property not being considered in the granting of a benefit.
Payment of benefits is not affected by a period or periods of absence from New Zealand not exceeding two years in the aggregate.
Unemployment Benefits—Subject to the conditions set out below, every person over the age of 16 years who is not qualified to receive an age benefit is entitled to a benefit in respect of unemployment. An applicant is required to satisfy the Commission in respect of the following:
That he is unemployed:
That he is capable of undertaking and is willing to undertake suitable work:
That he has taken reasonable steps to obtain suitable employment:
That he has resided continuously in New Zealand for not less than 12 months at any time.
An unemployment benefit is not payable in respect of the first seven days of any period of unemployment, except in special circumstances. In addition, the Commission may postpone, for a period not exceeding six weeks, the commencement of the benefit, or it may terminate the benefit in any of the following circumstances:
If the applicant has voluntarily become unemployed without good and sufficient reason:
If the applicant has lost his employment by reason of any misconduct as a worker:
If the applicant or beneficiary has refused or failed, without a good and sufficient reason, to accept any offer of suitable employment:
Unemployment benefits are payable usually in accordance with the following scale:
| Weekly Benefit | |
|---|---|
| $ | |
| Person under 20 years without dependants | 9.25 |
| Married man with wife included | 21.50 |
| Others | 11.75 |
Dependent children are provided for by way of family benefit at the rate of $1.50 per week each.
The benefit is payable so long as the beneficiary is unemployed or until he becomes eligible to receive another class of benefit, other than a family benefit—e.g., an age benefit.
A married woman is entitled to receive the benefit of up to $10.75 a week only if her husband is unable to maintain her. If a beneficiary is not receiving a benefit in respect of a wife, an allowance may be paid in respect of any person who has the care of his home.
The foregoing rates of benefits may be reduced, having regard to the income received by the applicant or his wife.
The numbers of applications for unemployment benefits dealt with during the years ended 31 March 1965 and 1966 were 2,660 and 1,762 respectively, 1,855 persons being granted a benefit in 1964–65 and 1,237 in 1965–66. At the end of March 1966, 133 benefits were in force, compared with 208 at the end of the previous year. Payment of additional benefit for a dependent wife was included in 534 of the benefits granted during 1965–66 and in 44 of the benefits in force at 31 March 1966.
Sickness Benefits—Every person over the age of 16 years who has resided continuously in New Zealand for not less than 12 months at any time and who satisfies the Commission that he is temporarily incapacitated for work through sickness or accident, and that by reason thereof he has suffered a loss of salary, wages, or other earnings, is entitled to a sickness benefit. The amount of the benefit is limited to the amount by which the weekly earnings of the applicant have been reduced by reason of his incapacity or to a maximum of $21.50 a week payable to a man and his wife. Where a person is engaged in business on his own account and by reason of sickness or accident is obliged to employ a substitute during the period of incapacity, the remuneration paid to the substitute is regarded as loss of earnings. Every application for a benefit must be supported by a medical certificate, and no benefit is payable for the first seven days of incapacity except under special circumstances.
A married woman shall be entitled to receive a sickness benefit of up to $10.75 a week, only if the Commission is satisfied that her husband is unable to maintain her.
Subject to the foregoing remarks concerning amount of benefit, the rates of sickness benefits are as follows:
| Weekly Benefit | |
|---|---|
| $ | |
| Person under 20 years without dependants | 9.25 |
| Married man with wife included | 21.50 |
| Others | 11.75 |
Any applicant who is maintaining a home and who is not drawing a benefit in respect of a wife, may receive a benefit of up to $9.25 a week in respect of any person who has the care of his home.
Dependent children are provided for by way of family benefit.
The rate of benefit computed as aforesaid is reduced by 10c for every complete 10c of the total income, exclusive of war disablement or basic war-widows' pensions, of the applicant and of his wife or her husband, as the case may be, in excess of $8 a week.
The numbers of applications for sickness benefits dealt with during the years ended 31 March 1965 and 1966 were 32,965 and 34,860 respectively. The number of persons granted sickness benefits was 30,764 in 1964–65 and 32,313 in 1965–66.
In the following table sickness benefits which ceased during the calendar year 1965 are shown according to the duration of the sickness benefit.
| Duration of Sickness Benefit (Weeks) | Number of Benefits | ||
|---|---|---|---|
| Males | Females | Total | |
| 0–4 | 9,244 | 3,038 | 12,282 |
| 5–12 | 6,479 | 2,725 | 9,204 |
| 13–25 | 2,323 | 2,978 | 5,301 |
| 26–52 | 1,150 | 625 | 1,775 |
| 53–104 | 436 | 180 | 616 |
| Over 104 | 119 | 66 | 185 |
| Totals | 19,751 | 9,612 | 29,363 |
The following table gives a classification of sickness benefits according to the disease suffered by the beneficiary. The data are obtained from an analysis of the benefits which ceased during the calendar year 1965.
| Disease or Injury | Males | Females | Percentage of Total |
|---|---|---|---|
| Infective and parasitic diseases | 961 | 340 | 4.4 |
| Neoplasms | 479 | 206 | 2.3 |
| Allergic, endocrine system, metabolic, and nutritional diseases | 562 | 184 | 2.5 |
| Diseases of the blood and blood-forming organs | 61 | 72 | 0.5 |
| Mental, psychoneurotic, and personality disorders | 1,374 | 938 | 7.9 |
| Diseases of the nervous system and sense organs | 914 | 242 | 3.9 |
| Diseases of the circulatory system | 2,216 | 401 | 8.9 |
| Diseases of the respiratory system | 2,525 | 716 | 11.0 |
| Diseases of the digestive system | 2,777 | 660 | 11.7 |
| Diseases of the genito-urinary system | 502 | 379 | 3.0 |
| Deliveries and complications of pregnancy | ... | 3,436 | 11.8 |
| Diseases of the skin and cellular tissue | 714 | 174 | 3.0 |
| Diseases of the bones and organs of movement | 1,504 | 456 | 6.8 |
| Congenital malformations | 73 | 28 | 0.3 |
| Senility, and ill-defined conditions | 1,216 | 579 | 6.1 |
| Accidents, poisonings, and violence | 3,873 | 801 | 15.9 |
| Totals | 19,751 | 9,612 | 100.0 |
Emergency Benefits—An emergency benefit may be granted by the Commission on the grounds of hardship to any person who by reason of age, physical or mental disability, domestic circumstances, or any other reason is unable to earn a sufficient livelihood for himself and those dependent on him and is ineligible for any other monetary benefit other than family benefit. The amount of the emergency benefit is at the discretion of the Commission.
Payments of benefits for which tuberculosis sufferers may qualify are at the rates of $11 a week for a single person under 20 years of age without dependants, $13.50 a week for a single person 20 years and over, and $24 a week for a married couple. These rates are increased by 50c a week for each dependent child.
Supplementary Assistance—Since 1951 supplementary assistance has been available to social security beneficiaries and others who have special commitments which cannot be met out of current income, have insufficient other resources, and are unable to help themselves. Welfare and other organisations have been encouraged to assist in bringing this source of help to the knowledge of persons who might qualify, and departmental literature has included information on the purpose of supplementary assistance. Continuing grants are made where the applicant's continuing commitments, e.g., food, fuel, rent, are in excess of the income received by the applicant, and lump sum grants may be made to meet some non-recurring expense. An analysis of these grants showing purpose and amounts of grants, is given in the parliamentary paper H. 9, 1965. More detailed analyses are given in earlier parliamentary papers.
In the 1965–66 year, 16,432 applications for assistance were granted, expenditure totalling $1,799,790, compared with 14,815 grants totalling $1,367,748 in 1964–65.
Domestic and Nursing Concession—Female social security beneficiaries or the wives of social security beneficiaries are allowed, in addition to the ordinary income exemption of $416 a year, to earn up to $156 a year in domestic or nursing service in private homes, hospitals, homes for the care of the aged, or charitable institutions approved by the Commission, without their benefits being reduced.
During the year 1965–66, 324 applications were received for employment in private homes and 303 were granted, while at 31 March 1966 there were 457 concessions in force, compared with 419 at the end of March 1965. During the year 1965–66, 512 applications were received for employment in hospitals and institutions, and 487 were granted, while at 31 March 1966 there were 645 concessions in force.
Reciprocity with Australia—The Social Security (Reciprocity with Australia) Act 1948, provided for reciprocity in relation to a wide range of benefits between New Zealand and the Commonwealth of Australia. The Act came into force on 1 July 1949. (A similar Act was passed in Australia and came into force on the same date.)
For the purpose of any application for a benefit except New Zealand non-means-test superannuation benefit in respect of a person covered by this Act, residence in Australia or birth in Australia is regarded as residence or birth in this country.
Applicants for age, invalids', or widows' benefits must be qualified on residential grounds to receive the corresponding pensions under the Social Services Act (Australia) as if their residence in New Zealand had been residence in Australia. No male person is entitled to receive an age benefit unless he has attained the age of 65 years. The Act also provides that the Commission shall treat blindness or permanent incapacity for work occurring in Australia as if it had occurred in New Zealand.
Part III of the Act deals with persons who, although ordinarily resident in New Zealand, are temporarily resident in Australia. Such residence is not a disqualification for a benefit. Benefits may be applied for and paid in Australia for a limited period, although the Commission may, in its discretion, postpone payment of the whole or any part of the benefit until the return of the beneficiary to New Zealand.
Reciprocal benefits in force in New Zealand at 31 March 1966 comprised 462 age benefits, 25 widows' benefits, 5 family benefits, 26 invalids' benefits, and 7 sickness benefits, a total of 525 compared with 544 a year earlier.
Reciprocity with United Kingdom—The Social Security (Reciprocity with United Kingdom) Act 1956 brought into operation from 1 April 1956 an agreement providing for reciprocity in a comprehensive range of benefits between New Zealand and the United Kingdom. The general principle of the agreement is that persons migrating from one country to the other will be taken into the social security scheme of the receiving country and paid benefits by the receiving country under the laws and conditions applicable to other residents of that country;
This principle is modified to the extent that the United Kingdom has agreed to continue to pay retirement pensions and widows' pensions in New Zealand to former residents of the United Kingdom who are qualified under the United Kingdom scheme. In such cases, New Zealand will supplement such pensions where necessary to bring them up to the New Zealand rates.
United Kingdom Residents in New Zealand—In New Zealand the agreement applies to former residents of England, Scotland, Wales, Northern Ireland, and the Isle of Man who claim age, superannuation, widows', orphans', invalids', sickness, and unemployment benefits under the Social Security Act. Permanent residence in New Zealand is a requirement for age, superannuation, widows', and invalids' benefits.
The agreement modifies the residential requirements of the Social Security Act and enables persons who formerly lived in the United Kingdom to be treated as if they resided in New Zealand during any period they lived in the United Kingdom. Though the normal qualifying age for a grant of age benefit in New Zealand is 60 years, no man claiming age benefit by virtue of the agreement is entitled to receive it till he reaches 65 years.
The United Kingdom continues to pay retirement pensions and widows' pensions to persons in New Zealand who are qualified under the national insurance scheme and, in such cases, New Zealand, where necessary, supplements the national insurance pensions to bring them up to the rate of the appropriate New Zealand benefit. There is no supplementation in cases where the national insurance retirement or widow's pension is equal to, or greater than, the corresponding New Zealand social security benefit. Reciprocal benefits in force in New Zealand at 31 March 1966 comprised 4,318 superannuation benefits, 3,040 age benefits, 240 widows' benefits, 15 family benefits, 101 invalids' benefits, and 8 sickness benefits, a total of 7,722, compared with 6,964 a year earlier.
New Zealand Residents in the United Kingdom—In the United Kingdom the agreement applies to former residents of New Zealand who claim retirement pensions, widows' pensions, widowed mother's and guardian's allowances, sickness and employment benefits under the National Insurance Act.
The United Kingdom scheme is a contributory scheme, and payment of benefits is dependent upon the satisfaction of specified contributory conditions.
The agreement modifies the provisions of the National Insurance Act of the United Kingdom and enables persons who formerly lived in New Zealand to be treated for the purpose of satisfying the contribution conditions of that Act as if they had paid contributions under the national insurance scheme for each week during which they had been resident in New Zealand. The qualifying age for retirement pension under the National Insurance Act is 60 years for women and 65 years for men.
It is to be noted that, although a man may have been in receipt of age benefit when he left New Zealand, he is not entitled to retirement pension in the United Kingdom unless he is 65 years of age.
A married woman who was receiving age or superannuation benefit in New Zealand cannot qualify in her own right for a retirement pension in the United Kingdom unless she has, since the date of her marriage, paid at least 156 contributions under the legislation of the United Kingdom, or was treated under the New Zealand legislation as an unmarried woman. She may, however, qualify for a wife's allowance, provided that her husband has attained the age of 70 years or has retired from regular employment and attained the age of 65 years.
Persons in receipt of social security benefits in New Zealand who leave New Zealand wholly or mainly for a visit to the United Kingdom will normally have their benefits suspended on departure, but if they return to New Zealand within 12 months they will be paid arrears of their social security benefit for the period of their absence. If they apply for, and receive, national insurance pensions while in the United Kingdom, the amount paid by the United Kingdom will be deducted from the arrears of social security benefit payable on their return.
MEDICAL, HOSPITAL, AND OTHER RELATED BENEFITS—Part II of the Social Security Act 1964, administered by the Department of Health and dealing with medical and like benefits, is of general application to all persons ordinarily resident in New Zealand, and makes provision for medical, pharmaceutical, hospital, maternity, and other related benefits.
Medical Benefits—Under the provisions contained in the Act every person is entitled to such medical treatment as is ordinarily given by medical practitioners in the course of a general practice. Certain services are excluded, these being principally:
Medical services in maternity cases. (These services are covered by maternity benefits and are described under a later heading):
Medical services involved in any medical examination of which the sole or primary purpose is the obtaining of a medical certificate:
Medical services other than anaesthetic services, involved in or incidental to the extraction of teeth by a medical practitioner:
Medical services in respect of which fees are payable under the Social Security (X-ray Diagnostic Services) Regulations 1941, Social Security (Physiotherapy Benefits) Regulations 1951, and Social Security (Laboratory Diagnostic Services) Regulations 1946—see later headings:
Medical services afforded by means of advice given by telephone, telegram, or letter except under circumstances specifically approved by the Director-General of Health, and medical services not rendered by a medical practitioner in person.
Every medical practitioner who renders any of the prescribed services is entitled, on behalf of the patient, to receive from the Department of Health a reasonable fee not exceeding 75c for every occasion on which any such service is provided. Milage fees are also provided for in certain cases. Where the practitioner is called upon to provide, in response to an urgent request, services on a Sunday or holiday, or between the hours of 8 p.m. and 8 a.m., the appropriate fee shall be a reasonable one not exceeding $1.25. For specialist services an amount not exceeding 75c for each attendance is likewise recoverable. Doctors may claim directly from the Department of Health and require the patient to pay the balance of his fee, or may require the patient to pay the whole fee and himself claim a refund from the Department of Health. There has been a steady swing towards the direct-claim system by doctors, and 82 percent now follow this practice.
The number of doctors providing general medical services in March 1966 was 1,831, and the number of “services” per head of population in the year ended 31 March 1966 was 4.2 (same as in the preceding year); the average population per general practitioner was 1,439.
Pharmaceutical Benefits—Under these benefits, which came into operation on 5 May 1941, persons receiving medical attention under the Act are entitled, generally without cost to themselves, to those medicines, drugs, approved appliances, and materials, prescribed for their use by medical practitioners and which are included in the Drug Tariff.
Prescriptions passed for payment in the year ended 31 March 1966 totalled 16,959,812, or 6.4 per head of population. The average cost per prescription was $1.14, the cost per head of population being $6.78.
Hospital Benefits—Treatment is provided free by public hospitals where a patient is entitled to hospital benefits under the Act. The Act provides for the payment to the proprietors of private hospitals and to other approved institutions of prescribed amounts in respect of hospital treatment afforded by them. In the case of private hospitals and other institutions the amount paid is in partial satisfaction of claims against the patients or other persons liable for the hospital charges.
These benefits came into force on 1 July 1939, and the rates from 1 August 1966, which vary for different classes of treatment, are as follows:
For surgical treatment $5.90 a day, with a minimum of $11.80.
For medical (including psychiatric) treatment $4.00 a day.
The Act also provides that in lieu of payment being made in respect of individual hospital patients the Minister may from time to time authorise the payment of a grant in respect of hospital treatment afforded in any private hospital or other approved institution.
In addition to the public hospitals and licensed private hospitals, there is another limited class of semi-public hospitals which, in accordance with the Act, has been approved for the purposes of hospital benefits. This class includes the Karitane Baby Hospitals (six), conducted by the Royal New Zealand Society for the Protection of Women and Children, more commonly known as the Plunket Society, and in addition a home for incurables operated under a charitable trust. Special rates were determined for these classes of hospital, and such payments must be accepted in full satisfaction of the claim of the institution authorities.
Hospital benefits are also available in respect of maintenance and treatment afforded to any inpatient of Queen Mary Neurological Hospital, Hanmer Springs, or of the Queen Elizabeth Hospital, Rotorua, which is concerned with the treatment of arthritis and cerebral palsy. Treatment is free except that a small charge is made in respect of single-room accommodation at Queen Mary Hospital when obtained at the request of the patient.
The Social Security (Hospital Benefits for Outpatients) Regulations 1947 provide for free treatment of outpatients at public hospitals. “Hospital treatment” in relation to an outpatient of any public hospital covers the supply of artificial aids, including contact lenses (introduced 1 June 1947), hearing aids (1 November 1947), artificial limbs (1 April 1948), surgical footwear (1 December 1951), ileostomy and colostomy appliances (27 April 1955), urinals: men's (25 July 1955), women's (29 October 1959), and all medical, surgical, or other treatment afforded by the staff of the hospital; but does not include dental treatment or services in respect of which fees are payable under specific Social Security Regulations (X-ray diagnostic services, laboratory diagnostic services) referred to under later headings. In respect of surgical footwear the conditions of supply provide for part payment by the patient. Inpatient treatment is provided free by public hospitals where the patient is entitled to hospital benefits under the Act.
Mental Hospitals—Treatment of patients in public mental hospitals has been without charge from 1 April 1939. A licensed (private) mental hospital may be recognised and approved by the Minister as a hospital for the purposes of the Act, and hospital benefits in respect of treatment are payable accordingly.
Maternity Benefits—Maternity benefits include ante-natal and post-natal advice and treatment by medical practitioners, and the services of doctors and nurses at confinements in maternity hospitals or elsewhere.
These benefits came into force on 15 May 1939, but the maternity medical practitioner service was not in full operation until 1 October of that year. The amount calculated in accordance with the scale of fees for the time being in force shall be accepted by the medical practitioner in full satisfaction of his claims except in the case of a practitioner who is recognised as an obstetric specialist in accordance with the terms of the Act. Such a practitioner, in addition to the fees payable by the Department of Health, may recover additional fees from the patient. A medical practitioner may contract out of the maternity benefits provisions. In such cases the patient is responsible for all the fees.
The main provisions in regard to maternity benefits apart from the medical practitioner service are as follows:
Licensed (private) maternity hospitals: Licensees of licensed maternity hospitals who have entered into contracts under the Act are entitled to receive fees of $5.9 in respect of the day of birth of the child and for each of the succeeding 14 days. The licensee's contract permits a specified additional charge to the patient.
Midwives and maternity nurses: Approved midwives and maternity nurses who are in attendance in cases where confinement takes place other than in a maternity hospital are entitled to receive from the Department fees at the rate of $8 for the day or days of labour and $5.40 per day for each of the 14 days succeeding the birth of the child or $1.60 per day if a visiting obstetric nurse only. These amounts are in full satisfaction of a nurse's claims in respect of the nursing services.
X-ray Diagnostic Services—The benefits provided for comprise the following:
The making of X-ray examinations with the aid of a fluorescent screen:
The taking of X-ray photographs:
The supply and administration of any drugs or other substances for the purposes of any such examination or photograph:
The provision of medical services incidental to any such examination or photograph, except medical services of a kind not ordinarily performed by radiologists as such:
The provision of any other incidental services for the purposes of any such examinations or photographs.
X-ray photographs or X-ray examinations made or taken for dental purposes or for the purposes of life assurance, visas, emigration permits, and examinations for the sole or primary purpose of obtaining medical certificates for production to some other person, are not included in the services that may be provided. This does not exclude examinations for medical certificates for the purposes of benefits under the Social Security Act or “sickness benefits” from a friendly society, or group examinations approved by the Director-General of Health.
The scale of fees payable in respect of services rendered by recognised radiologists is prescribed in a schedule to the Social Security (X-ray Diagnostic Services) Regulations 1941, Amendment No. 5, issued on 26 January 1960. In respect of recognised radiologists the amount of such fees is deducted from the amount charged to the patient, who is responsible for the balance, if any.
Physiotherapy Benefits—Physiotherapy treatment by private physiotherapists is covered by the Social Security (Physiotherapy Benefits) Regulations 1951. The general arrangement for these benefits consists of contracts with registered physiotherapists under which they are paid from the Department of Health a fee of 50c for each treatment and undertake not to charge the patient any additional fees in excess of $1 for treatment afforded in their rooms or $1.50 for treatment afforded elsewhere.
No physiotherapy treatment is recognised for the purpose of the benefits unless it is given on the recommendation of a medical practitioner, and not more than six weeks' treatment may be given on a single recommendation except in the case of certain specified diseases, illness, etc., approved by the Director-General of Health, when the period of treatment on any one recommendation may be extended up to six months.
Home-nursing Services—Home-nursing services free of cost to the recipients were introduced by the Social Security (District Nursing Services) Regulations 1944, which stipulate that no charge may be made for district nursing services provided by any Department of State, hospital board, or subsidised association elsewhere than in a hospital or other institution, but provision is made for payments to these organisations from the Department of Health.
Domestic Assistance—The provision of monetary assistance to approved incorporated associations formed for the purpose of providing domestic assistance in homes, or whose objects include the provision of such assistance, is made by the Social Security (Domestic Assistance) Regulations 1944. Assistance in this connection (commenced 20 December 1944) is restricted by the regulations to the following classes:
Cases where there are one or more children under 12 years of age permanently residing in a home and the mother or other woman in charge of the home is wholly or partially incapacitated from undertaking her ordinary domestic duties by reason of pregnancy or maternity, or by reason of accident, sickness, etc.:
Cases where there are three or more children under 12 years of age permanently residing in the home, and any member of the household requires special care and attention by reason of sickness or infirmity:
Cases where all members of the household of an age or condition to help in the home are wholly or partially incapacitated from work by sickness or otherwise:
Cases where lack of domestic assistance in the home is a cause of undue hardship.
Laboratory Diagnostic Services—The benefits concerning laboratory diagnostic services came into operation on 1 April 1946, and comprise the supply of all materials or substances required for the purpose of providing laboratory diagnostic services, and the provision of medical services incidental to any laboratory diagnostic service, except medical services of a kind that are not ordinarily performed by pathologists as such, and the provision of any other incidental services for the purposes of laboratory diagnostic services.
The following services are not included:
Examination of specimens for public health.
Post-mortem examinations.
Laboratory services for dental purposes or for the purposes of life insurance.
The preparation of sera and vaccines.
The schedule of fees payable from the Department covers fees payable to recognised pathologists. The fee is in full satisfaction in respect of the services provided.
Dental Services—The Social Security (Dental Benefits) Regulations 1960 provide for free dental treatment. These benefits commenced on 1 February 1947, and at present are confined to persons who are under 16 years of age.
The regulations provide that the services may be provided—
By a registered dentist in a State dental clinic; or
By a State dental nurse in a State dental clinic; or
By a contracting dentist pursuant to a contract under these regulations; or
By a contracting authority in the dental department of a public hospital or in a dental school, pursuant to a contract under these regulations.
A schedule to the regulations prescribes the nature of the benefits that may be provided and a scale of fees payable to contracting dentists and authorities in respect thereof.
Artificial Aids—The Social Security (Hospital Benefits for Outpatients) Regulations 1947 made provision for the supply of artificial aids, such as artificial limbs, hearing aids, and contact lenses.
Contact Lenses—These may be supplied in respect of the following optical disabilities: (a) conical cornea, (b) high myopia, where the degree of myopia present in the greatest axis of the better eye is not less than —10 diopters, (c) monocular aphakia, if the restoration of binocular vision is highly desirable by reason of the patient's occupation or other circumstances and binocular vision cannot be restored without the use of contact lenses. In each case the supply of such lenses must be recommended by an approved ophthalmologist.
Lenses may also be supplied in respect of any other ocular condition which cannot be corrected by ordinary spectacles; in these cases recommendation by two ophthalmologists is necessary.
Hearing Aids—Individual electrical hearing aids may be supplied subject to the following conditions:
The patient possesses a hearing loss of at least 35 decibels in the better ear over the significant frequencies of speech or such other loss of a lesser degree as, in the opinion of an otologist employed or engaged by a hospital board, renders the use of an aid necessary.
The patient's hearing loss is such that in the opinion of the otologist it is capable of correction or marked improvement by the use of the type of hearing aid supplied or approved for the purpose of the benefit.
It is provided that in respect of patients who satisfy these conditions but who do not wish to avail themselves of the hearing aid issued free of charge by hospital boards there may be paid a sum not exceeding $26 towards the purchase of any aid approved for the purposes of these benefits. If a patient has received a benefit for a hearing aid within the preceding five years, the hospital board may pay half (or up to a maximum of $13) of the cost of replacement, provided that the replacement aid will assist hearing more than the existing aid and that the patient is otherwise eligible.
Artificial Limbs—The free supply of artificial limbs is subject to the following conditions:
The patient has not obtained or is not entitled to obtain a limb as an ex-serviceman under the provisions of the War Pensions Regulations 1956 or under the provisions of section 22 of the Workers' Compensation Act 1956:
The supply of the limb is recommended by an approved orthopaedic surgeon:
The limb is of an approved type and can, in the opinion of the supplier's orthopaedic adviser, be satisfactorily fitted.
For the purposes of the regulations “artificial limb” includes artificial arms, artificial hands, artificial legs, and artificial feet, and includes an initial supply of not more than six pairs of limb socks for such limbs, plus a further supply of two limb socks a year, and for female amputees, replacement understockings.
LEGISLATIVE AUTHORITY—All pensions payable to or on account of members of the forces, the Mercantile Marine, and the Emergency Reserve Corps are governed by the War Pensions Act 1954.
ADMINISTRATION—The Secretary for War Pensions, who under the Act must be an officer of the Social Security Department, is charged with the administration of war pensions under the general direction and control of the Minister in Charge of War Pensions. The Act also provides for the appointment of a War Pensions Board (or boards), which has the responsibility of granting or declining claims for pensions and allowances. This board consists of not less than three and not more than four members, one of whom must be a registered medical practitioner and one a representative of returned servicemen. Claimants have the right of appeal to a War Pensions Appeal Board, also appointed under the Act. An appeal board consists of three members, two of whom must be registered medical practitioners, one of these being a representative of returned servicemen.
GROUNDS FOR PAYMENT OF WAR PENSIONS—Pensions in respect of the death or disablement of any member of the New Zealand forces are payable to the dependants of the member (in the case of death) and to the member and his dependants (in the case of disablement) in any of the following cases:
Where death or disablement occurred while on service overseas as a member of the forces in connection with any war in which Her Majesty was then engaged, or in connection with any emergency, whether arising out of the obligations undertaken by New Zealand under the Charter of the United Nations or otherwise (i.e., includes service rendered in Korea).
Where death or disablement is attributable to his service in New Zealand or overseas, e.g., in Malaysia and Vietnam.
In any case where the condition which resulted in the death or disablement was aggravated by his service in New Zealand or overseas.
It is laid down that the onus of proving that death or disablement was attributable to service, or that the condition which resulted in death or disablement was aggravated by such service, shall not be on the claimant and that the War Pensions Board and the War Pensions Appeal Board shall give claimants the full benefit of all presumptions in their favour. A member who was graded fit for service when he entered the forces is deemed to have been absolutely fit at that time unless any defects were noted then or within the first two months of service. This presumption does not operate if the member failed to disclose any material fact to the medical examiner. The Act also states that the boards are not to be bound by technicalities or legal forms or rules of evidence, but shall determine all claims in accordance with their merits.
WAR PENSIONS AND ALLOWANCES, AND WAR VETERANS' ALLOWANCES: SUMMARY OF RATES—The list below summarises the rates of war and economic pensions and allowances as from 1 April 1967.
| Class of Pensions, Allowance, etc. | |
|---|---|
| Dependants of Deceased Members of the Forces, Mercantile Marine, or Emergency Reserve Corps— | Weekly Rate |
| Widow— | $ |
| Basic rate | 8.70 |
| Mother's allowance (where one child) | 8.25 |
| Mother's allowance (where more than one child) each additional dependent child) | 1.00 |
| Economic pension | 11.75 |
| Child— | |
| Where both parents dead or if not under control of mother | 7.05 |
| Other children | 1.50 |
| Widowed mother (wholly dependent or mother of two or more sons being deceased members of the forces)— | |
| Basic rate | 8.70 |
| Economic pension | 11.75 |
| Widowed mother (partially dependent) | |
| Basic rate | 4.00 |
| Economic pension | 9.50 |
| Other dependant | 8.70 |
| Guardian of children of deceased member | 10.75 |
| Member— | $ |
| Basic disablement pension | 11.80 |
| Special increment for blindness, multiple or serious disabilities | 7.00 |
| Economic pension (if unmarried $11.75) | 10.75 |
| Attendant's allowance | 16.00 |
| Wife | 10.75 |
| Child | 1.50 |
| Other dependant | 10.75 |
| War Veteran's Allowance— | |
| Unmarried veteran ($611 a year) | 11.75 |
| Married male veteran ($1,118 a year) | 21.50 |
| Married female veteran ($559 a year) | 10.75 |
| Yearly Rate | |
| Age supplement (maximum) payable to veteran or to his wife, or both, as each attains the age of 65 years | $ 78.00 |
| Supplementary Assistance | According to circumstances |
| Clothing Allowance— | Weekly Rate |
| Loss of— | $ |
| Two limbs or parts | 1.25 |
| Leg or part | 1.15 |
| Arm or part | 0.85 |
| Use of mechanical appliance apart from artificial limb (maximum) | 0.85 |
The payment of $1.50 a week to each child may be made either by way of family benefit or, alternatively, by way of war pension.
Economic pensions and war veterans' allowances are subject to a means test on income and are reducible if income from other sources exceeds $8 a week or $416 a year. In the case of a widow supporting a dependent child or children the allowable income without reduction in pension is, however, $12 a week. In the computation of a wife's pension, the income of the husband is taken into account.
The earnings of women from domestic or nursing services in private homes or in hospitals or charitable institutions up to $156 a year are not taken into account.
The War Pensions Amendment Act 1961 made provision for any sick benefit from a friendly society or a like benefit from any other source up to $2 a week to be disregarded in computing the rate of pension or war veteran's allowance.
Pensions payable for specific disabilities are assessed as a percentage of the full pension payable for total disablement. The following schedule sets out the relevant disabilities and percentages.
| Nature of Disability | Percent of Full Pension Payable |
|---|---|
| Total blindness | 100 |
| Incurable insanity | 100 |
| Very severe facial disfigurement | 100 |
| Amputation of— | |
| Leg through hip joint; leg through upper third of thigh (if without useful stump); arm (where an artificial arm cannot be fitted with retention of elbow joint function) | 100 |
| Leg through upper third or thigh (if with useful stump) | 90 |
| Permanent loss of speech | 90 |
| Amputation of leg through knee joint or middle or lower third of thigh | 85 |
| Total deafness | 85 |
| Amputation of arm (where an artificial arm can be fitted with retention of elbow joint function) | 80 |
| Severe facial disfigurement | 80 |
| Amputation of leg below knee | 75 |
| Loss of— | |
| One eye; four fingers | 50 |
| Three fingers; thumb | 40 |
| Two fingers | 25 |
| Index finger of either hand | 20 |
If a member, while in receipt of a permanent pension of an amount of not less than 70 percent of the maximum pension that would be payable in respect of total disablement, dies from any cause not attributable to service as a member of the forces, a pension may be granted to his widow or dependent children as if death was attributable to service. The 1961 Amendment Act extended this provision to include the widow or dependent children of a member who was not in receipt of such a pension, but who, in the opinion of the Board, could have been granted a permanent pension of not less than 70 percent of total disablement if he had not died.
Other grants and concessions which may be made include the following:
A free pass on the New Zealand Railways rail and road services to members in receipt of full permanent pensions;
A permit to travel first class at second-class rates on the New Zealand Railways to amputees and others suffering locomotive disabilities to a degree of over 50 percent for which they receive permanent pensions;
Free medical and surgical treatment in respect of pensionable disabilities. Surgical appliances such as artificial limbs, etc., are also supplied free and kept in good order and repair;
Payment of an annual travelling allowance of up to $52 to totally disabled pensioners who are unfit to travel alone;
Payment of up to $200 towards the cost of structural alterations with a $50 provision for furniture to provide special accommodation for a pensioner suffering from pulmonary tuberculosis;
Reasonable accommodation and out-of-pocket expenses are allowed for war pensioners reporting for medical examination or treatment while a reasonable amount may be paid by way of compensation in respect of loss of earnings;
Interest-free loans to certain seriously disabled pensioners to purchase motorcars; payment of loadings on life-assurance policies where the loadings are due to war disabilities; gallantry awards to disablement pensioners; and funeral grants in respect of deceased ex-servicemen.
Pensions to Dependants (other than Wives or Children)—In addition to pensions for wives and children, a pension may be granted to any member of a deceased or disabled serviceman's family. “A member of the family” includes a parent, grandparent, step-parent, grandchild, stepchild, brother, sister, half-brother, half-sister, and mother-in-law. “Child,” in relation to any member of the forces, means a child under the age of 16 years, and includes an adopted child and an ex-nuptial child (subject to certain conditions). The parents of a male member of the forces are included in the definition of dependant in every case, without proof of preservice dependency. Also, except in the case of the wife, widow, children under 16, and parents, the eligibility of dependants is based on the expectation of dependency on the member.
Economic Pensions—An “economic pension” is defined as a supplementary pension granted on economic grounds and is in addition to any pension payable as of right in respect of death or disablement. In considering a claim for an economic pension a War Pensions Board is required to take into consideration the ability of the claimant to obtain and retain suitable employment, the personal income and ownership of any property, the cost of living, and other relevant matters.
The personal earnings of a disablement pensioner may be disregarded in the assessment of an economic pension to an amount equivalent to that by which the disablement pension is less than the amount of pension for total disablement.
Servicemen pensioned for minor disablement do not receive economic pensions.
WAR VETERANS' ALLOWANCES—The object of war veterans' allowances was to make provision for members of the forces who, apart from any wounds or other injuries received during war service, were ageing prematurely or otherwise becoming unfit for permanent employment by reason of mental or physical incapacity. The term “veteran” includes—
Any male member of the New Zealand forces who has served as such in actual engagement with the enemy or, by reason of his period of overseas service and the arduous or dangerous nature of it, is considered a proper person for the grant of an allowance:
Any female member who has served overseas as a member of the New Zealand forces:
Any person who served as a member of a New Zealand contingent in the South African War and has attained the age of 75 years.
Any person who was a member of the forces of any Commonwealth country other than New Zealand and who—
Served outside that country with a unit in actual engagement with the enemy during any war or emergency in which New Zealand forces served; or
Served outside that country and by reason of the period of service and the arduous or dangerous nature of such service is considered a proper person for a grant of an allowance; or
Was in actual engagement with the enemy.
A condition precedent to the granting of a war veteran's allowance to a member of the New Zealand forces (or to a bona fide resident of New Zealand at the commencement of the war or emergency in which he served as a member of the forces of a Commonwealth country other than New Zealand) is a minimum of five years' continuous residence in New Zealand immediately preceding the date of the claim. Continuous residence is not deemed to be interrupted by occasional absences not exceeding six months in the aggregate, increased by one month for each year in excess of five that the veteran has resided in New Zealand; any absences as a member of the Commonwealth forces are also disregarded. For any other person residence of at least 20 years preceding application for an allowance is required, although absences not exceeding two years in the aggregate during that period are permitted with a further allowance of six months' absence for every year of residence in excess of 20.
Whether or not a claimant for an allowance is unfit for permanent employment by reason of mental or physical infirmity is a question of fact to be determined by the War Pensions Board. Claimants have the right of appeal to a War Pensions Appeal Board.
No account is taken of the amount of war disablement pensions in the determination of the basic war veterans' allowances. In computing any war veteran's allowance no account is taken of the personal earnings of any woman from domestic or nursing services in a private home or hospital or charitable institution up to $156 per year.
Where any veteran and his wife have attained the age of 65 years, an age supplement of a maximum of $78 a year each may be paid provided that the amount of the age supplement, together with income from other sources and any disablement pension, does not exceed $416 a year.
Where a veteran in receipt of an allowance dies leaving a widow in respect of whom an allowance is being paid, a War Pensions Board may, in its discretion, grant the widow a gratuity equivalent to $1,063.40 a year for two years or of such lesser amount as it thinks fit.
EMERGENCY RESERVE CORPS PENSIONS—These pensions are payable under the 1954 Act where death or disablement was suffered by a member of the Emergency Reserve Corps in the course of service (including training), or was directly attributable to such service.
MERCANTILE MARINE PENSIONS—The 1954 Act provides for the payment of pensions and allowances in respect of death or disablement of members of the mercantile marine as a result of the Second World War.
WAR SERVICEMEN'S DEPENDANTS' ALLOWANCE—An economic pension, a wife's pension, or a veteran's allowance may be increased by $1 a week by way of a war serviceman's dependant's allowance where the recipient is the parent of a deceased member of the New Zealand forces, the mercantile marine, or Her Majesty's forces established elsewhere than in New Zealand. Where the deceased was a member of the forces death must have been attributable to war service or, if a member of the mercantile marine, death must have been directly attributable to the Second World War. If the claim is in respect of the death of a member of the British mercantile marine or of forces other than the New Zealand forces, the member must have been domiciled in New Zealand at the commencement of the war in which he served.
SUPPLEMENTARY ASSISTANCE—Since 1951 supplementary assistance has been available to provide for similar cases to those set out under social security supplementary assistance. During the year ended 31 March 1966 there were 717 grants totalling $47,636, compared with 577 grants totalling $36,716 in the previous year.
WAR BURSARIES—Bursaries for educational purposes are available to children of war veterans, seriously and permanently disabled ex-servicemen, and of deceased ex-servicemen in respect of whose deaths war pensions are paid. Bursaries are paid at the following rates:
| Class of Bursary | Per Year |
|---|---|
| $ | |
| (a) Secondary school children | 50 |
| (b) Full-time university students | 60 |
| (c) Part-time university students | 20 |
| (d) Part-time technical school children | 3 |
The rates payable under (a) and (b) are doubled in the case of an orphan child or a child whose father or mother is in receipt of an economic pension or a war veteran's allowance.
During 1965–56, 3,099 bursaries were granted, expenditure on this behalf being $199,366 for the year. The 1964–65 figures were 2,990 bursaries and $190,736.
WAR PENSIONS APPEAL BOARD—A claimant may appeal to a War Pensions Appeal Board from a decision of a War Pensions Board within six months of the date on which the decision of the latter was communicated to him. Such an appeal can be made only in so far as it relates to—
The rejection of any claim for a pension in respect of the death or disablement of a member of the forces on the ground that the death or disablement was not attributable to his service as a member of the forces or that the condition that resulted in his death or disablement was not aggravated by such service.
The assessment of a pension granted to any member of the forces in so far as the assessment is based on medical grounds.
The rejection of any claim for a war veteran's allowance on the ground that the applicant is not unfit for permanent employment.
The appeal board may confirm the decision of the War Pensions Board or may grant a pension, or, within the limits prescribed by the Act, may increase or reduce the amount of any pension. The number of appeals dealt with was 141 in 1965–66. Of these, 66, or 47 percent, were upheld.
STATISTICAL REVIEW OF WAR PENSIONS, ALLOWANCES, ETC.—During the year ended 31 March 1966 the Department dealt with 3,141 applications for war pensions. Of these, 761 applications were lodged by ex-servicemen in respect of their own disabilities, the balance being made up of claims by dependants, applications for economic pensions, and war veterans' allowances. The total for the previous year was 2,982; of these, 881 were in respect of the applicants' own disability. In addition there were 138 claims received during the year in respect of disablement arising from service with peacetime armed forces, of which 76 were granted and 62 declined.
Summary of Disabilities for Which Pensions Granted, 1939–66—The following is a summary of the disabilities attributed to war service from 1939 onwards and for which ex-service personnel had been granted pensions up to 31 March 1966.
| Class of Disability or Disease | Type of Service | Total | Percentage of Total | |||
|---|---|---|---|---|---|---|
| Overseas (1939–45) | K Force | J Force | New Zealand | |||
| Infections and infestations | 2,053 | 92 | 7 | 157 | 2,309 | 3.7 |
| Nervous system | 9,711 | 43 | 13 | 1,746 | 11,513 | 18.6 |
| Eye, ear, and nose | 7,087 | 88 | 20 | 1,473 | 8,668 | 14.0 |
| Circulatory and blood system | 2,601 | 10 | 2 | 1,074 | 3,687 | 6.0 |
| Metabolism and endocrine system | 437 | 2 | 1 | 179 | 619 | 1.0 |
| Respiratory system | 3,733 | 30 | 54 | 1,235 | 5,052 | 8.2 |
| Diseases of bones, joints, muscles, tendons, and ligaments | 5,373 | 29 | 9 | 1,874 | 7,285 | 11.8 |
| Digestive system | 4,689 | 39 | 13 | 1,231 | 5,972 | 9.7 |
| Generative system | 350 | 1 | 1 | 126 | 478 | 0.8 |
| Gunshot wounds and accidental injuries to bones, joints, and soft tissues | 8,204 | 120 | 30 | 1,970 | 10,324 | 16.7 |
| Skin | 2,561 | 25 | 12 | 550 | 3,148 | 5.1 |
| Areolar tissue | 48 | 2 | – | 29 | 79 | 0.1 |
| Tumours and neoplastic growth | 225 | 2 | – | 56 | 283 | 0.5 |
| Malformations | 303 | 1 | – | 132 | 436 | 0.7 |
| Amputations (not including fingers and toes) | 511 | 4 | – | 22 | 537 | 0.9 |
| Urinary tract | 641 | 7 | 3 | 159 | 810 | 1,3 |
| Debility | 445 | – | – | 109 | 554 | 0.9 |
| Totals | 48,972 | 495 | 165 | 12,122 | 61,754 | 100.0 |
The following table shows for all classes of war pensions the number in force at the end of March in each year and the expenditure during the years given.
| Year Ended 31 March | First World War (1914–18) | Second World War (1939–45) | K Force | War Veterans | South African War | Mercantile Marine | Emergency Reserve Corps | Supplementary Assistance | Total |
|---|---|---|---|---|---|---|---|---|---|
| Number in Force | |||||||||
| 1956 | 16,683 | 24,687 | 183 | 8,479 | 26 | 24 | 9 | .. | 50,091 |
| 1957 | 16,317 | 24,519 | 200 | 9,520 | 24 | 27 | 9 | .. | 50,616 |
| 1958 | 15,694 | 24,330 | 203 | 10,881 | 21 | 26 | 9 | .. | 51,164 |
| 1959 | 15,383 | 24,423 | 199 | 12,157 | 21 | 28 | 9 | 116 | 52,336 |
| 1960 | 14,890 | 24,430 | 209 | 12,961 | 21 | 24 | 9 | 127 | 52,671 |
| 1961 | 14,339 | 24,518 | 197 | 14,251 | 19 | 28 | 9 | 161 | 53,522 |
| 1962 | 13,845 | 24,676 | 209 | 14,749 | 17 | 29 | 8 | 178 | 53,711 |
| 1963 | 13,104 | 24,737 | 203 | 15,185 | 16 | 27 | 8 | 174 | 53,454 |
| 1964 | 12,556 | 24,521 | 184 | 14,350 | 14 | 25 | 8 | 212 | 51,870 |
| 1965 | 11,946 | 24,629 | 167 | 13,894 | 12 | 23 | 8 | 295 | 50,974 |
| 1966 | 11,389 | 24,716 | 190 | 13,488 | 11 | 21 | 8 | 377 | 50,200 |
| Expenditure ($000) | |||||||||
| 1956 | 6,087 | 4,715 | 30 | 5,414 | 11 | 5 | 4 | 8 | 16,274 |
| 1957 | 6,253 | 4,822 | 36 | 5,999 | 10 | 7 | 4 | 11 | 17,142 |
| 1958 | 6,589 | 5,134 | 39 | 7,078 | 10 | 7 | 4 | 14 | 18,875 |
| 1959 | 6,664 | 5,443 | 35 | 9,017 | 11 | 8 | 4 | 18 | 21,201 |
| 1960 | 6,780 | 5,676 | 35 | 9,855 | 11 | 8 | 4 | 19 | 22,388 |
| 1961 | 6,639 | 5,759 | 35 | 11,410 | 11 | 8 | 4 | 19 | 23,884 |
| 1962 | 6,583 | 5,876 | 26 | 12,250 | 11 | 8 | 4 | 22 | 24,780 |
| 1963 | 6,378 | 6,418 | 18 | 12,720 | 10 | 8 | 4 | 17 | 25,573 |
| 1964 | 6,756 | 6,967 | 27 | 12,928 | 10 | 10 | 4 | 29 | 26,731 |
| 1965 | 6,586 | 7,126 | 22 | 13,348 | 9 | 9 | 4 | 37 | 27,142 |
| 1966 | 6,507 | 7,829 | 23 | 13,299 | 9 | 8 | 5 | 48 | 27,728 |
The foregoing figures of expenditure include the following: (a) travelling allowances of $1 a week paid to 1,354 pensioners at 31 March 1966; (b) clothing allowances, of which 1,345 were being paid at 31 March 1966 and the annual value of which for 1965–66 was $63,556; (c) gallantry awards of an annual value of $5,858. The following are not included: (a) costs of certain medical treatment not available under social security amounting to $142,324 in 1965–66 and $152,350 in 1964–65; (b) railway and bus concessions to pensioners for total and permanent disablement and locomotive disabilities for which a permanent pension of over 50 percent disablement has been granted, costing $45,376 in 1965–66 and $45,722 in the previous year; (c) loadings on life-assurance policies where the loadings are due to war disabilities, expenditure under this heading being $476 in 1965–66; (d) funeral grants which cost $57,568 in 1965–66; and (e) 31 interest-free loans in 1965–66 totalling $25,000 towards the purchase of motor vehicles by certain seriously disabled pensioners.
Administration costs for 1965–66 in respect of war pensions and allowances amounted to $31,784 as against $31,384 in 1964–65.
The numbers of First and Second World War and K Force pensions in force as at 31 March of each of the latest six years are given below.
| At 31 March | Disablement Pensions | Dependants of Disabled Ex-members | On Account of Death | Total | ||
|---|---|---|---|---|---|---|
| Permanent | Temporary | Widows | Parents and Other Dependants | |||
| First World War, 1914–18 | ||||||
| 1961 | 9,481 | 175 | 1,699 | 2,923 | 61 | 14,339 |
| 1962 | 9,109 | 141 | 1,536 | 3,006 | 53 | 13,845 |
| 1963 | 8,553 | 122 | 1,336 | 3,049 | 44 | 13,104 |
| 1964 | 8,038 | 122 | 1,270 | 3,091 | 35 | 12,556 |
| 1965 | 7,503 | 133 | 1,151 | 3,130 | 29 | 11,946 |
| 1966 | 7,066 | 122 | 1,023 | 3,154 | 24 | 11,389 |
| Second World War, 1939–45 | ||||||
| 1961 | 16,777 | 4,725 | 842 | 1,560 | 614 | 24,518 |
| 1962 | 17,001 | 4,440 | 870 | 1,603 | 762 | 24,676 |
| 1963 | 17,396 | 4,126 | 873 | 1,633 | 709 | 24,737 |
| 1964 | 17,628 | 3,779 | 849 | 1,676 | 589 | 24,521 |
| 1965 | 17,554 | 3,841 | 918 | 1,779 | 537 | 24,629 |
| 1966 | 17,635 | 3,789 | 961 | 1,867 | 464 | 24,716 |
| K. Force | ||||||
| 1961 | 83 | 110 | 2 | – | 2 | 197 |
| 1962 | 99 | 105 | 2 | – | 3 | 209 |
| 1963 | 101 | 97 | 2 | – | 3 | 203 |
| 1964 | 103 | 77 | 2 | – | 2 | 184 |
| 1965 | 101 | 58 | 5 | – | 3 | 167 |
| 1966 | 116 | 62 | 8 | – | 4 | 190 |
The number of children for whom payments were made in 1965–66 but who were not included in the preceding table totalled 822, being 39 in respect of First World War pensions, 772 for Second World War pensions, and 11 for K force pensions.
The next table shows the number of disability pensions in force at 31 March 1966, classified according to percentage of disablement.
| Percentage
of Disablement | First World War | Second World War 1939–1945 | K Force | Total | |||
|---|---|---|---|---|---|---|---|
| Permanent | Temporary | Permanent | Temporary | Permanent | Temporary | ||
| * Includes “over 100 per cent” disablement which is a special rate pension for total blindness or other serious disablement. | |||||||
| 100* | 1,569 | 16 | 1,574 | 336 | 10 | 4 | 3,509 |
| 90–99 | 109 | 1 | 118 | 37 | – | – | 265 |
| 80–89 | 260 | 12 | 315 | 103 | 1 | 2 | 693 |
| 70–79 | 673 | 11 | 757 | 203 | 5 | 1 | 1,650 |
| 60–69 | 320 | 31 | 417 | 255 | 2 | – | 1,025 |
| 50–59 | 642 | 20 | 942 | 361 | 9 | 11 | 1,985 |
| 40–49 | 1,012 | 4 | 1,260 | 399 | 11 | 4 | 2,690 |
| Under 40 | 2,481 | 27 | 12,252 | 2,095 | 78 | 40 | 16,973 |
| Totals | 7,066 | 122 | 17,635 | 3,789 | 116 | 62 | 28,790 |
Details of economic pensions payable at 31 March 1966 are now given, together with the totals as at 31 March 1965.
| Class of Pension | First World War 1914–18 | Second World War 1939–45 | K Force | |||
|---|---|---|---|---|---|---|
| Number | Annual Value | Number | Annual Value | Number | Annual Value | |
| $(000) | $(000) | $(000) | ||||
| Ex-members with permanent pensions | 1,463 | 740 | 1,080 | 545 | 6 | 3 |
| Ex-members with temporary pensions | 6 | 2 | 202 | 97 | 2 | 1 |
| Widows | 2,401 | 1,314 | 1,324 | 858 | – | – |
| Widowed mothers | 8 | 4 | 308 | 141 | – | – |
| Totals at 31 March 1966 | 3,878 | 2,060 | 2,914 | 1,641 | 8 | 4 |
| Totals at 31 March 1965 | 4,041 | 2,176 | 2,870 | 1,507 | 5 | 2 |
REHABILITATION—The Rehabilitation Act 1941 and its amendments made provision for the re-establishment in civil life of discharged servicemen, and an extensive programme was promoted by the Rehabilitation Board, the National Rehabilitation Council, and the Rehabilitation Department. Under the Emergency Forces Rehabilitation Act 1953 regulations were made for the rehabilitation and protection of servicemen and dependants of servicemen who served overseas in connection with any emergency under the United Nations Charter or otherwise.
The Rehabilitation Board determines the nature and extent of the assistance that may be granted to any class of servicemen, and approves the granting of such assistance.
On 1 April 1954 the Rehabilitation Department ceased to function as a separate Department and became a division of the Department of Internal Affairs, in the form of a board secretariat with regional representation at Auckland, Wellington, and Christchurch. From 1 January 1960 the Rehabilitation Division became part of the Social Security Department.
Rehabilitation Assistance—All forms of rehabilitation assistance available to ex-servicemen of the Second World War and K Force ceased on 31 March 1965. There have been 13,781 ex-servicemen settled on farms with rehabilitation assistance, and education assistance granted in 54,437 cases. Total rehabilitation expenditure to 31 March 1966 was $567,156,688 covering loans, grants, farm trading and settlement, trade training and educational facilities.
Resettlement assistance, limited to housing and furniture loans, is available to servicemen with earlier service in the South-East Asia area, but men with service in the area from 1 April 1965 may be granted resettlement assistance on an extended scale. Housing loans for men with qualifying service after 1 April 1965 have an increased limit. Subsidised trade training and education assistance have also been made available. For those men who still qualify for resettlement assistance by way of furniture loans, the maximum limit has been increased to $400.
Closing dates for housing and furniture loans have been set at 31 March 1971 or five years from the date qualifying service ceased, whichever is the later. Application for subsidised trade training and education assistance must be lodged within two years of return to New Zealand.
No time limits have been fixed in respect of the availability of any rehabilitation assistance for (a) children of deceased and totally incapacitated ex-servicemen, or (b) ex-servicemen whose rehabilitation may at any time be retarded or interrupted or become necessary from war disability. Appropriate forms of assistance for these groups will continue under such terms and conditions as may be considered appropriate by the Rehabilitation Board from time to time.
Special provisions exist to ensure that rehabilitation assistance will continue to be available to all ex-servicemen whose rehabilitation may at any time be interrupted or become necessary as a result of disability arising from service with emergency forces,
Expenditure—Rehabilitation expenditure (including loan authorisations) for the year ended 31 March 1966, together with the totals to 31 March 1966, was as follows.
| Item | Year Ended 31 March 1966 | To 31 March 1966 From Outset |
|---|---|---|
| Educational facilities, including books, tuition fees, and subsistence allowance | $(000) 30 | $(000) 3,748 |
| Trade training— | ||
| Payments to Disabled Servicemen's Re-establishment League, etc. | 19 | 4,616 |
| Trade-training centres operated by Rehabilitation Board | – | 11,721 |
| Training of blinded ex-servicemen | 6 | 274 |
| Other expenditure | – | 469 |
| 25 | 17,080 | |
| Farm training and settlement (excluding loans) | 3,146 | 91,283 |
| Item | Year Ended 31 March 1966 | To 31 March 1966 From Outset |
|---|---|---|
| Loans— | $(000) | $(000) |
| Interest concessions | 1,371 | 29,222 |
| Loans authorised | 6,596 | 407,992 |
| Reserve Fund contributions | 59 | 5,175 |
| Suspensory loans, etc. | 68 | 11,333 |
| 8,094 | 453,722 | |
| Grants and other items | – | 1,323 |
| Totals | 11,295 | 567,356 |
GENERAL.—Superannuation for all Government employees is provided for under the authority of the Superannuation Act 1956.
Local Government employees, and employees of all statutory bodies are provided for under the National Provident Fund Act 1950 which also authorises certain schemes for members of the general public. Details of the National Provident Fund are given in Section 6D.
There are also a considerable number of private superannuation funds and some information about them is given at the end of this subsection.
GOVERNMENT SUPERANNUATION FUND—The Government Superannuation Fund in its present form was established on 1 April 1948. Its revenues consist of contributions, subsidies from the Consolidated Revenue Account, and other funds and interest earned on investments.
The Fund is administered by a board consisting of the Minister of Finance as chairman, the Secretary to the Treasury, the Chairman of the State Services Commission, the General Manager of Railways, the Director-General of Education, the Director-General of the Post Office, the Commissioner of Police, five members appointed on the nomination of the various employee organisations, and one on the nomination of the Minister of Defence.
Membership—Membership of the Superannuation Fund is now available for all employees of the State. These include employees of Departments of State under the control of the State Services Commission, and also those employed in the Education Service, the Railways Department, and the Post Office. Membership is compulsory for permanent members of the Armed Forces, the Police and Prisons Service, also for members of the Judicature (Judges of the Supreme Court and Court of Arbitration), Maori Land Court Judges, Magistrates, and Members of Parliament. A contributor to the Fund who enters the service of the Government of Western Samoa or of the Western Samoa Trust Estates Corporation may, if the Board agrees, continue to contribute to the Fund. In addition, the Fund has continued to be the vehicle for the superannuation scheme for the Cook Islands Public Service.
Compulsory membership also applies to any person, other than a married woman, who has become permanently employed in the Government service after 1 January 1964, and who is at least 17 and less than 25 years of age.
Contributions—Contributions range from 5 percent of salary for those under 30 years of age when they join the scheme, to 10 percent for those over 50 years of age. The rate of increase is in 1 percent steps for each five years of age. An alternative modified scheme within the framework of the standard scheme was introduced in 1955 under which contributors may elect to contribute only 60 percent of the standard contribution rates and receive only 60 percent of the standard benefits.
Benefits—Upon retirement a contributor entitled to a retiring allowance may elect to accept a refund of his contributions, or an allowance. If he chooses the latter he may vary the normal allowance by electing to (a) take an increased allowance to age 65, reducing thereafter, (b) surrender a portion of the allowance to provide after his death an annuity for his widow or other approved dependant, (c) surrender not more than one-quarter of his retiring allowance and to receive in lieu a lump sum payment equal to nine times the amount of the allowance surrendered.
Standard retiring allowances are computed at the rate of one hundred and twentieth part of the annual salary for each year of contributory service, to which is added an equal amount by way of employer subsidy. However the latter is not permitted to exceed one-third of the annual salary. The annual salary for the purpose of this computation is taken to be the average of that received during the five years immediately preceding retirement, although in special cases (i.e., where the first computed portion of the retiring allowance is less than $300) the average salary received during the last three years may be used if it results in a more favourable computation.
Retiring allowances and other benefits are paid in advance in instalments every 28 days. No recovery is made should the beneficiary die during the benefit period.
When a married contributor dies, his widow may elect to receive a refund of his contributions or an allowance at half the rate of the allowance to which her husband would have been entitled had he retired on the date of his death. The widow of a superannuitant may elect to receive a refund of the amount of his contributions less any sums received by him during his lifetime, or to receive an annuity at one-half the rate of his retiring allowance, disregarding any election to take a variable allowance or to surrender part of the allowance for an approved dependant.
The amount of the widow's annuity cannot be less than $260 ($156 in the modified scheme). In addition, $78 per annum ($46.80 in the modified scheme) is paid for each child under 16 years of age (or 18 if still receiving full-time education) left by a deceased contributor or superannuitant. The widow's benefit is payable only during widowhood but is reinstated if after remarrying she again becomes a widow.
When a female contributor or superannuitant dies leaving a husband who can satisfy the Board that he was totally or partially dependent on her immediately before her death, a widower's annuity, calculated on a similar basis to the widow's benefit, may be paid.
Variation of General Conditions—As stated above, membership of the Fund is compulsory for the Police, members of the Prisons Service, and for the Armed Forces. Members of the Police and Prisons Service are obliged to retire at age 60 and to enable late entrants to obtain the equivalent of 40 years service for superannuation purposes, there are special provisions for the computation of their allowances. Where contributory service commenced after age 25, each year in the Police and Prisons Service is deemed to be one year and one-seventh. Where contributory service commenced after age 20 but before age 25, a lesser proportion is added. An increased rate of contributions is payable by those whose service is scaled up. The standard benefits apply.
Contributions for members of the Aimed Forces are the same percentage of salary as for the general State Services (i.e., excluding the Police and Prisons groups already mentioned) and their retiring allowances are computed in the normal manner. However, they may qualify for a retiring allowance after 20 years' service, irrespective of age, while for the general Service qualifications range from 40 years' service to 65 years of age, in accordance with date of entry into the Fund.
Prior to the implementation in 1962 of equal pay for women in the State Services, female contributors could retire on completion of 30 years' service or on reaching 55 years of age. Those employed at 1 April 1962 may still do so but women who have joined the Fund since then have to satisfy the same retiring allowance qualifications as do males.
Members of the Judicature contribute at the rate of 7 percent of their salary. Their retiring allowances are based on a scale which varies according to length of service. The result of the formula is that after 10 years' service a pension equal to six twenty-fourths of the annual salary at date of retirement is payable, increasing by one twenty-fourth of that salary for each year over 10. The allowance, however, is not to exceed 16 twenty-fourths of that salary. A widow of a Judge is entitled to half her husband's retiring allowance subject to a minimum of 15 percent and a maximum of 25 percent of the husband's final salary.
Magistrates and Judges of the Maori Land Court contribute 8 percent of their salary. Their retiring allowances are based on one thirty-sixth of the annual salary at the date of retirement for each year of service, up to a maximum of two-thirds of that salary. The widow's benefit is calculated in the same way as for Judges' widows.
Members of all the groups mentioned above are entitled to a retiring allowance at any stage if they become substantially unfit for further duty. The allowances are based on the period of contributory service completed and are computed in the normal manner.
Members of Parliament contribute 10 percent of an ordinary member's salary. A member qualifies for a pension if he retires from Parliament having completed not less than nine years service as a member, or not less than eight years when he has served throughout the duration of not less than three sessions. The allowance is payable from age 50 onwards. The allowance is computed at the rate of one thirty-second part of an ordinary member's salary for each year of service, with a maximum of two-thirds of that salary. The standard provisions for widows', widowers' and children's benefits apply.
Statistics—At 31 March 1966 there were 92,205 contributors, who paid $10,970,422 for the year into the Fund. The pensioners at the same date numbered 25,306 and were entitled to $21,690,610 a year, made up as follows.
| Class of Payee | Number | Annual Allowances | ||
|---|---|---|---|---|
| Males | Females | Total | ||
| $(000) | ||||
| Retired for age or length of service | 12,858 | 3,295 | 16,153 | 18,315 |
| Retired for ill-health | 1,105 | 206 | 1,311 | 665 |
| Widows and dependent widowers | 1 | 6,558 | 6,559 | 2,610 |
| Children | 669 | 614 | 1,283 | 100 |
| Totals | 14,633 | 10,673 | 25,306 | 21,690 |
Accumulated funds at 31 March 1966 amounted to $103,078,984. Total assets, which amounted to $104,187,796 included: Investments, $99,655,660; interest, due and accrued, $1,307,738; contributions in course of transmission, etc., $514,358; and cash in hand and at bank, $2,710,040.
The average effective interest earnings of the Fund for the year ended 31 March 1966 was $4.70 percent.
The total revenue of the Fund for the year ended 31 March 1966 was $33,853,122, including members' contributions $11,040,548, interest on investments and on contributions, $4,590,824, other items $1,086, and subsidy $16,220,664. The total amount expended during the year was $27,753,402, including retiring and other allowances $25,295,220, and refunds of contributions $2,458,182.
In the Parliamentary Superannuation Account revenue was $71,804 including contributions $34,400, subsidy $34,400, and interest $3,004. Expenditure on retiring and other allowances was $49,590.
The following statistics present a review of the operations of the Fund during the latest five years.
| Year Ended 31 March | Number of Contributors | Annual Contributions* | Interest Received From Investments | Subsidy From Government Trading Departments, and Others | Annual Value of Allowances | Accumulated Fund |
|---|---|---|---|---|---|---|
| * Includes transfers from National Provident Fund. | ||||||
| $(000) | $(000) | $(000) | $(000) | $(000) | ||
| 1962 | 75,373 | 7,960 | 2,936 | 11,759 | 15,748 | 76,116 |
| 1963 | 76,486 | 8,251 | 3,396 | 13,055 | 16,756 | 82,858 |
| 1964 | 82,680 | 8,867 | 3,752 | 13,937 | 18,136 | 90,134 |
| 1965 | 86,735 | 10,065 | 4,142 | 14,743 | 20,022 | 96,902 |
| 1966 | 92,205 | 11,040 | 4,590 | 16,220 | 21,690 | 103,002 |
PRIVATE SUPERANNUATION FUNDS—Most large and many small employers have established their own staff superannuation funds. Certain taxation concessions are available to an employer and his employees in respect of their contributions to a superannuation fund provided the fund is approved by the Commissioner of Inland Revenue, and it is probable that there are very few funds being administered which have not been approved. The totals of approved Funds as at 31 March in the years stated are as follows (as there is no information available on discontinuances, it is not possible to state the numbers in active operation).
| 1957 | 3,625 | 1,962 | 4,702 |
| 1958 | 3,844 | 1,963 | 4,979 |
| 1959 | 3,967 | 1,964 | 5,197 |
| 1960 | 4,201 | 1,965 | 5,493 |
| 1961 | 4,404 | 1,966 | 5,860 |
Some funds, particularly those of larger organisations such as banks, oil companies, and insurance companies, provide for pensions on retirement. Although most funds provide for lump-sum payments on retirement, the relative proportions of persons covered by provisions for lump-sum payments or pensions is not known.
GENERAL—The National Provident Fund was established on 1 March 1911 with the object of providing a superannuation scheme for the public. The present legislative authority is contained in the National Provident Fund Act 1950 and its amendments.
The Fund is administered by a board comprising the Minister of Finance as chairman, the Secretary to the Treasury, the Director-General of Health, the Valuer-General, the Superintendent of the Fund, and up to three other members appointed by the Governor-General.
The Fund now provides four distinct services:
Public Fund—It provides pension schemes for individual members of the general public and schemes for members of approved friendly societies, employees of firms, trade unions, etc.
Local Authorities Superannuation—It administers superannuation schemes for employees of all local authorities and quasi-government organisations.
Savings Superannuation Scheme for Farm Employees—It administers a superannuation scheme for farm employees.
Local Authorities Investment Pool—It controls the investment pool into which local authorities may temporarily invest otherwise idle funds.
The State guarantees the benefits payable under the schemes and in most cases provides a subsidy to the extent of one-fourth of contributions. However no State subsidy is payable in the farm employees scheme, while the trading quasi-government organisations in the local authorities schemes themselves meet the subsidy which is payable by the State in the case of local authorities.
The State meets all administration expenses.
Public Fund—Membership of the public part of the National Provident Fund is open to any resident of New Zealand over the age of 15 years.
There are two schemes offered and contributors may join one or both of them. The Level Premium Scheme permits a contributor to purchase a predetermined amount of pension from age 60 years by the payment of fixed, regular contributions, with the first $20 per week of pension attracting the State subsidy of 25 percent of contributions. After five years' membership contributors qualify for ancillary benefits in the form of incapacity allowances and widows' and dependent children's allowances.
The Annual Single Premium Scheme enables members to purchase a pension by making contributions of any amount as and when they like. At the end of each 12–monthly period the total contributions made during that period are applied towards the purchase of a pension from age 60 years. Only the first $1,000 of contributions in any twelve-monthly period attracts State subsidy while, as in the Level Premium Scheme, the subsidy is limited to the first $20 per week of pension purchased. There is a widow's benefit provided.
In both the schemes the contributor, when he reaches 60 years of age, may defer uplifting the pension (but to not later than age 65) and the pension ultimately payable increases 10 percent for each year of deferment. At the same time he may elect to contribute to a “Post-60 Scheme” and thus further increase the ultimate benefits.
When the pension becomes payable the following options are provided:
Both schemes—Up to one-quarter of the pension may be surrendered in exchange for a lump sum equivalent to nine times the amount of annual pension forgone.
Level Premium Scheme—The contributor may elect to receive a joint and survivorship pension with wife (husband). This means that the pension is immediately reduced but continues unchanged until the death of the surviving spouse.
Annual Single Premium Scheme—The contributor may elect to surrender portion of his pension to provide an additional amount for his widow or an annuity for an approved dependant.
Local Authorities Superannuation—There are uniform superannuation conditions for the employees of all local authorities in New Zealand, although slight variations are made to suit the special needs of particular groups, e.g., nurses and firemen. The schemes embrace the staff of quasi-government organisations, e.g., producer boards, but again there are special variations when required (e.g., aircrew of the National Airways Corporation and of Air New Zealand). The schemes also cover teachers in private schools.
The standard benefits and contributions are substantially the same as those for the Government Superannuation Fund (see section on that fund). As there is provision for transfer to and from the Government Superannuation Scheme the result is that State and local authority employees have a wide range of transfer without loss of accrued superannuation rights.
By inter-Government agreement the National Provident Fund salary/service scheme is also the vehicle for superannuation for the Western Samoa Public Service, the Western Samoa Trust Estates Corporation, and the Bank of Western Samoa.
Savings Superannuation Scheme for Farm Employees—This scheme, which is employer-subsidised, was prepared with the co-operation of the Federated Farmers of New Zealand and is designed to meet the special needs of farm employees who are accustomed to serve more than one employer during their working lifetime. The basis of the scheme is contributions by the employees matched by the employer. They are accumulated with interest and bonus (with the State guaranteeing a minimum return of 4 percent) and used to purchase an annuity on retirement (normally between 60 and 65 years of age). At this stage the employee may take a quarter of the proceeds in a lump sum, or up to the whole proceeds if the money is needed for housing purposes. The scheme includes a benefit for widows while, unlike other schemes within the Fund, a withdrawing contributor receives interest, at the rate of 3 percent, on his personal contributions as, they are refunded.
Investment Pool—Nearly 600 local authorities and other approved bodies are now paying money into the Fund for investment. Since the inauguration of the pool in 1955 the total amount invested in the Fund has been $438.4 million and the total amount withdrawn is $351.4 million, leaving a balance of $87 million invested in the Fund as at 31 March 1966. The following table shows the various terms for which the money is invested in the Fund and the different classes of local authorities supporting the pool as at 31 March 1966.
| Class of Local Authority | At Call | One Year and Under Two Years | Two Years and Under Three Years | Three Years and Under Five Years | Five Years and Over | Totals |
|---|---|---|---|---|---|---|
| $(000) | $(000) | $(000) | $(000) | $(000) | $(000) | |
| Cities and boroughs | 9,092 | 5,060 | 2,420 | 1,400 | 5,146 | 23,118 |
| Counties | 3,220 | 500 | 922 | 1,072 | 1,702 | 7,416 |
| Electric-power boards | 2,854 | 936 | 756 | 438 | 4,086 | 9,070 |
| Urban fire authorities | 278 | 2 | 30 | 34 | 82 | 426 |
| Harbour boards | 4,198 | 338 | 2,144 | 3,874 | 2,368 | 12,922 |
| Hospital boards | 3,576 | 2,866 | 4,866 | 28 | 3,750 | 15,086 |
| Sundry local authorities | 1,272 | 382 | 248 | 42 | 1,844 | 3,788 |
| Other approved bodies | 6,818 | 1,072 | 2,268 | 422 | 4,610 | 15,190 |
| Totals | 31,308 | 11,156 | 13,654 | 7,310 | 23,588 | 87,016 |
Nearly half of the pool is made up of money at call which cannot be expected to be retained by the Fund for very long and, as a result, a considerable portion must of necessity be invested in readily realisable short-term Government stocks. From the longer-term money has developed a “hard core” from which it has been possible for the Fund to augment substantially its normal investable income for lending to local authorities.
Investment of Funds—The following table shows the details of investment of all funds, i.e., including pool moneys.
| Class of Security | Investments at 31 March | ||
|---|---|---|---|
| 1964 | 1965 | 1966 | |
| $ (thousand) | |||
| Government stock | 77,689 | 85,148 | 76,844 |
| Local authority debentures | 74,253 | 82,806 | 88,008 |
| Mortgages | 1,547 | 1,441 | 1,453 |
| Company shares and debentures | 478 | 478 | 478 |
| Western Samoan Government stock | 100 | 100 | 100 |
| Totals | 154,067 | 169,973 | 166,883 |
Other Statistical Information—The numbers of contributors at 31 March 1966 were as follows.
| Fund | Males | Females | Total |
|---|---|---|---|
| Annual single premium | 10,623 | 1,252 | 11,875 |
| Level premium | 6,851 | 531 | 7,382 |
| Farm employees | 344 | 1 | 345 |
| Local authorities | 10,098 | 3,750 | 13,848 |
| Totals | 27,916 | 5,534 | 33,450 |
Summarised statistics are set out for the last three years.
| Item | Year Ended 31 March | ||
|---|---|---|---|
| 1964 | 1965 | 1966 | |
| New contributors | 7,560 | 4,932 | 6,252 |
| Total contributors at end of year | 29,480 | 31,112 | 33,450 |
| Pensioners and other beneficiaries | 6,151 | 6,433 | 6,701 |
| Income— | $(000) | $(000) | $(000) |
| Contributions | 5,150 | 5,288 | 5,928 |
| Interest | 3,153 | 4,332 | 4,394 |
| State subsidy | 1,100 | 1,256 | 1,358 |
| Transfer on account Western Samoa | 660 | 40 | .. |
| Total income (including State subsidy) | 10,063 | 10,916 | 11,680 |
| Outgo— | |||
| Pensions | 1,995 | 2,194 | 2,651 |
| Other benefits (includes capitalisation of retiring allowances) | 967 | 1,015 | 1,075 |
| Total outgo | 2,962 | 3,209 | 3,726 |
| Funds at end of year | 67,025 | 74,732 | 82,686 |
| Investment Pool at end of year | 90,705 | 98,244 | 87,016 |
| Effective percentage rate— | |||
| Interest on Fund | $5.64 | $5.70 | $4.78 |
| Pool profit | $0.96 | ||
THE legislation dealing with friendly societies is contained in the Friendly Societies Act 1909 and its amendments. Provision is made for the registration of all societies and branches with the Registrar of Friendly Societies, and also for the general superintendence by the Government of the administration of the funds of the societies.
LODGES AND MEMBERS—The table following gives the number of registrations (i.e., of friendly societies proper, or lodges, together with benevolent societies, working-men's clubs, etc., registered under the Act) and of lodge members as at 31 December of the years shown.
| Name of Order | Registrations | Lodge Members | ||||
|---|---|---|---|---|---|---|
| 1963 | 1964 | 1965 | 1963 | 1964 | 1965 | |
| * Membership figures relate to “actuarial” societies only. | ||||||
| Manchester Unity Independent Order of Oddfellows | 233 | 233 | 232 | 30,067 | 30,252 | 30,397 |
| Independent Order of Oddfellows | 182 | 181 | 179 | 6,690 | 6,524 | 6,555 |
| National Independent Order of Oddfellows | 1 | 1 | 1 | 39 | 36 | 34 |
| Ancient Order of Foresters | 123 | 110 | 107 | 9,477 | 9,244 | 9,124 |
| United Ancient Order of Druids | 136 | 136 | 136 | 12,627 | 12,306 | 12,134 |
| Independent Order of Rechabites | 43 | 43 | 43 | 2,349 | 2,294 | 2,248 |
| Order of Sons of Temperance | 6 | 6 | 6 | 342 | 331 | 328 |
| Sons and Daughters of Temperance | 1 | 1 | 1 | 60 | 56 | 55 |
| Hibernian-Australasian Catholic Benefit Society | 69 | 69 | 69 | 3,628 | 3,628 | 3,679 |
| Protestant Alliance Friendly Society of Australasia | 10 | 10 | 10 | 361 | 347 | 334 |
| Isolated friendly societies | 73 | 73 | 73 | 461* | 454* | 437* |
| Working-men's clubs | 27 | 27 | 28 | – | – | – |
| Specially authorised societies | 39 | 41 | 46 | – | – | – |
| Totals | 943 | 931 | 931 | 66,101 | 65,472 | 65,325 |
Annual returns of receipts, expenditure, etc., of lodges are required by law. For the year 1965 the Registrar of Friendly Societies received returns from 744 “actuarial” lodges, with an aggregate membership of 65,325 at the end of the year, as compared with 750 lodges and 65,472 members for 1964. During the year, 2,861 members were admitted by initiation, etc., and 485 by clearance; 1,338 died, 523 left by clearance, and 1,632 by arrears, etc.
The various benefits under the social security scheme, particularly medical and hospital benefits (see Section 6A), have no doubt had a considerable effect on the membership of friendly societies; the number of members is now less than half the figure for 1938.
The statistics given subsequently relate to the lodges (744 in 1965) for which returns were received and tabulated by the Treasury.
MORTALITY AND SICKNESS—In the following statement of the mortality experience for the last five years no account has been taken of age incidence.
| Year | Deaths of Members | Per 1,000 Members at Risk | Deaths of Members' Wives | Per 1,000 Members at Risk |
|---|---|---|---|---|
| 1961 | 1,301 | 19.76 | 306 | 4.65 |
| 1962 | 1,368 | 21.00 | 283 | 4.34 |
| 1963 | 1,359 | 20.62 | 300 | 4.55 |
| 1964 | 1,425 | 21.69 | 310 | 4.72 |
| 1965 | 1,338 | 20.62 | 302 | 4.66 |
The number of members sick during 1965 was 9,398, equal to 14.8 per 100 members at risk. The sickness experienced during 1965 was 247,265 weeks, equal to 26 weeks 2 days per sick member and 3 weeks 5 days for each member at risk.
FUNDS OF FRIENDLY SOCIETIES—The total funds of the societies and branches as at 31 December 1965 amounted to $25,580,010, made up as follows.
| Funds | Amount | Assets | Amount |
|---|---|---|---|
| $(000) | $(000) | ||
| Sick and funeral funds | 15,608 | Investments at interest | 21,454 |
| Surplus appropriation funds, etc. | 3,637 | Value of land and buildings | 3,929 |
| Management funds, goods, etc. | 2,026 | Cash not bearing interest | 40 |
| Distress, benevolent funds, etc. | 4,309 | Value of goods | 78 |
| Other assets | 55 | ||
| Owing by management funds | 24 | ||
| Total | 25,580 | Total | 25,580 |
The net income from investments credited to the sick and funeral funds for 1965 amounted to $891,656, the average rate being $11.83 percent, as against $11.68 in 1964.
There has been over many years a continuous increase in the amount of accumulated funds standing to the credit of friendly societies, the increase in the last 10 years amounting to $9,423,450, or 58 percent. The average capital per member has also appreciably increased, the gain in the last 10 years amounting to $164.89 (73 percent).
| Year | Total Funds | Average Capital per Member |
|---|---|---|
| $(000) | $ | |
| 1955 | 16,157 | 226.69 |
| 1956 | 17,024 | 241.01 |
| 1957 | 17,682 | 253.03 |
| 1958 | 18,280 | 265.08 |
| 1959 | 19,049 | 281.87 |
| 1960 | 19,980 | 301.14 |
| 1961 | 20,985 | 317.81 |
| 1962 | 21,964 | 330.62 |
| 1963 | 23,045 | 348.62 |
| 1964 | 23,759 | 362.88 |
| 1965 | 25,580 | 391.58 |
GENERAL—The strongly egalitarian temper of New Zealand society—a product of historical, geographical, and economic factors—is reflected in education administration by the policy of giving education at all levels to those who desire it. In few other countries is there closer approximation to equality of educational opportunity.
Education in New Zealand has its legal basis in the Education Act 1964. This Act, which consolidated the Education Act 1914 and its amendments, followed the pattern of that earlier Act which itself had been largely based on the original Education Act 1877. The Act provides for compulsory education, which is free and secular in State primary schools and, because of a liberal free place system, predominantly free in State secondary schools.
The original Education Act, which was mainly concerned with the provision of State primary education, created the Department of Education and prescribed the constitution and functions of education boards and school committees. As far as mere structure is concerned, this still remains the pattern of the system of State primary school administration, but there have been, in the intervening years, great changes in the relative function of the three types of authority. The general tendency over the first 50 years of the national system of education was for final power and responsibility to shift from the school committees to the education boards and from the education boards to the Department, but since 1930 this tendency has been arrested.
The Department controls the inspectorate and supervises the staffing of schools and all matters pertaining to curricula and conducts the School Certificate Examination. The Maori schools, the Correspondence School, the Technical Correspondence Institute, and several special schools are administered by the Department. It has official contacts with the University Grants Committee and the National Council of Adult Education, but the universities are independent in their educational activities. The Department distributes the funds voted annually for education by Parliament, and it administers the capital expenditure voted for educational building. There are regional offices of the Department in Auckland, Wellington, and Christchurch.
All schools, both at the primary and the secondary level, are regularly visited by inspectors, who give assistance and guidance to teachers in educational matters. They also assess teaching efficiency for grading purposes in State-controlled schools.
Education Boards and School Committees—There remains, however, a considerable amount of local and regional control. Statutory boards (i.e., education boards administering State primary schools other than Maori schools, and governing bodies of secondary schools) are responsible for the schools in their area. They are the employing authorities of the teachers. They disburse the grants received from the Department of Education for maintenance of schools and new building of schools, and for equipment and teaching materials. No local rates are levied for education either by municipal or local education authorities.
Each State primary school controlled by an education board has its school committee, elected by the parents of pupils and adults resident in the school district, which is a statutory body charged with management of property and other matters on behalf of the board. The members of the school committee form the electorate for electing the board members. The local boards controlling secondary schools (either singly, or several schools in the same town) are made up of representatives of the parents of pupils, of the education board of the district, and of other local groups and organisations.
Although the boards and the school committees have lost many of their original powers, they have not ceased to play an important part in the system. A school committee's primary function is the care of school buildings, grounds, and equipment, but, in addition to this, many interest themselves very keenly in the general activities of the school and provide, along with voluntary parent-teacher associations, a focusing point for local opinion on educational matters. In the primary field in particular, the education boards are still the initiating bodies on matters of buildings, sites, conveyance of pupils, consolidation, and provision of school life facilities generally, and, although the final word often lies with the Minister of Education or the Department, the boards have no small influence in the fixing of policy within their districts.
Trends and Problems—Among the main problems in education at present are those arising from the dramatic increase in the school population during the post-war years. At a time when smaller classes were being planned for, the intake of pupils became greater than ever before and this slowed up the move to reduce the size of classes. Such reduction, however, is still regarded as a major educational objective. The problem has been complicated by a general shortage of adolescent labour and there has been difficulty in training sufficient teachers to staff the schools.
Prominent among trends that have become discernible in recent years are the following: a more flexible school and class organisation; a fuller recognition of individual differences among children; study of subject-matter that has real meaning for children; free secondary education for all; and developments in the field of advanced technical education to meet needs arising from the expansion and diversification of industry.
THE COMMISSION ON EDUCATION IN NEW ZEALAND—A broadly representative, 11-member commission on New Zealand education, under the chairmanship of Sir George Currie, then Vice-Chancellor of the University of New Zealand, was set up by the Minister of Education in February 1960.
Under its terms of reference, the Commission was to consider the publicly controlled system of primary, secondary, and technical education in relation to the present and future needs of the country. It was also to consider the question of financial assistance to private schools.
The hearings were held in various centres and opportunity was taken by the Commission to visit teachers training colleges, schools, and educational institutions of all kinds. The official report of the Commission, which was submitted to the Minister of Education on 12 June 1962, contained a large number of recommendations for improvements in the national system of education, many of which have since been implemented. The Report of the Commission on Education in New Zealand can be purchased from the Government Printer.
THE EDUCATION SYSTEM—At the age of five years a child may enter, and at six years he must enter, either a State primary school or some other registered primary school, or, if living in an isolated area, must enrol with the primary department of the Education Department's Correspondence School. All State primary schools are coeducational. The child passes through the infant classes and Standards 1,2, 3, and 4. This normally takes six years. The remaining two years of the primary course will be taken either in Forms I and II at the same primary school or, if there is one conveniently situated, at an intermediate school. The intermediate school is a centrally situated school which pupils enter from the surrounding primary schools (called in these circumstances “contributing schools”) after they have completed the primary-school course as far as Standard 4. Because the intermediate school comprises a fairly large number of pupils (usually between 300 and 600) who are mainly between the ages of 11 and 13 years it is possible to classify them into groups of approximately equal ability, provide a good range of optional courses, and utilise specialist teachers and advanced equipment to the full. As at this point in his school career the pupil's social and intellectual interests have developed, he is ready to take full advantage of the varied and enriched courses provided.
On completing a course in Form II or on reaching the age of 14 by 31 March of the first year in which he attends a secondary school, the child becomes entitled to free secondary education until the end of the year in which he attains the age of 19 years. All children are required to attend school until they reach the age of 15 years. This means, in effect, that some period of secondary education is now compulsory for nearly all children. The only provision for exemption is inability to profit from the further period of education.
When a child leaves the primary stage he normally enters Form III of a secondary school. In some country areas a child enters the secondary department of a district high school. Since 1944 secondary schools have catered increasingly not only for “academic” pupils, but for those pupils as well who, after fulfilling the core requirements, specialise in the more practical subjects (technical, agricultural, domestic, commercial).
Maori children may attend any State primary school. Schools to meet special needs of Maori children have been provided by the Department of Education in some areas, but other children may, and do, attend these. For secondary education Maori children may go free to any State secondary schools or district high schools. Scholarships awarded by the Department of Education enable some Maori children from rural areas to attend secondary schools where boarding facilities are available. Of these, 11 are private church schools operated on a single-sex basis and providing full secondary courses. Some of them are partly financed out of public endowments originally provided for the purpose of Maori education.
School Certificates—The School Certificate Examination conducted by the Department of Education is now regarded as the accepted test of a completed secondary education for the great bulk of the pupils who do not desire to proceed to university. The School Certificate Examination is taken at the end of the third or fourth year of the secondary course. The subjects of the examination are English and either three or four other subjects from a wide range. A pupil may, however, on the recommendation of the school Principal, sit the examination in five subjects in addition to English. School Certificates are endorsed on satisfactory completion of an advanced course of instruction for one year.
Higher School Certificates are awarded after a five years' course to pupils who have been awarded a School Certificate and satisfactorily completed an advanced course of two years; and to pupils who have obtained a qualification recognised by the Universities Entrance Board for admission to a University in New Zealand and satisfactorily complete an advanced course of one year. A Higher School Certificate may also be awarded after a four years' course to pupils who have obtained a credit pass or better in the Entrance Scholarship Examination of the Universities Entrance Board or have obtained, in addition to a qualification recognised by the Universities Entrance Board for admission to a University in New Zealand, an A or B pass in the Universities Bursaries Examination conducted by the Universities Entrance Board.
Since 1961 a Certificate of Education has been awarded to candidates who, while not successful in qualifying for the School Certificate, have performed creditably in subjects of that examination. It is now awarded to those candidates who have gained not less than 50 percent of the possible marks in any subject. The certificate indicates the subjects in respect of which it is awarded and those subjects in which the candidate has gained 30 percent or more of the possible marks.
University Entrance—Prior to 1944 all pupils desiring to undertake a university course were required to sit and pass the University Entrance Examination conducted by the University of New Zealand. In 1944 a system of partial accrediting came into operation. Under this system pupils attending certain approved schools may be accredited for matriculation purposes provided they have completed a four years' secondary school course. The University Entrance Examination is now conducted by the Universities Entrance Board, and pupils not accredited for entrance to university may qualify by passing the examination. The standard of the present entrance examination is somewhat higher than that maintained prior to the introduction of the accrediting system.
Pupils who have been accredited for, or who have passed, a University Entrance Examination, may without further secondary education receive a fees bursary entitling them to tuition fees for a recognised course at a university. The term of a fees bursary is normally the minimum period in which a student pursuing a full-time course of study in each year could complete the recognised course taken under the bursary. Where pupils have obtained a Higher School Certificate, they may receive a fees and allowances bursary. Also, a person who has obtained passes in three units of a course for a degree of bachelor of arts or of bachelor of science, or equivalent passes in some other recognised course, may receive a fees and allowances bursary. A fees and allowances bursary is tenable for any recognised course at a university provided that the student pursues a full-time course of study during each year of the bursary. The term of a fees and allowances bursary is similar to that of a fees bursary. Students who complete a bachelor's degree in not more than one year in excess of the minimum period in which that degree may be completed by a student taking a full-time course each year are eligible for the award of a master's bursary. Further details of bursaries are set out later.
Universities—There are universities at Auckland, Hamilton, Palmerston North, Wellington, Christchurch, and Dunedin. The State supports the universities and acts through the University Grants Committee.
Between 10 and 12 percent of pupils leaving secondary school matriculate at the universities, but less than half of the number obtain a bachelor's degree between three and five years later. This pass rate is partly explained by the fact that only three-fifths of the university students are attending full time. The pressure on the universities to cater for part-time students has been partly a result of the national urge for equality of opportunity in education, but there is more full-time study today than in the past as a result of moves to encourage a greater proportion of full-time students, a course which was recommended by the Committee on New Zealand Universities, chaired by Sir David Hughes Parry, in 1959. The Committee estimated that the New Zealand universities would probably be producing about 2,000 persons with bachelors' degrees in 1965, and about 2,600 in 1970, but was certain that graduates in excess of these numbers would be required by the New Zealand community. It has been estimated that the number of students attending lectures in 1965 (20,344) may be doubled by 1980, and this is presenting the University Grants Committee with a major problem in the forward planning of a big and complex programme of buildings. University buildings in use in 1965 had an area of 2 million square feet, and estimated requirements for 1980 are 8 million square feet of teaching, library, administration, and student union space.
Special Groups—The State system also caters for the needs of certain special groups. Children living in isolated areas or prevented in other ways from attending school may be enrolled in the Correspondence School for both primary and secondary work.
For children with various types of handicap there are provided numerous special educational services. The mentally backward are grouped in 140 special classes attached to ordinary schools throughout the country and in two residential special schools. For children who are extremely backward mentally there are 27 occupation centres in the main cities, and full-time or part-time occupation groups in 10 smaller towns. Two residential schools cater for the needs of the deaf and those partially deaf children who cannot profit from teaching in an ordinary primary school. In addition, 10 classes for severely deaf and two for partially deaf children are attached to ordinary schools. A national diagnostic and guidance service organised in association with the two schools for the deaf gives assistance to deaf babies and infants and their parents and advises teachers in ordinary schools who have children with a hearing loss in their classes. Children with speech defects attend regularly one of 86 speech clinics. In six of the largest cities there are 13 remedial clinics to assist children suffering from serious educational retardation (mainly in reading). Twelve reading advisers assist teachers in ordinary schools in coping with backward readers. Two classes cater for partially sighted children in Wellington and Dunedin, and there has recently been established a resource centre for blind and partially sighted children in Christchurch. Homai College, a residential school for blind children operated by the New Zealand Foundation for the Blind, is situated in Auckland, and caters for 138 blind children. Six schools have been organised as separate units for cerebralpalsied children. Where a sufficient number of children in hospital justifies it, teachers are made available to conduct hospital classes which are attached to a local school. There are 34 classes of this type. There are five classes for physically handicapped or delicate children. Children who are admitted to one or other of the seven health camps for a period of six to 10 weeks attend the school associated with each health camp. There are six day classes for maladjusted children, and the Department of Education operates a residential school for severely disturbed children. Other special schools and homes which take care of children with the most serious and deep-seated problems of maladjustment or delinquency, the schools for the deaf, and the two special schools for the mentally backward, are administered for the Department by the Child Welfare Division which, in educational matters, is under the control of the Minister of Education. All other special classes and centres are controlled by the education boards. The boards also employ 34 visiting teachers whose task it is to help children whose progress at school is causing concern, by acting as a link between the school, the home, and the community. The psychological service of the Department of Education is established in 17 centres. It comprises 45 psychologists, who offer a comprehensive diagnostic and guidance service, and 15 organisers of special classes for mentally backward pupils. The Department provides education officers for special classes conducted by the Department of Justice in prisons for prisoners whose basic education is of a low standard.
* Except for Maori scholarship holders in the denominational secondary schools.
Private Schools—In addition to the various State schools described, a parent may send his child to a private school, either primary or secondary, conducted by either religious bodies or private individuals. No Government free place is tenable at these schools,* but an academic bursary or a secondary school bursary (referred to later) may be tenable at a private school, while assistance for transport by rail and road and a boarding allowance under certain conditions may also be given to pupils attending private schools, whether primary or secondary. All private schools must be registered, and are subject to regular inspection by the Department's inspectors. The majority of the private schools are conducted by the Roman Catholic Church. Amongst the private schools are two endowed secondary schools modelled after the English public school.
Coeducation—Coeducation applies at all stages of the school system. All State primary schools and some private primary schools teach boys and girls together. At the secondary level all district high schools and three-quarters of the State secondary schools have both boys and girls on their rolls, whilst the remaining quarter of the State secondary schools and nearly all of the private secondary schools are single-sex schools. A comparison of the total enrolment of all secondary schools (State as well as private) shows that the ratio of pupils in single-sex to coeducational schools has changed from 51 to 49 in 1935 to 40 to 60 in 1965.
Pre-school Education—Children below the age of five years are not enrolled in the State primary schools. They may be enrolled, however, at free kindergartens controlled by local free kindergarten associations which are voluntary bodies formed for the purpose, or at play centres controlled by play centre associations.
Since 1942 the Government has made grants available to kindergarten students in training, and in 1949 accepted responsibility for the cost of sites and buildings for training centres. The salaries of kindergarten teachers and full-time training centre staff have, since 1948, been paid by the Department of Education, and grants are available towards the fees of part-time lecturers in the training centres. Subsidies of $2 for $1 on voluntary contributions raised for the purchase of land, buildings, and initial equipment for free kindergartens are paid by the Government. In July 1965 there were 18,828 children enrolled at 243 free kindergartens.
Play centre associations receive from the Government a small annual maintenance grant in respect of play centres which meet a required standard of equipment, and a small establishment grant towards initial costs is paid to new centres. In July 1965 there were 299 recognised play centres for 8,950 children.
PUBLIC EXPENDITURE ON EDUCATION—The following table shows the expenditure (after recoveries have been deducted) from public funds on each branch or service of education for the latest four years.
| Item | Expenditure Year Ended 31 March | |||
|---|---|---|---|---|
| 1963 | 1964 | 1965 | 1966 | |
| * Includes senior technical education. | ||||
| $(000) | ||||
| Expenditure on education— | ||||
| General | 8,134 | 8,352 | 8,657 | 8,978 |
| Buildings, land, furniture, and equipment | 24,780 | 27,309 | 31,810 | 33,341 |
| Primary education | 30,865 | 34,104 | 37,990 | 41,801 |
| Secondary education | 19,516* | 21,926* | 23,185 | 24,506 |
| Senior technical education | .. | .. | 1,957 | 3,081 |
| Higher education | 7,737 | 8,777 | 11,146 | 13,497 |
| Training of teachers | 5,892 | 6,717 | 7,388 | 8,062 |
| Maori schools | 1,189 | 1,215 | 1,213 | 1,212 |
| Education of the blind | 408 | 507 | 472 | 371 |
| Special schools | 498 | 534 | 585 | 614 |
| Child welfare | 2,037 | 2,254 | 2,533 | 2,741 |
| Miscellaneous grants | 965 | 1,047 | 1,121 | 1,295 |
| National Library Service | 810 | 833 | 933 | 1,010 |
| Totals | 102,831 | 113,575 | 128,990 | 140,509 |
The foregoing figures do not include revenue received by universities from endowments, fees, etc., which are available for educational purposes.
The following figures show Government expenditure on education during the latest 12 years.
| Year Ended 31 March | Expenditure from Public Funds | Expenditure as Percentage of National Income | Expenditure per Head of Mean Population |
|---|---|---|---|
| * Provisional. | |||
| $(000) | percent | $ | |
| 1955 | 50,818 | 3.2 | 24.13 |
| 1956 | 57,038 | 3.4 | 26.53 |
| 1957 | 63,272 | 3.6 | 28.84 |
| 1958 | 68,072 | 3.7 | 30.30 |
| 1959 | 71,858 | 3.7 | 31.26 |
| 1960 | 78,336 | 3.7 | 33.40 |
| 1961 | 87,106 | 3.9 | 36.47 |
| 1962 | 93,658 | 4.0 | 38.34 |
| 1963 | 102,832 | 4.1 | 41.09 |
| 1964 | 113,574 | 4.1 | 44.54 |
| 1965 | 128,988 | 4.3 | 49.59 |
| 1966 | 140,509 | 4.3* | 53.08 |
EDUCATION BUILDINGS—The increases in school population have led to an expansion of the school building programme. Figures for additional classrooms completed in recent years are shown below. The figures do not include classrooms replacing obsolete accommodation.
| Primary | Secondary | |
|---|---|---|
| 1960 | 423 | 463 |
| 1961 | 388 | 357 |
| 1962 | 602 | 457 |
| 1963 | 623 | 363 |
| 1964 | 472 | 326 |
| 1965 | 459 | 231 |
An important step in the building of new schools was the use of standard plans for both primary and secondary schools. In 1951 a Dominion Basic Plan for primary schools was introduced, while, in the secondary field, three standard designs were evolved; and a number of new schools were built to each of these plans over the period 1953 to 1956.
The year 1955 saw the application in New Zealand of the “block” principle in the planning of schools, giving improved teaching facilities and amenities at a lower cost. The first primary schools planned on the “block” principle opened in 1955, and the first secondary school in 1957. These planning principles are now being developed further in two-storeyed secondary schools.
Education boards are able to plan and build primary schools within specified limits or “white lines” defined on the one hand by a building code which lays down minimum requirements for each type of building, and on the other by the upper limit placed by the Government on the amount of money which it is prepared to allocate to any particular project.
SCHOLARS AND STUDENTS—The numbers of scholars and students receiving instruction in educational institutions are shown in the following summary. The table refers to roll numbers at 1 July.
| Class of Institution | 1961 | 1962 | 1963 | 1964 | 1965 |
|---|---|---|---|---|---|
| * Prior to 1963, technical schools providing advanced technical instruction. | |||||
| Preschool Education | |||||
| Play centres | 4,356 | 4,979 | 5,779 | 6,610 | 8,950 |
| Kindergartens | 15,517 | 16,625 | 18,024 | 18,180 | 18,829 |
| Totals, pre-school | 19,873 | 21,604 | 23,803 | 24,790 | 27,779 |
| Primary Education | |||||
| State primary schools | 328,404 | 332,086 | 338,525 | 346,908 | 356,069 |
| Maori (primary) schools | 12,663 | 11,937 | 11,112 | 10,324 | 9,613 |
| Intermediate schools and departments | 33,164 | 33,895 | 36,394 | 40,005 | 42,216 |
| Chatham Islands schools | 125 | 125 | 137 | 117 | 119 |
| Correspondence classes | 1,038 | 1,046 | 964 | 959 | 959 |
| Registered private primary schools | 54,079 | 55,293 | 56,341 | 57,154 | 57,244 |
| Departmental special schools | 440 | 403 | 435 | 427 | 564 |
| New Zealand Foundation for the Blind | 81 | 86 | 90 | 92 | 95 |
| Special classes | 1,599 | 5,781 | 5,902 | 6,384 | 6,906 |
| Totals, primary | 431,593 | 440,652 | 449,900 | 462,370 | 473,785 |
| Secondary Education | |||||
| State secondary schools | 100,797 | 110,059 | 117,525 | 121,573 | 125,569 |
| Secondary departments of district high schools | 8,834 | 8,464 | 7,453 | 7,136 | 6,525 |
| Correspondence classes | 532 | 505 | 482 | 493 | 466 |
| Registered private secondary schools | 20,752 | 22,290 | 23,603 | 24,439 | 25,073 |
| Totals, secondary | 130,915 | 141,318 | 149,063 | 153,641 | 157,633 |
| Technical Education | |||||
| Technical institutes*— | |||||
| (a) Part-time students | 8,335 | 11,855 | 12,238 | 12,915 | 12,011 |
| (b) Full-time students | 390 | 573 | 731 | 872 | 985 |
| Technical Correspondence Institute | 5,861 | 6,678 | 7,710 | 9,066 | 11,257 |
| Secondary schools— | |||||
| Part-time students | 43,444 | 44,620 | 48,910 | 51,000 | 56,403 |
| Agricultural colleges— | |||||
| Short courses | 591 | 551 | 391 | 622 | 390 |
| Totals, technical | 58,621 | 64,277 | 69,980 | 74,475 | 81,046 |
| Higher Education | |||||
| University institutions | 16,529 | 17,214 | 18,303 | 19,640 | 22,154 |
| Totals, scholars and students | 657,531 | 685,065 | 711,049 | 734,916 | 762,397 |
The preceding table reveals the marked enrolment increases of between 20,000 and 30,000 in each of the last five years. In the period between 1955 and 1965 the total increase in primary and secondary enrolments was 178,000 full-time pupils, and the number of part-time students at day and night classes increased by 36,000 in those 10 years. This development led in turn to proportionate increases in the recruitment of teachers and in the provision of classrooms, of teaching equipment, and other facilities such as school transport.
Births in recent years have been double the number in pre-war years, and the number of pupils and students at all educational institutions has increased from 192 per 1,000 population in 1936 to 290 per 1,000 population in 1965. A second factor, accentuating the rate of expansion in the secondary school sector, was the gradual increase in the number of students staying at school beyond the age of 15 years, and leaving school from a higher form. The effect of this second movement has been that the number of candidates for the School Certificate Examination in 1965 was four times the number in 1949.
The wave effect resulting from the large number of post-war births has spread through primary and secondary schools and is now straining university institutions. Projections of school and university enrolment as far as 1972 were published in a statement by the Minister of Education (E. 2, 1959), which sets out in some detail the assumptions on which the projections were based.
The growth of the school population is illustrated by the diagram below, which is drawn on logarithmic scale.
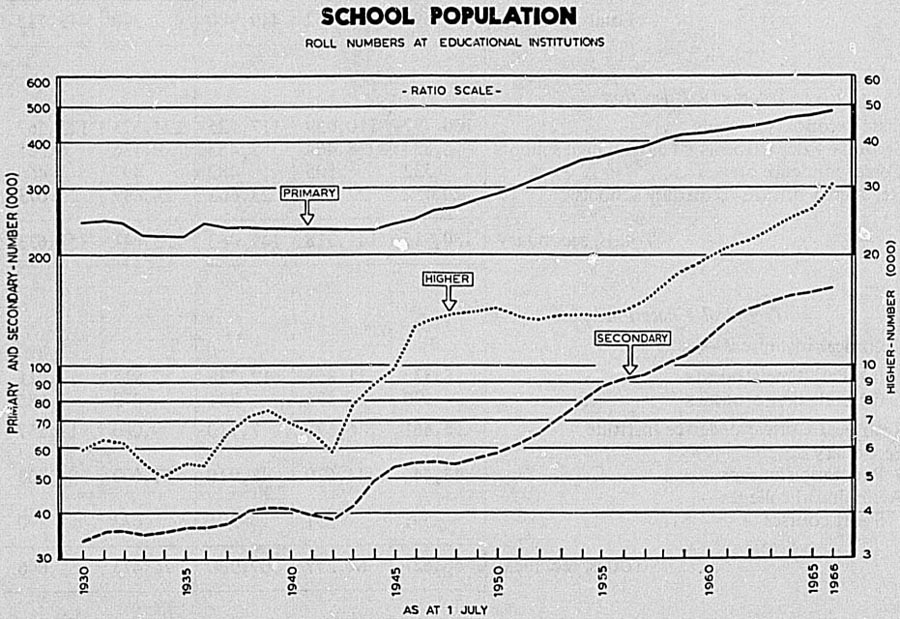
SCHOOL POPULATION
ROLL NUMBERS AT EDUCATIONAL INSTITUTIONS
The total numbers of school leavers have increased from an estimated 26,000 in 1951 to 39,631 in 1962; in 1965 more than 46,000 pupils left school, and over 50,000 are expected to leave in 1970.
ANNUAL EXAMINATIONS—The numbers of candidates who actually presented themselves for the various examinations conducted by the Department of Education and also by the Trades Certification Board during the latest five years are given below.
| Examination | 1961 | 1962 | 1963 | 1964 | 1965 |
|---|---|---|---|---|---|
| Teacher's Certificate | 352 | 361 | 417 | 457 | 387 |
| School Certificate | 24,938 | 30,692 | 34,606 | 35,854 | 37,980 |
| Technological | 103 | 114 | 106 | 111 | 138 |
| Samoan Public Service | 528 | 480 | 457 | 498 | 57 |
| Engineers' and Surveyors' Assistants | 32 | 52 | 45 | 67 | 89 |
| New Zealand Certificate in Engineering | 413 | 532 | 846 | 1,061 | 1,533 |
| Technical Teacher's Certificate | 133 | 119 | 123 | 137 | 52 |
| Diploma in Teaching | – | 249 | 314 | 428 | 516 |
| Totals | 26,499 | 32,599 | 36,914 | 38,613 | 40,752 |
| Trades Certification | 8,628 | 10,016 | 11,059 | 12,386 | 13,410 |
Of the candidates in 1965 for School Certificate, 19,003 or 50.8 percent, gained a pass, while 114 persons were awarded Certificates of Attainment.
Comparative figures for the number of candidates for the University Entrance Examination and the number of passes by accrediting and by examination are given in the following table.
| Year | Candidates | Passes | |
|---|---|---|---|
| Accredited | By Examination | ||
| 1960 | 8,112 | 4,362 | 777 |
| 1961 | 8,649 | 4,670 | 818 |
| 1962 | 9,583 | 5,150 | 880 |
| 1963 | 11,957 | 6,427 | 862 |
| 1964 | 13,445 | 6,984 | 873 |
| 1965 | 14,555 | 7,246 | 1,317 |
The universities conducted examinations in 1965 in the faculties of arts, science, medicine, dentistry, home science, law, engineering, commerce, agriculture, music, architecture, and divinity; for diplomas in journalism, in fine arts, in banking, in social science, and in physical education; and for admission to the legal and accountancy professions. There were 22,145 entrants for the degree and professional examinations in 1965 compared with 21,576 in 1964.
PRIMARY SCHOOLS—The primary school system at the end of 1965 consisted of 2,254 State primary schools (of which 128 were Maori schools), 339 registered private primary schools (including eight Maori private church schools), and two lower departments of secondary schools.
Lower departments of secondary schools may be run for pupils who have not passed Form II, provided that no part of the cost of instruction or of the maintenance of the department is met from public moneys. At the end of 1965 the total number of pupils in the two departments of secondary schools was 74 with two teachers.
The curriculum of the primary school, as set out in the syllabus of instruction, includes character training, English, arithmetic, geography and history, arts and crafts (including needlework), nature study, physical education (including swimming), health education, and music. Teachers are advised on the teaching of nature study, physical education, arts and crafts, reading, and music by itinerant specialists. Itinerant specialists are also available to teachers in small rural schools and teachers of infant classes. At the Forms I and II levels woodwork and metalwork instruction is given to boys at manual-training centres, and girls are taught domestic subjects, including cookery and hygiene.
The syllabus as a whole has been revised in recent years. Textbooks are issued free to pupils in all schools, both State and private. A series of basic primer readers and a considerable amount of equipment for primer classes are also provided by the Government.
State Primary Schools—The figures set out in the following table refer to all pupils in State primary schools and intermediate schools and departments. Pupils in secondary departments of district high schools are not included.
| Year | Schools (Including Intermediate Schools and Departments) | Pupils at End of Year | Pupils for First Four Weeks of Third Term | ||
|---|---|---|---|---|---|
| Average of Mean Weekly Roll | Average Attendance | Average Attendance as Percentage of Weekly Roll | |||
* Excludes Chatham Islands and Maori schools. † Average roll and average attendance figures for the school year. | |||||
| 1960 | 2,028 | 378,927* | 359,580† | 335,885† | 93.4† |
| 1961 | 2,057 | 403,028 | 393,270 | 365,473 | 92.9 |
| 1962 | 2,062 | 407,482 | 395,917 | 370,209 | 93.5 |
| 1963 | 2,076 | 416,371 | 406,535 | 380,007 | 93.5 |
| 1964 | 2,108 | 429,449 | 417,850 | 389,479 | 93.2 |
| 1965 | 2,126 | 441,541 | 429,268 | 400,763 | 93.4 |
While the number of schools has not increased greatly, mainly owing to the consolidation of small rural schools, the total rolls have increased by 120,136 since 1955. The changes which have taken place in the size of schools may be seen from the following table.
| Number of Public Schools | 1955 | 1965 | Increase (+) or Decrease (-) |
|---|---|---|---|
| Roll 70 and under | 996 | 848 | -148 |
| Roll 71 to 350 | 604 | 705 | +101 |
| Roll 351 and over | 338 | 541 | +203 |
| Totals | 1,938 | 2,094 | +156 |
NOTE: In addition there were four State primary schools in the Chatham Islands and 32 Special schools for handicapped children.
In each of the education districts are located inspectors of primary schools who form part of the staff of the Department of Education. The total number of primary-school inspectors at 31 March 1966 was 88, allocated as follows: Auckland, 20; South Auckland, 13; Hawke's Bay, 7; Taranaki, 4; Wanganui, 7; Wellington, 10; Nelson, 3; Canterbury, 13; Otago, 6; Southland, 5. In addition there are four inspectors in the Head Office of the Department, and one inspector in the Auckland office of the Department.
The following table relates to pupils on the rolls of the State primary schools other than Maori schools, Chatham Islands schools, and Forms I and II only of intermediate schools at 1 July in each of the years shown.
| Age in Years | 1963: Total Pupils | 1964: Total Pupils | 1965 | Percentage of Total Pupils | ||||
|---|---|---|---|---|---|---|---|---|
| Boys | Girls | Total | 1963 | 1964 | 1965 | |||
| 5 | 48,812 | 52,502 | 27,456 | 26,000 | 53,456 | 12.8 | 13.4 | 13.2 |
| 6 | 48,328 | 49,968 | 27,428 | 26,005 | 53,433 | 12.7 | 12.7 | 13.2 |
| 7 | 47,389 | 48,700 | 25,854 | 24,602 | 50,456 | 12.5 | 12.4 | 12.4 |
| 8 | 46,228 | 48,015 | 25,214 | 23,839 | 49,053 | 12.2 | 12.2 | 12.1 |
| 9 | 45,194 | 46,261 | 24,691 | 23,204 | 47,895 | 11.9 | 11.8 | 11.8 |
| 10 | 43,040 | 45,382 | 23,945 | 22,786 | 46,731 | 11.3 | 11.5 | 11.5 |
| 11 | 43,100 | 43,220 | 23,250 | 21,946 | 45,196 | 11.3 | 11.0 | 11.2 |
| 12 | 40,733 | 42,081 | 21,726 | 20,367 | 42,093 | 10.7 | 10.7 | 10.4 |
| 13 | 15,584 | 15,302 | 9,058 | 6,159 | 15,217 | 4.1 | 3.9 | 3.8 |
| 14 | 1,730 | 1,645 | 955 | 529 | 1,484 | 0.5 | 0.4 | 0.4 |
| 15 | 193 | 191 | 76 | 60 | 136 | – | – | – |
| 16 and over | 139 | 147 | 88 | 72 | 160 | – | – | – |
| Totals | 380,470 | 393,414 | 209,741 | 195,569 | 405,310 | 100.0 | 100.0 | 100.0 |
The next table gives the number of State primary schools other than Maori schools in each education district as at 30 September 1965, classified according to roll numbers. The number of intermediate schools and departments is also shown.
| Roll Number | Education District | Total Number of Schools | |||||||||
|---|---|---|---|---|---|---|---|---|---|---|---|
| Auckland | South Auckland | Taranaki | Wanganui | Hawke's Bay | Wellington | Nelson | Canterbury | Otago | Southland | ||
| * Includes one normal intermediate school. | |||||||||||
| 1–8 | – | – | – | – | – | 5 | – | 5 | – | – | 10 |
| 9–24 | 20 | 20 | 17 | 26 | 34 | 39 | 11 | 49 | 17 | 21 | 254 |
| 25– 30 | 5 | 8 | 5 | 11 | 7 | 3 | 6 | 15 | 8 | 7 | 75 |
| 31–70 | 61 | 74 | 43 | 39 | 46 | 35 | 15 | 95 | 50 | 51 | 509 |
| 71–110 | 40 | 51 | 10 | 18 | 20 | 23 | 8 | 23 | 11 | 15 | 219 |
| 111–150 | 21 | 29 | 10 | 8 | 12 | 16 | 2 | 16 | 12 | 4 | 130 |
| 151–190 | 15 | 26 | 7 | 6 | 6 | 7 | 5 | 12 | 9 | 7 | 100 |
| 191–230 | 19 | 9 | 2 | 4 | 4 | 8 | – | 8 | 8 | 8 | 70 |
| 231–270 | 10 | 10 | 4 | 4 | 5 | 10 | 3 | 10 | 7 | 3 | 66 |
| 271–310 | 8 | 9 | 5 | 2 | 5 | 12 | 3 | 8 | 7 | 1 | 60 |
| 311–350 | 16 | 11 | 1 | 3 | 3 | 6 | 2 | 7 | 8 | 3 | 60 |
| 351–390 | 21 | 19 | 3 | 2 | 9 | 17 | 2 | 10 | 11 | 2 | 96 |
| 391–430 | 14 | 5 | 5 | 3 | 4 | 7 | 2 | 10 | 6 | 3 | 59 |
| 431–470 | 28 | 13 | 3 | 4 | 7 | 6 | 2 | 5 | 3 | 3 | 74 |
| 471–510 | 15 | 16 | 2 | 5 | 7 | 9 | 4 | 9 | 2 | 2 | 71 |
| 511–550 | 14 | 5 | – | 3 | 4 | 7 | – | 9 | 2 | 3 | 47 |
| 551–590 | 10 | 7 | 1 | 3 | 2 | 6 | – | 6 | 1 | 1 | 37 |
| 591–630 | 10 | 5 | – | 3 | 1 | 4 | – | 6 | – | – | 29 |
| 631–670 | 2 | 2 | – | 3 | – | – | – | 3 | – | – | 10 |
| 671–710 | 3 | 1 | – | 1 | – | 4 | – | 1 | – | – | 10 |
| 711–750 | 1 | 1 | – | – | – | – | – | 2 | – | – | 4 |
| 751–790 | 2 | 1 | – | – | – | 1 | – | 3 | – | – | 7 |
| 791–830 | – | – | – | – | – | 3 | – | 2 | – | – | 5 |
| 831–870 | – | – | – | – | – | – | – | – | – | – | – |
| 871–910 | – | – | – | – | – | – | – | – | – | – | – |
| 911–950 | – | – | – | – | – | 1 | – | – | – | – | 1 |
| 951–990 | – | 1 | – | – | – | – | – | – | – | – | 1 |
| 991–1,030 | – | – | – | – | – | 1 | – | – | – | – | 1 |
| Normal schools | 2 | 1 | – | 1 | – | 2 | – | 1 | 1 | – | 8 |
| Intermediate schools and departments | 29* | 13* | 4 | 6* | 6 | 7 | 2 | 6* | 5* | 3 | 81 |
| Totals | 366 | 337 | 122 | 155 | 182 | 239 | 67 | 321 | 168 | 137 | 2,094 |
In addition there were four State primary schools in the Chatham Islands and 32 special schools for handicapped children.
Primary Schools for Maoris—Some 78.4 percent of the Maori children in New Zealand are educated in State primary schools controlled by education boards, 16.2 percent at Maori schools, and 5.4 percent at registered private schools (including those at Maori private schools). At 1 July 1965, there were 42,224 attending State primary schools controlled by education boards out of a total of 53,876 Maori children receiving primary education in New Zealand. The long-term policy, endorsed by representatives of the Maori people themselves, is gradually to transfer the Maori schools now directly under the Department of Education to the control of the local education boards. However, transfers will take place only after full consultations with the local Maori people.
The language of instruction in the Maori schools is English, but the schools are not completely English in outlook, for Maori arts and crafts, songs, legend, and history are taught.
Methods of teaching are practical, and objectives closely related to the special needs of the Maori people. In many of the Maori schools, such equipment as woodwork rooms, cookery rooms, model cottages, baths, hot and cold showers, and laundries are supplied. Health education is featured in every Maori school.
The number of pupils on the rolls of the 128 Maori schools at 1 July 1965 was 9,613 (including 859 European children).
In addition, 2,898 Maori children were on the rolls of registered private primary schools.
The following table gives the principal statistics of Maori schools during the latest five years.
| Year | Number of Schools at end of Year | Roll at 1 July | Average Attendance* | Average Attendance as Percentage of Weekly Roll* | Number of Teachers† | ||
|---|---|---|---|---|---|---|---|
| Maori | European | Males | Females | ||||
* Average roll and attendance figures for first four weeks of third term. † Includes junior assistants (78 females in 1965) | |||||||
| 1961 | 154 | 11,606 | 1,057 | 11,171 | 88.9 | 234 | 312 |
| 1962 | 150 | 10,953 | 984 | 11,405 | 95.1 | 227 | 289 |
| 1963 | 142 | 10,182 | 930 | 10,166 | 90.7 | 210 | 271 |
| 1964 | 135 | 9,477 | 847 | 9,619 | 91.3 | 201 | 250 |
| 1965 | 128 | 8,754 | 859 | 8,678 | 90.0 | 193 | 235 |
Four inspectors of schools attached to the Department of Education are engaged in the inspection of Maori schools, Maori private church schools, and secondary schools for Maoris.
Intermediate Schools—Pupils on the rolls of the 78 intermediate schools and 3 intermediate departments at the end of 1965 numbered 42,117. The progress that is being made with the establishment of this type of school may be gauged from the fact that 25 years earlier (1940) the number of pupils was 5,450. Of all children in Forms I and II of State primary schools at 1 July 1965, 47.4 percent were enrolled at the intermediate schools. The ages of pupils on the roll at 1 July of each of the latest three years were as follows.
| Age, in Years | 1963 | 1964 | 1965 | ||||||
|---|---|---|---|---|---|---|---|---|---|
| Boys | Girls | Total | Boys | Girls | Total | Boys | Girls | Total | |
| 10 | 160 | 234 | 394 | 211 | 271 | 482 | 225 | 364 | 589 |
| 11 | 5,881 | 6,313 | 12,194 | 6,384 | 6,855 | 13,239 | 6,813 | 7,666 | 14,479 |
| 12 | 8,606 | 7,950 | 16,556 | 9,640 | 8,915 | 18,555 | 9,974 | 9,256 | 19,230 |
| 13 | 3,804 | 2,639 | 6,443 | 4,099 | 2,791 | 6,890 | 4,258 | 2,899 | 7,157 |
| 14 | 449 | 272 | 721 | 471 | 267 | 738 | 452 | 240 | 692 |
| 15 | 47 | 29 | 76 | 54 | 33 | 87 | 32 | 26 | 58 |
| 16 and over | 8 | 2 | 10 | 7 | 7 | 14 | 5 | 6 | 11 |
| Totals | 18,955 | 17,439 | 36,394 | 20,866 | 19,139 | 40,005 | 21,759 | 20,457 | 42,216 |
The average roll at September 1965 was 41,977 and the average attendance for the same period was 39,852.
Private Schools—No private school may be established unless application is first made to the Department of Education for registration. Certain standards of efficiency and suitability of staff, premises, equipment, and curriculum have to be fulfilled as a condition of registration. In general, the instruction afforded must be as efficient as in a State school of the same class.
The following table contains the principal statistics of private primary schools for each of the last five years. The figures include Maori private church schools.
| Year | Number of Schools | Roll at End of Year | Average Attendance* | Teachers | ||||
|---|---|---|---|---|---|---|---|---|
| Boys | Girls | Total | Males | Females | Total | |||
| * Average attendance as at September. | ||||||||
| 1961 | 336 | 27,728 | 27,815 | 55,543 | 51,370 | 200 | 1,280 | 1,480 |
| 1962 | 339 | 28,245 | 28,581 | 56,826 | 53,027 | 208 | 1,312 | 1,520 |
| 1963 | 337 | 28,854 | 29,104 | 57,958 | 54,477 | 214 | 1,353 | 1,567 |
| 1964 | 341 | 29,093 | 29,478 | 58,571 | 55,148 | 217 | 1,386 | 1,603 |
| 1965 | 340 | 28,967 | 29,232 | 58,199 | 55,172 | 222 | .1,432 | 1,654 |
The majority of the schools included in the preceding table are Roman Catholic Church schools, of which there were 273 at the end of 1965 with 50,607 pupils and 1,347 teachers (112 males and 1,235 females). The remaining private schools comprised 55 church schools of other denominations with 253 teachers and 6,392 pupils, and 12 undenominational schools with 54 teachers and 1,200 pupils.
SECONDARY SCHOOLS—Every child completing the work of Form II or attaining the age of 14 years by 31 March of the year of entry to secondary school becomes entitled to free secondary education. Extension of a free place beyond the age of 19 years is allowable in special cases approved by the Director-General of Education. The secondary syllabus is based on a common core, consisting of English, social studies, general science, elementary mathematics, music, arts and crafts, and physical education, to be followed by a degree of specialisation within a wide range of subjects that may be taken to the School Certificate stage. All types of secondary schools are required to give to all pupils during the first two years of their secondary course a minimum number of units of instruction in the common core subjects.
Secondary schools are either public (State) or private. The following table shows the number of secondary schools in existence during each of the latest five years.
| Year | State Secondary Schools | Secondary Departments of District High Schools | Private Secondary Schools | Total |
|---|---|---|---|---|
| 1961 | 160 | 95 | 110 | 365 |
| 1962 | 169 | 92 | 110 | 371 |
| 1963 | 180 | 84 | 113 | 377 |
| 1964 | 182 | 82 | 114 | 378 |
| 1965 | 186 | 78 | 112 | 376 |
District high schools are State primary schools with a secondary “top” and the basic course is academic, as in the normal secondary school. Where staffing and equipment allow, special courses are provided in agriculture, commercial work, and domestic science. Most State secondary schools are established under their own controlling authority, and district high schools are controlled by the education boards. Where a secondary school is established in place of a secondary department of a district high school, the education board of the district will usually control the new school for the first few years. Thereafter, the school will be placed under its own board.
The inspection of secondary schools is carried out by inspectors of secondary schools attached to the Department of Education. In 1966 there were 57 inspectors.
The number of pupils at the end of each of the latest five years is shown in the following table. No account is taken of lower departments of secondary schools, and in the case of district high schools only the secondary departments are included.
| Year | State Secondary Schools | District High Schools | Private Secondary Schools | Correspondence Schools | Total |
|---|---|---|---|---|---|
| 1961 | 95,076 | 7,931 | 20,223 | 439 | 123,669 |
| 1962 | 103,498 | 7,733 | 21,758 | 469 | 133,458 |
| 1963 | 110,546 | 6,744 | 23,045 | 431 | 140,766 |
| 1964 | 113,943 | 6,485 | 23,864 | 452 | 144,744 |
| 1965 | 117,873 | 5,937 | 24,486 | 419 | 148,715 |
The foregoing table does not include part-time students attending technical classes (66,641 in July 1965), students receiving part-time tuition from the Correspondence School (1,913 in July 1965), and students receiving part-time instruction from the Technical Correspondence School (11,178 in July 1965).
The numbers of each sex attending schools providing secondary education at the end of 1965 were: State secondary schools, 62,887 boys and 54,986 girls; secondary departments of district high schools, 2,903 and 3,034; endowed and registered private secondary schools, 12,379 and 12,107; and full-time at Correspondence School, 142 and 277.
Duration of Stay at State and Private Secondary Schools—The following table gives particulars of pupils who left schools providing secondary education in 1965, classified according to years of attendance.
| Year of Attendance | State
Secondary Schools | District High Schools | Private Secondary | All Schools | |
|---|---|---|---|---|---|
| Totals | Percent | ||||
| First | 1,592 | 162 | 99 | 1,853 | 4.0 |
| Second | 8,849 | 654 | 748 | 10,251 | 22.1 |
| Third | 12,448 | 806 | 1,593 | 14,847 | 32.0 |
| Fourth | 9,532 | 409 | 2,263 | 12,204 | 26.3 |
| Fifth | 5,338 | 48 | 1,309 | 6,695 | 14.4 |
| Sixth and over | 444 | 3 | 82 | 529 | 1.2 |
| Totals | 38,203 | 2,082 | 6,094 | 46,379 | 100.0 |
Secondary Education for Maoris—At 1 July 1965, 12,670 Maori pupils were receiving secondary education. This number comprised 10,874 pupils attending State secondary schools and Maori district high schools and 1,796 pupils attending private secondary schools.
The establishment of Maori district high schools was a step forward in the provision of secondary education for Maoris. These schools, which are controlled by the Department of Education, provide courses of a practical nature specially suited to the needs of the Maori pupils. There were seven of these schools in 1965 with 314 Maori pupils at 1 July of that year.
Maori pupils receiving secondary education in private secondary schools at the end of 1965 included 899 pupils attending 10 Maori private secondary schools. Of this number, 175 pupils were holders of Maori Post-primary Scholarships, awarded by Government and tenable at a secondary school with approved boarding accommodation. A further 31 Maori Post-primary Scholarship holders were attending other private secondary schools and 95 were enrolled at State secondary schools.
Academic Bursaries—Bursaries of a maximum annual value of $120 may be granted to pupils of above-average ability who are obliged to live away from home in order to obtain tuition in all of the subjects of their chosen course of study for the School Certificate Examination. The bursary, limited to 400 awards each year, is tenable for up to three years subject to satisfactory reports on the pupils' progress.
Secondary School Bursaries—Bursaries, of a maximum annual value of $120 and tenable for a period of up to two years, may be granted to pupils obliged to live away from home in order to take a Sixth Form course at a secondary school (State or private) which is approved for accrediting purposes. In order to qualify, applicants must be under 18 years of age and must have passed either the School Certificate or the University Entrance Examination or have been accredited for the litter.
Technical School Bursaries—Bursaries of a maximum value of $120 may be awarded to pupils who have completed at any secondary school a two years' course preparatory to a specialised course in agriculture, fine arts, engineering, building construction, commerce, or home science. The bursaries are tenable at secondary schools approved for that purpose and may be held for a maximum of two years. Applicants must be under the age of 17 years at the commencement of the specialised course and must be obliged to live away from home in order to receive satisfactory instruction in the courses to be followed.
Probable Destination of State and Private Secondary Pupils—An indication of the vocations intended to be followed by pupils leaving secondary schools during 1965 is contained in the next table. Of the totals, 11.9 percent of boys and 4.9 percent of girls intended to proceed to full-time university studies, while a further 2.8 percent of boys and 13.2 percent of girls stated their intention of entering the teaching profession. Clerical occupations (including typing) claimed 11.4 percent of boys and 31.2 percent of girls; shops and warehouses, 6.6 percent and 11.6 percent; manual trades, 27.0 percent and 3.5 percent; farming, 15.3 percent and 0.9 percent; 02 percent and 7.3 percent intended to stay at home and take up domestic duties; various other occupations claimed 24.8 percent and 27.4 percent.
| Occupation | Totals | Maoris Included in Totals | ||
|---|---|---|---|---|
| Boys | Girls | Boys | Girls | |
| University | 2,852 | 1,115 | 37 | 12 |
| Teachers' college | 672 | 2,974 | 30 | 74 |
| Professional cadetship | 855 | 141 | 37 | 2 |
| Health services | 65 | 2,762 | 1 | 210 |
| Office work— | ||||
| (a) Government or local authority | 847 | 1,471 | 45 | 134 |
| (b) Industry and commerce | 1,874 | 5,479 | 31 | 175 |
| Shop and warehouse assistants | 1,500 | 2,615 | 60 | 201 |
| Skilled trades— | ||||
| (a) Government or local authority | 860 | 78 | 177 | 12 |
| (b) With private employers | 5,583 | 720 | 315 | 24 |
| Farming (including those engaged at their own homes) | 3,659 | 212 | 466 | 45 |
| Factory operatives and clothing workers | 894 | 1,476 | 190 | 404 |
| Domestic work and at home | 45 | 1,647 | 9 | 572 |
| Armed forces (not included elsewhere) | 503 | 33 | 58 | 17 |
| Other occupations Not known | 3,606 | 1,841 | 728 | 317 |
| Not known | ||||
| Totals | 23,815 | 22,564 | 2,184 | 2,199 |
VOCATIONAL GUIDANCE—Vocational guidance centres have been opened in Auckland, Wellington, Christchurch, Dunedin, Lower Hutt, Hamilton, and Napier. The vocational guidance officers are, however, in close contact with all the secondary schools in the country. The vocational guidance officers, acting in conjunction with headmasters and special careers teachers in the schools, offer their services at any point in the pupil's career where a choice has to be made, whether of school course or of vocation. When a pupil has made his choice of career, the vocational guidance officer will if requested find suitable employment for him and endeavour to follow up his progress until he is finally and satisfactorily settled in his line of work.
The centres are in frequent touch with a number of voluntary agencies such as “Heritage”, Crippled Children Society, and lay tuberculosis associations.
For the year ended 31 December 1965 the total callers at the centres numbered 27,536. In addition, 16,592 pupils were interviewed individually in secondary schools. Group interviews were carried out with many children and “careers courses” were organised by several centres during school holidays so that groups of pupils were enabled to see conditions and operations in occupations selected for their own particular requirements. Other activities, apart from attention to numerous inquiries by letter and the preparation and constant revision of leaflets covering over 700 occupations and other useful information, included visits to schools, addresses at meetings, and the placement of young people in employment.
RURAL EDUCATION: Consolidation of Schools—In order to give children in country districts the advantage of special equipment and more specialised teaching in larger schools, the consolidation of the smaller rural schools has been undertaken wherever practicable. The extent of this consolidation will be evident from the fact that, whereas in 1934 there were 2,532 State primary (excluding intermediate) schools, the number in 1965, despite a considerable increase in the school population in the intervening period, was 2,084.
Transport and Board—A natural consequence of consolidation was an increase in the numbers of pupils requiring some form of transport to enable them to attend school. In recent years school transport facilities have been steadily developed until now 17 percent of the total school population receive assistance in one form or another. Most of these pupils are conveyed by buses under contract to education boards or operated by the Department of Education. Financial aid towards the cost of fares is given in some cases where the number of pupils is insufficient to warrant a special school bus service. In addition, free passes on the railway to the nearest State or private school are granted to eligible children living near a railway line but at some distance from a primary school, and the same privilege is enjoyed by pupils having to travel to attend secondary schools, district high schools, and private secondary schools, as well as to part-time pupils travelling to attend technical classes, and pupils attending manual-training centres.
In areas where there is no organised transport, capitation payments are made to parents for the conveyance of their children to school by car.
The expenditure on transport of pupils for the financial year 1965–66 was $4,139,534, as compared with $4,083,938 in 1964–65.
In certain cases, boarding allowances are granted to pupils living in areas where there are no available or convenient transport services to enable them to attend school. Boarding allowances are also granted to secondary pupils to allow them to take, in other centres, certain specified courses not available at their local school.
The expenditure on boarding allowances of pupils attending schools for the last four years is given in the table below.
| 1962–63 | 1963–64 | 1964–65 | 1965–66 | |
|---|---|---|---|---|
| $ | $ | $ | $ | |
| State primary and intermediate (other than Maori) | 13,810 | 11,838 | 12,894 | 13,641 |
| Private primary | 16,960 | 22,658 | 19,018 | 20,545 |
| State secondary | 217,110 | 250,238 | 242,362 | 264,035 |
| Maori | 14,356 | 16,034 | 14,952 | 15,852 |
| Private secondary | 147,546 | 152,256 | 145,700 | 160,551 |
| Totals | 409,782 | 453,024 | 434,926 | 474,624 |
The next table gives particulars of the number of children transported to school and the number in receipt of boarding allowances as at 1 July 1965, according to the type of school attended. Totals for the three preceding years are also shown.
| Type of School | Number of Pupils on Roll | Total Pupils Transported to School | Number Receiving Boarding Allowance |
|---|---|---|---|
| State primary schools | 414,804 | 63,341 | 88 |
| State secondary schools (including district high schools) | 132,560 | 35,632 | 2,428 |
| Private primary schools and lower departments of secondary schools | 57,080 | 3,101 | 187 |
| Private secondary schools | 25,073 | 2,430 | 1,503 |
| Totals, 1965 | 629,517 | 104,504 | 4,206 |
| Totals, 1964 | 614,416 | 104,779 | 5,858 |
| Totals, 1963 | 596,367 | 104,124 | 6,160 |
| Totals, 1962 | 579,930 | 100,887 | 5,744 |
Correspondence School—Since 1922 correspondence classes have been conducted for the education of children in very remote areas and of those unable to attend school on account of lengthy illness or other causes. The usual subjects of the syllabus of instruction are taught at the school, and in addition pupils who require instruction which is usually available in a special class in a State primary school can receive instruction by correspondence. One of the features of the school is the provision of instruction in subjects involving practical work, such as needlework, woodwork, and the science subjects. A corporate school spirit is developed through the school badge and uniform, daily radio lessons, club activities, the publication of a school magazine, periodical exhibitions of work, and by parents' and ex-pupils' associations. The personal link between the pupil and the school is strengthened and the work of the school facilitated by a number of teachers from the school visiting pupils in their homes in the first term each year and, in four areas, by round-the-year visiting by resident teachers. Residential schools are held in November each year to give pupils the opportunity of taking part in group activities and of intensive tutorial work in subjects not readily dealt with by correspondence. At a district level, school day and school week gatherings are held in order to enable pupils to gain the opportunity of social education by working in the classroom.
Young persons in employment, including uncertificated teachers of small State primary schools and junior assistants in Maori schools, inmates of Department of Justice institutions, pupils of secondary schools who require examination subjects which their own schools cannot provide, officers of Government Departments, and others who are unable to attend classes at secondary schools, also receive tuition as part-time students of the Correspondence School. In addition, the school enrols teachers for the diploma in teaching courses.
In 1966 there were 5,946 pupils on the roll of the Correspondence School, 1,053 being in the primary division, 468 full-time and 3,732 part-time students in the secondary division, and 711 students taking the Diploma in Teaching course. The staff of the school consists of the headmaster, deputy headmaster, 142 teachers, and 45 clerical personnel.
Agricultural Clubs—More particularly in rural schools, practical interest in agriculture has been stimulated by the widespread formation of boys' and girls' agricultural clubs. The pupils undertake projects in livestock rearing and crop growing which are adjudged annually on the club field day, usually held at the school or local centre.
The agricultural instructors and nature study specialists employed by the education boards play an important part in the formation of the clubs, and by giving technical advice do much to assure the successful completion of the various projects. The clubs receive active support from parents, teachers, and the farmers' organisations.
HEALTH SERVICES—Information on the medical and dental inspection of school children and the dental-clinic system is given in Section 5A (Public Health) of this Yearbook.
Free Issue of Milk—The milk-in-schools scheme, for the free issue of a half-pint daily ration of milk to children, commenced on 1 March 1937. The cost of the scheme was charged to the Department of Agriculture, expenditure in 1965–66 being $1,659,972. The scheme was discontinued in February 1967.
TEACHING PROFESSION: Training of Teachers—In 1965 there were nine teachers colleges (at North Shore, Auckland (2), Ardmore, Hamilton, Palmerston North, Wellington, Christ-church, and Dunedin), catering for students who desired to enter the teaching profession. At 1 July 1965 there were 6,655 students in training. This number includes 1,750 holders of secondary teacher studentships (Division U) and 115 holders of primary teacher studentships (Division S) who are attached to teachers colleges while attending university as full-time students as part of their training for teaching, and who are therefore an integral part of the teachers colleges. Included in the remainder were 3,994 “Division A” students undertaking training for primary teaching and 389 “Division C” students undertaking training for secondary teaching. The minimum academic qualification for admission to Division A has been the School Certificate, but approximately two-thirds of these students have an Endorsed School Certificate or University Entrance. From 1964, Endorsed School Certificate has been the minimum academic qualification for admission to Division A. Nearly all “Division C” students are university graduates at the time of admission.
The following table shows the number of students in these two groups in December of each of the years 1961–1963, and at 1 July in the years 1964 and 1965.
| Year | Division A | Division C | Total | ||
|---|---|---|---|---|---|
| Males | Females | Males | Females | ||
| 1961 | 877 | 2,281 | 123 | 140 | 3,421 |
| 1962 | 948 | 2,504 | 173 | 181 | 3,806 |
| 1963 | 1,053 | 2,772 | 181 | 186 | 4,192 |
| 1964 | 1,071 | 2,873 | 173 | 209 | 4,326 |
| 1965 | 951 | 3,043 | 180 | 209 | 4,383 |
The normal course of training for “Division A” students has been a period of two years at a teachers college, followed by a further period of one year as a probationary assistant attached to a State primary school. The two-year course is to be replaced progressively by a three-year course which was introduced at the Hamilton and Dunedin colleges in 1966. In addition, a new primary teacher studentship scheme introduced in 1965 enables a number of selected students to attend university full time as part of the primary teacher training course. The allowance payable to the holders of these studentships while taking a full university course will be similar to those paid to holders of the secondary teacher studentships while attending their university course. Third-year studentships, which entitle holders to an extra year's training instead of a probationary year, are available to selected students who wish to specialise in music, or who wish to become speech therapists or teachers of the deaf.
For students of “Division C” the course is for one year. These students are university graduates or near graduates who train for service in secondary schools. To enable students to qualify to teach homecraft subjects, bursaries providing training at a teachers college and at a technical high school were instituted in 1943. There were 167 homecraft trainees in the Auckland and Dunedin Teachers Colleges in 1965. A further 48 trainees were being trained in 1965 as manual training instructors. A new secondary teacher training course (Division B) was introduced in 1966. The course provides for three years of concurrent training at a university and at a teachers college and is available at Auckland Secondary Teachers College and at Christchurch Teachers College. There were 48 direct entrants to this course in 1966.
In order to meet future staffing requirements due to the rapidly increasing school population a special training scheme was held in the years 1949 to 1965 for selected adult trainees. The course comprised one year at a teachers college following which the trainees were required to serve for one year as probationary assistants before being granted teachers' certificates. These trainees are not included in the figures in the tabulation of students at training colleges shown earlier, nor are some fee-paying students of whom there were 30 in 1965.
Secondary teachers' bursaries, although still awarded in some cases, have been largely replaced by secondary teacher studentships. To be eligible for one of these awards an applicant must have reached the age of 16 years on 31 December of the year of application, and must at the time of application have qualifed for entrance to the university, or hold some equivalent or higher qualification approved by the Director-General of Education. Students are attached to the teachers college in the appropriate university centre, and a principal lecturer, appointed to each teachers college, supervises the work of the students and assists them towards the completion of their university courses. Each student, on accepting the award, signs an agreement that he will satisfy the stated conditions. One important condition is that if he does not achieve reasonable success in his university studies he will transfer to some other teacher training course at a teachers college and there complete his training as a teacher.
The allowances payable in 1966 were—
For the first and second year of the studentship, $630;
For the third and further years of the studentship, $880;
For the graduate training year—First step on the teachers' basic scale $1,610.
Nine-tenths of the consolidated university fees are paid in addition to the allowances. During the period of the studentship a boarding allowance at the rate of $98 a year is paid if the student is required to live away from home.
In 1965, 704 secondary teacher studentships were awarded and of these 547 were taken up in 1966. In addition, 41 holders of secondary teachers' bursaries in 1965 qualified to transfer in 1966 to secondary teacher studentships.
There were 40 holders of secondary teachers' bursaries and 1/748 holders of secondary teacher studentships attending university institutions in 1966.
State Primary-school Teachers—The following table shows the number of teachers in State primary schools in the various education districts as at 30 September 1965; together with totals for 1940, 1963, and 1964.
| — | Sole
Teachers and Heads of Schools | Assistant Teachers | Probationary Assistants | Total Number of Teachers | Percentage of Male to Female Teachers | |||
|---|---|---|---|---|---|---|---|---|
| M. | F. | M. | F. | M. | F. | |||
| * Excluding Maori schools. | ||||||||
| Auckland | 332 | 5 | 756 | 1,601 | 92 | 259 | 3,045 | 63.3 |
| South Auckland | 322 | 3 | 493 | 1,005 | 68 | 189 | 2,080 | 73.8 |
| Taranaki | 117 | – | 93 | 240 | 17 | 53 | 520 | 77.5 |
| Wanganui | 147 | 2 | 197 | 364 | 29 | 83 | 822 | 83.1 |
| Hawke's Bay | 165 | 4 | 221 | 420 | 35 | 73 | 918 | 84.7 |
| Wellington | 219 | 9 | 390 | 852 | 43 | 154 | 1,667 | 64.2 |
| Nelson | 64 | – | 77 | 148 | 15 | 30 | 334 | 87.6 |
| Canterbury | 302 | 13 | 430 | 878 | 51 | 167 | 1,841 | 74.0 |
| Otago | 158 | 5 | 202 | 386 | 22 | 89 | 862 | 79.6 |
| Southland | 134 | 1 | 118 | 226 | 13 | 52 | 544 | 95.0 |
| Intermediate schools and departments | 78 | – | 661 | 502 | 42 | 38 | 1,321 | 144.6 |
| Maori primary schools | 124 | 4 | 57 | 174 | 12 | 25 | 396 | 95.1 |
| Totals, 1965 | 2,162 | 46 | 3,695 | 6,796 | 439 | 1,212 | 14,350 | 78.2 |
| Totals, 1964 | 2,152 | 36 | 3,487 | 6,526 | 414 | 1,212 | 13,827 | 77.9 |
| Totals, 1963* | 1,996 | 41 | 3,443 | 5,779 | 359 | 984 | 12,602 | 85.2 |
| Totals, 1940* | 1,635 | 510 | 886 | 2,890 | 227 | 438 | 6,586 | 71.6 |
The average number of pupils per teacher (including probationary assistants) in all public primary schools was 30.0 in 1940, 31.4 in 1933, and 29.5 in 1965; but the basis in recent years is September rolls and not average yearly attendance.
Secondary-school Teachers—The following table indicates the number of full-time teachers employed in the State schools providing secondary education. The principals are included except in the case of district high schools, the figures for which apply to assistants in the secondary department only.
| Year | State Secondary Schools | District High Schools | Totals | ||||
|---|---|---|---|---|---|---|---|
| Males | Females | Males | Females | Males | Females | Combined | |
| 1960 | 2,743 | 1,506 | 295 | 103 | 3,038 | 1,609 | 4,647 |
| 1961 | 3,013 | 1,649 | 292 | 118 | 3,305 | 1,767 | 5,072 |
| 1962 | 3,246 | 1,843 | 280 | 123 | 3,526 | 1,966 | 5,492 |
| 1963 | 3,318 | 1,966 | 251 | 109 | 3,569 | 2,075 | 5,644 |
| 1964 | 3,468 | 2,064x | 240 | 103 | 3,708 | 2,167x | 5,875 |
| 1965 | 3,548 | 2,094 | 215 | 90 | 3,763 | 2,184 | 5,947 |
The number of teachers employed in State schools providing secondary education rose from 908 male teachers and 630 female teachers in 1940 to 3,763 and 2,184 respectively in 1964. In the latter year there were also 1,119 teachers (561 male and 558 female) employed in private secondary schools.
FREE TEXTBOOKS IN SCHOOLS—Free textbooks were supplied to all primary and secondary pupils in both State and private schools from the beginning of 1959. Under the free textbooks scheme, the books remain the property of the school controlling authorities and are issued on loan to pupils. The school authorities have a wide discretion in their choice of suitable books.
AUDIO-VISUAL TEACHING AIDS—Regular broadcasting programmes for schools were initiated in 1931. A varied series of programmes linked with the curriculum are broadcast each school day from all main national stations. Special lessons are also broadcast each day for Correspondence School pupils.
Audio-Visual Aids—The National Film Library, a branch of the Department of Education, lends films and gramophone records free of charge to schools. It also lends films free-of-charge to other organisations having some educational purpose. Films are also supplied to the education services in Western Samoa, Rarotonga, and in the Niue, Pitcairn, Cook, and Chatham Islands. A branch of the library situated in Auckland supplies films to schools and organisations in the upper half of the North Island and another in Christchurch serves the South Island except Nelson and Marlborough. The rest of New Zealand is serviced from Wellington.
The Library contains more than 30,000 films with about 6,900 titles. Up to 7,000 reels of film are issued each week, and of these 72 percent go to schools or colleges. Approximately 2,500 schools and 3,200 other organisations having some educational purposes benefit from this service.
A number of filmstrips is produced each year by the Filmstrip Production Unit of the Education Department. These and selected productions from overseas are available to schools on free loan from filmstrip libraries in the offices of education boards. They can also be purchased by schools for a nominal sum from the National Film Library. More than 1,800 titles are available to primary and secondary schools. Up to 40,000 filmstrips are issued each year. Nearly all schools are equipped with filmstrip projectors.
A tape-copying service is also provided by the National Film Library for schools with tape recorders. Tapes submitted by the schools are transcribed from master tapes held by the National Film Library.
A gramophone record library of 2,417 titles and 4,450 copies is available for use by schools and teachers colleges. Issues exceed 12,000 records a year.
Museums—To assist schools to make the fullest use of the museums, an education officer is attached jointly to the museum and the teachers' training college in each of the four main centres. Cases of exhibits are circulated amongst schools where pupils are unable to make regular visits to a museum.
Publications—The School Journal, an illustrated paper, is published in four separate parts suitable for pupils in the various standard classes. Parts 1 and 2 are published six times in the year while Parts 3 and 4 for the senior classes appear four times a year. Primary School Bulletins, dealing with topics of New Zealand history, geography, nature study, and family life in other countries, are published every year. These and other publications are prepared in the School Publications Branch of the Department of Education and issued free to all primary and intermediate schools, both State and private. Vernacular Journals are also issued to schools in Cook, Niue, and Tokelau Islands.
Arithmetic textbooks for all classes in primary schools have been prepared and published over the last few years and a set of infant readers is being issued.
A series of handbooks for teachers in primary schools dealing with English, social studies, arts and crafts, and reading in the infant school have been issued free to primary schools, both State and private, on the basis of one copy per classroom. Further handbooks on physical education and on the teaching of numbers in the infant school are being issued.
The Post-primary School Bulletin is published 10 times a year and issued free to all State and private secondary schools. It provides background reading for subjects of the revised curriculum particularly in social studies, science, and literature.
The Education Gazette is published by the Department twice a month. It is a medium for the dissemination of official information and for the advertisement of vacancies. Copies are distributed to educational authorities and to State schools throughout New Zealand, and private schools receive one copy free of charge.
Education, a magazine for teachers, is published 10 times a year.
HIGHER EDUCATION: The University System—The system of higher education in New Zealand has evolved in recent years from a federal university with constituent colleges to a system of separate universities and a university college of agriculture. These are the University of Auckland, the University of Waikato (at Hamilton), Massey University (at Palmerston North), the Victoria University of Wellington, the University of Canterbury (at Christchurch), and the University of Otago (at Dunedin), with Lincoln College a constituent agricultural college of the University of Canterbury.
At the centre there is the University Grants Committee which functions under the Universities Act 1961. The primary function of the University Grants Committee is to advise the Government of the needs of New Zealand for university education and research. It determines the allocation of grants of money which it recommends for appropriation by Parliament to meet these needs, and reviews the expenditure by the universities of money appropriated by Parliament. The University Grants Committee is also responsible for the award of scholarships, and through its statutory subcommittee, the Research Committee, for the distribution of the Government grant for research. Another statutory subcommittee of the University Grants Committee, the Curriculum Committee, has responsibilities in respect of the development of courses for degrees and diplomas. In the performance of its duties it is required to have regard to the comparative equivalence of courses.
The Universities Entrance Board was established on 1 January 1962 to maintain a common educational standard for admission to the universities. The Board prescribes the conditions of examinations for University Entrance, Entrance Scholarships, the University Bursaries Examination, and Fine Arts Preliminary.
The special problems of legal education are the province of the Council of Legal Education which prescribes the examination requirements for admission of candidates as barristers and solicitors of the Court.
The universities in Auckland, Wellington, Canterbury, and Otago, besides offering courses in the faculties of arts, science, commerce, law, and music, specialise in certain fields. The University of Otago provides courses in medicine and dentistry, mineral technology, home science, and physical education; the University of Canterbury provides courses in engineering (mechanical, electrical, civil, and chemical) and fine arts; the University of Auckland provides courses in architecture, fine arts, engineering (mechanical, chemical and materials, electrical, and civil), and postgraduate courses in obstetrics and gynaecology; and the Victoria University of Wellington provides courses in public administration and social science. Massey University provides courses in agriculture, horticulture, food technology, and veterinary science, as well as courses in arts and science, and also provides extramural tuition in a number of subjects to students throughout New Zealand. The establishment of a veterinary faculty at Massey University in 1964 removed New Zealand's dependence on Australia for the training of veterinary surgeons.
Free University Education: Scholarships—The most important awards for those entering university are the University Junior Scholarships. These scholarships are tenable for three to six years, depending upon the minimum time in which the holder, studying full-time, could complete the recognised course taken under the scholarship. The University Junior Scholarship provides a scholarship allowance of $220 a year and is tenable with a fees and allowances bursary (see Bursaries below). These scholarships, together with the Taranaki Scholarships and certain privately endowed scholarships, are awarded on the results of the Entrance Scholarships Examination conducted by the Universities Entrance Board.
Scholarships awarded during degree courses include Senior Scholarships awarded by the individual universities and Lincoln College (and of a value to be determined by them). The various university institutions also have private scholarships for which their own students may compete. The scholarships awarded at the end of the university course, which are listed in full in the university calendars, include the Rhodes Scholarships, the 1851 Exhibition Scholarships, Post-graduate Scholarships and Post-Doctoral Fellowships, the Macmillan Brown Agricultural Scholarship, the Shirtcliff Scholarships, the Gordon Watson Scholarship, the Shell Post-graduate Scholarship, the Michael Hiatt Baker Scholarship, the Rutherford Scholarships, the Orford Studentship, and the National Research Scholarships. Many of the Post-graduate Scholarships and some of the Post-doctoral Fellowships are tenable in New Zealand. The other awards are in general tenable overseas.
University Bursaries—The system of bursaries for students entering upon a university course is set out in the University Bursaries Regulations 1966, which were made following a full review of the scheme that had been in operation from 1912 to 1965. Bursaries available to students are fees bursaries, fees and allowances bursaries, and masters bursaries. There is provision for the award of supplementary allowances with a fees and allowances bursary to students who satisfy the scholastic or academic requirements. The supplementary allowances were paid for the first time in 1967. In general, fees and fees and allowances bursaries are tenable for the minimum period, not exceeding six years for medicine, or five years for other courses, in which a student following a full-time course in each year could complete the recognised course taken under the bursary. There is provision for these bursaries to be extended for an additional year in any case where, in the opinion of the Director-General of Education, the personal circumstances of the bursar warrant it. There is also provision for the extension of a bursary for a limited period to assist students undertaking a second recognised course of study.
Fees Bursaries are awarded to students following part-time or full-time courses who have qualified for entrance to the university either by examination or accrediting, or who, having been granted provisional admission, pass two units in any one year. These bursaries provide for payment of tuition fees during their term.
Fees and Allowances Bursaries are awarded to students who hold the Higher School Certificate and are tenable for any recognised course at a university provided that the bursar undertakes a full-time course of study in each year of the bursary. Also, a student who in any year is credited with passes in the subjects or units comprising a full-time course may transfer from the fees bursary to a fees and allowances bursary.
A fees and allowances bursary entitles the holder to payment of tuition fees plus allowances of $80 in the first year of the bursary, $120 in the second year, $160 in the third year, and $200 in the fourth and any subsequent year of the bursary.
The holder of a fees and allowances bursary who is obliged to live away from his home or his usual place of residence in order to attend a university affording tuition in the subjects appropriate to his course and year may also qualify for a boarding allowance of $250 a year.
Masters' Bursaries are awarded to students who have completed a bachelor's degree, in not more than one year in excess of the minimum period in which that degree could be completed by a student taking a full-time course each year. They must, however, proceed in the next year or in the year following that year to take a full-time course leading to a master's degree. The holder of a master's bursary is entitled to tuition fees and an allowance of $300 and he may also, in the same way as a fees and allowances bursar, receive a boarding allowance of $250 a year if eligible.
Supplementary Allowances are awarded to students who gain the required standard of passes in the university bursaries examination or in the entrance scholar-hip examination and who are holding a fees and allowances bursary. A supplementary allowance may also be awarded to a student who gains the requisite grade of pass in the subjects or units of a full-time university course.
All these bursaries are subject to strict rules as to suspension and cancellation. A student who in any year does not pass in a prescribed number of units or subjects will have his bursary suspended and it will not be reinstated unless in the following year he is credited with a prescribed number of passes. Only one such suspension is allowed and subsequent failure results in cancellation of the bursary.
Further details of the amounts payable and other qualifying conditions for the various classes of bursaries are available from vocational guidance centres and from the Head Office of the Department of Education, Wellington.
The Government offers for competition annually four bursaries to students wishing to attend the School of Social Science at the Victoria University of Wellington. Preference is given to candidates nominated by church or other organisations engaged in social work. These bursaries provide for full fees, a bursary allowance of $160, and a boarding allowance of $250 where appropriate.
The total number of University National, Entrance, Higher School Certificate, fees, and fees and allowances bursaries current in 1965 was 8,913.
Bursaries, etc., are also awarded annually by other Government Departments and include medical, dental, physiotherapy, and dietetic bursaries (Department of Health), national research scholarships and national research fellowships (Department of Scientific and Industrial Research), rehabilitation bursaries (Social Security Department), coal-mining bursaries (Mines Department). Study awards are made to selected public servants to enable them to undertake university study. The Department of Education has a system of studentships with generous allowances available for those intending ultimately to qualify as secondary teachers.
The following table gives the number of students, including those taking short courses at agricultural colleges, who received free university education during each of the latest five years.
| Year | Junior University, University National , and Taranaki Scholarships | Senior University Scholarships | University National, Entrance, and H.S.C. Bursaries* | Teachers' College Studentships | Other | Total |
|---|---|---|---|---|---|---|
| * Includes also fees, fees and allowances, and Masters' Bursaries awarded under University Bursaries Regulations. | ||||||
| 1961 | 186 | 32 | 6,153 | 732 | 2,404 | 9,507 |
| 1962 | 156 | 30 | 6,734 | 766 | 3,194 | 10,880 |
| 1963 | 220 | 56 | 7,418 | 1,064 | 3,721 | 12,479 |
| 1964 | 239 | 56 | 7,748 | 1,065 | 3,714 | 12,822 |
| 1965 | 266 | 57 | 9,260 | 1,106 | 3,609 | 14,298 |
Holders of rehabilitation bursaries numbered 16 in 1961, 12 in 1962, 84 in 1963, 43 in 1964, and 54 in 1965.
Students—In 1965 there were 20,269 students actually in attendance at the six universities and one agricultural college. Of these, 1,710 were graduates, 17,674 undergraduates, and 885 unmatriculated students. In addition, there were 1,876 students attached to the various universities, but exempt from lectures, and 399 students who were taking short courses. Comparable figures for the latest five years are given in the following table.
| Year | Students Attending Lectures | Exempt Students | Total* | ||
|---|---|---|---|---|---|
| Males | Females | Males | Females | ||
| * Does not include students taking horticulture courses at agricultural colleges. | |||||
| 1961 | 11,606 | 3,720 | 1,153 | 341 | 16,820 |
| 1962 | 12,067 | 3,814 | 1,039 | 294 | 17,214 |
| 1963 | 12,811 | 4,188 | 999 | 305 | 18,303 |
| 1964 | 13,582 | 4,562 | 1,083 | 413 | 19,640 |
| 1965 | 14,937 | 5,332 | 1,252 | 624 | 22,145 |
The following table gives particulars of students who were taking definite courses at universities, including agricultural college, during the latest three years. Additional information is published in Education Statistics of New Zealand available from the Department of Education, Wellington.
| Course | 1963 | 1964 | 1965 | ||||||
|---|---|---|---|---|---|---|---|---|---|
| Males | Females | Total | Males | Females | Total | Males | Females | Total | |
| NOTE - Physiotherapy first-year students only. | |||||||||
| Agriculture and Agricultural Science— | |||||||||
| Degree | 531 | 7 | 338 | 313 | 3 | 316 | 341 | 8 | 349 |
| Diploma | 295 | 2 | 297 | 236 | 4 | 240 | 270 | 4 | 274 |
| Dairy Farming (diploma) | – | – | – | – | – | – | 25 | – | 25 |
| Dairy Technology (diploma) | – | – | – | – | – | – | 91 | 4 | 95 |
| Horticulture (degree) | 36 | 2 | 38 | 29 | 5 | 34 | 36 | 6 | 42 |
| Horticulture (diploma) | 33 | 10 | 43 | 18 | 11 | 29 | 12 | 33 | 45 |
| Sheep Farming (diploma) | – | – | – | – | – | – | 48 | – | 48 |
| Certificate in Agriculture | 26 | 5 | 31 | 15 | – | 15 | 11 | – | 11 |
| Valuation and Farm Management (diploma) | – | – | – | – | – | – | 26 | – | 26 |
| Wool (diploma) | 89 | – | 89 | – | – | – | 81 | 1 | 82 |
| Architecture— | |||||||||
| Degree | 147 | 9 | 156 | 142 | 4 | 146 | 173 | 3 | 176 |
| Diploma | 94 | 5 | 99 | 72 | 3 | 75 | 43 | 1 | 44 |
| N.Z.I.A. | 11 | – | 11 | 11 | – | 11 | 10 | – | 10 |
| Arts | 3,117 | 2,803 | 5,920 | 3,413 | 3,129 | 6,542 | 4,231 | 3,673 | 7,904 |
| Banking (diploma) | 15 | – | 15 | 10 | – | 10 | 5 | – | 5 |
| Business Administration (diploma) | – | – | – | – | – | – | 12 | – | 12 |
| Criminology (diploma) | – | – | – | – | – | – | 6 | 1 | 7 |
| Commerce (including accountancy) | 2,414 | 87 | 2,501 | 2,453 | 92 | 2,545 | 2,755 | 148 | 2,903 |
| Dentistry | 188 | 5 | 193 | 191 | 6 | 197 | 203 | 6 | 209 |
| Diagnostic Radiology (diploma) | 2 | – | 2 | 1 | – | 1 | 1 | – | 1 |
| Divinity | 60 | 5 | 65 | 78 | 6 | 84 | 83 | 9 | 92 |
| Education (degree) | – | – | – | 2 | – | 2 | 3 | 3 | 6 |
| Education (diploma) | 162 | 69 | 231 | 178 | 269 | 91 | 252 | 107 | 359 |
| Educational Psychology (diploma) | 7 | – | 7 | 5 | – | 5 | 1 | – | 1 |
| Engineering (degree)— | |||||||||
| First professional | 264 | 1 | 265 | 270 | – | 270 | 278 | – | 278 |
| Chemical | 51 | – | 51 | 55 | 1 | 56 | 54 | 2 | 56 |
| Civil | 222 | – | 222 | 218 | – | 218 | 259 | 3 | 262 |
| Electrical | 151 | 1 | 152 | 163 | 1 | 164 | 182 | – | 182 |
| Mechanical | 115 | – | 115 | 85 | – | 85 | 118 | – | 118 |
| Metallurgical | 24 | – | 24 | 44 | – | 44 | 32 | – | 32 |
| Mining | 22 | – | 22 | ||||||
| Engineering (professional) | 8 | – | 8 | 5 | – | 5 | – | – | – |
| Fine Arts— | |||||||||
| Diploma | 69 | 108 | 177 | 105 | 118 | 223 | 135 | 131 | 266 |
| Preliminary | 6 | 8 | 14 | 3 | 8 | 11 | |||
| Food Processing— | |||||||||
| Food Technology | 23 | – | 23 | 21 | 5 | 26 | 37 | 6 | 43 |
| Dairy Engineering (diploma) | 5 | – | 5 | – | – | – | 10 | – | 10 |
| Home Science— | |||||||||
| Degree | – | 30 | 30 | – | 27 | 27 | – | 2 | 29 |
| Diploma | – | 140 | 140 | – | 170 | 170 | – | 181 | 181 |
| Intermediate courses— | |||||||||
| Agriculture | 90 | 4 | 94 | 126 | 8 | 134 | 176 | 12 | 188 |
| Agriculture (horticulture) | 6 | 3 | 9 | 10 | – | 10 | |||
| Architecture | 66 | 2 | 68 | 108 | 4 | 112 | 125 | 6 | 131 |
| Dentistry | 44 | – | 44 | 46 | 2 | 48 | 61 | 1 | 62 |
| Engineering | 480 | 2 | 482 | 407 | 1 | 498 | 612 | 1 | 613 |
| Food Technology | 10 | 5 | 15 | 18 | 3 | 21 | 28 | 5 | 33 |
| Intermediate course (cont.)— | |||||||||
| Home Science | – | 17 | 17 | – | 11 | 11 | – | 25 | 25 |
| Medicine | 238 | 45 | 283 | 284 | 37 | 321 | 295 | 52 | 347 |
| Optometry | 1 | – | 1 | 2 | – | 2 | 1 | – | 1 |
| Pharmacy | 10 | 2 | 12 | – | – | – | 17 | 7 | 24 |
| Surveying | 20 | – | 20 | 60 | – | 60 | 33 | – | 33 |
| Veterinary Science | 66 | 3 | 69 | 79 | 8 | 87 | 85 | 9 | 94 |
| Law | 1,100 | 51 | 1,151 | 1,222 | 66 | 1,288 | 1,395 | 74 | 1,469 |
| Medical Science | 4 | – | 4 | 8 | 1 | 9 | 1 | – | 1 |
| Medicine— | |||||||||
| Degree | 550 | 61 | 611 | 523 | 63 | 586 | 525 | 69 | 594 |
| Microbiology (diploma) | 3 | – | 3 | – | – | – | – | – | – |
| Mining (diploma) | – | – | – | – | – | – | – | – | – |
| Music— | |||||||||
| Degree | 59 | 49 | 108 | 61 | 40 | 101 | 57 | 40 | 97 |
| Diploma | 1 | – | 1 | 2 | 1 | 3 | 1 | 1 | 2 |
| Executant (diploma) | 8 | 7 | 15 | 7 | 5 | 12 | 8 | 13 | 21 |
| Optometry (diploma) | – | – | – | – | – | – | 19 | – | 19 |
| Pharmacy (degree) | 4 | 2 | 6 | 24 | 9 | 33 | 18 | 10 | 28 |
| Physical education (diploma) | 50 | 80 | 130 | 53 | 84 | 137 | 53 | 96 | 149 |
| Physiotherapy, certificate | 11 | 57 | 68 | 6 | 54 | 60 | 4 | 57 | 61 |
| Public administration (diploma) | 8 | – | 8 | 12 | – | 12 | 10 | – | 10 |
| Public Health (diploma) | 3 | – | 3 | – | – | – | 6 | – | 6 |
| Radiology (diploma) | 1 | 12 | 13 | – | 6 | 6 | – | 6 | 6 |
| Science | 2,346 | 582 | 2,928 | 2,405 | 635 | 3,040 | 2,621 | 649 | 3,270 |
| Social Science (diploma) | 9 | 10 | 19 | 14 | 8 | 22 | 21 | 5 | 26 |
| Speech Therapy (certificate) | – | – | – | – | – | – | 2 | 11 | 13 |
| Surveying (diploma) | 2 | – | 2 | 21 | – | 21 | 43 | 1 | 44 |
| Town Planning (diploma) | 17 | 1 | 18 | 25 | 1 | 26 | 40 | – | 40 |
| Urban Valuation (diploma) | 28 | 3 | 31 | 34 | – | 34 | 48 | – | 48 |
| Veterinary science | – | – | – | 32 | 2 | 34 | 60 | 2 | 62 |
| Other— | |||||||||
| Not stated | – | – | – | 7 | – | 7 | 9 | – | 9 |
| Certificate of Proficiency | – | – | – | – | – | – | 118 | 99 | 217 |
| Cultural interest only | – | – | – | – | – | – | 53 | 85 | 138 |
| Totals | 13,222 | 4,295 | 17,517 | 13,822 | 4,733 | 18,555 | 16,369 | 5,695 | 22,064 |
The spread of these students over the universities in 1965 was: University of Auckland, 5,707; University of Waikato, 207; Victoria University of Wellington, 4,782; University of Canterbury, 4,646; University of Otago, 3,980; Massey University of Manawatu, 2,168; Lincoln College, 574.
Graduates—The numbers of degree graduates from New Zealand universities in 1964 and 1965 are shown in the following table.
| Course | Honours | Masters | Bachelors | |||
|---|---|---|---|---|---|---|
| 1964 | 1965 | 1964 | 1965 | 1964 | 1965 | |
| Agriculture | – | – | 1 | 1 | 4 | 2 |
| Agricultural Science | – | 6 | 13 | 9 | 55 | 55 |
| Agricultural Science (Hort.) | – | – | – | 2 | 6 | 8 |
| Architecture | – | – | – | – | 53 | 53 |
| Arts | 143 | 160 | 59 | 75 | 701 | 709 |
| Commerce | 3 | 6 | 4 | 4 | 157 | 161 |
| Dental Surgery | 3 | 3 | 1 | 1 | 41 | 39 |
| Divinity | – | – | – | – | 7 | 7 |
| Education | – | – | – | – | – | 1 |
| Engineering (Chemical) | – | 2 | 15 | 12 | 15 | 9 |
| Engineering (Civil) | – | 74 | 76 | |||
| Engineering (Electrical) | – | 50 | 50 | |||
| Engineering (Mechanical) | – | 28 | 29 | |||
| Engineering (Metallurgical) | – | 10 | 7 | |||
| Food Technology | – | – | – | – | 4 | 4 |
| Home Science | – | – | – | – | 3 | 3 |
| Laws | 7 | 8 | 1 | 2 | 134 | 133 |
| Medical Science | – | – | – | – | 8 | 8 |
| Medicine and Surgery | – | – | – | – | 106 | 105 |
| Music | – | – | – | – | 9 | 12 |
| Science | 82 | 93 | 39 | 49 | 440 | 432 |
| Totals | 238 | 278 | 133 | 155 | 1,905 | 1,905 |
In addition, doctorates were completed in Science (2), Medicine (5), Philosophy (33), Literature (1), Dental Surgery (3).
Staff—The teaching staff of the universities and agricultural colleges in 1965 consisted of 1,339 persons on full-time appointments and 501 persons working part-time. On full-time appointments there were 187 professors, 527 senior lecturers, 456 lecturers, 138 junior lecturers, and 31 instructors and demonstrators engaged in teaching. Non-teaching staff numbered 1,453 full-time and 157 part-time workers.
TECHNICAL EDUCATION—Technical education is concerned mainly with the needs of pupils who have left school but wish to obtain training for their chosen occupation. Nevertheless, some elements of technical education are provided in secondary schools within the framework of courses of secondary instruction available to full-time day scholars. All courses of secondary instruction include a core of compulsory subjects to be taken by all pupils, but there is some degree of choice in the remaining subjects which complete the course of each pupil. Some of these optional subjects are of a practical nature akin to technical education. In the larger centres there is a tendency for one or two schools to provide a large element of technical education in this way, while the remaining schools have an academic bias with little or no technical education provided. In the smaller centres, where there are one or two secondary schools only, this form of specialisation is not possible, but these schools normally provide some facilities for technical education.
Technical education for those who have left school but wish to begin or extend their training for their chosen occupation is provided in several ways: by secondary schools, usually outside the normal hours of secondary instruction; by technical institutes established in the four main centres and concerned with vocational training only; and by the New Zealand Technical Correspondence Institute which supplements the facilities provided by secondary schools and technical institutes. Students of the New Zealand Technical Correspondence Institute in subjects requiring practical work attend block courses available at various centres.
A considerable element of this technical education comprises practical and theoretical training for apprentices. Practical training is given in day classes or in block courses. Apprentices are released from their employment approximately half a day a week to attend the former, and up to three weeks in a year where they attend block courses of concentrated full-time instruction. Day classes and block courses for apprentices are conducted in secondary schools having facilities for technical training (these secondary schools were in many cases formerly designated technical schools or technical high schools) and in technical institutes. The full-time block courses are usually conducted at regional or national centres and there is a growing trend towards this type of practical instruction as more National Apprenticeship Committees press for block courses and as increasing numbers of apprentices in individual trades justify their establishment. This practical instruction is supplemented by instruction in theory at evening classes established locally in secondary schools and technical institutes where the numbers of apprentices warrant, and by correspondence tuition from the New Zealand Technical Correspondence Institute in other cases. The examinations for apprentices are administered by the New Zealand Trades Certification Board, a statutory body which is responsible for making provision for the examination of persons wishing to practise a trade and for awarding, either independently or in conjunction with any other examining body, diplomas or certificates to such persons.
Technical education at a higher level for technicians is growing steadily. The Technicians Certification Authority of New Zealand was established in 1958 to prescribe courses and syllabuses and to conduct examinations for technicians leading to the award of national certificates. Courses leading to national certificates have been provided for in engineering, draughting, draughting (architectural), science, building, and quantity surveying. In addition, at a lower level, there are courses leading to New Zealand Technical Certificates for radio technicians and those engaged in automotive engineering and welding. There is also a New Zealand Certificate of Competency in Garage Management. The instruction in these courses is given at part-time classes or on a sandwich basis (i.e., full-time classes attended at intervals for short periods) in secondary schools with facilities for technical education and in technical institutes, and also by correspondence through the New Zealand Technical Correspondence Institute. There are a few of these courses which can be taken at a technical institute to the second or third stage on a full-time basis.
In addition to the national courses established for apprentices and technicians, there are a number of courses providing technical education which have been organised regionally to meet local demands. Examples are commercial courses for girls, work study and electronic data processing courses, courses in journalism, industrial and commercial design, etc., which, while not at present being taught for any nationally recognised qualifications, may develop into national courses in time. Also, instruction is given in courses which do lead to recognised qualifications, but for which the examination syllabuses are provided by independent organisations, e.g., the New Zealand Society of Accountants, Chartered Institute of Secretaries, New Zealand Institute of Valuers, etc. Instruction in such courses tends to be restricted to the technical institutes, but in some cases there are part-time classes and, very occasionally, full-time classes at secondary schools.
In some of the main centres, secondary schools, which were formerly designated technical schools because of the large volume of technical education which they provided, have been split up into two schools—a secondary school providing secondary education and a technical institute devoted solely to the provision of technical and continuation education. In recent years, technical institutes have been established in this way at Auckland (Auckland Technical Institute), Petone (Central Institute of Technology), Wellington (Wellington Polytechnic), Christchurch (Christchurch Technical Institute), and Dunedin (Otago Polytechnic). Also, the former Technical Correspondence School was renamed the New Zealand Technical Correspondence Institute. A further development may be the establishment of a national technical institute which will be concerned with offering courses for which there is not sufficient regional demand to warrant the establishment of a regional technical institute.
Bursaries are available for suitably qualified students wishing to take approved full-time courses in technical institutes. They provide for payment of tuition fees and, in the case of students living away from home, a boarding allowance of $120 for the first and second years of the bursary and $250 for the third and fourth years of the bursary.
In 1965 there were 215 centres at which technical classes for part-time day and evening students were provided. The numbers of students receiving technical education in educational institutions in 1965 totalled 81,046. This number included part-time and full-time students at technical institutes, students enrolled with the New Zealand Technical Correspondence Institute, part-time students of secondary schools, and a small number of students enrolled for short courses at agricultural colleges.
N.Z. Technical Correspondence Institute—In July 1946 the Department took over the responsibility for the study courses previously conducted by the Army Educational and Welfare Service. The Technical Correspondence School was established in Wellington to develop these courses for men in the armed services, and also to provide correspondence instruction in vocational and technical subjects for apprentices and advanced students unable to attend technical schools or classes.
The expansion of the work of the school has been remarkable. It was established in 1946 with a staff of two teachers and gave instruction in 12 technical subjects. Instruction is now given in 465 technical subjects. This work is mainly in three categories: first, the teaching of students through marking and commenting on their test papers, and the supervision of their studies; second, the preparation of new, and the revision of old, lessons for students' use; third, the preparation of textbooks. So far the school has published 13 textbooks and two are at present being written.
The main function of the school, now known as the New Zealand Technical Correspondence Institute, is to provide technical education from apprentice up to advanced technician level for those who are unable to obtain such education through the usual institutions. In particular, the Institute meets many demands for technical education in the building, electrical, and engineering trades, and also provides courses in agriculture and horticulture, dairy manufactures, management and commerce, mining and fire engineering, surveying, textiles, and valuation. As all students are employed in an industry or profession, their correspondence studies are supported by practical experience.
The work of the Technical Correspondence Institute parallels the teaching given in the other senior technical institutes, and instruction is given in many subjects not taught elsewhere. The Institute plays an important role in the education of many of the apprentices who sit the annual examinations of the Trades Certification Board. It also prepares a large percentage of candidates for the various examinations of the Technicians Certification Authority in engineering, building, draughting, and science as well as for other professional and industrial examinations.
The number of students on the roll at 1 August 1966 exceeded 13,000. There is an establishment of 200 full-time tutors, besides the Principal, and some 50 administrative staff.
New Zealand Council for Technical Education—This Council was set up in 1958 following a conference of parties interested in technical education called by the Minister for the purpose of advising him on all matters pertaining to education and training for employment in industry and commerce. It was envisaged that the Council would encourage close relations between those concerned with technical education, industry, and commerce, and to this end the Council was constituted with a wide membership representative of the following bodies: Department of Education; University Grants Committee; Associated Chambers of Commerce; Manufacturers' Federation; Employers' Federation; Federation of Labour; Institution of Engineers; State Services Commission; Technical Education Association. The Commissioner of Apprenticeship is a member of the Council, and there are other members representing regional and special interests.
COUNCIL FOR EDUCATIONAL RESEARCH—The Carnegie Corporation of New York was instrumental in founding the New Zealand Council for Educational Research in 1933 and supported it by grants for 10 years. Since 1945 the Council has been supported in the main by State funds, supplemented by contributions from educational bodies and business organisations.
The Council is under independent control and was given statutory recognition in the New Zealand Council for Educational Research Act 1945.
The Council has concentrated on New Zealand problems, and many of its publications (44 research reports and 18 shorter studies in education) consist of critical surveys on various aspects of New Zealand education and of accounts of outstanding experiments in school practice. The work done under the auspices of the Council has been carried out not only by its own permanent staff but also by part-time investigators.
In addition to its activities as a research organisation, the Council acts as a clearing house for information on educational matters.
The Council's activities are under the control of a permanent officer (the director), who is assisted by a staff of ten. There are local institutes for educational research in Auckland, Wellington, Palmerston North, Christchurch, and Dunedin.
MAORI EDUCATION FOUNDATION—The Maori Education Foundation Act 1961 established the Maori Education Foundation for the general purpose of promoting and encouraging the better education of Maoris and of providing financial assistance for that purpose. The Act provided for the constitution of a Board of Trustees of the Foundation consisting of a chairman appointed by the Governor-General; the Director-General of Education (deputy-chairman); the Secretary for Maori Affairs; the officer for Maori Education or some other officer of the Department of Education appointed by the Director-General of Education; and four Trustees appointed by the Governor General, one a Maori member of Parliament appointed on the nomination of the other Maori members of Parliament, one appointed on the nomination of the Maori Council of Tribal Executives, one appointed on the nomination of the Dominion Executive of the Maori Women's Welfare League, and one appointed on the nomination of the Minister of Maori Affairs. The Government made an initial grant of $250,000 and the Minister of Finance may approve further grants and also subsidies on contributions to the Foundation of money, land, and other property. By the end of 1966 the capital resources of the Foundation had risen to $1,680,000. Some of the principal purposes for which the Board of Trustees is empowered to apply the income of the Foundation include the education and vocational training of Maoris; the granting of financial assistance or of equipment to schools and institutions at which Maoris are receiving education; the provision of bursaries to assist Maoris attending secondary schools or any New Zealand or overseas university, agricultural college, or institution of similar status; the provision of post-graduate scholarships for Maoris holding university degrees or diplomas; and the making of special research or study grants to Maoris undertaking special research or study projects. Although the bulk of the Foundation's income is expended on grants to individuals, the major endeavours of the Foundation are being concentrated on fostering the greater participation of Maori parents and children in play-centres and kindergartens. During the 1966 academic year assistance was granted to over 1,100 pupils and students. While over 250 grants were of comparatively small amounts for school clothing or equipment, the bulk of the grants were towards the cost of board and tuition of secondary boarding school pupils. In a number of cases Foundation grants are a necessary supplement to other scholarships and awards. Seventy-five university students were being assisted in 1966.
ADULT EDUCATION: National Council of Adult Education—The functions and powers of the National Council of Adult Education as set out in the Adult Education Act 1963.
To furnish information and advice to the University Grants Committee and the Director-General of Education on any matter relating to adult education, and in particular in regard to any matter which may be the subject of representation or recommendation through the Minister to the Government of New Zealand by the University Grants Committee or the Director-General of Education:
To conduct such surveys and experiments in adult education as it may consider necessary or desirable:
To advise and assist wherever possible and whenever desirable any bodies or organisations which are engaged in adult education activities, including any such bodies or organisations which are financed partly or wholly from public funds:
To initiate from time to time experimental, exploratory, and pioneering activities relating to adult education; and to help to fill temporary gaps, in existing activities:
To call conferences and to co-operate with and foster co-operation between universities and other bodies and organisations engaged in adult education:
To collect, examine, and disseminate information relating to adult education:
Generally to take an overall cognisance of the development of adult education; and subject to the provisions of this Act or any other Act, to do whatever it considers necessary or desirable in order to stimulate activity in adult education so that it may best accomplish the purposes for which it exists.
From the coming into operation of the new Act on 1 January 1964, the Council ceased to make grants to the universities for adult education purposes (as it had done previously), and each university's adult education department is now financed from the block grants negotiated for the universities by the University Grants Committee. Although full responsibility and control of their adult education activities rests with the universities, each is advised by a committee representative of various community interests.
The adult education department in each university has a director in charge and a staff of lecturers or tutors. This staff contains general and specialist tutors, the latter catering for special interests such as music, drama, art, and home science. Two of the North Island universities also have tutors specialising in work among the Maori people. Some of the tutors are stationed in different parts of the university district and serve as area tutor-organisers. A large number of part-time tutors supplement the activity of the full-time staff (numbering approximately 60). The work is carried out by various methods—lecture courses, study conferences, seminars, schools of varying length (both residential and non-residential), and correspondence courses written for group study and discussion. Cultural activities such as organising itineraries of groups of musicians, dancers, and art exhibitions are also undertaken.
In addition to the adult education activities of the universities, a growing amount of adult education is being done by evening classes in secondary schools. There has also been an increase in the number of technical institutes which cater for a wide variety of adult educational interests. It was to ensure an orderly and co-ordinated development of these forms of adult education, as well as that carried out by the numerous voluntary bodies, that the National Council was given the functions mentioned earlier.
The National Council consists of two members appointed by the Minister of Education, two appointed by the University Grants Committee (one from a list of names suggested by the universities, and one from a list of names suggested by the voluntary bodies actively engaged in adult education), the Chairman of the University Grants Committee, and the Director-General of Education (or their nominees) ex-officio. The Council has the power to co-opt one member.
Education of New Settlers—The large number of new settlers coming to New Zealand from European countries in recent years led to the establishment of evening classes for teaching English and what may broadly be called civics. Classes were usually established at secondary schools or technical institutes and special textbooks and other materials were prepared for use by teachers and students. Several thousands of new settlers have passed through these classes and many have now become naturalised New Zealand citizens. There are still a few evening classes being held where numbers justify, but otherwise new settlers requiring assistance are now encouraged to apply for correspondence tuition.
Community Centres—In 1938 a community centre was established at Feilding under the supervision of two experienced educationalists specially appointed to the staff of the Feilding Agricultural High School. Classes have been conducted in drama, child care, literature, art appreciation, and physical welfare, both at the centre and in outlying areas. In 1944 a community centre was opened in a suburb of Christchurch. Subsequently, experimental centres were opened in Westport, Wakari, Hawera, and in the coal-mining districts of the Buller. These centres received some assistance, directly or indirectly, from public funds. There are, however, many other community centre schemes supported by voluntary effort.
SCHOOL LIBRARY SERVICE—This service, which is financed by the Department of Education and administered by the National Library of New Zealand, aims at giving children access to the best literature. Regular exchanges of children's and young people's books are sent on a circulating basis to approximately 2,500 schools. The schools served are primary, both public and private, intermediate, and district high schools. Pupils of the Correspondence School also receive books regularly.
All schools, including secondary schools, receive additional books on request. Some 807,195 requests were filled during the year ended 31 March 1966.
LIBRARY SCHOOL—The Library School of the National Library of New Zealand offers professional training to those holding university degrees or with equivalent education. Students receive allowances equal to those paid to students of teachers colleges. Facilities for training are offered to students sponsored by UNESCO and by countries participating in the Colombo Plan.
PACIFIC ISLANDS EDUCATION—The Department of Education acts in liaison with the Departments of External Affairs and Island Territories to assist other administrations including those in Fiji, Tonga, Western Samoa, the Gilbert and Ellice Islands, Pitcairn Island, New Hebrides, and British Solomon Islands Protectorate with their educational problems.
As part of this assistance, the Department of Education assumes responsibility for filling in the vicinity of 220 education posts in the Pacific. Officers and teachers are inspected and their rights protected against their return to New Zealand. The Officer for Islands Education has a staff including three inspectors, three scholarships officers, and two textbook writers. Advisory visits are made to most of the islands, and supplies of modern textbooks and apparatus are sent regularly. Many publications have been produced.
In addition, a very important function of the Islands Education Division is to operate and supervise closely a scholarship system which enables some 248 islands students to obtain in New Zealand schools, trade training centres, and universities, more advanced education than would otherwise be available to them. During the term of their scholarship these students are fully maintained by the Departments of Island Territories and External Affairs. In 1965, approximately 216 other students from Fiji and Tonga, the British Solomon Islands Protectorate, and the Gilbert and Ellice Islands and New Hebrides were supervised and assisted in obtaining the benefits of a more varied or advanced education than they could gain in the islands. These totals include 60 island students who are training as teachers in the various courses of the New Zealand teachers colleges.
CHILD WELFARE—The Child Welfare Division of the Department of Education was established by the Child Welfare Act 1925 for the purpose of the maintenance, care, and control of children who are under the protection of the State, and to provide generally for the protection and training of indigent, neglected, and delinquent children. While this Act is the general statutory authority for the work of the Division, the Infants Act 1908, the Adoption Act 1955, and the Child Care Centre Regulations 1960 provide the legislative basis for other particular aspects of the work.
The Division is administered from a Head Office in Wellington. It employs 259 field officers in 29 district offices, 407 institution workers, and 254 clerical officers. Field staff duties include preventive work; investigation and reporting for the Children's Court; supervision of children in their own homes; foster home, institution, and work placement; adoption and illegitimate birth inquiry work; the licensing of foster parents defined in the Infants Act 1908; registration of child care centres; inspection of children's homes run by voluntary organisations and examination of requests made by them for financial subsidies; the oversight of immigrant and refugee children. Field officers receive assistance in many of these duties from 152 honorary child welfare officers, who are people of integrity and local standing in their communities.
Facilities for institutional care and training include short- and long-term training centres for difficult and delinquent children and residential special schools for the deaf, mentally retarded, and emotionally disturbed children. There is also a small hostel for girls who have commenced work, but are not yet ready to live independently in the community.
While there is no specific statutory requirement that child welfare officers should engage in preventive work, the Division has always followed a policy of providing early assistance in an attempt to prevent children from becoming delinquent. Inquiries into the circumstances of infants in need of care and protection are accepted as one of the first steps in the prevention of later difficulties. The earlier that assistance can be given, the more likelihood there is of it being successful.
Children's Courts—Children's Courts are presided over by Stipendiary Magistrates specially authorised to exercise jurisdiction in these Courts. Very wide discretionary powers are given to Children's Courts. Wherever practicable the hearings are conducted in premises apart from the Magistrate's Court, and no newspaper is permitted to publish either the names of children appearing before these Courts or any particulars that are likely to identify a child.
A child for the purposes of me Act is a person up to 17 years of age.
Children's Courts deal with cases of children brought either (a) on a complaint under the Child Welfare Act that a child is neglected, indigent, delinquent, not under proper control, or living in a detrimental environment or (b) charged with an offence. After hearing the complaint or the charge, and in the light of the child welfare officer's report, the Court may, according to the needs of the case, commit the child to the care of the Superintendent of Child Welfare, or place him under supervision of a child welfare officer for a period (usually one year or two years) or discharge him with an admonition and, on occasion, an order for restitution or a fine.
Appearance before the Children's Courts in the three latest calendar years and the rates per 10,000 children aged 7 to 17 are given in the following table:
| Reason for Appearance | Number | Rate | ||||
|---|---|---|---|---|---|---|
| 1963 | 1964 | 1965 | 1963 | 1964 | 1965 | |
| * The discrepancy between the totals of this and the “Decisions” table is owing to the exclusion from this table of one case in 1964 and three cases in 1965 of applications by the manager of a private children's home for an agreement to be enforced. | ||||||
| For offences against special Acts, regulations, or bylaws | 353 | 466 | 504 | 6 | 9 | 9 |
| For more serious offences | 3,808 | 4,078 | 4,254 | 69 | 71 | 73 |
| Subtotals | 4,161 | 4,544 | 4,758 | 75 | 80 | 82 |
| On “complaints” under the Child Welfare Act | 665 | 832 | 975 | ... | ... | ... |
| Totals | 4,826 | 5,376* | 5,733* | ... | ... | ... |
The decisions made in Children's Courts are shown in the summary below for the three latest calendar years.
| Decision | 1963 | 1964 | 1965 |
|---|---|---|---|
| Committed to the care of the Child Welfare Superintendent | 559 | 784 | 797 |
| Placed under supervision of child welfare officers | 2,039 | 2,214 | 2,387 |
| Admonished and discharged with or without costs, restitution, or fine | 1,532 | 1,641 | 1,746 |
| All other decisions | 696 | 738 | 806 |
| Totals | 4,826 | 5,377 | 5,736 |
A new approach to the problem of delinquency was the establishment throughout New Zealand in 1959 of a Juvenile Crime Prevention Section of the New Zealand Police. The aim is to detect delinquency at an early stage and, by close co-operation between child welfare officers and specialist police officers, to deal with the less serious offenders without Court action. The police, after consultation with child welfare officers, decide whether or not there will be a prosecution. For those not being prosecuted appropriate action is taken, for example, in the form of a warning from the Police or continuing informal supervision by child welfare officers. During the year ended 31 December 1965, 4,441 cases were dealt with under this scheme without prosecution.
State Wards—Many of the children who are committed to the care of the Superintendent of Child Welfare and who are thereby under his guardianship are placed immediately in foster homes and either at school or in employment. Those who require special care and training which cannot be provided in the ordinary life of the community are placed in institutions administered by the Superintendent. Some few reside in private institutions and some are in boarding schools.
Of the total of 15,193 children under the control and supervision of the Child Welfare Superintendent and his officers at 31 December 1965, 3,881 were under the guardianship of the Superintendent and were placed as shown in the following summary.
| — | Number | Percentage of Total |
|---|---|---|
| Residing in individual private homes (foster homes, employers' or relatives' homes) | 2,923 | 75.3 |
| In institutions administered by the Child Welfare Division (including those temporarily admitted) | 628 | 16.2 |
| In mental hospitals | 172 | 4.4 |
| In residential schools and colleges (including schools for handicapped children) | 92 | 2.4 |
| In hospitals, convalescent homes, etc. | 12 | 0.3 |
| In children's homes (including orphanages, etc.) | 53 | 1.4 |
| Attending university or teachers' training colleges | 1 | – |
| Totals | 3,881 | 100.0 |
For the children requiring institutional care and training the Child Welfare Division administers several different types of institution. There are long-term training institutions for disturbed and delinquent adolescents. “Kingslea”, accommodating girls, is situated at Shirley, Christchurch, and “Kohitere”, accommodating boys, is located at Levin. They are essentially open institutions providing full educational facilities with qualified and trained teachers and also a wide range of vocational training. Another small institution at Featherston provides specially for girls of primary school age who are so difficult or disturbed as to require special educational and social training. A small hostel for girls at Wellington provides for some who, while in ordinary employment, require for the time being the conditions of supervision and care obtainable in a hostel. There are 11 receiving homes and boys' homes in the larger centres and a girls' home in Auckland which provide remand facilities, temporary care, and observation. Children not requiring institutional care but presenting behaviour and personality problems beyond the capacity of most ordinary foster parents are provided for in “Family Homes”. These are private houses owned by the Division and occupied rent-free by specially selected married couples who receive board payments and agree to care for children on a long-term basis as a condition of the tenancy. These homes are also used to provide transit accommodation in areas in which there is no receiving home or boys' home. Of the 31 homes now in operation, two are used as hostels for working adolescents.
Children Under Supervision—Children placed by the Courts under supervision of child welfare officers are supervised in their own homes, except that in a few cases, with the approval of the parents or guardians, the child welfare officer arranges placement elsewhere—e.g., in employment. Magistrates have the authority to order that part or all of the period of supervision be spent in an institution. Most children placed under supervision respond well; where they do not they may appear before the Court again and be committed to the care of the Superintendent. There were 2,848 children under supervision at 31 December 1965.
Preventive cases, numbering 5,411 at 31 December 1965, consist of children who, without any Court appearance, are being supervised and assisted by child welfare officers under arrangements made voluntarily with the parents or guardians.
Welfare of Children—Child welfare officers undertake a wide variety of miscellaneous investigations and inquiries concerning the welfare of children. In the year ended 31 December 1965, 10,537 cases were handled. Cases may be referred by neighbours, police, teachers, employers, doctors, solicitors, etc., or by parents themselves who are seeking advice and guidance. Some of these cases will respond quickly to help. Others may need preventive oversight and guidance over several months or even two or three years. Financial help can be given in special cases. In a relatively small number of cases preventive help is not sufficient and Court action is the outcome of inquiries.
As provided for in the Child Welfare Act 1925, child welfare officers, on receiving from the Registrars notifications of illegitimate births, make confidential inquiries and assist the mother as necessary in making provision for her child.
Child welfare officers administer the provisions of the Infants Act 1908 by which children under six years of age living apart from their parents or guardians for more than seven consecutive days are required to be in licensed foster homes unless they are residing with close relatives ant providing payment or reward is involved. At 31 December 1965, 540 such children were being supervised.
Under the Adoption Act 1955 a child welfare officer must give prior approval to the placement for adoption of a child under 15 years, or alternatively, the applicants must apply for an interim order of adoption from the Court. The Court is required to obtain a child welfare officer's report on such a placement before granting an order. A waiting period of at least six months is required, during which the placement is supervised by a child welfare officer, before a final order can be made.
The Division also has a measure of responsibility towards handicapped children generally, partly because of its role in assisting in the administration of residential schools for children who are deaf, mentally backward, or emotionally maladjusted. Child welfare officers, more especially in country areas, also assist in locating children who require special education, in advising parents or teachers concerning the facilities available, and in ensuring that the circumstances become known to appropriate agencies.
Inspection of children's homes operated by private organisations and administration of schemes of Government financial assistance to these homes is another important function of the Division. Financial assistance is given in the form of capitation payments for children in care and subsidies of up to 50 percent on expenditure for extension or replacement of buildings or additions to facilities.
Regulations for the registration and licensing of “Child Care Centres” (e.g., day nurseries, creches, etc.) have been in force since 1961.
Table of Contents
DEPENDENCE ON AGRICULTURAL AND PASTORAL EXPORTS—Products of animal origin average annually over 90 percent of the total value of New Zealand exports, and agricultural exports of grass seed and fruit can be added to raise even higher the value of exports of primary produce. New Zealand is the largest exporter in the world of butter and (in some years) of meat, and is also one of the leading exporters of wool and cheese. Exports of milk powder and casein have grown rapidly since 1947 and now exceed in value traditional exports such as tallow and hides and skins: New Zealand's export volume of milk powder is second to that of the United States.
The following table of exports by value indicates the relative importance of primary products:
| Year Ended 30 June | Dairy Produce | Meat | Wool | Hides, Pelts, and Skins | Total Exports* |
|---|---|---|---|---|---|
| *Of New Zealand produce. | |||||
| $ (million) | |||||
| 1963 | 138.0 | 173.0 | 214.4 | 25.4 | 620.0 |
| 1964 | 157.1 | 183.2 | 271.4 | 30.4 | 728.4 |
| 1965 | 180.9 | 212.5 | 208.6 | 31.7 | 733.7 |
| 1966 | 173.5 | 195.1 | 231.3 | 39.7 | 751.0 |
GENERAL MARKETING SITUATION: Meat—Most meat produced in the world is used for domestic consumption, and only about 6 percent of world output enters into international trade. About three-quarters of all meat exports come from five countries. In order of importance these are New Zealand, Denmark, Argentina, Australia, and the Netherlands. The import trade is dominated by the United Kingdom, which takes about two-thirds of the total exports. Next in importance as importers are the United States of America, and the Western European countries such as Italy, West Germany, and France.
Beef and veal comprise about half the world exports, with Argentina, Australia, and New Zealand the main exporters. In recent years, exports of pig meats (mostly by European countries) and mutton and lamb (mostly by New Zealand and Australia) have increased, but the amount of beef entering international trade has declined as a result of reduced shipments from Argentina. The United Kingdom remains the largest market for sheep meats.
The population of the United Kingdom is increasing only slowly, and the consumption per head of carcass meat has remained fairly stable in recent years. At the same time the United Kingdom home production has risen considerably following encouragement by a system of guaranteed agricultural prices.
Though the United Kingdom is traditionally New Zealand's export market for meat and must remain so in the foreseeable future, there has been for some years a growing realisation of the need for supplementary markets.
Until about 1955 New Zealand had not been able to establish permanent markets of any size for meat outside the United Kingdom, sales to Western Europe being limited to years of shortage. All countries in Western Europe have traditionally protected their agriculture. The establishment of the European Economic Community has not only formalised but also greatly extended these policies. Among the main supplementary markets are Japan, West Germany, West Indies, Canada, and the United States of America. Previous to 1955 nearly all New Zealand meat went overseas in carcass form. Now more than a quarter of it is exported precut or otherwise processed and it is packaged in some 6 million New Zealand made cartons. A small amount of specialised cuts is now air freighted to new markets.
In 1957–58, as a result of changes in the composition of the United States of America beef herd, a strong demand developed for manufacturing grades of beef. New Zealand and Australia helped to meet that demand. Although the quantities shipped from New Zealand each year have fluctuated since then, the United States has absorbed the bulk of the exportable surplus of beef.
Exports of New Zealand meat to the United States form only a very small proportion of national consumption. In February 1964 the United States and New Zealand Governments reached an agreement which guaranteed New Zealand continued access to the United States market with provision for a steady growth in the quantity exported each year from New Zealand. Access was granted for 103,000 tons of beef and veal in 1964. The annual rate of growth fixed in the agreement was the estimated rate of increase in the total United States market for these products, namely 3.7 percent. Based on this figure the permissible level of New Zealand exports was 107,000 tons in 1965 and 111,000 tons in 1966. A similar agreement was made between the United States and Australia.
The following table shows the main destination of exports from New Zealand of frozen and chilled beef and veal for the three latest years.
| Country of Destination | Year Ended June | |||||
|---|---|---|---|---|---|---|
| 1964 | 1965 | 1966* | ||||
| * Provisional. | ||||||
| tons | $(000) | tons | $(000) | tons | $(000) | |
| United Kingdom | 9,204 | 3,792 | 27,652 | 11,929 | 26,103 | 13,341 |
| United States | 91,197 | 45,384 | 55,428 | 27,704 | 50,490 | 28,495 |
| Canada | 2,543 | 1,304 | 1,881 | 1,004 | 1,177 | 741 |
| Other countries | 16,340 | 7,606 | 34,515 | 16,772 | 20,267 | 11,019 |
| Totals | 119,283 | 58,088 | 119,475 | 57,409 | 98,037 | 53,597 |
Imports into the United States of some classes of fresh, chilled, or frozen meat are shown in the following table. (Source: Commonwealth Secretariat.)
| Country of Export | Beef and Veal | Mutton and Lamb | ||||
|---|---|---|---|---|---|---|
| 1963 | 1964 | 1965 | 1963 | 1964 | 1965 | |
| tons (thousand) | ||||||
| New Zealand | 109 | 75 | 46 | 7 | 4 | 5 |
| Australia | 229 | 168 | 137 | 30 | 15 | 14 |
| Canada | 7 | 12 | 32 | – | – | – |
| Republic of Ireland | 32 | 9 | 3 | – | – | – |
| Mexico | 33 | 22 | 21 | – | – | – |
| Other countries | 35 | 71 | 32 | – | – | – |
| Total imports | 445 | 357 | 271 | 37 | 20 | 19 |
| United States production | 7,746 | 8,687 | 8,768 | 344 | 319 | 290 |
Wool—New Zealand is one of the largest exporters of wool in the world. Most of the wool is auctioned in New Zealand and buyers come from all the main importing countries to make their purchases of wool. A small percentage of wool produced is shipped to England for sale on the London market. Prices fluctuate according to the demand for wool. The threat of competition from synthetic materials is such that the International Wool Secretariat is actively promoting advertising, merchandising, and research. World wool production and wool utilisation have in recent years been approximately in balance and there has been no pressure on supplies.
World wool production increased by almost 40 percent in the 10 years to 1960–61; this growth reflects improvements both in carrying capacity per acre (number of sheep), and in wool production per sheep. Of the increase, probably over two-thirds stemmed from the upward trend in sheep population, the remainder from improved output per head of sheep. Since the war there has been no significant change in the broad geographical distribution of production, which remains heavily concentrated in Australia, New Zealand, Argentina, South Africa and Uruguay—all of which export on a large scale—and in the United States and the Soviet Union, neither of whose clips enters the international market to any significant extent. These countries account for 76 percent of world production; of the world total, Australia alone produces 30 percent and with New Zealand, Argentina, and South Africa some 53 percent.
Most of the major producing countries increased their wool production over the 10 years to 1960–61; Australia by 46 percent, New Zealand by 51 percent, and South Africa by 29 percent. In the Soviet Union wool production almost doubled. In the United States the increase was less than 20 percent, while production in South America was little changed.
The distribution of wool production does not, of course, coincide exactly with the distribution of the sheep population since the production of wool, or yield per sheep varies considerably. While there is undoubtedly scope for improvement in a number of the lower yielding countries, the yields, which are averages over the sheep populations as a whole, are determined by the type of pasture, breed of sheep, average age of flock, and age of the sheep at slaughter. Variations in yield between countries, therefore, do not necessarily reflect variations in efficiency, but rather differences in pastoral conditions and objectives in farming.
Sheep numbers and wool production for selected countries are shown in the following table. (Source: Commonwealth Secretariat.)
| Country | Sheep Numbers | Wool Production | Production per Head of Sheep | |||
|---|---|---|---|---|---|---|
| 1963–64 | 1964–65 | 1963–64 | 1964–65 | 1963–64 | 1964–65 | |
| million | million lb (greasy) | lb (greasy) | ||||
| Australia | 165.0 | 170.6 | 1,783 | 1,628 | 10.8 | 9.5 |
| New Zealand | 51.3 | 53.7 | 616 | 660 | 12.0 | 12.3 |
| Argentina | 48.0 | 48.0 | 395 | 397 | 8.2 | 8.3 |
| South Africa | 34.0 | 34.0 | 323 | 315 | 9.5 | 9.3 |
| Uruguay | 22.3 | 22.1 | 192 | 183 | 8.9 | 8.3 |
| United States | 28.0 | 26.6 | 287 | 253 | 10.2 | 9.5 |
| United Kingdom | 29.7 | 29.9 | 127 | 130 | 4.3 | 4.3 |
| U.S.S.R. | 133.9 | 125.2 | 809 | 785 | 6.0 | 6.3 |
| Whole world | 928.0 | 926.0 | 5,758 | 5,606 | 6.2 | 6.1 |
Dairy Produce—For the sale of dairy products New Zealand is very largely dependent on the United Kingdom market. In 1960 the total production of butter by 32 of the main producing countries of the world amounted to 4.2 million tons. In the same year world exports by 19 of the leading exporters amounted to about 560,000 tons, that is, only about 13 percent of world production entered into international trade. Of this quantity, 408.000 tons (73 percent) came on to the United Kingdom market. Of the exports of 431,000 tons of cheese from 20 countries in 1960 there were 133,000 tons sent to the United Kingdom. These figures show that relatively small changes in demand-supply relationships in individual countries can have a most disturbing effect on the United Kingdom market.
Some countries have adopted agricultural income and price support policies to maintain and stabilise farming incomes. Only industrialised countries with a relatively low proportion of their national income derived from agriculture can continue support measures on a large scale. International trade is adversely affected in several ways. To maintain prices at support levels many countries have restricted imports of agricultural products, so that entry into markets, in which New Zealand's exports could effectively compete, has often been denied. High support prices and consequent high domestic prices discourage consumption and often lead to the accumulation of supplies which are surplus to domestic requirements. Surpluses generated in this manner are frequently disposed of in other markets at prices well below the cost of production. New Zealand's position in the United Kingdom market was adversely affected in 1958 when some European countries dumped on the market such quantities of butter that there were serious falls in prices.
Since 1958 price reductions in some European countries have to some extent stimulated consumption in them, but not a great deal of progress has been made in the reduction of subsidised dairy production that leads to dumping. It is essential for New Zealand to maintain strong and consistent pressure in international councils so that these measures are furthered. There were signs in 1960 that European countries were prepared to exercise restraints to ensure a normal flow of supplies to the United Kingdom market, but dumping by a number of countries led to a serious fall in prices early in 1961. Discussions extending over a number of months in GATT and other international bodies were aimed at finding a remedy to the situation. Some alleviation of New Zealand's position was afforded in November 1961 when the British Government asked all countries currently supplying butter to Britain to agree to limit their shipments to the quantities proposed by GATT up to 31 March 1962. Britain has restricted imports of butter from 1 April 1962. This involved a waiver by New Zealand of the agreement for unrestricted entry to the United Kingdom market on the understanding that New Zealand would be granted a fair share of imports. When the New Zealand Government agreed in May 1963 to the request of the British Government (in connection with EFTA discussions involving Denmark) that the tariff of $1.5 a hundredweight on non-Commonwealth butter be suspended for the duration of the present system of quota restrictions, Britain agreed that New Zealand would be entitled to two-fifths of total permitted imports. The United Kingdom consults New Zealand before the opening of each quota year about the supply of butter to the United Kingdom market. The basic quota for 1966–67 was set at 430,000 tons, including an addition of 10,000 tons to Ireland's basic quota under the Free Trade Agreement. New Zealand had a basic quota of 168,000 tons, but was entitled to supply 174,200 tons. Under the 1966 Trade Agreement the minimum quantity of butter that will be imported from New Zealand was raised to 170,000 tons with the provision that New Zealand would share in any expansion of the level of total imports. For 1967–68 the total quota is 470,000 tons, consisting of 440,000 tons basic quota and 30,000 tons supplementary quotas. New Zealand's basic quota is 176,000 tons but this could be increased by a share in a possible additional import authorisation of 5,000 tons on a reserve quota.
New Zealand is moving towards the development of more supplementary markets for dairy produce, although quantities of the major products that can thus be disposed of are relatively small compared with exports to the United Kingdom, New Zealand's long-standing market. Major industrial countries where income levels and food-consumption habits could provide important markets have adopted trading policies aimed at restricting imports of foodstuffs to protect their agriculture. International commodity agreements are now proposed as a long-term solution to the problem facing the suppliers of some of the temperate foodstuffs.
TRADE AGREEMENTS WITH THE UNITED KINGDOM—The United Kingdom has always been New Zealand's main export market for primary produce. New Zealand's trading relations with the United Kingdom are governed by a number of formal commitments. Under the Ottawa Agreement of 1932 New Zealand undertook to maintain a preferential tariff on imports from the United Kingdom, while the United Kingdom for its part was obliged to grant duty-free entry for practically all New Zealand products and maintain specified duties on some foreign products of interest to New Zealand. The United Kingdom also undertook to place quota restrictions on foreign meats.
On butter the foreign tariff rate, and therefore the margin of preference, fixed in 1932 was $1.50 a hundredweight (this has since been suspended). On cheese the tariff preference was 15 percent; there was no preference set for mutton and lamb but a negligible tariff preference for beef, coupled with a foreign quota on meat which was designed to ensure an expanding share of the United Kingdom market was arranged. There never has been any preference on wool.
In 1958 the provisions of the Ottawa Agreement were reviewed. The new agreement which came into force on 25 November 1958, gave new flexibility to New Zealand's international trading and negotiating position. It was agreed that the levels of preferences in favour of the United Kingdom set by the 1932 Agreement could be modified but the basic principle was retained to ensure that the close and mutually beneficial economic partnership between the United Kingdom and New Zealand would continue. All the existing rights and preferences for New Zealand goods entering the United Kingdom were preserved. These included the 1957 supplementary agreement providing for annual consultation on the agricultural production and marketing policies of the two countries as well as the 10–year right of entry to the United Kingdom market, without restriction as to quantity, of butter, cheese, skim and buttermilk powders, casein, and chilled and frozen pork. Access for these products was guaranteed until 31 May 1967. The 15–year right of entry for New Zealand meat, agreed to in 1952 outside the 1932 pact, remained in force. The Joint Declaration on Meat signed on 14 February 1952 accorded New Zealand unrestricted access to the British market for beef, veal, lamb, and mutton. This right was due to expire in September 1967.
In 1966 further negotiations were carried out for the revision and extension of our trade arrangements with Britain. The imminence of the expiry dates of the assurances of unrestricted entry led the Government to initiate negotiations with the United Kingdom about the conditions of entry for New Zealand exports beyond 1967. It was regarded as essential for New Zealand to ensure that the marketing of its increasing farm production could be based on conditions of certainty of access into its main market. Officials began talks in London in November 1965. The negotiations were resumed at official level in May 1966 and the major issues which could not be resolved were finally settled in the ministerial negotiations which took place from 10 to 28 June. The final text of the new agreement was signed in New Zealand on 24 November 1966.
Britain agreed to admit until 30 September 1972 without restriction of quantity, imports of New Zealand beef, veal, lamb, mutton, cheese, skim and buttermilk powders, casein, and chilled and frozen pork. In 1961 New Zealand had voluntarily waived a similar right of unrestricted access for butter in favour of a quota system designed to protect the price of New Zealand butter against dumped and subsidised supplies.
This quota arrangement has become part of the 1958 Agreement through an Exchange of Letters in May 1963 and was balanced by New Zealand's agreeing to the suspension of the preference on butter. The scheme has now become an integral part of the total trading relationship between New Zealand and the United Kingdom. In this context the scheme was reviewed during the 1966 negotiations and certain modifications agreed upon. The United Kingdom Government reaffirmed its intention not to remove quota restrictions on butter so long as the circumstances for which they were imposed remained, that is, the protection of New Zealand against dumping. The minimum quantity of butter to be imported from New Zealand while quotas remained was raised from 164,000 tons to 170,000 tons. The Agreement also provided that New Zealand would share in any growth of total imports above the existing level. These new assurances replaced that contained in the 1963 Exchange of Letters which entitled New Zealand to a 40 percent share of total permitted imports.
Apart from these provisions on access it was settled that the 1959 Agreement amended as mentioned should continue for at least three years from 1 January 1967 and may continue thereafter subject to six months notice. In return for these concessions New Zealand guaranteed duty-free entry for certain British goods and minimum margins of preference of up to 20 percent in some instances for a further number of goods. The total value to the United Kingdom in current trade of these items is about $16 million.
These are the formal arrangements. In practice they are of considerable importance because of New Zealand's dependence on the United Kingdom market. Of our total exports, nearly half is sent to Britain but for certain products the degree of dependence is much greater. In recent years over 80 percent of butter, cheese, mutton and lamb exports have been sent to the United Kingdom.
Restricted Alternative Outlets—Deriving from history and continuing British demand for New Zealand's food products the link between New Zealand and Britain is a major element in New Zealand's trade pattern. At the same time New Zealand's efforts to reduce its economic vulnerability and dependence on Britain by diversifying markets for existing export products and developing new markets for new exports have met with some success. Significantly increased export markets have been the United States, the European Economic Community, and Japan.
However, formidable barriers restrict the further expansion of New Zealand's exports, the greatest being the agricultural protectionist policies in force in many of the countries which are consumers or potental consumers of the food products (particularly dairy products) New Zealand exports. In many cases these policies are backed up with measures—tariff and non-tariff—which either limit access for efficient producers and exporters or deny access altogether. Not only do these policies make it difficult for New Zealand to export but they also frequently result in dumping of surpluses by other countries on relatively free markets.
New Zealand has fought these restrictive policies for many years through bilateral means and in the forum provided by the General Agreement on Tariffs and Trade (GATT). It has been New Zealand's hope throughout the post-war period that a wider acceptance of the whole philosophy of the GATT—universal, multilateral, and non-discriminatory trade-would form a basis for the policies and actions of all trading nations.
Other factors too, make it difficult for New Zealand to expand its export markets. Developing countries often cannot afford to import freely dairy produce and meat which to them are luxuries. Moreover, consumer preference for local foodstuffs, the lack of cold storage facilities, and the existence of religious and social barriers against meat consumption are all significant barriers to trade with these areas. Difficulties such as these make New Zealand more conscious of the restrictions on imports in the countries of Europe and North America which could be expected to be “natural” markets for our products.
EUROPEAN ECONOMIC COMMUNITY—The Rome Treaty establishing the European Economic Community (EEC) came into force on 1 January 1958. The member countries are Belgium, France, West Germany, Luxembourg, Italy, and the Netherlands. In mid-1966 the EEC finally completed the broad lines of its agricultural policy—previously the source of much contention—and is now gradually introducing free trade in all farm products in preparation for a single free agricultural market within the Community after 1 July 1968. The same date has also been set as the target for complete free trade within the Community in industrial goods, and by then, too, complete labour mobility within the Six should have been achieved. On 1 July 1968 the EEC's common external tariff—a uniform barrier to imports from outside countries—will also come into effect.
In 1961–63 Britain attempted to negotiate entry to the EEC. However, the negotiations ended in failure in January 1963 with France's insistence on strict application of the Rome Treaty to Britain without special dispensations, particularly for agricultural products.
In 1966–67 Britain probed the attitude of the Six to the possibility of re-opening formal negotiations.
The prospect of Britain negotiating entry to the EEC is a vital issue for New Zealand, and the success of any such negotiations could have the most far-reaching consequences. The basis of the EEC's agricultural policy is that all internal output should be disposed of profitably before imports are permitted from non-member countries. This policy has led to expanding agricultural production in the Community at the expense of potential exporters to the members of the Six. The Community's common price system involves levies on imports of cheaper agricultural commodities from non-member countries to raise prices to the EEC level. If Britain joined the EEC New Zealand would face a most serious problem for dairy products, especially butter, under the import system that would apply (as well as difficult problems for meat). Unless there were adequate agreed safeguards, New Zealand would have to find alternative markets or cut back production. This would be disastrous for the New Zealand dairy industry since our exports of butter to Britain in 1965–66, at $93.6 million, were nearly 86 percent of total butter exports and 12.6 percent of all exports of New Zealand goods.
However, New Zealand has made its case widely known overseas. During 1966 the Minister of Overseas Trade toured EEC capitals where he gained renewed recognition in many quarters that New Zealand was a special case and would require special treatment. Discussions with the British Secretary of State for Commonwealth Affairs in Wellington in February 1967 reaffirmed that British Ministers recognised New Zealand's unique dependence on the British market and the necessity for establishing safeguard arrangements.
EUROPEAN FREE TRADE ASSOCIATION (EFTA)—On 27 May 1959 Sweden invited Austria, Denmark, Norway, Portugal, Switzerland, and the United Kingdom (“The Seven”) to join with her in exploring the possibility of forming a free trade area. Discussions began in Stockholm in June 1959, and a Convention for a European Free Trade Association, agreed by Ministers of the Seven on 20 November 1959, became effective on 3 May 1960. Finland has been included as an associate member.
The Convention defines the objects of the Association as (1) to promote economic expansion in the area of the Association and in each member state; (2) to ensure that trade between member states takes place in conditions of fair competition; (3) to prevent significant disparity between member states in the conditions of supply of raw materials produced within the area; and (4) to contribute to the harmonious development and expansion of world trade and to the progressive removal of barriers to it.
Members agreed to abolish their tariffs on industrial goods originating in the area within 10 years by means of a series of reductions. An initial 20 percent reduction of tariffs was made on 1 July 1960. Members undertook to abolish quantitative restrictions on imports of goods from the free trade area within 10 years. There is no common external tariff for the Association, each member country being free to fix the level of its tariffs against the countries outside the area. Various rules govern trading within the area of goods manufactured wholly or in part from materials originating outside the area and fair conditions of competition—such matters as government subsidies, restrictive practices, dumping, etc. Special arrangements are in force in relation to agricultural produce and fish.
The Council of EFTA consists of one ministerial or official representative from each member country. Each state has a single vote and recommendations must normally be unanimous. Decisions of the Council are binding on member countries.
EFTA Tariff Reductions—By 1963 tariffs were lowered to half their original level. Following the breakdown of negotiations for Britain's entry into the European Economic Community a new phase of activity was begun by the European Free Trade Association. Plans were made to hasten the removal of all tariffs on industrial goods and new proposals were put forward for agricultural and fishery products. In May 1963 agreement was reached to set up a completely free trade area in industrial goods by the end of 1966, and this position has virtually been reached.
UNITED KINGDOM MARKET: Dairy Produce—New Zealand's important position in the supply of butter, cheese, and milk powder to the United Kingdom market is illustrated in the following table, showing imports into the United Kingdom, by country of export. Domestic production of butter in the United Kingdom is relatively small in comparison with total supplies. Domestic cheese supplies, on the other hand, are comparatively large, as is also the domestic output of milk powder. (Source: Commonwealth Secretariat.)
| Country of Export | Butter | Cheese | Milk Powder | ||||||||
|---|---|---|---|---|---|---|---|---|---|---|---|
| 1938 | 1964 | 1965 | 1966 | 1938 | 1964 | 1965 | 1966 | 1963 | 1964 | 1965 | |
| tons (thousand) | |||||||||||
| New Zealand | 130 | 176 | 170 | 165 | 82 | 81 | 81 | 68 | 33 | 39 | 47 |
| Australia | 90 | 75 | 64 | 78 | 12 | 15 | 12 | 7 | 4 | 4 | 4 |
| Canada | 2 | 18 | – | – | 34 | 14 | 14 | 14 | – | – | 1 |
| Denmark | 118 | 90 | 101 | 100 | 1 | 9 | 9 | 9 | 1 | 3 | 1 |
| Netherlands | 36 | 15 | 20 | 19 | 10 | 11 | 11 | 16 | 6 | 7 | 2 |
| Other countries | 100 | 90 | 84 | 83 | 7 | 20 | 23 | 27 | 26 | 43 | 25 |
| Total imports | 476 | 464 | 439 | 445 | 146 | 150 | 150 | 141 | 70 | 96 | 80 |
| United Kingdom production | 20 | 23 | 36 | 30 | 43 | 110 | 113 | 107 | 86 | 68 | 105 |
On average, over 88 percent of New Zealand's total exports of butter and almost 81 percent of the total exports of cheese go to the United Kingdom.
The following table shows the comparative figures for consumption of butter and margarine in the United Kingdom. (Source: Commonwealth Secretariat.)
| Product | 1938 | 1960 | 1961 | 1962 | 1963 | 1964 | 1965 | 1966* |
|---|---|---|---|---|---|---|---|---|
| * Provisional. | ||||||||
| lb per head | ||||||||
| Butter | 24.1 | 18.3 | 19.7 | 20.3 | 19.3 | 18.9 | 19.3 | 19.7 |
| Margarine | 10.0 | 15.0 | 13.3 | 13.1 | 13.3 | 13.3 | 12.0 | 12.0 |
Meat—The following table shows the imports of meat into the United Kingdom from the principle countries, by country of export. (Source: Commonwealth Secretariat.)
| Country (of Export) | Mutton and Lamb | Beef and Veal | All Meats* | ||||||||
|---|---|---|---|---|---|---|---|---|---|---|---|
| 1938 | 1964 | 1965 | 1966 | 1938 | 1964 | 1965 | 1966 | 1964 | 1965 | 1966 | |
| * Including pig-meat, offal, and canned meat. | |||||||||||
| tons (thousand) | |||||||||||
| New Zealand | 184 | 293 | 295 | 271 | 52 | 26 | 29 | 19 | 341 | 346 | 311 |
| Australia | 95 | 23 | 23 | 10 | 115 | 85 | 91 | 68 | 137 | 144 | 106 |
| Argentina | 45 | 12 | 15 | 20 | 354 | 149 | 108 | 118 | 193 | 143 | 162 |
| Denmark | – | – | – | – | – | – | – | – | 337 | 351 | 347 |
| Other countries | 22 | 11 | 12 | 15 | 68 | 85 | 61 | 80 | 353 | 334 | 342 |
| Totals | 346 | 339 | 345 | 316 | 589 | 345 | 290 | 285 | 1,361 | 1,318 | 1,268 |
| United Kingdom production | 211 | 252 | 241 | 265 | 604 | 864 | 818 | 854 | 2,048 | 2,073 | 2,099 |
New Zealand is one of the leading suppliers of meat to the United Kingdom, accounting for about four-fifths of the imports of mutton and lamb and over one-fifth of total meat imports.
It has been recognised by New Zealand meat exporters that the dispatch of ever-increasing quantities of lamb to Britain could lead to over-supply and a drop in prices. A Market Development Committee, made up of five members of the Meat Producers Board and five representatives of the export industry has been established under the Meat Export Control Amendment Act 1966. This Committee asked meat exporters to divert 10 percent of Iamb sales for the 1966–67 season to markets other than the United Kingdom. Failure to divert the required weight of lamb will involve the payment of a levy at the rate of 2.5 cents a pound.
New Zealand's frozen beef competes under difficulties with chilled and fresh beef from countries nearer the United Kingdom, with the consequence that the New Zealand share of the United Kingdom's beef imports has been relatively small.
It should be noted that, partly as a result of agricultural support, well over half the meat consumed in Britain is now obtained from domestic supplies. A five-year National Economic Development Plan of the British Government released in September 1965 proposes to increase further the productivity in agriculture to meet the major part of the food-demand growth expected by 1970 with the object of lessening the need for imports. Support for agriculture is given in the form of guaranteed prices for the main agricultural commodities and direct farming grants mainly designed to raise farm productivity. In general, the price guarantees are maintained by payments to farmers of the difference between guaranteed prices and average market prices (deficiency payments) and imports are not restricted. Meat is considered to have one of the most important parts to play in any selective expansion programme, but it is proposed that this will be done consistently with commitments to overseas suppliers. The main emphasis is to be on beef and veal production and as two-thirds of the home-produced beef comes from the dairy stock there will be an accompanying increase in output of milk and its products.
THE ORGANISATION OF MARKETING—In a country such as New Zealand which is very dependent upon overseas trade, the efficient organisation of marketing of primary produce takes on a special importance. Since the gradual abandonment of the principles of laissez faire from the First World War onwards, great changes have taken place, and developments have been described in detail in earlier issues of the Yearbook.
Broadly speaking, the policy of controlled marketing of primary products has exhibited five phases:
In the early 1920s the producer organisations made moves to rationalise the organisation of marketing.
The next stage was for the State to trade directly, buying products outright, bearing losses and retaining profits. The Primary Products Marketing Act 1936 established the Marketing Department, which confined its pre-war operations to dairy produce.
This was followed, after the outbreak of the Second World War and the establishment of bulk purchase, by the formation of financial pool accounts for each industry, the profits, subject to the general policy of stabilisation, being paid out to the suppliers, and any reserves held for the benefit of the industry. During the war the United Kingdom Government was the sole purchaser of imported foodstuffs, and the Marketing Department the authority in New Zealand responsible for the bulk purchase and shipment of dairy produce, meat, wool, and tallow.
The fourth phase was the direction of policy by boards and committees with the assumption of executive and not, as previously, merely advisory powers. Each body continued to use the marketing organisation for assembly, storage, transport, distribution, and accounting which the Marketing Department had built up, these services being made available at cost.
The fifth phase was the progressive transfer from 1947 to various boards or authorities representative of the industry concerned (with Government representation to protect the public interest) of the responsibility and authority for the effective marketing of their own products, or the return to private enterprise with the boards assuming mainly their former pre-war functions.
Marketing Authorities—Since about 1950 the principle has been accepted that producers should be predominantly responsible for the marketing of their products. The major statutes under which specific marketing authorities operate are the Dairy Board Act 1961, the Meat Export Control Act 1921–22 and the Amendment Act of 1956 (for the Meat Producers Board), and the Meat Export Prices Act 1955, the Wool Commission Act 1951, the Milk Act 1944, the Apple and Pear Marketing Act 1948, and the Primary Products Marketing Act 1953 (as regards citrus fruit, honey, and eggs).
Dairy Produce—By the Dairy Products Marketing Commission Act 1947 the functions of the Marketing Department as regards butter and cheese for export (later extended to cover the control of all dairy produce for export) were transferred to the New Zealand Dairy Products Marketing Commission. By the same Act the control and regulation of butter and cheese for local consumption were also transferred to the Commission. Under the Dairy Board Act 1961, which came into force on 1 September 1961, the functions of the Commission were assumed by the New Zealand Dairy Board.
The Dairy Board acquires and markets all New Zealand butter and cheese intended for export, controls the export of other dairy products, and regulates the marketing of butter and cheese in New Zealand. In selling the industry's exportable surplus of milk powder and casein, the Board is guided by an advisory committee for each product. The Board owns in the United Kingdom a company, Milk Products (N.Z.) Ltd., through which all New Zealand milk powder sold in the United Kingdom is distributed. It also owns Empire Dairies Ltd., which acts as one of the 17 first-hand agents through which New Zealand butter and cheese are distributed in Britain. The Board carries out extensive advertising and publicity of New Zealand produce in the United Kingdom.
Meat—The New Zealand Meat Producers Board was constituted in 1922 under the provisions of the Meat Export Control Act 1921–22 to protect the interests of the producers. The Board obtains funds by the imposition of a levy on all meat exported, the levy being at present 0.075c per pound on all carcass meat. Its main functions are (a) to ensure that all export meat is graded to a standard; (b) to negotiate shipping freight, organise shipping, and allocate space; (c) to organise advertising or allied promotional work. Provision was made by the Meat Export Prices Act 1955, however, for the determination annually by the Meat Export Prices Committee of minimum prices for meat exported from New Zealand. The farmer sells his stock to a works or exporter and is paid by the works or exporter, who in turn is reimbursed by the Meat Producers Board for any deficiency payment.
Under the Meat Export Control Amendment Act 1959 the Meat Producers Board may purchase meat for sale outside New Zealand to promote the sale of meat in other countries, provided such action establishes new markets. A further amendment to the Act in 1962 gives the Meat Board power, with the approval of the Minister of Finance, to provide financial backing to export companies operating in any markets.
To encourage the further exploitation of new markets, a company was formed in 1960 on the initiative of the Meat Producers Board. The capital is provided by the New Zealand owned freezing companies, but these companies and the Meat Producers Board appoint an equal number of directors. The company ensures that new markets are adequately supplied and that reasonable pricing policies are followed.
Wool—By the Wool Commission Act 1951 there was established a Wool Commission with the principal function of assuring minimum prices for greasy, scoured, and growers' slipe wool in accordance with the table of minimum prices (effective only after agreement with the Minister), for New Zealand wool sold in New Zealand or the United Kingdom at auction sales approved by the Commission. The Wool Disposal Account was abolished and its moneys, together with those standing to the credit of the Wool Industry Deposit Account, were transferred to the Wool Commission Account which was established by the Act. The marketing of wool is carried out by public auction. Although the Wool Commission Act makes provision for a charge to be made on all wool sold or exported in order to cover the administration costs of the Commission, in fact no such charge has ever been levied. The annual interest earnings on the Commission's investments, together with profits from the resale of wool bought in at floor price, have met all costs and, in addition, have been sufficient to augment the original capital. The Commission, acting on behalf of the Wool Board, collects; a levy, which is paid over in its entirety to the Wool Board for research and promotional activities. From July 1964 the levy increased from $0.75 to $2.35 a bale to enable the Wool Board to meet its share of the budget of $26 million for promotion and research by the International Wool Secretariat, of which Australia, New Zealand, and South Africa are members. Since 1954 the Commission has from its funds made a supplementary payment to the Board each year of an amount equal to that levied on growers direct and this meant that the levy on growers for Wool Board purposes was, up to 1963, at half the rate that otherwise would have applied. Since 1964 the Commission's supplementary payment has been on a changed basis of 0.07c per pound of greasy wool, which is approximately equivalent to $1.50 a bale.
Apples and Pears—Apples and pears are purchased from growers by the New Zealand Apple and Pear Marketing Board. This Board was set up in 1948, in terms of the Apple and Pear Marketing Act 1948, to acquire and market the apple and pear crop. It administers a guaranteed price scheme based on the cost of production of apples and pears. This price is a New Zealand average, and within it prices to growers vary for the different varieties, grades, and sizes. In this case the Board does not itself declare the average price to be paid for apples and pears, its power being limited in this respect to making recommendations to the Minister of Agriculture, who declares the cost of production. This cost of production has, since the passing of an amending Act in 1954, become the average price to be paid for apples and pears for the season concerned. The Board is charged with the duty of recovering from the market these prices together with the costs of marketing. It determines the wholesale prices at which fruit is sold in New Zealand by authorised wholesalers to retailers. If in any season the total receipts from sales of fruit by the Board exceed the amount which the Board is required to pay to growers in accordance with the declared average price, the surplus, after deduction of costs and expenses incurred by the Board, is apportioned between a reserve fund and the growers. Until the reserve fund reached $2,000,000 the whole of the annual profit was paid into it. From then until the fund reached $2,500,000 the profit was distributed in the proportion of 25 percent to the growers and 75 percent to the fund. This amount having been reached, the profit is now allocated equally between the two. If sales in any season realise less than the amount the Board is required to pay, the deficiency is met from the reserve fund. Most apples and pears are purchased by the Board, with the Act making limited provision for certain private sales by growers in accordance with regulations issued thereunder. The Board was able to declare a bonus to fruitgrowers for five seasons from 1953–54, the average amounts paid out per case being for 1954, 3.408c; for 1955. 1.975c; for 1956. 3.317c; for 1957, 11.725c; and for 1958, 4.100c. In 1959 a loss of $867,926 was incurred by the Board and in 1960, though a profit of $608,886 was made by the Board, it was agreed with the growers that no bonus would be paid, the amount involved being invested in a processing factory set up by the Board. In the 1961 season the Board incurred a loss of $269,608 but in 1962 there was a profit of $46,568, and a bonus of 0.458c per case was paid. In 1963 there was a loss of $139,160, and in 1964 a loss of $1,247,790. In 1965 there was a profit of $438,552, but in 1966 there was a heavy loss of $1,823,060.
With the exceptions listed below, all fruit must be offered to the Board, and accepted by it if it comes within the scope of the New Zealand Grown Fruit Regulations 1952, which set standard grades with which the fruit must conform.
Officers of the Department of Agriculture inspect the fruit, and if it complies with the required standards the fruit becomes the property of the Board.
The exceptions under which fruit is not required to be offered to the Board are:
Growers may sell direct to consumers in lots of not more than two cases, or with permission of the Board, to retailers in specified localities. In the latter case the Board may prescribe conditions as to quantities, varieties, standards, etc., of fruit sold:
Manufacturers may be licensed by the Board to purchase their requirements direct from growers (although in some cases the Board itself purchases fruit and resells it to the factory). In such cases, also, the Board may make conditions as above:
Growers may also be permitted by the Board to sell at municipal markets established under the Municipal Corporations Act 1954. The Board is not obliged to accept fruit from a grower while he holds a permit to sell at such a market.
The Board decides what proportion of the fruit is to remain in New Zealand and what proportion is to be exported, and arranges for the storage and release of varieties according to their condition and keeping capacity, in order to make fruit available for as long a period as possible during the year. As at 1 December 1953 the Board purchased from the Government the greater part of the facilities then in use for the handling of the crop. They included cool stores and ancillary equipment. Since then, however, the reserve fund, which has been built up from profits derived almost solely from exports, has been invested in a chain of modern cool stores and mechanical equipment designed for the improved handling of fruit.
A Committee of Inquiry' into the sale of apples and pears on the local market reported to Parliament on 4 October 1961—see parliamentary paper H. 29A. The Committee supported continuance of the existing form of marketing with minor variations.
Potatoes—The Potato Board, with equal representation of growers and merchants and an officer of the Public Service as an advisory member, was established by the Potato Growing Industry Act 1950. Its principal function is to ensure that an adequate supply of main-crop potatoes shall be available for consumption. Its powers include the making of contracts between growers and the Board for main-crop potatoes, and the appointment of wholesalers authorised to purchase from growers and to sell potatoes in respect of which contracts have been made with the Board. In June 1956 the Government announced that it would guarantee the overdraft of the Potato Board to enable the Board to guarantee a certain schedule of minimum prices to contract growers for any potatoes unsold at the end of the season. The purpose is to encourage the growing of an adequate supply of potatoes.
Milk—The New Zealand Milk Board was set up in 1953. It operates the National Milk Scheme and engages in other activities for the purpose of ensuring an adequate supply and efficient distribution of milk.
The Board may make a levy on milk to finance its operations but while a subsidy on milk is payable from the Consolidated Revenue Account the rate of levy requires the approval of the Minister of Agriculture.
Retail prices are fixed by Order in Council. The price for the milk to the producer is fixed by the Government after consultation with the Milk Board. Intermediate margins, such as those for pasteurising and bottling milk and to vendors for its delivery, are fixed by the Government on the recommendation of the Board. The total cost at the present time exceeds the amount paid by the consumers, the balance being met by subsidy. It is the function of the Milk Board to administer the whole town milk scheme on behalf of the Government which, however, retains a direct interest by virtue of the substantial sum paid in subsidy.
Eggs—The Egg Marketing Authority, which was established in 1953, consists of seven members—four producer members of the New Zealand Poultry Board and three Government representatives. The principal function of the Authority is to regulate and control the marketing and distribution of eggs and egg pulp in New Zealand and elsewhere in accordance with the regulations, to ensure as far as possible sufficient supplies of eggs and their equitable distribution in the general interests of producers and consumers.
The New Zealand Egg Marketing Authority operates principally through licensed distributors in the various districts who, on commission, receive and resell eggs, or, as directed by the Authority, manufacture egg pulp for the use of bakers and pastrycooks. Eggs are subject to price control. A subsidy, at present at the rate of 3.33c per dozen, is paid by the Government in respect of eggs received at authorised egg floors (as the licensed distributors are known). This is to offset floor charges and distribution costs which would otherwise be passed on to the consumers.
Imported Citrus Fruits and Bananas—Since the beginning of 1951 the importation and marketing of imported citrus fruits, bananas, and pineapples have been taken over by a registered company, Fruit Distributors Ltd., representing trade interests. The operations of the company are defined and restricted by an agreement between it and the Government. There are two Government members on the company's board of directors.
New Zealand Lemons and Oranges—The Citrus Marketing Authority was established in 1953 to market fresh lemons, either directly or through agents, throughout New Zealand and to process unmarketable but otherwise sound fruit into by-products, such as fruit juice and lemon peel. The Authority has a membership of six, five of whom are nominees of the New Zealand Citrus Council and represent the producers, and one appointed by the Minister of Agriculture as the Government member who also protects the interests of consumers.
The Citrus Marketing Authority controls the assembly and distribution of New Zealand lemons, and also New Zealand grown sweet oranges. The entire output of fruit, which comes under the jurisdiction of the Authority, is sold at agreed prices to Fruit Distributors Ltd. The Authority operates processing and packing facilities at Kerikeri, and Tauranga.
Honey—The Honey Marketing Authority, set up in 1953, undertakes the task of packing and marketing honey within New Zealand and for export, and operates the blending plant in Auckland. A levy is made at the rate of 1c per pound on all honey sold locally and the funds paid into the Honey Industry Account, which is administered by the Authority for the benefit of the industry in general.
The Authority comprises four members elected by beekeepers, and one member appointed as Government representative. One of the functions of the Government representative is to watch the interests of the consumer.
TRANSPORT AND OVERSEAS MARKETS—Primary produce forms the bulk of New Zealand's exports and it comes to hand for shipment in seasonal cycles. These are most pronounced for lamb, and apples and pears, but apply also to a marked extent to mutton, beef, wool, and related produce. Butter, cheese, and other dairy produce become available throughout the year but production is considerably higher in the six months October to March than in the remainder of the year. The peak season for all the animal products is much the same, being roughly November to May, while there is a shorter concentrated season for fruit in March and April.
This seasonality presents shipping problems in the marketing process. In addition, the bulk, of the commodities are perishable and require continuous refrigeration throughout the period of at least two to three months between production and consumption. The demand for shipping space lags a little behind the season, generally building up in January and declining in June. A realisation of the demands that increased production was making on transport, storage, handling, and shipping services led in 1964 to the setting up of an Export and Shipping Council, an independent body whose main purpose is to improve the efficiency and economy of New Zealand's export trade particularly as it relates to transport services. Shipping has received special attention as shipping costs absorb a substantial portion of market realisation.
The Council is representative of producer boards, freezing companies, transport interests, harbour boards, the Associated Chambers of Commerce, and the Federation of Labour. It has been successful in bringing into effect many of the recommendations of the streamlining report on ports, shipping, transport and other services, produced as a result of consultations between the producer boards and the main shipping lines. The Council works through committees concerned with the following subjects: shipping allotment procedure; peak shipping requirements; packages and cargo handling; cartoned meat; port facilities and transport; marking, stowage, and sorting; development markets; import licensing year.
PRICES OF PRIMARY PRODUCTS: Wool—Statistics of greasy wool sold at auction in New Zealand (compiled from information supplied by the New Zealand Wool Commission) are shown in the following tables. The first table gives total quantities and values as recorded at sales, no attempt being made to allow for variations in quality or in the relative quantities of the various types of wool sold from season to season. Besides price movements, therefore, the average value per pound of wool sold shown in this table includes variations on account of these additional factors. Under the Wool Commission Act 1951 the Wool Commission is authorised to prepare a table of minimum prices for various classes of wool, which becomes effective by agreement with the Minister of Agriculture. Where wool is sold at less than the minimum price at an approved sale, the Commission may supplement the sale price so as to increase it to the minimum price, or, alternatively, may buy such wool at a price not greater than the minimum price. The Commission has not purchased wool to any extent except in the 1957–58, 1958–59, and 1966–67 seasons.
| WEIGHT, SALE VALUE, AND AVERAGE VALUE PER POUND OF GREASY WOOL SOLD AT AUCTION | ||||
|---|---|---|---|---|
| Season | Weight of Greasy Wool Sold | Sale Value | Value per Pound | Average Minimum Floor Price per Pound of Greasy Wool |
| * See Latest Statistical Information. | ||||
| lb(m) | $(m) | c | c | |
| 1953–54 | 317.1 | 132.8 | 43.75 | 21.67 |
| 1954–55 | 338.6 | 140.2 | 41.39 | 21.67 |
| 1955–56 | 341.6 | 131.5 | 38.49 | 25.00 |
| 1956–57 | 356.2 | 162.6 | 45.63 | 25.00 |
| 1957–58 | 370.4 | 127.0 | 34.30 | 27.50 |
| 1958–59 | 406.3 | 122.1 | 30.06 | 27.50 |
| 1959–60 | 409.2 | 132.2 | 37.21 | 27.50 |
| 1960–61 | 420.9 | 141.6 | 33.51 | 27.50 |
| 1961–62 | 423.4 | 138.2 | 32.65 | 27.50 |
| 1962–63 | 444.1 | 158.5 | 35.70 | 27.50 |
| 1963–54 | 433.9 | 199.1 | 45.89 | 27.50 |
| 1964–65 | 443.2 | 155.6 | 35.12 | 29.17 |
| 1965–66 | 509.2 | 176.6 | 34.67 | 29.17 |
| 1966–67 | * | * | * | * |
In the next table details of a wool price index on base: average over all sales 1963–64 season (= 1000) are given. This index has been compiled in an attempt to eliminate all but the price factor in movements of average wool values. A description of the make-up of this index is given in a supplement to the December 1964 issue of the Monthly Abstract of Statistics.
| Season | Index Numbers* Base: 1963–64 (= 1000) |
|---|---|
* Based on price on floor, clean. † See Latest Statistical Information. | |
| 1947–48 | 466 |
| 1948–49 | 473 |
| 1949–50 | 689 |
| 1950–51 | 1,584 |
| 1951–52 | 749 |
| 1952–53 | 840 |
| 1953–54 | 903 |
| 1954–55 | 886 |
| 1955–56 | 832 |
| 1956–57 | 985 |
| 1957–58 | 750 |
| 1958–59 | 663 |
| 1959–60 | 812 |
| 1960–61 | 745 |
| 1961–62 | 731 |
| 1962–63 | 788 |
| 1963–64 | 1,000 |
| 1964–65 | 780 |
| 1965–66 | 775 |
| 1966–67 | † |
Dairy Produce—The measures introduced by the United Kingdom Government against dumping by European countries of surplus quantities of butter on the British market were an important factor contributing to the improvement in the price of butter which took place in the second half of 1958. In December 1958, however, the United Kingdom Government decided to uplift the quota restrictions previously imposed and withdrew its requests to Sweden and Finland to limit their exports and informed the Republic of Ireland that arrangements with it could lapse. The United Kingdom Government stated that if at any future time the imports of dumped or subsidised butter from any country should assume such proportions as to cause or threaten material injury to the New Zealand producers, application could again be made by New Zealand under the Customs Duties (Dumping and Subsidies) Act, and an assurance was given that any application would be dealt with expeditiously.
There were indications in 1960 that European countries had adopted some change of outlook so far as the flooding of the United Kingdom market with surplus butter was concerned, and would tend to encourage greater sales on their home markets, but disposals of surpluses in 1961 again upset the market. Consumption in the United Kingdom increased, but stocks built up as Continental countries disposed of embarrassing butter surpluses, and the price of New Zealand butter dropped to $25 per hundredweight. New Zealand raised the matter with GATT and discussions were held within the framework of GATT in April and June 1961 and again in September, the British Government having sought this latter meeting after the lodging of an anti-dumping application by New Zealand. In November 1961, when Britain asked all exporting countries to limit their supplies to the quantities proposed by GATT to 31 March 1962, the price for New Zealand butter rose almost immediately and recovered still further after quota restrictions were introduced by Britain from 1 April 1962.
The scale of import authorisations in 1965 led to heavy oversupply of the butter market with the recovery of production by Western European countries which subsidise their exports to the United Kingdom market.
The following table shows the average weekly price for New Zealand butter ex-store United Kingdom for each month in the past four years, along with the average weekly sales on the London market during the same period. (Source: Dairy Board.)
| Month | Butter | |||||||||
|---|---|---|---|---|---|---|---|---|---|---|
| (Finest and First Grades) Average Price per Cwt | (All Grades) Weekly Average Sales* | |||||||||
| 1963 | 1964 | 1965 | 1966 | 1967 | 1963 | 1964 | 1965 | 1966 | 1967 | |
| * Averages are for weeks ending Saturday. | ||||||||||
| $ | $ | $ | $ | $ | tons | tons | tons | tons | tons | |
| January | 31.50 | 33.50 | 35.00 | 31.20 | 30.00 | 3,105 | 3,199 | 3,057 | 2,413 | 3,243 |
| February | 31.50 | 33.50 | 35.00 | 30.70 | 30.00 | 3,259 | 3,244 | 3,077 | 2,654 | 3,413 |
| March | 31.50 | 33.50 | 35.00 | 30.20 | 30.00 | 3,123 | 3,216 | 3,070 | 3,025 | 3,622 |
| April | 31.50 | 33.50 | 34.80 | 30.00 | 30.00 | 3,121 | 3,425 | 2,796 | 3,058 | 3,180 |
| May | 31.50 | 33.50 | 33.70 | 30.00 | 30.00 | 3,083 | 3,057 | 2,898 | 3,763 | 3,428 |
| June | 32.70 | 33.50 | 32.80 | 30.00 | 30.00 | 3,098 | 3,060 | 3,002 | 3,049 | 3,230 |
| July | 33.50 | 33.50 | 32.20 | 30.00 | 3,101 | 3,098 | 3,155 | 3,274 | ||
| August | 33.50 | 33.50 | 32.20 | 30.00 | 3,007 | 3,127 | 3,166 | 3,897 | ||
| September | 33.50 | 33.50 | 32.20 | 30.00 | 2,992 | 3,058 | 2,998 | 4,065 | ||
| October | 33.50 | 34.10 | 32.20 | 30.00 | 3,001 | 2,894 | 3,040 | 3,495 | ||
| November | 33.50 | 35.00 | 32.20 | 30.00 | 3,165 | 2,971 | 2,876 | 3,418 | ||
| December | 33.50 | 35.00 | 32,20 | 30.00 | 3,126 | 3,273 | 2,738 | 3,522 | ||
| Annual average | 32.60 | 33.80 | 33.30 | 30.15 | 3,098 | 3,135 | 2,990 | 3,312 | ||
The next table gives similar information for the London sales of New Zealand cheese. (Source: Dairy Board.)
| Month | Cheese | |||||||||
|---|---|---|---|---|---|---|---|---|---|---|
| (Finest and First Grades, White) Average Price per Cwt (Crated) | (All Grades) Weekly Average Sales* | |||||||||
| 1963 | 1964 | 1965 | 1966 | 1967 | 1963 | 1964 | 1965 | 1966 | 1967 | |
| * Averages are for weeks ending Saturday. | ||||||||||
| $ | $ | $ | $ | $ | tons | tons | tons | tons | tons | |
| January | 23.00 | 23.00 | 26.00 | 25.50 | 25.50 | 1,804 | 2,238 | 1,388 | 1,206 | 1,445 |
| February | 23.00 | 23.00 | 26.00 | 25.50 | 25.50 | 1,364 | 1,586 | 1,203 | 1,291 | 1,586 |
| March | 23.00 | 23.50 | 26.00 | 25.50 | 25.50 | 1,154 | 1,994 | 1,297 | 1,296 | 1,435 |
| April | 23.00 | 24.00 | 26.00 | 25.50 | 25.50 | 1,418 | 1,573 | 1,278 | 1,331 | 1,522 |
| May | 23.00 | 24.00 | 25.50 | 25.50 | 25.50 | 1,484 | 1,589 | 1,404 | 1,849 | 1,496 |
| June | 23.00 | 24.00 | 25.50 | 25.50 | 25.50 | 1,670 | 1,523 | 1,534 | 1,339 | 1,424 |
| July | 23.00 | 24,70 | 25.50 | 25.50 | 1,440 | 1,468 | 1,626 | 1,207 | ||
| August | 23.00 | 25.00 | 25.50 | 25.50 | 1,384 | 1,478 | 1,422 | 1,394 | ||
| September | 23.00 | 25.00 | 25.50 | 25.50 | 1,294 | 1,472 | 1,467 | 1,536 | ||
| October | 23.00 | 25.00 | 25.50 | 25.50 | 1,713 | 1,401 | 1,546 | 1,587 | ||
| November | 23.00 | 25.70 | 25.50 | 25.50 | 1,950 | 1,313 | 1,595 | 1,554 | ||
| December | 23.00 | 26.00 | 25.50 | 25.50 | 1,343 | 1,652 | 1,088 | 1,468 | ||
| Annual average | 23.00 | 24.30 | 25.70 | 25.50 | 1,502 | 1,606 | 1,404 | 1,421 | ||
The next table gives the comparative f.o.b. and ex-store London prices in relation to the basic price per pound of butterfat.
NOTE—“F.o.b. equivalent” represents payments by the Dairy Board to dairy factories, and therefore excludes the Board's expenses as exporters.
“Equivalent ex-store London” includes selling expenses in New Zealand and United Kingdom (e.g., advertising). Strictly it also includes grading premiums, discount and, in the case of crated cheese, an allowance for shrinkage, as well as the expenses (insurance, freight, handling and storage charges, and commission).
| Year | Basic Price c per lb | f.o.b.* Equivalent $ per cwt | Price Equivalent Ex-store London $ per cwt | Basic Price c per lb | f.o.b.* Equivalent $ per cwt | Price Equivalent Ex-store London $ per cwt |
|---|---|---|---|---|---|---|
* f.o.b. = free on board, i.e., loaded at a New Zealand port. † See notes to table on page 581. | ||||||
| Butter | Cheese | |||||
| 1957–58 | 30.21 | 31.00 | 34.50 | 32.71 | 17.30 | 20.90 |
| 1958–59 | 26.67 | 27.70 | 31.50 | 29.17 | 15.90 | 19.40 |
| 1959–60 | 26.67† | 27.90 | 31.30 | 31.67† | 17.10 | 20.80 |
| 1960–61 | 26.67 | 27.80 | 31.40 | 31.67 | 17.40 | 21.00 |
| 1961–62 | 26.67 | 27.70 | 31.30 | 31.67 | 17,70 | 21.40 |
| 2962–63 | 26.67 | 27.80 | 31.40 | 30.83 | 17.50 | 21.30 |
| 1963–64 | 26.67† | 27.70 | 31.50 | 30.83† | 17.70 | 21.70 |
| 1964–65 | 28.25† | 29.10 | 33.50 | 34.08† | 1.9.10 | 23.10 |
| 1965–66 | 28.25 | 29.10 | 33.50 | 37.59 | 20.90 | 24.90 |
| 1966–67 | 28.25 | 29.10 | 33.70 | 37.63 | 21.14 | 25.58 |
The movements in prices and sales of butter on the United Kingdom market are shown in the following diagram.
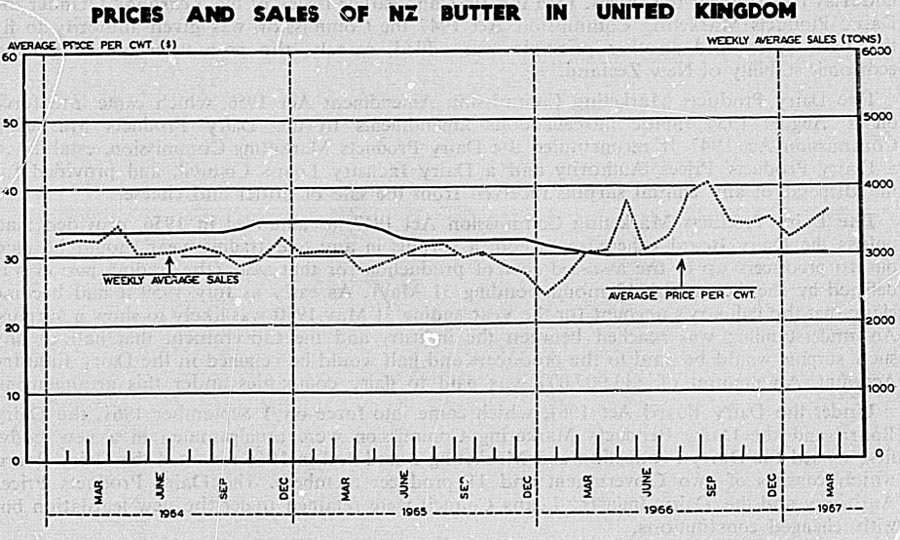
The movements in prices and sales of cheese on the United Kingdom market are shown in the following diagram.
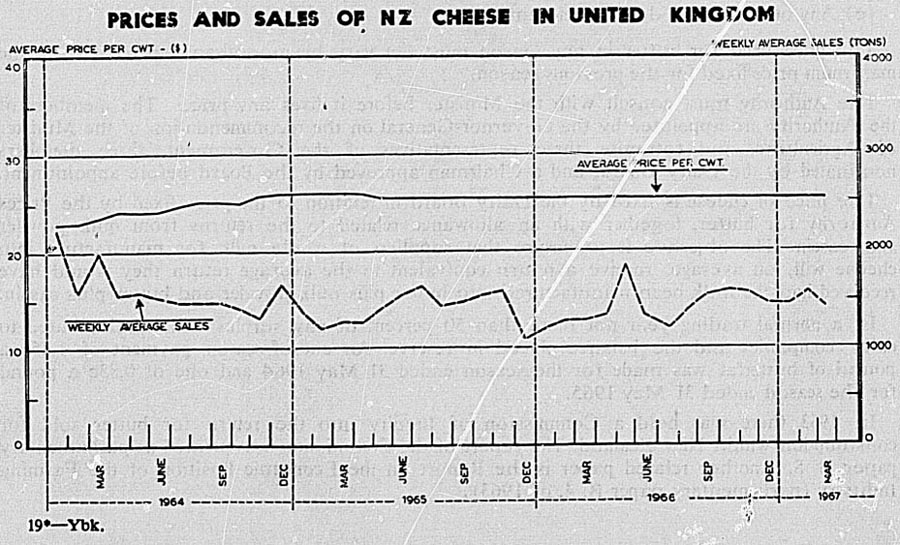
Basic Prices for Dairy Produce—Basic prices (then known as guaranteed prices) for butter and cheese were introduced by the Government on 1 August 1936 to give stability to the dairy industry, and the Primary Products Marketing Act 1936 set out the principles which underlay the fixing of the prices. (See the 1961 and earlier issues of the Yearbook.) Under the Dairy Products Marketing Commission Act 1947 the Commission was given authority to fix the basic price, and another principle was added, namely, the promotion of the general economic stability of New Zealand.
The Dairy Products Marketing Commission Amendment Act 1956, which came into force on 1 August 1957, made miscellaneous amendments to the Dairy Products Marketing Commission Act 1947. It reconstituted the Dairy Products Marketing Commission, established a Dairy Products Prices Authority and a Dairy Industry Loans Council, and provided for the disposal of any annual surplus received from the sale of butter and cheese.
The Dairy Products Marketing Commission Act 1947, as amended in 1956, provided that, unless the Dairy Board otherwise agreed, a surplus in any one trading year should be paid out to producers up to the assessed cost of production for that year (the trading period was defined by the Act as the 12 months ending 31 May). As early as July 1959 it had become clear that the industry's account for the year ending 31 May 1960 was likely to show a surplus. An understanding was reached between the industry and the Government that half of any such surplus would be paid to the producers and half would be retained in the Dairy Industry Account. An amount of $13,902,000 was paid to dairy companies under this arrangement.
Under the Dairy Board Act 1961, which came into force on 1 September 1961, the Dairy Board and the Dairy Products Marketing Commission were amalgamated in a new body, first named the Dairy Production and Marketing Board and in 1966 renamed the Dairy Board which consists of two Government and 1 1/8 producer members. The Dairy Products Prices Authority and the Dairy Industry Loans Council were retained under the new legislation but with changed constitutions.
Under the Dairy Board Act 1961 prices for butter are fixed by the Dairy Products Prices Authority after taking into account the following matters:
The necessity in the public interest of maintaining the stability and efficiency of the dairy industry.
The amount which butter and cheese acquired by the Board is realising and the market prospects for the coming year.
The state of the Dairy Industry Account, the Dairy Industry Reserve Account, and the Dairy Industry Capital Account.
Any submissions made by the Dairy Board.
Any other matters deemed relevant.
The price fixed for butter in any season must not vary by more than 5 percent from the maximum price fixed for the previous season.
The Authority must consult with the Minister before it fixes any prices. The members of the Authority are appointed by the Governor-General on the recommendation of the Minister of Agriculture, and comprise three representatives of the Government, three members nominated by the Dairy Board, and a Chairman approved by the Board before appointment.
The price of cheese is fixed by the Dairy Board in relation to the price fixed by the Prices Authority for butter, together with an allowance related to the returns from milk powder and casein. The objective is to ensure that suppliers of whole milk for manufacture into cheese will, on average, receive a return equivalent to the average return they would have received had the milk been manufactured into butter plus milk powder and butter plus casein.
In a normal trading year not more than 50 percent of any surplus will be distributed to dairy companies and the balance placed in reserve. An end-of-season payment of 1.25c a pound of butterfat was made for the season ended 31 May 1964 and one of 0.83c a pound for the season ended 31 May 1965.
In 1963 there was held a Commission of Inquiry into the return for butter sold for consumption within New Zealand. The report of the Commission was printed as parliamentary paper B. 8. Another related paper is the Report on the Economic Position of the Farming Industry (parliamentary paper B. 4. of 1963).
The basic prices in cents per pound of butter and cheese for export paid to dairy factories are now given.
| Season | Creamery Butter (Finest Grade 93–93 1/2 pt) | Whey Butter (First Grade) | Cheese (First Grade 92–92 1/2 pt) |
|---|---|---|---|
| * These additional amounts are surplus payments, as authorised by the Dairy Products Marketing Commission Amendment Act 1956 and Dairy Production and Marketing Board Act 1961, expressed on a product basis. | |||
| cents per lb (gross weight) | |||
| Ended 31 July— | |||
| 1957–58 | 27.624 | 25.958 | 15.445 |
| 1958–59 | 24.741 | 23.075 | 14.135 |
| 1959–60 | 24.829 | 23.163 | 15.266 |
| 3.019* | – | 1.467* | |
| 1960–61 | 24.775 | 23.108 | 15.257 |
| Ended 31 May— | |||
| 1961–62 | 24.749 | 23.083 | 15.377 |
| 1962–63 | 24,710 | 23.053 | 14.953 |
| 1963–64 | 24.678 | 23.012 | 15.070 |
| 1.029* | – | 0.502 | |
| 1964–65 | 25.898 | 24.232 | 16.328 |
| 0.686* | – | 0.335* | |
| 1965–66 | 25.902 | 24.235 | 17.820 |
| 1966–67 | 25.884 | 24.218 | 16.059 |
Produce of other grades incurs differential premiums or penalties according to grading points. Differentials used since the introduction of basic purchase prices are as follows.
| CREAMERY BUTTER | |||
|---|---|---|---|
| Grade | 1936–37 to 1957–58 | 1958–59 and 1959–60 | 1960–61 to 1966–67 |
| cents per lb | |||
| Finest 94 points and over | +0.104 | +0.156 | +0.167 |
| Finest 93–93 1/2 points (basic) | – | – | – |
| First 92–92 1/2 points | −0.052 | −0.156 | −0.167 |
| First 90–91 1/2 points | −0.208 | −0.469 | −0.625 |
| Second grade | −0.625 | −1.667 | −1.667 |
| Third grade (from 1955–56) | −5.0 | −5.0 | −5.0 |
| CHEESE | ||||
|---|---|---|---|---|
| Grade | 1936–37 to 1950–51 | 1951–52 to 1954–55 | 1955–56 to 1959–60 | 1960–61 to 1966–67 |
| cents per lb | ||||
| Finest 94 points and over | +0.130 | +0.260 | +0.260 | + 1.042 |
| Finest 93–93 1/2 points | +0.104 | +0.179 | +0.179 | +0.833 |
| First 92–92 1/2 (basic) | – | – | – | – |
| First 91–91 1/2 points | −0.052 | −0.052 | −0.052 | −0.208 |
| Second 88–90 1/2 points | −0.208 | −0.604 | −0.896 | −1.042 |
| Second 87 and under | −1.000 | −3.125 | −3.125 | |
The prices quoted in the preceding table were designed to enable average dairy companies to pay to suppliers the following amounts in cents per pound of butterfat used for butter or cheese manufacture. Also given is the actual average net revenue per pound of butterfat supplied.
| Season | Price per Pound of Butterfat Used for— | |||
|---|---|---|---|---|
| Butter-making (Basic Price) | Cheese-making (Basic Price) | Butter-making (Average Net Revenue) | Cheese-making (Average Net Revenue) | |
* Plus 3.666c surplus payments at end of season. † Plus 1.25c surplus payments at end of season. ‡ Plus .833c surplus payment at end of season. | ||||
| cents per lb | ||||
| 1956–57 | 31.290 | 33.790 | 31.233 | 34.073 |
| 1957–58 | 30.208 | 32.708 | 30.268 | 33.181 |
| 1958–59 | 26.667 | 29.167 | 26.960 | 29.393 |
| 1959–60 | 26.667* | 31.667* | 26.955* | 31.883* |
| 1960–61 | 26.667 | 31.667 | 26.965 | 32.128 |
| 1961–62 | 26.667 | 31.667 | 26.924 | 31.740 |
| 1962–63 | 26.667 | 30.833 | 26.989 | 31.219 |
| 1963–64 | 26.667† | 30.833† | 27.113 | 31.853 |
| 1964–65 | 28.250‡ | 34.083‡ | 28.684 | 35.348 |
| 1965–66 | 28.250 | 37.592 | 28.673 | 38.217 |
| 1966–67 | 28.250 | 37.625 | ||
There is an assumption implicit in the basic price scheme that the payout to butter factory suppliers is for cream at the farm and the payout to cheese factory suppliers is for whole milk delivered to the factory. Where a factory receives whole milk and makes butter, the residual skim milk can be manufactured into any of several products, the main ones being skim-milk powders and casein. The only possible products of a cheese factory additional to those covered by the guaranteed price for cheese are products of separated whey and are of relatively insignificant value.
At the conclusion of the 1960–61 season there was a net deficit of $14,982,700 in the Dairy Industry Account. The gross deficit of $16,602,842 on sales of butter, which was only partially offset by a gross surplus of $4,733,244 on cheese and by commission on sales of milk powder and casein, was an indication of the extent to which New Zealand's interests had been injured during the season by butter dumping on the United Kingdom market.
At the end of the 1965 season it was possible to pay off the debit of $7,130,000 at the Reserve Bank, and to put $1,000,000 into the capital account of the Dairy Industry Loans Council for modernisation of dairy-factory and cool-store facilities and also to allocate $1,000,000 to product-development purposes. The improved position was partly the result of greater sales of skim-milk powder and casein.
Meat—The Imported Meat Trade Association in the United Kingdom compiles weekly London wholesale meat prices, the basis of quotation being “ex-hooks to retailers at Smithfield market”. The next table gives prices for New Zealand meat at the end of the last week in the month. One half of the value of all New Zealand exports of frozen and chilled meat are generally accounted for by lamb, and the two first-quality weight grades quoted in the table usually account for approximately 5 percent and 40 to 50 percent respectively of all lamb carcasses exported. Beef accounts for one quarter of the total exports of frozen and chilled meat (by value), but mutton comprises only about 5 percent of the total value of frozen-meat exports. With the reduction of regular supplies of quarter beef to the United Kingdom, price quotations have been infrequent.
In 1960 imported lamb and mutton prices in the United Kingdom improved considerably, but towards the end of the year lamb values again took a downward turn, which continued during 1961. United Kingdom domestic production of lamb and mutton showed still further increases during 1961 and this, combined with larger stocks of imported lamb held in United Kingdom stores, had the effect of keeping lamb prices at the lower levels until there was a recovery in prices in the second quarter of 1962. After a drop early in 1963 there was a good recovery which was further assisted by a shortage of beef in the middle of 1964, and this was sustained until August 1966, when prices dropped partly because of a dislocation of normal trading arrangements associated with the shipping strike in the United Kingdom some weeks earlier.
| End of Last Week in March | Lamb | Mutton | Beef | |||||
|---|---|---|---|---|---|---|---|---|
| First Quality | Second Quality | Ewe | Boneless Cartoned Ox G.A.Q. | |||||
| 28 lb and Under | 29 to 36 lb | 37 to 42 lb | 28 lb and Under | 29 to 36 lb | 57 to 64 lb | Rumps | Silverside | |
| cents per lb | ||||||||
| 1958 | 20.4–20.8 | 17.9–18.3 | 17.1–17.5 | 20.0 | 18.3 | 8.7 | .. | .. |
| 1959 | 18.7 | 17.5–18.3 | 17.5 | 17.1–17.5 | 17.1–17.5 | 7.9–8.3 | .. | .. |
| 1966 | 20.0–20.8 | 18.3–19.2 | 17.9–18.3 | 20.0–20.8 | 18.7–19.2 | 8.3 | .. | .. |
| 1961 | 18.7–19.2 | 17.9–18.3 | 16.2–16.7 | 19.2 | 18.3–18.7 | 9.2–9.6 | .. | .. |
| 1962 | 17.5 | 17.1–17.5 | 17.1 | 16.2 | 17.1 | 9.2 | .. | .. |
| 1963 | 16.7–17.5 | 16.2–17.1 | 16.7 | 16.7–17.5 | 16.7 | 8.7 | .. | .. |
| 1964 | 21.2–21.7 | 20.4 | 19.2–19.6 | 21.7–22.1 | 20.4–20.8 | .. | .. | .. |
| 1965 | 22.1 | 21.2–21.7 | 21.2–21.7 | 21.7–22.5 | 21.7–22.1 | 12.9 | .. | .. |
| 1966 | 22.9–23.3 | 20.8–21.2 | 19.2 | 213–23.7 | 21.7 | .. | 41.7–42.5 | 37.5 |
| 1967 | 20.8–21.7 | 20.4–20.8 | 20.0 | 20.3–21.2 | 20.4–20.8 | .. | 38.3–39.2 | 38.3–39.2 |
Schedule Prices—A schedule of buying prices is issued each week by meat operators in New Zealand. The Meat Producers Board keeps a close watch on the prices being received for the meat and all by-products and on processing costs to ensure that the schedule prices give a just and equitable return to producers.
The opening schedules for the last five seasons are given below. Prices quoted are for dressed weights “on the hooks” at freezing works. For the 1966–67 season the quoted price does not include wool.
| Item | Season | ||||
|---|---|---|---|---|---|
| 1962–63 | 1963–64 | 1964–65 | 1965–66 | 1966–67 | |
| Price of Lamb, Wether, and Ewe Mutton, in Cents per Pound | |||||
| Lambs— | |||||
| Downs (29–36 lb) | 14.2 | 16.3 | 18.75 | 17.5 | 12.9 |
| Canterbury (29–36 lb) | 13.75 | 15.8 | 18.3 | 17.1 | 12.5 |
| Crossbred (29–36 lb) | 14.2 | 16.3 | 18.75 | 17.5 | 12.9 |
| Seconds (29–36 lb) (N.I.) | 13.3 | 15.4 | 18.3 | 17.5 | 12.9 |
| Wethers— | |||||
| Primes (48 lb and under)— | |||||
| North Island | 7.5 | 7.9 | 10.4 | 9.6 | 8.3 |
| South Island | 6.9 | 7.3 | 9.8 | 8.95 | 7.9 |
| Seconds (48 lb and under)— | |||||
| North Island | 6.7 | 7.1 | 9.6 | 8.75 | 8.3 |
| South Island | 6.0 | 6.5 | 8.95 | 8.1 | 7.9 |
| Ewes (48 lb and under) (N.I.) | 4.2 | 5.8 | 8.95 | 6.7 | 7.5 |
| Item | Season | ||||
|---|---|---|---|---|---|
| 1962–63 | 1963–64 | 1964–65 | 1965–66 | 1966–67 | |
| * From 1957–58 to 1961–62 Heifer G.A.Q. prices were for 680 lb and under. Prior to 1959–60 G.A.Q. cow prices are for all weights. In 1963–64 the Ox range was 740 lb and under, and the Heifer range 560 lb and under for both G.A.Q. and F.A.Q. | |||||
| Price in Dollars per 100 lb of Beef (N.I.) | |||||
| Quarter beef, North Island— | |||||
| Ox, chiller beef (680 lb and under) | 13.50 | 12.50 | 15.00 | 15.00 | 15.50 |
| Ox— | |||||
| G.A.Q. (680 lb and under) | 13.50 | 12.50 | 15.00 | 15.00 | 15.50 |
| F.A.Q. (all weights) | 11.50 | 12.00 | 15.00 | 15.00 | 15.50 |
| Heifer— | |||||
| G.A.Q. (500 lb and under)* | 12.50 | 12.00 | 14.50 | 14.50 | 14.50 |
| F.A.Q. (all weights) | 11.00 | 11.50 | 14.50 | 14.50 | 14.50 |
| Cow, G.A.Q. (600 lb and under)* | 10.50 | 10.00 | 11.20 | 12.00 | 12.50 |
| Boner beef (cow) | 10.00 | 10.50 | 10.50 | 11.25 | 14.00 |
Minimum Prices for Export Meat—The institution of a system of minimum prices for meat exported from New Zealand was provided for by the Meat Export Prices Act 1955. A Meat Export Prices Committee was established, and consists of two members of the Meat Board, the Secretary to the Treasury, the Director-General of Agriculture, and a Chairman nominated by agreement between the Government and the producers. A schedule of minimum prices is fixed at the beginning of the season. Regard must be paid by the Committee to the average of the prices received for each class of meat during the preceding three seasons, the ruling level of minimum prices, and the Committee may have regard to the market trend and future prospects for the sale of meat, prices ruling for other farm products, and the general level of costs, prices, and wages in New Zealand.
The following table gives the minimum prices which apply for the year ending 30 September 1967.
| Class of Meat | Grade of Meat | Minimum Price per Pound f.o.b. |
|---|---|---|
| c | ||
| Lamb | Prime down cross 29–36 lb | 13.542 |
| Wether mutton | Prime 49–56 lb | 7.5 |
| Ewe mutton | Prime 49–56 lb | 5.417 |
| Chilled beef | Ox 680 lb and under | 13.333 |
| Ox and heifer quarter beef | G.A.Q.: 680 lb and under | 13.333 |
| Quarter cow beef | G.A.Q.: 600 lb and under | 10.417 |
| Boner cow, ox, and heifer | All weights, boned-out value | 15.0 |
| Boner bull | ||
| Veal (sides or quarters) | Under 280 lb | 11.667 |
| Porkers | Prime 60–100 lb | 15.0 |
| Baconers | Prime 111–140 lb | 15.0 |
Deficiency Payments—Payments are made from the Meat Industry Reserve Account when the f.o.b. equivalents of the prices paid to farmers fall below the minimum price determined for any class of meat in the week to which the schedule relates.
Deficiency payments each season have been as follows: 1955–56, $734,338; 1956–57, $223,950; 1957–58, nil; 1958–59, $158,000; 1959–60, $1,860,000; 1960–61, nil; 1961–62, $4,825,000. No deficiency payments have been required in later seasons.
FARM INDUSTRY RESERVES—Although the details of wartime bulk-purchase agreements are now of historical interest only, it was during the period of bulk purchase that the present farm industry reserves were built up. Following the introduction of the Government stabilisation scheme in December 1942, agreement was reached between the Government and farmers' organisations in May 1943 regarding the stabilisation of meat and dairy prices. It was agreed that other than those increases necessary to meet higher costs of production, all increases in overseas realisations would be paid into a special fund which would be used in subsequent years for the benefit of the industry concerned. A meat pool account was already in existence, having been created to assist those producers who were affected by restrictions imposed on the export of particular classes of meat as a result of the shipping shortage. Subsidies designed to keep down farm production costs were also paid out of these funds. The wool reserve account was created in a somewhat different fashion, arising in the main from the profits derived from the sale of wartime surplus stocks, and in part from a levy on all wool sold at auctions.
The following table shows the balances in the various farm industry reserve accounts at given dates.
| Year | Dairy Produce Account at 31 July | Meat Industry Reserve Account at 30 Sept | Wool Commission Account at 30 June |
|---|---|---|---|
* This amount was reduced by the payment to dairy companies of $13,902,000 shortly after the end of the season under the agreement that half the surplus earned during the trading year ended 31 May 1960 would be paid out to producers. The final balance was $3,872,000. † At 31 May. | |||
| $ (thousand) | |||
| 1956 | 54,292 | 81,362 | 57,982 |
| 1957 | 27,826 | 82,584 | 59,502 |
| 1958 | −14,698 | 84,456 | 61,046 |
| 1959 | 4,264 | 86,436 | 62,536 |
| 1960 | 17,774* | 86,888 | 65,014 |
| 1961 | −10,338 | 89,626 | 66,636 |
| 1962 | −13,380† | 86,336 | 69,406 |
| 1963 | −8,428† | 88,088 | 71,278 |
| 1964 | −7,130† | 89,482 | 72,830 |
| 1965 | 3731†x | 90,940 | 72,800 |
| 1966 | −478† | 93,497 | 73,709 |
GENERAL—Surveys of domestic trade are a comparatively recent development in international statistics. They have been advocated by United Nations and are made by most economically advanced countries. In New Zealand the Department of Statistics has conducted Censuses of Distribution in 1953, 1958, and 1963. These censuses have covered retail trade, wholesale trade, and some service establishments. Quarterly sample surveys of retail and wholesale trade have been based on the Census of Distribution; these provide valuable economic indicators on the value of sales by the various types of stores and the value of stocks held.
The Census of Distribution for 1962–63 revealed retail trade sales of $1,516 million or an average turnover of $54,748 for each of the 27,688 stores. At 31 March 1963 there was one retail shop for every 91 persons, nearly one-half of them selling food and drink. A large proportion of the goods sold had earlier passed through wholesale stores, there being 3,052 such stores covered in the census with a total turnover of $986 million. The 3,170 service establishments covered in a limited survey at the Census had total receipts of $55 million at an average of $17,351 per establishment. Notable exclusions from the Census were petrol and oil sales, newspaper sales other than in shops, and sales by bread bakers and milk vendors. A full report of the census is given in the publication Census of Distribution 1963.
In the following table the main results of the Censuses of 1958 and 1963 for retail trade are set out; the 1958 statistics have been adjusted to make them comparable, that is, by the exclusion of returns for bread bakeries and milk vendors.
| Item | 1958 | 1963 | Percentage Increase |
|---|---|---|---|
| Number of stores | 25,634 | 27,688 | 8.0 |
| $(000) | $(000) | ||
| Sales | 1,174,802 | 1,515,890 | 29.0 |
| Purchases | 919,762 | 1,160,676 | 26.2 |
| Opening stocks | 179,076 | 233,178 | 30.2 |
| Closing stocks | 194,108 | 235,972 | 21.6 |
Some other features of retail trade shown by the 1963 Census together with comparative figures for 1958 are shown in the following table.
| Store-type Group | Average Turnover per Store | Average Labour Force per Store | Turnover per Unit of Labour Force | Turnover per Head of Population | Average Population per Store | |
|---|---|---|---|---|---|---|
| $ | $ | $ | ||||
| Food and drink | 1,963 | 36,828 | 3.6 | 10,242 | 195.4 | 188 |
| 1,958 | 31,156 | 3.4 | 9,144 | 167.8 | 186 | |
| Apparel | 1,963 | 38,218 | 3.8 | 10,012 | 60.4 | 633 |
| 1,958 | 33,964 | 3.9 | 8,720 | 57.6 | 590 | |
| Furniture | 1,963 | 67,256 | 5.1 | 13,294 | 38.6 | 1,742 |
| 1,958 | 57,780 | 5.3 | 10,870 | 34.0 | 1,696 | |
| Automotive | 1,963 | 173,494 | 4.7 | 36,730 | 79.4 | 2,184 |
| 1,958 | 122,318 | 6.0 | 20,370 | 55.6 | 2,200 | |
| Hardware | 1,963 | 85,050 | 5.4 | 15,612 | 28.8 | 2,956 |
| 1,958 | 79,002 | 5.8 | 13,624 | 27.0 | 2,933 | |
| Chemicals | 1,963 | 37,908 | 3.8 | 10,010 | 15.8 | 2,409 |
| 1,958 | 28,210 | 3.6 | 7,858 | 11.0 | 2,563 | |
| Miscellaneous— | ||||||
| General, department, and variety | 1,963 | 221,366 | 21.9 | 10,102 | 67.0 | 3,308 |
| 1,958 | 202,484 | 21.8 | 9,290 | 61.4 | 3,295 | |
| Other | 1,963 | 57,792 | 4.3 | 13,430 | 114.6 | 504 |
| 1,958 | 48,330 | 4.3 | 11,338 | 103.0 | 469 | |
| All retail stores | 1,963 | 54,748 | 4.5 | 12,304 | 599.8 | 91 |
| 1,958 | 45,830 | 4.4 | 10,370 | 517.4 | 89 | |
CENSUS OF DISTRIBUTION 1963: Retail Establishments—Of the 27,688 retail stores covered by the census, 19,205, or 69.4 percent, were situated in the North Island, and 8,483, or 30.6 percent, in the South Island.
The following table shows details by statistical areas. The figures quoted in parentheses are in each case the percentage of total.
| Statistical Areas | Population at 31 March 1963 | Number of Stores | Purchases During 1962–63 | Sales or Turnover During 1962–63 | Stocks at Close of Year (March 1963) |
|---|---|---|---|---|---|
| (000) | $(000) | $(000) | $(000) | ||
| Northland | 88.9 | 868 | 32,916 | 42,608 | 6,896 |
| (3.5) | (3.1) | (2.8) | (2.8) | (2.9) | |
| Central Auckland | 549.5 | 6,295 | 251,832 | 334,206 | 48,282 |
| (21.7) | (22.7) | (21.7) | (22.0) | (20.5) | |
| South Auckland - Bay of Plenty | 369.7 | 3,989 | 172,796 | 221,654 | 35,016 |
| (14.6) | (14.4) | (14.9) | (14.6) | (14.9) | |
| East Coast | 47.1 | 409 | 17,696 | 23,938 | 4,060 |
| (1.9) | (1.5) | (1.5) | (1.6) | (1.7) | |
| Hawke's Bay | 120.1 | 1,296 | 51,492 | 66,974 | 11,412 |
| (4.8) | (4.7) | (4.4) | (4.4) | (4.8) | |
| Taranaki | 102.4 | 1,0.68 | 45,728 | 58,278 | 9,516 |
| (4.0) | (3.9) | (4.0) | (3.8) | (4.0). | |
| Wellington - Hutt | 492.9 | 5,280 | 228,700 | 300,900 | 47,958 |
| (19.5) | (19.1) | (19.7) | (19.9) | (20.3) | |
| Marlborough | 28.8 | 332 | 13,222 | 16,900 | 2,856 |
| (1.1) | (1.2) | (1.1) | (1.1) | (1.2) | |
| Nelson | 65.4 | 764 | 27,144 | 35,794 | 5,928 |
| (2.6) | (2.8) | (2.3) | (2.4) | (2.5) | |
| Westland | 24.8 | 334 | 8,682 | 11,590 | 1,782 |
| (1.0) | (1.2) | (0.8) | (0.8) | (0.8) | |
| Canterbury | 359.0 | 3,911 | 174,758 | 227,512 | 34,452 |
| (14.2) | (14.1) | (15.1) | (15.0) | (14.6) | |
| Otago | 180.8 | 2,055 | 81,664 | 105,550 | 16,316 |
| (7.2) | (7.4) | (7.0) | (7.0) | (6.9) | |
| Southland | 97.8 | 1,087 | 54,046 | 69,986 | 11,498 |
| (3.9) | (3.9) | (4.7) | (4.6) | (4.9) | |
| Totals | 2.527.1 | 27,688 | 1,160,676 | 1,515,890 | 235,972 |
| (100.0) | (100.0) | (100.0) | (100.0) | (100.0) |
In 1963 the principal centres of population (urban areas) included 60.6 percent of New Zealand's people, but contained 65.8 percent of all retail stores, with 70.3 percent of total sales or turnover.
The following table shows details by urban and rural areas. The figures in parentheses are in each case the percentage of total.
| Location Group | Population at 31 March 1963 | Number of Stores | Sales or Turnover During 1962–63 | Stocks at Close of Year (March 1963) |
|---|---|---|---|---|
* Auckland, Wellington, Christchurch, Dunedin. † Whangarei, Hamilton, Tauranga, Rotorua, Gisborne, Napier, Hastings, New Plymouth, Wanganui, Palmerston North, Nelson, Timaru, Invercargill. ‡ Boroughs outside urban areas with population over 4,000. | ||||
| (000) | $(000) | $(000) | ||
| Main urban areas* (including Hutt Urban Area) | 1,083.4 | 12,448 | 714,680 | 106,188 |
| (42.9) | (44.9) | (47.1) | (45.0) | |
| Secondary urban areas† (excluding Hutt Urban Area) | 446.5 | 5,779 | 351,276 | 58,530 |
| (17.7) | (20.9) | (23.2) | (24.8) | |
| Smaller centres‡ | 192.2 | 3,286 | 198,362 | 33,118 |
| (7.6) | (11.9) | (13.1) | (14.0) | |
| Other urban | 132.8 | 2,684 | 122,632 | 20,966 |
| (5.2) | (9.7) | (8.1) | (8.9) | |
| Rural | 672.2 | 3,491 | 128,940 | 17,170 |
| (26.6) | (12.6) | (8.5) | (7.3) | |
| Totals | 2,527.1 | 27,688 | 1,515,890 | 235,972 |
| (100.0) | (100.0) | (100.0) | (100.0) | |
Leading results of the Census relating to principal urban areas are shown in the following table.
| Urban Area | Population March 1963 | Percentage of N.Z. Total Population | Number of Stores | Percentage of N.Z. Total Stores | Sales or Turnover During Year | Percentage of N.Z. Total Sales | Stocks at Close of Year | Percentage of N.Z. Total Stocks |
|---|---|---|---|---|---|---|---|---|
| $(000) | $(000) | |||||||
| Auckland | 482,300 | 19.1 | 5,732 | 20.7 | 311,320 | 20.5 | 45,146 | 19.1 |
| Wellington | 155,400 | 6.1 | 1,845 | 6.7 | 133,688 | 8.8 | 19,948 | 8.5 |
| Hutt | 105,600 | 4.2 | 902 | 3.3 | 45,504 | 3.0 | 6,658 | 2.8 |
| Christchurch | 232,700 | 9.2 | 2,706 | 9.8 | 157,050 | 10.4 | 24,142 | 10.2 |
| Dunedin | 107,400 | 4.2 | 1,263 | 4.6 | 67,118 | 4.4 | 10,294 | 4.4 |
| Whangarei | 23,700 | 0.9 | 327 | 1.2 | 19,690 | 1.3 | 3,228 | 1.4 |
| Hamilton | 55,600 | 2.2 | 742 | 2.7 | 56,864 | 3.8 | 9,036 | 3.8 |
| Tauranga | 27,900 | 1.1 | 449 | 1.6 | 21,178 | 1.4 | 3,352 | 1.4 |
| Rotorua | 28,100 | 1.1 | 328 | 1.2 | 18,816 | 1.2 | 3,068 | 1.3 |
| Gisborne | 25,900 | 1.0 | 306 | 1.1 | 20,054 | 1.3 | 3,462 | 1.5 |
| Napier | 35,100 | 1.4 | 414 | 1.5 | 21,284 | 1.4 | 3,474 | 1.5 |
| Hastings | 35,000 | 1.4 | 443 | 1.6 | 24,364 | 1.6 | 4,268 | 1.8 |
| New Plymouth | 34,100 | 1.3 | 438 | 1.6 | 26,992 | 1.8 | 4,610 | 2.0 |
| Wanganui | 37,200 | 1.5 | 426 | 1.5 | 20,636 | 1.4 | 3,454 | 1.5 |
| Palmerston North | 45,800 | 1.8 | 613 | 2.2 | 33,608 | 2.2 | 6,206 | 2.6 |
| Nelson | 26,900 | 1.1 | 358 | 1.3 | 22,100 | 1.5 | 3,596 | 1.5 |
| Timaru | 27,300 | 1.1 | 364 | 1.3 | 23,654 | 1.6 | 3,838 | 1.6 |
| Invercargill | 43,900 | 1.7 | 571 | 2.1 | 42,036 | 2.8 | 6,938 | 2.9 |
The next table gives the number of stores and value of sales or turnover for boroughs with over 1,000 population not included in the 18 main urban areas of the preceding table.
| Borough | Number of Stores | Sales or Turnover During 1962–63 |
|---|---|---|
| $(000) | ||
| Kaitaia | 75 | 3,710 |
| Kaikohe | 62 | 2,940 |
| Dargaville | 74 | 4,158 |
| Helensville | 29 | 1,462 |
| Pukekohe | 112 | 6,164 |
| Waiuku | 44 | 1,860 |
| Tuakau | 36 | 1,912 |
| Thames | 114 | 4,176 |
| Paeroa | 80 | 3,590 |
| Waihi | 63 | 2,144 |
| Te Aroha | 88 | 4,138 |
| Huntly | 82 | 4,590 |
| Morrinsville | 112 | 5,576 |
| Ngaruawahia | 40 | 1,498 |
| Te Puke | 80 | 5,072 |
| Matamata | 105 | 5,508 |
| Cambridge | 98 | 5,242 |
| Whakatane | 165 | 11,754 |
| Opotiki | 61 | 2,862 |
| Te Awamutu | 152 | 8,594 |
| Putaruru | 85 | 5,488 |
| Kawerau | 43 | 2,368 |
| Otorohanga | 63 | 3,542 |
| Te Kuiti | 94 | 4,952 |
| Taupo | 114 | 6,290 |
| Taumarunui | 92 | 7,110 |
| Wairoa | 82 | 4,234 |
| Waipawa | 40 | 1,768 |
| Waipukurau | 63 | 4,596 |
| Dannevirke | 104 | 5,962 |
| Woodville | 34 | 1,070 |
| Waitara | 58 | 2,872 |
| Inglewood | 44 | 2,164 |
| Stratford | 109 | 7,010 |
| Eltham | 41 | 1,720 |
| Hawera | 147 | 8,184 |
| Patea | 36 | 1,390 |
| Ohakune | 27 | 1,014 |
| Raetihi | 33 | 1,424 |
| Taihape | 68 | 3,536 |
| Marton | 78 | 4,586 |
| Feilding | 140 | 8,674 |
| Pahiatua | 60 | 3,120 |
| Foxton | 46 | 1,412 |
| Shannon | 20 | 866 |
| Levin | 162 | 7,398 |
| Otaki | 69 | 2,044 |
| Masterton | 216 | 13,204 |
| Carterton | 61 | 2,624 |
| Greytown | 27 | 774 |
| Featherston | 33 | 1,252 |
| Martinborough | 28 | 1,204 |
| Picton | 46 | 1,250 |
| Blenheim | 193 | 12,902 |
| Motueka | 66 | 3,158 |
| Richmond | 49 | 1,512 |
| Westport | 100 | 3,936 |
| Rangiora | 78 | 4,424 |
| Kaiapoi | 54 | 1,792 |
| Runanga | 11 | 364 |
| Brunner | 5 | 112 |
| Greymouth | 151 | 6,960 |
| Hokitika | 72 | 2,284 |
| Ashburton | 168 | 12,976 |
| Geraldine | 36 | 3,116 |
| Temuka | 54 | 2,116 |
| Waimate | 68 | 4,320 |
| Queenstown | 29 | 914 |
| Oamaru | 182 | 14,654 |
| Alexandra | 43 | 2,296 |
| Milton | 44 | 1,880 |
| Balclutha | 73 | 5,292 |
| Kaitangata | 13 | 352 |
| Gore | 145 | 12,702 |
| Winton | 44 | 1,984 |
| Mataura | 26 | 1,070 |
| Riverton | 27 | 700 |
| Bluff | 36 | 1,362 |
Just under half the total number of retail stores were in the food and drink groups—grocers, butchers, dairies, etc. This group accounted for only 33 percent of the turnover however, the average turnover per store being $36,800. As against this, the automotive group, which accounts for only 4 percent of all retail stores, handled 13 percent of the turnover, with an average turnover of $173,500 per store.
The following table shows details by store-type groups.
| Store-type Group | Number of Stores | Number of Paid Employees on 9 April 1963 | Total Labour Force on 9 April 1963 | Average Labour Force per Store | Salaries and Wages Paid During 1962–63 | Sales or Turnover During 1962–63 | Average Sales or Turnover per Unit of Labour Force | Stocks at Close of Year (March 1963) | ||
|---|---|---|---|---|---|---|---|---|---|---|
| Males | Females | Total | ||||||||
| $(000) | $(000) | $ | $(000) | |||||||
| Food and drink | 13,410 | 16,350 | 13,716 | 30,066 | 48,215 | 3.6 | 37,814 | 493,852 | 10,242 | 27,470 |
| Apparel | 3,992 | 3,490 | 8,102 | 11,592 | 15,239 | 3.8 | 14,616 | 152,568 | 10,012 | 47,738 |
| Furniture | 1,451 | 4,312 | 1,893 | 6,205 | 7,341 | 5.1 | 9,804 | 97,588 | 13,294 | 21,920 |
| Automotive | 1,157 | 3,899 | 626 | 4,525 | 5,465 | 4.7 | 7,770 | 200,732 | 36,730 | 22,818 |
| Hardware | 855 | 2,918 | 1,043 | 3,961 | 4,658 | 5.4 | 6,258 | 72,718 | 15,612 | 16,486 |
| Chemicals (chemist, etc.) | 1,049 | 1,331 | 1,770 | 3,101 | 3,973 | 3.8 | 4,416 | 39,768 | 10,010 | 7,366 |
| Department, variety, and general stores | 764 | 5,983 | 10,155 | 16,138 | 16,742 | 21.9 | 19,262 | 169,124 | 10,102 | 33,944 |
| Miscellaneous | 5,010 | 10,808 | 6,081 | 16,889 | 21,560 | 4.3 | 24,900 | 289,540 | 13,430 | 58,230 |
| Totals, all retail stores | 27,688 | 49,091 | 43,386 | 92,477 | 123,193 | 4.5 | 124,840 | 1,515,890 | 12,304 | 235,972 |
The following table shows details by turnover size groups.
| Amount of Total Turnover | Number of Stores | Number of Paid Employees on 9 April 1963 | Total Labour Force on 9 April 1963 | Salaries and Wages Paid During 1962–63 | Sales or Turnover During 1962–63 | Stocks at Close of Year (March 1963) | ||
|---|---|---|---|---|---|---|---|---|
| Males | Females | Total | ||||||
| $ $ | $(000) | $(000) | $(000) | |||||
| Under 10,000 | 3,893 | 499 | 1,480 | 1,979 | 6,639 | 1,642 | 23,904 | 4,724 |
| 10,000–19,999 | 6,049 | 2,120 | 4,574 | 6,694 | 14,110 | 6,268 | 89,422 | 14,870 |
| 20,000–39,999 | 8,669 | 6,524 | 8,875 | 15,399 | 26,060 | 17,908 | 248,434 | 36,036 |
| 40,000–99,999 | 6,552 | 13,286 | 10,624 | 23,910 | 30,613 | 33,348 | 385,682 | 55,486 |
| 100,000–199,999 | 1,463 | 8,227 | 4,540 | 12,767 | 13,707 | 19,314 | 201,952 | 31,908 |
| 200,000–499,999 | 740 | 7,920 | 4,748 | 12,668 | 12,952 | 19,052 | 224,648 | 36,546 |
| 500,000–1,999,999 | 292 | 7,592 | 5,334 | 12,926 | 12,977 | 18,696 | 247,890 | 42,610 |
| 2,000,000–and over | 30 | 2,923 | 3,211 | 6,134 | 6,135 | 8,612 | 93,958 | 13,792 |
| Totals, all retail stores | 27,688 | 49,091 | 43,386 | 92,477 | 123,193 | 124,840 | 1,515,890 | 235,972 |
Of the 27,688 retail stores, 11,499 (41 percent) were operated by private registered companies, 9,947 (36 percent) were under individual ownership, 4,396 (16 percent) were run by partnerships, and 1,271 (5 percent) were run by public registered companies.
The following table shows details by type of organisation. The figures quoted in parentheses are in each case the percentage of total.
| Type of Organisation | Number of Stores | Turnover During 1962–63 | Stocks at Close of Year (March 1963) |
|---|---|---|---|
| $(000) | $(000) | ||
| Private registered companies | 11,499 | 796,572 | 135,302 |
| (41.5) | (52.5) | (57.3) | |
| Public registered companies | 1,271 | 316,236 | 55,706 |
| (4.6) | (20.9) | (23.6) | |
| Individual ownership | 9,947 | 211,676 | 23,872 |
| (35.9) | (14.0) | (10.1) | |
| Partnership | 4,396 | 128,208 | 11,960 |
| (15.9) | (8.4) | (5.1) | |
| Other | 575 | 63,198 | 9,132 |
| (2.1) | (4.2) | (3.9) | |
| Totals | 27,688 | 1,515,890 | 235,972 |
| (100.0) | (100.0) | (100.0) | |
The number of multiple stores engaged in retail trade represented only 11 percent of the total stores, but accounted for 31 percent of the total turnover. A multiple store is defined as one of a group of four or more under common ownership.
| Store-type Group | Number of Stores | Sales or Turnover During 1962–63 | Stocks at | |
|---|---|---|---|---|
| Start of Year (April 1962) | Close of Year (March 1963) | |||
| Multiple Stores | ||||
| $(000) | $(000) | $(000) | ||
| Food and drink | 1,112 | 78,486 | 3,802 | 4,092 |
| Apparel | 420 | 27,202 | 8,248 | 7,862 |
| Furniture | 195 | 27,054 | 4,978 | 5,102 |
| Automotive | 105 | 49,270 | 5,090 | 5,328 |
| Hardware | 114 | 31,094 | 5,666 | 6,126 |
| Chemicals (chemist, etc.) | 41 | 3,888 | 516 | 588 |
| Miscellaneous | 1,109 | 259,390 | 54,080 | 52,814 |
| Totals | 3,096 | 476,384 | 82,382 | 81,912 |
| Other Stores | ||||
| Food and drink | 12,298 | 415,366 | 22,464 | 23,378 |
| Apparel | 3,572 | 125,366 | 39,670 | 39,876 |
| Furniture | 1,256 | 70,534 | 16,566 | 16,818 |
| Automotive | 1,052 | 151,462 | 16,966 | 17,490 |
| Hardware | 741 | 41,624 | 9,978 | 10,360 |
| Chemicals (chemist, etc.) | 1,008 | 35,880 | 6,442 | 6,778 |
| Miscellaneous | 4,665 | 199,274 | 38,712 | 39,360 |
| Totals | 24,592 | 1,039,506 | 150,796 | 154,060 |
The following table shows the disposition of the different methods of selling by store-type group and by location group. The figures quoted in parentheses are in each case the percentage of total.
| Group | Turnover (1962–63) in the Form of— | Total Sales or Turnover (1962–63) | ||||||
|---|---|---|---|---|---|---|---|---|
| Cash | Charge Account | Hire Purchase Not Assigned to Finance Companies | Hire Purchase Assigned to Finance Companies | Budget Store Credit, etc. | Cash-Order Coupons | Other Instalment | ||
| Store-type Groups $(000) | ||||||||
| Food and drink | 428,186 | 64,998 | 84 | 16 | 554 | 4 | 10 | 493,852 |
| (46.7) | (13.8) | (0.1) | (–) | (4.7) | (1.1) | (0.1) | (32.6) | |
| Apparel | 124,240 | 19,290 | 882 | 842 | 3,688 | 296 | 3,330 | 152,568 |
| (13.5) | (4.1) | (1.5) | (1.7) | (31.4) | (80.4) | (45.8) | (10.1) | |
| Furniture | 28,842 | 37,098 | 21,406 | 8,968 | 478 | 4 | 792 | 97,588 |
| (3.1) | (7.9) | (35.4) | (18.7) | (4.1) | (1.1) | (10.9) | (6.4) | |
| Automotive | 102,410 | 51,078 | 15,490 | 31,690 | 14 | – | 50 | 200,732 |
| (11.2) | (10.9) | (25.6) | (65.9) | (0.1) | (–) | (0.7) | (13.2) | |
| Hardware | 16,814 | 54,798 | 318 | 658 | 18 | 2 | 110 | 72,718 |
| (1.8) | (116) | (0.5) | (1.4) | (0.2) | (0.5) | (1.5) | (4.8) | |
| Chemicals (chemist, etc.) | 37,668 | 1,852 | – | – | 248 | – | – | 39,768 |
| (4.1) | (0.4) | (–) | (–) | (2.1) | (–) | (–) | (2.6) | |
| Department, variety, and general stores | 89,832 | 62,106 | 11,468 | 774 | 2,818 | 42 | 2,084 | 169,124 |
| (9.8) | (13.2) | (19.0) | (1.6) | (24.0) | (11.4) | (28.7) | (11.2) | |
| Miscellaneous | 89,476 | 179,280 | 10,822 | 5,130 | 3,920 | 20 | 892 | 289,540 |
| (9.8) | (38.1) | (17.9) | (10.7) | (33.4) | (5.5) | (12.3) | (19.1) | |
| Totals, all retail stores | 917,468 | 470,500 | 60,470 | 48,078 | 11,738 | 368 | 7,268 | 1,515,890 |
| (100.0) | (100.0) | (100.0) | (100.0) | (100.0) | (100.0) | (100.0) | (100.0) | |
| Location Group $(000) | ||||||||
| Main urban areas (including Hutt Urban Area) | 480,922 | 162,370 | 36,044 | 25,582 | 4,532 | 226 | 5,004 | 714,680 |
| (52.4) | (34.5) | (59.6) | (53.2) | (38.6) | (61.4) | (68.9) | (47.1) | |
| Secondary urban areas (excluding Hutt Urban Area) | 201,062 | 118,154 | 14,902 | 11,310 | 4,510 | 138 | 1,200 | 351,276 |
| (21.9) | (25.1) | (24.6) | (23.5) | (38.4) | (37.5) | (16.5) | (23.2) | |
| Smaller centres | 101,128 | 83,022 | 6,054 | 6,642 | 690 | 4 | 822 | 198,362 |
| (11.0) | (17.7) | (10.0) | (13.8) | (5.9) | (1.1) | (11.3) | (13.1) | |
| Other urban | 64,116 | 51,438 | 2,640 | 3,462 | 822 | – | 154 | 122,632 |
| (7.0) | (10.9) | (4.4) | (7.2) | (7.0) | (–) | (2.1) | (8.1) | |
| Rural | 70,240 | 55,516 | 830 | 1,082 | 1,184 | – | 88 | 128,940 |
| (7.7) | (11.8) | (1.4) | (2.3) | (10.1) | (–) | (1.2) | (8.5) | |
| Totals, all retail stores | 917,468 | 470,500 | 60,470 | 48,078 | 11,738 | 368 | 7,268 | 1,515,890 |
| (100.0) | (100.0) | (100.0) | (100.0) | (100.0) | (100.0) | (100.0) | (100.0) | |
The following table shows, by the store-type group, average turnover and average labour force per establishment, turnover per unit of labour force and per head of population, and the approximate number of times stock was turned over per annum.
| Store-type Group | Average Sales or Turnover per Establishment | Average Labour Force per Establishment | Sales or Turnover per Unit of Labour Force | Sales or Turnover per Head of Population | Number of Times Stock Turned Over per Annum |
|---|---|---|---|---|---|
| $ | $ | $ | |||
| Food and drink | 36,828 | 3.6 | 10,242 | 195.4 | 18.0 |
| Apparel | 38,218 | 3.8 | 10,012 | 60.4 | 3.2 |
| Furniture | 67,256 | 5.1 | 13,294 | 38.6 | 4.5 |
| Automotive | 173,494 | 4.7 | 36,730 | 79.4 | 8.8 |
| Hardware | 85,050 | 5.4 | 15,612 | 28.8 | 4.4 |
| Chemicals | 37,908 | 3.8 | 10,010 | 15.8 | 5.4 |
| Miscellaneous | 79,436 | 6.6 | 11,974 | 181.6 | 5.0 |
| All retail stores | 54,748 | 4.5 | 12,304 | 599.8 | 6.4 |
Self-service Grocery Stores—As might be expected, self-service stores are most common among the larger establishments. A total of 83 percent of grocery stores with turnovers of $100,000 or more have self-service units, 73 percent of those in the $80,000–$99,999 group and 67 percent of those in the $60,000–$79,999 group. The percentages decline steadily with size of turnover to 20 percent of stores in the $10,000–$19,999 group and only 10 percent of those in the under $10,000 group.
| Turnover Size | With Self-service Units | Without Self-service Units | Percentage of Self-service Units to Total Stores | ||||||
|---|---|---|---|---|---|---|---|---|---|
| Number of Stores | Sales or Turnover During 1962–63 | Value of Stocks | Number of Stores | Sales or Turnover During 1962–63 | Value of Stocks | ||||
| Start of Year | Close of Year | Start of Year | Close of Year | ||||||
| $ $ | $(000) | $(000) | $(000) | $(000) | $(000) | $(000) | |||
| Under 10,000 | 17 | 138 | 22 | 26 | 161 | 948 | 122 | 140 | 9.6 |
| 10,000–19,000 | 106 | 1,668 | 188 | 208 | 432 | 6,638 | 626 | 658 | 19.7 |
| 20,000–39,999 | 632 | 19,480 | 1,850 | 1,940 | 1,206 | 35,290 | 3,124 | 3,272 | 34.4 |
| 40,000–59,999 | 568 | 27,550 | 2,200 | 2,366 | 525 | 25,186 | 2,216 | 2,262 | 52.0 |
| 60,000–79,999 | 318 | 21,630 | 1,668 | 1,780 | 157 | 10,516 | 924 | 922 | 66.9 |
| 80,000–99,999 | 127 | 11,286 | 820 | 878 | 46 | 4,036 | 362 | 376 | 73.4 |
| 100,000 and over | 140 | 20,596 | 1,486 | 1,674 | 29 | 3,616 | 390 | 362 | 82.8 |
| Totals | 1,908 | 102,348 | 8,234 | 8,872 | 2,556 | 86,230 | 7,764 | 7,992 | 42.7 |
Wholesale Establishments—The total of 3,052 wholesale stores included in the tables accounted for a turnover of $985,866,000, or an average turnover of $323,023 per store.
The principal centres of population (urban areas) contained 89.6 percent of wholesale stores with 96.1 percent of total turnover. Auckland and Wellington (including Hutt) urban areas together accounted for 46.6 percent of stores and 57.0 percent of turnover.
The following table shows the distribution of wholesale trade by statistical areas and by main location groups. The figures in parentheses are in each case the percentage of total.
| Area | Population at 31 March 1963 | Number of Stores | Purchases During 1962–63 | Sales or Turnover During 1962–63 | Stocks at Close of Year (March 1963) |
|---|---|---|---|---|---|
| (000) | $(000) | $(000) | $(000) | ||
| Statistical Areas | |||||
| Northland | 88.9 (3.5) | 57 (1.9) | 9,370 (1.2) | 11,164 (1.1) | 1,406 (1.0) |
| Central Auckland | 549.5 (21.7) | 924 (30.3) | 270,058 (34.0) | 337,994 (34.3) | 46,414 (32.8) |
| South Auckland - Bay of Plenty | 369.7 (14.6) | 215 (7.0) | 41,694 (5.3) | 51,264 (5.2) | 5,526 (3.9) |
| East Coast | 47.1 (1.9) | 23 (0.9) | 4,150 (0.5) | 5,042 (0.5) | 620 (0.5) |
| Hawke's Bay | 120.1 (4.8) | 110 (3.6) | 18,760 (2.4) | 22,826 (2.3) | 3,270 (2.3) |
| Taranaki | 102.4 (4.0) | 81 (2.7) | 14,222 (1.8) | 17,222 (1.7) | 2,422 (1.7) |
| Wellington - Hutt | 492.9 (19.5) | 700 (22.9) | 218,910 (27.6) | 268,938 (27.3) | 40,390 (28.5) |
| Marlborough | 28.8 (1.1) | 23 (0.8) | 2,636 (0.3) | 3,040 (0.3) | 358 (0.3) |
| Nelson | 65.4 (2.6) | 57 (1.9) | 9,824 (1.2) | 12,096 (1.2) | 1,610 (1.1) |
| Westland | 24.8 (1.0) | 22 (0.7) | 4,580 (0.6) | 5,502 (0.6) | 598 (0.4) |
| Canterbury | 359.0 (14.2) | 528 (17.3) | 133,492 (16.8) | 168,238 (17.1) | 25,098 (17.7) |
| Otago | 180.8 (7.2) | 214 (7.0) | 48,738 (6.1) | 61,040 (6.2) | 10,616 (7.5) |
| Southland | 97.8 (3.9) | 98 (3.2) | 17,852 (2.2) | 21,500 (2.2) | 3,264 (2.3) |
| Totals, all wholesale stores | 2,527.1 (100.0) | 3,052 (100.0) | 794,286 (100.0) | 985,866 (100.0) | 141,592 |
| Location Groups | |||||
| Main urban areas (including Hutt Urban Area) | 1,083.4 (42.9) | 2,060 (67.5) | 619,004 (77.9) | 773,420 (78.5) | 114,286 (80.7) |
| Secondary urban areas (excluding Hutt Urban Area) | 446.5 (17.7) | 676 (22.1) | 144,112 (18.2) | 174,486 (17.7) | 23,364 (16.5) |
| Smaller centres, other urban and rural | 997.2 (39.4) | 316 (10.4) | 31,170 (3.9) | 37,960 (3.8) | 3,942 (2.8) |
| Totals, all wholesale stores | 2,527.1 (100.0) | 3,052 (100.0) | 794,286 (100.0) | 985,866 (100.0) | 141,592 (100.0) |
The following tables show details of wholesale establishments by store-type groups.
| Store-type Group | Number of Stores | Number of Paid Employees on 9 April 1963 | Total Labour Force on 9 April 1963 | ||
|---|---|---|---|---|---|
| Males | Females | Total | |||
| Food and drink | 784 | 6,974 | 2,508 | 9,482 | 9,986 |
| Apparel | 309 | 1,791 | 1,261 | 3,052 | 3,242 |
| Furniture | 165 | 1,086 | 362 | 1,448 | 1,515 |
| Automotive | 263 | 2,781 | 639 | 3,420 | 3,487 |
| Hardware | 419 | 4,230 | 986 | 5,216 | 5,370 |
| Chemicals | 124 | 1,108 | 569 | 1,677 | 1,706 |
| Miscellaneous | 988 | 8,407 | 3,018 | 11,425 | 11,858 |
| Totals, all wholesale stores | 3,052 | 26,377 | 9,343 | 35,720 | 37,164 |
| Store-type Group | Average Labour Force per Store | Salaries and Wages Paid During 1962–63 | Sales or Turnover During 1962–63 | Average Sales or Turnover per Unit of Labour Force | Stocks at Close of Year (March 1963) |
|---|---|---|---|---|---|
| $(000) | $(000) | $ | $(000) | ||
| Food and drink | 12.7 | 16,188 | 321,028 | 32,148 | 21,840 |
| Apparel | 10.5 | 5,682 | 84,860 | 26,176 | 15,378 |
| Furniture | 9.2 | 2,728 | 42,820 | 28,264 | 5,502 |
| Automotive | 13.3 | 6,096 | 92,838 | 26,624 | 15,054 |
| Hardware | 12.8 | 9,364 | 117,844 | 21,944 | 26,464 |
| Chemicals | 13.8 | 2,682 | 36,848 | 21,600 | 7,452 |
| Miscellaneous | 12.0 | 20,454 | 289,628 | 24,424 | 49,902 |
| Totals, all wholesale stores | 12.2 | 63,194 | 985,866 | 26,528 | 141,592 |
A classification by size of turnover shows that stores with under $40,000 turnover numbered 755 (24.7 percent), but accounted for only $13,976,000, or 1.4 percent of turnover. At the other end of the scale a total turnover of $462,696,000 (46.9 percent) was accounted for by only 212 stores (6.9 percent), which had a turnover of $1,000,000 or more.
| Amount of Total Turnover | Number of Stores | Number of Paid Employees on 9 April 1963 | Total Labour Force on 9 April 1963 | Salaries and Wages Paid During 1962–63 | Sales or Turnover During 1962–63 | Stocks at Close of Year (March 1963) | ||
|---|---|---|---|---|---|---|---|---|
| Males | Females | Total | ||||||
| $ $ | $(000) | $(000) | $(000) | |||||
| Under 10,000 | 212 | 82 | 90 | 172 | 414 | 158 | 1,160 | 242 |
| 10,000–19,999 | 211 | 168 | 151 | 319 | 539 | 356 | 3,056 | 500 |
| 20,000–39,999 | 332 | 665 | 329 | 994 | 1,229 | 1,450 | 9,760 | 1,970 |
| 40,000–99,999 | 662 | 2,108 | 762 | 2,870 | 3,209 | 4,778 | 44,922 | 8,814 |
| 100,000–199,999 | 547 | 2,869 | 927 | 3,796 | 3,996 | 6,798 | 79,458 | 15,718 |
| 200,000–499,999 | 591 | 6,130 | 1,809 | 7,939 | 8,084 | 14,564 | 188,340 | 32,084 |
| 500,000–599,999 | 87 | 1,508 | 502 | 2,010 | 2,026 | 3,530 | 47,816 | 7,970 |
| 600,000–799,999 | 135 | 2,294 | 789 | 3,083 | 3,107 | 5,584 | 93,282 | 12,080 |
| 800,000–999,999 | 63 | 1,728 | 460 | 2,188 | 2,194 | 4,002 | 55,376 | 8,372 |
| 1,000,000 and over | 212 | 8,825 | 3,524 | 12,349 | 12,366 | 21,974 | 462,696 | 53,842 |
| Totals, all wholesale stores | 3,052 | 26,377 | 9,343 | 35,720 | 37,164 | 63,194 | 985,866 | 141,592 |
Service Establishments—Only a selected group of services was included in the Census of Distribution 1963. These were grouped in three broad divisions, personal, business and community, and other services.
Of the total number of service establishments, 85.7 percent provided services only, and in the remainder some secondary form of trading was also carried on.
Services covered by the census totalled 3,170 establishments of which 2,243, or 70.8 percent, were in the North Island and 927, or 29.2 percent, in the South Island.
The principal centres of population (urban areas) contained 71.9 percent of service establishments with 87.4 percent of the total turnover of such establishments.
The following table gives details of numbers and location of those services covered by the census.
| Item | Personal Services | Business and Community Services | Other Services | Total |
|---|---|---|---|---|
| Number of establishments .. .. .. No. | 2,132 | 301 | 737 | 3,170 |
| Sales or turnover during 1962–63 .. .. .. $(000) | 28,718 | 18,882 | 7,404 | 55,004 |
| Location of establishments | ||||
| Main urban areas (including Hutt Urban Area) .. .. .. No. | 988 | 189 | 340 | 1,517 |
| Secondary urban areas (excluding Hutt Urban Area) .. .. .. No. | 525 | 63 | 174 | 762 |
| Smaller centres .. .. .. No. | 291 | 34 | 104 | 429 |
| Other urban .. .. .. No. | 220 | 8 | 67 | 295 |
| Rural .. .. .. No. | 108 | 7 | 52 | 167 |
| Paid employees on 9 April 1963— | ||||
| Males .. .. .. No. | 3,441 | 855 | 710 | 5,006 |
| Females .. .. .. No. | 7,576 | 485 | 138 | 8,199 |
| Totals .. .. .. No. | 11,017 | 1,340 | 848 | 13,205 |
| Total labour force on 9 April 1963 .. .. .. No. | 13,195 | 1,622 | 1,659 | 16,476 |
| Salaries and wages paid during 1962–63 .. .. .. $(000) | 11,178 | 2,682 | 1,276 | 15,136 |
Service establishments are further analysed in the following table.
| Amount of Total Turnover | Number of Establishments | Number of Paid Employees on 9 April 1963 | Total Labour Force 9 April 1963 | Salaries and Wages During 1962–63 | Sales or Turnover During 1962–63 | ||
|---|---|---|---|---|---|---|---|
| Males | Females | Total | |||||
| $ $ | $(000) | $(000) | |||||
| Under 2,000 | 366 | 8 | 77 | 85 | 471 | 44 | 444 |
| 2,000– 3,999 | 747 | 58 | 394 | 452 | 1,252 | 284 | 2,128 |
| 4,000– 5,999 | 546 | 107 | 569 | 676 | 1,251 | 484 | 2,592 |
| 6,000– 9,999 | 535 | 279 | 763 | 1,042 | 1,613 | 950 | 4,062 |
| 10,000– 19,999 | 520 | 710 | 1,110 | 1,820 | 2,385 | 1,964 | 7,128 |
| 20,000– 39,999 | 254 | 960 | 762 | 1,722 | 1,975 | 2,250 | 6,914 |
| 40,000– 99,999 | 121 | 1,014 | 1,373 | 2,387 | 2,470 | 2,924 | 7,388 |
| 100,000– 199,999 | 42 | 646 | 1,538 | 2,184 | .2,205 | 2,044 | 5,814 |
| 200,000 and over | 39 | 1,224 | 1,613 | 2,837 | 2,854 | 4,192 | 18,534 |
| Totals | 3,170 | 5,006 | 8,199 | 13,205 | 16,476 | 15,136 | 55,004 |
Special Analyses—Special analyses were taken out to show total retail trade by retail and service establishments and, at the same time, details were also obtained of total services provided.
The following table shows details of retail trade as above by commodity groups.
| Commodity Group | Sales or Turnover During 1962–63 | |
|---|---|---|
| Amount | Percent of Total | |
| $(000) | ||
| Groceries and small goods (including butter, bacon, etc.) | 191,870 | 12.7 |
| Meat and fish (uncooked) | 79,572 | 5.3 |
| Fruit and vegetables | 45,380 | 3.0 |
| Other foods (baked and cooked foods, meals, etc.) | 44,926 | 3.0 |
| Milk, ice cream, confectionery, soft drinks | 42,644 | 2.8 |
| Beer, wine, and spirits | 94,560 | 6.3 |
| Tobacco, cigarettes, and tobacconists' sundries | 48,762 | 3.2 |
| Chemists' goods, toiletries, cosmetics (including dispensing) | 43,808 | 2.9 |
| Clothing, drapery, dress piece goods | 182,288 | 12.1 |
| Footwear | 35,032 | 2.3 |
| Furniture, bedding, floor coverings, soft furnishings, and household textiles | 66,854 | 4.4 |
| Television sets and spare parts | 15,604 | 1.0 |
| Radios, radiograms, and record players | 10,004 | 0.7 |
| Other musical instruments | 6,902 | 0.5 |
| Household appliances and electrical goods | 41,388 | 2.7 |
| Domestic hardware, china, and glassware | 28,574 | 1.9 |
| Builders' hardware and materials (excluding timber, bricks, and roofing tiles) | 50,528 | 3.4 |
| Books, stationery, and newspapers | 38,664 | 2.6 |
| Motor vehicles, parts, accessories (excluding petrol and oil | 206,458 | 13.7 |
| Bicycles, parts and accessories | 3,100 | 0.2 |
| Coal, coke, and firewood | 5,608 | 0.4 |
| Fertilisers and manures | 28,688 | 1.9 |
| Florists' goods | 2,484 | 0.2 |
| Grain, seed, and fodder | 29,530 | 2.0 |
| Jewellery (including watches, clocks, and precious stones) | 10,186 | 0.7 |
| Leather, luggage, and harness | 3,818 | 0.2 |
| Agricultural machinery | 28,856 | 1.9 |
| Office machinery | 12,024 | 0.8 |
| Other machinery | 13,696 | 0.9 |
| Paint, glass, and wallpaper | 13,398 | 0.9 |
| Photographic supplies and equipment | 3,276 | 0.2 |
| Plumbing equipment and piping | 454 | – |
| Professional and scientific equipment | 1,322 | 0.1 |
| Rubber goods (excluding tyres and tubes) | 912 | 0.1 |
| Sewing machines and accessories | 2,484 | 0.2 |
| Sports goods (including toys and games) | 10,308 | 0.7 |
| Seeds, plants, and garden supplies | 5,170 | 0.3 |
| Other goods | 57,304 | 3.8 |
| Totals, retail commodities | 1,506,436 | 100.0 |
The following table shows details of total services provided by retail and service establishments.
| Type of Service | Number of Establishments Handling Service Specified | Sales or Turnover During 1962–63 |
|---|---|---|
| $(000) | ||
| Personal service provided by establishments classified as— | ||
| Service establishments | 2,132 | 28,718 |
| Retail stores | 788 | 2,968 |
| Totals, personal services | 2,920 | 31,686 |
| Community and business services provided by establishments classified as— | ||
| Service establishments | 301 | 18,882 |
| Retail stores | 191 | 484 |
| Totals, community and business services | 492 | 19,366 |
| Other services provided by establishments classified as— | ||
| Service establishments | 737 | 7,404 |
| Retail stores | 1,527 | 7,672 |
| Totals, other services | 2,264 | 15,076 |
| Grand totals, all services | 5,676 | 66,128 |
The following table shows a commodity analysis of wholesale trade.
| Commodity Croup | Sales or Turnover During 1962–63 | |
|---|---|---|
| Amount | Percent of Total | |
| $(000) | ||
| Groceries and small goods (including butter, bacon, etc.) | 165,586 | 16.8 |
| Meat and fish (uncooked) | 22,448 | 2.3 |
| Fruit and vegetables | 51,548 | 5.2 |
| Other food (bread, cakes, pastry, etc.) | 28,190 | 1.8 |
| Milk, ice cream, confectionery, soft drinks | 21,104 | 2.1 |
| Beer, wine, and spirits | 45,434 | 4.6 |
| Tobacco, cigarettes, and tobacconists' sundries | 47,120 | 4.8 |
| Chemists' goods, toiletries, cosmetics | 44,712 | 4.5 |
| Clothing, drapery, and piece goods | 79,426 | 8.1 |
| Footwear | 13,616 | 1.4 |
| Furniture, bedding, floor coverings, soft furnishings, and household textiles | 32,902 | 3.3 |
| Television sets and spare parts | 9,842 | 1.0 |
| Radios, radiograms, and record players | 4,418 | 0.5 |
| Other musical instruments | 2,208 | 0.2 |
| Household appliances and electrical goods | 39,886 | 4.1 |
| Domestic hardware, china, and glassware | 21,274 | 2.2 |
| Builders' hardware and materials (excluding timber, bricks, and roofing tiles) | 47,328 | 4.8 |
| Books, stationery, and newspapers | 15,696 | 1.6 |
| Motor vehicles, parts, accessories (excluding petrol and oil) | 94,734 | 9.6 |
| Coal, coke, and firewood | 3,332 | 0.3 |
| Fertilisers, manures, grain, seed, and fodder | 24,350 | 2.5 |
| Jewellery (including watches, clocks, and precious stones) | 5,284 | 0.5 |
| Leather, luggage, and harness | 3,950 | 0.4 |
| Agricultural machinery | 8,264 | 0.8 |
| Other machinery | 40,358 | 4.1 |
| Paint, glass, and wallpaper | 14,704 | 1.5 |
| Photographic supplies and equipment | 5,534 | 0.6 |
| Plumbing equipment and piping | 10,548 | 1.1 |
| Rubber goods (excluding tyres and tubes) | 2,700 | 0.3 |
| Seeds, plants, and garden supplies | 2,284 | 0.2 |
| Sports goods (including toys and games) | 6,076 | 0.6 |
| Other | 81,010 | 8.2 |
| Totals, wholesale commodities | 985,866 | 100.0 |
Statistics of capital assets (both new and secondhand) acquired or sold in 1962–63 are shown in the following table.
| Store-type Group | New Assets Acquired | Secondhand Assets Acquired | Assets Sold | ||||
|---|---|---|---|---|---|---|---|
| Plant and Machinery | Fittings and Installations | Motor Vehicles | Plant and Machinery | Motor Vehicles | Plant and Machinery | Motor Vehicles | |
| $(thousand) | |||||||
| Retail Stores | |||||||
| Food and drink | 2,856 | 2,066 | 1,800 | 1,328 | 1,364 | 642 | 1,102 |
| Apparel | 94 | 814 | 490 | 44 | 214 | 34 | 292 |
| Furniture | 166 | 316 | 648 | 22 | 184 | 26 | 328 |
| Automotive | 222 | 256 | 1,200 | 54 | 612 | 18 | 1,578 |
| Hardware | 208 | 210 | 608 | 16 | 98 | 26 | 252 |
| Chemicals | 44 | 182 | 178 | 14 | 112 | 12 | 116 |
| Miscellaneous | 1,466 | 1,962 | 2,436 | 110 | 402 | 272 | 1,246 |
| Totals | 5,056 | 5,806 | 7,360 | 1,588 | 2,986 | 1,030 | 4,914 |
| Wholesale Stores | |||||||
| Food and drink | 1,636 | 258 | 1,622 | 134 | 122 | 108 | 596 |
| Apparel | 70 | 182 | 442 | 8 | 58 | 6 | 278 |
| Furniture | 386 | 62 | 342 | 2 | 40 | 2 | 174 |
| Automotive | 174 | 152 | 532 | 2 | 32 | 6 | 262 |
| Hardware | 384 | 234 | 792 | 12 | 84 | 34 | 332 |
| Chemicals | 60 | 16 | 360 | – | – | 6 | 164 |
| Miscellaneous | 1,114 | 1,036 | 1,818 | 92 | 182 | 88 | 936 |
| Totals | 3,824 | 1,980 | 5,908 | 250 | 518 | 250 | 2,742 |
| Services | |||||||
| Personal | 582 | 288 | 552 | 120 | 290 | 76 | 264 |
| Community and business | 46 | 46 | 112 | 4 | 40 | 4 | 56 |
| Other | 1,020 | 36 | 106 | 16 | 60 | 48 | 50 |
| Totals | 1,648 | 370 | 770 | 140 | 390 | 128 | 370 |
| Grand totals | 10,528 | 8,156 | 14,038 | 1,978 | 3,894 | 1,408 | 8,026 |
Interest paid and depreciation charged during 1962–63 are shown in the next table.
| Store-type Group | Interest Paid on Bank Overdraft and Other Business Borrowings | Business Depreciation Charges in Respect of— | |||
|---|---|---|---|---|---|
| Buildings | Plant, Equipment, Furniture, and Fittings | Motor Vehicles | Total | ||
| $(thousand) | |||||
| Retail Stores | |||||
| Food and drink | 2,060 | 874 | 4,488 | 1,546 | 6,908 |
| Apparel | 780 | 136 | 748 | 326 | 1,210 |
| Furniture | 806 | 106 | 306 | 416 | 828 |
| Automotive | 616 | 226 | 342 | 252 | 820 |
| Hardware | 552 | 128 | 280 | 416 | 824 |
| Chemicals | 102 | 42 | 208 | 120 | 370 |
| Miscellaneous | 3,154 | 726 | 2,296 | 1,618 | 4,640 |
| Totals | 8,070 | 2,238 | 8,668 | 4,694 | 15,600 |
| Wholesale Stores | |||||
| Food and drink | 940 | 324 | 1,056 | 928 | 2,308 |
| Apparel | 478 | 30 | 220 | 252 | 502 |
| Furniture | 170 | 22 | 218 | 132 | 372 |
| Automotive | 200 | 84 | 260 | 242 | 586 |
| Hardware | 714 | 172 | 834 | 476 | 1,482 |
| Chemicals | 94 | 44 | 124 | 148 | 316 |
| Miscellaneous | 1,362 | 336 | 1,154 | 908 | 2,398 |
| Totals | 3,958 | 1,012 | 3,866 | 3,086 | 7,964 |
| Services | |||||
| Personal | 174 | 60 | 642 | 374 | 1,676 |
| Community and business | 12 | 6 | 72 | 50 | 128 |
| Other | 58 | 6 | 150 | 88 | 244 |
| Totals | 244 | 72 | 864 | 512 | 1,448 |
| Grand totals | 12,272 | 3,322 | 13,398 | 8,292 | 25,012 |
QUARTERLY SURVEY OF RETAIL TRADE—A quarterly sample survey of retail trade is made by the Department of Statistics.
The present sample survey excludes certain types of retail stores which were included in the Census of Distribution 1963; these store types are hotels, chartered clubs, wine and spirit merchants, and the complete automotive group. Besides the above exclusions, for purposes of the sample survey some changes in the grouping of store types apply.
Retail Sales or Turnover—The following table gives quarterly sales.
| QUARTERLY SALES OR TURNOVER—STORE-TYPE GROUPS | ||||||||||||
|---|---|---|---|---|---|---|---|---|---|---|---|---|
| Quarter Ended | Turnover for Store-type Group | |||||||||||
| Butcher, poulterer, etc. | Grocer | Other Food and Drink | Footwear | Other Apparel | Furniture and Soft Furnishings | Household Appliances, Electrical Goods, Radios, etc. | Hardware, Builders' Hardware, Paints, etc. | Chemist | General Department, and Variety | Other | All Groups | |
| $(million) | ||||||||||||
| 1957— | ||||||||||||
| Mar | 14.5 | 33.8 | 24.6 | 4.2 | 22.6 | 8.5 | 11.0 | 13.8 | 5.2 | 30.6 | 50.6 | 219.4 |
| Jun | 15.6 | 35.3 | 24.5 | 5.2 | 29.8 | 10.7 | 10.0 | 14.8 | 5.8 | 33.7 | 51.1 | 236.6 |
| Sep | 16.2 | 36.0 | 24.5 | 4.4 | 25.0 | 11.1 | 11.0 | 15.3 | 5.9 | 32.4 | 52.8 | 234.6 |
| Dec | 16.9 | 38.8 | 27.4 | 5.7 | 31.1 | 12.4 | 15.3 | 15.9 | 6.9 | 40.1 | 62.9 | 273.5 |
| 1958— | ||||||||||||
| Mar | 15.1 | 36.5 | 25.4 | 4.8 | 24.9 | 9.9 | 11.8 | 15.2 | 5.9 | 33.3 | 52.8 | 235.7 |
| Jun | 16.4 | 37.0 | 24.9 | 5.4 | 31.2 | 12.0 | 11.8 | 16.5 | 6.0 | 36.9 | 56.0 | 254.0 |
| Sep | 16.8 | 37.0 | 25.3 | 4.6 | 25.8 | 10.6 | 10.0 | 16.2 | 5.9 | 33.7 | 53.7 | 239.5 |
| Dec | 16.9 | 40.5 | 27.5 | 5.7 | 30.5 | 11.3 | 12.3 | 17.9 | 6.9 | 40.5 | 60.4 | 270.4 |
| 1959— | ||||||||||||
| Mar | 15.1 | 36.4 | 25.0 | 4.6 | 22.7 | 8.6 | 8.8 | 14.2 | 5.8 | 31.3 | 48.0 | 220.5 |
| Jun | 16.8 | 37.7 | 25.8 | 5.6 | 29.5 | 10.0 | 9.6 | 15.0 | 6.3 | 36.1 | 53.3 | 245.7 |
| Sep | 17.4 | 38.5 | 27.0 | 4.7 | 25.0 | 10.4 | 10.1 | 15.1 | 6.4 | 34.6 | 55.5 | 244.8 |
| Dec | 17.9 | 42.5 | 29.7 | 6.2 | 31.4 | 12.3 | 12.6 | 17.5 | 7.7 | 44.1 | 65.8 | 287.6 |
| 1960— | ||||||||||||
| Mar | 16.3 | 39.1 | 29.0 | 5.0 | 25.5 | 9.9 | 10.2 | 15.4 | 6.7 | 35.1 | 64.2 | 256.3 |
| Jun | 17.2 | 40.3 | 29.0 | 6.5 | 31.9 | 11.8 | 10.7 | 16.1 | 6.9 | 38.7 | 59.7 | 268.9 |
| Sep | 18.2 | 42.4 | 30.4 | 5.7 | 27.8 | 12.2 | 12.0 | 17.3 | 7.5 | 37.3 | 62.3 | 273.2 |
| Dec | 18.5 | 45.8 | 33.3 | 7.3 | 35.1 | 14.2 | 13.3 | 19.1 | 8.7 | 47.3 | 72.6 | 315.2 |
| 1961— | ||||||||||||
| Mar | 17.4 | 42.0 | 31.7 | 5.8 | 27.6 | 11.6 | 10.9 | 17.6 | 7.8 | 37.3 | 66.9 | 276.7 |
| Jun | 17.9 | 42.7 | 30.3 | 7.1 | 33.7 | 12.7 | 11.7 | 17.7 | 8.2 | 41.5 | 64.5 | 288.3 |
| Sep | 19.1 | 44.2 | 31.7 | 5.8 | 28.7 | 12.2 | 13.3 | 18.1 | 8.6 | 37.6 | 65.1 | 284.4 |
| Dec | 19.3 | 48.2 | 35.4 | 7.4 | 35.4 | 13.8 | 15.2 | 20.2 | 10.0 | 49.2 | 73.4 | 327.3 |
| 1962— | ||||||||||||
| Mar | 17.8 | 44.3 | 33.0 | 5.8 | 28.1 | 10.8 | 11.7 | 17.5 | 8.6 | 37.1 | 65.5 | 280.3 |
| Jun | 18.5 | 45.2 | 31.4 | 7.0 | 33.1 | 12.0 | 13.4 | 17.8 | 8.7 | 41.1 | 61.9 | 290.2 |
| Sep | 18.9 | 46.8 | 32.4 | 5.9 | 29.0 | 12.3 | 1.4.1 | 17.4 | 9.0 | 39.1 | 66.3 | 291.0 |
| Dec | 19.1 | 50.5 | 36.6 | 7.4 | 35.4 | 14.2 | 17.2 | 19.6 | 10.6 | 50.9 | 76.5 | 337.9 |
| 1963— | ||||||||||||
| Mar | 18.4 | 46.2 | 34.1 | 6.0 | 28.7 | 11.7 | 14.7 | 19.0 | 9.2 | 38.1 | 73.2 | 299.3 |
| Jun | 19.3 | 47.4 | 32.7 | 7.3 | 34.8 | 13.4 | 17.0 | 18.3 | 9.1 | 45.0 | 67.3 | 311.5 |
| Sep | 20.1 | 48.7 | 33.8 | 6.1 | 30.9 | 14.2 | 18.2 | 18.8 | 9.3 | 43,1 | 66.7 | 309.7 |
| Dec | 20.7 | 52.3 | 37.4 | 7.7 | 37.0 | 15,7 | 19.6 | 22.1 | 11.1 | 57.0 | 79.0 | 359.5 |
| 1964— | ||||||||||||
| Mar | 19.0 | 47.6 | 34.6 | 6.0 | 30.1 | 12.8 | 16.9 | 20.1 | 9.4 | 43.0 | 72.7 | 312.2 |
| Jun | 20.4 | 48.8 | 32.8 | 7.7 | 36.3 | 14.9 | 18.0 | 20.9 | 9.7 | 49.5 | 70.1 | 328.9 |
| Sep | 21.0 | 50.8 | 34.2 | 6.4 | 32.2 | 15.5 | 18.4 | 21.0 | 10.2 | 47.1 | 71.8 | 328.6 |
| Dec | 22.2 | 58.0 | 38.8 | 8.2 | 39.9 | 18.0 | 21.0 | 24.5 | 12.5 | 59.7 | 87.7 | 390.5 |
| 1965— | ||||||||||||
| Mar | 20.1 | 52.0 | 36.4 | 6.3 | 32.5 | 14.1 | 16.3 | 22.3 | 10.0 | 43.7 | 85.8 | 339.5 |
| Jun | 21.5 | 54.2 | 35.1 | 7.9 | 39.9 | 16.5 | 18.1 | 23.2 | 10.3 | 50.3 | 78.4 | 355.4 |
| Sep | 22.2 | 56.7 | 36.5 | 6.6 | 35.3 | 17.0 | 17.5 | 23.9 | 10.8 | 48.9 | 78.9 | 354.3 |
| Dec | 23.6 | 62.0 | 40.8 | 8.6 | 42.8 | 19.3 | 20.0 | 27.6 | 12.9 | 65.9 | 96.3 | 419.8 |
| 1966— | ||||||||||||
| Mar | 21.7 | 55.3 | 37.9 | 6.5 | 33,4 | 15.1 | 16.8 | 23.9 | 10.6 | 47.6 | 93.3 | 362.1 |
| Jun | 23.2 | 57.4 | 36.7 | 8.8 | 43.1 | 17.5 | 18.6 | 23.7 | 10.9 | 57.0 | 85.0 | 381.9 |
| Sep | 23.6 | 60.1 | 38.6 | 7.5 | 39.0 | 18.1 | 18.5 | 23.4 | 11.9 | 52.8 | 85.6 | 379.0 |
| Dec | 24.3 | 63.7 | 42.4 | 9.3 | 45.5 | 19.8 | 19.3 | 27.0 | 13.9 | 65.1 | 99.9 | 430.2 |
The information in the preceding table on turnover has been regrouped in the following table to give statistics of commodity sales.
| QUARTERLY SALES OR TURNOVER—COMMODITY GROUPS | |||||||||
|---|---|---|---|---|---|---|---|---|---|
| Quarter Ended | Groceries and small Goods (Including Butter, Bacon, etc.) | Meat and Fish | Fruit and Vegetables | Other Foods (Baked and Cooked Foods, Meals, etc.) | Milk, Ice Cream, Confectionery, Soft Drinks, etc. | Tobacco Cigarettes, and Tobacconists' Sundries | Chemists' Goods, Toiletries, Cosmetics (Including Dispensing) | Clothing, Drapery, Dress Piece Goods | Footwear |
| $(million) | |||||||||
| 1957—Mar | 36.2 | 23.5 | 8.2 | 8.8 | 7.1 | 6.2 | 31.3 | 5.5 | |
| Jun | 37.7 | 24.6 | 8.9 | 7.9 | 7.3 | 6.7 | 40.9 | 6.7 | |
| Sep | 38.8 | 25.6 | 8.9 | 7.7 | 7.5 | 6.9 | 34.4 | 5.7 | |
| Dec | 42.2 | 27.4 | 9.5 | 8.6 | 8.4 | 8.0 | 43.1 | 7.4 | |
| 1958—Mar | 38.6 | 24.6 | 8.5 | 9.1 | 7.4 | 6.9 | 34.8 | 6.3 | |
| Jun | 39.0 | 25.6 | 8.8 | 8.1 | 7.7 | 6.9 | 42.9 | 7.0 | |
| Sep | 39.3 | 26.9 | 8.8 | 8.0 | 8.2 | 7.0 | 35.4 | 6.1 | |
| Dec. | 43.0 | 28.2 | 8.6 | 8.8 | 9.1 | 8.1 | 41.7 | 7.5 | |
| 1959—Mar | 37.3 | 24.4 | 7.6 | 8.9 | 8.2 | 6.7 | 31.5 | 6.0 | |
| Jun | 41.0 | 17.9 | 9.0 | 9.3 | 8.5 | 9.1 | 7.6 | 43.5 | 7.4 |
| Sep | 42.8 | 18.7 | 9.4 | 9.5 | 8.6 | 9.4 | 7.8 | 216.7 | 6.3 |
| Due | 46.7 | 19.0 | 11.2 | 9.9 | 10.2 | 10.6 | 9.5 | 46.7 | 8.3 |
| 1960—Mar | 42.5 | . 17.3 | 10.1 | 9.6 | 10.1 | 9.9 | 7.8 | 37.1 | 6.8 |
| Jun | 42.8 | 18.7 | 9.4 | 10.5 | 9.5 | 10.1 | 8.2 | 45.8 | 8.6 |
| Sep | 45.1 | 20.0 | 10.2 | 10.8 | 9.6 | 10.4 | 8.8 | 40.1 | 7.5 |
| Dec | 48.9 | 19.9 | 12.3 | 11.0 | 11.1 | 11.4 | 10.6 | 50.9 | 9.7 |
| 1961—Mar | 44.6 | 18.8 | 10.8 | 10.4 | 10.7 | 10.5 | 9.0 | 39.5 | 7.6 |
| Jun | 45.2 | 19.3 | 9.5 | 11.0 | 10.0 | 10.6 | 9.6 | 48.4 | 9.4 |
| Sep | 46.2 | 20.5 | 10.4 | 11.0 | 9.8 | 10.7 | 10.0 | 40.6 | 7.7 |
| Dec | 49.7 | 20.8 | 12.4 | 11.3 | 11.4 | 11.9 | 12.1 | 51.3 | 9.9 |
| 1962—Mar | 44.6 | 18.6 | 11.0 | 10.7 | 11.0 | 11.0 | 9.8 | 39.5 | 7.5 |
| Jun | 46.2 | 19.9 | 9.9 | 10.8 | 10.0 | 11.1 | 10.3 | 47.3 | 9.3 |
| Sep | 47.2 | 20.2 | 10.7 | 11.3 | 10.0 | 11.2 | 10.4 | 41.3 | 7.9 |
| Dec | 51.9 | 20.2 | 13.3 | 11.6 | 11.7 | 12.2 | 12.7 | 52.9 | 9.8 |
| 1963—Mar | 46.4 | 19.3 | 11.4 | 11.1 | 10.9 | 11.2 | 10.4 | 40.7 | 7.9 |
| Jun | 48.8 | 20.2 | 10.4 | 11.9 | 10.1 | 11.5 | 10.5 | 51.6 | 9.9 |
| Sep | 49.9 | 21.5 | 11.3 | 11.9 | 10.1 | 12.0 | 10.9 | 44.1 | 8.0 |
| Dec | 55.0 | 22.1 | 13.6 | 12.0 | 11.7 | 13.1 | 13.7 | 54.6 | 10.2 |
| 1964—Mar | 50.0 | 20.2 | 11.4 | 11.2 | 11.0 | 11.9 | 10.9 | 42.4 | 7.8 |
| Jun | 52.0 | 22.1 | 10.6 | 11.6 | 10.3 | 12.2 | 11.5 | 52,3 | 10.1 |
| Sep | 53.9 | 22.9 | 11.6 | 12.1 | 10.3 | 12.5 | 12.0 | 46.0 | 8.3 |
| Dec | 59.9 | 24.1 | 13.4 | 13.6 | 12.0 | 13.7 | 15.4 | 58.7 | 10.8 |
| 1965—Mar | 52.6 | 22.0 | 11.7 | 12.8 | 11.2 | 12.3 | 11.7 | 46.2 | 8.2 |
| Jun | 54.9 | 23.6 | 10.6 | 13.6 | 10.7 | 12.6 | 12.3 | 57.4 | 10.3 |
| Sep | 57.4 | 24.4 | 11.8 | 14.2 | 10.6 | 13.0 | 13.1 | 50.9 | 8.3 |
| Dec | 63.7 | 25.5 | 14.4 | 14.9 | 12.5 | 14.1 | 16.4 | 63.3 | 11.2 |
| 1966—Mar | 58.2 | 23.5 | 12.0 | 13.5 | 11.7 | 12.8 | 12.6 | 47.7 | 8.3 |
| Jun | 58.7 | 24.9 | 11.1 | 14.5 | 11.1 | 13.2 | 13.4 | 63.0 | 11.4 |
| Sep | 61.8 | 25.3 | 12.2 | 15.6 | 10.7 | 13.6 | 14.4 | 55.3 | 9.6 |
| Dec | 65.6 | 25.6 | 14.6 | 16.0 | 12.7 | 14.8 | 17.4 | 66.6 | 12.0 |
| Quarter Ended | Furniture, Bedding, Floor Coverings, Soft Furnishings, and Household Textiles | Musical Instruments (Including Radios and Television Sets) | Household Appliances and Electrical Goods | Domestic Hardware, China, and Glassware | Builders' Hardware and Materials (Excluding Timber, Bricks, and Roofing Tiles) | Books, Stationery, etc. | Other Commodities | Total Sales or Turnover |
|---|---|---|---|---|---|---|---|---|
| $(million) | ||||||||
| 1957—Mar | 11.4 | 3.1 | 8.9 | 6.2 | 11.8 | 7.2 | 44.1 | 219.4 |
| Jun | 14.3 | 3.7 | 8.4 | 6.6 | 12.9 | 6.6 | 43.3 | 236.6 |
| Sep | 14.7 | 3.7 | 8.7 | 6.7 | 13.3 | 6.6 | 45.2 | 234.6 |
| Dec | 16.2 | 4.4 | 12.1 | 8.4 | 13.2 | 8.4 | 56.1 | 273.5 |
| 1958—Mar | 13.3 | 3.4 | 9.5 | 7.5 | 12.8 | 7.7 | 45.1 | 235.7 |
| Jun | 16.4 | 4.3 | 9.9 | 7.7 | 14.4 | 6.8 | 48.5 | 254.0 |
| Sep | 14.6 | 3.3 | 8.3 | 7.0 | 13.7 | 6.3 | 46.8 | 239.5 |
| Dec | 15.1 | 3.6 | 10.0 | 8.3 | 14.4 | 8.8 | 55.1 | 270.4 |
| 1959—Mar | 11.7 | 2.6 | 7.2 | 6 3 | 11.4 | 7.4 | 43.3 | 220.5 |
| Jun | 13.9 | 4.0 | 7.9 | 6.6 | 12.3 | 6.9 | 40.9 | 245.7 |
| Sep | 14.1 | 3.9 | 8.4 | 6.5 | 12.2 | 6.9 | 43.7 | 244.8 |
| Dec | 15.9 | 5.4 | 11.6 | 8.8 | 12.5 | 9.5 | 51.9 | 287.6 |
| 1960—Mar | 13.2 | 4.3 | 8.6 | 6.5 | 11.3 | 7.5 | 53.7 | 256.3 |
| Jun | 16.1 | 4.7 | 8.6 | 6.8 | 12.1 | 7.3 | 49.8 | 268.9 |
| Sep | 16.1 | 5.2 | 9.6 | 7.0 | 12.7 | 7.7 | 52.3 | 273.2 |
| Dec | 18.1 | 5.2 | 11.7 | 9.2 | 12.3 | 10.2 | 62.7 | 315.2 |
| 1961—Mar | 14.8 | 4.2 | 8.8 | 7.1 | 12.8 | 8.2 | 58.7 | 276.7 |
| Jun | 16.7 | 4.5 | 9.6 | 7.1 | 13.4 | 8.5 | 55.5 | 288.3 |
| Sep | 16.5 | 5.9 | 9.2 | 6.7 | 12.8 | 8.3 | 58.3 | 284.4 |
| Dec | 18.1 | 5.6 | 12.1 | 9.1 | 13.0 | 10.3 | 68.0 | 327.3 |
| 1962—Mar | 14.1 | 4.4 | 8.5 | 6.6 | 12.2 | 8.9 | 61.8 | 280.3 |
| Jun | 16.5 | 7.3 | 9.4 | 6.6 | 12.6 | 8.6 | 54.7 | 290.2 |
| Sep | 16.8 | 7.5 | 9.2 | 6.2 | 12.2 | 8.8 | 60.2 | 291.0 |
| Dec | 18.6 | 9.1 | 12.2 | 8.7 | 12.5 | 11.4 | 69.0 | 337.9 |
| 1963—Mar | 15.1 | 7.7 | 9.6 | 6.8 | 13.1 | 9.7 | 68.1 | 299.3 |
| Jun | 17.0 | 9.1 | 10.8 | 7.0 | 12.4 | 9.1 | 62.5 | 311.5 |
| Sep | 17.9 | 9.2 | 11.5 | 7.0 | 12.8 | 9.2 | 62.2 | 309.7 |
| Dec | 19.1 | 9.8 | 13.7 | 9.7 | 13.1 | 11.7 | 76.3 | 359.5 |
| 1964—Mar | 15.1 | 9.2 | 10.1 | 7.2 | 13.2 | 9.5 | 70.9 | 312.2 |
| Jun | 17.5 | 10.7 | 11.2 | 7.9 | 14.3 | 9.2 | 65.4 | 328.9 |
| Sep | 18.3 | 10.4 | 11.2 | 7.8 | 14.5 | 9.4 | 67.4 | 328.6 |
| Dec | 21.8 | 10.8 | 14.0 | 10.1 | 15.3 | 12.1 | 84.8 | 390.5 |
| 1965—Mar | 17.8 | 8.1 | 11.1 | 7.4 | 14.3 | 9.7 | 82.2 | 339.5 |
| Jun | 20.4 | 9.9 | 12.3 | 7.8 | 15.4 | 8.8 | 74.8 | 355.4 |
| Sep | 21.0 | 8.9 | 12.0 | 7.9 | 15.6 | 8.9 | 76.2 | 354.3 |
| Dec | 23.9 | 9.7 | 15.2 | 11.0 | 16.4 | 11.8 | 95.6 | 419.8 |
| 1966—Mar | 19.0 | 7.3 | 12.0 | 8.5 | 14.4 | 9.9 | 92.7 | 362.1 |
| Jun | 22.4 | 8.7 | 12.9 | 8.8 | 14.6 | 9.2 | 84.1 | 381.9 |
| Sep | 23.4 | 7.8 | 12.8 | 8.6 | 15.2 | 9.4 | 83.1 | 379.0 |
| Dec | 24.5 | 7.3 | 14.8 | 11.5 | 15.2 | 12.7 | 98.8 | 430.2 |
Retail Stocks—The following table shows quarterly stock values. The figures up to June 1964 have been revised.
| QUARTERLY STOCK VALUES—STORE-TYPE GROUPS | ||||||||||||
|---|---|---|---|---|---|---|---|---|---|---|---|---|
| Quarter Ended | Stocks for Store-type Groups | |||||||||||
| Butcher, Poulterer, etc. | Grocer | Other Food and Drink | Footwear | Other Apparel | Furniture and Soft Furnishings | Household Appliances, Electrical Goods, Radios, etc. | Hardware, Builders' Hardware, Paints, etc. | Chemist | General, Department and Variety | Other | All Groups | |
| $(million) | ||||||||||||
| 1960—Jun | 0.9 | 16.2 | 4.2 | 8.6 | 38.3 | 11.7 | 9.1 | 14.2 | 5.8 | 29.3 | 48.9 | 187.2 |
| Sep | 0.8 | 16.2 | 4.2 | 8.7 | 40.2 | 12.1 | 9.9 | 14.6 | 5.7 | 31.9 | 51.1 | 195.4 |
| Dec | 0.7 | 16.1 | 4.4 | 8.5 | 38.5 | 12.0 | 9.6 | 15.0 | 5.6 | 32.1 | 50.5 | 193.1 |
| 1961—Mar | 0.8 | 15.8 | 4.3 | 8.5 | 40.0 | 12.2 | 9.8 | 15.8 | 6.0 | 33.0 | 50.1 | 196.4 |
| Jun | 0.9 | 16.2 | 4.2 | 8.7 | 39.5 | 13.4 | 10.0 | 16.1 | 6.2 | 32.5 | 53.8 | 201.5 |
| Sep | 0.9 | 16.6 | 4.3 | 9.1 | 41.7 | 13.8 | 10.8 | 16.3 | 6.2 | 36.6 | 57.4 | 213.6 |
| Dec | 0.9 | 16.6 | 4.6 | 8.7 | 39.1 | 13.2 | 10.4 | 15.9 | 6.3 | 33.5 | 55.2 | 204.4 |
| 1962—Mar | 0.9 | 16.8 | 4.6 | 8.8 | 41.9 | 12.4 | 10.3 | 16.0 | 6.6 | 34.4 | 54.3 | 206.9 |
| Jun | 1.0 | 16.8 | 4.5 | 8.7 | 40.8 | 12.5 | 10.7 | 16.6 | 6.1 | 33.4 | 54.8 | 206.3 |
| Sep | 1.0 | 17.1 | 4.6 | 8.9 | 42.1 | 12.3 | 11.4 | 16.0 | 6.8 | 35.8 | 57.6 | 213.7 |
| Dec | 0.9 | 17.0 | 4.7 | 8.4 | 39.3 | 12.5 | 11.1 | 16.1 | 6.9 | 32.9 | 55.2 | 204.8 |
| 1963—Mar | 1.0 | 16.9 | 4.8 | 8.9 | 38.8 | 12.9 | 11.5 | 16.7 | 7.0 | 33.9 | 55.7 | 208.1 |
| Jun | 1.0 | 17.4 | 4.8 | 8.3 | 38.4 | 13.1 | 11.6 | 17.3 | 7.2 | 35.3 | 53.9 | 208.2 |
| Sep | 0.9 | 17.8 | 4.8 | 9.1 | 40.2 | 13.6 | 12.5 | 16.7 | 7.3 | 37.3 | 59.6 | 219.8 |
| Dec | 0.9 | 17.9 | 4.7 | 8.9 | 38.4 | 13.2 | 11.9 | 17.3 | 7.3 | 35.6 | 58.1 | 214.2 |
| 1964—Mar | 1.0 | 18.6 | 4.9 | 9.0 | 41.1 | 13.5 | 13.2 | 17.9 | 7.5 | 35.9 | 57.7 | 220.5 |
| Jun | 1.1 | 19.6 | 4.9 | 8.9 | 43.2 | 13.8 | 13.5 | 18.9 | 7.7 | 36.2 | 58.7 | 226.5 |
| Sep | 0.9 | 18.7 | 5.0 | 10.1 | 45.1 | 15.6 | 14.0 | 18.0 | 7.6 | 44.2 | 61.0 | 240.3 |
| Dec | 0.7 | 18.6 | 4.9 | 9.8 | 43.1 | 15.3 | 14.1 | 18.6 | 7.6 | 39.0 | 58.1 | 229.8 |
| 1965—Mar | 0.9 | 18.6 | 4.9 | 10.3 | 46.3 | 16.0 | 14.5 | 18.6 | 7.9 | 41.7 | 60.3 | 240.1 |
| Jun | 1.0 | 18.9 | 4.9 | 10.4 | 46.0 | 16.1 | 14.8 | 18.0 | 8.2 | 40.7 | 65.2 | 244.1 |
| Sep | 0.9 | 18.9 | 5.1 | 11.2 | 48.1 | 16.3 | 15.2 | 19.1 | 8.1 | 45.1 | 71.1 | 259.0 |
| Dec | 0.8 | 19.4 | 5.3 | 10.2 | 46.1 | 16.2 | 15.2 | 20.0 | 8.1 | 42.6 | 69.4 | 253.1 |
| 1966—Mar | 1.0 | 20.2 | 5.4 | 10.5 | 49.3 | 16.1 | 15.5 | 20.2 | 8.4 | 44.0 | 69.8 | 260.4 |
| Jun | 1.0 | 19.8 | 5.3 | 10.7 | 47.5 | 17.0 | 15.2 | 19.5 | 8.6 | 42.2 | 73.6 | 260.2 |
| Sep | 0.9 | 20.3 | 5.5 | 11.5 | 50.2 | 17.5 | 16.1 | 20.1 | 9.0 | 44.8 | 77.5 | 273.4 |
| Dec | 0.9 | 20.2 | 5.8 | 11.1 | 48.8 | 17.2 | 15.3 | 19.6 | 9.1 | 41.1 | 76.9 | 266.0 |
Retail Trade Statistics Corrected for Seasonal Fluctuations and for Price and Population Changes—To facilitate direct comparisons between quarterly figures, seasonally corrected values of retail trade turnover have been prepared. To do this, seasonal correction factors were calculated representing, for each quarter, an average over several years of the ratio of sales in this quarter to the trend value for the quarter (the trend values being calculated as appropriately centred moving averages). The factors have been revised from time to time as later figures indicated changes in the magnitudes of the seasonal fluctuations. Those in use from the June quarter 1963 are based on the period March quarter 1958 to December quarter 1962.
Over the period covered by the, retail trade survey there has been a rise in the general price level so that part of the increase in the survey figures has been the result purely of this price change and does not represent an increase in the real volume of sales. A special pries index has been prepared for the purpose of deflating the retail sales figures to give a series in dollars of constant purchasing power—i.e., the adjusted series shows the changes in the real volume of retail sales. The principal source of the prices used for this index are the commodity prices used in the Consumers' Price Index. The prices have been appropriately weighted and the whole index expressed on the base: year ended 31 March 1958 (=1000), so that application of the index to the original figures, both before and after seasonal correction, gives series in constant 1957–58 dollars.
Finally, a further adjustment has been made to express the series in terms of turnover per head of population in recognition of the fact that part of the expansion of retail turnover is due to population growth.
The results of these calculations and adjustments are shown in the following table.
| QUARTERLY SALES OR TURNOVER—ALL STORE TYPES | ||||||
|---|---|---|---|---|---|---|
| Quarter Ended | Total Sales or Turnover | |||||
| In Current $s | In Constant 1957–58 $s | |||||
| As Recorded | Seasonally Corrected | Before Seasonal Correction | Seasonally Corrected | |||
| Value | Index Number* | Value | Index Number* | |||
| * Base: Average quarterly values during the year ended March 1958 (= 1000). | ||||||
| $(m) | $(m) | $(m) | $(m) | |||
| 1957—March | 219.4 | 234.4 | 958 | 224.2 | 239.6 | 980 |
| June | 236.6 | 238.8 | 976 | 238.6 | 241.0 | 985 |
| September | 234.6 | 242.2 | 990 | 234.8 | 242.4 | 991 |
| December | 273.5 | 245.6 | 1,004 | 272.6 | 245.0 | 1,002 |
| 1958—March | 235.7 | 251.8 | 1,029 | 234.0 | 250.0 | 1,022 |
| June | 254.0 | 256.4 | 1,048 | 250.4 | 252.8 | 1,034 |
| September | 239.5 | 247.2 | 1,011 | 231.4 | 238.8 | 977 |
| December | 270.4 | 243.0 | 993 | 259.6 | 233.2 | 953 |
| 1959—March | 220.5 | 235.6 | 963 | 211.8 | 226.4 | 925 |
| June | 245.7 | 248.0 | 1,014 | 236.0 | 238.4 | 974 |
| September | 244.8 | 252.6 | 1,033 | 233.6 | 241.0 | 986 |
| December | 287.6 | 258.4 | 1,056 | 274.6 | 246.8 | 1,009 |
| 1960—March | 256.3 | 273.8 | 1,119 | 244.6 | 261.2 | 1,068 |
| June | 268.9 | 271.4 | 1,110 | 256.2 | 258.6 | 1,057 |
| September | 273.2 | 282.0 | 1,153 | 258.0 | 266.2 | 1,088 |
| December | 315.2 | 283.2 | 1,158 | 295.4 | 265.4 | 1,085 |
| 1961—March | 276.7 | 295.6 | 1,208 | 260.8 | 278.6 | 1,139 |
| June | 288.3 | 291.2 | 1,190 | 271.4 | 274.2 | 1,121 |
| September | 284.4 | 293.6 | 1,200 | 265.4 | 273.8 | 1,119 |
| December | 327.3 | 294.0 | 1,202 | 304.2 | 273.2 | 1,117 |
| 1962—March | 280.3 | 299.4 | 1,224 | 260.6 | 278.2 | 1,138 |
| June | 290.2 | 293.0 | 1,198 | 269.8 | 272.4 | 1,113 |
| September | 291.0 | 300.4 | 1,228 | 269.0 | 277.6 | 1,135 |
| December | 337.9 | 306.8 | 1,254 | 311.4 | 282.8 | 1,156 |
| 1963—March | 299.3 | 317.2 | 1,297 | 275.8 | 292.4 | 1,195 |
| June | 311.6 | 317.0 | 1,274 | 286.6 | 291.6 | 1,192 |
| September | 309.6 | 319.8 | 1,266 | 283.6 | 293.0 | 1,198 |
| December | 359.6 | 325.6 | 1,470 | 326.0 | 295.4 | 1,208 |
| 1964—March | 312.2 | 330.2 | 1,276 | 281.8 | 298.2 | 1,219 |
| June | 329.0 | 334.6 | 1,345 | 293.8 | 298.8 | 1,100 |
| September | 328.6 | 339.4 | 1,387 | 290.0 | 299.6 | 1,225 |
| December | 390.5 | 353.8 | 1,446 | 339.8 | 307.8 | 1,258 |
| 1965—March | 339.5 | 359.2 | 1,468 | 295.6 | 312.8 | 1,279 |
| June | 355.4 | 361.6 | 1,478 | 308.6 | 314.0 | 1,284 |
| September | 354.3 | 366.0 | 1,496 | 306.0 | 316.0 | 1,292 |
| December | 419.8 | 380.2 | 1,554 | 360.0 | 326.0 | 1,333 |
| 1966—March | 362.1 | 383.0 | 1,566 | 309.4 | 327.4 | 1,339 |
| June | 381.9 | 388.4 | 1,588 | 325.2 | 330.8 | 1,352 |
| September | 379.0 | 391.4 | 1,600 | 320.6 | 331.2 | 1,354 |
| December | 430.2 | 389.6 | 1,593 | 361.8 | 327.6 | 1,340 |
| Quarter Ended | Turnover per Head of Population | |||||
|---|---|---|---|---|---|---|
| In Current $s | In Constant 1957-58 $s | |||||
| As Recorded | Seasonally Corrected | Before Seasonal Correction | Seasonally Corrected | |||
| Value | Index Number* | Value | Index Number* | |||
| * Base: Average quarterly values during the year ended March 1958 (= 1000). | ||||||
| $ | $ | $ | $ | |||
| 1957—March | 99.0 | 105.8 | 972 | 101.2 | 108.2 | 994 |
| June | 106.4 | 107.4 | 986 | 107.2 | 108.2 | 994 |
| September | 104.8 | 108.2 | 994 | 105.0 | 108.4 | 995 |
| December | 121.4 | 109.0 | 1,001 | 121.0 | 108.8 | 999 |
| 1958—March | 103.8 | 111.0 | 1,019 | 103.2 | 110.2 | 1,012 |
| June | 111.4 | 112.6 | 1,033 | 110.0 | 111.0 | 1,019 |
| September | 104.6 | 108.0 | 992 | 101.2 | 104.4 | 958 |
| December | 117.2 | 105.4 | 967 | 112.6 | 101.0 | 928 |
| 1959—March | 95.0 | 101.6 | 932 | 91.2 | 97.6 | 895 |
| June | 105.6 | 106.6 | 978 | 101.4 | 102.4 | 940 |
| September | 104.8 | 108.2 | 993 | 100.0 | 103.2 | 947 |
| December | 122.4 | 109.8 | 1,009 | 116.8 | 105.0 | 964 |
| 1960—March | 108.4 | 115.8 | 1,063 | 103.4 | 110.4 | 1,014 |
| June | 113.4 | 114.6 | 1,051 | 108.0 | 109, 0 | 1,001 |
| September | 114.8 | 118.6 | 1,089 | 108.4 | 112.0 | 1,028 |
| December | 131.6 | 118.2 | 1,086 | 123.4 | 110.8 | 1,018 |
| 1961—March | 114.8 | 122.8 | 1,127 | 108.2 | 115.6 | 1,062 |
| June | 119.4 | 120.4 | 1,106 | 112.4 | 113.4 | 1,042 |
| September | 117.0 | 120.8 | 1,109 | 109.2 | 112.6 | 1,034 |
| December | 133.4 | 120.0 | 1,101 | 124.0 | 111.4 | 1,023 |
| 1962—March | 113.4 | 121.2 | 1,113 | 105.4 | 112.6 | 1,035 |
| June | 117.0 | 118.0 | 1,084 | 108.8 | 109.8 | 1,008 |
| September | 116.8 | 120.6 | 1,107 | 108.0 | 111.4 | 1,023 |
| December | 134.6 | 122.2 | 1,122 | 124.2 | 112.6 | 1,034 |
| 1963—March | 118.4 | 125.6 | 1,153 | 109.2 | 115.6 | 1,062 |
| June | 122.8 | 125.0 | 1,148 | 113.0 | 115.0 | 1,056 |
| September | 121.6 | 125.6 | 1,154 | 111.4 | 115.0 | 1,056 |
| December | 140.2 | 127.0 | 1,166 | 127.2 | 115.2 | 1,058 |
| 1964—March | 120.8 | 127.8 | 1,174 | 109.2 | 115.4 | 1,060 |
| June | 126.8 | 129.0 | 1,185 | 113.4 | 115.2 | 1,058 |
| September | 126.4 | 130.6 | 1,198 | 111.6 | 115.2 | 1,058 |
| December | 149.2 | 135.2 | 1,241 | 129.8 | 117.6 | 1,080 |
| 1965—March | 128.8 | 136.4 | 1,252 | 112.2 | 118.8 | 1,091 |
| June | 134.6 | 137.0 | 1,258 | 116.8 | 118.8 | 1,091 |
| September | 133.8 | 138.2 | 1,269 | 115.6 | 119.4 | 1,096 |
| December | 157.4 | 142.6 | 1,309 | 135.0 | 122.2 | 1,122 |
| 1966—March | 135.2 | 143.0 | 1,314 | 115.6 | 122.2 | 1,122 |
| June | 142.6 | 145.2 | 1,333 | 121.6 | 123.6 | 1,135 |
| September | 141.2 | 145.9 | 1,339 | 119.4 | 123.4 | 1,133 |
| December | 159.2 | 144.2 | 1,325 | 134.0 | 121.4 | 1,114 |
The information in the two preceding tables is presented graphically in the following diagrams.
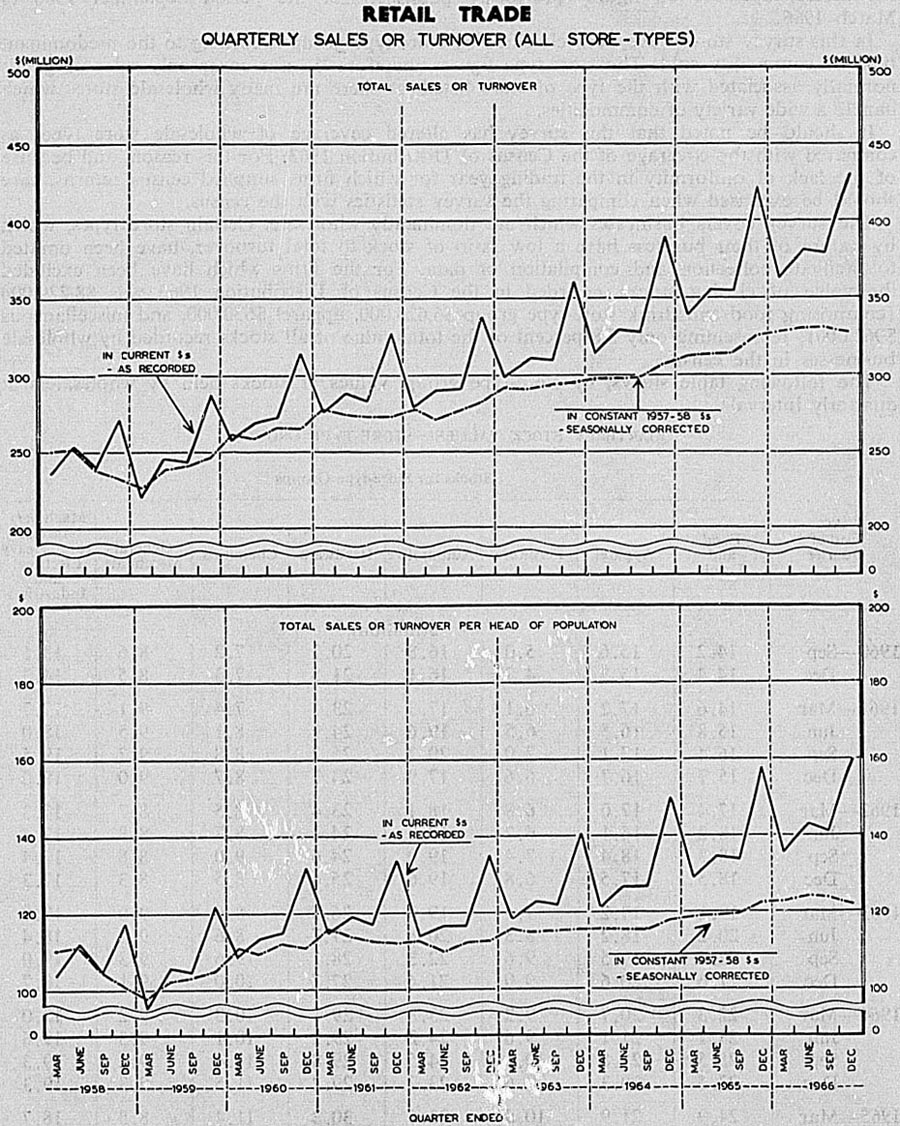
QUARTERLY SURVEY OF WHOLESALE TRADE—The quarterly survey of wholesale trade commenced in September 1960 and was revised in 1966. The revision was made to cover some new businesses and changes in method of selling from mostly retail to mostly wholesale disclosed by the 1963 Census of Distribution, together with additional businesses commencing operations in later quarterly periods. Reclassification of stores also took place. The major reclassification of store type occurred in the “General Merchants” category; a number of such firms are now included in the “Food and Drink” store-type group. All data supplied by the firms were reclassified back to the inception of the survey. The figures presented in the tables supersede all figures previously published for the period September 1960 to March 1966.
In this survey stores have been classified by store-type group according to the predominant type of commodity sold. The store-type figures therefore do not cover only sales of goods normally associated with the type of store listed, as there are many wholesale stores which handle a wide variety of commodities.
It should be noted that this survey has altered coverage of wholesale store types as compared with the coverage of the Census of Distribution 1963. For this reason, and because of the lack of uniformity in the trading year for which firms supplied census returns, care should be exercised when comparing the survey statistics with the census.
The survey covers businesses which are dominantly wholesale. Certain store types, which by nature of their business have a low ratio of stock to total turnover, have been omitted to facilitate collection and compilation of data. For the firms which have been excluded the value of closing stocks recorded in the Census of Distribution 1963 was $8,220,000 (comprising food and drink store-type group $6,628,000, apparel $630,000, and miscellaneous $962,000), representing only 5.8 percent of the total value of all stocks recorded by wholesale businesses in the census.
The following table shows, by store-type group, values of stocks held by wholesalers at quarterly intervals.
| QUARTERLY STOCK VALUES—STORE-TYPE GROUPS | ||||||||
|---|---|---|---|---|---|---|---|---|
| At End of Quarter | Stocks for Store-type Groups | |||||||
| Food and Drink | Apparel | Furniture | Automotive | Hardware | Chemicals | General Merchants | Machinery (Agricultural, Heavy Electrical and Industrial) | |
| $(million) | ||||||||
| 1960—Sep | 14.2 | 15.6 | 5.0 | 16.8 | 20.7 | 7.2 | 8.6 | 13.5 |
| Dec | 14.4 | 15.3 | 4.7 | 16.1 | 21.5 | 7.3 | 8.5 | 14.3 |
| 1961—Mar | 14.6 | 17.2 | 6.1 | 17.3 | 23.3 | 7.4 | 9.1 | 17.7 |
| Jun | 15.8 | 16.5 | 6.5 | 19.6 | 24.9 | 8.1 | 9.5 | 18.0 |
| Sep | 16.4 | 17.1 | 7.0 | 20.2 | 25.2 | 8.8 | 9.7 | 19.5 |
| Dec | 15.7 | 16.7 | 6.6 | 17.9 | 23.7 | 8.7 | 9.0 | 19.0 |
| 1962—Mar | 17.4 | 17.0 | 6.8 | 18.1 | 23.4 | 8.5 | 8.7 | 17.3 |
| Jun | 18.2 | 16.1 | 6.7 | 18.7 | 24.3 | 8.7 | 8.8 | 17.4 |
| Sep | 18.3 | 18.4 | 7.4 | 19.0 | 24.6 | 9.0 | 8.8 | 17.4 |
| Dec | 18.5 | 17.5 | 6.8 | 19.6 | 25.6 | 8.5 | 8.3 | 17.3 |
| 1963—Mar | 19.1 | 19.2 | 7.4 | 19.0 | 26.5 | 8.6 | 9.0 | 17.8 |
| Jun | 20.2 | 18.2 | 8.3 | 20.8 | 27.7 | 8.6 | 9.2 | 18.4 |
| Sep | 22.0 | 19.5 | 9.6 | 22.3 | 28.1 | 9.6 | 9.3 | 19.0 |
| Dec | 21.6 | 20.6 | 9.0 | 21.4 | 27.7 | 10.0 | 9.1 | 18.7 |
| 1964—Mar | 22.3 | 20.7 | 9.2 | 23.8 | 29.1 | 10.3 | 9.2 | 19.0 |
| Jun | 23.1 | 21.1 | 9.6 | 24.2 | 29.2 | 10.1 | 9.3 | 19.6 |
| Sep | 25.5 | 21.8 | 10.1 | 24.5 | 29.8 | 11.4 | 9.2 | 19.3 |
| Dec | 23.5 | 20.3 | 9.6 | 23.2 | 29.2 | 11.5 | 9.3 | 19.3 |
| 1965—Mar | 24.9 | 21.9 | 10.5 | 23.6 | 30.2 | 11.4 | 8.8 | 18.7 |
| Jun | 24.3 | 21.5 | 11.3 | 24,5 | 30.9 | 11.8 | 9.4 | 21.2 |
| Sep | 24.0 | 22.8 | 12.0 | 27.8 | 32.7 | 13.9 | 9.8 | 22.6 |
| Dec | 24.6 | 22.4 | 11.9 | 29.9 | 35.1 | 14.5 | 9.3 | 23.4 |
| 1966—Mar | 27.1 | 23.0 | 13.3 | 31.0 | 35.0 | 14.4 | 9.4 | 23.4 |
| Jun | 26.9 | 22.6 | 13.0 | 29.4 | 35.3 | 14.9 | 9.4 | 24.4 |
| Sep | 27.7 | 21.8 | 12.5 | 29.5 | 35.1 | 17.5 | 9.5 | 25.0 |
| Dec | 27.0 | 21.3 | 12.3 | 34.3 | 34.9 | 17.2 | 9.1 | 25.6 |
| At End of Quarter | Stocks for Store-type Groups | ||||||
|---|---|---|---|---|---|---|---|
| Electrical Supplies | Paper and Stationery | Grain and Seeds | Rubber, Leather and Canvas Goods | Office, Printers' and Photographic Supplies | Other | All Groups | |
| $(million) | |||||||
| 1960—Sep | 6.0 | 3.7 | 1.9 | 1.7 | 2.0 | 14.8 | 131.5 |
| Dec | 6.3 | 3.9 | 1.7 | 1.8 | 1.8 | 16.3 | 133.8 |
| 1961—Mar | 8.3 | 3.9 | 1.9 | 1.8 | 2.8 | 12.3 | 143.7 |
| Jun | 7.9 | 4.1 | 2.0 | 1.8 | 3.1 | 13.9 | 151.7 |
| Sep | 8.2 | 4.4 | 1.8 | 2.0 | 2.9 | 15.1 | 158.2 |
| Dec | 8.0 | 3.8 | 1.7 | 2.0 | 2.8 | 14.3 | 149.8 |
| 1962—Mar | 7.7 | 3.7 | 2.1 | 2.1 | 2.8 | 13.9 | 149.4 |
| Jun | 7.6 | 3.9 | 2.0 | 2.1 | 2.3 | 13.0 | 149.9 |
| Sep | 7.9 | 4.1 | 1.9 | 2.2 | 3.0 | 14.0 | 155.8 |
| Dec | 7.8 | 4.0 | 1.7 | 2.2 | 3.0 | 13.8 | 154.8 |
| 1963—Mar | 8.1 | 3.9 | 2.1 | 2.3 | 2.9 | 13.2 | 159.1 |
| Jun | 7.7 | 4.1 | 2.3 | 2.4 | 2.8 | 13.5 | 164.0 |
| Sep | 7.9 | 5.3 | 2.1 | 2.4 | 3.1 | 15.3 | 175.6 |
| Dec | 8.7 | 4.8 | 1.9 | 2.3 | 3.6 | 13.6 | 173.1 |
| 1964—Mar | 9.5 | 5.2 | 2.4 | 2.5 | 3.5 | 14.1 | 180.8 |
| Jun | 10.2 | 5.0 | 2.6 | 2.6 | 3.4 | 13.8 | 183.7 |
| Sep | 10.3 | 5.3 | 2.4 | 2.8 | 4.2 | 15.3 | 191.9 |
| Dec | 10.6 | 5.4 | 2.3 | 2.9 | 4.3 | 15.0 | 186.4 |
| 1965—Mar | 11.0 | 5.8 | 2.5 | 2.6 | 4.1 | 14.3 | 190.3 |
| Jun | 10.9 | 5.5 | 2.9 | 2.5 | 4.0 | 13.9 | 194.6 |
| Sep | 12.2 | 6.3 | 2.9 | 2.5 | 4.9 | 15.9 | 210.4 |
| Dec | 12.9 | 5.7 | 2.6 | 2.7 | 5.2 | 16.5 | 216.8 |
| 1966—Mar | 15.5 | 6.0 | 2.6 | 2.7 | 5.5 | 17.2 | 226.4 |
| Jun | 12.5 | 6.0 | 2.7 | 2.7 | 5.1 | 16.0 | 220.8 |
| Sep | 11.9 | 6.5 | 2.6 | 2,8 | 5.6 | 17.1 | 225.2 |
| Dec | 13.0 | 6.3 | 2.2 | 3.2 | 5.1 | 15.1 | 226.6 |
The following table shows, by store-type group, for stores covered by the survey, values of sales or turnover by wholesalers for quarterly periods.
| QUARTERLY SALES OR TURNOVER—STORE-TYPE GROUPS | ||||||||
|---|---|---|---|---|---|---|---|---|
| Quarter Ended | Turnover for Store-type Groups | |||||||
| Food and Drink | Apparel | Furniture | Automotive | Hardware | Chemicals | General Merchants | Machinery (Agricultural, Heavy Electrical and Industrial) | |
| $(million) | ||||||||
| 1960—Sep | 40.5 | 23.4 | 10.8 | 32.3 | 25.2 | 12.6 | 20.4 | 14.5 |
| Dec | 44.5 | 24.3 | 11.0 | 30.8 | 24.9 | 10.7 | 23.1 | 14.9 |
| 1961—Mar | 40.1 | 22.6 | 8.9 | 28.0 | 25.0 | 11.3 | 20.3 | 16.0 |
| Jun | 43.7 | 26.2 | 11.3 | 32.9 | 28.3 | 12.0 | 20.4 | 15.5 |
| Sep | 46.6 | 24.7 | 12.6 | 35.7 | 28.2 | 12.2 | 20.8 | 15.9 |
| Dec | 52.5 | 23.9 | 11,3 | 36.0 | 26.7 | 11.6 | 20.6 | 15.1 |
| 1962—Mar | 45.0 | 23.6 | 8.5 | 31.2 | 24.6 | 11.7 | 17.4 | 13.1 |
| Jun | 46.5 | 25.4 | 11.1 | 32.2 | 26.6 | 11.7 | 17.6 | 12.8 |
| Sep | 49.3 | 24.2 | 14.1 | 37.9 | 28.1 | 12.9 | 19.8 | 14.2 |
| Dec | 56.0 | 24.1 | 15.0 | 38.9 | 27.6 | 13.3 | 20.8 | 14.9 |
| 1963—Mar | 51.0 | 22.7 | 13.0 | 35.0 | 27.2 | 14.4 | 19.7 | 15.1 |
| Jun | 55.0 | 26.7 | 15.0 | 40.3 | 29.3 | 13.8 | 19.9 | 15.5 |
| Sep | 57.9 | 28.9 | 18.6 | 47.9 | 31.9 | 14.9 | 20.4 | 16.6 |
| Dec | 66.9 | 27.9 | 18.7 | 55.3 | 32.4 | 14.5 | 23.1 | 16.8 |
| 1964—Mar | 58.7 | 26.1 | 16.1 | 40.7 | 31.4 | 15.4 | 18.8 | 16.1 |
| Jun | 62.1 | 30.9 | 19.8 | 49.0 | 36.2 | 15.8 | 20.2 | 16.5 |
| Sep | 68.7 | 28.9 | 22.6 | 55.0 | 36.8 | 16.8 | 20.4 | 18.2 |
| Dec | 75.8 | 28.9 | 22.5 | 52.6 | 38.4 | 18.1 | 23.3 | 18.8 |
| 1965—Mar | 66.6 | 28.7 | 18.8 | 45.6 | 38.0 | 16.8 | 20.3 | 18.1 |
| Jun | 68.4 | 30.1 | 21.7 | 54.9 | 41.7 | 18.7 | 22.3 | 17.2 |
| Sep | 71.7 | 31.0 | 22.6 | 56.9 | 44.0 | 21.7 | 26.5 | 23.5 |
| Dec | 78.3 | 29.8 | 20.6 | 58.3 | 42.9 | 21.2 | 27.1 | 23.4 |
| 1966—Mar | 65.0 | 29.3 | 17.8 | 53.0 | 44.1 | 21.4 | 20.5 | 22.2 |
| Jun | 71.8 | 31.0 | 22.6 | 57.3 | 45.1 | 21.6 | 22.5 | 20.5 |
| Sep | 78.4 | 29.8 | 23.6 | 59.4 | 47.8 | 22.1 | 25.3 | 22.2 |
| Dec | 89.2 | 30.2 | 22.3 | 56.9 | 45.1 | 23.9 | 26.6 | 23.8 |
| Quarter Ended | Turnover for Store-type Groups | ||||||
|---|---|---|---|---|---|---|---|
| Electrical Supplies | Paper and Stationery | Grain and Seeds | Rubber, Leather and Canvas Goods | Office, Printers' and Photographic Supplies | Other | All Groups | |
| $(million) | |||||||
| 1960—Sep | 7.9 | 5.6 | 5.8 | 3.0 | 2.8 | 22.1 | 227.2 |
| Dec | 7.7 | 5.6 | 4.1 | 3.2 | 2.8 | 25.4 | 232.9 |
| 1961—Mar | 9.9 | 5.4 | 4.9 | 2.8 | 3.0 | 23.9 | 222.2 |
| Jun | 7.5 | 5.6 | 4.2 | 3.0 | 3.0 | 21.3 | 235.1 |
| Sep | 11.1 | 8.3 | 4.3 | 3.1 | 3.0 | 23.2 | 249.6 |
| Dec | 9.5 | 8.2 | 4.3 | 3.0 | 3.0 | 24.2 | 249.8 |
| 1962—Mar | 7.6 | 5.5 | 4.5 | 2.6 | 2.7 | 23.1 | 221.1 |
| Jun | 9.8 | 5.9 | 4.1 | 3.2 | 2.3 | 20.2 | 229.2 |
| Sep | 11.3 | 6.6 | 4.9 | 3.1 | 2.8 | 22.9 | 252.1 |
| Dec | 9.6 | 6.8 | 4.1 | 3.1 | 3.4 | 24.9 | 262.6 |
| 1963—Mar | 10.1 | 9.0 | 4.5 | 3.1 | 3.0 | 23.2 | 251.0 |
| Jun | 11.4 | 9.6 | 4.0 | 3.3 | 2.7 | 23.0 | 269.6 |
| Sep | 13.2 | 10.0 | 5.3 | 3.5 | 3.2 | 23.6 | 295.9 |
| Dec | 12.5 | 10.5 | 4.6 | 3.6 | 3.9 | 28.9 | 319.5 |
| 1964—Mar | 12.0 | 9.3 | 4.8 | 3.1 | 3.2 | 25.6 | 281.2 |
| Jun | 15.1 | 9.9 | 4.5 | 3.7 | 2.8 | 25.0 | 311.5 |
| Sep | 15.5 | 10.9 | 4.6 | 3.8 | 3.5 | 24.9 | 330.7 |
| Dec | 18.4 | 11.7 | 4.7 | 4.2 | 3.8 | 28.4 | 349.5 |
| 1965—Mar | 13.7 | 10.7 | 5.5 | 3.7 | 3.8 | 23.4 | 313.7 |
| Jun | 16.9 | 9.8 | 5.2 | 4.2 | 3.8 | 23.5 | 338.6 |
| Sep | 15.6 | 11.4 | 6.7 | 4.2 | 4.6 | 25.2 | 365.5 |
| Dec | 15.1 | 11.5 | 5.6 | 4.1 | 5.8 | 29.7 | 373.2 |
| 1966—Mar | 12.8 | 11.2 | 6.0 | 4.5 | 5.1 | 24.6 | 337.4 |
| Jan | 16.1 | 11.1 | 4.8 | 4.5 | 4.6 | 27.1 | 360.5 |
| Sep | 15.9 | 11.8 | 6.1 | 4.6 | 5.2 | 27.3 | 379.6 |
| Dec | 14.0 | 12.3 | 5.4 | 4.3 | 5.6 | 31.6 | 391.5 |
HIRE-PURCHASE TRADE—Hire-purchase trade in New Zealand has been growing steadily in recent years in common with other developed countries. This growth generally is explained by common causes, including an increasing social acceptance and the development of borrowing facilities. There is an increasing tendency for consumer durables to be purchased on credit. Instalment credit allows high-priced goods to be acquired as opportunity or desire dictates, with less reference to the immediate cash position. Some people welcome the discipline of monthly credit repayments as a means of saving. Consumer credit is provided either by retailers or finance companies. A major activity of the finance companies is the financing of motor vehicles on hire purchase.
Regulations to curb hire-purchase trade have existed since 22 July 1955. Restrictions in recent years are now set out.
| Commodity | Date Effective | Minimum Deposit Percent | Maximum Repayment Period Months |
|---|---|---|---|
| New motor cars and light trucks | 17 Apr. 1961 | 66 2/3 | 12 |
| Secondhand cars and light trucks | 17 Apr. 1961 | 50 | 18 |
| 1 Sep. 1965 | 50 | 12 | |
| 11 Feb. 1967 | 66 2/3 | 12 | |
| Motor cycles | 11 Feb. 1967 | 50 | 12 |
| Furniture and furnishings | 3 May 1962 | 5 | 24 |
| 11 Feb. 1967 | 15 | 18 | |
| Other consumer goods | 3 May 1962 | 5 | 24 |
| 24 Apr. 1964 | 10 | 24 | |
| 11 Feb. 1967 | 15 | 18 |
A quarterly survey is made of hire-purchase trade. It includes selected merchandising firms and finance corporations and is estimated to cover about 58 percent of hire-purchase business. The following table shows the value of goods sold on hire-purchase as recorded by the businesses in the survey and the percentage deposit to total value of goods so sold.
| Period | Value of Goods Sold on Hire Purchase | Details of Purchase | Percentage in Cash to Total Value of Goods Sold on Hire Purchase | |
|---|---|---|---|---|
| Cash Payments | Amount Financed Under Hire-purchase Agreements | |||
| $(000) | $(000) | $(000) | percent | |
| Motor Vehicles | ||||
| Quarter ended— | ||||
| 1964—31 March | 8,680 | 4,508 | 4,172 | 51.9 |
| 30 June | 9,032 | 4,664 | 4,368 | 51.6 |
| 30 September | 10,664 | 5,544 | 5,120 | 52.0 |
| 31 December | 11,802 | 5,916 | 5,886 | 50.1 |
| 1965—31 March | 10,968 | 5,524 | 5,444 | 50.4 |
| 30 June | 12,178 | 6,470 | 5,708 | 53.1 |
| 30 September | 13,320 | 7,062 | 6,258 | 53.0 |
| 31 December | 13,762 | 7,134 | 6,628 | 51.8 |
| 1966—31 March | 13,542 | 7,146 | 6,396 | 52.8 |
| 30 June | 16,262 | 9,122 | 7,140 | 56.1 |
| 30 September | 15,716 | 8,126 | 7,590 | 51.7 |
| 31 December | 16,476 | 8.442 | 8,034 | 51.2 |
| Plant and Machinery | ||||
| 1964—31 March | 3,668 | 1,278 | 2,390 | 34.8 |
| 30 June | 2,176 | 798 | 1,378 | 36.7 |
| 30 September | 3,210 | 956 | 2,254 | 29.8 |
| 31 December | 3,860 | 1,060 | 2,800 | 27.5 |
| 1965—31 March | 4,408 | 1,416 | 2,992 | 32.1 |
| 30 June | 2,982 | 886 | 2,096 | 29.7 |
| 30 September | 4,180 | 1,492 | 2,688 | 35.7 |
| 31 December | 5,962 | 2,152 | 3,810 | 36.1 |
| 1966—31 March | 6,256 | 2,330 | 3,926 | 37.2 |
| 30 June | 4,180 | 1,492 | 2,688 | 35.7 |
| 30 September | 4,500 | 1,728 | 2,772 | 38.4 |
| 31 December | 5,552 | 1,982 | 3,570 | 35.7 |
| Period | Value of Goods Sold on Hire Purchase | Details of Purchase | Percentage in Cash to Total Value of Goods Sold on Hire Purchase | |
|---|---|---|---|---|
| Cash Payments | Amount Financed Under Hire-purchase Agreements | |||
| $(000) | $(000) | $(000) | percent | |
| Television Sets | ||||
| Quarter ended— | ||||
| 1964—31 March | 1,748 | 296 | 1,452 | 16.9 |
| 30 June | 1,914 | 422 | 1,492 | 22.0 |
| 30 September | 1,908 | 378 | 1,530 | 19.8 |
| 31 December | 1,606 | 398 | 1,208 | 24.8 |
| 1965—31 March | 1,306 | 270 | 1,036 | 20.7 |
| 30 June | 1,568 | 296 | 1,272 | 18.9 |
| 30 September | 1,252 | 252 | 1,000 | 20.1 |
| 31 December | 1,114 | 232 | 882 | 20.8 |
| 1966—31 March | 940 | 184 | 756 | 19.6 |
| 30 June | 1,190 | 220 | 970 | 18.5 |
| 30 September | 1,162 | 218 | 944 | 18.8 |
| 31 December | 728 | 134 | 594 | 18.4 |
| Other Household and Personal Goods | ||||
| 1964—31 March | 5,836 | 998 | 4,838 | 17.1 |
| 30 June | 6,978 | 1,164 | 5,814 | 16.1 |
| 30 September | 6,392 | 1,098 | 5,294 | 17.2 |
| 31 December | 7,762 | 1,236 | 6,526 | 15.9 |
| 1965—31 March | 5,658 | 1,030 | 4,628 | 18.2 |
| 30 June | 6,688 | 1,072 | 5,616 | 16.0 |
| 30 September | 6,568 | 1,238 | 5,330 | 18.8 |
| 31 December | 8,324 | 1,390 | 6,934 | 16.7 |
| 1966—31 March | 6,212 | 1,076 | 5,136 | 17.3 |
| 30 June | 7,062 | 1,140 | 5,922 | 16.1 |
| 30 September | 7,010 | 1,134 | 5,876 | 16.2 |
| 31 December | 8,092 | 1,290 | 6,802 | 15.9 |
| Total | ||||
| 1964—31 March | 19,932 | 7,080 | 12,852 | 35.5 |
| 30 June | 20,100 | 7,048 | 13,052 | 35.1 |
| 30 September | 22,174 | 7,976 | 14,198 | 36.0 |
| 31 December | 25,030 | 8,610 | 16,420 | 34.4 |
| 1965—31 March | 22,340 | 8,240 | 14,100 | 36.9 |
| 30 June | 23,416 | 8,724 | 14,692 | 37.3 |
| 30 September | 25,320 | 10,044 | 15,276 | 39.7 |
| 31 December | 29,162 | 10,908 | 18,254 | 37.4 |
| 1966—31 March | 26,950 | 10,736 | 16,214 | 39.8 |
| 30 June | 28,694 | 11,974 | 16,720 | 41.7 |
| 30 September | 28,388 | 11,206 | 17,182 | 39.5 |
| 31 December | 30,848 | 11,848 | 19,000 | 38.4 |
The following table shows the amount owing under hire-purchase agreements and the percentage of payments overdue at the end of each quarterly period. As stated previously the statistics are estimated to cover about 58 percent of total hire-purchase business.
| As at— | Amount Owing Under Hire-purchase Agreements | Percentage of Payments Overdue |
|---|---|---|
| $(000) | ||
| 1964—31 March | 48,190 | 4.8 |
| 30 June | 47,810 | 4.9 |
| 30 September | 49,074 | 4.4 |
| 31 December | 52,450 | 4.4 |
| 1965—31 March | 54,550 | 4.0 |
| 30 June | 55,300 | 4.0 |
| 30 September | 56,788 | 4.1 |
| 31 December | 61,812 | 3.8 |
| 1966—31 March | 61,702 | 3.9 |
| 30 June | 62,704 | 3.9 |
| 30 September | 62,876 | 4.0 |
| 31 December | 64,342 | 4.1 |
The following table shows the average amount covered by hire-purchase agreements in each of the four categories of sales for each quarterly period.
| Period | Motor Vehicles | Machinery | Household and Personal Goods | |
|---|---|---|---|---|
| Television Sets | Other Household and Personal Goods | |||
| $ | $ | $ | $ | |
| Quarter ended— | ||||
| 1964—31 March | 628 | 4,046 | 274 | 60 |
| 30 June | 628 | 3,482 | 256 | 54 |
| 30 September | 634 | 3,046 | 250 | 58 |
| 31 December | 674 | 4,128 | 232 | 56 |
| 1965—31 March | 646 | 4,446 | 244 | 62 |
| 30 June | 618 | 4,200 | 238 | 54 |
| 30 September | 668 | 3,580 | 228 | 56 |
| 31 December | 694 | 4,102 | 208 | 60 |
| 1966—31 March | 656 | 4,402 | 198 | 66 |
| 30 June | 718 | 3,970 | 188 | 54 |
| 30 September | 740 | 3,372 | 192 | 64 |
| 31 December | 766 | 3,486 | 204 | 60 |
LAW OF NEW ZEALAND—The law applied in the Courts of New Zealand has three principal sources—the common law of England, certain statutes of the United Kingdom Parliament enacted prior to 1947, and statutes of the New Zealand Parliament.
The initial law of New Zealand when it became a British colony was the law of England as it existed on 14 January 1840—that is, the common law together with those statutes of the United Kingdom Parliament which were applicable to the circumstances of the colony at that date. Subsequent law consists of those enactments of the United Kingdom Parliament between 1840 and 1947 which extended expressly or by necessary implication to New Zealand, and the enactments of the New Zealand Legislature.
In interpreting the common law the Courts have been concerned to preserve uniformity with the common law as interpreted in England. This unity is ensured not only by the existence of the Privy Council as the final Court of appeal for New Zealand, but by the practice of the Judges of following English decisions even though they are in theory not bound by them.
The New Zealand Parliament is the sole authority with inherent power to legislate for the country and there are no constitutional restrictions on the law which it can pass. Before the adoption by New Zealand of the Statute of Westminster in 1947 the powers of Parliament were limited in two respects. First, there was a somewhat uncertain and ill-defined incapacity to make laws having extra-territorial application, and, secondly, there was an incapacity to make laws conflicting with a statute of the United Kingdom Parliament extending to New Zealand. Since 1947, however, both these limitations have disappeared, although the United Kingdom Parliament still has the power to make laws extending to New Zealand at the request and with the consent of the New Zealand Legislature.
REVISION OF LAW—In any progressive society the law requires alteration from time to time if it is to reflect the life of the community and adequately give effect to the needs of the people. As in other countries in modern times, legislation is by far the most important means by which the law of New Zealand is adapted to changing circumstances. The responsibility of bringing before Parliament proposals for the revision of the common law and that part of the statute law not administered by other Departments of State is in the hands of the Minister of Justice. Hitherto the Minister of Justice has been assisted in carrying out this responsibility by the Law Revision Committee, an informal advisory body established in 1937. In December 1965, however, a Law Revision Commission was set up under the chairmanship of the Minister of Justice comprising members of the Government and Opposition parties in Parliament, the heads of the three principal legal Departments of State, and representatives of the practising legal profession and of the university law faculties. The principal functions of the Commission will be to prepare programmes for the reform of the law, to indicate the order in which particular topics should be examined, to allocate the work, and to exercise a general oversight over law reform. In addition to the Commission there are four standing committees each specialising in a particular area of the law. These committees will consider topics referred to them by the Commission and will report thereon, normally to the Minister of Justice.
COURTS—The hierarchy of Courts in New Zealand comprises the Court of Appeal, the Supreme Court, and the Magistrates' Courts.
As constituted by the Judicature Amendment Act 1957 the Court of Appeal consists of the Chief Justice by virtue of his office as head of the judiciary and of a President and two Judges of the Court of Appeal appointed by the Governor-General. An additional Judge or Judges of the Supreme Court may be nominated by the Chief Justice to sit on the Court of Appeal in any particular case where it is expedient. The Judges of the Court of Appeal are also Judges of the Supreme Court, but have seniority over all other Judges of that Court except the Chief Justice or the acting Chief Justice.
The Court of Appeal may from time to time appoint ordinary or special sittings and may make rules in respect of places and times for sittings and similar matters.
The Court of Appeal, unlike other Courts, exercises an appellate jurisdiction only. In addition to ordinary appeals from the Supreme Court, certain other proceedings in inferior Courts may, on an order from the Supreme Court, be removed into the Court of Appeal for argument. The Court of Appeal also determines criminal appeals under the Crimes Act 1961.
All decisions of the Court of Appeal are final unless leave is granted to appeal to the Privy Council. This leave may be granted either by the Court of Appeal or by the Privy Council itself. The Privy Council thus remains the final Court of appeal in all civil cases and may also occasionally hear appeals in special criminal cases.
The Supreme Court, which was first established by the Supreme Court Ordinance 1841, is now constituted under the Judicature Act 1908. The Members of the Court are a Chief Justice and 15 other Judges, the number being fixed by statute. An additional Judge or Judges may be appointed whenever the Governor-General deems it necessary by reason of absence or anticipated absence of any of the Judges on leave prior to retirement, each appointment being a permanent one from the time when it is made. The fixing of the number of Judges, together with the provision that the salary of a Judge shall not be diminished during his term of office, is an important safeguard for the principle of judicial independence. Judges, who retire at 72 years are appointed to hold office during good behaviour and may be removed only by the Queen upon an Address by the House of Representatives. The Governor-General may suspend a Judge upon a like Address.
Magistrates' Courts are set up under the Magistrates' Courts Act 1947 and possess an extensive jurisdiction in both civil and criminal cases. The jurisdiction of the Court is exercised by Stipendiary Magistrates, whose number is limited by statute to 40, there being 38 at present holding office. Justices of the Peace, however, still sit as a Magistrates' Court to hear a limited number of minor criminal charges.
Stipendiary Magistrates must have been qualified as barristers and solicitors of the Supreme Court for at least seven years. They are appointed by the Governor-General, and may be removed by the Governor-General for inability or misbehaviour only. They retire at 68 years of age.
Apart from these Courts of general jurisdiction there are in New Zealand several Courts with specialist functions. These include the Court of Arbitration, which makes awards governing pay and working conditions in industry, and also makes general wage orders; the Compensation Court, which determines claims under the Workers' Compensation Act; the Land Valuation Court, which determines disputes over the valuation of land and hears claims for compensation when land is taken for public purposes; and the Maori Land Court and Maori Appellate Court, which have jurisdiction in respect of questions relating to Maori land.
JURIES—The institution of the jury is regulated in New Zealand by the Juries Act 1908. Subject to certain exceptions, every British subject between 21 and 65 years of age and resident within 15 miles of a Supreme Court centre is liable to serve on a jury. Women have the right to exemption on request.
The list of exempted persons is contained in the Juries Amendment Act 1951. The following is a summary of the persons now exempted from jury service:
Members of the Executive Council and of the House of Representatives; Judges of the Supreme Court and of the Compensation Court; Judges and Members of the Court of Arbitration and of the Land Valuation Court; Judges and Commissioners of the Maori Land Court; Magistrates; Visiting Prison Justices and members of Parole Boards; Coroners; the Chairman of the Local Government Commission; the Chairman and Members of the Licensing Control Commission; Officers of Parliament; clergymen; nuns; persons wholly engaged in teaching and school inspectors; barristers and solicitors; medical practitioners, nurses, and dentists; registered chemists; members of the armed forces; Police and traffic officers; pilots, masters, and crews of vessels; members of fire brigades; certain Civil Defence personnel; and certain officers of the Department of Justice, including those engaged in Court or prison work, and wives of prison officers.
Special juries are provided for in section 71 of the Juries Act. That section provides that in a civil action in the Supreme Court triable by jury either party may, by leave of the Court or a Judge thereof, procure trial by a special jury instead of a common jury. Except with the consent of all the parties, however, no action may be tried with a special jury unless in the opinion of the Court or a Judge difficult questions in relation to scientific, technical, business, or professional matters are likely to arise.
The Grand Jury was abolished in New Zealand by the Crimes Act 1961.
LEGAL PROFESSION—At 31 December 1966 there were 2,493 members of the New Zealand Law Society holding practising certificates. These members included 30 females.
CIVIL JURISDICTION: Magistrates' Courts—Magistrates' Courts have existed in New Zealand since 1846. The Courts may now hear all claims up to $2,000, but if the parties agree in writing that the Court shall hear their case it has jurisdiction whatever the amount claimed. In the exercise of this jurisdiction it may grant the same remedies, legal and equitable, as the Supreme Court.
The following table shows the number of plaints entered, cases disposed of, amounts sued for, and amounts for which judgment was recorded in the Magistrates' Courts during the latest 11 years.
| Year | Plaints Entered | Cases Disposed of | |||
|---|---|---|---|---|---|
| Number | Total Amount Sued for | Number | Total Amount Claimed | Total Amount for which Judgment Entered | |
| $(000) | $(000) | $(000) | |||
| 1955 | 66,078 | 5,686 | 38,475 | 3,004 | 2,636 |
| 1956 | 72,746 | 6,124 | 43,872 | 3,718 | 3,200 |
| 1957 | 79,000 | 6,426 | 46,477 | 3,730 | 3,152 |
| 1958 | 82,493 | 6,364 | 50,094 | 3,638 | 3,150 |
| 1959 | 80,856 | 5,772 | 51,386 | 3,612 | 2,942 |
| 1960 | 81,185 | 6,296 | 49,499 | 2,952 | 2,556 |
| 1961 | 92,383 | 7,394 | 54,266 | 3,848 | 3,434 |
| 1962 | 108,698 | 8,924 | 60,537 | 4,684 | 4,102 |
| 1963 | 112,692 | 9,520 | 66,663 | 5,192 | 4,472 |
| 1964 | 115,902 | 9,444 | 69,016 | 5,154 | 4,554 |
| 1965 | 112,813 | 11,526 | 69,690 | 5,244 | 4,644 |
The average amount claimed in each plaint was $86 in 1955 and $102 in 1965.
Supreme Court—The jurisdiction of the Supreme Court is twofold, original and appellate. It has by statute a general jurisdiction to administer the laws of New Zealand. One important aspect of this original jurisdiction is an inherent power to control inferior Courts and judicial tribunals through the writs of certiorari and prohibition. This is essentially a power to determine the limits of jurisdiction of other Courts and is to be distinguished from its appellate function by which the Supreme Court reviews a case which was properly heard and determined by a lower Court. An appeal to the Supreme Court lies only where it is provided for by statute. With certain exceptions, all cases determined in the Magistrates' Court are subject to appeal to the Supreme Court.
The next table shows the number of actions commenced, cases tried, and judgments entered, together with the amounts for which judgments were recorded in the civil jurisdiction of the Supreme Court in the latest 11 years.
| Year | Number of Actions Commenced | Cases Tried | Judgments Recorded (Entered or in Cases Tried) | |||
|---|---|---|---|---|---|---|
| With Jury | Without Jury | Number | Amount Claimed | Amount Recovered | ||
| $(000) | $(000) | |||||
| 1955 | 1,614 | 137 | 198 | 365 | 1,057 | 511 |
| 1956 | 1,735 | 146 | 199 | 393 | 1,653 | 801 |
| 1957 | 1,817 | 144 | 206 | 414 | 1,489 | 709 |
| 1958 | 1,931 | 153 | 242 | 477 | 1,672 | 936 |
| 1959 | 2,136 | 138 | 240 | 471 | 2,034 | 1,172 |
| 1960 | 2,162 | 138 | 248 | 443 | 1,862 | 1,010 |
| 1961 | 2,201 | 128 | 278 | 466 | 2,086 | 871 |
| 1962 | 1,891 | 144 | 286 | 466 | 1,902 | 1,037 |
| 1963 | 2,008 | 141 | 256 | 436 | 3,035 | 1,865 |
| 1964 | 1,967 | 106 | 241 | 345 | 1,601 | 889 |
| 1965 | 2,183 | 98 | 296 | 319 | 2,105 | 1,181 |
Court of Appeal—During the five years 1961 to 1965 there were 242 civil appeals, of which 72 were allowed, and also 14 cases removed to the Appeal Court, resulting in seven judgments for the plaintiffs and seven for the defendants.
CRIMINAL JURISDICTION: Magistrates' Courts—Since 1952, Magistrates have had jurisdiction, which was confirmed by the Summary Proceedings Act 1957, to deal with the majority of indictable offences. This Act gives a Magistrate jurisdiction over all crimes against property and all but the most grave of other crimes, such as treason, homicide, rape, and perjury. If the Magistrate deals summarily with an indictable offence, he may impose a sentence of imprisonment of up to three years or a fine of up to $400. A Magistrate may, however, decline to deal with an offence summarily, in which case the accused is committed for trial in the Supreme Court in the ordinary way. The accused person has, moreover, the right to claim jury trial if he is charged with any offence, indictable or summary, punishable by imprisonment for more than three months.
Justices of the Peace now hear only a small number of summary cases where the statute creating the offence provides that one Justice or two or more Justices are to have power to deal with it, or where jurisdiction is expressly conferred on Justices in a particular case. The tendency is to have all but the most trivial criminal cases dealt with by Stipendiary Magistrates, although the extent to which this is practicable varies from district to district.
The following table shows the number of charges dealt with in Magistrates' Courts in the latest 11 years. These figures and all the figures relating to Magistrates' Courts, Supreme Court, and prisons, include Maoris; Children's Court cases are excluded and will be found under the section relating to juvenile offences.
| Year | Charges Against Males | Charges Against Females | Total |
|---|---|---|---|
| 1955 | 82,218 | 4,317 | 86,535 |
| 1956 | 91,314 | 5,262 | 96,576 |
| 1957 | 104,142 | 5,655 | 109,797 |
| 1958 | 113,506 | 6,804 | 120,310 |
| 1959 | 106,360 | 6,622 | 112,982 |
| 1960 | 117,061 | 7,735 | 124,796 |
| 1961 | 126,030 | 8,925 | 134,955 |
| 1962 | 140,992 | 9,918 | 150,910 |
| 1963 | 147,101 | 10,759 | 157,860 |
| 1964 | 168,940 | 13,694 | 182,634 |
| 1965 | 186,696 | 14,506 | 201,202 |
The great majority of these charges are, as may be expected, for comparatively minor offences, particularly against the traffic laws. Traffic offences alone accounted for more than two-thirds of the convictions in the Magistrates' Courts in 1965; of the 183,855 convictions, 144,289 were for traffic offences, while 6,320 were for offences against the liquor laws, and 4,568 for drunkenness.
The following table classifies the convictions in Magistrates' Courts into more common offences or groups of offences for the latest five years. The figures refer to total charges, with the corresponding number of distinct cases following the totals in each year. There were 12,022 offences by females in the 156,662 distinct cases for 1965.
| Type of Offence | 1961 | 1962 | 1963 | 1964 | 1965 |
|---|---|---|---|---|---|
*Counting only the principal offence in cases where a person is charged simultaneously with two or more offences. †Excludes offences of negligence or drunk in charge causing death or injury; conversion; drunk in charge; failing to stop after accident involving injury. ‡Includes assaulting, etc., police, previously in another group. §Does not include trespass as in previous years. | |||||
| Common assault | 1,067 | 1,312 | 1,401 | 1,526 | 1,434 |
| Sexual offences | 564 | 748 | 602 | 695 | 731 |
| Other offences against the person | 152 | 153 | 234 | 323 | 971‡ |
| Theft | 3,500 | 3,950 | 3,904 | 4,074 | 4,299 |
| Wilful damage | 852 | 931 | 943 | 846 | 879§ |
| Other offences against property (including forgery) | 5,107 | 5,865 | 6,461 | 6,658 | 6,890 |
| Drunkenness (including drunk in charge, etc.) | 4,494 | 5,294 | 5,118 | 4,786 | 4,568 |
| Application for prohibition order | 637 | 764 | 817 | 654 | 635 |
| Offensive conduct or language, obstruction, etc., of police, and vagrancy | 2,694 | 3,697 | 4,092 | 4,876 | 3,848 |
| Offences against good order | 1,809 | 1,607 | 1,628 | 1,603 | 1,351 |
| Breach of probation | 436 | 472 | 486 | 512 | 563 |
| Offences relating to dangerous drugs | 61 | 19 | 58 | 63 | 94 |
| Failing to pay maintenance | 1,313 | 1,531 | 1,650 | 1,696 | 1,988 |
| Other offences relating to administration of justice, drugs, etc. | - | - | - | - | 1,495 |
| Breach of price control orders | 139 | 24 | 3 | 5 | 1 |
| Failing to furnish return and making false return of land and income | 4,118 | 3,589 | 3,604 | 1,901 | 879 |
| Unlawfully on licensed premises and other breaches of Licensing and Sale of Liquor Acts | 5,036 | 4,951 | 4,918 | 4,784 | 6,320 |
| Deserting merchant ships | 226 | 244 | 160 | 151 | 210 |
| Other offences | 4,593 | 4,921 | 4,832 | 6,082 | 4,482 |
| Sub-totals | 36,798 | 40,072 | 40,911 | 41,235 | 41,638 |
| Minor traffic offences† | 85,746 | 97,323 | 102,102 | 125,255 | 142,217 |
| Totals | 122,544 | 137,395 | 143,013 | 166,490 | 183,855 |
| Distinct Cases* | 102,340 | 114,749 | 119,871 | 142,855 | 156,662 |
| Rate per 10,000 mean population for convictions, excluding minor traffic offences | 151.6 | 161.0 | 160.9 | 158.7 | 157.3 |
The next table classifies the result of hearing and punishment inflicted on summary conviction for all cases during 1965.
| Result of Hearing | Offences Against the Person | Offences Against Property | Offences Against Good Order | Offences Affecting Administration of Justice, etc. | Other Offences | Total |
|---|---|---|---|---|---|---|
| *A large proportion are traffic offences. | ||||||
| Committed for trial or sentence | 271 | 747 | 38 | 50 | 13 | 1,119 |
| Imprisonment | 672 | 3,475 | 890 | 272 | 286 | 5,595 |
| Corrective training | - | - | - | - | - | - |
| Detention in detention centre | 98 | 333 | 69 | 35 | - | 535 |
| Detention in borstal institution, etc. | 44 | 1,162 | 84 | 76 | 3 | 1,369 |
| Released on probation | 314 | 3,104 | 381 | 39 | 76 | 3,914 |
| Convicted and ordered to come up for sentence if required | 151 | 276 | 204 | 39 | 21 | 691 |
| Fined* | 1,742 | 2,946 | 147,261 | 576 | 10,760 | 163,285 |
| Convicted and discharged (or pay costs) | 115 | 772 | 3,020 | 174 | 746 | 4,827 |
| Suspended imprisonment (maintenance cases) | - | - | - | 1,866 | - | 1,866 |
| Miscellaneous | - | - | 710 | 1,063 | - | 1,773 |
| Dismissed, withdrawn, or struck out | 854 | 1,596 | 8,400 | 3,318 | 2,060 | 16,228 |
| Totals | 4,261 | 14,411 | 161,057 | 7,508 | 13,965 | 201,202 |
| Distinct cases | 3,417 | 6,814 | 141,713 | 6,765 | 10,565 | 169,274 |
Traffic Offences—Traffic offences form so large a proportion of summary convictions that a further analysis is of interest. The roost frequent traffic offences dealt with are breaches of parking regulations and excessive speed, but cases of negligent or dangerous driving have shown a steady increase.
The following table analyses all traffic convictions dealt with in Magistrates' Courts for the latest five years.
| Offence | 1961 | 1962 | 1963 | 1964 | 1965 |
|---|---|---|---|---|---|
| Reckless, dangerous, or careless use or driving of motor vehicle causing death | 22 | 27 | 41 | 52 | 78 |
| Reckless, dangerous, or careless use or driving of motor vehicle causing injury | 31 | 32 | 64 | 157 | 134 |
| Driving, or in charge of, motor vehicle under the influence of drink or drugs causing de th | - | - | 2 | 2 | 2 |
| Driving, or in charge of, motor vehicle under the influence of drink or drugs causing injury | 1 | 1 | 2 | 2 | 4 |
| Failing to stop motor vehicle after accident involving bodily injury | 12 | 11 | 36 | 25 | 50 |
| Unlawfully converting vehicle to own use | 947 | 1,095 | 1,161 | 1,055 | 953 |
| Driving, or in charge of, motor vehicle under the influence of drink or drug | 713 | 782 | 814 | 759 | 847 |
| Driving, or in charge of, other vehicle under the influence of drink or drug | 2 | 2 | 5 | 1 | 4 |
| Exceeding speed limits | 25,059 | 27,892 | 28,059 | 36,029 | 40,865 |
| Reckless, dangerous, or careless use or driving, of motor vehicle | 14,058 | 15,052 | 16,266 | 19,591 | 23,999 |
| Reckless, dangerous, or careless use or driving, of other vehicle | 115 | 149 | 157 | 135 | 153 |
| Breaches of regulations for the lighting of vehicles | 3,317 | 4,111 | 3,931 | 4,547 | 5,062 |
| Offences relating to the registration, etc., of motor vehicles | 6,044 | 6,450 | 7,321 | 7,868 | 9,860 |
| Offences relating to driver's licence | 5,079 | 6,050 | 6,113 | 7,742 | 9,678 |
| Breaches of parking regulations | 22,009 | 24,650 | 25,206 | 32,460 | 34,748 |
| Other traffic offences | 10,065 | 12,969 | 15,049 | 16,883 | 17,852 |
| Totals | 87,474 | 99,273 | 104,227 | 127,308 | 144,289 |
| Convictions per 1,000 of mean population | 36.04 | 39.90 | 41.00 | 49.00 | 54.50 |
Convictions for traffic offences increased greatly in 1965 being 16,981, or 13.3 percent higher than for 1964. Increases in convictions for the more serious offences (with the percentage in parentheses) were recorded as follows: negligent driving causing death, 26 (50.0); excessive speed in motor vehicle, 4,836 (13.4); negligent or dangerous driving of motor vehicle, 4,408 (22.5). It should be noted that the number of motor vehicles increased from 1,100,622 at 30 June 1964 to 1,180,964 at June 1965.
The previous table excludes the more serious cases involving death or injury, which are sent forward to the Supreme Court for trial or sentence. In 1965, 8 such cases were sent forward and there were 5 sentences, comprising 3 for careless, reckless, dangerous, or drunken driving causing death, and 2 for careless, reckless, dangerous, or drunken driving causing injury.
Of the 144,289 convictions for traffic offences, 9,091 persons had their drivers' licences cancelled for varying lengths of time. The periods of cancellation are given below, together with the figures for the three preceding years.
| Period for which Licence Cancelled | 1962 | 1963 | 1964 | 1965 |
|---|---|---|---|---|
| Under 3 months | 1,620 | 1,905 | 2,363 | 2,379 |
| 3 months and under 6 months | 972 | 1,305 | 1,834 | 2,505 |
| 6 months and under 1 year | 308 | 404 | 594 | 880 |
| 1 year and under 2 years | 1,223 | 1,320 | 1,734 | 2,000 |
| 2 years and under 3 years | 236 | 376 | 347 | 317 |
| 3 years and under 4 years | 669 | 767 | 755 | 850 |
| 4 years and under 5 years | 14 | 10 | 17 | 31 |
| 5 years and over | 80 | 81 | 79 | 129 |
| Total cancellations | 5,122 | 6,168 | 7,723 | 9,091 |
Drunkenness—The following table shows the number of convictions for drunkenness, together with the rate per 1,000 of mean population, for each of the latest five years.
| Year | Convictions for Drunkenness | Per 1,000 of Mean Population | ||||
|---|---|---|---|---|---|---|
| Males | Females | Total | Males | Females | Total | |
| 1961 | 4,381 | 113 | 4,494 | 3.59 | 0.09 | 1.85 |
| 1962 | 5,127 | 167 | 5,294 | 4.10 | 0.14 | 2.13 |
| 1963 | 4,955 | 163 | 5,118 | 3.88 | 0.13 | 2.04 |
| 1964 | 4,628 | 158 | 4,786 | 3.55 | 0.12 | 1.84 |
| 1965 | 4,392 | 176 | 4,568 | 3.30 | 0.13 | 1.73 |
Repeated (or duplicate) convictions against the same person are included in the statistics shown in the preceding table, but the figures do not include cases of application for prohibition orders of which there were 635 in 1965, compared with 654 in 1964. The rates of convictions have fallen in the latest year, with convictions of females following the same trend as convictions of males.
Supreme Court—Criminal cases in the Supreme Court are of two classes—those in which the accused person has pleaded guilty in the Lower Court and has been committed to the Supreme Court for sentence, and those actually tried in the Supreme Court.
The following table gives a summary of criminal cases dealt with in the Supreme Court during each of the latest five years. Frequently a series of charges is preferred against the one offender and this serves to explain the distinction between total cases and distinct persons.
| Year | Tried in Supreme Court | Sentences in Case of Committal for Sentence | Total Sentences | ||||||
|---|---|---|---|---|---|---|---|---|---|
| Indictments and Informations | Convictions | ||||||||
| M | F | M | F | M | F | M | F | Total | |
| (a) Total Cases | |||||||||
| 1961 | 901 | 75 | 394 | 25 | 113 | - | 507 | 25 | 532 |
| 1962 | 817 | 118 | 401 | 48 | 217 | 1 | 618 | 49 | 667 |
| 1963 | 1,030 | 47 | 532 | 17 | 219 | 7 | 751 | 24 | 775 |
| 1964 | 795 | 52 | 415 | 11 | 186 | 57 | 601 | 68 | 669 |
| 1965 | 1,052 | 117 | 522 | 52 | 277 | 3 | 799 | 55 | 854 |
| (b) Distinct Persons | |||||||||
| 1961 | 406 | 28 | 222 | 12 | 60 | - | 282 | 12 | 294 |
| 1962 | 368 | 19 | 201 | 13 | 50 | 1 | 251 | 14 | 265 |
| 1963 | 416 | 21 | 250 | 12 | 42 | 5 | 292 | 17 | 309 |
| 1964 | 349 | 31 | 194 | 11 | 35 | 2 | 229 | 13 | 242 |
| 1965 | 398 | 29 | 229 | 19 | 53 | 3 | 282 | 22 | 304 |
Of the 427 distinct persons indicted during 1965, 248 were convicted and 162 acquitted, and “no bill” was returned or the prosecution was not otherwise proceeded with in the remaining 17 cases.
The next table summarises the offences of persons convicted and sentenced in the Supreme Court during each of the latest five years.
| Year | Total Convictions and Sentences | Distinct Persons Convicted and Sentenced | ||||||||
|---|---|---|---|---|---|---|---|---|---|---|
| Offences Against the Person | Offences Against Property | Forgery and Offences Against the Currency | Other Offences | Total | Offences Against the Person | Offences Against Property | Forgery and Offences Against the Currency | Other Offences | Total | |
| 1961 | 209 | 282 | 13 | 28 | 532 | 161 | 119 | 5 | 9 | 294 |
| 1962 | 198 | 431 | 16 | 22 | 667 | 118 | 134 | - | 13 | 265 |
| 1963 | 226 | 431 | 58 | 60 | 775 | 149 | 125 | 2 | 33 | 309 |
| 1964 | 140 | 471 | 18 | 40 | 669 | 95 | 122 | 1 | 24 | 242 |
| 1965 | 196 | 578 | 11 | 69 | 854 | 124 | 132 | 2 | 46 | 304 |
The table which follows shows the number of distinct persons sentenced in the Supreme Court during each of the latest five years classified according to the principal types of offences.
| Type of Offence | 1961 | 1962 | 1963 | 1964 | 1965 |
|---|---|---|---|---|---|
| *Includes persons charged with murder but convicted of manslaughter. | |||||
| Murder | 2 | 4 | 3 | 4 | 2 |
| Attempted murder | 1 | - | 1 | - | - |
| Manslaughter* | 4 | 3 | 4 | 11 | 8 |
| Traffic offences involving death or injury | 21 | 20 | 20 | 3 | 5 |
| Assaults and wounding | 44 | 25 | 38 | 24 | 40 |
| Sexual offences | 80 | 59 | 71 | 50 | 54 |
| Other offences against the person | 9 | 7 | 12 | 3 | 15 |
| Robbery, burglary, and breaking and entering | 38 | 50 | 44 | 50 | 50 |
| Theft, receiving, and fraud | 68 | 75 | 69 | 58 | 64 |
| Other offences against property | 13 | 7 | 12 | 14 | 18 |
| Forgery and uttering | 5 | 2 | 2 | 1 | 2 |
| Other offences | 9 | 13 | 33 | 24 | 46 |
| Totals | 294 | 265 | 309 | 242 | 304 |
| Per 10,000 mean population | 1.21 | 1.06 | 1.22 | 0.93 | 1.15 |
Sentences imposed in the Supreme Court during each of the latest five years were as follows:
| Sentence | 1961 | 1962 | 1963 | 1964 | 1965 |
|---|---|---|---|---|---|
*Commuted to life imprisonment. †Abolished during 1963. | |||||
| Probation (under Criminal Justice Act) | 34 | 28 | 21 | 21 | 33 |
| Ordered to come up for sentence | 5 | 7 | 2 | 10 | 12 |
| Discharged | - | 1 | 3 | 2 | 1 |
| Fined | 29 | 39 | 57 | 28 | 56 |
| Imprisoned | 172 | 173 | 205 | 164 | 190 |
| Corrective training | 7 | - | 3 | † | † |
| Detention centre | - | 4 | 4 | 1 | 2 |
| Borstal training | 33 | 6 | 4 | 9 | 6 |
| Preventive detention | 13 | 7 | 10 | 7 | 4 |
| Death | 1* | - | - | - | - |
| Totals | 294 | 265 | 309 | 242 | 304 |
In 1941 the death sentence for murder was abolished. It was restored in 1950 by the Capital Punishment Act but was again abolished by the Crimes Act 1961. The only crime for which the death penalty may be imposed is treason. On conviction for murder a mandatory sentence of life imprisonment is imposed.
Flogging and whipping were also abolished in 1941 and have not been restored.
CRIMINAL APPEALS—The law relating to criminal appeals is contained in the Crimes Act 1961.
If it allows an appeal, the Court of Appeal may quash the conviction, vary the sentence, or order the case to be retried in the Supreme Court.
Applications filed in criminal cases and the results of the appeals are shown in the following table.
| Year | Application Filed | Sentence Varied | Appeal Dismissed or Disallowed |
|---|---|---|---|
| 1961 | 94 | 11 | 83 |
| 1962 | 97 | 12 | 85 |
| 1963 | 106 | 13 | 93 |
| 1964 | 78 | 13 | 65 |
| 1965 | 84 | 10 | 74 |
OFFENCES BY WOMEN—Of the 201,202 criminal charges dealt with in the Magistrates' Courts in 1965, 14,506, or 7.2 percent, were preferred against females. This figure showed an increase on the 1964 total which was 13,694.
Most of the offences for which summary convictions are entered against women are of a trivial nature, such as minor breaches of traffic regulations.
Convictions for more serious offences are set out in the following table.
| Offence | 1962 | 1963 | 1964 | 1965 |
|---|---|---|---|---|
| Common assault | 30 | 34 | 36 | 31 |
| Drunkenness | 149 | 144 | 142 | 155 |
| Burglary, breaking and entering, etc. | 66 | 63 | 43 | 111 |
| Theft | 584 | 740 | 882 | 847 |
| Fraud and false pretences | 98 | 238 | 311 | 321 |
| Offensive conduct or language | 62 | 110 | 133 | 112 |
| Vagrancy | 167 | 181 | 182 | 185 |
Women received into prison under sentence during 1965 numbered 191. The principal offences concerned were: cruelty to children, 7; burglary, breaking and entering, etc., 17; theft, 53; fraud and false pretences, 12; vagrancy, 46; failing to pay fine, 6; breach of probation, 16. The corresponding total in 1964 was 186, and the main offences were: cruelty to children, 3; burglary, breaking and entering, etc., 15; theft, 43; fraud and false pretences, 9; vagrancy, 55; failing to pay fine, 6; breach of probation, 10.
JUVENILE OFFENDERS—Children's Courts were established in New Zealand under the Child Welfare Act 1925. All offences, except murder or manslaughter on the one hand, and certain traffic offences on the other, committed by children under 17 years are dealt with in Children's Courts, the procedure and rules of which differ widely from those of the ordinary Courts. In addition, when an offender between 17 and 18 years comes before a regular Court, the Court may order his case to be heard in the Children's Court.
Unless no other suitable room is available, sittings of the Children's Court are not held in a courtroom and, where a Children's Court is in the same building as any other Court, it does not sit when that other Court is in session. Proceedings in Children's Courts are not open to the public, and no report of them may be published except with the consent of the presiding Magistrate.
When a child is brought before a Children's Court and charged with any offence, it is not necessary to record a conviction even if the charge is proved, and in practice convictions are not entered. The Court has power without recording a conviction to impose any penalty or make any order as if a conviction had been recorded.
The following table shows the number of cases dealt with in Children's Courts during each of the latest 11 years. It is shown in two ways; i.e., total charges (meaning each offence counted once irrespective of the number with which a person is charged at the one time); and distinct cases (meaning only one charge, the most serious, is counted, irrespective of the number a person is charged with at the time). All the Children's Court tables are shown in this way.
| Year | Total Charges | Distinct Cases | ||||
|---|---|---|---|---|---|---|
| Males | Females | Total | Males | Females | Total | |
| 1955 | 5,026 | 685 | 5,711 | 2,730 | 548 | 3,278 |
| 1956 | 5,420 | 593 | 6,013 | 2,949 | 495 | 3,444 |
| 1957 | 7,306 | 875 | 8,181 | 3,770 | 646 | 4,416 |
| 1958 | 8,084 | 1,089 | 9,173 | 4,358 | 745 | 5,103 |
| 1959 | 7,158 | 809 | 7,967 | 3,525 | 640 | 4,165 |
| 1960 | 9,297 | 1,068 | 10,365 | 4,803 | 806 | 5,609 |
| 1961 | 9,104 | 1,356 | 10,460 | 4,678 | 867 | 5,545 |
| 1962 | 8,092 | 1,330 | 9,422 | 3,713 | 897 | 4,610 |
| 1963 | 9,000 | 1,414 | 10,414 | 4,139 | 1,047 | 5,186 |
| 1964 | 9,099 | 1,665 | 10,764 | 4,547 | 1,195 | 5,742 |
| 1965 | 9,654 | 2,000 | 11,654 | 4,764 | 1,453 | 6,217 |
Detailed statistics for Children's Court cases during each of the latest five years are as follows.
| Type of Offence | 1961 | 1962 | 1963 | 1964 | 1965 |
|---|---|---|---|---|---|
*Includes forgery and uttering. NOTE—Distinct cases figures are included in those for total charges. | |||||
| Total Charges | |||||
| Sexual offences | 167 | 159 | 138 | 144 | 161 |
| Assaults | 114 | 96 | 112 | 111 | 138 |
| Other offences against the person | 11 | 13 | 14 | 17 | 22 |
| Robbery, burglary, and breaking and entering | 1,544 | 2,126 | 2,593 | 2,500 | 2,752 |
| Theft, receiving, and fraud | 3,262 | 3,309 | 3,192 | 3,333 | 3,447 |
| Unlawful conversion of vehicles | 1,164 | 910 | 1,217 | 1,041 | 1,316 |
| Wilful damage | 574 | 545 | 590 | 488 | 426 |
| Other offences against property* | 53 | 145 | 65 | 86 | 58 |
| Offences against good order | 2,357 | 829 | 940 | 1,116 | 872 |
| Indigent or delinquent child | 908 | 1,027 | 1,181 | 1,556 | 1,722 |
| Other offences | 306 | 263 | 372 | 372 | 740 |
| Totals | 10,460 | 9,422 | 10,414 | 10,764 | 11,654 |
| Distinct Cases | |||||
| Sexual offences | 109 | 106 | 106 | 117 | 122 |
| Assaults | 90 | 80 | 89 | 96 | 115 |
| Other offences against the person | 11 | 12 | 13 | 17 | 21 |
| Robbery, burglary, and breaking and entering | 743 | 928 | 1,021 | 1,090 | 1,142 |
| Theft, receiving, and fraud | 1,500 | 1,387 | 1,428 | 1,442 | 1,521 |
| Unlawful conversion of vehicles | 351 | 276 | 359 | 378 | 414 |
| Wilful damage | 227 | 229 | 257 | 228 | 219 |
| Other offences against property* | 15 | 39 | 22 | 23 | 23 |
| Offences against good order | 1,555 | 526 | 618 | 743 | 599 |
| Indigent or delinquent child | 765 | 882 | 1,067 | 1,387 | 1,554 |
| Other offences | 179 | 145 | 206 | 221 | 487 |
| Totals | 5,545 | 4,610 | 5,186 | 5,742 | 6,217 |
The cases heard during 1965 resulted as follows:
| Total Charges | Distinct Cases | |
|---|---|---|
| Dismissed or withdrawn | 629 | 377 |
| Admonished and discharged | 1,673 | 1,027 |
| Committed to care of Child Welfare Division of the Department of Education | 1,871 | 906 |
| Placed under supervision | 4,471 | 2,313 |
| Committed to an institution | 704 | 188 |
| Fined | 1,336 | 979 |
| Otherwise dealt with | 970 | 427 |
| Total cases | 11,654 | 6,217 |
PENAL SYSTEM—The penal system exists to protect the community against those who would break the laws which are laid down so that citizens may live harmoniously together and the common good be promoted. This purpose is achieved principally through the processes of deterrence and reformation; in modern times in New Zealand as in other countries an increasing emphasis is being placed on the reformation and rehabilitation of the offender.
The paramount policy is to ensure first that those who by reason of the nature of their offences or the character of their offending are a serious danger to society are removed from the community. Subject to that the goal is to deal with offenders within the community wherever possible—that is, to impose sanctions that do not involve imprisonment. Where prison or other forms of detention are necessary the aim is to do as much as possible during the sentence to rehabilitate the offender and to bridge the gap between institution and free society. The interest of the community as well as of the offender is promoted by his reformation since the reformed offender does not again break the laws.
Treatment of Offenders Within the Community—The principal penalties available to the Courts in dealing with offenders outside a prison are fines, probation, and periodic detention.
Fines—Fines are by far the most common sentence imposed by the Courts in New Zealand, even if traffic offences are not taken into account. For very minor offences the imposition of a fine is the only sanction available to the Courts, but even where there is power to sentence the offender to a term of imprisonment the Courts often content themselves with fining him. In the Supreme Court also, which deals with more serious offences, there has been a trend in recent years to make greater use of fines as a punishment.
Probation—The legislation on probation is contained in Part I of the Criminal Justice Act 1954. The Court may release on probation any offender guilty of an offence punishable by imprisonment either on indictment or summarily. Probation is a conditional suspension of imprisonment and provides the opportunity for an offender to rehabilitate himself in the community. An offender may be released on probation for a period of not less than one year or more than three years and during this time he must accept the supervision of a probation officer and observe conditions imposed regarding employment and residence, associates, and general behaviour. These conditions are automatic, but the Courts have power to impose further conditions at their discretion on granting probation. This power makes probation a very flexible type of treatment and is coming to be more freely and imaginatively used. Where the offence consists of the destruction or damage of property, restitution of the whole or part of the loss is commonly required as a condition of probation. Some Courts have in suitable cases made it a condition of probation that the offender do particular work of value to the community in his spare time.
The probation method is widely used. The following figures show the numbers of persons placed on probation during each of the latest 11 years.
| Year | Number Admitted to Probation |
|---|---|
| 1955 | 1,429 |
| 1956 | 1,692 |
| 1957 | 1,749 |
| 1958 | 1,870 |
| 1959 | 1,804 |
| 1960 | 1,979 |
| 1961 | 1,944 |
| 1962 | 1,978 |
| 1963 | 2,162 |
| 1964 | 2,024 |
| 1965 | 2,456 |
The next table gives the number of offenders in each age group placed on probation during 1965, together with the period of their probation.
| Age in Years | Period of Probation | Total | ||||||||||
|---|---|---|---|---|---|---|---|---|---|---|---|---|
| 1 Year | 15 Months | 18 Months | 2 Years | 3 Years | ||||||||
| M. | F. | M. | F. | M. | F. | M. | F. | M. | F. | M. | F. | |
| Under 20 | 439 | 87 | 2 | - | 284 | 58 | 443 | 54 | 101 | 16 | 1,269 | 215 |
| 20-24 | 164 | 31 | 1 | - | 99 | 22 | 144 | 13 | 40 | 6 | 448 | 72 |
| 25-29 | 49 | 9 | 2 | - | 33 | 4 | 48 | 9 | 19 | 3 | 151 | 25 |
| 30-39 | 63 | 9 | 1 | - | 20 | 7 | 61 | 9 | 13 | 1 | 158 | 26 |
| 40-49 | 22 | 3 | - | - | 7 | 3 | 22 | 2 | 4 | - | 55 | 8 |
| 50-59 | 9 | 1 | - | - | 2 | - | 6 | 1 | 2 | - | 19 | 2 |
| 60-69 | 1 | 1 | - | - | - | - | 4 | - | 1 | - | 6 | 1 |
| 70 and over | - | - | - | - | - | - | 1 | - | - | - | 1 | - |
| Totals | 747 | 141 | 6 | - | 445 | 94 | 729 | 88 | 180 | 26 | 2,107 | 349 |
Periodic Detention—The Criminal Justice Amendment Act 1962 made provision for sentences of periodic detention. This sentence is at present available only to Courts in Auckland, Christchurch, Wellington, the Hutt Valley, and Invercargill. Any person between the ages of 15 and 21 years who is convicted of an offence punishable by imprisonment or who wilfully refuses to pay a fine may be sentenced to periodic detention for any term up to 12 months. Under the sentence he is required to attend at a work centre on a certain number of occasions each week and while in custody must attend classes or groups, undergo physical training, or perform work either in the centre or outside it. Work outside an institution may be at a hospital or school, at the home of an elderly or infirm person, or on Crown or local authority property. Work centres provide sleeping accommodation as well as other facilities, and in practice offenders sentenced to periodic detention are usually required to attend during the whole of a weekend.
Other Powers of the Court—Although not sentences in the strict sense various other means are available to the Courts in dealing with offenders whose offences are not serious. They include conviction and discharge, the effect of which is that the offender has a conviction recorded against him but no sanction is imposed, and conviction coupled with an order that the offender come up for sentence if called upon within a specified period. This is a suspension of punishment conditional upon good behaviour but is not subject to the positive conditions of a probation order.
Finally the Court, although it may find an offender guilty, may discharge him without conviction if it considers the offence to be of a trivial or technical character.
Detention in Penal Institution—The sentences of detention which the Courts may now impose are as follows—
(a) Borstal training, which means detention in a borstal institution for an indefinite period not exceeding two years. The offender must be at least 17 years (in special cases 15) but under 21 years. The time of his release is decided by the Borstal Parole Board, which must consider his case from time to time. After his release he is on probation for 12 months.
(b) Detention in a detention centre, the term fixed by statute being three months. The offender must be at least 16 but under 21 years of age, and he may earn up to one month's remission of his sentence by good conduct. After his release the offender is on probation for 12 months.
(c) Imprisonment for a stated number of years or for life. An offender sentenced to imprisonment for a fixed term may earn remission of up to one-quarter of his sentence.
(d) Preventive detention, which means detention in prison for an indefinite term to be decided by the Prisons Parole Board, but in any event not less than three years nor, except where the offender has qualified for preventive detention through certain sexual offences, more than 14 years. The offender must be 25 years of age or over and must have qualified for preventive detention by the number of his previous convictions and the type of his previous sentences. After serving three years of his sentence the offender may be released on probation on the recommendation of the Parole Board, provided the Board is of opinion that he is not likely to resume his criminal career. The period of probation in each case extends until the expiry of the full 14 years or for life, as the case may be.
Classification—The key to successful prison work lies in understanding the individual prisoner, and in order to assist the prisons administration to this end classification boards operate in the three main reception centres, Auckland Prison, Wellington Prison, and Christchurch Prison, and in Wi Tako Prison, an institution for those in prison for the first time.
Every man sentenced to imprisonment for a term of six months or more (or in some cases for shorter terms) comes before the classification board which can call upon a psychologist, psychiatrist, vocational guidance officer, probation officer, or any other form of specialist service to assist in defining the offender's character and potential and advise upon the most hopeful form of treatment while he is in prison.
In New Zealand the total number of prisoners is not high. There is therefore little opportunity for special categories of prisons. The task of the classification boards is to advise on the question of allocation of prisoners. Boards have no executive powers, but they furnish to the prisons administration a report on each prisoner whom they see, and their recommendations are as far as possible carried out.
Measures Employed in Treatment—This section may conveniently be dealt with under the heads of vocational and non-vocational training, group therapy, earnings, and punishment.
Vocational Training—Every prisoner must assist by his labour to reduce the cost of his maintenance in custody; it is also necessary that he should develop the habit of hard and consistent work. In New Zealand all available prisoners are put to work on some form of constructive employment, whether it be industrial production in a secure institution or food production on a prison farm. In addition, and particularly for the younger offender, there are courses of trade training.
Non-vocational Training—If a prisoner is eventually to be released into the community, then it is important during his period of imprisonment to pay regard to every aspect of his life as a citizen. It is not enough merely to restrict his freedom and to train him to work; he must also be kept or made mentally and morally fit.
An increasing number and variety of evening activities are being introduced into the prisons, and the number of prisoners engaged on them is likewise increasing. Very real training benefit is derived from these activities, whether they be recreational, education, cultural, individual, or collective.
There are full-time teachers in Auckland Prison, Christchurch Prison, Waikeria and Waipiata Youth Centres, Arohata and Invercargill Borstal Institutions, and part-time teachers in many other institutions. It is their task to seek to improve the general education of those prisoners who have been unable to reach the level of Form II, and also to assist those who are undertaking further education or technical courses through a Correspondence School. The interest shown in education is encouraging, since in many cases it fits a prisoner for better employment on his release and thereby helps to reduce the chances of his further offending.
All institutions receive at regular intervals a generous supply of well chosen books from the National Library Service and, in addition, inmates are permitted a free use of the library's request service.
Group Therapy—Group discussions are part of the programme of every institution. These groups of about seven or eight inmates meet regularly with an officer under informal conditions to discuss their problems and attitudes.
The leadership of a group is not confined solely to professional psychologists. Most are led by selected custodial officers who undergo a brief training course beforehand and receive subsequent help and guidance from professional staff.
The primary aim of group discussion is to help inmates to come to a closer understanding of themselves and their problems. At the same time the groups also encourage inmates to form constructive relationships with officers.
Earnings—All prisoners are credited with earnings based on a system of marks assessed according to diligence and conduct. A portion of the earnings may be spent on tobacco, confectionery, and toilet necessities in a prison canteen, and this provides an incentive to good work and conduct. At the same time the loss of this privilege is a useful disciplinary measure.
Punishments—An inmate charged with one of the less serious offences against discipline appears before the Superintendent, who may impose a penalty or in his discretion refer the case to a Visiting Justice or to the Court. A Visiting Justice may deal with all cases of offences against discipline and must deal with those which are outside the jurisdiction of the Superintendent, unless he thinks they should be brought before the Court. His powers of punishment are wider than those of a Superintendent. The provisions as to offences and punishments are the same for both prisons and borstals.
Pre-release Hostels—The setting up in 1961 of the first pre-release hostel at Invercargill for male borstal inmates was an important step forward toward the goal of bridging the gap between the wholly controlled life of the penal institution and the responsibilities and temptations of free society. Further pre-release hostels have been established for male borstal inmates at Auckland, Hamilton, and Wellington, one in Christchurch for adult male inmates, and one in Wellington for female inmates. Selected inmates are sent to these hostels during the last part of their sentence. They live at these hostels and spend their leisure time there under supervision white working in the community.
Release to Work—Under the Penal Institutions Amendment Act 1961, inmates may be released during the day to engage in private employment. The selection of inmates for this privilege is made on the recommendation of the Superintendent of a penal institution, by a special committee chaired by a Magistrate. The inmates are required to contribute part of their wages towards the cost of their maintenance in the institution and part may also be withheld in satisfaction of outstanding fines or debts and the balance is made available to their dependants or is held by the Department of Justice for payment upon final release.
Post-release Care—Offenders serving a sentence of borstal training, preventive detention, or imprisonment for 12 months or more are released on probation. For a period of time they must be under the supervision of a Probation Officer and, during any part of that period falling within the maximum period they could have been detained in an institution, are subject to recall if their behaviour on release is not satisfactory. Offenders sentenced to detention in a detention centre are also subject to probationary supervision for 12 months following release. The period of supervision has a dual purpose—it is the protection of the community against further offending and it is at the same time an aid to the prisoner to re-establish himself. The step from custody to freedom is a difficult one for prisoners, many of whom require assistance, advice, and discipline during this period.
An offender serving a sentence of imprisonment of less than 12 months is on probation after release if the sentencing Court so orders.
Parole System—The introduction of types of sentences designed to encourage the rehabilitation of an offender or to protect society against the hardened criminal, rather than merely to inflict punishment for an offence which has been committed, has created the need for a procedure to enable a person serving one of these sentences to be released as soon as he shows that he is fit to be returned to society.
This need is filled by the parole boards which have the responsibility of reviewing the cases of all persons sentenced to borstal training, preventive detention, or life imprisonment, and of recommending, or in the case of borstal trainees directing, release on probation at the appropriate time.
There are at present five parole boards: the Prisons Parole Board, which deals with all offenders except those sentenced to borstal training, and four Borstal Parole Boards which between them have jurisdiction over all borstal trainees. Persons serving sentences of imprisonment other than life imprisonment or preventive detention and who are not habitual criminals do not normally have their cases considered by a board but any particular case may be referred to the Prisons Parole Board in special circumstances.
Until 1961 there was only one board, called the Prisons Board in 1910 when is was established, and known as the Parole Board after 1954, when the Criminal Justice Act amended its jurisdiction to conform with the changes then made in the penal law. The provision for separate boards for the review of borstal cases was made by the Criminal Justice Amendment Act 1961.
The Prisons Parole Board consists of a Judge of the Supreme Court as Chairman, the Secretary for Justice, and at least one but not more than five other members, all except the Secretary for Justice being appointed by the Governor-General for three years and being eligible for reappointment.
Each Borstal Parole Board consists of a Magistrate as Chairman, the Secretary for Justice, the superintendent of the local borstal institution in respect of which the board is appointed, and two residents of the locality in which the institution is situated. All the members except the Secretary for Justice and the superintendent are appointed by the Governor-General for three years and are eligible for reappointment.
Categories of persons whose cases were considered by the Prisons Parole Board and the Borstal Parole Boards during each of the latest five years were as follows:
| Year | Borstal Detention* | Corrective Training | Imprisonment or Hard Labour | Habitual Criminals or Preventive Detention | Persons on Parole | Total |
|---|---|---|---|---|---|---|
*Under jurisdiction of the Borstal Parole Boards from November 1961. †Abolished during 1963. | ||||||
| 1961 | 1,022 | 161 | 32 | 80 | 10 | 1,305 |
| 1962 | 1,418 | 115 | 28 | 83 | 12 | 1,656 |
| 1963 | 1,436 | 106 | 20 | 60 | 16 | 1,638 |
| 1964 | 1,237 | 21† | 34 | 91 | 10 | 1,393 |
| 1965 | 1,285 | 3† | 14 | 87 | 14 | 1,403 |
Of the cases coming before the Boards in 1965, there were 460 recommendations made for release on probation and one person on parole was favourably recommended for discharge.
COMPENSATION FOR VICTIMS OF CRIME—The Criminal Injuries Compensation Act 1963 introduced the first statutory scheme in the world for compensation by the State to persons injured by crimes of violence and to the dependants of persons killed by such acts. The scheme is administered by the Crimes Compensation Tribunal, consisting of a Judge, or a person qualified to hold judicial office, as chairman and two other members. Compensation may be awarded in respect of any one or more of the following matters.
(a) Expenses actually and reasonably incurred as a result of the victim's injury or death.
(b) Pecuniary loss of the victim as a result of total or partial incapacity for work.
(c) Pecuniary loss to dependants as a result of the victim's death.
(d) Other pecuniary loss resulting from the victim's injury and any expenses which in the opinion of the Tribunal it is reasonable to incur.
(e) Pain and suffering of the victim.
The maximum amounts that may be paid in respect of (b) and (c) are the same as those payable under the Workers' Compensation Act. The maximum amount for other pecuniary loss and for expenses is $2,000 and the maximum for pain and suffering is $1,000.
In considering any application for compensation the Tribunal may take into account any behaviour by the victim which may have contributed to his injury. It is not the policy of the Act to permit double compensation, and the Tribunal is therefore directed to deduct any amount that may be received by the victim or his dependants in consequence of the injury, for example, social security benefits or worker's compensation. However, the proceeds of any accident insurance policy need not be taken into account.
The Act makes provision for recovery from the offender, where appropriate, of any compensation paid to his victim under the scheme. The Secretary for Justice has a discretion to apply to the Tribunal for an order requiring the offender to pay to the State the whole or any part of the compensation awarded to the victim or his dependants.
The following table shows the trend of operations under the Act.
| Action | 1964 | 1965 |
|---|---|---|
| Applications filed | 9 | 23 |
| Cases in which an award made | 3 | 18 |
| Amount of Awards | $850 | $4,444 |
STATISTICS OF PRISONERS—There are 14 institutions serving as prisons or borstals in New Zealand, and 9 police jails. Any person serving a sentence of not more than eight days may be detained at any police station, which is deemed to be a prison for that period. The prison population during the year 1965 is shown in the following table.
| Males | Females | Total | |
|---|---|---|---|
| Persons in prison at January 1965 | 1,663 | 94 | 1,757 |
| Receptions during the year (including multiple receptions of the same person, but excluding transfers) | 6,355 | 487 | 6,842 |
| Discharges during the year (including multiple discharges of the same person, but excluding transfers) | 6,414 | 483 | 6,897 |
| Persons in prison at 31 December 1965 | 1,604 | 98 | 1,702 |
| Daily average number of prisoners | 1,782 | 97 | 1,879 |
Not all prisoners received were actually persons undergoing sentence on conviction for criminal offences. In 1965, 192 debtors were released after being detained or imprisoned for non-payment of debt following a Court order, 35 were classed as mental defectives and transferred to mental hospitals, while 2,622 persons were not returned to prison after release for hearing of the charge, being acquitted, fined, placed on probation, etc.
The following table analyses the ages and offences of distinct persons received into prison under sentence during 1965.
| Age, in Years | Offences Against the Person | Burglary, Theft, and Fraud | Conversion, Wilful Damage, etc. | Vagrancy and Drunkenness | Other Offences | Total | ||
|---|---|---|---|---|---|---|---|---|
| Sexual Offences | Assaults | Other | ||||||
| Under 21 | 32 | 91 | 14 | 521 | 146 | 38 | 277 | 1,119 |
| 21-24 | 30 | 71 | 11 | 265 | 61 | 59 | 225 | 722 |
| 25-29 | 20 | 47 | 12 | 169 | 26 | 34 | 151 | 459 |
| 30-39 | 50 | 47 | 12 | 158 | 26 | 67 | 224 | 584 |
| 40-49 | 26 | 23 | 6 | 90 | 14 | 71 | 155 | 385 |
| 50-59 | 13 | 6 | 5 | 31 | 1 | 59 | 79 | 194 |
| 60 and over | 10 | - | 2 | 10 | - | 13 | 22 | 57 |
| Totals | 181 | 285 | 62 | 1,244 | 274 | 341 | 1,133 | 3,520 |
| Maoris (included above) | 40 | 121 | 21 | 371 | 109 | 81 | 273 | 1,016 |
The next table gives particulars of ages and length of sentence of distinct persons received into prison under sentence during 1965.
| Age, in Years | Length of Sentence | |||||||
|---|---|---|---|---|---|---|---|---|
| Under 1 Month | 1 Month and Under 3 Months | 3 Months and Under 12 Months | 1 Year and Under 3 Years | 3 Years and Under 5 Years | Over 5 Years | Other | Total | |
| *Sentenced to life imprisonment. | ||||||||
| Under 21 | 77 | 174 | 370 | 488 | 8 | 2 | - | 1,119 |
| 21-24 | 120 | 226 | 240 | 123 | 10 | 3 | - | 722 |
| 25-29 | 79 | 128 | 171 | 63 | 17 | 1 | - | 459 |
| 30-39 | 136 | 141 | 214 | 71 | 16 | 5 | 1 | 584 |
| 40-49 | 97 | 104 | 137 | 36 | 7 | 4 | - | 385 |
| 50-59 | 50 | 61 | 60 | 14 | 6 | 2 | 1 | 194 |
| 60 and over | 15 | 14 | 17 | 8 | 3 | - | - | 57 |
| Totals | 574 | 848 | 1,209 | 803 | 67 | 17 | 2* | 3,520 |
The special types of detention (or imprisonment) imposed during 1965 were included in the previous table. The categories in which they were included, together with the maximum or minimum age for each type of sentence and with the number sentenced in parentheses, are as follows: detention centre—three and under 12 months, under 21 years of age (251); borstal training—one and under three years, under 21 years of age (435); preventive detention—over five years, over 25 years of age (3). The ages and number of these prisoners are: under 21, 686; 30-39, 1; 40-49, 1; 50-59, 1; total, 689.
Of the total of distinct persons received into prison in 1965 no less than 76 percent had been convicted for an offence on at least one previous occasion, and 37.6 percent of these had been convicted more than six times.
The number of prisoners received to serve sentence imposed during the year 1965 for criminal offences was 4,012, but deducting multiple receptions of the same prisoner, the number of distinct persons was 3,520 (3,329 males and 191 females). The corresponding figures for 1964 were 4,214 of which 3,665 were distinct persons (3,479 males and 186 females).
An analysis is given below of distinct persons received into prison according to nature of sentence imposed for the four latest years.
| Nature of Sentence | 1962 | 1963 | 1964 | 1965 |
|---|---|---|---|---|
| Imprisonment | 2,974 | 2,822 | 3,005 | 2,831 |
| Corrective training | 34 | 9 | - | - |
| Detention centre | 170 | 207 | 205 | 251 |
| Borstal training | 375 | 443 | 449 | 435 |
| Preventive detention | 6 | 8 | 6 | 3 |
| Totals | 3,559 | 3,489 | 3,665 | 3,520 |
The next table shows the number of persons in prison at 31 December in each of the latest 11 years.
| At 31 December | Persons in Jail | Proportion per 10,000 of Population as at 31 December | |||
|---|---|---|---|---|---|
| Undergoing Sentence | On Remand and Awaiting Trial, etc. | Total | Undergoing Sentence | Total in Prison | |
| 1955 | 1,117 | 37 | 1,154 | 5.16 | 5.33 |
| 1956 | 1,362 | 41 | 1,403 | 6.17 | 6.35 |
| 1957 | 1,469 | 44 | 1,513 | 6.49 | 6.69 |
| 1958 | 1,636 | 59 | 1,695 | 7.06 | 7.32 |
| 1959 | 1,702 | 44 | 1,746 | 7.29 | 7.48 |
| 1960 | 1,770 | 58 | 1,828 | 7.45 | 7.69 |
| 1961 | 1,810 | 56 | 1,866 | 7.46 | 7.69 |
| 1962 | 1,704 | 56 | 1,760 | 6.85 | 7.07 |
| 1963 | 1,744 | 60 | 1,804 | 6.86 | 7.09 |
| 1964 | 1,685 | 72 | 1,757 | 6.49 | 6.76 |
| 1965 | 1,652 | 50 | 1,702 | 6.24 | 6.43 |
Statistics of distinct persons received into prison under sentence of imprisonment during the latest 11 years, with the rates per 10,000 of mean population, are given in the next table.
| Year | Number | Per 10,000 of Mean Population |
|---|---|---|
| 1955 | 2,531 | 11.83 |
| 1956 | 2,886 | 13.22 |
| 1957 | 3,037 | 13.60 |
| 1958 | 3,056 | 13.37 |
| 1959 | 2,955 | 12.83 |
| 1960 | 3,057 | 12.86 |
| 1961 | 3,209 | 13.22 |
| 1962 | 3,559 | 14.30 |
| 1963 | 3,489 | 13.72 |
| 1964 | 3,665 | 14.11 |
| 1965 | 3,520 | 13.30 |
POLICE—The Police in New Zealand are maintained wholly by the Central Government. The law relating to the establishment and regulation of the police is contained in the Police Act 1958.
Organisation and Duties—A Commissioner with headquarters at Wellington, subject to the directions of the Minister in Charge of Police, has the general direction and control of the Police. His senior assistants at the national headquarters are his deputy who holds the rank of Assistant Commissioner, the national head of the Criminal Investigation Branch, and the Secretary for Police. The latter officer is a member of the public service seconded to the Police.
For operational purposes the country is divided into 16 police districts, each under the control of an Assistant Commissioner (in the case of Auckland), a Chief Superintendent, Superintendent or Chief Inspector. The Auckland District, which includes the largest metropolitan centre in New Zealand, is again divided into five divisions each under the control of a Superintendent or Chief Inspector.
Districts and divisions are divided into sub-districts under the charge of Chief Inspectors, Inspectors, senior sergeants, sergeants or constables, and cities and the larger towns, where regular beat duty is performed, are divided into beats, patrolled by constables under the supervision of sergeants, and supplemented by mobile patrols.
In addition to the enforcement of the criminal law and the Police Offences and Official Secrets Acts, there are various statutes of a regulatory nature which the members of the Police are called upon to administer, wholly or partly, such as the Arms Act, Sale of Liquor Act, Gaming Act, Dangerous Drugs Act, Transport Act, Pawnbrokers' Act, Secondhand Dealers' Act. They also undertake certain inquiries and other duties on behalf of other Departments of the Government Service.
Police in country districts in some cases hold such additional appointments as Registrars and Bailiffs at Magistrates' Courts, Probation Officers, and Honorary Fishery Officers.
Recruiting—Male recruits for the Police, for entry as constables, must be between the ages of 19 and 35 years. Cadets must be between the ages of 17 years and 18 years 3 months. Male recruits and cadets must have a height of not less than 5 ft 8 1/2 in. The term of cadetship at the Police Training School is 19 months and on successful completion of the course and on attaining the age of 19 years, cadets are appointed constables; if they complete the course before reaching 19 years they are given further training at police stations until they reach the required age.
Female recruits, who enter as constables, must be between the ages of 20 and 33 years with a height of not less than 5 ft 5 in.
All candidates for entry into the Police must pass a departmental education pre-entry test and also a medical test. They must be of British nationality, of good character, smart, active, and intelligent. Selection is made only after exhaustive inquiries into the character, antecedents, and qualifications of the applicants. On appointment, male and female constable recruits undergo a three months' course of training at the Police Training School, Trentham, where they receive training in their powers and responsibilities as police officers, fitting them to deal with the situations which may be faced on duty.
Examinations are required to be passed for promotion to sergeant and senior sergeant and to commissioned rank. Promotion through the ranks of those qualified by examination is governed principally by merit, seniority being a deciding factor only when equality in merit exists.
Members who show an aptitude for detective duty are detailed for service in the Criminal Investigation Branch. Detectives are attached to each of the 16 district headquarters and to some of the larger outlying police stations, and they undertake duty, as required, in the investigation and detection of serious crime throughout the country.
Strength—The effective strength of the Police at 31 March 1966, inclusive of 61 women police, was 2,749 (2,417 Uniform Branch, 332 Criminal Investigation Branch). Details of the effective strength were Commissioner, two Assistant Commissioners, nine Chief Superintendents. 22 Superintendents, 18 Chief Inspectors, 39 Inspectors, 121 senior sergeants, 7 temporary senior sergeants, 393 sergeants, 11 temporary sergeants, 2,126 constables, and 61 women police. In addition to the above, there were also 114 police cadets, 11 matrons, one district constable, and 164 public servants.
Women Police—At 31 March 1966 the women police consisted of one senior sergeant, one sergeant, and 59 constables, and these were stationed at Auckland, Hamilton, Napier, New Plymouth, Wanganui, Palmerston North, Wellington, Nelson, Christchurch, Timaru, Dunedin, and Invercargill.
Women police receive the same pay as the men, they are called upon to perform similar duties and they are required to compete with the men for promotion.
DEFENCE POLICY—The principles which successive Governments have over the years accepted as providing the framework for the formation of defence policy, as well as the responsibilities and obligations which have been accepted in conformity with those principles, and the forces and equipment required to discharge them, are described in a series of White Papers on defence policy. The most recent of these have been published as parliamentary papers A. 19 in 1961 and A. 8 in 1966.
CONTROL AND CO-ORDINATION OF DEFENCE—In November 1962 the Government announced its intention to establish a Department of Defence as a small separate co-ordinating department to advise the Minister on defence policy, planning, and expenditure. Further examination of the requirements for a higher defence organisation led to a subsequent decision that a unified Department of Defence should be established to provide the greatest possible degree of central control and co-ordination, while at the same time making provision for the three Armed Services to retain their separate identities within the Department. The Government therefore announced in October 1963 its intention to establish a unitary Ministry of Defence combining not only all joint service functions but also the departments of Army, Navy, and Air, and this was carried out with administrative effect from 1 January 1964.
Formal legislative provision for the establishment of the unified Ministry of Defence is contained in the Defence Act 1964. The Ministry consists of the New Zealand Naval Forces, the New Zealand Army, the Royal New Zealand Air Force, public servants appointed under the State Services Act 1962, and certain other civilians. The former Army, Navy, and Air Departments have been abolished. The Ministry is responsible, under the Minister of Defence, for the whole field of national defence. The Governor-General remains Commander-in-Chief of New Zealand.
The Defence Act provides for the appointment of a Secretary of Defence as permanent head of the Ministry and as the principal civilian adviser to the Minister. The Secretary is responsible for co-ordinating the business of the Ministry as a whole and for the co-ordination of long-term financial planning and defence expenditure. He is not responsible for the command and efficient and economic administration of the Services but has the power to investigate and report to the Minister in matters of such administration. The former appointments of Navy Secretary, Army Secretary, and Air Secretary have been replaced by Deputy Secretaries of Defence.
The Act also provides for the appointment of a Chief of the Defence Staff as the principal military adviser to the Minister. The Chief of the Defence Staff is convenor and chairman of the Chiefs of Staff Committee and conveys its advice to the Minister. Like the Secretary of Defence, he may carry out inspections of the Services and report to the Minister.
The major corporate body within the Ministry of Defence is the Defence Council which consists of the Minister as chairman, the Secretary of Defence and the Chief of the Defence Staff as deputy chairman, and the Chiefs of Staff of the three Services. In addition, the Defence Council may from time to time co-opt officers of other departments of State. Subject to the over-riding control of the Minister of Defence, the Defence Council is responsible for the administration and command of the Defence Forces. Without limiting the duties of the Secretary of Defence or the Chief of the Defence Staff, the Council is responsible for advising the Minister on important matters of defence policy. It is also specifically required constantly to examine the possibilities of integrating common functions in the Services.
The independent Naval Board, Army Board, and Air Board established under the Navy Act 1954, the New Zealand Army Act 1950, and the Royal New Zealand Air Force Act 1950 have been abolished, and in their place Naval, Army, and Air Boards of the Defence Council have been constituted as subordinate bodies of the Defence Council. These Boards carry out such functions in respect of their respective Services as are delegated to them by the Defence Council.
All existing joint committees remain in existence, but the Defence Council has power to reconstitute or abolish them or establish new committees and prescribe their functions.
The central core of the Ministry of Defence is provided by the Defence Office. Under the Secretary of Defence and the Chief of the Defence Staff this is responsible for policy, finance, and general administration, and for the joint military machinery.
Co-operation With Other Countries—To facilitate exchanges on military matters New Zealand Defence Liaison Staffs are maintained in London, Canberra, Washington, Kuala Lumpur, and Singapore. In addition the Head and Deputy Heads of the New Zealand Defence Staff, Washington, are accredited to the Canadian Service authorities as advisers to the New Zealand High Commissioner in Ottawa. New Zealand officers are also employed in the SEATO Military Planning Office, Bangkok. The United Kingdom and Australia have Service representatives attached to their respective High Commissions in Wellington and there are Service attaches on the staff of the United States Embassy in Wellington. Several other countries have Service attaches accredited to, but not resident in, New Zealand.
Defence Science—A Defence Research Organisation was established in 1948 to co-ordinate defence research in New Zealand and to assist the Services with specific scientific problems. The organisation was administered by the Department of Scientific and Industrial Research till 1 April 1965, when administration was transferred to the Ministry of Defence. The activities of the organisation are guided by the Defence Science Policy Committee, comprising defence and scientific representatives.
Machinery for Commonwealth co-operation in defence science is provided by the Commonwealth Defence Science Organisation based in London, with an executive committee consisting of the chief defence scientists of Commonwealth countries. In addition, a Commonwealth Defence Science Committee, on which New Zealand is represented, meets from time to time in London.
LEGISLATIVE AUTHORITY FOR THE ARMED SERVICES—The principal statutes governing the armed services are as follows: The Defence Act 1964; the New Zealand Army Act 1950 and its amendments; the Military Manoeuvres Act 1915; the Navy Act 1954 and its amendments; the Naval Discipline Act (U.K.); the Naval and Victualling Stores Act 1908; and the Royal New Zealand Air Force Act 1950 and its amendments.
Two other Acts of general application, are the National Military Service Act 1961 and the Courts-Martial Appeals Act 1953. The latter provides for the establishment of a special Court of Appeal for the Navy, Army, and Air Force, to which persons convicted by a court martial may appeal against conviction.
National Military Service Act 1961—This Act, as amended in 1964, provides that every male British subject ordinarily resident in New Zealand (normally one who has lived in New Zealand for a continuous period of not less than a year) becomes liable to serve in the Army upon reaching 20 years of age and must then register. Selection of those who will be called upon to serve is made by ballot based on birth dates in a given period. Those selected may then be required to serve in the Army for (a) a period of whole-time service in camp not exceeding 14 weeks; (b) three years' part-time service during which training may be required for a total of 60 days; (c) three years in the Reserve. The current annual intake is 3,000 out of an estimated total number of some 15,000 persons fit and eligible for service. Provision is made in the Act for persons to apply for postponement of liability for service on grounds of hardship or for registration as conscientious objectors.
STRENGTH OF DEFENCE SERVICES—The following table gives the strengths of the regular forces of the three services together with any emergency force over the latest 11 years.
| As at 31 March | Navy | Army | Air Force | Total |
|---|---|---|---|---|
| 1956 | 2,832 | 4,380 | 4,701 | 11,913 |
| 1957 | 2,926 | 2,907 | 4,790 | 11,623 |
| 1958 | 2,998 | 4,400 | 4,769 | 12,167 |
| 1959 | 3,007 | 4,230 | 4,547 | 11,784 |
| 1960 | 2,919 | 5,342 | 4,510 | 12,771 |
| 1961 | 2,853 | 4,905 | 4,390 | 12,148 |
| 1962 | 2,848 | 5,434 | 4,505 | 12,787 |
| 1963 | 2,877 | 5,049 | 4,058 | 11,984 |
| 1964 | 3,035 | 5,559 | 4,338 | 12,932 |
| 1965 | 2,976 | 5,374 | 4,390 | 12,740 |
| 1966 | 2,922 | 5,549 | 4,381 | 12,852 |
THE ROYAL NEW ZEALAND NAVY—The Government in New Zealand has since the earliest days made provision for naval forces in its defence measures. Royal Naval vessels regularly visited New Zealand waters, but these were soon supplemented by a number of Government-owned vessels, the first of which was the Australia, a schooner purchased from India in 1842. In addition, in 1877 the New Zealand Government began regular financial contributions towards maintaining Royal Naval ships in New Zealand waters. In 1921 the naval forces became the New Zealand Division of the Royal Navy, and in 1941 they became the Royal New Zealand Navy.
Command and Administration—The command and administration of the Royal New Zealand Navy under the Navy Act 1954 and the Defence Act 1964 are carried out by the Defence Council by delegation to the Naval Board. The Naval Board consists of the Chairman (the Minister of Defence), Chief of the Naval Staff and First Naval Member (a Rear-Admiral), Second Naval Member and Chief of Naval Personnel (a Commodore), Third Naval Member and Chief of Naval Technical Services (a Commodore), and the Deputy Secretary of Defence (Navy).
Role of the Royal New Zealand Navy—Through the collective defence arrangements made by New Zealand, e.g., under UN, SEATO, and ANZUS agreements, and within the Commonwealth, the Royal New Zealand Navy provides forces capable of integrating with the navies of friendly nations. These forces are also planned to provide a measure of defence for the home territories should the need arise.
One ship is permanently attached to the Commonwealth Far East Strategic Reserve and others could reinforce it at short notice. The normal peacetime duties are many and varied, and include single Service and joint exercises both in the New Zealand area and overseas, cruises to foreign ports and around New Zealand and its island territories; support for New Zealand Antarctic interests, surveying, fishery protection, and servicing weather stations. These are in addition to training both active service personnel and reserves for their wartime tasks.
State of the Navy—Her Majesty's New Zealand ships, as at 30 September 1966, were:
*Awaiting disposal. †On loan from Royal Navy. | ||
|---|---|---|
| Cruiser | Royalist* | At least one frigate is deployed to the Far East Station. The remaining ships in commission are normally employed within the New Zealand Naval Station. |
| Frigate (Leander class) | Waikato | |
| Frigates (Otago class) | Otago | |
| Taranaki | ||
| Frigate (Whitby class) | Blackpool† | |
| Frigates (Loch class) | Rotoiti* | |
| Kaniere* | ||
| Survey ship | Lachlan | |
| Supply ship | Endeavour | Antarctic support and fleet replenishment. |
| Ocean minesweepers | Kiama | Training and fishery protection. |
| Inverell | ||
| Stawell* | ||
| Echuca* | ||
| Fleet auxiliary | Tui | Naval and oceanographic research. |
| Motor launches | Twelve | Fishery protection, training survey work, harbour duties, RNZNVR Divisions. |
Shore Establishments—Navy Office, Wellington, is the office of the New Zealand Naval Board and its associated naval and administrative staffs.
The Naval Base at Devonport, Auckland, consists of the office of the Commodore, Auckland, HMNZS Philomel (the naval barracks and training establishment), the Royal New Zealand Naval Hospital, and Dockyard.
The Dockyard (administered by a Captain Superintendent) includes the Naval Store Depot and is capable of refitting ships up to light cruisers.
HMNZS Tamaki is the new entry training establishment for the Navy and is situated near HMNZS Philomel, Auckland. HMNZS Irirangi is the wireless station for the New Zealand Naval Station and is situated at Waiouru in the centre of the North Island.
Personnel—Entry into the Royal New Zealand Navy is open to young men through the following channels:
| Artificer apprentices | Ages 15 years to 17 years 6 months. |
| Youths | Ages 16 years to 17 years 6 months. |
| Adult entries | Ages 17 years 6 months to 25 years (28 years for tradesmen). |
With the exception of the artificer apprentices who carry out their initial training in Philomel before proceeding to the United Kingdom for trade training, all new entries receive their basic training in Tamaki. Technical and specialist training is, as far as possible, carried out in New Zealand, but where no facilities exist, ratings attend courses in naval establishments in Australia and the United Kingdom.
There are two schemes for direct entry as officer cadets on the General List. Candidates between the ages of 15 years and 16 years 6 months are eligible for selection as cadet midshipmen; these cadets carry out three years' training at the Royal Australian Naval College, Jervis Bay, New South Wales, before proceeding to the United Kingdom for specialist technical training. To cater for the older age group, young men between the ages of 17 years and 19 years are eligible for selection as special entry cadets; these cadets undergo approximately 20 months' preliminary training at the Royal Australian Naval College before proceeding to the United Kingdom. Cadets entered under both schemes carry out a short period of sea training in the Royal New Zealand Navy before undergoing their specialist training in the United Kingdom. In the United Kingdom those cadets who will become seamen and supply specialists spend two years at the Royal Naval College, Dartmouth, and the cadets who will become engineering specialists undergo about four years' technical training at the Royal Naval Engineering College, Plymouth. On completion of their United Kingdom training the officers return to New Zealand to take up appointments as trained officers in the Royal New Zealand Navy.
A number of officers for the Supplementary List are now being trained at HMNZS Tamaki. The candidates, who must be between 17 and 23 years of age, do one year's training ashore before going to sea for further experience.
Suitable ratings who qualify educationally and professionally are eligible for promotion to officer rank, depending on age and experience.
Women's Royal New Zealand Naval Service—The Women's Royal New Zealand Naval Service was first formed in 1942 as a wartime service. In 1949 the WRNZNS became a permanent part of the Royal New Zealand Navy. Employment of members of the WRNZNS is varied and includes duties as cooks, stewards, writers, shorthand typists, motor-transport drivers, and teleprinter operators. These duties are supplemented or amended as necessary to meet the requirements of the Navy.
Royal New Zealand Naval Volunteer Reserve—There is a division of the Royal New Zealand Naval Volunteer Reserve in each of the four main centres—Auckland, Wellington, Christchurch, and Dunedin. When the Military Training Act 1949 was introduced these divisions accepted the responsibility for training the Navy's compulsory naval reservists. In all they trained 1,992 men before it was decided in 1957 to cease compulsory training for the Navy. The divisions then reverted to their former purely volunteer role.
Strength of the Navy—The strength of the Navy as at 31 August 1966 was as follows:
| Officers | Ratings | Total | |
|---|---|---|---|
| Regular Forces (including WRNZNS) | 320 | 2,540 | 2,860 |
| Active Reserves: | |||
| Royal New Zealand Naval Reserve | 14 | - | 14 |
| Royal New Zealand Naval Volunteer Reserve | 160 | 436 | 596 |
| Totals | 174 | 436 | 610 |
| Inactive (Supplementary) Reserves: | |||
| Royal New Zealand Fleet Reserve | - | 2,088 | 2,088 |
| Retired Officers and Pensioners | 295 | 122 | 417 |
| Totals | 295 | 2,210 | 2,505 |
Naval Expenditure—During the year ended 31 March 1966 the sum of $21,524,306 was expended on the Royal New Zealand Navy. The total expenditure for the previous financial year was $19,584,906.
THE ARMY—The New Zealand Army is raised, maintained, and organised under the authority of the New Zealand Army Act 1950, and the Defence Act 1964.
The Army consists of the Regular Force, the Territorial Force, the Army Reserve, the Cadet Corps, and military forces raised in time of war or other like emergency. The New Zealand Army Act as far as possible places the officers and soldiers of the Regular and Territorial Forces on the same footing.
The New Zealand Army comprises the following Corps:
Royal Regiment of New Zealand Artillery.
Royal New Zealand Armoured Corps.
Corps of Royal New Zealand Engineers.
Royal New Zealand Corps of Signals.
Royal New Zealand Infantry Regiment.
New Zealand Special Air Service.
New Zealand Army Air Corps.
Royal New Zealand Army Service Corps.
Royal New Zealand Army Medical Corps.
Royal New Zealand Army Ordnance Corps.
Corps of Royal New Zealand Electrical and Mechanical Engineers.
Royal New Zealand Dental Corps.
Royal New Zealand Chaplains Department.
New Zealand Army Pay Corps.
New Zealand Army Legal Service.
Royal New Zealand Provost Corps.
Royal New Zealand Army Education Corps.
New Zealand Army Physical Training Corps.
Royal New Zealand Nursing Corps.
New Zealand Women's Royal Army Corps.
New Zealand Cadet Corps.
Command and Organisation—The command and administration of the New Zealand Army are carried out by the Defence Council, by delegation to the Army Board. The Army Board consists of:
The Minister of Defence as Chairman; The Chief of the General Staff (First Military Member); The Vice-Chief of the General Staff (Second Military Member); The Adjutant-General (Third Military Member); The Quartermaster-General (Fourth Military Member); The Deputy Secretary of Defence (Army); and an Associate Member (Territorial Force).
The Army is organised, trained, and equipped so that, in the event of war, or other emergency, it can undertake rapidly and efficiently the tasks which may fall to it.
The Army is organised into the following major components:
(a) The Static Support Force; (b) The Field Force; (c) The Army Reserve; (d) The Cadet Corps.
The Static Support Force: This Force commands, administers, trains, and equips the Army as a whole. The establishment is approximately 3,000 regular all ranks. It is assisted in its tasks in peace by the service units of the Field Force.
The Field Force: This consists of operational formations containing Regular and integrated Regular and Territorial units. It is designed to provide an infantry brigade group plus its logistic support and reserves for overseas service. The Force also provides a Regular Force contribution to the Commonwealth Strategic Reserve. The Field Force establishment totals approximately 3,250 Regulars and 10,000 Territorials all ranks.
The Army Reserve: Contains Regular and Territorial officers and soldiers who have completed their Active engagement. In time of war or other like emergency the Governor-General may, by proclamation, transfer the Army Reserve or any specified portion thereof to the Regular Force or the Territorial Force.
The Cadet Corps: The Cadet Corps now comprises 20,000 secondary-school cadets, of which Army cadet units will total approximately 13,000 all ranks. Service is voluntary and, subject to satisfying the necessary standards, schools may raise and train units. All units are designated by the name of the school raising them. Cadet Corps officers are provided from the school staffs.
Conditions of Service:Regular Force—All officers and soldiers over 20 years of age are liable for service overseas with the exception of the Home Service Section. Enlistment in the Regular Force is voluntary and is until retiring age for officers, with provisions for special short-term engagements, and for soldiers of the General Service Section as follows:
Men: Minimum of three or more years up to a maximum of 12 years on the Active List followed by three or more years on the reserve. Re-engagement may be for a minimum period of two years with a maximum of the number of years necessary to complete 12 years' service. Alternatively on completion of any period of engagement a soldier may re-engage until retiring age. Reserve service liability after re-engagement is for three years or until retiring age, whichever is the sooner.
Women: Three years, with re-engagement for one, two, or three years, until retiring age.
Promotion of long service Regular officers to lieutenant, captain, and major is normally gained after two, four, and six years service respectively in the previous rank, provided that the prescribed promotion courses and examinations are passed and the officer is recommended for promotion. A regular lance-corporal is required to qualify at a unit test before promotion to corporal, at a district course for sergeant, written examination set and marked by Army Headquarters for staff sergeant, and at a course at Army Schools for warrant officer.
Territorial Force: In time of war or other emergency the Governor-General may, by proclamation, declare the Territorial Force liable for continuous service within New Zealand or overseas. In peace time the Territorial Force is to be maintained at a planned strength of 10,000 by a selective National Service Scheme which was commenced in 1962, in addition to voluntary enlistment from citizens satisfying certain requirements. Following a period of 14 weeks' full-time training National Servicemen are required to complete three years' part-time service before being posted to the Army Reserve. National Servicemen may also volunteer for further service on the active list on completion of their three years' obligatory service.
Before promotion to captain or major, officers are required to qualify at prescribed courses and examinations, and before promotion to lieutenant-colonel at a promotion course.
Training: Regular Force—Except in the case of special entries and Quartermaster officers commissioned from the ranks, all Regular officers are commissioned on graduation from the Royal Military College, Duntroon, Australia; the Royal Military Academy, Sandhurst, England, or, from the Officers Cadet School, Portsea, Australia. Post-graduate and specialist training is received either in New Zealand or at overseas training establishments. Officers receive staff training at Staff Colleges in England, Australia, or in the United States of America. Selection for Staff College is by examination set and marked in New Zealand.
Regular soldiers are trained at the Army Schools, Corps Schools, or Depots, and in Regular units in New Zealand. In certain cases special training is received at overseas training establishments.
Territorial Force—Officers and soldiers are required to carry out annually a minimum of 20 days' training to be classified as efficient. Of this training a minimum of 14 days must be annual camp training. In addition to this part-time training obligation, National Servicemen and volunteers with no previous training are required to complete a period of 14 weeks' full-time training at the commencement of their service.
The maximum number of days annual part-time training including attendance at courses, for which officers and soldiers can receive pay is: (a) commanding officers of units, 60 days; (b) other officers, 50 days; (c) non-commissioned officers, 50 days; and (d) privates, 40 days.
Cadet Corps—Training covers a three year cycle with emphasis placed on training in leadership, weapon handling, field craft, and adventure type training. Some training in first aid, signals communication, and survival techniques is also given. Each unit is required to complete a minimum of 43 hours' training annually, including a five-day barracks week. Courses for officers and non-commissioned officers are conducted at district training camps during school vacations.
Training Establishments: The Army Schools—Headquarters, The Army Schools, commands and administers a group of Army schools situated at the one centre, which provide courses for all ranks of the Regular Force as well as for officers and specialist non-commissioned officers of the Territorial Force.
The group consists of the Tactical School, Regular Force Depot, School of Army Administration, School of Artillery, School of Armour, School of Signals, School of Infantry, Royal New Zealand Army Service Corps School, Royal New Zealand Electrical and Mechanical Engineering School, the Regular Force Cadet Unit, and the Regular Force Cadet School.
The Regular Force Depot provides basic recruit and instructor courses for all arms of the Regular Force, including Regular Force Cadets.
The Regular Force Cadet School provides academic training for cadets between the ages of 15 1/2 and 18 years. Trade training of cadets is carried out at the appropriate corps school or depot.
The School of Military Engineering, Medical Corps Depot, and the Army Ordnance School are situated apart from the central Army School organisation but fulfil similar functions. In addition, each military district from time to time holds courses for Territorial officers and soldiers, and for personnel of the New Zealand Cadet Corps.
Rifle Clubs and Associations—All rifle clubs and associations (including the parent body, the National Rifle Association of New Zealand) must be formally recognised by the Army Board. There are 104 rifle clubs and 23 rifle associations and subassociations in New Zealand.
The planning, construction, and maintenance of rifle ranges, and precautions to be observed in conducting rifle practices and competitions, are governed by orders issued by the Army Board.
Army Expenditure—Army expenditure for the two latest financial years has been as follows: 1964-65, $24,601,716; 1965-66, $27,335,062.
Strength of the Army—The strength of the Army as at 31 August 1966 was as follows:
| Officers | Soldiers | Total | |
|---|---|---|---|
| *Includes 1,897 National Servicemen under training or awaiting posting to units. | |||
| Regular Forces (including forces in Malaysia, Thailand, and South Vietnam; women; but excluding five personnel seconded from the British and Australian Armies) | 635 | 4,869 | 5,504 |
| Territorial Force (Active) | 752 | 10,647 | 11,399* |
| Reserve of Officers | 1,095 | - | 1,095 |
| Class A Reserve (Territorial Force) | - | 931 | 931 |
| Class B Reserve (Regular Force) | - | 2,158 | 2,158 |
| Cadet Corps | 458 | 12,759 | 13,217 |
THE ROYAL NEW ZEALAND AIR FORCE—The Royal New Zealand Air Force had its inception in the New Zealand Permanent Air Force and the New Zealand Air Force (Territorial), established as part of the defence forces of the country in 1923. Permission for a change of name to Royal New Zealand Air Force was granted in 1934. By the Air Force Act 1937, the RNZAF was constituted as a separate armed service, and its administration was vested in the newly formed Air Department. Until 1951 the administration of Air Force law was in accordance with Royal Air Force practice, but with the coming into force that year of the Royal New Zealand Air Force Act 1950 a separate New Zealand system of Air Force law was established. Until 1964 the Civil Aviation Administration also formed part of the Air Department, but in 1964 the Civil Aviation Act and the Defence Act established a separate Department of Civil Aviation and transferred the remainder of the Air Department to the Ministry of Defence. Provision is made in the Defence Act 1964, however, for the Civil Aviation authorities to be associated with discussions of issues where military and civil aviation interests are both concerned.
Command and Organisation—The RNZAF is raised, maintained, and organised under the authority of the Royal New Zealand Air Force Act 19.50 and the Defence Act 1964. The force consists of: (a) The Regular Air Force; (b) The Territorial Air Force; (c) The Air Force Reserve; (d) The Women's Royal New Zealand Air Force; (e) The Air Training Corps.
The command and administration of the RNZAF are carried out by the Defence Council, by delegation to the Air Board which consists of the Minister of Defence as Chairman; the Chief of the Air Staff; the Air Member for Personnel; the Air Member for Supply; the Deputy Chief of the Air Staff and the Deputy Secretary of Defence (Air). RNZAF Headquarters is located in Wellington. There are six RNZAF bases in New Zealand. The RNZAF station at Lauthala Bay, Fiji, was officially closed in January 1965 though operations on a reduced scale are being maintained by a detached flight from Hobsonville. An RNZAF Operations Group, which has the responsibility for the operational functions of the RNZAF, has its headquarters at RNZAF Auckland. An RNZAF Training Group, with a headquarters at RNZAF Wigram, is responsible for all RNZAF training.
Role—The role of the RNZAF is to provide forces for the defence of New Zealand and her island territories, for the defence of sea and air communications, and for deployment overseas as necessary to support the United Nations and to meet obligations to, and defence arrangements with, the Commonwealth and allied countries. In order to meet these commitments the RNZAF is organised to provide an operational force immediately available in an emergency. In addition, the RNZAF provides support for the search and rescue organisations in New Zealand and the South Pacific area.
Operational Units—Operational units of the RNZAF comprise a medium range transport squadron and a light bomber squadron based with the RAF in Singapore; a maritime squadron, long range transport squadron, and a battlefield support squadron are based at RNZAF Auckland, and a day fighter ground attack squadron, and a communications transport squadron are based at RNZAF Ohakea.
Technical Services—RNZAF technical services are organised and patterned on the Royal Air Force. All RNZAF bases are equipped to undertake routine servicing of the aircraft they operate. The overhaul and repair of aircraft engines and accessories are carried out at No. 1 Repair Depot, RNZAF Woodbourne, but a large proportion of the repair and overhaul work is contracted to the two principal airlines—the National Airways Corporation at. Christchurch and Air New Zealand in Auckland.
Equipment Services—Spares and equipment required by the RNZAF are provided through an equipment branch which is also responsible for the control and administration of catering, motor transport, and movements. Supply procedures and systems are patterned on the Royal Air Force and the United States Services, both of which are also the main sources of supply for technical spares and equipment.
Personnel: Regular Air Force, Officers—Candidates for commissions in the General Duties (Flying) Branch are drawn mainly from civil life. Candidates for other officer branches are mostly selected from the ranks, although some candidates with high educational and specialist qualifications are enlisted from civilian sources. After a probationary period of service they are initially granted short service commissions with the opportunity of qualifying for a permanent commission later. Applications from officers of other Commonwealth services who have retired, or are about to retire, are accepted from time to time.
Some officer cadets are enlisted and on completion of up to four years' military and university studies are granted permanent commissions in the General Duties, Technical, Administrative and Supply, or Education Branches. Normal retiring ages for officers holding permanent commissions in the General Duties Branch are: squadron leaders and below 45 years; wing commander, 48 years; group captain and above 53 years. For other branches the equivalent retiring ages are 49, 51, and 53 years respectively. In special cases the retiring age of any officer may be extended up to the age of 55 years, or exceptionally, 57 years.
Airmen and Airwomen—Service for airmen in the Regular Air Force is mainly through initial engagements of up to eight years on the active list, according to trade, with a reserve liability of four years in each case. Twelve-year engagements are granted to men who are selected for apprentice training. This training was formerly carried out at the RAF apprentice schools at Halton and Locking in Britain, but from 1960 has been provided by the Royal Australian Air Force apprentice school at Wagga, New South Wales. The RNZAF also trains its own apprentices in certain trades, under a scheme known as the New Zealand Certificate in Engineering Training Scheme. Trainees commence their service at RNZAF Woodbourne and take a four year course as fitters to the level of the New Zealand Certificate in Engineering. For airwomen, the initial term of service is normally three years with no reserve obligation. Opportunities exist for both airmen and airwomen to re-engage in order to qualify for superannuation, for which a minimum period of 20 years' service before attaining the age of 55 years is required. Release leave and end-of-service grants, based on length of service, are given for both short- and long-term service.
Non-regular Forces—The non-regular forces of the RNZAF consist of: (a) The Territorial Air Force; (b) The Active Reserve; (c) The General Reserve; and (d) The Air Training Corps. Except for the airmen who comprise the Band of the Royal New Zealand Air Force, the Territorial Air Force is manned in specialist officer branches only.
The Active Reserve is manned by personnel who either have reserve obligations following service in the Regular Air Force, or who volunteer on the expiry of those obligations. Not all Active Reserve personnel are required to carry out training annually but they are required to carry out such training as the Air Board determines is necessary. The General Reserve has no training obligations in time of peace.
The Air Training Corps is essentially a disciplined youth movement which fosters an interest in the air and provides a valuable source of recruits for the Regular Air Force.
Recruitment—There are recruiting offices at Auckland, Wellington, and Christchurch, and an RNZAF representative in Dunedin.
Training: Flying Training—The training of all aircrew is undertaken at the Flying Training Wing at RNZAF Wigram. New Zealand Navy and Army pilots are trained in support of joint and single service flying activities. Since 1962 some flying training has been carried out on behalf of the Royal Malaysian Air Force for both pilots and flying instructors.
Ground Training—Airmen Cadets take an education, general service, and basic training course for 12 months at the Airman Cadets' School, RNZAF Woodbourne. During this period cadets enlisted in non-technical trades are trained to specialist level, while those enlisted in technical trades complete training to a basic engineering level. All other recruits, both airmen and airwomen, receive initial general service training, followed by basic engineering and specialist training for airmen, technical recruits, or specialist training only for recruits enlisted in the non-technical trades. Airmen and airwomen who graduate from specialist training are employed on units for periods ranging from six months to two years, depending on the trade, and are then returned to the appropriate trade training school for advanced training. Training for security police, provosts, ATC, and general service instructors is conducted at the General Service Training School, RNZAF Wigram. This school also conducts specialist courses in management and leadership training for junior non-commissioned officers.
Officer Training—The RNZAF conducts formal courses of officer training in New Zealand at three levels: indoctrination of officer cadets; junior command and staff training for flight lieutenants; and senior command and staff training for squadron leaders and wing commanders. In addition, selected RNZAF officers attend the Royal Air Force and Royal Australian Air Force Staff Colleges; the British Joint Services Staff College; the Air Warfare College of the Royal Air Force; and the Imperial Defence College in London. The RNZAF has exchange-of-personnel agreements with the Royal Air Force, the Royal Australian Air Force, and the United States Air Force; up to 12 RNZAF officers are on exchange at any one time. Each year up to 10 officer cadets are recruited under a University Cadetship Scheme conducted in conjunction with the University of Canterbury. These Cadets read for bachelor degrees in science, arts, commerce, or engineering and during university vacations receive their military training. On completing the degree course, students are appointed to permanent commissions. Officer Cadet and University Cadet training is carried out at RNZAF Wigram, and the two levels of command and staff training are carried out at the Command and Staff School, RNZAF Auckland.
Strength of the Air Force—The strength of the RNZAF at 31 August 1966 was as follows: Regular Air Force, 4,020; WRNZAF, 307; Territorial Air Force, 103; Active Reserve, 682; General Reserve, 1,460; Air Training Corps, 4,869 (2,658 in school units and 2,211 in town squadrons).
Air Force Expenditure—The total expenditure of the RNZAF for the year ended 31 March 1966 (including works construction and maintenance) was $30,853,704. The comparable figure for 1964-65 was $29,276,776.
ARMED FORCES OVERSEAS—A brief summary of forces raised and employed overseas up till 1959 in Japan; with the United Nations forces in Korea; in Cyprus; and in the former Federation of Malaya is given in the 1959 and earlier issues of the Yearbook. The following is a brief account of New Zealand's contributions to the Commonwealth Strategic Reserve, and of other elements of the New Zealand Armed Services serving overseas at the end of 1966.
Commonwealth Strategic Reserve: New Zealand agreed in 1955 to contribute forces to a Commonwealth Far East Strategic Reserve to be established in the South-East. Asian area. That year an Army Special Air Service Squadron was formed and began anti-terrorist operations in Malaya in January 1956. The Squadron comprised 133 officers and men and operated as a sub-unit of the British Army's 22nd Special Air Service Regiment. It was replaced in late 1957 by a regular infantry battalion which has remained in Malaysia as part of the Commonwealth Strategic Reserve. At present the 1st Battalion, Royal New Zealand Infantry Regiment, consisting of 750 officers and men, is serving in Malaysia. Like its predecessors it has carried out operations against the terrorist remnants in the area in northern peninsular Malaysia bordering on Thailand. It has also been engaged on operations against Indonesian infiltrators in both eastern and western Malaysia. An SAS detachment has also been deployed in the Borneo States of Malaysia.
Regular contributions of air and naval units have also been made. From 1955 to 1958 No. 14 Squadron RNZAF, a day fighter ground attack squadron, was based in Singapore. It was replaced by No. 75 Squadron RNZAF, a light bomber squadron, which was withdrawn to New Zealand in early 1962. No. 14 Squadron RNZAF, equipped with Canberra light bombers, returned to Singapore on indefinite deployment towards the end of 1964. No. 41 Squadron RNZAF, a medium range transport squadron, continues to be based in Singapore as part of the Strategic Reserve.
The naval contribution to the Reserve consists of one modern frigate. The frigates take this duty in turn and while so engaged form part of the Royal Navy's Far East Fleet. Each ship's absence from New Zealand is usually just under one year.
Thailand: As a result of the worsening situation in neighbouring Laos during early 1962, the Thai Government appealed to the New Zealand Government for assistance. On 22 May of that year a token force of four officers and 27 other ranks of the 1st Special Air Service Squadron left New Zealand for service in Thailand. The force operated with United States and Thailand units. It was withdrawn in September 1962.
As part of general efforts to improve communication facilities in Thailand, British, Australian, and New Zealand forces were engaged, between March 1964 and October 1965, in building an airfield in North-East Thailand. The New Zealand component of 33 men was provided by 2nd Plant Troop, 2nd Construction Squadron, Royal New Zealand Engineers. Elements of the RNZAF transport squadron based in Singapore as part of the Commonwealth Strategic Reserve assisted in this project and in a United States programme for the improvement of logistic and communications facilities in North-East Thailand.
In January 1966 a specialist team of some 15 men of the Corps of Royal New Zealand Engineers went to Thailand to provide capital and technical assistance under the Colombo Plan in the building of a road in North-East Thailand, from Borabu towards Buriram, a distance of 170 kilometres. In addition to providing the supervisors and instructors for the project, New Zealand will provide much of the equipment for the building of the road.
South Vietnam: In June 1964, at the request of the Republic of South Vietnam, an Army engineer detachment was sent to South Vietnam to help in reconstruction and development projects. The team returned to New Zealand in June 1965. The following month, in response to a further request from the South Vietnamese Government, an artillery battery was sent to South Vietnam. An infantry company was sent in May 1967.
United Nations Observers: At the request of the Secretary-General of the United Nations, New Zealand has provided military observers in United Nations truce supervisory operations in Kashmir since 1951 and in Palestine since 1954. The number of observers in Kashmir has been four, except for the period of hostilities in mid-1965 when, for a short time, New Zealand provided nine officers. The number of observers in Palestine has varied between two and seven with five being the strength in 1966.
New Zealand continues to provide one military member of the Commonwealth Liaison Mission to the United Nations Command in South Korea.
Aid to Malaysia: In addition to the direct military help being given by New Zealand operational units in South-East Asia in maintaining the security of Malaysia, New Zealand has, since early 1964, undertaken a programme of defence aid to Malaysia. Under this programme military equipment valued at approximately $912,000 has been dispatched, New Zealand servicemen are being seconded to the Malaysian armed forces and, up to September 1966, 212 Malaysian servicemen have been trained in New Zealand. Expenditure has been met from an item of $200,000 in the Defence Vote annually since 1964-65.
STRENGTHS OF THE ARMED SERVICES IN WAR: South African War—Approximately 6,500 troops from New Zealand served in the South African War.
First World War, 1914-18—A total of 124,211 persons (including 91,941 volunteers) were called up for overseas and home service prior to 12 November 1918. Of these 100,444 went overseas. This total comprised 98,950 troops serving with the New Zealand Expeditionary Forces in the European, Mediterranean, or Samoan areas; 550 nurses; and 944 others (including 211 British Army reservists, 541 naval personnel, and 192 Royal Flying Corps personnel). In addition, it was known that 3,370 (not included above) left New Zealand and enlisted in British and Australian forces, while others (exact numbers unknown) are known to have joined Canadian and South African forces.
At Armistice date in November 1918 New Zealand had over 56,000 troops overseas, and a further 10,000 were ready to embark or in training.
The troops provided for overseas service represented nearly 10 percent of the total population of New Zealand in 1914 and over 40 percent of the male population between the ages of 20 and 45 years. These percentages do not take into account New Zealanders who served in the British or Australian naval or military forces.
Second World War, 1939-45—Approximately 60,000 men volunteered for service in the New Zealand forces in the Second World War before conscription was introduced in July 1940.
The net intake of men to the armed forces—i.e., exclusive of transfers between the services and of re-entries—was 194,000, equivalent to 67 percent of the male population between the ages of 18 and 45 years. In addition, approximately 10,000 women served in the forces. It is estimated that approximately 140,000 persons served overseas.
A total of 104,988 Army personnel served overseas with the Second New Zealand Expeditionary Force, and, of these, 99,343 (97,893 males and 1,450 females) left New Zealand on or before 15 August 1945, and 5,645 (5,491 males and 154 females) left New Zealand on or after 16 August 1945. (Some detailed tables are given on pages 269-271 of the 1956 issue of the Yearbook.)
The following table shows the approximate strength of each of the services from the outbreak of war in September 1939 at yearly intervals until August 1945, when hostilities ceased. The figures at July 1942 are also shown, as that month marked the peak for mobilisation, there being 151,073 men in the armed forces at that time, representing approximately 43 percent of the male population of military age.
| As at 31 March | Navy | Army | Air Force | All Services | Total | Female Personnel (Included in Previous Columns) | |
|---|---|---|---|---|---|---|---|
| In New Zealand | Overseas | ||||||
| 1939 (September) | 1,320 | 18,000 | 1,486 | 20,392 | 414 | 20,806 | - |
| 1940 | 1,791 | 29,300 | 3,808 | 27,628 | 7,271 | 34,899 | 18 |
| 1941 | 3,579 | 75,148 | 10,213 | 54,997 | 33,943 | 88,940 | 202 |
| 1942 | 5,605 | 109,389 | 18,228 | 82,201 | 51,021 | 133,222 | 2,356 |
| 1942 (July) | 6,110 | 124,773 | 23,666 | 104,490 | 50,059 | 154,549 | 3,476 |
| 1943 | 7,657 | 104,087 | 33,777 | 82,740 | 62,781 | 145,521 | 7,302 |
| 1944 | 10,018 | 72,662 | 41,595 | 55,039 | 69,236 | 124,275 | 7,942 |
| 1945 | 10,412 | 46,698 | 35,004 | 42,731 | 49,383 | 92,114 | 5,609 |
| 1945 (August) | 10,466 | 40,942 | 31,578 | 36,962 | 46,024 | 82,986 | 4,632 |
CASUALTIES ON ACTIVE SERVICE—The following table gives particulars of casualties suffered on active service by members of the armed forces in the wars, etc., listed. For the Second World War the figures shown for Navy and Air Force include New Zealand personnel serving with the Royal Navy and Royal Air Force respectively. Deaths and injuries due to accidental causes while on active service are included in the figures of deaths and wounded respectively. The number shown as “missing” refers to the number so classified at the end of the period quoted.
| — | Deaths (Including Died as Prisoner of War) | Wounded and Injured | Prisoners of War | Wounded and Taken Prisoner of War | Interned | Missing | Total |
|---|---|---|---|---|---|---|---|
| *At 4 August 1919 this total comprised 16,688 deaths, 41,315 wounded and 1 missing. | |||||||
| South African War, 1899-1902 | 228 | 166 | - | - | - | - | 394 |
| First World War, 1914-18 (up to 12 November 1918)— | |||||||
| 1 N.Z.E.F. | 16,302 | 41,262 | 356 | - | - | 84 | 58,004* |
| Samoa | 2 | - | - | - | - | - | 2 |
| Nurses | 13 | - | - | - | - | - | 13 |
| Totals | 16,317 | 41,262 | 356 | - | - | 84 | 58,019 |
| Second World War, 1939-45 (up to 31 December 1946)— | |||||||
| Navy | 573 | 170 | 54 | - | 3 | - | 800 |
| Army | 6,793 | 15,324 | 6,644 | 1,219 | - | 46 | 30,026 |
| Air Force | 4,149 | 255 | 520 | 32 | 23 | - | 4,979 |
| Mercantile Marine | 110 | - | - | - | 123 | - | 233 |
| Totals | 11,625 | 15,749 | 7,218 | 1,251 | 149 | 46 | 36,038 |
| Jayforce (up to December 1948) | 11 | - | - | - | - | - | 11 |
| Korea (up to December 1954)— | |||||||
| Navy | 2 | 1 | - | - | - | - | 3 |
| Army | 37 | 80 | 1 | - | - | - | 118 |
| Totals | 39 | 81 | 1 | - | - | - | 121 |
| Malaya (up to September 1960)— | |||||||
| Army | 10 | 21 | - | - | - | - | 31 |
| Air Force | 5 | 2 | - | - | - | - | 7 |
| Totals | 15 | 23 | - | - | - | - | 38 |
| In Vietnam— | |||||||
| Army | 3 | 20 | - | - | - | - | 23 |
| Totals | 3 | 20 | - | - | - | - | 23 |
SUMMARY OF WARTIME ACTIVITIES OF ARMED FORCES—A condensed account of the wartime activities of the three armed services was given in the 1958 and earlier issues of the Yearbook.
PERSONS WITH OVERSEAS WAR SERVICE—Census statistics on overseas war service are now given.
| Wars | 1956 | 1961 | ||||
|---|---|---|---|---|---|---|
| Males | Females | Total | Males | Females | Total | |
| * Plus any with service in both World Wars. | ||||||
| Overseas service— | ||||||
| Only in Korean War | 4,290 | 19 | 4,309 | 4,948 | 34 | 4,982 |
| Only in Second World War | 138,270 | 4,618 | 142,888 | 140,549 | 5,447 | 145,996 |
| Only in First World War | 55,616 | 1,100 | 56,716 | 45,879 | 1,064 | 46,943 |
| Only in South African War | 1,618 | 6 | 1,624 | 991 | 14 | 1,005 |
| In Korean War and Second World War | 1,212 | 5 | 1,217 | 1,330 | 3 | 1,333 |
| In Korean War and Second World War and/or First World War | 98 | 2 | 100 | 67 | 2 | 69 |
| In Second World War and First World War | 2,995 | 44 | 3,039 | 3,274 | 62 | 3,336 |
| In South African War and First World War | 797 | 2 | 799 | 470 | 5 | 475 |
| In South African War and Second World War* | 84 | 2 | 86 | 44 | - | 44 |
| Totals with overseas war service | 204,980 | 5,798 | 210,778 | 197,552 | 6,631 | 204,183 |
Although the number of First World War veterans declined by 16 percent between the censuses of 1956 and 1961, there still remained 50,858 (49,725 men and 1,133 women). Of this figure, 38,848 served with the New Zealand Forces, and the remaining 12,010, who served with the Australian, United Kingdom, Indian, and Other Commonwealth Forces, will include an unknown number of immigrants who have arrived in New Zealand since 1918.
The number of Second World War servicemen in New Zealand is increasing, because the number of Second World War servicemen of overseas forces coming to New Zealand has been greater than the number of veterans of the New Zealand Forces dying or emigrating.
Figures from the last three censuses showing the increases in number of persons who served overseas in the Second World War, are: 1951, 141,901 (137,740 men and 4,161 women); 1956, 147,296 (142,626 men and 4,670 women); 1961, 150,771 (145,257 men and 5,514 women).
The increase (amounting to 2.3 percent between 1956 and 1961, compared with 3.8 percent between 1951 and 1956), is accounted for mainly by immigration of persons who served in the United Kingdom Forces. The number of those with overseas service in the New Zealand Forces only, declined from 124,394 (122,557 men and 1,837 women) to 122,939 (120,885 men and 2,054 women) between 1956 and 1961, the decline being accounted for by emigration as well as deaths.
PERSONS WITH WAR SERVICE IN NEW ZEALAND ONLY—In the following table the numbers of persons mobilised for at least 28 days in home service only are given.
| — | Males | Females | Total |
|---|---|---|---|
| Home service only, First World War | 9,120 | 217 | 9,337 |
| Home service only, Second World War | 84,278 | 8,275 | 92,553 |
| Home service, First World War and overseas service Second World War | 210 | - | 210 |
| Home service Second World War and overseas service First World War | 7,754 | 43 | 7,797 |
CIVIL DEFENCE—The Civil Defence Act 1962 made provision for a civil defence organisation, the preparation of plans for civil defence to operate in the case of a national emergency or a major disaster, and the carrying out of those plans if a national emergency or a major disaster occurs.
Provision is made for the appointment of a Secretary of Civil Defence, a Director, a Deputy-Director, and Regional Commissioners, and the constitution of a National Civil Defence Committee.
Various Planning Committees have been established and are responsible for formulating national civil defence plans for consideration by the national committee prior to being submitted to the Minister of Civil Defence who is given power under the Act to approve them as national plans.
The civil defence roles and responsibilities of Government Departments and other organisations have been defined in plans already approved.
The preparation of local civil defence plans and the establishment of the organisation to implement such plans, are the responsibility of local authorities.
Table of Contents
LAND UTILISATION—The total area of New Zealand, excluding the island territories in the Pacific, but including the minor islands since these form parts of land districts, is 66,390,700 acres.
The broad grouping of land use in 1960 for farm and other purposes is shown in the following table.
| Acres (million) | ||
|---|---|---|
| Occupied farm land— | ||
| Improved grassland | 18.4 | |
| Tussock and other native grassland | 13.0 | |
| Total grassland | —— | 31.4 |
| Land in field crops, gardens, and orchards | 1.4 | |
| Plantations | 0.9 | |
| Land in fern, scrub, and second growth | 5.7 | |
| Standing bush | 2.7 | |
| Barren and unproductive land | 1.9 | |
| Total other occupied farm land | —— | 12.6 |
| Total occupied farm land | —— | 44.0 |
| Land in cities and boroughs | 0.4 | |
| National parks, reserves, and domains | 5.1 | |
| State forest land | 9.8 | |
| Other land, including waste land such as mountains, bare rock, water surfaces, roads, etc. | 7.1 | |
| Total land | 66.4 | |
Tenure of Occupied Lands—The area of land in occupation as at 31 January 1960, classified according to tenure, was as follows:
| Acres | |
|---|---|
| Crown land (including leases and licences) | 18,256,493 |
| Freehold (including all land held on deferred payment) | 22,335,285 |
| Leasehold | 3,427,119 |
| Total occupied area | 44,018,897 |
Size of Holdings—Although approximately 31 percent of holdings surveyed in 1960 were less than 100 acres in extent, the total area of such holdings represented only a little under 3 percent of the occupied land of New Zealand. A further 24 percent of the holdings ranged between 100 and 200 acres, but the aggregate area of these amounted to less than 9 percent of the total. At the other end of the scale it was found that 64 percent of the occupied land was held in areas of 1,000 acres and upwards, although the number of such holdings was only a little under 9 percent of the total. Holdings of 5,000 acres and upwards, of which there were 1,013 in 1960, accounted for 38 percent of the total area of occupied land.
The number of holdings and percentages of total holdings in occupation, grouped according to size, as returned in each of the years 1949, 1952, 1957, and 1960 are given below. For these years, excepting 1960, statistics were collected for areas under 10 acres.
| Area, in Acres | Number of Holdings | Percentage of Total | ||||||
|---|---|---|---|---|---|---|---|---|
| 1949 | 1952 | 1957 | 1960 | 1949 | 1952 | 1957 | 1960 | |
| 1- 9 | 11,463 | 12,363 | 11,765 | .. | 13.16 | 13.69 | 13.90 | — |
| 10- 49 | 13,611 | 13,716 | 10,396 | 11,721 | 15.63 | 15.19 | 12.29 | 15.24 |
| 50- 99 | 12,962 | 13,460 | 11,932 | 12,353 | 14.89 | 14.91 | 14.10 | 16.06 |
| 100- 199 | 17,250 | 18,104 | 17,949 | 18,384 | 19.81 | 20.05 | 21.22 | 23.90 |
| 200- 319 | 10,084 | 10,308 | 10,289 | 10,687 | 11.58 | 11.42 | 12.16 | 13.89 |
| 320- 639 | 10,653 | 11,083 | 11,184 | 12,109 | 12.23 | 12.27 | 13.22 | 15.74 |
| 640- 999 | 4,215 | 4,382 | 4,357 | 4,659 | 4.84 | 4.85 | 5.15 | 6.06 |
| 1,000- 4,999 | 5,827 | 5,866 | 5,745 | 6,002 | 6.69 | 6.50 | 6.79 | 7.80 |
| 5,000- 9,999 | 538 | 535 | 531 | 551 | 0.62 | 0.59 | 0.63 | 0.71 |
| 10,000-19,999 | 278 | 276 | 261 | 264 | 0.32 | 0.31 | 0.31 | 0.34 |
| 20,000-49,999 | 144 | 143 | 141 | 145 | 0.17 | 0.16 | 0.17 | 0.19 |
| 50,000 and over | 51 | 52 | 54 | 53 | 0.06 | 0.06 | 0.06 | 0.07 |
| Totals | 87,076 | 90,288 | 84,604 | 76,928 | 100.00 | 100.00 | 100.00 | 100.00 |
The total acreage of holdings in each group is given in the following table.
| Area of Holdings, in Acres | 1949 | 1952 | 1957 | 1960 |
|---|---|---|---|---|
| acres | ||||
| 1- 9 | 53,053 | 56,401 | 50,871 | .. |
| 10- 49 | 344,548 | 346,400 | 265,188 | 299,766 |
| 50- 99 | 949,958 | 989,287 | 882,805 | 918,596 |
| 100- 199 | 2,417,342 | 2,536,230 | 2,521,234 | 2,618,512 |
| 200- 319 | 2,527,401 | 2,584,876 | 2,579,161 | 2,692,109 |
| 320- 639 | 4,823,068 | 5,011,073 | 5,061,457 | 5,470,835 |
| 640- 999 | 3,349,984 | 3,470,297 | 3,452,809 | 3,683,904 |
| 1,000- 4,999 | 11,377,539 | 11,367,370 | 11,125,375 | 11,537,911 |
| 5,000- 9,999 | 3,661,138 | 3,670,182 | 3,592,587 | 3,755,107 |
| 10,000-19,999 | 3,891,586 | 3,870,948 | 3,704,443 | 3,839,876 |
| 20,000-49,999 | 4,457,035 | 4,404,001 | 4,326,151 | 4,330,396 |
| 50,000 and over | 4,864,847 | 4,912,638 | 4,989,284 | 4,871,885 |
| Totals | 42,717,499 | 43,219,703 | 42,551,365 | 44,018,897 |
The following additional details not normally obtained in the annual farm production survey were collected under the special census of agriculture in 1960:
| Holdings at 31 January 1960 | Number | Percentage of Total |
|---|---|---|
| Occupied by Maoris | 5,227 | 6.79 |
| Lying entirely idle and unused | 4,591 | 5.97 |
A classification of all holdings in 1960 according to the status of the occupier showed the following position:
| Holdings at 31 January 1960 | Number | Percentage of Total |
|---|---|---|
| Owner | 44,119 | 57.35 |
| Lessee | 13,571 | 17.64 |
| Manager | 3,683 | 4.79 |
| Partner | 3,950 | 5.13 |
| Shareworker | 2,107 | 2.74 |
| Part owner, part lessee | 9,498 | 12.35 |
| Totals | 76,928 | 100.00 |
Condition of Occupied Land—In 1965, 43,497,659 acres were assessed as being occupied, including reserves and Maori lands leased, but excluding areas within borough boundaries, and holdings of less than 10 acres in extent. The land in occupation in New Zealand at 31 January 1965 was classified according to condition and use as follows.
| Use of Land | Acres | Percentage of Total |
|---|---|---|
*Includes areas sown with crops. †Includes unimproved land together with domestic orchards, residences, private gardens, and grounds. | ||
| Area in crop at 31 January | 1,044,716 | 2.40 |
| In fallow | 125,800 | 0.29 |
| In sown grasses and clovers*— | ||
| Cut for hay, seed, or silage | 19,433,357 | 44.68 |
| Not cut for hay, seed, or silage | ||
| In orchards (commercial only) | 16,569 | 0.04 |
| In market gardens and nurseries | 16,342 | 0.04 |
| In plantations | 1,034,926 | 2.38 |
| Total area in cultivation | 21,671,710 | 49.82 |
| Balance of land† | 21,825,949 | 50.18 |
| Total area in occupation | 43,497,659 | 100.00 |
Information collected in 1960 in conjunction with the World Census of Agriculture showed that 36 percent of the total area in occupation was stated as being capable of cultivation by ploughs or discs.
Land in cultivation (under crop and in pasture) forms the subject matter of Section 14—Farming. An indication of the condition and geographical distribution of unimproved land is afforded by the following table, which relates to the position at 31 January 1960.
| Land District | Phormium (New Zealand Flax) | Tussock and Naturally Established Native Grasses | Fern, Scrub, and Second Growth | Standing Native Bush | Barren and Unproductive Land | Total, Unimproved Occupied Land |
|---|---|---|---|---|---|---|
| acres | ||||||
| North Auckland | 3,575 | 107,539 | 871,412 | 263,177 | 95,023 | 1,340,726 |
| South Auckland | 1,717 | 62,322 | 1,299,029 | 687,679 | 107,206 | 2,157,953 |
| Gisborne | 65 | 116,171 | 310,830 | 178,136 | 29,368 | 634,570 |
| Hawke's Bay | 55 | 286,719 | 341,212 | 69,538 | 42,198 | 739,722 |
| Taranaki | 61 | 4,295 | 150,328 | 193,136 | 17,863 | 365,683 |
| Wellington | 7,923 | 589,474 | 672,635 | 290,726 | 126,672 | 1,687,430 |
| North Island | 13,396 | 1,166,520 | 3,645,446 | 1,682,392 | 418,330 | 6,926,084 |
| Marlborough | 5,838 | 1,407,022 | 278,281 | 112,482 | 225,566 | 2,029,189 |
| Nelson | 2,089 | 200,676 | 380,029 | 190,723 | 41,938 | 815,455 |
| Westland | 4,323 | 43,758 | 207,166 | 214,841 | 126,146 | 596,234 |
| Canterbury | 4,897 | 3,931,458 | 242,723 | 113,033 | 539,795 | 4,831,906 |
| Otago | 2,031 | 5,054,486 | 614,061 | 250.702 | 439,049 | 6,360,329 |
| Southland | 6,956 | 1,231,629 | 303,981 | 147,452 | 67,201 | 1,757,219 |
| South Island | 26,134 | 11,869,029 | 2,026,241 | 1,029,233 | 1,439,695 | 16,390,332 |
| New Zealand | 39,530 | 13,035,549 | 5,671,687 | 2,711,625 | 1,858,025 | 23,316,416 |
REGISTRATION OF LAND OWNERS—Practically all title to privately owned land and interests in land in New Zealand is held under the land transfer system administered under the Land Transfer Act 1952. This system was introduced into New Zealand by the Land Transfer Act 1870. While that Act retained some of the provisions and innovations of the Land Transfer Act 1860 which it repealed and superseded, it was largely based on the revolutionary Torrens system of registration of title devised for South Australia.
Under this land transfer system, which with certain modifications has operated in New Zealand since 1870, the title to land is not secured or effected by the mere execution of deeds or documents. Registration of a valid title is the fundamental principle, and it is only by such registration that title to land or any interest therein may pass or be obtained. The District Land Registrar appointed in and for each of the land registration districts is responsible for the registration in his district, and any person named in the register as taking an interest under a registered instrument acquires a practically indefeasible title.
No instrument or dealing may be registered unless it is in accordance with statute or general law or if forbidden by positive law. An increasing number of statutes and regulations expressly impose upon the District Land Registrar the duty and responsibility of ensuring that no instrument is registered or no interests in land are acquired in contravention of the statutory provisions and requirements regulating the aggregation and subdivision of land, the alienation of Crown land, Maori land, or public reserves, the dedication or constitution of roads, streets, and access ways, and many other matters involving Government policy.
The land transfer system has proved so successful and has provided such a reliable record of dealings with land that over the last half century there has been an increasing tendency on the part of local authorities and other statutory bodies to use its facilities to give specific notice of obligations and restrictions attaching to land by virtue of their respective statutes. When national or district scheme or drainage, irrigation, water supply, or sewerage which result in improvement to land are undertaken today, statutory authority is customarily given to charge part of the cost against the land. These charges are recorded against the titles concerned. While entries of this nature on the register were not envisaged in the original land transfer system they do ensure that a prospective purchaser, by inspection of the Register, can acquaint himself with all matters affecting the property. The land transfer registration system is also used extensively to ensure that other statutory restrictions governing the acquisition and subdivision of land and dealings with land are not contravened.
Special procedures are necessary for the registration of dealings with Crown land and Maori land and these are contained in the Land Act 1948, the Maori Affairs Act 1953, and the various related Acts respectively.
The demand for land for housing development has resulted in adaptations to the system. The normal procedures relating to subdivision title and finance have been streamlined and, as in most forms of substantial purchase today, provision made for payment by instalment. The State-sponsored group building schemes, the Housing Act 1955, and the housing provisions in the Municipal Corporations Act 1954 and the Counties Act 1956 have met this situation. Agreements for sale and purchase and occupation licences are registered today in great numbers in the same way as the traditional forms of dealing with land.
The Joint Family Homes Act introduced in 1950 provides for settlements of land as “joint family homes” and increasing use is made of this procedure year by year. (See Section 19.)
Certificates of Title Issued—The following table shows the number of certificates issued for the latest 11 years.
| Year Ended 31 March | Total |
|---|---|
| 1956 | 24,069 |
| 1957 | 22,948 |
| 1958 | 23,590 |
| 1959 | 25,521 |
| 1960 | 26,953 |
| 1961 | 29,337 |
| 1962 | 31,743 |
| 1963 | 28,764 |
| 1964 | 29,049 |
| 1965 | 35,258 |
| 1966 | 39,760 |
LAND TRANSFERS—Land transfers registered under the Land Transfer Act during the year ended 31 March 1966 totalled 71,508, and the total consideration involved was $592.6 million. These figures show that the trend of substantial increases in the number and total value of property transactions that occurred during 1963-64 and 1964-55 continued in 1965-66, although at a reduced rate. Total consideration in 1965-66 rose by 10.5 percent compared with a rise of nearly 28 percent in 1964-65 and nearly 25 percent in 1963-64.
The 2.8 percent rise in the number of transactions in 1965-66 compared with rises of over 16 percent in 1964-55 and almost 12 percent in 1963-64.
The table following shows transfers registered under the Land Transfer Act during the past 11 years.
| Year Ended 31 March | Urban Properties | Rural Properties | All Properties: Total Consideration | ||||||
|---|---|---|---|---|---|---|---|---|---|
| Number | Area | Consideration | Freehold | Total Freehold and Leasehold | |||||
| Number | Area | Consideration | Number | Consideration | |||||
| acres | $(m) | acres (000) | $(m) | $(m) | $(m) | ||||
| 1956 | 41,378 | 10,363 | 361,4 | 7,112 | 1,237 | 74.7 | 7,722 | 80.5 | 241.9 |
| 1957 | 38,066 | 9,578 | 151,2 | 6,677 | 1,205 | 72.2 | 7,268 | 78.1 | 229.4 |
| 1958 | 42,183 | 10,391 | 179,3 | 7,703 | 1,440 | 92.2 | 8,390 | 100.1 | 279.4 |
| 1959 | 41,854 | 10,283 | 170,4 | 6,796 | 1,072 | 79.2 | 7,299 | 84.8 | 255.2 |
| 1960 | 45,125 | 10,999 | 189,7 | 7,204 | 1,263 | 89.2 | 7,730 | 95.7 | 285.5 |
| 1961 | 52,233 | 16,000 | 239,8 | 8,403 | 1,710 | 124.4 | 9,179 | 135.8 | 375.6 |
| 1962 | 49,358 | 13,979 | 233,4 | 7,787 | 1,408 | 117.2 | 8,455 | 126.7 | 360.1 |
| 1963 | 46,277 | 15,108 | 237,3 | 6,782 | 1,135 | 92.5 | 7,289 | 99.1 | 336.4 |
| 1964 | 51,942 | 16,572 | 299,1 | 7,269 | 1,297 | 111.0 | 7,894 | 120.8 | 419.9 |
| 1965 | 59,983 | 18,207 | 362,7 | 8,642 | 1,589 | 156.6 | 9,565 | 173.5 | 536.2 |
| 1966 | 61,581 | 18,347 | 394,0 | 9,281 | 1,560 | 185.3 | 9,927 | 198.6 | 592.6 |
The numbers of transfers shown in the table relate only to transfers of land on sale, i.e., they do not include transfers of land from trustees to beneficiaries or to new trustees, transfers of mortgages, easements, etc.
Regarding all land transfer statistics a word of caution is necessary. Very diverse types of property are included in the land transfer figures, and consequently the averages should not be taken for more than they purport to show, e.g., average consideration figures per acre for rural freehold properties should not be taken as representing average prices per acre for farm property.
In the case of town and suburban properties, however, the numbers involved are probably sufficient to smooth out changes from year to year in the proportions of different classes of property included in the total.
URBAN LAND TRANSFERS—The following table shows urban land transfers by consideration group for the year ended 31 March 1966. A table for the previous year is included for purposes of comparison. The land transfers are also broken down into freehold and leasehold transactions. The majority of both urban and rural transactions are freehold.
| Consideration Group | Freehold | Leasehold | All Urban Transfers | ||||||
|---|---|---|---|---|---|---|---|---|---|
| Number | Total Consideration | Average Consideration | Number | Total Consideration | Average Consideration | Number | Total Consideration | Average Consideration | |
| $ | $(000) | $ | $(000) | $ | $(000) | $ | |||
| 1964-65 | |||||||||
| Under 2,000 | 17,520 | 20,430 | 1,166 | 397 | 336 | 848 | 17,917 | 20,768 | 1,160 |
| 2,000-2,999 | 5,771 | 13,726 | 2,378 | 133 | 316 | 2,374 | 5,904 | 14,042 | 2,378 |
| 3,000-3,999 | 4,038 | 13,728 | 3,400 | 101 | 342 | 3,384 | 4,139 | 14,070 | 3,400 |
| 4,000-9,999 | 22,596 | 152,894 | 6,766 | 553 | 3,642 | 6,586 | 23,149 | 156,534 | 6,762 |
| 10,000-19,999 | 7,070 | 89,944 | 12,722 | 199 | 2,594 | 13,038 | 7,269 | 92,538 | 12,730 |
| 20,000-49,999 | 1,267 | 35,362 | 27,910 | 48 | 1,342 | 27,974 | 1,315 | 36,706 | 27,914 |
| 50,000-199,999 | 267 | 21,772 | 81,544 | 7 | 642 | 91,754 | 274 | 22,414 | 81,804 |
| 200,000 and over | 15 | 5,348 | 356,546 | 1 | 252 | 252,000 | 16 | 5,600 | 350,012 |
| Totals | 58,544 | 353,204 | 6,034 | 1,439 | 9,466 | 6,580 | 59,983 | 362,672 | 6,046 |
| 1965-66 | |||||||||
| Under 2,000 | 16,726 | 19,796 | 1,184 | 402 | 332 | 824 | 17,128 | 20,126 | 1,176 |
| 2,000-2,999 | 5,930 | 14,106 | 2,378 | 126 | 300 | 2,374 | 6,056 | 14,406 | 2,378 |
| 3,000-3,999 | 4,077 | 13,814 | 3,388 | 106 | 366 | 3,450 | 4,183 | 14,180 | 3,390 |
| 4,000-9,999 | 22,773 | 156,208 | 6,860 | 525 | 3,590 | 6,836 | 23,298 | 159,798 | 6,858 |
| 10,000-19,999 | 8,855 | 113,336 | 12,800 | 241 | 3,210 | 13,318 | 9,096 | 116,546 | 12,812 |
| 20,000-49,999 | 1,452 | 40,202 | 27,688 | 73 | 2,122 | 29,058 | 1,525 | 42,324 | 27,754 |
| 50,000-199,999 | 264 | 21,000 | 79,548 | 16 | 1,082 | 67,590 | 280 | 22,082 | 78,864 |
| 200,000 and over | 13 | 3,988 | 306,724 | 2 | 516 | 258,184 | 15 | 4,504 | 300,252 |
| Totals | 60,090 | 382,450 | 6,366 | 1,491 | 11,518 | 7,722 | 61,581 | 393,964 | 6,398 |
In general, transactions included in the under $2,000 group would involve vacant sections, although many building sections are now priced above this level.
Urban land transfers involving consideration between $2,000 and $19,999 would be, in the main, residential properties, although the group would include a considerable number of building sections, particularly in the main urban areas.
The $4,000-$9,999 group would include a very large number of the residential properties that changed hands during the year 1965-66. Almost 38 percent of the total number of urban land transfers were in this group.
The number of transactions in the $10,000-$19,999 group has increased substantially during the past two years, probably as a result of higher prices paid for residential properties.
The range of transactions involving $20,000 or above would represent mainly commercial and industrial properties, although increasing numbers of residential properties will be included near the lower end of the range. The lowest group in the range—that of transactions involving $20,000 to $49,999—is the only group in the range to show increases in either number of transactions or total consideration in the latest year, and these increases are relatively modest.
Both the higher amount groups in the $20,000 and over range showed slight falls in 1965-66. The number of transactions in the $50,000-$199,999 group was 280 in 1965-66, a fall of 6 compared with a rise of 78 in 1964-65, while total consideration was $22.1 million compared with $22.4 million in 1964-65.
Transactions in the $200,000 and over group fell from 24 with a total consideration of $17.0 million in 1963-64 to 16 (consideration $5.6 million) in 1964-65, and again to 15, involving $4.5 million, in 1965-66. In the latest year, the money involved in these large-scale transactions amounted to only a little over 1 percent of the total amount involved in urban property transactions.
The following table shows urban land transfers by land registration districts. The continued growth of Auckland urban area is reflected in the figures referring to North Auckland Land Registration District.
| Land Registration District | 1964-65 | 1965-66 | ||||
|---|---|---|---|---|---|---|
| Number | Area | Consideration | Number | Area | Consideration | |
| acres | $(000) | acres | $(000) | |||
| North Auckland | 20,704 | 5,378 | 137,928 | 21,218 | 5,424 | 150,006 |
| South Auckland | 7,708 | 2,881 | 39,524 | 8,562 | 3,043 | 46,592 |
| Gisborne | 544 | 287 | 2,510 | 659 | 240 | 3,600 |
| Hawke's Bay | 1,962 | 472 | 10,682 | 2,214 | 1,331 | 13,112 |
| Taranaki | 1,389 | 348 | 6,960 | 1,387 | 336 | 8,132 |
| Wellington | 11,419 | 3,582 | 80,582 | 11,676 | 3,549 | 86,176 |
| Marlborough | 547 | 213 | 2,576 | 542 | 233 | 2,876 |
| Nelson | 1,233 | 692 | 6,166 | 1,427 | 481 | 7,272 |
| Westland | 336 | 92 | 978 | 349 | 107 | 1,072 |
| Canterbury | 8,452 | 1,888 | 46,466 | 7,832 | 1,724 | 45,294 |
| Otago | 3,912 | 1,847 | 19,544 | 3,877 | 1,340 | 20,008 |
| Southland | 1,777 | 528 | 8,760 | 1,838 | 541 | 9,824 |
| Totals | 59,983 | 18,207 | 362,672 | 61,581 | 18,347 | 393,964 |
Rural Land Transfers—The following analysis shows, for 1965-66, transfers of country freehold properties classified by size groups. The average consideration per acre for the previous year is given in parentheses. Statistics by size groups are available for freehold land transfers only, but these comprise the great proportion of transfers.
| Size Group (Acres) | Number | Area | Total Consideration | Average Consideration Per Acre | |
|---|---|---|---|---|---|
| acres | $(000) | $ | $ | ||
| Under 30 | 3,992 | 30,659 | 35,868 | 1,169.94 | (1,114.04) |
| 30-49 | 630 | 25,127 | 9,280 | 369.30 | (300.54) |
| 50-99 | 1,236 | 91,702 | 24,328 | 265.30 | (234.20) |
| 100-149 | 926 | 111,546 | 24,638 | 220.88 | (185.18) |
| 150-249 | 928 | 180,735 | 27,566 | 152.52 | (137.10) |
| 250-499 | 849 | 298,409 | 30,732 | 102.98 | (95.00) |
| 500 and over | 720 | 821,843 | 32,840 | 39.96 | (32.92) |
| Totals | 9,281 | 1,560,019 | 185,252 | 118.76 | (98.54) |
These transactions would mainly involve farms and farm land. Compared with the previous year, the area of rural freehold land sold in 1965-66 showed a decrease of almost 2 percent. However, the 1964-65 figure of 1,588,903 acres was unusually high, representing an increase of almost 23 percent over the 1963-64 total. The area of rural freehold land sold in 1965-66 is the third highest annual total in the last decade, being exceeded only in 1964-65 and 1960-61.
The 2 percent decrease in area in the latest year was coupled with a sharp increase in total consideration from $156.6 million in 1964-65 to $185.3 million in 1965-66, resulting in a rise of over $20 (18 percent) in average consideration per acre.
Further particulars relating to transfers of country freehold properties are contained in the next table.
| Year Ended 31 March | Average Value per Transaction | Average Value per Acre |
|---|---|---|
| 1954 | 8,670 | 53.38 |
| 1955 | 10,100 | 51.54 |
| 1956 | 10,508 | 60.42 |
| 1957 | 10,810 | 59.88 |
| 1958 | 11,972 | 64.06 |
| 1959 | 11,660 | 73.94 |
| 1960 | 12,376 | 70.60 |
| 1961 | 14,798 | 72.72 |
| 1962 | 15,044 | 83.18 |
| 1963 | 13,634 | 81.44 |
| 1964 | 15,268 | 85.54 |
| 1965 | 18,116 | 98.54 |
| 1966 | 19,960 | 118.76 |
Differences exist in average consideration, average value per transaction, and average acreage per transaction in sales of rural freehold property in the North Island and in the South Island. The following table shows the figures for the two Islands for the year ended 31 March 1966. It will be noted that the average consideration per acre for properties of below 150 acres in extent was lower in the South Island, while for properties of 150 acres or above the average consideration in the South Island was above that in the North Island.
| Item | Size Group (Acres) | Total Acreage | ||||||
|---|---|---|---|---|---|---|---|---|
| Under 30 | 30-49 | 50-99 | 100-149 | 150-249 | 250-499 | 500 and over | ||
| Average consideration per acre by size group— | ||||||||
| North Island $ | 1,224.62 | 396.92 | 278.28 | 228.70 | 149.00 | 92.34 | 34.26 | 125.30 |
| South Island $ | 1,054.24 | 289.62 | 217.38 | 193.40 | 159.62 | 118.60 | 48.56 | 107.34 |
| New Zealand $ | 1,169.94 | 369.30 | 265.30 | 220.88 | 152.52 | 102.98 | 39.96 | 118.76 |
| Average value per transaction by size group— | ||||||||
| North Island $ | 10,162 | 15,892 | 20,742 | 27,474 | 28,802 | 32,258 | 38,904 | 19,915.6 |
| South Island $ | 6,996 | 11,424 | 15,856 | 23,524 | 31,568 | 42,064 | 55,850 | 20,052.2 |
| New Zealand $ | 8,986 | 14,730 | 19,684 | 26,608 | 29,704 | 36,196 | 45,612 | 19,960.4 |
| Average area per transaction by size group— | ||||||||
| North Island acres | 8 | 40 | 75 | 120 | 193 | 349 | 1,136 | 158.9 |
| South Island acres | 7 | 39 | 73 | 122 | 198 | 355 | 1,150 | 136.8 |
| New Zealand acres | 8 | 40 | 74 | 120 | 195 | 351 | 1,141 | 168.1 |
In 1965-66 rural freehold land transfers in the North Island totalled 6,234, involving 990,860 acres of land and a total consideration of $124.2 million, as compared with the 1964-65 figures of 5,593 transfers, involving 979,800 acres and a total consideration of $103.8 million. Thus, the acreage increased by a little over 1 percent, and the consideration by nearly 20 percent.
South Island rural freehold land transfers in 1965-66 numbered 3,047, involving 569,160 acres, and a total consideration of $61,100,000. Compared with the 1964-65 South Island figures this was virtually the same number of transactions (3,047 as against 3,049), a decrease in acreage (569,160 acres as against 609,070 acres in 1964-65), and a 15.6 percent increase in consideration ($61.2 million as against $52.8 million).
In the year ended 31 March 1966 the value of all rural land transfers, freehold and leasehold, for the first time approached $200 million. The actual figure, $198,632,000, represented an increase of 14.5 percent over the previous year's total of $173,502,000. In two years the annual value figure for rural land transfers has increased by over 64 percent—from $120.8 million in 1963-64 to $198.6 million in 1965-66.
The following table shows all rural land transfers, freehold and leasehold, by land registration districts for the year ended 31 March 1966.
| Land Registration District | Freehold | Leasehold | Total | ||||||
|---|---|---|---|---|---|---|---|---|---|
| Number | Area | Consideration | Number | Area | Consideration | Number | Area | Consideration | |
| Acres (000) | $(000) | Acres (000) | $(000) | Acres (000) | $(000) | ||||
| Northland | 2,379 | 246 | 38,098 | 44 | 9 | 616 | 2,423 | 255 | 38,714 |
| South Auckland | 1,690 | 275 | 42,236 | 27 | 5 | 382 | 1,717 | 281 | 42,618 |
| Gisborne | 258 | 95 | 3,366 | 31 | 14 | 472 | 289 | 108 | 3,838 |
| Hawke's Bay | 426 | 78 | 9,452 | 48 | 19 | 1,112 | 474 | 97 | 10,564 |
| Taranaki | 511 | 81 | 10,062 | 61 | 18 | 1,252 | 572 | 99 | 11,312 |
| Wellington | 970 | 215 | 20,940 | 92 | 39 | 1,772 | 1,062 | 255 | 22,714 |
| Marlborough | 309 | 40 | 3,310 | 50 | 24 | 758 | 359 | 64 | 4,066 |
| Nelson | 376 | 48 | 3,186 | 49 | 19 | 368 | 425 | 68 | 3,556 |
| Westland | 38 | 9 | 366 | 17 | 5 | 176 | 55 | 14 | 542 |
| Canterbury | 1,184 | 213 | 26,258 | 61 | 43 | 1,776 | 1,245 | 256 | 28,036 |
| Otago | 519 | 122 | 11,180 | 119 | 90 | 3,446 | 638 | 213 | 14,626 |
| Southland | 621 | 136 | 16,798 | 47 | 21 | 1,248 | 668 | 157 | 18,046 |
| Totals | 9,281 | 1,560 | 185,252 | 646 | 306 | 13,378 | 9,927 | 1,866 | 198,632 |
LEGISLATION CONCERNING LAND DEVELOPMENT, SETTLEMENT, AND SALE OF LAND—Legislation governing this aspect is found in the Land Act 1948, the Land Settlement Promotion Act 1952, and the Marginal Lands Act 1950. The Land Act provides for the administration, development, and disposal of Crown lands and authorises the purchase and development of private land for settlement purposes. The Land Settlement Promotion Act provides for the closer settlement of farm land by preventing the undue aggregation of land and providing for the acquisition of farm land that is, or when subdivided will be, capable of substantially increased production. The Marginal Lands Act 1950 assists farmers to restore, maintain, and increase production on marginal lands, by providing finance where it is not available through normal lending channels.
Land Settlement Promotion Act 1952—Part I of the Act authorises the Minister of Lands to take in certain circumstances any farm land that is suitable for settlement, and is, or when subdivided and developed will be, capable of substantially increased production. Land cannot be taken from any person owning less than the equivalent of two economic farms, and provision is also made for the retention of land for the owner's children. The owner may object to a Land Valuation Committee or the Land Valuation Court to the taking of land. The Court may also be called in to assess compensation for land taken if the owner does not accept the Crown's offer.
Part II deals with the control of sales and leases of farm land to prevent undue aggregation. The Act applies to sales of freehold farm land and, with certain exceptions, to leases of farm land for terms of three years or more. The consent of the Land Valuation Court is required to such transactions unless the purchaser or lessee files a declaration with the District Land Registrar within one month of the date of the transaction to the effect that he owns no farm land, has no interest in any estate or trust owning farm land, has not since the passing of the Act transferred any farm land to any person as trustee or created any trust in respect of farm land, and that he has entered into the transaction solely on his own behalf.
The Act prevents, without the consent of the Land Valuation Court or Committee, the purchase of farm land by a trustee for any person under the age of 17 years, or the purchase by a company or trustee for a company to be formed where the shareholders are less than 10 in number and any member of such company is under the age of 17 years or where shares will be held in trust for any person under that age at the date of the transaction.
Marginal Lands Act 1950—The administration of the Act is the responsibility of the Minister of Lands and is carried out by the Department of Lands and Survey. Actual control is vested in the Marginal Lands Board. To assist it in the administration of the Act the Board has appointed Marginal Lands Committees in each land district. Each committee consists of three members—the Commissioner of Crown Lands for the land district, who is chairman, an officer of the Department of Agriculture, and one other person selected from a panel of farmers appointed for each committee. The farming members are selected for their experience in the farming or management of marginal lands.
The Board is empowered to make loans for the purchase of additional land, refinance, development—in fact for any purpose having for its object the successful development and farming of a property regarded as suitable for a loan.
It is the policy of the Board not to compete with existing lending institutions and before it will make an advance the applicant must satisfy the Board that finance cannot be obtained through normal business channels. The Board will not normally provide finance for the improvement of a property unless it is capable of being developed into an economic unit. The policy is to assist competent men to make their holdings economic rather than help farmers already substantially established to bring into production additional land which could be developed from their private resources or out of revenue.
The scheme is achieving its objective of increasing production from marginal country. Many farmers on difficult and unattractive properties have, with Marginal Lands Board assistance and with application and energy established and maintained profitable production. Many have completed their development programmes and, as a result, have been able to convert their current account mortgages to instalment mortgages, repaying the advances over a term of years, while other have repaid their advances in full.
An estimate of the area of grassing undertaken with Marginal Lands Act finance is 150,000 acres with increases in carrying capacity estimated at 348,500 sheep, 18,000 run cattle, and 15,500 dairy cows.
For the year ended 31 March 1966 the Board granted 103 loans totalling $2,473,428. In all, from the inception of the marginal lands scheme, 1,279 loans have been approved, amounting to $14,911,228.
The present rates of interest payable on advances are:
| Current account first mortgage | 5 percent. |
| Current account second and subsequent mortgages | 5 1/2 percent. |
| Instalment mortgage, first | 5 1/2 percent, reducible to 5 percent. |
| Instalment mortgage, second and subsequent mortgages | 6 percent, reducible to 5 1/2 percent. |
SOIL CONSERVATION AND RIVERS CONTROL—The problem of damage by flooding and soil erosion, and of exhausted soils on hill country, deteriorating pastures, and increasing run-off led to the enactment of the Soil Conservation and Rivers Control Act 1941. This provided for the establishment of the Soil Conservation and Rivers Control Council, and catchment boards in problem districts. There are 13 catchment boards and three catchment commissions and the Waikato Valley Authority, covering three-quarters of New Zealand.
River Control—New Zealand has a generous and well distributed rainfall exceeding 45 in. over about 70 percent of the country, and has only a very small area with less than 25 in. In some districts, such as the West Coast of the South Island and the western central plateaus of the North Island, annual rainfall exceeds 100 in., with extremes over 200 in.
The topography and soils over most of the country generally favour high run-off, both on total annual flow and peak flood discharges. There are, however, some areas in the North Island where flood peaks are greatly reduced by porous pumice soils, while on some river systems natural lake storage in headwaters helps to control flooding. Severe storms are likely to occur at any season of the year and extreme falls have been experienced of 12 in. to 20 in. in 24 hours in certain areas. It is therefore not surprising that flood control is a major problem in New Zealand, with total run-off and peak flood discharges being among the highest in the world.
With the passing of the Act and the setting up of catchment boards with their specialist staff, great progress has been made with river control throughout the country. Action has naturally been focused first on the major river valleys where there has been a history of severe flood damage and where the property owners have been able to meet their share of the cost. Schemes are now in hand, or planned, in the lower reaches of most of the major problem rivers. Schemes range from channel clearing, training, and bank protection, with partial flood protection up to 5-10-year frequency, to complete protection with stopbanks up to floods of 100-year frequency. Such schemes may involve expenditure up to $5,000,000, and subsidies vary generally from $1 for $1 to $3 for $1 or more depending on the capacity of the property owners to meet their share of the cost.
The policy of the Soil Conservation and Rivers Control Council is to encourage soil conservation as complementary to river control. In the case of two large river schemes and several smaller schemes planning has included the whole catchment. As farmers become aware of the benefits of soil conservation work comprehensive planning for other river catchments will follow.
There are many rivers in New Zealand where major control systems cannot be justified at the present time, but where a great many smaller individual works covering clearing, training works, bank protection, minor stopbanking, and the like are being carried out. Such works primarily serve to hold the river in check and prevent serious deterioration until such time as more comprehensive planning can be justified. Type and cost of works have to be related to the financial capacity of the area. Subsidies are generally $2 for $1 but may be up to $3 for $1 Continuity of control and maintenance is of greatest importance in river work and the Council therefore encourages the planning of comprehensive schemes where rating districts are established to ensure the meeting of capital charges and adequate future maintenance.
Most of the major river-control works are carried out by catchment boards, the Waikato Valley Authority, or river boards, but smaller works are also carried out by Ministry of Works, counties, and drainage boards.
Drainage—The high rainfall and run-off factors indicated above have created drainage problems in many areas, particularly in low-lying sections of valleys where river gradients are flat or in coastal areas. Drainage works are often carried out in conjunction with river-control schemes and include floodgates and pumping stations. Particularly in the North Island, there are large areas of peat swamps that pose a special problem of development because the danger of excessive shrinkage with overdrainage necessitates careful control of the water level. These areas have been largely held and developed by the Lands and Survey Department.
Drainage work is generally more straightforward with quicker returns, and subsidies rarely exceed $1 for $1. Only community drains giving benefit to more than one owner qualify for subsidy. Drain maintenance is also subsidised to encourage a higher standard of maintenance, the subsidy usually being $1 for $2.
Drainage works are carried out primarily through catchment authorities, Waikato Valley Authority, and a large number of drainage boards, but are also carried out by the Ministry of Works on behalf of the Lands and Survey Department and by counties. It is emphasised that drainage works must be properly co-ordinated with river works.
Soil Conservation—Soil erosion and flooding problems have their origin on the hill-country pastoral lands, especially where farming has forced grass to take over the protective functions of vigorous native forest, scrub, fern, and swamp vegetation. The changes in the vegetation brought about by developing farm resources have been reflected in drastic changes in the soil in the hill country. The protective, stabilising, and water-controlling combination of vigorous native vegetation, litter, and spongy soil has given way to a shallow-rooted, less protective carpet of grass on compacted, impervious, and often exhausted soils. The problem is one of restoring an erosion-resistant and water-absorbent combination of soil and vegetation with a satisfactory capacity to control water, which causes most soil erosion. Successful techniques which have been developed include spelling, control of burning and of animal pests, oversowing, topdressing, strict grazing control, the wider use of cattle, subdivisional fencing, stock water ponds, gully-control, contour ploughing, terraces, grassed waterways, and spaced and close tree planting for stability.
To assist farmers directly to tackle their own problems subsidies are made on farmers' contributions. These are from $1 for $1 to $2 for $1 on tree planting for stability and wind breaks, materials for conservation fencing, contouring, or flood-control dams, and on gully-control planting and structures.
Land Capability and Catchment Control—Experience has proved that the American system of land classification for soil conservation purposes is very satisfactory. In this system an inventory is made of the physical factors of slope, soil type, climate, and soil erosion. Along with a knowledge of vegetation and farming experience a land capability map is prepared classifying the land into classes according to the way in which the land in each class can be used. The required soil conservation practices are also determined for each class.
From this basic classification of the land in a catchment more detailed surveys of individual farms provide the data necessary for detailed conservation farming plans. These plans are then discussed with the farmer and fitted into his capacity for implementing them over a period of years. Great care is taken to support the necessary special soil conservation practices with accepted good farm management practices. The conservation treatment and farm management practice can then be dovetailed with the river control and drainage plans for the lower catchment to provide the ultimate plan for catchment control. Allied operations of importance are soil conservation forestry, fire prevention, and animal pest destruction.
Plans have now been developed in this country to integrate farming practices with the physical limitations of the land in order to assure permanent production consistent with stability and permanence of the land and conservation of the rain that falls.
Agricultural Aviation—The Soil Conservation and Rivers Control Council has an advisory committee on agricultural aviation, which since 1949-50 has sponsored new developments in aviation for conservation purposes. The promotion of aerial topdressing, aerial oversowing with grasses and clovers, dropping of fencing materials, and spreading of rabbit poison is enabling millions of acres of denuded and eroded high country to receive conservation treatment progressively. These aerial aids to farming, coupled with the wider adoption of provident management practices on the land, provide a practical soil conservation approach with great potentialities on the dominantly hilly problem lands.
Staffing and Finance—The Ministry of Works provides the technical and administrative services required by the Council. The Council and the catchment boards have built up a team of specialist engineers and soil conservators, which ensures that investigations, planning, supervision, and execution of works are carried out to high standards.
An administrative charge of up to 1/30c in the dollar on capital value over the district provides for the services of catchment boards, but special rates struck on a classification according to the benefit accruing provide the local contribution for actual works.
Public Relations—The Soil Conservation and Rivers Control Council sponsors information services by way of publications, movie films, show displays, and radio broadcasts.
Publications—A list of the soil conservation, hydrological, and other publications available may be obtained by writing to the Secretary, Soil Conservation and Rivers Control Council, P.O. Box 12-041, Wellington North, New Zealand.
GENERAL—There are 15.2 million acres of Crown land which are held under lease or licence by individuals for farming or other purposes. Crown land permanently set aside for national parks, reserves, and domains comprises 6.2 million acres. The Department of Lands and Survey is also developing 1.1 million acres of land for subdivision and settlement as individual farms. Unoccupied Crown land can be broadly defined as land vested in the Crown which is not for the time being set aside for any public purpose, held by any person in fee simple or on lease or licence, or under development by the Department of Lands and Survey.
The total area of New Zealand, excluding the island territories, is 66,390,700 acres. However, only a small proportion of this area remains unoccupied in the ownership of the Crown land beyond the boundaries of national parks, reserves, domains and State forests. The following table illustrates this fact, and, further, shows that this small proportion is decreasing with time.
| Category | 1955 | 1965 |
|---|---|---|
| (acres) | ||
| Occupied farm land | 43,355,869 | 43,497,659 |
| Land in cities and boroughs | 332,360 | 387,026 |
| National parks, reserves, and domains | 4,528,405 | 6,192,009 |
| State forests | 9,636,262 | 9,884,360 |
| Unoccupied (includes waste land such as mountain tops, bare rock, water surfaces, roads, etc.) | 8,537,804 | 6,429,646 |
| Totals | 66,390,700 | 66,390,700 |
The Land Settlement Board, through the Department of Lands and Survey, disposes of Crown land for farming, urban, commercial, and industrial purposes. The demand for this land, particularly farm land, and for the other categories in and near to the main centres, has been considerable for some years and shows no sign of diminishing. What is diminishing, however, is the Crown's reserve of land suitable for subdivision and settlement. This has almost disappeared, and would in fact do so were it not for the fact that the Land Act 1948 gives the Land Settlement Board authority to purchase private land or the interest of any lessee or licensee in any Crown land or Maori land for the purposes of settlement as farming, urban, commercial, industrial, or pastoral land. In the last 10 years, 513,689 acres have been purchased under this provision, while 410,656 acres have been disposed of. Much of the balance of almost 100,000 acres is farm land which was in a reverted condition at the time of purchase and requires long-term development before it can be subdivided into what would be economic farms.
A further provision for the acquisition of land is contained in the Land Settlement Promotion Act 1952. This gives power to the Minister of Lands, under certain conditions, to take any farm land suitable for settlement where additional farm land is required for the settlement of landless discharged servicemen and others requiring land on which to establish themselves in farming. This provision has not been operated however.
ADMINISTRATION—Crown land is administered under the authority of the Land Act 1948. The Minister of Lands is charged with the administration of the Land Act, and his executive officer is the Director-General of Lands, who is the Permanent Head of the Department of Lands and Survey. New Zealand is divided into 12 land districts, the executive officer for each district being a Commissioner of Crown Lands.
The central authority under the Land Act is the Land Settlement Board consisting of the Minister of Lands (Chairman), the Director-General of Lands (Deputy Chairman), the Secretary to the Treasury, the Director-General of Agriculture, the Valuer-General, a representative of the State Advances Corporation, the Assistant Director-General of Lands, the Fields Director of the Department of Lands and Survey, and not more than two other persons appointed by the Governor-General.
The Land Settlement Board is required to appoint one or more Land Settlement Committees for each land district, and 20 of these committees have been set up. Each committee consists of three members with the Commissioner of Crown Lands for the land district as chairman and two private farmer members.
DISPOSAL OF CROWN LAND—Crown land is normally offered to the public at valuation and if necessary a ballot is conducted to decide the successful applicant, although in certain circumstances preferential allotment can be made. Any land may, however, be offered for disposal by tender at a minimum price or rental value or by public auction at an upset price. Crown land may be acquired on the following tenures:
Farm land, urban land, commercial or industrial land—(a) On renewable lease; (b) for cash; (c) on deferred payments. A renewable lease is for a term of 33 years with a perpetual right of renewal for the same term and, except where otherwise provided for, with a right of acquiring the fee simple.
Pastoral land—(a) On pastoral lease for a term of 33 years with a perpetual right of renewal for the same term, but with no right of acquiring the fee simple; (b) on pastoral occupation licence for a term not exceeding 21 years, with no right of renewal or of acquiring the fee simple.
Short tenancies for grazing or other purposes for a term not exceeding five years.
SELECTIONS—The following table shows details of the various freehold selections during the year 1965-66, together with totals for 1964-65.
| Freehold | Number of Selectors | Total Area Selected | Purchase Price |
|---|---|---|---|
| acres | $ | ||
| Crown lands— | |||
| Farm | 334 | 7,444 | 103,730 |
| Urban | 293 | 179 | 329,564 |
| Commercial or industrial | 29 | 38 | 162,982 |
| Land Subdivision in Counties Act | 7 | 4 | 3,320 |
| Totals, 1965-66 | 663 | 7,665 | 599,596 |
| Totals, 1964-65 | 737 | 8,183 | 799,778 |
Corresponding details concerning selections made under leasehold tenures are given for similar periods.
| Leases and Licences | Number of Selectors | Total Area Selected | Annual Rental | Annual Instalment |
|---|---|---|---|---|
| * Areas and rents not shown; licences on royalty basis only. | ||||
| Crown lands— | ||||
| Renewable leases— | acres | $ | $ | |
| Farm | 77 | 56,856 | 29,828 | 110 |
| Urban | 26 | 6 | 1,794 | ... |
| Commercial or industrial | 17 | 973 | 10,152 | ... |
| Pastoral leases | 6 | 140,155 | 4,020 | ... |
| Pastoral occupation licences | 1 | 53,470 | 10 | ... |
| Deferred-payment licences— | ||||
| Farm | 131 | 40,946 | ... | 58,038 |
| Urban | 876 | 271 | ... | 127,508 |
| Commercial or industrial | 38 | 138 | ... | 10,914 |
| Land Subdivision in Counties Act | 30 | 8 | ... | 3,486 |
| Special leases (section 67, Land Act) | 60 | 7,984 | 17,272 | 444 |
| Licences for removal of minerals* | 54 | ... | ... | ... |
| Licences to occupy | 1,635 | 44,885 | 172,974 | ... |
| Totals | 2,951 | 345,692 | 236,050 | 200,500 |
| Endowment and other lands— | ||||
| Leases under section 48, Land Act | 46 | 3,523 | 9,834 | ... |
| Westport Harbour Board | 9 | 18 | 64 | ... |
| Sundry endowment leases | 68 | 27,297 | 6,918 | 1,046 |
| Grand totals, 1965-66 | 3,074 | 376,530 | 252,866 | 201,546 |
| Grand totals, 1964-65 | 3,369 | 190,438 | 354,268 | 197,672 |
LEASES AND LICENCES CURRENT AT 31 MARCH 1966—The following table shows the total number of leases and licences current at 31 March 1966. This table is in two parts, the first (a), dealing with leases and licences issued under the Land Act 1948, and the second (b), with those issued under Acts other than the Land Act 1948 and still current at 31 March 1966.
| Tenure | Number | Area | Annual Rent | Annual Instalment (Including Improvement Loading) |
|---|---|---|---|---|
| *Areas and rents not shown; licences on royalty basis only. | ||||
| (a) Tenures Under the Land Act 1948 | ||||
| Crown lands— | acres | $ | $ | |
| Renewable leases— | ||||
| Farm | 4,977 | 2,657,495 | 974,142 | 21,146 |
| Urban | 2,590 | 890 | 101,744 | 252 |
| Commercial or industrial | 80 | 140 | 46,962 | 262 |
| Pastoral leases | 478 | 7,241,218 | 192,744 | 2,674 |
| Pastoral occupation licences | 51 | 407,820 | 6,332 | ... |
| Deferred-payment licences— | ||||
| Farm | 1,682 | 693,653 | ... | 525,726 |
| Urban | 11,776 | 3,148 | ... | 1,214,718 |
| Commercial or industrial | 415 | 3,050 | ... | 272,290 |
| Land Subdivision in Counties Act | 1,084 | 253 | ... | 113,166 |
| Special leases (section 67, Land Act)— | ||||
| Renewable— | ||||
| Farm | 216 | 50,180 | 17,916 | 1,810 |
| Urban | 15 | 18 | 40,500 | 100 |
| Commercial or industrial | 141 | 4,522 | 84,048 | 456 |
| Non-renewable— | ||||
| Farm | 93 | 52,183 | 13,080 | 448 |
| Urban | 17 | 40 | 568 | ... |
| Commercial or industrial | 15 | 114 | 67,518 | ... |
| Licences for removal of minerals* | 220 | ... | ... | ... |
| Flax leases | 5 | 1,057 | 32 | 830 |
| Communal grazing licences | 2 | 244 | 108 | ... |
| Miscellaneous licences | 4,891 | 390,879 | 255,922 | ... |
| Totals, Crown lands | 28,748 | 11,506,904 | 1,801,616 | 2,153,878 |
| Endowment and other lands— | ||||
| Leases under section 169, Land Act | 45 | 4,102 | 1,552 | ... |
| Leases under section 48, Land Act | 295 | 49,559 | 53,204 | 6,026 |
| Leases under section 47, Land Act | 9 | 86 | 2,112 | ... |
| Westport Harbour Board Endowment | 111 | 3,405 | 492 | ... |
| Sundry endowment leases | 219 | 220,353 | 19,438 | 1,046 |
| Totals, tenures under Land Act 1948 | 29,427 | 11.784,409 | 1,878,414 | 2,160,950 |
| Tenure | Number | Area | Annual Rent | Annual Instalment (Including Improvement Loading) |
|---|---|---|---|---|
| (b) Tenures Under Acts Other Than the Land Act 1948 | ||||
| acres | $ | $ | ||
| Crown lands— | ||||
| Renewable leases | 4,670 | 1,300,069 | 284,270 | 3,474 |
| Leases under section 5, Discharged Soldiers' Settlement Amendment Act 1921-22 | 2 | 280 | 126 | ... |
| Special tenure leases | 317 | 119,283 | 28,180 | 138 |
| Leases in perpetuity | 6,346 | 1,288,171 | 306,816 | 552 |
| Mining district land occupation leases | 24 | 80 | 60 | ... |
| Pastoral regulation licences (mining districts) | 11 | 1,708 | 102 | .. |
| Small grazing-run leases | 4 | 21,301 | 1,208 | ... |
| Pastoral-run licences | 38 | 576,229 | 9,718 | ... |
| Education reserves: Public Bodies Leases Act | 123 | 7,288 | 3,556 | 66 |
| Deferred-payment licences | 344 | 87,537 | ... | 36,372 |
| Small-farm tenures | 1 | 65 | 4 | ... |
| Leases under Education Lands Act— | ||||
| Leases | 44 | 6,057 | 10,752 | 232 |
| Temporary tenancies | 4 | 5 | 66 | ... |
| Hanmer Crown leases | 27 | 8 | 220 | ... |
| Former mining tenures (over Crown land) | 2,424 | 1,168 | 2,244 | ... |
| Sundry leases | 41 | 1,963 | 1,188 | ... |
| Totals, Crown lands | 14,420 | 3,411,212 | 648,510 | 40,834 |
| Endowment and other lands— | ||||
| Westport Harbour Board Endowment | 546 | 8,867 | 5,988 | ... |
| Thermal Springs licences | 34 | 26 | 178 | ... |
| Sundry other endowments | 234 | 27,117 | 10,716 | ... |
| Former mining tenures— | ||||
| Over Maori land | 35 | 14 | 54 | ... |
| Over freehold land | 20 | 10 | 36 | ... |
| Over endowments | 22 | 13 | 14 | ... |
| Miscellaneous licences | 889 | 31,668 | 13,850 | 1,092 |
| Totals, tenures under Acts other than Land Act 1948 | 16,200 | 3,478,927 | 679,346 | 41,926 |
| Grand totals, all tenures | 45,627 | 15,263,336 | 2,557,760 | 2,202,876 |
LEASES AND LICENCES FREEHOLDED—Over the past few years many Crown lessees have availed themselves of the provisions of the Land Act 1948 and have freeholded their on the land will be found in Section 6B, Rehabilitation.
In 1965-66, 796 leases were freeholded, either for cash or on deferred payments. The area covered by these leases was 131,514 acres and the total purchase price $2,917,178, of which $2,465,926 was on deferred payments. These figures are an increase on those for 1964-65, when 615 leases over 102,662 acres were freeholded for a total of $1,570,572.
| Leases and Licences Freeholded | Purchased for Cash | Purchased on Deferred Payments | ||||
|---|---|---|---|---|---|---|
| Number | Area | Purchase Price | Number | Area | Purchase Price | |
| Crown lands— | acres | $ | acres | $ | ||
| Farm | 89 | 23,638 | 332,322 | 210 | 107,512 | 1,833,050 |
| Urban | 391 | 208 | 91,196 | 72 | 54 | 123,230 |
| Commercial or industrial | 13 | 3 | 3,840 | 8 | 10 | 508,700 |
| Totals, Crown lands | 493 | 23,849 | 427,358 | 290 | 107,576 | 2,464,980 |
| Endowment and other lands— | ||||||
| Farm | 1 | 85 | 90 | - | - | - |
| Urban | 11 | 3 | 23,804 | 1 | 1 | 946 |
| Grand totals | 505 | 23,937 | 451,252 | 291 | 107,577 | 2,465,926 |
LAND DEVELOPMENT—The Land Settlement Board, constituted in 1941 to administer land policy and land development through the Department of Lands and Survey, has had the responsibility of developing, for the settlement of ex-servicemen of the Second World War, both Crown land and undeveloped private land purchased or acquired for the purpose. Initially all land developed was offered exclusively to ex-servicemen eligible for rehabilitation farming assistance, but with the commitment to settle ex-servicemen largely fulfilled, a civilian land settlement policy has been introduced. The few remaining ex-servicemen awaiting farms still receive preference at ballots, but as few are applying, the great bulk of farms offered by the Land Settlement Board go to civilians.
Development of land for settlement includes clearing, cultivation, grassing, fencing, erection of buildings, and installation of water supplies. To consolidate pastures and to control regrowth of scrub and weeds, the land is farmed as part of the development process. This helps to meet the cost of development and to ensure that, when the farms are disposed of, the new settlers will not experience stock troubles or reversion.
The major development districts are Rotorua with 257,000 acres under development, Southland (246,000 acres), North Auckland (206,000 acres), Te Kuiti (127,000 acres), and Gisborne (76,000).
The following table contains particulars of land acquired for development and settlement during the year ended 31 March 1966, and from the establishment of the Land Settlement Board in 1941 to 31 March 1966; also shown are those areas made available for settlement and the balance on hand at the latter date. The figures do not include particulars relating to ex-servicemen who have been assisted by way of rehabilitation loans to purchase established farms on their own account. Further information concerning the settlement of ex-servicemen leases, either for cash or on deferred-payment licence.
As the table shows, the bulk of the land has been purchased by voluntary negotiation or was formerly unoccupied Crown land which has been included in development blocks. All the land shown as acquired compulsorily was acquired between 1943 and 1953.
| Nature of Transaction | Year Ended 31 March 1966 | From Inception (1941) to 31 March 1966 | ||
|---|---|---|---|---|
| Area | Units | Area | Units | |
* Tentative figures only. Final subdivision and utilisation is decided as development is approaching completion. NOTE—Areas include adjustments consequent on surveys. | ||||
| ACQUISITIONS | acres | acres | ||
| (a) Purchased by voluntary negotiation | 84,738 | 21 | 1,726,659 | .. |
| (b) Compulsorily acquired (Servicemen's Settlement and Land Sales Act 1943 and Servicemen's Settlement Act 1950) | - | - | 281,472 | .. |
| (c) Properties where ex-servicemen substituted under section 31 (3) (b), Servicemen's Settlement Act 1950 | - | - | 17,390 | .. |
| (d) Crown land made available | 12,805 | 1 | 855,565 | .. |
| Totals, acquisitions | 97,543 | 22 | 2,881,086 | 5,690 |
| DISPOSALS | ||||
| I—To Grade “A” Ex-servicemen | ||||
| (a) Developed units (including substitutions) | 2,149 | 6 | 1,368,485 | 3,523 |
| (b) Unimproved units | - | - | 2,013 | 6 |
| 2,149 | 6 | 1,370,498 | 3,529 | |
| II—To Civilians | ||||
| (a) Developed units | 32,347 | 55 | 201,370 | 486 |
| (b) Unimproved units | .. | .. | 45,427 | 93 |
| 32,347 | 55 | 246,797 | 579 | |
| III—Sundry Disposals | ||||
| (a) Transferred to Maori Affairs Department for settlement | - | - | 12,116 | 31 |
| (b) Adjacent owners, reserves, workers' homes, unsuitable for settlement, etc. | 8,577 | .. | 141,080 | 22 |
| 8,577 | .. | 153,196 | 53 | |
| Totals, disposals | 43,073 | 61 | 1,770,491 | 4,161 |
| Land on hand for development in farm settlements | - | - | 1,110,595 | 1,529* |
| Maori land being developed with Crown land | - | - | 10,816 | |
RESERVES AND NATIONAL PARKS: History—Land has been set aside for public purposes from the early years of colonial administration in New Zealand. The New Zealand Act 1840 (Imperial) authorised the disposal of land “to any persons, bodies, public or corporate, for the public uses of our subjects there resident or any of them”. Royal Instructions of 1840 to Governor Hobson elaborated on this and provided that such lands were not to be granted conveyed or demised or occupied by any private person or for any private purpose. A subsequent Royal Instruction dated 1846 and the New Zealand Company's Colonisation Act 1847 (Imperial) authorised the vesting of reserves in trust for public purposes or uses.
The wisdom of reserving areas for public purposes on the subdivision of land into residential sections has also long been recognised by legislation. The Plans of Towns Regulations Act 1875 provided for reserves in the case of Crown subdivisions. Legislation requiring the provision of reserves on subdivisions of private land was first enacted in the Land Laws Amendment Act 1912. The Land Act 1924 specified that not less than 5 percent of the area of any subdivision was to be reserved for public purposes and the Land Subdivision in Counties Act 1946 added the alternative, at the option of the Minister of Lands, of the subdivider paying costs or contributing land for sale with the proceeds earmarked for the purchase or improvement of reserves.
Subdivision is controlled by the local authority under the Municipal Corporations Act 1954 or the Counties Amendment Act 1961. Land is normally set aside as reserves, but the local authority may take a cash payment for reserve development. Local authorities are charged with ensuring that adequate provision is made on subdivision for reserves and with subsequent administration of reserves. The Crown is not bound by this legislation, but in practice refers its subdivisions to local bodies for approval and makes generous provision for reserves.
The first statute providing for the reservation of Crown land for parks and domains was the Land Act 1877; an amendment in 1884 permitted the reservation of land containing “natural curiosities”; and the Land Act 1892 allowed Crown land to be set aside as scenic reserves. It was in 1887 that the three mountain peaks of Ruapehu, Ngauruhoe, and Tongariro were given to the nation by Te Heuheu Tukino and associated chiefs as “a national park for the benefit of everybody”. This gift came only 15 years after Yellowstone was established as America's and the world's first national park and the gift area formed the nucleus of New Zealand's first national park—Tongariro—in 1894. The second national park—Egmont—was constituted by special legislation in 1900.
The first general legislation on national parks was enacted in 1928—this provided a uniform means of setting up and administering new parks. Under this legislation two new parks were established—Arthur's Pass in 1929 and Abel Tasman in 1942.
Interest in national parks increased after the Second World War and a review of the administration led to the passing of the National Parks Act 1952. This made the Minister of Lands responsible to Parliament for national parks and laid the foundations for an integrated system of parks. Fiordland (part of which was first reserved in 1905) became a national park and four new parks were constituted—Mount Cook (1953), Urewera (1954), Nelson Lakes (1956), and Westland (1960). In 1964 the Mount Aspiring National Park was constituted. The National Parks Act established the National Parks Authority consisting of the Director-General of Lands (Chairman), the Assistant Director-General of Lands, the Secretary for Internal Affairs, the Director-General of Forests, the General Manager of Department of Tourist and Publicity, three person appointed by the Minister of Lands on the recommendation of the Royal Forest and Bird Protection Society, the Federated Mountain Clubs of New Zealand and the Royal Society of New Zealand respectively, and one person appointed by the Minister of Lands to represent the national park boards.
The National Parks Authority is serviced by the Department of Lands and Survey and a Supervisor of National Parks has been appointed to assist in co-ordinating and integrating policy in the 10 parks. Each national park is under the control of a National Park Board of which the Commissioner of Crown Lands for the Land District is chairman. Each Board comprises not more than eight persons appointed by the Minister of Lands but in the case of Egmont and Tongariro special provisions exist regarding the appointment of members to the Boards. Each Board employs one or more salaried rangers responsible for development, protection, and interpretation, and their work is supplemented by the voluntary help of about 250 honorary rangers appointed from those whose interests bring them into the parks frequently or who live nearby.
Scenic and historic reserves are controlled by scenic and historic boards, by local authorities, or by the Commissioner of Crown Lands for the district. A large number of honorary rangers help in the supervision of these reserves. The legislation governing these and all other reserves is the Reserves and Domains Act 1953. Once land has been reserved for a specific purpose, either by notice in the New Zealand Gazette or by deposit of a subdivisional plan, the purpose of the reservation can be changed or the reservation revoked only by the Minister of Lands. In some cases advertising is first required and in all cases the Minister will not approve a change of purpose or the revocation of the reservation unless it is in the public interest. The Minister is also responsible through the Department of Lands and Survey to see that use of these areas is consistent with the purpose for which the land was reserved.
Description—Ten national parks have been constituted in New Zealand covering 5,070,471 acres or one-thirteenth of the country's land area. They are set aside as the law says “for the purpose of preserving in perpetuity as national parks, for the benefit and enjoyment of the public, areas of New Zealand that contain scenery of such distinctive quality or natural features so beautiful or unique that their preservation is in the national interest”. The National Parks Act requires that parks be administered and maintained so that they are preserved as far as possible in their natural state; that their value as soil, water, and forest conservation areas is maintained; that, as far as possible, native flora and fauna is preserved and introduced flora and fauna exterminated; and that, subject to restrictions necessary to preserve native flora and fauna or for the general welfare of the parks, the public has freedom of entry and access. The only restricted area is the “special area” set aside to protect the habitat of the takahe (notornis)—128,000 acres out of the three-million acre Fiordland National Park.
Any form of development not provided for in the National Parks Act must be sanctioned by Act of Parliament. Permitted development includes the erection of houses for park rangers and huts for Government employees engaged in noxious animal destruction, the erection of huts by mountaineering, tramping, or other similar clubs, the erection of ski tows and similar facilities. Appropriate commercial undertakings may operate in the parks under licence while boards controlling the parks may, with the consent of the Authority, establish camping grounds, huts, hostels, accommodation houses, or other buildings, and may help private enterprise in their establishment. “Wilderness areas” where development is restricted to access by foot track are provided for in the Act and a number have been set aside. Virtually all the finance for parks is provided by the Government, but donations by private individuals or organisations are encouraged and earn $2 for $1 subsidy from the Government.
Three of the 10 national parks are in the North Island and seven in the South. Tongariro National Park (166,561 acres), includes the three volcanoes—Ruapehu, Ngauruhoe, and Tongariro—and the ski-ing playground of the North Island. Egmont (82,289 acres) contains one of the world's most symmetrical mountains and preserves forests within a 6-mile radius. It varies from heavily forested lower slopes to the bare scoria, rock, snow, and ice of the upper levels. The remaining park in the North Island, Urewera (493,032 acres), surrounds Lake Waikaremoana and is part of the largest remaining forest area in the North Island. Kiwi, kaka, and most other native birds are found and the area is rich in Maori history.
In the South Island, Abel Tasman National Park (45,134 acres), contains coastal and elevated bush-clad country along the shores of Tasman Bay and includes off-shore islands and reefs. It has a broken coastline with many bays, coves, and beaches of golden sand. Nelson Lakes (141,127 acres) is centred on the twin lakes of Rotoiti and Rotoroa and is surrounded by mountainous country with extensive beech forests on the lower slopes, Further south, Arthur's Pass (243,081 acres), preserves an alpine and forested area straddling the Southern Alps. Mount Cook (172,979 acres) and Westland (210,257 acres) national parks share a common boundary along the main divide of the Southern Alps, and Westland takes in forest and lake country and a small strip of sea coast as well as the Franz Josef and Fox Glaciers. Mount Cook National Park contains most of New Zealand's highest mountains and includes the 18-mile-long Tasman Glacier. Fiordland (3,023,711 acres), one of the world's largest national parks, contains majestic scenery with fiords, mountains, forests, and lakes. It includes Lakes Manapouri and Te Anau while the road through the Homer Tunnel gives access to Milford Sound. The park is the only known habitat of the takahe (notornis) and the kakapo. Mount Aspiring National Park (492,300 acres) embraces the alpine region in north-west Otago and South Westland extending from the Haast Pass to the Routeburn area at the head of Lake Wakatipu and including Mount Aspiring.
Scenic Reserves—Scenic reserves, of which there are 907 with a total area of 623,458 acres, preserve native forest, and preserve access by the public to other scenic features such as the sea coast, lakes, rivers, waterfalls, limestone caves, thermal areas, and vantage points. Forest areas range from large tracts of remote forested land with considerable conservation value to small remnant areas in developed districts. Large scenic reserves have been set aside along main highways, but, in general, barren mountainous regions not included in national parks remain Crown land.
There are 17 reserves in excess of 5,000 acres and some are larger than the smallest national park, Abel Tasman. Some areas at present set aside as scenic reserves could, in future years, achieve national park status.
Scenic reserves over 5,000 acres are: Lewis Pass, Wanganui River, Buller Gorge, Rakeahua (Stewart Island), Lake Kaniere, Gouland Downs, South Cape (Stewart Island), Glenhope, Lake Brunner, Tennyson Inlet, Rahu (Reefton), Mangamuka Gorge, Tangarakau, Te Tapui (Cambridge), Pihanga, Waioeka Gorge, and John Coull Memorial Reserve (Wanganui River).
Public use of scenic reserves varies greatly, as does the extent of their development. Some are well developed with cleared areas used for camping and picnics and have formed tracks. Facilities on those flanking highways are mainly the provision of off-road parking combined with picnic areas. Many reserves have no facilities as yet. Among the best known reserves not in the preceding list are Trounson Kauri Park in North Auckland, Huka Falls, near Taupo, Hongi's Track, and various thermal areas near Rotorua, Waitomo Caves, Ball's Clearing in Hawke's Bay, Pelorus Bridge and Hundalee in Marlborough, the Summit Road Scenic Reserves and Peel Forest in Canterbury, Punakaiki, and Lake Ianthe in Westland, and Forest Hill and Curio Bay in Southland.
In an endeavour to recreate the natural New Zealand scene in an area where exotic trees, noxious weeds, and engineering development have intruded, the Department of Lands and Survey has established a plant nursery at Taupo where native trees and shrubs are being propagated for beautification of reserves in the Taupo basin.
There is provision in the Reserves and Domains Act 1953 for land to be declared private scenic reserves—this land remains in private ownership, but receives the protection of the Act. There are 3,888 acres in 20 private scenic reserves and these include White Island, where grey faced and other petrels nest in large numbers, as well as about 3,000 pairs of gannets annually. The Pukeiti Rhododendron Trust area is a private scenic reserve near New Plymouth in native bush being planted with native trees as well as rhododendrons. One new private reserve near Awaka provides, in an area of 1,360 acres, shelter for native birds. Other large private scenic reserves are Moncrieff, near Nelson, and Makarora on the Haast Pass Road.
Historic Reserves—Forty-five areas of historic interest totalling 3,012 acres are set aside as historic reserves and the Department of Lands and Survey co-operates closely in the administration and investigation of historic sites with the New Zealand Historic Places Trust. Historic reserves mark the landfall and landing places of early voyagers such as Tasman and Cook, the site of missionary Samuel Marsden's first sermon on New Zealand soil, sites of early fortifications, of engagements during the Maori wars, and buildings of historic value. Sites of Maori rock drawings and places of significance in New Zealand's early constitutional history are also preserved.
The Treaty House area at Waitangi, administered by the Waitangi National Trust, is not an historic reserve, in the strict sense.
Bird Sanctuaries and Allied Reserves—Land is reserved for bird sanctuaries, for the preservation of flora and fauna, or some similar purpose in cases where the land provides a habitat for bird or plant life of such importance that some control on public access is desirable. Such areas are now reserved under the Reserves and Domains Act 1953. In all there are 35 reserves in this category with a total area of 447,618 acres; some of them are mainland areas, but most are off shore, outlying, and subantarctic islands. Major areas of particular public interest include Little Barrier Island in Hauraki Gulf, the only known habitat of the stitch bird; Cape Kidnappers gannet colony in Hawke's Bay; Kapiti Island off Wellington's west coast; the white heron colony in South Westland; and the Taiaroa Head albatross colony near Dunedin.
All of New Zealand's subantarctic islands, except for a small area surrounding the meteorological station on Campbell Island, are reserved for the preservation of flora and fauna and provide a habitat for marine mammals and millions of sea birds. As well as Campbell Island, the reserves include the Auckland Islands, Bounty Islands, Antipodes Islands, and Snares Islands. To the north of New Zealand, most of the land in the Kermadec Islands is similarly reserved.
Generally, access to reserves of this type is by permit only, a policy followed solely in the interests of preservation of the plant and bird life to ensure an absolute minimum of human interference to anything living and growing naturally there.
Nature Conservation Council—The Nature Conservation Council Act 1962 provides for the establishment of a Nature Conservation Council. This Council of independent members, expert in the field of conservation, has been set up to co-ordinate scientific and technical information on nature conservation, to inquire into the effect of proposed public works on any aspect of nature conservation and to act as an advisory body to Government on matters affecting nature conservation which is defined in the Act as “the preservation of the native flora and fauna and the natural features and natural beauty of New Zealand”.
Wildlife Refuges and Sanctuaries—The Wildlife Act 1953 provides for the constitution of wildlife sanctuaries, these being areas devoted primarily as habitat areas for wildlife where the maximum degree of protection can be afforded. Restrictions are imposed on entry into the sanctuaries and certain prohibitions dealing with killing or disturbance of wildlife are imposed. The former game sanctuaries are now termed wildlife refuges. Occupiers of any land in wildlife refuges can be authorised to carry out certain operations necessary for the normal use of land.
Public Domains—Domains of which there are 912 covering 62,123 acres provide districts with land for the recreational needs of the people as a whole. Many domains are designed primarily to provide for organised sport but there are a large number which preserve for public use attractive natural areas, particularly along the coastline, and provide facilities for camping. Some outstanding examples of coastal domains are Orewa, near Auckland, Ohope Beach, near Whakatane, Queen Elizabeth Park, near Wellington, Momorangi Bay in the Marlborough Sounds, Kaiteriteri and Pohara in the Nelson district, and Waikuku Beach in Canterbury. Universally known city domains are the Auckland Domain and Hagley Park, Christchurch. Native bush is protected on domain land.
Summary of Areas Reserved—The following table records the main classes of reservations as at 31 March 1966.
| Type of Reservation | No. | Acres |
|---|---|---|
| National parks | 10 | 5,070,471 |
| Scenic reserves | 907 | 623,458 |
| Historic reserves | 45 | 3,012 |
| Bird sanctuaries and allied reserves | 35 | 447,618 |
| Public domains | 912 | 62,123 |
GENERAL—Before European settlement, all the land in the country was held by the various groups and tribes of the Maori people in accordance with their traditional customs and usages, and the land so held was described as Maori customary land. By the Treaty of Waitangi the exclusive right to purchase such land was reserved to the Crown. Practically all of the land which was formerly Maori customary land has now been converted to other forms of title by one or other of the following processes:
(a) Purchase or other acquisition by the Crown (from whom in turn the European colonists obtained land for farms, etc.).
(b) The issue of a Crown grant to a Maori owner on the recommendation of the Maori Land Court.
(c) The issue of a freehold order by the Maori Land Court in favour of the Maori or Maoris found entitled upon an investigation of title. This process was used instead of process (b) after the introduction of the land transfer system into New Zealand.
Land which was included in titles issued under processes (b) and (c) became known as Maori freehold land. In 1965 the area of Maori land was 3,900,000 acres, of which 3,680,000 acres were in the North Island.
Maori freehold land becomes Crown land if all interests in it are purchased or otherwise acquired by the Crown, or becomes non-Maori land when bought or inherited by a person of less than half Maori blood, or is declared to be so by the Maori Land Court.
Since 1954, by virtue of various provisions in the Maori Affairs Act 1953, emphasis has been placed on the need for the improvement of existing Maori land titles by the elimination of small fractional interests and the reduction in the number of owners. The idea behind this is to clear the way for the better use of the land in an attempt to keep Maori freehold land in the possession of the Maori people.
In 1965 an analysis was made of Maori land in connection with the Committee of Inquiry into Laws Affecting Maori Land and the Powers of the Maori Land Court. The area of Maori land in the North Island (3,680,565 acres) is classified in the following table.
| Classification | Area |
|---|---|
| Leased or under development by Board of Maori Affairs | acres 1,281,240 |
| Under active incorporation | 537,868 |
| Under inactive incorporation | 81,585 |
| Farmed but not leased | 518,166 |
| Unoccupied but suitable for development | 515,026 |
| Unoccupied but probably suitable for forestry | 399,844 |
| Unoccupied and probably of no use | 271,226 |
| Maori reserved land | 75,610 |
| Total | 3,680,565 |
With regard to Maori freehold land, the Court during 1965-66 approved of leases comprising 21,312 acres to non-Maoris and 12,718 acres to Maoris, the previous year's figures being 40,946 and 12,991 acres respectively. It confirmed transfers (apart from sales to the Crown) affecting 49,098 acres of freehold land to non-Maoris and 4,822 acres to Maoris in 1965-66, the corresponding 1964-65 figures being 18,750 and 2,768 acres respectively. During the year ended 31 March 1966 timber cutting right were confirmed by the Court in respect of 20,561 acres. The Court, before confirming an alienation, must satisfy itself, among other things, that it is not contrary to the interests of the Maori owners.
MAORI LAND DEVELOPMENT—Maori land development policy is directed to the settlement of Maori farmers on farms which will assure them of a reasonable standard of living based on today's costs and standards; to secure them the best possible tenure for the lands they farm; to assist them to develop the land and to teach them modern methods of farming. The means at the Department's disposal have permitted the development of approximately 10,000 acres of new land annually. In the year ended 30 June 1965 there were 18 farms settled. Up to 30 June 1965 the Department had settled 2,291 Maori farmers on farms.
The estimated area of Maori land suitable for settlement is limited to 725,000 acres (210,000 acres under departmental control and 515,000 acres of idle land), on which about 500 Maori sheep farmers and 3,300 dairy farmers could be settled eventually.
BOARD OF MAORI AFFAIRS—The Board of Maori Affairs constituted under the Maori Affairs Act 1953 consists of the Minister of Maori Affairs, the Secretary for Maori Affairs, the Director-General of Lands, the Valuer-General, the Secretary to the Treasury, the Director-General of Agriculture, the member of the Executive Council representing the Maori race or, if there is no such member, any member of the Executive Council appointed by the Governor-General to be a member of the Board, and three other members appointed by the Governor-General.
The functions of the Board include, among other things, the following:
The control of the development and settlement of Maori land or land owned or occupied by Maoris.
The approval of investment and advances, and of certain expenditure from the Maori Trustee funds.
The control of negotiations for the acquisition of Maori lands by the Crown.
The control of expenditure on housing operations under the Maori Housing Act 1935.
MAORI LAND COURT—The Maori Land Court consists of a Chief Judge and such other Judges as the Governor-General may think fit to appoint. Its general function is to deal with problems peculiar to multiple ownership of Maori lands and includes appointing successors to deceased owners, partitioning or combining titles, granting probate of wills or letters of administration of deceased Maoris, appointing trustees for minors and other persons under disability, and confirming sales, leases, and other dealings with Maori lands it also deals with Maori claims under the Family Protection Act 1955 and performs other miscellaneous functions.
The Maori Appellate Court consists of any two or more Judges of the Maori Land Court, provided that two Judges at least shall concur in every decision of the Court. With certain exceptions the Appellate Court determines appeals, whether on law or on fact, from all final orders of the Maori Land Court.
MAORI TRUSTEE—The Maori Trust Office was originally created to take over from the Public Trust Office the administration of certain Maori reserves and the administration of the estates of deceased Maoris and those under disability. The Maori Trust Office now forms part of the Department of Maori Affairs and is headed by the Maori Trustee, comparable in status and functions with the Public Trustee. The control of most Maori Trustee activities has been decentralised by the delegation of wide powers to the District Officers of the Department of Maori Affairs, who deal primarily with all Maori Trustee matters in their districts.
In addition to the administration of Maori reserves, situated mainly in Taranaki, and in Nelson, Greymouth, and other South Island localities, the Maori Trustee has the responsibility for the administration of large areas of Maori land elsewhere. Most of these lands are, like the Maori reserves, vested in the Maori Trustee, who is responsible for leasing them and distributing the proceeds to the owners.
The Maori Trustee has extensive lending powers used principally for the settlement and improvement of Maori land, for the establishment of Maoris in business, and for housing purposes. Most advances are made on the security of Maori land.
The following table is a summary of the assets and liabilities of the Maori Trustee as at 31 March in the latest two years.
| Item | As at 31 March | |
|---|---|---|
| 1965 | 1966 | |
| Assets— | $(000) | $(000) |
| Cash | 181 | 268 |
| Investments— | ||
| Government securities | 4,934 | 5,134 |
| Local authority debentures | 289 | 286 |
| Mortgages, charges, and advances on overdraft | 3,265 | 3,567 |
| Land, buildings, and miscellaneous | 379 | 442 |
| Totals | 9,048 | 9,696 |
| Liabilities— | ||
| Amounts held for beneficiaries and sundry depositors | 6,339 | 6,786 |
| Reserves and Appropriation Account | 2,676 | 2,896 |
| Sundry creditors, etc. | 33 | 14 |
| Totals | 9,048 | 9,696 |
GENERAL—In earlier years surveys of land subdivisions for the purpose of issuing title comprised the major function of the Survey Division of the Lands and Survey Department, but now there is an increasing demand for engineering survey information on which to plan major construction works, and for topographical and cadastral information on which to plan the future development of the country. Mapping efforts are being concentrated on completing the topographical map coverage of the unmapped areas of the country as quickly as possible. Much work is being carried out on control surveys, especially in the investigation of electric power projects, and this is designed to fit into a system of national coverage of precise levelling.
Surveys of private lands for the purpose of the Land Transfer Act 1952 are carried out by registered private surveyors and are examined and approved by the Lands and Survey Department.
Statutory authority for the surveyor to enter upon any land and to place survey marks thereon is contained in several Acts, and the wilful destruction of these marks is subject to a severe penalty.
All surface surveys are made in accordance with regulations laid down and are subject to field check (if thought necessary) and to office examination prior to approval and deposit.
The standard of length is the chain of 22 Imperial yards divided into 100 links, and all linear measurements have to be expressed in terms thereof, and areas in acres, roods, and perches, with decimals of a perch.
In the 1957 and earlier issues of the Yearbook there is described the survey system of minor triangulation adopted in 1876 to enable settlers to be given possession of definite pieces of land, with each section having for the purpose of record and title registration a complete identification by means of its number, the number of the block, and the name of the district.
A national series of completely contoured maps is being produced with the assistance of photogrammetrical plotting machines, but progress with these maps has been slow and it has been found necessary to resort to a system of interim stream and ridge-pattern maps using aerial photographs with slotted template assembly and radial line plotting in some areas.
STANDARD SURVEYS—In order to more adequately correlate and redefine old boundary marks for land-title purposes and to provide a permanent standard of reference for future surveys in cities and boroughs where land values are high, and on highways and on main arterial roads where modern road surfaces have eliminated survey marks, a precise survey is carried out, all intersections being referenced with permanent standard marks, normally iron tubes in concrete blocks protected by an iron cover.
These surveys are of two classes—(1) those in the cities and boroughs, being of standard of accuracy of 2 inches to the mile, the cost of which is borne party by the local authority concerned and partly by the Department of Lands and Survey and (2) those carried out on highways and arterial roads to a lesser standard of accuracy, for the purpose of referencing survey marks lost or obliterated by road works and surfaces.
These standard traverses will in the future be correlated with precise levelling traverses, thus providing a standard level datum for engineering works.
PRECISE LEVELLING—Precise levelling is being extended continuously for the purpose of correlating the level data of irrigation and drainage and other engineering works. This type of levelling has been carried out in accordance with international standards of accuracy—namely, 0.012 feet or 0.144 inches per mile.
These levels are at mean sea-level datum determined from the tidal records of the principal tidal stations or of tide gauges established specially for that purpose. The traverses are referenced at approximately 25-mile intervals by fundamental bench marks and at approximately 1-mile intervals by standard bench marks.
This work is being further extended to meet the requirements of national drainage, irrigation, hydro-electric, and river-control development, where related and co-ordinated levels in terms of a fixed datum are essential.
AERIAL SURVEY AND TOPOGRAPHICAL MAPPING—Extensive use is made of aerial photographs for other than purely mapping purposes. All types of land and engineering development, investigations into geological resources, afforestation, and town and rural planning are now based on data extracted from the aerial photographs. The Department is responsible for the maintenance of a complete library of aerial photographs, which are made available for all national purposes. At present the North Island has been completely photographed while two-thirds of the South Island has been covered.
There is an increasing demand for topographical maps of all scales for land development, forestry, engineering, geological and soil survey, and other governmental purposes. New cartographic techniques have revolutionised the production of better and more varied scales and types of maps. In consequence it can now be claimed that New Zealand has a mapping organisation that compares more than favourably with overseas mapping agencies.
Mapping is also undertaken of islands and territory within the Ross Dependency, Antarctica. Information for these maps is based on aerial photography supplied by the United States, field work from New Zealand field parties, and maps prepared by other countries.
GEOGRAPHIC BOARD—The New Zealand Geographic Board, constituted under the provisions of the New Zealand Geographic Board Act 1946, is the official place-names authority.
The main function of the board is to adjudicate on matters pertaining to place and feature names in New Zealand. The board has authority to assign new names for localities, geographical features, post offices, railway stations, etc., and to alter existing names subject to the right of appeal vested in the general public and to the rights of local authorities concerning names within the areas administered by such local authorities.
The board together with three co-opted members also acts as the Antarctic Place Names Committee. This committee is the official New Zealand authority for approval of names in the Antarctic. Its activities are confined mainly to the Ross Dependency but liaison is maintained with the place-name authorities of other countries.
The membership of the board comprises the Surveyor-General, two representatives of the Maori race, a representative of the New Zealand Geographical Society, a representative of the Federated Mountain Clubs of New Zealand, and two members appointed on the recommendation of the Minister of Lands.
MAPS—Map sales agencies are maintained at each of the district offices except Wellington and at the Head Office of the Department of Lands and Survey. In addition 351 private selling agents have been appointed throughout the country and overseas. All maps for sale are listed in the Catalogue of Maps published by the Department.
GENERAL—Equitable land values are a basis for many of the relations of the Central Government and local authorities with the individual. In particular they are required in connection with the following: (a) the levying of land tax; (b) the apportionment of rating levies over contributory local authorities; (c) the levying of rates by local authorities; (d) the advancing of money on mortgage by Government Departments and by trustees under the Trustee Act; (e) the assessing of stamp, estate, and gift duties; (f) the fixing of prices payable to the Crown or by the Crown for transfers of land.
SYSTEM AND PROCEDURE—The Government Valuation of Land Act 1896 set up a separate Government Department charged with the duty of assessing the values of real estate for taxation and other purposes of the Central Government and for local rating purposes. The present law relating to the valuation of land is contained in the Valuation of Land Act 1951, and in the Land Valuation Court Act 1948.
The work of the Valuation Department is directed by the Valuer-General, the actual work of valuing being done by district valuers and assistant valuers. The duty of a valuer is to examine each property and to estimate to the best of his ability (1) the unimproved value of the land contained therein, (2) the value of the buildings (if any) or other improvements (if any) upon such land, and (3) the capital value of the property.
Valuers are enjoined not to strain after high values, nor to accept special prices paid for land in exceptional circumstances, but to determine the value neither above nor below the fair selling value in view of the many and diverse purposes for which the values are used.
Generally, under the New Zealand law, the increased value attaching to any piece of land which is due to the successful working of other lands in the district, or to State or local authority expenditure on public works, or to the general prosperity and development of the country, forms portion of the “unimproved value”.
“Improvements” on land are defined, with certain provisos, as any work done or materials used on or for the benefit of the land by any owner or occupier resulting in an increase in the value of the land.
The “capital value” is the sum of the “unimproved value” plus the value of “improvements”.
THE VALUATION ROLL—A valuation roll is prepared for each district over which a territorial local authority has rating jurisdiction, setting forth the ownership, description, and valuation of each property.
Revision of Rolls—District valuation rolls are revised by the Valuer-General at intervals of not more than five years unless the Governor-General in Council directs otherwise.
Equalisation of Values—The Valuation Equalisation Act 1957 provides for an equitable adjustment of rates and of levies based on rateable values as between the several constituent districts comprising the district of an ad hoc local authority where those constituent districts have been revalued by the Valuer-General at different times.
The Supplementary Roll—There is, in addition to the district valuation roll for each district, a supplementary roll for that district. Generally, all special valuations of land made during the currency of a district roll for particular purposes—e.g., the granting of loans by Government Departments or trustees on the security of lands, the assessment of stamp, gift, and estate duties—are entered on the supplementary roll.
Objections to Valuations—In the case of a revision of a district roll, the Valuer-General, any local authority, or any owner whose name appears on the roll, may object to any valuation thereon. Where a particular property only is revalued, only the owner has a right of objection. If, after the Valuer-General has reconsidered the matter, the objector is still dissatisfied he may ask for the objection to be heard by the Land Valuation Court.
LAND VALUATION COURT—The Land Valuation Court consists of three members appointed by the Governor-General in Council, one of whom is the Judge of the Court. In addition to its jurisdiction under the Valuation of Land Act 1948, the Court hears claims for compensation under the Public Works Act 1928 and determines values under the Land Settlement Promotion Act 1952. Land valuation committees for particular localities operate under the general jurisdiction of the Court.
Except that the Judge of the Court may on the application of any party to proceedings, or of his own motion, state a case for the opinion of the Court of Appeal on a question of law, the decisions of the Land Valuation Court (either decisions of the Court itself or orders of the committees sealed by the Registrar) are final.
If any owner who has objected to a valuation made at a revision of a district roll is not satisfied with the value of the land as fixed by the Land Valuation Court's order, he may, within 14 days of the sealing of the order, give notice to the Valuer-General that he requires the capital value to be reduced to the value which he (the owner) considers to be the fair selling value as specified in his notice (but not less than the aggregate amount owing on mortgages or other charges on the land), or the land to be acquired on behalf of Her Majesty, or sold, at that value. There is also provision that if the Valuer-General is of the opinion that the value has been fixed by the Court at less than the capital value, he may within 14 days after the sealing of the Court's order require the owner to consent to what he (the Valuer-General) considers is the fair capital value, and, failing such consent being given within 30 days after notice is delivered, he may, with the approval of the Governor-General in Council, acquire the property at that value on behalf of Her Majesty.
VALUATIONS IN RELATION TO RATING—The district valuation roll so long as it continues in force is by law the roll from which the valuation roll of every local authority rating on the capital or on the unimproved value is framed.
The Urban Farm Land Rating Act 1932 provides for rating relief for farm lands subject to rates levied by borough (or city) councils, independent town councils, and county councils in respect of county towns. The Act provides that these local authorities may assess valuations for rating purposes for such farm lands lower than the values for the same lands appearing on the district valuation rolls.
The Valuation of Land Amendment Act 1965 provides for the making of rates-postponement values and special rateable values of industrial or commercial land in residential or rural areas. This enables local authorities rating on the capital value or on the unimproved value, to grant relief for certain residences in industrial or commercial zones, certain farm lands with valuations reflecting potential use for urban development and also non-conforming industrial or commercial property.
Local authorities can rate on the annual (rental) values of properties within their areas, these values being assessed by the local authorities' own valuers. The annual value is defined as the rent at which a property would let from year to year reduced by 20 percent in the case of houses, buildings, and other perishable property, and by 10 percent in the case of land, but it may not be less than 5 percent of the value of the fee simple. A new valuation roll in this regard is prepared either annually or triennially.
CAPITAL AND UNIMPROVED VALUES OF LAND—The figures in the following table show valuations over a long period of years for the whole of New Zealand; they are gross values and include the value not only of rateable properties but also of churches, schools, unoccupied Crown lands, and other lands exempt from local rating.
| At 31 March | Capital Value (Land and Improvements) | Unimproved Value of Land (Included in Previous Column) | At 31 March | Capital Value (Land and Improvements) | Unimproved Value of Land (Included in Previous Column) |
|---|---|---|---|---|---|
| $ (million) | $ (million) | ||||
| 1878 | 199.1 | 125.1 | 1,936 | 1,271.6 | 591.4 |
| 1885 | 226.5 | .. | 1,937 | 1,264.5 | 575.7 |
| 1888 | 222.3 | 151.0 | 1,938 | 1,272.7 | 564.7 |
| 1891 | 244.4 | 151.7 | 1,939 | 1,305.8 | 565.6 |
| 1897 | 277.2 | 168.8 | 1,940 | 1,321.0 | 557.8 |
| 1902 | 309.6 | 189.7 | 1,941 | 1,346.2 | 555.1 |
| 1906 | 395.4 | 245.9 | 1,942 | 1,363.8 | 553.8 |
| 1907 | 473.3 | 299.4 | 1,943 | 1,368.4 | 553.8 |
| 1909 | 543.0 | 345.5 | 1,944 | 1,377.6 | 554.1 |
| 1911 | 586.2 | 368.1 | 1,945 | 1,394.7 | 555.0 |
| 1913 | 681.1 | 425.9 | 1,946 | 1,420.9 | 558.4 |
| 1915 | 742.1 | 461.4 | 1,947 | 1,492.8 | 568.5 |
| 1916 | 778.3 | 482.6 | 1,948 | 1,592.1 | 583.2 |
| 1917 | 810.9 | 502.2 | 1,949 | 1,778.5 | 614.3 |
| 1918 | 842.8 | 521.8 | 1,950 | 1,971.8 | 648.9 |
| 1919 | 891.1 | 552.0 | 1,951 | 2,225.5 | 698.3 |
| 1920 | 940.2 | 581.8 | 1,952 | 2,629.8 | 788.5 |
| 1921 | 1,037.2 | 635.3 | 1,953 | 3,064.7 | 899.6 |
| 1922 | 1,089.0 | 658.3 | 1,954 | 3,405.5 | 974.3 |
| 1923 | 1,106.8 | 661.6 | 1,955 | 4,136.6 | 1,158.2 |
| 1924 | 1,137.0 | 667.7 | 1,956 | 4,613.2 | 1,288.8 |
| 1925 | 1,174.7 | 678.6 | 1,957 | 4,992.7 | 1,395.1 |
| 1926 | 1,206.5 | 682.1 | 1,958 | 5,354.5 | 1,502.3 |
| 1927 | 1,236.5 | 683.0 | 1,959 | 5,664.5 | 1,610.6 |
| 1928 | 1,262.9 | 670.4 | 1,960 | 6,132.5 | 1,779.6 |
| 1929 | 1,301.8 | 689.5 | 1,961 | 6,497.4 | 1,905.7 |
| 1930 | 1,329.1 | 677.8 | 1,962 | 6,945.7 | 2,061.1 |
| 1931 | 1,335.6 | 663.3 | 1,963 | 7,373.6 | 2,212.1 |
| 1932 | 1,325.7 | 643.6 | 1,964 | 7,760.4 | 2,345.8 |
| 1933 | 1,307.4 | 629.1 | 1,965 | 8,459.2 | 2,644.5 |
| 1934 | 1,300.7 | 619.5 | 1,966 | 9,085.0 | 2,865.5 |
| 1935 | 1,275.2 | 602.3 | |||
The table shows a continuous decrease in land values from 1929 to 1943. Probably the lowest point in real values was reached about 1934, and the decreases shown after that year merely indicate that the new valuations being made were still at levels lower than the existing pre-depression figures. After 1943 land values were stabilised through the operation of the Servicemen's Settlement and Land Sales Act 1943, and the increases shown to 1950 mainly reflect the writing into new valuations of increases which had occurred prior to 1943.
The lifting of land sales control on urban properties from 23 February 1950 was reflected in the 1951 general revaluations of boroughs and cities. County revaluations did not, however, reflect the transition to a free market basis until the 1952 revaluations, the effect of the higher basis having been postponed 12 months as provided for by section 38 of the Statutes Amendment Act 1950.
The fact that land valuations are not continuously up to date has the effect in the preceding table of delaying the appearance of other than the steepest movements and of reducing their apparent magnitudes. Rural land values are generally conditioned by the prices received for exports of primary products, improved efficiency in farming methods, growth of population, improved internal transport, and other facilities, etc.
In the following table the gross values are analysed in more detail.
| As at 31 March | North Island | South Island | New Zealand | |||
|---|---|---|---|---|---|---|
| Capital Value (Land and Improvements) | Unimproved Value of Land (Included in Previous Column) | Capital Value (Land and Improvements) | Unimproved Value of Land (Included in Previous Column) | Capital Value (Land and Improvements) | Unimproved Value of Land (Included in Previous Column) | |
| $ (million) | ||||||
| Counties | ||||||
| 1961 | 1,796.3 | 517.7 | 922.1 | 348.9 | 2,718.4 | 866.6 |
| 1962 | 1,907.0 | 544.6 | 999.6 | 379.0 | 2,906.6 | 923.6 |
| 1963 | 1,989.5 | 583.7 | 1,051.5 | 402.1 | 3,040.9 | 985.7 |
| 1964 | 2,112.9 | 630.8 | 1,093.6 | 414.7 | 3,206.5 | 1,045.5 |
| 1965 | 2,243.2 | 662.6 | 1,155.6 | 435.5 | 3,398.7 | 1,098.1 |
| 1966 | 2,223.7 | 640.8 | 1,271.4 | 494.4 | 3,495.1 | 1,135.2 |
| Boroughs | ||||||
| 1961 | 2,762.8 | 786.3 | 996.2 | 249.9 | 3,759.0 | 1,036.1 |
| 1962 | 2,960.1 | 864.4 | 1,056.2 | 269.3 | 4,016.3 | 1,133.7 |
| 1963 | 3,205.0 | 939.4 | 1,106.2 | 283.6 | 4,311.3 | 1,223.0 |
| 1964 | 3,380.7 | 996.4 | 1,150.4 | 300.1 | 4,531.1 | 1,296.5 |
| 1965 | 3,795.3 | 1,186.6 | 1,242.4 | 355.7 | 5,037.7 | 1,542.2 |
| 1966 | 4,286.2 | 1,366.8 | 1,285.4 | 360.8 | 5,571.6 | 1,727.6 |
| Independent Town Districts | ||||||
| 1961 | 16.0 | 2.6 | 4.1 | 0.3 | 20.0 | 2.9 |
| 1962 | 18.7 | 3.4 | 4.2 | 0.3 | 22.9 | 3.7 |
| 1963 | 17.0 | 3.1 | 4.3 | 0.3 | 21.4 | 3.4 |
| 1964 | 18.3 | 3.5 | 4.5 | 0.3 | 22.8 | 3.8 |
| 1965 | 19.2 | 3.8 | 3.6 | 0.3 | 22.8 | 4.1 |
| 1966 | 14.3 | 2.6 | 4.1 | 0.3 | 18.3 | 2.8 |
| Grand Totals | ||||||
| 1955 | 2,955.9 | 810.4 | 1,180.7 | 347.9 | 4,136.6 | 1,158.3 |
| 1956 | 3,282.5 | 893.3 | 1,330.7 | 395.5 | 4,613.2 | 1,288.8 |
| 1957 | 3,500.6 | 953.6 | 1,492.1 | 441.5 | 4,992.7 | 1,395.1 |
| 1958 | 3,741.5 | 1,022.5 | 1,613.0 | 479.7 | 5,354.5 | 1,502.3 |
| 1959 | 3,955.1 | 1,099.1 | 1,709.4 | 511.5 | 5,664.5 | 1,610.6 |
| 1960 | 4,318.9 | 1,224.1 | 1,813.5 | 555.6 | 6,132.5 | 1,779.6 |
| 1961 | 4,575.0 | 1,306.6 | 1,922.4 | 599.1 | 6,497.4 | 1,905.7 |
| 1962 | 4,885.7 | 1,412.4 | 2,060.0 | 648.7 | 6,945.7 | 2,061.1 |
| 1963 | 5,211.5 | 1,526.2 | 2,162.1 | 686.0 | 7,373.6 | 2,212.1 |
| 1964 | 5,511.9 | 1,630.7 | 2,248.5 | 715.1 | 7,760.4 | 2,345.8 |
| 1965 | 6,057.6 | 1,853.0 | 2,401.6 | 791.5 | 8,459.2 | 2,644.5 |
| 1966 | 6,524.2 | 2,010.2 | 2,560.9 | 855.5 | 9,085.0 | 2,865.5 |
RATEABLE VALUES—The following summary indicates rateable values for counties, boroughs, and independent town districts as at 31 March 1966. The value of improvements in urban areas is much higher than in rural areas.
| Local Authority District | North Island | South Island | New Zealand | |||
|---|---|---|---|---|---|---|
| Capital Value (Land and Improvements) | Unimproved Value of Land (Included in Previous Column) | Capital Value (Land and Improvements) | Unimproved Value of Land (Included in Previous Column) | Capital Value (Land and Improvements) | Unimproved Value of Land (Included in Previous Column) | |
| $ (million) | ||||||
| Counties | 2,015.9 | 606.6 | 1,165.5 | 472.9 | 3,181.4 | 1,079.5 |
| Boroughs | 3.798.2 | 1,229.9 | 1,132.4 | 328.0 | 4,930.6 | 1,557.9 |
| Town districts (independent) | 12.0 | 2.3 | 3.6 | 0.3 | 15.6 | 2.5 |
| Totals | 5,826.1 | 1,838.8 | 2,301.6 | 801.2 | 8,127.7 | 2,639.9 |
The next table shows the percentage distribution of area and population as at 1 April 1966, and of rateable property values between the different types of local authority districts as at 31 March 1966.
| Local Authority District | Area | Population | Rateable Property Values | ||
|---|---|---|---|---|---|
| Capital Value | Unimproved Value | Value of Improvements | |||
| Percentage Distribution | |||||
| Counties | 99.2 | 31.7 | 39.1 | 40.9 | 38.3 |
| Boroughs | 0.8 | 67.9 | 60.7 | 59.0 | 61.5 |
| Town districts (independent) | – | 0.4 | 0.2 | 0.1 | 0.3 |
| Totals | 100.0 | 100.0 | 100.0 | 100.0 | 100.0 |
Particulars of values for each county, borough, and independent town district in considerable detail are contained in the Report on Local Authority Statistics, where similar data are also given for dependent town districts and for road districts.
VALUERS' REGISTRATION BOARD—The Valuers Act 1948 provides for the registration of land valuers and for some control of their work. There is a Registration Board under the chairmanship of the Valuer-General, which issues certificates for registration to all valuers and annual practising certificates to public valuers. The main objects of the Act are to secure a high standard of valuation work throughout the country and to encourage competent valuers. There were 364 classified as rural valuers, 379 as urban valuers, and 54 as both rural and urban valuers at 31 March 1966.
PORT DEVELOPMENT—The number of ports in use by overseas vessels has not changed greatly during the past 60 years since the pattern of trading was firmly established, but there has been an increasing emphasis on port development. The trend today is for fewer harbours to cater for overseas vessels, but with each port to be equipped with modern facilities to obtain a better turnround of ships. An Exports and Shipping Council was set up in 1965 to promote economy and efficiency in the handling of New Zealand's exports and to speed up the turnround of ships by streamlining procedures. Also, a Transport Commission is currently inquiring into port development, into carriage of goods to ports and cargo movements.
Streamlining primarily involves a reduction in the number of calls made by overseas ships at New Zealand ports, and such activities arise partly from the need to offset increases in the freight bill following rises in freight rates. (Outward freight on exports exceeds $90 million and inward freight on imports exceeds $70 million.) Planning is now taking place for prospective developments in the wider use of containers and other forms of unit loading in keeping with world-wide advances in cargo handling.
In recent years most harbour boards have undertaken extensive port development. New Zealand's first loan from the International Bank for Reconstruction and Development (the World Bank) was authorised in 1963 for port development. It involved $5.08 million which was loaned to the harbour boards of Auckland, Lyttelton, Napier, Timaru, and Whangarei.
Among major port improvements in recent years have been: a new wharf at Whangarei for the Marsden Point oil refinery; new overseas passenger terminal buildings at Auckland and Wellington; facilities for roll-on roll-off vehicle ferries at Wellington, Picton, and Lyttelton; the installation of all-weather mechanical loaders at Bluff and Timaru; extensions to the port of Tauranga to serve the growing timber, woodpulp, and paper industries of the Bay of Plenty area.
Additional information to that contained in this section on port, cargo, and shipping statistics may be found in the Report on Transport Statistics, an annual publication of the Department of Statistics.
PORT STATISTICS—Demands made on ports by overseas and coastal vessels is well illustrated in the following table, which gives the total number and tonnage of all calls made each year.
| Year | Overseas Vessels | Coastal Vessels | Total | |||
|---|---|---|---|---|---|---|
| Number of Calls | Net Tonnage | Number of Calls | Net Tonnage | Number of Calls | Net Tonnage | |
| tons (000) | tons (000) | tons (000) | ||||
| 1955 | 2,200 | 9,189 | 13,239 | 4,740 | 15,439 | 13,929 |
| 1956 | 2,268 | 9,753 | 12,984 | 4,855 | 15,252 | 14,608 |
| 1957 | 2,443 | 10,305 | 12,927 | 4,828 | 15,370 | 15,133 |
| 1958 | 2,977 | 11,880 | 12,735 | 4,793 | 15,712 | 16,673 |
| 1959 | 2,875 | 12,700 | 10,999 | 4,973 | 13,874 | 17,672 |
| 1960 | 3,124 | 13,549 | 10,249 | 4,978 | 13,373 | 18,527 |
| 1961 | 3,652 | 16,177 | 10,247 | 5,036 | 13,899 | 21,213 |
| 1962 | 3,603 | 16,457 | 10,654 | 5,467 | 14,257 | 21,924 |
| 1963 | 3,764 | 16,433 | 11,076 | 6,189 | 14,840 | 22,622 |
| 1964 | 3,568 | 15,690 | 10,653 | 7,022 | 14,221 | 22,711 |
| 1965 | 3,452 | 15,486 | 9,766 | 7,213 | 13,218 | 22,699 |
| 1966 | 3,605 | 16,784 | 9,427 | 8,063 | 13,032 | 24,847 |
Up to and including 1963 overseas ships made an increasing number of calls at ports while on the New Zealand coast. Since 1964 there has been some reduction in calls and the number is expected to fall further as the recommendation of Exports and Shipping Council are adopted. The average number of coastal calls by each overseas ship was 3.6 in 1962; 3.7 in 1963; 3.3 in 1964; 3.2 in 1965; and 3.2 in 1966. Movements of coastal vessels declined from 1953 to 1962 when the rail-road ferry Aramoana came into operation. The Aramoana displaced other coastal vessels but its daily return trips between Wellington and Picton have added to the number of calls at ports. The second rail-road ferry, Aranui, was brought into service in June 1966 and had a similar effect. Nevertheless, the total of coastal calls fell considerably in 1964, 1965, and 1966.
The following table shows for the three latest years the total entrances of shipping at the various ports. Overseas and coastal vessels calling at more than one port in the course of a single voyage have been recorded as entered at every port visited. The figures given in this section include all registered merchant vessels trading at New Zealand ports: thus they exclude naval vessels when engaged in their normal duties, private launches, lighters engaged in loading or unloading vessels in roadsteads, trawlers, other fishing vessels, and pleasure craft.
| Port | 1963 | 1964 | 1965 | |||
|---|---|---|---|---|---|---|
| Number | Tonnage | Number | Tonnage | Number | Tonnage | |
| Houhora | – | – | – | – | 7 | 1,065 |
| Awanui | 95 | 760 | 82 | 7,476 | 97 | 12,473 |
| Mangonui | 26 | 1,456 | 22 | 1,192 | 31 | 3,783 |
| Whangaroa | 88 | 3,078 | 57 | 1,415 | 51 | 3,077 |
| Bay of Islands | 96 | 244,789 | 68 | 164,908 | 87 | 192,512 |
| Whangarei | 742 | 467,111 | 912 | 1,444,970 | 997 | 2,188,051 |
| Auckland | 3,319 | 4,446,614 | 3,004 | 4,437,635 | 2,668 | 4,504,795 |
| Onehunga | 196 | 71,056 | 217 | 82,181 | 240 | 96,134 |
| Raglan | 65 | 21,708 | 54 | 19,414 | 48 | 15,412 |
| Thames | 146 | 2,431 | 55 | 488 | 14 | 1,946 |
| Coromandel | 119 | 5,530 | 119 | 5,183 | 88 | 3,947 |
| Whitianga | 74 | 1,718 | – | – | – | – |
| Tauranga | 350 | 942,156 | 336 | 920,882 | 325 | 860,513 |
| Ohope | 29 | 11,105 | 28 | 10,731 | 26 | 10,125 |
| Tokomaru Bay | 6 | 1,864 | 9 | 3,006 | 7 | 2,338 |
| Tolaga Bay | 8 | 2,439 | 7 | 2,099 | 4 | 1,323 |
| Gisborne | 256 | 222,298 | 228 | 191,519 | 212 | 182,312 |
| Napier | 494 | 1,276,316 | 468 | 1,268,073 | 454 | 1,215,968 |
| Taranaki | 326 | 1,013,408 | 293 | 925,841 | 285 | 880,162 |
| Wanganui | 219 | 85,587 | 183 | 68,774 | 148 | 63,275 |
| Wellington | 2,624 | 5,104,915 | 2,593 | 4,837,350 | 2,361 | 4,585,509 |
| Picton | 548 | 852,804 | 635 | 959,567 | 619 | 956,228 |
| Wairau | 73 | 7,227 | 78 | 7,722 | 39 | 3,862 |
| Nelson | 866 | 408,978 | 821 | 372,730 | 796 | 371,170 |
| Motueka | 284 | 34,512 | 235 | 25,652 | 200 | 23,153 |
| Tarakohe | 153 | 110,225 | 187 | 127,753 | 224 | 127,724 |
| Westport | 141 | 115,625 | 172 | 133,975 | 161 | 116,646 |
| Greymouth | 117 | 107,843 | 94 | 77,828 | 116 | 96,906 |
| Jackson Bay | – | – | 10 | 4,158 | 15 | 7,018 |
| Kaiapoi | 157 | 13,029 | 119 | 8,393 | 124 | 8,729 |
| Lyttelton | 1,339 | 3,531,508 | 1,235 | 3,194,046 | 1,140 | 3,116,594 |
| Timaru | 462 | 866,964 | 421 | 814,800 | 329 | 723,308 |
| Oamaru | 130 | 77,408 | 148 | 69,906 | 116 | 53,127 |
| Otago | 640 | 1,510,861 | 612 | 1,438,208 | 502 | 1,299,388 |
| Deep Cove | – | – | 32 | 38,066 | 27 | 31,036 |
| Bluff | 516 | 1,020,889 | 544 | 1,005,669 | 514 | 898,103 |
| Half-moon Bay | 136 | 38,127 | 143 | 40,826 | 146 | 41,751 |
| Totals | 14,840 | 22,622,339 | 14,221 | 22,712,436 | 13,218 | 22,699,463 |
In 1965 Wellington ranked as the first port of New Zealand as regards aggregate tonnage of shipping entered, followed by Auckland, Lyttelton. Whangarei, Otago, Napier, Picton, Bluff, Taranaki, Tauranga, and Timaru, in that order.
In the cases of Wellington, Lyttelton, Picton, Bluff, and Half-moon Bay, the figures are inflated by the recording of the regular inter-island steamer services.
All Calls of Overseas Vessels—The following table shows for the three latest years the number of calls and net tonnage of overseas vessels arriving at New Zealand ports, either direct or coastwise.
| Port | 1963 | 1964 | 1965 | |||
|---|---|---|---|---|---|---|
| Number of Calls | Tonnage of Vessels | Number of Calls | Tonnage of Vessels | Number of Calls | Tonnage of Vessels | |
| Bay of Islands | 44 | 240,669 | 30 | 160,744 | 34 | 189,131 |
| Whangarei | 64 | 267,147 | 100 | 902,564 | 138 | 1,299,025 |
| Auckland | 886 | 4,113,190 | 881 | 4,108,642 | 899 | 4,153,682 |
| Onehunga | 2 | 673 | 2 | 770 | 9 | 3,362 |
| Raglan | 1 | 385 | 2 | 770 | – | – |
| Tauranga | 283 | 918,126 | 280 | 897,535 | 270 | 841,129 |
| Gisborne | 26 | 141,666 | 27 | 123,323 | 26 | 131,412 |
| Napier | 280 | 1,193,366 | 265 | 1,116,575 | 245 | 1,038,992 |
| Taranaki | 209 | 956,533 | 186 | 868,198 | 158 | 775,196 |
| Wanganui | 3 | 864 | 5 | 1,162 | 2 | 768 |
| Wellington | 632 | 2,978,908 | 571 | 2,457,314 | 509 | 2,250,497 |
| Picton | 30 | 162,637 | 22 | 124,207 | 18 | 127,014 |
| Nelson | 78 | 264,828 | 71 | 231,972 | 73 | 227,578 |
| Westport | 5 | 762 | 11 | 4,042 | 11 | 3,559 |
| Greymouth | 1 | 288 | – | – | 1 | 1,239 |
| Lyttelton | 514 | 2,170,462 | 457 | 1,863,154 | 455 | 1,917,051 |
| Timaru | 153 | 728,280 | 147 | 697,640 | 144 | 638,238 |
| Oamaru | 7 | 12,439 | 2 | 2,530 | 3 | 6,279 |
| Otago | 325 | 1,350,728 | 289 | 1,209,862 | 263 | 1,069,300 |
| Deep Cove | – | – | 4 | 15,717 | 9 | 9,222 |
| Bluff | 221 | 931,122 | 216 | 903,281 | 185 | 803,533 |
| Totals | 3,764 | 16,433,073 | 3,568 | 15,690,002 | 3,452 | 15,486,207 |
The inward overseas tonnages of ships in the preceding table are converted to percentages for the major ports in the next table.
| Port | 1,961 | 1,962 | 1,963 | 1,964 | 1,965 |
|---|---|---|---|---|---|
| percent | |||||
| Whangarei | 0.9 | 1.3 | 1.6 | 5.8 | 8.4 |
| Auckland | 25.9 | 25.2 | 25.1 | 26.2 | 26.8 |
| Tauranga | 4.8 | 4.7 | 5.6 | 5.7 | 5.4 |
| Napier | 6.8 | 7.6 | 7.3 | 7.1 | 6.7 |
| Taranaki | 6.0 | 5.8 | 5.8 | 5.5 | 5.0 |
| Wellington | 19.6 | 18.3 | 18.1 | 15.6 | 14.6 |
| Other North Island | 2.6 | 2.4 | 2.3 | 1.9 | 2.1 |
| North Island | 66.6 | 65.3 | 65.8 | 67.8 | 69.0 |
| Lyttelton | 13.2 | 12.8 | 13.2 | 11.9 | 12.4 |
| Timaru | 4.2 | 5.0 | 4.4 | 4.4 | 4.1 |
| Otago | 8.8 | 8.8 | 8.2 | 7.7 | 6.9 |
| Bluff | 4.9 | 5.6 | 5.7 | 5.8 | 5.2 |
| Other South Island | 2.3 | 2.5 | 2.7 | 2.4 | 2.4 |
| South Island | 33.4 | 34.7 | 34.2 | 32.2 | 31.0 |
OVERSEAS SHIPPING: Ports of Arrival and Departure—The next table shows the extent to which various ports were made the first port of arrival or the last port of departure by overseas vessels during the latest three years.
| Port | Entered as First Call | Cleared as Last Call | ||||
|---|---|---|---|---|---|---|
| 1963 | 1,964 | 1,965 | 1,963 | 1,964 | 1,965 | |
| net tonnage of vessels | ||||||
| Whangarei | 107,903 | 737,052 | 1,143,428 | 101,003 | 761,209 | 1,100,738 |
| Auckland | 2,698,585 | 2,768,302 | 2,663,286 | 1,881,174 | 1,821,978 | 1,902,390 |
| Onehunga | – | 770 | 1,480 | – | – | 1,874 |
| Raglan | – | 385 | – | – | – | – |
| Tauranga | 137,754 | 164,226 | 157,135 | 460,330 | 501,527 | 515,189 |
| Gisborne | 288 | 7,583 | 8,435 | 10,093 | 4,240 | 6,941 |
| Napier | 68,215 | 98,052 | 81,778 | 246,975 | 284,575 | 218,054 |
| Taranaki | 132,532 | 117,531 | 127,181 | 221,460 | 238,713 | 175,204 |
| Wanganui | 288 | – | 770 | – | 288 | 385 |
| Wellington | 1,084,410 | 857,700 | 808,534 | 766,719 | 680,081 | 614,327 |
| Picton | 23,041 | 19,993 | 12,886 | 40,183 | 21,054 | 44,730 |
| Nelson | 5,990 | 24,091 | 58,484 | 76,728 | 43,157 | 15,147 |
| Greymouth | 288 | 1,171 | 1,908 | – | – | 477 |
| Lyttelton | 387,492 | 420,644 | 344,112 | 309,811 | 233,603 | 253,340 |
| Timaru | 49,498 | 87,891 | 66,339 | 77,831 | 91,519 | 121,430 |
| Otago | 82,729 | 47,370 | 63,302 | 358,874 | 290,546 | 323,123 |
| Deep Cove | – | 6,511 | 1,992 | – | 10,222 | 7,060 |
| Bluff | 130,825 | 81,957 | 83,402 | 324,604 | 375,729 | 244,732 |
| Totals | 4,909,838 | 5,441,229 | 5,624,452 | 4,875,785 | 5,358,441 | 5,545,141 |
As will be seen, in 1965, 62 percent of overseas vessels (on a tonnage basis) arriving in New Zealand made Auckland or Wellington their first port of entry, and 45 percent used one of these two ports as the final departure point. Most of the tonnage at Whangarei comprises overseas oil tankers, whose calls are practically limited to that port.
Passengers—The overseas passenger traffic is concentrated principally at Auckland and Wellington. Small numbers of overseas passengers, however, arrive at and leave from the other ports. The following table gives the numbers of passengers arriving at and departing from each port for the latest five years.
| Port | Passengers Arriving from Overseas | Passengers Departing for Overseas | ||||||||
|---|---|---|---|---|---|---|---|---|---|---|
| Year Ended 31 March | Year Ended 31 March | |||||||||
| 1961 | 1,962 | 1,963 | 1,964 | 1,965 | 1,961 | 1,962 | 1,963 | 1,964 | 1,965 | |
| Auckland | 21,376 | 29,310 | 23,885 | 26,845 | 25,671 | 21,110 | 23,089 | 21,954 | 22,938 | 23,534 |
| Napier | 11 | 32 | 36 | 29 | 29 | 176 | 156 | 165 | 51 | 145 |
| Wellington | 17,054 | 19,922 | 21,455 | 15,413 | 15,224 | 16,308 | 12,153 | 12,725 | 10,163 | 10,790 |
| Lyttelton | 813 | 1,160 | 334 | 297 | 309 | 230 | 208 | 290 | 221 | 212 |
| Dunedin | 42 | 88 | 17 | 22 | 17 | 129 | 515 | 53 | 98 | 84 |
| Invercargill | .. | .. | .. | 62 | 33 | .. | .. | .. | 115 | 114 |
| Other | 67 | 104 | 364 | 222 | 557 | 586 | 219 | 569 | 138 | 361 |
| Totals | 39,363 | 50,616 | 46,091 | 42,890 | 41,840 | 38,539 | 36,340 | 35,756 | 33,724 | 35,240 |
Entrances and Clearances of Overseas Vessels—The following table gives the number and net tonnage of overseas vessels entering and clearing New Zealand ports during the last 11 years (recorded at the first port of arrival and final port of departure only), and distinguishes those entered and cleared “with cargo” from those “in ballast”.
| Year | With Cargo | In Ballast* | Total | |||
|---|---|---|---|---|---|---|
| Vessels | Net Tonnage | Vessels | Net Tonnage | Vessels | Net Tonnage | |
| * “In ballast” means (a) inwards—“having no cargo for discharge in New Zealand”, such as cruise ships and vessels to load exports; (b) outwards—“having no cargo loaded in New Zealand”, such as cruise ships, empty tankers, and phosphate ships. | ||||||
| Entered | ||||||
| 1956 | 720 | 3,022,713 | 60 | 341,835 | 780 | 3,364,548 |
| 1957 | 795 | 3,503,875 | 101 | 436,064 | 896 | 3,939,939 |
| 1958 | 794 | 3,445,543 | 135 | 608,225 | 929 | 4,053,768 |
| 1959 | 750 | 3,355,648 | 133 | 671,477 | 883 | 4,027,125 |
| 1960 | 818 | 3,800,255 | 154 | 700,637 | 972 | 4,500,892 |
| 1961 | 865 | 4,150,015 | 173 | 803,914 | 1,038 | 4,953,929 |
| 1962 | 850 | 4,054,820 | 141 | 734,012 | 991 | 4,788,832 |
| 1963 | 883 | 4,145,525 | 146 | 764,313 | 1,029 | 4,909,838 |
| 1964 | 901 | 4,592,275 | 169 | 848,954 | 1,070 | 5,441,229 |
| 1965 | 897 | 4,637,483 | 171 | 986,969 | 1,068 | 5,624,452 |
| 1966 | 915 | 4,981,326 | 203 | 1,147,143 | 1,118 | 6,128,469 |
| Cleared | ||||||
| 1956 | 464 | 2,017,829 | 321 | 1,346,892 | 785 | 3,364,721 |
| 1957 | 549 | 2,488,506 | 346 | 1,451,350 | 895 | 3,939,856 |
| 1958 | 554 | 2,495,808 | 357 | 1,478,484 | 911 | 3,974,292 |
| 1959 | 577 | 2,506,593 | 326 | 1,608,136 | 903 | 4,114,729 |
| 1960 | 610 | 2,643,682 | 351 | 1,764,743 | 961 | 4,408,425 |
| 1961 | 651 | 2,999,025 | 380 | 1,924,397 | 1,031 | 4,923,422 |
| 1962 | 680 | 3,064,190 | 320 | 1,821,239 | 1,000 | 4,885,429 |
| 1963 | 730 | 3,043,665 | 304 | 1,832,120 | 1,034 | 4,875,785 |
| 1964 | 733 | 3,385,294 | 319 | 1,973,147 | 1,052 | 5,358,441 |
| 1965 | 743 | 3,280,389 | 325 | 2,264,752 | 1,068 | 5,545,141 |
| 1966 | 737 | 3,294,918 | 381 | 2,805,989 | 1,118 | 6,100,907 |
Direction of Overseas Shipping—Particulars of the number and net tonnage of vessels entered and cleared between New Zealand and various countries are given in the following table.
| Country | 1964 | 1965 | ||||||
|---|---|---|---|---|---|---|---|---|
| Entered | Cleared | Entered | Cleared | |||||
| No. | Net Tonnage | No. | Net Tonnage | No. | Net Tonnage | No. | Net Tonnage | |
| * Excludes vessels entering from or clearing to Singapore from 9 August 1965. | ||||||||
| Australia | 384 | 1,435,972 | 428 | 1,563,382 | 376 | 1,411,045 | 408 | 1,407,240 |
| Bahrein | 3 | 17,709 | 2 | 12,163 | – | – | 3 | 19,369 |
| Belgium | 5 | 23,411 | 1 | 5,867 | 2 | 8,392 | 1 | 6,187 |
| Canada | 35 | 192,703 | 13 | 79,721 | 33 | 155,428 | 24 | 139,112 |
| Fiji | 44 | 137,589 | 29 | 105,435 | 47 | 195,094 | 39 | 183,423 |
| France | 2 | 7,657 | 19 | 96,231 | 3 | 10,927 | 26 | 136,324 |
| French Polynesia | 19 | 105,430 | 19 | 113,806 | 13 | 63,624 | 21 | 134,841 |
| Germany, West | 16 | 77,195 | 8 | 47,968 | 19 | 91,087 | 5 | 25,625 |
| Gilbert and Ellice Islands | 9 | 54,649 | 10 | 55,382 | 10 | 59,584 | 13 | 68,645 |
| Hong Kong | 12 | 18,220 | 10 | 29,241 | 10 | 29,468 | 12 | 40,681 |
| India | 15 | 62,624 | 3 | 28,827 | 9 | 35,647 | 5 | 22,437 |
| Iran | 17 | 230,763 | 23 | 244,675 | 17 | 222,592 | 31 | 365,514 |
| Japan | 94 | 298,561 | 116 | 379,017 | 93 | 324,548 | 119 | 394,165 |
| Kuwait | 20 | 365,055 | 9 | 130,617 | 28 | 489,956 | 15 | 252,723 |
| Malaysia* | 16 | 104,312 | 24 | 253,559 | 17 | 133,416 | 16 | 146,190 |
| Nauru | 37 | 207,702 | 28 | 157,299 | 27 | 158,543 | 21 | 123,365 |
| Netherlands Antilles | 11 | 74,367 | 6 | 38,912 | 3 | 17,746 | 1 | 7,784 |
| South Africa | 8 | 20,531 | 2 | 11,364 | 14 | 39,831 | 3 | 8,183 |
| Tonga | 15 | 35,650 | 8 | 45,690 | 17 | 39,504 | 8 | 25,793 |
| United Kingdom | 149 | 1,059,864 | 145 | 1,104,236 | 143 | 1,057,467 | 155 | 1,122,901 |
| United States | 79 | 479,953 | 56 | 336,562 | 83 | 510,421 | 53 | 358,398 |
| Other countries | 80 | 431,312 | 93 | 517,987 | 104 | 570,132 | 89 | 556,241 |
| Totals | 1,070 | 5,441,229 | 1,052 | 5,358,441 | 1,068 | 5,624,452 | 1,068 | 5,545,141 |
CARGO STATISTICS—With cargo statistics it should be noted that the term “ton” does not invariably denote a weight of 2,240 lb. It is practicable to obtain the actual weights involved for only a portion of the goods handled. In other cases close approximations are made by applying uniform formulas as to the number of bales, cases, sacks, etc., to the ton. A considerable portion of trading goods, however, is recorded in measurement tons, 40 cubic feet of space being regarded as the equivalent of a ton. As the practice is uniform, comparisons from year to year are not appreciably affected, nor are comparisons between ports, unless there is a radical difference in the class of trade carried on, in which case recourse should be had to consideration of items of trade. Since a much larger proportion of imports are in measurement tons direct comparisons of tonnages of imports and exports are not always valid.
The following table gives a summary of the tonnage of cargo handled at all ports for the last 11 years.
| Year | Inward* | Transhipments | Outward* | Total Tonnage† | ||
|---|---|---|---|---|---|---|
| Coastal | Overseas | Coastal | Overseas | |||
* Excluding transhipments. †Transhipments Included twice. ‡ Excluding landings of sand, shingle and shell not loaded at ports. | ||||||
| tons (000) | ||||||
| 1956 | 2,149 | 4,947 | 190 | 1,944 | 1,556 | 10,976 |
| 1957 | 2,253 | 5,169 | 174 | 1,964 | 1,611 | 11,345 |
| 1958 | 2,259 | 4,865 | 148 | 2,018 | 1,665 | 11,104 |
| 1959 | 2,180 | 4,495 | 128 | 1.930 | 1,913 | 10,772 |
| 1960 | 2,283 | 5,059 | 110 | 1,996 | 1,933 | 11,490 |
| 1961 | 2,433 | 5,704 | 158 | 2,164 | 1,983 | 12,600 |
| 1962 | 2,464 | 5,157 | 116 | 2,231 | 2,045 | 12,130 |
| 1963 | 2,882 | 5,697 | 109 | 2,550 | 2,120 | 13,467 |
| 1964 | 3,838 | 7,187 | 103 | 3,504 | 2,593 | 17,328 |
| 1965‡ | 4,636 | 7,181 | 85 | 4,680 | 2,574 | 19,241 |
| 1966 | 5,221 | 7,942 | 74 | 5,183 | 2,677 | 21,171 |
Since the opening of the oil refinery at Whangarei on 30 May 1964 the pattern of the statistics for coastal shipping has been substantially altered. Oil is now brought to New Zealand mostly in crude form to Whangarei, and the oil products amounting to some 2 million tons annually are distributed as outward coastal cargo from Whangarei and as inward coastal cargo at the other major ports which previously received the oil products direct from overseas.
The next table shows for each port the total inward and outward cargo in 1965. Loadings of bunker fuels amounting to 269,148 tons are not included.
| Port | Inward* | Transhipments | Outward* | Total Tonnage† | ||
|---|---|---|---|---|---|---|
| Coastal | Overseas | Coastal | Overseas | |||
* Excluding transhipments. †Transhipments included twice. | ||||||
| manifest tons | ||||||
| Houhora | 1,501 | – | – | 34 | – | 1,535 |
| Awanui | 2,863 | – | – | 160 | – | 3,023 |
| Mangonui | 4,512 | – | – | – | – | 4,512 |
| Whangaroa | 3,785 | – | – | 22 | – | 3,807 |
| Bay of Islands | 4,548 | 1,200 | – | – | 31,055 | 36,803 |
| Whangarei | 120,442 | 2,725,775 | – | 2,229,486 | 257,597 | 5,333,300 |
| Auckland | 983,073 | 1,854,529 | 33,084 | 136,364 | 574,462 | 3,614,596 |
| Onehunga | 131,454 | 1,448 | 152 | 135,621 | 2,129 | 270,956 |
| Raglan | 14,573 | – | – | 1,910 | – | 16,483 |
| Tauranga | 216,117 | 215,010 | – | 25,358 | 541,844 | 998,329 |
| Ohope | 2,538 | – | – | 15,061 | – | 17,599 |
| Tokomaru Bay | – | – | – | 1,022 | – | 1,022 |
| Tolaga Bay | 679 | – | – | 822 | – | 1,501 |
| Gisborne | 37,077 | 1,844 | – | 22,631 | 15,849 | 77,401 |
| Napier | 253,222 | 233,718 | 966 | 18,266 | 156,489 | 663,627 |
| Taranaki | 151,579 | 284,129 | 315 | 6,061 | 148,798 | 591,197 |
| Wanganui | 104,045 | 1,229 | – | 4,719 | – | 109,993 |
| Wellington | 1,071,810 | 845,972 | 39,348 | 608,810 | 202,230 | 2,807,518 |
| Picton | 385,968 | – | 182 | 326,931 | 18,162 | 731,425 |
| Wairau | 2,185 | – | – | 1,024 | – | 3,209 |
| Nelson | 129,339 | 25,246 | 871 | 86,040 | 69,346 | 311,713 |
| Motueka | 5,415 | – | – | 14,636 | – | 20,051 |
| Tarakohe | 25,965 | – | – | 197,805 | – | 223,770 |
| Westport | 4,198 | 2,721 | – | 201,399 | – | 208,318 |
| Greymouth | 6,512 | 511 | – | 171,529 | 6 | 178,558 |
| Jackson Bay | 86 | – | – | 6,523 | – | 6,609 |
| Kaiapoi | 13,181 | – | – | 16,740 | – | 29,921 |
| Lyttelton | 484,879 | 577,231 | 2,152 | 264,624 | 148,903 | 1,479,941 |
| Timaru | 83,886 | 29,267 | – | 62,029 | 170,566 | 345,748 |
| Oamaru | 9,219 | 999 | – | 21,816 | 652 | 32,686 |
| Otago | 230,952 | 217,798 | 7,947 | 64,744 | 86,930 | 616,318 |
| Deep Cove | 17,548 | 473 | – | 508 | – | 18,529 |
| Bluff | 130,173 | 162,322 | – | 35,770 | 148,535 | 476,800 |
| Half-moon Bay | 2,474 | – | – | 1,473 | – | 3,947 |
| Totals | 4,635,798 | 7,181,422 | 85,017 | 4,679,938 | 2,573,553 | 19,240,745 |
Transhipments—Developments in shipping and other transport services have led to a decline in the volume of cargo transhipped, the tonnage handled during 1965 being the lowest ever recorded. Transhipments during 1965 totalled 85,017 tons, of which 39,348 tons (46.3 percent) were handled at Wellington, and 33,084 tons (38.9 percent) were handled at Auckland. Wellington continues to handle the bulk of the overseas to coastal (and vice versa) trade, but Auckland's position in relation to the Pacific Islands makes this the natural port for the transhipment of overseas cargo to this area.
Inward Overseas Cargo—The following table shows the tonnages of some major items of inward overseas cargo handled in 1965. Transhipments are included.
| Port | Fresh Fruit | Grain | Gypsum, Plaster of Paris | Iron and Steel | Machinery | Fertilisers | Motor Spirit, Kerosene |
|---|---|---|---|---|---|---|---|
| manifest tons | |||||||
| Bay of Islands | – | – | – | – | – | 1,200 | – |
| Whangarei | – | – | 12,267 | 1,345 | 5,030 | 113,990 | – |
| Auckland | 61,760 | 96,766 | 53,526 | 260,019 | 75,436 | 348,094 | 129,799 |
| Tauranga | – | 39,224 | – | 12,754 | 20 | 117,335 | 11,661 |
| Gisborne | – | – | – | 933 | – | – | – |
| Napier | – | – | 95 | 16,944 | 1,767 | 181,962 | – |
| Taranaki | 9 | – | – | 9,314 | – | 206,682 | 39,228 |
| Wellington | 10,768 | 22,375 | 567 | 107,174 | 34,641 | 3,049 | 104,246 |
| Nelson | – | – | 7,483 | 3,234 | 1,848 | 5,362 | – |
| Westport | – | – | 2,090 | – | – | – | – |
| Lyttelton | 22,224 | 4 | 20,358 | 66,284 | 19,264 | 107,991 | 93.502 |
| Timaru | 1,089 | – | 8 | 3,795 | 2,382 | 2,317 | 5,845 |
| Otago | – | – | 7,681 | 25,166 | 4,229 | 87,390 | 10,767 |
| Bluff | – | – | 500 | 17,570 | 3,638 | 87,840 | 15,194 |
| All other ports | 30 | – | – | 784 | 4 | – | – |
| Totals | 95,880 | 158,369 | 104,575 | 525,316 | 148,259 | 1,263,212 | 410,242 |
| Port | Motor Vehicles and Parts | Oil, Other Minerals | Sugar | Textiles | All Other Goods | Total |
|---|---|---|---|---|---|---|
| manifest tons | ||||||
| Bay of Islands | – | – | – | – | – | 1,200 |
| Whangarei | 3 | 2,588,402 | – | – | 4,738 | 2,725,775 |
| Auckland | 100,056 | 15,380 | 143,172 | 59,883 | 539,503 | 1,883,394 |
| Tauranga | – | – | – | – | 34,016 | 215,010 |
| Gisborne | – | – | – | – | 911 | 1,844 |
| Napier | 116 | – | – | 23 | 33,045 | 233,952 |
| Taranaki | 696 | – | – | – | 28,515 | 284,444 |
| Wellington | 195,751 | 31,008 | – | 33,680 | 334,271 | 877,530 |
| Nelson | 2,977 | – | 863 | 9 | 4,065 | 25,841 |
| Westport | – | – | – | – | 631 | 2,721 |
| Lyttelton | 31,563 | 2,095 | 10 | 25,343 | 190,727 | 579,365 |
| Timaru | 432 | 6 | – | 149 | 13,244 | 29,267 |
| Otago | 5,023 | 2,639 | 2 | 7,492 | 75,315 | 225,704 |
| Bluff | 1,606 | – | – | 642 | 35,332 | 162,322 |
| All other ports | 13 | – | – | – | 3,872 | 4,703 |
| Totals | 338,236 | 2,639,530 | 144,047 | 127,221 | 1,298,185 | 7,253,072 |
Outward Overseas Cargo—In the section dealing with the export trade it is pointed out that pastoral products make up over 90 percent of New Zealand's exports. The following table shows how the various ports participated in the handling of the main pastoral produce items in the outward overseas cargo, including transhipments, during 1965. Although pastoral products constitute the bulk of New Zealand's exports on a value basis, a number of other types of commodities constitute an important part of the total outward overseas cargo. The table shows the extent to which ports of loading participated in the handling of the major remaining items.
| Port | Butter | Cheese | Other Milk Products | Frozen and Reserved Meat | Hides and Skins | Tallow | Wool |
|---|---|---|---|---|---|---|---|
| manifest tons | |||||||
| Bay of Islands | 13,646 | – | 5,946 | 10,589 | 108 | 729 | 34 |
| Whangarei | 15,670 | – | 670 | 29 | – | 55 | – |
| Auckland | 131,297 | 17,544 | 145,670 | 99,823 | 17,137 | 16,507 | 50,359 |
| Onehunga | 14 | 7 | 21 | 149 | – | 2 | – |
| Tauranga | – | 39 | 3,218 | – | – | 488 | 882 |
| Gisborne | 4,528 | – | – | 8,540 | 521 | 571 | 1,526 |
| Napier | – | – | 575 | 54,503 | 6,925 | 5,569 | 53,051 |
| Taranaki | 14,627 | 66,476 | 9,354 | 43,738 | 3,755 | 3,559 | 3,467 |
| Wellington | 10,487 | 7,808 | 19,477 | 65,133 | 11,197 | 5,340 | 51,495 |
| Picton | – | – | – | 4,482 | 6 | 593 | 501 |
| Nelson | 465 | 1,189 | 171 | 3,101 | 64 | 268 | 278 |
| Greymouth | – | – | – | – | – | – | – |
| Lyttelton | 479 | 350 | 659 | 53,585 | 9,514 | 7,568 | 31,656 |
| Timaru | – | 1,205 | 268 | 50,786 | 3,377 | 3,425 | 18,550 |
| Oamaru | – | – | – | – | – | – | – |
| Otago | 45 | 1,138 | 309 | 35,131 | 4,999 | 4,374 | 27,789 |
| Bluff | 153 | 5,740 | 767 | 87,194 | 6,695 | 8,315 | 32,980 |
| Totals | 191,411 | 101,496 | 187,105 | 516,783 | 64,298 | 57,363 | 272,568 |
| Port | Fresh Fruit | Beans and Peas | Paper, Newsprint, etc. | Timber, Softwood | Wood Pulp | All Other Goods | Total |
|---|---|---|---|---|---|---|---|
| manifest tons | |||||||
| Bay of Islands | – | – | – | – | – | 3 | 31,055 |
| Whangarei | – | – | – | – | – | 241,173 | 257,597 |
| Auckland | 3,903 | 141 | 2,805 | 10,438 | 265 | 87,886 | 583,775 |
| Onehunga | 270 | – | – | 53 | – | 1,616 | 2,132 |
| Tauranga | 18 | – | 111,507 | 363,174 | 57,005 | 5,513 | 541,844 |
| Gisborne | – | – | – | – | – | 163 | 15,849 |
| Napier | 22,980 | 13 | – | – | – | 13,601 | 157,217 |
| Taranaki | – | – | – | – | – | 3,822 | 148,798 |
| Wellington | 996 | 1,842 | 69 | 2,310 | – | 32,259 | 208,413 |
| Picton | 11,780 | 236 | – | – | – | 746 | 18,344 |
| Nelson | 48,908 | 227 | – | 12,330 | – | 2,345 | 69,346 |
| Greymouth | – | – | – | – | – | 6 | 6 |
| Lyttelton | 913 | 9,162 | 270 | 74 | – | 34,675 | 148,905 |
| Timaru | – | 2,599 | 22 | 82,344 | – | 7,990 | 170,566 |
| Oamaru | – | – | – | – | – | 652 | 652 |
| Otago | 1,745 | 652 | – | 6 | – | 10,742 | 86,930 |
| Bluff | – | 144 | 1 | 362 | – | 6,184 | 148,535 |
| Totals | 91,513 | 15,016 | 114,674 | 471,091 | 57,270 | 449,376 | 2,589,964 |
Shipping Between New Zealand and Island Dependencies—In the tables of overseas shipping no account is taken of ships moving between the main islands of New Zealand and the island dependencies. Information on cargoes will be found in Section 38, N.Z. Territory Overseas.
SHIPPING ON INLAND WATERS—Although New Zealand is well supplied with rivers few can be used by shipping for other than short distances. There are no regular passenger or cargo services on any of the livers. The only inland-water shipping of consequence is the service on Lake Wakatipu operated with the Earnslaw. This vessel is the property of the New Zealand Railways. Passengers and cargo are carried from the rail head at Kingston to Queenstown and to other points on the shores of the lake. Farmers made use of this service for transporting livestock until the construction of a new road from Queenstown to Glenorchy. The next table shows the operations of this service during the latest five years.
| Year Ended 31 March | Passengers | Livestock | Timber | Other Goods | Revenue | Expenditure |
|---|---|---|---|---|---|---|
| No. | No. | super. ft. (000) | tons | $ | $ | |
| 1962 | 35,976 | 17,535 | 295 | 4,108 | 49,226 | 67,422 |
| 1963 | 36,651 | 11,909 | 140 | 3,611 | 45,014 | 71,002 |
| 1964 | 36,978 | 12,296 | 162 | 3,577 | 42,294 | 69,552 |
| 1965 | 25,432 | 3,242 | 139 | 4,158 | 38,254 | 69,648 |
| 1966 | 21,943 | 827 | 304 | 4,144 | 35,816 | 71,526 |
REGISTRY OF OVERSEAS SHIPS—The following table shows the country of registry of vessels arriving in New Zealand during the latest six years.
| Country of Registry | 1,960 | 1,961 | 1,962 | 1,963 | 1,964 | 1,965 |
|---|---|---|---|---|---|---|
| net tons(000) | ||||||
| British Commonwealth— | ||||||
| United Kingdom | 2,239 | 2,541 | 2,516 | 2,561 | 2,704 | 2,605 |
| New Zealand | 484 | 428 | 422 | 423 | 472 | 470 |
| Other British Commonwealth | 243 | 269 | 214 | 130 | 29 | 35 |
| With cargo | 2,559 | 2,812 | 2,702 | 2,609 | 2,728 | 2,618 |
| In ballast | 407 | 426 | 450 | 505 | 477 | 493 |
| Totals, British Commonwealth countries | 2,966 | 3,238 | 3,152 | 3,114 | 3,205 | 3,111 |
| Percentage of total | 66 | 65 | 66 | 63 | 59 | 55 |
| Other— | ||||||
| Norway | 272 | 363 | 334 | 428 | 469 | 500 |
| Sweden | 101 | 91 | 95 | 91 | 140 | 159 |
| Netherlands | 324 | 373 | 398 | 353 | 343 | 321 |
| Panama | 66 | 80 | 111 | 98 | 111 | 59 |
| United States of America | 394 | 372 | 278 | 222 | 213 | 187 |
| Remaining countries | 378 | 437 | 421 | 604 | 960 | 1,287 |
| With cargo | 1,242 | 1,338 | 1,353 | 1,537 | 1,864 | 2,019 |
| In ballast | 293 | 378 | 284 | 259 | 372 | 494 |
| Totals, other countries | 1,535 | 1,716 | 1,637 | 1,796 | 2,236 | 2,513 |
| Percentage of total | 34 | 35 | 34 | 37 | 41 | 45 |
| Grand totals | 4,501 | 4,954 | 4,789 | 4,910 | 5,441 | 5,624 |
NEW ZEALAND SHIPPING REGISTER—The figures for vessels registered in New Zealand as at the end of each of the last 11 years are as follows.
| Year | Sailing Vessels | Steam and Motor Vessels | Totals | ||||||
|---|---|---|---|---|---|---|---|---|---|
| Vessels | Gross Tonnage | Net Tonnage | Vessels | Gross Tonnage | Net Tonnage | Vessels | Gross Tonnage | Net Tonnage | |
| 1956 | 37 | 1,831 | 1,497 | 481 | 258,924 | 132,547 | 518 | 260,755 | 134,044 |
| 1957 | 36 | 1,821 | 1,487 | 490 | 264,309 | 134,669 | 526 | 266,130 | 136,156 |
| 1958 | 36 | 1,821 | 1.487 | 495 | 271,179 | 137,660 | 531 | 273,000 | 139,147 |
| 1959 | 41 | 2,338 | 1,898 | 490 | 260,248 | 131,409 | 531 | 262,586 | 133,307 |
| 1960 | 42 | 2,471 | 2,031 | 491 | 243,008 | 122,631 | 533 | 245,479 | 124,662 |
| 1961 | 42 | 2,471 | 2,031 | 503 | 241,096 | 120,992 | 545 | 243,567 | 123,023 |
| 1962 | 40 | 2,652 | 2,096 | 493 | 250,399 | 124,724 | 533 | 253,051 | 126,820 |
| 1963 | 50 | 4,051 | 3,505 | 496 | 244,047 | 120,603 | 546 | 248,098 | 124,108 |
| 1964 | 53 | 4,180 | 3,628 | 521 | 251,032 | 122,798 | 574 | 255,212 | 126,426 |
| 1965 | 60 | 4,274 | 3,698 | 534 | 235,503 | 114,308 | 594 | 239,777 | 118,006 |
| 1966 | 65 | 4,335 | 3,720 | 556 | 238,149 | 112,520 | 621 | 242,484 | 116,240 |
In the table which follows, the vessels on the New Zealand register at 31 December 1965 are classified into sailing, steam, and motor, and are listed for the various ports of registry.
| Port of Registry | Sailing Vessels | Steam Vessels | Motor Vessels | ||||||
|---|---|---|---|---|---|---|---|---|---|
| Vessels | Gross Tonnage | Net Tonnage | Vessels | Gross Tonnage | Net Tonnage | Vessels | Gross Tonnage | Net Tonnage | |
| Whangarei | 3 | 61 | 53 | – | – | – | 6 | 893 | 53 |
| Auckland | 43 | 3,982 | 3,461 | 13 | 3,986 | 1,772 | 332 | 59,382 | 28,161 |
| Napier | – | – | – | 1 | 819 | 449 | 8 | 3,677 | 1,543 |
| Wellington | 11 | 136 | 95 | 22 | 46,269 | 22,428 | 74 | 77,556 | 40,032 |
| Nelson | – | – | – | – | – | – | 24 | 7,101 | 2,960 |
| Lyttelton | 1 | 5 | 2 | 6 | 4,695 | 1,774 | 14 | 2,953 | 1,365 |
| Timaru | 1 | 5 | 2 | – | – | – | 1 | 1,240 | 497 |
| Otago | – | – | – | 2 | 2,435 | 995 | 15 | 22,993 | 11,710 |
| Bluff | 1 | 85 | 85 | 2 | 969 | 368 | 14 | 535 | 201 |
| Totals | 60 | 4,274 | 3,698 | 46 | 59,173 | 27,786 | 488 | 176,330 | 86,522 |
Auckland is the port of registry of the majority of the vessels forming New Zealand's “mosquito” fleet, the average net tonnage of the 388 vessels on the Auckland register being only 86 tons.
In the next table vessels registered in New Zealand at the end of 1965 have been classified according to whether employed in the coastal or the foreign trade. The totals given therein do not agree with those shown above, as vessels employed exclusively within “restricted limits” and pleasure craft are not included.
| Size of Vessels | Employed in the Coastal Trade Only | Employed Partly in the Coastal and Partly in the Foreign Trade | Employed in the Foreign Trade Only | |||
|---|---|---|---|---|---|---|
| Number of Vessels | Net Tonnage | Number of Vessels | Net Tonnage | Number of Vessels | Net Tonnage | |
| Net tons | ||||||
| 1–49 | 32 | 615 | – | – | – | – |
| 50– 99 | 15 | 1,057 | – | – | – | – |
| 100– 199 | 9 | 1,122 | – | – | – | – |
| 200– 299 | 5 | 1,263 | – | – | – | – |
| 300– 399 | 15 | 5,478 | 1 | 377 | – | – |
| 400– 599 | 8 | 3,684 | – | – | – | – |
| 600– 799 | 1 | 691 | – | – | – | – |
| 800– 999 | 1 | 807 | 1 | 909 | 4 | 3,599 |
| 1,000–1,199 | – | – | – | – | – | – |
| 1,200–1,499 | 3 | 4,015 | – | – | 12 | 15,974 |
| 1,500–1,999 | – | – | – | – | 15 | 29,157 |
| 2,000 and over | 4 | 12,091 | – | – | 9 | 25,978 |
| Totals | 93 | 30,823 | 2 | 1,286 | 40 | 74,708 |
MARINE OFFICERS' CERTIFICATES—The examinations for masters, mates, and engineers serving in the Mercantile Marine are conducted by the Marine Department, the regulations relating to these examinations being based upon those of the United Kingdom Board of Trade with such modifications as are necessitated by local conditions. The Board of Trade recognises the following certificates only as of Commonwealth validity: extra master, master, first mate, and second mate foreign-going ships, first- and second-class steam and motor engineers. It is a condition of such recognition that candidates must possess service qualifications and pass examinations similar and not inferior to those prescribed by the Board of Trade. Regulations provide for the examinations for masters and mates for marine engineers in both foreign-going and home trade.
SHIP SURVEY STATISTICS—The Marine Department carries out the survey of ships as required by the Shipping and Seamen Act 1752, and during the period 1 January 1965 to 31 December 1965, certificates of survey were issued to the following categories of New Zealand ships:
| Passenger ships engaged in international voyages | 3 |
| Cargo steamships engaged in international voyages | 3 |
| Cargo motorships engaged in international voyages | 42 |
| Home-trade steamships | 9 |
| Home-trade motorships | 92 |
| Restricted-limits steamships | 25 |
| Restricted-limits motorships | 382 |
| Total | 556 |
In addition to the certificates of survey required under the Shipping and Seamen Act 1952, the Department is required to issue certificates to vessels engaged in international voyages in accordance with the provisions of the International Convention for the Safety of Life at Sea 1960, to which the New Zealand Government is a signatory. Special surveys additional to the above were made for seaworthiness after damage, for efficiency of equipment, and for tonnage measurement.
LIGHTHOUSE SERVICE—Since 1865 when the Central Government took over the control of all coastal lighthouses and other navigational aids outside harbour limits, and from 1877 when the Marine Department was formed, the Government has been responsible for administering, developing, maintaining, and servicing all navigational aids around New Zealand's coastline. On headlands, capes, reefs, and shoals around the 4,330 miles of coastline there are 270 navigational aids. These aids comprise 25 manned lighthouses, 117 automatic lights, 106 day beacons, 6 navigational buoys, three fog signals and 13 radio beacons, and represent a capital investment of $4 million approximately. Their maintenance and servicing involves over $500,000 annually. Light dues collected from ships in 1965–66 amounted to 5426,000 and are used to meet running costs of the service.
Each light, manned and automatic, is of a type designed to meet a particular requirement. The “zenon gas” light installed on Tiri Tiri Island, the main coastal approach light tower to Waitemata Harbour, is of 11 million candlepower, and is one of the most powerful in the world.
Over half of the lighthouses are fitted with marine radio beacons which give out omni-directional signals of a definite known character which ships can identify. By means of direction finding equipment fitted on ships the mariner can ascertain his position irrespective of the weather.
WRECKS—In the case of any wreck or shipping casualty in New Zealand waters a Superintendent of Mercantile Marine, or other person empowered by the Minister of Marine, institutes an inquiry into the cause and circumstances of such casualty. If necessary, a formal investigation is held by a Magistrate, who has power to cancel or suspend the certificate of any officer from whose wrongful act or default damage has resulted.
Should any wreck occur on the coast, or in any river or lake, the Receiver of Wrecks for that district, usually an officer of the Customs, has the necessary authority to be used in the preservation of life and property.
The numbers of shipping casualties reported to the Marine Department during the year ended 31 December 1965 are shown in the following table. It should be noted that figures list all casualties including small craft.
| Type of Ship | Miscellaneous, Berthing, Machinery Breakdown, etc. | Collision | Fire | Foundering | Stranding | Total |
|---|---|---|---|---|---|---|
| Passenger | 2 | – | – | – | – | 2 |
| Cargo | 4 | 3 | 1 | 1 | 2 | 11 |
| Fishing | 6 | 1 | 1 | 5 | 8 | 21 |
| Miscellaneous | – | 2 | 1 | 1 | – | 4 |
| Totals | 12 | 6 | 3 | 7 | 10 | 38 |
RAILWAY DEVELOPMENT—A network of railways extending over more than 3,000 route miles links almost all the principal centres of population in New Zealand and carries a large share of the passenger and freight traffic to and from the towns and cities. Practically all the railway services in the country are provided by the New Zealand Government Railways Department, using the title New Zealand Railways for trading purposes. The Department also operates road services over more than 5,000 route miles of highways; a rail- and road-vehicle and passenger-ferry service across Cook Strait between Wellington and Picton; an air-freight service across Cook Strait; and a steamer service on Lake Wakatipu in the South Island. A total staff of about 24,000 people is employed by the Department.
Recent years have witnessed notable progress in development of the system and a steady increase in the carrying capacity of its main lines. Extensive use is being made of the latest developments in railway-transport technology, including diesel and electric traction, transistorised equipment for centralised traffic control, mechanised equipment for freight handling and track-maintenance work, and electronic data-processing machines to assist with accounting and statistical operations. Many new types of goods wagons have been and are being introduced, and numerous station buildings, goods sheds, bridges, etc., are being replaced by up-to-date structures in a continuing programme.
Major projected improvements are the construction of a 15-mile railway link, including a 5 1/2-mile tunnel through the Kaimai Hills, to shorten the railway distance between the Waikato and the Bay of Plenty districts, and of a large new marshalling yard with associated servicing and repair depots at Te Rapa on the northern outskirts of Hamilton.
A World Bank loan of $30 million is being made available for a rolling stock re-equipment programme estimated to cost $50 million and planned for completion by March 1969.
BRIEF HISTORY—In 1860 a contract was let by the provincial government of Canterbury for the construction of a railway from Lyttelton to Christchurch, and the first portion of this line was opened on 1 December 1863.* A line from Invercargill to Bluff Harbour was opened on 5 February 1867, and meanwhile, in 1865, the Auckland Provincial Council had begun construction of a line from Auckland to Drury.
In 1870 the General Government established an Immigration and Public Works Department which had as one of its main objects the building of a system of railways to open up the country for settlement. By 31 March 1880, 1,182 route miles of State-owned railways were open for traffic, and by 31 March 1900 more than 2,100 route miles in 10 separate sections were in use. The 369-mile trunk line between Christchurch and Invercargill was complete in January 1879, but is was November 1908 before the 426-mile North Island main trunk railway between Auckland and Wellington was ready for traffic throughout.
More recently other main lines have been completed, to link most of the short isolated sections. The last link to be completed was that from Christchurch to Picton, in 1945. Since then, between 1950 and 1957, 63 miles of branch lines have been built in the North Island to serve the extensive man-made forests.
In 1957 the main highway between Blenheim and Nelson was deemed, for the purpose of calculating passenger fares and freight charges, to be a “notional railway” connected at Blenheim to the railway system.
Over the years since the railways were first built, vast improvements have been made and many sections reconstructed at considerable expense to ease gradients, shorten distances, and reduce curvature. Several of these major railway deviations involved the boring of long tunnels, such as those on the Wellington-Tawa deviation, opened in June 1937; the Turakina-Okoia deviation, opened in December 1947; and the Rimutaka deviation between Upper Hutt and Featherston, opened in November 1955.
Construction is shortly to begin on a 15-mile railway, including a 5 1/2-mile tunnel through the Kaimai Hills between Waharoa on the Rotorua line and Apata on the East Coast main line. It is planned to be completed about 1970, and will shorten the distance between Hamilton and Tauranga by 32 miles.
EXTENT OF THE SYSTEM—The total route milage of railways vested in the New Zealand Government Railways Department and open for traffic at 31 March 1965 was 3,254–1,636 miles in the North Island and 1,618 in the South Island. In addition, the Railways Department was working traffic over a further 4 miles of railways owned by other Government Departments. Double line was provided over a total of 157 route miles, of which 126 miles were in the North Island.
A total of 68 route miles has been electrified since 1922 on the 1,500-volt direct-current, overhead contact system. The 8 1/2-mile Otira - Arthur's Pass section of the South Island transalpine line, including the Otira Tunnel, was electrified in 1923; the 6 1/2-mile Christchurch-Lyttelton section in 1929; the 6 1/2-mile Wellington-Johnsonville line in 1938; and the 24 1/2-mile Wellington-Paekakariki line in 1940. The first section of the Wellington - Hutt Valley electrification was brought into operation in 1953, and the last stage of this project, covering 22 route miles, was completed in July 1955.
RAILWAY CONSTRUCTION AND ENGINEERING—In most instances, Government railways in New Zealand have been constructed by the Public Works Department, now the Ministry of Works, and handed over to the Railways Department upon completion. Recent practice has been for the Ministry of Works to construct the earthworks, bridges, tunnels, and buildings, and for the Railways Department to lay the track and instal signals.
* A special article in the 1963 issue of the Yearbook (pp. 1175–1195) outlined the first 100 years of railway development in New Zealand.
Track—All track is laid to a gauge of 3 ft 6 in. Steel rails for main lines weigh 91 lb per yard, but several secondary and branch lines have been laid with rails weighing 72 lb per yard. Much of the track, not yet renewed since these standards were adopted in 1950, is still laid with rails weighing 85, 70, and 55 lb per yard. About 90 miles of track are completely renewed each year. Timber sleepers, laid 2,400 to the mile, have traditionally been of Australian hardwood, but since 1960 substantial and increasing use has been made of treated radiata pine sleepers from New Zealand mills.
Bridges—To carry the railways across gorges, rivers, and streams in New Zealand, more than 2,600 bridges and viaducts have been built with an aggregate length of 55 miles. The longest railway bridge is that over the Rakaia River, 34 miles south of Christchurch. Completed in 1939 to replace an original timber structure of the 1870s, it is 5,720 ft (1.08 miles) long.
The highest viaduct; is the Mohaka, completed in 1937 to carry the Napier-Gisborne railway 318 ft above the bed of the Mohaka River. Twenty New Zealand railway viaducts altogether carry the rails more than 1.10 ft above the streams they cross.
Tunnels—At the close of March 1965, a total of 189 railway tunnels with an aggregate length of 53 1/2 miles were in use, 108 in the North Island and 81 in the South Island. The two longest tunnels are the Otira (5 miles 26 chains) on the Midland Line in the South Island, opened in 1923; and the Rimutaka (5 miles 37 chains) on the Wairarapa line in the North Island, opened in 1955. Excluding city tube railways, these stand fifteenth and twelfth respectively in a list of the world's longest railway tunnels. The Kaimai Tunnel, now under construction for completion in 1970, will be 5 miles 39 chains long.
Cook Strait Rail/Air Freight Service—An air freight service across Cook Strait was commenced in February 1947; information on its operation is given in Subsection 11D.
Cook Strait Rail Ferry Service—Two ferries to carry rail and road vehicles, and passengers, are operated by the Railways Department between Wellington and Picton. The Aramoana (4,160 tons) and Aranui (4,524 tons) are each designed to carry a maximum of 34 railway wagons, or about 85 motorcars, on the vehicle deck and a further 30 motorcars in an upper-deck garage. There is all-weather accommodation in lounges and cabins in each vessel for about 500 passengers, but it is possible to carry up to 1,150 passengers per ship on special occasions. Regular sailings with the Aramoana began on 13 August 1962 and a two-ship timetable was introduced with the advent of the Aranui on 27 June 1966.
ROLLING STOCK—Information as to the rolling stock in use on the State railways as at 31 March 1966 is given in the following table.
| * In addition there are five small diesel-electric shunting locomotives in use in workshops and 98 diesel and petrol shunting tractors, both road and rail, in use at stations and in depots. | |
|---|---|
| Locomotives— | |
| Steam (tender) | 257 |
| Steam (tank) | 23 |
| Electric | 28 |
| Diesel-electric | 181 |
| Diesel-electric shunting | 50 |
| Other diesel shunting | 86 |
| Total | 625* |
| Passenger vehicles— | |
| Sleepers | 18 |
| First class | 79 |
| Second class | 561 |
| Composite | 2 |
| Railcars | 50 |
| Electric multiple units | 128 |
| Postal | 6 |
| Total | 844 |
| Four Wheeled | Bogie | |
|---|---|---|
| Wagons— | ||
| Horse boxes | 9 | 35 |
| Cattle | 929 | 117 |
| Sheep | 2,388 | 13 |
| Frozen and chilled meat | 689 | 859 |
| Cool, ventilated | 1,223 | – |
| Covered goods | 1,426 | 479 |
| High side | 18,050 | 192 |
| Low side | 1,013 | – |
| Platform | 509 | 1,467 |
| Coal hopper | 941 | – |
| Vegetable | – | 28 |
| Brake vans | 8 | 426 |
| Heating vans | – | 6 |
| Other | 2,091 | 541 |
| Totals | 29,276 | 4,163 |
| 33,439 | ||
To the extent that local resources permit, locomotives and rolling stock are constructed in railway workshops. Additional requirements are met by importations from overseas. Construction of steam locomotives in railway workshops continued until 1950 in the North Island and 1956 in the South Island. The last imported steam locomotives were placed in service in the North Island in 1952.
Dieselisation of motive power began in 1949 with the purchase of four 25-ton diesel-mechanical shunting locomotives, 82 more similar locomotives of varying sizes being subsequently acquired. The first diesel-electric locomotives for main-line services were 15 imported from England in 1951–52. These were 51-ton, 660 h.p. machines. Ten 1,500 h.p. and forty-two 750 h.p. locomotives were imported from England between 1954 and 1958. In 1955, thirty 1,425 h.p. diesel-electric locomotives were imported from Canada and the United States, followed by 10 more of the same type from Australia in 1957. Further deliveries from Canada since 1960 brought the fleet total of this type to 97 by 31 March 1966, when a further 15 were on order.
During the year ended 31 March 1966, 17 locomotives of the new 950 h.p. “Db” class, a lighter version of the 1,425 h.p. “Da” locomotive, were brought into service. Early in 1966 tenders were called for 89 main-line diesel-electric locomotives of 1,000/1,600 h.p., and five 1,012 h.p. “Di” class diesel-electric locomotives of a new lightweight class were to be delivered a little later from Australia.
Eighteen 40-ton diesel-electric shunting locomotives were imported from England in 1959 for heavy shunting duty, and by 31 March 1966 another 32 had been built in railway workshops, and more were under construction.
The first diesel railcars on New Zealand Railways were placed in service in 1936. At 31 March 1965 a fleet of 50 was in use on fast passenger services covering a total of more than 7,000 miles daily on 12 main lines. The latest cars are English-built articulated vehicles introduced between 1955 and 1959, each one weighing 57 tons unladen and seating 88 passengers. Each car is powered by two 210 h.p. diesel engines of Italian make and is easily capable of 65 m.p.h. on level track.
Multiple-unit electric coaches were first introduced on the Johnsonville line in 1938. By 1955 a fleet of 49 motor coaches and 79 trailer coaches was in use on Wellington suburban train services. A typical three-coach set comprising one 600 h.p. motor coach and two trailer coaches weighs 96 tons unladen, measures 188 ft 6 in. overall, and seats 200 passengers. This stock can accelerate rapidly from stops and operates up to 50 m.p.h. in normal service.
Standard main-line passenger cars are 56 ft in length, have reversible chair seats, and are steam heated and electrically lit. Some are pressure ventilated. Sleeping cars have wash basins, wall mirrors, reading lights, and plug-in sockets for electric razors in each two-berth cabin.
Main-line diesel locomotives were used primarily in freight service at first, and by 1964–65 were handling almost two-thirds of this traffic, but diesel haulage of the Limited express trains in the North Island was accomplished in April 1963, and of other regular express trains between Auckland and Wellington (except for electric traction south of Paekakariki) in February 1965. Steam for carriage heating is now supplied from special boiler vans attached to each train.
Wagon Stock—Of the total of 32,999 goods and livestock wagons in stock at 31 March 1966, more than half have been built since 1945. Typical of the modern wagons now in use are steel high-side open wagons with a capacity of 15 tons; double-deck sheep wagons each able to carry 80 sheep; long, covered wagons for express goods trains; and high-capacity, all-steel, insulated wagons for frozen-meat traffic. A special type of wagon was designed for the Murupara-Kawerau log traffic, and deliveries of a new type of 14-ton-capacity covered wagon for palletised goods traffic began in 1960. Other special types of wagons have been developed for the conveyance of packaged timber, containers, cement in bulk, heated bitumen, and other bulk commodities. In addition to the 32,999 wagons owned by the Department at 31 March 1966, another 235 privately owned wagons were also in use, mainly for petrol and cement traffic.
The proportions of railway traffic moved by the different types of motive power are shown in the following table. In recent years, diesel power has become steadily more important at the expense of steam.
In these traffic figures, the weight of motive power is excluded—except in the case of diesel railcars and multiple-unit electric trains.
| Types of Trains | 1963–64 | 1964–65 | 1965–66 | |||
|---|---|---|---|---|---|---|
| Cross Ton-miles (Million) | Percent | Gross Ton-miles (Million) | Percent | Gross Ton-miles (Million) | Percent | |
| Passenger trains— | ||||||
| Steam locomotives | 213.6 | 27.1 | 186.4 | 24.2 | 111.2 | 14.6 |
| Diesel locomotives | 149.4 | 18.9 | 162.7 | 21.1 | 236.3 | 30.9 |
| Diesel railcars | 184.5 | 23.4 | 179.2 | 23.2 | 174.5 | 22.8 |
| Electric locomotives | 48.0 | 6.1 | 50.2 | 6.5 | 47.4 | 6.2 |
| Electric multiple unit | 193.0 | 24.5 | 193.4 | 25.0 | 195.2 | 25.5 |
| Totals, passenger | 788.5 | 100.0 | 771.9 | 100.0 | 764.6 | 100.0 |
| Mixed and goods trains— | ||||||
| Steam | 1,301.8 | 35.9 | 1,249.6 | 32.1 | 1,133.7 | 28.6 |
| Diesel | 2,239.8 | 61.9 | 2,554.3 | 65.7 | 2,741.5 | 69.2 |
| Electric | 80.1 | 2.2 | 84.8 | 2.2 | 86.0 | 2.2 |
| Totals, mixed and goods | 3,621.7 | 100.0 | 3,888.7 | 100.0 | 3,961.2 | 100.0 |
| All trains— | ||||||
| Steam locomotives | 1,515.4 | 34.3 | 1,436.0 | 30.8 | 1,244.9 | 26.3 |
| Diesel locomotives | 2,389.2 | 54.2 | 2,717.0 | 58.3 | 2,977.8 | 63.0 |
| Diesel railcars | 184.5 | 4.2 | 179.2 | 3.8 | 174.5 | 3.7 |
| Electric locomotives | 128.1 | 2.9 | 135.0 | 2.9 | 133.4 | 2.8 |
| Electric multiple unit | 193.0 | 4.4 | 193.4 | 4.2 | 195.2 | 4.2 |
| Grand totals, gross ton-miles | 4,410.2 | 100.0 | 4,660.6 | 100.0 | 4,725.8 | 100.0 |
REVENUE AND EXPENDITURE—Gross revenue and expenditure on the railways (including subsidiary services) are shown in the following table.
| Year Ended 31 March | Gross Revenue | Expenditure | Net Revenue |
|---|---|---|---|
| * Loss recovered from General Reserve. | |||
| $(thousand) | |||
| 1962 | 73,279 | 73,603 | −324* |
| 1963 | 72,887 | 76,588 | −3,701* |
| 1964 | 79,477 | 78,399 | 1,078 |
| 1965 | 85,318 | 82,948 | 2,370 |
| 1966 | 87,552 | 84,184 | 3,368 |
The chief items of expenditure for 1965–66 were: wages $52,352,964; locomotive fuel (including electricity), $3,221,288; stores and material, $10,414,034; depreciation and renewals, $8,721,596; miscellaneous, $9,473,942.
The revenue and expenditure for the latest five years, distinguishing between railway operation and other items, are given in the following table.
| Year Ended 31 March | Gross Revenue | Expenditure | Net Revenue or Loss | |||
|---|---|---|---|---|---|---|
| Railway Operation | Subsidiary Services, etc. | Railway Operation | Subsidiary Services, etc. | Railway Operation | Subsidiary Services, etc. | |
| $ (thousand) | ||||||
| 1962 | 63,390 | 9,890 | 63,632 | 9,972 | −242 | −82 |
| 1963 | 62,752 | 10,134 | 66,874 | 9,712 | −4,122 | +422 |
| 1964 | 67,648 | 11,828 | 67,946 | 10,452 | −298 | +1,376 |
| 1965 | 72,786 | 12,531 | 71,932 | 11,015 | +854 | +1,516 |
| 1966 | 74,753 | 12,799 | 73,228 | 10,956 | +1,525 | +1,843 |
The respective Island figures of revenue and expenditure for railway operation only (i.e. omitting subsidiary services) are given below for the 1965–66 year.
| Area | Revenue | Expenditure | Net Revenue or Loss | Ratio of Expenditure to Revenue |
|---|---|---|---|---|
| $ (thousand) | percent | |||
| North Island | 52,445 | 47,341 | 5,104 | 90.3 |
| South Island | 22,308 | 25,887 | −3,579 | 116.0 |
| Totals | 74,753 | 73,228 | +1,525 | 98.0 |
The various subsidiary services conducted by the Railways Department, with the revenue and expenditure of each during the last two years, are shown below. Full working costs, including interest, are charged against these services, and the interest so charged is taken into miscellaneous receipts as revenue.
| Service | Revenue | Expenditure | ||
|---|---|---|---|---|
| 1964–65 | 1965–66 | 1964–65 | 1965–66 | |
| $ (thousand) | ||||
| Lake Wakatipu steamers | 38 | 36 | 70 | 72 |
| Advertising service | 208 | 213 | 186 | 192 |
| Departmental dwellings | 867 | 869 | 2,705 | 2,118 |
| Lease of bookstalls, etc. | 216 | 240 | 224 | 271 |
| Road services— | ||||
| Passengers and goods | 6,098 | 6,385 | 6,052 | 6,343 |
| Rail ferry service | 3,368 | 3,785 | 1,778 | 1,960 |
| Miscellaneous receipts | 1,736 | 1,271 | … | … |
| Totals | 12,531 | 12,799 | 11,015 | 10,956 |
Revenue—In the following table the railway operating revenue is classified according to the class of traffic, etc., from which it was derived.
| Year Ended 31 March | Passenger Traffic | Goods, Livestock, and Parcels | Refreshments and Bookstalls | Total |
|---|---|---|---|---|
| *Included with subsidiary services revenue. | ||||
| $ (thousand) | ||||
| 1962 | 5,802 | 57,588 | * | 63,390 |
| 1963 | 5,852 | 55,466 | 1,434 | 62,752 |
| 1964 | 5,864 | 60,334 | 1,450 | 67,648 |
| 1965 | 5,760 | 65,546 | 1,480 | 72,786 |
| 1966 | 5,897 | 67,313 | 1,543 | 74,753 |
The revenue from passenger fares and luggage during the year 1965–66 represented an expenditure on railway travel of $2.23 per head of mean population. The total railway operating revenue was equal to $28.24 per head.
Expenditure—The railway operating expenditure under various heads is now given.
| Year Ended 31 March | Maintenance of Way and Works | Maintenance of Rolling Stock | Locomotive Transportation | Traffic Transportation | Head Office and General Charges* | Refreshments and Bookstalls | Total |
|---|---|---|---|---|---|---|---|
* Includes superannuation subsidy. † Included in subsidiary services expenditure. | |||||||
| $ (thousand) | |||||||
| 1962 | 16,190 | 14,778 | 11,236 | 19,722 | 1,706 | † | 63,632 |
| 1963 | 17,312 | 15,018 | 11,294 | 19,876 | 1,880 | 1,494 | 66,874 |
| 1964 | 16,962 | 15,822 | 11,484 | 20,300 | 1,852 | 1,526 | 67,946 |
| 1965 | 17,298 | 17,000 | 12,226 | 21,798 | 2,040 | 1,570 | 71,932 |
| 1966 | 17,923 | 17,176 | 12,211 | 22,118 | 2,134 | 1,666 | 73,228 |
The increase in expenditure has arisen chiefly from an increased wage bill, mainly the result of higher rates of pay and improved conditions of employment.
PASSENGER TRAFFIC—From 1958 to 1965 the number of journeys represented by railway passenger tickets sold remained over the 25 million mark, reaching a peak of 26,324,017 in 1961–62. The traffic had shown a steady upward trend since 1951–52, when the number of journeys was 21,292,556. This trend reflected the improvements in service made possible by completion of the suburban railway electrification at Wellington in 1955 and by the introduction of fast railcar services between 1955 and 1959. In 1965–66, however, the annual figure declined to 23,888,635 journeys.
The annual number of suburban passenger journeys at Auckland, Wellington, Christchurch, Dunedin, and Invercargill attained a record total of 23,311,438 in 1961–62. Although suburban traffic at Wellington continued to increase after that year (until 1965–66), the opening of the Lyttelton road tunnel in February' 1964 and other factors caused a decline in other districts, so that the total suburban journeys in 1965–66 were 21,234,369. This traffic produced revenue of $1,976,380, or 9c per journey.
In the same year, 1965–66, revenue from non-suburban rail passenger traffic was $3,669,892, representing an average of $1.38 in respect of each of 2,654,266 journeys. Since 1957 this traffic has fluctuated between 2,600,000 and 3,200,000 journeys a year. Prior to 1957 there had been a generally steady but tapering decline from the wartime peak of 15,733,306 non-suburban journeys in 1943–44. This decline was attributable to numerous factors; among them the reduction of troop movements, the increased use of private cars as post-war economic conditions improved, the curtailment of train services because of wartime and post-war coal and staff shortages, the development of air services, the transference of schoolchildren traffic in country districts from train services to school buses, the elimination of passenger services on many branch lines and the discontinuance of numerous local passenger train and mixed train services in country areas. Much of the short-distance passenger traffic formerly carried by train in rural areas was taken over by road services operated by the Railways Department. The operations of the Department's Road Services Branch are outlined under another heading at the end of this section.
The following table shows rail passenger journeys over the latest four years.
| Type of Journey | 1962–63 | 1963–64 | 1964–65 | 1965–66 |
|---|---|---|---|---|
| Non-suburban— | ||||
| Ordinary— | ||||
| Standard fares | 1,842,914 | 1,827,227 | 1,706,695 | 1,699,052 |
| Reduced fares | 395,935 | 373,332 | 310,943 | 280,854 |
| Season | 829,712 | 873,890 | 791,250 | 674,360 |
| Totals, non-suburban | 3,068,561 | 3,074,449 | 2,808,888 | 2,654,266 |
| Suburban— | ||||
| Ordinary | 4,644,976 | 4,438,964 | 4,185,675 | 4,446,029 |
| Season | 17,952,020 | 18,221,100 | 18,142,680 | 16,788,340 |
| Totals, suburban | 22,596,996 | 22,660,064 | 22,328,355 | 21,234,369 |
| Grand totals | 25,665,557 | 25,734,513 | 25,137,243 | 23,888,635 |
Computed passenger miles are shown in the following table.
| Year | Passenger Miles |
|---|---|
| (000) | |
| 1955–56 | 469,424 |
| 1956–57 | 471,912 |
| 1957–58 | 442,830 |
| 1958–59 | 441,604 |
| 1959–60 | 447,644 |
| 1960–61 | 446,244 |
| 1961–62 | 449,261 |
| 1962–63 | 452,300 |
| 1963–64 | 455,585 |
| 1964–65 | 431,729 |
| 1965–66 | 421,094 |
The following table shows the revenue received from passenger journeys over the latest four years.
| Type of Fare | 1962–63 | 1963–64 | 1964–65 | 1965–66 |
|---|---|---|---|---|
| $(thousand) | ||||
| Non-suburban— | ||||
| Ordinary— | ||||
| Standard fares | 3,304 | 3,345 | 3,225 | 3,297 |
| Reduced fares | 323 | 299 | 265 | 278 |
| Season | 90 | 93 | 101 | 95 |
| Miscellaneous | 272 | 262 | 247 | 251 |
| Totals, non-suburban | 3,989 | 3,999 | 3,838 | 3,921 |
| Suburban | ||||
| Ordinary | 588 | 564 | 545 | 584 |
| Season | 1,276 | 1,301 | 1,377 | 1,392 |
| Totals, suburban | 1,864 | 1,865 | 1,922 | 1,976 |
| Grand totals | 5,853 | 5,864 | 5,760 | 5,897 |
GOODS TRAFFIC—The volume of goods traffic carried by New Zealand Railways increased steadily year by year until 1930, but declined considerably during the depression until 1933. Since then there has been a steady upward trend, with only occasional and brief recessions reflecting fluctuations in economic activity.
The volume of revenue-earning goods and livestock traffic in 1965–66 decreased slightly by 0.7 percent from the all-time record of 11,971,634 tons in 1964–65 to 11,887,509 tons. The average length of haul, however, rose so that total traffic increased by 4.7 percent to a record 1,473 million ton-miles. Of the 11,887,509 tons carried, 11,645,341 tons were carried by rail between stations while the balance was mainly short hauls within station yards.
The following table shows the tonnage of goods and livestock between stations, net ton-miles, goods and mixed train-miles run, and goods and livestock revenue, together with associated significant averages. These figures exclude traffic carried wholly within station yards, and the revenue quoted excludes that derived from demurrage, cranage hire, engine hire, etc., and from parcels traffic. Non-revenue-earning traffic, such as coal and oil fuel to locomotive depots, is also excluded.
| Year Ended 31 March | Tonnage Carried Between Stations | Ton-miles | Average Length | Goods and Mixed Train-miles | Gross Revenue | |||
|---|---|---|---|---|---|---|---|---|
| Total | Per Ton | Per Train-mile | Per Ton-mile | |||||
| (000) | (000) | miles | (000) | $(000) | $ | $ | c | |
| 1962 | 10,807 | 1,221,084 | 113 | 9,145 | 55,836 | 5.17 | 6.11 | 4.58 |
| 1963 | 10,029 | 1,156,432 | 115 | 8,796 | 52,424 | 5.22 | 5.96 | 4.53 |
| 1964 | 11,077 | 1.303,029 | 117 | 9,084 | 57,248 | 5.17 | 6.30 | 4.39 |
| 1965 | 11,713 | 1,406,830 | 119 | 9,547 | 62,348 | 5.32 | 6.53 | 4.43 |
| 1966 | 11,645 | 1,473,135 | 126 | 9,648 | 63,988 | 5.49 | 6.63 | 4.34 |
The numbers of livestock carried by rail have declined in recent years following the complete removal in 1961 of restrictions on the road transport of livestock; figures for recent years are shown in the following table.
| Item | 1962–63 | 1963–64 | 1964–65 | 1965–66 |
|---|---|---|---|---|
| Cattle and horses | 850,267 | 793,228 | 723,224 | 567,170 |
| Calves | 588,864 | 585,885 | 560,143 | 506,624 |
| Sheep | 5,962,373 | 5,885,771 | 4,894,436 | 3,724,171 |
| Pigs | 396,274 | 400,186 | 378,742 | 318,446 |
| Totals | 7,797,778 | 7,665,070 | 6,556,545 | 5,116,411 |
| Equivalent tonnage | 571,112 | 548,880 | 483,554 | 374,022 |
Parcels Traffic—Revenue from parcels traffic, for which tonnage figures are not recorded, amounted to $1,934,722 in 1965–66, compared with $1,780,422 in 1964–65 and $1,596,664 in 1963–64.
Rail Ferry Traffic—Traffic statistics for the rail ferry service since 13 August 1962 are given in the following table.
| Year Ended 31 March | Return Crossings | Passenger Journeys | Motor Vehicles | Freight in Railway Wagons | ||
|---|---|---|---|---|---|---|
| Number | Manifest Tonnage | Deadweight Tons | Manifest Tons | |||
| * Seven and one-half months only, from 13 August 1962. | ||||||
| 1963* | 246 | 123,520 | 21,474 | 107,370 | 48,922 | 93,100 |
| 1964 | 505 | 186,139 | 37,362 | 186,810 | 143,655 | 267,733 |
| 1965 | 571 | 206,712 | 45,592 | 227,960 | 180,650 | 361,110 |
| 1966 | 563 | 211,520 | 51,396 | 256,980 | 215,480 | 432,142 |
Financial statistics for the Cook Strait ferry service are as follows.
| Year Ended 31 March | Revenue | Expenditure, Total | ||||
|---|---|---|---|---|---|---|
| Passengers | Refreshments | Motor Vehicles | Other Goods | Total | ||
| * Seven and one-half months only, from 13 August 1962. | ||||||
| $ | $ | $ | $ | $ | $ | |
| 1963* | 305,560 | 34,140 | 305,586 | 659,644 | 1,304,930 | 858,460 |
| 1964 | 442,662 | 59,482 | 480,300 | 1,717,202 | 2,699,646 | 1,629,526 |
| 1965 | 442,594 | 74,012 | 534,190 | 2,316,804 | 3,367,600 | 1,777,690 |
| 1966 | 431,124 | 79,476 | 481,040 | 2,793,054 | 3,784,694 | 1,960,180 |
The following diagram illustrates the traffic on the railways and road services.
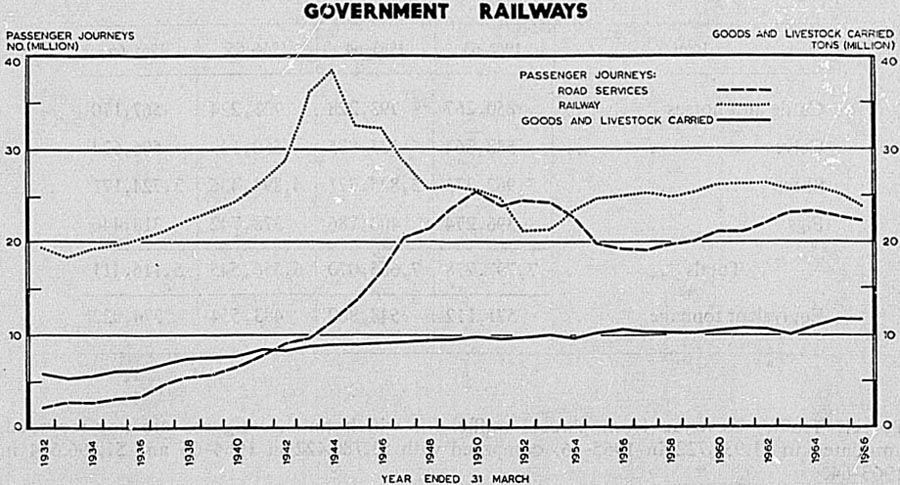
RAILWAY EMPLOYEES—The average number of persons employed by the State railways throughout the year ended 31 March 1966 was 23,672. The staff is divided into two divisions—namely, the salaried division and the general division—and is further classed in a number of branches as shown in the following table.
| Year Ended 31 March | Traffic | Way and Works | Locomotive Running | Workshops | Road Services | Other | Total |
|---|---|---|---|---|---|---|---|
| 1962 | 7,273 | 5,856 | 3,458 | 4,679 | 1,490 | 1,234 | 23,990 |
| 1963 | 7,374 | 6,121 | 3,632 | 4,891 | 1,513 | 1,274 | 24,805 |
| 1964 | 7,202 | 5,932 | 3,590 | 5,019 | 1,498 | 1,274 | 24,515 |
| 1965 | 7,125 | 5,674 | 3,593 | 4,940 | 1,499 | 1,276 | 24,107 |
| 1966 | 7,073 | 5,492 | 3,518 | 4,822 | 1,508 | 1,259 | 23,672 |
A system of classification, first introduced in 1896 and revised at various times since, applies to railway employees. A Board is constituted to hear appeals of members against decisions in regard to promotion, loss of status, or breaches of discipline. The board consists of a Magistrate and two members of the Railways service, one appointed by the Minister of Railways and the other elected by the members of the Department. The Government Railways Amendment Act 1944 provided for the establishment of a tribunal of three members whose principal functions are to prescribe scales of salaries and rates of wages for railway employees; conditions in regard to hours of work, overtime, etc.; and terms and conditions in regard to leave of absence, railway travel concessions, etc. This tribunal, known as the Government Railways Industrial Tribunal, is deemed to be a Commission of Inquiry under the Commissions of Inquiry Act 1908. The members, who must not be members of the railway employees' organisations, are appointed for a term of three years.
RAILWAY ACCIDENTS—During the year ended 31 March 1966, 21 persons were killed and 400 injured in all kinds of accidents associated with train working and movements of rolling stock. Comparative figures for the previous year were 31 killed and 424 injured. These figures do not include employees who were killed or injured whilst engaged on other duties, e.g., railway workshops.
Of the 21 persons meeting with fatal accidents in 1965–66, none were passengers but four were employees. Of the others, 15 were killed at level crossings, one while trespassing, and one from other causes. Of those injured, 30 were passengers, 297 employees (chiefly in minor accidents), and 73 were neither passengers nor employees. Of the 73 other persons, 54 were injured in crossing accidents.
In furtherance of departmental policy, an additional 43 automatic road-crossing alarms were installed in 1965–66, bringing the total number of automatic alarms now in operation up to 526.
PRIVATE RAILWAYS—There are a number of short private railways in New Zealand, principally lines serving collieries and sawmills. The most important are the 7-mile line of the Ohai Railway Board, extending from Wairio (north-west of Invercargill) to coal mines at Ohai, and the 4-mile line from Stirling to the State Mines at Kaitangata (South Otago). These lines carry substantial coal traffic in departmental wagons. The Whakatane Board Mills Ltd. in the North Island operates a 6 1/2-mile private line from Awakeri to their mill at Whakatane in the Bay of Plenty.
RAILWAY-OPERATED ROAD SERVICES: Road Passenger Services—There is a network of railway-operated road services whose origin dates back to November 1926 when a bus service between Napier and Hastings was purchased. Others were acquired in the following years (notably the services within the Hutt Valley and between the Hutt Valley and Wellington in 1927 and 1928), but it was 1934 before the first long-distance coach service was taken over. The main development of the network took place between 1936 and 1951, when the route mileage over which licences were held rose from 260 to 5,992. In 1966 the Railways Department was running more than 25 percent of the total vehicle mileage of all licensed road passenger service operators in New Zealand (see section 11c), and was maintaining in its fleet more than 25 percent of all the vehicles used to provide road passenger services throughout the country. During the year ended 31 March 1966, the Railways Department's Road Services Branch, employing a staff of 1,508 on average, earned a total revenue of $6,385,188, an increase of $286,494 compared with 1964–65. After making full allowance for depreciation and interest charges, net revenue was $42,020.
Suburban bus services at Auckland, Hastings, Hutt Valley, Wellington-Khandallah, Titahi Bay, Paekakariki, and Dunedin, with a fleet of 210 vehicles at the end of the year, carried 13,034,703 passengers for a total revenue of $1,138,592. All the other road passenger services, both long and short distances, with 587 coaches, buses, and other vehicles, carried 9,262,506 passengers for a revenue of $3,049,768. The routes of the services in operation at 31 March 1966 covered 5,397 miles of highway.
In addition to the road passenger services, a small number of road goods services were operated. Goods traffic on these services, together with the hire of vehicles to the Rail Ancillary Goods Service, produced a further $1,275,794. Some 278 motor trucks and vans were maintained for the goods services.
Rail Ancillary Goods Services—These services which have been developed since 1945, are operated by the Department's Traffic Branch for the carriage of goods consigned to or from wayside stations. The ancillary services are complementary to and fully co-ordinated with the train services and worth-while economies in railway operation followed from their use. The haulage of small loads in high-capacity railway wagons is considerably reduced, so that a better utilisation of wagon stock is obtained, and the costly stopping and starting of heavy goods trains is kept to a minimum.
The following selected statistics illustrate the development of the Railways Department's road services operations since 1930.
| Year Ended 31 March | Route Miles at 31 March* | Number of Passenger Vehicles at 31 March | Number of Other Vehicles at 31 March | Total Passenger Journeys | Total Passenger and Goods Revenue | Total Expenditure, Including Interest Charges |
|---|---|---|---|---|---|---|
| * Route milage for which licences are held. | ||||||
| (000) | $ (000) | $ (000) | ||||
| 1931 | 101 | 60 | – | 3,188 | 206 | 218 |
| 1936 | 260 | 66 | – | 3,242 | 206 | 190 |
| 1941 | 3,453 | 288 | 39 | 7,731 | 936 | 866 |
| 1946 | 4,507 | 464 | 154 | 16,588 | 2,198 | 1,918 |
| 1951 | 5,992 | 749 | 301 | 24,091 | 4,216 | 4,320 |
| 1956 | 5,842 | 763 | 356 | 19,271 | 5,170 | 5,036 |
| 1961 | 5,754 | 735 | 332 | 21,370 | 5,674 | 5,638 |
| 1962 | 5,852 | 757 | 328 | 22,280 | 5,822 | 5,688 |
| 1963 | 5,862 | 749 | 322 | 23,143 | 5,928 | 5,768 |
| 1964 | 5,873 | 720x | 345x | 23,465 | 6,062 | 5,842 |
| 1965 | 5,819 | 738x | 347x | 22,955 | 6,098 | 6,054 |
| 1966 | 5,858 | 729 | 378 | 22,297 | 6,385 | 6,343 |
GENERAL—Capital investment in New Zealand's roading and road transport system exceeds that of all other forms of transport services. There are over 57,000 miles of roads and over 1 million motor vehicles, while the population census in 1961 revealed that there were 31,316 road transport drivers, 11,064 persons engaged in the construction and maintenance of roads, 13,790 persons whose occupation involved carrying and cartage services, 17,796 persons occupied in the repair of motor vehicles, and 5,851 persons engaged in motor-vehicle assembly and body building.
Road transportation has become an integral part of the economy and grows along with it. Primary production, for example, relies heavily on road transport. An increasing amount must be spent on the roading system not only to maintain and increase national production but also, among other things, to prevent economic waste due to congestion on main traffic routes. Urban motorways are absorbing an increasing proportion of the available funds of the National Roads Board which has an impressive record of road improvements since 1954.
ROADS AND BRIDGES—Two major developments in recent years have been the Auckland Harbour Bridge and the Christchurch-Lyttelton Road Tunnel; tolls are charged to users to provide for upkeep and repay the loans raised for their construction. The Auckland Harbour Bridge, with its approaches, is nearly 2 miles long and was opened in 1959. The Christchurch-Lyttelton Road Tunnel, which was opened in 1964, comprises 2 1/2 miles of motorway, of which 1 1/4 miles is actual tunnel.
Another major development has been the construction of the 130-mile Haast Pass Road in South Westland which was opened on 6 November 1965; construction extended over 19 years and involved an expenditure of $9 million. It connects Westland and Otago and opens up areas of scenic beauty.
Details of formed roads are given in the following table.
| Nature of Surface | Cities and Boroughs | Counties | Road Districts | Town Districts | Total | |
|---|---|---|---|---|---|---|
| County Roads | State Highways and Motorways | |||||
| * All on county roads. | ||||||
| Miles | ||||||
| Paved | 4,645 | 9,954 | 5,425 | 7 | 99 | 20,130 |
| Metal or gravel | 606 | 29,948 | 5,189 | 128 | 70 | 32,280 |
| Unmetalled | 115 | 5,189 | – | 40 | 18 | 5,362 |
| Totals: formed roads | 5,366 | 52,044 | 175* | 187 | 57,772 | |
The configuration of the country' has presented problems in the construction of roads, while the numerous rivers and streams have called for many bridges. The following table shows the numbers and total lengths of bridges incorporated in the roads system at 31 March 1965. Only bridges of 25 ft or over in length have been taken into account. There is an average of slightly under 15 ft of bridging per mile of formed road.
| Materials of Which Bridge Constructed | Cities and Boroughs | Counties | Road Districts | Town Districts | Totals | |||||
|---|---|---|---|---|---|---|---|---|---|---|
| No. | Total Length | No. | Total Length | No. | Total Length | Total | Total Length | No. | Total Length | |
| * Includes Bailey bridges erected as a temporary measure. | ||||||||||
| ft | ft | ft | ft | ft | ||||||
| Concrete reinforced or stone | 241 | 26,369 | 2,948 | 283,884 | – | – | 12 | 936 | 3,201 | 311,189 |
| Steel girders and concrete deck* | 61 | 8,021 | 1,309 | 130,523 | – | – | 3 | 90 | 1,373 | 138,634 |
| Timber with steel or concrete | 71 | 8,040 | 1,901 | 169,292 | 6 | 162 | 3 | 95 | 1,981 | 177,589 |
| Timber | 89 | 7,769 | 2,764 | 221,542 | 10 | 395 | 5 | 180 | 2,868 | 229,886 |
| Totals | 462 | 50,199 | 8,922 | 805,241 | 16 | 557 | 23 | 1,301 | 9,423 | 857,298 |
Auckland Harbour Bridge Traffic—Before the Auckland Harbour Bridge of four lanes was opened in 1959, it was expected that it would take 19 years for traffic to reach 8 million vehicles a year, but instead it took only five years. Plans are in hand for extensions by way of two additional lanes on each side of the existing bridge making a total of eight traffic lanes. Traffic totals for March years are shown in the following table.
| Class of Vehicle | 1961–62 | 1962–63 | 1963–64 | 1964–65 | 1965–66 |
|---|---|---|---|---|---|
| (000) | |||||
| Cars | 5,355 | 5 946 | 6,914 | 8,141 | 9,471 |
| Motor cycles, etc. | 292 | 287 | 283 | 255 | 240 |
| Buses | 238 | 245 | 255 | 265 | 268 |
| Trucks | 399 | 425 | 486 | 523 | 478 |
| Non-revenue traffic | 82 | 92 | 112 | 139 | 146 |
| Totals | 6,368 | 6,995 | 8,050 | 9,323 | 10,603 |
Christchurch-Lyttelton Road Tunnel—There is an increasing volume of traffic using the Christchurch-Lyttelton road tunnel as shown in the following table.
| Class of Vehicle | Year Ended 31 March | ||
|---|---|---|---|
| 1964* | 1,965 | 1,966 | |
| * Part year only. | |||
| Cars | 697,789 | 771,737 | |
| Motor cycles, etc. | 76,473 | 98,781 | |
| Buses | 12,342 | 12,780 | |
| Trucks | 72,715 | 112,776 | |
| Non-revenue traffic | 26,593 | 31,082 | |
| Totals | 137,853 | 885,912 | 1,027,156 |
ROADS ADMINISTRATION—The main statutes covering roads administration in New Zealand are the Public Works Act 1928, the Municipal Corporations Act 1954, the Counties Act 1956, and the National Roads Act 1953. Administration of the country's roading system is exercised by municipalities in respect of streets, by county councils in respect of county roads, and by the National Roads Board in respect of State highways. There are 7,190 miles of State highways.
By the National Roads Act a National Roads Board was established from 1 April 1954, and its functions are defined as follows:
To administer the National Roads Fund in accordance with the provisions of the Act.
To provide an advisory service in respect of the whole roading system of counties, boroughs, and town districts throughout New Zealand, and to report to the Government from time to time on the progress being made in providing a roading system adequate for needs arising from current developments in motor traffic.
To advise the Government of any changes necessary in the legislation and regulations relating to the use of roads.
To act as the final authority in disputes relating to road classifications.
To advise the Government of changes necessary in the provision of finance for road construction and maintenance, particularly of changes considered advisable in the levying and collection of motor taxation, including exemptions therefrom.
To assist and advise local authorities generally on roading matters and any special roading problems arising from development of industries, etc.
To undertake at not more than five- or less than three-year intervals a comprehensive survey into the roading position in New Zealand, including standards, growth of traffic, adequacy, etc.
To give effect to any special mutter of roading policy communicated to it by the Government.
(i) To initiate and conduct research into roading problems in New Zealand.
To collect information on reading developments in other countries and make this available to loading authorities in New Zealand.
To undertake any other activity for the provision of a roading system adequate both for the needs of an efficient road transport system and for the benefit generally of motor-vehicle operators and the safety of the public in relation to motor traffic.
The composition of the National Roads Board is: (a) one member, to be appointed Chairman of the Board; (b) the person holding the appointment in the Ministry of Works as Director of Roading; (c) an officer of the Ministry of Works; (d) an officer of the Transport Department; (e) two nominees of the New Zealand Counties Association (incorporated); (f) two nominees of the Municipal Association of New Zealand (incorporated); (g) a representative of commercial road users; and (h) a representative of private motorists. District Roads Councils—New Zealand is divided into 21 roads districts, composed of local authorities grouped according to geographic situation and community interest.
For each roads district there is an advisory body, known as the District Roads Council, which is constituted to include the District Commissioner of Works, one representative of each constituent county and road district, one person to represent boroughs and independent town districts for each two members representing counties or read districts, a representative of commercial road users, a representative of private motorists, and a nominee of the Commissioner of Transport.
District Roads Councils function as advisory bodies, with the principal duties of recommending upon the maintenance and improvement programmes for State highways, and upon the yearly allocation of subsidies and grants from the National Roads Fund for local authority roading. They also make recommendations to the National Roads Board on standards and requirements for roads and highways in their particular districts, and on general matters affecting road users or road safety.
Finance—A National Roads Fund has been established within the Public Account, the revenue of the Fund being derived mainly from motor taxation together with an annual contribution from the Government. Expenditure from the Fund is for the purpose of developing State highways to modern standards and of subsidising the roading programmes of local authorities.
Motor spirits tax of 14.80c per gallon is paid into the National Roads Fund; additional tax of 3.33c per gallon imposed on 4 May 1967 is credited to the Consolidated Revenue Account.
Following is a statement of receipts and expenditure of the National Roads Fund for the latest two March years.
| Item | 1964–65 | 1965–66 |
|---|---|---|
| $ | $ | |
| Receipts— | ||
| Petrol tax (net) | 45,417,372 | 48,588,434 |
| Milage tax | 1,905,248 | 2,595,864 |
| Tyre tax | 73,832 | – |
| Fees and charges— | ||
| Registration and licence fees | 6,106,822 | 6,451,208 |
| Heavy traffic fees | 6,627,044 | 7,225,144 |
| Contribution from Consolidated Revenue Account | 2,000,000 | 10,000 |
| Miscellaneous receipts— | ||
| Repayments of plant purchases | 35,030 | 24,270 |
| Repayments of advances to local authorities | 14,246 | 23,268 |
| Rents | 108,872 | 114,482 |
| Sales of land and buildings | 37,030 | 54,788 |
| Interest on plant purchases | 3,628 | 1,676 |
| Interest on advances to local authorities | 1,064 | 724 |
| Transfer of bridging material | 2,194 | 14,544 |
| Bailey bridging hire | 57,040 | 117,920 |
| Interest on investments | 42,166 | 85,500 |
| Miscellaneous | 2,550 | 1,324 |
| Contribution from local authorities for work done by Ministry of Works | 16,000 | 26,562 |
| Total receipts | 62,450,138 | 65,335,708 |
| Item | 1964–65 | 1965–66 |
|---|---|---|
| Expenditure— | $ | $ |
| Highways maintenance | 8,856,854 | 9,260,430 |
| Highways construction | 21,384,740 | 29,012,058 |
| Local authority roading subsidies and grants | 24,477,898 | 27,094,660 |
| Administration and general expenses— | ||
| Ministry of Works administration | 2,999,500 | 3,126,326 |
| Fees and travelling expenses | 12,772 | 14,406 |
| Miscellaneous expenses | 55,634 | 158,632 |
| Bridging expenses— | ||
| Bailey bridging | 54,938 | 34,548 |
| Unauthorised expenditure | 6,464 | 5,018 |
| Total expenditure | 57,848,800 | 68,706,078 |
| Balance in Fund at end of year | 6,234,030 | 2,863,660 |
In the following table are shown the amounts which have been expended on State highways construction, renewal, or maintenance during the last five years. Maintenance figures include the cost of flood damage restoration when applicable. There are 7,190 miles of State highways, of which 81 percent are now sealed.
| Class of Expenditure | 1961–62 | 1962–63 | 1963–64 | 1964–65 | 1965–66 |
|---|---|---|---|---|---|
| $ (thousand) | |||||
| Construction and improvement | 12,461 | 13,666 | 19,307 | 19,158 | 26,424 |
| Renewal of bridges | 1,952 | 2,194 | 2,230 | 2,227 | 2,588 |
| Maintenance, repairs, etc. | 8,410 | 8,479 | 8,786 | 8,857 | 9,260 |
| Totals | 22,823 | 24,340 | 30,323 | 30,241 | 38,272 |
An analysis of the actual expenditure on maintenance in each Island, as compared with the number of motor vehicles in each Island at 31 March of each of the last five years, appears in the following table, the percentages relating to New Zealand totals.
| Item | 1961–62 | 1962–63 | 1963–64 | 1964–65 | 1965–66 |
|---|---|---|---|---|---|
| North Island— | Percentage of New Zealand Totals | ||||
| Maintenance expenditure | 66.46 | 68.91 | 66.22 | 67.16 | 66.72 |
| Motor vehicles | 67.74 | 67.82 | 68.21 | 68.56 | 68.66 |
| South Island— | |||||
| Maintenance expenditure | 33.54 | 31.09 | 33.78 | 32.84 | 33.28 |
| Motor vehicles | 32.26 | 32.18 | 31.79 | 31.44 | 31.34 |
The following table shows the milage of State highways in the North and South Islands at 31 March 1966, together with a classification as to the type of construction or surface.
| Island | Length of Highways | ||
|---|---|---|---|
| Scaled Surface | Gravel or Macadam Surface | Total | |
| miles | |||
| North Island | 3,155 | 659 | 3,814 |
| South Island | 2,683 | 693 | 3,376 |
| Totals | 5,838 | 1,352 | 7,190 |
State Highways—The National Roads Act provides for the declaration of roads as State highways with the approval of the Minister of Works. In 1964 the National Roads Board reviewed the State highway system. It determined that the network must continue to be based on the pattern of national development, needs of defence, and directness of route and main travel desire lines. It reaffirmed the most important basic principles in designing a State highway system to be that the total milage of the system must be based on routes of primary importance; that routes must be equitably distributed in relation to the pattern of national development; that routes must be confined to those which have characteristics in keeping with the function of the system. It is estimated that an average increase of traffic of at least 5 percent a year can be expected on the State highways until 1974 at least.
The National Roads Board has the sole power of construction, maintenance, and control of all State highways. These powers may be delegated, for any State highway or portion thereof, to the local authority in whose district the road is situated. Any construction or maintenance work that is not delegated by the Board to a local authority is carried out by or through the agency of the Ministry of Works and the cost borne by the Fund. The Board may also delegate to the Ministry of Works its duties in connection with design, supervision, construction, or maintenance, or the administration of any specified State highway.
Highway Standards—In order to qualify for highway subsidies local authorities are required to carry out works to a standard approved by the National Roads Board. Subsidies are not payable unless the approved standard is observed, although work of a higher standard may be undertaken provided that the additional expenditure involved is found by the local authorities concerned. From time to time the Board's standards are revised to meet the latest developments in highway practice and engineering design and also to cater for the requirements of increasing traffic. Roadmaking materials used in highway works are subject to standard tests.
Motorways—The Public Works Act makes provision for the declaration of motorways. Motorways provide efficient and economic means of communication, while the control of access and the total elimination of ribbon development will go far to improve road safety and prevent obsolescence.
The total milage of motorways in use at 31 March 1966 was 46.34 miles. During 1965–66, 10 motorway bridges, totalling 6,070 ft, were completed. Additional lengths are under construction at Auckland, Wellington, Christchurch, and Dunedin. The figures quoted for motorways' milages and bridging are included in those shown under highways.
Activity During the Year Ended 31 March 1966—During the year ended 31 March 1966, 147 miles of new sealing on highways were completed, giving an aggregate of 5,839 miles sealed, or 81.2 percent of the total highway milage. In addition, improvements to existing sealed surfaces were effected on 446 miles of highways.
New bridging totalled 14,932 linear feet, compared with 11,659 linear feet in the previous year.
Local Authority Roading—The National Roads Board pays a subsidy at the rate of $1.50 for each $2 that is spent by local authorities out of their own funds on such programmes of subsidised works as have been accepted for a financial year by the Board; the amount of subsidy is not less than 14 percent of the Board's revenue in the case of boroughs and independent town districts, and not less than 26 percent in the case of counties, dependent town districts, and road districts.
In addition, the Board may make a grant to a local authority, having regard to its particular financial problems or special circumstances.
In recognition of the urgency and importance of the country's bridge renewal problem, the Board makes generous grants for bridge replacement. Wooden bridges built 50 and 60 years ago, which have served the country well, continue to deteriorate at a greater rate than replacements can be built. In seven years to March 1966 there were 1,983 bridges completed.
For the year ended 31 March 1966 the following amounts were paid to local authorities from the National Roads Fund for roading.
| Local Authority | Subsidy | Grants | Total |
|---|---|---|---|
| $ (thousand) | |||
| Municipalities | 7,528 | 2,519 | 10,047 |
| County councils (including road boards) | 9,916 | 7,132 | 17,048 |
| Totals | 17,444 | 9,651 | 27,095 |
Loan Assistance—In special circumstances the Board may advance money by way of loan to local authorities to provide for the proportion of cost payable by a local authority in respect of a subsidised work. Such loans must be repaid by instalments extending over a period (not exceeding 10 years) to be agreed upon between the Board and the local authority, and interest is payable at a rate approved by the Minister of Finance.
The Board is also empowered to sell roadmaking machinery, plant, and equipment to local authorities on such terms as it thinks fit, including terms for the repayment of the purchase money by instalments extending over not more than four years, with interest on the unpaid balance at such rate as is fixed by the Board. Since this scheme was introduced by the Main Highways Board, plant, etc., has been purchased to the value of $2,334,212, of which sum $10,318 was outstanding at 31 March 1966. Repayments received during 1965–66 totalled $24,270.
Development Roading—In addition to the expenditure on roading from the National Roads Fund, moneys are provided annually by the Consolidated Revenue Account (Vote Roads) for development road construction. Under this heading subsidies are paid to local authorities for the construction of new roads giving access to farm lands being brought into production. This Vote also finances access roading to lands being prepared for farm settlement by the Lands and Survey and Maori Affairs Departments, as well as certain new roading of a national development character such as the through road linking Paringa - Haast - Haast Pass.
New roads constructed for farm access are handed over to the care of local authorities, while national roading normally becomes the responsibility of the National Roads Board for maintenance as part of the State highway system.
Government roading expenditure from the Consolidated Revenue Account (Vote Roads) for the year ended 31 March 1966 was approximately $1,844,580.
Overall Roading Expenditure—The following table shows the total expenditure on roading from all sources for the year ended 31 March 1966.
| National Roads Fund— | $ (000) | $ (000) |
| State highways | 38,272 | |
| Subsidies, etc. - local roading | 27,095 | |
| 65,368 | ||
| Consolidated Revenue Account (Vote Roads) | 1,844 | |
| Local authority funds— | ||
| Municipalities | 17,174 | |
| County councils, etc. | 14,806 | 31,980 |
| Total | 99,192 |
REGISTRATION AND LICENSING OF MOTOR VEHICLES—From 1 July 1967 initial registration fees are: motor cars, from $16 to $50 according to engine capacity; motor cycles, $10; power cycles, $6; light trucks, $30; heavy trucks, $50; trailers, $10. Annual licence fees are as follows: Power cycles, $4; motor cycles, $6; motorcars and private station wagons, $10; traction engines, $3; motor vehicles not otherwise specified, $10; trailers (not exceeding 2 tons laden weight), $6. Other fees include drivers' licences, 50c; changes of ownership, $5; and dealers' licences (motor cycles, $4; any other motor vehicles, $6). All such fees, except those for drivers' licences which are payable to the local authorities, were credited to the National Roads Fund until 30 June 1967; since 1 July 1967 they have been credited to the Consolidated Revenue Account.
The following table shows the numbers of the various types of motor vehicles licensed as at 31 March in each of the last five years.
| Type of Vehicle | Licensed as at 31 March | ||||
|---|---|---|---|---|---|
| 1962 | 1,963 | 1,964 | 1,965 | 1,966 | |
| *From 1 July 1964 Government vehicles are classified according to type. | |||||
| Cars | 553,181 | 583,867 | 630,490 | 688,534 | 724,582 |
| Rental cars | 2,582 | 2,916 | 2,777 | 2,976 | 3,100 |
| Private taxicabs | 170 | 207 | 146 | 256 | 187 |
| Light goods service vehicles (i.e. gross laden weight 2 tons and under) | 54,096 | 55,484 | 58,438 | 59,626 | 64,701 |
| Heavy goods service vehicles (i.e. gross laden weight over 2 tons) | 76,062 | 77,542 | 79,886 | 94,147 | 98,698 |
| Contract vehicles | 1,756 | 1,776 | 1,761 | 2,404 | 1,659 |
| Omnibuses | 2,330 | 2,472 | 2,558 | 2,661 | 2,734 |
| Public taxicabs | 2,691 | 2,859 | 2,615 | 2,950 | 3,133 |
| Service coaches | 546 | 537 | 487 | 520 | 502 |
| Vehicles including cycles exempted from payment of annual licence fees | 68,881 | 71,270 | 74,910 | 80,056 | 87,508 |
| Government vehicles | 17,132 | 18,307 | 19,647 | * | * |
| Motor cycles | 31,288 | 32,488 | 31,030 | 32,482 | 31,731 |
| Power cycles | 13,065 | 13,195 | 15,881 | 17,636 | 17,971 |
| Totals, motor vehicles | 823,780 | 862,920 | 920,626 | 984,248 | 1,036,506 |
| Trailers, including trailers exempted from payment of annual licence fees | 134,516 | 138,734 | 148,056 | 163,879 | 180,616 |
| Dealers' cars | 3,264 | 3,236 | 3,249 | 3,398 | 3,110 |
| Dealers' motor cycles | 116 | 133 | 140 | 141 | 104 |
| Totals, all vehicles | 961,676 | 1,005,023 | 1,072,071 | 1,151,666 | 1,220,336 |
Motor vehicles exempted from the annual licence fee include a miscellaneous collection of machines such as farmers' motor vehicles used solely on the farm and only venturing on roads to proceed from one part of the farm to another, or from farm to garage for repair, etc., excavators, scoops, trench diggers, logging machinery, cranes, etc.
The rate of increase in the number of motor vehicles has exceeded the rate of increase in population. The following table shows the changes in relationship between the number of licensed vehicles and population as at 31 March in the latest 11 years.
| As at 31 March | Number of Persons in Population per Car | Number of Persons in Population per Motor Vehicle (Excluding Trailers) |
|---|---|---|
| 1956 | 5.5 | 3.5 |
| 1957 | 5.2 | 3.4 |
| 1958 | 4.8 | 3.2 |
| 1959 | 4.8 | 3.2 |
| 1960 | 4.7 | 3.2 |
| 1961 | 4.6 | 3.1 |
| 1962 | 4.5 | 3.0 |
| 1963 | 4.3 | 2.9 |
| 1964 | 4.1 | 2.8 |
| 1965 | 3.8 | 2.7 |
| 1966 | 3.7 | 2.6 |
The countries with fewest persons per motor vehicle are, in order, United States, Canada, Australia, and New Zealand.
The next table shows the estimated total consumption of motor spirits in New Zealand, together with the quantity consumed by motor vehicles on public roads, for each year during the last 11 years.
| Calendar Year | Consumption of Motor Spirits | |
|---|---|---|
| By Motor Vehicles on Public Roads | Total Consumption | |
| million gallons | ||
| 1955 | 185.0 | 228.5 |
| 1956 | 200.7 | 244.6 |
| 1957 | 207.0 | 252.4 |
| 1958 | 217.0 | 263.7 |
| 1959 | 218.5 | 261.0 |
| 1960 | 234.3 | 280.4 |
| 1961 | 245.4 | 296.4 |
| 1962 | 253.0 | 298.7 |
| 1963 | 273.0 | 317.1 |
| 1964 | 294.9 | 339.7 |
| 1965 | 312.7 | 356.8 |
The following diagram illustrates the movement that has taken place in the number of motor vehicles licensed, and in the consumption of motor spirits by motor vehicles.
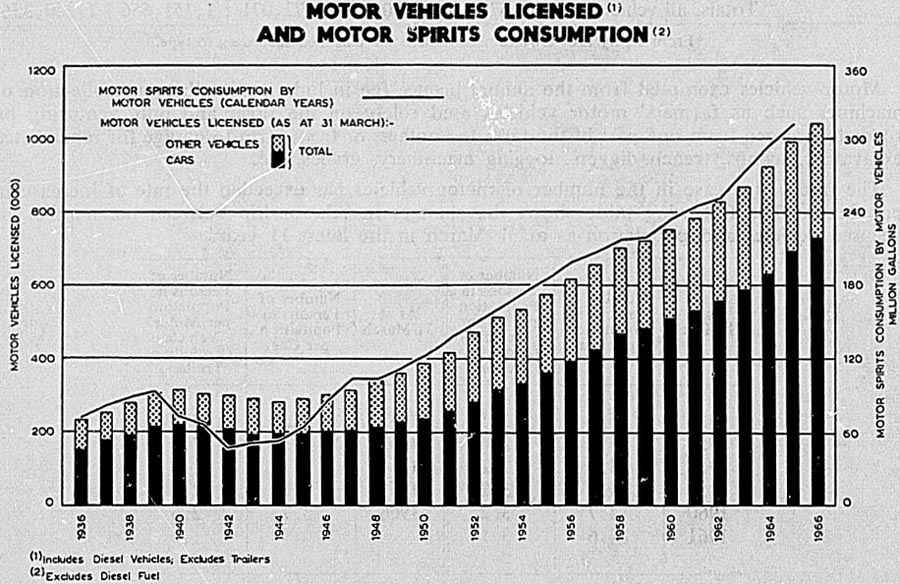
The following table gives particulars of the numbers of motor vehicles newly registered during each of the last 11 financial years. It should be noted that if a vehicle is again brought into use after its registration has been cancelled, it is treated as a new registration.
| Year Ended 31 March | Cars | Motor Cycles (including Power Cycles) | Commercial Vehicles | Trailers | Total Registrations |
|---|---|---|---|---|---|
| 1956 | 45,116 | 3,710 | 21,096 | 12,423 | 82,345 |
| 1957 | 38,348 | 5,106 | 19,821 | 14,275 | 77,550 |
| 1958 | 41,178 | 7,682 | 17,957 | 15,771 | 82,588 |
| 1959 | 31,644 | 7,757 | 26,085 | 15,704 | 81,190 |
| 1960 | 30,932 | 5,980 | 24,291 | 16,667 | 77,870 |
| 1961 | 36,385 | 6,640 | 17,711 | 29,182 | 89,918 |
| 1962 | 40,400 | 6,705 | 20,720 | 24,577 | 92,402 |
| 1963 | 45,260 | 6,623 | 18,586 | 21,091 | 91,560 |
| 1964 | 62,320 | 6,207 | 19,955 | 21,583 | 110,065 |
| 1965 | 69,071 | 8,074 | 22,091 | 23,034 | 122,270 |
| 1966 | 70,361 | 6,194 | 22,517 | 26,551 | 125,623 |
Registrations of new vehicles and those vehicles previously registered only in another country are available separately from total new registrations. Particulars (which exclude re-registrations) are as follows for the six latest years.
| Year Ended 31 March | Cars | Motor Cycles (Including Power Cycles) | Commercial Vehicles | Trailers | Total Registrations |
|---|---|---|---|---|---|
| 1961 | 34,376 | 4,743 | 13,808 | 21,152 | 74,079 |
| 1962 | 39,050 | 5,288 | 14,126 | 17,033 | 75,497 |
| 1963 | 43,360 | 4,665 | 13,002 | 18,194 | 79,221 |
| 1964 | 60,912 | 4,350 | 14,805 | 17,129 | 97,196 |
| 1965 | 67,426 | 5,934 | 16,162 | 19,261 | 108,783 |
| 1966 | 68,530 | 4,786 | 15,959 | 22,743 | 112,018 |
ROAD TRANSPORT—The Transport Act 1962 is the main legislation governing road transport and the operations of the Transport Department. The Traffic Regulations 1956, made pursuant to the Transport Act, set out the rules of the road, the requirements as to motor vehicle equipment, and the obligations of motor drivers and owners and pedestrians. The Heavy Motor Vehicle Regulations 1955 fix, in respect of commercial vehicles of over 2 tons gross weight, heavy-traffic fees payable to local authorities for road-maintenance purposes, and also for classifying roads and providing other measures. Quarterly licence fees under the Heavy Motor Vehicle Regulations range from $4.83 (not above 2 1/2 tons) to $196 (30 tons), with $7 for each additional ton above 30. The fees for farmers' trucks range from $2.67 to $184.67 on a corresponding basis. Heavy traffic fees, less the cost of collection, are paid into the National Roads Fund.
Third-party Insurance—Owners of motor vehicles are required to insure against liability to pay damages on account of the death of any person or of bodily injury to any person in the event of the death or bodily injury being caused by, or through, or in connection with, the use of motor vehicles in New Zealand. The premium is paid with the annual licence fees. The Transport Act 1962 also makes provision for compensation in respect of death or injury caused by uninsured or unidentified motor vehicles.
Transport Licensing—Passenger services, goods services, rental services, and harbour-ferry services may only be carried on under licence granted under the Transport Act 1962.
New Zealand is divided into a number of licensing districts, each with a licensing authority. Transport districts for passenger services and taxicabs differ, particularly in regard to the metropolitan areas of Auckland, Wellington, Christchurch, and Dunedin, from goods-service or rental-service districts. Harbour-ferry services are licensed only in Auckland. The licensing authority may comprise one or three persons. The sole member or the chairman (where the authority consists of three members) has the authority and privileges of a Magistrate in respect of proceedings.
A transport licence is required for the carriage of any goods (whether for hire or reward or not) by any goods-service vehicle the weight of which exceeds 2 1/2 tons if there is available for their carriage a route that includes not less than:
In the case of fresh fruit, fresh vegetables, or empty containers on return journeys, 100 miles of open Government railway.
In the case of hay, 75 miles of open Government railway.
In the case of logs, 50 miles of open Government railway or the Murupara-Kawerau railway.
In the case of biscuits or confectionery, 50 miles of open Government railway.
In any other case, 40 miles of open Government railway.
Where a farmer is carrying his own farming goods (other than lime) in a goods-service vehicle owned by him a transport licence is required if the gross laden weight exceeds 6 1/2 tons and if there is an available route that includes:
In the case of fresh vegetables, fresh fruit, or empty containers on return journeys, 100 miles of open Government railway.
In the case of eggs, 75 miles of open Government railway.
In any other case, 40 miles of open Government railway.
These provisions do not apply—
Where the route that includes the railway is longer by more than one-third than the shortest road route.
Where the owner of the vehicle is the Crown.
Where the vehicle is owned by a local authority or public body and the goods are carried within the district of the local authority or public body.
To the carriage of livestock.
To the carriage of fresh meat, poultry, and fresh fish.
To the carriage of reticulation materials by an electrical supply authority within its own district.
A transport licence is not required for: (1) the carriage to and from school of school children and their teachers only; (2) the carriage by a contract vehicle or a harbour ferry of a private party on a special occasion; (3) carriage of workmen to and from work by the Government or a public body, where the vehicle is not designed principally for the carriage of persons and such service has been approved by the Commissioner for this purpose; (4) carriage of newspapers, or in connection with funerals, or repair and wreckage of vehicles which have met with mishap; (5) farmers carrying milk, cream, or whey to and from dairy factories for their neighbours where a licensed goods service is not available; (6) relieving or assisting inhabitants of a locality where the usual communications are interrupted by flood, earthquake, or fire; (7) carriage of showman's goods, and equipment by a vehicle owned by the showman; (8) carriage of goods in connection with repair and maintenance of service-station equipment; (9) carriage of goods by an apiarist in connection with business; (10) carriage of household effects by an owner on change of residence; (11) letting on hire agricultural tractors and trailers; (12) carriage of soft drinks by manufacturers for retail distribution unless there is an available route which includes at least 75 miles of open Government railway; (13) carriage (otherwise than for commercial purposes) to or from an exhibition or show of a vehicle or farm machinery registered with a vintage farm machinery club if approved by the Commissioner of Transport in writing; (14) a goods service (not within section 109 of the Act) exclusively for the collection and disposal of domestic, industrial, or commercial refuse; (15) every goods service for the carriage by any member of a hunt club or pony club or amateur horse sports club of a horse or pony belonging to any member of the club to or from any hunt, gymkhana, amateur horse sports meeting, or other club function (excluding meetings under the control of the New Zealand Racing Conference or the New Zealand Trotting Conference); (16) every goods service for the carriage of goods from one part of a farm to another part of the same farm or from one farm to another adjoining farm which is owned or managed by the same person; (17) carriage of fresh, pasteurised, or homogenised milk and fresh or pasteurised cream; and (18) other passengers, goods, rental, or harbour-ferry services otherwise exempted by Order in Council.
Operations of Licensed Goods and Passenger Services—The following tables review the operations of licensed road transport services. The first of these tables gives the estimated overall figures concerning licensed road goods services for each of the four latest years ended 31 March.
| Road Goods Services | 1961–62 | 1962–63 | 1963–64 | 1964–65 |
|---|---|---|---|---|
| *Figure for capital invested now includes buildings, plant, etc. Figures for previous years comprised capital invested in vehicles only. | ||||
| Revenue $ (000) | 90,000 | 90,000 | 102,000 | 114,000 |
| Capital invested $ (000) | 60,000 | 62,000 | 84,000* | 84,000* |
| Total vehicle-miles (000) | 257,000 | 259,000 | 275,000 | 288,500 |
| Number of goods-service licences | 6,911 | 6,690 | 6,699 | 6,781 |
| Average revenue per vehicle-mile c | 35.25 | 34.71 | 37.21 | 39.62 |
| Average number of miles per vehicle | 15,050 | 15,268 | 15,786 | 15,825 |
The second table shows traffic data, revenue, and number of vehicles used by the road passenger services operating in New Zealand, and is inclusive of services in the four metropolitan transport districts, for each of the four latest years ended 31 March.
| Road Passenger Services | 1961–62 | 1962–63 | 1963–64 | 1964–65* |
|---|---|---|---|---|
| *Not fully comparable with preceding years as some operators transferred to goods service table. | ||||
| Traffic statistics— | ||||
| Passengers carried (000) | 189,492 | 189,994 | 201,029 | 195,207 |
| Vehicle-miles (000) | 76,418 | 79,899 | 83,134 | 83,898 |
| Total revenue $(000) | 22,920 | 23,439 | 24,359 | 25,085 |
| Total revenue, per mile c | 29.99 | 29.33 | 29.30 | 29.89 |
| Number of vehicles included | 4,016 | 3,875 | 4,135 | 4,076 |
Statistics on bus services run by the New Zealand Railways (included above) are given separately in Section 11B.
The following table sets out statistics of taxicab services for the four latest March years.
| Item | 1961–62 | 1962–63 | 1963–64 | 1964–65 |
|---|---|---|---|---|
| Passengers carried (000) | 26,000 | 26,500 | 27,000 | 27,500 |
| Milage run (000) | 89,000 | 91,000 | 93,000 | 94,000 |
| Total revenue $ (000) | 10,600 | 10,800 | 11,200 | 12,000 |
| Revenue per mile c | 11.91 | 11.87 | 12.04 | 12.77 |
| Number of vehicles | 2,861 | 3,064 | 2,761 | 3,206 |
Statistics of the rental vehicle industry are set out in the following table.
| Item | 1961–62 | 1962–63 | 1963–64 | 1964–65 |
|---|---|---|---|---|
| Number of cars | 2,484 | 2,594 | 2,824 | 3,052 |
| Number of other vehicles | 742 | 784 | 816 | 874 |
| Milage run (000) | 37,000 | 36,000 | 41,350 | 42,600 |
| Estimated total revenue $(000) | 3,200 | 3,000 | 3,800 | 4,000 |
| Revenue per mile c | 8.72 | 8.68 | 9.22 | 9.61 |
Economic Research—The Economic Research branch of the Transport Department was established in 1963 and during the first three years it has: (a) Carried out a survey on the general transport situation in New Zealand with its findings published in a bulletin Transport in New Zealand. (b) Conducted a survey into the demand for freight transport. (c) Collected and analysed statistical data for a new publication Car and Truck Operating Costs. (d) Analysed the financial and operating statistics of the licensed road transport industry with its findings published in Statistics of the Road Transport Industry. (e) Conducted studies into commodity transport, the economic cost of road accidents and other varied research work on transport economics.
In addition, investigations have been carried out for the newly formed Transport Commission.
TRAFFIC ACCIDENTS ON ROADS—Motor-vehicle accidents involving death or personal injury are required by law to be reported to the police. For the year ended 31 December 1965, 11,871 such accidents, resulting in 559 fatalities and in injuries to 17,093 other people were reported. Comparative figures for 1964 and 1963 were (1963 figures being given in parentheses): Number of accidents, 11,336 (10,071); fatalities, 428 (394); persons injured, 16,168 (14,477). The increases must be related to the growing number of vehicles on the roads. Details of the number and nature of road accidents for the latest five calendar years, which have been compiled by the Transport Department, are as follows:
| Nature of Accident | Number of Accidents | ||||
|---|---|---|---|---|---|
| 1961 | 1962 | 1963 | 1964 | 1965 | |
| Collisions— | |||||
| Between two or more motor vehicles | 4,088 | 4,248 | 4,453 | 5,207 | 5,609 |
| Between motor vehicle and bicycle | 1,331 | 1,364 | 1,297 | 1,303 | 1,297 |
| Between motor vehicle and pedestrian | 1,330 | 1,422 | 1,490 | 1,495 | 1,586 |
| Between motor vehicle and fixed object | 721 | 794 | 925 | 999 | 1,036 |
| Between motor vehicle and animal or horse vehicle | 56 | 51 | 66 | 68 | 71 |
| Between motor vehicle and railway train | 46 | 53 | 38 | 45 | 41 |
| Multiple and other collisions | 204 | 260 | 294 | 360 | 335 |
| Totals, collisions | 7,776 | 8,192 | 8,563 | 9,477 | 9,975 |
| Non-collisions— | |||||
| Drove off road | 267 | 326 | 346 | 408 | 550 |
| Went over bank | 326 | 342 | 372 | 432 | 431 |
| Overturned on roadway | 505 | 600 | 650 | 808 | 713 |
| Person fell from vehicle | 121 | 145 | 115 | 171 | 136 |
| Other | 36 | 39 | 25 | 40 | 66 |
| Totals, non-collisions | 1,255 | 1,452 | 1,508 | 1,859 | 1,896 |
| Total accidents | 9,031 | 9,644 | 10,071 | 11,336 | 11,871 |
Particulars of fatal motor vehicle accidents included in the foregoing table are now given. It should be noted that the figures relate to the number of deaths which, as stated above, numbered 559 in 1965.
| Nature of Accident | 1961 | 1962 | 1963 | 1964 | 1965 |
|---|---|---|---|---|---|
| Collisions, motor vehicle with— | |||||
| Pedestrian | 95 | 84 | 93 | 94 | 118 |
| Motor vehicle | 86 | 105 | 93 | 103 | 153 |
| Train | 6 | 9 | 6 | 6 | 9 |
| Bicycle | 30 | 31 | 26 | 26 | 32 |
| Horse vehicle or animal | 4 | – | – | 1 | – |
| Other | 47 | 59 | 63 | 51 | 62 |
| Otherwise | 84 | 86 | 76 | 95 | 120 |
| Totals | 352 | 374 | 357 | 376 | 494 |
Statistics of deaths resulting from motor vehicle accidents are available for many years from vital statistics, these figures being discussed briefly in Section 4c.
The following table shows motor accident death and injury rates in 1965 for New Zealand in comparison with other countries.
| — | Persons Killed | Persons Injured | Killed per 10,000 Vehicles | Killed per 100,000 Population | Injured per 10,000 Vehicles | Injured per 100,000 Population |
|---|---|---|---|---|---|---|
| New Zealand | 559 | 17,093 | 5.6 | 21.2 | 172.6 | 647.4 |
| Australia | 3,049 | 76,772 | 8.0 | 27.0 | 205.0 | 682.0 |
| Great Britain | 7,925 | 389,985 | 6.2 | 14.6 | 303.0 | 716.4 |
| United States of America | 49,000 | 1,800,000 | 5.4 | 25.3 | 197.8 | 928.7 |
ROAD SAFETY—The New Zealand Road Safety Council advises the Government on matters of road safety. Local road safety committees deal with local problems and make recommendations to the parent body. There are 36 local organisations operating throughout New Zealand.
Publicity directed towards road safety is carried out per medium of the press, posters, screen slides, and radio, concentrating on simultaneous presentation, as far as possible, of specific aspects of the problem. Other means employed in furthering road safety consist of traffic instruction in schools, inspection of motor vehicles, and enforcement of traffic laws.
The Transport Act 1962 contains several provisions designed to achieve greater safety on the roads. A maximum speed limit of 55 miles per hour is fixed, but lower limits are provided for special classes of vehicles—e.g., motor cycles with pillion riders, 45 miles per hour (30 miles per hour without safety helmets); heavy passenger vehicles, 45 miles per hour; vehicles drawing trailers, 40 miles per hour; and heavy goods vehicles, 40 miles per hour. A uniform speed limit of 30 miles per hour is fixed in boroughs, town districts, or other localities which have been declared to be closely populated localities by notice published by the Minister of Transport in the New Zealand Gazette. The Act also gives the Minister power to exempt any road in a particular borough or town district from the provisions of the maximum speed limit, and further exceptions are ambulances (fitted with a siren or bell) or police or traffic officer vehicles travelling on urgent duty, or fire engines on urgent fire service. Limited-speed zones may now be defined and indicated by signs at the approaches to closely settled areas, and there a maximum speed limit of 30 m.p.h. operates when adverse conditions prevail, such as poor visibility, heavy traffic, condition of road, or presence of children.
Persons convicted on indictment of reckless driving, dangerous driving, or driving while under the influence of drink or a drug to such an extent as to be incapable of having proper control of a motor vehicle, if injury or death to any person results from their actions, are liable to a maximum penalty of five years' imprisonment or a fine of $1,000. Where no person is injured or where the offence as above results in summary conviction, the maximum penalty is three months' imprisonment or a fine of $200. For driving while under the influence of drink to such an extent as to be incapable of having proper control of the vehicle the minimum disqualification from obtaining a licence, unless the Court thinks fit to order otherwise, is three years for the first offence and 10 years for any subsequent offence if convicted within seven years from the date of the immediately preceding conviction. For reckless or dangerous driving the minimum cancellation of licence is now one year. Application may be made to the Court to review the disqualification after six months except for intoxicated driving for which the period is 12 months and two years for a subsequent offence. The Act prescribes penalties for careless or inconsiderate driving, certain accident-promoting offences (three months' disqualification), and makes compulsory the reporting to the police of all motor-vehicle accidents involving injury.
Included in the Traffic Regulations 1956 are the requirements to which motor drivers must conform and which are designed to promote the safety of those using the roads.
The following table shows the nature of the offences resulting in convictions during the four latest years ended 31 March.
| Type of Offence | 1962–63 | 1963–64 | 1964–65 | 1965–66 |
|---|---|---|---|---|
| (a) Road traffic offences— | ||||
| Intoxicated in charge | 290 | 301 | 264 | 288 |
| Reckless or negligent driving | 20 | 25 | 36 | 38 |
| Driving in a dangerous manner | 215 | 267 | 299 | 357 |
| Dangerous speed | 107 | 108 | 122 | 213 |
| Careless or inconsiderate driving | 1,177 | 1,339 | 1,693 | 2,346 |
| Exceeding 30 m.p.h. | 7,633 | 8,336 | 10,310 | 13,857 |
| Overtaking offences | 837 | 853 | 1,005 | 1,288 |
| Failing to keep left | 715 | 834 | 1,042 | 1,496 |
| Failing to yield right of way | 400 | 550 | 723 | 1,906 |
| Driver's licence offences | 2,079 | 2,379 | 3,324 | 4,410 |
| Licensing and registration offences | 913 | 1,229 | 1,187 | 1,634 |
| Lighting offences | 1,685 | 1,828 | 2,133 | 2,735 |
| Defective brakes | 296 | 328 | 386 | 389 |
| No warrant of fitness | 4,578 | 5,926 | 6,828 | 6,776 |
| Loading offences | 133 | 136 | 176 | 235 |
| Exceeding 55 m.p.h. | 1,383 | 1,744 | 2,785 | 4,809 |
| L-plate offences | 499 | 604 | 698 | 649 |
| Cycling offences | 993 | 943 | 946 | 1,055 |
| Failing to dip | 131 | 136 | 180 | 239 |
| Failing to give right of way to pedestrians | 147 | 126 | 131 | 187 |
| Exceeding 40 m.p.h. with pillion passenger | 283 | 368 | 354 | 344 |
| Crossing railway line | 154 | 127 | 100 | 97 |
| Compulsory stop | 1,535 | 2,094 | 2,453 | 2,029 |
| Parking | 7,132 | 8,563 | 13,430 | 13,909 |
| Miscellaneous | 2,972 | 3,461 | 4,654 | 6,462 |
| (b) Heavy-motor-vehicle offences— | ||||
| Exceeding heavy-traffic licence | 773 | 896 | 1,130 | 1,668 |
| Exceeding axle load | 2,020 | 2,299 | 2,042 | 2,470 |
| No heavy-traffic licence | 645 | 773 | 841 | 1,119 |
| Speeding | 926 | 947 | 487 | 629 |
| Miscellaneous | 111 | 99 | 121 | 295 |
| Type of Offence | 1962–63 | 1963–64 | 1964–65 | 1965–66 |
| (c) Transport licensing offences— | ||||
| Unlicensed goods service | 102 | 160 | 199 | 101 |
| Breach of goods-service licence | 65 | 78 | 80 | 99 |
| Unlicensed passenger service | 1 | 2 | 5 | 3 |
| Breach of passenger-service licence | 5 | 2 | 5 | 3 |
| No certificate of fitness | 285 | 340 | 455 | 525 |
| No vehicle authority | 58 | 68 | 106 | 133 |
| Drivers' hours breaches | 13 | 18 | 6 | 173 |
| Overloading | 88 | 111 | 190 | 170 |
| Rental vehicle offences | 82 | 86 | 90 | 74 |
| Miscellaneous transport offences | 40 | 76 | 109 | 119 |
| (d) Miscellaneous offences under miscellaneous Acts and regulations | 74 | 93 | 101 | 55 |
| Totals | 41,595 | 48,653 | 61,226 | 75,384 |
The above table covers only the offences reported by officers of the Transport Department.
URBAN PASSENGER SERVICES OPERATED BY LOCAL AUTHORITIES—The data provided in this section covers the whole of the urban passenger transport services operated by local authorities, and no account is taken of the various motor-bus services operated by the New Zealand Government Railways, or by any private enterprise.
In recent years the use of the motor and trolley bus service has increased and electric tramways have been superseded. Electric tramways reached the peak of milage of track in use in 1929 when 170 miles of line were operated by local authorities. A steady decline took place until 1950 when 158 miles of track were in use; thereafter trams were rapidly replaced by motor and trolley buses. The last tramway system serving a city area was in Wellington, and this was terminated in May 1964. Wellington, however, still retains 31 chains of track for the only electric cable tram service now operating in New Zealand.
Details of revenue and expenditure are given in the following table.
| Year Ended 31 March | Revenue | Average Fare per Passenger | Revenue per Mile Run | Expenditure | Expenditure per Mile Run | |||
|---|---|---|---|---|---|---|---|---|
| Passenger Fares | Total | Operating Expenses | Capital Charges | Total | ||||
| $(000) | $ (000) | c | c | $(000) | $ (000) | $(000) | c | |
| Auckland— | ||||||||
| 1962 | 3,308 | 3,354 | 6.48 | 42.32 | 2,819 | 700 | 3,520 | 44.42 |
| 1963 | 3,236 | 3,286 | 6.53 | 41.80 | 2,851 | 751 | 3,602 | 45.82 |
| 1964 | 3,230 | 3,280 | 6.61 | 41.44 | 2,886 | 699 | 3,584 | 45.29 |
| 1965 | 3,245 | 3,296 | 6.87 | 40.92 | 2,960 | 706 | 3,666 | 45.51 |
| 1966 | 3,266 | 3,326 | 7.16 | 41.62 | 3,099 | 693 | 3,792 | 47.45 |
| Gisborne— | ||||||||
| 1962 | 57 | 59 | 7.27 | 31.25 | 58 | 1 | 58 | 31.16 |
| 1963 | 57 | 60 | 7.47 | 29.96 | 49 | 9 | 59 | 29.50 |
| 1964 | 62 | 64 | 8.03 | 30.71 | 53 | 10 | 63 | 30.18 |
| 1965 | 55 | 59 | 7.84 | 29.72 | 53 | 11 | 63 | 31.83 |
| 1966 | 57 | 61 | 7.82 | 30.51 | 55 | 8 | 63 | 31.12 |
| New Plymouth— | ||||||||
| 1962 | 137 | 141 | 4.25 | 26.12 | 145 | 16 | 161 | 29.93 |
| 1963 | 137 | 140 | 4.24 | 25.81 | 149 | 16 | 165 | 30.44 |
| 1964 | 133 | 137 | 4.42 | 25.50 | 146 | 16 | 162 | 30.17 |
| 1965 | 127 | 130 | 4.40 | 24.45 | 147 | 16 | 163 | 30.56 |
| 1966 | 123 | 127 | 4.43 | 24.55 | 150 | 12 | 162 | 31.42 |
| Palmerston North— | ||||||||
| 1962 | 78 | 81 | 5.16 | 25.39 | 76 | 13 | 88 | 27.73 |
| 1963 | 81 | 84 | 5.37 | 25.29 | 72 | 12 | 84 | 25.35 |
| 1964 | 80 | 83 | 5.31 | 24.45 | 73 | 13 | 86 | 25.29 |
| 1965 | 84 | 87 | 5.65 | 24.98 | 77 | 14 | 91 | 25.96 |
| 1966 | 81 | 83 | 5.46 | 24.14 | 81 | 14 | 95 | 27.39 |
| Eastbourne— | ||||||||
| 1962 | 152 | 158 | 12.48 | 28.34 | 115 | 27 | 142 | 25.52 |
| 1963 | 153 | 159 | 12.61 | 28.51 | 121 | 26 | 147 | 26.32 |
| 1964 | 153 | 159 | 12.55 | 28.91 | 120 | 30 | 151 | 27.49 |
| 1965 | 161 | 168 | 13.57 | 31.22 | 129 | 31 | 160 | 29.63 |
| 1966 | 155 | 163 | 13.70 | 31.99 | 121 | 34 | 155 | 30.40 |
| Wellington— | ||||||||
| 1962 | 1,949 | 1,996 | 5.49 | 45.59 | 1,942 | 371 | 2,313 | 52.84 |
| 1963 | 1,957 | 2,002 | 5.59 | 45.11 | 2,017 | 395 | 2,413 | 54.37 |
| 1964 | 1,957 | 2,007 | 5.61 | 44.19 | 2,049 | 458 | 2,506 | 55.18 |
| 1965 | 1,967 | 2,014 | 5.94 | 44.50 | 2,062 | 415 | 2,477 | 54.74 |
| 1966 | 2,023 | 2,066 | 6.60 | 46.24 | 2,133 | 429 | 2,564 | 57.36 |
| Christchurch— | ||||||||
| 1962 | 1,202 | 1,226 | 5.45 | 27.12 | 1,253 | 303 | 1,556 | 34.41 |
| 1963 | 1,203 | 1,226 | 5.48 | 27.24 | 1,283 | 293 | 1,576 | 35.03 |
| 1964 | 1,300 | 1,324 | 6.42 | 29.54 | 1,335 | 309 | 1,643 | 36.67 |
| 1965 | 1,279 | 1,310 | 6.49 | 28.50 | 1,366 | 278 | 1,644 | 35.78 |
| 1966 | 1,271 | 1,303 | 6.54 | 28.92 | 1,389 | 239 | 1,628 | 36.15 |
| Timaru— | ||||||||
| 1962 | 76 | 77 | 5.90 | 29.72 | 80 | 24 | 105 | 40.14 |
| 1963 | 74 | 76 | 5.94 | 28.97 | 80 | 24 | 104 | 39.44 |
| 1964 | 72 | 73 | 6.11 | 27.88 | 77 | 23 | 100 | 37.98 |
| 1965 | 70 | 72 | 5.87 | 25.43 | 84 | 24 | 1.08 | 37.96 |
| 1966 | 74 | 76 | 6.44 | 26.15 | 92 | 24 | 116 | 39.97 |
| Dunedin— | ||||||||
| 1962 | 813 | 832 | 5.09 | 39.76 | 783 | 223 | 1,006 | 48.07 |
| 1963 | 819 | 840 | 5.78 | 40.28 | 785 | 231 | 1,016 | 48.73 |
| 1964 | 835 | 858 | 6.50 | 41.19 | 809 | 248 | 1,057 | 50.77 |
| 1965 | 797 | 822 | 6.52 | 41.31 | 789 | 258 | 1,047 | 52.59 |
| 1966 | 759 | 787 | 6.63 | 41.53 | 802 | 250 | 1,053 | 55.55 |
| Invercargill— | ||||||||
| 1962 | 102 | 104 | 4.58 | 19.64 | 142 | 32 | 174 | 32.84 |
| 1963 | 108 | 110 | 4.57 | 20.04 | 147 | 32 | 179 | 32.71 |
| 1964 | 111 | 113 | 4.60 | 21.56 | 142 | 32 | 174 | 33.13 |
| 1965 | 116 | 120 | 4.99 | 22.89 | 144 | 32 | 176 | 33.69 |
| 1966 | 119 | 123 | 5.37 | 23.71 | 160 | 30 | 190 | 36.62 |
| Totals, All Services— | ||||||||
| 1962 | 7,873 | 8,028 | 5.84 | 37.67 | 7,414 | 1,710 | 9,124 | 42.82 |
| 1963 | 7,825 | 7,983 | 5.97 | 37.43 | 7,555 | 1,789 | 9,346 | 43.82 |
| 1964 | 7,932 | 8,098 | 6.25 | 37.76 | 7,689 | 1,837 | 9,527 | 44.43 |
| 1965 | 7,903 | 8,080 | 6.47 | 37.41 | 7,811 | 1,784 | 9,595 | 44.43 |
| 1966 | 7,929 | 8,116 | 6.80 | 38.20 | 8,083 | 1,734 | 9,818 | 46.22 |
Details of vehicles, miles run and passengers carried are given in the following table.
| Year Ended 31 March | Number of Vehicles | Number of Miles Run | Total Passengers Carried | Passengers per Mile Run | ||
|---|---|---|---|---|---|---|
| Trolley Buses | Motor Buses | Trolley Buses | Motor Buses | |||
*Includes tram and cable cars: 1961–62, 64; 1962–63, 64; 1963–64, 57; 1964–65, 2; 1965–66, 2. †Includes tram and cable car milage; 1961–62, 1,039,000; 1962–63, 979,000; 1963–64, 401,000; 1964–65, 66,000; 1965–66, 40,000. | ||||||
| (000) | (000) | (000) | ||||
| Auckland— | ||||||
| 1962 | 133 | 235 | 3,525 | 4,398 | 51,006 | 6.44 |
| 1963 | 133 | 235 | 3,414 | 4,448 | 49,531 | 6.30 |
| 1964 | 133 | 235 | 3,390 | 4,524 | 48,861 | 6.17 |
| 1965 | 133 | 235 | 3,473 | 4,583 | 47,239 | 5.86 |
| 1966 | 133 | 235 | 3,420 | 4,570 | 45,600 | 5.71 |
| Gisborne— | ||||||
| 1962 | 9 | 188 | 781 | 4.16 | ||
| 1963 | 10 | 199 | 767 | 3.85 | ||
| 1964 | 10 | 208 | 770 | 3.71 | ||
| 1965 | 10 | 199 | 707 | 3.55 | ||
| 1966 | 10 | 202 | 735 | 3.65 | ||
| New Plymouth— | ||||||
| 1962 | 4 | 17 | 84 | 454 | 3,230 | 6.00 |
| 1963 | 4 | 18 | 82 | 461 | 3,228 | 5.94 |
| 1964 | 4 | 18 | 82 | 455 | 3,018 | 5.61 |
| 1965 | 4 | 18 | 75 | 458 | 2,896 | 5.43 |
| 1966 | 3 | 18 | 60 | 458 | 2,784 | 5.38 |
| Palmerston North— | ||||||
| 1962 | – | 12 | – | 318 | 1,506 | 4.74 |
| 1963 | – | 14 | – | 331 | 1,501 | 4.53 |
| 1964 | – | 14 | – | 340 | 1,502 | 4.41 |
| 1965 | – | 14 | – | 349 | 1,493 | 4.27 |
| 1966 | – | 14 | – | 346 | 1,476 | 4.27 |
| Eastbourne— | ||||||
| 1962 | – | 21 | – | 558 | 1,220 | 2.19 |
| 1963 | – | 21 | – | 559 | 1,214 | 2.17 |
| 1964 | – | 21 | – | 550 | 1,216 | 2.21 |
| 1965 | – | 21 | – | 539 | 1,185 | 2.20 |
| 1966 | – | 21 | – | 510 | 1,132 | 2.22 |
| Wellington— | ||||||
| 1962 | 145* | 112 | 2,511 | 1,866 | 35,505 | 8.11 |
| 1963 | 145* | 111 | 2,423 | 2,016 | 35,008 | 7.89 |
| 1964 | 144* | 155 | 1,903† | 2,639 | 34,895 | 7.68 |
| 1965 | 121* | 145 | 2,351† | 2,174 | 33,092 | 7.31 |
| 1966 | 121* | 144 | 2,465† | 2,004 | 30,668 | 6.86 |
| Christchurch— | ||||||
| 1962 | – | 156 | – | 4,522 | 22,062 | 4.88 |
| 1963 | – | 156 | – | 4,501 | 21,945 | 4.88 |
| 1964 | – | 168 | – | 4,482 | 20,263 | 4.52 |
| 1965 | – | 166 | – | 4,596 | 19,709 | 4.29 |
| 1966 | – | 166 | – | 4,504 | 19,432 | 4.31 |
| Timaru— | ||||||
| 1962 | – | 17 | – | 260 | 1,287 | 4.94 |
| 1963 | – | 16 | – | 262 | 1,252 | 4.77 |
| 1964 | – | 16 | – | 262 | 1,176 | 4.49 |
| 1965 | – | 16 | – | 284 | 1,200 | 4.23 |
| 1966 | – | 15 | – | 291 | 1,151 | 3.96 |
| Dunedin— | ||||||
| 1962 | 75 | 39 | 1,400 | 694 | 15,984 | 7.64 |
| 1963 | 68 | 39 | 1,292 | 793 | 14,184 | 6.80 |
| 1964 | 68 | 45 | 1,269 | 814 | 12,854 | 6.17 |
| 1965 | 68 | 41 | 1,197 | 793 | 12,210 | 6.13 |
| 1966 | 68 | 43 | 1,067 | 828 | 11,448 | 6.04 |
| Invercargill— | ||||||
| 1962 | – | 20 | – | 530 | 2,226 | 4.20 |
| 1963 | – | 20 | – | 548 | 2,359 | 4.30 |
| 1964 | – | 22 | – | 526 | 2,404 | 4.57 |
| 1965 | – | 22 | – | 523 | 2,330 | 4.46 |
| 1966 | – | 21 | – | 520 | 2,219 | 4.27 |
| Total: All Services | (000) | (000) | (000) | |||
| 1962 | 357* | 638 | 7,521† | 13,788 | 134,806 | 6.33 |
| 1963 | 350* | 640 | 7,212† | 14,118 | 130,989 | 6.14 |
| 1964 | 349* | 704 | 6,644† | 14,800 | 126,958 | 5.92 |
| 1965 | 326* | 688 | 7,096† | 14,498 | 122,062 | 5.65 |
| 1966 | 325* | 687 | 7,013† | 14,231 | 116,645 | 5.49 |
The length of routes covered by the services are given in the following table.
| Area and Service | At 31 March | |||||||||
|---|---|---|---|---|---|---|---|---|---|---|
| 1962 | 1963 | 1964 | 1965 | 1966 | ||||||
| Auckland— | m | ch | m | ch | m | ch | m | ch | m | ch |
| Trolley bus | 68 | 52 | 70 | 16 | 70 | 47 | 60 | 4 | 61 | 40 |
| Motor bus | 144 | 43 | 146 | 60 | 147 | 23 | 139 | 48 | 140 | 0 |
| Gisborne— | ||||||||||
| Motor bus | 14 | 40 | 14 | 40 | 14 | 40 | 14 | 40 | 14 | 40 |
| New Plymouth— | ||||||||||
| Trolley bus | 3 | 29 | 3 | 29 | 3 | 29 | 3 | 29 | 3 | 29 |
| Motor bus | 19 | 39 | 20 | 9 | 20 | 9 | 20 | 9 | 20 | 39 |
| Palmerston North— | ||||||||||
| Motor bus | 52 | 24 | 53 | 40 | 55 | 0 | 56 | 0 | 56 | 0 |
| Eastbourne— | ||||||||||
| Motor bus | 16 | 0 | 16 | 0 | 16 | 0 | 16 | 0 | 16 | 0 |
| Wellington— | ||||||||||
| Trolley bus | 24 | 46 | 24 | 46 | 25 | 40 | 33 | 32 | 32 | 56 |
| Motor bus | 55 | 41 | 55 | 41 | 58 | 76 | 56 | 51 | 57 | 27 |
| Tram or cable way | 13 | 68 | 13 | 68 | 9 | 59 | 0 | 31 | 0 | 31 |
| Christchurch— | ||||||||||
| Motor bus | 148 | 34 | 149 | 19 | 153 | 0 | 156 | 0 | 158 | 4 |
| Timaru— | ||||||||||
| Motor bus | 20 | 3 | 20 | 3 | 20 | 3 | 23 | 11 | 23 | 11 |
| Dunedin— | ||||||||||
| Trolley bus | 25 | 20 | 25 | 20 | 25 | 20 | 25 | 20 | 25 | 20 |
| Motor bus | 42 | 35 | 42 | 35 | 42 | 35 | 42 | 35 | 42 | 35 |
| Invercargill— | ||||||||||
| Motor bus | 29 | 39 | 29 | 39 | 26 | 6 | 26 | 6 | 26 | 6 |
DEVELOPMENT OF AVIATION—Aviation developed early in New Zealand. Richard William Pearse, of the Waitohi Valley near Timaru, designed and built a successful heavier-than-air machine which flew at least as early as 31 March 1904, thus almost forestalling the Wright Brothers. There were numerous other important New Zealand pioneers. In the 1920s aviation activities spread, notably through the aero-club movement. Commercial air services also came into being and at the outbreak of war in 1939 there was already a considerable network of regular air services within New Zealand in addition to widespread charter, air taxi, and aerial work activity. Regular air services overseas did not begin before the Second World War, in spite of a number of gallant pioneer flights.
New Zealand today ranks among the leading three nations of the world in terms of use of air transport per head of population. A further significant increase in international air traffic, with some resultant effect on domestic air traffic, is taking place following the opening of the new International Airport at Auckland in November 1965, and the use of that airport and Christchurch by large jet aircraft. The main runway at Auckland International Airport is 8,500 ft long and the airport cost $20 million to construct.
New Zealand's international airline, Air New Zealand, operates in partnership with QANTAS and BOAC across the Tasman Sea and 234,773 passengers were carried to and from Australia in the year ended 31 March 1966. In the same period a further 86,154 passengers were carried between New Zealand and the South Pacific island groups. Passengers carried on domestic services in the year totalled 1,113,336. An air freight service operates across Cook Strait and under charter, while aerial topdressing resulted in some 1,038,297 tons of fertiliser and lime being distributed on pasture land to stimulate farm production. There are over 100 licensed aerodromes throughout the country, the majority unsealed with few amenities. However, key airports are rapidly being brought up to turbo-prop and jet aircraft standards. In addition, there are approximately 10,000 unlicensed grass strips used mainly for agricultural and other aerial work operations.
AIR SERVICE OPERATIONS—Most of the domestic air services are provided by the New Zealand National Airways Corporation which operates a network linking all major centres. The Corporation was established by the New Zealand National Airways Act 1945 and was therein charged with establishing a national air transport system to meet the need for air services within New Zealand. (The Corporation took over the routes of private operators including Union Airways of New Zealand Ltd.) When the Corporation was established the legislation envisaged a monopoly. This monopoly was legally ended by the passage of the Air Services Licensing Act 1951 which established an independent statutory authority to hear applications for air service licences. Since that date, numerous licences have been granted to privately owned companies, but the Corporation's position has not been significantly affected: in terms of total capacity ton-miles, the operations of all private domestic scheduled operators in 1965–66 represented only 15.9 percent of the operations of the Corporation.
A list of domestic operators indicating their routes and the scale of their operations is set out later.
New Zealand participates also in international air services through its ownership of Air New Zealand. This company, established in 1940 as Tasman Empire Airways Ltd., was originally jointly owned by Australia, Britain, and New Zealand. At its incorporation the subscribed capital was contributed by the United Kingdom Government (through BOAC), 38 percent; by the Commonwealth of Australia (through QANTAS), 23 percent; and by Union Airways of New Zealand Ltd. (wholly owned by the Union Steam Ship Co.), 39 percent. By 1947 the Minister of Finance in New Zealand had acquired the shareholding of Union Airways, and from 1 March 1949 the shareholding was held in the following proportions: BOAC, 20 percent; QANTAS, 30 percent; New Zealand Government, 50 percent. BOAC sold its interest to the Commonwealth of Australia in 1955.
By 1960 it had become clear that the monopoly of the Tasman air traffic formerly reserved to TEAL could not be much longer maintained in New Zealand's interests and this fact, together with the spread of jet aircraft throughout the world, led to planning for the company to extend its services to the U.S.A. and elsewhere, for which purpose it would require large jet aircraft. In these new circumstances the Australian and New Zealand Governments agreed that New Zealand should purchase the Australian shareholding, and thus become the sole owner of the company. In March 1961 an agreement to this effect was concluded and at the same time a bilateral air services agreement was negotiated between Australia and New Zealand whereby each country granted to the airline of the other rights to and beyond its territory. Subsequently, the New Zealand Government negotiated traffic rights for Air New Zealand in Honolulu, Los Angeles, Hong Kong, and Singapore in addition to the company's traditional rights in Fiji and the rights already obtained in Australia and American Samoa. (The change of name from TEAL to Air New Zealand was made on 1 April 1965.) A fleet of three Douglas DC 8 series 50 aircraft was obtained in the latter half of 1965 and came into use on routes to the United States in December 1965 and to South-East Asia in March 1966.
Other regular international air services are provided by BOAC, QANTAS, Canadian Pacific Airlines, Pan American World Airways and UTA French Airlines; these are described later.
LEGISLATION—The principal legislation affecting civil aviation in New Zealand is the Civil Aviation Act 1964. This Act established the Department of Civil Aviation (the Civil Aviation Administration had formerly formed part of the Air Department concerned also with military aviation). The principal functions of the new Department are stated to be: (a) To promote and encourage the orderly and economic development of civil aviation: (b) To exercise such functions as may be necessary to ensure the safe operation of aircraft: (c) To initiate and carry out surveys into any aspect of civil aviation: (d) To provide for the investigation of accidents in which aircraft are involved: (e) To advise the Minister and Government Departments on all matters affecting civil aviation: (f) To provide a national meteorological service: (g) To carry out such functions and duties as may be conferred on it by this or any other enactment or as the Minister may from time to time direct.
The Act provides comprehensive powers for the Minister in relation to aerodromes and other matters and provides for regulations to be made governing the conduct of civil aviation within New Zealand. The Department is headed by the Secretary for Civil Aviation. The Director of Operations and Technical Services in the Department has statutory powers of his own in regulatory matters. The Department embraces also the Meteorological Services and the Chief Inspector of Accidents.
Under the Air Services Licensing Act 1951 all air services must comply with an air service licence issued by the independent statutory Air Services Licensing Authority. “Air service” means an air transport service or an air topdressing service, whether regular or casual, in respect of any journey beginning and ending in New Zealand; and includes any such service in which the aircraft used leaves and returns to the same aerodrome without any intermediate stop.
The International Air Services Licensing Act 1947 provides that no systematic public air transport service shall be operated between New Zealand and another country except in accordance with a licence issued by the Minister of Civil Aviation. (Non-scheduled or charter services are made subject to the Minister's approval by the Civil Aviation Act 1964.)
The Carriage by Air Act 1940 adopted the Warsaw Convention governing the liabilities of international air carriers towards their passengers and consignors of goods (and other persons) in respect of international carriage. The Carriage by Air Act 1962 enables ratification of the Hague Protocol which has as its principal effect an increase in the limit of liability for the death of a passenger from $6,000 to $12,000 approximately. Owing to international complications, New Zealand has not yet ratified the Hague Protocol.
AIR NAVIGATIONAL SERVICES AND FACILITIES—The Department of Civil Aviation is the responsible authority for the provision of all facilities for air navigation in New Zealand and its island territories, and by delegation the facilities required for flying operations in Western Samoa and to a lesser degree in Fiji.
Air navigational facilities include a variety of electronic aids such as non-directional medium-frequency beacons (NDB), very high-frequency beacons (VOR), instrument landing systems (ILS), surveillance radar (SRE), precision approach radar (PAR), distance measuring equipment (DME), and also visual aids to navigation including visual glide slope indicators (VASI), high and low intensity approach, runway and taxiway lights, aerodrome identification beacons, obstruction lights, hazard beacons, runway markings, cloud height measuring devices, wind strength and direction indicators, etc. A Telecommunications Division designs, installs, and maintains the electronic equipment.
To assist the safe, orderly, and expeditious use of the air navigation system the Department provides a comprehensive ground services organisation comprising air traffic control units, communications services, crash-fire services, a search and rescue and ground safety organisations. Units of the ground services organisations are located at the majority of aerodromes served by regular scheduled air transport services in New Zealand and Pacific island territories, operating from control towers and associated departmental buildings. In addition, control centres and communications centres are established at Auckland and Fiji for the conduct of international operations and at Wellington, Christchurch, and Dunedin to provide services to en-route aircraft throughout the entire country. A search and rescue service is provided from rescue co-ordination centres established by the Department whose responsibility it is to organise and co-ordinate the effort and resources of military and civil agencies in the planning and direction of search and rescue operations for any type of action, whether air, land, or sea.
The Department maintains a flight supervision and standards service and conducts examinations and issues licences for all categories of aircrew and ground personnel. Specially equipped aircraft and qualified aircrew are continuously engaged on the checking and calibration of all air navigation facilities.
An Aeronautical Information Service prepares and publishes the New Zealand Aeronautical Information Publication and Notices to Airmen and, in collaboration with Lands and Survey Department, produces aeronautical maps and charts, etc.
An aeronautical training college is established at Christchurch International Airport where regular courses are conducted in air traffic control, meteorology, radio engineering, and communications.
GOVERNMENT EXPENDITURE—The net Government expenditure on civil aviation in New Zealand and its island territories in 1965–66 was $8,195,990, compared with $8,522,314 in 1964–65.
New Zealand is the administering authority for the South Pacific Air Transport Council, which established and maintains the International Airport at Nandi, Fiji. The major member Governments are United Kingdom, Australia, and New Zealand.
AIR SERVICES LICENSING—Licensing of air services in New Zealand is vested in the Air Services Licensing Authority which was constituted by the Air Services Licensing Act of 1951. This Authority consists of one chairman and three members appointed by the Crown, and its principal functions are to hear and determine applications for the granting, renewal, or transfer of air service licences. An air service (including aerial topdressing) may not be commenced or carried on without a licence granted under the Act except that any aero club affiliated to the Royal New Zealand Aero Club (Inc.) may carry club members in club-owned or hired aircraft without such a licence.
NEW ZEALAND NATIONAL AIRWAYS CORPORATION—Most of the internal scheduled services are operated by the Corporation. The Corporation operates daily services to and from the following destinations: Kaitaia, Kaikohe, Whangarei, Auckland, Tauranga, Hamilton, Whakatane, Rotorua, Taupo, Gisborne, New Plymouth, Napier-Hastings, Wanganui, Palmerston North, Masterton, Wellington, Blenheim, Nelson, Westport, Hokitika, Christchurch, Timaru, Oamaru, Dunedin, Invercargill.
Statistics of operations of the National Airways Corporation for the two latest years are shown in the following table.
| Item | 1964–65 | 1965–66 | Change in Latest Year |
|---|---|---|---|
| *Includes Bristol Freighter operations. | |||
| percent | |||
| Route milage | 3,459 | 3,459 | … |
| Milage flown— | |||
| (a) Revenue | 9,323,339 | 10,278,742* | +10.25 |
| (b) Non-revenue including training | 279,850 | 331,585 | + 18.49 |
| Revenue passengers carried— | |||
| Schedule | 992,346 | 1,042,803 | +13.06 |
| Charter | 13,355 | 9,813 | −26.52 |
| Passenger-miles created (000)— | |||
| Schedule | 338,809 | 386,787 | + 14.16 |
| Charter | 8,009 | 5,112 | −36.17 |
| Revenue passenger-miles (000)— | |||
| Schedule | 246,424 | 279,225 | + 13.31 |
| Charter | 5,338 | 3,201 | −40.04 |
| Average passenger journey (miles) | 267 | 268 | + 0.22 |
| Freight, excess, mail (lb) (000)— | |||
| Schedule | 34,243 | 36,368 | + 6.20 |
| Charter | 3,170 | 1,543 | −51.33 |
| Excess baggage ton-miles | 227,227 | 247,197 | + 8.79 |
| Freight ton-miles (000)— | |||
| Schedule | 4,420* | 4,733* | + 7.09 |
| Charter | 277* | 182* | −34.07 |
| Mail ton-miles | 429,109 | 435,696 | +1.53 |
| Total revenue load factor | 69.87 | 68.12 | … |
| Revenue passenger load factor | 72.73 | 72.19 | … |
Operating expenditure in 1965–66 totalled $15,187,878 (including depreciation on equipment) as compared with $13,325,344 in 1964–65 and $11,882,400 in 1963–64.
An operating profit of $648,408 for the year 1965–66 was recorded but, after adding interest on investments and deducting taxation and interest on capital loans, this was reduced to $153,890. The corresponding figure for 1964–65 was $293,674 net profit.
Notwithstanding the Air Services Licensing Act 1951, the Corporation is still charged by the National Airways Act 1945 “to satisfy the need for air services within New Zealand”. The Corporation has therefore sought constantly to improve the standard and scope of its service whilst keeping fares at a low level. The Corporation has not therefore sought high profits. The expansion achieved during recent years is indicated by the increase in revenue passenger miles on scheduled services from 216 million in 1963–64 to 246 million in 1964–65 and to 279 million in 1965–66.
FLYING OPERATIONS: Domestic Scheduled Services—Scheduled air transport operations over specific routes were first commenced in New Zealand in December 1934, on the route Inchbonnie - Hokitika - Franz Josef Glacier, on the West Coast of the South Island. Subsequent extensions of services up to the outbreak of war in September 1939 had covered almost the whole of New Zealand. During 1946 and 1947 the New Zealand National Airways Corporation absorbed all then existing scheduled commercial services, and by adding to the fleet of aircraft was able to commence new services.
In February 1953 a scheduled service between Christchurch and Oamaru via Ashburton and Timaru was commenced by South Island Airways Ltd., followed by a Christchurch to Nelson service during 1954. In April 1956 these services were taken over by a new company, Trans Island Airways Ltd. The Christchurch - Oamaru service ceased in June 1957 and the Christchurch - Nelson service ceased in March 1959. Bay of Plenty Airways Ltd. came into existence in July 1958, taking over the non-scheduled operations of Tauranga Air Services Ltd. Their Wellington service commenced in September 1959. The company ceased operations in November 1961.
In December 1960 a new company, South Pacific Airlines of New Zealand Ltd., commenced timetable operations with two modified DC 3 aircraft, serving smaller centres not previously having a regular air service. This airline added a further three modified DC 3 aircraft and fully scheduled operations were undertaken largely consistent with the company's initial service to smaller centres, but also offering competition on some routes previously operated only by the National Airways Corporation, until the end of February when the company became bankrupt and was finally wound-up. Some of the services were continued by National Airways Corporation, and others by the Mount Cook and Southern Lakes Tourist Co. Ltd.
At 26 December 1966 domestic scheduled services excluding NAC were being operated on the following routes.
| Terminating Points of Routes | Intermediate Stops | Route Miles | Scheduled Frequency |
|---|---|---|---|
| West Coast Airways Ltd. | |||
| Hokitika-Haast | Franz Josef, Fox, as required | 126 | 5 return flights weekly |
| Straits Air Freight Express Ltd. | |||
| Wellington-Nelson (freight) | Nil | 96 | Daily as required |
| Wellington-Blenheim (freight) | Nil | 72 | |
| Mt. Cook and Southern Lakes Tourist Co. Ltd. | |||
| Christchurch-Te Anau | Mt. Cook, Queenstown, Te Anau | 378 | 3 return flights weekly |
| Christchurch-Dunedin | Mt. Cook, Queenstown, also Cromwell on demand, Alexandra | 337 | 4 return flights weekly |
| Christchurch-Queenstown | Mt. Cook | 242 | 14 flights weekly, 7 north and 7 south |
At 31 March 1966 the aircraft used in the operation of services on the above routes and including NAC were:
| Bristol 170 | 6 |
| DH 89 Dominie | 2 |
| Douglas DC 3 | 18 |
| Douglas DC 3 (freighter) | 6 |
| Fokker Friendship | 11 |
| Vickers Viscount 807 | 4 |
| Total | 47 |
The following table gives the summarised results of the operations of scheduled commercial air services during the last 11 years. Statistics for the New Zealand Railways Freight Service, operated by Straits Air Freight Express Ltd. since 1 April 1951, are excluded.
| Year Ended 31 March | Hours Flown | Miles Flown (000) | Passengers | Freight lb (000)* | Mail lb (000) | Passenger-miles (000) | Freight Ton-miles† (000) | Mail Ton-miles (000) |
|---|---|---|---|---|---|---|---|---|
*Includes excess baggage. †Includes excess baggage ton-miles. | ||||||||
| 1956 | 49,572 | 6,276 | 428,494 | 19,070 | 1,157 | 104,402 | 2,397 | 219 |
| 1957 | 53,016 | 6,815 | 476,779 | 19,017 | 1,229 | 118,659 | 2,419 | 250 |
| 1958 | 54,309 | 7,107 | 513,694 | 20,854 | 1,757 | 130,266 | 2,811 | 277 |
| 1959 | 55,356 | 7,481 | 556,545 | 21,329 | 1,808 | 146,392 | 2,990 | 279 |
| 1960 | 54,776 | 7,614 | 650,812 | 22,492 | 1,993 | 169,936 | 3,165 | 313 |
| 1961 | 60,796 | 8,539 | 744,025 | 30,005 | 2,225 | 189,594 | 4,077 | 355 |
| 1962 | 67,255 | 9,602 | 841,783 | 30,789 | 2,319 | 214,105 | 4,360 | 375 |
| 1963 | 59,022 | 8,914 | 822,023 | 29,028 | 2,464 | 211,846 | 4,114 | 397 |
| 1964 | 62,180 | 9,327 | 873,246 | 28,128 | 2,552 | 228,209 | 4,176 | 423 |
| 1965 | 67,229 | 10,302 | 983,612 | 31,934 | 2,542 | 262,217 | 4,812 | 431 |
| 1966 | 73,098 | 11,169 | 1,111,858 | 33,925 | 2,815 | 269,622 | 5,174 | 453 |
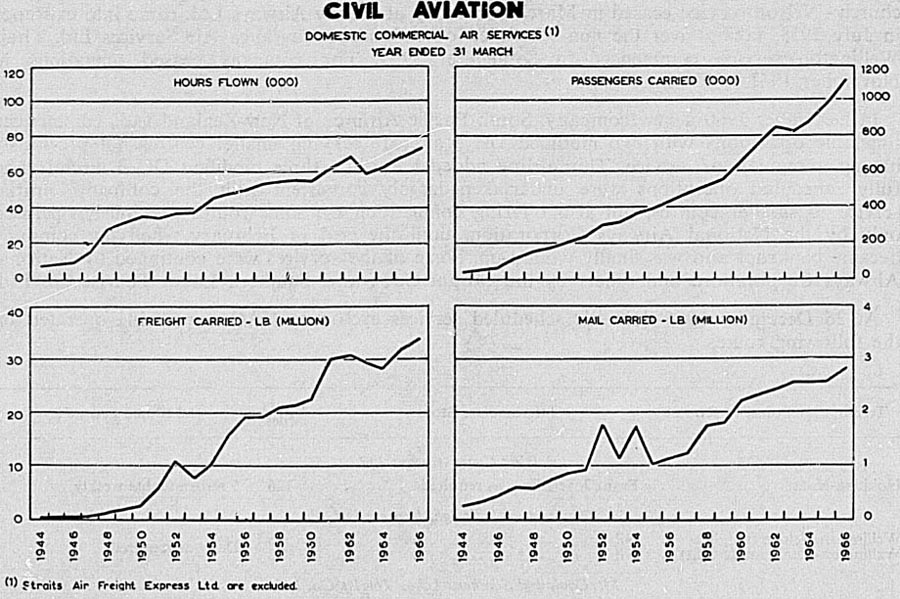
Cook Strait Rail/Air Freight Service—The New Zealand Railways Air Freight Service was commenced officially in February 1947 following a number of special inter-island freight flights which had been carried out by the Royal New Zealand Air Force at the request of the Railways Department to meet a shipping emergency. The service was conducted by the RNZAF, operating Dakota aircraft, until June 1947, when the service was handed over to the New Zealand National Airways Corporation, which continued to operate with Dakotas.
In 1950 the Railways Department decided to allow private enterprise the opportunity of tendering for the contract to run the service, and the successful tenderer was Straits Air Freight Express Ltd., which took over on 1 April 1951. The service is at present being maintained by five Bristol Freighter aircraft on a daily basis, the number of trips varying according to the amount of cargo offering.
Traffic statistics for this freight service for the last 11 years are as follows. The drop from the peak figures of 1961–62 can be attributed in part to the operation of the rail-road ferry G.m.v. Aramoana across Cook Strait between Wellington and Picton from August 1962.
| Year Ended 31 March | Trips Flown | Hours Flown | Miles Flown | Freight lb (000) | Freight Ton-miles (000) | Passengers |
|---|---|---|---|---|---|---|
| 1956 | 5,411 | 2,683 | 398,547 | 53,914 | 1,780 | 986 |
| 1957 | 6,107 | 3,033 | 453,912 | 54,364 | 1,797 | 1,308 |
| 1958 | 7,415 | 3,826 | 554,688 | 67,857 | 2,240 | 1,660 |
| 1959 | 8,563 | 4,365 | 642,666 | 76,280 | 2,527 | 1,437 |
| 1960 | 9,509 | 4,465 | 628,113 | 87,612 | 2,566 | 1,225 |
| 1961 | 11,853 | 4,864 | 635,078 | 112,771 | 2,693 | 1,231 |
| 1962 | 13,739 | 5,534 | 765,022 | 122,360 | 3,041 | 1,557 |
| 1963 | 12,381 | 5,050 | 660,924 | 110,625 | 2,650 | 927 |
| 1964 | 10,588 | 4,265 | 560,130 | 87,656 | 2,067 | 809 |
| 1965 | 11,315 | 4,558 | 591,796 | 95,764 | 2,239 | 899 |
| 1966 | 13,401 | 5,755 | 773,253 | 115,765 | 2,987 | 1,478 |
Non-scheduled Air Services—During March 1966, 16 companies and 25 aero clubs were providing timetable, charter, taxi, scenic, and joyriding services. The RNZAF, using Sunderland flying boats, flew 30 flights to the Chatham Islands during the year. The following is a traffic summary of these services for the two latest years ended 31 March,
| — | 1964–65 | 1965–66 | ||||
|---|---|---|---|---|---|---|
| Commercial Companies | Aero Clubs | Total | Commercial Companies | Aero Clubs | Total | |
| Number of flights | 30,707 | 8,978 | 39,685 | 25,988 | 8,446 | 34,434 |
| Hours flown | 15,787 | 6,804 | 22,591 | 14,598 | 6,104 | 20,702 |
| Miles flown | 1,607,890 | 492,628 | 2,100,518 | 1,397,616 | 467,683 | 1,865,299 |
| Passengers carried | 92,240 | 15,245 | 107,485 | 77,486 | 15,267 | 92,753 |
| Freight carried (tons) | 5,621 | 42 | 5,663 | 5,835 | 55 | 5,890 |
Aerial Work Operations—Aerial topdressing as a means of improving bill pastures and checking and preventing soil erosion began operating commercially in 1949. The industry developed rapidly and is now an established feature of the national economy. More than half the fertiliser sown in the country is applied from the air, and in the year ended 31 March 1966, 1,038,297 tons of fertiliser were distributed in this way. Aerial application of insecticides and weedkillers has also been developed. Other aerial work includes photography, seed sowing, and dropping of rabbit and opossum poisons, supplies, and fencing materials. A technical qualification is now mandatory for pilots engaged in the application of all agricultural chemicals except fertilisers. Many agricultural chemicals are highly toxic and the qualification ensures that pilots are familiar with their properties and the correct application techniques.
A summary of aerial work operations for the year ended 31 March 1966 follows.
| Topdressing— | |
| Hours flown | 111,495 |
| Fertiliser distributed (tons) | 1,038,297 |
| Seed sown with fertiliser (tons) | 631 |
| Area treated (acres) | 9,200,331 |
| Seed sowing— | |
| Hours flown | 2,003 |
| Seed sown (tons) | 1,688 |
| Area treated (acres) | 237,051 |
| Rabbit poisoning— | |
| Hours flown | 3,397 |
| Bait distributed (tons) | 5,707 |
| Spraying— | |
| Hours flown | 5,391 |
| Weedkiller and insecticide distributed (gallons) | 2,795,815 |
| Supply dropping— | |
| Hours flown | 911 |
| Materials dropped (tons) | 4,429 |
| Miscellaneous— | |
| Hours flown | 2,810 |
| Materials dropped (tons) | 1,518 |
| Aerial photography and survey— | |
| Hours flown | 1,146 |
| Number of aerial-work operators | 65 |
| Number of aerial-work aircraft owned | 295 |
INTERNATIONAL SERVICES: Air New Zealand—Tasman Empire Airways Ltd. was incorporated in New Zealand on 26 April 1940, following a formal inter-governmental agreement on air traffic rights across the Tasman Sea of 10 April the same year. The company's first operation commenced between Auckland and Sydney on 30 April 1940 with the flying boat Aotearoa.
In June 1950 the company took over the Auckland-Suva service from New Zealand National Airways Corporation. The Wellington-Sydney service was inaugurated on 3 October 1950 and the Christchurch-Melbourne service on 28 June 1951. With the withdrawal of flying boats from the Tasman routes, the Wellington-Sydney service was temporarily discontinued in June 1954 and a new service from Christchurch to Sydney using Douglas DC 6 aircraft was commenced in the following month. The same type of aircraft were also employed on the Auckland-Fiji route as from June 1954. The first Lockheed Electra turboprop aircraft was brought into use on the trans-Tasman service in December 1959, and by March 1960 all TEAL services between Australia, New Zealand, and Fiji were being operated by the company's fleet of three Electras.
The Coral Route to Tahiti via Suva and Aitutaki was inaugurated in December 1951. In October 1952 Apia in Western Samoa was added to the route, and in August 1953 a service to Tonga was inaugurated. This Suva-Tonga service was discontinued in June 1957. TEAL changed from flying boats to land planes on its Coral Route services late in 1960; DC 6s were used initially, but in March 1961 they were replaced by Lockheed Electras. The service was originally direct from Nandi in Fiji to Faa'a Airport at Papeete, Tahiti; an intermediate stop at Pago Pago, Eastern Samoa, was added in September 1961.
Air New Zealand's international operations on the trans-Tasman service include links to and from Auckland and Wellington with Sydney, Melbourne, and Brisbane; and Christchurch to and from Melbourne and Sydney. These services are operated in conjunction with those of QANTAS and BOAC, whose services extend to the Far East and to Europe via Hong Kong, Middle East, and U.S.A. In addition to the trans-Tasman services Air New Zealand provides a weekly air service between Auckland and Norfolk Island, which connects with a QANTAS service to Sydney; and a similar service from Auckland to Noumea (New Caledonia), which in turn connects with the Union de Transports Aeriens (UTA) round the world service operating on the Sydney-Noumea-Nandi-Tahiti route; and also a daily service from Auckland to Fiji.
Jet aircraft came into service in November 1965 when Auckland's new international airport at Mangere was opened for use and new routes were opened through Fiji to Honolulu and Los Angeles in December 1965 and via Australia to Singapore and Hong Kong in March 1966.
Additional services to or through New Zealand include a service from Auckland to Nandi and Samoa with Pan American (PAWA) who operate a twice-weekly extension through Tahiti and Honolulu to the United States and beyond, and Canadian Pacific (CPAL) which operates through Auckland on a fortnightly service via Fiji to Vancouver. Air New Zealand maintains linking services with regional South Pacific operators; Polynesian Airlines Ltd. (PAL) operating between Western Samoa, the Cook Islands, Tonga, and Nandi—and the Fiji Airways Ltd. operating services between Fiji, Gilbert and Ellice Islands, Tarawa, and the New Hebrides.
Total Traffic Statistics for Overseas Airlines—Total traffic figures for overseas airlines operating to and from New Zealand, showing passenger movements, freight and mail separately, are given in the following tables for March years.
| PASSENGER MOVEMENTS | ||||||
|---|---|---|---|---|---|---|
| Routes | Entering New Zealand | Leaving New Zealand | Total | |||
| 1964–65 | 1965–66 | 1964–65 | 1965–66 | 1964–65 | 1965–66 | |
| Trans-Tasman | ||||||
| Auckland-Sydney | 44,959 | 45,008 | 41,109 | 41,749 | 86,068 | 86,757 |
| Auckland-Melbourne | 7,389 | 7,708 | 7,327 | 7,641 | 14,716 | 15,349 |
| Auckland-Brisbane | 3,853 | 5,729 | 3,872 | 6,345 | 7,725 | 12,074 |
| Wellington-Sydney | 24,263 | 25,897 | 22,582 | 23,550 | 46,845 | 49,447 |
| Wellington-Melbourne | 3,515 | 4,682 | 4,135 | 5,826 | 7,650 | 10,508 |
| Wellington-Brisbane | 2,025 | 2,486 | 2,519 | 2,785 | 4,544 | 5,271 |
| Christchurch-Sydney | 15,282 | 20,229 | 15,880 | 20,651 | 31,162 | 40,880 |
| Christchurch-Melbourne | 6,552 | 6,202 | 8,070 | 8,285 | 14,622 | 14,487 |
| Totals | 107,838 | 117,941 | 105,494 | 116,832 | 213,332 | 234,773 |
| Auckland-Nandi | 27,653 | 36,132 | 24,589 | 31,541 | 52,242 | 67,673 |
| Auckland-Norfolk | 2,450 | 3,303 | 2,468 | 3,341 | 4,918 | 6,644 |
| Auckland-Noumea | 2,123 | 2,186 | 2,041 | 2,206 | 4,164 | 4,392 |
| Coral Route | – | – | – | – | 3,257 | 4,553 |
| Grand totals | 140,064 | 159,562 | 134,592 | 153,920 | 277,13 | 318,035 |
| FREIGHT (KILOGRAMS) | ||||||
|---|---|---|---|---|---|---|
| Routes | Entering New Zealand | Leaving New Zealand | Total | |||
| 1964–65 | 1965–66 | 1964–65 | 1965–66 | 1964–65 | 1965–66 | |
| Trans-Tasman | ||||||
| Auckland-Sydney | 402,435 | 607,265 | 279,500 | 343,292 | 681,935 | 950,557 |
| Auckland-Melbourne | 103,206 | 113,359 | 63,672 | 117,964 | 166,878 | 231,323 |
| Auckland-Brisbane | 5,647 | 16,391 | 16,615 | 24,464 | 22,262 | 40,855 |
| Wellington-Sydney | 374,957 | 482,307 | 129,625 | 247,043 | 504,582 | 729,350 |
| Wellington-Melbourne | 19,197 | 64,975 | 40,953 | 42,759 | 60,150 | 107,734 |
| Wellington-Brisbane | 1,775 | 5,815 | 5,186 | 22,583 | 6,961 | 28,398 |
| Christchurch-Sydney | 123,701 | 199,649 | 87,689 | 172,158 | 211,390 | 371,807 |
| Christchurch-Melbourne | 74,820 | 44,864 | 45,851 | 82,331 | 120,671 | 127,195 |
| Totals | 1,105,738 | 1,534,625 | 669,091 | 1,052,594 | 1,774,829 | 2,587,219 |
| Auckland-Nandi | 220,312 | 267,893 | 357,889 | 646,108 | 578,201 | 914,001 |
| Auckland-Norfolk | 8,239 | 13,057 | 45,328 | 36,714 | 53,567 | 49,771 |
| Auckland-Noumea | 3,113 | 3,476 | 37,081 | 28,452 | 40,194 | 31,928 |
| Coral Route | – | – | – | – | 9,521 | 15,376 |
| Grand totals | 1,337,402 | 1,819,051 | 1,109,389 | 1,763,868 | 2,456,312 | 3,598,295 |
N.B.—Excess baggage not included in: PAWA, CPAL.
| MAIL (KILOGRAMS) | ||||||
|---|---|---|---|---|---|---|
| Routes | Entering New Zealand | Leaving New Zealand | Total | |||
| 1964–65 | 1965–66 | 1964–65 | 1965–66 | 1964–65 | 1965–66 | |
| Trans-Tasman | ||||||
| Auckland-Sydney | 306,565 | 330,332 | 113,964 | 122,872 | 420,529 | 453,204 |
| Auckland-Melbourne | 16,393 | 15,837 | 8,235 | 9,765 | 24,628 | 25,602 |
| Auckland-Brisbane | 1,359 | 3,093 | 1,444 | 2,635 | 2,803 | 5,728 |
| Wellington-Sydney | 92,206 | 116,703 | 87,428 | 100,200 | 179,634 | 216,903 |
| Wellington-Melbourne | 3,612 | 6,589 | 3,221 | 4,766 | 6,833 | 11,355 |
| Wellington-Brisbane | 1,894 | 1,345 | – | 89 | 1,894 | 1,434 |
| Christchurch-Sydney | 27,659 | 28,568 | 34,665 | 36,737 | 62,324 | 65,305 |
| Christchurch-Melbourne | 6,298 | 6,489 | 2,121 | 1,941 | 8,419 | 8,430 |
| Totals | 455,986 | 508,956 | 251,078 | 279,005 | 707,064 | 787,961 |
| Auckland-Nandi | 123,765 | 140,246 | 178,510 | 87,999 | 302,275 | 228,245 |
| Auckland-Norfolk | 819 | 1,576 | 691 | 1,001 | 1,510 | 2,577 |
| Auckland-Noumea | 900 | 1,036 | 1,657 | 1,035 | 2,557 | 2,071 |
| Coral Route | – | – | – | – | 7,762 | 9,944 |
| Grand totals | 581,470 | 651,814 | 431,936 | 369,040 | 1,021,168 | 1,030,798 |
AIRPORT STATISTICS—The following table shows airport activities for the two latest years ended 31 March.
| Airport | Aircraft Movements of Passenger Planes | Freighter Plane Movements | Passenger Arrivals and Departures | |||||
|---|---|---|---|---|---|---|---|---|
| International | Domestic | |||||||
| 1964–65 | 1965–66 | 1964–65 | 1965–66 | 1964–65 | 1965–66 | 1964–65 | 1965–66 | |
| Wellington | 1,155 | 1,526 | 27,697 | 32,005 | 15,488 | 16,567 | 603,451 | 688,398 |
| Whenuapai | 3,519 | 2,385 | 14,719 | 11,736 | 1,123 | 807 | 534,716 | 379,677 |
| Mangere | – | 1,482 | – | 6,030 | – | 404 | – | 245,031 |
| Christchurch | 964 | 1,043 | 15,579 | 17,097 | 3,632 | 3,808 | 415,667 | 493,206 |
| Nelson | – | – | 9,491 | 9,893 | 694 | 633 | 114,460 | 132,619 |
| Dunedin | – | 1 | 6,124 | 7,558 | 536 | 671 | 106,098 | 118,995 |
| Woodbourne | 3 | – | 4,379 | 5,043 | 10,947 | 12,982 | 71,197 | 80,654 |
| Palmerston North | 100 | 44 | 6,472 | 6,275 | 271 | 304 | 60,301 | 66,217 |
| Invercargill | 2 | 7 | 5,039 | 5,582 | 145 | 200 | 64,866 | 72,364 |
| Hamilton | – | – | 3,315 | 4,242 | 235 | 345 | 46,617 | 64,433 |
| Napier | – | – | 3,909 | 4,340 | 405 | 446 | 54,080 | 60,414 |
| New Plymouth | – | 1 | 3,861 | 4,273 | 134 | 147 | 44,954 | 58,402 |
| Gisborne | – | – | 3,390 | 3,468 | 422 | 462 | 41,184 | 44,827 |
| Other | 27 | 9 | 26,611 | 22,743 | 854 | 663 | 170,726 | 206,847 |
| Totals | 5,770 | 6,498 | 130,586 | 140,285 | 34,886 | 38,439 | 2,328,317 | 2,712,084 |
AERO CLUBS—Practical interest in aviation was greatly stimulated by the first trans-Tasman, flight of Kingsford-Smith and Ulm in 1928, and to this flight the aero-club movement largely owes its inception. The steady progress made by the movement was in a great measure due to the scheme initiated by the Government of subsidising a limited number of light aeroplane clubs.
On 1 April 1955 a revised scheme of financial assistance to aero clubs was put into operation. This scheme was reviewed in 1957, in 1960 and again in 1961, the subsidy to aero clubs being gradually reduced. In March 1962 the Government ceased granting financial assistance. In the 33 years during which subsidies or other forms of financial assistance were provided, the aero club movement benefited to the extent of some $1,000,000.
The next table gives a summary of the training activities of aero clubs for the latest five years.
| Year Ended 31 March | Clubs Operating | Membership | Aircraft in Use | Hours Flown | Ab Initio Pupils Under Training | ||
|---|---|---|---|---|---|---|---|
| Associate | Flying | Dual | Solo | ||||
| *Includes two special pilot training organisations. | |||||||
| 1962 | 37 | 3,409 | 4,636 | 118 | 18,247 | 44,874 | 1,027 |
| 1963 | 39 | 3,189 | 5,147 | 127 | 17,986 | 39,557 | 1,113 |
| 1964* | 40 | 3,524 | 4,884 | 127 | 18,111 | 39,902 | 1,356 |
| 1965* | 40 | 3,765 | 5,315 | 149 | 23,041 | 46,974 | 1,007 |
| 1966 | 36 | 2,448 | 5,102 | 126 | 23,275 | 48,824 | 1,085 |
LICENCES—A summary of licences and certificates current at 31 March in the four latest years is given below.
| Type of Licence | At 31 March | |||
|---|---|---|---|---|
| 1963 | 1964 | 1965 | 1966 | |
| Flight Crew (ICAO) Type— | ||||
| Pilot licences— | ||||
| Student Pilot | 1,599 | 1,741 | 1,894 | 2,238 |
| Private Pilot | 1,755 | 1,676 | 1,918 | 1,975 |
| Commercial Pilot | 615 | 629 | 666 | 754 |
| Airline Transport Pilot | 206 | 204 | 243 | 267 |
| Pilot Licence Ratings— | ||||
| Instructor | 227 | 234 | 268 | 285 |
| Instrument | 321 | 319 | 369 | 445 |
| Compass | 13 | 17 | 14 | 21 |
| Chemical | 175 | 178 | 180 | 167 |
| Towing | 120 | 148 | 120 | 176 |
| Navigator Licences— | ||||
| Flight Navigator | 49 | 52 | 60 | 70 |
| Licences to Operate Radio Equipment in Aircraft— | ||||
| Flight Radio Operator | 5 | 4 | 3 | 3 |
| Flight Radio Telephone Operator Rating | 1,598 | 1,764 | 2,034 | |
| Flight Engineer Licences— | ||||
| Flight Engineer | 25 | 25 | 33 | 53 |
| Other Licences, Certificates, etc.— | ||||
| Aircraft Maintenance Engineer Licences | 364 | 380 | 403 | 425 |
| Aircraft— | ||||
| Certificates of Registration | 725 | 769 | 851 | 889 |
| Aerodromes— | ||||
| Public Licences | 40 | 44 | 48 | 50 |
| Private | 58 | 43 | 42 | 45 |
| Authorised Places | 2 | 4 | 4 | 6 |
| Government Civil | 28 | 26 | 26 | 23 |
| Air Service Certificates | 48 | 46 | 56 | 56 |
Table of Contents
INTRODUCTORY—Post Office history in New Zealand began in 1831 when the Postmaster-General for New South Wales commissioned a resident of Kororareka in the Bay of Islands to make up and receive mails.
With the arrival of Governor Hobson in 1840 the first post office proper was set up at Kororareka (now Russell). The same year saw the establishment of offices at other settlements in the north and at Port Nicholson (Wellington), and the beginnings of overland mail routes.
By 1958 seventy-three post offices had been opened to provide communications services for the scattered settlers. In that year a Post Office Act was passed making the Post Office an independent Department of State. The Post Office had previously operated under the control of the Customs Department.
The system of communication by telegraph was inaugurated in the 1860s. A separate Department, the Telegraph Department, was created by Act of Parliament in 1865 to take responsibility for the erecting of telegraph lines, the opening of morse telegraph offices, and the laying and maintaining of lines of communication under Cook Strait to connect the telegraph lines of the North and South Islands. This Act vested the control of communication by electric telegraph in the new Department.
During 1881 the first New Zealand telephone exchanges were opened at Christchurch and Auckland. An amendment to the Electric Telegraph Act of 1875 had been passed in September 1880 extending the power of the Government, through the Telegraph Department, to control all electric communications by telephone and making it unlawful for any but the approved authority to establish telephone lines without express permission.
The telegraph and postal services were amalgamated at the beginning of 1881. The Postmaster-General became Minister of Telegraphs, and the Post and Telegraph Department was created to replace the two previous authorities. Under the Post Office Act 1959, which came into operation on 1 January 1960, the name of the Department became the Post Office, and the Minister's title became Postmaster-General.
Through its control of telecommunications, the Post Office plays a vital role in linking New Zealand with the outside world. However, while the establishment of overseas cable services has been responsible for the greatly increased demand in such field as telex and telephones, growth has not been at the expense of the oldest Post Office services, mail and savings, which continue to show steady growth.
POSTAL BUSINESS—At 31 March 1966 there were 1,439 post offices in New Zealand. In addition, there were 112 offices at which telephone business only was transacted. The following table shows the numbers of articles posted in the latest five years.
| Year Ended 31 March | Letters, Lettercards, and Postcards | Accounts, Circulars, Newspapers, Packets, etc. | Parcels | Total Articles Posted |
|---|---|---|---|---|
| million | ||||
| 1962 | 229.1 | 270.1 | 7.9 | 507.2 |
| 1963 | 239.9 | 278.9 | 7.2 | 526.0 |
| 1964 | 257.8 | 268.4 | 7.7 | 533.9 |
| 1965 | 263.1 | 280.0 | 8.3 | 551.4 |
| 1966 | 273.6 | 291.8 | 7.9 | 573.3 |
Compared with the year ended 31 March 1965, letters, lettercards, and postcards posted during the year ended 31 March 1966 showed an increase of 10.5 million (4.0 percent); and parcels, a decrease of 0.4 million (4.5 percent). Postings of accounts, circulars, etc., increased by 11.8 million (4.2 percent) during the year.
The average numbers of letters, etc., posted in New Zealand per head of population during the year ended 31 March 1966 were: letters, lettercards, and postcards, 102.2; accounts, circulars, newspapers, packets, etc., 109.0; parcels, 3.0.
During the 1965–66 year, 956,294 lb of letters and 218,460 parcels were posted by inland air mails, and 404,628 lb of letters, 201,360 lb of newspapers and packets, etc., and 171,816 lb of parcels were posted by overseas air mail.
RURAL MAIL DELIVERY—The rural delivery system enables country residents to obtain postal notes, money orders, and stamps, to register correspondence, and to collect or post their mail in boxes at or near their gates. The deliveries are generally performed by contractors who handle the mail in conjunction with the carriage of goods, and thus the rural-mail delivery is in many areas the medium by which residents obtain their newspapers, bread, parcels, etc. The growth of this scheme can be gauged from the following figures: 1921, 8,700; 1940, 32,382; 1955, 63,859; 1965, 75,591; and in March 1966, 76,055 boxholders.
AIR MAILS: Inland—On 16 March 1936 the first regular air-mail services linking up larger centres of population were established between Palmerston North and Dunedin, and between Nelson, Blenheim, and Wellington. As air services increased in frequency and extent the air-mail facilities were correspondingly expanded. The present net work extends from Kaitaia to Invercargill.
The rate of postage for inland air-mail correspondence is 4c for the first half-ounce and 2c each additional half-ounce.
The number of letters and parcels carried by air in New Zealand is now shown.
| Year Ended 31 March | Letters | Parcels |
|---|---|---|
| 1966 | 21,731,000 | 218,460 |
Overseas: Trans-Tasman Air Services—The first flight of the regular trans-Tasman service linking Auckland and Sydney took place on 30 April 1940, connection being made at Sydney with the Empire service to London. The existing service provides for flights from New Zealand (Auckland, Wellington, and Christchurch) and Australia (Sydney, Melbourne, and Brisbane) with a frequency overall of at least one flight each day.
New Zealand- United Kingdom Air Service—This service is now operating daily via Sydney to London, the transit time New Zealand to the United Kingdom being normally two to three days.
Trans-Pacific Services—The trans-Pacific service operating between New Zealand and North America commenced on 20 July 1940. Air lines now operate a daily service to San Francisco, and there is also a service between Auckland and Vancouver.
Pacific Island Services—Airmails are forwarded by New Zealand operated air services to Norfolk Island, Fiji, New Caledonia, and American Samoa (Pago Pago). Local air services provide connections from Pago Pago to Apia, and from Nandi (Fiji) to Nukualofa (Tonga), Apia (Western Samoa), and the Gilbert and Ellice Islands.
OVERSEAS PARCEL POST—Particulars of overseas parcels received and dispatched in each of the latest five years are contained in the following table.
| Year | Overseas Parcels Received | Overseas Parcels Dispatched | |||
|---|---|---|---|---|---|
| Number | Weight | Customs Duty | Number | Weight | |
| lb | $(000) | lb | |||
| 1962 | 464,628 | 4,181,652 | 1,421 | 192,943 | 1,736,487 |
| 1963 | 510,007 | 4,590,063 | 1,329 | 195,080 | 1,233,920 |
| 1964 | 534,332 | 4,808,988 | 1,531 | 213,597 | 1,384,628 |
| 1965 | 570,162 | 5,131,458 | 1,400 | 238,069 | 1,513,580 |
| 1966 | 555,088 | 4,995,792 | 1,483 | 263,496 | 1,763,674 |
NEWSPAPERS—In March 1966 there were 330 publications on the Post Office Register of Newspapers. Of these 42 are published daily, 12 being morning papers and 30 evening papers. Two appear five times a week, 8 three times a week, 16 twice a week, 68 weekly, 30 fortnightly, 162 monthly, and two at irregular intervals; many of these are magazines rather than newspapers as popularly understood.
MONEY ORDER AND POSTAL NOTE SERVICES—Details of these services are now given.
Money Orders—New Zealand has reciprocal money-order agreements with all British Commonwealth countries and also with the United States of America, the Republic of Ireland, South Africa, and Tonga. Money orders may also be issued in New Zealand for payment in any other country with which the United Kingdom has exchanges of money orders.
For payment within New Zealand the maximum amount for a single order is $200, but there is no limit to the amount which may be remitted. The commission is computed on each individual order.
For money orders issued for payment overseas there is a limit for most countries of $80 for a single order. There are two special rates of commission, one rate applying to Australia (and countries advised through Australia), Fiji, Norfolk Island, and Tonga, and the other rate to all other countries.
During 1965, 2,127,693 money orders were issued in New Zealand for a total of $61,322,524, and of that total 73,429 orders of a value of $585,930 were issued for payment overseas. Money orders issued overseas for payment in New Zealand in 1965 numbered 24,223 with a value of $172,918.
Postal Notes—Postal notes in 23 denominations ranging from 10c to $2 and for $4 are issued in New Zealand for payment within New Zealand, Niue, and the Cook Islands.
Postal notes are negotiable, and their period of validity is unlimited. They are, therefore, a popular medium for making small inland remittances by post, and during the year ended 31 March 1966, 2,579,420 postal notes valued at $3,498,224 were purchased by the public.
British Postal Orders—These are both issued and paid in New Zealand. Denominations sold in this country are 10c, 15c, 20c, 25c, 30c, 50c, $1, $1.50, and $2. Poundage is payable. For all remittances in excess of 50c per day a permit is required.
As these orders are payable in several British Commonwealth countries they are a popular medium for making small postal remittances to overseas countries, particularly the United Kingdom.
During the year ended 31 March 1966 the Post Office sold 2,236,674 British postal orders valued at $1,212,046, and paid 135,532 orders valued at $332,534.
POST OFFICE SAVINGS BANK—Details on the Post Office Savings Bank are given in Section 29, Banking and Currency.
TELEGRAPH AND TELEPHONE SERVICES—Up to 31 March 1966 a total sum of $223,856,638 had been expended on telecommunication construction, including the construction of telephone exchanges. The amount expended during the financial year 1965–66 was $17,414,852.
Details of telegraph and telephone services for each of the last five financial years are now given.
| Year Ended 31 March | Number of Paid Telegrams and Tolls Messages Forwarded During the Year | Revenue | Total Value of Business | |
|---|---|---|---|---|
| Telegraph and Toll | Telephone Exchange | |||
| million | $(000) | $(000) | $(000) | |
| 1962 | 63.6 | 16,750 | 20,773 | 37,523 |
| 1963 | 66.2 | 18,415 | 22,854 | 41,269 |
| 1964 | 68.9 | 19,947 | 25,250 | 45,197 |
| 1965 | 72.5 | 21,973 | 27,546 | 49,519 |
| 1966 | 75.3 | 23,859 | 30,118 | 53,977 |
The number of telegrams forwarded annually is about 8.3 million, while the number of toll communications exceeds 67 million.
A greetings telegram service was introduced on 1 June 1960. During the year ended 31 March 1966, 444,880 greetings telegrams were sent.
The delivery of telegrams, especially in the larger cities, continues to have its problems because of the difficulties in the recruitment of staff for this work. To meet these difficulties the telephoning of telegrams was resorted to some years ago. The system provides also for the phoning in of telegrams for dispatch. Approximately 66 percent of telegrams are now handled by telephone.
Machine-printing telegraphs operating at 45 words per minute were introduced on 5 December 1921. In 1929 a teleprinter circuit, working at a speed of 66 words per minute, commenced operation, and at 31 March 1966 there were 163 offices with teleprinter circuits.
The first voice-frequency telegraph system—of three high-speed channels between Wellington and Christchurch—was installed in 1938. Since then a network embracing all the larger provincial towns has been developed.
A leased teleprinter service for business organisations was begun in 1951. At 31 March 1966 there were 94 organisations leasing 58,238 miles of telegraph circuit. Annual revenue from this source was $699,132.
Until 1950 daily newspapers received their outside news over the public telegraph system but in that year their national organisation leased an extensive teleprinter network so that the news could be transmitted direct from Wellington into the various newspaper offices. Newspapers participating in this arrangement number 36.
TELEPHONE-EXCHANGE SERVICE—At 31 March 1966 there were 569 exchanges in New Zealand serving a total of 1,024,101 telephones. Of these exchanges 249 were manually operated, serving 188,131 telephones, or 18 percent of the total, and 320 were automatic, serving 835,970 telephones, or 82 percent of the total.
The following table indicates the growth of the New Zealand telephone-exchange service (the figures are as at 31 March of each year shown).
| Item | 1958 | 1959 | 1960 | 1961 | 1962 | 1963 | 1964 | 1965 | 1966 |
|---|---|---|---|---|---|---|---|---|---|
* Represents separate instruments connected to main telephone system. † Of these, 582,668 were residential telephones and 121,752 were business telephones. | |||||||||
| Exchanges | 459 | 478 | 493 | 501 | 511 | 529 | 540 | 547 | 569 |
| Subscribers' main stations | 434,804 | 459,869 | 491,773 | 532,560 | 571,917 | 602,285 | 632,986 | 668,393† | 704,420 |
| Service stations | 3,948 | 4,073 | 4,281 | 4,475 | 4,653 | 4,846 | 4,906 | 5,099 | 5,301 |
| Toll stations | 1,531 | 1,507 | 1,490 | 1,467 | 1,481 | 1,451 | 1,439 | 1,410 | 1,418 |
| Public call stations | 2,803 | 2,912 | 3,058 | 3,231 | 3,451 | 3,621 | 3,774 | 3,917 | 4,046 |
| Extension stations | 159,646 | 170,777 | 183,399 | 201,145 | 218,866 | 237,223 | 257,761 | 282,788 | 308,916 |
| Private telephone lines | 2,492 | 2,204 | 2,020 | 1,919 | 1,507 | 1,146 | 1,089 | 989 | 983 |
| Telephone station totals* | 605,224 | 641,342 | 686,021 | 744,797 | 801,875 | 850,572 | 901,955 | 962,596 | 1,025,084 |
| Main stations installed during year | 43,744 | 45,366 | 53,603 | 65,918 | 68,683 | 65,969 | 70,819 | 84,321 | 93,028 |
| Number of waiting applicants | 34,501 | 32,087 | 28,711 | 27,152 | 19,108 | 19,499 | 18,694 | 14,456 | 13,453 |
The total number of telephone stations shows an increase of 419,860, or 69 percent, during the period covered by the table, the net gain for each of the last five years being 57,078, 48,697, 51,383, 60,641, and 62,488 respectively. The increase in Subscribers' main stations during the period covered by the table amounted to 269,616, or approximately 62 percent, while extension stations show an increase of 123,142, or 77 percent.
The “party” line system of telephone service is used mainly by those whose premises are situated at a distance from an exchange. In March 1966 the number of “party” lines was 51,116, serving a total of 158,797 stations.
According to the latest comparative data available (January 1965), compiled by the Chief Statistician of the American Telephone and Telegraph Co., New Zealand ranks third in the number of telephones per 100 of population, the leading countries being the United States of America (45.88), Sweden (44.01), New Zealand (36.52), Canada (36.12), and Switzerland (35.97).
The first public call stations (coin-in-the-slot) telephones were installed at Wellington in August 1910, and 4,046 such instruments were in use throughout New Zealand at 31 March 1966. Of these, 3,598 can be used for making both local and toll calls and sending telegrams, while 448 are used for local calls only.
The capital expenditure on the equipment, etc., of the telephone exchanges up to 31 March 1966 was $193,717,356.
The following table shows the classification of telephone exchanges and the annual rental rates for different classes of connection as from 1 April 1967.
| Class of Exchange | Class of Connection | Annual Rate Within Base-rate Area | |
|---|---|---|---|
| Business | Residential | ||
| $ | $ | ||
| Class I Automatic exchanges with more than 10,000 paying subscribers. | Individual | 86.00 | 44.00 |
| 2-party | 62.00 | 38.00 | |
| (Typical exchanges are Auckland, Christchurch, Dunedin, Hamilton, Invercargill, Palmerston North, and Wellington) | 3-party | 58.00 | 37.00 |
| 4-party | 54.00 | 36.00 | |
| 5-party | 50.00 | 34.00 | |
| 6-10 party | 46.00 | 30.00 | |
| Class II Automatic exchanges with 3,001–10,000 paying Subscribers. | Individual | 80.00 | 44.00 |
| 2-party | 60.00 | 38.00 | |
| (Typical exchanges are Blenheim, Gisborne, Levin, Napier, and Timaru.) | 3-party | 56.00 | 37.00 |
| 4-party | 52.00 | 36.00 | |
| 5-party | 48.00 | 34.00 | |
| 6-10 party | 42.00 | 30.00 | |
| Class III Automatic exchanges with 201–3,000 paying subscribers. | Individual | 72.00 | 42.00 |
| 2-party | 58.00 | 36.00 | |
| (Typical exchanges are Alexandra, Dannevirke, Marton, Westport.) | 3-party | 54.00 | 35.00 |
| 4-party | 50.00 | 24.00 | |
| Manual exchanges with over 3,000 paying subscribers. | 5-party | 46.00 | 32.00 |
| (Typical exchanges are Feilding, Henderson, Rotorua.) | 6–10 party | 28.00 | 20.50 |
| Class IV Other exchanges affording continuous service. | Individual | 66.00 | 40.00 |
| (Typical exchanges are Hokitika, Paekakariki, Picton, and Queenstown.) | 2-party | 56.00 | 34.00 |
| 3-party | 52.00 | 33.00 | |
| 4-party | 48.00 | 32.00 | |
| 5-party | 44.00 | 30.00 | |
| 6-10 party | 38.00 | 27.00 | |
| Class V Exchanges observing restricted hours of service. | Individual | 56.00 | 33.00 |
| (Typical exchanges are Kawhia, Kumara, Mangaweka, and Tikitiki.) | 2-party | 44.00 | 29.00 |
| 3-party | 42.00 | 28.00 | |
| 4-party | 41.00 | 26.50 | |
| 5-party | 37.00 | 25.00 | |
| 6-10 party | 36.00 | 24.00 | |
For stations located outside the boundary of the base-rate area of an exchange a milage rate is added to the general base-rate-area rental, depending on the distance by line measurement from the base-rate boundary to the respective subscriber's station.
TOLL SERVICE—At first, toll communication between towns was made over lines not in use for telegraph purposes. In 1900, construction of exclusive telephone circuits commenced, the first circuits of any length being provided between Dunedin-Invercargill, Auckland-Hamilton, and Wellington-Masterton. The North and South Islands were first linked by a telegraph cable in 1866 and later by a telephone cable in 1926. A broadband toll link, comprising microwave radio and coaxial cable systems, now connects main centres from Whangarei to Dunedin.
Calls handled by toll operators are increasing at 3 million annually and extensions to the existing toll circuit network are being made by the provision of additional broadband systems.
Toll rates for distances up to 30 miles range from 5c to 12c for each three minutes. They are the same day and night. For distances over 30 miles, the rates range from 18c to a maximum of 80c for three minutes' conversation. These rates are increased by approximately one-third of the relative initial rate for each minute exceeding three. Between 6 p.m. and 8 a.m. on weekdays, and between midnight and 6 a.m. on Sundays and departmental holidays, the rates for calls over 60 miles are reduced and vary from 25c to 65c for three minutes' conversation, with a proportionate increase for each additional minute. Urgent calls are charged at double the rate for an ordinary call.
In addition to station-to-station calls other types of calls accepted are person-to-person, transferred charge, collect, fixed time, and contract. Credit-cards are available at a cost of $1 each. These entitle the holder to have the charges for toll calls and telegrams debited to a telephone at a distant exchange.
TELEX SERVICE: Telex—the international abbreviation for Teleprinter Exchange Service—is a customer-to-customer service using page teleprinters. An international telex service for communicating with overseas subscribers only commenced in New Zealand on 31 August 1960 with 16 subscribers. Service was then available with 23 countries overseas.
Automatic telex service was introduced in New Zealand on 13 May 1964 with 150 subscribers. This service absorbed the previous international connections and all New Zealand telex subscribers may now communicate with each other as well as with overseas telex subscribers. International service is now available with 76 countries. At 31 March 1966 there were 441 subscribers.
The annual rental is $320 for a standard machine and $430 for a teleprinter equipped with a tape reperforator and transmitter. In the year to 31 March 1966 rentals totalled $147,454 and time used. International calls are charged for a minimum of 3 minutes. The rate varies according to the country called. In the year to 31 March 1966 rentals totalled $147,454 and call revenue was $264,888 (internal $146,472 and international $118,416).
OVERSEAS CABLE SERVICES—Telegraphic communication overseas was first established between New Zealand and Australia by means of the Eastern Extension Telegraph Company's cable from Wakapuaka (Nelson) to Sydney in 1876, this cable being duplicated in 1890. Subsequent developments were the opening in 1902 of the Pacific cable between Auckland and Canada via Norfolk Island, Suva, and Fanning Island, with a connection linking Norfolk Island to Brisbane; the laying of a cable direct between Auckland and Sydney in 1912; shifting of terminals from Wakapuaka to Wellington in 1917; laying a cable direct between Auckland and Suva in 1923, and duplicating the Suva-Canada cable in 1927. In 1929 a merger of British cable and wireless companies resulted in the overseas cable services being brought under the control of one authority (the private company of Cable and Wireless Ltd., with headquarters in London), following which one cable between Wellington and Sydney was abandoned, part of it being lifted for reuse, and the route of the other was altered to terminate at Auckland instead of Wellington. Following a conference of representatives of Commonwealth Governments (including New Zealand) held in London in 1945, the Commonwealth's external telecommunications systems were brought under Government control and, in accordance with the Commonwealth Telegraphs Agreement 1948, the New Zealand Post Office purchased the assets of Cable and Wireless Ltd. in New Zealand, and took over the operation of the overseas cable services.
In July 1962 a new submarine cable with a capacity of 80 telephone channels was brought into operation between New Zealand and Australia as part of a Commonwealth round-the-world cable project. The cable was extended from New Zealand to Fiji in December 1962, and in December 1963 was further extended, via Hawaii, to Vancouver and across Canada by microwave to Montreal. At Montreal it links up with the trans-Atlantic telephone cables, to connect with Britain, and provide high quality circuits for telephone, telegraph, and telex communication between New Zealand, Australia, Fiji, Canada, the United States of America, and Britain. This cable system links New Zealand with most of the world's major countries, and it will be supplemented by the bringing into service in April 1967 of the South-East Asia Commonwealth Cable which will extend the system from Australia to New Guinea, and (via Guam) to Malaysia, Hong Kong, and Singapore.
International Telephone Service—Telephone communication by cable and radio is now available to 141 countries, as well as to Ross Dependency (Scott Base), Raoul Island, Chatham Islands, Campbell Island, passenger ships, and H.M. New Zealand and Australian warships.
RADIO COMMUNICATION: Government Stations—The first wireless-telegraph station in New Zealand for communicating with ships at sea was opened at Wellington on 26 July 1911.
An event of major importance in the development of New Zealand's external telecommunication services was the opening of the Himatangi radio transmitting station in November 1953 thus providing for direct New Zealand - United Kingdom radiotelephone and radiotelegraph circuits, The receiving station complementary to the Himatangi transmitting station is Makara Radio.
The principal stations under the control of the New Zealand Government are at Awarua, Wellington, and Auckland on the New Zealand mainland, at Rarotonga in the Cook Islands, at Niue, and at the Chatham Islands. Smaller stations are established at certain lighthouses on the New Zealand coast and also on a number of adjacent islands. Marine radio beacons are operated at the lighthouses at Cape Reinga, Cuvier Island, Moko Hinau Island, East Cape, Portland Island, Stephens Island, Baring Head, Cape Campbell, The Brothers, Godley Head, Taiaroa Head, Dog Island, and Puysegur Point.
Communication is effected with outer islands in the Cook Group by Rarotonga Radio through small feeder stations. Small stations in the Tokelau Islands communicate with Apia Radio. Niue communicates with Apia Radio, Rarotonga Radio, and Wellington Radio.
By means of the radio stations at Wellington, Apia, Rarotonga, and Niue, communication is maintained between New Zealand and the Pacific islands, the last three stations mentioned having direct communication with New Zealand. Direct communication is also available with Chatham Islands, Nukualofa (Tonga), Noumea (New Caledonia), and Sydney.
Facilities exist for the dispatch of radiotelegrams to vessels at sea, and special rates operate for vessels registered in New Zealand and Australia.
The use of mobile radiotelephone services continues to grow. Post Office very-high-frequency service available from 48 base stations meets the mobile communication requirements of 2,054 subscribers operating 13,056 mobile units. A miscellany of private and Government owner-operated stations provide mobile radiotelephone service through 1,669 base stations for a further 5.277 mobile units. Radiotelephone services continue to provide essential service for isolated communities which cannot reasonably be reached by landline—e.g., isolated settlers, alpine huts, etc. There is also a free radio-medical service for ships at sea and for lighthouses on the New Zealand coast for use in emergency cases.
Private Stations—Private radio stations are governed by the New Zealand Radio Regulations 1953.
Ordinary radio-receiving licences and television-receiving licences authorise reception from broadcasting stations, and may be obtained at any Post Office Savings Bank on payment of the prescribed fee. Further reference to these licences will be found in Section 12B, Radio and Television Broadcasting.
Licences for amateur stations are intended to provide facilities for experimental transmission to those interested in radio science, and are issued only to holders of amateur operators' certificates.
RECEIPTS AND PAYMENTS—The receipts and payments of the Post Office for the latest two financial years are now shown.
* Net figure—i.e., receipts less payments. | ||
|---|---|---|
| Receipts | 1964–65 | 1965–66 |
| $(000) | $(000) | |
| Postages | 18,272 | 21,033 |
| Money-order and postal-note commission | 241 | 258 |
| Private box and bag rents and rural-delivery fees | 426 | 396 |
| Miscellaneous receipts | 9,944 | 10,157 |
| Telegrams | 2,275 | 2,351 |
| Tolls | 19,698 | 21,507 |
| Telephone-exchange rentals | 27,546 | 30,118 |
| Overseas telecommunications | 1,763* | 1,971* |
| Totals | 80,165 | 87,791 |
| Payments | 1964–65 | 1965–66 |
| $(000) | $(000) | |
| Salaries, wages, and allowances | 43,108 | 47,817 |
| Overtime | 6,439 | 7,456 |
| Conveyance of mails— | ||
| Overseas | 1,927 | 2,050 |
| Inland | 3,210 | 3,331 |
| Maintenance and renewal of telecommunications system | 2,139 | 2,093 |
| Motor services, workshops, tools and plant | 3,362 | 3,511 |
| Post Office buildings | 2,086 | 3,052 |
| Miscellaneous | 5,729 | 6,550 |
| Interest on capital liability | 8,773 | 9,275 |
| Sick-benefit Fund | 129 | 135 |
| Government Superannuation Fund subsidy | 1,163 | 1,437 |
| 78,065 | 86,707 | |
| Less transfers to vote—Telecommunications Development | 4,527 | 4,522 |
| Totals | 73,538 | 82,185 |
Receipts and payments for the latest 11 years are shown by the following figures.
| Year Ended 31 March | Receipts $(000) | Payments $(000) |
|---|---|---|
| 1956 | 38,142 | 34,457 |
| 1957 | 41,091 | 38,507 |
| 1958 | 45,482 | 42,844 |
| 1959 | 46,740 | 43,327 |
| 1960 | 50,443 | 46,940 |
| 1961 | 54,326 | 51,296 |
| 1962 | 60,742 | 55,297 |
| 1963 | 65,764 | 61,565 |
| 1964 | 71,803 | 65,199 |
| 1965 | 80,166 | 73,538 |
| 1966 | 87,791 | 82,185 |
WORK PERFORMED FOR OTHER DEPARTMENTS—Because it has numerous small offices readily accessible to the public, the Post Office also undertakes agency work for other Government Departments. Among the principal activities in this connection are the receipt and payment of moneys on behalf of the various Departments, the more important of which are enumerated below.
Receipts—For the following Departments: Agriculture (inspection fees, etc.), Education (child welfare receipts and examination fees, etc.), Health, Inland Revenue (land tax and income tax, including social security income tax under PAYE system), Lands and Survey, National Roads Board (special milage tax on motor vehicles), Public Trust Office, State Advances Corporation (State rents, loan and interest repayments), Electricity (some electric-power receipts), Transport, Tourist and Publicity, Valuation, Customs (collection of Customs duty and sales tax), Treasury (Government Superannuation and National Provident Fund receipts).
Payments—Department of Social Security (social security benefits and war pensions, etc.), Health (refunds of medical expenses), Defence, Education (boarding-out orders), Labour (subsidised wage payments and military training medical examination payments), Maori Affairs (Maori trust payments), Public Trust Office, Police (witness warrants), Treasury (Government Superannuation payments and miscellaneous payments for other Departments), Ministry of Works, and for Reserve Bank (interest warrants and coupons).
Other services performed by the Post Office are the issue of licences in respect of motor vehicles and radio apparatus, and assistance to the Marine Department and the Department of Civil Aviation on radio matters. In some of the smaller centres postmasters act as Registrars of Births, Deaths, and Marriages, also as Registrars of Electors.
Other activities, not strictly departmental, include the receipt of motor vehicles insurance (third-party risks) premiums under the Transport Act 1962, the issue of fishing and game licences on behalf of acclimatisation societies, organising and selling health stamps, and collecting revenue for such outside bodies as the New Zealand Poultry Board, the New Zealand Trade Certification Board, the Armed Forces Canteen Council, and the New Zealand Broadcasting Corporation.
STAFF—The large volume and varied nature of the business of the Post Office entails the employment of a large staff. The Department is administered by the Postmaster-General, with the Director-General as executive head. The staff at 31 March 1966 was as follows: Permanent, 24,763, temporary, 2,904 (a number of whom work part-time), non-classified, 483, total, 28,147. In addition, there were 680 country postmasters and telephonists who acted as such in conjunction with other pursuits. There were also 22 officers of the Railways Department who acted as postmasters.
VEHICLES—The Post Office fleet as at 31 March 1966 consisted of 3,298 vehicles—1,444 trucks, 900 vans, 944 cars, and 10 motor scooters. Of this fleet, 442 vehicles are used for hire to other Departments, 2,172 for engineering construction work, and 684 on postal, telegram delivery, and other general work. The fleet travelled 28 million miles in the year ended 31 March 1966.
GENERAL: Radio-broadcasting Company—The initial development of broadcasting on a Dominion-wide basis was confirmed by the agreement of the Radio-broadcasting Company of New Zealand on 1 August 1925 to establish and maintain an efficient broadcasting service. The company purchased existing stations in the four main centres and began operation of its new stations at Auckland and Christchurch in August-September 1926. Stations at Wellington and Dunedin followed soon after. By the end of 1931 the number of receiving licences in the country had risen to about 70,000.
New Zealand Broadcasting Board—With the expiry of the Radio-broadcasting Company's contract in January 1932, control of the broadcasting service, under the Broadcasting Act 1931, was vested in the New Zealand Broadcasting Board. Existing plant was purchased from the company.
New Zealand Broadcasting Service—The Broadcasting Act 1936 abolished the New Zealand Broadcasting Board and vested control of the newly constituted National Broadcasting Service in a Minister of the Crown. Administration of the service was placed in the hands of a Director of Broadcasting, appointed by the Governor-General in Council. Permanent officers previously employed by the board became officers of the Public Service from 1 July 1936.
By the 1936 Act the Minister of Broadcasting was empowered also to establish and operate commercial radio stations broadcasting advertising matter. The Broadcasting Amendment Act 1937 provided for the establishment of a National Commercial Broadcasting Service which existed separately until it was abolished under section 4 of the Statutes Amendment Act 1943. On 26 August 1943 the two services were combined under the Director of Broadcasting.
The Broadcasting Amendment Act 1960 provided for the establishment of a television service to be operated by the Minister in Charge of Broadcasting in association with the existing broadcasting service.
NEW ZEALAND BROADCASTING CORPORATION—The Broadcasting Corporation Act 1961 repealed all previous legislation and established a Corporation of three members empowered from 1 April 1962 to take over and operate the existing service. Apart from this the Act provides that the Corporation may, after considering the services already available in any locality, call for applications and make recommendations to the Minister of Broadcasting on the granting of warrants for the establishment and operation of private broadcasting and television stations. The Corporation exercises a continuing function of supervising and controlling programmes broadcast by any stations so licensed. The Broadcasting Corporation Amendment Act 1965 increased the membership of the Corporation from three to seven, and extended the powers of the Corporation to permit assistance to performing art and cultural organisations.
RADIO—There are in New Zealand 47 medium-wave broadcasting stations and two shortwave transmitters of Radio New Zealand, the latter having 19 assigned frequencies. One of the medium-wave stations (4XD) is privately owned and operates with the assistance of a subsidy from the Broadcasting Account. Of those remaining, 28 stations—shown with an asterisk in the following list—broadcast advertising material. No advertising is broadcast on Sundays or on Christmas Day, Good Friday, or Anzac Day. Stations 2YA, 1YA, 3YA, 4YA, and 4YX maintain a daily 24–hour service apart from a shutdown once a week between the hours of 11.20 p.m. Sunday and 5 a.m. Monday in the case of 2YA, and 6 a.m. in the case of the other four stations.
A complete list of medium-wave stations follows.
| MEDIUM-WAVE STATIONS | ||||
|---|---|---|---|---|
| Call Sign and Locality | Radiated Power | Frequency | Normal Hours of Transmission per Week | |
* Broadcasts advertising material. † Operates when 2YA broadcasts the proceedings of the House of Representatives. | ||||
| kilowatts | kilocycles | hr | min | |
| 1XA, Kaitaia* | 2.00 | 1,440 | 116 | 30 |
| 1XE, Kaikohe* | 2.00 | 1,220 | 116 | 30 |
| 1XN, Whangarei* | 2.00 | 970 | 116 | 30 |
| 1YX, Whangarei | 2.00 | 830 | 121 | 20 |
| 1YA, Auckland | 20.00 | 760 | 161 | 20 |
| 1YC, Auckland | 10.00 | 880 | 42 | 0 |
| 1ZB, Auckland* | 10.00 | 1,070 | 132 | 0 |
| 1YD, Auckland* | 2.00 | 1,250 | 83 | 0 |
| 1ZD, Tauranga* | 10.00 | 1,000 | 113 | 30 |
| 1XH, Hamilton* | 2.00 | 1,310 | 129 | 30 |
| 1YW, Hamilton | 2.00 | 1,140 | 121 | 20 |
| 1YZ, Rotorua | 10.00 | 860 | 121 | 20 |
| 1ZC, Rotorua* | 2.00 | 1,350 | 113 | 30 |
| 1ZO, Tokoroa* | 2.00 | 1,420 | 121 | 20 |
| 1ZU, Taumarunui* | 1.00 | 1,520 | 121 | 20 |
| 1ZA, Taupo* | 2.00 | 1,500 | 80 | 45 |
| 2ZG, Gisborne* | 2.00 | 1,060 | 116 | 30 |
| 2YW, Gisborne | 2.00 | 1,180 | 121 | 20 |
| 2XP, New Plymouth* | 2.00 | 1,370 | 116 | 30 |
| 2ZH, Hawera* | 1.00 | 1,560 | 116 | 30 |
| 2YZ, Napier | 20.00 | 630 | 121 | 20 |
| 2ZC, Napier* | 2.00 | 1,280 | 123 | 30 |
| 2XA, Wanganui* | 2.00 | 1,200 | 116 | 30 |
| 2ZA, Palmerston North* | 2.00 | 940 | 123 | 30 |
| 2XB, Masterton* | 2.00 | 840 | 113 | 30 |
| 2YA, Wellington | 100.00 | 570 | 162 | 20 |
| 2YC, Wellington | 60.00 | 660 | 42 | 0 |
| 2YB, Wellington | 20.00 | 800 | † | |
| 2ZB, Wellington* | 20.00 | 980 | 126 | 0 |
| 2YD, Wellington* | 2.00 | 1,130 | 83 | 0 |
| 2ZE, Blenheim* | 1.00 | 1,540 | 29 | 30 |
| 2XN, Nelson* | 2.00 | 1,340 | 116 | 30 |
| 3YW, Westport | 2.00 | 1,460 | 121 | 20 |
| 3YZ, Greymouth | 10.00 | 920 | 121 | 20 |
| 3ZA, Greymouth* | 2.00 | 750 | 31 | 0 |
| 3YA, Christchurch | 20.00 | 690 | 161 | 20 |
| 3YC, Christchurch | 10.00 | 960 | 42 | 0 |
| 3ZB, Christchurch* | 10.00 | 1,100 | 126 | 0 |
| 3YD, Christchurch* | 2.00 | 1,400 | 83 | 0 |
| 3XC, Timaru* | 2.00 | 1,160 | 116 | 30 |
| 4YX, Alexandra | 2.00 | 640 | 161 | 20 |
| 4YA, Dunedin | 20.00 | 780 | 161 | 20 |
| 4YC, Dunedin | 10.00 | 900 | 42 | 0 |
| 4ZB, Dunedin* | 10.00 | 1,040 | 126 | 0 |
| 4XD, Dunedin | 0.25 | 1,430 | 15 | 0 |
| 4YZ, Invercargill | 20.00 | 720 | 121 | 20 |
| 4ZA, Invercargill* | 10.00 | 820 | 123 | 30 |
Of the two short-wave transmitters employed by Radio New Zealand, each has a power of 7.50 kilowatts, and frequencies used are in the 6, 9, 11, and 15 megacycle bands. Frequencies are adjusted throughout the day as well as seasonally to give best reception in the target areas, 15.28, and 11.78 megacycles being commonly used for daily transmissions of the home service programme, and the additional one of 6.08 megacycles being employed for transmissions to Australia and Antarctica. Broadcasting hours amount to approximately 15 1/2 hours daily to the Pacific islands and 12 1/2 hours daily to Australia.
Coverage of Medium-wave Service—The basic function of medium-wave stations in the programme coverage of New Zealand is as follows:
Stations 1YA, 2YA, 3YA, 4YA, 1YX, 1YZ, 2YZ, 3YZ, 4YZ, 1YW, 2YW, 3YW, and 4YX broadcast the national (non-advertising) programme to listeners throughout the country.
Stations 1YC, 2YC, 3YC, 4YC, provide alternative non-advertising programmes to those of the national programme stations in (a) but with slightly less extensive coverage.
Stations 1ZB, 2ZB, 3ZB, 4ZB, 1XA, 1XE, 1XN, 1XH, 2ZC, 1ZA, 1ZO, 1ZU, 2ZA, 2ZE, 2ZG, 3ZA, 4ZA, 1YD, 2YD, 3YD, 1ZD, 1ZC, and 2XB present advertising programmes mainly of a light character, coverage being comparable with stations listed in (a).
Stations 2XP, 2XA, 2XN, 2ZH, and 3XC serve the immediate locality of the centres in which they operate and present advertising and non-advertising programmes during specified hours. Within their coverage range these stations give alternative programmes to those provided by stations listed in (a), (b), and (c).
Stations 1XA, 1XE, 1YX, 2ZH, 3YW, and 4YX are satellite stations rebroadcasting for local reception the programmes of more distant stations with which they are linked.
Coverage of Short-wave Service—Radio New Zealand broadcasts to the Pacific islands a daily home-service programme from 5 a.m. to 5.45 p.m. on one frequency and a special evening programme from 6 p.m. to 8.45 p.m. on two frequencies. Its transmission to Australia comprises a daily home-service programme from 8 a.m. to 5.45 p.m. on one frequency and a special evening programme from 9 p.m. to 11.45 p.m. on two frequencies. In addition to its large radio audience throughout the Pacific, Radio New Zealand has listeners as far distant as the United Kingdom, Sweden, France, the United States, and Japan. Radio New Zealand programmes illustrate many different aspects of life in this country.
National Programmes—Programmes from national non-commercial stations include, as well as all types of music, plays, short stories, serials, sports commentaries and results, talks, documentaries, women's programmes, children's educational and entertainment programmes, news, and devotional programmes.
All proceedings of the House of Representatives are broadcast from Station 2YA. During broadcasts of Parliament the scheduled programmes of Station 2YA are broadcast by Station 2YC, and those of Station 2YC transmitted by Station 2YB.
Time signals from the New Zealand Time Service are broadcast every day from Station 2YA or 2YC. The signals take the form of a series of six “dots” at intervals of one second, the last “dot” denoting the exact minute. Fuller details of this time service may be obtained from the article published in Section 40 (Miscellaneous) of this Yearbook.
Commercial Programmes—Commercial stations broadcast music, serials, variety and quiz programmes, sports commentaries and results, children's and women's programmes, news and other spoken programmes.
A brief historical outline of the commercial stations is given in the 1961 and earlier issues of the Yearbook.
TELEVISION—The relatively high cost of establishing television in New Zealand was the main reason for the delay in providing this service. Few countries of such a small population are so isolated and beyond the reach of the stimuli and assistance which arise from telecasts in a neighbouring country, with opportunities for sharing programmes, relays, and so on. In addition, the hilly terrain in most parts of the country presents difficulties in the attainment of a comprehensive coverage.
However, in August 1958 the Postmaster-General and the Minister of Broadcasting jointly announced that, on a recommendation of the Inter-departmental Committee on Television (established in 1949) and with the advice of the New Zealand Radio and Television Manufacturers Federation, it had been decided to establish the 625 line system as the standard for any television service in New Zealand.
In October 1958 approval was given to purchase equipment to enable technical investigations to be made on such matters as the likely coverage of TV transmitters, the determination of suitable transmitter sites, the provision of a TV coverage plan, and the relative suitability of different operating frequencies. Channel 2 Auckland, which was originally opened in 1959 as an experimental television station, began its regular programme service on 1 June 1960 with a weekly two-hour transmission. By November 1960 the hours of telecasting had increased to two and a half each evening, Monday to Friday. On 1 January 1961 telecasting on seven nights a week began.
Television stations commenced transmissions in Christchurch on 1 June 1961, Wellington on 1 July 1961, and in Dunedin on 31 July 1962.
Television Programmes—Film purchased overseas makes up a substantial portion of TV programmes. Nevertheless all stations are active in the exploitation of New Zealand news and talent as much as possible. An analysis of TV programmes for a week in August 1964 showed that of the total hours then telecast 22 percent were devoted to news, talks, and information programmes (including religion), 8 percent to variety, 19 percent to drama, 16 percent to comedy, 9 percent to adventure and westerns, 12 percent to mystery and crime, 9 percent to children's programmes, and 5 percent to sports. The pattern of programme interest has been markedly affected by four mobile outside telecast units which have been in use since the beginning of 1963.
Extensions to coverage—The Corporation is currently surveying for transmitter sites to extend TV coverage to all areas of New Zealand. Ten of these transmitters are so far in service, relaying the programmes of the four metropolitan stations.
As a temporary measure, the Corporation has laid down a policy whereby it will license low-power translators to serve fringe-area localities until permanent high-power regional transmitters are operating. The arrangement is that the Corporation takes out the transmitting licence and comes to an agreement with a non-profit society of local interested persons to provide the translator equipment and to maintain it.
By August 1966, 67 percent of homes in New Zealand were equipped with television sets. By the end of 1970 it is likely that over 80 percent of homes will have television sets. Latest comparable figures for other countries are: United States, 93 percent; Canada, 92 percent; Britain, 83 percent; Australia, 64 percent.
Details of television broadcasting stations in operation at the four main centres are as follows.
| TELEVISION STATIONS | ||||||
|---|---|---|---|---|---|---|
| Call Sign and Location of Studio | Radiated Power | Frequency | Normal Hours of Transmission per Week | |||
| Vision | Sound | Vision | Sound | |||
| kilowatts | megacycles | hr | min | |||
| AK TV-2, Auckland | 100.0 | 20.0 | 55.25 | 60.75 | 65 | 0 |
| WN TV-1, Wellington | 100.0 | 20.0 | 45.25 | 50.75 | 65 | 0 |
| CH TV-3, Christchurch | 100.0 | 20.0 | 62.25 | 67.75 | 65 | 0 |
| DN TV-2, Dunedin | 10.0 | 2.0 | 55.25 | 60.75 | 65 | 0 |
The hours of telecasting are from 2 p.m. to 11 p.m. from Monday to Thursday and on Sunday, from 2 p.m. to midnight on Friday and Saturday. Advertising material is included on Tuesday, Wednesday, and Thursday from 2 p.m. till 11 p.m.; and on Saturday from 2 p.m. till midnight.
ORCHESTRAS: NZBC Symphony Orchestra—Formed in 1946 as the National Orchestra, this is a full symphony orchestra widely known for the high standard of its public concerts as well as its performances over the air. Distinguished conductors and soloists from other countries and New Zealand choral groups appear regularly with the Orchestra, and free concerts for school children are an established part of its tour programme. During 1966 the NZBC Symphony Orchestra was in process of being enlarged to a playing strength of approximately 105 players to enable the undertaking of the complete symphonic repertoire. Also in 1966 a Little Symphony Orchestra of 30–35 members, drawn from the ranks of the full Orchestra, was established to provide orchestral music for the smaller communities outside the touring schedule of the Symphony Orchestra, and to present programmes from the repertoire specially written for chamber orchestras. In addition the New Zealand Broadcasting Corporation, in the 1965–66 financial year, paid to the Queen Elizabeth the Second Arts Council of New Zealand the sum of $24,600, which was intended to aid the establishment of regional orchestras and the development of music throughout the country.
NEW ZEALAND LISTENER—Programmes and advance information for all radio and television stations are published in the weekly journal, the New Zealand Listener, first issued on 30 June 1939. The Listener also publishes interviews, talks and discussions, fiction, poetry and criticism. It gives much attention to the arts and to the broader aspects of life in New Zealand.
FINANCIAL STATISTICS—The following tables show the financial results of the principal activities of the New Zealand Broadcasting Corporation.
| Item | 1962–63 | 1963–64 | 1964–65 | 1965–66 |
|---|---|---|---|---|
* Includes television ($91,124 in 1962–63, $189,696 in 1963–64, $257,374 in 1964–65, $422,940 in 1965–66). NOTE—Minus sign (-) indicates an excess of expenditure over revenue. | ||||
| Non-commercial Activities | ||||
| National radio— | $ (thousand) | |||
| Expenditure on programmes | 431 | 462 | 552 | 612 |
| General administrative and running expenses | 1,292 | 1,273 | 1,396 | 1,351 |
| Post Office charges for licence fee collection | 140 | 174 | 202 | 329 |
| Depreciation | 370 | 500 | 669 | 908 |
| 2,233 | 2,409 | 2,819 | 3,200 | |
| Less recovery from commercial radio for provision of technical facilities and services | 235* | 359* | 487* | 706* |
| Net expenditure | 1,998 | 2,050 | 2,332 | 2,494 |
| Revenue | 1,917 | 1,845 | 1,980 | 1,951 |
| Balance of revenue over expenditure | -81 | -205 | -352 | -543 |
| National television— | $ (thousand) | |||
| Expenditure on programmes | 262 | 303 | 435 | 580 |
| General administrative and running expenses | 538 | 719 | 1,023 | 1,450 |
| Post Office charges for licence fee collection | 21 | 41 | 93 | 219 |
| Provision of technical facilities and services | 46 | 95 | 129 | 211 |
| Net expenditure | 867 | 1,158 | 1,680 | 2,460 |
| Revenue | 1,051 | 2,198 | 4,087 | 5,580 |
| Balance of revenue over expenditure | 184 | 1,040 | 2,407 | 3,120 |
| Total surplus non-commercial activities | 103 | 835 | 2,055 | 2,577 |
| Commercial Activities | ||||
| Commercial radio— | ||||
| Expenditure on programmes | 405 | 528 | 569 | 685 |
| General administrative and running expenses | 2,745 | 2,837 | 3,123 | 3,481 |
| Provision of technical facilities and services | 144 | 169 | 230 | 283 |
| Net expenditure | 3,294 | 3,534 | 3,922 | 4,449 |
| Revenue | 4,279 | 4,301 | 4,205 | 4,448 |
| Net surplus before tax or deficit | 985 | 767 | 283 | -1 |
| Commercial television— | ||||
| Expenditure on programmes | 263 | 381 | 495 | 686 |
| General administrative and running expenses | 771 | 1,152 | 1,814 | 2,450 |
| Provision of technical facilities and services | 45 | 95 | 128 | 211 |
| Net expenditure | 1,079 | 1,628 | 2,437 | 3,347 |
| Revenue | 1,043 | 1,898 | 3,595 | 4,335 |
| Net surplus before tax or deficit | -36 | 270 | 1,158 | 988 |
| New Zealand Listener— | ||||
| Printing, publishing, and distribution costs | 216 | 244 | 303 | 333 |
| General administrative and running expenses | 105 | 112 | 127 | 151 |
| Net expenditure | 321 | 356 | 430 | 484 |
| Revenue | 288 | 325 | 392 | 442 |
| Net surplus before tax | -33 | -31 | -38 | -42 |
| Total net surplus before tax | 916 | 1,006 | 1,403 | 945 |
| Provision for taxation | 457 | 502 | 386 | 324 |
| Net surplus after tax | 459 | 504 | 1,017 | 621 |
| Orchestra and concert activities— | ||||
| Net expenditure | 454 | 528 | 593 | 621 |
| Less concert proceeds | 121 | 139 | 142 | 143 |
| Balance of expenditure | 333 | 389 | 451 | 478 |
| Summary | ||||
| Non-commercial activities surplus | 103 | 835 | 2,055 | 2,577 |
| Commercial activities surplus | 459 | 504 | 1,017 | 621 |
| Less concert activities | 562 333 | 1,339 389 | 3,072 451 | 3,198 478 |
| Net surplus | 229 | 950 | 2,621 | 2,720 |
In the table for national radio the amount recovered from commercial activities on account of provision of technical services provides for Head Office engineering overhead and services, allowance for depreciation on assets in use commercially, and share of the costs of interference suppression and frequency measurement. From 1962–63 this charge relates only to use of assets.
There are two principal sources of revenue, radio and television-licence fees and radio and television advertising. While licence fee revenue is credited to the accounts of the noncommercial stations and sales revenue to those of the commercial stations, a common fund is in fact operated, all revenue being available for the general purpose of broadcasting. Up till 1962–63, the commercial surplus was subject to taxation without set-off from any deficit arising from the non-commercial activities. However, since the 1963–64 financial year, 75 percent of the net cost of the Symphony Orchestra and concert presentation has been allowed as a deduction before the assessment of income tax.
Revenue from licence fees and from advertising for the latest four financial years is shown in the following table.
| Item | 1962–63 | 1963–64 | 1964–65 | 1965–66 |
|---|---|---|---|---|
| $(thousand) | ||||
| Radio-licence fees | 1,826 | 1,814 | 1,980 | 1,951 |
| TV-licence fees | 1,046 | 2,179 | 4,087 | 5,580 |
| Radio advertising | 4,053 | 4,107 | 4,205 | 4,448 |
| TV advertising | 1,027 | 1,868 | 3,595 | 4,335 |
| Totals | 7,952 | 9,967 | 13,867 | 16,314 |
LICENCES—The licence fee for a radio receiving station is $3 a year.
A licence issued for a radio receiving station situated in a family residence is sufficient in respect of all radio receivers in that residence other than those owned and used by subtenants or lodgers occupying part of the premises in the residence.
Free licences are issued to blind persons and institutions for the blind, as well as to public hospitals and orphan and other charitable institutions where radio or television receivers are used for the benefit of patients or inmates. Free licence privileges are also extended to the operation of radio or television sets in schools for educational broadcast purposes. The total number of free licences issued for each of the last six years, at 31 March, was: 1961, 3,134; 1962, 3,188; 1963, 3,288; 1964, 3,294; 1965, 3,397; 1966, 3,483.
A penalty is attached to the operating of unlicensed radio or television apparatus. Requirements with respect to licences are set out in the Radio Regulations 1953.
The following table shows the increase in radio receiving licences.
| At 31 March | Auckland | Wellington | Canterbury | Otago | New Zealand Total | Licences per Hundred of Population |
|---|---|---|---|---|---|---|
| 1956 | 188,775 | 176,136 | 87,945 | 64,296 | 517,152 | 23.76 |
| 1957 | 191,138 | 175,638 | 88,177 | 64,825 | 519,778 | 23.40 |
| 1958 | 206,755 | 184,853 | 90,279 | 67,420 | 549,307 | 24.14 |
| 1959 | 215,242 | 189,163 | 93,682 | 69,077 | 567,164 | 24.38 |
| 1960 | 219,918 | 193,197 | 93,944 | 70,344 | 577,403 | 24.36 |
| 1961 | 224,491 | 193,625 | 97,492 | 71,437 | 587,045 | 24.32 |
| 1962 | 224,739 | 202,701 | 101,673 | 72,428 | 601,541 | 24.28 |
| 1963 | 227,745 | 207,348 | 102,036 | 73,601 | 610,730 | 24.11 |
| 1964 | 227,166 | 204,394 | 104,914 | 76,259 | 612,733 | 23.73 |
| 1965 | 251,476 | 206,370 | 106,960 | 75,588 | 640,394 | 24.25 |
| 1966 | 247,797 | 217,215 | 105,256 | 73,855 | 644,123 | 24.08 |
A summary of radio licences in force in New Zealand at 31 March 1966 follows.
| District | Receiving Licences | Radio District Dealers | Private Experimental | Other | Total Licences | |
|---|---|---|---|---|---|---|
| Amateur | Research | |||||
| Auckland | 247,797 | 1,329 | 1,352 | 107 | 113 | 250,698 |
| Wellington | 217,215 | 1,250 | 1,361 | 84 | 102 | 220,012 |
| Canterbury | 105,256 | 554 | 613 | 18 | 47 | 106,488 |
| Otago | 73,855 | 489 | 302 | 27 | 62 | 74,735 |
| Totals | 644,123 | 3,622 | 3,628 | 236 | 324 | 651,933 |
A summary of television licences in force in New Zealand follows.. The licence fee is $13 a year.
| At 31 March | Auckland | Wellington | Christchurch | Dunedin | Other Centres | Total | Number of Sets Covered by Hirers' Licences |
|---|---|---|---|---|---|---|---|
| 1961 | 4,808 | … | … | … | … | 4,808 | 211 |
| 1962 | 14,302 | 4,041 | 4,784 | 4 | 212 | 23,343 | 842 |
| 1963 | 40,921 | 15,048 | 15,374 | 3,649 | 6,847 | 81,839 | 5,976 |
| 1964 | 68,052 | 28,401 | 26,552 | 9,877 | 34,862 | 167,744 | 13,558 |
| 1965 | 100,078 | 43,149 | 42,460 | 19,194 | 109,039 | 313,920 | 33,257 |
| 1966 | 121,353 | 55,094 | 54,958 | 25,879 | 177,593 | 434,877 | 56,922 |
| 1967 | 139,293 | 62,838 | 64,933 | 35,258 | 221,566 | 529,888 | 70,233 |
NEWSPAPERS—There are eight daily newspapers in the four main metropolitan areas with a total circulation of 730,000. In the smaller cities and provincial towns there are 32 daily newspapers with a total circulation of 303,000. Non-daily newspapers have a circulation of 985,000.
When circulation figures for daily newspapers are related to population figures, it is found that New Zealand has 399 copies per 1,000 inhabitants. The latest comparative figures for other countries include United Kingdom, 523; Australia, 348; Canada, 223; United States, 314; U.S.S.R., 229; Sweden, 505; Norway, 388; Denmark, 344; and France, 245. (Source: UN Statistical Yearbook.)
Statistics compiled from various sources disclose that from 1840 to 1940, altogether 468 newspapers (of all categories) were established in New Zealand. The acceleration of motor transport had a speedy and decisive effect on the small-town press. Many local papers which, by publishing once, twice, or three times a week, had been serving adequately the needs of a district and backblocks were unable to survive when city papers were able to reach remote settlements within a few hours of publication, offering to country dwellers such superior attractions as daily publication, full services of New Zealand and world news, sporting news, and attractive magazine features. Under the steady pressure of competition, mergers were effected in a number of provincial towns to reduce the quota of papers, generally to a single daily.
The circulation of all periodicals is not known, but for 147 periodicals (not including two national weeklies classified as newspapers) the circulation is 2,026,000. (These statistics are compiled from information gathered by the Association of New Zealand Advertisers.)
The total number of magazines, reviews, journals, and periodicals published (but not necessarily all sold) in 1964–65 was 20,320,000.
Advertising—The advertising revenue of newspapers and periodicals is shown in the following table, along with the selling value of the newspapers and periodicals at the factory door.
| Type of Publication | Advertising Revenue | Selling Value | ||
|---|---|---|---|---|
| 1963–64 | 1964–65 | 1963–64 | 1964–65 | |
| $(000) | ||||
| Newspapers, daily | 22,582 | 24,470 | 5,994 | 6,164 |
| Newspapers other than daily | 1,804 | 1,902 | 2,230 | 2,422 |
| Magazines, reviews, journals, and periodicals | 880 | 1,008 | 848 | 958 |
LIBRARIES—New Zealand is fairly well served with libraries and the book stocks and circulation figures compare favourably with those of other English-speaking nations. In most centres the local authority maintains a public library.
Under the auspices of the New Zealand Library Association, a well developed system of inter-library co-operation has been developed, particularly in the use of resources by means of inter-library loans.
National Library of New Zealand—By the National Library Act 1965, the Alexander Turnbull Library, the General Assembly Library and the National Library Service were combined to form the National Library of New Zealand. Provision is made under the Act for the development and extension, where desirable, of the services provided by or associated with the three constituent libraries. The National Library came into being on 1 April 1966 under the administration of the Department of Education, the permanent head of which is a statutory trustee. The planning of a new building for the Library has begun.
General Assembly Library—The General Assembly Library provides services for Parliament.
The Library has been the main copyright depository for New Zealand material and has good collections of New Zealand newspapers and periodicals. Several of the newspapers are indexed daily. The main strengths are in the fields of economics, politics, administration, biography, history and government documents. In all, over 300,000 volumes are held.
During the recess, the Library is open to the public on the recommendation of a member of Parliament. During the session, access is limited to students needing books not readily available elsewhere.
Alexander Turnbull Library—The Alexander Turnbull Library in Wellington is a State research and reference library, bequeathed to the nation in 1918 by Alexander Horsburgh Turnbull (1868–1918). Before the formation of the National Library, the Library was under the control of the Department of Internal Affairs.
The original bequest has now been increased to approximately 150,000 books, together with many thousands of manuscripts, paintings and prints, photographs and maps. Acquisitions increase steadily in number, by purchase and gift. The Turnbull material has been augmented by many important donations and bequests, including some entire collections.
The fields covered by the Library fall into two main divisions. The Pacific Collections (inclusive of Antarctica) are strongest in material relating to history, early voyaging, ethnology and literature, with particular emphasis upon New Zealand publications and the work of New Zealand authors. The book stock is notably reinforced by ancillary materials as already indicated. The General or non-Pacific Collections are primarily concerned with English literature, rare books and the development of the art of printing. The Milton collection, which was of especial concern to Turnbull himself, is of particular importance. The rare book collection of first editions of works in English literature, early printed books and examples of fine printing numbers about 7,000 volumes.
The value of the Library to the researcher lies not only in the wide range of significant titles in its specialised areas of interest, but as much in the wealth of supporting minor items which tend to be over-shadowed by the more spectacular holdings.
The Library's extensive holdings of manuscript material include private archives relating to most aspects of New Zealand history. The Library's resources of early paintings of historical and topographical interest are outstanding as is the collection of photographs and negatives which has been built up to about 250,000 pieces during the past 20 years.
The Library undertakes a comprehensive programme of publishing original manuscripts and paintings from the holdings. Some of this work has been done under the auspices of the Alexander Turnbull Library Endowment Trust Fund. Exhibitions are mounted in the Library and some are sent on tour.
As from 1966, the Alexander Turnbull Library has assumed responsibility for the compilation and maintenance of the National Bibliography, begun by the National Library Service in 1947 and for the centralised cataloguing of current New Zealand material. The trustees of the National Library have decided that the collections of the Alexander Turnbull Library within the New Zealand sphere be regarded as the comprehensive national collection of such material which shall be developed accordingly.
Central Division—Taking over the main functions of the National Library Centre of the former National Library Service, the Central Division is responsible for the selection, housing and maintenance of materials for the national lending collections and for making their resources accessible to other libraries. On 31 March 1966, these collections comprised 223,000 non-fiction titles and 16,000 volumes of periodicals.
The Division is also responsible for the acquisition of materials for the national collections and acts as purchasing agent for thirty-three other Government departments operating within the Public Account.
Other functions developed with the Book Resources Committee of the New Zealand Library Association are concerned with the national system of inter-library loan and associated bibliographical projects. The National Union Catalogue of Non-Fiction now containing more than 700,000 entries, records the holdings of the major libraries in New Zealand. The Union List of Serials is a similar record, including periodicals and is available in published form. The Index to New Zealand Periodicals published yearly, now indexes 145 of the more important serials and annuals.
Extension Division—This division has two parts:
Country Library Service—The Country Library Service, founded in 1938 under the control of the Minister of Education, has been extended through district offices in Hamilton, Palmerston North, and Christchurch for closer contact with participating libraries. Bulk loans of books are made free of charge to libraries controlled by local authorities, both borough and county, which operate a free library service locally and maintain it at a reasonable standard of efficiency. To towns where the population is less than 15,000, loans are made, from books vans, special subject collections are sent, and thousands of books are supplied in response to requests for information and for individual titles. Libraries in towns with a greater population, excluding the main centres, receive assistance under certain conditions. Outside the boundaries of boroughs and town districts, groups of people may have books at the rate of $6 for 50 changed three times a year to form their own small local libraries. Eight specially equipped vans, each carrying 1,600–2,000 books, including novels and books on many subjects, travel over the whole territory. Visits are arranged to allow libraries of boroughs and county groups to make their own exchanges every four months. In between visits, books are sent by post from the headquarters and district offices to libraries requesting them. Hampers of books are sent to isolated groups of readers which cannot be reached by van.
Librarians are encouraged to visit the offices of the Country Library Service to see the range of books available and to discuss problems of administration. On visits of book vans, field librarians help to keep librarians in touch with developments in service. During times of reorganisation, assistance in staffing is given. In this way local authorities are helped and encouraged to meet the minimum standards for public libraries participating in the Country Library Service.
Free public libraries which extend their service to general hospitals in their area receive special collections of books for the use of patients. Psychiatric hospitals receive collections of books which are exchanged regularly. Prisons and borstal institutions receive books and change them on the four-monthly visits of the travelling book vans. A library service is given to lighthouses, and to camps of the Ministry of Works, Electricity Department, and New Zealand Forest Service.
The number of libraries obtaining books from the Country Library Service on 31 March 1966 was as follows: free libraries, 138; subscription libraries, 888; groups, 21; Ministry of Works, Electricity Department, and New Zealand Forest Service camps, 61; psychiatric hospitals, 16; hospitals, 28; prisons and borstal institutions, 19.
School Library Service—The School Library Service, established in 1941, is responsible for providing a wide and varied choice of books of high imaginative quality or technical excellence for children at all levels of ability and stages of development, and arranging for their distribution and circulation to schools. It thus supplements the library resources of individual schools from its large pool stocks of books.
Services at present available can be broadly defined as: (i) general exchanges of books; (ii) an information and request service; (iii) assistance to schools in organising their books for use; and (iv) the provision of book lists.
By constant scanning of the output of printed material, by long-term buying plans, and by the regular publication of book lists, the Service has set standards of book selection and coverage, and brings to the notice of those concerned the worth-while books appropriate for their purpose.
Library School—The New Zealand Library School offers a professional course to those holding university degrees or with equivalent education leading respectively to the diploma or the certificate of the New Zealand Library School. The course lasts from March to December. The possession of either qualification, followed by three years' satisfactory work in libraries, entitles a librarian to apply for the Associateship of the New Zealand Library Association. The School was established in 1946 and 389 students had been given professional training by the end of 1966. Students receive allowances equal to those paid to students of teachers' colleges. The New Zealand Library Association's Certificate Course, Part Two of which since 1952 had been carried out by a five weeks' course at the School, has now been superseded, in view of the increasing number of entrants, by an arrangement under which candidates who pass a preliminary examination spend four weeks at the School for each of three successive years.
Facilities are offered to students sponsored by UNESCO and by countries participating in the Colombo Plan.
Census of Libraries, 1964—The quinquennial census of libraries was taken for the year ended 31 March 1964. The census covered a total of 413 libraries comprising three national libraries, 33 libraries in universities (including the libraries of other institutions of higher education), 163 special libraries, and 214 public libraries. Corresponding figures for the 1959 Census of Libraries, with the same coverage, were 286, 3, 21, 98, and 164 respectively.
Three libraries were listed as national libraries—the General Assembly Library, the Alexander Turnbull Library, and the National Library Service.
The libraries in universities (including other institutions of higher education) comprised the libraries of the six universities with nine libraries in close association, the libraries of eight teachers' training colleges, the library of the university college of agriculture, the libraries of five theological colleges, and four institutions of higher technical education, making a total of 33, or 12 more than five years earlier.
The special libraries were, for the purpose of this census, divided into (a) libraries of learned societies, etc., and of commercial interests and (b) libraries of Government Departments. There were 39 libraries in the former category and 124 in the latter, being increases of 17 and 48 since 1959. Coverage in the former category may not be complete.
Public libraries (those controlled or largely supported by a local authority and including branch libraries) showed an increase of 50 over the 1959 census—214 as against 164.
In the period 1959 to 1964 public library membership increased by 28 percent and book circulation by 27 percent. Book stocks rose by 30 percent, so that slightly less use was made of the books available. Since 1959 circulation per member has dropped at most libraries, except the very largest. Television, which has been introduced since 1960, has probably been one of the factors involved. There are 4.60 books to every member in the public libraries; on average those books circulate 6.32 times annually and members take out 29.06 public library books a year. Junior readers read four times as much fiction as non-fiction while adults read three times as much.
The following are summarised tables of the results of the 1964 census. Full details containing the census data have been published in a separate report prepared by the Department of Statistics.
| NATIONAL, UNIVERSITY, AND SPECIAL LIBRARIES—BOOK STOCK AND CIRCULATION | ||||||||
|---|---|---|---|---|---|---|---|---|
| Class of Library | Number of Libraries | Book Stock at 31 March 1964 | Circulation During Year | |||||
| Books | Serials | Pamphlets | Total | Items Lent Outside the Library* | Items Lent to Other Libraries* | Items Borrowed From Other Libraries* | ||
* Items include books, serials, and pamphlets. | ||||||||
| National libraries | 3 | 2,905,656 | 39,709 | 21,646 | 2,967,011 | 2,135,175 | 144,802 | 6,397 |
| Libraries in universities, etc. | 33 | 1,007,523 | 162,685 | 18,372 | 1,188.580 | 538,234 | 7,747 | 12,806 |
| Special libraries— | ||||||||
| Learned societies and commercial interests | 39 | 148,226 | 88,531 | 24,035 | 260,792 | 35,070 | 1,865 | 3,699 |
| Government departments and associated organisations | 124 | 447,916 | 386,991 | 49,730 | 884,637 | 292,992 | 12,920 | 27,172 |
| Totals, special libraries | 163 | 596,142 | 475,522 | 73,765 | 1,145,429 | 328,062 | 14,785 | 30,871 |
| Grand totals | 199 | 4,509,321 | 677,916 | 113,783 | 5,301,020 | 3,001,471 | 167,334 | 50,074 |
| PUBLIC LIBRARIES—BOOK STOCK AT 31 MARCH 1964 | ||||||||||
|---|---|---|---|---|---|---|---|---|---|---|
| Public Libraries in Area With a Population of | Number of Libraries* | Own Stock | For Reference Only (Included in Own Stock) | Country Library Service Stock | ||||||
| Adult | Junior | Total | Adult | Junior | ||||||
| Pay Collection | Free Fiction | Free Non-fiction | Fiction | Non-fiction | ||||||
* Number of library systems which operate 214 libraries (including 62 branches as separate entities). | ||||||||||
| 50,000 and over | 6 | 229,765 | 292,519 | 698,591 | 175,759 | 68,579 | 1,465,213 | 51,349 | 5,320 | 12,805 |
| 20,000 to 49,999 | 14 | 162,401 | 66,325 | 213,542 | 92,069 | 36,834 | 571,171 | 26,684 | 13,850 | 6,180 |
| 10,000 to 19,999 | 9 | 24,342 | 29,288 | 50,391 | 27,888 | 11,655 | 143,564 | 1,580 | 13,577 | 6,058 |
| 5,000 to 9,999 | 30 | 109,201 | 63,250 | 64,888 | 43,779 | 14,123 | 295,241 | 3,271 | 22,316 | 10,290 |
| 3,000 to 4,999 | 29 | 78,745 | 46,535 | 28,534 | 19,391 | 6,168 | 179,373 | 1,465 | 15,787 | 8,396 |
| Under 3,000 | 64 | 133,103 | 47,248 | 28,851 | 22,842 | 4,715 | 236,759 | 1,087 | 26,691 | 8,558 |
| Totals | 152 | 737,557 | 545,165 | 1,084,797 | 381,728 | 142,074 | 2,891,321 | 85,436 | 97,541 | 52,287 |
| PUBLIC LIBRARIES—BOOKS: CIRCULATION AND USE | |||||||||||
|---|---|---|---|---|---|---|---|---|---|---|---|
| Public Libraries in Areas Population of— | Number of Libraries* | Own Stock | Country Library Service Stock | Interlibrary Loans | |||||||
| Adult | Junior | Total | Adult | Junior | Lent to Other Libraries | Borrowed from Other Libraries | |||||
| Pay Collection | Free Fiction | Free Non-fiction | Periodicals | ||||||||
* See footnote to table above. | |||||||||||
| 50,000 and over | 6 | 1,922,767 | 1,856,492 | 1,554,362 | 429,946 | 1,631,742 | 7,395,309 | 31,326 | 134,284 | 2,756 | 8,139 |
| 20,000 to 49,999 | 14 | 1,775,195 | 844,686 | 693,716 | 180,216 | 1,318,224 | 4,812,037 | 65,568 | 32,249 | 276 | 8,952 |
| 10,000 to 19,999 | 9 | 362,754 | 362,052 | 256,595 | 72,399 | 268,435 | 1,322,235 | 52,580 | 27,587 | 897 | 4,610 |
| 5,000 to 9,000 | 30 | 990,185 | 452,422 | 332,508 | 61,733 | 535,081 | 2,371,929 | 149,960 | 100,306 | 304 | 15,460 |
| 3,000 to 4,999 | 29 | 558,897 | 264,554 | 156,056 | 20,625 | 204,546 | 1,204,678 | 102,665 | 56,843 | 1,007 | 8,164 |
| Under 3,000 | 64 | 676,969 | 183,111 | 107,573 | 17,657 | 190,060 | 1,175,370 | 159,653 | 61,873 | 1,223 | 7,478 |
| Totals | 152 | 6,286,767 | 3,963,317 | 3,100,810 | 782,576 | 4,148,088 | 18,281,558 | 561,752 | 413,142 | 6,463 | 52,803 |
International Statistics on Libraries—The following tables compiled from published UNESCO and other statistics show New Zealand's position in relation to other English-speaking countries as regards library resources, borrowers, and book circulation.
| NATIONAL, UNIVERSITY, AND SPECIAL LIBRARIES | ||||||
|---|---|---|---|---|---|---|
| Country | Population (Million) | Year | Type of Data | Library Category | ||
| National | University | Special | ||||
| New Zealand | 2.6 | 1,964 | Libraries | 3 | 33 | 163 |
| Volumes (000) | 2,967 | 1,189 | 1,145 | |||
| Australia | 11.0 | 1,963 | Libraries | 1 | 10 | 552 |
| Volumes (000) | 730 | 2,990 | .. | |||
| Canada | 18.2 | 1,961 | Libraries | 1 | 34 | 372 |
| Volumes (000) | 250 | 6,993 | 6,000 | |||
| South Africa | 14.4 | 1,958 | Libraries | 2 | .. | .. |
| Volumes (000) | 700 | .. | .. | |||
| United Kingdom | 51.9 | 1,958 | Libraries | 3 | 632 | 1,177 |
| Volumes (000) | 9,000 | 21,533 | 14,850 | |||
| United States of America | 180.7 | 1,960 | Libraries | 1 | 1,940 | 5,000 |
| Volumes (000) | 12,075 | 176,000 | .. | |||
| PUBLIC LIBRARIES | ||||||
|---|---|---|---|---|---|---|
| Country | Population (Million) | Year | Number of Libraries | Book Stock, Number of Volumes | Borrowers | Circulation, Number of Volumes |
* Estimated. | ||||||
| (000) | (000) | (000) | ||||
| New Zealand | 2.6 | 1,964 | 152 | 2,891 | 629 | 18,282 |
| Australia | 11.0 | 1,963 | 320 | 5,000* | .. | .. |
| Canada | 18.2 | 1,961 | 875 | 14,528 | 2,431 | 60,268 |
| South Africa | 14.4 | 1,958 | 368 | 4,933 | 537 | 14,783 |
| United Kingdom | 53.3 | 1,962 | 562 | 77,200 | 14,470 | 460,504 |
| United States of America | 180.7 | 1,960 | 7,800 | 200,000 | .. | 550,000 |
CINEMAS—Statistics relating to cinemas are normally collected every alternate year. The survey of cinemas for the year ended 31 March 1965 covered 397 theatres, compared with 491 in 1963.
The extensive development of television since 1961 has influenced cinema patronage. Cinema attendances during the year 1964–65 were 11.6 million fewer than when the previous survey was made in 1962–63. The average number of admissions per head of mean population fell from 15 in 1962–63 to 10 in the latest survey.
The following table gives figures of cinema attendances and takings.
| Year | Theatres | Admissions | Gross Admission Takings | Amusement Tax | Net Admission Takings | Average Admission Price* | Admissions Per Head of Mean Population |
|---|---|---|---|---|---|---|---|
* Including amusement tax. | |||||||
| (000) | $(000) | $(000) | $(000) | C | No. | ||
| 1938–39 | 576 | 29,809 | 3,788 | 94 | 3,694 | 12.7 | 18.5 |
| 1939–40 | 574 | 31,171 | 4,020 | 108 | 3,912 | 12.9 | 19.1 |
| 1944–45 | 551 | 35,420 | 5,176 | 220 | 4,956 | 14.6 | 21.3 |
| 1949–50 | 600 | 36,353 | 5,580 | 272 | 5,308 | 15.3 | 19.3 |
| 1953–54 | 582 | 37,368 | 7,360 | 600 | 6,758 | 19.7 | 18.1 |
| 1956–57 | 578 | 37,596 | 8,966 | 740 | 8,226 | 23.8 | 17.1 |
| 1958–59 | 547 | 38,208 | 9,700 | 850 | 8,850 | 25.4 | 16.6 |
| 1960–61 | 545 | 40,632 | 10,792 | 952 | 9,840 | 26.6 | 17.0 |
| 1962–63 | 491 | 37,584 | 10,136 | 880 | 9,256 | 27.0 | 15.0 |
| 1964–65 | 397 | 26,026 | 8,180 | 180 | 8,000 | 31.4 | 10.0 |
The following statistics for the last three collections cover the operations of all classes of cinemas—viz, (a) those operating six days per week; (b) those operating on odd days per week; (c) circuit, or itinerant operators. The average number of screenings per week in these categories in 1964–65 were 12.5, 2.2, and 1.0 respectively.
| Item | 1960–61 | 1962–63 | 1964–65 |
|---|---|---|---|
| Cinemas— | |||
| Screening six days per week | 217 | 204 | 176 |
| Screening odd days per week | 294 | 254 | 197 |
| Circuit | 34 | 33 | 24 |
| Totals | 545 | 491 | 397 |
| Cinemas according to seating accommodation— | |||
| Other than circuits— | |||
| Under 200 | 92 | 70 | 42 |
| 200 and under 500 | 206 | 170 | 144 |
| 500 and under 1,000 | 179 | 184 | 157 |
| 1,000 and under 1,500 | 25 | 25 | 21 |
| 1,500 and over | 9 | 9 | 9 |
| Circuit cinemas | 34 | 33 | 24 |
| Totals | 545 | 491 | 397 |
| Seating accommodation (all cinemas) No. | 257,207 | 246,361 | 209,991 |
| Average seating capacity per cinema No. | 472 | 502 | 529 |
| Persons engaged— | |||
| Full time—Males No. | 547 | 595 | 518 |
| Females No. | 441 | 475 | 418 |
| Part time—Males No. | 1,107 | 1,012 | 722 |
| Females No. | 1,651 | 1,522 | 1,182 |
| Performances per year No. | 162,006 | 155,546 | 138,314 |
| Average attendance per performance No. | 251 | 242 | 188 |
Statistics on the commercial operation of theatres are given in the following table. These statistics relate only to cinemas, and do not purport to show employees, revenue, and expenditure of the motion-picture industry as a whole. In particular, the full revenue and expenditure in connection with screen advertising, and also head office expenses of controlling companies (including such items as interest on debentures and mortgage charges), unless recovered from exhibitors, are not recorded in the statistics. The item “Rent” under “Theatre expenditure” does not represent the rental value of all theatres, but only the rent paid where theatres were leased or rented.
| Item | 1960–61 | 1962–63 | 1964–65 |
|---|---|---|---|
* Includes drawings of working proprietors. | |||
| Revenue— | $(000) | ||
| Admission receipts (including amusement tax) | 10,792 | 10,136 | 8,180 |
| Screen advertising | 300 | 424 | 384 |
| Other receipts | 224 | 308 | 304 |
| Totals | 11,316 | 10,868 | 8,868 |
| Expenditure— | |||
| Salaries and wages* | 2,402 | 2,332 | 2,128 |
| Film hire | 2,900 | 2,766 | 2,604 |
| Advertising | 688 | 718 | 598 |
| Amusement tax | 952 | 880 | 180 |
| Rent | 736 | 768 | 370 |
| Repairs and maintenance | 444 | 330 | 226 |
| Depreciation | 324 | 266 | 212 |
| Other expenses | 1,376 | 1,666 | 1,452 |
| Totals | 9,820 | 9,724 | 7,768 |
Classification by Statistical Areas—The following two tables show some of the principal statistics of cinemas for 1964–65 by statistical areas. It will be noticed that attendances per person are higher in the southern portion of the North Island than in the northern areas. In the South Island there are noticeably higher attendances per person in Nelson, Westland, and Southland than in the other areas. The popularity of the cinema is still most pronounced on the West Coast. Average attendances per person in the Westland statistical area were 18.3 in 1964–65 as compared with 20.4 in 1962–63.
| Statistical Area | Population 1 April 1965 | Number of Cinemas | Seating Accommodation | Paid Admissions | Average Admission Charge | Admissions per Head of Population | Gross Admission Takings |
|---|---|---|---|---|---|---|---|
* Based on mean population in this case | |||||||
| Number of Seats | (000) | C | No. | $(000) | |||
| Northland | 91,400 | 31 | 10,106 | 888 | 27.1 | 9.7 | 240 |
| Central Auckland | 586,097 | 64 | 41,514 | 5,386 | 27.5 | 9.2 | 2,022 |
| South Auckland - Bay of Plenty | 384,000 | 67 | 30,975 | 3,657 | 27.7 | 9.5 | 1,012 |
| East Coast | 47,700 | 9 | 4,649 | 679 | 25.9 | 14.2 | 176 |
| Hawke's Bay | 124,600 | 21 | 9,086 | 1,423 | 26.2 | 11.4 | 372 |
| Taranaki | 104,100 | 19 | 10,827 | 1,264 | 27.7 | 12.1 | 350 |
| Wellington | 516,700 | 58 | 40,359 | 5,319 | 31.7 | 10.3 | 1,690 |
| Marlborough | 29,700 | 6 | 2,512 | 279 | 29.0 | 9.4 | 80 |
| Nelson | 67,700 | 20 | 7,953 | 882 | 27.1 | 13.0 | 240 |
| Westland | 25,100 | 10 | 4,521 | 458 | 26.3 | 18.3 | 120 |
| Canterbury | 373,720 | 45 | 23,272 | 3,092 | 33.7 | 8.3 | 1,040 |
| Otago | 186,400 | 33 | 17,203 | 1,534 | 34.0 | 8.2 | 524 |
| Southland | 102,900 | 14 | 7,214 | 1,166 | 27.0 | 11.3 | 314 |
| All areas | 2,640,117 | 397 | 209,991 | 26,026 | 31.4 | 10.0* | 8,180 |
| Statistical Area | Amusement Tax | Net Admission Takings | Film Hire | Film Hire as a Proportion of Net Admission Takings | Number of Performances for Year | Average Attendance per Performance | Average Seating Capacity per Hall |
|---|---|---|---|---|---|---|---|
| $(000) | $(000) | $(000) | Percent | No. | No. | No. | |
| Northland | 2 | 238 | 64 | 27.2 | 6,404 | 139 | 326 |
| Central Auckland | 80 | 1,942 | 684 | 35.2 | 27,996 | 192 | 646 |
| South Auckland - Bay of Plenty | 8 | 1,004 | 292 | 29.1 | 21,748 | 168 | 462 |
| East Coast | – – | 174 | 58 | 32.8 | 3,112 | 218 | 516 |
| Hawke's Bay | 2 | 370 | 134 | 36.2 | 7,016 | 203 | 433 |
| Taranaki | 2 | 346 | 104 | 30.2 | 8,266 | 153 | 570 |
| Wellington | 36 | 1,654 | 542 | 32.8 | 27,554 | 193 | 696 |
| Marlborough | – – | 80 | 20 | 24.4 | 1,622 | 172 | 419 |
| Nelson | 2 | 238 | 76 | 32.4 | 4,366 | 202 | 398 |
| Westland | – – | 120 | 30 | 24.1 | 2,374 | 193 | 452 |
| Canterbury | 32 | 1,008 | 342 | 33.9 | 14,940 | 207 | 517 |
| Otago | 14 | 506 | 154 | 30.4 | 8,395 | 183 | 521 |
| Southland | 2 | 314 | 104 | 32.9 | 4,521 | 258 | 515 |
| All areas | 180 | 8,000 | 2,604 | 32.5 | 138,314 | 188 | 529 |
Classification by Urban Areas—Statistics have been prepared for the principal urban areas for the latest year and are shown in the next table. The Hutt urban area has been included with Wellington for the purposes of these statistics.
Seating accommodation in relation to population in these areas shows Dunedin to have one seat for every 12.3 persons, Wellington one for every 12.4, Auckland one for every 14.1, and Christchurch only one for every 2.07 persons.
| Urban Areas | Population 1 April 1965 | Number of Cinemas | Seating Accommodation | Paid Admissions | Admissions per Seat | Average Admission Charge | Admissions per Head of Population | Gross Admission Takings |
|---|---|---|---|---|---|---|---|---|
| (000) | No. | No. of Seats | (000) | No. | c | No. | $(000) | |
| Auckland | 515 | 47 | 36,594 | 5,219 | 143 | 37.9 | 10.1 | 1,980 |
| Wellington (including Hutt) | 273 | 29 | 21,998 | 3,142 | 143 | 34.7 | 11.5 | 1,090 |
| Christchurch | 244 | 16 | 11,757 | 2,003 | 170 | 36.6 | 8.2 | 738 |
| Dunedin | 109 | 9 | 8,865 | 1,004 | 113 | 36.5 | 9.2 | 366 |
| All areas | 1,141 | 101 | 79,214 | 11,369 | 144 | 36.8 | 10.0 | 4,176 |
| Urban Areas | Amusement Tax | Net Admission Takings | Film Hire | Film Hire as Proportion of Net Admission Takings | Number of Performances for Year | Average Attendance per Performance | Average Number of Seats Available per Performance | Proportion of Hall Capacity Filled per Performance |
|---|---|---|---|---|---|---|---|---|
| $(000) | $(000) | $(000) | Percent | No. | No. | No. | Percent | |
| Auckland | 80 | 1,900 | 670 | 35.2 | 26,068 | 200 | 963 | 20.8 |
| Wellington (including Hutt) | 32 | 1,058 | 346 | 32.6 | 15,909 | 198 | 868 | 22.8 |
| Christchurch | 30 | 708 | 262 | 36.9 | 8,660 | 231 | 908 | 25.5 |
| Dunedin | 14 | 352 | 114 | 32.6 | 5,152 | 195 | 1,082 | 18.0 |
| All areas | 156 | 4,018 | 1,392 | 34.6 | 55,789 | 204 | 938 | 21.7 |
Classification of Cinemas—The following table shows the classification of cinemas according to number of screening days per week and of circuit operators.
| Screening | Number of Cinemas | Seating Accommodation | Paid Admissions | Admissions per Seat | Average Admission Charge | Gross Admission Takings |
|---|---|---|---|---|---|---|
* Ten circuits. | ||||||
| No. | No. of Seats | (000) | No. | C | $(000) | |
| Six days per week | 176 | 143,458 | 23,125 | 161 | 32.4 | 7,498 |
| Odd days per week | 197 | 61,996 | 2,786 | 45 | 23.5 | 654 |
| Circuit | 24* | 4,537 | 115 | 25 | 23.5 | 26 |
| All cinemas | 397 | 209,991 | 26,026 | 124 | 31.4 | 8,180 |
| Screening | Amusement Tax | Net Admission Takings | Film Hire | Film Hire as a Proportion of Net Admission Takings |
|---|---|---|---|---|
| $(000) | $(000) | $(000) | Percent | |
| Six days per week | 178 | 7,322 | 2,392 | 32.7 |
| Odd days per week | 2 | 652 | 204 | 31.3 |
| Circuit | – – | 26 | 8 | 28.6 |
| All cinemas | 180 | 8,000 | 2,604 | 32.5 |
| Screening | Persons Engaged | Number of Performances for Year | Average Attendance per Performance | Average Number of Seats Available per Performance | Proportion of Hall Capacity filled per Performance | |||
|---|---|---|---|---|---|---|---|---|
| Full Time | Part Time | |||||||
| Male | Female | Male | Female | |||||
| No. | No. | No. | No. | No. | No. | No. | Percent | |
| Six days per week | 425 | 368 | 367 | 921 | 114,661 | 202 | 869 | 23.2 |
| Odd days per week | 86 | 46 | 337 | 257 | 22,391 | 124 | 388 | 32.1 |
| Circuit | 7 | 4 | 18 | 4 | 1,262 | 91 | … | … |
| All cinemas | 518 | 418 | 722 | 1,182 | 138,314 | 188 | .. | .. |
Cinema Attendance in Principal Countries—The table below shows the number of admissions per head in the years quoted in a number of selected countries. These figures are taken from the United Nations Statistical Yearbook.
| Country | Year | Number of Admissions | |
|---|---|---|---|
| Total (Million) | Per Head | ||
| Australia | 1,960 | 210 | 21.0 |
| Canada | 1,963 | 98 | 5.2 |
| Denmark | 1,963 | 35 | 7.4 |
| France | 1,964 | 286 | 5.9 |
| Germany, West | 1,964 | 335 | 5.7 |
| Ireland, Republic of | 1,961 | 38 | 13.5 |
| Israel | 1963–64 | 46 | 19.3 |
| Italy | 1,963 | 698 | 13.8 |
| Japan | 1,964 | 431 | 4.5 |
| New Zealand | 1964–65 | 26 | 10.0 |
| Norway | 1,962 | 35 | 9.6 |
| Russia (U.S.S.R.) | 1,963 | 3,900 | 17.4 |
| Spain | 1,963 | 320 | 10.3 |
| Sweden | 1,963 | 52 | 6.8 |
| Switzerland | 1,964 | 47 | 8.1 |
| United Kingdom | 1,964 | 343 | 6.3 |
| United States of America | 1,963 | 2,179 | 11.5 |
| Yugoslavia | 1,964 | 123 | 6.4 |
PRODUCTION AND PRODUCTIVITY INDEXES—Growth rates in a national economy constitute the most important single class of economic indicator. Growth is the result of many factors but attention has been focussed in recent years on labour productivity, that is, the relation between output and labour input.
As a basis for improved measures of productivity, the Department of Statistics instituted in 1962 a new volume of production index. This index, known as the Index of Production, measures the volume of output of all goods and services produced by the economy. Its complete coverage and concept of net output bring it into line with the approach to national income and sector accounts. Not only does the new index produce a more comprehensive volume of production measure, but it also provides the basis for a productivity index known as the Index of Productivity. The two indexes not only provide measures of the country's economic growth, but they also give the Court of Arbitration a measure of productivity for its wage claim deliberations. The Court is now specifically required to have regard to productivity when considering an application for a general wage order.
The advantages of the Index of Production covering the whole productive process are obvious. For one thing services of all kinds are of major importance in present day economic life and obviously must be adequately covered by indexes representative of the whole production structure of the economy. The weighting of the index is based upon the pattern derived for the 1954–55 Inter-Industry Study, and the weights for each indicator are derived from the net output and depreciation represented by that indicator in 1954–55. The divisions for the sector indexes are based upon the industrial division of the New Zealand Standard Industrial Classification which, in turn, is based upon an industrial classification recommended by the United Nations and which is being universally adopted by other countries. The proportionate weighting is as follows:
| Weight percent | |
|---|---|
| Farming | 20.7 |
| Forestry and logging | 0.8 |
| Fisheries, etc. | 0.3 |
| Mining and quarrying | 1.0 |
| Manufacturing | 21.6 |
| Building and construction | 8.2 |
| Electric power and gas | 1.6 |
| Services | 45.8 |
| 100.0 |
Production Index—The following are the figures for the index equated to Base 1954–55 = 1000.
| Year | Index |
|---|---|
| 1954–55 | 1,000 |
| 1955–56 | 1,039 |
| 1956–57 | 1,059 |
| 1957–58 | 1,115 |
| 1958–59 | 1,146 |
| 1959–60 | 1,191 |
| 1960–61 | 1,265 |
| 1961–62 | 1,307 |
| 1962–63 | 1,349 |
| 1963–64 | 1,430 |
| 1964–65 | 1,518 |
Over the 10 years studied the index increased by 51.8 percent, an average rate of approximately 4.3 percent each year. The year 1955–56 gave an increase almost the same as the average, but in 1956–57 the increase was only 1.9 percent, a result caused mainly by a relatively small increase in the Manufacturing group. The following year 1957–58, the main index rose by 5.3 percent, with the heavily-weighted Manufacturing, Farming, and Services groups all contributing substantially. The latter half of the year 1958–59 was a period of restraint, and particularly affected was the Services group (mainly wholesale and retail trade) which recorded a small rise only. After allowing for off-setting solid increases in the Farming and Manufacturing groups, the overall index rise was recorded as 2.8 percent in 1958–59.
There was a year of recovery in 1959–60 with an average rise of 3.9 percent. This was followed in 1960–61 by a substantial rise, when sharp increases in the Manufacturing and Services groups were the main reason for the 6.2 percent rise in the overall index. In 1961–62, the increase of 3.3 percent was below the average for the period, and this pattern was repeated in 1962–63, when the increase was only 3.2 percent, a result mainly of a decline in Building and Construction and a smaller than average increase in the Services group. A sharp upward movement was recorded in 1963–64 with an increase of 6.0 percent, resulting mainly from substantial increases in the Manufacturing and Services groups. In 1964–65 the increase in volume of output for the Manufacturing group was the largest recorded throughout the ten-year period and this was the main contributing factor to the rise of 6.2 percent in the overall index for 1964–65; this increase, equalling the rise of 6.2 percent in 1960–61, has not been exceeded during the 10–year period. In the last five years the index has risen by 27.5 percent, or 5.0 percent a year on average. The following table shows the group indexes.
| VOLUME OF PRODUCTION: MAJOR GROUP INDEXES | |||||||||||
|---|---|---|---|---|---|---|---|---|---|---|---|
| Industrial Group | 1954–55 | 1955–56 | 1956–57 | 1957–58 | 1958–59 | 1959–60 | 1960–61 | 1961–62 | 1962–63 | 1963–64 | 1964–65 |
| Farming | 1,000 | 1,019 | 1,047 | 1,114 | 1,168 | 1,194 | 1,240 | 1,262 | 3 338 | 1369x | 1,397 |
| Forestry and logging | 1,000 | 1,075 | 1,075 | 1,102 | 1,166 | 1,284 | 1,315 | 1,334 | 1,295 | 1,354 | 1,477 |
| Fisheries, etc. | 1,000 | 1,044 | 1,056 | 1,096 | 1,104 | 1,153 | 1,195 | 1,142 | 1,218 | 1,250 | 1,269 |
| Mining and quarrying | 1,000 | 1,113 | 1,188 | 1,176 | 1,242 | 1,289 | 1,409 | 1,339 | 1,290 | 1,364 | 1,418 |
| Manufacturing | 1,000 | 1,048 | 1,065 | 1,139 | 1,203 | 1,244 | 1,366 | 1,436 | 1,501 | 1,658 | 1,873 |
| Power and gas | 1,000 | 1,091 | 1,138 | 1,290 | 1,281 | 1,435 | 1,525 | 1,654 | 1,832 | 2,016 | 2,204 |
| Building and construction | 1,000 | 1,078 | 1,086 | 1,119 | 1,134 | 1,248 | 1,312 | 1,350 | 1,310 | 1,317 | 1,379 |
| All services | 1,000 | 1,032 | 1,052 | 1,096 | 1,104 | 1,142 | 1,208 | 1,248 | 1,275 | 1355x | 1,411 |
| Total All Groups | 1,000 | 1,039 | 1,059 | 1,115 | 1,146 | 1,191 | 1,265 | 1,307 | 1,349 | 1,430 | 1,518 |
The table shows the steady progress in the output of farming, the greatest upward movements being in 1957–58, 1958–59, and 1962–63. During the 10 years covered, Farming output rose by 39.7 percent, or 3.4 percent a year, compared with the increase in the overall index of 4.3 percent a year.
The other primary industry groups all increased their outputs but at lower overall rates than the average. The increased demand from the building industry for timber in 1964–65 is reflected in the increase of over 9 percent in 1964–65, in the Forestry and Logging group. The Power and Gas group recorded the largest increase, over 120 percent, in the 10-year period.
The Manufacturing group showed the second largest increase, with a rise of 87.3 percent during the period, considerably more than the overall average; there was a particularly sharp increase in 1964–65, when the rise was the largest during the 10–year period for the Manufacturing group. The Building and Construction group showed a gain of 37.9 percent over the period.
The most heavily-weighted group, Services, recorded an increase of 41.1 percent, which was below the average of 51.8 percent. Service industries may be said to be of two kinds, those for supplying the needs of persons as final consumers, and those which service industries of all kinds. The volume index for these service industries covers many activities such as wholesale and retail trade, transport and communication, finance, education, and personal services.
PRODUCTIVITY—The productivity index shows changes in the volume of output per person engaged, and is obtained by dividing the volume of production index by an index of employment. The index of employment is an index of total labour force for the year but excluding armed forces and unemployed.
| Production Year | Index of Production | Index of Employment | Index of Productivity |
|---|---|---|---|
| 1954–55 | 1,000 | 1,000 | 1,000 |
| 1955–56 | 1,039 | 1,020 | 1,019 |
| 1956–57 | 1,059 | 1,038 | 1,020 |
| 1957–58 | 1,115 | 1,059 | 1,053 |
| 1958–59 | 1,146 | 1,082 | 1,059 |
| 1959–60 | 1,191 | 1,093 | 1,090 |
| 1960–61 | 1,265 | 1,118 | 1,131 |
| 1961–62 | 1,307 | 1,143 | 1,143 |
| 1962–63 | 1,349 | 1,161 | 1,162 |
| 1963–64 | 1,430 | 1,191 | 1,201 |
| 1964–65 | 1,518 | 1,227 | 1,237 |
Comparing the index of production with the index of employment shows how the average output per person engaged varied over the 10 years under review. It can be seen that the productivity index is a little more sensitive to changes in economic tempo than is the index of production. In 1956–57 there was virtually no increase in productivity, but in 1957–58 there was a gain of 3.2 percent. Then 1958–59 was another year of low productivity gain, while the succeeding year gave an increase slightly less than that of 1957–58, and the gain in 1960–61 was of 3.8 percent. In 1961–62 the increase was 1.1 percent, and the following year, 1962–63, 1.7 percent. For 1963–64 the increase was 3.4 percent. For the latest year, 1964–65, the index of productivity per worker rose by 3.0 percent, slightly less than in the previous year despite the higher rate of increase for total production. The full effect of the sharp rise in the number of persons born immediately following the Second World War is now being reflected in the higher-than-average percentage gains recorded in the labour force for the last two years.
The rise of 3.0 percent in the labour force in 1964–65 compares with an average rise of 2.1 percent over the 10–year period.
Over the 10–year period covered, productivity has increased by 23.7 percent, which represents an average annual rate of increase of 2.1 percent.
GROSS DOMESTIC PRODUCT IN CONSTANT PRICES—A volume of production index, covering the national output in its entirety and allowing for the input of goods and services by individual producing units, provides material with which the gross domestic product in constant prices may be obtained. With only minor modification, particularly the inclusion of the service of defence, the volume of production index can be converted into an index of real gross domestic product. It should be noted that adjustments have been made to figures previously published in the following tables relating to Gross Domestic Product in Constant Prices.
| Year | Index of Production | Index of Real Gross Domestic Product |
|---|---|---|
| 1954–55 | 1,000 | 1,000 |
| 1955–56 | 1,039 | 1,037 |
| 1956–57 | 1,059 | 1,057 |
| 1957–58 | 1,115 | 1,112 |
| 1958–59 | 1,146 | 1,143 |
| 1959–60 | 1,191 | 1,188 |
| 1960–61 | 1,265 | 1,261 |
| 1961–62 | 1,307 | 1,303 |
| 1962–63 | 1,349 | 1,343 |
| 1963–64 | 1,430 | 1,425 |
| 1964–65 | 1,518 | 1,512 |
An examination of these two indexes, shows that the major influences on their movements are identical.
Gross domestic product in current prices can be obtained from gross national product by allowing for net income accruing to overseas residents. Both have been obtained by the Department of Statistics in its annual compilation of the national income and expenditure.
| Year | Gross National Product | Gross Domestic Product |
|---|---|---|
| $(m) | $(m) | |
| 1954–55 | 1,860 | 1,878 |
| 1955–56 | 1,966 | 1,984 |
| 1956–57 | 2,062 | 2,082 |
| 1957–58 | 2,184 | 2,204 |
| 1958–59 | 2,270 | 2,298 |
| 1959–60 | 2,434 | 2,458 |
| 1960–61 | 2,622 | 2,662 |
| 1961–62 | 2,722 | 2,756 |
| 1962–63 | 2,924 | 2,974 |
| 1963–64 | 3,210 | 3,258 |
| 1964–65 | 3,512 | 3,580 |
The index of real gross domestic product can then be used to derive gross domestic product in constant prices and, by allowing for the share of output accruing overseas, real gross national product can also be obtained. This is done in the following tables where both the gross domestic product and the gross national product are expressed in 1954–55 prices.
| Year | Index of Real Gross Domestic Product | Gross Domestic Product at 1954–55 Prices | Gross National Product at 1954–55 Prices |
|---|---|---|---|
| $(m) | $(m) | ||
| 1954–55 | 1,000 | 1,878 | 1,860 |
| 1955–56 | 1,037 | 1,948 | 1,930 |
| 1956–57 | 1,057 | 1,986 | 1,966 |
| 1957–58 | 1,112 | 2,088 | 2,070 |
| 1958–59 | 1,143 | 2,146 | 2,120 |
| 1959–60 | 1,188 | 2,232 | 2,210 |
| 1960–61 | 1,261 | 2,368 | 2,332 |
| 1961–62 | 1,303 | 2,448 | 2,418 |
| 1962–63 | 1,343 | 2,522 | 2,480 |
| 1963–64 | 1,425 | 2,676 | 2,636 |
| 1964–65 | 1,512 | 2,840 | 2,786 |
There are two advantages in compiling these two important national income aggregates in constant prices. In the first place the elimination of price movements from them, as from any other national income data, does give a better idea of changes in their real value from year to year; second, expressing a volume of production index in value terms, in this instance constant values, does enable it to be compared with other economically significant statistics expressed in similar values. This gives a further dimension to the statistics that an index number alone does not possess, and thereby adds to their usefulness as economic statistics.
Gross domestic product is the value of all goods and services produced by the economy during the year. The total value of goods and services available for internal use either for personal consumption, Government use, capital formation or stock accumulation can be obtained by deducting from the total gross domestic product at current prices, that portion which is exported, and adding the value of goods and services imported. In the following table exports and imports of goods and services are also derived from the Official Estimates of National Income and Expenditure.
| Year | Gross Domestic Product | Exports of Goods and Services | Imports of Goods and Services | Value of Goods and Services Available* |
|---|---|---|---|---|
* This is also called gross domestic expenditure. | ||||
| $(m) | ||||
| 1954–55 | 1,878 | 506 | 556 | 1,928 |
| 1955–56 | 1,984 | 566 | 602 | 2,020 |
| 1956–57 | 2,082 | 594 | 596 | 2,084 |
| 1957–58 | 2,204 | 592 | 658 | 2,270 |
| 1958–59 | 2,298 | 576 | 578 | 2,300 |
| 1959–60 | 2,458 | 670 | 548 | 2,336 |
| 1960–61 | 2,662 | 630 | 682 | 2,714 |
| 1961–62 | 2,756 | 634 | 694 | 2,816 |
| 1962–63 | 2,974 | 668 | 652 | 2,958 |
| 1963–64 | 3,258 | 788 | 760 | 3,230 |
| 1964–65 | 3,580 | 822 | 794 | 3,552 |
Just as gross domestic product and gross national product corrected for price changes are better indicators of the volume of production and the level of economic growth, so also if the goods and services available for internal use are expressed in constant prices, a better idea of the volume of goods and services available, and the economic welfare of the country can be obtained. Therefore, in the following table, corrections are made to eliminate price changes from the value of imports and exports, so that the value of goods and services available, in 1954–55 prices, can be obtained from gross domestic product also in 1954–55 prices.
| Year | Gross Domestic Product at 1954–55 Prices | Exports of Goods and Services at 1954–55 Prices | Imports of Goods and Services at 1954–55 Prices | Goods and Services* Available for Use at 1954–55 Prices |
|---|---|---|---|---|
* This is also called gross domestic expenditure. | ||||
| $(m) | ||||
| 1954–55 | 1,878 | 506 | 556 | 1,928 |
| 1955–56 | 1,948 | 568 | 584 | 1,964 |
| 1956–57 | 1,986 | 592 | 562 | 1,956 |
| 1957–58 | 2,088 | 596 | 612 | 2,104 |
| 1958–59 | 2,146 | 662 | 550 | 2,034 |
| 1959–60 | 2,232 | 680 | 530 | 2,082 |
| 1960–61 | 2,368 | 658 | 650 | 2,360 |
| 1961–62 | 2,448 | 706 | 656 | 2,398 |
| 1962–63 | 2,522 | 738 | 636 | 2,420 |
| 1963–64 | 2,676 | 782 | 740 | 2,634 |
| 1964–65 | 2,840 | 750 | 770 | 2,860 |
Although a comparison of the gross domestic product with the value of goods available gives some indication as to whether or not the country is living within its means, the omission of certain balance of payments data, notably transactions in investment income and unilateral transfers, does limit its value. On the other hand, if exports and imports are corrected for price changes and compared with the gross domestic product in constant prices, this provides a useful measure of welfare in the volume of goods and services available for internal use.
It can be seen from the preceding table that the volume of exports has increased more than the volume of imports, over the 10–year period, but the rate of increase of the volume of imports in the last two years has exceeded that of exports, a period in which there was a marked improvement in the terms of trade for New Zealand. The following table assesses movements caused by changes in the terms of trade, by showing gross domestic product at constant prices corrected for the terms of trade. By making this correction to the gross domestic product at 1954–55 prices, a much better picture can be obtained of the purchasing power, both here and abroad, of the income it represents.
| Year | Gross Domestic Product at 1954–55 Prices | Exports of Goods and Services at 1954–55 Prices | Exports of Goods and Services Corrected for the Terms of Trade | Effective Gross Domestic Product |
|---|---|---|---|---|
| $(m) | ||||
| 1954–55 | 1,878 | 506 | 506 | 1,878 |
| 1955–56 | 1,948 | 568 | 552 | 1,932 |
| 1956–57 | 1,986 | 592 | 564 | 1,958 |
| 1957–58 | 2,088 | 596 | 548 | 2,040 |
| 1958–59 | 2,146 | 662 | 538 | 2,022 |
| 1959–60 | 2,232 | 680 | 638 | 2,190 |
| 1960–61 | 2,368 | 658 | 592 | 2,302 |
| 1961–62 | 2,448 | 706 | 594 | 2,336 |
| 1962–63 | 2,527 | 738 | 646 | 2,430 |
| 1963–64 | 2,676 | 782 | 748 | 2,642 |
| 1964–65 | 2,840 | 750 | 778 | 2,868 |
From gross domestic product at constant prices there is deducted that portion which is exported and added back the amount of imports that can be exchanged for these exports. By comparing the gross domestic product at 1954–55 prices with the corrected figures it is seen that there was a steady loss in purchasing power of the gross domestic product over the years to 1962–63, the worst years being a loss of $124 million in 1958–59, a loss of $112 million in 1951—62, and a loss of $92 million in 1962–63. A sharp upward movement in export prices in 1963–64 cut the loss to $34 million for 1963–64, and the continued improvement in the export price index, which rose at a faster rate than the import price index in 1964–65, has resulted in a gain in the purchasing power of the gross domestic product in 1964–65 for the first year during the series.
The final table uses figures shown in previous tables. It is intended to be a summary of the previous paragraphs and to enable the significant aggregates to be compared one with another.
| Year | Gross Domestic Product Current Prices | Gross Domestic Product 1954–55 Prices | Exports of Goods and Services at 1954–55 Prices | Exports of Goods and Services Corrected for the Terms of Trade | Imports of Goods and Services at 1954–55 Prices | Effective Gross Domestic Product | Goods and Services* Available for Use at 1954–55 Prices |
|---|---|---|---|---|---|---|---|
* This is also called gross domestic expenditure. | |||||||
| $(m) | |||||||
| 1954–55 | 1,878 | 1,878 | 506 | 506 | 556 | 1,878 | 1,928 |
| 1955–56 | 1,984 | 1,948 | 568 | 552 | 584 | 1,932 | 1,964 |
| 1956–57 | 2,082 | 1,986 | 592 | 564 | 562 | 1,958 | 1,956 |
| 1957–58 | 2,204 | 2,088 | 596 | 548 | 612 | 2,040 | 21,04 |
| 1958–59 | 2,298 | 2,146 | 662 | 538 | 550 | 2,022 | 2,034 |
| 1959–60 | 2,458 | 2,232 | 680 | 638 | 530 | 2,190 | 2,082 |
| 1960–61 | 2,662 | 2,368 | 658 | 592 | 650 | 2,302 | 2,360 |
| 1961–62 | 2,756 | 2,448 | 706 | 594 | 656 | 2,336 | 2,398 |
| 1962–63 | 2,974 | 2,522 | 738 | 646 | 636 | 2,430 | 2,420 |
| 1963–64 | 3,258 | 2,676 | 782 | 748 | 740 | 2,642 | 2,634 |
| 1964–65 | 3,580 | 2,840 | 750 | 778 | 770 | 2,868 | 2,860 |
Gross Domestic Product at Current Prices is the total value of goods and services produced by the national economy in any particular year.
Gross Domestic Product at 1954–55 Prices is the gross domestic product from which price changes since the base year have been eliminated to enable its real value in terms of goods and services to be evaluated.
Exports of Goods and Services at 1954–55 Prices is that portion of the gross domestic product at constant prices which is exported.
Exports of Goods and Services Corrected for the Terms of Trade—This is the value of imports at base year prices (i.e., 1954–55) that can be obtained in exchange for the year's exports.
Imports of Goods and Services at 1954–55 Prices—This is the value of goods and services at base year prices that were actually imported during the year.
Effective Gross Domestic Product—This is the gross domestic product at 1954–55 prices to which a correction has been made to allow for the purchasing power in overseas markets of that portion which is exported. The correction is the same as that used to adjust exports of goods and services for changes in the terms of trade.
Goods and Services Available for Use at 1954–55 Prices is obtained by deducting exports of goods and services from the gross domestic product at 1954–55 prices and adding imports of goods and services at 1954–55 prices (This is also called gross domestic expenditure).
While all these figures cannot be regarded as exact measures, they reveal certain trends in the national economy. Thus while it can be said that production and productivity have grown steadily over the last 10 years, deterioration in export prices and hence in the terms of trade reduced the benefits of increased production up to 1962–63. The sharp upward movement in export prices in 1963–64 considerably improved the terms of trade in that year as compared with earlier years, and another increase in the export price index, greater than in the import price index, during 1964–65, resulted in a favourable terms of trade balance for 1964–65, on base 1954–55.
Thus, in the last two years, the effective gross domestic product has increased successively, by 8.7 and 8.6 percent, while the gross domestic product at 1954–55 prices rose by only 6.1 percent in each of the two years.
Table of Contents
SOILS AND LAND USE—Soil is the product of its environment—of the rock waste which is the parent material, of the climate under which it weathers, of the kind of topography upon which it is situated, of the vegetation under which it develops, and of the length of time during which it has been developing. In New Zealand, the wide variety of conditions under which the many kinds of rock are transformed into soil results in a complex pattern. Yet it is a complexity showing regularities and relationships that enable the soils to be grouped and classified. The conditions that control soil formation tend also to govern the kind of land use. Thus a close relationship between soils and land use arises in two ways—from characteristics inherent in the soils themselves and from environmental factors such as the climate and topography. Maps showing the pattern of soils and of land use are published in A Descriptive Atlas of New Zealand (1959). Soils are shown in two divisions: (a) zonal soils, and (b) intrazonal and azonal soils; and descriptions of the location, properties, and productive capacities of the different soil types in New Zealand are now given.
Zonal Soils—If the soils formed from unusual parent materials, e.g., volcanic ash, and those occupying special sites, such as steep slopes and swampy hollows, are set aside, a simple pattern of zonal soils is revealed. It consists of the brown-grey earths of the semi-arid areas where the rainfall is less than about 20 inches a year; the yellow-grey earths of subhumid areas where the rainfall is approximately 20–40 inches a year; the northern, central and southern, and high-country yellow-brown earths respectively of the humid regions where the rainfall is well distributed and a greater than approximately 40 inches a year; and the podzolised yellow-brown earths and podzols where an acid litter of decomposing vegetation and high rainfall results in excessive leaching. Zonal soils comprise 18 million of the country's 66 million acres.
The brown-grey earths (1 1/2 m; 1/2 m acres*) occupy the dry inter-montane basins of Central Otago and the Mackenzie Plains where rainfall is insufficient for plant requirements for most of the year. They are generally rich in plant nutrients and are weakly acid to alkaline, in places with salty patches. Many of them are stony. Their chief need is more water but irrigation must be practised with care to avoid waterlogging or spreading salts. They produce fine wool and store sheep and, where irrigated, fat lambs; lucerne is grown and, in favoured spots, stone fruits and brassica and other seed crops.
The yellow-grey earths (2 1/2 m; 3/4 m acres) are the seasonally dry soils of southern Otago, Canterbury, Wairarapa, Hawke's Bay, and Manawatu, where rainfall is inadequate for plant growth for a third to half of the year. They are moderately to weakly acid, and the older soils have a thick hard silt-pan in the subsoil. Fat-lamb farming is the principal use with mixed arable farming on the drier soils and some dairying on the moister soils. Stony soils related to the yellow-grey earths (1 1/2m acres) cover much of Canterbury Plains; they are used for sheep farming including fat lambs; with irrigation, they carry over four ewes per acre and grow cereal and pasture seed crops.
* Where two areas are given in parentheses after particular types of soil they refer to easy and hilly land respectively, and are usually expressed in millions of acres.
The rainfall of the yellow-brown earths is usually adequate for plant growth for most of the year. The high-country yellow-brown earths (1/2 m; 1 m acres) of the cold upland basins east of the Southern Alps are developed under tussock at high elevations. They have yellow friable subsoils and are moderately acid and strongly leached. Where oversown with clovers they respond to molybdenised superphosphate and sulphur. They are used mostly for wool production and some store sheep. The southern and central yellow-brown earths (2 m; 4 1/2 m acres) of the cool and mild districts like Southland and Wellington were formed under forest and have nutty subsoils. When sown to pasture with lime and superphosphate (in places molybdenised), they are used for dairying and fat lambs on the rolling land, and for wool production, store stock, and some fat lambs on the more hilly slopes. Cattle are also run to help control pasture growth and prevent its reversion to scrub and fern. The associated podzolised yellow-brown earths and podzols (140,000; 200,000 acres) are best developed in Southland. They are formed under rimu-kamahi forest and are very strongly leached with grey acid structureless topsoils and with iron pans in the subsoils in places. They are being brought into pasture for sheep and cattle grazing. Waterlogged counterparts of these soils, the grey podzols or “pakihi soils” (3/4 m; 100,000 acres) in Westland where the rainfall is 100 inches or so per year. They have structureless subsoils and their chief problem is one of drainage to remove the excess water. They are difficult to utilise once the forest has been removed. The northern yellow-brown earths (1/2 m; 3/4 m acres), formed under mixed forest in the warm moist climate of North Auckland, are mostly heavy clays. The more fertile soils are moderately acid but support good pastures when topdressed with lime and phosphate, in places molybdenised; the rolling land is used for dairying and fat lambs, the hills for sheep and cattle grazing. The less fertile soils support fair pastures when topdressed with lime and superphosphate; on the easier land many dairy- and fat-lamb farms are situated, but pastures on the hill country are less easy to maintain.
The northern podzolised yellow-brown earths and podzols (1/2 m; 300,000 acres) have thin grey structureless topsoils overlying a grey siliceous horizon, and are strongly acid and very low in plant nutrients. Where formed under kauri they are know as “gumlands”. In places, especially where the soils are sandy, farming should be approached with caution because subsoil pans of humus and iron impede drainage; otherwise the fertilisers and soils can be made to support good dairy pastures.
Intrazonal and Azonal Soils—The intrazonal soils include the soils from less-common parent materials and those influenced by high ground water; and the azonal soils are youthful owing to recent renewal by sedimentation, volcanic eruptions, or erosion.
Rendzina and other lime-rich soils, mostly from limestones, occur both in subhumid areas (100,000 acres) such as near Oamaru, in North Canterbury, and in Hawke's Bay, and in the humid areas (1/4 m acres) particularly North Auckland. They are fertile, with deep, dark granular topsoils. In the drier areas, they are used for intensive arable farming and sheep farming and, near Oamaru, for poultry farming; in the humid areas, for dairying and fat lambs.
The yellow-brown sands (3/4 m acres), from coastal sand drifts of various ages, occur on sandhills which dry out excessively in summer and on sand plains where ground water approaches the surface in winter. The drier soils are for grazing; the soils with moister subsoils, after fertilising with phosphate and potash, are used for sheep farming and dairying. Where the subsoils are loose, blowing is a problem.
The yellow-brown pumice soils (2m acres) of central North Island are formed mostly of two volcanic ash showers that fell 800 and 1,700 years ago. Their topsoils are mostly sand or sandy loams, and the subsoils pumice sands and gravels. Because the cattle and sheep became bush sick these areas were difficult to farm for many years and large areas were planted in exotic forests. However, the ailment is now overcome by topdressing with cobaltised superphosphate and, except where droughty, the soils can be converted into good farmland. In addition to phosphate they need consolidation and, after continued use, potash topdressing. The yellow-brown loams (4 m acres) are derived mostly from fine-textured ashes eruped by volcanoes in central North Island and by Mount Egmont and occur around the margin of the younger pumice soils. They are very friable loamy soils, respond well to superphosphate topdressing, and give slight to good responses to limes; potash responses are expected to increase with continued use. The soils are used mainly for dairying and fat-lamb production.
The red and brown loams and brown granular clays (1 1/4 m acres) are formed from basalts and adesites and are rich in iron and aluminium. They are friable soils with strong structure and a marked power to fix phosphates. The younger, more fertile soils (1/2 m; 1/4 m acres) respond to superphosphate and lime, those from basalt also respond to potash; they are used for dairying, fat-lamb production, and sheep grazing, and in places for market gardens and orchards. The older soils have lower natural fertility and include the strongly acid granular soils and the moderately acid ironstone soils; they carry fair pastures when topdressed with lime, phosphate, and potash and, on the acid soils, with molybdenised superphosphate.
The organic soils (1/2 m acres) are peaty and occur mostly in the Auckland district. Where mellow and fertile they can be farmed satisfactorily, but the peats of acid bogs require special treatment.
The gley soils (3/4 m acres) are formed under the influence of groundwater which causes the formation of grey subsoils commonly mottled with rust colours. They, too, occur mostly in the Auckland district, and when drained are used for dairying and fat-lamb production.
Recent soils from alluvium (1 1/2 m acres) are formed from flood sediments on river flats. For the most part they are fertile, deep loams, but some are gravelly with excessive drainage. They are used mainly for fat lambs and dairying; also, in drier areas, for cereals, pasture and vegetable seed crops, pulse crops for canning, pip and stone fruits, small fruits, and tobacco.
Recent soils from volcanic ash (1 3/4 m acres) occur mostly around the active volcanoes of Ngauruhoe and Ruapehu, and also around Mount Tarawera. Where they cover the pumice soils their cobalt content offsets the deficiency in the pumice.
Steepland soils occupy about half the area of New Zealand, being most extensive on the axial ranges, and in the north-west Nelson and east Taranaki. Although showing characters related to the zone where they occur they are for the most part shallow and their subsoils vary widely in fertility according to the underlying rock. They are relatively unstable and are periodically renewed by erosion. When the plant cover is disturbed by man the erosion is accelerated and the results affect not only the hillsides but also the rivers and river flats. Areas occupied by these soils are: steepland brown-grey earths, 1/2 m acres; steepland yellow-grey earths, 1/2 m acres; high-country steepland yellow-brown earths, 4 1/2 m acres; other steepland yellow-brown earths, 14 m acres (including 2 m with high natural fertility), and podzolised steepland soils, 6 3/4 m acres. The podzolised steepland soils are largely in forest, and occur mainly in western Nelson, Westland, and western Southland, at altitudes from 5,000 ft in the north to 3,000 ft in the south. Above these levels there are 2 3/4 m acres of poor wet soils largely in subalpine scrub and tussock, and grading up to the alpine barrens (3 3/4 m acres) at elevations where vegetation is sparse or absent and much bare rock and ice are present.
New Approach to Land Use—The rapid increase in knowledge of the soils of New Zealand has brought about a change in approach to land use. In the early thirties the use of land was still guided by the art of judging its capabilities from external appearances and a general knowledge of farming and local conditions. This method had its success but in places failed badly, for example, in parts of the country, pastures could not be maintained and farm land was abandoned. The need for solving such problems led to the improvement in ways of recognising and mapping the soils so that their properties and uses could be determined. Today, land use is guided for the most part by the capabilities of the soil type as revealed by investigation. The reliability of predictions made in this way has stimulated the rapid conversion of large areas of “problem” land into good farms and has raised land use to a new pitch of efficiency. It reflects the modern swing from farming as a traditional art to farming as an up-to-date science.
NATURE OF FARMING—The natural tussock grassland, which occurs mainly on the hilly and mountainous country to the east of the Main Divide of the South Island, is used for extensive pastoral fanning, where the main product is wool and in some instances store sheep, while on the less steep country, particularly in the North Island where there is surface-sown grassland, both store sheep and cattle are additional products. The third type of grassland, that sown after ploughing, is found on the flat and gently undulating country of both Islands and is used mainly for the production of meat and dairy produce. Here farmers have exploited the use of certified strains of grasses and clovers, phosphatic fertilisers, lime and trace elements. However, with the advent of mechanisation, and, more particularly, the use of aircraft for topdressing hill pastures, considerable areas of surface-sown grassland have been topdressed in recent years. This treatment of country otherwise inaccessible to normal topdressing methods, coupled with oversowing of grass, is resulting in considerable improvement to hill pasture, with a consequent increase in carrying capacity and production.
The North Island—Many parts of the North Island have proved very suitable for dairying because of the temperate climate, a fairly high rainfall well distributed over the year, and land reasonably flat and of average to good quality. Approximately 90 percent of the total dairy stock in the country are grazed on the flat and undulating land of Northland, Central Auckland, South Auckland – Bay of Plenty, Taranaki, and Wellington Statistical Areas. Pastures of high feeding value form the basis of the industry and carrying capacity may be as high as one cow per acre, and annual production as high as 200 to 350 lb of butterfat per acre. The main winter supplementary feed is hay and silage made from the surplus spring and early summer growth of the pastures. In most of the dairying areas fat-lamb raising is associated with dairying, particularly in the Waikato and the Bay of Plenty. Sheep farming is carried on throughout the Island, but is most concentrated in Rangitikei-Manawatu and on the eastern section from the Wairarapa, through Hawke's Bay, to the hill country north of Gisborne.
The South Island—Sheep farming is practised in practically all parts of the Island east of the Southern Alps. The tussock grasslands, particularly on the higher parts, carry about one sheep to 10 acres, whereas improved pastures heavily topdressed carry six or more sheep to the acre. On the easier hill country, in addition to returns from wool, a considerable portion of the revenue comes from the sale of store sheep, which are purchased by the farmers on the plains and undulating country for fattening and for flock-replacement purposes.
On the plains and downlands of Canterbury and in parts of Marlborough, Otago, and Southland, where the climate and soils are suitable, arable mixed farming is a feature. Approximately 19 percent of New Zealand's wheat, oats, and barley acreage is in these districts. On the majority of the cereal-producing farms sheep and lambs are also fattened. Considerable areas (approximately three-quarters of the New Zealand acreage) of rape, kale, turnips, and swedes are grown for summer and winter supplementary feed.
Dairying is very localised and is concentrated near the cities to cater for whole-mil, requirements. Districts where herds are run for dairy-factory supply are the plains areas of Southland; parts of Nelson and Westland; and Banks Peninsula, in Canterbury. Less than 8 percent of the dairy cows are in the South Island, and approximately one-sixth of the beef cattle.
CLASSIFICATION OF HOLDINGS BY PRINCIPAL FARMING ENTERPRISES—The collection of farm production statistics in 1960 was carried out as New Zealand's part of the World Census of Agriculture. Detailed information has been published separately in the report of the New Zealand Census of Agriculture, 1959–60.
For purposes of fuller analysis of the New Zealand results than is customarily given in Statistical Area (previously Land District) tables, counties with some affinity as to farming types, etc., have been regrouped to form what have been designated “Regional Areas”, and certain tables given in Sections 14B and 14C of this volume are set out on this basis. The following sets out in detail the content of these regional areas.
| Regional Area | Counties Included (as at 1960) |
|---|---|
| Northland | Mangonui, Whangaroa, Hokianga, Bay of Islands, Whangarei, Hobson, Otamatea, Rodney, Waitemata. |
| South Auckland | Manukau, Franklin. Raglan. |
| Waikato and Hauraki Lowlands | Waikato, Waipa, Otorohanga, Hauraki Plains, Piako, Matamata. |
| Cape Colville | Great Barrier, Coromandel, Thames, Ohinemuri. |
| Central Plateau | Tauranga, Rotorua, Taupo, Whakatane. |
| Westland Uplands | Waitomo, Taumarunui, Clifton, Waimarino. |
| Taranaki | Taranaki, Inglewood, Egmont, Stratford, Eltham, Waimate West, Hawera. |
| East Cape | Opotiki, Matakaoa, Waiapu, Uawa, Waikohu, Cook. |
| Hawke's Bay | Wairoa, Hawke's Bay, Waipawa, Waipukurau, Patangata. |
| Rangitikei | Patea, Waitotara, Wanganui, Rangitikei, Kiwitea, Pohangina. |
| Manawatu | Dannevirke, Woodville, Oroua, Manawatu, Kairanga, Horowhenua, Pahiatua. |
| Wairarapa | Eketahuna, Mauriceville, Masterton, Wairarapa South, Akitio. |
| Featherston | Hutt, Makara, Featherston. |
| Nelson | Waimea, Golden Bay, Buller, Murchison, Inangahua. |
| Marlborough | Sounds, Marlborough, Awatere, Kaikoura. |
| Westland | Grey, Westland. |
| North Canterbury | Amuri, Cheviot, Waipara. |
| Foothills | Ashley, Oxford, Tawera, Selwyn. |
| Canterbury Plains | Kowai, Rangiora, Eyre, Malvern, Paparua, Springs, Ellesmere. |
| Christchurch | Waimairi, Heathcote, Halswell. |
| Banks Peninsula | Mount Herbert, Akaroa, Wairewa. |
| Mackenzie | Mackenzie. |
| South Canterbury | Ashburton, Geraldine, Levels, Waimate, Waitaki. |
| Otago | Waihemo, Waikouaiti, Peninsula, Taieri, Tuapeka. |
| Central Otago | Maniatoto, Vincent, Lake. |
| Southern | Bruce, Clutha, Southland, Wallace. |
| Remainder | Chatham Islands, Stewart Island. |
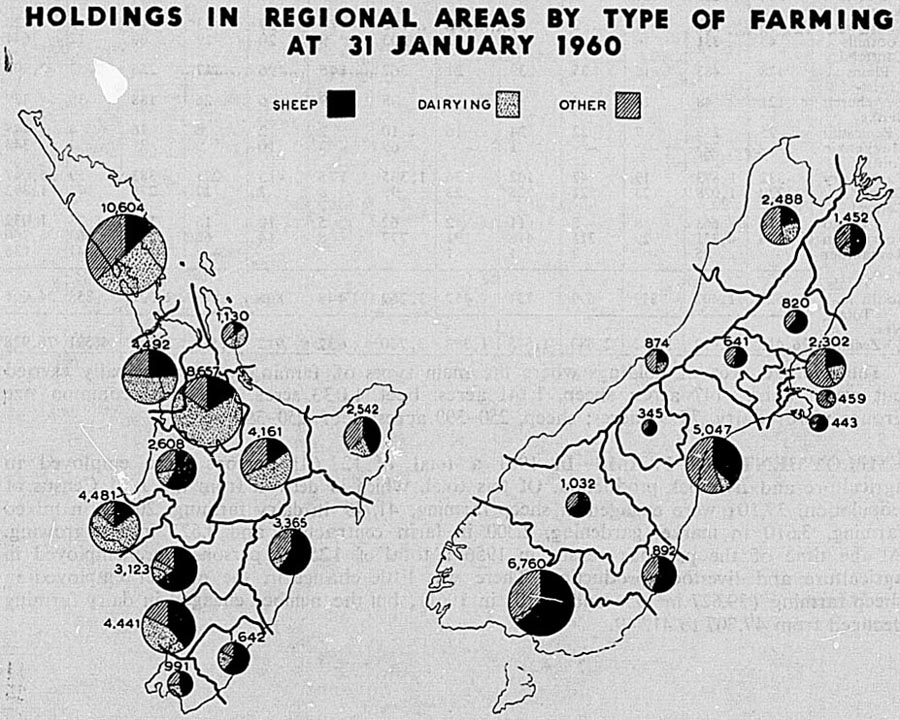
HOLDINGS IN REGIONAL AREAS BY TYPE OF FARMING AT 31 JANUARY 1960
Figures for 1959–60 as to the number of holdings of various principal types of farming enterprises in the several regional areas (each Island separately) are here presented. (“Principally” means 75 percent or more; “predominant” means 50–74 percent; “mixed” means approximately equal; “general mixed” covers three or more types with none predominant.)
| Regional Area | Principally Dairy Farming | Principally Sheep Farming | Principally Beef Farming | Dairy and Sheep with Dairy Predominant | Sheep and Dairy with Sheep Predominant | Mixed Dairy and Sheep | Sheep and Cropping with Sheep Predominant | Cropping and Sheep with Cropping Predominant | Mixed Sheep and Cropping | General Mixed Farming | Other (including Horticulture, Timber, etc.) | Idle and Unused | Total |
|---|---|---|---|---|---|---|---|---|---|---|---|---|---|
| Northland | 5,397 | 1,371 | 492 | 382 | 91 | 165 | 8 | 1 | 1 | 158 | 981 | 1,557 | 10,604 |
| South Auckland | 2,357 | 1,081 | 127 | 167 | 60 | 49 | 12 | 14 | 3 | 64 | 317 | 241 | 4,492 |
| Waikato and Hauraki Low-lands | 5,962 | 1,382 | 128 | 374 | 107 | 117 | 5 | 3 | 1 | 74 | 232 | 272 | 8,657 |
| Cape Colville | 589 | 157 | 27 | 69 | 20 | 25 | – | – | – | 21 | 54 | 168 | 1,130 |
| Central Plateau | 2,126 | 668 | 54 | 228 | 62 | 103 | 14 | 2 | 2 | 46 | 380 | 476 | 4,161 |
| Western Uplands | 342 | 1,556 | 28 | 130 | 86 | 82 | 15 | 4 | 2 | 40 | 101 | 222 | 2,608 |
| Taranaki | 3,209 | 666 | 22 | 166 | 60 | 98 | 6 | – | 3 | 45 | 104 | 102 | 4,481 |
| East Cape | 539 | 1,068 | 56 | 84 | 26 | 46 | 66 | 58 | 36 | 92 | 201 | 270 | 2,542 |
| Hawke's Bay | 257 | 2,045 | 47 | 46 | 52 | 55 | 119 | 85 | 37 | 59 | 358 | 205 | 3,365 |
| Rangitikei | 554 | 2,017 | 39 | 91 | 98 | 79 | 99 | 1 | 7 | 39 | 46 | 53 | 3,123 |
| Manawatu | 1,920 | 1,733 | 62 | 137 | 117 | 121 | 70 | 13 | 8 | 35 | 150 | 75 | 4,441 |
| Wairarapa | 361 | 1,010 | 3 | 74 | 39 | 34 | 49 | 3 | 5 | 10 | 40 | 14 | 1,642 |
| Featherston | 275 | 454 | 8 | 33 | 23 | 12 | 28 | – | 1 | 6 | 73 | 78 | 991 |
| Totals, North Island | 23,888 | 15,208 | 1,093 | 1,981 | 841 | 986 | 491 | 184 | 106 | 689 | 3,037 | 3,733 | 52,237 |
| Marlborough | 202 | 724 | 10 | 47 | 18 | 14 | 170 | 21 | 62 | 39 | 89 | 56 | 1,452 |
| Nelson | 625 | 548 | 64 | 129 | 59 | 70 | 87 | 50 | 34 | 148 | 507 | 167 | 2,488 |
| Westland | 214 | 227 | 137 | 65 | 9 | 16 | – | – | 1 | 9 | 80 | 116 | 874 |
| North Canterbury | 15 | 507 | 4 | 2 | 9 | 8 | 188 | 13 | 29 | 23 | 19 | 3 | 820 |
| Foothills | 45 | 331 | 6 | 9 | 16 | 11 | 103 | 9 | 20 | 19 | 60 | 12 | 641 |
| Canterbury Plains | 478 | 483 | 18 | 35 | 39 | 21 | 362 | 145 | 196 | 217 | 256 | 52 | 2,302 |
| Christchurch | 121 | 48 | 14 | 4 | 2 | 3 | 8 | 9 | 6 | 26 | 188 | 30 | 459 |
| Banks Peninsula | 75 | 259 | 7 | 22 | 24 | 16 | 10 | 2 | 2 | 6 | 16 | 4 | 443 |
| Mackenzie | – | 225 | – | – | 1 | – | 69 | 3 | 10 | 9 | 21 | 7 | 345 |
| South Canterbury | 332 | 1,873 | 19 | 47 | 102 | 36 | 1,335 | 175 | 415 | 271 | 383 | 59 | 5,047 |
| Otago | 230 | 1,078 | 23 | 21 | 25 | 23 | 98 | 8 | 7 | 27 | 278 | 74 | 1,892 |
| Central Otago | 16 | 663 | 8 | 5 | 11 | 2 | 62 | 5 | 10 | 15 | 162 | 73 | 1,032 |
| Southern | 174 | 4,351 | 29 | 311 | 418 | 191 | 777 | 8 | 14 | 66 | 257 | 164 | 6,760 |
| Remainder | – | 85 | – | 2 | 1 | 1 | – | – | – | – | 6 | 41 | 136 |
| Totals, South Is. | 2,527 | 11,402 | 339 | 699 | 734 | 412 | 3,269 | 448 | 806 | 875 | 2,322 | 858 | 24,691 |
| Totals, New Zealand | 26,415 | 26,610 | 1,432 | 2,680 | 1,575 | 1,398 | 3,760 | 632 | 912 | 1,564 | 5,359 | 4,591 | 76,928 |
The average area of holdings where the main types of farming were principally carried out were: dairy, 147 acres; sheep, 1,141 acres; beef, 1,033 acres. The most common size groups were: dairy, 75–99 acres; sheep, 250–399 acres; beef, 250–399 acres.
EMPLOYMENT ON FARMS—In 1961 a total of 121,641 persons were employed in agriculture and livestock production. Of this total, which is derived from the 1961 Census of population, 39,101 were engaged in sheep farming, 41,749 in dairy farming, 20,622 in mixed farming, 3,610 in market gardening, 2,300 in farm contracting, and 3,627 in fruitgrowing. At the time of the previous census in 1956 a total of 125,692 persons were employed in agriculture and livestock production. There was little change in the number employed in sheep farming (39,627 in 1956 and 39,101 in 1961), but the number engaged in dairy farming declined from 47,307 to 41,749.
Of the 39,101 persons engaged in 1961 in sheep farming 10,396 were employers, and 9,324 were farming on their own account. Comparable figures in 1956 were 11,284 employers and 9,421 farming on own account. In dairy farming the number of employers declined from 10,969 in 1956 to 9,126 in 1961, while the number farming on their own account declined from 20,965 to 13,749.
Wage and salary earners in the sheep farming industry numbered 18,515 in 1956 and 19,000 in 1961. In the dairy farming industry they numbered 14,445 in 1956 and 18,209 in 1961, an increase in wage and salary earners partly offsetting the decline in the number of persons fanning on their own account in this industry.
The following table is based on occupations recorded at the 1961 Census. The number of persons engaged in farming occupations does not coincide exactly with the number employed in the farming industry. A number of persons engaged in farming occupations would be employed in other industries, and on the other hand, a number of persons in non-farming occupations would be employed in the farming industry. For example, gardeners are included under farm occupations, but a number are employed in gardens attached to factories, and so will be included in the labour force of manufacturing industries. Examples of people in non-farming occupations who may be employed in the farming industry are accountants, cooks, and pilots of topdressing planes. However, with these minor qualifications, the table does give a broad picture of the occupations of those engaged in the farming industry at the Population Census of 1961.
| Major Groups and Selected Occupations | Males | Females | Total |
|---|---|---|---|
| Farmers and farm managers— | |||
| Dairy farmer | 23,614 | 1,111 | 24,725 |
| Sheep farmer, station owner, run holder | 22,042 | 638 | 22,680 |
| Farmer in mixed farming | 13,072 | 454 | 13,526 |
| Farmer or settler, n.o.d. | 614 | 43 | 657 |
| Farm manager, foreman, or overseer | 553 | 8 | 561 |
| Market gardener | 1,879 | 167 | 2,046 |
| Orchardist, fruitgrower | 1,344 | 57 | 1,401 |
| Poultry farmer | 984 | 230 | 1,214 |
| Nurseryman | 578 | 85 | 663 |
| Cattle farmer, grazier | 354 | 21 | 375 |
| Sharemilker | 4,514 | 355 | 4,869 |
| Wheat or other grain grower, agricultural farmer | 349 | 10 | 359 |
| Other | 1,426 | 92 | 1,518 |
| Totals | 71,323 | 3,271 | 74,594 |
| Other farm occupations— | |||
| Farm labourer, n.o.d. | 23,228 | 1,303 | 24,531 |
| Landgirl | … | 1,040 | 1,040 |
| Relative assisting on farm | 371 | 213 | 584 |
| Orchard hand, n.o.d. | 854 | 180 | 1,034 |
| Shepherd, musterer | 3,941 | 32 | 3,973 |
| Shearer | 2,071 | 9 | 2,080 |
| Milker | 257 | 863 | 1,120 |
| Fencer | 1,408 | 2 | 1,410 |
| Tractor driver | 1,407 | 2 | 1,409 |
| Farm contractor, n.o.d. | 738 | 6 | 744 |
| Gardener, jobbing or n.o.d. | 2,043 | 101 | 2,144 |
| Poultry farm worker | 236 | 97 | 333 |
| Market garden hand | 1,035 | 537 | 1,572 |
| Other | 4,653 | 1,638 | 6,291 |
| Totals | 42,242 | 6,023 | 48,265 |
| Totals, all farm occupations | 113,565 | 9,294 | 122,859 |
| n.o.d. — not otherwise defined. | |||
GROSS FARMING INCOME—Gross fanning income is the value of the output of the fanning sector. A description of this statistical series was given in the 1966 and earlier issues of the Yearbook.
The following table shows the figures of gross farming income for the past 16 production seasons as well as for the pre-war year 1938–39. The second part of this table gives the relative contributions of each of the seven groups in each year in the form of percentages of the total of all farm production.
| Year | Farm Group | |||||||
|---|---|---|---|---|---|---|---|---|
| Grain and Field Crops | Horticulture, Poultry, and Bees | Wool | Mutton and Lamb | Beef | Dairying | Pigs | Total | |
* Provisional. | ||||||||
| $(million) | ||||||||
| 1938–39 | 9.4 | 12.6 | 18.6 | 24.4 | 13.2 | 56.6 | 4.8 | 139.6 |
| 1950–51 | 25.0 | 30.0 | 227.2 | 131.4 | 24.2 | 136.4 | 8.4 | 582.6 |
| 1951–52 | 22.6 | 39.0 | 108.8 | 77.6 | 27.0 | 152.2 | 9.4 | 436.6 |
| 1952–53 | 23.8 | 40.6 | 128.0 | 93.6 | 44.6 | 180.0 | 11.8 | 522.4 |
| 1953–54 | 32.4 | 38.8 | 142.4 | 104.8 | 36.2 | 178.6 | 11.4 | 544.6 |
| 1954–55 | 31.8 | 41.4 | 151.6 | 112.0 | 44.8 | 169.0 | 11.2 | 561.8 |
| 1955–56 | 32.2 | 41.6 | 143.0 | 111.6 | 36.8 | 177.0 | 12.4 | 554.6 |
| 1956–57 | 29.6 | 45.0 | 183.0 | 124.0 | 41.8 | 179.2 | 11.4 | 614.0 |
| 1957–58 | 29.6 | 45.2 | 137.8 | 117.8 | 63.0 | 187.6 | 11.8 | 592.8 |
| 1958–59 | 31.8 | 43.6 | 130.4 | 106.0 | 67.4 | 172.8 | 12.2 | 564.2 |
| 1959–60 | 39.2 | 47.0 | 169.4 | 99.2 | 68.0 | 187.4 | 13.2 | 623.4 |
| 1960–61 | 42.2 | 50.4 | 158.2 | 109.2 | 55.0 | 184.6 | 14.2 | 613.8 |
| 1961–62 | 42.2 | 55.8 | 153.8 | 92.6 | 59.6 | 175.8 | 15.0 | 594.8 |
| 1962–63 | 43.4 | 57.0 | 180.4 | 107.8 | 68.8 | 180.6 | 16.0 | 654.0 |
| 1963–64 | 50.0 | 62.4 | 230.2 | 131.2 | 74.4 | 198.2 | 17.0 | 763.6 |
| 1964–65 | 48.6 | 69.6 | 172.8 | 167.0 | 87.2 | 229.4 | 17.6 | 792.2 |
| 1965–66* | 50.6 | 74.2 | 193.2 | 169.2 | 96.4 | 247.6 | 15.6 | 846.8 |
| Percentages of Total Income | ||||||||
| 1938–39 | 7 | 9 | 13 | 17 | 9 | 41 | 3 | 100 |
| 1949–50 | 6 | 8 | 26 | 19 | 5 | 34 | 2 | 100 |
| 1950–51 | 4 | 5 | 39 | 23 | 4 | 23 | 1 | 100 |
| 1951–52 | 5 | 9 | 25 | 18 | 6 | 35 | 2 | 100 |
| 1952–53 | 5 | 8 | 25 | 18 | 9 | 34 | 2 | 100 |
| 1953–54 | 6 | 7 | 26 | 19 | 7 | 33 | 2 | 100 |
| 1954–55 | 6 | 7 | 27 | 20 | 8 | 30 | 2 | 100 |
| 1955–56 | 6 | 8 | 26 | 20 | 7 | 32 | 2 | 100 |
| 1956–57 | 5 | 7 | 30 | 20 | 7 | 29 | 2 | 100 |
| 1957–58 | 5 | 8 | 23 | 20 | 11 | 32 | 2 | 100 |
| 1958–59 | 6 | 8 | 23 | 19 | 12 | 31 | 2 | 100 |
| 1959–60 | 6 | 8 | 27 | 16 | 11 | 30 | 2 | 100 |
| 1960–61 | 7 | 8 | 26 | 18 | 9 | 30 | 2 | 100 |
| 1961–62 | 7 | 9 | 26 | 16 | 10 | 30 | 3 | 100 |
| 1962–63x | 7 | 8 | 28 | 16 | 11 | 28 | 2 | 100 |
| 1963–64x | 7 | 8 | 30 | 17 | 10 | 26 | 2 | 100 |
| 1964–65 | 6 | 9 | 22 | 21 | 11 | 29 | 2 | 100 |
| 1965–66 | 6 | 9 | 23 | 20 | 11 | 29 | 2 | 100 |
The following diagram shows gross farming income for the farming groups.
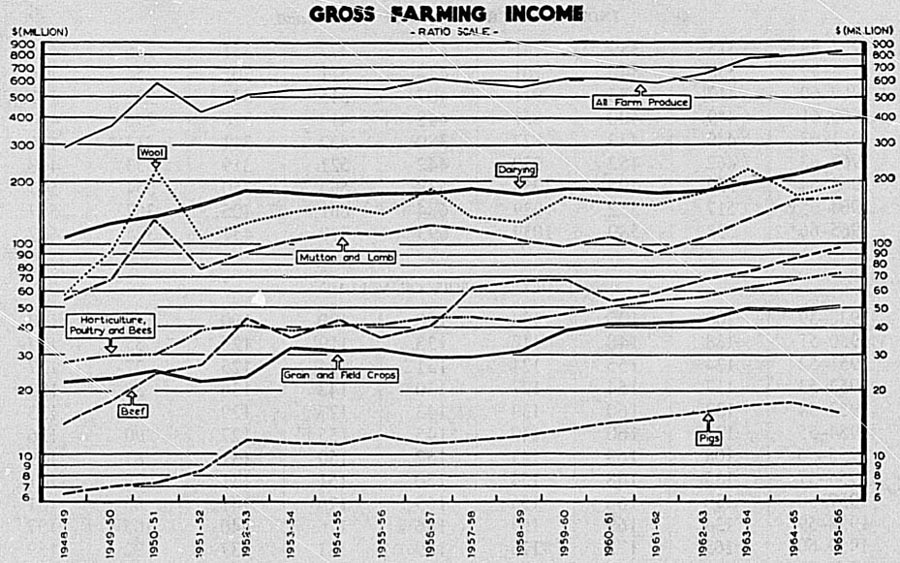
GROSS FARMING INCOME
Index numbers have also been compiled showing the movements in volume of farm production both in total and for the same component groups as previously defined. For the compilation of these index numbers computations have been made for each season showing what the aggregate annual values would have been had the 1938–39 prices been constant throughout the period. From the resultant aggregates, index numbers have been compiled which measure the movements in the volume of production, for, since prices were assumed to be constant, volume is the only variable factor in the aggregates. The coverage of the pastoral production groups includes allowances for changes in the numbers of livestock on farms.
In the following tables index numbers of value and volume on the base: 1938–39 (=100) are given, and these give a clearer idea of the extent of year-to-year change.
| Year | Grain and Field Crops | Horticulture, Poultry, and Bees | Wool | Mutton and Lamb | Beer | Dairying | Pigs | All Farm Produce |
|---|---|---|---|---|---|---|---|---|
* Provisional. | ||||||||
| INDEX NUMBER OF VALUE | ||||||||
| 1938–39 | 100 | 100 | 100 | 100 | 100 | 100 | 100 | 100 |
| 1950–51 | 266 | 238 | 1,222 | 539 | 183 | 241 | 175 | 417 |
| 1951–52 | 240 | 310 | 585 | 318 | 205 | 269 | 196 | 313 |
| 1952–53 | 253 | 322 | 688 | 384 | 338 | 318 | 246 | 374 |
| 1953–54 | 345 | 308 | 766 | 430 | 274 | 316 | 238 | 390 |
| 1954–55 | 338 | 329 | 815 | 459 | 339 | 299 | 233 | 402 |
| 1955–56 | 343 | 330 | 769 | 457 | 279 | 313 | 258 | 397 |
| 1956–57 | 315 | 357 | 984 | 508 | 317 | 317 | 238 | 440 |
| 1957–58 | 315 | 359 | 741 | 483 | 477 | 331 | 246 | 425 |
| 1958–59 | 338 | 346 | 701 | 434 | 511 | 305 | 254 | 404 |
| 1959–60 | 417 | 373 | 911 | 407 | 515 | 331 | 275 | 447 |
| 1960–61 | 449 | 400 | 851 | 448 | 417 | 326 | 296 | 440 |
| 1961–62 | 449 | 443 | 827 | 380 | 452 | 311 | 313 | 426 |
| 1962–63 | 462 | 452 | 970 | 442 | 521 | 319 | 333 | 468 |
| 1963–64 | 532 | 495 | 1,238 | 538 | 564 | 350 | 354 | 547 |
| 1964–65x | 517 | 552 | 929 | 684 | 661 | 405 | 367 | 567 |
| 1965–66* | 538 | 589 | 1,039 | 693 | 730 | 437 | 325 | 607 |
| INDEX NUMBERS OF VOLUME | ||||||||
| 1938–39 | 100 | 100 | 100 | 100 | 100 | 100 | 100 | 100 |
| 1950–51 | 138 | 148 | 117 | 133 | 119 | 125 | 85 | 127 |
| 1951–52 | 124 | 155 | 124 | 131 | 124 | 125 | 77 | 127 |
| 1952–53 | 117 | 154 | 127 | 130 | 143 | 136 | 88 | 133 |
| 1953–54 | 132 | 160 | 130 | 143 | 127 | 129 | 85 | 133 |
| 1954–55 | 121 | 160 | 140 | 145 | 155 | 127 | 90 | 136 |
| 1955–56 | 108 | 169 | 143 | 152 | 150 | 131 | 87 | 139 |
| 1956–57 | 135 | 168 | 154 | 150 | 151 | 131 | 78 | 141 |
| 1957–58 | 130 | 166 | 156 | 169 | 176 | 141 | 86 | 151 |
| 1958–59 | 134 | 169 | 169 | 186 | 176 | 140 | 105 | 157 |
| 1959–60 | 163 | 172 | 176 | 189 | 181 | 137 | 92 | 159 |
| 1960–61 | 179 | 176 | 183 | 199 | 172 | 143 | 92 | 166 |
| 1961–62 | 163 | 200 | 184 | 209 | 196 | 140 | 96 | 169 |
| 1962–63 | 195 | 225 | 197 | 211 | 208 | 144 | 1,110 | 178 |
| 1963–64 | 215 | 249 | 194 | 219 | 195 | 149 | 111 | 184 |
| 1964–65x | 202 | 260 | 196 | 221 | 206 | 157 | 101 | 189 |
| 1965–66* | 210 | 274 | 222 | 230 | 203 | 166 | 90 | 199 |
From the 1951–52 season through to the 1956–57 season the value series showed a much faster growth rate than the volume series, a result of a general upward movement in prices.
From 1956–57 to 1962–63 prices were more stable and in some cases showed a decline and, in consequence, the index of total value of farm produce remained relatively stable, even though the volume index showed a consistent upward movement.
In 1963–64, considerably higher prices for wool, meat, and dairy products sold overseas, resulted in a 15 percent rise in the value index compared with a 2.8 percent increase in the volume index.
In the year 1964–65, higher prices for meat and dairy products sold overseas were offset by a sharp fall in wool prices, resulting in only a very slight rise in the value index compared with 2.7 percent increase in the volume index.
In the latest year, 1965–66, a rise of 6.9 percent value compared favourably to a volume increase of 5.3 percent for all farm produce.
The table clearly shows the effects of fluctuations in the price of wool from year to year.
Over the 27-year period, the average annual compound rate of increase in the volume series has been 2.6 percent. For the latest five years the compound rate of increase has been 3.8 percent.
FARM PRODUCTION: EXPORTS AND NEW ZEALAND CONSUMPTION—Estimates of the relative importance of exports and of consumption within New Zealand in the disposal of farm produce have been compiled by utilising the statistics of gross farming income in conjunction with statistics of trade in farm products.
In the paragraphs covering the statistics of gross farming income it is explained that these estimates were framed on the basis of “on the farm” values in order that they might indicate the gross receipts by the farmer, after making provision for transport charges and other expenses incurred in the marketing of produce.
In compiling the statistics of the relative importance of the New Zealand market and of export markets for farm products the value of exports has been assessed as the “farm” value of the commodities concerned, and not at the f.o.b. declared value for export. This adjustment has been made in order to ensure that both sets of statistics from which the comparison is made are on the same value basis. It will be realised, then, that the figures given in this statement indicate the proportions of total gross returns to farmers arising from farm products exported and from consumption of such products within New Zealand.
The figures of the return to farmers in respect of New Zealand consumption of farm produce have been obtained by deducting exports from total production. In these compilations exports of dairy products have been converted to a butterfat equivalent, the returns to farmers being computed on the basis of butterfat payout; while the slaughterings represented by exports of meat products have been taken as the basis on which to estimate farmers' receipts from exports of meat. In certain instances where statistics of stock are available adjustment has been made for the carryover from one season to another. It has been assumed that stocks of wool, frozen meat, and butter and cheese carried over are held for export, and that other stocks are subsequently consumed within New Zealand.
Any lack of correspondence between the statistics of production and of trade will affect the accuracy of these estimates. Statistics of production relate to the production year for each commodity, or group of commodities, coming within the scope of this investigation. As the production years do not cover identical 12-monthly periods, the aggregate of production of farm produce includes statistics for a number of yearly periods ending in different months. Exports during any one year do not consist entirely of commodities produced within the same 12-monthly period to which the export statistics relate. The value of changes in number of livestock on farms is, on account of the complexities otherwise involved, wholly applied to the New Zealand consumption figure. The effect of these various factors is, however, minimised by taking averages for five seasons.
The following table shows in quinquennial periods the proportions of gross farming income arising from exports of farm produce and from consumption of such produce within New Zealand.
| Gross Farming Income | 1936–37 to 1940–41 | 1941–42 to 1945–46 | 1946–47 to 1950–51 | 1951–52 to 1955–56 | 1956–57 to 1960–61 | 1961–62 to 1965–66 |
|---|---|---|---|---|---|---|
| All farm produce— | percent | |||||
| From exports | 67 | 67 | 71 | 70 | 68 | 66 |
| From New Zealand consumption | 33 | 33 | 29 | 30 | 32 | 34 |
| Totals | 100 | 100 | 100 | 100 | 100 | 100 |
DAIRY PRODUCTION—The total butterfat production “at the pail” during the 1965–66 dairy season is estimated to have amounted to 645.6 million lb, an increase of 22.5 million lb, or 3.6 percent, above the 1964–65 figure of 623.1 million lb.
The quantity of butterfat processed by dairy factories in 1965–66 is estimated at 578.1 million lb, compared with 556.8 million lb processed by factories during 1964–65.
Variations over the last 10 years in total butterfat production, including estimates for butterfat in milk and cream sold for human consumption, used and lost on farms, etc., are given in the following table. The table also gives the number of dairy cows recorded as in milk, and estimates of the average butterfat production per cow “at the pail”, which are derived by the New Zealand Dairy Board from data concerning tested herds.
| Year | Total Butterfat | Dairy Cows in Milk | Average Production per Cow |
|---|---|---|---|
* Relates to holdings of 10 acres and over, whereas figures for earlier years relate to holdings of one acre and over. | |||
| million lb | (000) | lb | |
| 1956–57 | 524 | 1,998 | 266 |
| 1957–58 | 558 | 1,967 | 285 |
| 1958–59 | 557 | 1,931 | 293 |
| 1959–60 | 547 | 1,887* | 288 |
| 1960–61 | 557 | 1,929* | 287 |
| 1961–62 | 555 | 1,968* | 280 |
| 1962–63 | 567 | 1,997* | 282 |
| 1963–64 | 590 | 2,011* | 292 |
| 1964–65 | 623 | 2,032x | 305x |
| 1965–66 | 646 | 2,086 | 308 |
The next table shows the estimated production and utilisation of butterfat during each of the last five seasons. (Source: New Zealand Dairy Board.)
| Utilisation | 1961–62 | 1962–63 | 1963–64 | 1964–65 | 1965–66 |
|---|---|---|---|---|---|
* Includes small quantities of creamery fat used in whey buttermaking. † Including residual fat in skim-milk from home separation. † Basis of estimate changed. Series subject to revision. | |||||
| million lb | |||||
| Creamery buttermaking* | 383.2 | 395.0 | 421.6 | 445.0x | 463.1 |
| Cheesemaking | 90.9 | 87.9 | 83.9 | 93.8x | 93.8 |
| Whole-milk products | 7.9 | 10.2 | 12.3 | 13.5x | 16.4 |
| Totals | 482.0 | 493.1 | 517.9 | 552.3x | 573.3 |
| Residual fat in skim-milk products | 2.6 | 3.0 | 4.0 | 4.5 | 4.8 |
| Total processed by dairy factories | 484.6 | 496.1 | 521.9 | 556.8x | 578.1 |
| Consumed as milk, cream, or ice cream | 50.3 | 50.8 | 48.9 | 46.7X | 47.6‡ |
| Farm butter | 0.2 | 0.2 | 0.2 | .. | .. |
| Fed to stock† | 14.2 | 14.0 | 13.4 | 13.4x | 13.6 |
| Wastage | 5.5 | 5.6 | 5.8 | 6.2 | 6.3 |
| Total production “at pail” | 554.8 | 566.6 | 590.2 | 623.1x | 645.6 |
Changes in the usage of butterfat in dairy factories over recent years are indicated by the percentages in the following table.
| Usage | Percentage of Total Butterfat | ||||
|---|---|---|---|---|---|
| 1961–62 | 1962–63 | 1963–64 | 1964–65 | 1965–66 | |
| Butterfat received into factories from farms and used for— | |||||
| Buttermaking | 79.5 | 80.1 | 81.4 | 80.6x | 80.8 |
| Cheesemaking | 18.9 | 17.8 | 16.2 | 17.0x | 16.4 |
| Whole milk products | 1.6 | 2.1 | 2.4 | 2.4x | 2.8 |
| Totals | 100.0 | 100.0 | 100.0 | 100.0 | 100.0 |
Butterfat processed by dairy factories totalled 578.1 million lb. Of this total, 463.1 million lb, or 80.1 percent, was used in buttermaking, 93.8 million lb, or 16.2 percent, in cheese-making, and 16.4 million lb, or 2.8 percent, in the manufacture of condensed and powdered whole milk products. Residual fat in skim milk products accounted for the remaining 4.8 million lb of butterfat.
Total butterfat processed in 1965–66 was a record. Again there was no diversion to butter factories of milk normally supplied to cheese factories, nevertheless, while butterfat used in buttermaking increased by 4.1 percent, butterfat used in cheesemaking showed no change compared with 1964–65.
Creamery butter production during 1965–66 amounted to 251,302 tons, being an increase of 9,195 tons, or 3.8 percent, on the previous season's total of 242,107 tons. Whey butter manufacture amounted to 3,090 tons, a decrease of 61 tons, or 1.9 percent from the previous year's total of 3,151 tons.
Cheese manufacture totalled 105,593 tons, a decrease of 631 tons, or 0.6 percent, from the previous season's total of 106,224 tons.
Of the other dairy products, skim milk powder rose by 5,716 tons, or 7.1 percent, to 85,936 tons. Buttermilk powder likewise increased in production by 2,884 tons to 24,588 tons (an increase of 13.3 percent), while casein production for 1965–66 at 53,001 tons was 11,209 tons, or 26.8 percent, above the 1964–65 total of 41,792 tons. The output of condensed and powdered whole milk for 1965–66 was 15,365 tons; but this figure excludes infant foods and is therefore not comparable with those for earlier years which include infant foods.
Production by dairy factories during the last five seasons is set out in the following table.
| Product | 1961–62 | 1962–63 | 1963–64 | 1964–65 | 1965–66 |
|---|---|---|---|---|---|
* Excludes infant foods from 1 June 1965. | |||||
| tons (000) | |||||
| Creamery butter | 207.5 | 214.0 | 228.7 | 242.1 | 251.3 |
| Whey butter | 3.2 | 3.0 | 2.8 | 3.2 | 3.1 |
| Cheese | 100.6 | 98.4 | 95.1 | 106.2 | 105.6 |
| Condensed and powdered whole milk* | 14.9 | 14.4 | 15.6 | 13.4 | 15.4* |
| Skim-milk powder | 41.8 | 50.8 | 62.8 | 80.2 | 85.9 |
| Buttermilk powder | 17.4 | 17.9 | 19.9 | 21.7 | 24.6 |
| Casein | 35.4 | 37.6 | 42.2 | 41.8 | 53.0 |
The following diagram shows the progress of the dairy industry over a long period of years.
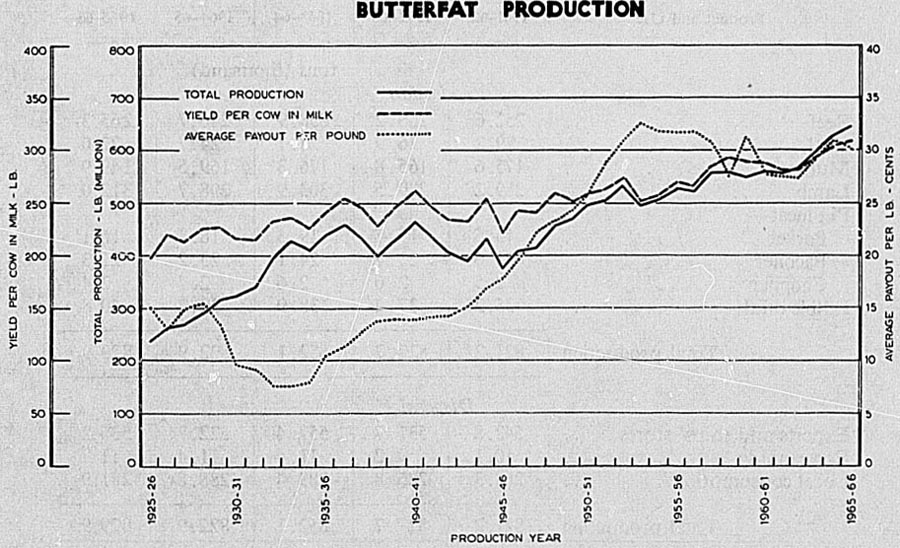
BUTTERFAT PRODUCTION
The Dairy Board has its functions defined in the Dairy Board Act 1961. Marketing functions are discussed in section 21A. It is the Board's concern to promote the orderly development of the dairy, bobby calf, and pig industries with a view to improving the quality of the stock and expanding production. Quality improvement involves testing stock for production, the development of artificial breeding, and research and experimental work. The organisation of orderly marketing of veils and bobby calves, pigs, and dairy stock is one of the functions of the Board.
The Board's production and administration section is financed by a levy on dairy produce. It shares with the Government the management and finance of the Dairy Research Institute, and, with the Government, the Meat Producers Board, and the Wool Board, the control of the Veterinary Services Council.
The Board is also represented on the Dairy Products Prices Authority, the Dairy Industry Loans Council, the Meat Producers Board, the Pig Producers Council, the Bobby Calf Pools Central Executive, the Dairy Factory Managers Registration Board, and on a committee which examines improvements in manufacture.
The Dairy Industry Act 1952 regulates the production, collection, treatment, preparation, and manufacture, under proper sanitary conditions, of dairy produce—i.e., milk, cream, butter, cheese, and any other product of milk or cream—intended for sale for human consumption within New Zealand or for export.
Inspectors are empowered to inspect premises used for the production or manufacture of dairy produce. Any defects affecting the cleanliness and sanitation of the premises, or of the plant, machinery, and apparatus used in connection therewith, may be ordered to be remedied to the satisfaction of the inspector, and until so remedied their use in the production of dairy produce may be forbidden. Inspectors are authorised to condemn any dairy produce considered unfit for human consumption, and the sale of unwholesome milk or other dairy produce is prohibited.
Dairy produce intended for export must be sound and wholesome in all respects, and must comply with the requirements of the Act as to inspection, grading, and marking.
The Cooperative Dairy Companies Act 1949 provides for the registration of co-operative dairy companies.
MEAT PRODUCTION AND DISPOSAL—Meat production for the seasons ended September 1964, 1965, and 1966 totalled 852,100 tons, and 829,900 tons respectively. The following table shows in summary form production and disposal of meat. Figures are shown at bone-in weights.
| Product and Use | 1961–62 | 1962–63 | 1963–64 | 1964–65 | 1965–66 |
|---|---|---|---|---|---|
| tons (thousand) | |||||
| Production | |||||
| Beef | 252.6 | 266.2 | 258.9 | 246.7 | 265.3 |
| Veal | 29.2 | 26.9 | 28.1 | 24.7 | 22.0 |
| Mutton | 175.6 | 165.8 | 176.3 | 169.5 | 149.9 |
| Lamb | 289.2 | 289.5 | 303.9 | 298.7 | 312.0 |
| Pig meat— | |||||
| Porker | 15.5 | 17.7 | 19.3 | 18.3 | 16.1 |
| Baconer | 21.6 | 21.7 | 24.1 | 23.2 | 21.3 |
| Chopper | 2.5 | 2.6 | 2.6 | 2.7 | 2.4 |
| Edible offal | 35.2 | 37.4 | 38.9 | 39.2 | 40.8 |
| Total production | 821.2 | 827.7 | 852.1 | 822.9 | 829.9 |
| Disposal | |||||
| Exports and ships' stores | 542.8 | 531.7 | 557.4 | 522.7 | 536.2 |
| For canning | 10.1 | 9.2 | 11.4 | 11.4 | 11.7 |
| Local consumption | 268.3 | 286.8 | 283.4 | 288.8x | 281.9 |
| Total production | 821.2 | 827.7 | 852.1 | 822.9 | 829.9 |
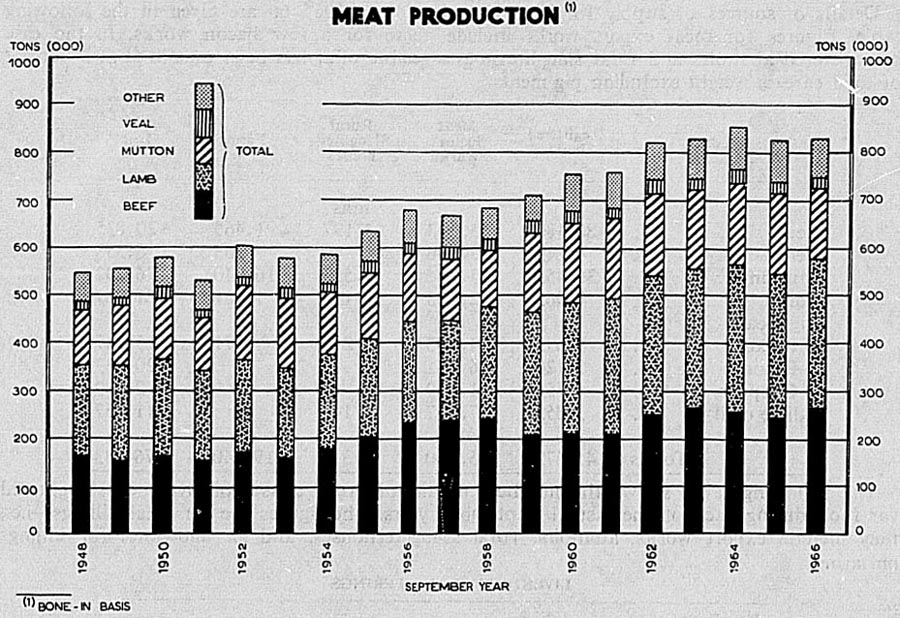
MEAT PRODUCTION
Meat consumed in New Zealand during 1965–66 represented approximately 33 percent of total production. The figures in the next table give acutal consumption during the years ended 30 September, by classes of meat.
| Product | Local Consumption | Consumption per Head of Mean Population | ||||
|---|---|---|---|---|---|---|
| 1963–64 | 1964–65 | 1965–66 | 1963–64 | 1964–65 | 1965–66 | |
| tons (000) | lb | |||||
| Beef | 112.7 | 119.0 | 120.8 | 97.6 | 101.2 | 101.1 |
| Veal | 9.5 | 9.3 | 8.6 | 8.3 | 7.9 | 7.2 |
| Mutton | 88.5 | 85.4 | 76.3 | 76.7 | 72.6 | 63.9 |
| Lamb | 20.9 | 19.2 | 22.0 | 18.1 | 16.3 | 18.4 |
| Pig meat— | ||||||
| Porker | 16.1 | 15.4 | 15.1 | 14.0 | 13.1 | 12.6 |
| Baconer | 22.6 | 20.1 | 20.0 | 19.6 | 17.1 | 16.7 |
| Chopper | 2.4 | 2.4 | 2.2 | 2.1 | 2.1 | 1.8 |
| Edible offal | 10.8 | 10.8 | 11,6 | 9.4 | 9.2 | 9.7 |
| Grand totals | 283.5 | 281.6 | 276.6 | 245.7 | 239.4 | 231.5 |
Details of sources of supply for local consumption in 1965–66 are given in the following table. Figures for meat export works include those for a few bacon works. In the case of registered abattoirs and rural slaughterhouses, edible offal has been estimated at 3 percent of total carcass weight excluding pig meats.
| Product | Registered Abattoirs | Meat Export Works | Rural Slaughterhouses | Farms | Total |
|---|---|---|---|---|---|
| tons | |||||
| Beef | 80,180 | 35,993 | 3,197 | 1,465 | 120,835 |
| Veal | 4,849 | 3,366 | 40 | 303 | 8,558 |
| Mutton | 35,453 | 23,266 | 1,533 | 16,040 | 76,292 |
| Lamb | 7,965 | 12,423 | 118 | 1,461 | 21,967 |
| Pig meat— | |||||
| Porker | 9,695 | 4,605 | 276 | 571 | 15,147 |
| Baconer | 3,126 | 16,911 | – | – | 20,037 |
| Chopper | 551 | 1,639 | – | – | 2,190 |
| Edible offal | 3,853 | 7,557 | 147 | – | 11,557 |
| Totals | 145,672 | 105,760 | 5,311 | 19,840 | 276,583 |
The following table shows the numbers of the different classes of livestock slaughtered for food during each of the last 11 September years. The figures are for total killings—i.e., they include export works, abattoirs, rural slaughterhouses, and an allowance for killings on farms.
| LIVESTOCK SLAUGHTERINGS | |||||
|---|---|---|---|---|---|
| Year Ended 30 September | Sheep | Lambs | Cattle | Calves | Pigs |
| Carcasses (000) | |||||
| 1956 | 5,886 | 14,807 | 1,000 | 1,406 | 816 |
| 1957 | 5,301 | 14,339 | 1,047 | 1,407 | 751 |
| 1958 | 5,081 | 15,883 | 1,106 | 1,314 | 768 |
| 1959 | 7,459 | 18,355 | 962 | 1,222 | 883 |
| 1960 | 7,356 | 19,283 | 956 | 1,234 | 863 |
| 1961 | 7,289 | 19,846 | 995 | 1,299 | 839 |
| 1962 | 8,002 | 21,518 | 1,224 | 1,413 | 850 |
| 1963 | 7,220 | 21,308 | 1,282 | 1,412 | 921 |
| 1964 | 7,901 | 22,157 | 1,286 | 1,392 | 1,002 |
| 1965 | 7,552x | 21,924x | 1,138 | 1,231 | 951x |
| 1966 | 6,711 | 22,326 | 1,172 | 1,102 | 874 |
Meat intended for export from New Zealand is slaughtered at meat export slaughterhouses, of which 37 are at present operating. They are licensed annually under the provisions of the Meat Act 1964 and regulations thereunder, which also authorise officers of the Department of Agriculture to inspect all meat whether for export or for local consumption.
The supervision of grading of meat for export is one of the responsibilities of the Meat Producers Board. Grading at each freezing works is carried out, after slaughtering and dressing, by graders employed by the concern operating the freezing works. Supervising graders of the Meat Producers Board are allotted to each group of works to ensure uniformity of grading.
To supply meat for the larger urban centres there are at present 38 abattoirs operating, the larger ones being organised on the same lines as meat export works, and the supply is augmented by meat drawn from export works. At rural slaughterhouses meat is killed for consumption in small country towns and rural districts. Many farmers, particularly on sheep farms, kill their own meat.
To regulate and control the marketing of bobby calves, Bobby Calf Committees were established in 1938 and are now governed by the Bobby Calf Marketing Regulations 1955 under the control of the Dairy Board.
WOOL PRODUCTION—Although fourth in order in actual size of flocks, New Zealand holds third place in the world as a producer of wool, and second place as an exporter. New Zealand specialises in the production and export of crossbred wool. With the exception of a small annual consumption by local mills the whole of the wool produced in New Zealand is exported. The quantity on a greasy basis used by local manufacturers in the post-war period until 1958–59 ranged between 10,900,000 lb and 14,500,000 lb. Figures for local consumption in recent years are as follows.
| Year Ended 30 June | Quantity Used (Greasy Basis) |
|---|---|
| lb (000) | |
| 1960 | 15,800 |
| 1961 | 17,100 |
| 1962 | 20,400 |
| 1963 | 18,200 |
| 1964 | 20,300 |
| 1965 | 22,300 |
| 1966 | 23,300 |
The following table shows for the last 11 seasons the total wool production (greasy basis), the movement in the average price per pound of wool (greasy basis), and the estimated total value of wool production (obtained by valuing the production estimate at the overall price per lb of greasy wool sold at auction).
| Season Ended 30 June | Total Wool Production (Greasy Basis) | Average Price Per pound (Greasy Basis) | Estimated Value of Total Wool Production |
|---|---|---|---|
| lb (m) 462 | c. | $(m) | |
| 1956 | 462 | 38.49 | 177.8 |
| 1957 | 491 | 45.63 | 224.0 |
| 1958 | 496 | 34.30 | 170.2 |
| 1959 | 540 | 30.06 | 162.4 |
| 1960 | 577 | 37.21 | 214.6 |
| 1961 | 588 | 33.62 | 197.6 |
| 1962 | 587 | 32.65 | 191.6 |
| 1963 | 620 | 35.70 | 221.4 |
| 1964 | 617 | 35.12 | 218.8 |
| 1965 | 623 | 35.12 | 218.8 |
| 1966 | 695 | 34.68 | 241.0 |
On account of lack of information on changes in stocks of wool on farms, the above figures of production should not be taken as precise measures of actual production in each season.
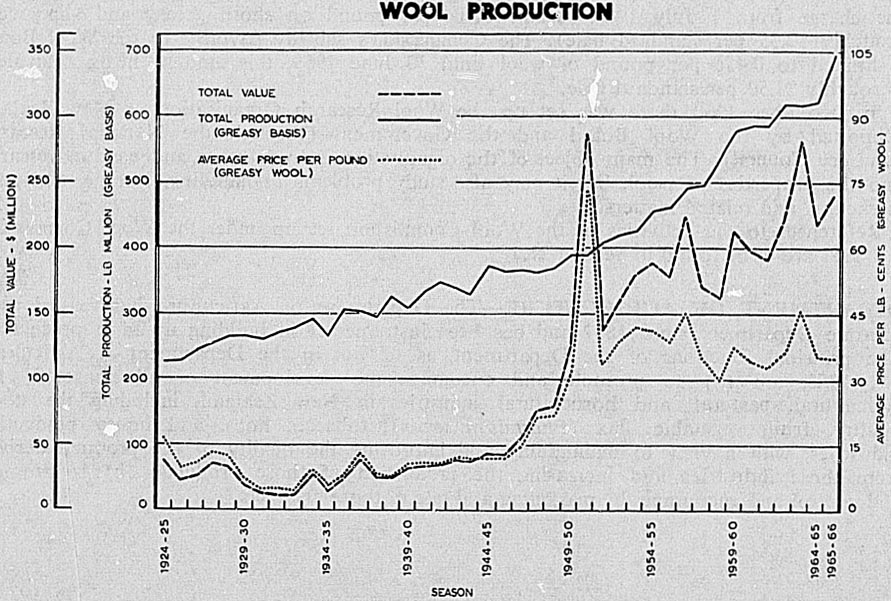
WOOL PRODUCTION
An analysis of wool sold at New Zealand auctions, according to quality groups, is given in the following table. (Source: Wool Commission.)
| Quality Group | 1961–62 | 1962–63 | 1963–64 | 1964–65 | 1965–66 | |||||
|---|---|---|---|---|---|---|---|---|---|---|
| Bales | Percentage of Total Sales | Bales | Percentage of Total Sales | Bales | Percentage of Total Sales | Bales | Percentage of Total Sales | Bales | Percentage of Total Sales | |
| 60–64's and up | 14,044 | 1.1 | 15,153 | 1.2 | 13,410 | 1.0 | 13,497 | 1.0 | 14,351 | 1.0 |
| 60's | 7,459 | 0.6 | 8,915 | 0.7 | 10,257 | 0.8 | 9,736 | 0.7 | 8,196 | 0.5 |
| 58–60's, 58's, and 56–58's | 90,799 | 7.2 | 89,307 | 6.8 | 87,063 | 6.7 | 83,956 | 6.4 | 82,930 | 5.6 |
| 50–56's and 56's | 120,872 | 9.6 | 123,033 | 9.4 | 123,362 | 9.5 | 107,858 | 8.2 | 137,573 | 9.3 |
| 52's | 50,529 | 4.0 | 54,086 | 4.1 | 55,239 | 4.2 | 47,335 | 3.6 | 50,605 | 3.4 |
| 50's | 149,779 | 11.8 | 136,865 | 10.5 | 128,736 | 10.0 | 123,882 | 9.4 | 133,193 | 9.0 |
| 48–50's | 123,880 | 9.8 | 137,321 | 10.5 | 125,622 | 9.7 | 138,346 | 10.6 | 152,739 | 10.3 |
| 46–50's and 48's | 464,657 | 36.8 | 439,900 | 33.6 | 405,405 | 31.3 | 380,516 | 29.0 | 438,865 | 29.5 |
| 46–48's | 171,362 | 13.6 | 202,069 | 15.4 | 217,271 | 16.8 | 279,140 | 21.3 | 310,545 | 21.0 |
| 46's and lower | 70,112 | 5.5 | 102,789 | 7.8 | 128,930 | 10.0 | 127,977 | 9.8 | 154,660 | 10.4 |
| Totals | 1,263,493 | 100.0 | 1,309,438 | 100.0 | 1,295,295 | 100.0 | 1,312,243 | 100.0 | 1.483,657 | 100.0 |
The Wool Industry Act 1944 provided for the establishment of the Wool Board. The Board's principal concern is the promotion of the wool industry, particularly in regard to markets, scientific and industrial research in relation to wool and sheep with a view to improvement in quality and quantity, and the discovery of new or improved methods of utilisation. Specific matters in relation to which the Board may be called upon to exercise certain functions are the production, handling, pooling, appraising, storage, distribution, marketing, and disposal of wool. The Board is empowered to act in combination or association with other bodies established outside New Zealand functioning on similar lines, such as the International Wool Secretariat and the Wool Bureau, and with the Meat Producers Board and the Dairy Board. It is also represented on the Wool Commission established by the Wool Commission Act 1951. To provide funds for the Board to carry out its functions the Wool Industry Act authorises a levy on all wool produced in New Zealand, the rate of the levy to be fixed each season by the Board. Under the wool Commission Act, payment of this levy is at present suspended, the expenses of the Board and the Commission being met, partly from a charge imposed by regulation under that Act on all wool exported or used in New Zealand, and partly from accumulated funds of the Commission. Following the decision of the Wool Board to find additional funds for the wool promotion and research programme of the International Wool Secretariat, the charge from 1 July 1964 became 0.70c per pound on shorn greasy and slipe wool (roughly $2.35 per standard bale). The Commission's subsidy payment to the Wool Board is limited to 0.45c per pound of wool until 30 June 1969, this amount being equivalent to roughly $1.50 per standard bale.
In December 1960 there was set up the Wool Research Organisation of New Zealand supported by the Wool Board and the Government (through the National Research Advisory Council). The main object of the organisation is to promote and conduct research into the properties of wool, but it may also study problems of handling, storage, transport, marketing, and related matters.
References to the activities of the Wool Commission set up under the Wool Commission Act 1951 are to be found in Section 21.
DEPARTMENT OF AGRICULTURE—The Department of Agriculture has existed as a separate Department since 1892 and has been instrumental in building up farm production. The principal functions of the Department, as set out in the Department of Agriculture Act 1953, are (a) to promote and encourage the development of all phases of the agricultural, pastoral, and horticultural industries in New Zealand, including the stock, poultry, fruit, vegetable, flax (Phormium tenax), tobacco, hops, and honey production industries, with a view to maintaining and improving the quality of the products derived from those industries and increasing the production of those products; (b) to promote and control and encourage the marketing and sale of those products.
Under the control of the Minister of Agriculture, the Department of Agriculture provides a service of which the main object is the advancement of the interests of primary production. Under a Director-General of Agriculture there are Divisional Directors of Animal Health, Meat, Dairy, Farm Advisory, Research, Horticulture, Sheep and Wool, and Administration. While the service is primarily educative, the Department administers a number of Acts and regulations.
Animal Health—The Animal Health Division is responsible for the control of infectious diseases of livestock, and vaccination and testing are carried out to prevent and eradicate certain serious stock diseases. Special attention is given to herds supplying milk for human consumption. Livestock husbandry forms an essential part of the extension service provided by this Division. All stock exported and imported is examined by the Division's veterinarians. Instruction is given in poultry keeping. The Division is concerned with the control of noxious weeds and, with the Rabbit Destruction Council through district rabbit boards, in the destruction of rabbits, opossums, and wallabies.
The Port Agriculture Inspection Service was established in 1960 to take over both plant and animal quarantine work. Officers of this service handle all aspects of agricultural work at major ports and airports.
Meat—The Meat Division is responsible for the ante-mortem and post-mortem inspection of all stock and meat produced in abattoirs and meat export works—and for the standard of hygiene in these establishments as well as in all meat export and domestic meat packing plants. It supervises the standard of hygiene in game packing houses and gives veterinary certificates covering the export of game and fish.
Sheep and Wool—This Division was established in 1966 to carry out the advisory work formerly located in the Farm Advisory Division, on sheep and wool production. In addition, it has the responsibility in association with the various breed societies, to establish and operate a performance-recording scheme for sheep and beef cattle to assist breeders to develop stock which will produce better meat.
Dairy Produce—Instruction in the manufacture of butter, cheese, milk powder, and casein is given by the Dairy Division. Dairy produce is inspected and graded before shipment and a close supervision is exercised over butter and cheese at all stages of manufacture, and the Division is responsible for the registration of town milk supply premises. It also provides technical advice on market milk treatment. The Division has laboratories at Auckland, New Plymouth, and Wallaceville which provide a comprehensive examination of dairy products as a background to its control of dairy produce quality. The Division is responsible for the registration and licensing of dairy factories, approval of their design, general suitability, and economic justification.
Farm Advisory Service—The Farm Advisory Division is concerned with advisory work in soil management, crop and pasture production, and farm management. A field staff of farm advisory officers acts as a link between the research stations and the farmers and also carries out co-operative demonstration trials and demonstrations on farmers' properties. The Division is concerned with seed certification and crops, pastures, farm management and economics, rural sociology and home economics, and farm machinery. Soil testing and assistance with farm drainage work are both undertaken. The Division controls the following stations: Seed Testing Station, Palmerston North; Phormium plantation, Moutoa; Flock House Farm of Instruction, Bulls, and two demonstration farms, one at Kaikohe and one at Te Anau.
Greater emphasis is now being given by advisory officers to the consideration of the whole farm as a business unit and to close co-operation, for example, with accountants, lending institutions, and stock and station agents, in order to help the farmer to improve the profitability of his enterprise.
Research—In 1963 the Director of Ruakura Animal Research Station was given additional responsibilities as Director, Agricultural Research, and all research stations of the Department were brought under his control as a Division, with headquarters at Ruakura and Assistant Directors of Animal Research and Soils Research and Superintendent, Field Research and Soils Research and a Superintendent, Field Research, all stationed at Ruakura.
Work at Ruakura has been concerned to a large extent with animal nutrition under conditions of grassland farming, and Wallaceville with disease and diagnostic work. Diagnostic stations for animal diseases are established at Ruakura and at Taieri near Dunedin with additional stations to be opened at Whangarei and Lincoln during 1967. Horticultural research is centered in Levin where plant quarantine and diagnostic services also have their headquarters. Investigations into grape and wine production are carried out at Te Kauwhata. Associated with Ruakura are the hill country research station at Whatawhata, the soil fertility research station at Rukuhia, both near Hamilton, and the substation at Manutuke, near Gisborne. Irrigation research is undertaken at Winchmore near Ashburton, and agricultural research at Taieri.
Horticulture—The Horticulture Division provides an advisory service to fruitgrowers, market gardeners, nurserymen, flower growers, and beekeepers. Its officers inspect market gardens, nurseries, and apiaries for disease, and sets grading standards for pip fruit for export and home consumption. The Horticulture Division provides an advisory service to commercial producers of all types of fruit and vegetables, as well as to nurserymen and cut-flower growers. This advisory service covers all aspects of production from soil management, disease and pest control and crop production and handling. Advisory officers of the division also demonstrate and adapt research results in districts for all horticultural crops and beekeeping.
Experimental and demonstration areas are sited at Keri Keri, Manutuke (citrus), and Avondale, Auckland (vegetables and ornamentals).
The division also has the responsibility for disease and pest control in nurseries, orchards, and market gardens and for the quality of apples and pears packed for export or local market. The Apiary Section of the division advises producers on all aspects of beekeeping and is responsible for the control of disease in apiaries.
Marketing and Trade—The Department is also concerned with many of the issues relating to the marketing of primary products, both overseas and within New Zealand, as well as with general economic problems affecting farming industries as a whole.
DEPARTMENT OF SCIENTIFIC AND INDUSTRIAL RESEARCH—The Department devotes a large part of its activities to the promotion of agricultural research relating to most phases of agriculture.
The Soil Bureau's survey of New Zealand soils provides basic information on their most suitable use for agricultural and other purposes. The Bureau also undertakes research on the relationship of soil to problems of agriculture, horticulture, forestry, building foundations, and engineering.
The Crop Research Division is concerned with producing new and improved varieties of field and vegetable crops suited for local conditions. Special attention is given to the breeding of new varieties which are disease resistant.
The Hop and Tobacco Research Stations, both of which are subsidised by the respective industries, investigate problems relating to the growing of these two crops, while the Fruit Research Division performs a similar function for the whole fruit industry.
The work of the Grasslands Division is directed towards improving the productivity of pastures by breeding improved varieties of grasses and clovers and investigating the factors affecting their growth.
Closely associated with the Grasslands Division are the Plant Chemistry and Plant Physiology Divisions. The Plant Chemistry Division undertakes research on plant nutrition and metabolism with special reference to the relationship between pasture and animal nutrition and health. It has developed means of controlling bloat by using emulsified oils; and anti-protozoal drugs used experimentally in the search for improved control have given promising results. The Plant Physiology Division in studying the physiology of plant growth and reproduction with a view to determining the relative importance of the factors which control these processes.
Farmers, fruitgrowers, and gardeners are assisted by the Plant Diseases Division, which investigates all types of plant diseases, with the object of bringing them under control, and by the Fruit Research Division, which investigates problems other than pests and diseases adversely affecting the fruit industry. The Entomology Division studies New Zealand insects with special reference to those, such as grass grub, which attack agricultural crops. The Animal Ecology Division investigates the ecology of introduced mammals, such as the rabbit, with the object of discovering more effective methods of control.
The Wheat Research Institute, which like the Tobacco and Hop Research Stations is subsidised by industry, aims at improving the milling and baking qualities of the wheat produced in this country. A moisture-testing service helps farmers to determine when wheat crops are ready for harvesting.
The work of the Botany Division and the Applied Mathematics Division has only an indirect bearing on agriculture. The Botany Division's function is to study all plant life in New Zealand, and in doing so it provides basic information of use to other divisions of the Department. The Applied Mathematics Division assists other divisions by advising on the design of experiments so that these yield the maximum information, and on the interpretation of results obtained.
Closely associated with the Department are a number of research associations and institutes which undertake research work of importance to agriculture. The Fertilizer Manufacturers' Research Association concerns itself with problems relating to the production, distribution, and use of fertilisers, the Wool Industries' Research Institute studies all aspects of wool manufacture, while the Wool Research Organisation undertakes research on wool, with particular reference to its physical, chemical, and biological properties, and also on its handling, storage, transport, and marketing for export. The Meat Industry Research Institute studies problems affecting the meat industry, while the Dairy Research Institute investigates the production of milk in relation to feeding, breeding, and management of dairy animals and the manufacture of dairy products. It also investigates the building, design, and efficiency of dairy machinery.
The Value of Agricultural Research—The value of research to agriculture, which is not easy to assess in monetary terms, is reflected in the development of improved and higher yielding varieties of plants, in their more effective handling, and in the control of pests and diseases.
A soil survey of the whole of New Zealand has been completed, and the problems of mineral deficiency diseases such as bush sickness and dopiness have been solved. Tobacco research has resulted in the area of this crop being more than doubled and the yield per acre trebled. At current prices the increased yield is worth more than $2 million to the growers and tobacco growing, though it is confined to only a comparatively small area of suitable soils in Nelson district, has become one of the most prosperous of rural industries. The Hop Research Station has developed two new hop varieties of excellent quality and high yield, and with resistance to the serious disease root rot.
Control has been secured over a wide range of plant diseases. Ball smut and loose smut of cereals have almost disappeared, dry rot of brassicas has materially lessened, and blast of stone fruit has been controlled. A method of controlling yellow dwarf virus in wheat has been developed which involves spraying the crop with insecticides to destroy the aphids which transmit the disease. A system of certifying spray materials effective against a wide range of disease of horticultural and garden crops has been devised. A most effective culture to promote lucerne growth has been found and maintained.
Numerous serious insect pests have been brought under control, and the diamond-back moth, white butterfly, and codling moth are not the menace they formerly were: DDT has been used effectively against grass grub, subterranean grass caterpillar, and ryegrass stem weevil. Damage to pasture by grass grub, conservatively estimated at $20 million a year, can be controlled if the proper routine is followed in the use of the insecticide. Because of the residue problems resulting from the careless use of chlorinated hydrocarbons for grass-grub control, the Entomology Division is investigating the use of other types of insecticides. Biological methods of control of this insect are also being investigated to supplement the chemical method and overcome the resistance problem which has arisen in some areas.
The work of the Grasslands and Crop Research Divisions has resulted in the development and expansion of a profitable farm seed industry. Research into the breeding of new strains of pasture plants, and into the utilisation and management of pastures, has done much to enable New Zealand to lead the world in grassland farming, and raise its per-acre yield of meat and dairy produce. At a cost of $12,000 million, the Grasslands Division developed Manawa (short-rotation) ryegrass which is now worth $300,000 a year in seed alone. Certified seed of the new Ariki (long-rotation) ryegrass became available to farmers for the first time in the 1966 season, and a new white clover, Grassland 4700, in field testing has shown outstanding winter production. Research leading to a successful pasture establishment on pumice soils of the central North Island has greatly increased production in this area. Rape and turnip seed, hitherto imported from overseas, are now produced locally, as the results of breeding and selection work done by the Crop Research Division, which in addition, has improved the quality of oats, barley, lupins, carrots, and lucerne.
Of particular interest are new high-yielding varieties of potato developed by the Division to withstand wind, drought, and competition from weeds, and a new high-yielding, good quality variety of pea which is resistant to wilt.
In collaboration with the Wheat Research Institute this Division has bred several new varieties of wheat specially suited for local conditions. Aotea, released in 1957, has shown an increase in yield of more than 20 percent over Cross 7, an improved variety developed 20 years previously. This increased yield has been worth more than $2 million in overseas exchange. A further significant development has been the combining of high yield and high quality in one variety—Hilgendorf 61—which although released only in 1961, was sown on a third of the total area in wheat in the 1965–66 season.
The Institute has devised methods of utilising sprouted wheat and of controlling the vitamin B content of flour.
Corky pit of apples and other deficiency diseases of fruit have been overcome, and investigations into storage and transport have vastly improved the quality of fruit arriving in the United Kingdom. A system of more intensive planting of apples on semi-dwarfing rootstock developed by the Fruit Research Division is attracting wide interest among commercial growers. It facilitates management, trees bear much earlier, and yields have been as high as 700 bushels per acre from five-year-old trees in trials.
EXPENDITURE ON RESEARCH—The National Research Advisory Council's recommendations for increased allocations of finance for research in 1965–66 provided for priority to be given to projects likely to be of benefit to primary production. It has been estimated that of $4,114,000 spent on agricultural and fisheries research in 1963, 91.1 percent was by Government Departments (mainly the Departments of Agriculture and Scientific and Industrial Research), 5.2 percent by universities and 3.7 percent by other organisations. The relation of research in agriculture to that in other fields is more comprehensively reviewed in a special article at the end of this issue of the Yearbook.
PASTURE GRASSES—Researches and experiments in regard to pasture grasses are regular features of the activities of both the Department of Agriculture and the Department of Scientific and Industrial Research. These experiments, which extend right on to individual farms throughout New Zealand, and are conducted in co-operation with the farmers themselves, are wide in their application, and cover all the major phases of pasture management, dealing in particular with such items as pasture mixtures, suitability as to soil types, methods of establishment and management, the efficient use of fertilisers, etc. The results are made available per medium of the Journal of Agriculture and such allied publications, as well as by special pamphlets which are distributed without charge. The farmer is thus enabled to avail himself of, and profit by, highly specialised knowledge and experience. In addition, a constant endeavour is being made not only to improve existing strains by such measures as seed certification and the provision of pedigree seed, but also to evolve new strains.
The following table shows the areas under artificially sown grasses, and includes areas of tussock, and other naturally established native grasses which have been permanently improved by oversowing with grasses and clovers.
| Year | Artificially Sown Pasture Grasses and Lucerne | |
|---|---|---|
| Cut for Seed, Hay or Silage | Not Cut for Seed, Hay, or Silage | |
* Includes 183,873 acres also sown with crops in 1963–64, 173,898 acres in 1964–65, and 183,247 acres in 1965–66. | ||
| acres | ||
| 1960–61 | 1,206,438 | 17,810,656 |
| 1961–62 | 1,160,010 | 18,087,564 |
| 1962–63 | 1,387,299 | 18,129,203 |
| 1963–64 | 1,335,768 | 18,431,705* |
| 1964–65 | 1,337,501 | 18,095,856* |
| 1965–66 | 1,480,485 | 18,321,728* |
TOPDRESSING—Topdressing with artificial fertilisers has been an important factor in the intensification of grassland farming. Most New Zealand soils need fertilisers,- especially phosphates. Superphosphate has been produced in New Zealand in increasing quantities since the 1880s, using rock phosphates from Nauru and Ocean Islands. Over the years there has been a marked changeover from straight superphosphate as the principal fertiliser for grassland and crops. Usual variants are serpentine superphosphate or aerial superphosphate, or a mixture of superphosphate with potash, additional sulphur or a trace element. Production of chemical fertilisers in the 1965 calendar year totalled 1,937,000 tons, the superphosphate content of this output being 1,585.000 tons. Approximately half of the sown grassland receives fertiliser annually, with about half the fertilised area covered by aerial distribution; about one third of the quantity is distributed by aeroplanes from 8,000 airstrips. Further information on aerial topdressing is contained in Section 11D. Total expenditure on topdressing of farm land comes to about $50 million annually, including fertiliser, transport, and application costs.
The use of lime to correct soil acidity and increase the availability of trace elements grew steadily from 1890 to a peak of 1,500,000 tons in 1945. Since then usage has dropped to less than 1,000.000 tons annually; there is now a more judicious application of lime and a greater use of trace elements such as molybdenum according to proved soil needs.
The following table gives particulars of areas of grassland topdressed during the latest six years.
| Year | Grassland Area Topdressed | |||
|---|---|---|---|---|
| With Artificial Fertiliser Only | With Lime Only | With Both Artificial Fertiliser and Lime | Total Grassland Topdressed | |
| acres | ||||
| 1960–61 | 8,208,571 | 356,299 | 1,249,202 | 9,814,072 |
| 1961–62 | 8,530,121 | 332,351 | 1,132,315 | 9,994,787 |
| 1962–63 | 8,637,506 | 318,779 | 985,801 | 9,942,086 |
| 1963–64 | 9,750,559 | 382,892 | 1,257,700 | 11,391,151 |
| 1964–65 | 10,846,274 | 392,946 | 1,606,679 | 12,845,899 |
| 1965–66 | 11,295,363 | 365,668 | 1,439,014 | 13,100,045 |
While topdressing in the past was practically confined to sown grasses on the flat and gently undulating country, the application of fertilisers to the surface-sown hill-country pastures in increasing quantities from aircraft has followed from the development of commercial aerial topdressing operations since 1949. Further information in this connection is contained in Section 11D.
SUBSIDIES, GRANTS, ETC.—For many years a number of grants and subsidies have been paid to the farming industry and allied organisations from public funds. In addition, agricultural and pastoral education is assisted financially by grants to the agricultural colleges.
Subsidies reached their peak during the war and immediate post-war years, details of which are available in earlier issues of the Yearbook. In more recent years there has been a considerable curtailment of this type of assistance to farmers.
The following table shows the payments during the latest three years.
| Subsidy, Grant, etc. | 1963–64 | 1964–65 | 1965–66 |
|---|---|---|---|
| $ | $ | $ | |
| Carriage of lime | 83,982 | 110,838 | 93,820 |
| Fertiliser transport subsidy | — | — | 1,419,918 |
| Flood and drought relief | 4,626 | 330,610 | 190,150 |
| Eradication of bovine tuberculosis— | |||
| Compensation for condemned animals, loss of production payments, hardship payments, and incidental costs | 1,447,548 | 1,580,968 | 1,417,928 |
| Subsidies to rabbit boards | 1,371,968 | 1,278,020 | 1,401,400 |
| Grants to rabbit boards | 379,200 | 389,504 | 433,456 |
| Subsidies to nassella tussock boards | 143,440 | 145,460 | 158,082 |
| Subsidies to county councils under the Noxious Weeds Act | 95,064 | 96,850 | 104,000 |
| Agricultural Engineering Institute | — | 30,000 | 73,000 |
| Herd Improvement Council | 58,554 | 59,166 | 67,166 |
| National Hydatids Council | 70,000 | 70,000 | 70,000 |
| Veterinary Services Council | 83,500 | 64,500 | 61,000 |
Comment on some of the more important items is necessary to explain their origin and significance.
Lime Subsidy—Since 30 November 1959 a subsidy on lime transport has been paid to farmers applying lime to newly developed land which is lime responsive, has not previously been limed,' and which is cultivated and sown for the first time; or, if it cannot be cultivated, which receives its first dressing of lime. Farmers meet full transport costs and are entitled to claim a refund from the Department of Agriculture.
Fertiliser Transport Subsidy—As from 1 August 1965 a subsidy on the transport of fertiliser (excluding lime) was introduced following a recommendation of the Agricultural Development Conference. The subsidy meets two-thirds of the cost of transport in excess of $3 per ton.
Rabbit Boards—In the post-war years a determined effort has been made to rid the country of rabbits which were lowering the carrying capacity of farmland and causing a loss of production running into many million dollars in value annually. Rabbit-infested areas were brought under rabbit board control. In 1948 there were 47 boards in the South Island and 61 in the North Island covering 18 million acres. By 1966 the whole of New Zealand was under the jurisdiction of boards. Rabbit board rates are subsidised by the Government, which also makes grants to rabbit boards. Good progress has been made towards the eradication of the rabbit and this goal is now in sight in many areas. Rabbit boards may undertake opossum and wallaby control.
Other Items—Most of the remaining items represent attempts to deal with specific problems, such as the eradication of bovine tuberculosis, which are of importance to the whole community but the handling of which would impose a serious burden on individuals or small groups, and the cost of the Government contribution towards running particular organisations, such as the Agricultural Engineering Institute.
AGRICULTURAL DEVELOPMENT CONFERENCE—An Agricultural Development Conference was held in 1963 and 1964. It was called as a result of the feeling in both producer and official circles that agricultural expansion should proceed at a more rapid rate and that a thorough examination should be made of the economic factors impeding such expansions. The first session of the conference in October 1963 approved the establishment of seven working parties to report to it on a number of such factors—farm finance, taxation, scale of farming, manpower, land valuation, noxious animals and weeds, and farm costs. The conference also endorsed the setting up of a Targets Committee to report on the increases in livestock numbers required to ensure that export income will expand at the pace required to maintain economic growth. The Targets Committee's report in 1964 stated that by 1972–73 list stock numbers would have to rise to 111 million ewe equivalents compared with 80 million in 1962–63. This would require an increase in stock numbers of 3.5 percent a year, an increase in pastoral production of 3.8 percent a year, and an increase in pastoral exports of 4.1 percent a year. These calculations assumed the continuance of 1962–63 export prices, and made allowance for the growth of other exports (mainly forest products), the expansion of import replacement industries, and also the expansion of invisible payments.
The targets were endorsed by the conference which also made a number of recommendations to the Government based on the conclusions of the eight working parties. These, in the main, did not recommend any sweeping administrative changes, but suggested a number of measures designed to improve incentives and encourage development. Stress was also laid on the need to expand advisory services to enable farmers to improve their efficiency.
AGRICULTURAL PRODUCTION COUNCIL—This Council has been set up following a recommendation of the Agricultural Development Conference in 1964. It comprises the Minister of Agriculture (Chairman), the Director-General of Agriculture (Deputy-Chairman), the Dominion President Federated Farmers of N.Z. (Inc.), the Chairmen of the three Producer Boards (Dairy, Meat, and Wool), and the Secretary to the Treasury. The main functions of the Council are to keep under review the livestock targets established by the Conference, to propose measures that will facilitate the attainment of targets and to consider any matters that may be referred to it by the Minister of Agriculture.
The Council has several standing Committees—Finance, Taxation, Manpower, and Farm Costs—and working parties on specific projects such as Lime and Fertiliser Usage and Dairy Beef and Veal Production.
The Council has also established 21 district agricultural advisory committees to identify factors limiting production in their districts and to propose remedial measures; to ensure that farmers and their advisers are fully aware of the taxation concessions and incentives, the terms and availability of finance, and the local “bench marks” for farming; and to keep the Council advised of local problems and circumstances.
The increased production required is being achieved. This year, 1967, is the half-way mark from 1962 to 1972, and livestock numbers are slightly above the desirable trend set by the Agricultural Development Conference.
FARM PRODUCTIVITY—Based on sophisticated techniques of grassland farming, agricultural production has continued to grow in a way which has resulted in increasing quantities of dairy products, meat, and wool for export. This has been accompanied by a marked rise in the productivity of labour employed in farming. Over the past decade production has increased by almost 2.5 percent a year, while the labour force declined from 130,000 to 119,000. A general improvement in management practices and a heavy rate of investment in land improvement have been the principal factors responsible for the expansion of output. A study by Professor B. P. Phillpott of Lincoln Agricultural College attributes two-thirds of the 2.6 percent average annual increase in output between 1920–1960 to capital investment and one-third to improved efficiency in the use of resources. The pattern is one of more intensive farming, for the area used for farming has not expanded since early in the present century. This has meant more intensive use of public and social capital. Since, with more intensive farming, there is a greater demand for any given operation in a defined area, recent decades have witnessed a very substantial growth of contract services for farmers in harvesting and in farm maintenance and improvement. The trend towards this division of function in farming activities was, of course, largely influenced by the production and availability of highly specialised new farm machinery which it would have been uneconomic for individual farmers to own.
FARM MACHINERY—The following table gives details of farm machinery for those items where a comparison is available. The figures for 1960 onwards relate to holdings of 10 acres and over, whereas figures for earlier years relate to holdings of 1 acre and over.
| Type of Machine | 1950 | 1952 | 1957 | 1960 | 1965 |
|---|---|---|---|---|---|
* This item covers only those machines actually used for threshing wheat or oats during the year specified. † Estimates, in 1953, 52,495; 1954, 55,623; 1955, 62,137; 1958, 73,499; 1959, 75,291. † Stationary shearing machine plants only. § Electric motors of over one-quarter horsepower only. | |||||
| Milking machines | 36,368 | 37,563 | 38,764 | 36,721 | 32,887 |
| Cream separators | 54,421 | .. | .. | 30,608 | 19,889 |
| Shearing machines— | |||||
| Plants | 18,791 | 20,810 | 26,592 | 28,922‡ | 32,032 |
| Stands | 40,536 | 44,472 | .. | 61,637 | 65,918 |
| Agricultural tractors† | 34,918 | 45,734 | 71,456 | 78,415 | 89,421 |
| Rotary hoes and garden tractors | 3,093 | 4,380 | .. | .. | .. |
| Electric motors | 110,683 | 123,439 | 139,080 | 122,758§ | 120,669 |
| Internal-combustion engines | 29,926 | 29,052 | .. | .. | .. |
| Threshing machines* | 1,900 | 1,965 | .. | .. | .. |
| Header harvesters | 3,121 | 3,130 | .. | 4,746 | 5,829 |
The figures show a continuation of the trend towards more intensive mechanisation of farm work that has been in evidence over a considerable period.
Milking Machines—Information concerning milking machines on farms was first collected in 1919, in which year there were 7,577 plants recorded. Since that year the use of milking machines has expanded rapidly. Of the 1,905,534 cows in milk on 31 January 1952, 1,799,375, or 94 percent, were milked by machine. At the end of January 1965 there were 32,887 milking machine plants in use, with a total of 186,585 sets of cups, compared with 36,721 machines and 183,329 sets of cups at 31 January 1960.
Agricultural Tractors—During the period from 1964 to 1966 the number of agricultural tractors employed on farms rose from 18,940 to 90,985. These figures do not include rotary hoes or garden tractors.
The classes of tractors on farm holdings of 10 acres and over outside borough boundaries at 31 January 1966 are given in the following table.
| Type | Number | Percentage of Total |
|---|---|---|
| Diesel oil— | ||
| Crawler | 7,223 | 7.9 |
| Wheel | 31,990 | 33.2 |
| Total | 39,213 | 41.1 |
| Petrol or kerosene— | ||
| Crawler | 6,398 | 7.0 |
| Wheel | 45,374 | 49.9 |
| Total | 51,772 | 56.9 |
GENERAL—Crops grown in New Zealand are in general sufficient to meet domestic needs for agricultural products, apart from tropical and subtropical products such as tea, sugar, cotton, etc., though a substantial proportion of wheat requirements is imported.
Local requirements of all the important fruits and berries grown in temperate zones are met by New Zealand orchard production. Citrus fruits are grown in the subtropical northern portion of the North Island, and grapes are also cultivated in certain localities with a favourable climate. In addition to meeting local demand, there is a substantial export trade in apples and pears.
Home gardens supply a considerable proportion of family requirements of vegetables, but there is a substantial area planted in market gardens, both inside and outside borough boundaries, to meet the needs of a growing population. Potato production is normally adequate but has occasionally to be supplemented by imports. The production of onions has been largely sufficient for local requirements of recent years.
Animals can be grazed in open pasture for the full 12 months of the year, but the winter growth of grass, except in certain favoured localities, requires to be supplemented in order to keep stock in good condition during the colder months, and in some districts supplementary fodders are necessary in the drier summer months. The supply of supplementary fodders is adequate both in quantity and in quality, so that New Zealand imports stock food to a very minor extent only.
Hay and silage crops are grown almost exclusively on the farms where they are consumed, though some districts specialise in the growing of certain other supplementary fodder crops. The bulk of the supplementary fodders other than grass and clover hay, and silage, is grown in the South Island, since the colder climate necessitates more extensive supplementary feeding than in the North Island.
The renewal and extension of pastures require the annual supply of very considerable quantities of grass seed, which are now grown almost entirely in New Zealand. There is a small import of certain classes of seeds, but this is almost negligible in relation to requirements; on the other hand, an appreciable export trade in some species of grass seeds has been developed.
GEOGRAPHIC DISTRIBUTION—Grain growing is localised to a considerable extent, the Canterbury statistical area, with its fertile plains, supplying in 1965–66, 64 percent of New Zealand's wheat yield, 54 percent of the oats threshed, and 63 percent of the barley yield. Maize growing is largely confined to certain portions of the East Coast (notably Cook County) and South Auckland - Bay of Plenty areas. The growing of peas for threshing is carried out extensively in Canterbury, and to a lesser extent in Marlborough and Wellington, Canterbury alone producing 75 percent of the total yield. In the season 1965–66, 71 percent of the area closed off for production of grass seed was in the Canterbury district.
The Canterbury statistical area also produces a large proportion of the commercial potato crop, followed by Wellington statistical area, while the growing of potatoes for the early market is of importance in a few relatively frost-free areas, particularly Pukekohe, near Auckland. The Pukekohe district also provides the Auckland area with a considerable portion of its vegetable requirements as well as being the main onion-growing area of the Island. Wellington city draws most of its vegetable supplies from the Otaki and Levin districts, while Ohakune, in the centre of the North Island, with climate and soils suitable for the production of cabbages and broccoli, supplies both Auckland and Wellington with these vegetables. Hastings has become a centre for the canning and processing of many vegetables.
In the South Island market gardening is carried on near the cities, and on the rich soils near Christchurch over 1,000 acres are devoted to this purpose; also to the immediate south of Oamaru and on the Taieri Plains just south of Dunedin there are other areas aggregating more than 1,000 acres. Nelson also produces considerable quantities of fresh and processed vegetables, most of which are marketed in Wellington.
Commercial orchards in New Zealand are largely confined to certain areas suited by climatic and soil conditions. The Nelson and Hawke's Bay districts are notable for their apple and pear orchards, a high percentage of the crops from these districts normally being exported. Central Otago is well suited to the growing of stone fruits, notably apricots. Hawke's Bay and Nelson are also noted for their peach production. In certain particularly warm areas of the North Island with suitable soils citrus fruits are grown, the principal areas being Kerikeri, in Northland; Tauranga, in the Bay of Plenty; and Gisborne.
Grape growing is of importance in central Auckland and Hawke's Bay, and to a lesser extent in South Auckland. Tobacco growing is confined to the Nelson district, hop growing also being concentrated in this area.
The area devoted to each of the principal crops in the 1965–66 season and the percentage distributions for each crop by statistical areas and North and South Island are given in the following table.
| Crop | Total Area | Northland | Central Auckland | South Auckland-Bay of Plenty | East Coast | Hawke's Bay | Taranaki | Wellington | North Island |
|---|---|---|---|---|---|---|---|---|---|
| For threshing— | acres | percentage of crop area | |||||||
| Wheat | 199,525 | – | – | – | 0.1 | 1.5 | 0.1 | 4.6 | 6.3 |
| Oats | 38,704 | – | – | - - | 0.1 | 0.5 | – | 2.5 | 3.1 |
| Barley | 83,983 | – | – | 0.5 | 1.4 | 5.2 | 0.8 | 16.6 | 24.5 |
| Maize | 8,069 | 1.1 | 0.8 | 7.1 | 80.0 | 10.4 | – | – | 99.4 |
| Peas (not canning) | 28,786 | – | – | – | – | 2.1 | – | 11.7 | 13.8 |
| Oats— | |||||||||
| For chaff, hay, or silage | 19,477 | 1.7 | 0.7 | 5.1 | 0.3 | 1.7 | 2.0 | 4.7 | 16.2 |
| Fed off, cut green, abandoned, etc. | 27,539 | 0.3 | 0.3 | 1.0 | 0.7 | 2.5 | 0.3 | 3.4 | 8.5 |
| Root Crops— | |||||||||
| Potatoes | 24,434 | 0.8 | 16.3 | 3.6 | 0.8 | 5.6 | 1.0 | 20.6 | 48.7 |
| Swedes | 212,906 | 0.4 | 0.1 | 11.9 | 1.0 | 1.4 | 1.3 | 5.9 | 22.0 |
| Turnips | 229,895 | 1.0 | 0.9 | 6.6 | 0.9 | 3.4 | 0.5 | 5.8 | 19.1 |
| Turnips and rape mixed | 30,647 | 0.5 | 0.7 | 1.4 | 0.2 | 3.0 | 0.1 | 4.2 | 10.1 |
| Vegetable crops for processing | 6,151 | 0.1 | 1.8 | 0.5 | 24.1 | 56.7 | 0.1 | 2.6 | 85.9 |
| Peas for vining (including canning and quick freeze) | 12,136 | 0.1 | – | 0.1 | 7.0 | 59.5 | – | 2.7 | 69.4 |
| Green Fodder— | |||||||||
| Rape | 101,377 | 0.1 | – | 0.8 | 0.1 | 6.3 | 0.1 | 3.8 | 11.2 |
| Chou moellier, kale | 127,749 | 0.6 | 0.7 | 8.4 | 0.4 | 14.8 | 2.3 | 26.5 | 53.7 |
| Grasses, clover and lucerne for seed | 200,824 | 0.3 | 0.1 | 0.4 | 0.5 | 3.7 | 0.1 | 4.0 | 9.1 |
| Grasses and clovers for hay and silage | 1,097,416 | 6.5 | 7.0 | 36.1 | 0.5 | 3.6 | 10.2 | 8.5 | 72.4 |
| Lucerne for hay or silage | 182,245 | 0.2 | 0.1 | 7.9 | 0.4 | 3.4 | 0.8 | 2.6 | 15.4 |
| Commercial orchards | 18,274 | 3.6 | 13.7 | 7.0 | 3.0 | 23.6 | 0.1 | 0.9 | 51.9 |
| Market gardens | 12,936 | 2.0 | 36.7 | 6.1 | 1.4 | 9.5 | 0.8 | 17.4 | 73.9 |
| Crop | Total Area | Marlborough | Nelson | Westland | Canterbury | Otago | Southland | South Island |
|---|---|---|---|---|---|---|---|---|
| For threshing— | acres | percentage of crop area | ||||||
| Wheat | 199,525 | 1.5 | 0.1 | – | 63.3 | 15.6 | 13.2 | 93.7 |
| Oats | 38,704 | 1.1 | 0.3 | – | 57.2 | 16.7 | 21.6 | 96.9 |
| Barley | 83,983 | 4.1 | 2.5 | – | 62.0 | 5.6 | 1.3 | 75.5 |
| Maize | 8,069 | 0.6 | – | – | – | – | – | 0.6 |
| Peas (not canning) | 28,786 | 7.1 | 0.2 | – | 75.7 | 2.7 | 0.5 | 86.2 |
| Oats— | ||||||||
| For chaff, hay, or village | 19,477 | 1.8 | 1.3 | – | 32.8 | 26.3 | 21.6 | 83.8 |
| Fed off, cut green, abandoned, etc. | 27,539 | 7.8 | 2.9 | 0.2 | 53.5 | 21.3 | 5.8 | 91.5 |
| Root Crops— | ||||||||
| Potatoes | 24,434 | 1.3 | 2.4 | – | 38.0 | 6.2 | 3.4 | 51.3 |
| Swedes | 212,906 | 0.5 | 1.4 | 0.9 | 20.3 | 20.2 | 34.7 | 78.0 |
| Turnips | 229,895 | 2.0 | 1.8 | 0.7 | 46.0 | 18.4 | 12.0 | 80.9 |
| Turnips and rape mixed | 30,647 | 2.7 | 1.0 | 0.6 | 29.6 | 21.9 | 34.1 | 89.9 |
| Vegetable crops for processing | 6,151 | 4.0 | 1.7 | – | 4.8 | 2.1 | 1.5 | 14.1 |
| Peas for vining (including canning and quick freeze) | 12,136 | 7.3 | 8.2 | – | 15.1 | – | – | 30.6 |
| Green Fodder— | ||||||||
| Rape | 101,377 | 4.0 | 0.7 | — | 50.4 | 24.2 | 9.5 | 88.8 |
| Chou moellier, kale | 127,749 | 1.1 | 0.8 | 0.2 | 12.7 | 12.5 | 19.0 | 46.3 |
| Grasses, clover and lucerne for seed | 200,824 | 4.5 | 0.9 | – | 71.1 | 7.6 | 6.8 | 90.9 |
| Grasses and clovers for hay and silage | 1,097,416 | 1.1 | 1.8 | 0.7 | 10.3 | 5.5 | 8.2 | 27.6 |
| Lucerne for hay or silage | 182,245 | 5.2 | 1.0 | 0.1 | 49.0 | 24.3 | 5.0 | 84.6 |
| Commercial orchards | 18,274 | 3.0 | 23.3 | – | 4.8 | 17.0 | – | 48.1 |
| Market gardens | 12.936 | 0.6 | 7.7 | – | 8.3 | 9.3 | 0.2 | 26.1 |
STATISTICS—Detailed statistics of crops are contained in the annual statistical report on Farm Production issued annually by the Department of Statistic?. Unless otherwise stated, the statistics quoted in this subsection relate to holdings of 10 acres and over situated outside borough boundaries.
BUSHEL WEIGHTS—For statistical and other purposes it is at times necessary to convert bushel units to a weight basis. For New Zealand produce and fruit, conversion is effected by using the following weights per bushel for the commodities mentioned.
| Produce | Weight of Bushel | Fruit | Weight of Bushel |
|---|---|---|---|
| lb | lb | ||
| Wheat | 60 | Apples | 40 |
| Oats | 40 | Pears | 38 |
| Barley | 50 | Quinces | 40 |
| Maize | 56 | Peaches | 42 |
| Peas | 60 | Nectarines | 42 |
| Ryecorn | 56 | Apricots | 42 |
| Beans | 65 | Plums | 42 |
| Grass seed | 20 | Cherries | 42 |
| Oranges | 42–43 | ||
| Lemons (uncured) | 42 |
AREA UNDER CULTIVATION—A general summary of the areas under cultivation is given in the following table. The statistics quoted in this and other tables in this subsection relate to holdings of 10 acres and upwards outside borough boundaries.
| Year | Pasture Land* | Field Crops | Plantations | Orchards | Lying Fallow | Other Cultivated Land | Total Cultivated Land |
|---|---|---|---|---|---|---|---|
* Excluding areas of grasses and clovers cut for seed, hay, or silage, and crops sown together with grasses, which have been included in field crops. † Includes market gardens and nurseries (previously in “Other Cultivated Land”), and excludes domestic orchards † Areas in residences, private grounds, gardens and domestic orchards are excluded. § Includes land prepared for grassland but not sown at 31 January. | |||||||
| acres (000) | |||||||
| 1960–61 | 17,617 | 2,426 | 938 | 33 | 139 | .. | 21,153 |
| 1961–62 | 17,886 | 2,379 | 991 | 31† | 143 | .. | 21,429‡ |
| 1962–63 | 17,951 | 2,594 | 1,024 | 32† | 123 | .. | 21,725‡ |
| 1963–64 | 18,248 | 2,561 | 1,041 | 32† | 112 | .. | 21,994‡ |
| 1964–65 | 17,922 | 2,591 | 1,035 | 33† | 126 | 106 | 21,813‡ |
| 1965–66 | 18,385§ | 2,692 | 1,056 | 33† | 72 | 123 | 22,361‡ |
In the following pages statistics of the principal crops are quoted with explanatory comment. In addition to summary tables, covering in each instance a range of related items, important individual crops are discussed under separate headings.
PRINCIPAL FIELD CROPS—The following table shows the areas under each of the principal field crops for the years stated.
| Crop | 1961–62 | 1962–63 | 1963–64 | 1964–65 | 1965–66 |
|---|---|---|---|---|---|
* Including turnips and rape mixed. † Rape, kale, and chou moellier only. † Includes linseed, mangolds, and tobacco. §Includes crops sown together with grasses, 183,247 acres and areas used for second crops, 9,015 acres | |||||
| acres | |||||
| Wheat | 191,486 | 230,491 | 207,860 | 194,430 | 206,146 |
| Oats | 81,987 | 64,600 | 73,075 | 97,025 | 85,720 |
| Barley | 89,779 | 97,429 | 103,961 | 102,397 | 98,043 |
| Maize | 14,698 | 15,753 | 17,709 | 16,158 | 13,920 |
| Peas for threshing | 28,030 | 29,824 | 29,971 | 27,240 | 28,786 |
| Linen flax | 651 | 681 | 501 | 283 | 446 |
| Potatoes | 22,506 | 22,409 | 25,045 | 25,969 | 24,434 |
| Turnips and swedes* | 459,754 | 426,923 | 459,620 | 483,896 | 473,448 |
| Onions | 1,434 | 1,880 | 2,376 | 1,861 | 1,750 |
| Vegetable crops for processing | 16,357 | 16,095 | 17,444 | 15,407 | 18,287 |
| Green fodder† | 268,617 | 251,076 | 246,315 | 250,963 | 229,126 |
| Grasses, clovers, and lucerne for seed | 146,126 | 265,520 | 187,612 | 136,501 | 200,824 |
| Grasses and clovers for hay or silage | 867,602 | 962,142 | 988,882 | 1,049,218 | 1,097,416 |
| Lucerne for hay or silage | 146,282 | 159,637 | 159,274 | 151,782 | 182,245 |
| Other crops‡ | 43,688 | 49,997 | 52,452 | 46,429 | 40,550 |
| Totals | 2,378,997 | 2,594,457 | 2,572,097 | 2,599,559 | 2,701,141§ |
The figures quoted in the foregoing table in respect of wheat, oats, barley, maize, and peas relate to the total areas under these crops for grain or fodder. A considerable portion of the area under cereal crops, particularly oats, is cut for chaff, hay, or silage, or is fed off. In regard to peas it should be noted that additional areas of this crop for domestic consumption in the form of green peas are included under market gardens and crops for processing.
GRAIN AND SEED CROPS—Details of areas for threshing, total yields, and yields per acre of the principal grain and seed crops during recent years are set out in the following table.
| Year | Wheat | Oats | Barley | Maize | Peas |
|---|---|---|---|---|---|
* Estimated. | |||||
| Areas for Threshing (Acres) | |||||
| 1961–62 | 186,288 | 34,682 | 77,116 | 7,344 | 28,030 |
| 1962–63 | 225,748 | 20,877 | 87,432 | 7,898 | 29,824 |
| 1963–64 | 203,960 | 26,573 | 93,980 | 9,649 | 29,971 |
| 1964–65 | 183,996 | 38,772 | 87,035 | 9,685 | 27,240 |
| 1965–66 | 199,525 | 38,704 | 83,983 | 8,069 | 28,786 |
| 1966–67* | 219,000 | 31,000 | 88,000 | 7,000 | .. |
| Total Yields (Bushels (000)) | |||||
| 1961–62 | 7,835 | 1,886 | 3,561 | 545 | 763 |
| 1962–63 | 9,156 | 1,028 | 4,202 | 609 | 1,001 |
| 1963–64 | 10,068 | 1,548 | 5,776 | 744 | 1,100 |
| 1964–65 | 9,198 | 2,494 | 4,670 | 927 | 878 |
| 1965–66 | 10,721 | 2,399 | 5,030 | 762 | 1,058 |
| 1966–67* | 11,826 | 1,922 | 5,456 | ||
| Yields per Acre (Bushels) | |||||
| 1961–62 | 42.06 | 54.38 | 46.17 | 74.17 | 27.22 |
| 1962–63 | 40.56 | 49.25 | 48.05 | 77.10 | 33.55 |
| 1963–64 | 49.36 | 58.24 | 61.46 | 77.12 | 36.70 |
| 1964–65 | 49.99 | 64.32 | 53.65 | 95.67 | 32.22 |
| 1965–66 | 53.73 | 61.97 | 59.89 | 94.40 | 36.76 |
| 1966–67* | 54.00 | 62.00 | 62.00 | ||
WHEAT—As a result of the increase in the overall price of wheat, combined with the release of the high yielding varieties Arawa and Aotea, and also to other economic factors, the acreage threshed has moved up in recent years towards pre-war levels.
The following diagram shows the fluctuations that have occurred in the area sown in wheat, together with the total yield and the average yield per acre.
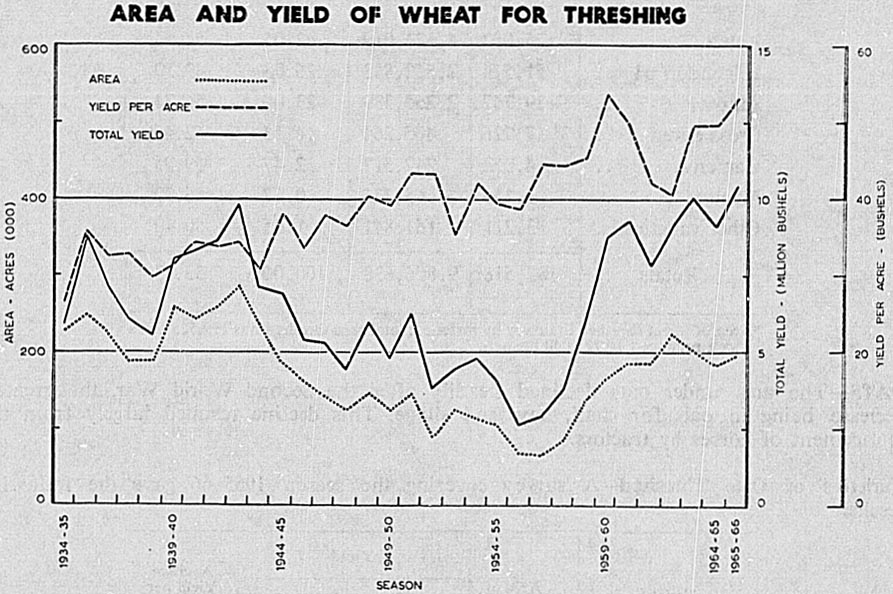
AREA AND YIELD OF WHEAT FOR THRESHING
Wheat Board—Control of the importation of wheat and flour and of the distribution of both imported and locally produced wheat rests with the Wheat Board. The operations of this Board, which consists of representatives of flourmillers, wheat growers, and bakers, with the Minister of Industries and Commerce as Chairman, and his nominee from the Department of Industries and Commerce as Deputy Chairman, are governed by the Wheat Board Act 1965.
All New Zealand milling wheat is purchased from farmers by the Wheat Board through the agency of the grain merchants acting as brokers for the Board. The Board is responsible for the importation of any wheat and flour and the distribution of imported poultry wheat in the North Island; in the South Island poultry wheat is not controlled. Its functions also include arrangements for the processing of wheat and the sale of flour to merchants, bakers, pastrycooks, grocers, and others.
The annual consumption of wheat in New Zealand approximates 16 million bushels—some 10 1/2 million bushels being required for flour and cereal foods, and the balance for poultry food and seed. Over the five seasons ended 1965–66 the annual local production of wheat averaged 9,395,602 bushels, while imports over the five years ended 1966 averaged 6,045,400 bushels annually.
Varieties of Wheat—The choice of wheat varieties for sowing is influenced by their suitability to local conditions of climate, soil type, etc. Wheat growers receive valuable guidance regarding suitable varieties as the result of research work and field trials undertaken by the Crop Research Division, Department of Scientific and Industrial Research, the Wheat Research Institute, and the Department of Agriculture. The survey of varieties of wheat grown for threshing is now carried out each year. The 1966 survey which related to wheat sown in 1965 and harvested in 1966 showed the following results.
| Variety | Area (Acres) | Yield | Average Yield per Acre (Bushels) | |
|---|---|---|---|---|
| Bushels | Percentage of Total Production | |||
* Area of wheat threshed in survey by varieties; total area threshed was 199,525 acres which produced 10,721,040 bushels. | ||||
| Aotea | 75,052 | 4,123,019 | 42.05 | 54.94 |
| Hilgendorf 61 | 51,574 | 2,552,883 | 26.03 | 49.50 |
| Arawa | 39,747 | 2,255,339 | 23.00 | 56.74 |
| Cross Seven | 7,726 | 405,264 | 4.13 | 52.45 |
| Gamenya | 4,052 | 242,517 | 2.47 | 59.85 |
| Mendos | 1,156 | 65,775 | 0.67 | 56.90 |
| Other varieties | 3,211 | 161,841 | 1.65 | 50.40 |
| Totals | 182,518* | 9,806,638 | 100.00 | 53.73 |
OATS—The area under oats declined steadily after the Second World War, the greatest decrease being in oats for chaff, hay, and silage. This decline resulted largely from the replacement of horses by tractors.
Varieties of Oats Threshed—A survey covering the season 1965–66 gave the following results:
| Variety | Area (Acres) | Yield | Average Yield per Acre (Bushels) | |
|---|---|---|---|---|
| Bushels | Percentage of Total Production | |||
* Area of oats threshed in survey by varieties; total area threshed was 38,704 acres which produced 2,398,612 bushels. | ||||
| Onward | 19,160 | 1,334,254 | 64.09 | 69.64 |
| Grey Winter | 3,423 | 140,318 | 6.74 | 40.99 |
| Black Supreme | 3,297 | 200,632 | 9.64 | 60.85 |
| Algerian | 2,995 | 132,576 | 6.37 | 44.27 |
| Achilles | 1,122 | 68,415 | 3.29 | 60.98 |
| Other | 3,508 | 205,654 | 9.87 | 58.60 |
| Totals | 33,505* | 2,081,849 | 100.00 | 62.14 |
More than half a million bushels of oats are milled each year to produce some 3,000 short tons of rolled oats, and 2,900 short tons of oatmeal and proprietary oaten foods.
BARLEY—Production of barley has increased in recent years and is sufficient to meet domestic demand. In the 10 seasons 1956–57 to 1965–66 the average area of barley sown was 90,000 acres of which 74,000 were harvested for grain, most of the remainder being used for green feed. In the 1964–65 season there were 4,669,609 bushels of barley threshed and 5,029,842 bushels in the 1965–66 season. During 1964–65, 1,627,000 bushels were used for malting and 863,074 bushels for stock food.
Varieties grown in the 1965–66 season were as set out below.
| Variety | Area (Acres) | Yield | Average Yield per Acre (Bushels) | |
|---|---|---|---|---|
| Bushels | Percentage of Total Production | |||
* Area of barley threshed in survey by varieties; total area threshed was 83,983 acres. | ||||
| Carlsberg | 30,518 | 1,883,568 | 42.92 | 61.72 |
| Kenia | 21,135 | 1,302,006 | 29.67 | 61.60 |
| Research | 19,717 | 1,130,779 | 25.77 | 57.35 |
| Other varieties | 1,757 | 71,934 | 1.64 | 40.94 |
| Totals | 73,127* | 4,388,287 | 100.00 | 60.01 |
PEAS—The area of peas for threshing has fallen considerably since the peak of 50,000 acres averaged over the three seasons 1946–47 to 1948–49, the average area for the five years 1961–62 to 1965–66 being 28,762 acres. There have been fluctuations in the export figures for this commodity. In 1949 nearly 850,000 bushels were exported, whereas by 1953 the amount had fallen to approximately 370,000 bushels. Over the five years 1962 to 1966 exports averaged 531,419 bushels annually.
Varieties of peas grown in the 1965–66 season were as under.
| Variety | Area (Acres) | Yield | Average Yield per Acre (Bushels) | |
|---|---|---|---|---|
| Bushels | Percentage of Total Production | |||
* Area of peas threshed in survey by varieties; total area threshed was 28,786 acres which produced 1,058,126 bushels. | ||||
| Garden varieties | 8,974 | 319,308 | 35.18 | 35.58 |
| Field varieties— | ||||
| Blue Boiling | 1,435 | 52,120 | 5.74 | 36.32 |
| Maple | 13,079 | 492,877 | 54.30 | 37.68 |
| White | 1,275 | 43,374 | 4.78 | 34.02 |
| Totals | 24,763* | 907,679 | 100.00 | 36.65 |
The foregoing figures exclude green peas grown for market or processing (e.g., canning and quick freezing). There has been an increasing use of quick-frozen peas.
POTATOES—The production of potatoes is usually adequate to meet the home market.
Under the Potato Growing Industry Act 1950 a Potato Board was established consisting of seven members, three of whom are representative of the growers on an elective basis, three nominated by the New Zealand Grain, Seed, and Produce Merchants' Federation (Incorporated), and one an officer of the Public Service acting in an advisory capacity.
The principal functions of the Board are to ensure that adequate supplies of main-crop potatoes are available for consumption in New Zealand, and for that purpose to enter into contracts with growers for the growing of main-crop potatoes. The Act provides that the Board may impose a levy not exceeding $3 per ton on main-crop potatoes sold by growers, the proceeds of which are to be applied by the Board in payment of charges, etc., for which it may become liable in the exercise of its functions.
The Board undertakes to compensate contract growers for any declared unsold number one grade contract produce held by growers at the end of the season. For the 1965–66 season the rate involved varies according to varieties from $16 to $28 per ton in the South Island and $20 to $32 per ton in the North Island. These rates are the same as for the previous season.
Figures for area and yield of potatoes for the latest five years are as follows.
| Year | Area | Total Yield | Yield per Acre |
|---|---|---|---|
| acres | tons | tons | |
| 1961–62 | 22,506 | 191,244 | 8.50 |
| 1962–63 | 22,409 | 181,425 | 8.10 |
| 1963–64 | 25,045 | 200,786 | 8.02 |
| 1964–65 | 25,969 | 243,064 | 9.36 |
| 1965–66 | 24,434 | 230,858 | 9.45 |
The estimated area for 1966–67 was 21,000 acres.
ONIONS—Areas in, and yields of, onions for the latest five years are as follows.
| Year | Area | Total Yield | Yield per Acre |
|---|---|---|---|
| acres | tons | tons | |
| 1961–62 | 1,434 | 13,745 | 9.59 |
| 1962–63 | 1,880 | 21,003 | 11.17 |
| 1963–64 | 2,376 | 31,201 | 13.13 |
| 1964–65 | 1,861 | 19,110 | 10.27 |
| 1965–66 | 1,750 | 21,208 | 12.12 |
LINSEED—The area under this crop has fluctuated considerably over a long period. The highest level of 24,437 acres was reached in 1951–52. In the processing of linseed, the linseed oil is extracted while the residue provides a valuable concentrate for stock food. A small quantity of unprocessed linseed is also used for this purpose.
Varieties of linseed grown in the 1965–66 season were as follows:
| Variety | Area | Yield | Average Yield per Acre | |
|---|---|---|---|---|
| Weight | Percentage of Total Production | |||
* This is the total area surveyed. The total area of linseed grown in the 1965–66 season is not available. | ||||
| acres | cwt | percent | cwt | |
| Redwood | 6,481 | 105,992 | 98.28 | 16.35 |
| Rocket | 114 | 1,207 | 1.12 | 10.59 |
| Others | 46 | 649 | 0.60 | 14.09 |
| Totals | 6,641* | 107,848 | 100.00 | 16.24 |
SUPPLEMENTARY FODDER CROPS—The following table gives the areas of the supplementary fodder crops.
| Year | Grasses and Clovers, Including Lucerne for Hay or Silage | Cereal Crops | Rape, Kale, and Chou Moellier | Swedes, Turnips, Turnips and Rape | Total Area of Fodder Crops* |
|---|---|---|---|---|---|
* Excludes small areas of other minor fodder crops. | |||||
| acres | |||||
| 1960–61 | 994,332 | 75,523 | 287,992 | 448,489 | 1,806,336 |
| 1961–62 | 1,013,884 | 72,520 | 268,617 | 459,754 | 1,814,775 |
| 1962–63 | 1,121,779 | 66,318 | 251,076 | 426,923 | 1,866,096 |
| 1963–64 | 1,148,156 | 68,443 | 246,315 | 459,620 | 1,922,534 |
| 1964–65 | 1,201,000 | 90,522 | 250,963 | 483,896 | 2,026,381 |
| 1965–66 | 1,279,661 | 71,321 | 229,126 | 473,448 | 2,053,556 |
In 1965–66 grasses and clovers cut for hay or silage totalled 1,097,416 acres and lucerne 182,245 acres. Oats was the only cereal crop utilised in any quantity for this purpose. Oats also was the principal cereal crop fed off to stock. The area of oats cut for chaff, hay, or silage or fed off amounted to 46,432 acres. The principal green-fodder crops apart from oats are rape (101,377 acres) and chou moellier, including kale (127,749 acres). Swedes and turnips are the principal root crops grown in New Zealand, the total area sown in these crops in 1965–66 being 473,448 acres (including 30,647 acres of turnips and rape mixed).
SEED CERTIFICATION—The Department of Agriculture has a seed certification scheme covering such crops as potatoes, wheat, perennial ryegrass, Italian ryegrass, short rotation (H1) ryegrass, cocksfoot, timothy, browntop, Phalaris tuberosa, white clover, cowgrass (broad red clover), Montgomery red clover, subterranean clover, oats, barley, ryecorn, sweet blue lupins, onions, chou moellier, rape, kale, turnip, and swede seeds. Selected strains are multiplied under the Department's certification scheme through the stages of certified “Pedigree” seed and certified “Mother” seed to certified “Standard” or “Permanent Pasture” seed. These seeds are sold through the usual commercial channels.
GRASS SEED—Of the total area of grasses, clovers, and lucerne cut for seed during 1965–66, 85 percent was in the South Island.
The areas of grass, clover, and lucerne crops harvested for seed, distinguishing the principal varieties, are given in the following table.
| Crop | 1961–62 | 1962–63 | 1963–64 | 1964–65 | 1965–66 |
|---|---|---|---|---|---|
| Ryegrass— | acres | ||||
| Perennial | 35,355 | 91,397 | 54,116 | 42,344 | 62,977 |
| Italian | 4,990 | 8,830 | 7,851 | 8,801 | 11,197 |
| Short rotation (H1) | 16,301 | 21,518 | 12,838 | 11,689 | 16,892 |
| Cocksfoot | 11,528 | 13,573 | 9,583 | 8,174 | 8,731 |
| Chewings fescue | 2,844 | 2,683 | 1,311 | 1,127 | 1,507 |
| Crested dogstail | 6,111 | 8,280 | 5,893 | 4,656 | 4,866 |
| Red clover (including cowgrass) | 14,892 | 17,957 | 12,487 | 14,249 | 19,943 |
| White clover | 39,732 | 83,831 | 71,476 | 31,903 | 55,541 |
| Lucerne | 6,869 | 9,535 | 5,586 | 4,219 | 10,966 |
| Other grasses and clovers | 7,504 | 7,916 | 6,471 | 9,339 | 8,204 |
| Totals | 146,126 | 265,520 | 187,612 | 136,501 | 200,824 |
Quantities (in dressed weights) of grass and clover seeds treated by machine dressing plants for the latest three years are given below.
| Type of Seed | Unit | Quantity (Year Ended 31 October) | ||
|---|---|---|---|---|
| 1964 | 1965 | 1966 | ||
| Ryegrass— | ||||
| Perennial | bush | 1,356,245 | 980,180 | 1,363,437 |
| Short rotation (H1) | bush | 321,491 | 300,204 | 403,836 |
| Italian (including W. Wolths) | bush | 179,456 | 196,054 | 228,855 |
| Cocksfoot | lb | 2,026,922 | 1,416,802 | 1,578,616 |
| Chewings fescue | lb | 285,869 | 193,905 | 295,988 |
| Crested dogstail | lb | 2,257,987 | 1,399,882 | 1,082,233 |
| Browntop | lb | 163,563 | 241,785 | 417,068 |
| Timothy | lb | 302,226 | 547,721 | 797,822 |
| White clover | lb | 9,923,911 | 5,303,582 | 5,829,564 |
| Suckling clover | lb | 209,190 | 213,396 | 118,204 |
| Suckling white mixture | lb | 835,250 | 579,570 | 351,895 |
| Cowgrass (including broad red clover) | lb | 822,771 | 1,519,565 | 1,573,503 |
| Montgomery red clover | lb | 798,660 | 612,926 | 1,365,184 |
| Lucerne | lb | 456,622 | 306,711 | 733,407 |
| Other grasses and clovers | lb | 230,136 | 219,586 | 257,983 |
Large quantities of grass and clover seed have been exported during recent years, especially to the United Kingdom, Australia, and the United States of America. Details of the volume and value of exports during recent years will be found in Section 22B of this issue.
GARDENS AND PLANTATIONS—The following table sets out the acreages for market gardens, plantations, etc. Forest Service plantations are included in these figures. The statistics relate only to holdings of 10 acres and over outside boroughs. In 1956–57 the area of market gardens in the 1–9 acre group represented 19 percent of the total acreage; in the case of nurseries the percentage was 21 percent and for private gardens 5 percent. Plantations were scarcely affected, being well under 1 percent. Figures include berry-fruit gardens.
| Year | Market Gardens* | Nurseries | Private Gardens, etc. | Plantations |
|---|---|---|---|---|
* Excluding crops for processing. | ||||
| acres | ||||
| 1960–61 | 11,540 | 1,354 | .. | 942,427 |
| 1961–62 | 13,270 | 1,317 | .. | 991,095 |
| 1962–63 | 13,779 | 1,431 | .. | 1,024,353 |
| 1963–64 | 12,991 | 1,758 | .. | 1,041,476 |
| 1964–65 | 14,579 | 1,763 | 102,446 | 1,034,926 |
| 1965–66 | 12,936 | 1,848 | 122,656 | 1,056,274 |
Commercial Gardens—The Department of Agriculture estimates that approximately 2,700 vegetable growers were cultivating a total area of approximately 45,000 acres in 1964. Included in this figure are approximately 19,000 acres used exclusively for growing crops for processing.
Commercial berry-fruit gardens are surveyed every five years by the Department of Agriculture, the last such survey being in 1960. The areas then being grown were raspberries, 498 acres; strawberries, 300 acres; black currants, 51 acres; gooseberries, 48 acres; boysenberries, 25 acres; and loganberries, 13 acres. The production of berry fruits in the 1962–63 season were raspberries, 965 tons; strawberries, 1,565 tons; black currants, 68 tons; gooseberries, 71 tons; boysenberries, 71 tons; and loganberries, 48 tons. The greatest concentration of gardens is in Canterbury, near Christchurch, and at Waimate, with a combined total of 281 acres. Raspberries account for most of the 188 acres in the Nelson district. The mixed-berry gardens of the Wairarapa total 112 acres. In the vicinity of Auckland city some 79 acres of strawberries are grown. Other major centres of berry-fruit growing are Central Otago, 68 acres; Manawatu, 57 acres; and Hawke's Bay, 59 acres. Gooseberries are little grown commercially except in the Wairarapa (39 acres). These estimates include those grown in boroughs. The only berry fruit for which there is an organised marketing scheme is the raspberry, for which local marketing committees have been established in Nelson (since 1940) and in Canterbury and Otago (since 1959), while a Central Council of Raspberry Growers was created by the Raspberry Marketing Regulations 1950 to coordinate marketing by the three district committees.
Nurseries—The number of nurseries registered at 31 December 1966 totalled 645 and these covered 2,124 acres.
Home Garden Production—Home garden production, on which a question was asked for the first time at the 1956 Census, is dealt with in the next table. This question was not asked again in subsequent censuses.
| Proportion of Requirements | Potatoes Grown | Other Vegetables Grown | ||
|---|---|---|---|---|
| Number of Households | Per cent of Total Specified | Number of Households | Percent of Total Specified | |
| All | 48,084 | 8.73 | 45,498 | 8.27 |
| Three-quarter | 24,293 | 4.41 | 54,395 | 9.88 |
| One-half | 46,251 | 8.40 | 69,901 | 12.70 |
| One-quarter | 56,866 | 10.33 | 56,604 | 10.29 |
| Under one-quarter | 101,288 | 18.40 | 107,329 | 19.50 |
| Nil | 273,811 | 49.73 | 216,630 | 39.36 |
| Not specified | 12,459 | – | 12,695 | – |
| Totals | 563,052 | 100.00 | 563,052 | 100.00 |
Of the specified cases 49.73 percent of householders did not grow potatoes and 39.36 percent did not grow other types of vegetables.
Of the total households where a return was made 62 percent kept a garden and 38 percent had no garden. Where only 37 percent of dwellings with one occupant returned “yes”, this rose sharply to 59 per cent of households with two occupants. The proportions answering “yes” to this question increased continuously from two to six occupants, and declined from seven occupants onwards.
ORCHARDS AND THE FRUIT INDUSTRY—Apples and pears are the main fruits, the principal growing areas being Nelson and Hawke's Bay. Peach and plum orchards are distributed over Nelson, Hawke's Bay, Central Otago, and near Auckland. Central Otago, with its hot summers and severe winters, produces the greater part of the English plums, apricots, and cherries. The coastal strip from North Auckland, through the Bay of Plenty, to Gisborne is sufficiently mild for the production of citrus and other subtropical fruits such as passionfruit, tamarilloes, and Chinese gooseberries.
The area in commercial holdings of 10 acres and over outside borough boundaries returned as under fruit trees was given as 18,274 acres at 31 January 1966.
During 1963 the Department of Agriculture made the third comprehensive field survey of fruit trees in commercial orchards. This survey covered all orchards with 100 or more deciduous fruit trees, over 50 citrus trees, or over half an acre in berry fruits, grapes, subtropical fruits, and mixed orchards of half an acre and over. The Horticulture Division of the Department of Agriculture has supplied the following numbers of fruit trees of principal kinds in commercial orchards based on 1963 survey figures: apple, 1,208,000; pear, 174,000; quince, 3,400; peach, 336,000; nectarine, 34,000; apricot, 129,000; plum, 97,000; cherry, 18,200; lemon, 33,400; orange, 66,400; grapefruit, 38,000; mandarin, 27,000; tangelo, 4,400.
The 1963 survey showed that the total number of fruit trees had increased since the second survey of 1958. There were 121,000 more apple trees and 30,000 more pear trees, but 10,600 fewer grapefruit trees, 8,000 fewer lemon trees, and 3,000 fewer quince trees.
A survey by the Department of Agriculture in 1960 of all vineyards containing at least half an acre of vines covered 161 vineyards. The total area in grapes was estimated at 958 acres, comprising 863 acres in wine grapes, 72 acres in outdoor table grapes, and 23 acres devoted to grape-juice production. Vineyards were mainly in Auckland (425 acres), Hawke's Bay (387 acres), Waikato (63 acres), Gisborne (45 acres), Northland (21 acres), Thames (10 acres), Bay of Plenty (3 acres), and South Island (4 acres). In 1963 there were 165 licensed winemakers who produced 1,320,500 gallons of grape wine, 3,650 gallons of grape-juice beverage, 21,500 gallons of fruit wine, and 14,250 gallons of cider. Grape-wine production consisted of 220,000 gallons of unfortified table wines, i.e., under 25 percent proof spirit, and 1,100,500 gallons of fortified wines, over 30 percent proof spirit. The estimated area in glasshouse vineries in 1963 was 409,150 square feet. The main centres of indoor grape growing were: Auckland, 204,300 square feet; Canterbury, 51,500 square feet; Manawatu, 51,500 square feet; and Oamaru, 40,700 square feet. Approximately 103,950 square feet of glasshouse vineries have been adapted for early market and 215,200 square feet for late market. In 1963 grapes used for winemaking were estimated at 4,750 tons. There were 100 tons of outdoor table grapes and 185 tons of glasshouse grapes marketed for dessert purposes.
Apples and Pears—A summary of the activities of the New Zealand Apple and Pear Board appears in Section 21.
Quantities of apples and pears marketed in New Zealand by the Board in the last five seasons are given below. These figures exclude direct sales from fruitgrowers to the public.
| Season | Apples | Pears | Total |
|---|---|---|---|
| bushel cases | |||
| 1962 | 1,899,500 | 444,400 | 2,343,900 |
| 1963 | 1,776,700 | 357,100 | 2,133,800 |
| 1964 | 1,985,500 | 411,600 | 2,397,100 |
| 1965 | 1,822,200 | 429,600 | 2,251,800 |
| 1966 | 1,893,900 | 448,800 | 2,342,700 |
The following table shows the quantities of the main varieties of apples and pears marketed in New Zealand by the Apple and Pear Marketing Board and exported to the United Kingdom and elsewhere during the 1965–66 season, together with the total estimated production of each variety. Factories are given authority to purchase fruit for processing direct from the growers.
| Variety | Marketed in New Zealand by the Apple and Pear Board | Exported to United Kingdom | Exported to Other Countries | Estimated Total Production* |
|---|---|---|---|---|
* Estimated by Horticulture Division, Department of Agriculture. | ||||
| Apples— | bushel cases | |||
| Sturmer Pippin | 256,319 | 636,647 | 142,728 | .. |
| Delicious | 388,592 | 166,748 | 197,161 | .. |
| Jonathan | 219,977 | 215,328 | 177,257 | .. |
| Grannie Smith | 248,047 | 200,404 | 326,172 | .. |
| Cox's Orange Pippin | 127,195 | 186,858 | 1,914 | .. |
| Ballarat Seedling | 55,591 | 60,399 | 6,346 | .. |
| Golden Delicious | 122,153 | 168,093 | 102,319 | .. |
| Gravenstein | 159,669 | 10,991 | 144 | .. |
| Dougherty | 85,438 | 42,575 | 26,339 | .. |
| Others | 230,880 | 227,016 | 102,310 | .. |
| Totals, apples | 1,893,861 | 1,915,059 | 1,082,690 | 5,943,000 |
| Pears— | ||||
| William's Bon Chretien | 124,156 | – | 307 | .. |
| Winter Cole | 116,838 | 69,322 | 32,121 | .. |
| Winter Nelis | 93,723 | 28,223 | 9,969 | .. |
| Others | 114,090 | 30,084 | 46,624 | .. |
| Totals, pears | 448,807 | 127,629 | 89,021 | 1,003,000 |
Stone Fruits—The 1963 survey by the Department of Agriculture revealed that nearly half of the total of 340,000 peach trees were in Hawke's Bay, and that, of the balance, some 76,000 peach trees were in the Auckland district.
Production and disposal of stone fruits for the year ended 30 June 1966 were estimated as follows.
| Fruit | Disposal | Total Production | ||
|---|---|---|---|---|
| Market | Canning | Jam and Pulping | ||
| bushels | ||||
| Peaches | 665,950 | 459,150 | 3,200 | 1,128,300 |
| Nectarines | 61,200 | 1,550 | – | 62,750 |
| Apricots | 168,250 | 75,600 | 16,000 | 259,850 |
| Plums— | ||||
| European | 14,450 | 150 | 2,150 | 16,750 |
| Japanese | 154,950 | 9,350 | 9,550 | 173,850 |
| Cherries | 21,750 | 100 | – | 21,850 |
Citrus and Subtropical Fruits—Estimated quantities of citrus fruits marketed in New Zealand by the Citrus Marketing Authority, together with direct sales to the public by citrus growers, are given in the following table.
| Year | Grapefruit | Lemons* | Sweet Oranges | Mandarins and Other Citrus Fruits |
|---|---|---|---|---|
* Figures for lemons relate to packed J bushel cases. | ||||
| bushels | ||||
| 1959 | 138,900 | 119,200 | 13,900 | 4,500 |
| 1960 | 150,700 | 128,900 | 18,100 | 5,700 |
| 1961 | 153,200 | 120,700 | 18,400 | 7,800 |
| 1962 | 204,850 | 149,500 | 28,750 | 10,350 |
| 1963 | 178,750 | 117,000 | 25,750 | 10,500 |
| 1964 | 185,050 | 121,625 | 33,650 | 14,100 |
| 1965 | 184,200 | 133,660 | 31,050 | 15,800 |
| 1966 | 158,500 | 112,400 | 36,600 | 22,000 |
Reference to the Citrus Marketing Authority is to be found in Section. 21. Estimated production figures for other subtropical fruits for 1966 are: tamarilloes, 2,191 tons; passion fruit, 84 tons; Chinese gooseberries, 1,638 tons.
HOPS—Practically the whole of the hop gardens are located in Waimea county. Production per acre usually ranges between 1,200 and 1,500 lb. In the 1966 season 3,696 bales were packed, which was 283 bales more than the previous season. The total crop produced in the 1966 season was 1,071,971 lb, as against 1,023,988 lb in 1965. About 84 percent of the crop is now picked by machines.
A Hop Marketing Committee of six members (one Government and five producer) was established by the Hop Marketing Regulations 1939 to regulate and control the marketing either locally or overseas of all hops produced in New Zealand and to assist the industry generally.
TOBACCO—Tobacco is grown mainly in the Motueka district. Most of the tobacco produced is flue-cured, producing a yellow-leaf tobacco which is largely used for the manufacture of cigarettes, the balance, air-cured, being used mainly in the manufacture of smoking mixtures and pipe tobacco. Some 6,519,041 lb of raw tobacco leaf was imported for the year ended 30 December 1966, with a value of $3,659,480.
With the following particulars relating to tobacco production, it should be noted that the figures relate to the total commercial tobacco production and not merely to holdings of 10 acres or over situated outside borough boundaries. (Source: New Zealand Tobacco Board.)
| Season | Number of Growers | Area Planted | Production* | Estimated Value of Crop* |
|---|---|---|---|---|
* Includes research and experimental crops. | ||||
| acres | lb (000) | $(000) | ||
| 1960–61 | 549 | 4,151 | 6,777 | 2,934 |
| 1961–62 | 613 | 4,699 | 9,327 | 4,116 |
| 1962–63 | 729 | 5,357 | 8,948 | 3,944 |
| 1963–64 | 763 | 5,878 | 9,381 | 4,128 |
| 1964–65 | 728 | 5,840 | 9,881 | 4,554 |
| 1965–66 | 585 | 5,088 | 6,823 | 3,268 |
The production figures represent the weight of the leaf purchased from growers before redrying. Flue-cured leaf accounted for 98.1 percent and air-dried leaf for 1.9 percent of the 1965–66 crop.
PHORMIUM TENAX—Certain areas in various parts of New Zealand are covered by natural stands of Phormium tenax (New Zealand flax), once used by the Maoris for many purposes and one of the earliest of this country's exports. Only a small proportion of the natural area is mailable but this, together with an estimated planted area of about 3,000 acres, produces some 5,000 tons of fibre and tow. The industry provides at least one-third of the local requirements of woolpacks.
LINEN FLAX—There is a strong demand for all linen fibre produced in New Zealand from a local manufacturer of twine who uses this kind of fibre in the making of twine for closing bags and bales and for rolling meat, and for other purposes which require a twine made from a strong durable fibre.
Areas for the last five seasons are: 1960–61, 526 acres; 1961–62, 651 acres; 1962–63, 681 acres; 1963–64, 501 acres, and 1964–65, 283 acres. The 1965 harvest yielded 611 tons of straw.
Production from the single factory still operated by the Linen Flax Corporation at Geraldine has been as follows:
| Product | 1961 | 1962 | 1963 | 1964 | 1965 |
|---|---|---|---|---|---|
| tons | |||||
| Straw processed | 1,257 | 1,373 | 1,351 | 1,449 | 1,369 |
| Scratched fibre | 143 | 158 | 158 | 150 | 167 |
| Seed | 112 | 175 | 156 | 142 | 160 |
| Tow | 55 | 44 | 35 | 40 | 38 |
| Linmeal | 71 | 110 | 93 | 102 | 103 |
GENERAL—New Zealand has more than 25 times as many animals as people: this ratio is probably not exceeded in any country in the world. Grasslands have been developed to the extent that the best dairy farms can carry one cow to the acre, and the best sheep farms can support six sheep to the acre throughout the year.
The first sheep stations in the 1840s were stocked with Merinos from Australia. During the 1850s and 1860s several English breeds of sheep were imported, notably Southdowns, Leicesters, Lincolns, and Romneys. In 1855 there were 761,700 sheep in the country; by 1870 there were 9,700,000. Until 1882, the year of the successful introduction of cargo refrigeration when mutton and lamb exports were sent to London, the Merino and its crosses were predominant, because the only sheep products of any importance for export were wool and a little tallow, obtained by boiling down carcasses. Then the Merino was superseded in the North Island by breeds more suited to the climate and conditions. Today the flock sheep of the North Island are nearly all predominantly of Romney blood. In the South Island, Merino blood in varying degree continued to play an important part in the flock structure. Merinos have become restricted to the foothills of the Southern Alps, while Corriedales are more profitable in the better hill country and crossbreds and long woolled British breeds at lower levels. There were nearly 10 million breeding ewes in 1901.
In 1861 there were 193,000 cattle in New Zealand and by 1897 the number had reached 1,138,000. Cattle raising and fattening are usually associated with hill-country sheep farming and fat-lamb farming respectively, and beef stock are grazed chiefly in the North Island. The most popular breed of beef cattle is now the Aberdeen Angus, which has gradually gained ground over the last 30 years, with Herefords and Shorthorns next in number.
The growth of dairy herds was related to the availability of refrigeration for the export of butter from 1882, and the development of butter and cheese factories. There were 300,000 dairy cows by 1897, 185,000 of them in the North Island and 115,000 in the South Island. Now the North Island has more than twelve times as many dairy cows as the South Island. At first the Shorthorn was the popular breed, but since 1920 the Jersey has emerged as the predominant breed of dairy cattle.
In the following table, dairy cows in milk, total cattle, sows, and total pigs are as at 31 January; sheep shorn, lambs shorn, and lambs tailed are for the season ending in the year stated; breeding ewes and total sheep are as at 30 June, while the coverage is of holdings of 10 acres and over situated outside borough boundaries.
| Livestock | 1963 | 1964 | 1965 | 1966 |
|---|---|---|---|---|
* Includes those in boroughs and on holdings under 1 acre. | ||||
| Cattle (including dairy cows) | 6,690,964 | 6,696,205 | 6,801,333 | 7,217,720 |
| Dairy cows in milk | 1,997,253 | 2,010,868 | 2,032,227 | 2,087,869 |
| Total dairy cattle | 3,133,057 | 3,128,437 | 3,173,757 | 3,361,621 |
| Beef cattle | 3,557,907 | 3,567,768 | 3,627,576 | 3,856,099 |
| Sheep (including lambs)* | 50,190,284 | 51,291,898 | 53,747,753 | 57,343,257 |
| Breeding ewes* | 34,988,968 | 35,701,953 | 37,1,78,110 | 39,667,734 |
| Lambs tailed during season | 33,695,859 | 34,751,815 | 34,791,580 | 36,990,224 |
| Lambs shorn during season | 12,458,114 | 13,038,884 | 12,902,499 | 17,707,176 |
| Sheep shorn during season | 45,697,884 | 46,508,396 | 47,415,405 | 49,624,239 |
| Pigs (total) | 766,025 | 771,450 | 716,008 | 666,905 |
| Breeding sows | 97,039 | 95,179 | 90,048 | 81,678 |
The dairying and beef-production industries are both largely concentrated in the North Island, which has 87 percent of the total cattle and 92 percent of the dairy stock. Localising the dairying industry still further, it is found that 65 percent of the milking cows of New Zealand are in the northern half of the North Island. Taranaki and Wellington districts between them account for nearly one-quarter of the total dairy cows in milk.
Beef cattle are fairly evenly spread over the North Island, except Taranaki and areas close to Auckland.
Taking the number of beef breeding cows two years old and over as a guide to beef production, South Auckland – Bay of Plenty and Wellington statistical areas easily lead with two-fifths of the New Zealand total between them. Hawke's Bay is next, followed by East Coast and Northland in that order. These five districts together depasture 75 percent of breeding cows reserved for production of beef cattle.
Pig fanning is not now so closely an adjunct of dairy farming as in former years although the distribution follows that of dairy cattle. Thus Northland, Central Auckland, and South Auckland - Bay of Plenty statistical areas account for 57 percent of the pig population and Wellington for 10 percent. Taranaki, however, which is mainly a cheese producing district, has 15.6 percent of New Zealand's milking cows, but only 12.3 percent of the pigs, while Nelson, Westland, and Canterbury, which together have only 4.8 percent of the cows in milk, have 13.2 percent of the pig population.
Sheep farming is more evenly distributed between the North and South Islands. The statistical areas of major importance are Canterbury, Wellington, South Auckland - Bay of Plenty, Southland, Otago, and Hawke's Bay, in that order, these six districts accounting for 83.5 percent of the total sheep population in 1966.
| Statistical Area | Dairy Cows, and Heifers Two Years Old and Over (In Milk) | Beef Breeding Cows, Two Years Old and Over | Total Cattle | Breeding Sows | Total Pigs | Sheep Shorn* | Lambs Shorn* | Lambs Tailed* | |
|---|---|---|---|---|---|---|---|---|---|
* Sheep shorn, lambs shorn, and lambs tailed during 1965–66, remaining particulars for stock at 31 January 1966. | |||||||||
| Northland | (000) | 263 | 105 | 753 | 11 | 96 | 1,575 | 754 | 1,053 |
| Percent | 12.6 | 8.6 | 10.5 | 13.7 | 14.3 | 3.2 | 4.2 | 2.9 | |
| Central Auckland | (000) | 185 | 33 | 414 | 10 | 83 | 1,147 | 489 | 801 |
| Percent | 8.9 | 2.8 | 5.7 | 12.0 | 12.4 | 2.3 | 2.8 | 2.2 | |
| South Auckland - Bay of Plenty | (000) | 909 | 275 | 2,369 | 25 | 201 | 7,410 | 3,686 | 5,414 |
| Percent | 43.5 | 22.6 | 32.8 | 30.7 | 30.2 | 14.9 | 20.8 | 14.6 | |
| East Coast | (000) | 12 | 139 | 398 | 1 | 8 | 2,018 | 939 | 1,150 |
| Percent | 0.6 | 11.5 | 5.5 | 1.3 | 1.2 | 4.1 | 5.3 | 3.1 | |
| Hawke's Bay | (000) | 41 | 180 | 615 | 2 | 13 | 5,537 | 2,437 | 3,947 |
| Percent | 2.0 | 14.9 | 8.5 | 2.1 | 2.0 | 11.2 | 13.8 | 10.7 | |
| Taranaki | (000) | 327 | 38 | 675 | 9 | 82 | 1,511 | 755 | 1,073 |
| Percent | 15.6 | 3.1 | 9.4 | 11.3 | 12.3 | 3.0 | 4.3 | 2.9 | |
| Wellington | (000) | 192 | 215 | 1,041 | 9 | 66 | 7,908 | 3,847 | 5,409 |
| Percent | 9.2 | 17.7 | 14.4 | 10.7 | 9.9 | 15.9 | 21.7 | 14.6 | |
| North Island | (000) | 1,928 | 986 | 6,264 | 67 | 549 | 27,105 | 12,907 | 18,847 |
| Percent | 92.4 | 81.2 | 86.8 | 81.8 | 82.3 | 54.6 | 72.9 | 51.0 | |
| Marlborough | (000) | 13 | 20 | 78 | 2 | 14 | 1,170 | 237 | 718 |
| Percent | 0.6 | 1.6 | 1.1 | 2.1 | 2.1 | 2.3 | 1.3 | 1.9 | |
| Nelson | (000) | 34 | 15 | 103 | 3 | 29 | 582 | 203 | 367 |
| Percent | 1.6 | 1.2 | 1.4 | 3.9 | 4.3 | 1.2 | 1.1 | 1.0 | |
| Westland | (000) | 16 | 14 | 69 | 1 | 12 | 166 | 64 | 127 |
| Percent | 0.8 | 1.1 | 1.0 | 1.4 | 1.7 | 0.3 | 0.4 | 0.3 | |
| Canterbury | (000) | 51 | 69 | 297 | 7 | 48 | 8,184 | 1,581 | 6,680 |
| Percent | 2.4 | 5.7 | 4.1 | 8.0 | 7.2 | 16.5 | 8.9 | 18.1 | |
| Otago | (000) | 21 | 62 | 209 | 1 | 9 | 5,987 | 1,002 | 4,436 |
| Percent | 1.0 | 5.1 | 2.9 | 1.6 | 1.3 | 12.1 | 5.7 | 12.0 | |
| Southland | (000) | 24 | 49 | 198 | 1 | 7 | 6,429 | 1,714 | 5,816 |
| Percent | 1.2 | 4.1 | 2.7 | 1.2 | 1.1 | 13.0 | 9.7 | 15.7 | |
| South Island | (000) | 159 | 228 | 954 | 15 | 118 | 22,519 | 4,800 | 18,143 |
| Percent | 7.6 | 18.8 | 13.2 | 18.2 | 17.7 | 45.4 | 27.1 | 49.0 | |
Detailed statistics of livestock are contained in the Report on Statistics of Farm Production. This publication also contains the summary tables from parliamentary paper H. 23, which is a statistical analysis of the annual sheep returns.
SHEEP—Over the 10 years to 30 June 1966 the total number of sheep increased by 42.4 percent. The totals for breeding ewes and sheep at 30 June 1966 were both 6.7 percent higher than a year earlier.
The following table analyses categories of sheep and gives a broad classification of stud and other groups.
| At 30 June | Rams | Wethers | Breeding Ewes | Dry Ewes | Hoggets | Total | ||
|---|---|---|---|---|---|---|---|---|
| Ram | Wether | Ewe | ||||||
* Change in classification. | ||||||||
| Thousands Totals | ||||||||
| 1961 | 882 | 2,179 | 33,592 | 522 | 269 | 2,724 | 8,294 | 48,462 |
| 1962 | 900 | 2,281 | 33,945 | 549 | 267 | 2,725 | 8,321 | 48,988 |
| 1963 | 902 | 2,257 | 34,989 | 517 | 263 | 2,721 | 8,541 | 50,190 |
| 1964 | 907 | 2,352 | 35,702 | 468 | 268 | 2,663 | 8,932 | 51,292 |
| 1965 | 931 | 2,553 | 37,178 | 478 | 269 | 2,982 | 9,355 | 53,748 |
| 1966 | 956 | 2,601 | 39 668 | 336 | 291 | 3,139 | 10,353 | 57,343 |
| Stud Sheep (Entered in Flock Book) | ||||||||
| 1952 | 13 | – | 331 | 6 | 119 | – | 130 | 598 |
| 1957 | 17 | – | 441 | 6 | 153 | – | 168 | 784 |
| 1962 | 25 | – | 508 | 7 | 183 | – | 196 | 918 |
| Sheep of a Distinctive Breed but Not Entered in Flock Book | ||||||||
| 1952* | 588 | 2,393 | 17,804 | 357 | 42 | 1,997 | 4,483 | 27,664 |
| 1957 | 720 | 1,970 | 24,699 | 352 | 72 | 2,336 | 6,096 | 36,245 |
| 1962 | 834 | 2,012 | 29,035 | 450 | 75 | 2,289 | 7,280 | 41,975 |
| Crossbred Sheep | ||||||||
| 1952* | 32 | 586 | 4,828 | 88 | 6 | 593 | 939 | 7,122 |
| 1957 | 33 | 292 | 3,760 | 73 | 9 | 450 | 736 | 5,353 |
| 1962 | 41 | 269 | 4,402 | 93 | 9 | 436 | 846 | 6,096 |
The 1962 classification of breeds shows that of the 48,987,992 sheep in New Zealand 35,936,339 (73.36 percent) were Romneys and 6,095,779 (12.44 percent) were crossbreds. The remainder were composed principally of Corriedale 2,457,976, half-bred 2,217,396, Southdown 955,956, and Merino 916,782.
There has been a steady increase in the average flock size over the last five years which follows a period of three years when there was little change. A classification by size of flock for the last five years is now given.
| Size of Flocks | 1962 | 1963 | 1964 | 1965 | 1966 |
|---|---|---|---|---|---|
| 1–99 | 4,605 | 4,816 | 5,214 | 5,299 | 4,914 |
| 100–199 | 2,913 | 2,741 | 2,744 | 2,646 | 2,544 |
| 200–499 | 6,213 | 6,067 | 5,849 | 5,728 | 5,316 |
| 500–999 | 8,500 | 8,092 | 7,806 | 7,395 | 6,958 |
| 1,000–1,499 | 7,831 | 7,815 | 7,911 | 7,493 | 7,140 |
| 1,500–1,999 | 4,746 | 4,911 | 5,105 | 5,444 | 5,754 |
| 2,000–2,499 | 2,398 | 2,572 | 2,701 | 2,885 | 3,281 |
| 2,500–4,999 | 3,208 | 3,359 | 3,507 | 3,908 | 4,476 |
| 5,000–7,499 | 474 | 528 | 530 | 611 | 699 |
| 7,500–9,999 | 141 | 151 | 162 | 183 | 205 |
| 10,000–19,999 | 121 | 125 | 122 | 148 | 164 |
| 20,000 and over | 23 | 21 | 20 | 24 | 30 |
| Total flocks | 41,173 | 41,198 | 41,671 | 41,764 | 41,481 |
| Average flock size | 1,190 | 1,218 | 1,231 | 1,287 | 1,382 |
CATTLE—Numbers of cattle by categories are now given.
| Category | At 31 January | ||
|---|---|---|---|
| 1964 | 1965 | 1966 | |
| Dairy stock— | |||
| Cows and heifers, two years old and over— | |||
| Cows in milk during season | 2,010,868 | 2,032,227 | 2,087,869 |
| Heifers not yet in milk | 53,985 | 56,744 | 59,881 |
| Cows not in milk during season, but intended to be used again for dairying | 21,249 | 24,833 | 29,837 |
| Heifers— | |||
| One and under two years old | 470,671 | 464,800 | 507,208 |
| Under one year old | 476,087 | 501,831 | 581,446 |
| Bulls and bull calves intended for dairy breeding | 95,577 | 93,322 | 95,380 |
| Totals, dairy stock | 3,128,437 | 3,173,757 | 3,361,621 |
| Beef stock— | |||
| Breeding cows and heifers, two years old and over | 1,341,409 | 1,320,482 | 1,411,391 |
| Cows, two years old and over, not used for breeding | 75,701 | 73,840 | 70,143 |
| Heifers— | |||
| One and under two years old | 375,651 | 385,182 | 393,791 |
| Under one year old | 471,617 | 431,571 | 472,893 |
| Steers and bulls of all ages | 1,303,390 | 1,416,501 | 1,507,881 |
| Totals, beef stock | 3,567,768 | 3,627,576 | 3,856,099 |
| Totals, cattle | 6,696,205 | 6,801,333 | 7,217,720 |
The following table shows the number of holdings with dairy cows in milk, grouped according to size of herd in milk, for the three last intervals for which such information is available.
| As at 31 Jan. | Holdings. | Total Holdings With 10 or more Cows in Milk | |||||||||
|---|---|---|---|---|---|---|---|---|---|---|---|
| With 10–19 Cows | With 20–29 Cows | With 30–39 Cows | With 40–49 Cows | With 50–59 Cows | With 60–69 Cows | With 70–79 Cows | With 80–89 Cows | With 90–99 Cows | With 100 and over | ||
| 1952 | 4,368 | 4,536 | 5,527 | 5,245 | 4,438 | 3,665 | 2,512 | 1,726 | 1,105 | 2,532 | 35,654 |
| 1957 | 3,477 | 3,563 | 4,549 | 4,835 | 4,589 | 4,305 | 3,071 | 2,023 | 1,351 | 3,094 | 34,857 |
| 1960 | 2,579 | 2,802 | 3,665 | 4,215 | 4,199 | 3,986 | 2,915 | 2,148 | 1,289 | 3,353 | 31,151 |
There were 27,747 holdings with 10 or more cows in milk at 31 January 1965; the general trend is towards fewer holdings and larger herds.
For dairy stock the Jersey breed, with 78.6 percent of all dairy stock in 1962, is predominant, while the main beef stock breeds are Aberdeen Angus (74.5 percent), Hereford (16.3 percent), and Shorthorn (5.4 percent).
PIGS—The rearing of pigs fluctuates as indicated in the following table.
| At 31 January | Breeding Sows One Year Old and Over | Other Pigs of All Ages (Including Boars) | Total Pigs |
|---|---|---|---|
* Gilts 6 months old but under 12 months intended for breeding numbered 34,466. | |||
| 1961 | 83,979 | 571,453 | 655,432 |
| 1962 | 84,499 | 601,042* | 685,541 |
| 1963 | 97,039 | 668,986 | 766,025 |
| 1964 | 95,179 | 676,271 | 771,450 |
| 1965 | 90,048 | 625,960 | 716,008 |
| 1966 | 81,678 | 585,227 | 666,905 |
Particulars as to pig breeds collected in 1950 showed that the principal distinctive breeds were Berkshire (6.6 percent) and Tamworth (5.5 percent), but over 80 percent of the pigs in New Zealand were classified as crossbreds.
HORSES—Farm horses have been almost completely replaced by tractors. By 1965 the number of heavy- and medium-type horses had fallen to 6,844, hacks and light working horses having decreased to a much lesser extent.
DOGS—The count of dogs registered during the year ended 31 March 1966 showed that there were 206,516 dogs registered in counties, 51,201 in boroughs, 847 in town districts, and 244 in road districts. Unregistered dogs and those up to six months old are not included in these figures.
POULTRY—The following table shows poultry recorded at censuses.
| Census | Number of Households Keeping Poultry | Fowls | Ducks | Geese | Turkeys | Total Poultry |
|---|---|---|---|---|---|---|
* Excluding flocks owned by Maoris. | ||||||
| April 1921* | 145,993 | 3,491,567 | 379,988 | 46,234 | 73,220 | 3,991,009 |
| April 1926* | 158,856 | 3,308,384 | 352,030 | 43,879 | 76,852 | 3,781,145 |
| March 1936 | 166,354 | 3,488,516 | 377,791 | 66,667 | 86,102 | 4,019,076 |
| September 1945 | 159,333 | 4,070,683 | 319,918 | 41,903 | 37,862 | 4,470,366 |
| April 1951 | 180,723 | 3,829,481 | 260,659 | 58,474 | 50,976 | 4,199,590 |
| April 1956 | 192,736 | 4,160,424 | 210,718 | 60,938 | 53,491 | 4,485,571 |
| April 1961 | 163,476 | 4,183,563 | 202,245 | 73,457 | 66,132 | 4,525,397 |
The figures from 1951 onwards include only birds aged four months or over, while the 1945 figures cover birds of all ages. At earlier censuses the question was for the number of birds—no reference being made to age. The census of 1945 was taken in the spring, whereas the other censuses were taken in the autumn.
Poultry farming is regarded as a definite branch of the farming industry. Those keeping poultry may be classified under three groups, namely—commercial poultry farmers, sideline poultry producers, and household poultry keepers. As might be anticipated, the last-named group is by far the largest. Taking only fowls into consideration, 148,116, or 92.5 percent, of the flocks comprised less than 25 birds.
Sideline poultry producers are those with flocks of over 100 birds but fewer than 1,000. These flocks are usually kept by people as a sideline to augment their incomes received from other daily employment. In 1961 there were 773 flocks of over 1,000 birds forming the basic commercial units of the poultry industry. Of these, 506 ranged from 1,000 to 1,999, 178 from 2,000 to 2,999, 54 from 3,000 to 3,999, and 35 exceeded 4,000. The vast majority of household poultry keepers and sideline producers depend upon commercial poultry farms for annual replacement stock. Again, the commercial and sideline groups sell their eggs through licensed egg floors and are therefore mainly responsible for supplying eggs to retail shops in the cities and larger towns. Egg production has been steadily increasing, sales through licensed distributors rising from 28,378,354 dozen in 1963–64 to 30,484,133 dozen in 1964–65 and 33,449,158 dozen in 1965–66. It is estimated that approximately 40 to 45 percent of the total egg production passes through these channels.
Poultry farming is confined largely to egg production, but units are now established for the production of table poultry, and attention paid to the production of “broilers” or 3 to 3 1/2 lb live weight chicken. Until recently, table poultry was almost entirely a by-product of commercial egg production.
Commercial poultry farms are distributed over both Islands, but there are concentrations around Auckland, Christchurch, and Oamaru. Duck-egg farming is carried on only to a limited extent and is centred mainly around Auckland. The poultry industry does not cater for overseas markets, though limited quantities of frozen egg pulp, surplus to local requirements, are exported.
Until about 1950, White Leghorns were almost the only breed used for commercial egg production but crossbred birds are now by far the most popular birds for egg production. The pure breeds mated to produce these crossbreds are White Leghorns, Australorps, and Rhode Island Reds.
Khaki Campbell and Runner ducks are mainly used for egg production, while Khaki Campbell, Muscovy, and some Pekin ducks are marketed as table birds. There is little organised turkey production.
Reference to the field covered by the Egg Marketing Authority is given in Section 21 of this Yearbook.
BEES—The rich pasture lands of New Zealand and some bush areas are particularly favourable for apiculture and the production of high-grade honey for the local and export markets.
Production for the year ended 31 May 1966 was estimated at 5,200 tons of honey and 182,000 lb of commercial beeswax, slightly above the average for the last six seasons.
Registrations under the Apiaries Act show that at 31 May 1965 there were 4,613 beekeepers with a total of 13,345 apiaries and 194,589 established hives. Fifty-three percent of hives and 58 percent of apiaries were in the North Island. Following is a summary of these registrations showing beekeepers in groups according to the number of hives kept.
| Group | 1–5 Hives | 6–29 Hives | 30–250 Hives | 251 Hives and Over | Total |
|---|---|---|---|---|---|
| Beekeepers | 3,187 | 813 | 367 | 246 | 4,613 |
| Apiaries | 3,285 | 1,175 | 1,925 | 6,960 | 13,345 |
| Hives established | 6,960 | 9,398 | 31,110 | 147,121 | 194,589 |
GENERAL—New Zealand has a climate favourable to the growth of forests. The first European settlers found extensive evergreen forests extending up to 3,500-4,500 ft on the mountains and covering some two-thirds of the land area. The remaining third was made up of rocky mountain tops and low rainfall zones on the east side of the South Island.
In the early days of settlement the demand for timber was met by exploitation of the kauri (Agathis australis) forests of the far north. These forests were almost destroyed by logging and subsequent burning. The podocarp-broadleaf forest in both islands was then cleared to make way for farms, often without use being made of the timber. There was little interest in conservation, and clearing of the forest extended well beyond the limits now considered desirable in the long-term national interest.
Towards the end of the nineteenth century the need to conserve forests of the high mountain watersheds was recognised. National parks and scenic and “climatic” reserves amounting to about 2 million acres and constituting 3.1 percent of the land area of New Zealand had been set aside as “permanent forest” by the early 1900s and thus preserved. There were also some 15 million acres of other forest, of which half was owned by the Crown.
The New Zealand Forest Service was created in 1920 as the administrative agency of national forest policy. Since then a firm policy has been developed on conservation. All Crown forest land considered at the time to give long-term advantages in forest rather than in agriculture has been dedicated permanent State forest. Also from 1920 tree planting of exotic coniferous species from the northern hemisphere has been carried out by the Forest Service and by private enterprise to supplement wood production from native forests. The area in State exotic forests has now reached almost 600,000 acres and private interests have established an equivalent area. These exotic forests are now the basis of a flourishing timber industry supplying over two-thirds of the output of sawn timber, a fast-expanding pulp and paper industry, and other forest industries producing particle board, plywood, and other products. Industrial developments are based largely on the extensive exotic forests of the Bay of Plenty-Taupo region.
Over two-thirds of the exotic forests have been planted with radiata pine (Pinus radiata), which grows remarkably quickly in New Zealand conditions.
The following table shows the area of forest in relation to other categories of land in 1965.
| Type of Land | Area, in Million Acres | Percentage of Total Land Area |
|---|---|---|
*Includes approximately 0.1 million acres of non-productive species. | ||
| Indigenous forest | 14.1 | |
| Man-made (exotic) forest | 1.3* | |
| Total forested land | 15.4 | 23.2 |
| Pasture and arable land | 33.7 | 50.0 |
| Other non-forested land | 16.4 | 25.5 |
| Minor islands | 0.2 | 0.3 |
| Lakes, rivers, etc. | 0.7 | 1,0 |
| Total territorial area | 66.4 | 100.0 |
FOREST RESOURCES: Forest Produce Supplies—Of the remaining indigenous forest some 1,000,000 acres contain timber merchantable by today's standards. It has been estimated that the amount is 2,000 million cubic feet, representing approximately 13,000 million board feet of sawn timber. In addition, there are about 1,300,000 acres of exotic forests, of which some 1,200,000 acres are classed as productive. The indigenous forests are still, despite the greatly increased use of exotic timber, being depleted at the rate of some 30,000 acres a year to provide some 250,000,000 board feet of timber annually.
The indigenous forests, from which 20 years ago 86 percent of rough sawn timber supplies were obtained, at present supply approximately 33 percent. In 20 years' time they are expected to provide about 14 percent. In the distant future the amount of produce obtained will depend on the success of management practices.
It can be expected that a high proportion of the exotic forests will be worked on a sustained-yield basis. Besides supplying 67 percent of the rough-sawn timber cut in the year ended 31 March 1966, they provided 62 million cubic feet of pulp logs, veneer logs, smallwood, and logs for export.
Imports of timber have varied from 30 to 60 million board feet during the past 10 years. They are composed of special-purpose timbers—large-dimension Oregon pine for structural use, joinery timbers, and Australian hardwood poles and sleepers.
While supplies of wood from indigenous forests will decrease in the future, the area in exotic forests and the wood from them will increase. Timbers from exotic species will also in time largely replace imported timber and, provided the increase in forest area is sufficient, will provide a substantial amount of produce for export.
The exports of forest produce have risen in value from less than $2 million in 1953 to almost $25 million in the year ended June 1966. The growth of the export trade in forest products in the last decade has been closely associated with the rapid rise of the pulp and paper industry. Almost three-quarters of the value of these exports in the year ended June 1966 was in newsprint and pulp, which accounted for nearly half the value of all exports to Australia.
Local production of fibreboard, paperboard, newsprint, and wrapping and tissue paper has significantly reduced imports. The total value of output of the pulp and paper industry reached $55 million in 1964-65. Over the last decade total production of pulp (the basic commodity) has risen at an average annual rate of over 15 percent. Production rose from 99,000 tons in 1955-56 to 411,000 tons in 1965-66. During the same period total wood consumption in the pulp and paper industry (which includes the sawmills of integrated plants) increased from 16 million cubic feet to 73 million cubic feet. (Total sawn-timber production from forests was 757 million board feet in 1965-66 to meet building and other needs in the country. Additional products include plywood, veneer, fencing posts, and sleepers.)
Classification of Forests—More than three-quarters of the New Zealand forest area is unmerchantable forest. This is mainly Crown-owned indigenous forest, and, because it covers, much of the remoter mountainous and high-rainfall country, its primary function is soil protection and water regulation. It does include considerable areas of potentially productive forest land which could, in the distant future, be placed under production management; but such management would always be subordinate to the protective functions of this class of forest.
“Merchantable” forests are more diverse in tenure and composition than the unmerchantable forests because they include almost all the planted (exotic) forests, nearly half of which are owned privately or by local authorities. Fully merchantable indigenous forests have receded in advance of close settlement, and the largest areas are now on Crown lands and Maori lands in regions little suited to other forms of land use (especially on the West Coast of the South Island). The distribution of merchantable exotic forests has been influenced mainly by the availability of cheap, undeveloped land in the period (1900 to 1935) when most of these forests were established.
The distribution by area of forested land in 1965 is shown by the following table.
| Class of Forested Land | Indigenous Forests | Exotic Forests | All Forests |
|---|---|---|---|
| Accessible and/or merchantable forests— | acres (thousand) | ||
| State forests | 1,570 | 580 | 2,150 |
| Unoccupied Crown land | 180 | - | 180 |
| Freehold and leasehold land | 450 | 580 | 1,030 |
| Maori land | 280 | - | 280 |
| Reserves | 180 | - | 180 |
| Totals | 2,660 | 1,160 | 3,820 |
| Inaccessible and/or unmerchantable forests— | |||
| State forests | 5,290 | - | 5,290 |
| Unoccupied Crown land | 1,400 | - | 1,400 |
| Freehold and leasehold land | 1,600 | 100 | 1,700 |
| Maori land | 800 | - | 800 |
| Reserves | 2,400 | - | 2,400 |
| Totals | 11,490 | 100 | 11,590 |
| Totals, all forested land | 14,150 | 1,260 | 15,410 |
Botanical Composition of Forests—The indigenous forests of New Zealand can be grouped very broadly into mixed temperate evergreen forest and southern-beech forest. The former is a mixed community of many species of broad-leaved trees and conifers, and the latter a pure community of one or more of the species of southern beech (Nothofagus).
In general, the mixed temperate evergreen forests are the forests of the north and of the warm, wet lowlands and lower mountain slopes; their upper altitudinal limit becomes gradually lower from north to south. The beech forests are the forests of the south, of the high mountains, and of the drier lowlands. But the beech species are absent from many localities, e.g., Stewart Island and Mt. Egmont, where their presence might be expected. There are also extensive areas, especially in the north-west and south-west of the South Island, and on the mountain ranges of the North Island, where the two types mingle to form forests of varied composition.
Most of the mixed forests has been cut over for timber and cleared for farming, whereas the southern-beech forest, because of the difficult terrain and the poor soils on which it most frequently grows, is largely intact. The following description gives in more detail the distribution and the present state of the main forest communities.
Kauri forest (mixed temperate evergreen forest in which kauri is the dominant species) once occupied much of the area north of a line joining Port Waikato to Tauranga, but, except for limited reservations and small pockets, it has disappeared. The main secondary tree species are taraire and tawa. Mixed podocary forest (the principal podocarp is rimu; the important secondary ones, totara, matai, and miro) was found at all latitudes in the three main islands. The heaviest commercial stands were on flat or near-flat sites; in steeper country timber trees thinned out and secondary species became more plentiful. The remaining forest of this type consists of pockets which will be worked for a few decades to come, some large areas on steep country, such as the Urewera, which can be classed mainly as protection forest, and fairly extensive forests in the centre of the North Island and on the West Coast of the South Island which contain most of the remaining indigenous-softwood supplies. The main species of broad-leaved trees in these forests are kamahi, tawa, and rata. Kahikatea forest occupied low-lying swampy river silts, but most of these areas have been cleared for farming.
Bog forests, where the dominant trees are smaller podocarps of the silver-pine group, occupy limited areas, mainly in the central North Island and on the West Coast of the South Island. They have largely been cut over for posts and sleepers.
Although most southern-beech forests can be classified as protection forests, there are large areas in more accessible regions which have been cut over and are regenerating, or which have not yet been cut over and will be reserved for sustained-yield management. Where southern-beech forest is present in the more accessible areas of the North Island and northern Marlborough-Nelson, the species are hard beech (Nothofagus truncata) and black beech (N. solandri var. solandri). Red beech (N. fusca) abounds in the less accessible upper areas, where it is usually accompanied by the silver beech (N. menziesii), the main tree at high altitudes. In dry places mountain beech (N. solandri var. cliffortioides) replaces silver. On the eastern slopes of the Southern Alps there was once a belt of mountain-beech forest, but all except pockets of this has been burnt. On the western side of the Alps, beech forest is absent from the Taramakau River southwards for 100 miles. In western Otago and western Southland silver beech is the main forest tree, with areas of mountain beech and small pockets of red beech. At the lower elevations silver beech is milled extensively and much of the forest has disappeared.
Important forest trees at high elevations, not already mentioned, are kaikawaka (Libocedrus bidwillii) and thin-bark totara (Podocarpus hallii).
In the undisturbed indigenous vegetation limited transition areas between tussock grassland and forest proper carried manuka (Leptospermum scoparium and L. ericoides) and sometimes bracken fern (Pteridium esculentum). With the destruction of much tussock grassland and forest these belts have extended and manuka has even occupied extensive areas of destroyed forest remote from any original manuka stands. These stands are important because they are often a stage in succession back to mature forest.
Much land now classified as forest consists of second growth of broad-leaved shrubs and trees which have come in after milling operations or on abandoned farm land.
Exotic plantations of over 50 acres now total some 980,000 acres, besides which there are approximately 200,000 acres of farm woodlots and shelter belts. These areas of exotic species already provide over three-quarters of the total wood production, and before many years have passed must supply most of it. In some poorly forested districts shelter belts provide a large part of the local timber supply.
The following table shows, by ownership and species, the estimated area of exotic production forest as at 31 March 1966.
| Ownership | Area (thousand acres) | Percent |
|---|---|---|
| State | 613 | 52 |
| Local authorities | 44 | 4 |
| Companies | 326 | 27 |
| Individuals | 202 | 17 |
| Totals | 1,185 | 100 |
| Species— | ||
| Radiata pine | 749 | 63 |
| Douglas fir | 82 | 7 |
| Corsican pine | 73 | 6 |
| Ponderosa pine | 80 | 7 |
| Lodgepole pine | 27 | 2 |
| Other conifers | 66 | 6 |
| Other broadleaved | 108 | 9 |
| Totals | 1,185 | 100 |
Most of the large exotic plantations are in the central North Island region. They were established with radiata pine (Pinus radiata), mainly between 1925 and 1935. Other plantations are scattered throughout the country, although there are still some timber-short districts with few plantations, notably Taranaki, Poverty Bay and the east coast, and South Canterbury.
FOREST ADMINISTRATION: Under the Forests Act 1949 the New Zealand Forest Service has, under the direction of the Minister of Forests, complete responsibility in carrying out all matters of forest policy affecting State forest land and has exclusive control and management of:
All State forest land, whether for the production of timber or other forest produce, or for the protection of the land with a view to water conservation or soil stabilisation, or for ensuring the balanced use of the land, or for scientific purposes, or for recreational or amenity purposes not prejudicial to forestry;
The establishment, culture, and maintenance of forests on State forest land, and the harvesting, utilisation, transport, sale, or other disposal of forest produce from State forest land;
The granting of licences, leases, permits, and other rights and authorities under the Act;
The enforcement of the conditions of licences, leases, permits, and other rights and authorities granted under the Act or any enactment repealed;
The collection and recovery of all purchase moneys, rents, fees, royalties, charges, and revenues of the Service; and
Generally the exercise of all powers, authorities, and duties conferred or imposed on the Minister or the Forest Service by the Act.
Regulations—The Forests Act 1949 authorises the appointment by regulation of committees to advise the Minister of Forests on specified matters. Regulations issued under this authority are the Timber Production Advisory Committee Regulations 1949, the Sirex Advisory Committee Regulations 1950, the Forest and Fire Publicity Committee Regulations 1952, and the Waipoua Forest Sanctuary Advisory Committee Regulations 1952.
Other regulations in force are the Sawmill Registration Regulations 1952, the Timber Regulations 1948, the Forest Service Fees and Charges Regulations 1953, and the Forest Produce Import and Export Regulations 1956.
FOREST MANAGEMENT—The management activities of the Forest Service are directed towards:
Protecting, conserving, and, if possible, perpetuating the remaining indigenous forests of the country.
Creating an exotic estate large enough and sufficiently diverse to supply the future needs of New Zealand in timber and other forest produce, and to cater for export markets.
Indigenous Production Forests—Conservation measures in indigenous production forests involve regulation and restriction of the annual cut, rigid insistence on close utilisation, both of forests and forest products, and block sales of carefully measured and appraised standing timber. The Forest Service formulates working plans for all major State forests and through them regulates, both by individual forests and by districts, the amount of timber that may be cut annually.
The possibility of ultimately regenerating podocarp forests and bringing them into a productive state is not being overlooked. The ecology of the natural forest associations and the silvicultural characteristics of the individual species are being studied. Past work has shown the importance of preserving a forest climate, which means that clear felling, or any condition that allows exposure and desiccation, must be avoided.
Parallel to the policy of rationing the cut is that of making long-term log and timber sales. This has the effect of giving stability to sawmilling industries and to the communities dependent on them. Further stability is being sought by the practice of replanting logged areas with exotic species, combined where possible with the planting of adjacent areas of open country. By this means a sustained yield, part exotic and part indigenous, can be achieved, and the sawmilling industries and communities can look forward to a life in perpetuity.
The kauri forests, now only remnants of the vast forests from which timber was first felled in quantity, are owned principally by the State. The remaining kauri stands show promise of being amenable to sound forestry management. Bleeding for gum, which damaged many trees in the past, is forbidden. The annual cut is strictly rationed. Wherever kauri is felled a portion of the growing stock in young vigorous trees is left as a reserve. Young pole stands are silviculturally treated to free them from competition and improve growth. Natural regeneration is assisted and encouraged. A small but regular cut of this valuable species is assured.
The prospects of improving and perpetuating the beech forests on a sustained-yield basis are good. Both the major species, red and silver beech, when given the right conditions, will regenerate freely; both grow sufficiently rapidly to grow on a medium-length rotation (100-130 years); and both show their optimum development on sites that are unsuitable for agriculture. Many large areas of virgin forest are still intact, and, in the case of red beech, extensive stands of pole forest which have originated as a result of fire, wind throw, or mining activities. Against these favourable circumstances must be set the presence in many localities of red deer, whose browsing may check or even prevent effective regeneration.
Exotic-forest Management—The establishment of State exotic forests dates from 1896, when an Afforestation Branch of the Lands Department was formed and forest-tree nurseries were established at Tapanui and Eweburn in the South Island and at Rotorua in the North Island. Planting commenced in 1898, and proceeded slowly until 1922, by which time 47,000 acres had been established. The formation of the New Zealand Forest Service as a separate Department of State in the early twenties coincided approximately with an afforestation boom, and in the period 1923-36 no less than 376,000 acres were planted by the State and 297,000 acres by commercial companies. Since then plantings have been on a modest scale, but, in pursuance of the policy of doubling the exotic-forest estate by the end of the century, the rate of State planting has been increased (from 12,000 acres in 1961 to 20,000 acres in 1965), and financial inducements are provided to encourage planting by non-State agencies.
In the earlier years the areas selected for planting were often chosen with little consideration for the suitability of the site for tree growing or for the proximity of the forests to existing and future markets. As a result there have been failures, and the geographical distribution of the forests leaves much to be desired. These faults are now being corrected by greater attention to prospects of wood-based industries and large markets, and by careful selection of areas where the climate, soil, and topography are all favourable to tree growth.
There is now a large valuable exotic-forest estate, which is providing two-thirds of the annual sawn-wood requirements and is supporting a large and growing pulp and paper industry. Radiata pine, the species used for some 65 percent of the area, is the supreme all-purpose tree in New Zealand's exotic forestry. It grows rapidly, produces a large volume of usable wood, and is remarkably adapted to a variety of sites. Other major species are Douglas fir, Corsican pine, and ponderosa pine. Of recent years the southern pines—loblolly, slash, and long-leaf pines—have found a place in the more northerly forests. Minor species planted on a restricted scale are lodgepole, strobus, and patula pines, larch, Japanese cedar, Lawson cypress, Monterey cypress, and western red cedar.
In its early years exotic forestry was necessarily experimental, and, as could be expected, not all the species or methods used were successful and not all the sites used suitable. Nor could the ultimate outcome of afforestation be clearly seen and the waxing and waning of enthusiasm and enterprise led to wide fluctuations in the planting programme.
Now that the stage of large-scale utilisation has been reached there are opportunities to increase productivity by correcting the deficiencies in the distribution of age classes, replacing unthrifty plantations, and improving the quality of the trees, and at the same time, meeting the demand for forest products and ensuring continuity of supplies. The diversity of products now marketable (poles, mining timber, and fencing material as well as the major products, sawlogs, and pulpwood) permits utilisation of trees of a wide range of sizes and aids the operations needed in management practice. There is wide use of forest working plans to prescribe and co-ordinate forest operations both by the State and the larger private forest owners.
Protection-forest Management—The vegetation of the mountainous areas—forest, scrub, and sub-alpine grassland—is of the highest importance to the welfare of New Zealand; for many of the rivers that bring water to low-lying farm lands or provide the domestic water supply of cities and towns have their headwaters in the mountainous back country. The mountains receive frequent heavy falls of rain and are mostly formed of rocks that erode easily when exposed to heavy rain and low temperatures. It is only the blanket of montane vegetation that, by absorbing much of the rainfall and by stabilising unconsolidated rocky slopes, prevents the low-lying districts surrounding the lower courses of the rivers from being frequently subjected to disastrous flash floods, and the river channels from becoming choked with the products of erosion. Hence this vegetation of the mountain regions is called “protection forest”, a term that also includes the protective scrub, grass, and other vegetation above the timber line.
The Forest Service controls some six million acres of protection-forest land, and the main function of its Protective Forestry Section is to maintain the protective vegetation in good condition. The greatest threat to this vegetation is from the large numbers of browsing animals that were introduced many years ago, and which in the absence of natural enemies and limiting climate have multiplied excessively. Consequently the first step in the effective management of these areas is the control of these animals. Protection-forestry rangers are trained in field biology, in field geology, and in watershed and range management. They make careful observations of the effects of browsing on various plants and from these observations are able to estimate whether or not the animals are increasing or decreasing in number in any area.
The control of noxious animals is a huge task, and catchment areas where animals are troublesome are divided into classes of priority for purposes of control, depending on the condition of the vegetation, the seriousness of erosion, and the economic importance of the catchment.
The Protection Forestry Section works in close association with the Forest Research Institute, which maintains a special branch for the investigation of such features of catchments as the condition and trends of vegetation, alpine climates, and rates of erosion, the possibility of introducing new forest and scrub species into badly depleted areas, and changes in and methods of control of animal populations.
Recreation in Forests—As the population increases and as the cleared land becomes more firmly occupied by agricultural interests, so does the call on the recreational resources of the forests become greater. Weekend hunters head for the forest to shoot deer and pigs; fishermen frequent the streams; trampers wander along the many tracks; and alpinists climb through the forest to the heights above. The Forest Service caters for this demand in popular forests by establishing regular patrols, clearing and maintaining tracks, making camping sites and fireplaces, and (with the help of tramping and alpine clubs) building and maintaining huts and erecting bridges. Several areas are being developed in this way as forest parks, which, although primarily protection forests, will also provide recreation facilities.
Protection of Forests and Timber:Protection Against Fire—The fire-protection policy of the Forest Service follows from the premise that fire is the greatest single menace to forests, particularly exotic plantations, and protection vegetation in New Zealand; within a few hours fire can undo the work of decades in building up a soil and vegetation balance.
Indigenous forests are fairly fire-resistant, but highly flammable in drought conditions; and a severely-burnt indigenous forest usually means a destroyed forest, because many New Zealand species are extremely difficult to regenerate. With the increasing areas of exotic forest reaching the harvesting stage, there is a new fire hazard in that they are being worked with equipment carrying a high fire risk.
Although rainfall in New Zealand is generally adequate and well distributed, the characteristic high winds and strong sunshine dry out the vegetation on exposed situations remarkably quickly. Consequently there are few seasons when high fire hazards do not develop in some part of the country.
The fire-protection organisation of the Forest Service operates over the whole of New Zealand, covering State forests, forests on other Crown lands, scenic reserves, and national parks. The organisation has also the responsibility of securing co-ordination and uniformity in the administration of the Forest and Rural Fires Act by other fire authorities.
A fire-fighting service is maintained wherever the Department has fire-fighting responsibilities. This reaches its highest level of organisation in the larger exotic forests, where there are lookout cabins equipped with fire finders, radio, and telephones. Trained fire-fighting crews with modern equipment can be brought into action at short notice and controlled through a radio network. Aerial patrols operate during each fire season in the important Rotorua area.
The provision of a fire-hazard prediction and warning service is an essential function of the fire-protection organisation. There is a nation-wide network of “fire weather” and radio stations, and the fire-hazard situation in any part of the country is known at the head office of the Forest Service in Wellington each day during the fire season (October to April) within an hour of the weather observations being taken at the stations. This enables appropriate action, such as advice to fire authorities and broadcasting of warnings, to be taken.
The legislative provisions for fire protection are in the Forest and Rural Fires Act 1955 and the Fire Services Act 1949.
Protection Agains Noxious Animals—Under the Noxious Animals Act 1956 the Forest Service is responsible for the control of deer, goats, chamois, pigs, and other introduced wild animals on all lands where the damage they cause significantly affects the welfare of the country. Responsibility for the control of opossums and wallabies on pastoral lands has, by amendment to the Rabbits Act 1955, passed to rabbit boards. On State forest and unoccupied Crown land the Forest Service deals with opossum and wallaby control.
The widespread populations of many of these animals have a serious effect on the regeneration of forest trees and ground-cover vegetation, in production as well as in protection forests. The natural forest floor of ferns, mosses, and shrubs has been extensively damaged by such ground-browsing animals as deer and goats, while simultaneously the upper storey is being adversely affected by the canopy-feeding opossum.
Damage by deer and opossums in commercial exotic forests over the past few years has made it necessary to extend control measures into these forests.
Over 200,000 animals are killed each year by Forest Service and private hunters. Even with modern facilities, including air transport of supplies, the task of noxious animal control is arduous, however, and overall progress is slow.
In difficult country where hunting has proved impracticable, such as in parts of Westland, poisoning has been used successfully.
Control of Insects and Fungi—Sound silvicultural practices are the first line of defence, rendering trees less vulnerable to attack.
Biological control over insect pests is exerted by their natural enemies, insect or fungal parasites. Introduced species frequently come into the country without their natural enemies; part of the work of the biologist is to breed and liberate the latter.
Chemical control is an emergency measure to deal with outbreaks. It includes spraying of affected forests from aeroplanes, chemical treatment of nursery soils, and the dipping of timber to prevent attack by bark beetles and fungi.
Observers of the Forest Biology Survey maintain a constant watch on the exotic forests and on woodlots and shelter belts, and it is planned to extend this surveillance to the indigenous forests. Thus any incipient epidemics can be detected in time for effective control measures to be taken; and much information is accumulated which helps to elucidate the relationships between the organisms and the forests.
Timber Inspection and Quarantine—In keeping with current world trends, the Forest Service has developed an efficient quarantine service which covers all timber entering or leaving New Zealand.
In the past, this country has enjoyed comparative freedom from introduced insect pests, but the ever increasing tempo of international trade has multiplied the chances of accidental importation of harmful insects. Timber quarantine as practised in New Zealand embraces all imported timbers (including sawn, hewn, and natural-round produce), ship's dunnage, and imported cases and crates.
Packing timbers are considered the greatest medium for insect entry, and, in order to reduce the risks, a prohibition has recently been placed on the importation of sawn timber and wood packing with bark attached.
The same care is given to export timber, which must be completely free of insect attack before export is permitted.
Stabilisation of Sand Dunes—Sand-dune fixation is under the joint control of the Department of Lands and Survey and the New Zealand Forest Service. The objective is twofold: the stabilisation of dunes for the protection of agricultural and pastoral land, and the establishment of production forests. The Forest Service plants marram grass, sows lupin, and later establishes trees on certain protective zones. Six schemes are in operation—at Aupouri, Mangawhai, Woodhill, Waiuku, Waitarere, and Santoft—the total gross area of which is approximately 100,000 acres. About 21,000 acres of trees have been planted. Much of the area permanently fixed with trees will become productive forest.
RESEARCH—The complexity of the many indigenous-forest and exotic-forest problems requires the maintenance of an organisation to ensure the continuity and co-ordination of research effort. Since 1947 all forestry and forest-products research (including research on noxious animals) administered by the Forest Service has been undertaken or co-ordinated by the Forest Research Institute, Rotorua. In addition, the Department of Scientific and Industrial Research, the universities, and private industrial organisations undertake research into certain aspects of forestry and forest products.
The Forest Research Institute programme ranges widely. It includes studies of the fundamental physiological processes of tree growth; of the ecology of indigenous and exotic forests; of silvicultural practices for all stages of exotic forestry; of growth rates and productivity under various silvicultural treatments and their impact on the economics of the operations; of forest soils, particularly of deficiencies and remedies for them; of selection, breeding, and introduction of improved strains of trees; and of all factors affecting the health of the trees. The institute has made country-wide inventories of forest resources, indigenous and exotic, and conducts surveys of the condition of protection forests and the mountain scrub and grassland associated with them, particular attention being paid to the impact of animal pests on the vegetation.
Linked with the research into wood formation are studies of the products of forests. The physical and mechanical properties of timbers are investigated, both generally and with special reference to the effects of tree selection based on visual qualities and of silvicultural treatment. Suitability for production of woodpulp and the characteristics of the pulp from species not now used are also studied. Assistance is given to the timber industry by work on wood use, timber seasoning, and preservative treatments.
Observers of the Forest Biology Survey maintain a constant watch on the exotic forests and on woodlots and shelter belts and carry out specific investigations in indigenous forests. The Survey is designed for the detection of incipient epidemics in time for effective control measures to be taken; at the same time much information is accumulated which helps to elucidate the relationships between the organisms and the forests.
TRAINING IN FORESTRY—The Forest Service recruits rangers and professional officers as technical trainees at the age of 16 to 20 years. Ranger trainees work for one year in the forests and then attend Rotorua Ranger School for one year where they study the sciences and other subjects basic to forestry. Another two years are then spent on forests to consolidate knowledge and to learn supervision and gain experience in planning, control, and leadership. Those selected as forester trainees go directly to university on a full-time study bursary to obtain a B.Sc. degree, which may lead to post-graduate study at an overseas forestry school.
To build up a permanent and efficient skilled-labour force, the Forest Service now recruits each year about 80 youths 16 to 18 years of age. These junior woodsmen receive a two-year course of basic training in the practical skills of forestry at one of the woodsman schools at Kaingaroa, Golden Downs, or Dusky, followed by a third year of advanced training given in small groups in selected forests. The Forestry Training Centre at Rotorua regularly offers the timber industry courses in timber grading, timber inspection, and other forestry operations. A continuous series of courses is provided for Forest Service staff on all phases of Forest Service activity.
The Timber Industry Training Centre at Rotorua provides courses for the industry in saw doctoring, sawmilling, and timber machining.
The Government also offers bursaries to help science graduates not in its employ to qualify at recognised overseas forestry schools. Other scholarships for study or for research are available from a private fund.
PRIVATE FORESTRY:Private Forest Estate—The National Exotic Forest Survey has found that forest holdings other than State forest amounted, in 1962, to 545,000 acres in the following ownership categories: other Government departments 17,000 acres; local authorities 44,000 acres; afforestation companies 282,000 acres, and private persons (mostly farmers) 202,000 acres. (Estimated total areas in various ownerships at 31 March 1966 are given earlier.)
Afforestation companies boomed in the 1923-30 period, when huge areas, mostly of radiata pine, were planted. The area cut over is already being regenerated.
Extension Services—The sale by the State of planting stock in bulk lots, coupled with a revival of interest through the activities of farm-forestry associations newly established throughout the country, has resulted in an increase in extension-forestry work.
Forest Taxation—The value of standing trees does not increase any assessment for land tax and local body rates and, since 1949, concessions have been made in connection with income tax. Expenditure incurred in planting, protecting, and maintaining shelter belts and woodlots has since that year been allowed to be charged against income for tax purposes. At the same time income from the intermittent sale of farm trees could, on application to the Commissioner of Inland Revenue, be spread over five years to mitigate the effects of the higher graduation tax. In 1960 the timber value of trees growing on a deceased's estate was exempted from death duties. This exemption removes the fear of a crippling burden on the estate and the possibility of the forced sale of a perhaps immature plantation.
Forestry Encouragement Finance—Under the Forestry Encouragement Act 1962 the Government may grant loans to private owners and local authorities towards the cost of establishing and tending new plantations and the tending of those already existing. The scheme came into operation in 1963.
FINANCE OF STATE ACTIVITIES—At present more money is being spent on the establishment and tending of forests than is obtained in revenue. Expenditure by way of general administration of forestry has been met in full from taxation, as distinct from the development of State forests, which is financed from national development loans.
Sources of finance are shown in the following table.
| Source | 1961-62 | 1962-63 | 1963-64 | 1964-65 | 1965-66 |
|---|---|---|---|---|---|
| $(000) | |||||
| Consolidated Revenue Account expenture | 6,728 | 7,260 | 7,540 | 5,344 | 5,621 |
| Less receipts | 3,044 | 2,948 | 3,220 | 92 | 95 |
| Required from Consolidated Revenue Account | 3,684 | 4,312 | 4,320 | 5,252 | 5,526 |
| Works and Trading Account expenditure | 5,430 | 5,758 | 6,496 | 11,682 | 12,918 |
| Less receipts | 4,618 | 4,634 | 4,946 | 9,276 | 10,498 |
| Loan moneys required | 812 | 1,124 | 1,550 | 2,406 | 2,420 |
| Net finance required from Government funds | 4,496 | 5,436 | 5,870 | 7,658 | 7,946 |
FOREST UTILISATION: Removals of Roundwood—By the 1930s the easy abundance of indigenous timber had gone, whereas some of the exotic forests had reached the stage where harvesting could begin. By 1939, of the 60 million cubic feet per annum of roundwood for industrial use, some 10 million cubic feet came from the exotic forests. By 1948 the total removals of roundwood had gone up to 81 million cubic feet with 29 million cubic feet from the exotic forests.
Today the forest industry comprises some 552 sawmills, 10 veneer plants, and seven plywood plants, a fibreboard mill, two particle board mills, and five pulp and paper mills. The table below shows the quantities of timber produced by the forests of New Zealand to supply the forest industries.
| ROUNDWOOD PRODUCTION* (Volume in Million Cubic Feet) | |||
|---|---|---|---|
| Year Ended 31 March | Indigenous Wood | Exotic Wood | Total |
*Excludes firewood. | |||
| 1951 | 58.8 | 41.0 | 99.8 |
| 1956 | 55.7 | 68.0 | 123.7 |
| 1959 | 55.6 | 84.6 | 140.2 |
| 1960 | 58.6 | 104.5 | 163.1 |
| 1961 | 55.0 | 113.5 | 168.5 |
| 1962 | 54.1 | 120.9 | 175.0 |
| 1963 | 46.5 | 118.0 | 164.5 |
| 1964 | 47.0 | 135.2 | 182.2 |
| 1965 | 46.0 | 155.2 | 201.2 |
| 1966 | 43.6 | 163.4 | 207.0 |
Sawn-timber Production—The most important of the exotic timber species is radiata pine, which accounts for about 92 percent of the total cut of exotics; larch, eucalypts, Douglas fir, and a few other species are produced on a minor scale. Less than a third of the country's timber requirements come from the indigenous forests, and this proportion must inevitably fall as cutting is gradually reduced to the point where a small sustained yield of indigenous timber can be maintained.
The table below gives the production of rough-sawn timber from 1921 onwards.
| Year Ended 31 March | Softwoods | Hardwoods | Grand Total | ||||
|---|---|---|---|---|---|---|---|
| Indigenous | Exotic | Total | Indigenous | Exotic | Total | ||
| Board feet (million) | |||||||
| 1921 | 290 | 10 | 300 | 7 | 1 | 8 | 308 |
| 1926 | 335 | 7 | 342 | 10 | 1 | 11 | 353 |
| 1931 | 208 | 13 | 221 | 9 | - | 9 | 230 |
| 1936 | 249 | 34 | 283 | 10 | - | 10 | 293 |
| 1941 | 277 | 54 | 331 | 11 | - | 12 | 343 |
| 1946 | 226 | 97 | 323 | 19 | 3 | 22 | 345 |
| 1951 | 301 | 190 | 492 | 32 | 4 | 36 | 528 |
| 1956 | 275 | 305 | 580 | 43 | 3 | 46 | 626 |
| 1961 | 287 | 392 | 678 | 32 | 4 | 36 | 714 |
| 1962 | 278 | 378 | 656 | 33 | 4 | 37 | 693 |
| 1963 | 243 | 373 | 616 | 25 | 3 | 28 | 643 |
| 1964 | 244 | 393 | 637 | 26 | 3 | 29 | 666 |
| 1965 | 236 | 470 | 706 | 27 | 3 | 30 | 736 |
| 1966 | 219 | 505 | 724 | 30 | 3 | 33 | 757 |
NOTE—Quantities have been rounded to the nearest million board feet. (Board feet are units of 12 in. by 12 in. by 1 in.) In some cases this rounding off results in a total disagreeing slightly with the total individual items shown in the table.
The growth of exotic-timber production compared with the relatively steady production of indigenous timber is shown in the following diagram.
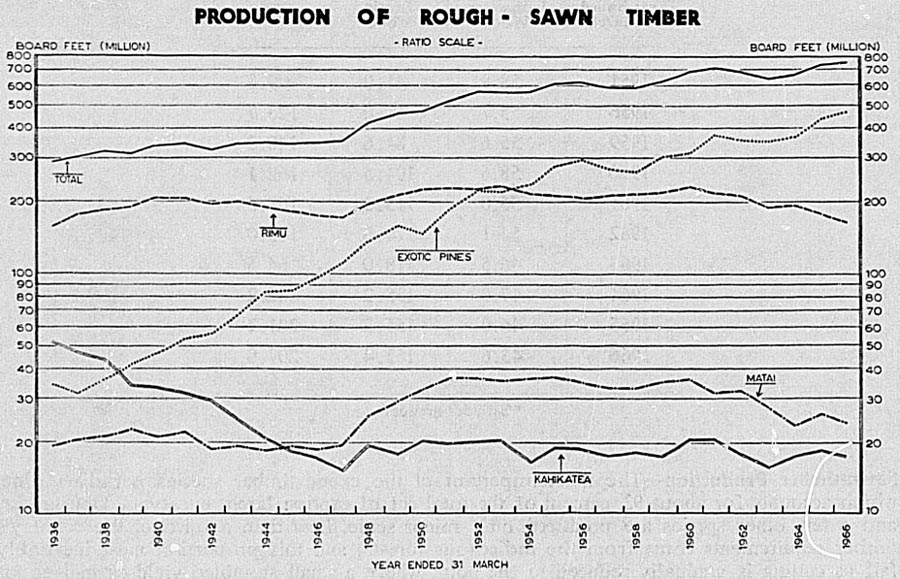
The following table gives details of timber production by species for the past five years.
| Species | Year Ended 31 March | ||||
|---|---|---|---|---|---|
| 1962 | 1963 | 1964 | 1965 | 1966 | |
| board feet (million) | |||||
| Rimu and miro | 214 | 190 | 193 | 179 | 167 |
| Matai | 32 | 28 | 24 | 27 | 24 |
| Totara | 13 | 9 | 9 | 10 | 9 |
| Kahikatea | 18 | 16 | 17 | 18 | 17 |
| Tawa | 17 | 13 | 14 | 14 | 16 |
| Beech | 13 | 9 | 10 | 12 | 12 |
| Other indigenous | 4 | 3 | 3 | 3 | 4 |
| Totals, indigenous | 311 | 268 | 270 | 263 | 249 |
| Exotic pines | 359 | 354 | 371 | 441 | 473 |
| Douglas fir | 14 | 15 | 18 | 25 | 27 |
| Eucalypts | 3 | 2 | 2 | 2 | 2 |
| Other exotic | 4 | 5 | 5 | 5 | 6 |
| Totals, exotic | 381 | 375 | 396 | 473 | 508 |
| Totals (all species) | 692 | 643 | 666 | 736 | 757 |
The Pulp and Paper Industry—The pulp and paper industry is equipped for substantial utilisation of the big exotic forests on the volcanic plateau of the North Island. There are five plants, three of which are integrated with sawmilling. The integrated plants are pulping radiata pine logs from their own or from State exotic forests.
The basic products of the industry are mechanical and chemical pulp, which are converted into such products as newsprint, kraft and other paper, paperboard, and fibreboard.
The following table gives the production of pulp in New Zealand.
| Year Ended 31 March | Wood Pulp | |
|---|---|---|
| Chemical | Mechanical | |
| tons | ||
| 1940 | - | 217 |
| 1945 | - | 15,434 |
| 1950 | - | 21,438 |
| 1955 | 43,204 | 29,568 |
| 1958 | 118,636 | 90,801 |
| 1959 | 131,357 | 103,512 |
| 1960 | 140,057 | 102,715 |
| 1961 | 152,009 | 109,399 |
| 1962 | 154,086 | 121,503 |
| 1963 | 168,108 | 135,419 |
| 1964 | 181,197 | 188,290 |
| 1965 | 193,029 | 203,372 |
| 1966 | 193,181 | 217,743 |
NOTE—Mechanical pulp includes ground-wood pulp and defibrated pulp.
All mechanical pulp is used in the manufacture of paper, paperboard, and fibreboard, but there is a deliberate surplus of chemical pulp for export. (See table on Trade in Pulp and Paper.)
Production figures of pulp products in New Zealand are as follows.
| Year Ended 31 March | Newsprint | Other Printing and Writing Paper | Other Paper and Paperboard | Total Paper and Paperboard | Fibreboard |
|---|---|---|---|---|---|
| tons | |||||
| 1940 | - | .. | 12,873 | 12,873 | - |
| 1945 | - | .. | 20,619 | 20,619 | 6,862 |
| 1950 | - | .. | 21,787 | 21,787 | 13,526 |
| 1955 | - | .. | 40,273 | 40,273 | 20,591 |
| 1956 | 9,000 | .. | 48,379 | 57,379 | 21,340 |
| 1957 | 52,700 | .. | 55,570 | 108,270 | 21,415 |
| 1958 | 64,713 | .. | 66,280 | 130,993 | 21,000 |
| 1959 | 75,298 | .. | 76,348 | 151,646 | 23,030 |
| 1960 | 76,100 | .. | 85,585 | 161,685 | 24,830 |
| 1961 | 89,300 | .. | 91,959 | 181,259 | 25,533 |
| 1962 | 91,800 | .. | 97,022 | 188,822 | 31,560 |
| 1963 | 113,700 | 2,000 | 106,842 | 222,542 | 27,250 |
| 1964 | 168,005 | 4,000 | 124,018 | 296,023 | 29,229 |
| 1965 | 184,317 | 11,869 | 114,940 | 311,126 | 31,736 |
| 1966 | 195,606 | 16,258 | 137,290 | 349,154 | 33,771 |
The rise of production of pulp and pulp products is clearly shown in the following diagram.
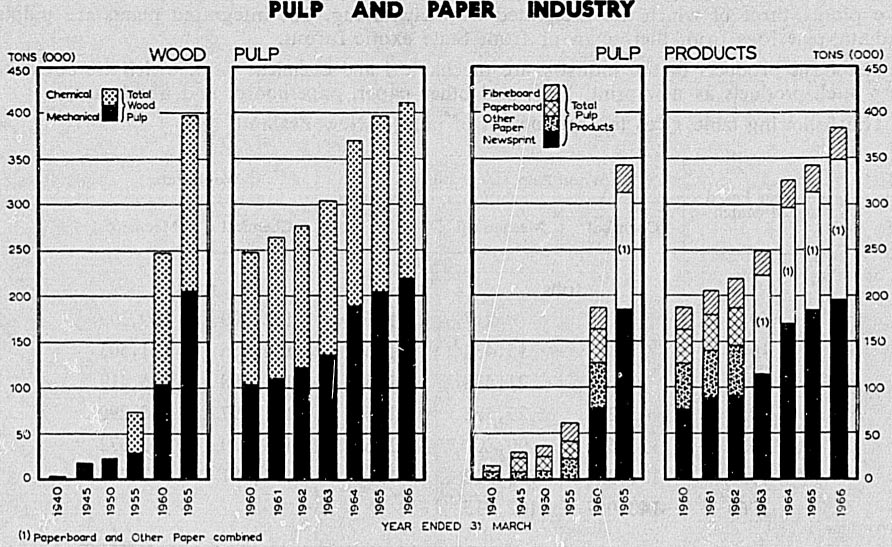
Tasman Pulp and Paper Co.—This company was formed in 1952 to utilise timber from the Kaingaroa State Forest. Practical assistance and financial backing were given by the Government, which is represented on the board of directors. The company's plant is at Kawerau, Bay of Plenty. The pulp and paper mill began operation late in 1955 and the sawmill early in 1956. The annual rated capacity of the sawmill is 34 million board feet of sawn timber in one shift, while the capacity of the pulp and paper plant is 200,000 tons of newsprint, 95,000 tons of chemical pulp, and 160,000 tons of mechanical pulp.
In 1959 the Bowater Group obtained an interest in the Tasman Pulp and Paper Co., taking over the management and development of the mill and the world sales of all its products.
New Zealand Forest Products Ltd.—This public company is already utilising over 30,000,000 cubic feet of timber a year from its own 250,000 acres of exotic forest. Plant capacity is 100,000 tons of kraft, printing, and writing paper, 150,000 tons of kraft pulp, and 80,000,000 board feet of sawn timber per annum. The company is equipped to convert 10,000,000 board feet of timber into wooden cases and to produce 50,000,000 square feet of veneer, 43,000 tons of fibreboard, and 38,000,000 multi-wall paper bags. The integrated pulp mill, paper mill, and sawmill is located at Kinleith, near Tokoroa, while the fibreboard, multiwall paper bags, and wooden cases are manufactured in Auckland. Forest Products are also joint owners with A.P.M. of Australia in Fibre Products N.Z. Ltd., a firm which makes over 13 million moulded fruit trays a year.
Whakatane Board Mills Ltd., which is a subsidiary of New Zealand Forest Products, operates two paperboard machines, with an annual production capacity of 58,000 tons. The company manufactures its own mechanical and semi-chemical pulp, and is self-sufficient for more than 90 percent of its raw materials; it also uses considerable quantities of waste paper.
The company owns its own radiata-pine forest at Matahina and hauls the logs 26 miles to the mill by road. An associated company, Whakatane Timber Mills Ltd., has its modern sawmill located near the board mill to take the larger logs from the forest.
Caxton Paper Mills Ltd. makes tissue and various lightweight papers adjacent to the Tasman Pulp and Paper Co.'s plant at Kawerau. The mill has a capacity of 30 thousand tons annually. It draws water and steam supplies from the Tasman company.
New Zealand Paper Mills Ltd., at Mataura, has been in operation for more than 80 years. Its three machines produce a wide range of papers from fine tissues to heavy krafts, as well as paper felt, pressings, and manilas for special trade requirements. The mills are being modernised to enable production to be diversified and substantially increased. A mill for making mechanical pulp has been installed; its output supplements purchased supplies of New Zealand made sulphate pulp, imported sulphite pulp, and waste paper. Annual production capacity is 15,000 tons of kraft and other papers.
Plywood and Veneer Manufacture—Seven factories manufacture plywood, and the total output for the year ended 31 March 1965, when reduced to a uniform basis of 3/16 in. thickness, was 54.2 million square feet. Three other plants produce veneer only. Total production of veneer in the industry in 1964-65 was 183 million square feet (1/16 in. basis).
Over the past decade radiata pine has become increasingly important as a species for peeler log supply, and in the 1964-65 year provided 47 percent of total peeler log production. Now that the indigenous forests have become depleted, the production of peeler logs for veneer and plywood manufacture is regarded by the Forest Service as having a first claim on the State forests; hence in its own logging activities the Forest Service aims at producing the maximum amount of peeler logs, and has recently also adopted a policy of requiring sawmillers purchasing State indigenous forest to reserve logs suitable for peeling and divert them to the veneer factories.
Species of logs and quantities of plywood and veneer produced are shown in the following table.
| Year Ended 31 March | Volume of Logs Used | Value of Logs Used | Production | ||||||
|---|---|---|---|---|---|---|---|---|---|
| Rimu | Kahikatea | Radiata Pine | Other | Imported | Total | Plywood | Veneer | ||
| cubic feet (thousand) | $(000) | million square feet | |||||||
| 1959 | 973 | 117 | 511 | 198 | - | 1,799 | 936 | 40.0 | 149.7 |
| 1960 | 1,055 | 168 | 560 | 100 | 113 | 1,996 | 1,026 | 43.1 | 169.2 |
| 1961 | 1,067 | 262 | 395 | 101 | 143 | 1,968 | 1,142 | 48.0 | 176.2 |
| 1962 | 1,010 | 178 | 728 | 93 | 163 | 2,172 | 1,214 | 49.3 | 189.3 |
| 1963 | 1,082 | 168 | 878 | 90 | 35 | 2,253 | 1,202 | 51.4 | 188.8 |
| 1964 | 920 | 208 | 836 | 47 | 148 | 2,159 | 1,290 | 52.9 | 185.9 |
| 1965 | 983 | 171 | 1,133 | 43 | 97 | 2,427 | 1,280 | 54.2 | 183.0 |
Production of Round and Split Produce—Considerable quantities of native timbers have been used in the past to meet the needs for mining, fencing timbers, and firewood, and for a proportion of sleeper, pole, and bridge-timber requirements. Thinnings and small-diameter logs from exotic forests are now supplying almost the total requirements for fence posts in the country. A 1964 survey showed a total annual fence post usage of 7 1/4 million posts, most of which are preservative treated.
Wood Preservation—In the year ended 31 March 1966, 40 percent of all sawn timber produced was preservative treated; by world standards the proportion treated is very high, partly because of the relative ease with which exotic softwoods such as radiata pine may be treated.
Features of the preservation industry are: The very wide use in house building of timber treated by diffusion or vacuum-pressure methods with water-borne preservative at low retentions to prevent insect borer attack; the wide dispersal of small treating plants specialising in such treatment; and the quality-control function exercised by the Timber Preservation Authority (set up by the Government in 1955). Plant inspection and sampling associated with quality control are done on behalf of the Authority by Forest Service staff.
Timber Preservation Authority specifications cover the accepted methods of treatment, types of preservative, and levels of toxicity dictated by service conditions. Thus provision is made for treatment against decay of exterior timbers with oil-type preservatives (e.g., creosote) by pressure, hot and cold bath, and cold soak, the principal products being poles, posts, and sleepers. Multi-salt preservatives have a wide range of applications with consequent variation in the amount of preservative required to be present. The principal method of application is by vacuum pressure, but such variations as the oscillating pressure method (OPM) and the Lowry process have been introduced. The OPM is expected to facilitate treatment of large-diameter round products and large sawn sections of radiata pine and similar timbers, because it avoids the long pre-seasoning period.
Collection of statistics on wood preservation was introduced in 1955 and the following table shows the quantities of sawn timber treated in the country.
| Year | Open Tank | Diffusion Impregnation* | Pressure Impregnation | Total |
|---|---|---|---|---|
| board feet (thousand) | ||||
| *Mainly boron. | ||||
| 1954-55 | 53 | 6,984 | 61,484 | 68,520 |
| 1955-56 | - | 7,307 | 81,967 | 89,274 |
| 1956-57 | - | 8,829 | 83,792 | 92,621 |
| 1957-58 | 5 | 21,637 | 83,522 | 105,163 |
| 1958-59 | - | 47,187 | 96,584 | 143,770 |
| 1959-60 | 30 | 70,889 | 105,837 | 176,756 |
| 1960-61 | 12 | 94,895 | 120,007 | 214,914 |
| 1961-62 | - | 93,873 | 127,801 | 221,674 |
| 1962-63 | 3 | 91,242 | 120,333 | 211,579 |
| 1963-64 | 16 | 102,974 | 125,873 | 228,863 |
| 1964-65 | 140 | 132,991 | 142,373 | 275,504 |
| 1965-66 | 4 | 149,621 | 153,878 | 303,503 |
In addition to the above, 8,819,000 cubic feet of other timber, such as sleepers, poles, and fencing materials, was treated by the open-tank method, by diffusion, and by pressure impregnation in 1965-66.
Employment Statistics—The following table shows the number of employees and working proprietors in the forest industries at 15 October in the years stated. (Source: Labour and Employment Gazette, Department of Labour.)
| At 15 October | Forestry | Logging | Sawmilling | Pulp and Paper Industry | Other | Total |
|---|---|---|---|---|---|---|
*Included in Other. NOTES:
| ||||||
| 1946 | 1,807 | 1,760 | * | 1,868 | 15,049 | 20,484 |
| 1950 | 2,133 | 2,202 | * | 2,222 | 18,074 | 24,631 |
| 1955 | 2,207 | 2,842 | 6,328 | 3,573 | 13,679 | 28,629 |
| 1958 | 2,564 | 2,738 | 6,221 | 4,520 | 14,124 | 30,167 |
| 1959 | 2,886 | 2,702 | 6,139 | 4,803 | 14,369 | 30,899 |
| 1960 | 2,945 | 2,563 | 6,431 | 5,160 | 14,897 | 31,996 |
| 1961 | 3,079 | 2,546 | 6,358 | 5,316 | 15,356 | 32,655 |
| 1962 | 3,447 | 2,421 | 6,210 | 5,562 | 15,079 | 32,719 |
| 1963 | 3,985 | 2,400 | 6,075 | 6,269 | 15,411 | 34,140 |
| 1964 | 3,908 | 2,638 | 6,248 | 6,500 | 16,167 | 35,461 |
| 1965 | 3,948 | 2,728 | 6,313 | 6,960 | 16,925 | 36,874 |
OVERSEAS TRADE—Although durable Australian hardwoods are still imported for use as railway sleepers, large poles, cross-arms, and wharf, bridge, and constructional timbers, etc., increasing use is being made of preservative-treated softwood timber for these and other uses in which structural timbers are subject to severe service conditions. The demand for Douglas fir, redwood, and western red cedar from North America for structural uses, exterior joinery, and weatherboards continues. Other imports are normally limited to Japanese oak for the furniture trade and to small quantities of other species for specialty purposes.
While exports of indigenous timbers in recent years have virtually ceased, owing to the conservation of these timbers for home consumption, there is now an established market in Australia for radiata pine timber and in Japan for pine logs.
Tables giving details of the external trade in timber follow. The value of imports is the current domestic value in the country of origin; the value of exports is free on board at the port of shipment.
| TIMBER IMPORTS BY CATEGORIES | |||||||
|---|---|---|---|---|---|---|---|
| Year | Sawn Timber | Sleepers | Logs and Poles | ||||
| Australian Hardwoods | North American Softwoods* | Oak | Other | Total | |||
*Douglas fir, redwood, and cedar. | |||||||
| board feet (million) | Cu. ft. (million) | ||||||
| Ended December— | |||||||
| 1958 | 10.0 | 14.9 | 3.1 | 5.0 | 32.9 | 12.1 | 0.4 |
| 1959 | 5.5 | 13.3 | 1.5 | 3.6 | 23.9 | 5.4 | 0.4 |
| 1960 | 8.7 | 16.6 | 1.5 | 4.3 | 31.1 | 7.6 | 0.5 |
| 1961 | 9.8 | 21.3 | 1.1 | 5.2 | 37.4 | 9.8 | 0.6 |
| 1962 | 6.0 | 17.2 | 0.4 | 4.8 | 28.4 | 3.3 | 0.4 |
| Ended June— | |||||||
| 1963 | 5.7 | 16.3 | 0.2 | 5.5 | 27.7 | 3.3 | 0.3 |
| 1964 | 7.0 | 14.9 | 0.2 | 5.2 | 27.3 | 2.7 | 0.6 |
| 1965 | 6.4 | 22.7 | 0.1 | 6.9 | 36.1 | 2.7 | 0.5 |
| 1966 | 7.2 | 22.4 | 0.2 | 8.7 | 38.5 | 2.2 | 0.8 |
NOTE—Figures have been adjusted to include items not given in board feet in published statistics.
| TIMBER EXPORTS BY CATEGORIES | |||||||
|---|---|---|---|---|---|---|---|
| Year | Indigenous Timber | Radiata Pine | Other Exotics | Total Exotics | Total, All Sawn Timber | Logs and Poles | |
| Sawn | Cases | ||||||
| board feet (million) | cu. ft. (million) | ||||||
| Ended December— | |||||||
| 1957 | - | 27.2 | 2.1 | 0.6 | 29.9 | 29.9 | - |
| 1958 | 0.4 | 33.4 | 4.9 | 1.3 | 39.6 | 40.1 | 1.1 |
| 1959 | 0.3 | 41.3 | 4.5 | 4.9 | 50.8 | 51.0 | 5.0 |
| 1960 | 0.4 | 40.6 | 3.6 | 3.0 | 47.2 | 47.6 | 4.3 |
| 1961 | 0.2 | 26.8 | 3.7 | 1.5 | 32.0 | 32.2 | 9.2 |
| 1962 | 0.2 | 26.6 | 4.2 | 1.9 | 32.7 | 32.9 | 9.3 |
| Ended June— | |||||||
| 1963 | 0.1 | 25.1 | 4.3 | 3.1 | 32.5 | 32.6 | 7.8 |
| 1964 | - | 25.5 | 4.0 | 3.9 | 33.4 | 33.4 | 10.9 |
| 1965 | 0.3 | 33.2 | 3.9 | 4.6 | 41.7 | 42.0 | 14.5 |
| 1966 | 0.1 | 26.9 | 2.3 | 3.5 | 32.7 | 32.8 | 17.8 |
NOTE—Small quantities of roundwood are included in the exports.
| EXPORTS OF TIMBER: DESTINATION | ||||||||||
|---|---|---|---|---|---|---|---|---|---|---|
| Year | Australia | Pacific Islands | Japan | Other Countries | Total | |||||
| Quantity | Value | Quantity | Value | Quantity | Value | Quantity | Value | Quantity | Value | |
| bd. ft. (million) | $(000) | bd. ft. (million) | $(000) | bd. ft. (million) | $(000) | bd. ft. (million) | $(000) | bd. ft. (million) | $(000) | |
| Ended December— | ||||||||||
| 1957 | 28.5 | 1,642 | 1.4 | 148 | 0.1 | 2 | - | - | 30.0 | 1,792 |
| 1958 | 35.7 | 2,115 | 4.4 | 492 | 13.7 | 266 | - | 2 | 53.7 | 2,876 |
| 1959 | 46.9 | 2,890 | 4.1 | 444 | 60.2 | 1,073 | - | 1 | 111.2 | 4,408 |
| 1960 | 44.7 | 2,738 | 3.4 | 366 | 51.6 | 1,086 | - | - | 99.7 | 4,190 |
| 1961 | 28.8 | 1,698 | 3.4 | 362 | 110.4 | 2,304 | - | 12 | 142.6 | 4,376 |
| 1962 | 28.6 | 1,680 | 4.3 | 480 | 105.2 | 2,267 | 6.0 | 241 | 144.1 | 4,668 |
| Ended June— | ||||||||||
| 1963 | 28.1 | 1,609 | 4.9 | 515 | 77.1 | 1,631 | 16.2 | 357 | 126.3 | 4,112 |
| 1964 | 27.6 | 1,634 | 5.2 | 534 | 118.4 | 2,565 | 52.5 | 278 | 163.7 | 5,011 |
| 1965 | 36.7 | 2,160 | 6.9 | 599 | 171.6 | 3,650 | 1.0 | 40 | 216.2 | 6,449 |
| 1966 | 28.9 | 1,786 | 3.9 | 397 | 196.1 | 3,932 | 17.6 | 399 | 246.5 | 6,514 |
NOTE—Logs are included (expressed in board feet solid volume).
Production of the pulp and paper industry almost fully meets New Zealand's requirements and leaves a considerable surplus of newsprint and woodpulp for export.
The following table gives New Zealand's external trade in pulp and paper for the latest seven years.
| EXTERNAL TRADE IN PULP AND PAPER | |||||
|---|---|---|---|---|---|
| Year | Wood Pulp | Fibreboard | Paper and Paperboard | ||
| Newsprint | Other Paper and Paperboard† | Total | |||
*In 1,000 square feet. †Includes all other paper exported, but not manufactures of paper and paperboard; values include items for which no quantities are given. Basis for valuation: Exports—free on board at port of shipment; Imports—c.d.v. in country of origin. | |||||
| Imports | |||||
| tons | |||||
| Ended December— | |||||
| 1960 | 12,045 | 687* | 31,609 | 30,921 | 62,530 |
| 1961 | 13,497 | 702* | 26,774 | 37,036 | 63,810 |
| 1962 | 14,525 | 127* | 10,580 | 30,698 | 41,278 |
| Ended June— | |||||
| 1963 | 16,254 | 93* | 6,126 | 30,999 | 37,125 |
| 1964 | 19,889 | 119* | 6,458 | 30,891 | 37,349 |
| 1965 | 17,557 | 349* | 4,536 | 31,370 | 35,906 |
| 1966 | 21,673 | 193* | 3,004 | 26,595 | 29,599 |
| Value $ (thousand) | |||||
| Ended December— | |||||
| 1960 | 1,020 | 15 | 3,412 | 8,896 | 12,308 |
| 1961 | 1,236 | 12 | 2,826 | 10,454 | 13,280 |
| 1962 | 1,201 | 5 | 1,134 | 8,734 | 9,868 |
| Ended June— | |||||
| 1963 | 1,344 | 6 | 666 | 8,359 | 9,025 |
| 1964 | 1,730 | 10 | 665 | 8,647 | 9,312 |
| 1965 | 1,609 | 12 | 473 | 7,617 | 8,090 |
| 1966 | 1,949 | 8 | 337 | 7,626 | 7,963 |
| Exports | |||||
| tons | |||||
| Ended December— | |||||
| 1960 | 70,150 | 948* | 49,413 | 5,932 | 55,345 |
| 1961 | 63,601 | 911* | 46,175 | 975 | 47,150 |
| 1962 | 70,134 | 1,836* | 41,493 | 1,067 | 42,560 |
| Ended June— | |||||
| 1963 | 69,067 | 2,519* | 72,061 | 800 | 72,861 |
| 1964 | 65,601 | 2,396* | 107,353 | 811 | 108,164 |
| 1965 | 55,850 | 2,841* | 110,912 | 743 | 111,655 |
| 1966 | 70,332 | 3,291* | 117,060 | 1,674 | 118,734 |
| Value $ (thousand) | |||||
| Ended December— | |||||
| 1960 | 5,623 | 33 | 6,160 | 916 | 7,076 |
| 1961 | 5,031 | 34 | 5,406 | 335 | 5,741 |
| 1962 | 5,668 | 54 | 4,597 | 252 | 4,849 |
| Ended June— | |||||
| 1963 | 5,500 | 66 | 8,037 | 263 | 8,300 |
| 1964 | 5,512 | 72 | 11,518 | 250 | 11,768 |
| 1965 | 4,746 | 90 | 11,933 | 199 | 12,132 |
| 1966 | 5,980 | 125 | 11,917 | 306 | 12,223 |
FOREST TREES AND TIMBERS—Detailed information is contained in publications of the New Zealand Forest Service, including Forest Trees and Timbers of New Zealand (Entrican, Hinds, and Reid); Exotic Forest Trees in New Zealand (Weston); The National Forest Survey of New Zealand, 1955, Vol. I: The Indigenous Forest Resources of New Zealand (Masters, Holloway, and McKelvey); The Physical and Mechanical Properties of the Principal Indigenous Woods of New Zealand (Entrican, Ward, and Reid); New Zealand Building Timbers (Reid); and the annual reports of the Forest Service and Forest Research Institute. New Zealand Forestry gives an overall account of all aspects of forestry in New Zealand from pre-settlement times to the present day.
GENERAL—The fishing industry in New Zealand is based on the bottom-dwelling or demersal species of fish caught by trawling, Danish seining, lines, and nets. Trawling is by far the most important method, producing approximately 77 percent of the total catch, followed by line methods 12 percent, net and other methods 7 percent, and Danish seining 4 percent. The efficient motor trawler ranging in size between 50 ft and 60 ft with a crew of two or three men has come to be the type of vessel mainly used by the industry. In recent years there has been a trend to larger stern-ramp trawler with improved gear and equipment. Two 140 ft boats have entered service with a newly established Nelson company which will fish in new fields and by producing fish meat will be able to use all fish caught. The Marine Department has a 92 ft stern-ramp trawler for fishing research and experiment.
In New Zealand the fishing industry consists of a relatively large number of operators. It is widely dispersed around a number of smaller ports as well as the main ports. The industry is built around the handling and selling of fresh fish in the main, as opposed to processing fish. Exports are relatively limited, except for crayfish.
Controls governing the fishing industry have been based mainly on conservation which, over the years, has come to mean a steady level of catch of each individual species rather than a full economic utilisation of available resources. Plans are being made for the development of the fishing industry. The Territorial Sea and Fishing Zone Act 1965 redefined the three-mile territorial seas and introduced a nine-mile fishing zone beyond the territorial limit.
Of the many kinds of excellent edible fishes the most important are the snapper (Chrysophrys auratus), which is the principal species in the catch (mainly by trawl) in the north-western part of the South Island, the west coast of the North Island, and the east coast of the North Island to just south of East Cape; next in importance is tarakihi (Cheilodactylus macropterus), which is taken mainly by trawlers working off the east coast of the North Island and in smaller quantities off the coasts of the South Island. The groper or hapuku (Polyprism oxygeneios) is caught on lines in the deeper water from North Cape to Stewart Island, but principally in Cook Strait and on the rocky parts of the east coast of the South Island, while the blue cod (Parapercis colias) is the staple line-caught product of the southern line fisheries, particularly about Foveaux Strait, Stewart Island, and at Chatham Islands. Tuna species occur both in the inshore and in the oceanic waters around New Zealand but tuna fishery has not been developed in accordance with the probable density of these species, although plans have been made for more intensive development.
The flounder and sole (Pleuronectidae) occur in the more shallow and sheltered waters.
The most productive grounds are in relative shallow waters, and, except for groper and ling, which are fished for by means of deep long lines, most of the fishing is carried on at depths of less than 80 fathoms. Depths of over 100 fathoms occur at a comparatively short distance from the coast. The principal methods of fishing are long-lining for groper (hapuku), ling, hake, kingfish, and snapper; hand-lining for blue cod; trawling and Danish seining, by which flounders, snapper, tarakihi, gurnard, John Dory, and a variety of other fish are taken. In bays and estuaries set-nets are used for flounders, snapper, and mullet, and seines are also employed principally for the capture of flat fish and snapper.
The governing legislation for the fishing industry is the Fisheries Act 1908, which is administered by the Marine Department.
The principal regulations dealing with fisheries are the Fisheries (General) Regulations 1950, the Freshwater Fisheries Regulations 1951, and the Commercial Fishing Regulations 1963. Under the Freshwater Fisheries Regulations are issued a number of modification notices which deal with particular aspects—e.g., permissible length of different classes of fish to be taken—while the various acclimatisation societies' rules are issued under the authority of these regulations. The Oyster Fishing Regulations 1946 and the Whitebait Fishing Regulations 1964 are directly relevant to the fishing industry. Other regulations include the Seal Fisheries Regulations 1946, the Quinnat Salmon Regulations 1964, the Fish-pass Regulations 1947, and the Toheroa Regulations 1955.
Fishing Industry Board—In 1963 there was passed a Fishing Industry Board Act, providing for the establishment of a seven-member board with the principal function of promoting the expansion and development of the fishing industry, marketing and standards of hygiene and packaging, continuity of supply, co-ordination within the industry, co-ordination of research, and means of financing development. Members were appointed and met for the first time in April 1964.
The Government made a grant of $100,000 towards the cost of establishing the Board. A levy of approximately 2 percent of the landed value of fish came into force on 1 January 1965, and this is expected to provide $56,000 a year for the Board's activities. The Board has set up committees to investigate local supply and marketing, export development, technical education, tuna development, and fishing demonstrations.
Objectives of the Board include the provision of adequate supplies of high-quality fish for the local market at reasonable prices, and an increase in overseas earnings from selling more fish overseas. It is recognised that fishermen must be encouraged to modernise their trawling fleet and that shore establishments of the industry must be improved to fulfil these objectives. In 1965 the Government arranged to guarantee mortgages to the value of $1,000,000 and lend up to $600,000 through the State Advances Corporation to purchase new, fully-equipped fishing vessels. Guarantees will be given or loans made on the recommendation of a Fishing Industry Loans Committee.
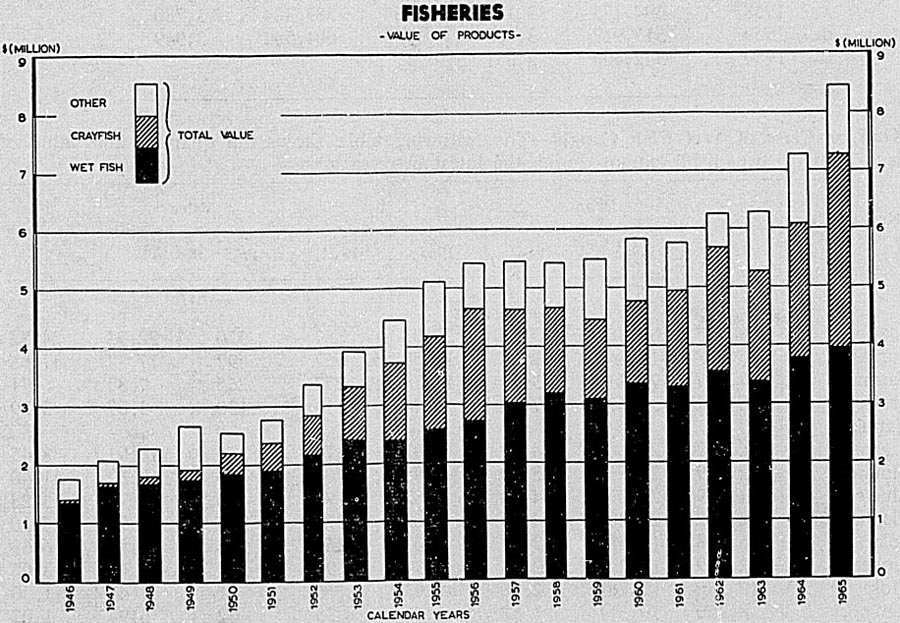
FISHERIES
FISHERY STATISTICS—As at 31 December 1965 there were 1,703 licensed fishing boats, compared with 1,567 a year earlier. Values of catches by these boats for the year ended 31 December 1965 were as follows: Over $2,000, 704; $1,000-$2,000, 140; under $1,000, 859.
The estimated total quantity and value of the principal classes of fishery products marketed were as follows in the two latest years.
| Product | Unit | Quantity | Value | ||
|---|---|---|---|---|---|
| 1964 | 1965 | 1964 | 1965 | ||
| $(000) | $(000) | ||||
| Wet fish | cwt | 589,384 | 604,582 | 3,780 | 3,949 |
| Whitebait (West Coast South Island only) | cwt | 2,822 | 2,416 | 290 | 233 |
| Oysters (dredged) | sacks | 94,980 | 123,294 | 665 | 864 |
| Oysters (rock) | sacks | 2,132 | 2,196 | 20 | 20 |
| Mussels | sacks | 25,110 | 31,859 | 54 | 43 |
| Crayfish | cwt | 90,307 | 97,933 | 2,315 | 3,270 |
| Fish livers | lb | 91,122 | 213,819 | 9 | 21 |
| Total value | .. | .. | .. | 7,133 | 8,400 |
Annual quantities and values of wet fish caught are shown in the following table.
| Year | Total Quantity | Total Value |
|---|---|---|
| cwt | $(000) | |
| 1955 | 435,335 | 2,599 |
| 1956 | 450,890 | 2,713 |
| 1957 | 498,302 | 3,008 |
| 1958 | 494,173 | 3,173 |
| 1959 | 517,917 | 3,086 |
| 1960 | 542,506 | 3,351 |
| 1961 | 528,632 | 3,254 |
| 1962 | 554,654 | 3,545 |
| 1963 | 550,966 | 3,336 |
| 1964 | 589,384 | 3,780 |
| 1965 | 604,582 | 3,949 |
Kind or Class of Wet Fish Caught—The following table shows the quantity and value of each kind of "wet fish'' caught during the latest two years.
| Kind or Class of Fish | Quantity | Value | ||||||
|---|---|---|---|---|---|---|---|---|
| 1964 | 1965 | 1964 | 1965 | 1964 | 1965 | 1964 | 1965 | |
| cwt | percent | $(000) | percent | |||||
| Snapper | 160,795 | 169,483 | 27.28 | 28.03 | 867 | 970 | 22.95 | 24.55 |
| Tarakihi | 115,573 | 118,367 | 19.61 | 19.58 | 657 | 697 | 17.37 | 17.65 |
| Gurnard | 77,397 | 71,236 | 13.13 | 11.78 | 277 | 265 | 7.33 | 6.71 |
| Trevally | 46,572 | 51,174 | 7.90 | 8.46 | 116 | 130 | 3.07 | 3.29 |
| Hapuku (groper) | 26,977 | 24,583 | 4.58 | 4.07 | 378 | 334 | 10.01 | 8.45 |
| Flounder | 19,459 | 23,266 | 3.30 | 3.85 | 409 | 450 | 10.82 | 11.40 |
| Blue cod | 24,039 | 23,079 | 4.08 | 3.82 | 178 | 130 | 4.71 | 3.28 |
| Elephant fish | 24,312 | 21,882 | 4.13 | 3.62 | 224 | 241 | 5.92 | 6.10 |
| Sole | 16,933 | 18,584 | 2.87 | 3.07 | 260 | 264 | 6.89 | 6.69 |
| Pioke | 12,789 | 14,224 | 2.17 | 2.35 | 93 | 120 | 2.47 | 3.03 |
| Moki | 12,260 | 12,261 | 2.08 | 2.03 | 56 | 51 | 1.47 | 1.30 |
| Red cod | 8,956 | 10,317 | 1.52 | 1.71 | 35 | 42 | 0.94 | 1.07 |
| Other | 43,322 | 46,126 | 7.35 | 7.63 | 230 | 255 | 6.08 | 6.46 |
| Totals | 589,384 | 604,582 | 100.00 | 100.00 | 3,949 | 3,780 | 100.00 | 100.00 |
Methods of Capture—The total quantity of "wet fish'' caught by each of the common methods of fishing is shown below for the latest two years.
| Method of Fishing | Quantity | Value | ||
|---|---|---|---|---|
| 1964 | 1965 | 1964 | 1965 | |
| cwt | $(000) | |||
| Trawl | 460,453 | 480,594 | 2,665 | 2,869 |
| Danish seine | 23,008 | 24,072 | 130 | 145 |
| Set and drag nets | 37,141 | 37,260 | 345 | 386 |
| Long and hand lines | 68,423 | 62,351 | 636 | 546 |
| Other methods | 359 | 305 | 3 | 2 |
| Total | 589,384 | 604,582 | 3,779 | 3,948 |
Landings at the Ports—Ports where the total landed catch was in excess of 10,000 cwt are listed in the following table.
| Port | Quantity | Value | ||
|---|---|---|---|---|
| 1964 | 1965 | 1964 | 1965 | |
| cwt | $(000) | |||
| Auckland | 133,424 | 146,479 | 639 | 725 |
| Gisborne | 55,697 | 59,658 | 261 | 191 |
| Timaru | 56,961 | 51,787 | 272 | 440 |
| Napier | 43,296 | 46,313 | 224 | 251 |
| Wellington | 45,340 | 40,619 | 348 | 302 |
| Tauranga | 27,437 | 35,605 | 138 | 188 |
| Lyttelton | 36,048 | 27,298 | 286 | 232 |
| Manukau | 35,756 | 26,113 | 149 | 115 |
| Nelson | 18,063 | 22,171 | 111 | 142 |
| Chatham Islands | 10,579 | 15,953 | 32 | 48 |
| Thames | 14,055 | 14,072 | 87 | 112 |
| Port Chalmers | 12,416 | 14,051 | 117 | 135 |
| Akaroa | 11,868 | 11,567 | 101 | 100 |
The total quantity of fish landed at these ports in 1965 was 511,686 cwt, which was 84.63 percent of the total catch.
EXPORTS—A table showing quantities and values of the principal classes of fishery products exported during each of the latest three years is set out below.
| Commodity | Unit | Quantity | Value £(000) | ||||
|---|---|---|---|---|---|---|---|
| 1963 | 1964 | 1965 | 1963 | 1964 | 1965 | ||
| Crayfish and tails | cwt | 23,987 | 28,459 | 28,042 | 2,023 | 2,973 | 3,919 |
| Frozen fish | cwt | 48,962 | 54,775 | 52,342 | 868 | 1,042 | 1,045 |
| Fish and shellfish, canned | lb | 60,909 | 43,523 | 118,366 | 33 | 86 | 60 |
| Fish, smoked, dried, etc. | cwt | 852 | 871 | 882 | 19 | 19 | 22 |
| Other Crustacea and mollusca | cwt | 247 | 705 | 122 | 9 | 25 | 2 |
| Fish meal | cwt | .. | .. | 1,840 | .. | .. | 9 |
| Total values | .. | .. | .. | .. | 2,951 | 4,146 | 5,057 |
FISH-LIVER OIL—Fish-liver oil is now meeting strong competition from synthetically produced vitamins. Only one factory is now processing fish livers. The total weight of livers processed and the quantity of oil produced in each of the latest six years were as follows.
| Year | Weight of Livers Treated | Quantity of Oil Produced |
|---|---|---|
| lb | gallons | |
| 1960 | 308,376 | 16,775 |
| 1961 | 328,495 | 18,782 |
| 1962 | 302,729 | 17,156 |
| 1963 | 269,272 | 16,952 |
| 1964 | 91,122 | 6,075 |
| 1965 | 213,819 | 10,760 |
OYSTER BEDS—The principal oyster beds around the coast of New Zealand are those situated in Foveaux Strait, between South and Stewart Islands, and the rock-oyster beds on the east and west coasts of the Auckland peninsula.
In South Island waters a close season is observed from 1 October to 14 February, and in North Island waters from 1 November to 30 April in each year. The taking of oysters is governed by the Oyster-fishing Regulations 1946, and vessels operating commercially are subject to the Commercial Fishing Regulations 1963. During the 1965 season 123,124 sacks of oysters were dredged from Foveaux Strait, compared with 94,890 sacks in 1964.
The rock-oyster beds of Auckland were worked for many years under a variety of systems, but, owing to stripping of the beds, close seasons had frequently to be proclaimed. From 1908 the picking and wholesale marketing of rock oysters from the North Island beds was undertaken by the State, private picking being prohibited. In 1958 a change was made in the marketing procedure, and sales to the public through the oyster depot were discontinued. The total supply of oysters is now allocated direct to the trade in an endeavour to achieve wider distribution through the retail fish shops.
Oyster cultivation is being carried out on an experimental basis by the Marine Department in the Hauraki Gulf, in the Bay of Islands, and in the Kaipara Harbour. In 1964 an Act was passed to provide for the setting up of oyster farms by private persons as a first step towards establishing a rock-oyster industry.
Rock oysters picked by the State in 1965 totalled 2,196 sacks, compared with 2,132 sacks in 1964.
CRAYFISH—Marine crayfish occur off many parts of the New Zealand coast. Part of the catch of crayfish is sold in local markets for domestic consumption, part is exported as frozen crayfish tails and whole crays, while a small quantity is canned.
With the development of the export of frozen crayfish tails to the United States of America and the high price received for this product, the increase in the catch of crayfish was phenomenal, reaching a peak of 130,000 cwt in 1956. The catch of crayfish over the latest five years is as follows.
| Year | Quantity | Value |
|---|---|---|
| cwt | $(000) | |
| 1961 | 79,398 | 1,694 |
| 1962 | 90,018 | 2,142 |
| 1963 | 89,449 | 1,881 |
| 1964 | 90,307 | 2,315 |
| 1965 | 97,933 | 3,270 |
WHALING—In 1963 the International Whaling Commission introduced a complete ban on the killing of humpback whales and the sole remaining New Zealand whaling station, situated in the Cook Strait area, was forced to convert to hunting sperm whales. The company sought sperm whales with some initial success but a substantial drop in the world price for sperm-whale oil led to the cessation of shore-based whaling, which began in New Zealand about 1829.
SEALS—The taking of seals in New Zealand waters has been on a restricted scale during the last 70 years, these animals being placed on the protected list in 1894. No sealing was then allowed until 1913, when there was an open season, but with certain restrictions. From 1916 a close season was observed until 1922, when the taking of seals was again permitted, but only till 1924, since when a close season has been observed, except for a short restricted open season during 1946.
BIG-GAME FISHING—Swordfish (striped and black marlin, and occasionally broadbill), mako shark, and other big-game fish occur principally off the east coast of the Auckland Provincial District, and attract both New Zealand and visiting big-game fishermen. The principal centres for this sport are Whangaroa, Russell (Bay of Islands), Whitianga (Mercury Bay), and Tauranga, where specially designed and equipped launches in charge of experienced men may be hired. The season lasts from December to May, the best months usually being February and March. The record black marlin swordfish (976 lb) was caught off the Bay of Islands.
To preserve this very important fishery the Fisheries (General) Regulations 1950 prohibit the taking of these fish by other than rod and line, and stipulate that the line be not heavier than No. 39 linen thread line. In addition, a limit bag of not more than four fish per boat per day has been imposed.
In the 1965 season (from November 1964 to June 1965), big-game fish caught included 15 black marlin, 243 striped marlin, 5 blue marlin, 178 mako shark, and 578 other species. Figures for the 1964 season recorded 13 black marlin, 180 striped marlin, 5 blue marlin, 152 mako shark, and 620 fish of other species.
WHITEBAIT—A fishery that is peculiar to New Zealand with regard both to the product and to the methods of operation is the whitebait fishery, which is carried on from July to November in the tidal reaches of many rivers. The most productive fishing grounds are near the mouths of the rivers of the West Coast of the South Island and in the lower reaches of the Waikato River. Normally the whitebait fishery gives employment to over 300 regular fishermen, and a greater number of part-time fishers, and has, over a period of years, produced an average of approximately 3,000 cwt of whitebait. With improved transport from the more remote rivers, in which aeroplanes have played an important part a substantial whitebait industry has been developed, particularly on the West Coast of the South Island. The 1965 season for the West Coast of the South Island showed a total of 2,416 cwt, compared with 2,822 cwt in 1964.
FRESHWATER FISHERIES—With the exception of the Rotorua Acclimatisation District in the thermal lakes region and the Southern Lakes District in the South Island, which are under the control of the Department of Internal Affairs, the local administration and management of freshwater fisheries are in the hands of acclimatisation societies.
A fishing licence, for which the fee for the season (usually from 1. October to 30 April) is $5, enables the holder to fish for acclimatised fish in any part of New Zealand except the Rotorua Acclimatisation District (which includes the Taupo Trout Fishing District) and the Southern Lakes Acclimatisation District. For fishing in the Rotorua area and the Southern Lakes District the local licence fees are $5 for all male adults, but in the Taupo area of the Rotorua Acclimatisation District, which is the most popular of all New Zealand angling resorts, the licence fees for each season are $7 for male adults and $4 for females and males under 17 years, weekly licences are $1.50 and 75c respectively, and daily licences 50c in all cases. For all acclimatisation districts there is a reduced scale of licence fees for female and juvenile anglers. Monthly, weekly, and daily licences are also available, while half-season, weekend, and single-river licences are optional in some districts. The open season for Lakes Taupo and Rotorua extends from 1 July to 30 June (a 12-month season).
The open season in many North Island districts has been extended, usually from 1 June to 30 September, to authorise the taking of acclimatised fish during the winter period. All lakes and some rivers are open in the Auckland District, with lakes or rivers being open in the Hawke's Bay, Taranaki, Hawera, Wanganui, and Wellington Acclimatisation Districts.
The estimated revenue from angling licences for the 1963-64 season was $268,000.
Table of Contents
MINERAL PRODUCTION—In New Zealand non-metallic minerals such as coal, clay, limestone, and dolomite are both economically and industrially as important as metallic ores. Over 90 percent of the value of the present mineral production is represented by coal and limestone, together with sand, rock, and gravel for roads, ballast, building, and construction.
The increasing complexity of modern industry creates a demand for a wider range of primary and ancillary raw materials. New industries such as aluminium smelting, iron and steel, and glass manufacture create additional demands for clays, dolomite, and magnesite for refractories, limestone for fluxes and so on.
Mineral requirements and values have changed and in 1964 the Government launched a new three-stage five-year programme for mineral research. The first stage involves expansion of projects in progress in regard to oil prospecting, surveying of dolomite deposits, and coal utilisation. The second stage involves national surveys for important minerals, including limestone (for agriculture, and for the cement, steel, carbide, and other industries), aggregate and sand (for roads, glass, steel, and other industries), and bentonite for foundry and steel industries, cosmetics and pharmaceutical preparations. The third part of the programme consists of long-term projects such as ground water supplies and requirements of electrochemical industries.
The following table shows the production of metals and minerals during 1964 and 1965 from mines and quarries.
| Mineral | 1964 | 1965 | ||
|---|---|---|---|---|
| Quantity | Value | Quantity | Value | |
| Fuels | $(000) | Fuels | $(000) | |
| Coal | 2,876,972 tons | 16,239 | 2,659,034 tons | 15,559 |
| Petroleum (crude) | 142,240 gal | 22 | 151,000 gal | 12 |
| Condensate | 123,460 gal | 18 | 7,000 gal | 1 |
| Natural gas | 5,077,400 cu. ft. Metals | 3 | 4,915,350 cu. ft. | 3 |
| Gold | 8,948 oz | 234 | 12,136 oz | 310 |
| Silver | 141 oz | - | 55 oz | - |
| Copper ore | 724 tons | 14 | 142 tons | 12 |
| Iron ore | 2,550 tons | 20 | 2,236 tons | 8 |
| Non-metallics | ||||
| tons | tons | |||
| Bentonite | 1,806 | 46 | 2,926 | 76 |
| Clay for bricks, tiles, etc. | 299,415 | 362 | 354,456 | 431 |
| Clay for pottery, fillers, etc. | 5,867 | 101 | 7,422 | 130 |
| Diatomite | 1,679 | 49 | 1,729 | 49 |
| Dimension stone | 20,557 | 115 | 4,307 | 41 |
| Dolomite | 9,164 | 101 | 7,556 | 85 |
| Limestone for agriculture | 1,177,215 | 2,041 | 1,129,711 | 2,080 |
| Limestone for industry | 50,199 | 102 | 14,981 | 71 |
| Limestone and marl, for cement | 1,340,184 | 869 | 1,474,563 | 997 |
| Magnesite | 603 | 8 | 837 | 11 |
| Perlite (processed value) | 914 | 28 | 1,124 | 26 |
| Pumice | 20,518 | 38 | 107,863 | 80 |
| Rock for harbour work | 402,993 | 243 | 703,962 | 365 |
| Salt | 21,332 | 674 | 34,170 | 1,080 |
| Sand, rock, gravel, etc., for building aggregate | 4,407,712 | 5,556 | 5,678,789 | 7,850 |
| Sand, rock, gravel, etc., for roads and ballast | 14,990,804 | 14,665 | 19,485,604 | 17,120 |
| Sand for industry | 186,799 | 333 | 268,993 | 340 |
| Serpentine | 135,257 | 263 | 138,272 | 401 |
| Silica sand | 43,251 | 147 | 74,234 | 162 |
| Sulphur ore | 35 | 1 | 30 | 1 |
| Wollastonite | 14 | - | 54 | - |
| Totals | ... | 42,299 | ... | 47,303 |
LEGISLATION—Legislative control of mineral production is contained in the Atomic Energy Act 1945, the Bauxite Act 1959, the Coal Mines Act 1925, the Iron and Steel Industry Act 1959, the Mining Act 1926, the Quarries Act 1944, the Petroleum Act 1937, and the Continental Shelf Act 1964. The administrative agency is the Mines Department.
The Mineral Resources Committee is a sub-committee of the Council of Scientific and Industrial Research, and its terms of reference include the determination of the direction of mineral investigations in relation to financial resources available and the possibilities of early economic development. The Committee also has a responsibility to encourage co-ordination between Government and private organisations in the search for and development of minerals of national industrial importance. It has published a report Development of Mineral Resources of New Zealand.
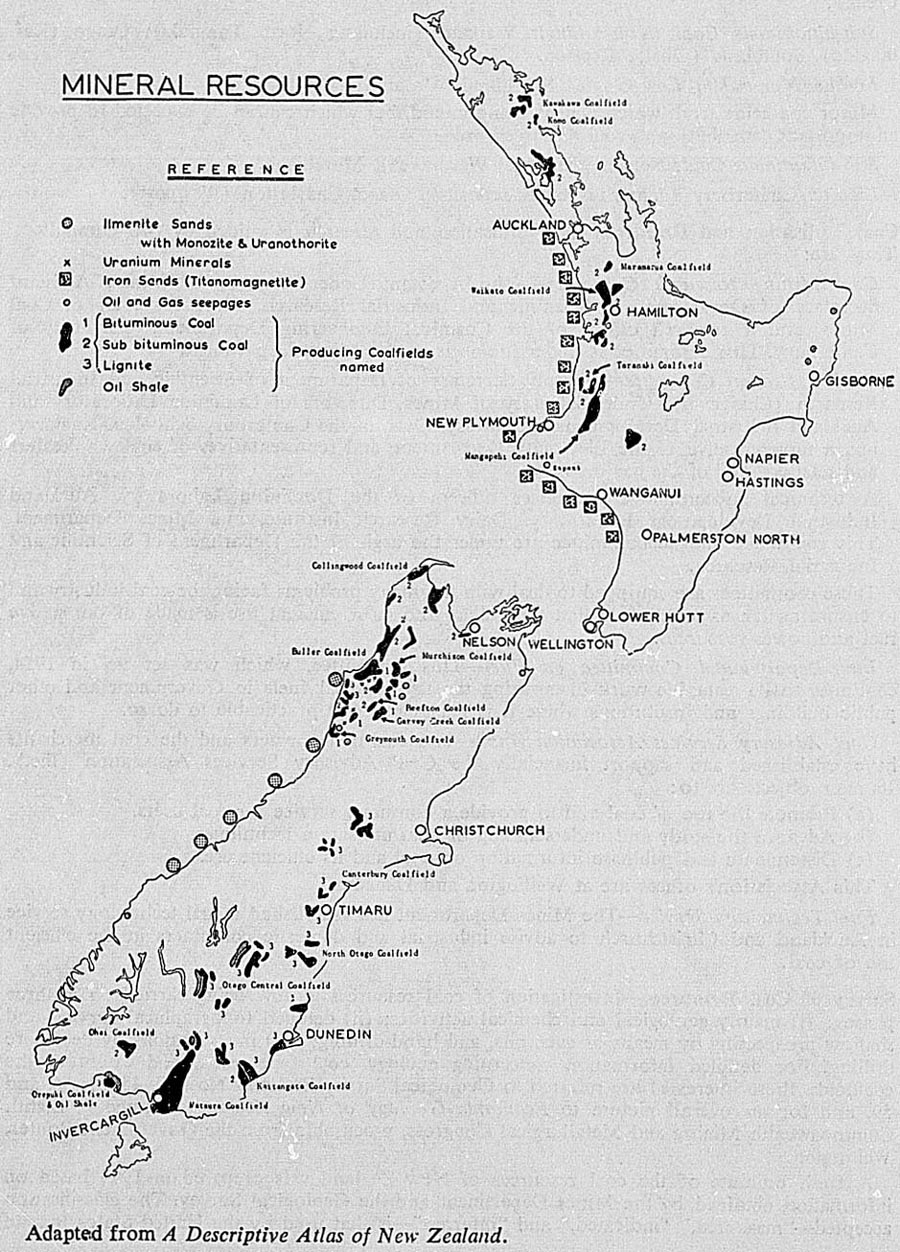
COAL—Coal in New Zealand has for many years been mined in certain well defined areas, outside which no coal is known to exist in any significant quantities. The major coalfields, with the class of coal found in each, are—
Bituminous Coal (Coking): Greymouth, Westport (Buller Coalfields), Reefton (Garvey Creek).
Sub-bituminous Coal (Non-coking): Waikato (including North Taranaki), Otago (Kai-tangata), Southland (Ohai), Reefton.
Lignite (Non-coking Low Grade): Southland (Mataura).
Minor coalfields from which coal is being mined, but which cannot be expected to provide an important contribution to coal resources, are—
Sub-bituminous Coal: Nelson (Puponga, Westhaven), Murchison.
Lignite: Canterbury (numerous small deposits), Otago, Charleston (Westport).
Coal Utilisation and Research—Coal utilisation and research is guided by two committees. They are:
Coal Mining Research Committee—The Assistant Under-Secretary of Mines, Assistant Secretary of Department of Scientific and Industrial Research, Chief Inspector of Coal Mines, and a research officer of the Chemical Engineering Department, University of Canterbury. This committee is under the aegis of the Mines Department.
Coal Utilisation Committee—Deputy Secretary of Department of Scientific and Industrial Research (Chairman), Under-Secretary of Mines, Directors of Dominion Laboratory and Auckland Industrial Development Laboratory, Dean of the Canterbury School of Engineering, a representative of the Electricity Department, and representatives of coal wholesalers and retailers, and of the gas industry.
A technical subcommittee comprises officers of the Dominion Laboratory, Auckland Industrial Development Laboratory, Dairy Research Institute, and Mines Department. This committee and subcommittee are under the aegis of the Department of Scientific and Industrial Research.
These committees are equipped to deal with the many problems facing the coal industry and to ensure as far as practicable that the fullest and most efficient use is made of our native fuel and power resources.
Inter-Departmental Committee on Fuel—This committee, which was set up in 1954, continues to do valuable work in ensuring the use of local fuels in Government and other public buildings and institutions where it is reasonable and practicable to do so.
Coal Advisory Services Association (Inc.)—The coal-mine owners and the coal merchants have established and support financially the Coal Advisory Services Association (Inc.). Its main objects are to:
Promote the use of coal and to provide a consumer service for coal users.
Advance the study and understanding of coal utilisation techniques.
Disseminate and publicise information on coal and its efficient use. This Association's offices are at Wellington and Dunedin.
Fuel Technology Service—The Mines Department has established a fuel technology service in Auckland and Christchurch to advise industrial and domestic consumers in the efficient use of coal.
Survey of Coal Resources—Investigation of coal resources is now being carried on in three phases: (i) mainly geological and chemical activities; (ii) detailed topographical surveys and shallow prospecting by means of cuts, pits, and hand drilling; (iii) investigations by deep-core drilling. For detailed information concerning geology, coal type, rank, and extent of the coalfields, those interested are referred to Geological Survey Bulletins Nos. 17, 45, 51, 56, and 59, and for an overall picture to Economic Geology of New Zealand, Volume 4, Eighth Commonwealth Mining and Metallurgical Congress, procurable from the Government Printer, Wellington.
A fresh estimate of the coal resources of New Zealand was prepared in 1964 based on information obtained by the Mines Department and the Geological Survey. The classification accepted—"measured,'' "indicated,'' and "inferred''—is that used by the United States Bureau of Mines and also accepted in the Commonwealth Mineral Resources Survey issued by the British Commonwealth of Nations Scientific Liaison Offices, London. These terms are simply defined as follows.
"Measured coal'' is coal for which tonnage is computed from dimensions revealed in outcrops, trenches, workings, and drill holes and for which the grade is computed from the results of detailed sampling. The sites for inspection, sampling, and measurements are so closely spaced and the geologic character is defined so well that the size, shape, and content are well established.
The computed tonnage and grade are judged to be accurate within limits, and no such limit is judged to differ from the computed tonnage or grade by more than 20 percent.
"Indicated coal'' is coal for which tonnage and grade are computed partly from specific measurements, samples, or production data and partly from projection for a reasonable distance on geologic evidence. The sites available for inspection, measurement, and sampling are too widely or otherwise inappropriately spaced to outline the coal completely or to establish its grade throughout.
"Inferred coal'' is coal for which quantitative estimates are based largely on broad knowledge of the geological character of the deposit and for which there are few, if any, samples of measurements. The estimates are based on an assumed continuity or repetition for which there is geologic evidence; this evidence may include comparison with deposits of similar type. Bodies that are completely concealed may be included if there is specific geologic evidence of their presence.
The following table sets out the estimated coal reserves, which total 1,066 million tons.
| Locality | Measured | Indicated | Recoverable |
|---|---|---|---|
| Tons (000) | |||
| Bituminous | |||
| Buller | 22,263 | 8,735 | 15,900 |
| Murchison | 40 | 650 | 1,380 |
| Reefton | 1,250 | 3,540 | 8,180 |
| Garvey Creek | 100 | 2,800 | 5,000 |
| Greymouth | 4,023 | 10,428 | 32,174 |
| Pike River | - | - | 15,000 |
| Shag Point | 280 | - | 820 |
| 27,956 | 26,153 | 78,454 | |
| Sub-bituminous | |||
| Northland | 80 | 500 | 3,000 |
| Maramarua | 17,100 | 36,400 | 24,000 |
| Huntly | 4,900 | 83,100 | 45,000 |
| Rotowaro | 15,800 | 15,600 | 21,100 |
| Glen Massey | 170 | 45 | 4,000 |
| Whatawhata | 100 | 100 | 200 |
| Kawhia | 100 | 450 | 5,750 |
| Mangapehi | - | 3,000 | - |
| Tatu-Ohura | 3,400 | 1,100 | 12,000 |
| Waitewhena | 400 | 900 | 11,000 |
| Mokau | - | - | 60,000 |
| Collingwood | 105 | 130 | 1,000 |
| Heaphy River | - | - | 1,000 |
| Inangahua | 30 | 100 | 8,000 |
| Fletcher Creek | - | - | 3,000 |
| Punakaiki | - | - | 2,000 |
| Kaitangata | 1,920 | 500 | 500 |
| Ohai | 7,100 | 8,400 | 90,000 |
| Orepuki | - | - | 1,000 |
| 51,205 | 150,325 | 292,550 | |
| Locality | Measured | Indicated | Recoverable |
|---|---|---|---|
| Lignite | |||
| Charleston | 5,970 | 2,000 | 8,000 |
| Canterbury | 200 | - | 2,000 |
| North Otago | 250 | - | 2,000 |
| Central Otago | 250 | - | 15,000 |
| Green Island | 250 | - | 3,000 |
| Kaitangata | 4,300 | 20,000 | 75,000 |
| Pomahaka | - | - | 60,000 |
| Mataura Valley | 5,400 | 20,200 | 216,000 |
| 16,620 | 42,200 | 381,000 | |
| Totals | 95,781 | 218,678 | 752,004 |
Coal Consumption—The approximate distribution of coal consumption during each of the latest five years is shown in the following table. The total quantity is based on actual production in each year plus imports and minus exports (including bunker coal for overseas vessels). Additional information on accumulating stocks of coal has led to a revision of this series.
| User | 1960 | 1961 | 1962 | 1963 | 1964 |
|---|---|---|---|---|---|
| tons (000) | |||||
| Railways | 219 | 216 | 187 | 183 | 166 |
| Gasworks | 277 | 279 | 262 | 268 | 258 |
| Electricity generation | 601 | 602 | 342 | 597 | 586 |
| Households | 540 | 535 | 470 | 517 | 476 |
| Factory industries— | |||||
| Meatworks | 155 | 151 | 121 | 120 | 114 |
| Dairy factories | 288 | 290 | 292 | 306 | 328 |
| Pulp and paper mills | 121 | 125 | 122 | 156 | 142 |
| Cement works | 158 | 172 | 186 | 210 | 213 |
| Other factories | 245 | 215 | 203 | 210 | 196 |
| Other consumers | 314 | 286 | 250 | 196 | 298 |
| Total consumption | 2,918 | 2,871 | 2,435 | 2,763 | 2,777 |
Summary of Operations—The following table summarises coal-mining operations.
| Year | Output (tons 000) | Persons Ordinarily Employed | Lives Lost by Accidents in or about Mines | ||||
|---|---|---|---|---|---|---|---|
| Surface | Underground | Totals | Per Million Tons Produced | Per Thousand Persons Employed | Lives Lost | ||
| Prior to 1961 | 149,534 | .. | .. | .. | .. | .. | 626 |
| 1961 | 2,925 | 1,356 | 2,688 | 4,044 | 0.69 | 0.49 | 2 |
| 1962 | 2,550 | 1,330 | 2,522 | 3,852 | 2.40 | 1.57 | 6 |
| 1963 | 2,742 | 1,294 | 2,366 | 3,660 | 1.48 | 1.09 | 4 |
| 1964 | 2,877 | 1,367 | 2,264 | 3,631 | 1.07 | 0.83 | 3 |
| 1965 | 2,659 | 1,236 | 2,211 | 3,447 | - | - | - |
| Totals | 163,277 | ... | ... | ... | ... | ... | 641 |
Underground Mines—The following table gives particulars of the operations of underground mining during the last five years.
| Calendar Year | Output (tons 000) | Men Employed Underground | Tons per Man Underground | Men Employed on Surface | Tons per Man on Pay Roll |
|---|---|---|---|---|---|
| 1961 | 1,814 | 2,688 | 675 | 944 | 499 |
| 1962 | 1,697 | 2,522 | 673 | 912 | 494 |
| 1963 | 1,622 | 2,366 | 686 | 930 | 492 |
| 1964 | 1,652 | 2,264 | 730 | 918 | 519 |
| 1965 | 1,609 | 2,211 | 728 | 831 | 529 |
There were 85 underground mines in operation in 1965, and of these 19 operated by the State produced 1,117,486 tons of coal. Production from individual State mines is set out in the Mines Statement, parliamentary paper C. 2.
Opencast Mines—Production of coal from opencast mines in 1965 amounted to 1,049,330 tons, which was 175,637 tons less than the production in 1964. The proportion of the total production of coal obtained from opencast mines amounted to 39.5 percent.
There were 42 opencast mines in operation in 1965 and of these 13 operated by the State produced 399,265 tons. All of these State mines have come into production since the beginning of 1944. Details of production from all opencast mines for the last five years are given in the following table.
| Year | Output (tons 000) | Men Employed | Tons per Man Employed |
|---|---|---|---|
| 1961 | 1,111 | 412 | 2,697 |
| 1962 | 854 | 418 | 2,042 |
| 1963 | 1,120 | 364 | 3,077 |
| 1964 | 1,225 | 449 | 2,728 |
| 1965 | 1,049 | 405 | 2,591 |
Derived Products—Low-temperature carbonisation works, using the Lurgi process, established at Rotowaro, 70 miles south of Auckland, in 1931, produced during 1965, 17,764 tons of carbonettes, 254,358 gallons of tar and oil, and 1,215 tons of char from 32,695 tons of slack coal, which was part of the output of a group of local mines.
The Sockburn pliant, near Christchurch, produced 42,653 gallons of tar and 5,844 tons of coke during 1965.
The briquetting works at Ngakawau owned and operated by State Coal Mines has commenced production.
It has been found that a blend of Stockton coal and non-coking coals from Reefton, Buller Gorge, and Charleston make a freer burning briquette not subject to degradation. Testing work is being continued.
Mercer Power Station—This station, of 180,000 kW capacity, if working at full capacity, can burn up to 700,000 tons of coal a year. Two-thirds of the coal is provided from the Kopuku opencast coalfield about 7 miles distant from the station, and the remainder from the Huntly coalfield.
State Coal Mines—The State purchase of coal mines, which began in 1940, has left only two large private mines in production. During 1965 there were 33 State coal mines in operation.
Financial—Sales of coal, etc., through the medium of depots totalled 1,386,344 tons (value $13,032,246) for the year ended 31 December 1965. This compares with 1,419,440 tons (value $13,584,742) for the year ended 31 December 1964. The operating loss for the year was $1,893,830 and with interest $1,142,278 on loan capital the loss was $3,036,108. As interest could not be paid it was remitted under section 15 of the New Zealand Loans Act 1953. Capital expenditure for the year was $500,014, depreciation was $1,064,698, and the value of fixed assets was reduced to $8,449,794.
Accidents—The number of compensatable accidents at State coal mines for the year ended 31 December 1965 was 1,445 compared with 1,414 in the previous year.
Coal Mining Districts' Welfare and Research Fund—This fund, into which is paid a levy at the rate of 7 1/2c per ton on coal other than lignite and 6c per ton on lignite, is used for coal-miners' relief, provision of amenities, payment of retiring allowances, establishment and maintenance of rescue stations, research, promotion of coal usage, and generally for the benefit of the industry.
Information concerning monetary benefits for miners incapacitated by miner's phthisis or any other occupational disease or heart disease contracted while working as a miner in New Zealand appears in Section 6A—Social Security.
IRON RESOURCES—New Zealand's largest resources of potential iron ore are contained in the black sands of the western beaches—from Westport southwards in the South Island and from Wanganui to Muriwai in the North Island. Titanomagnetite sands make up most of the black sands in the North Island, but from Waikato Heads northwards the beach deposits also contain ilmenite in varying proportions. In the South Island beach sands, ilmenite is the chief iron-bearing material. These beach sands have been estimated to contain some 800 million tons of titanomagnetite, with a further 8.6 million tons of ilmenite in the North Island and 43 million tons in the South Island.
A process has been developed whereby the sands can be smelted on a large scale economically to produce a good grade of steel. A steelworks is now being constructed at Glenbrook, 36 miles south of Auckland, by New Zealand Steel Limited, and the plant will use ironsands deposits from the North Head of the Waikato River, 12 miles away. It is envisaged that plant capable of producing about 140,000 tons of steel a year could be in operation by 1969 and that output could be expanded in 10 years to 400,000 tons a year.
There has been a small annual production of iron ore from the Onekaka deposits and certain small deposits in the North Auckland district, for use in gas purification, the preparation of stock licks, and in the brickmaking industry. Production of iron ore in 1964 was 2,236 tons.
URANIUM—In 1955 a lode of uranium-bearing minerals was discovered in the Buller Gorge. These deposits occur in steep, broken country which is heavily covered with bush, the area is subject to heavy rainfall and access is difficult. Prospecting work, however, has been disappointing and, so far, ore has not been found rich and extensive enough to be worked economically at present price levels.
The Atomic Energy Amendment Act 1957 amended the Atomic Energy Act 1945 by adding several new provisions designed to encourage the search for and production of uranium or other substances which may be used for the production of atomic energy.
GOLD—The gold-mining industry, which in its early stages contributed greatly to the progress and settlement of New Zealand, declined in importance with the exhaustion of the more accessible alluvial-gold deposits and of ore from the zones of enrichment. Annual production is now almost confined to one dredge.
The following table gives particulars of the estimated gold content of gold/silver/bullion production for the last three years.
| Type of Mining | Quantity | Value | ||||
|---|---|---|---|---|---|---|
| 1963 | 1964 | 1965 | 1963 | 1964 | 1965 | |
| oz | oz | oz | $ | $ | $ | |
| Quartz mining | 52 | 32 | 32 | 3,480 | 660 | 766 |
| Alluvial mining | 299 | 210 | 294 | 9,540 | 5,130 | 7,042 |
| Dredge mining | 13,855 | 8,847 | 11,865 | 519,650 | 228,748 | 302,502 |
| Totals | 14,206 | 9,089 | 12,191 | 532,670 | 234,538 | 310,310 |
SILVER—Most of the locally produced silver exported from New Zealand was obtained from the refinement of bullion from the quartz mines of the Hauraki goldfields, where gold and silver were found alloyed. A small quantity of silver is won by the West Coast gold dredges.
TUNGSTEN—The principal ore of tungsten in New Zealand is scheelite, though a little wolfram is found in Otago and Stewart Island, but not in economic quantities.
The scheelite-bearing quartz-veins are generally small and broken, while the scheelite is most erratically distributed in the veins, with the greatest concentration of scheelite situated close to the surface or at shallow depth. Access and transport present difficulties, and production costs are relatively high. Owing to the price of tungsten ores continuing at a low level scheelite mining is now on a much reduced scale. Mining is confined to the Glenorchy field in Otago.
COPPER—A deposit of copper ore near Parakao contains azurite and malachite, forms of carbonates of copper, as well as tentorite, an oxide of copper. It is used as an additive to fertilisers. Another deposit of copper ore was worked at Pupuke. It is estimated that the total production of copper ore over the years to the end of 1965 amounted to 7,602 tons, valued at $288,094.
Work has been commenced on a lode of copper ore at Moke Creek near Queenstown.
MANGANESE—Manganese ores are found in many localities, chiefly in the older sedimentary rocks. Of recent years there has been some production from deposits at Bombay, Moumoukai, and Otau, all in the Auckland district. Deposits are, however, generally small and shallow and capable of producing only limited tonnages of ore. There has been no production of manganese since 1960.
MERCURY—Cinnabar, the principal ore of mercury, is widely distributed in New Zealand, but only in a few localities is it found in quantities of economic importance. The most promising deposits of mercury ore in New Zealand are those of the Puhipuhi district.
ANTIMONY—Small quantities of antimony ore have been won from deposits in the South Island, but there has been no production since 1953.
LEAD AND ZINC—An ore-bearing reef of lead and zinc has recently been prospected near Te Aroha and preparations are being made for commercial mining.
TIN—Cassiterite in the form of "stream tin'' occurs in small deposits near Port Pegasus, Stewart Island, and these have been worked to some extent.
PLATINUM—Platinum occurs in several places, associated generally with gold in gravel, but quantities produced have been insignificant.
PETROLEUM—Prospecting and mining for petroleum in New Zealand is governed by the Petroleum Act 1937, the Petroleum Regulations 1939, and the Continental Shelf Act 1964. These give the Minister of Mines the jurisdiction to grant petroleum prospecting and mining licences on (a) land and in marine areas including territorial waters, and (b) the continental shelf; for the former there are 33 current prospecting licences covering 55,254 square miles and for the latter 7 licences covering 36,740 square miles.
Activity in the search for petroleum is being maintained. Geological and geo-physical work (including seismic surveys) is being conducted by several licence holders in various areas throughout New Zealand. Since the current search commenced a few years ago a number of deep wells have been drilled but they have been fruitless except in the following cases which are capable of commercial production.
| Name of Well and Locality | Depth in Feet | Date Completed | Result |
|---|---|---|---|
| Kapuni No. 1 (Taranaki) | 13,040 | October 1959 | Gas/condensate |
| Kapuni No. 2 (Taranaki) | 13,762 | January 1962 | Gas/condensate |
| Kapuni No. 3 (Taranaki) | 12,457 | June 1962 | Gas/condensate |
| Kapuni No. 4 (Taranaki) | 12,800 | October 1962 | Gas/condensate |
| New Plymouth (Taranaki) | 15,000 | August 1965 | Crude oil and gas. |
The Kapuni wells drilled on a Taranaki structure named Manaia have proved a gas/condensate field which should maintain a natural gas industry with a life of up to 25 years, and provide some of the feed-stock for the new oil refinery at Whangarei. Alternative uses of the gas are now being considered, including a gas-powered electricity generation station and the piping of the gas to Auckland and Wellington for household supply.
For many years small quantities of petroleum have been produced at New Plymouth. During 1965 the company operating at New Plymouth produced from four wells 151,000 gallons of crude oil and supplied 4,915,230 cubic feet of natural gas to the New Plymouth gas works. The total production of crude oil to 31 December 1965 is approximately 7,039,651 gallons.
The production for 1965 of 151,000 gallons of crude oil, along with 7,000 gallons of condensate from the Kapuni wells, was refined into the following products.
| Gallons | |
|---|---|
| Motor spirit | 23,450 |
| Distillate | 10,625 |
| Power kerosene | 18,835 |
| Diesel oil | 45,865 |
| Residual oil | 44,725 |
| Total | 143,500 |
BENTONITE—Deposits of this mineral occur at Porangahau, in the Hawke's Bay district, and at Mangatu, near Gisborne. A deposit of bentonite at Hororata is being prospected. Bentonite is mainly used in the preparation of foundry moulding-sands and drilling muds, but the mineral has many other uses.
PERLITE—Owing to its extreme lightness and unique thermal insulating properties, perlite has important applications in the building and construction industries. There are deposits in the Rotorua-Taupo area.
ASBESTOS—Chrysotile asbestos occurs at several points in the massive serpentines of Nelson and Otago, but the only deposits of importance so far located are those of Upper Takaka in the Nelson district. In 1955 production of asbestos was resumed after a temporary cessation.
KAURI GUM—Production of kauri gum has been at a comparatively low level in recent years. The quantity exported annually is now less than 100 tons.
PHOSPHATE—The occurrence of phosphate has been reported from many localities in New Zealand, but so far the deposits of Clarendon and Milburn have proved to be the only ones of economic importance and the more favourable sections of the deposits have been exhausted.
SERPENTINE—Serpentine, which in the South Island forms vast rock masses in Nelson and Otago, and which occurs in smaller amounts in the North Island, is of value to the fertiliser industry in the preparation of serpentine superphosphate. Production at first was mainly confined to the smaller occurrences in North Auckland owing to ease of access and transport, but production is now made from much larger deposits at Piopio, near Te Kuiti, in the North Island, and near Mossburn, in the South Island. To the end of 1965, 2,084,505 tons of serpentine had been mined, including 138,272 tons in 1965.
GREENSTONE—The mineral nephrite, the "pounamu'' of the Maori, a deep-green semi-transparent mineral with dark opaque patches, more popularly known as one of the varieties of "greenstone'', occurs as rounded segregations in the talc or talc-serpentine rocks of the Griffin Range of north Westland. The principal supply was obtained from the gravels of the Arahura and Taramakau Rivers, and from gold-sluicing claims of the Kumara district. Some of this has been cut and polished in New Zealand for personal and other small ornaments; the remainder has been exported. With the decline in sluicing operations this mineral has been in short supply. In 1965, about 5 tons of raw greenstone was produced, valued at $1,120.
SALT—At Lake Grassmere, in Marlborough, salt is being produced by the solar evaporation of sea water. The low rainfall, long hours of sunlight, and the wind conditions make this locality the most suitable one in New Zealand for this purpose. Salt was first harvested in 1952. Production of salt in the latest six years is shown in the following table:
| Year | Salt Produced | Value |
|---|---|---|
| tons | $(000) | |
| 1960 | 17,020 | 513 |
| 1961 | 5,017 | 150 |
| 1962 | 8,900 | 190 |
| 1963 | 11,000 | 300 |
| 1964 | 21,332 | 674 |
| 1965 | 34,170 | 1,080 |
BUILDING AND ORNAMENTAL STONES—New Zealand possesses a great variety of handsome and durable building stones scattered throughout both Islands. Their distribution is described in the 1958 and earlier issues of the Yearbook.
STATE AID TO MINING—State aid to mining in New Zealand is given in several forms—viz, (a) geological survey and bulletins; (b) detailed investigation of the occurrence and development of economic minerals; (c) schools of mines; (d) financial aid to prospecting and for access roads to mining fields; (e) research by Chemistry Division of the Department of Scientific and Industrial Research.
Geological Survey—Imperative to long-term assessment of New Zealand's mineral resources is an understanding of the country's geology. In New Zealand almost all Government geological work is carried out by the New Zealand Geological Survey, a scientific institution founded in 1865, which since 1926 has been a branch of the Department of Scientific and Industrial Research. Mines, Works, and other Government Departments consult the Geological Survey on geological problems, and do not themselves maintain a geological staff.
The Survey's principal work is to prepare geological maps of New Zealand and to determine the country's geological structure and geological history. Along with this, the Survey studies and helps to assess the country's mineral deposits, geothermal steam, and underground water resources, and gives advice on geological problems encountered in State and private civil engineering projects such as the construction of hydro-electric dams, bridges, tunnels, roads, and building foundations.
The Geological Survey has in the past done most of its regional geological mapping on a scale of one mile to the inch, about one-third of the country so far being covered by maps on this scale. Most of these maps have been issued in groups with a bulletin text describing the geology and mineral resources of the regions concerned. Paleontological bulletins are also issued. To speed the geological mapping of the country, the Survey in 1956 embarked on a programme to map the whole country on a less detailed scale. These new maps (scale of 1:250,000) are known informally as the "Four Mile'' series. They each carry about 3,000 words of descriptive text in their margins; there will be 27 of them altogether. In this series 20 have now been issued. One-mile maps and bulletins will continue to be issued at intervals for areas of special economic or scientific importance. The first of a new industrial series of maps, at 1:25,000 scale, has been issued recently. It covers the area of Hamilton City and is the first of several of city areas. Geological mapping has also been carried out in New Zealand's island territories and in the Ross Dependency.
Mineral Resources Surveys—A strong Economic Section of the Geological Survey is responsible for the investigation of potentially valuable deposits, coupled with closer study of the changing overseas economic emphasis. The work is largely concerned with the implementation of the Mineral Resources Committee's recommended programme. A new minerals map of New Zealand has been prepared. Field studies are made by the geologists, and laboratory examination of ores by the petrology specialists. Chemical analysis is usually done by the Chemistry Division, Department of Scientific and Industrial Research. The Petrology Section makes free identification of rocks and minerals forwarded by Mines Department, prospectors, and others.
Metallic Minerals—In earlier years when gold was of major importance the Survey reported on all major goldfields, several bulletins being published. Deposits of ores of iron, copper, tungsten, manganese, chrome, uranium, aluminium, and other metals have also been investigated over the years, and the Survey took complete responsibility for the raw material geological investigations for the new steel industry. Recently the Survey has, in collaboration with the Chemistry Division, been developing the techniques of geochemical prospecting with significant results in difficult terrain; chief ores being traced are copper, zinc, and manganese in Northland, West Otago, and Southland. It has nearly completed detailed surveys of the ilmenite-zircon-gold sand deposits near Westport, and of the important mineralisation of Coromandel-Colville.
Coal—Coal is still New Zealand's most important mineral, apart from constructional materials, and mapping the coalfields in detail has been one of the Survey's major undertakings in economic geology. Work has proceeded in co-operation with Mines Department and with the Chemistry Division, Department of Scientific and Industrial Research, where thousands of analyses of New Zealand coals have been made. Detailed maps and bulletins on Greymouth, Reefton, Kaitangata, and Ohai coalfields have been published, while those for the Waikato field will be the next to be issued. Although the mapping of the coalfields is largely complete, Survey geologists continue to help with a large number of day-to-day problems in the coalfields and undertake constant revision.
Oil—The Government does not undertake oil exploration. Oil companies however draw on Survey maps and bulletins for basic information about the country's stratigraphy and geological structure which enables them to narrow down areas deserving more detailed examination. Close and mutually beneficial co-operation has usually developed between Survey geologists and paleontologists and those of oil companies. Copies of oil company reports and maps continue to be deposited with the Government in terms of the Petroleum Act 1937. The Geological Survey is the national repository of collections of rocks, fossils, and drill cores collected by the oil companies.
Paleontological and stratigraphic information supplied by the Survey helped the search for oil in Taranaki, which was rewarded by the discovery of and development of a large reservoir of natural gas, of particular importance were the collections of fossils and drill cores held from earlier Taranaki oil-exploration bores. These greatly helped prediction of the type, age, and thickness of strata the drills would penetrate.
Constructional Materials and Other Non-metallic Minerals—As far as is possible with the staff available, the Survey advises Ministry of Works and local authority engineers, contractors, and other users on where rock materials for road metal, aggregate, building stone, sand, etc., can be obtained. A major aggregate survey has been launched in co-operation with Ministry of Works. Marl, limestone, and pozzolana for cement manufacture, perlite, bentonite, clays, talc, mica, and magnesite are other non-metallic minerals in whose utilisation the Survey has played a part. Current aid to industry given by the Survey includes detailed projects on North-west Nelson deposits of wollastonite, asbestos, dolomite, and talc magnesite; the limestone resources of Auckland and Otago have been assessed recently; North Auckland sands and halloysite clays are also under investigation.
In recent years interest has grown in the possibility of establishing electrochemical industries in this country, and the Geological Survey and Chemistry Division have helped in investigation of limestone and other raw materials for a calcium carbide industry, and of silica deposits suitable for manufacture of silicon, silicon carbide, and ferrosilicon.
CENSUS OF MINING AND QUARRYING—A census of mining and quarrying was taken for the production year 1963-64 to fit in with the World Programme of Basic Industrial Statistics sponsored by United Nations. Statistics for that year are shown in the following table.
| Item | Type of Mining or Quarrying | Total | |||
|---|---|---|---|---|---|
| Sand, Gravel, Rock, Clay, etc. | Limestone | Coal | Other, Including Gold | ||
| *One owner may operate several mines, e.g., the Government operates many coal mines. | |||||
| Type of organisation*— | |||||
| Registered company | 287 | 76 | 40 | 11 | 414 |
| Individual or partnership | 105 | 21 | 54 | 5 | 185 |
| Government or local authority | 106 | 1 | 1 | 1 | 109 |
| Totals | 498 | 98 | 95 | 17 | 708 |
| Nature of business— | |||||
| Underground mines operated | 2 | 2 | 94 | 4 | 102 |
| Surface mines or quarries operated | 974 | 115 | 48 | 19 | 1,156 |
| Totals | 976 | 117 | 142 | 23 | 1,258 |
| Employment— | |||||
| Average number of persons engaged (excludes working proprietors) | 2,517 | 314 | 3,278 | 117 | 6,226 |
| Salaries and wages paid (includes bonuses, overtime, etc.) persons engaged $(000) | 5,130 | 616 | 7,676 | 218 | 13,640 |
| Overtime hours worked hr(000) | 587 | 52 | 121 | 32 | 792 |
| Number of working proprietors | 130 | 24 | 134 | 6 | 294 |
| Production (values as at quarry floor or mine head)— | |||||
| Sand, gravel, rock, clay, etc. cu. yd (000) | 17,410 | 162 | 68 | - | 17,641 |
| $(000) | 17,000 | 64 | 80 | - | 17,146 |
| Limestone tons(000) | 71 | 1,699 | - | - | 1,770 |
| $(000) | 86 | 2,046 | - | - | 2,130 |
| Coal tons(000) | 1 | - | 2,843 | - | 2,844 |
| $(000) | 6 | - | 16,542 | - | 16,548 |
| Other $(000) | 196 | 44 | - | 652 | 892 |
| Total, values $(000) | 17,288 | 2,152 | 16,624 | 652 | 36,716 |
HISTORICAL DEVELOPMENT—The function of the early manufacturing industries in New Zealand was to supply locally the immediate needs of the small scattered communities for food, clothing, building materials, and home furnishings and to provide shipping with ropes, spars, and repairs. These handicraft activities grew into factories as the settlements expanded and as there developed more opportunities for the organisation and specialisation of labour, and for the more complex processing of domestic or imported raw materials. Flour mills, flax mills, ropewalks, and sawmills appeared in the early eighteen forties followed by breweries, brick kilns, cooperages in the mid forties and, later in that decade, lime kilns, ship and boat yards, soap and candle works, and tanneries.
By 1867, the first year in which statistics of factory production were collected in conjunction with the population census, manufacturing establishments included grain mills, breweries, biscuit factories, a bone-manure works, brick and tile yards and potteries, candle and soap works, coachbuilding workshops, fellmongeries, tanneries, wool-scouring works, flax works, aerated water and cordial factories, iron and brass foundries, lime kilns, malt kilns, engineering workshops, a patent slip, a petroleum works, rope and cordage works, sawmills, sash and door factories, ship and boat yards, and a woollen mill. The factories of this period were still primarily concerned with the satisfaction of the needs of the limited local markets.
The development boom of the eighteen seventies, the rapid rise in population, and the better communications between internal markets encouraged further factory expansion. There was to some extent a natural protection from overseas competition in the high freight rates on imports. Other factors which assisted in this expansion were the admission of certain raw materials free of duty, the imposition of a tariff on some finished goods, and the granting of bounties for new factories by central and provincial governments. These were followed by protection by way of tariff in 1888 when the home market was shrinking and capital and labour were beginning to leave the colony. Footwear and clothing factories, machinery and metal industries were protected by this tariff. A wider protective Customs tariff was imposed in 1895. During the depressed years of the eighteen eighties low wage costs enabled some New Zealand manufacturers to export their products, but this was partly attributable also to the special suitability of some New Zealand products, such as farm implements, to the needs of other developing communities overseas.
The first shipment of refrigerated meat in 1882 opened the way for the establishment and growth of the meat-freezing and butter and cheese industries. Ten years after this first shipment, 21 meat-freezing works and 104 butter and cheese factories had been established.
The recovery from the long depression, the resumption of large-scale immigration at the beginning of the present century, the spectacular development of meat-freezing and dairy factories, and the breaking in of new land, especially in the North Island, all contributed to the revival of a strong internal demand which stimulated manufacturing growth.
Auckland early established itself as the predominant manufacturing province in New Zealand, but in the general prosperity following the gold boom of the sixties there was a spectacular increase in manufacturing activity in Otago, which led Auckland until the nineties. Canterbury was the next most important manufacturing province. Today, Auckland, Wellington, and Canterbury are ahead of Otago.
With the rising population and increased export income during the first decade of this century, manufacturing continued to expand at a steady rate. The growth continued to be concentrated on industries processing farm products for export and those supplying the more simple goods, housing materials and equipment, repairs and supplies for farmers. In this period the electrical, wire-work, sheet-metal, and motor-vehicle industries had their beginnings.
Developments in the nineteen twenties included the expansion of the vehicle industry (particularly motor and cycle assembly), sawmilling, and the metal-working, furnishings, and apparel industries. These developments carried forward the tendency for industries processing farm products to be less dominating in value of production and employment compared with other types of industry.
During the depression of the nineteen thirties the total volume of factory output declined with the contraction of New Zealand's export income and the drop in internal demand.
While prices fell the output of factories processing farm products rose, but not sufficiently to offset the loss in volume from other manufacturing industries. The rapid fall in purchasing power caused the farmer to produce more, but the impact of the depression on the factories processing “non-farm” materials meant a heavy reduction in the output of consumer goods, building materials, and agricultural and dairy machinery and implements. By 1934-35, however, the volume of factory production had been restored to the 1929-30 level.
Apart from the metal-working and vehicle factories, which had improved their position significantly, industry emerged from the depression in much the same pattern as before.
The recovery of manufacturing after the depression was primarily the result of better export prices, more public development, and an expansionist monetary policy, all of which resulted in the re-engagement of most of the unemployed.
There had been little time for any protective effect of exchange control and import selection to stimulate industrial expansion between the date these measures were introduced (December 1938) and the outbreak of war in September 1939. It was the war and its shortages which changed the manufacturing pattern and gave great encouragement to industrial development. The engineering and apparel industries, which contributed so much to war needs, made the greatest progress.
Production expanded in response to the need to replace imports that the United Kingdom and other countries could no longer supply and to provide uniforms, weapons, equipment, and provisions for New Zealand and allied armed forces.
One protective effect of the war and post-war periods and their restricted supply of imports was that domestic industry was often enabled to attain its optimum (New Zealand) output quickly without a difficult competitive struggle with imports.
Post-war Development—The pattern of New Zealand industry changed again from 1949-50 with the exemption from import control of many items. Factory expansion was sustained by a high level of internal demand, by a widening of the range of products, and to some extent by the restriction of imports for a short period of exchange control. In this period the volume of production in the food, footwear, other wearing apparel and made up textile goods groups increased slowly in response to population growth, while leather industry production fell as a result of competition from imports and synthetics. Spectacular increases in production came from new developments in the pulp and paper and the rubber industries. However, as in past years it was the engineering factories that contributed most to the growth of manufacturing after 1949-50. The expansion in this field was stimulated especially by increasing mechanisation on farms, the high level of investment in New Zealand, the rising demand for consumer durables, and the increased imports of motor vehicle components.
The growth in production has been assisted by increases in manpower engaged and capital investment in new buildings and machinery. A measure of the increase in capital employed is that the value of land and buildings, plant, and machinery at the end of the production year for each person engaged was $870 in 1945-46, $1,266 in 1950-51, rising to $2,148 in 1955-56, $2,750 in 1960-61, $2,992 in 1961-62, $3,314 in 1962-63, and $3,382 in 1963-64.
The greater use of machinery for manufacturing during the last 20 years is illustrated also by the continuing rise in the average horsepower for each person engaged in manufacturing. In 1935-36 the average was 2.86; in 1945-46, 2.97; in 1955-56, 4.42; in 1962-63, 5.40; and in 1963-64, 5.46. This expansion has been facilitated by developments in electric power generation and industrial techniques. In 1963-64 the use of electric motors in factories accounted for 96 percent of the total rated horsepower for all types of engines employed in factories. The number and horsepower of steam, petrol, oil, and other nonelectrical engines has declined absolutely as well as relatively.
Industrial progress has been rapid, but manufacturing in New Zealand is still organised on a relatively small scale. In 1963-64, 61 percent of the factories employed 10 persons or less, a reflection of the fact that, partly as a result of geographical configuration, many factories still supply small local markets. Although these small factories are numerous, they accounted for only 1 percent of the total value of factory output. There were only 139 factories (1.48 percent of the total) in 1963-64 where the number of persons engaged exceeded 200, but these factories accounted for 36 percent of total value of output. Some were engaged in processing goods for export—for example, 31 were meat-freezing works.
Manufacturing plays a vital part in employment. In April 1966 about 27 percent of the total labour force was employed in manufacturing industries. Of the total female labour force 25 percent was engaged in manufacturing.
Successive annual increases in the volume of production have been: 1959-60, 3.5 percent; 1960-61, 9.8 percent; 1961-62, 5.1 percent; 1962-63, 4.5 percent; 1963-64, 10.4 percent; and 1964-65, 13 percent.
Import Replacement—In the latter part of 1957 and in early 1958 the terms of trade changed substantially to New Zealand's disadvantage and a serious depletion of overseas reserves resulted from the effects of heavy importing in 1957 and the fall in price of our main export commodities. To reduce overseas expenditure and arrest this drain on the reserves New Zealand reintroduced comprehensive import controls, which became effective on 1 January 1958. An improvement in the terms of trade in 1959 and 1960 allowed some relaxation in import restrictions, but a further fall in export prices and a higher volume of imports forced the Government to revert in 1961 to stricter import control. In mid-1962 the first of the measures to make the import licensing schedule more flexible in meeting manufacturers' and importers' needs was introduced.
Because of the importance of manufacturing industries in the employment of a rapidly increasing labour force and in conserving overseas funds, import licensing policy catered for plant and materials for industry. Manufacturing output has expanded in depth as well as in breadth. This has involved manufacturing in a number of industries being taken back to more basic stages rather than, for example, the mere assembly of imported components; making greater use of New Zealand's already available raw materials, such as wool and timber; and utilising raw materials hitherto unexploited, such as ironsands.
The development of manufacturing industries in New Zealand has been substantial in recent years. In addition to increases in the volume, range, and depth of manufacture of existing industries, several large new industrial enterprises have been established and are now in full production. These include a steel merchant bar mill; wire drawing and galvanising; wire rope production; the manufacture of wood screws; an aluminium mill producing sheet, foil, and extrusions; television tube production; a telephone cable plant; an oil refinery; a gin distillery; a sheet glass works; and nylon fibre and yarn spinning mills.
Other new products of New Zealand industry during the past five years include highspeed twist drills, aluminium tube and cable, press brakes, pneumatic and steel tyred road rollers, bicycles, electric motor starters, water heater and room thermostats, copper oxide, formaldehyde, urea formaldehyde syrup adhesives, concrete additives, liquid and powdered synthetic detergents, acrylic emulsions of paints, p.v.c. compounds, p.v.c. flooring, roofing and rainwater goods, woven plastic materials, textured synthetic yarns, foam backed fabrics, moulded pulp products, wallpaper, rindless cheese wrapping, and soluble coffee. Experimental production of brandy and whisky has been commenced.
RECENT MAJOR DEVELOPMENTS—The following are some of the more recent major developments.
Pulp and Paper—At Kinleith the fifth papermaking machine has been installed and capacity in other associated departments increased. The pulp making capacity of the mill at Kawerau is also being expanded. At another mill in the same area, the installation of plant for the production of groundwood pulp is proceeding. This continued development of the industry is particularly important in view of the likely increase in export opportunities for paper expected following the limited free trade area agreement with Australia. Further paper-making capacity is to be provided at the paper mill at Mataura. A report published by the Government indicates mat it may be practicable to establish a pulp mill at Nelson between 1970 and 1975.
Cement—Capacity for the production of cement has been increased and the annual volume has risen to 841,000 tons.
Fertiliser—The consumption of fertilisers produced in New Zealand has increased rapidly in recent years. Usage is expected to exceed 2,000,000 tons a year for the first time in the 1966-67 season. To meet this growth a new works has been established at Whangarei and major expansions of existing works have been completed at Awarua (Southland), Awatoto (Hawke's Bay), Dunedin, Hornby, Mount Maunganui, New Plymouth, and Otahuhu. These developments have increased installed capacity for the production of fertiliser to more than 2 1/2 million tons a year. Superphosphate is also being partially manufactured at Seadown, near Timaru.
Salt—There has been a continued upward trend in production of solar salt by the Lake Grassmere works. The 1966 season yielded 35,400 tons of coarse salt, an increase of 6,600 tons over the previous year's production.
Steel—At the end of 1964 specific plans were completed to establish in New Zealand an iron and steel industry based on domestic resources of ironsand. An operating company, New Zealand Steel Ltd., was registered in July 1965 and a site of about 1,000 acres was purchased at Glenbrook, 4 miles north of Waiuku. The industry is expected to commence production in the latter part of 1968. Production is estimated to reach 200,000 tons by 1970, 305,500 tons by 1975, 443,000 tons by 1978, and 604,900 tons in 1983. By 1970 the range of production should include billets (from iron sand) and galvanised sheet (from imported cold rolled coil). Welded pipe and cold rolled flat products (from imported hot rolled coil) should be added by 1975. By 1978 tinplate and hot rolled coil would be produced and would be followed by manufacture of sections and rails by 1983. The capital required is $35 million in the first stage, rising to $112 million (at 1964 values) for the first three stages. The initial workforce will be about 850, rising to about 1,800 at Stage III production levels in 1978.
New Zealand Steel Ltd. was originally to produce wire rod as part of its Stage I output, but the overseas consultants decided subsequently that wire rod could be more economically produced by Pacific Steel Ltd. This company, situated in Auckland, commenced manufacture in 1962 and produced in 1965-66 over 66,000 finished tons of merchant bar products from domestic scrap uprisings. Pacific Steel Ltd.'s capital was increased during 1966 from $4.18 million to $7 million and the total additional capital of $2.82 million was taken up by New Zealand Steel Ltd. Pacific Steel's production is expected to reach approximately 180,000 tons by 1970. The major expansion will be in the production of wire rod (73,500 tons) for which steel billets will be supplied by New Zealand Steel Ltd.
This closer association of the two companies will assist New Zealand Steel Ltd. significantly in its early years and could make possible a speeding up of its development programme. The companies will be able to co-operate in such matters as research and staff training and avoid unnecessary duplication of facilities in these and other areas.
New Zealand Steel Ltd.'s production should make a valuable contribution to the saving of overseas exchange. Estimated net savings of $40 million a year are envisaged by 1978 and about $60 million per year by 1983.
New Zealand will be the only country producing steel commercially from ironsands and will be among the earliest to use the recently developed Stelco Lurgi direct reduction process. This process will use concentrated pelletised ironsand, coal, and limestone as its basic raw materials, and will produce a sponge iron which, with the addition of a small quantity of scrap, will be made into a high quality steel in electric are furnaces. The plant will also use the latest developments in the continuous casting process.
SCIENTIFIC RESEARCH FOR INDUSTRY—There is a growing recognition in this country of the importance of scientific research in industry. Even in the more highly industrialised countries, where the larger concerns are able to undertake their own research, some form of assistance to industry from Government research organisations is required. In New Zealand this is even more necessary. A programme of increased research expenditure recommended by the recently established National Research Advisory Council provides additional finance for mineral exploration and development, building research, the application of mathematical techniques to industrial problems, and liaison and advisory services to the manufacturing industry. A number of branches of the Department of Scientific and Industrial Research carry out research and some service work for industry.
The Chemistry Division, in addition to doing testing work for other Government Departments, undertakes research on natural products and minerals. Typical examples are the pozzolanic materials, pumicite and diatomite, which have proved suitable for replacement of cement in big concrete works such as hydro dams.
The Department did the initial geological work on which proposals for an iron industry using beach and dune sands were based, and has assisted the establishment of the industry by investigating suitable coals for the type of kiln for the new works and reduction processing of ironsands.
An economic geology unit recently established within the Department is the principal co-ordinating agency for intensification of investigations into natural resources recommended by a Mineral Resources Committee set up in 1962 by the National Research Advisory Council. Surveys of a wide range of mineral deposits have been completed or are in progress, and commercial interest in the development of several fields has been encouraged.
The Physics and Engineering Laboratory does research and investigational work on physical and engineering problems. One of the laboratory's projects of interest to the building industry and particularly to structural engineers has been the development of an analogue computer with which the forces to which proposed buildings are likely to be subjected by earthquakes can be assessed. Largely as a result of research carried out with this computer the laboratory has published a handbook giving information on the forces and movements to be expected in buildings during large earthquakes. Another project of general interest in the application of automation to the laboratory's own heat-treatment plant. The laboratory has found ways and means of applying this principle to other industries, notably automation of electro-plating for a firm which expects to export the products and to make the plant itself for export. From chemical studies of indigenous timber, by-products of the pulp and paper industry, and kernels from the stone fruit industry, several products have been evolved that have been successfully developed (or seem likely to be) by commercial interests for domestic and export marketing.
In the development of electric power from geothermal steam these two laboratories worked in close collaboration with the Geological Survey and the Geophysics Division in providing the Ministry of Works with basic information required in the construction of the power station at Wairakei. Work by geologists and geophysicists indicated where boreholes should be dug, physicists advised on how to measure and control the pressure of the steam, while chemists showed how to clean the steam and prevent it from corroding the plant and equipment. This station is today providing electric power for both primary and secondary industries in the North Island. Intensified geothermal exploration by the co-operating Divisions has revealed the existence of four new geothermal fields each of comparable size to Wairakei.
In all the branches of the Department already mentioned assistance to manufacturing industry constitutes only part of the work, but there is one branch, the Auckland Industrial Development Division (AIDD), which was specifically set up to provide a research service for industry. Its present main fields of work are in foundry technology, fuel technology, and industrial measurement; product testing is carried out to assist local industry to manufacture to a standard of quality or performance; and it has made outstanding contributions in medical instrumentation. It seeks to ensure that science in industry is soundly based and endeavours to secure strong and healthy germination of research ideas. The policy followed is one of assistance and education, with encouragement to industry to obtain its own scientific control, development, and research facilities.
RESEARCH ASSOCIATIONS—Working in close collaboration with the Department of Scientific and Industrial Research are a number of co-operative research associations which are financed jointly by the industry concerned and the Government. The idea of co-operative research was introduced in the United Kingdom towards the end of the First World War, and considerable success followed the formation of numerous research associations, which were encouraged and supported financially by the Government in the interests of national welfare. The same need existed in New Zealand during the Second World War. Industries were expanding through the war effort, and in 1944 provision was made for the establishment of industrial research associations on similar lines to those in the United Kingdom. Of the eight associations now operating as autonomous bodies, five are concerned with manufacturing industries.
The Leather and Shoe Research Association undertakes problems on behalf of fell-mongers, hide processors, tanners, and footwear manufacturers.
The Pottery and Ceramics Research Association, originally set up in 1945 to assist the development of the whitewares section of the clay industry, was in 1951 extended to cover the whole field of clay industries by including manufacturers of structural clay products such as bricks, roofing tiles, field tiles, and refractories.
The Research Institute of Launderers, Drycleaners, and Dyers was established in 1947 to serve the research and scientific needs of the laundering, drycleaning, and dyeing industries. Its membership includes commercial concerns, hospitals, suppliers of equipment and materials, and also firms engaged in the garment and textile trades.
The Wool Industries Research Institute, established in 1937 as a unit of the Department of Scientific and Industrial Research and incorporated in 1945, serves the wool scouring and woollen milling industries. It is concerned with research relating to all aspects of wool manufacturing from the raw to finished cloth.
The Fertiliser Manufacturers' Research Association undertakes research associated with the analysis, production, and use of fertilisers, and on materials used in their manufacture.
To encourage industries other than those represented in the affiliated research associations to seek advancement through the application of research, a system of research contracts has been instituted under which projects proposed by the food industry and approved for investigation at Massey University, Palmerston North, where a department of food science and biotechnology was recently established, will be subsidised $ for $ through the Department's grant scheme.
Increased attention to the potential for more diversified processing of basic products of the primary industries was the principal aim in the recent renaming and reconstitution of the old Fats Research Division as the Food Chemistry Division; and projects being undertaken by the 3 MeV Van de Graaf accelerator recently installed at the Institute of Nuclear Sciences, Wellington, are expected to assist developments in both primary and secondary industry, particularly in the direction of sterilisation and preservation of food products.
EXPENDITURE ON INDUSTRIAL RESEARCH—Of an estimated $3,526,000 spent on industrial research in 1962-63 43.2 percent was spent by Government Departments, 32.7 percent by industry, and 21.0 percent by research associations in which industry and Government are jointly involved.
Research expenditure is more comprehensively reviewed in a special article at the end of this issue of the Yearbook.
SCOPE OF STATISTICS—Statistics of manufacturing industries were collected in New Zealand from 1867 to 1916 in conjunction with the five-yearly population census; but, commencing with the year 1918-19, the collection became an annual one, and the results are published in the Report on Industrial Production.
Commencing with the year 1951-52 factories have been classified according to the New Zealand Standard Industrial Classification. Apart from transfers within the framework of this series of factory production statistics, the adoption of the New Zealand Standard Classification meant the elimination from the series altogether of three important industries. These related to the logging operations of sawmillers, previously included in sawmilling, and the generation and supply of gas and electricity, accounting at that time for the activities of approximately 10,000 persons. Information on the generation and supply of gas and electricity is still the subject of an annual inquiry, but the results are no longer included in the series on factory production. Separate and detailed statistics for these industries are recorded in Section 20 of this Yearbook.
The statistics of factory production collected annually by the Department of Statistics embrace the activities of factories coming within the Manufacturing Division of the New Zealand Standard Industrial Classification of all Economic Activities, which is an adaptation of the United Nations International Standard Industrial Classification. The classification covers registered factories employing at least two persons (including the working proprietor) engaged in the manufacture, assembly, repair, or treatment of articles.
Bread bakeries and ready-made concrete establishments were surveyed as separate industries for the first time for 1962-63, but they have been excluded from group and national totals to maintain comparability with previous years. Commencing with the 1962-63 survey, the distilling, rectifying, and blending of spirits (a new industry in that year) is now included in each annual collection.
Industrial activities not covered by the survey of the Department of Statistics set out in this section are: cake and pastry kitchens; boot repairers; bespoke tailors; dressmakers, milliners; abattoirs; railway workshops; naval dockyard; all one-man factories.
The exclusion of these activities from the scope of the statistical inquiry, and also of all persons engaged in factories in a purely distributive capacity, reduces the total manufacturing labour force from that quoted by the Department of Labour (257,300) to the figure recorded in these statistics for 1964-65-211,050. Although the annual census of factory production covers only 82 percent of the labour force classified by the Department of Labour as “manufacturing” the percentage of the total production covered would be larger, as all but the very smallest establishments are included.
The year covered by these statistics is generally the year ending 31 March, but factories are permitted to furnish returns covering their financial year most closely corresponding to this period. In the case of the important semi-primary industries—butter, cheese, and other milk products, and meat freezing and preserving—the years correspond with the production seasons ending in May and September respectively.
Throughout this section, in addition to the conventional added value, net output (net value added) is given. For definitions of added value see explanations given later in this section under the heading “Net Output (Net Value Added)”.
GENERAL SUMMARY—The factory production table in Statistical Summary section of this volume gives a long time series of leading statistics.
The volume of production rose by 13.0 percent in 1964-65, as compared with an increase of 10.4 percent in 1963-64. A rise of 13.1 percent in the total value of production brought the figure to $2,177 million in 1964-65, as compared with $1,924 million in 1963-64. Added value increased by 10.2 percent, from $763 million in 1963-64 to $841 million in 1964-65, while manufacturers' surplus rose by 4.7 percent (from $188 million to $197 million), as compared with a rise of 29.6 percent in 1963-64. The number of persons engaged, including working proprietors, increased by 5.9 percent (from 199,266 to 211,050) and salaries and wages by 11.8 percent (from $369 million to $412 million).
The following table gives the main statistics by statistical areas for the year 1964-65.
| Statistical Area | Number of Establishments | Persons Engaged | Salaries and Wages Paid | Cost of Materials | Value of Production | Added Value | Net Output (Net Value Added) |
|---|---|---|---|---|---|---|---|
| No. | $(million) | ||||||
| Northland | 277 | 3,939 | 8.1 | 57.9 | 80.6 | 22.6 | 11.8 |
| Central Auckland | 2,644 | 68,304 | 132.5 | 363.6 | 625.3 | 261.7 | 199.4 |
| South Auckland - Bay of Plenty | 1,207 | 20,277 | 42.5 | 181.8 | 293.6 | 111.8 | 74.4 |
| East Coast | 120 | 2,016 | 3.7 | 10.4 | 18.0 | 7.5 | 5.5 |
| Hawke's Bay | 411 | 7,780 | 14.9 | 63.8 | 94.6 | 30.8 | 23.0 |
| Taranaki | 379 | 6,571 | 12.9 | 69.4 | 94.5 | 25.1 | 18.0 |
| Wellington | 1,898 | 42,439 | 84.7 | 276.9 | 446.6 | 169.7 | 131.4 |
| Marlborough | 118 | 1,366 | 2.4 | 6.1 | 9.8 | 3.7 | 2.7 |
| Nelson | 238 | 3,216 | 5.9 | 14.4 | 28.3 | 13.9 | 9.6 |
| Westland | 108 | 1,123 | 2.1 | 4.6 | 8.4 | 3.8 | 2.7 |
| Canterbury | 1,412 | 33,563 | 62.9 | 164.2 | 280.5 | 116.2 | 89.0 |
| Otago | 560 | 14,061 | 25.3 | 67.1 | 115.3 | 48.1 | 35.8 |
| Southland | 381 | 6,395 | 14.1 | 55.0 | 81.2 | 26.2 | 18.7 |
| Totals | 9,753 | 211,050 | 412.0 | 1,335.4 | 2,176.6 | 841.2 | 621.8 |
Further analyses by industrial groups of the figures shown in this table will be found in the appropriate contexts in the following pages.
In the next table the statistics for the year 1964-65 are reclassified by employment districts of the Department of Labour, which provide a more comprehensive locality classification of manufacturing strength. The fairest guide to actual volume of production is the last column in the table on “Net Output (Net Value Added)”. This shows Auckland district's dominance in the manufacturing field, its production being more than the total for the South Island. In order after Auckland come Christchurch, Lower Hutt, Wellington, Rotorua, Hamilton, and Dunedin.
| Employment District | Number of Factories | Persons Engaged | Salaries and Wages Paid | Cost of Materials | Value of Production | Added Value | Net Output (Net Value Added) | ||
|---|---|---|---|---|---|---|---|---|---|
| Males | Females | Males | Females | ||||||
| No. | No. | $(000) | $(000) | $(000) | $(000) | $(000) | $(000) | ||
| Whangarei | 277 | 3,580 | 359 | 7,693 | 376 | 57,934 | 80,580 | 22,647 | 11,770 |
| Auckland | 2,643 | 46,883 | 21,385 | 107,250 | 25,145 | 363,537 | 624,967 | 261,430 | 199,203 |
| Hamilton | 748 | 9,151 | 1,649 | 19,129 | 1,787 | 117,863 | 164,523 | 46,660 | 34,154 |
| Tauranga | 175 | 1,660 | 284 | 3,264 | 275 | 18,304 | 25,541 | 7,237 | 5,128 |
| Rotorua | 289 | 6,943 | 699 | 17,472 | 799 | 45,934 | 104,367 | 58,433 | 35,498 |
| Gisborne | 116 | 1,521 | 475 | 3,161 | 527 | 10,368 | 17,809 | 7,442 | 5,476 |
| Napier | 164 | 2,002 | 549 | 4,302 | 578 | 22,617 | 33,562 | 10,945 | 8,282 |
| Hastings | 199 | 3,876 | 965 | 8,314 | 1,095 | 37,635 | 56,331 | 18,695 | 13,913 |
| New Plymouth | 370 | 4,947 | 1,044 | 10,293 | 1,049 | 62,150 | 84,783 | 22,634 | 16,207 |
| Wanganui | 243 | 3,108 | 900 | 6,847 | 916 | 27,485 | 40,751 | 13,266 | 9,952 |
| Palmerston North | 462 | 5,924 | 1,876 | 12,259 | 1,990 | 61,905 | 88,976 | 27,072 | 20,568 |
| Masterton | 158 | 2,060 | 454 | 4,370 | 465 | 17,901 | 26,659 | 8,758 | 6,593 |
| Lower Hutt | 398 | 11,399 | 3,798 | 27,967 | 5,109 | 128,941 | 201,404 | 72,463 | 56,579 |
| Wellington | 694 | 9,213 | 4,622 | 21,222 | 5,630 | 51,379 | 102,958 | 51,580 | 40,052 |
| Totals, North Island | 6,936 | 112,267 | 39,059 | 253,543 | 45,741 | 1,023,951 | 1,653,211 | 629,261 | 463,374 |
| Blenheim | 118 | 1,084 | 282 | 2,116 | 299 | 6,075 | 9,788 | 3,713 | 2,659 |
| Nelson | 198 | 2,357 | 448 | 4,624 | 449 | 12,669 | 24,157 | 11,489 | 8,038 |
| Greymouth | 148 | 1,324 | 210 | 2,702 | 206 | 6,325 | 12,529 | 6,204 | 4,229 |
| Christchurch | 1,148 | 20,837 | 8,184 | 45,157 | 9,059 | 132,814 | 234,339 | 101,525 | 78,131 |
| Ashburton | 80 | 1,081 | 271 | 2,315 | 290 | 8,135 | 12,686 | 4,551 | 3,437 |
| Timaru | 184 | 2,571 | 619 | 5,486 | 634 | 23,287 | 33,431 | 10,145 | 7,438 |
| Oamaru | 57 | 1,310 | 314 | 2,449 | 282 | 8,771 | 14,064 | 5,292 | 4,099 |
| Dunedin | 503 | 8,943 | 3,494 | 18,761 | 3,794 | 58,358 | 101,209 | 42,851 | 31,673 |
| Invercargill | 381 | 5,925 | 470 | 13,569 | 515 | 55,018 | 81,218 | 26,200 | 18,719 |
| Totals, South Island | 2,817 | 45,432 | 14,292 | 97,179 | 15,528 | 311,452 | 523,422 | 211,970 | 158,423 |
| Totals, New Zealand | 9,753 | 157,699 | 53,351 | 350,722 | 61,269 | 1,335,403 | 2,176,633 | 841,230 | 621,797 |
A further summary of the operations of factories is given below for the three latest years.
| Item | 1962-63 | 1963-64 | 1964-65 | |
|---|---|---|---|---|
| Number of establishments | 9,034 | 9,365 | 9,753 | |
| Persons engaged | No. | 191,515 | 199,266 | 211,050 |
| Production costs— | ||||
| Salaries, wages | $(000) | 339,854 | 368,584 | 411,991 |
| Materials | $(000) | 1,005,762 | 1,160,718 | 1,335,403 |
| Other expenses | $(000) | 190,282 | 206,436 | 231,981 |
| Totals | $(000) | 1,535,898 | 1,735,738 | 1,979,376 |
| Value of production | $(000) | 1,681,244 | 1,924,084 | 2,176,633 |
| Manufacturers' surplus | $(000) | 145,346 | 188,346 | 197,258 |
| Value added in manufacture | $(000) | 675,482 | 763,368 | 841,231 |
| Net output (net value added) | $(000) | 495,916 | 568,378 | 621,797 |
| Overtime worked by wage earners | hrs.(000) | 27,674 | 30,266 | 34,815 |
| Volume index for industry: Base 1956-57 | (=1000) | 1,410 | 1,557 | 1,759 |
| Premises and plant— | ||||
| Value at end of year— | ||||
| Land and buildings | $(000) | 394,312 | 426,616 | 469,942 |
| Plant and machinery | $(000) | 240,408 | 247,306 | 277,356 |
| Capital expenditure during year— | ||||
| Land and buildings | $(000) | 32,296 | 27,926 | 33,280 |
| Plant and machinery | $(000) | 66,450 | 49,316 | 62,510 |
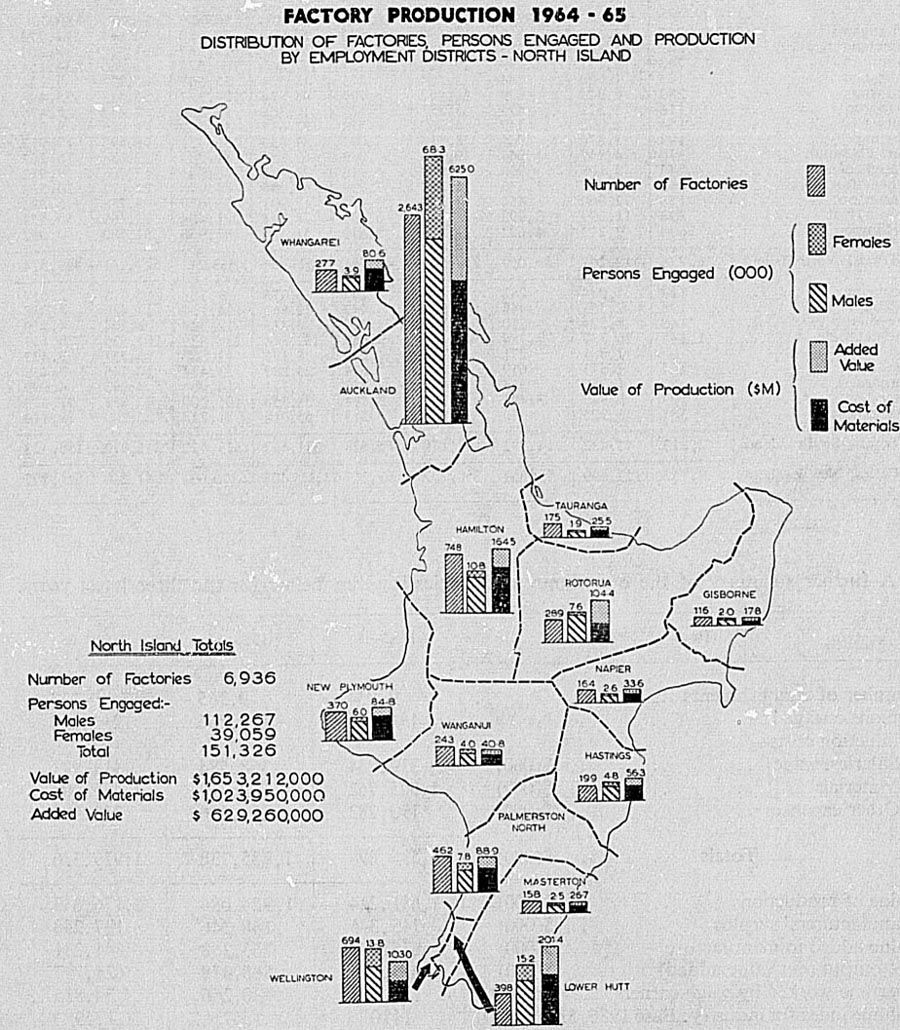
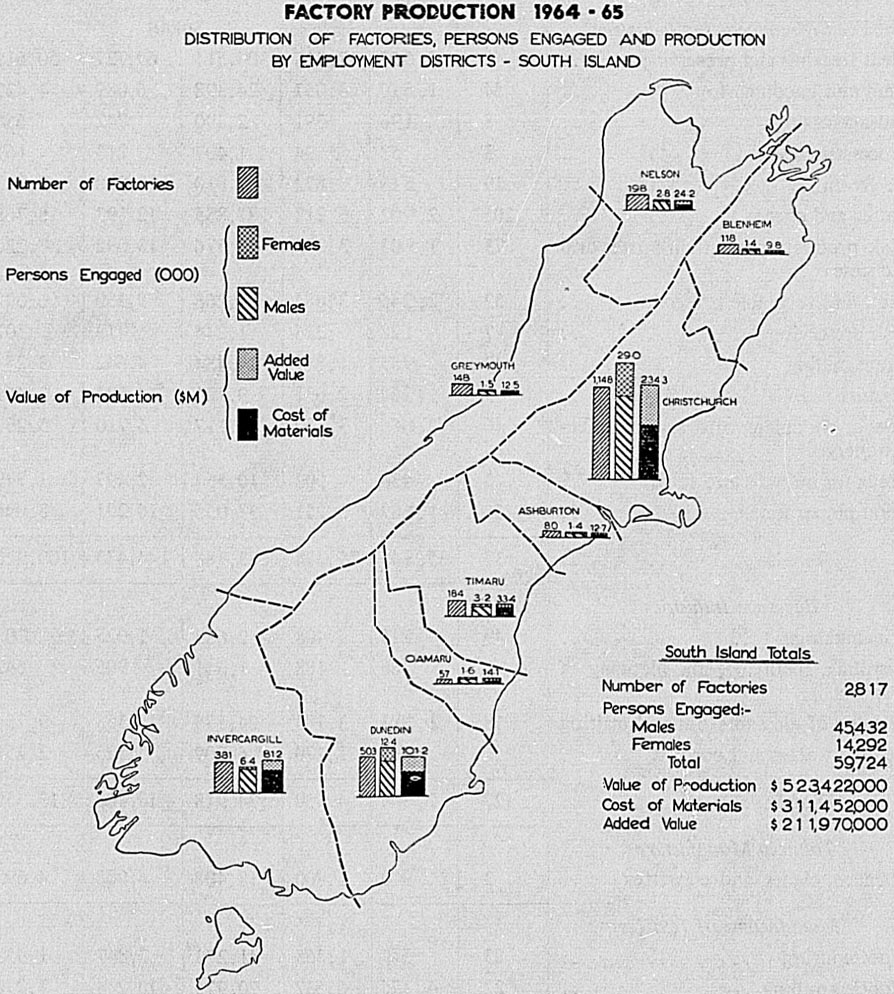
The following table gives a summary of some of the principal production statistics for the year 1964-65 classified by individual industries. Totals for the industrial groups to which these industries belong are also shown.
| Industry | Number of Establishments | Number of Persons Engaged | Salaries and Wages Paid | Value of Production | Value Added in Manufacture | Net Output (Net Value Added) |
|---|---|---|---|---|---|---|
| Food Manufacturing Industries | $(000) | |||||
| Meat freezing and preserving | 40 | 19,657 | 47,318 | 304,511 | 69,727 | 50,619 |
| Ham and bacon curing | 54 | 1,510 | 3,057 | 24,398 | 6,089 | 4,422 |
| Sausage casings | 8 | 196 | 391 | 2,390 | 742 | 658 |
| Processed cheese | 3 | 58 | 94 | 1,407 | 213 | 161 |
| Ice cream | 19 | 518 | 872 | 7,810 | 3,990 | 2,913 |
| Butter and cheese | 205 | 2,902 | 6,212 | 187,855 | 12,193 | 6,768 |
| Milk products other than butter and cheese | 73 | 1,503 | 3,246 | 43,576 | 13,092 | 7,220 |
| Fruit and vegetable preserving | 32 | 2,245 | 3,884 | 22,268 | 9,280 | 6,092 |
| Fish preserving | 7 | 128 | 226 | 1,244 | 413 | 302 |
| Grain milling | 40 | 985 | 1,811 | 14,484 | 4,642 | 3,251 |
| Biscuits | 9 | 1,260 | 2,031 | 9,721 | 4,593 | 3,468 |
| Cocoa, chocolate, and sugar confectionery | 46 | 2,056 | 3,100 | 16,117 | 6,710 | 5,202 |
| Feeds for animals and fowls | 43 | 438 | 902 | 10,554 | 2,497 | 1,749 |
| Food preparations, n.e.i. | 58 | 1,689 | 3,251 | 37,055 | 10,291 | 8,094 |
| Totals | 637 | 35,145 | 76,394 | 683,388 | 144,473 | 100,920 |
| Beverage Industries | ||||||
| Winemaking | 49 | 215 | 408 | 2,683 | 1,025 | 708 |
| Distilling, rectifying, and blending of spirits | 4 | 86 | 188 | 1,641 | 905 | 642 |
| Brewing of ale and stout and malting | 18 | 1,383 | 3,184 | 24,585 | 13,353 | 9,754 |
| Aerated waters and cordials | 56 | 662 | 1,170 | 6,009 | 3,125 | 2,251 |
| Totals | 127 | 2,346 | 4,950 | 34,918 | 18,408 | 13,356 |
| Tobacco Manufactures | ||||||
| Tobacco, cigars, and cigarettes | 3 | 970 | 1,700 | 18,408 | 6,008 | 4,693 |
| Manufacture of Textiles | ||||||
| Woolscouring | 23 | 549 | 1,365 | 41,273 | 2,847 | 1,953 |
| Woollen milling | 22 | 4,176 | 6,637 | 20,975 | 10,214 | 7,270 |
| Other spinning and weaving mills | 18 | 2,044 | 4,108 | 18,492 | 8,653 | 6,384 |
| Hosiery and other knitting mills | 78 | 4,417 | 6,811 | 27,883 | 12,929 | 9,456 |
| Phormium flax | 15 | 136 | 223 | 707 | 414 | 281 |
| Linen flax | 1 | 36 | 57 | 117 | 76 | 59 |
| Textiles, n.e.i. | 28 | 975 | 1,881 | 11,399 | 5,043 | 3,651 |
| Totals | 185 | 12,333 | 21,083 | 120,845 | 40,176 | 29,055 |
| Industry | Number of Establishments | Number of Persons Engaged | Salaries and Wages Paid | Value of Production | Value Added in Manufacture | Net Output (Net Value Added) |
|---|---|---|---|---|---|---|
| Manufacture of Footwear, Other Wearing Apparel, and Made-up Textiles | ||||||
| - $(000) | ||||||
| Leather gloves and apparel | 10 | 164 | 241 | 844 | 527 | 448 |
| Men's and boys' outerwear | 133 | 3,819 | 5,033 | 16,304 | 6,780 | 5,751 |
| Women's and girls' outerwear | 281 | 5,703 | 7,313 | 22,878 | 11,163 | 9,395 |
| Underclothing | 39 | 1,468 | 1,713 | 6,269 | 2,476 | 2,026 |
| Hats, caps, and millinery | 61 | 981 | 1,224 | 3,440 | 1,904 | 1,547 |
| Corsetry | 25 | 1,426 | 1,668 | 5,022 | 2,590 | 2,145 |
| Neckties | 7 | 201 | 263 | 977 | 539 | 475 |
| Shirts and pyjamas | 47 | 1,974 | 2,450 | 8,430 | 3,632 | 3,112 |
| Wearing apparel n.e.i. | 120 | 4,697 | 5,925 | 20,427 | 8,342 | 6,975 |
| Fur coats and necklets | 27 | 179 | 278 | 816 | 449 | 365 |
| Footwear (other than rubber) | 124 | 5,383 | 8,899 | 25,631 | 13,727 | 10,728 |
| Canvas goods | 40 | 509 | 744 | 2,894 | 1,182 | 964 |
| Made-up textiles (other than wearing apparel) | 72 | 857 | 1,084 | 5,622 | 2,171 | 1,860 |
| Totals | 986 | 27,361 | 36,835 | 119,553 | 55,480 | 45,789 |
| Manufactures of Wood and Cork (Except Manufacture of Furniture) | ||||||
| Sawmills and timber preservation | 395 | 5,889 | 12,468 | 50,510 | 27,627 | 19,044 |
| Planing mills | 173 | 2,119 | 4,128 | 29,498 | 9,731 | 7,669 |
| Joinery | 422 | 4,197 | 8,435 | 30,432 | 14,424 | 12,004 |
| Wooden containers | 39 | 569 | 1,121 | 4,801 | 2,054 | 1,501 |
| Plywood and veneer | 10 | 756 | 1,673 | 6,794 | 3,460 | 2,299 |
| Wood products n.e.i. | 61 | 603 | 1,145 | 4,528 | 2,063 | 1,593 |
| Totals | 1,100 | 14,133 | 28,970 | 126,562 | 59,360 | 44,110 |
| Manufacture of Furniture and Fixtures | ||||||
| Furniture | 476 | 4,986 | 9,992 | 31,410 | 15,573 | 13,130 |
| Mattress manufacture | 30 | 554 | 1,043 | 5,013 | 2,006 | 1,524 |
| Venetian blinds | 19 | 203 | 390 | 2,325 | 831 | 644 |
| Totals | 525 | 5,743 | 11,425 | 38,748 | 18,410 | 15,298 |
| Manufacture of Paper and Paper Products | ||||||
| Pulp, paper, and paperboard | 7 | 3,078 | 8,812 | 55,169 | 38,050 | 20,677 |
| Cardboard boxes, cartons, and paper bags | 55 | 2,431 | 4,669 | 29,022 | 10,614 | 7,994 |
| Paper products n.e.i. | 50 | 1,602 | 2,808 | 17,676 | 6,986 | 5,532 |
| Totals | 112 | 7,111 | 16,289 | 101,868 | 55,649 | 34,203 |
| Printing, Publishing, and Allied Industries | ||||||
| Printing and publishing | 88 | 6,405 | 13,977 | 41,919 | 29,949 | 21,968 |
| Job and general printing | 342 | 5,933 | 11,329 | 33,225 | 19,870 | 15,514 |
| Service industries for printing trade | 55 | 729 | 1,541 | 3,201 | 2,515 | 2,003 |
| Totals | 485 | 13,067 | 26,847 | 78,345 | 52,334 | 39,485 |
| Industry | Number of Establishments | Number of Persons Engaged | Salaries and Wages Paid | Value of Production | Value Added in Manufacture | Net Output (Net Value Added) |
|---|---|---|---|---|---|---|
| Manufacture of Leather and Leather Products (Except Footwear) | $(000) | |||||
| Tanning | 11 | 706 | 1,543 | 6,616 | 2,924 | 2,268 |
| Fellmongery | 7 | 115 | 238 | 2,335 | 524 | 404 |
| Leather goods | 83 | 1,104 | 1,670 | 5,359 | 2,672 | 2,234 |
| Totals | 101 | 1,925 | 3,451 | 14,310 | 6,120 | 4,906 |
| Manufacture of Rubber Products | ||||||
| Motor vehicle tyres and tubes | 3 | 955 | 2,730 | 13,054 | 7,281 | 5,694 |
| Rubber goods (other than motor vehicle tyres and tubes) | 32 | 1,835 | 3,796 | 12,700 | 7,591 | 5,769 |
| Vulcanising and tyre retreading | 71 | 629 | 1,265 | 6,098 | 3,698 | 2,458 |
| Totals | 106 | 3,419 | 7,791 | 31,852 | 18,570 | 13,921 |
| Manufacture of Chemicals and Chemical Products | ||||||
| Chemical fertilisers | 15 | 1,307 | 3,367 | 35,013 | 11,008 | 7,769 |
| Vegetable and animal oils and fats | 32 | 431 | 897 | 5,878 | 2,738 | 1,728 |
| Ink | 9 | 199 | 404 | 2,081 | 1,087 | 853 |
| Soap | 13 | 490 | 966 | 6,758 | 3,108 | 2,184 |
| Paint and varnish | 31 | 965 | 2,032 | 16,400 | 6,162 | 4,965 |
| Pharmaceuticals, toilet goods, and cosmetics | 39 | 1,192 | 1,852 | 13,140 | 5,833 | 4,776 |
| Chemical products n.e.i. | 80 | 1,730 | 3,322 | 20,597 | 9,370 | 6,355 |
| Totals | 219 | 6,314 | 12,842 | 99,868 | 39,305 | 28,629 |
| Manufacture of Products of Petroleum and Coal | ||||||
| Petroleum and coal products | 14 | 391 | 1,122 | 36,506 | 8,077 | 3,192 |
| Bituminous paving and roofing materials | 32 | 291 | 634 | 5,351 | 2,164 | 1,370 |
| Totals | 46 | 682 | 1,756 | 41,857 | 10,241 | 4,563 |
| Manufacture of Non-metallic Mineral Products (Except Products of Petroleum and Coal) | ||||||
| Structural clay products | 40 | 1,116 | 2,510 | 6,352 | 5,591 | 3,436 |
| Pottery, china, and earthenware | 10 | 782 | 1,370 | 2,877 | 2,488 | 1,850 |
| Cement | 6 | 823 | 2, 118 | 14,149 | 11,611 | 5,953 |
| Glass and glass products | 57 | 1,694 | 3,457 | 12,045 | 8,245 | 5,398 |
| Concrete products | 307 | 2,697 | 5,675 | 20,757 | 11,667 | 8,881, |
| Lime | 91 | 366 | 744 | 3,377 | 2,372 | 1,358 |
| Fibrous plaster | 83 | 393 | 797 | 2,339 | 1,196 | 997 |
| Non-metallic mineral products n.e.i. | 16 | 702 | 1,723 | 9,591 | 4,466 | 2,898 |
| Totals | 610 | 8,573 | 18,394 | 71,488 | 47,635 | 30,770 |
| Industry | Number of Establishments | Number of Persons Engaged | Salaries and Wages Paid | Value of Production | Value Added in Manufacture | Net Output (Net Value Added) |
|---|---|---|---|---|---|---|
| Basic Metal Industries | $(000) | |||||
| Basic metal industries | 90 | 1,315 | 2,935 | 15,864 | 6,603 | 5,125 |
| Manufacture of Metal Products (Except Machinery and Transport Equipment) | ||||||
| Sheet-metal working | 195 | 5,335 | 11,214 | 44,119 | 22,435 | 17,153 |
| Wire working | 54 | 803 | 1,718 | 9,063 | 3,745 | 3,038 |
| Nail making | 6 | 140 | 282 | 2,454 | 676 | 424 |
| Electroplating and metal polishing | 76 | 697 | 1,503 | 3,523 | 2,667 | 1,990 |
| Metal products n.e.i. | 316 | 6,143 | 13,573 | 54,709 | 27,633 | 20,837 |
| Totals | 647 | 13,118 | 28,290 | 113,867 | 57,156 | 43,441 |
| Manufacture, Assembly, and Repair of Machinery (Except Electrical Machinery) | ||||||
| Agricultural and pastoral machinery | 108 | 1,240 | 2,444 | 17,352 | 5,114 | 4,246 |
| Machinery n.e.i. | 670 | 12,650 | 27,514 | 88,315 | 47,504 | 38,020 |
| Totals | 778 | 13,890 | 29,958 | 105,667 | 52,618 | 42,266 |
| Manufacture of Electrical Machinery, Apparatus, Appliances, and Supplies | ||||||
| Range making | 6 | 992 | 1,905 | 7,043 | 3,330 | 2,474 |
| Radio and television assembly and Manufacture | 34 | 3,039 | 5,192 | 34,936 | 13,216 | 10,726 |
| Electrical machinery, appliances n.e.i. | 187 | 4,712 | 8,907 | 42,439 | 19,274 | 14,992 |
| Totals | 227 | 8,743 | 16,003 | 84,418 | 35,821 | 28,192 |
| Manufacture of Transport Equipment | ||||||
| Boat building and ship repairing | 78 | 1,257 | 2,556 | 5,989 | 3,524 | 2,859 |
| Motor-vehicle assembly | 17 | 4,090 | 9,750 | 95,920 | 20,738 | 17,797 |
| Motor-body building | 86 | 1,523 | 2,941 | 8,750 | 4,424 | 3,589 |
| Repairs to motor vehicles | 2,199 | 19,055 | 33,200 | 103,626 | 52,105 | 41,168 |
| Aircraft maintenance and repair | 30 | 1,699 | 4,159 | 8,892 | 6,318 | 5,057 |
| Perambulators | 6 | 154 | 238 | 691 | 375 | 310 |
| Transport equipment n.e.i. | 30 | 1,062 | 2,232 | 7,954 | 4,654 | 3,308 |
| Totals | 2,446 | 28,840 | 55,077 | 231,823 | 92,138 | 74,088 |
| Miscellaneous Manufacturing Industries | ||||||
| Optical, surgical, and dental, etc., equipment | 31 | 240 | 436 | 1,212 | 738 | 587 |
| Jewellery | 81 | 720 | 1,234 | 3,717 | 1,998 | 1,632 |
| Brushes and brooms | 14 | 512 | 807 | 3,261 | 1,598 | 1,267 |
| Toys and sports goods | 24 | 512 | 777 | 2,406 | 1,298 | 1,037 |
| Manufacturing industries n.e.i. | 173 | 4,038 | 7,746 | 32,387 | 19,095 | 14,463 |
| Totals | 323 | 6,022 | 11,001 | 42,984 | 24,726 | 18,987 |
| Grand totals | 9,753 | 211,050 | 411,991 | 2,176,633 | 841,230 | 621,797 |
ESTABLISHMENTS AND EMPLOYEES—In recent years the shortage of labour in the principal centres has resulted in branch factories and workrooms being opened in secondary towns to tap the labour resources in those areas. The 1964-65 survey covered 9,753 factories, the largest number included in any year.
The following table shows the number of factories in each statistical area.
| Statistical Area | Number of Factories | |||
|---|---|---|---|---|
| 1961-62 | 1962-63 | 1963-64 | 1964-65 | |
| Northland | 248 | 255 | 265 | 277 |
| Central Auckland | 2,291 | 2,332 | 2,522 | 2,644 |
| South Auckland - Bay of Plenty | 1,087 | 1,112 | 1,143 | 1,207 |
| East Coast | 118 | 119 | 119 | 120 |
| Hawke's Bay | 382 | 377 | 405 | 411 |
| Taranaki | 370 | 366 | 361 | 379 |
| Wellington | 1,843 | 1,836 | 1,848 | 1,898 |
| Marlborough | 102 | 99 | 107 | 118 |
| Nelson | 217 | 205 | 218 | 238 |
| Westland | 107 | 108 | 104 | 108 |
| Canterbury | 1,297 | 1,306 | 1,355 | 1,412 |
| Otago | 560 | 548 | 553 | 560 |
| Southland | 359 | 371 | 365 | 381 |
| Totals | 8,981 | 9,034 | 9,365 | 9,753 |
An analysis of the 1964-65 totals by industrial groups in the various statistical areas is given in the next table.
| Industry Group | Northland | Central Auckland | South Auckland - Bay of Plenty | East Coast | Hawke's Bay | Taranaki | Wellington |
|---|---|---|---|---|---|---|---|
| Number of Factories 1964-65 | |||||||
| Food | 21 | 111 | 81 | 10 | 23 | 85 | 99 |
| Beverages | 4 | 44 | 11 | 3 | 14 | 8 | 16 |
| Tobacco manufactures | - | 1 | - | - | 1 | - | 1 |
| Textiles | 1 | 58 | 4 | 2 | 10 | 2 | 47 |
| Footwear, other wearing apparel, and made-up textile goods | 6 | 438 | 34 | 7 | 21 | 21 | 227 |
| Wood and cork products (except furniture) | 44 | 146 | 241 | 17 | 51 | 53 | 164 |
| Furniture and fixtures | 6 | 190 | 50 | 3 | 19 | 13 | 107 |
| Paper and paper products | - | 42 | 6 | 2 | 2 | 1 | 32 |
| Printing, publishing, etc. | 7 | 141 | 44 | 4 | 17 | 9 | 141 |
| Leather and leather products (except footwear and apparel) | 1 | 49 | 1 | 3 | 3 | 2 | 16 |
| Rubber products | 4 | 27 | 13 | 2 | 2 | 5 | 24 |
| Chemicals and chemical products | 1 | 79 | 13 | 1 | 7 | 8 | 58 |
| Petroleum and coal products | 1 | 12 | 4 | - | 1 | 3 | 15 |
| Non-metallic mineral products n.e.i. | 45 | 97 | 66 | 8 | 46 | 22 | 91 |
| Basic metal manufactures | 1 | 36 | 4 | - | 2 | 2 | 20 |
| Metal products (except machinery and transport equipment) | 6 | 279 | 42 | 4 | 21 | 10 | 126 |
| Machinery (except electrical) | 22 | 187 | 125 | 12 | 31 | 28 | 151 |
| Electrical machinery and appliances | 2 | 88 | 16 | - | 9 | 2 | 54 |
| Transport equipment | 103 | 473 | 440 | 42 | 128 | 100 | 425 |
| Miscellaneous products | 2 | 146 | 12 | - | 3 | 5 | 84 |
| Totals | 277 | 2,644 | 1,207 | 120 | 411 | 379 | 1,898 |
| Industry Group | Marlborough | Nelson | Westland | Canterbury | Otago | Southland | Total N.Z. |
|---|---|---|---|---|---|---|---|
| Number of Factories 1964-65 | |||||||
| Food | 12 | 19 | 4 | 98 | 43 | 31 | 637 |
| Beverages | 1 | 6 | 2 | 11 | 6 | 1 | 127 |
| Tobacco manufactures | - | - | - | - | - | - | 3 |
| Textiles | 1 | 4 | - | 33 | 16 | 7 | 185 |
| Footwear, other wearing apparel, and made-up textile goods | 3 | 7 | 2 | 157 | 54 | 9 | 986 |
| Wood and cork products (except furniture) | 21 | 59 | 51 | 147 | 58 | 48 | 1,100 |
| Furniture and fixtures | 5 | 8 | 3 | 85 | 25 | 11 | 525 |
| Paper and paper products | - | 1 | - | 16 | 6 | 4 | 112 |
| Printing, publishing, etc. | 3 | 5 | 5 | 66 | 29 | 14 | 485 |
| Leather and leather products (except footwear and apparel) | - | - | - | 17 | 5 | 4 | 101 |
| Rubber products | 1 | 2 | 1 | 19 | 4 | 2 | 106 |
| Chemicals and chemical products | 2 | 5 | - | 27 | 15 | 3 | 219 |
| Petroleum and coal products | - | - | - | 7 | 3 | - | 46 |
| Non-metallic mineral products n.e.i. | 11 | 24 | 6 | 95 | 46 | 53 | 610 |
| Basic metal manufactures | - | 1 | - | 19 | 3 | 2 | 90 |
| Metal products (except machinery and transport equipment) | 2 | 7 | 4 | 97 | 32 | 17 | 647 |
| Machinery (except electrical) | 11 | 16 | 4 | 114 | 39 | 38 | 778 |
| Electrical machinery and appliances | - | 4 | - | 37 | 13 | 2 | 227 |
| Transport equipment | 44 | 68 | 24 | 312 | 152 | 135 | 2,446 |
| Miscellaneous products | 1 | 2 | 2 | 55 | 11 | - | 323 |
| Totals | 118 | 238 | 103 | 1,412 | 560 | 381 | 9,753 |
The number of factories and persons engaged are shown together in the following table, classified by industrial groups. Persons engaged include proprietors actively participating in their own businesses but exclude all persons engaged in selling and distribution. Figures for persons engaged refer to the average number over the whole year.
| Industry Group | Number of Factories | Number of Persons Engaged | ||||
|---|---|---|---|---|---|---|
| 1962-63 | 1963-64 | 1964-65 | 1962-63 | 1963-64 | 1964-65 | |
| Food | 673 | 661 | 637 | 34,178 | 34,195 | 35,145 |
| Beverages | 132 | 129 | 127 | 2,379 | 2,319 | 2,346 |
| Tobacco manufactures | 5 | 5 | 3 | 1,193 | 1,223 | 970 |
| Textiles | 181 | 185 | 185 | 11,085 | 11,587 | 12,333 |
| Footwear, other wearing apparel, and made-up textile goods | 960 | 994 | 986 | 26,034 | 26,538 | 27,361 |
| Wood and cork products (except furniture) | 1,051 | 1,073 | 1,100 | 13,485 | 13,391 | 14,133 |
| Furniture and fixtures | 498 | 506 | 525 | 5,114 | 5,453 | 5,743 |
| Paper and paper products | 102 | 112 | 112 | 6,403 | 6,982 | 7,111 |
| Printing, publishing, etc. | 466 | 480 | 485 | 12,085 | 12,579 | 13,067 |
| Leather and leather products (except footwear and apparel) | 93 | 98 | 101 | 1,730 | 1,789 | 1,925 |
| Rubber products | 96 | 104 | 106 | 3,205 | 3,278 | 3,419 |
| Chemicals and chemical products | 204 | 214 | 219 | 5,783 | 5,977 | 6,314 |
| Petroleum and coal products | 41 | 43 | 46 | 479 | 485 | 682 |
| Non-metallic mineral products n.e.i. | 586 | 603 | 610 | 7,604 | 8,015 | 8,573 |
| Basic metal manufactures | 86 | 90 | 90 | 1,147 | 1,224 | 1,315 |
| Metal products (except machinery and transport equipment) | 546 | 602 | 647 | 11,092 | 11,849 | 13,118 |
| Machinery (except electrical) | 611 | 664 | 778 | 11,318 | 12,267 | 13,890 |
| Electrical machinery and appliances | 162 | 178 | 227 | 6,586 | 7,387 | 8,743 |
| Transport equipment | 2,247 | 2,300 | 2,446 | 25,698 | 27,231 | 28,840 |
| Miscellaneous products | 294 | 324 | 323 | 4,917 | 5,497 | 6,022 |
| Totals | 9,034 | 9,365 | 9,753 | 191,515 | 199,266 | 211,050 |
Persons engaged are shown in the table below for the year 1964-65 classified into working proprietors, managerial and clerical, professional, and technical staff; and wage earners.
| Industry Group | Working Proprietors, Managers, Clerical, Professional, Technical | Wage-earning Employees | All Persons Engaged | ||||
|---|---|---|---|---|---|---|---|
| Males | Females | Males | Females | Males | Females | Total | |
| Food | 3,645 | 1,224 | 25,850 | 4,426 | 29,495 | 5,650 | 35,145 |
| Beverages | 418 | 167 | 1,574 | 187 | 1,992 | 354 | 2,346 |
| Tobacco manufactures | 65 | 56 | 346 | 503 | 411 | 559 | 970 |
| Textiles | 774 | 409 | 5,718 | 5,432 | 6,492 | 5,841 | 12,333 |
| Footwear, other wearing apparel, and made-up textile goods | 1,546 | 1,180 | 4,670 | 19,965 | 6,216 | 21,145 | 27,361 |
| Wood and cork products (except furniture) | 1,913 | 333 | 11,704 | 183 | 13,617 | 516 | 14,133 |
| Furniture and fixtures | 784 | 221 | 4,255 | 483 | 5,039 | 704 | 5,743 |
| Paper and paper products | 838 | 324 | 4,451 | 1,498 | 5,289 | 1,822 | 7,111 |
| Printing, publishing etc. | 1,626 | 1,069 | 8,366 | 2,006 | 9,992 | 3,075 | 13,067 |
| Leather and leather products (except footwear and apparel) | 203 | 75 | 948 | 699 | 1,151 | 774 | 1,925 |
| Rubber products | 507 | 140 | 2,292 | 480 | 2,799 | 620 | 3,419 |
| Chemicals and chemical products | 1,155 | 574 | 3,380 | 1,205 | 4,535 | 1,779 | 6,314 |
| Petroleum and coal products | 193 | 30 | 430 | 29 | 623 | 59 | 682 |
| Non-metallic mineral products n.e.i. | 1,317 | 283 | 6,512 | 461 | 7,829 | 744 | 8,573 |
| Basic metal manufactures | 202 | 51 | 1,044 | 18 | 1,246 | 69 | 1,315 |
| Metal products (except machinery and transport equipment) | 1,892 | 532 | 9,575 | 1,119 | 11,467 | 1,651 | 13,118 |
| Machinery (except electrical) | 2,222 | 590 | 10,756 | 322 | 12,978 | 912 | 13,890 |
| Electrical machinery and appliances | 1,152 | 396 | 4,839 | 2,356 | 5,991 | 2,752 | 8,743 |
| Transport equipment | 4,741 | 1,602 | 22,026 | 471 | 26,767 | 2,073 | 28,840 |
| Miscellaneous products | 754 | 350 | 3,016 | 1,902 | 3,770 | 2,252 | 6,022 |
| Totals | 25,947 | 9,606 | 131,752 | 43,745 | 157,699 | 53,351 | 211,050 |
Further information is given in the following table on persons engaged in 1964-65. Totals in each industrial group are shown by statistical areas.
| Industry Group | Northland | Central Auckland | South Auckland - Bay of Plenty | East Coast | Hawke's Bay | Taranaki | Wellington |
|---|---|---|---|---|---|---|---|
| Food | 1,069 | 7,861 | 2,959 | 836 | 3,082 | 2,458 | 5,083 |
| Beverages | 20 | 907 | 229 | 51 | 170 | 76 | 356 |
| Tobacco manufactures | - | 41 | - | - | 295 | - | 634 |
| Textiles | 18 | 3,326 | 50 | 149 | 257 | 84 | 2,509 |
| Footwear, other wearing apparel and made-up textile goods | 137 | 11,919 | 1,266 | 107 | 425 | 792 | 5,487 |
| Wood and cork products (except furniture) | 438 | 2,122 | 5,001 | 99 | 377 | 487 | 1,533 |
| Furniture and fixtures | 16 | 2,960 | 269 | 11 | 222 | 75 | 964 |
| Paper and paper products | - | 2,329 | 2,610 | 20 | 62 | 2 | 1,213 |
| Printing, publishing, etc. | 160 | 4,178 | 740 | 150 | 473 | 312 | 3,723 |
| Leather and leather products (except footwear and apparel) | 5 | 970 | 2 | 16 | 16 | 19 | 221 |
| Rubber products | 22 | 887 | 101 | 13 | 18 | 27 | 726 |
| Chemicals and chemical products | 5 | 2,307 | 293 | 7 | 195 | 276 | 1,916 |
| Petroleum and coal products | 188 | 171 | 62 | - | 6 | 9 | 172 |
| Non-metallic mineral products n.e.i. | 806 | 2,846 | 376 | 46 | 270 | 111 | 995 |
| Basic metal manufactures | 3 | 449 | 40 | - | 9 | 273 | 233 |
| Metal products (except machinery and transport equipment) | 43 | 6,875 | 359 | 14 | 191 | 126 | 2,766 |
| Machinery (except electrical) | 236 | 4,858 | 1,560 | 81 | 402 | 505 | 2,639 |
| Electrical machinery and appliances | 15 | 3,617 | 380 | - | 186 | 7 | 2,232 |
| Transport equipment | 739 | 6,604 | 3,369 | 416 | 1,075 | 903 | 7,546 |
| Miscellaneous products | 19 | 3,077 | 411 | - | 49 | 29 | 1,491 |
| Totals | 3,939 | 68,304 | 20,277 | 2,016 | 7,780 | 6,571 | 42,439 |
| Industry Group | Marlborough | Nelson | Westland | Canterbury | Otago | Southland | Total, N.Z. |
|---|---|---|---|---|---|---|---|
| Food | 324 | 731 | 31 | 4,992 | 3,056 | 2,663 | 35,145 |
| Beverages | 8 | 47 | 23 | 275 | 165 | 19 | 2,346 |
| Tobacco manufactures | - | - | - | - | - | - | 570 |
| Textiles | 2 | 32 | - | 3,514 | 2,291 | 101 | 12,333 |
| Footwear, other wearing apparel, and made-up textile goods | 200 | 94 | 152 | 5,314 | 1,364 | 104 | 27,361 |
| Wood and cork products (except furniture) | 100 | 618 | 488 | 1,683 | 576 | 606 | 14,133 |
| Furniture and fixtures | 17 | 40 | 7 | 814 | 269 | 79 | 5,743 |
| Paper and paper products | - | 12 | - | 395 | 171 | 297 | 7,111 |
| Printing, publishing, etc. | 73 | 156 | 72 | 1,732 | 1,010 | 288 | 13,067 |
| Leather and leather products (except footwear and apparel) | - | - | - | 412 | 224 | 40 | 1,925 |
| Rubber products | 8 | 10 | 4 | 1,560 | 30 | 13 | 3,419 |
| Chemicals and chemical products | 42 | 62 | - | 674 | 434 | 103 | 6,314 |
| Petroleum and coal products | - | - | - | 57 | 17 | - | 682 |
| Non-metallic mineral products n.e.i. | 56 | 400 | 33 | 1,514 | 561 | 359 | 8,573 |
| Basic metal manufactures | - | 2 | - | 232 | 66 | 8 | 1,315 |
| Metal products (except machinery and transport equipment) | 9 | 148 | 22 | 1,612 | 809 | 144 | 13,118 |
| Machinery (except electrical) | 106 | 91 | 67 | 2,251 | 659 | 435 | 13,890 |
| Electrical machinery and appliances | - | 13 | - | 1,629 | 646 | 18 | 8,743 |
| Transport equipment | 358 | 754 | 212 | 4,154 | 1,592 | 1,118 | 28,840 |
| Miscellaneous products | 63 | 6 | 12 | 744 | 121 | - | 6,022 |
| Totals | 1,366 | 3,216 | 1,123 | 33,563 | 14,061 | 6,395 | 211,050 |
The sex distribution among the persons engaged shows a considerable preponderance of males—in 1964-65, for every female engaged, there were three males. In the smaller districts there are few industries employing female labour to any great extent. The male preponderance is considerably smaller in the four main districts, where female labour is in great demand mainly on account of the importance of the clothing and textile industries. The majority of females in manufacturing industries are engaged in four classes: food; footwear and other wearing apparel; textiles; and printing, publishing, etc. In 1964-65 these industries accounted for 67 percent of all females in factories. In two industries only did the number of females exceed the number of males—viz, tobacco manufactures, where there were 136 females to every 100 males, and footwear and other wearing apparel, etc., where there were 340 females per 100 males. The upper table on the previous page shows the average number of males and females engaged according to industry groups for the year 1964-65.
Further information is available in the table below on the extent to which females were engaged in factories in New Zealand for 1964-65. This table gives by statistical areas the number of males per 100 females engaged, and the total persons engaged per 1,000 of population.
| Statistical Area | Males | Females | Total | Number of Males per 100 Females | Total Population at 1 April 1965 | Total Persons Engaged per 1,000 of Population |
|---|---|---|---|---|---|---|
| Northland | 3,580 | 359 | 3,939 | 997 | 91,400 | 43 |
| Central Auckland | 46,919 | 21,385 | 68,304 | 219 | 586,097 | 117 |
| South Auckland - Bay of Plenty | 17,645 | 2,632 | 20,277 | 670 | 384,000 | 53 |
| East Coast | 1,537 | 479 | 2,016 | 321 | 47,700 | 42 |
| Hawke's Bay | 6,175 | 1,605 | 7,780 | 385 | 124,600 | 62 |
| Taranaki | 5,511 | 1,060 | 6,571 | 520 | 104,100 | 63 |
| Wellington | 30,900 | 11,539 | 42,439 | 268 | 516,700 | 82 |
| Marlborough | 1,084 | 282 | 1,366 | 384 | 29,700 | 46 |
| Nelson | 2,729 | 487 | 3,216 | 560 | 67,700 | 48 |
| Westland | 952 | 171 | 1,123 | 557 | 25,100 | 45 |
| Canterbury | 24,489 | 9,074 | 33,563 | 270 | 373,720 | 90 |
| Otago | 10,253 | 3,808 | 14,061 | 269 | 186,400 | 75 |
| Southland | 5,925 | 470 | 6,395 | 1,261 | 102,900 | 62 |
| Totals | 157,699 | 53,351 | 211,050 | 296 | 2,640,117 | 80 |
A classification of the establishments, according to the number of persons engaged, is now given. Since 1951-52 the series excludes certain sectors of production previously included—principal omissions being the logging activities of sawmills and the generation and supply of gas and electricity.
| Year | Factories With Persons Engaged Numbering— | Total | ||||
|---|---|---|---|---|---|---|
| 10 or Under | 11-20 | 21-50 | 51-100 | Over 100 | ||
| Number of Factories | ||||||
| 1934-35 | 3,725 | 764 | 496 | 143 | 142 | 5,270 |
| 1939-40 | 4,218 | 957 | 772 | 212 | 183 | 6,342 |
| 1944-45 | 4,139 | 1,046 | 833 | 270 | 197 | 6,485 |
| 1949-50 | 4,993 | 1,409 | 1,106 | 312 | 207 | 8,027 |
| 1954-55 | 5,350 | 1,473 | 1,020 | 310 | 213 | 8,366 |
| 1959-60 | 5,242 | 1,621 | 1,108 | 312 | 267 | 8,550 |
| 1963-64 | 5,704 | 1,734 | 1,253 | 356 | 318 | 9,365 |
| 1964-65 | 5,893 | 1,828 | 1,294 | 409 | 329 | 9,753 |
| Number of Persons Engaged | ||||||
| 1934-35 | 14,901 | 11,321 | 15,309 | 9,716 | 28,111 | 79,358 |
| 1939-40 | 17,212 | 14,048 | 23,316 | 14,737 | 39,409 | 108,722 |
| 1944-45 | 18,382 | 15,547 | 25,787 | 18,809 | 43,889 | 122,414 |
| 1949-50 | 24,481 | 20,608 | 34,386 | 21,304 | 43,530 | 144,309 |
| 1954-55 | 27,206 | 21,432 | 31,650 | 21,808 | 51,479 | 153,575 |
| 1959-60 | 26,926 | 23,755 | 34,105 | 21,666 | 65,521 | 171,973 |
| 1963-64 | 28,940 | 25,079 | 38,736 | 24,464 | 82,047 | 199,266 |
| 1964-65 | 29,624 | 26,504 | 40,399 | 28,091 | 86,432 | 211,050 |
The classification according to the number of persons engaged shows clearly that, judged by the standards of highly industrialised communities, the average size of the industrial unit in New Zealand is small. Factories employing 10 persons or under accounted for 60 percent of the total number of factories in 1964-65.
SALARIES AND WAGES—The figures relating to the amounts paid as salaries and wages include amounts paid as bonuses and for overtime, also amounts drawn in lieu of salary by working proprietors. The amounts received by male and female employees (inclusive of all groups—executive, clerical, professional and technical, and wage earning), and the average amount received per employee of each sex, are set out below.
| Year | Males | Females | Both Sexes | |||
|---|---|---|---|---|---|---|
| Total | Average | Total | Average | Total | Average | |
| $(000) | $ | $(000) | $ | $(000) | $ | |
| 1960-61 | 256,508 | 1,890 | 44,642 | 980 | 301,150 | 1,660 |
| 1961-62 | 274,948 | 1,958 | 48,118 | 1,020 | 323,064 | 1,722 |
| 1962-63 | 290,592 | 2,020 | 49,262 | 1,034 | 339,854 | 1,774 |
| 1963-64 | 313,546 | 2,104 | 55,038 | 1,094 | 368,584 | 1,850 |
| 1964-65 | 350,722 | 2,224 | 61,270 | 1,148 | 411,992 | 1,952 |
The averages shown relate to all persons engaged, irrespective of age, industry, status, and personal occupation, and year-to-year comparisons may also be affected by changes in any of these factors. The figures do, however, give an indication of the increased earnings of factory workers in recent years.
The amount of salaries and wages paid in each industrial group and in all industries during the latest three years is given hereunder.
| Industry Group | Salaries and Wages Paid | ||
|---|---|---|---|
| 1962-63 | 1963-64 | 1964-65 | |
| $(000) | |||
| Food | 69,336 | 70,922 | 76,394 |
| Beverages | 4,552 | 4,654 | 4,950 |
| Tobacco manufactures | 1,936 | 2,028 | 1,700 |
| Textiles | 16,908 | 18,532 | 21,082 |
| Footwear, other wearing apparel, and made-up textile goods | 32,314 | 34,614 | 36,834 |
| Wood and cork products (except furniture) | 24,760 | 25,672 | 28,970 |
| Furniture and fixtures | 9,270 | 10,272 | 11,426 |
| Paper and paper products | 13,604 | 15,172 | 16,290 |
| Printing, publishing, etc. | 22,706 | 24,576 | 26,846 |
| Leather and leather products (except footwear and apparel) | 2,824 | 3,126 | 3,452 |
| Rubber products | 6,728 | 7,154 | 7,792 |
| Chemicals and chemical products | 10,464 | 11,508 | 12,842 |
| Petroleum and coal products | 948 | 1,020 | 1,756 |
| Non-metallic mineral products n.e.i. | 14,458 | 16,116 | 18,394 |
| Basic metal manufactures | 2,400 | 2,588 | 2,934 |
| Metal products (except machinery and transport equipment) | 21,388 | 24,004 | 28,290 |
| Machinery (except electrical) | 21,848 | 24,806 | 29,958 |
| Electrical machinery and appliances | 10,670 | 12,672 | 16,004 |
| Transport equipment | 44,744 | 49,424 | 55,076 |
| Miscellaneous products | 7,996 | 9,728 | 11,000 |
| Totals | 339,854 | 368,584 | 411,992 |
In the following table an analysis is made of the 1964-65 totals according to statistical areas in which the industries were carried on.
| Industry Group | Northland | Central Auckland | South Auckland Bay of Plenty | East Coast | Hawke's Bay | Taranaki | Wellington |
|---|---|---|---|---|---|---|---|
| Salaries and Wages Paid 1964-65 | |||||||
| $(000) | |||||||
| Food | 2,360 | 16,688 | 6,400 | 1,710 | 6,262 | 5,896 | 11,116 |
| Beverages | 30 | 1,972 | 458 | 102 | 366 | 128 | 786 |
| Tobacco manufactures | - | * | - | - | * | - | * |
| Textiles | * | 5,978 | 76 | * | 566 | * | 4,220 |
| Footwear, other wearing apparel, and made-up textile goods | 156 | 16,690 | 1,424 | 114 | 452 | 966 | 7,518 |
| Wood and cork products (except furniture) | 786 | 4,550 | 10,676 | 168 | 704 | 886 | 3,118 |
| Furniture and fixtures | 32 | 6,108 | 506 | 18 | 406 | 126 | 2,006 |
| Paper and paper products | - | 4,532 | 7,574 | * | * | * | 2,332 |
| Printing, publishing, etc. | 324 | 8,818 | 1,430 | 310 | 928 | 632 | 7,874 |
| Leather and leather products (except footwear and apparel) | * | 1,752 | * | 24 | 32 | * | 362 |
| Rubber products | 46 | 2,080 | 206 | * | * | 50 | 1,892 |
| Chemicals and chemical products | * | 4,468 | 682 | * | 562 | 576 | 3,944 |
| Petroleum and coal products | * | 374 | 136 | - | * | 16 | 386 |
| Non-metailic mineral products n.e.i. | 1,748 | 6,314 | 1,242 | 92 | 558 | 216 | 2,218 |
| Basic metal manufactures | * | 958 | 86 | - | * | * | 538 |
| Metal products (except machinery and transport equipment) | 84 | 15,132 | 818 | 26 | 406 | 214 | 5,944 |
| Machinery (except electrical) | 488 | 11,196 | 3,322 | 142 | 800 | 930 | 5,848 |
| Electrical machinery and appliances | * | 6,268 | 556 | * | 342 | * | 4,506 |
| Transport equipment | 1,242 | 12,912 | 6,066 | 704 | 1,728 | 1,434 | 16,180 |
| Miscellaneous products | 774 | 5,676 | 852 | 314 | 822 | 838 | 3,876 |
| Totals | 8,070 | 132,468 | 42,508 | 3,726 | 14,925 | 12,912 | 84,666 |
| Industry Group | Marlborough | Nelson | Westland | Canterbury | Otago | Southland | Total, N.Z. |
|---|---|---|---|---|---|---|---|
* To avoid disclosure of details of individual establishments, figures have been included in those for Miscellaneous products †Net total without figures from other groups to avoid disclosure of details. | |||||||
| Salaries and Wages Paid 1964-65 | |||||||
| $(000) | |||||||
| Food | 710 | 1,272 | 62 | 11,196 | 6,010 | 6,712 | 76,394 |
| Beverages | * | 90 | * | 576 | 334 | * | 4,950 |
| Tobacco manufactures | - | - | - | - | - | - | 1,700 |
| Textiles | * | 46 | - | 6,178 | 3,450 | 194 | 21,082 |
| Footwear, other wearing apparel, and made-up textile goods | 238 | 90 | * | 7,262 | 1,642 | 122 | 36,834 |
| Wood and cork products (except furniture) | 176 | 1,162 | 1,040 | 3,418 | 1,100 | 1,184 | 28,970 |
| Furniture and fixtures | 28 | 78 | 10 | 1,500 | 452 | 154 | 11,426 |
| Paper and paper products | - | * | - | 694 | 268 | 728 | 16,290 |
| Printing, publishing, etc. | 158 | 302 | 142 | 3,368 | 1,972 | 590 | 26,846 |
| Leather and leather products (except footwear and apparel) | - | - | - | 704 | 460 | 76 | 3,452 |
| Rubber products | * | * | * | 3,330 | 56 | * | 7,792 |
| Chemicals and chemical products | * | 132 | - | 1,256 | 872 | 268 | 12,842 |
| Petroleum and coal products | - | - | - | 130 | 34 | - | 1,756 |
| Non-metallic mineral products n.e.i. | 106 | 992 | 68 | 2,874 | 1,163 | 798 | 18,394 |
| Basic metal manufactures | - | * | - | 516 | 132 | * | 2,934 |
| Metal products (except machinery and transport equipment) | * | 274 | 42 | 3,384 | 1,640 | 308 | 28,290 |
| Machinery (except electrical) | 190 | 176 | 114 | 4,466 | 1,374 | 914 | 29,958 |
| Electrical machinery and appliances | - | 24 | - | 2,936 | 1,296 | * | 16,004 |
| Transport equipment | 610 | 1,230 | 336 | 7,884 | 2,830 | 1,920 | 55,076 |
| Miscellaneous products | 200 | 52 | 244 | 1,266 | 198 | 116 | 11,000† |
| Totals | 2,416 | 5,922 | 2,060 | 62,940 | 25,286 | 14,084 | 411,992 |
A further analysis of salaries and wages paid is given in the table below for 1964-65, and shows the amounts paid to working proprietors, managers, clerical, professional and technical staff, and those paid to other employees, i.e., wage earners. As mentioned earlier, drawings in lieu of salaries are included for proprietors actively engaged in the business. Males and females are distinguished throughout.
| Industry Group | Working Proprietors, Managers, Clerical, Professional. Technical | Wage-earning Employees | All Persons Engaged | ||||
|---|---|---|---|---|---|---|---|
| Males | Females | Males | Females | Males | Females | Total | |
| Salaries and Wages Paid 1964-65 | |||||||
| $(000) | |||||||
| Food | 10,366 | 1,522 | 59,634 | 4,872 | 70,000 | 6,394 | 76,394 |
| Beverages | 1,204 | 214 | 3,316 | 216 | 4,520 | 430 | 4,950 |
| Tobacco manufactures | 194 | 84 | 780 | 642 | 974 | 726 | 1,700 |
| Textiles | 2,440 | 554 | 11,950 | 6,138 | 14,390 | 6,692 | 21,082 |
| Footwear, other wearing apparel, and made-up textile goods | 4,664 | 1,778 | 9,052 | 21,340 | 13,716 | 23,118 | 36,834 |
| Wood and cork products (except furniture) | 5,144 | 396 | 23,214 | 216 | 28,358 | 612 | 28,970 |
| Furniture and fixtures | 2,316 | 286 | 8,264 | 560 | 10,580 | 846 | 11,426 |
| Paper and paper products | 2,996 | 472 | 11,072 | 1,748 | 14,068 | 2,220 | 16,288 |
| Printing, publishing, etc. | 4,800 | 1,388 | 18,238 | 2,420 | 23,038 | 3,808 | 26,846 |
| Leather and leather products (except footwear and apparel) | 652 | 102 | 1,906 | 790 | 2,558 | 892 | 3,450 |
| Rubber products | 1,454 | 180 | 5,578 | 580 | 7,032 | 760 | 7,792 |
| Chemicals and chemical products | 3,398 | 804 | 7,390 | 1,250 | 10,788 | 2,054 | 12,842 |
| Petroleum and coal products | 704 | 46 | 974 | 34 | 1,678 | 80 | 1,758 |
| Non-metallic mineral products n.e.i. | 3,706 | 356 | 13,814 | 518 | 17,520 | 874 | 18,394 |
| Basic metal manufactures | 656 | 64 | 2,192 | 22 | 2,848 | 86 | 2,934 |
| Metal products (except machinery and transport equipment) | 5,844 | 716 | 20,292 | 1,438 | 26,136 | 2,154 | 28,290 |
| Machinery (except electrical) | 6,620 | 752 | 22,160 | 426 | 28,780 | 1,178 | 29,958 |
| Electrical machinery and appliances | 3,282 | 536 | 9,410 | 2,774 | 12,692 | 3,310 | 16,002 |
| Transport equipment | 12,242 | 1,748 | 40,294 | 792 | 52,536 | 2,540 | 55,076 |
| Miscellaneous products | 2,380 | 498 | 6,128 | 1,994 | 8,508 | 2,492 | 11,000 |
| Totals | 75,062 | 12,500 | 275,660 | 48,770 | 350,722 | 61,270 | 411,992 |
The following statement shows the average earnings of males and females for the past 11 years.
| Year | Proprietors Actively Engaged | Managers, Overseers | Accountants, Clerks | Professional, Technical | Wage-earning Employees | Totals | ||||||
|---|---|---|---|---|---|---|---|---|---|---|---|---|
| Males | Females | Males | Females | Males | Females | Males | Females | Males | Females | Males | Females | |
| Average Salary or Wage | ||||||||||||
| $ | $ | $ | $ | $ | $ | $ | $ | $ | $ | $ | $ | |
| 1954-55 | 1,598 | 1,086 | 2,144 | 1,310 | 1,466 | 822 | .. | .. | 1,334 | 746 | 1,460 | 764 |
| 1955-56 | 1,680 | 1,194 | 2,254 | 1,366 | 1,588 | 872 | .. | .. | 1,482 | 784 | 1,554 | 804 |
| 1956-57 | 1,782 | 1,124 | 2,358 | 1,446 | 1,644 | 914 | .. | .. | 1,528 | 308 | 1,608 | 832 |
| 1957-58 | 1,838 | 1,242 | 2,482 | 1,488 | 1,696 | 954 | .. | .. | 1,594 | 838 | 1,678 | 862 |
| 1958-59 | 1,910 | 1,338 | 2,596 | 1,504 | 1,760 | 982 | .. | .. | 1,642 | 882 | 1,732 | 904 |
| 1959-60 | 2,004 | 1,304 | 2,718 | 1,586 | 1,854 | 1,028 | .. | .. | 1,706 | 900 | 1,804 | 928 |
| 1960-61 | 2,090 | 1,378 | 2,848 | 1,734 | 1,942 | 1,074 | .. | .. | 1,786 | 950 | 1,890 | 980 |
| 1961-62 | 2,132 | 1,388 | 2,954 | 1,770 | 2,012 | 1,114 | .. | .. | 1,852 | 992 | 1,958 | 1,020 |
| 1962-63 | 2,260 | 1,368 | 3,036 | 1,750 | 2,074 | 1,148 | 2,484 | 1,390 | 1,904 | 1,000 | 2,020 | 1,034 |
| 1963-64 | 2,312 | 1,462 | 3,168 | 1,836 | 2,166 | 1,196 | 2,566 | 1,382 | 1,980 | 1,062 | 2,104 | 1,094 |
| 1964-65 | 2,450 | 1,482 | 3,358 | 1,906 | 2,280 | 1,252 | 2,696 | 1,436 | 2,092 | 1,114 | 2,224 | 1,148 |
MOTIVE POWER—A supply of cheap motive power is a material element in industrial development. New Zealand industries were formerly handicapped in this respect, long railway hauls and, in some instances, sea carriage being involved in the transport of coal from the mines to the factories. The development of the country's electric power resources (as described in Section 20A) has been a major factor in industrial growth, especially as the rates compare very favourably with those in more highly industrialised countries.
The following table shows the number and aggregate horsepower of each class of engine used in factories.
| Class of Engine | 1939-40 | 1949-50 | 1959-60 | 1963-64 | 1964-65 |
|---|---|---|---|---|---|
* Included in “other”. | |||||
| Electric No. | 32,013 | 86,227 | 165,797 | 208,993 | 222,924 |
| h.p. | 213,237 | 399,925 | 770,213 | 1,040,066 | 1,117,879 |
| Steam No. | 1,012 | * | 407 | 276 | 273 |
| h.p. | 49,769 | * | 18,379 | 12,590 | 15,950 |
| Petrol and light oil No. | 382 9,546 | * | 709 | 758 | 931 |
| h.p. | * | 14,276 | 15,480 | 20,898 | |
| Heavy oil No. | * | 265 | 262 | 214 | |
| h.p. | * | 16,403 | 17,353 | 14,186 | |
| Other No. | 166 | 1,729 | 115 | 75 | 48 |
| h.p. | 4,813 | 56,188 | 3,611 | 1,863 | 2,075 |
| Totals No. | 33,573 | 87,956 | 167,293 | 210,364 | 224,390 |
| h.p. | 277,365 | 456,113 | 822,882 | 1,087,352 | 1,170,983 |
The figures relating to horsepower represent the rated horsepower of engines ordinarily in use for driving factory plant. Steam boilers and engines for generating electric power in own works are excluded.
The following table shows the types and rated horsepower of engines ordinarily in use in the various industries during 1964-65.
| Industry Group | Rated Horsepower of Engines in Use | |||||
|---|---|---|---|---|---|---|
| Electric | Steam | Petrol and Light Oil | Heavy Oil | Other | Total | |
| Food | 239,702 | 4,728 | 1,891 | 1,515 | 43 | 247,879 |
| Beverages | 15,985 | 211 | 162 | - | - | 16,358 |
| Tobacco manufactures | 2,081 | - | - | - | - | 2,081 |
| Textiles | 42,618 | 636 | 112 | - | - | 43,366 |
| Footwear, other wearing apparel, and made-up textile goods | 17,686 | 47 | 17 | 48 | - | 17,798 |
| Wood and cork products (except furniture) | 147,509 | 3,376 | 6,830 | 8,234 | 1,220 | 167,169 |
| Furniture and fixtures | 18,421 | - | 5 | - | - | 18,426 |
| Paper and paper products | 225,841 | 506 | 3 | 12 | - | 226,362 |
| Printing, publishing, etc. | 23,867 | 7 | 45 | 1,016 | 246 | 25,181 |
| Leather and leather products (except footwear and apparel) | 7,581 | 100 | 32 | - | - | 7,713 |
| Rubber products | 28,379 | 25 | 89 | - | - | 28,493 |
| Chemicals and chemical products | 52,048 | 251 | 201 | 468 | 338 | 53,306 |
| Petroleum and coal products | 16,127 | 5,406 | 1,346 | - | 4 | 22,883 |
| Non-metallic mineral products n.e.i. | 93,122 | 510 | 1,881 | 2,449 | 123 | 98,085 |
| Basic metal manufactures | 8,524 | - | 1 | - | - | 8,525 |
| Metal products (except machinery and transport equipment) | 58,486 | 33 | 660 | 144 | - | 59,323 |
| Machinery (except electrical) | 46,421 | 50 | 2,781 | 245 | 45 | 49,542 |
| Electrical machinery and appliances | 14,357 | - | 6 | 15 | - | 14,378 |
| Transport equipment | 40,381 | 64 | 4,590 | 40 | 56 | 45,131 |
| Miscellaneous products | 18,743 | - | 246 | - | - | 18,989 |
| Totals | 1,117,879 | 15,950 | 20,898 | 14,186 | 2,075 | 1,170,988 |
CONSUMPTION OF COAL—During the year 1964-65, 1,030,000 tons of New Zealand coal were used in industries covered by the statistics of factory production. Comparable figures for the two previous years were: 1963-64, 1,032,000 tons, and 1962-63, 955,000 tons. It is important to note that the factory production statistics exclude the activities of the gas-making industry and electric generation and supply stations. These two industries used 258,000 tons and 461,000 tons of coal respectively in 1964-65.
The following table shows for the year 1964-65 the consumption of coal by industrial groups.
| Industry Group | Tons of Coal Used |
|---|---|
| Food | 478,870 |
| Beverages | 12,159 |
| Tobacco manufactures | - |
| Textiles | 39,586 |
| Footwear, other wearing apparel, and made-up textile goods | 1,477 |
| Wood and cork products (except furniture) | 563 |
| Furniture and fixtures | 62 |
| Paper and paper products | 141,641 |
| Printing, publishing, etc. | 239 |
| Leather and leather products (except footwear and apparel) | 6,841 |
| Rubber products | 19,630 |
| Chemicals and chemical products | 18,053 |
| Petroleum and coal products | 36,280 |
| Non-metallic mineral products n.e.i. | 269,210 |
| Basic metal manufactures | 190 |
| Metal products (except machinery and transport equipment) | 1,854 |
| Machinery (except electrical) | 518 |
| Electrical machinery and appliances | 305 |
| Transport equipment | 254 |
| Miscellaneous products | 1,844 |
| Total | 1,029,576 |
Approximately 86 percent of the amount of coal used is accounted for in three groups: food, paper and paper products, and non-metallic mineral products n.e.i. Individual industries using more than 10,000 tons of coal in 1964-65 were as follows.
| Industry | Tons |
|---|---|
| Milk products other than butter and cheese | 251,154 |
| Cement | 213,180 |
| Pulp, paper and paperboard | 141,591 |
| Meat freezing and preserving | 114,073 |
| Butter and cheese | 76,937 |
| Structural clay products | 40,067 |
| Petroleum and coal products | 36,142 |
| Woollen milling | 24,119 |
| Food preparations n.e.i. | 20,064 |
| Brewing of ale and stout and malting | 11,319 |
| Rubber goods other than tyres and tubes | 10,916 |
MATERIALS—The value of materials used does not afford a very satisfactory basis of comparison as between one industry or industrial group and another, for the reason that the changes wrought during the process of manufacture vary considerably in degree. An example of the wide differences which may occur in the ratio of cost of materials to value of goods produced will be seen in the food group and the wood and cork products (except furniture) group. The values shown for materials used include the cost of containers and packing but exclude fuel costs.
Totals for the latest year show that the cost of materials used in food manufacture was $539 million, and the goods produced were valued at $683 million, while the materials used in the manufacture of wood and cork products cost $67 million and finished goods produced were valued at $127 million.
The cost of materials used in each industrial group and in all industries for each of the latest three years was as follows.
| Industry Group | Cost of Materials Used | ||
|---|---|---|---|
| 1962-63 | 1963-64 | 1954-65 | |
| $(000) | |||
| Food | 418,534 | 477,908 | 538,915 |
| Beverages | 14,386 | 15,388 | 16,510 |
| Tobacco manufactures | 12,160 | 12,964 | 12,400 |
| Textiles | 56,260 | 79,128 | 80,669 |
| Footwear, other wearing apparel, and made-up textile goods | 55,264 | 60,002 | 64,072 |
| Wood and cork products (except furniture) | 55,694 | 59,998 | 67,202 |
| Furniture and fixtures | 15,964 | 18,026 | 20,338 |
| Paper and paper products | 37,732 | 42,510 | 46,218 |
| Printing, publishing, etc. | 21,944 | 24,438 | 26,011 |
| Leather and leather products (except footwear and apparel) | 7,002 | 7,300 | 8,190 |
| Rubber products | 12,204 | 12,512 | 13,283 |
| Chemicals and chemical products | 46,860 | 52,734 | 60,563 |
| Petroleum and coal products | 7,408 | 8,098 | 31,616 |
| Non-metallic mineral products n.e.i. | 18,874 | 20,892 | 23,853 |
| Basic metal manufactures | 6,450 | 7,560 | 9,261 |
| Metal products (except machinery and transport equipment) | 40,858 | 44,172 | 56,711 |
| Machinery (except electrical) | 34,080 | 43,154 | 53,049 |
| Electrical machinery and appliances | 29,832 | 37,672 | 48,598 |
| Transport equipment | 101,048 | 120,186 | 139,685 |
| Miscellaneous products | 13,210 | 16,078 | 18,257 |
| Totals | 1,005,762 | 1,160,718 | 1,335,403 |
An analysis by statistical areas of the cost of materials used for the year 1964-65 is given below.
| Industry Group | Northland | Central Auckland | South Auckland - Bay of Plenty | East Coast | Hawke's Bay | Taranaki | Wellington |
|---|---|---|---|---|---|---|---|
| Cost of Materials Used 1964-65 | |||||||
| $(000) | |||||||
| Food | 28,188 | 106,398 | 108,820 | 6,478 | 31,086 | 53,762 | 70,176 |
| Beverages | 90 | 7,918 | 1,120 | 250 | 1,184 | 242 | 1,652 |
| Tobacco manufactures | - | * | - | - | * | - | * |
| Textiles | * | 19,220 | 1,080 | * | 10,288 | * | 18,218 |
| Footwear, other wearing apparel, and made-up textile goods | 226 | 27,870 | 2,688 | 190 | 924 | 1,576 | 13,542 |
| Wood and cork products (except furniture) | 2,204 | 13,258 | 23,940 | 558 | 2,234 | 1,492 | 8,060 |
| Furniture and fixtures | 58 | 10,726 | 638 | 14 | 496 | 132 | 3,882 |
| Paper and paper products | - | 14,704 | 16,766 | * | * | * | 8,268 |
| Printing, publishing, etc. | 168 | 10,560 | 874 | 192 | 742 | 340 | 7,228 |
| Leather and leather products (except footwear and apparel) | * | 3,818 | * | 18 | 180 | * | 546 |
| Rubber products | 96 | 3,758 | 420 | * | * | 66 | 3,126 |
| Chemicals and chemical products | * | 19,164 | 5,434 | * | 3,336 | 4,094 | 17,476 |
| Petroleum and coal products | * | 2,884 | 448 | - | * | 104 | 5,038 |
| Non-metallic mineral products n.e.i. | 1,762 | 8,746 | 1,866 | 158 | 672 | 288 | 3,154 |
| Basic metal manufactures | * | 4,358 | 52 | - | * | * | 1,262 |
| Metal products (except machinery and transport equipment) | 250 | 31,654 | 1,500 | 58 | 928 | 442 | 12,198 |
| Machinery (except electrical) | 558 | 19,934 | 4,452 | 184 | 1,372 | 1,506 | 10,994 |
| Electrical machinery and appliances | * | 21,512 | 1,392 | - | 730 | * | 12,814 |
| Transport equipment | 1,868 | 27,760 | 9,396 | 1,116 | 2,560 | 2,268 | 68,026 |
| Miscellaneous products | 22,464 | 9,390 | 878 | 1,236 | 7,098 | 3,106 | 11,268 |
| Totals | 57,934 | 363,630 | 181,762 | 10,448 | 63,828 | 69,420 | 276,926 |
| Industry Group | Marlborough | Nelson | Westland | Canterbury | Otago | Southland | Total, N.Z. |
|---|---|---|---|---|---|---|---|
* To avoid disclosure of details of individual establishments, figures have been included in those for Miscellaneous products. †Net total without figures from other groups to avoid disclosure of details. | |||||||
| Cost of Materials Used 1964-65 | |||||||
| $(000) | |||||||
| Food | 3,512 | 6,920 | 1,108 | 53,572 | 31,140 | 37,754 | 538,916 |
| Beverages | * | 154 | * | 2,784 | 920 | * | 16,510 |
| Tobacco manufactures | - | - | - | - | - | - | 12,400 |
| Textiles | * | 66 | - | 20,092 | 7,518 | 2,942 | 80,670 |
| Footwear, other wearing apparel, and made-up textile goods | 510 | 174 | * | 13,230 | 2,544 | 212 | 64,072 |
| Wood and cork products (except furniture) | 306 | 2,478 | 2,038 | 6,132 | 2,476 | 2,028 | 67,202 |
| Furniture and fixtures | 34 | 98 | 10 | 3,006 | 1,006 | 238 | 20,338 |
| Paper and paper products | - | * | - | 2,990 | 656 | 1,794 | 46,218 |
| Printing, publishing, etc. | 70 | 186 | 46 | 3,356 | 1,886 | 364 | 26,010 |
| Leather and leather products (except footwear and apparel) | - | - | - | 1,668 | 1,286 | 576 | 8,190 |
| Rubber products | * | * | * | 5,458 | 110 | * | 13,282 |
| Chemicals and chemical products | * | 374 | - | 4,532 | 4,008 | 2,004 | 60,564 |
| Petroleum and coal products | - | - | - | 502 | 180 | - | 31,616 |
| Non-metallic mineral products n.e.i. | 180 | 1,004 | 56 | 3,294 | 1,570 | 1,104 | 23,854 |
| Basic metal manufactures | - | * | - | 636 | 48 | * | 9,262 |
| Metal products (except machinery and transport equipment) | * | 488 | 84 | 5,850 | 2,512 | 730 | 56,712 |
| Machinery (except electrical) | 266 | 258 | 118 | 9,986 | 2,134 | 1,288 | 53,050 |
| Electrical machinery and appliances | - | 36 | - | 9,414 | 2,616 | * | 48,598 |
| Transport equipment | 976 | 1,894 | 586 | 15,194 | 4,214 | 3,826 | 139,684 |
| Miscellaneous products | 222 | 298 | 522 | 2,538 | 306 | 156 | 18,258† |
| Totals | 6,076 | 14,424 | 4,570 | 164,236 | 67,130 | 55,018 | 1,335,402 |
A large proportion of the total cost of materials is accounted for by the food group, which includes the primary produce processing industries dealing with meat freezing and preserving and the manufacture of butter, cheese, and other milk products. In the latest year, for example, the cost of materials used by this group, $539 million, represented 40 percent of the total cost of materials used by all industries, $1,335 million. For this reason, variations in the prices received for primary produce have a very marked effect on this total.
PRODUCTS—The value of products is based upon the valuation of goods at the factory door. It is the selling value at the factory to customers of all goods made or processed during the year after deducting all costs of selling and distribution.
In making use of the gross value of products it must be borne in mind that the figures include the value of raw materials operated upon, which value in recent years constitutes approximately three-fifths of the value of products. Where the products of one industry—for example, sawmilling—are treated again in other industries, such as furniture making, joinery, etc., part of the value of the timber shown as products of the former industry appears again as the materials of the latter industry and enters into the value of furniture and joinery made. Duplication of this kind is found in many industries.
The following table shows the gross value of production for each industrial group and for all industries.
| Industrial Group | Value of Production | ||
|---|---|---|---|
| 1962-63 | 1963-64 | 1964-65 | |
| $(000) | |||
| Food | 553,030 | 627,568 | 683,388 |
| Beverages | 30,770 | 33,152 | 34,918 |
| Tobacco manufactures | 17,858 | 19,198 | 18,408 |
| Textiles | 88,136 | 113,968 | 120,846 |
| Footwear, other wearing apparel, and made-up textile goods | 103,624 | 112,846 | 119,552 |
| Wood and cork products (except furniture) | 102,916 | 110,902 | 126,562 |
| Furniture and fixtures | 30,556 | 34,280 | 38,748 |
| Paper and paper products | 83,490 | 95,382 | 101,868 |
| Printing, publishing, etc. | 65,400 | 72,206 | 78,344 |
| Leather and leather products (except footwear and apparel) | 12,334 | 13,206 | 14,310 |
| Rubber products | 28,122 | 29,274 | 31,852 |
| Chemicals and chemical products | 78,132 | 88,900 | 99,868 |
| Petroleum and coal products | 10,498 | 11,642 | 41,858 |
| Non-metailic mineral products n.e.i. | 55,626 | 63,314 | 71,488 |
| Basic metal manufactures | 11,170 | 13,246 | 15,864 |
| Metal products (except machinery and transport equipment) | 80,680 | 91,284 | 113,868 |
| Machinery (except electrical) | 71,602 | 86,278 | 105,666 |
| Electrical machinery and appliances | 51,790 | 65,992 | 84,418 |
| Transport equipment | 175,996 | 204,732 | 231,822 |
| Miscellaneous products | 29,510 | 36,716 | 42,984 |
| Totals | 1,681,244 | 1,924,084 | 2,176,634 |
A similar analysis by statistical areas, but limited to the year 1964-65, is now given.
| Industry Group | Northland | Central Auckland | South Auckland - Bay of Plenty | East Coast | Hawke's Bay | Taranaki | Wellington |
|---|---|---|---|---|---|---|---|
| Value of Production 1964-65 | |||||||
| $(000) | |||||||
| Food | 32,042 | 139,744 | 126,082 | 9,982 | 43,396 | 64,360 | 88,572 |
| Beverages | 204 | 14,696 | 2,710 | 544 | 2,136 | 600 | 4,624 |
| Tobacco manufactures | - | * | - | - | * | - | * |
| Textiles | * | 30,894 | 1,228 | * | 11,270 | * | 27,708 |
| Footwear, other wearing apparel, and made-up textile goods | 450 | 53,788 | 4,712 | 344 | 1,632 | 3,188 | 25,020 |
| Wood and cork products (except furniture) | 3,556 | 21,760 | 48,872 | 936 | 3,648 | 3,074 | 14,016 |
| Furniture and fixtures | 116 | 20,646 | 1,472 | 40 | 1,094 | 310 | 7,002 |
| Paper and paper products | - | 26,564 | 50,714 | * | * | * | 13,948 |
| Printing, publishing, etc. | 768 | 28,210 | 3,904 | 690 | 2,608 | 1,436 | 21,678 |
| Leather and leather products (except footwear and apparel) | * | 6,872 | * | 52 | 248 | * | 1,240 |
| Rubber products | 278 | 8,510 | 1,022 | * | * | 180 | 7,546 |
| Chemicals and chemical products | * | 31,276 | 8,932 | * | 4,668 | 6,472 | 29,852 |
| Petroleum and coal products | * | 4,416 | 702 | - | * | 144 | 6,430 |
| Non-metallic mineral products n.e.i. | 8,408 | 23,510 | 5,272 | 356 | 1,834 | 696 | 7,614 |
| Basic metal manufactures | * | 6,614 | 180 | - | * | * | 2,364 |
| Metal products (except machinery and transport equipment) | 424 | 62,750 | 3,044 | 98 | 1,714 | 838 | 24,892 |
| Machinery (except electrical) | 1,492 | 39,146 | 10,278 | 400 | 3,230 | 3,152 | 21,084 |
| Electrical machinery and appliances | * | 36,652 | 2,622 | - | 1,300 | * | 22,404 |
| Transport equipment | 3,678 | 47,078 | 19,228 | 2,176 | 5,384 | 4,804 | 99,518 |
| Miscellaneous products | 29,166 | 22,184 | 2,608 | 2,358 | 10,414 | 5,290 | 21,124 |
| Totals | 80,580 | 625,310 | 293,580 | 17,976 | 94,578 | 94,544 | 446,642 |
| Industry Group | Marlborough | Nelson | Westland | Canterbury | Otago | Southland | Total |
|---|---|---|---|---|---|---|---|
* To avoid disclosure of details of individual establishments, figures have been included in those for Miscellaneous products. † Net total without figures from other groups to avoid disclosure of details. | |||||||
| Value of Production 1964-65 | |||||||
| $(000) | |||||||
| Food | 4,410 | 9,256 | 1,222 | 71,446 | 43,606 | 49,266 | 683,388 |
| Beverages | * | 458 | * | 5,920 | 2,480 | * | 34,918 |
| Tobacco manufactures | - | - | - | - | - | - | 18,408 |
| Textiles | * | 146 | - | 30,720 | 13,052 | 3,308 | 120,846 |
| Footwear, other wearing apparel, and made-up textile goods | 830 | 294 | * | 23,578 | 4,780 | 370 | 119,552 |
| Wood and cork products (except furniture) | 638 | 4,688 | 4,162 | 12,476 | 4,406 | 4,332 | 126,562 |
| Furniture and fixtures | 74 | 208 | 26 | 5,512 | 1,772 | 474 | 38,748 |
| Paper and paper products | - | * | - | 4,648 | 1,166 | 3,312 | 101,868 |
| Printing, publishing, etc. | 382 | 716 | 280 | 10,202 | 5,912 | 1,560 | 78,344 |
| Leather and leather products (except footwear and apparel) | - | - | - | 2,968 | 1,994 | 756 | 14,310 |
| Rubber products | * | * | * | 13,480 | 238 | * | 31,852 |
| Chemicals and chemical products | * | 1,008 | - | 7,932 | 6,178 | 3,096 | 99,868 |
| Petroleum and coal products | - | - | - | 848 | 294 | - | 41,858 |
| Non-metallic mineral products n.e.i. | 358 | 5,660 | 174 | 9,474 | 4,908 | 3,222 | 71,488 |
| Basic metal manufactures | - | * | - | 1,556 | 318 | * | 15,864 |
| Metal products (except machinery and transport equipment) | * | 944 | 144 | 12,078 | 5,538 | 1,344 | 113,868 |
| Machinery (except electrical) | 548 | 560 | 328 | 18,022 | 4,560 | 2,858 | 105,666 |
| Electrical machinery and appliances | - | 64 | - | 16,202 | 4,986 | * | 84,418 |
| Transport equipment | 1,792 | 3,830 | 1,096 | 27,904 | 8,404 | 6,930 | 231,822 |
| Miscellaneous products | 758 | 450 | 968 | 5,490 | 682 | 390 | 42,984 |
| Totals | 9,788 | 28,284 | 8,402 | 280,456 | 115,272 | 81,218 | 2,176,634 |
NET OUTPUT (NET VALUE ADDED): Added Value—Ever since the inception of statistics on manufacturing industries in New Zealand the term added value has been used in the various industry summaries, reports, and analytical tables. Throughout this long period the statistical concept of added value was defined as the difference between the value of an industry's product and the cost of materials, i.e., those materials which became physically part of, or were transformed directly into, the industry's product.
Several economic and statistical meanings are attached to such a concept of added value. The simplest interpretation is the one from which the words themselves derive in their ordinary common usage: the value added by a specific activity to materials to make from them a new product. The clothing manufacturer uses textiles to make suits and added value is simply the money value by which the value of textiles has been enhanced when made into suits.
Added value, however, can also be taken as the measure of the contribution of an industry to production in general and as a basis of comparison between one branch of the manufacturing industry and another. For instance, added value per person has been generally used in productivity studies and comparisons between industry branches and over a historical period. For such purposes the measure of added value is greatly superior to value of production which varies from industry to industry not only because their respective contributions are different but also because the unit cost of materials varies. A simpler example would be a comparison between two furniture factories, one of which largely uses pine whereas the second makes only mahogany furniture.
A third aspect of added value is its neutrality to structural organisation of the manufacturing industry as a whole; as a result added value is a measure which is consistent in its concept over time. The total value of production, on the other hand, is affected by the degree of industry integration which can in turn be affected in an accidental way by institutional and financial circumstances. The value of production depends on the number of units in the productive process, because it is partly duplicated as production moves from one unit to the next and the value is counted at every stage. Added value, by ignoring the value of materials at each stage, can be summed to a meaningful total independent of the number of units involved.
Net Output (Net Value Added)—It has been felt for a number of years, that the concept of added value as previously calculated was deficient in many ways for the purposes for which it is intended. Deducting only materials which go into the product of a firm or branch of industry is not enough in order to evaluate the contribution of a given industry. The firm or industry also uses materials not directly incorporated in the product, it uses services of many kinds and all of these are the products of industries, other than the given industry. In other words, to get a precise and satisfactory measure of “added value” the products of all other industries entering into production costs of the given industry need to be deducted. Failing this, none of the three purposes described in the first section of the notes can be satisfactorily achieved.
It is for these reasons that it has been decided to introduce a new concept of “added value” which henceforth will be designated as Net Output (Net Value Added). In order, however, not to interrupt historical data for statistical users both concepts will be published side by side for the next few years. Not only will the new Net Output (Net Value Added) series afford a much better comparison between branches of industry but its aggregate for the manufacturing industry as a whole will provide a direct measure of the contribution of the manufacturing industry to national income itself. The new Net Output (Net Value Added) series consists, as is shown in the schematic table below of three items only, viz, salaries and wages paid, interest paid by the industry, and surplus generated. These three items are also the components of national income or its companion aggregates net national and domestic output.
| COMPARISON BETWEEN NET OUTPUT (NET VALUE ADDED) AND ADDED VALUE | |||
|---|---|---|---|
| Cost Structure of
Industry (Typical Items of Cost) | Examples of
Industries Contributing to Production (Output of Industries Typically Supplying Goods and Services) | Item Included (+) or Excluded (-) In | |
| Net Output (Net Value Added) | Added Value | ||
| Rewards to Factors of Production— | |||
| Salaries and Wages | given industry's own contribution to production | + | + |
| Interest on borrowed capital | + | + | |
| Proprietors' surplus | + | + | |
| Other (non-factor) Costs— | |||
| Materials and components transformed into products | Manufacturing, Farming, Mining and Quarrying, Forestry | - | - |
| Fuels, electricity, water | Mining, Electricity, Gas, Water | - | + |
| Repairs and maintenance to plant and premises | Manufacturing, Building and Construction, Services | - | + |
| Costs connected with transport of persons and goods | Transport, Manufacturing | - | + |
| Rents | Real Estate | - | + |
| Insurance | Insurance | - | + |
| Communications services | Communications | - | + |
| Other management costs | Manufacturing, Services | - | + |
| Depreciation costs | Contribution to production by wear and tear of given industry's own capital equipment | - | + |
| The following table covering the manufacturing industry demonstrates how each concept is arrived at. | ||||||
|---|---|---|---|---|---|---|
| Components | 1959-60 | 1960-61 | 1961-62 | 1962-63 | 1963-64 | 1964-65 |
| $(million) | ||||||
| Value of production | 1,411 | 1,514 | 1,613 | 1,681 | 1,924 | 2,177 |
| Less Costs of materials | 878 | 939 | 977 | 1,006 | 1,161 | 1,335 |
| Added value | 533 | 574 | 636 | 675 | 763 | 841 |
| Less Other expenses | 108 | 118 | 128 | 136 | 148 | 166 |
| Depreciation charges | 31 | 33 | 37 | 43 | 47 | 54 |
| Net output (Net value added) | 394 | 423 | 471 | 496 | 568 | 622 |
| Percent | ||||||
| Contribution of manufacturing industry to net domestic output (income) | 18.8 | 18.5 | 20.1 | 19.4 | 20.3 | 20.1 |
The following table shows added value and net output for each industrial group and for all industries and an analysis of the 1964-65 totals according to the statistical areas in which the industries were carried on.
| Industry Group | 1964-65 | |
|---|---|---|
| Added Value | Net Output | |
| $(million) | ||
| Food | 144.5 | 100.9 |
| Beverages | 18.4 | 13.4 |
| Tobacco manufactures | 6.0 | 4.7 |
| Textiles | 40.2 | 29.1 |
| Footwear, other wearing apparel, and made-up textile goods | 55.5 | 45.8 |
| Wood and cork products (except furniture) | 59.4 | 44.1 |
| Furniture and fixtures | 18.4 | 15.3 |
| Paper and paper products | 55.6 | 34.2 |
| Printing, publishing, etc. | 52.3 | 39.5 |
| Leather and leather products (except footwear and apparel) | 6.1 | 4.9 |
| Rubber products | 18.6 | 13.9 |
| Chemicals and chemical products | 39.3 | 28.6 |
| Petroleum and coal products | 10.2 | 4.6 |
| Non-metallic mineral products n.e.i. | 47.6 | 30.8 |
| Basic metal manufactures | 6.6 | 5.1 |
| Metal products (except machinery and transport equipment) | 57.2 | 43.4 |
| Machinery (except electrical) | 52.6 | 42.3 |
| Electrical machinery and appliances | 35.8 | 28.2 |
| Transport equipment | 92.1 | 74.1 |
| Miscellaneous products | 24.7 | 19.0 |
| Totals | 841.2 | 621.8 |
The analysis for 1964-65 by statistical areas now follows.
| Industry Group | Northland | Central Auckland | South Auckland - South Auckland - Bay of Plenty | East Coast | Hawke's Bay | Taranaki | Wellington |
|---|---|---|---|---|---|---|---|
| Added Value 1964-65 | |||||||
| $(000) | |||||||
| Food | 3,854 | 33,348 | 17,262 | 3,504 | 12,310 | 10,598 | 18,398 |
| Beverages | 114 | 6,780 | 1,590 | 294 | 952 | 358 | 2,972 |
| Tobacco manufactures | - | * | - | - | * | - | * |
| Textiles | * | 11,674 | 148 | * | 982 | * | 9,490 |
| Footwear, other wearing apparel, and made-up textile goods | 224 | 25,920 | 2,024 | 156 | 710 | 1,612 | 11,478 |
| Wood and cork products (except furniture) | 1,352 | 8,502 | 24,932 | 378 | 1,414 | 1,582 | 5,956 |
| Furniture and fixtures | 56 | 9,920 | 834 | 26 | 598 | 178 | 3,118 |
| Paper and paper products | - | 11,860 | 33,948 | * | * | * | 5,678 |
| Printing, publishing, etc. | 600 | 17,648 | 3,032 | 500 | 1,866 | 1,096 | 14,448 |
| Leather and leather products (except footwear and apparel) | * | 3,054 | * | 34 | 68 | * | 692 |
| Rubber products | 182 | 4,752 | 600 | * | * | 114 | 4,420 |
| Chemicals and chemical products | * | 12,112 | 3,498 | * | 1,332 | 2,378 | 12,376 |
| Petroleum and coal products | * | 1,532 | 252 | - | * | 40 | 1,392 |
| Non-metallic mineral products n.e.i. | 6,646 | 14,764 | 3,406 | 198 | 1,164 | 408 | 4,460 |
| Basic metal manufactures | * | 2,256 | 128 | - | * | * | 1,100 |
| Metal products (except machinery and transport equipment) | 174 | 31,098 | 1,546 | 38 | 786 | 396 | 12,694 |
| Machinery (except electrical) | 934 | 19,212 | 5,826 | 216 | 1,858 | 1,646 | 10,098 |
| Electrical machinery and appliances | * | 15,140 | 1,230 | - | 572 | * | 9,590 |
| Transport equipment | 1,810 | 19,316 | 9,830 | 1,060 | 2,824 | 2,536 | 31,494 |
| Miscellaneous products | 6,702 | 12,794 | 1,730 | 1,122 | 3,316 | 2,182 | 9,856 |
| Totals | 22,646 | 261,680 | 111,818 | 7,528 | 30,750 | 25,122 | 169,716 |
| Industry Group | Marlborough | Nelson | Westland | Canterbury | Otago | Southland | Total |
|---|---|---|---|---|---|---|---|
* To avoid disclosure of details of individual establishments, figures have been included in Miscellaneous products. † Net total without figures from other groups to avoid disclosure of details. | |||||||
| Added Value 1964-65 | |||||||
| $(000) | |||||||
| Food | 898 | 2,336 | 114 | 17,874 | 12,464 | 11,514 | 144,472 |
| Beverages | * | 306 | * | 3,138 | 1,560 | * | 18,408 |
| Tobacco manufactures | - | - | - | - | - | - | 6,008 |
| Textiles | * | 80 | - | 10,628 | 5,534 | 366 | 40,176 |
| Footwear, other wearing apparel, and made-up textile goods | 320 | 120 | * | 10,346 | 2,236 | 158 | 55,480 |
| Wood and cork products (except furniture) | 332 | 2,210 | 2,124 | 6,344 | 1,930 | 2,302 | 59,360 |
| Furniture and fixtures | 40 | 112 | 16 | 2,506 | 766 | 238 | 18,410 |
| Paper and paper products | - | * | - | 1,658 | 510 | 1,518 | 55,650 |
| Printing, publishing, etc. | 312 | 530 | 236 | 6,846 | 4,026 | 1,196 | 52,334 |
| Leather and leather products (except footwear and apparel) | - | - | - | 1,302 | 708 | 180 | 6,120 |
| Rubber products | * | * | * | 8,024 | 128 | * | 18,570 |
| Chemical and chemical products | * | 634 | - | 3,398 | 2,170 | 1,092 | 39,304 |
| Petroleum and coal products | - | - | - | 344 | 114 | - | 10,240 |
| Non-metallic mineral products n.e.i. | 178 | 4,656 | 118 | 6,178 | 3,338 | 2,116 | 47,636 |
| Basic metal manufactures | - | * | - | 922 | 270 | * | 6,602 |
| Metal products (except machinery and transport equipment) | * | 456 | 62 | 6,228 | 3,026 | 612 | 57,156 |
| Machinery (except electrical) | 282 | 304 | 210 | 8,036 | 2,426 | 1,570 | 52,618 |
| Electrical machinery and appliances | - | 30 | - | 6,788 | 2,370 | * | 35,820 |
| Transport equipment | 816 | 1,938 | 510 | 12,712 | 4,192 | 3,104 | 92,138 |
| Miscellaneous products | 536 | 152 | 444 | 2,950 | 376 | 232 | 24,726† |
| Totals | 3,712 | 13,860 | 3,834 | 116,220 | 48,144 | 26,200 | 841,230 |
A final table on added value and net output for 1964-65 classifies factories into several added value and net output groupings, giving a general picture of size distribution. development of factory production in New Zealand is clearly portrayed in the following diagram, which also shows the relationship between cost of materials, added value, and value of production.
| Group | Establishments | Persons Engaged | Salaries and Wages Paid | Cost of Materials Used | Value of Production | Added Value | Net Output | ||
|---|---|---|---|---|---|---|---|---|---|
| Total | Per Person Engaged | Total | Per Person Engaged | ||||||
| Added Value $ | Number | Number | $(m) | $(m) | $(m) | $(m) | $ | (m) | $ |
| Under 5,000 | 501 | 1,245 | 1.9 | 3.9 | 5.3 | 1.4 | 1,102 | ... | ... |
| 5,000- 9,999 | 1,402 | 4,499 | 7.4 | 12.6 | 23.2 | 10.6 | 2,350 | ... | .... |
| 10,000- 19,999 | 2,326 | 12,533 | 21.9 | 39.5 | 73.5 | 34.0 | 2,712 | ... | ... |
| 20,000- 29-999 | 1,309 | 11,166 | 19.5 | 38.9 | 71.0 | 32.2 | 2,880 | ... | ... |
| 30,000- 39,999 | 890 | 10,283 | 18.1 | 39.5 | 70.3 | 30.7 | 2,988 | ... | ... |
| 40,000- 99,999 | 1,941 | 36,889 | 66.3 | 204.9 | 325.7 | 120.8 | 3,276 | ... | ... |
| 100,000- 199,999 | 683 | 26,969 | 48.3 | 191.3 | 287.3 | 96.0 | 3,560 | ... | ... |
| 200,000- 499,999 | 434 | 31,353 | 60.1 | 189.6 | 319.5 | 129.9 | 4,144 | ... | ... |
| 500,000- 999,999 | 140 | 23,415 | 46.8 | 123.5 | 221.4 | 97.9 | 4,180 | ... | ... |
| 1,000,000-1,999,999 | 82 | 25,381 | 55.4 | 200.0 | 319.7 | 119.7 | 4,716 | ... | ... |
| 2,000,000-4,999,999 | 39 | 21,252 | 50.2 | 202.1 | 316.7 | 114.6 | 5,392 | ... | ... |
| 5,000,000 and over | 6 | 6,065 | 16.1 | 89.5 | 143.1 | 53.6 | 8,830 | ... | ... |
| Totals | 9,753 | 211,050 | 412.0 | 1,335.4 | 2,176.6 | 841.2 | 3,986 | ... | ... |
| Net Output $ | |||||||||
| Under 5,000 | 989 | 3,009 | 4.8 | 9.2 | 14.3 | ... | ... | 2.5 | 826 |
| 5,000- 9,999 | 1,723 | 6,716 | 11.4 | 21.6 | 39.0 | ... | ... | 12.9 | 1,920 |
| 10,000- 19,999 | 2,364 | 15,241 | 27.2 | 61.0 | 106.1 | ... | ... | 34.1 | 2,236 |
| 20,000- 29,999 | 1,265 | 13,381 | 23.6 | 61.1 | 101.6 | ... | ... | 31.2 | 2,328 |
| 30,000- 39,999 | 754 | 10,939 | 19.4 | 60.3 | 94.5 | ... | ... | 26.1 | 2,386 |
| 40,000- 99,999 | 1,582 | 37,041 | 66.9 | 257.0 | 383.2 | ... | ... | 95.6 | 2,580 |
| 100,000- 199,999 | 554 | 27,316 | 50.0 | 147.8 | 248.1 | ... | ... | 77.5 | 2,836 |
| 200,000- 499,999 | 324 | 30,618 | 59.1 | 155.0 | 283.1 | ... | ... | 96.9 | 3,166 |
| 500,000- 999,999 | 107 | 24,114 | 48.4 | 138.4 | 238.7 | ... | ... | 74.0 | 3,068 |
| 1,000,000-1,999,999 | 66 | 24,626 | 56.9 | 224.2 | 356.2 | ... | ... | 92.3 | 3,746 |
| 2,000,000-4,999,999 | 22 | 15,207 | 36.4 | 169.0 | 245.3 | ... | ... | 57.6 | 3,790 |
| 5,000,000 and over | 3 | 2,842 | 8.0 | 30.9 | 66.4 | ... | ... | 21.3 | 7,480 |
| Totals | 9,753 | 211,050 | 412.0 | 1,335.4 | 2,176.6 | ... | ... | 621.8 | 2,946 |
The development of factory production in New Zealand is clearly portrayed in the following diagram, which also shows the relationship between cost of materials, added value, and value of production.
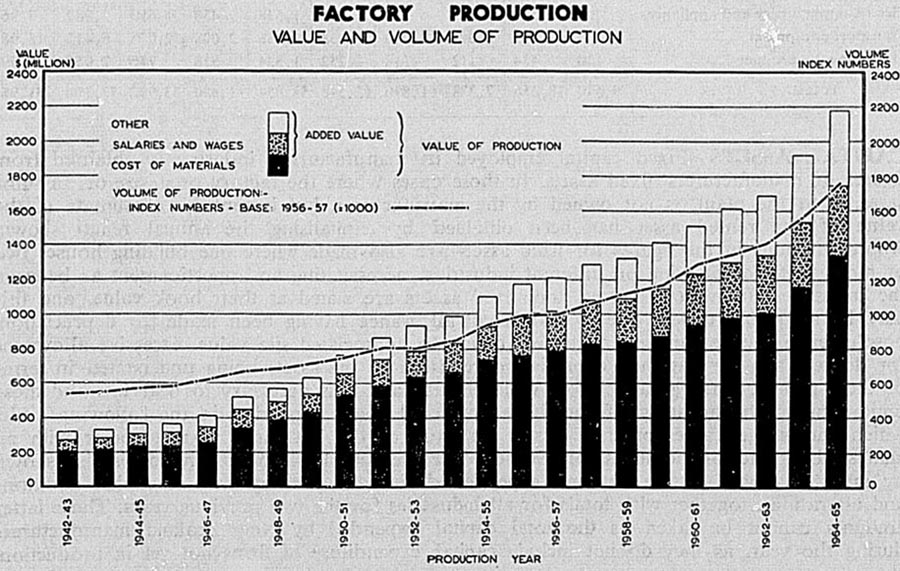
FACTORY PRODUCTION
VALUE AND VOLUME OF PRODUCTION
EXPENSES OF OPERATION—Total operating costs of factories for the year 1964-65 amounted to $1,979 million, of which salaries and wages accounted for $412 million, cost of materials for $1,335 million, and other expenses for $232 million, while value of production totalled $2,177 million.
The table below shows the principal items comprised in the figure for expenses of operation, other than salaries and wages and cost of materials, by industry groups for the year 1964-65.
| Industry Group | Coal | Electricity | Coke, Gas, Oils, etc. | Insurance | Interest on Loans, etc. | Depreciation | Rent | Repairs and Maintenance | Other | Total |
|---|---|---|---|---|---|---|---|---|---|---|
| $(000) | ||||||||||
| Food | 4,476 | 4,180 | 1,758 | 2,236 | 2,088 | 10,530 | 1,096 | 8,368 | 10,910 | 45,640 |
| Beverages | 126 | 300 | 224 | 232 | 362 | 1,594 | 138 | 660 | 1,778 | 5,414 |
| Tobacco manufactures | - | 36 | 26 | 84 | 152 | 444 | 4 | 206 | 514 | 1,466 |
| Textiles | 398 | 714 | 342 | 512 | 610 | 3,072 | 484 | 2,272 | 3,326 | 11,732 |
| Footwear, other wearing apparel, and made-up textile goods | 16 | 562 | 98 | 458 | 634 | 1,644 | 1,910 | 1,088 | 3,914 | 10,324 |
| Wood and cork products (except furniture) | 6 | 1,232 | 320 | 1,354 | 920 | 2,708 | 556 | 3,214 | 5,860 | 16,170 |
| Furniture and fixtures | - | 218 | 20 | 320 | 232 | 540 | 486 | 388 | 1,138 | 3,344 |
| Paper and paper products | 1,144 | 3,370 | 940 | 958 | 2,012 | 6,658 | 452 | 3,400 | 4,524 | 23,458 |
| Printing, publishing, etc. | 4 | 514 | 104 | 478 | 426 | 3,236 | 764 | 1,154 | 6,594 | 13,274 |
| Leather and leather products (except footwear and apparel) | 58 | 96 | 36 | 94 | 58 | 228 | 118 | 216 | 368 | 1,272 |
| Rubber products | 184 | 458 | 194 | 240 | 112 | 1,212 | 144 | 514 | 1,700 | 4,760 |
| Chemicals and chemical products | 188 | 724 | 314 | 536 | 516 | 2,958 | 264 | 2,150 | 3,544 | 11,192 |
| Petroleum and coal products | 2 | 290 | 116 | 122 | 412 | 3,032 | 58 | 626 | 1,436 | 6,090 |
| Non-metallic mineral products n.e.i. | 2,886 | 1,458 | 1,348 | 652 | 486 | 3,964 | 214 | 3,222 | 3,122 | 17,350 |
| Basic metal manufactures | 2 | 182 | 148 | 86 | 124 | 310 | 78 | 164 | 510 | 1,602 |
| Metal products (except machinery and transport equipment) | 16 | 1,202 | 428 | 796 | 1,042 | 3,440 | 996 | 1,626 | 5,208 | 14,756 |
| Machinery (except electrical) | 8 | 664 | 304 | 822 | 842 | 2,238 | 748 | 1,322 | 4,248 | 11,192 |
| Electrical machinery and appliances | 6 | 552 | 182 | 330 | 334 | 1,578 | 430 | 610 | 3,942 | 7,962 |
| Transport equipment | 4 | 1,072 | 324 | 1,260 | 938 | 2,936 | 2,008 | 2,036 | 8,412 | 18,988 |
| Miscellaneous products | 20 | 434 | 112 | 318 | 252 | 1,534 | 518 | 746 | 2,058 | 5,990 |
| Totals | 9,540 | 18,256 | 7,338 | 11,890 | 12,548 | 53,854 | 11,470 | 33,982 | 73,104 | 231,982 |
CAPITAL ASSETS—Fixed capital employed in manufacturing industry is obtained from figures of manufacturers' fixed assets. In those cases where the factory premises, or, in some cases, even the plant, is not owned by the manufacturer, but is rented, an estimate of the value of the rented asset has been obtained by capitalising the annual rental shown. Approximations in the figures for fixed assets are also made where one building houses two or more factories carrying on different industries, necessitating an apportionment as between the industries. In most instances, too, fixed assets are stated at their book value, and this may be an overstatement due to insufficient allowance having been made for depreciation, obsolescence, etc., or an understatement owing to appreciated site value, excessive allowance for depreciation, or currency depreciation resulting in the assets being understated in terms of their present earning capacity or replacement cost. It is necessary to bear in mind these limitations to the accuracy of the figures of fixed assets appearing in the following table, which shows the values of these assets for each of the last three years together with an analysis by principal industries for 1964-65. For the year 1964-65 information is also shown by industry groups of the amounts expended during the year by way of capital additions and alterations, together with totals for all industries for the two previous years. These latter amounts cannot be taken as the total capital expended by New Zealand manufacturers during the year, as they do not include capital expenditure of firms not yet in production.
| Industry Group | Capital Additions and Alterations During the Year | Value at End of Year (Including Estimated Value of Rented Assets | ||||
|---|---|---|---|---|---|---|
| Land and Buildings | Plant and Machinery | Total | Land and Buildings | Plant and Machinery | Total | |
| $(000) | ||||||
| Totals— | ||||||
| 1962-63 | 32,296 | 66,450 | 98,744 | 394,312 | 240,408 | 634,720 |
| 1963-64 | 27,926 | 49,316 | 77,244 | 426,616 | 247,306 | 673,922 |
| 1964-65— | ||||||
| Food | 8,866 | 14,034 | 22,900 | 100,358 | 57,280 | 157,638 |
| Beverages | 1,894 | 1,240 | 3,134 | 14,004 | 7,832 | 21,836 |
| Tobacco manufactures | 124 | 872 | 996 | 1,658 | 2,444 | 4,102 |
| Textiles | 1,220 | 4,286 | 5,506 | 19,534 | 14,280 | 33,814 |
| Footwear, other wearing apparel, and made-up textile goods | 1,078 | 1,722 | 2,800 | 30,244 | 10,986 | 41,230 |
| Wood and cork products (except furniture) | 1,272 | 2,922 | 4,194 | 22,912 | 16,178 | 39,090 |
| Furniture and fixtures | 428 | 632 | 1,060 | 11,532 | 2,618 | 14,150 |
| Paper and paper products | 946 | 4,174 | 5,120 | 31,012 | 37,958 | 68,970 |
| Printing, publishing, etc. | 1,286 | 4,464 | 5,750 | 25,050 | 18,874 | 43,924 |
| Leather and leather products (except footwear and apparel) | 248 | 256 | 504 | 3,278 | 1,022 | 4,300 |
| Rubber products | 526 | 1,732 | 2,258 | 6,076 | 4,570 | 10,646 |
| Chemicals and chemical products | 2,330 | 3,930 | 6,260 | 26,274 | 14,318 | 40,592 |
| Petroleum and coal products | 170 | 906 | 1,076 | 4,830 | 12,272 | 17,102 |
| Non-metallic mineral products n.e.i. | 2,006 | 6,970 | 8,976 | 20,978 | 21,608 | 42,586 |
| Basic metal manufactures | 270 | 504 | 774 | 3,336 | 1,876 | 5,212 |
| Metal products (except machinery and transport equipment) | 2,058 | 4,214 | 6,272 | 32,010 | 38,190 | 50,200 |
| Machinery (except electrical) | 1,592 | 2,890 | 4,482 | 25,822 | 10,756 | 36,578 |
| Electrical machinery and appliances | 1,712 | 1,836 | 3,548 | 15,388 | 5,430 | 20,818 |
| Transport equipment | 4,536 | 3,040 | 7,576 | 62,450 | 12,458 | 74,908 |
| Miscellaneous products | 716 | 1,882 | 2,598 | 13,198 | 6,408 | 19,606 |
| Totals, 1964-65 | 33,280 | 62,510 | 95,788 | 469,942 | 277,356 | 747,298 |
MANUFACTURERS' STOCKS—A quarterly survey of manufacturers' stocks has been conducted by the Department of Statistics since 1957. The survey is carried out on a sample basis, the selection representing approximately 12 1/2 percent of all the factories covered by the annual census of factory production. The survey is based on a sample of 1,050 factories selected from the 1959-60 Census of Manufacturing and allowance is made in the sampling procedures for the opening of new factories and the closing of established factories since the 1959-60 census. The combined stocks of manufacturers in the sample represent approximately 75 percent of the total manufacturers' stocks at the 1959-60 census, and appropriate estimation methods are used to derive statistics for the industry as a whole.
The following table compares in summary form the results of the quarterly surveys. In presenting the results, the chief seasonal industries—meat processing and dairy products manufacture—have been segregated to assist in the interpretation of movements in stock holdings. The heading “Materials” includes work in progress, fuel, and miscellaneous supplies.
| Total Stocks | Movement of Stocks at Annual Intervals | Percentage Movements in Stocks at Annual Intervals | |||||||
|---|---|---|---|---|---|---|---|---|---|
| Materials | Finished Goods | Total | Materials | Finished Goods | Total | Materials | Finished Goods | Total | |
| Including Primary Produce Processing Industries | $(000) | $(000) | $(000) | $(000) | $(000) | $(000) | percent | percent | percent |
| 31 March 1961 | 194,568 | 112,356 | 306,926 | +18,304 | -2,110 | +16,196 | +10.4 | -1.8 | +5.6 |
| 31 March 1962 | 189,002 | 119,712 | 308,714 | -5,566 | +7,356 | +1,788 | -2.9 | +6.5 | +0.6 |
| 31 March 1963 | 191,690 | 121,592 | 313,282 | +2,688 | +1,880 | +4,568 | +1.4 | +1.6 | +1.5 |
| 31 March 1964 | 208,106 | 140,876 | 348,984 | +16,416 | +19,284 | +35,702 | +8.6 | +15.9 | +11.4 |
| 31 March 1965 | 214,092 | 154,920 | 369,014 | +5,986 | +14,044 | +20,030 | +2.9 | +10.0 | +5.7 |
| 30 June 1965 | 221,662 | 150,086 | 371,748 | +15,902 | +17.380 | +33,282 | +7.7 | +13.1 | +9.8 |
| 30 September 1965 | 228,530 | 144,164 | 372,694 | +16,350 | +21,962 | +38,312 | +7.7 | +18.0 | +11.5 |
| 31 December 1965 | 230,888 | 164,194 | 395,082 | +21,326 | +27.896 | +49,222 | +10.2 | +20.5 | +14.2 |
| 31 March 1966 | 243,888 | 178,578 | 422,466 | +29,796 | +23,658 | +53,452 | +13.9 | +15.3 | +14.5 |
| 30 June 1966 | 250,388 | 185,670 | 436,058 | +28,726 | +35,584 | +64,310 | +13.0 | +23.7 | +17.3 |
| 30 September 1966 | 252,102 | 159,580 | 411,682 | +23,572 | +15,416 | +38,988 | +10.3 | +10.7 | +10.5 |
| 31 December 1966 | 251,746 | 171,160 | 422,906 | +20,858 | +6,966 | +27,824 | +9.0 | +4.2 | +7.0 |
| Excluding Primary Produce Processing Industries | |||||||||
| 31 March 1961 | 179,846 | 59,420 | 239,268 | +16,906 | +2,394 | +19,302 | +10.4 | +4.2 | +8.8 |
| 31 March 1962 | 177,306 | 64,204 | 241,508 | -2,540 | +4,784 | +2,240 | -1.4 | +8.1 | +0.9 |
| 31 March 1963 | 180,348 | 70,098 | 250,446 | +3.042 | +5,894 | +8,938 | +1.7 | +9.2 | +3.7 |
| 31 March 1964 | 196,730 | 78,104 | 274,832 | +16,382 | +8,006 | +24,386 | +9.1 | +11.4 | +9.7 |
| 31 March 1965 | 202,714 | 87,486 | 290,200 | +5,984 | +9,382 | +15,368 | +3.0 | +12.3 | +5.6 |
| 30 June 1965 | 210,260 | 90,800 | 301,060 | +15,312 | +9,528 | +24,840 | +7.9 | +11.7 | +9.0 |
| 30 September 1965 | 216,940 | 99,544 | 316,486 | +16,146 | +10,870 | +27,018 | +8.0 | +12.3 | +9.3 |
| 31 December 1965 | 219,528 | 94,230 | 313,758 | +21,758 | +10,676 | +32,434 | +11.0 | +12.8 | +11.5 |
| 31 March 1966 | 232,874 | 94,634 | 327,508 | +30,160 | +7,148 | +37,308 | +14.9 | +8.2 | +12.9 |
| 30 June 1966 | 239,598 | 100,606 | 340,204 | +29,338 | +9,806 | +39,144 | +14.0 | +10.8 | +13.0 |
| 30 September 1966 | 238,988 | 111,712 | 350,700 | +22,048 | +12,168 | +34,214 | +10.2 | +12.2 | +10.8 |
| 31 December 1966 | 238,118 | 107,790 | 345,908 | +18,590 | +13,560 | +32,150 | +7.8 | +14.4 | +10.2 |
More detailed information on stocks is given in the next table showing by industry groups comparative stock figures at the end of December.
| Industry Group | Stocks at 31 December | Increase or Decrease in Stocks December 1965 to December 1966 | |||||||
|---|---|---|---|---|---|---|---|---|---|
| 1965 | 1966 | ||||||||
| Materials | Finished Goods | Total | Materials | Finished Goods | Total | Materials | Finished Goods | Total | |
| $(000) | |||||||||
| Primary Produce Processing Industries | |||||||||
| Meat freezing, ham, bacon, and casings | 8,936 | 44,990 | 53,924 | 10,160 | 38,964 | 49,124 | +1,224 | -6,026 | -4,800 |
| Dairy | 2,424 | 24,974 | 27,398 | 3,466 | 24,408 | 27,874 | +1,042 | -566 | +476 |
| Totals | 11,360 | 69,964 | 81,322 | 13,628 | 63,370 | 76,998 | +2,268 | -6,594 | -4,324 |
| Other food | 14,646 | 12,402 | 27,048 | 16,094 | 13,730 | 29,824 | +1,448 | +1,328 | +2,776 |
| Beverages | 2,596 | 5,180 | 7,774 | 2,522 | 5,136 | 7,658 | -74 | -44 | -116 |
| Tobacco manufactures | 12,958 | - | 12,958 | 13,288 | - | 13,288 | +330 | - | +330 |
| Textiles | 21,292 | 7,180 | 28,474 | 21,124 | 7,106 | 28,228 | -168 | -74 | -246 |
| Clothing | 12,782 | 7,354 | 20,134 | 12,878 | 7,660 | 20,538 | +96 | +306 | +404 |
| Footwear | 2,824 | 846 | 3,670 | 3,160 | 872 | 4,032 | +336 | +26 | +362 |
| Wood manufactures | 9,254 | 10,728 | 19,982 | 9,828 | 14,742 | 24,572 | +574 | +4,014 | +4,590 |
| Furniture and fixtures | 5,360 | 1,206 | 6,566 | 5,526 | 1,118 | 6,644 | +166 | -88 | +78 |
| Paper and products | 14,602 | 5,332 | 19,934 | 14,076 | 5,502 | 19,578 | -526 | +170 | -356 |
| Printing, publishing | 11,402 | 1,602 | 13,004 | 11,700 | 1,886 | 13,586 | +298 | +284 | +582 |
| Leather and products | 2,216 | 488 | 2,704 | 2,410 | 520 | 2,930 | +194 | +32 | +226 |
| Rubber products | 4,752 | 4,078 | 8,830 | 4,968 | 4,112 | 9,080 | +216 | +34 | +250 |
| Chemicals and products | 15,176 | 13,144 | 28,320 | 16,416 | 14,840 | 31,256 | +1,240 | +1,696 | +2,936 |
| Petroleum, coal products | 1,910 | 758 | 2,668 | 2,276 | 902 | 3,178 | +366 | +144 | +510 |
| Non-metallic mineral products | 7,684 | 6,682 | 14,366 | 8,390 | 8,018 | 16,408 | +706 | +1,336 | +2,042 |
| Basic metal products | 2,384 | 510 | 2,894 | 2,036 | 534 | 2,568 | -348 | +24 | -326 |
| Metal products | 16,826 | 5,022 | 21,848 | 19,414 | 5,366 | 24,780 | +2,588 | +344 | +2,932 |
| Machinery | 18,896 | 3,762 | 22,656 | 23,926 | 6,470 | 30,396 | +5,030 | +2,708 | +7,740 |
| Electrical products | 13,140 | 3,622 | 16,760 | 13,838 | 3,634 | 17,472 | +698 | +12 | +712 |
| Transport equipment | 23,770 | 2,304 | 26,074 | 29,152 | 3,684 | 32,836 | +5,382 | +1,380 | +6,762 |
| Miscellaneous | 5,062 | 2,030 | 7,092 | 5,090 | 1,962 | 7,052 | +28 | -68 | 40 |
| Totals | 219,528 | 94,230 | 313,758 | 238,118 | 107,790 | 345,908 | +18,590 | +13,560 | +32,150 |
| Grand totals, all manufacturing industries | 230,888 | 164,194 | 395,080 | 251,746 | 171,160 | 422,906 | +20,858 | +6,966 | +27,826 |
ORGANISATION OF INDUSTRY—New Zealand's industrial progress has been fairly rapid, but industry is as yet organised on a relatively small scale.
The law in New Zealand restricts the membership of a partnership to not more than 25 persons, a private company to not fewer than two or more than 25 persons, and a public company to not fewer than seven persons. Co-operation is characteristic of certain industries engaged in the processing of primary products, mainly butter and cheese manufacturing.
Information as to the character of organisation of the establishments engaged in factory production during 1964-65 is given in the following table.
| Character of Organisation | Number of Establishments | Persons Engaged | Salaries and Wages Paid | Cost of Materials Used or Operated Upon | Value of Manufactures or Products | Added Value | Net Output | ||
|---|---|---|---|---|---|---|---|---|---|
| Total | Per Establishment | Total | Per Establishment | ||||||
| Number | $(000) | $(000) | $(000) | $(000) | $ | $(000) | $ | ||
| Private registered company | 6,911 | 132,335 | 252,822 | 680,526 | 1,179,032 | 498,506 | 72,132 | 383,558 | 55,500 |
| Public registered company | 884 | 63,831 | 130,766 | 421,984 | 709,190 | 287,206 | 324,894 | 199,774 | 225,988 |
| Individual | 1,053 | 4,581 | 7,652 | 11,856 | 23,978 | 12,122 | 11,512 | 9,950 | 9,450 |
| Partnership | 504 | 2,891 | 5,178 | 8,772 | 18,168 | 9,396 | 18,642 | 7,462 | 14,806 |
| Cooperative association | 292 | 4,392 | 9,360 | 206,280 | 231,098 | 24,818 | 84,994 | 13,890 | 47,568 |
| Local authority and State | 109 | 3,020 | 6,216 | 5,984 | 15,168 | 9,184 | 84,256 | 7,158 | 65,670 |
| Totals | 9,753 | 211,050 | 411,992 | 1,335,402 | 2,176,634 | 841,230 | 86,254 | 621,796 | 63,754 |
As would be expected, the average size of establishments operated by public registered companies is larger than in any other type of industrial organisation, the added value per unit being much greater than that for private registered companies. Private companies, however, occupy a very high place, both numerically and in the share they contribute to the added value created in New Zealand factories (59.3 percent in 1964-65, as compared with 34.1 percent in the case of public companies).
Since 1951-52, the first year of the new series, private and public registered companies have increased their combined share of added value from 87.8 percent to 93.4 percent. In 1964-65 the share of added value accruing to public companies was 34.1 percent, compared with 34.7 percent in 1951-52, but over the same period private companies increased their share from 53.1 percent to 59.3 percent. All other types of organisations have had a decreased share of added value.
VALUE AND VOLUME INDICES OF MANUFACTURING INDUSTRIES—Below is a table giving index numbers of added value, net output, value of production, and volume of production based on the year 1938-39. This table commences with the year 1928-29 and runs through to 1950-51, at which stage a new series was commenced.
| Production Year | Index Numbers of—Base: 1938-39 (= 100) | |||
|---|---|---|---|---|
| Value Added in Manufacture | Net Output (Net Value Added) | Value of Production | Volume of Production | |
| 1928-29 | 80 | .. | 79 | 71 |
| 1929-30 | 83 | .. | 79 | 74 |
| 1930-31 | 75 | 69 | 68 | 69 |
| 1931-32 | 62 | 55 | 58 | 60 |
| 1932-33 | 60 | 53 | 58 | 63 |
| 1933-34 | 64 | 57 | 63 | 65 |
| 1934-35 | 70 | 63 | 69 | 74 |
| 1935-36 | 77 | 70 | 79 | 81 |
| 1936-37 | 90 | 85 | 93 | 92 |
| 1937-38 | 99 | 95 | 99 | 97 |
| 1938-39 | 100 | 100 | 100 | 100 |
| 1939-40 | 113 | 114 | 113 | 110 |
| 1940-41 | 125 | 127 | 129 | 114 |
| 1941-42 | 137 | 141 | 136 | 116 |
| 1942-43 | 151 | 157 | 145 | 120 |
| 1943-44 | 162 | 168 | 154 | 125 |
| 1944-45 | 173 | 181 | 166 | 129 |
| 1945-46 | 185 | 194 | 171 | 131 |
| 1946-47 | 205 | 217 | 191 | 140 |
| 1947-48 | 233 | 244 | 238 | 151 |
| 1948-49 | 252 | 264 | 263 | 155 |
| 1949-50 | 285 | 297 | 290 | 164 |
| 1950-51 | 311 | 321 | 345 | 172 |
With the reclassification in 1951-52 a new series of index numbers was commenced and these are shown below. It should be realised in comparing the two series of index numbers that the latter excludes the activities of three important industries. These are the logging operations of sawmillers, previously included in the sawmilling industry, and the generation and supply of gas and electricity. However, the effect of the exclusion of these industries entirely from the newer series is not great, as the two series in the overlapping period recorded very similar movements.
| Production Year | Index Numbers of—Base: 1956-57 (= 1000) | |||
|---|---|---|---|---|
| Value Added in Manufacture | Net Output (Net Value Added) | Value of Production | Volume of Production | |
| 1949-50 | 494 | 529 | 527 | 721 |
| 1950-51 | 547 | 571 | 632 | 754 |
| 1951-52 | 677 | 731 | 716 | 806 |
| 1952-53 | 700 | 742 | 771 | 800 |
| 1953-54 | 784 | 825 | 823 | 848 |
| 1954-55 | 895 | 927 | 915 | 941 |
| 1955-56 | 971 | 980 | 973 | 994 |
| 1956-57 | 1,000 | 1,000 | 1,000 | 1,000 |
| 1957-58 | 1,096 | 1,093 | 1,071 | 1,070 |
| 1958-59 | 1,163 | 1,158 | 1,095 | 1,130 |
| 1959-60 | 1,287 | 1,312 | 1,172 | 1,169 |
| 1960-61 | 1,387 | 1,409 | 1,257 | 1,283 |
| 1961-62 | 1,536 | 1,568 | 1,340 | 1,349 |
| 1962-63 | 1,631 | 1,651 | 1,396 | 1,410 |
| 1963-64 | 1,843 | 1,892 | 1,598 | 1,557 |
| 1964-65 | 2,031 | 2,070 | 1,808 | 1,759 |
The table which follows sets out, by industry groups, index numbers of value of production, added value, net output, and volume of production. It is not possible to arrive at volume of production index numbers for all the groups, for technical reasons, and consequently some have been omitted, but the total index number for the year is calculated in such a way as to include the groups which cannot be assessed separately.
| INDEX NUMBERS OF VALUE OF FACTORY PRODUCTION, VALUE ADDED, NET OUTPUT AND VOLUME OF PRODUCTION, BASE 1956-57 (=1000) | ||||||||
|---|---|---|---|---|---|---|---|---|
| Industry Group | Value of Production | Value Added | Net Output | Volume of Production | ||||
| 1963-64 | 1964-65 | 1963-64 | 1964-65 | 1963-64 | 1964-65 | 1963-64 | 1964-65 | |
* Indices not available for the groups, but allowed for in compiling total index. | ||||||||
| Food | 1,329 | 1,447 | 1,730 | 1,670 | 1,835 | 1,694 | 1,360 | 1,379 |
| Beverages | 1,599 | 1,684 | 1,790 | 1,855 | 1,938 | 2,027 | 1,270 | 1,351 |
| Tobacco manufactures | 1,581 | 1,516 | 1,864 | 1,796 | 1,876 | 1,878 | 1,660 | 1,598 |
| Textiles | 1,884 | 1,998 | 2,029 | 2,340 | 2,037 | 2,363 | 1,948 | 2,395 |
| Footwear, other wearing apparel, and made-up textile goods | 1,429 | 1,514 | 1,539 | 1,616 | 1,517 | 1,590 | 1,297 | 1,368 |
| Wood and cork products (except furniture) | 1,519 | 1,734 | 1,464 | 1,707 | 1,518 | 1,798 | 1,205 | 1,342 |
| Furniture and fixtures | 1,653 | 1,868 | 1,634 | 1,850 | 1,596 | 1,816 | * | * |
| Paper and paper products | 2,136 | 2,282 | 2,213 | 2,329 | 2,860 | 3,150 | 2,141 | 2,321 |
| Printing, publishing, etc. | 1,730 | 1,877 | 1,795 | 1,966 | 1,785 | 1,934 | 1,631 | 1,740 |
| Leather and leather products (except footwear and apparel) | 1,614 | 1,749 | 1,958 | 2,029 | 2,011 | 2,056 | 1,431 | 1,600 |
| Rubber products | 1,385 | 1,507 | 1,667 | 1,846 | 1,767 | 1,949 | 1,485 | 1,600 |
| Chemicals and chemical products | 1,645 | 1,848 | 1,907 | 2,073 | 1,996 | 2,135 | 1,605 | 1,766 |
| Petroleum and coal products | 2,412 | 8,673 | 2,360 | 6,818 | 2,389 | 4,553 | * | * |
| Non-metallic mineral products n.e.i. | 1,709 | 1,929 | 1,767 | 1,985 | 1,859 | 2,119 | 1,604 | 1,760 |
| Basic metal manufactures | 1,959 | 2,347 | 2,143 | 2,488 | 2,236 | 2,543 | * | * |
| Metal products (except machinery and transport equipment) | 2,185 | 2,726 | 2,319 | 2,813 | 2,220 | 2,689 | * | * |
| Machinery (except electrical) | 1,653 | 2,024 | 1,937 | 2,363 | 1,920 | 2,370 | * | * |
| Electrical machinery and appliances | 3,086 | 3,947 | 3,125 | 3,953 | 3,201 | 4,051 | 2,678 | 3,462 |
| Transport equipment | 1,703 | 1,929 | 1,700 | 1,852 | 1,701 | 1,834 | * | * |
| Miscellaneous products | 3,098 | 3,627 | 3,435 | 4,116 | 3,396 | 4,171 | * | * |
| All Groups | 1,598 | 1,808 | 1,843 | 2,031 | 1,892 | 2,070 | 1,557 | 1,759 |
OVERTIME—Details of overtime worked in factories by wage-earning employees are summarised in the tables given, which show, by industry groups, the hours worked during the latest three years. The averages given are calculated on the basis of the total number of wage earners engaged irrespective of the number who actually worked overtime.
| Industry Group | Total overtime Worked by Wage Earners (Both Male and Female) | ||
|---|---|---|---|
| 1962-63 | 1963-64 | 1964-65 | |
| (000) | |||
| Food | 8,278 | 8,572 | 9,177 |
| Beverages | 441 | 475 | 466 |
| Tobacco manufactures | 238 | 244 | 230 |
| Textiles | 1,313 | 1,484 | 1,793 |
| Footwear, other wearing apparel, and made-up textile goods | 838 | 1,041 | 994 |
| Wood and cork products (except furniture) | 1,744 | 1,781 | 2,203 |
| Furniture and fixtures | 616 | 743 | 899 |
| Paper and paper products | 1,306 | 1,470 | 1,443 |
| Printing, publishing, etc. | 1,122 | 1,336 | 1,436 |
| Leather and leather products (except footwear and apparel) | 185 | 216 | 210 |
| Rubber products | 443 | 444 | 584 |
| Chemicals and chemical products | 868 | 995 | 1,144 |
| Petroleum and coal products | 72 | 74 | 99 |
| Non-metallic mineral products n.e.i. | 1,658 | 1,796 | 2,077 |
| Basic metal manufactures | 208 | 215 | 298 |
| Metal products (except machinery and transport equipment) | 2,336 | 2,389 | 3,064 |
| Machinery (except electrical) | 1,947 | 2,221 | 2,734 |
| Electrical machinery and appliances | 773 | 930 | 1,196 |
| Transport equipment | 2,703 | 3,109 | 3,879 |
| Miscellaneous products | 585 | 731 | 890 |
| Totals | 27,674 | 30,266 | 34,815 |
The next table shows, by industry groups, the hours of overtime worked during 1964-65 by males and females separately.
| Industry Group | Total Overtime Hours Worked by Wage Earners | Average Overtime Hours Worked by All Wage Earners | ||
|---|---|---|---|---|
| Males | Females | Males | Females | |
| (000) | (000) | |||
| Food | 8,645 | 531 | 334 | 120 |
| Beverages | 462 | 4 | 293 | 23 |
| Tobacco manufactures | 132 | 98 | 382 | 195 |
| Textiles | 1,422 | 371 | 249 | 68 |
| Footwear, other wearing apparel, and made-up textile goods | 443 | 551 | 95 | 28 |
| Wood and cork products (except furniture) | 2,197 | 6 | 188 | 33 |
| Furniture and fixtures | 865 | 34 | 203 | 70 |
| Paper and paper products | 1,293 | 149 | 291 | 100 |
| Printing, publishing, etc. | 1,248 | 188 | 149 | 94 |
| Leather and leather products (except footwear and apparel) | 168 | 42 | 177 | 60 |
| Rubber products | 567 | 16 | 248 | 35 |
| Chemicals and chemical products | 1,058 | 86 | 313 | 71 |
| Petroleum and coal products | 99 | 1 | 229 | 25 |
| Non-metallic mineral products n.e.i. | 2,042 | 34 | 314 | 75 |
| Basic metal manufactures | 297 | 1 | 285 | 44 |
| Metal products (except machinery and transport equipment) | 2,893 | 171 | 302 | 153 |
| Machinery (except electrical) | 2,698 | 37 | 251 | 114 |
| Electrical machinery and appliances | 1,034 | 162 | 214 | 69 |
| Transport equipment | 3,750 | 130 | 170 | 275 |
| Miscellaneous products | 786 | 105 | 261 | 55 |
| Totals | 32,097 | 2,718 | 244 | 62 |
SUMMARY OF OPERATIONS—The following table, by assembling data from previous pages, affords an analysis of production costs in 1964-65, together with the value of production for each industry group and for all industries. In addition, by virtue of the complete details collected annually of the cost structure of goods produced in manufacturing industries, it is possible to give information on the surplus available to manufacturers prior to payment of dividends, taxation, and other appropriations. The only exception occurs in the case of co-operative dairy companies, which do not purchase milk and cream in the way that other manufacturers purchase raw materials. They collect the milk and cream from their shareholders, process it, and pay out to these shareholders the whole of the profits of the sales of the products, less amounts paid to reserves. Manufacturing surplus shown by these companies is therefore confined to the amount of these transfers to reserves and any undistributed profits.
In quite a number of cases, articles produced are transferred at cost to separate selling departments and warehouses, or to retail stores run by the same company or establishment. Where this is apparent, the company concerned is asked to substitute a commercial value for its production. The same procedure holds where a company controls more than one factory, and transfers the products of one to the other for further processing. It must be recognised that estimated values have to be accepted in many transactions of this type.
| Industry Group | Production Costs | Value of Production | Manufacturing Surplus | |||
|---|---|---|---|---|---|---|
| Salaries and Wages | Cost of All Materials Used | Other Expenses of Operation | Total | |||
| $(000) | ||||||
| Food | 76,394 | 538,916 | 45,640 | 660,950 | 683,388 | 22,438 |
| Beverages | 4,950 | 16,510 | 5,414 | 26,872 | 34,918 | 8,046 |
| Tobacco manufactures | 1,700 | 12,400 | 1,466 | 15,566 | 18,408 | 2,842 |
| Textiles | 21,082 | 80,670 | 11,732 | 113,484 | 120,846 | 7,360 |
| Footwear, other wearing apparel, and made-up textile goods | 36,834 | 62,872 | 10,324 | 110,032 | 118,352 | 8,320 |
| Wood and cork products (except furniture) | 28,970 | 67,202 | 16,170 | 112,342 | 126,562 | 14,220 |
| Furniture and fixtures | 11,426 | 20,338 | 3,344 | 35,106 | 38,748 | 3,642 |
| Paper and paper products | 16,290 | 46,218 | 23,458 | 85,966 | 101,868 | 15,902 |
| Printing, publishing, etc. | 26,846 | 26,010 | 13,274 | 66,132 | 78,344 | 12,212 |
| Leather and leather products (except footwear and apparel) | 3,452 | 8,190 | 1,272 | 12,914 | 14,310 | 1,396 |
| Rubber products | 7,792 | 13,282 | 4,760 | 25,834 | 31,852 | 6,018 |
| Chemicals and chemical products | 12,842 | 60,564 | 11,192 | 84,596 | 99,868 | 15,272 |
| Petroleum and coal products | 1,756 | 31,616 | 6,090 | 39,464 | 41,858 | 2,394 |
| Non-metallic mineral products n.e.i. | 18,394 | 23,854 | 17,350 | 59,598 | 71,488 | 11,890 |
| Basic metal manufactures | 2,934 | 9,262 | 1,602 | 13,798 | 15,864 | 2,066 |
| Metal products (except machinery and transport equipment) | 28,290 | 56,712 | 14,756 | 99,758 | 113,868 | 14,110 |
| Machinery (except electrical) | 29,958 | 53,050 | 11,192 | 94,200 | 105,666 | 11,466 |
| Electrical machinery and appliances | 16,004 | 48,598 | 7,962 | 72,564 | 84,418 | 11,856 |
| Transport equipment | 55,076 | 139,684 | 18,988 | 213,750 | 231,822 | 18,072 |
| Miscellaneous products | 11,000 | 18,258 | 5,990 | 35,248 | 42,984 | 7,734 |
| Totals | 411,992 | 1,334,202 | 231,982 | 1,978,176 | 2,175,434 | 197,258 |
LIST OF CERTAIN COMMODITIES PRODUCED IN RECENT YEARS—The following is a list of certain commodities produced in New Zealand during the three latest years.
| Commodity | 1962-63 | 1963-64 | 1964-65 | |
|---|---|---|---|---|
* Not available for publication. | ||||
| Toasters | No. | 44,164 | 61,502 | 82,823 |
| Irons | No. | 42,857 | 77,795 | 81,606 |
| Radiators, electric | No. | 136,208 | 152,312 | 218,149 |
| Vacuum cleaners | No. | 45,996 | 55,111 | 58,996 |
| Washing machines | No. | 39,819 | 42,102 | 45,770 |
| Refrigerators (home and commercial and freezers) | No. | 37,668 | 53,728 | 52,806 |
| Electric ranges | No. | 37,895 | 40,321 | 44,272 |
| Electric rangettes | No. | 3,296 | 3,144 | 3,181 |
| Radios, including radiograms, etc. | No. | 103,679 | 94,856 | 80,460 |
| Television sets | No. | 63,989 | 113,904 | 162,813 |
| Blankets | Pairs | 202,068 | 225,216 | 243,622 |
| Floor coverings (textile top coverings) | sq. yd.(000) | 4,007 | 3,719 | 4,768 |
| Mattresses— | ||||
| Innerspring— | ||||
| Single | No. | 74,840 | 81,707 | 92,424 |
| Double | No. | 27,927 | 28,884 | 31,769 |
| Soft filled— | ||||
| Single | No. | 77,507 | 76,327 | 69,523 |
| Double | No. | 15,719 | 14,615 | 14,448 |
| Infants | No. | 13,552 | 10,386 | 9,555 |
| Venetian blinds | sq. ft.(000) | 2,987 | 2,812 | 2,745 |
| Newspapers produced— | ||||
| Dailies | thousand | 316,401 | 328,082 | 328,310 |
| Other than dailies | thousand | 50,224 | 53,018 | 55,463 |
| Hot-water bottles | No. | 300,230 | 302,711 | 451,839 |
| Soap— | ||||
| Toilet | ton | 3,934 | 3,601 | 4,031 |
| Bar | ton | 4,607 | 4,458 | 4,171 |
| Powder and flake | ton | 14,266 | 15,057 | 13,839 |
| Paints and enamels | gal(000) | 3,096 | 3,321 | 3,636 |
| Lacquers | gal(000) | 294 | 346 | 370 |
| Toothpaste | cwt | 11,827 | 12,756 | 15,667 |
| Furniture and floor polish | cwt | 25,088 | 27,249 | 25,548 |
| Shoe polishes and cleaners | cwt | 3,316 | 3,651 | 3,779 |
| Water heaters— | ||||
| Under 10 gallons | No. | 14,812 | 14,287 | 13,005 |
| 10 gallons and over | No. | 36,558 | 36,387 | 38,934 |
| Sinks: stainless steel | No. | 39,044 | 42,931 | 56,078 |
| Sink tops: stainless steel | No. | 23,415 | 26,619 | 28,412 |
| Wheelbarrows | No. | 20,572 | 19,939 | 22,311 |
| Lawnmowers (hand and power) | No. | 54,286 | 66,264 | 61,477 |
| Prams, pushchairs, strollers— | ||||
| Cane (inc. dolls') | No. | 6,741 | 4,180 | * |
| Other than cane | No. | 30,818 | 32,442 | * |
| Toothbrushes | No.(000) | 2,508 | 2,655 | 2,923 |
DETAILS OF CERTAIN PRINCIPAL INDUSTRIES—The principal statistics regarding leading factory industries for the last three years available are set out in the following pages. Fuller details are given in the annual Report on the Industrial Production Statistics.
| Commodity | 1962-63 | 1963-64 | 1964-65 | |
|---|---|---|---|---|
* In addition 1,019,000 bundles were produced in the sausage casings industry in 1963-64 and 1,049,000 bundles in 1964-65. * Includes products of establishments classified in other industries. * Includes chocolate sold for further manufacturing purposes. * Includes production by establishments classified in other industries. †Includes malting. * In addition, in 1962-63, 149,000 gallons; in 1963-64,164,000 gallons; and in 1964-65, 162,000 gallons were recorded by establishments classified in other industries. * Includes production by establishments classified in other industries. * Other principal products withheld to avoid disclosure of figures for individual establishments. * Includes refined glycerine. * Principal products shown for this industry include the production of establishments classified in other industries. * Includes production of establishments classified in other industries. † See next item for new classification. ‡ Effective running footage. * Includes production of establishments in other industries. * Principal products shown for these industries include the production of establishments classified in other industries. * Includes assembled vehicles from the motor-body building industry. * Includes production of establishments classified in other industries. NOTE—More detailed information on individual industries is given in the annual Report on Statistics of Industrial Production obtainable from Government bookshops. | ||||
| Meat Freezing and Preserving | ||||
| Number of establishments | 37 | 38 | 40 | |
| Persons engaged | No. | 19,129 | 19,165 | 19,657 |
| Production costs— | ||||
| Salaries, wages | $(000) | 43,006 | 44,100 | 47,318 |
| Materials | $(000) | 184,116 | 215,010 | 234,784 |
| Other expenses | $(000) | 17,474 | 18,352 | 19,880 |
| Totals | $(000) | 244,598 | 277,462 | 301,982 |
| Value of production | $(000) | 256,416 | 294,146 | 304,510 |
| Value added in manufacture | $(000) | 72,298 | 79,136 | 69,726 |
| Net output (net value added) | $(000) | 55,336 | 61,366 | 50,620 |
| Overtime worked by wage earners | h(000) | 5,243 | 5,475 | 5,835 |
| Volume index. Base: 1956-57 (= 1000) | 1,292 | 1,350 | 1,329 | |
| Principal products— | ||||
| Meat— | ||||
| Lamb carcasses No.(000) | 20,022 | 21,087 | 20,584 | |
| cwt(000) | 5,438 | 5,741 | 5,585 | |
| Mutton carcasses | No.(000) | 4,112 | 4,801 | 4,778 |
| cwt(000) | 1,858 | 2,091 | 2,065 | |
| Boned mutton | cwt(000) | 123 | 132 | 110 |
| Mutton and lamb pieces | cwt(000) | 189 | 177 | 193 |
| Beef quarters, bone in | cwt(000) | 1,106 | 1,339 | 1,854 |
| Beef quarters, without bone | cwt(000) | 183 | 305 | 284 |
| Boneless beef | cwt(000) | 1,638 | 1,406 | 1,033 |
| Bobby veal | cwt(000) | 192 | 194 | 197 |
| Other veal | cwt(000) | 117 | 119 | 82 |
| Pork | cwt(000) | 472 | 507 | 477 |
| Edible offals | cwt(000) | 747 | 843 | 860 |
| By-products— | ||||
| Runners (not processed) | No.(000) | 5,455 | 4,796 | 4,917 |
| Casings* | bundles(000) | 4,615 | 4,874 | 4,972 |
| Woolly sheepskins | No.(000) | 160 | 153 | 165 |
| Pelts | No.(000) | 25,909 | 25,974 | 26,772 |
| Cow hides | No.(000) | 646 | 611 | 497 |
| Ox and bull hides | No.(000) | 365 | 362 | 349 |
| Bobby calf hides | No.(000) | 1,268 | 1,256 | 1,154 |
| Other calf hides | No.(000) | 83 | 90 | 66 |
| Wool | lb(000) | 58,883 | 60,260 | 62,685 |
| Boiling-down products— | ||||
| Tallow | cwt(000) | 1,398 | 1,334 | 1,191 |
| Neatsfoot oil | gal (000) | 168 | 156 | 164 |
| Manures | cwt(000) | 795 | 698 | 623 |
| Livermeal | cwt(000) | 44 | 24 | 10 |
| Meatmeal | cwt(000) | 593 | 606 | 525 |
| Canned and other preserved meats, pastes, extracts, and miscellaneous cannings | cwt(000) | 109 | 146 | 127 |
| Ham and Bacon Curing | ||||
| Number of establishments | 50 | 52 | 54 | |
| Persons engaged | No. | 1,401 | 1,485 | 1,510 |
| Production costs— | ||||
| Salaries, wages | $(000) | 2,534 | 2,706 | 3,056 |
| Materials | $(000) | 15,212 | 15,888 | 18,308 |
| Other expenses | $(000) | 1,408 | 1,538 | 1,708 |
| Totals | $(000) | 19,154 | 20,132 | 23,074 |
| Value of production | $(000) | 20,180 | 21,184 | 24,398 |
| Value added in manufacture | $(000) | 4,968 | 5,296 | 6,090 |
| Net output (net value added) | $(000) | 3,620 | 3,818 | 4,422 |
| Overtime worked by wage earners | h(000) | 338 | 347 | 364 |
| Volume index. Base: 1956-57 (= 1000) | 1,183 | 1,248 | 1,343 | |
| Pigs dealt with— | ||||
| Carcasses | No.(000) | 441 | 460 | 495 |
| Cost | $(000) | 9,658 | 9,900 | 11,654 |
| Principal products— | ||||
| Ham and bacon | cwt | 333,001 | 346,511 | 353,161 |
| Frozen pork | cwt | 27,670 | 33,530 | 38,660 |
| Smallgoods | cwt | 276,028 | 289,983 | 323,795 |
| Lard (edible) | cwt | 10,876 | 11,558 | 12,309 |
| Butter, Cheese, and Other Milk Products | ||||
| Number of establishments— | ||||
| Butter and cheese | No. | 234 | 217 | 205 |
| Other milk products | No. | 77 | 75 | 73 |
| Persons engaged | No. | 4,555 | 4,304 | 4,405 |
| Production costs— | ||||
| Salaries, wages | $(000) | 9,100 | 8,650 | 9,458 |
| Materials | $(000) | 159,988 | 176,660 | 206,146 |
| Other expenses | $(000) | 10,202 | 10,538 | 11,486 |
| Totals | $(000) | 179,292 | 195,846 | 227,090 |
| Value of production | $(000) | 180,138 | 199,896 | 231,430 |
| Value added in manufacture | $(000) | 20,148 | 23,238 | 25,286 |
| Net output (net value added) | $(000) | 10,202 | 12,920 | 13,988 |
| Overtime worked by wage earners | h(000) | 1,076 | 1,133 | 1,213 |
| Volume index. Base: 1956-57 (= 1000) | 1,110 | 1,179 | 1,269 | |
| Butterfat used— | ||||
| For creamery butter | lb(000) | 393,745 | 415,087 | 444,945 |
| For cheesemaking | lb(000) | 88,048 | 84,330 | 93,156 |
| For whey butter making— | ||||
| Recoveries from own whey | lb(000) | 1,378 | 1,752 | 1,447 |
| Whey fat purchased | lb(000) | 4,012 | 4,142 | 4,624 |
| Second grade creamery butterfat | lb(000) | 131 | 120 | 545 |
| Total for whey butter | lb(000) | 5,521 | 6,014 | 6,616 |
| Principal products— | ||||
| Creamery butter | ton | 214,247 | 228,579 | 242,448 |
| Whey butter | ton | 3,036 | 2,835 | 3,148 |
| Cheese | ton | 98,291 | 94,884 | 105,174 |
| Condensed and powdered whole milk | ton | 13,778 | 15,458 | 14,381 |
| Skim-milk powder | ton | 50,789 | 62,421 | 77,973 |
| Buttermilk powder | ton | 18,516 | 20,659 | 22,922 |
| Casein | ton | 37,210 | 42,650 | 40,698 |
| Ice Cream | ||||
| Number of establishments | 23 | 24 | 19 | |
| Persons engaged | No. | 537 | 511 | 518 |
| Production costs— | ||||
| Salaries, wages | $(000) | 810 | 830 | 872 |
| Materials | $(000) | 3,002 | 3,326 | 3,820 |
| Other expenses | $(000) | 1,324 | 1,296 | 1,286 |
| Totals | $(000) | 5,136 | 5,452 | 5,978 |
| Value of production | $(000) | 6,140 | 6,370 | 7,810 |
| Value added in manufacture | $(000) | 3,138 | 3,042 | 3,990 |
| Net output (net value added) | $(000) | 1,958 | 1,944 | 2,912 |
| Overtime worked by wage earners | h(000) | 68 | 64 | 51 |
| Volume index. Base: 1956-57 (= 1000) | 1,383 | 1,566 | 1,593 | |
| Main materials used— | ||||
| Milk | gal(000) | 1,060 | 1,174 | 1,215 |
| Cream | gal(000) | 172 | 168 | 171 |
| Ice-cream mixture | cwt | 9,243 | 10,739 | 7,712 |
| Butter | cwt | 23,541 | 24,685 | 23,086 |
| Skim-milk powder | cwt | 16,958 | 17,822 | 21,844 |
| Sugar | cwt | 64,197 | 62,655 | 65,674 |
| Principal products— | ||||
| Bulk ice-cream | gal(000) | 2,819 | 3,010 | 2,787 |
| Ice cream, cartoned, wrapped, chocolate coated, etc. | gal(000) | 3,073 | 3,648 | 3,887 |
| Iced lollies | gal(000) | 636 | 667 | 713 |
| Grain Milling | ||||
| Number of establishments | 42 | 41 | 40 | |
| Persons engaged | No. | 924 | 966 | 985 |
| Production costs— | ||||
| Salaries, wages | $(000) | 1,566 | 1,702 | 1,812 |
| Materials | $(000) | 8,836 | 9,248 | 9,842 |
| Other expenses | $(000) | 1,320 | 1,458 | 1,498 |
| Totals | $(000) | 11,722 | 12,408 | 13,150 |
| Value of production | $(000) | 12,676 | 13,684 | 14,484 |
| Value added in manufacture | $(000) | 3,840 | 4,436 | 4,642 |
| Net output (net value added) | $(000) | 2,622 | 3,076 | 3,250 |
| Overtime worked by wage earners | h(000) | 127 | 130 | 132 |
| Volume index. Base: 1956-57 (= 1000) | 1,265 | 1,335 | 1,396 | |
| Main materials used— | ||||
| Wheat | bushel(000) | 10,015 | 10,392 | 10,774 |
| Oats | bushel(000) | 540 | 527 | 523 |
| Principal products— | ||||
| Flour | short ton | 215,421 | 218,457 | 230,329 |
| Wholemeal, wheatmeal* | short ton | 8,466 | 9,051 | 8,377 |
| Bran and pollard | short ton | 60,706 | 62,954 | 63,250 |
| Breakfast cereals— | ||||
| Oatmeal, rolled oats | short ton | 5,533 | 5,957 | 5,814 |
| Other (including cereals in biscuit, flake and puff form)* | short ton | 10,324 | 11,902 | 11,613 |
| Biscuits | ||||
| Number of establishments | 8 | 8 | 9 | |
| Persons engaged | No. | 1,169 | 1,203 | 1,260 |
| Production costs— | ||||
| Salaries, wages | $(000) | 1,814 | 1,904 | 2,030 |
| Materials | $(000) | 3,980 | 4,542 | 5,128 |
| Other expenses | $(000) | 1,160 | 1,086 | 1,190 |
| Totals | $(000) | 6,954 | 7,530 | 8,348 |
| Value of production | $(000) | 8,160 | 8,942 | 9,720 |
| Value added in manufacture | $(000) | 4,180 | 4,400 | 4,594 |
| Net output (net value added) | $(000) | 3,088 | 3,378 | 3,468 |
| Overtime worked by wage earners | h(000) | 247 | 265 | 282 |
| Volume index. Base: 1956-57 (= 1000) | 1,123 | 1,197 | 1,239 | |
| Main materials used— | ||||
| Flour | short ton | 11,852 | 12,867 | 13,070 |
| Sugar | ton | 4,206 | 4,642 | 4,259 |
| Chocolate | cwt | 11,327 | 12,385 | 13,006 |
| Margarine, lard, confectionery fat | cwt | 54,580 | 59,753 | 58,702 |
| Biscuits manufactured | ton | 18,053 | 19,287 | 19,624 |
| Cocoa, Chocolate, and Sugar Confectionery | ||||
| Number of establishments | 50 | 50 | 46 | |
| Persons engaged | No. | 2,002 | 2,025 | 2,056 |
| Production costs— | ||||
| Salaries, wages | $(000) | 2,836 | 2,996 | 3,100 |
| Materials | $(000) | 7,306 | 8,326 | 9,406 |
| Other expenses | $(000) | 1,626 | 1,546 | 1,578 |
| Totals | $(000) | 11,768 | 12,868 | 14,084 |
| Value of production | $(000) | 13,722 | 15,086 | 16,118 |
| Value added in manufacture | $(000) | 6,416 | 6,760 | 6,710 |
| Net output (net value added) | $(000) | 4,840 | 5,272 | 5,202 |
| Overtime worked by wage earners | h(000) | 241 | 254 | 249 |
| Volume index. Base: 1956-57 (= 1000) | 1,291 | 1,363 | 1,396 | |
| Main materials used— | ||||
| Sugar | ton | 11,455 | 11,351 | 12,446 |
| Cocoa beans | cwt | 52,816 | 55,392 | 60,514 |
| Cocoa butter | cwt | 10,015 | 12,282 | 13,886 |
| Glucose | cwt | 78,133 | 79,665 | 83,006 |
| Nuts | cwt | 26,100 | 29,042 | 29,501 |
| Confectionery manufactured— | ||||
| Chocolate and chocolate-coated* | ton | 8,349 | 9,838 | 10,101 |
| Sugar | ton | 11,558 | 10,537 | 10,436 |
| Fruit and Vegetable Preserving | ||||
| Number of establishments | 35 | 36 | 32 | |
| Persons engaged | No. | 2,202 | 2,274 | 2,245 |
| Production costs— | ||||
| Salaries, wages | $(000) | 3,628 | 3,832 | 3,884 |
| Materials | $(000) | 11,408 | 12,784 | 12,988 |
| Other expenses | $(000) | 3,264 | 3,434 | 3,668 |
| Totals | $(000) | 18,302 | 20,050 | 20,542 |
| Value of production | $(000) | 19,548 | 21,492 | 22,268 |
| Value added in manufacture | $(000) | 8,142 | 8,710 | 9,280 |
| Net output (net value added) | $(000) | 5,412 | 5,790 | 6,092 |
| Overtime worked by wage earners | h(000) | 620 | 565 | 631 |
| Volume index. Base: 1956-57 (= 1000) | 1,828 | 1,955 | 2,021 | |
| Main materials used— | ||||
| Fruit (fresh) | ton | 17,212 | 23,540 | 23,018 |
| Vegetables and tomatoes (fresh) | ton | 56,933 | 49,561 | 48,302 |
| Sugar | ton | 5,366 | 5,939 | 6,450 |
| Principal products— | ||||
| Canned fruit | cwt | 215,256 | 274,428 | 260,564 |
| Canned beans in sauce | cwt | 70,259 | 76,808 | 71,168 |
| Canned peas | cwt | 139,400 | 89,604 | 71,084 |
| Canned green beans | cwt | 36,427 | 28,717 | 27,508 |
| Other canned vegetables (not tomatoes) | cwt | 93,271 | 99,029 | 82,212 |
| Tomato soup | gal | 452,040 | 501,423 | 553,028 |
| Pickles and sauces* | gal | 854,773 | 919,679 | 1,009,265 |
| Jams, jellies, and conserves | cwt | 83,887 | 74,611 | 81,924 |
| Canned spaghetti in sauce | cwt | 86,899 | 90,223 | 85,872 |
| Canned tomatoes (whole and halves) | cwt | 12,784 | 14,974 | 17,255 |
| Quick-frozen vegetables— | ||||
| Peas | cwt | 196,675 | 199,216 | 224,246 |
| Beans | cwt | 39,102 | 43,722 | 52,875 |
| Other | cwt | 29,078 | 25,548 | 31,209 |
| Breweries† | ||||
| Number of establishments | 20 | 18 | 18 | |
| Persons engaged | No. | 1,415 | 1,371 | 1,383 |
| Production costs— | ||||
| Salaries, wages | $(000) | 2,896 | 2,926 | 3,184 |
| Materials | $(000) | 10,158 | 10,494 | 11,232 |
| Other expenses | $(000) | 3,734 | 3,836 | 3,776 |
| Totals | $(000) | 16,790 | 17,258 | 18,192 |
| Value of production | $(000) | 22,074 | 23,414 | 24,586 |
| Value added in manufacture | $(000) | 11,916 | 12,918 | 13,354 |
| Net output (net value added) | $(000) | 8,324 | 9,222 | 9,754 |
| Overtime worked by wage earners | h(000) | 369 | 417 | 415 |
| Volume index. Base: 1956-57 (= 1000) | 1,146 | 1,171 | 1,226 | |
| Main materials used— | ||||
| Malt bushel | (000) | 1,481 | 1,541 | 1,627 |
| Hops | cwt | 7,099 | 6,420 | 6,543 |
| Sugar | cwt | 139,924 | 102,535 | 75,569 |
| Beer produced for sale | gal(000) | 56,586 | 58,035 | 59,898 |
| Stout produced for sale | gal(000) | 341 | 338 | 392 |
| Aerated Waters and Cordials | ||||
| Number of establishments | 64 | 62 | 56 | |
| Persons engaged | No. | 695 | 662 | 662 |
| Production costs— | ||||
| Salaries, wages | $(000) | 1,154 | 1,158 | 1,170 |
| Materials | $(000) | 2,506 | 2,778 | 2,884 |
| Other expenses | $(000) | 840 | 858 | 992 |
| Totals | $(000) | 4,498 | 4,796 | 5,046 |
| Value of production | $(000) | 5,280 | 5,806 | 6,008 |
| Value added in manufacture | $(000) | 2,776 | 3,028 | 3,126 |
| Net output (net value added) | $(000) | 2,008 | 2,260 | 2,252 |
| Overtime worked by wage earners | h(000) | 59 | 47 | 39 |
| Volume index. Base: 1956-57 (= 1000) | 1,384 | 1,367 | 1,520 | |
| Main materials used— | ||||
| Sugar | ton | 6,612 | 6,416 | 6,775 |
| Essential oils and essences | lb(000) | 489 | 527 | 449 |
| Fruit extracts and juices | gal(000) | 95 | 89 | 67 |
| Aerated waters made | gal(000) | 9,672 | 9,475 | 10,680 |
| Cordials made* | gal(000) | 455 | 462 | 477 |
| Tobacco, Cigars, and Cigarettes | ||||
| Number of establishments | 5 | 5 | 3 | |
| Persons engaged | No. | 1,193 | 1,223 | 970 |
| Production costs— | ||||
| Salaries, wages | $(000) | 1,936 | 2,028 | 1,700 |
| Materials | $(000) | 12,160 | 12,964 | 12,400 |
| Other expenses | $(000) | 1,556 | 1,740 | 1,466 |
| Totals | $(000) | 15,650 | 16,734 | 15,566 |
| Value of production | $(000) | 17,858 | 19,198 | 18,408 |
| Value added in manufacture | $(000) | 5,698 | 6,236 | 6,008 |
| Net output (net value added) | $(000) | 4,334 | 4,690 | 4,694 |
| Overtime worked by wage earners | h(000) | 238 | 244 | 230 |
| Volume index. Base: 1956-57 (= 1000) | 1,524 | 1,660 | 1,598 | |
| Tobacco leaf used in manufacture | lb(000) | 12,812 | 13,036 | 13,175 |
| Cigarettes made million | 3,530 | 3,948 | 3,887 | |
| Tobacco made | lb(000) | 4,741 | 4,633 | 4,084 |
| Woollen Milling | ||||
| Number of establishments | 21 | 22 | 22 | |
| Persons engaged | No. | 3,681 | 3,842 | 4,176 |
| Production costs— | ||||
| Salaries, wages | $(000) | 5,494. | 5,750 | 6,636 |
| Materials | $(000) | 7,206 | 7,672 | 10,762 |
| Other expenses | $(000) | 2,366 | 2,650 | 3,116 |
| Totals | $(000) | 15,068 | 16,070 | 20,514 |
| Value of production | $(000) | 15,464 | 16,406 | 20,974 |
| Value added in manufacture | $(000) | 8,258 | 8,734 | 10,214 |
| Net output (net value added) | $(000) | 5,998 | 6,234 | 7,270 |
| Overtime worked by wage earners | h(000) | 531 | 639 | 735 |
| Volume index. Base: 1956-57 (= 1000) | 1,713 | 1,735 | 2,187 | |
| Main materials used— | ||||
| Wool fibres— | ||||
| Greasy and slipe wool | lb(000) | 11,137 | 10,763 | 12,530 |
| Scoured wool | lb(000) | 508 | 619 | 436 |
| Tops, noils | lb(000) | 1,319 | 1,197 | 2,022 |
| Woollen and worsted yarn | lb(000) | 124 | 157 | 433 |
| Non-wool fibres— | ||||
| Artificial and synthetic | lb(000) | 726 | 695 | 787 |
| Other | lb(000) | 15 | 10 | 22 |
| Principal products— | ||||
| Woollen cloth | yd(000) | 1,426 | 1,414 | 1,352 |
| Worsted cloth | yd(000) | 1,417 | 1,364 | 1,333 |
| Flannel | yd(000) | 252 | 144 | 203 |
| Blankets pairs(000) | 202 | 225 | 244 | |
| Rugs | No.(000) | 89 | 77 | 79 |
| Yarn produced for sale or transfer— | ||||
| Fingering | lb(000) | 1,635 | 1,679 | 2,426 |
| Machine knitting | lb(000) | 2,072 | 1,884 | 2,665 |
| Hosiery and Other Knitting Mills | ||||
| Number of establishments | 81 | 80 | 78 | |
| Persons engaged | No. | 4,199 | 4,382 | 4,417 |
| Production costs— | ||||
| Salaries, wages | $(000) | 5,710 | 6,412 | 6,812 |
| Materials | $(000) | 11,606 | 12,714 | 14,954 |
| Other expenses | $(000) | 3,240 | 3,520 | 3,716 |
| Totals | $(000) | 20,556 | 22,648 | 25,482 |
| Value of production | $(000) | 22,738 | 25,160 | 27,882 |
| Value added in manufacture | $(000) | 11,132 | 12,446 | 12,930 |
| Net output (net value added) | $(000) | 8,090 | 9,134 | 9,456 |
| Overtime worked by wage earners | h(000) | 255 | 289 | 324 |
| Volume index. Base: 1956-57 (= 1000) | 1,729 | 1,913 | 2,248 | |
| Clothing | ||||
| Number of establishments | 692 | 724 | 713 | |
| Persons engaged | No. | 18,999 | 19,643 | 20,269 |
| Production costs— | ||||
| Salaries, wages | $(000) | 21,946 | 23,950 | 25,588 |
| Materials | $(000) | 39,292 | 43,202 | 46,322 |
| Other expenses | $(000) | 5,564 | 6,004 | 6,424 |
| Totals | $(000) | 66,804 | 73,156 | 78,334 |
| Value of production | $(000) | 71,434 | 79,102 | 83,746 |
| Value added in manufacture | $(000) | 32,140 | 35,900 | 37,426 |
| Net output (net value added) | $(000) | 26,936 | 30,224 | 31,426 |
| Overtime worked by wage earners | h(000) | 434 | 553 | 542 |
| Volume index. Base: 1956-57 (= 1000) | 1,075 | 1,222 | 1,262 | |
| Footwear | ||||
| Number of establishments | 129 | 127 | 124 | |
| Persons engaged | No. | 5,564 | 5,370 | 5,383 |
| Production costs— | ||||
| Salaries, wages | $(000) | 8,450 | 8,540 | 8,898 |
| Materials | $(000) | 11,764 | 11,880 | 11,904 |
| Other expenses | $(000) | 2,744 | 2,938 | 3,134 |
| Totals | $(000) | 22,958 | 23,358 | 23,936 |
| Value of production | $(000) | 24,538 | 24,948 | 25,632 |
| Value added in manufacture | $(000) | 12,774 | 13,068 | 13,728 |
| Net output (net value added) | $(000) | 10,132 | 10,244 | 10,728 |
| Overtime worked by wage earners | h(000) | 354 | 422 | 382 |
| Volume index. Base: 1956-57 (= 1000) | 1,515 | 1,546 | 1,591 | |
| Main materials used— | ||||
| Upper leather sq. ft.(000) | 9,265 | 10,063 | 11,128 | |
| Sole leather | lb(000) | 2,206 | 2,042 | 2,125 |
| Synthetic soling material | lb(000) | 1,315 | 1,338 | 1,262 |
| Felt sq. yd.(000) | 51 | 85 | 98 | |
| Sawmills | ||||
| Number of establishments | 413 | 397 | 395 | |
| Persons engaged | No. | 5,862 | 5,750 | 5,889 |
| Production costs— | ||||
| Salaries, wages | $(000) | 11,066 | 11,322 | 12,468 |
| Materials | $(000) | 18,868 | 20,122 | 22,882 |
| Other expenses | $(000) | 8,768 | 8,584 | 9,080 |
| Totals | $(000) | 38,704 | 40,026 | 44,430 |
| Value of production | $(000) | 41,258 | 44,002 | 50,510 |
| Value added in manufacture | $(000) | 22,390 | 23,880 | 27,628 |
| Net output (net value added) | $(000) | 14,120 | 15,750 | 19,044 |
| Overtime worked by wage earners | h(000) | 724 | 689 | 880 |
| Volume index. Base: 1956-57 (= 1000) | 1,055 | 1,108 | 1,243 | |
| Rough-sawn timber produced thousand ft b.m. | 616,854 | 648,062 | 726,728 | |
| Planing Mills and Timber Preservation | ||||
| Number of establishments | 140 | 142 | 173 | |
| Persons engaged | No. | 2,032 | 1,960 | 2,119 |
| Production costs— | ||||
| Salaries, wages | $(000) | 3,560 | 3,556 | 4,128 |
| Materials | $(000) | 18,038 | 18,280 | 19,766 |
| Other expenses | $(000) | 1,920 | 1,850 | 2,218 |
| Totals | $(000) | 23,518 | 23,686 | 26,112 |
| Value of production | $(000) | 25,472 | 26,464 | 29,498 |
| Value added in manufacture | $(000) | 7,434 | 8,184 | 9,732 |
| Net output (net value added) | $(000) | 5,700 | 6,458 | 7,670 |
| Overtime worked by wage earners | h(000) | 283 | 258 | 314 |
| Rough-sawn timber used in manufacture thousand | ft b.m. | 170,923 | 147,928 | 168,850 |
| Dressed timber produced— | ||||
| Floorboards thousand | ft b.m. | 34,322 | 32,818 | 36,055 |
| Weatherboards thousand | ft b.m. | 21,397 | 21,301 | 23,463 |
| Other thousand | ft b.m. | 84,264 | 72,507 | 86,954 |
| Joinery work done | $(000) | 2,736 | 2,688 | 2,620 |
| Joinery | ||||
| Number of establishments | 402 | 427 | 422 | |
| Persons engaged | No. | 3,855 | 3,918 | 4,197 |
| Production costs— | ||||
| Salaries, wages | $(000) | 6,914 | 7,342 | 8,436 |
| Materials | $(000) | 11,802 | 13,798 | 16,008 |
| Other expenses | $(000) | 2,174 | 2,296 | 2,600 |
| Totals | $(000) | 20,892 | 23,436 | 27,044 |
| Value of production | $(000) | 22,926 | 25,996 | 30,432 |
| Value added in manufacture | $(000) | 11,124 | 12,196 | 14,424 |
| Net output (net value added) | $(000) | 9,110 | 10,072 | 12,004 |
| Overtime worked by wage earners | h(000) | 524 | 601 | 761 |
| Timber used in manufacture thousand | ft b.m. | 78,062 | 81,323 | 90,775 |
| Dressed timber produced— | ||||
| Floorboards thousand | ft b.m. | 6,417 | 8,996 | 10,439 |
| Weatherboards thousand | ft b.m. | 1,801 | 2,535 | 3,957 |
| Other thousand | ft b.m. | 7,702 | 11,360 | 11,557 |
| Joinery and other woodwork | $(000) | 20,710 | 22,756 | 27,276 |
| Furniture | ||||
| Number of establishments | 448 | 458 | 476 | |
| Persons engaged | No. | 4,308 | 4,692 | 4,986 |
| Production costs— | ||||
| Salaries, wages | $(000) | 7,888 | 8,940 | 9,992 |
| Materials | $(000) | 11,820 | 13,890 | 15,838 |
| Other expenses | $(000) | 2,078 | 2,368 | 2,630 |
| Totals | $(000) | 21,786 | 25,198 | 28,460 |
| Value of production | $(000) | 23,648 | 27,424 | 31,410 |
| Value added in manufacture | $(000) | 11,830 | 13,532 | 15,572 |
| Net output (net value added) | $(000) | 9,900 | 11,326 | 13,130 |
| Overtime worked by wage earners | h(000) | 514 | 624 | 751 |
| Pulp, Paper, and Paperboard | ||||
| Number of establishments | 7 | 7 | 7 | |
| Persons engaged | No. | 2,847 | 3,003 | 3,078 |
| Production costs— | ||||
| Salaries, wages | $(000) | 7,514 | 8,246 | 8,812 |
| Materials | $(000) | 14,336 | 16,412 | 17,120 |
| Other expenses | $(000) | 17,888 | 19,864 | 18,894 |
| Totals | $(000) | 39,738 | 44,520 | 44,824 |
| Value of production | $(000) | 45,906 | 52,396 | 55,170 |
| Value added in manufacture | $(000) | 31,570 | 35,986 | 38,050 |
| Net output (net value added) | $(000) | 15,490 | 18,004 | 20,678 |
| Overtime worked by wage earners | h(000) | 785 | 913 | 787 |
| Volume index. Base: 1956-57 (= 1000) | 1,885 | 2,193 | 2,297 | |
| Principal products— | ||||
| Newsprint | ton | 159,829 | 180,085 | 188,385 |
| Other paper | ton | 64,701 | 80,426 | 82,006 |
| Paperboard | ton | 45,098 | 49,974 | 47,874 |
| Fibreboard sq. yd.(000) | 8,756 | 9,283 | 10,047 | |
| Wood pulp for sale | ton | 67,209 | 75,968 | 87,221 |
| Cardboard Boxes, Cartons, and Paper Bags | ||||
| Number of establishments | 51 | 56 | 55 | |
| Persons engaged | No. | 2,094 | 2,403 | 2,431 |
| Production costs— | ||||
| Salaries, wages | $(000) | 3,760 | 4,332 | 4,670 |
| Materials | $(000) | 14,420 | 16,466 | 18,408 |
| Other expenses | $(000) | 2,080 | 2,844 | 2,992 |
| Totals | $(000) | 20,260 | 23,640 | 26,070 |
| Value of production | $(000) | 23,120 | 26,778 | 29,022 |
| Value added in manufacture | $(000) | 8,700 | 10,314 | 10,614 |
| Net output (net value added) | $(000) | 6,786 | 7,822 | 7,994 |
| Overtime worked by wage earners | h(000) | 385 | 409 | 483 |
| Volume index. Base: 1956-57 (= 1000) | 2,060 | 2,290 | 2,719 | |
| Paper used in manufacture | ton | 23,780 | 27,826 | 44,269 |
| Cardboard | ton | 19,131 | 21,862 | 24,393 |
| Corrugated and laminated paperboard | ton | 18,939 | 19,359 | 11,555 |
| Cardboard boxes, cartons, made* | $(000) | 18,650 | 21,104 | 22,086 |
| Paper bags and paper sacks, made* | $(000) | 4,246 | 4,748 | 5,256 |
| Printing and Publishing | ||||
| Number of establishments | 92 | 89 | 88 | |
| Persons engaged | No. | 6,007 | 6,218 | 6,405 |
| Production costs— | ||||
| Salaries, wages | $(000) | 11,854 | 12,860 | 13,978 |
| Materials | $(000) | 10,606 | 11,656 | 11,970 |
| Other expenses | $(000) | 6,184 | 6,906 | 8,092 |
| Totals | $(000) | 28,642 | 31,422 | 34,040 |
| Value of production | $(000) | 35,370 | 39,164 | 41,920 |
| Value added in manufacture | $(000) | 24,764 | 27,510 | 29,948 |
| Net output (net value added) | $(000) | 18,664 | 20,704 | 21,968 |
| Overtime worked by wage earners | h(000) | 453 | 520 | 566 |
| Volume index. Base: 1956-57 (= 1000) | 1,295 | 1,423 | 1,490 | |
| Newsprint used | ton | 63,794 | 69,729 | 71,934 |
| Other paper used | ton | 3,438 | 3,571 | 3,860 |
| Job and General Printing | ||||
| Number of establishments | 324 | 336 | 342 | |
| Persons engaged | No. | 5,480 | 5,700 | 5,933 |
| Production costs— | ||||
| Salaries, wages | $(000) | 9,666 | 10,366 | 11,330 |
| Materials | $(000) | 10,836 | 12,210 | 13,356 |
| Other expenses | $(000) | 4,062 | 4,320 | 4,652 |
| Totals | $(000) | 24,564 | 26,896 | 29,336 |
| Value of production | $(000) | 27,568 | 30,238 | 33,226 |
| Value added in manufacture | $(000) | 16,732 | 18,028 | 19,870 |
| Net output (net value added) | $(000) | 12,966 | 14,000 | 15,514 |
| Overtime worked by wage earners | h(000) | 608 | 734 | 775 |
| Volume index. Base: 1956-57 (= 1000) | 1,776 | 1,913 | 2,069 | |
| Newsprint used | ton | 1,702 | 2,791 | 3,409 |
| Other paper used | ton | 18,009 | 19,574 | 21,113 |
| Cardboard | ton | 4,993 | 4,946 | 5,143 |
| Corrugated and laminated paperboard | ton | 598 | 690 | 617 |
| Tanning | ||||
| Number of establishments | 11 | 11 | 11 | |
| Persons engaged | No. | 655 | 675 | 706 |
| Production costs— | ||||
| Salaries, wages | $(000) | 1,290 | 1,430 | 1,544 |
| Materials | $(000) | 3,364 | 3,334 | 3,692 |
| Other expenses | $(000) | 546 | 626 | 676 |
| Totals | $(000) | 5,200 | 5,390 | 5,912 |
| Value of production | $(000) | 6,062 | 6,322 | 6.616 |
| Value added in manufacture | $(000) | 2,698 | 2,988 | 2,924 |
| Net output (net value added) | $(000) | 2,168 | 2,376 | 2,268 |
| Overtime worked by wage earners | h(000) | 117 | 135 | 130 |
| Volume index. Base: 1956-57 (= 1000) | 1,081 | 1,181 | 1,247 | |
| Principal products*— | ||||
| Leather— | ||||
| Hides— | ||||
| Bends | lb(000) | 1,225 | 1,204 | 1,218 |
| Shoulders | lb(000) | 726 | 668 | 665 |
| Bellies | lb(000) | 736 | 645 | 706 |
| Chrome and other sides | sq. ft.(000) | 7,298 | 7,551 | 7,476 |
| Rubberware | ||||
| Number of establishments | 28 | 34 | 35 | |
| Persons engaged | No. | 2,584 | 2,661 | 2,790 |
| Production costs— | ||||
| Salaries, wages | $(000) | 5,556 | 5,904 | 6,526 |
| Materials | $(000) | 10,000 | 10,138 | 10,882 |
| Other expenses | $(000) | 3,224 | 3,094 | 3,456 |
| Totals | $(000) | 18,780 | 19,136 | 20,864 |
| Value of production | $(000) | 23,032 | 23,426 | 25,754 |
| Value added in manufacture | $(000) | 13,032 | 13,286 | 14,872 |
| Net output (net value added) | $(000) | 9,838 | 10,228 | 11,464 |
| Overtime worked by wage earners | h(000) | 356 | 349 | 482 |
| Volume index. Base: 1956-57 (= 1000) | 1,341 | 1,457 | 1,580 | |
| Main materials used— | ||||
| Natural rubber | lb(000) | 9,537 | 9,468 | 10,876 |
| Synthetic rubber | lb(000) | 11,785 | 12,703 | 13,878 |
| Latex | $(000) | 688 | 682 | 664 |
| Principal products— | ||||
| Motor tyres | No. | 769,194 | 868,727 | 937,661 |
| Motor tubes | No. | 571,913 | 605,827 | 586,273 |
| Camelback | lb(000) | 4,995 | 5,436 | 5,399 |
| Milking rubberware | ||||
| Bicycle tyres and tubes | $(000) | 2,818 | 2,664 | 3,212 |
| Battery containers | ||||
| Rubber and canvas footwear | ||||
| Chemical Fertilisers | ||||
| Number of establishments | 12 | 14 | 15 | |
| Persons engaged | No. | 1,329 | 1,314 | 1,307 |
| Production costs— | ||||
| Salaries, wages | $(000) | 2,698 | 2,838 | 3,368 |
| Materials | $(000) | 17,492 | 20,054 | 24,004 |
| Other expenses | $(000) | 3,016 | 3,024 | 3,386 |
| Totals | $(000) | 23,206 | 25,916 | 30,758 |
| Value of production | $(000) | 25,874 | 30,194 | 35,012 |
| Value added in manufacture | $(000) | 8,382 | 10,140 | 11,008 |
| Net output (net value added) | $(000) | 5,546 | 7,238 | 7,768 |
| Overtime worked by wage earners | h(000) | 386 | 397 | 553 |
| Volume index. Base: 1956-57 (= 1000) | 1,325 | 1,537 | 1,810 | |
| Main materials used— | ||||
| Rock phosphate | ton | 642,941 | 762,160 | 870,206 |
| Serpentine rock | ton | 144,355 | 153,782 | 159,219 |
| Sulphur | ton | 134,584 | 158,703 | 176,979 |
| Carbonate of lime | ton | 20,308 | 25,250 | 33,610 |
| Nitrate of soda | ton | 3,196 | 3,394 | 4,074 |
| Potash | ton | 81,891 | 89,736 | 115,486 |
| Principal products— | ||||
| Serpentine superphosphate and mixtures | ton | 429,860 | 406,965 | 370,953 |
| Basic and reverted superphosphate and mixtures | 35,512 | 33,031 | 43,061 | |
| Straight superphosphate and mixtures | ton | 541,092 | 676,243 | 867,464 |
| Aerial superphosphate and mixtures | ton | 328,732 | 438,899 | 506,463 |
| Other (including ground rock) | ton | 14,804 | 1,513 | 1,401 |
| Superphosphate content of above | ton | 1,109,763 | 1,287,419 | 1,478,727 |
| Soap Manufacture | ||||
| Number of establishments | 12 | 12 | 13 | |
| Persons engaged | No. | 475 | 469 | 490 |
| Production costs— | ||||
| Salaries, wages | $(000) | 844 | 924 | 966 |
| Materials | $(000) | 3,254 | 3,270 | 3,652 |
| Other expenses | $(000) | 810 | 950 | 1,014 |
| Totals | $(000) | 4,908 | 5,144 | 5,632 |
| Value of production | $(000) | 6,716 | 6,916 | 6,758 |
| Value added in manufacture | $(000) | 3,462 | 3,644 | 3,108 |
| Net output (net value added) | $(000) | 2,710 | 2,798 | 2,184 |
| Overtime worked by wage earners | h(000) | 71 | 72 | 77 |
| Volume index. Base: 1956-57 (= 1000) | 1,343 | 1,375 | 1,298 | |
| Main materials used— | ||||
| Tallow | ton | 12,058 | 11,766 | 11,508 |
| Other oils and fats | ton | 1,260 | 1,219 | 1,185 |
| Caustic soda | ton | 2,079 | 2,238 | 2,127 |
| Soda ash | ton | 2,676 | 3,015 | 2,734 |
| Principal products— | ||||
| Soap— | ||||
| Toilet | ton | 3,934 | 3,601 | 4,031 |
| Bar | ton | 4,607 | 4,458 | 4,171 |
| Powder and flake | ton | 14,266 | 15,057 | 13,839 |
| Candles | ton | 147 | 116 | 156 |
| Sandsoap | ton | 310 | 224 | 209 |
| Crude glycerine | ton | 1,489* | 276 | 151 |
| Paint and Varnish | ||||
| Number of establishments | 25 | 29 | 31 | |
| Persons engaged | No. | 820 | 882 | 965 |
| Production costs— | ||||
| Salaries, wages | $(000) | 1,674 | 1,808 | 2,032 |
| Materials | $(000) | 8,498 | 9,248 | 10,238 |
| Other expenses | $(000) | 1,016 | 1,116 | 1,242 |
| Totals | $(000) | 11,188 | 12,174 | 13,514 |
| Value of production | $(000) | 13,676 | 14,336 | 16,400 |
| Value added in manufacture | $(000) | 5,176 | 5,086 | 6,162 |
| Net output (net value added) | $(000) | 4,208 | 4,028 | 4,964 |
| Overtime worked by wage earners | h(000) | 106 | 112 | 97 |
| Volume index. Base: 1956-57 (= 1000) | 1,242 | 1,350 | 1,474 | |
| Main materials used— | ||||
| White lead | cwt | 10,894 | 9 556 | 6,298 |
| Titanium dioxide (in terms of 100% TiO2) | cwt | 70,943 | 74,388 | 74,932 |
| Other pigments and extenders | cwt | 115,075 | 112,734 | 127,812 |
| Linseed oil | gal(000) | 360 | 351 | 315 |
| Solvents | gal(000) | 1,775 | 1,837 | 2,369 |
| Resins | cwt | 93,757 | 109,259 | 125,035 |
| Principal products— | ||||
| Paints and enamels | gal(000) | 3,096 | 3,321 | 3,636 |
| Lacquers | gal(000) | 294 | 346 | 370 |
| Pharmaceuticals, Toilet Goods, and Cosmetics* | ||||
| Number of establishments | 38 | 41 | 39 | |
| Persons engaged | No. | 964 | 1,043 | 1,192 |
| Production costs— | ||||
| Salaries, wages | $(000) | 1,336 | 1,570 | 1,852 |
| Materials | $(000) | 5,228 | 6,480 | 7,308 |
| Other expenses | $(000) | 848 | 1,042 | 1,108 |
| Totals | $(000) | 7,412 | 9,092 | 10,268 |
| Value of production | $(000) | 9,140 | 11,804 | 13,140 |
| Value added in manufacture | $(000) | 3,912 | 5,324 | 5,832 |
| Net output (net value added) | $(000) | 3,098 | 4,334 | 4,776 |
| Overtime worked by wage earners | h(000) | 34 | 46 | 45 |
| Principal products— | ||||
| Pharmaceutical products | $(000) | 4,132 | 4,624 | 4,908 |
| Toilet preparations and cosmetics— | ||||
| Dentifrices | $(000) | 962 | 1,042 | 1,118 |
| Cosmetic creams and lotions | $(000) | 440 | 518 | 628 |
| Hair dressing | $(000) | 1,364 | 2,116 | 2,472 |
| Powder, face and talcum | $(000) | 468 | 530 | 590 |
| Lipstick | $(000) | 288 | 268 | 286 |
| Structural Clay Products | ||||
| Number of establishments | 44 | 43 | 40 | |
| Persons engaged | No. | 1,047 | 1,087 | 1,116 |
| Production costs— | ||||
| Salaries, wages | $(000) | 2,036 | 2,232 | 2,510 |
| Materials | $(000) | 536 | 602 | 762 |
| Other expenses | $(000) | 2,052 | 1,988 | 2,190 |
| Totals | $(000) | 4,624 | 4,824 | 5,460 |
| Value of production | $(000) | 5,084 | 5,500 | 6,352 |
| Value added in manufacture | $(000) | 4,548 | 4,900 | 5,592 |
| Net output (net value added) | $(000) | 2,522 | 2,944 | 3,436 |
| Overtime worked by wage earners | h(000) | 273 | 309 | 343 |
| Volume index. Base: 1956-57 (= 1000) | 1,109 | 1,100 | 1,200 | |
| Clay used— | ||||
| Purchased | ton | 12,943 | 13,217 | 28,566 |
| From own quarry | ton | 306,145 | 303,210 | 341,733 |
| Principal products— | ||||
| Firebricks* | No.(000) | 2,765 | 2,822 | 3,130 |
| Building bricks including hollow blocks | No.(000) | 46,774 | 50,206 | 52,101 |
| Salt-glazed pipes and fittings— | ||||
| Above 6 in | No.(000) | 27 | † | † |
| 6 in. and below | No.(000) | 3,059 | † | † |
| Glazed pipes and fittings— | ||||
| 4 in. and below ft‡ | (000) | .. | 5,327 | 6,467 |
| Over 4 in. but not exceeding 6 in. ft‡ | (000) | .. | 495 | 486 |
| Above 6 in ft‡ | (000) | .. | 31 | 20 |
| Field tiles and fittings— | No.(000) | 10,144 | † | † |
| 4 in. and below ft‡ | (000) | .. | 9,397 | 9,524 |
| Over 4 in. but not exceeding 6 in. ft‡ | (000) | .. | 1,228 | 1,638 |
| Above 6 in ft‡ | (000) | 73 | 89 | |
| Pottery, China, and Earthenware | ||||
| Number of establishments | 6 | 7 | 10 | |
| Persons engaged | No. | 704 | 775 | 782 |
| Production costs— | ||||
| Salaries, wages | $(000) | 1,076 | 1,248 | 1,370 |
| Materials | $(000) | 308 | 342 | 390 |
| Other expenses | $(000) | 532 | 548 | 666 |
| Totals | $(000) | 1,916 | 2,140 | 2,424 |
| Value of production | $(000) | 2,266 | 2,550 | 2,878 |
| Value added in manufacture | $(000) | 1,956 | 2,208 | 2,488 |
| Net output (net value added) | $(000) | 1,436 | 1,684 | 1,850 |
| Overtime worked by wage earners | h(000) | 152 | 153 | 133 |
| Principal products— | ||||
| Insulators and refractory insulator elements | $(000) | 674 | 742 | 902 |
| Crockery, artware and novelties, stoneware | $(000) | 882 | 1,100 | 1,250 |
| Other earthenware including sanitaryware | $(000) | 612 | 584 | 598 |
| Cement | ||||
| Number of establishments | 6 | 6 | 6 | |
| Persons engaged | No. | 801 | 786 | 823 |
| Production costs— | ||||
| Salaries, wages | $(000) | 1,636 | 1,812 | 2,118 |
| Materials | $(000) | 2,142 | 2,524 | 2,538 |
| Other expenses | $(000) | 5,186 | 5,884 | 5,740 |
| Totals | $(000) | 8,966 | 10,218 | 10,396 |
| Value of production | $(000) | 11,342 | 13,566 | 14,150 |
| Value added in manufacture | $(000) | 9,198 | 11,044 | 11,612 |
| Net output (net value added) | $(000) | 4,266 | 5,394 | 5,952 |
| Overtime worked by wage earners | h(000) | 311 | 295 | 375 |
| Volume index. Base: 1956-57 (= 1000) | 1,380 | 1,590 | 1,680 | |
| Principal materials— | ||||
| Limestone | ton | 523,623 | 576,770 | 706,405 |
| Clay, marl, cement rock | ton | 601,167 | 674,842 | 678,944 |
| Gypsum | ton | 26,703 | 30,588 | 34,519 |
| Cement made | ton | 653,225 | 754,140 | 786,521 |
| Concrete Product | ||||
| Number of establishments | 299 | 304 | 307 | |
| Persons engaged | No. | 2,311 | 2,548 | 2,697 |
| Production costs— | ||||
| Salaries, wages | $(000) | 4,410 | 5,074 | 5,676 |
| Materials | $(000) | 6,586 | 7,832 | 9,090 |
| Other expenses | $(000) | 2,316 | 2,678 | 2,930 |
| Totals | $(000) | 13,312 | 15,584 | 17,696 |
| Value of production | $(000) | 15,554 | 18,468 | 20,758 |
| Value added in manufacture | $(000) | 8,968 | 10,636 | 11,666 |
| Net output (net value added) | $(000) | 6,764 | 8,078 | 8,880 |
| Overtime worked by wage earners | h(000) | 439 | 567 | 619 |
| Volume index. Base: 1956-57 (= 1000) | 1,343 | 1,569 | 1,700 | |
| Materials used— | ||||
| Portland cement | ton | 102,545 | 122,201 | 136,108 |
| Sand, shingle | yd | 441,672 | 572,647 | 707,317 |
| Reinforcing | ton | 12,287 | 14,338 | 17,119 |
| Pumice | yd | 64,326 | 31,032 | 27,508 |
| Principal products— | ||||
| Roofing tiles and ridges | No.(000) | 9,415 | 9,821 | 8,815 |
| Fencing posts | No.(000) | 2,587 | 2,709 | 2,646 |
| Telegraph and power poles* | No.(000) | 25 | 25 | 28 |
| Housing bricks and blocks | No.(000) | 13,592 | 16,820 | 20,257 |
| Pipes | ton | 122,629 | 152,449 | 156,204 |
| Prestressed concrete beams | No. | .. | .. | 6,611 |
| Plywood and Veneer | ||||
| Number of establishments | 9 | 11 | 10 | |
| Persons engaged | No. | 723 | 701 | 756 |
| Production costs— | ||||
| Salaries, wages | $(000) | 1,432 | 1,486 | 1,672 |
| Materials | $(000) | 2,914 | 3,142 | 3,334 |
| Other expenses | $(000) | 684 | 820 | 1,198 |
| Totals | $(000) | 5,028 | 5,450 | 6,204 |
| Value of production | $(000) | 5,982 | 6,126 | 6,794 |
| Value added in manufacture | $(000) | 3,070 | 2,984 | 3,460 |
| Net output (net value added) | $(000) | 2,388 | 2,178 | 2,300 |
| Overtime worked by wage earners | h(000) | 102 | 100 | 101 |
| Volume index. Base: 1956-57 (= 1000) | 1,647 | 1,455 | 1,672 | |
| Species of logs used— | ||||
| Rimu | ft(000) (H. Dahl) | 10,202 | 8,668 | 9,263 |
| Kahikatea | ft(000) (H. Dahl) | 1,584 | 1,961 | 1,615 |
| Radiata pine | ft(000) (H. Dahl) | 8,273 | 7,878 | 10,676 |
| Other | ft(000) (H. Dahl) | 1,177 | 1,840 | 1,321 |
| Veneer produced (1/16 in. basis) | sq. ft.(000) | 188,813 | 185,882 | 183,049 |
| Plywood made (3/16 in. basis) | sq. ft.(000) | 51,393 | 52,883 | 54,190 |
| Range Making* | ||||
| Number of establishments | 6 | 6 | 6 | |
| Persons engaged | No. | 1,044 | 1,010 | 992 |
| Production costs— | ||||
| Salaries, wages | $(000) | 1,848 | 1,830 | 1,904 |
| Materials | $(000) | 2,998 | 2,874 | 3,714 |
| Other expenses | $(000) | 782 | 772 | 866 |
| Totals | $(000) | 5,628 | 5,476 | 6,484 |
| Value of production | $(000) | 6,204 | 5,804 | 7,044 |
| Value added in manufacture | $(000) | 3,206 | 2,930 | 3,330 |
| Net output (net value added) | $(000) | 2,440 | 2,170 | 2,474 |
| Overtime worked by wage earners | h(000) | 113 | 96 | 54 |
| Volume index. Base: 1956-57 (= 1000) | 1,362 | 1,358 | 1,508 | |
| Iron and steel used | ton | 6,276 | 5,254 | 6,204 |
| Principal products— | ||||
| Domestic gas ranges | No. | 3,990 | 3,228 | 2,272 |
| Domestic electric ranges | No. | 37,895 | 40,321 | 44,272 |
| Domestic electric rangettes | No. | 3,296 | 3,144 | 3,181 |
| Domestic coal ranges, rangettes, destructors, and other stoves | No. | 5,098 | 4,006 | 3,329 |
| Radio and Television Assembly and Manufacture* | ||||
| Number of establishments | 33 | 35 | 34 | |
| Persons engaged | No. | 2,324 | 2,829 | 3,039 |
| Production costs— | ||||
| Salaries, wages | $(000) | 3,320 | 4,354 | 5,192 |
| Materials | $(000) | 12,382 | 17,454 | 21,720 |
| Other expenses | $(000) | 1,716 | 2,116 | 2,624 |
| Totals | $(000) | 17,418 | 23,926 | 29,536 |
| Value of production | $(000) | 19,378 | 28,886 | 34,936 |
| Value added in manufacture | $(000) | 6,996 | 11,432 | 13,216 |
| Net output (net value added) | $(000) | 5,404 | 9,464 | 10,726 |
| Overtime worked by wage earners | h(000) | 199 | 285 | 293 |
| Volume index. Base: 1956-57 (= 1000) | 3,370 | 5,222 | 6,682 | |
| Principal products— | ||||
| Radios— | ||||
| Car and portable | No. | 57,941 | 60,902 | 54,876 |
| Table | No. | 25,245 | 12,331 | 13,558 |
| Radiograms | No. | 20,284 | 20,443 | 11,317 |
| Television sets | No. | 63,989 | 113,904 | 162,813 |
| Motor-vehicle Assembly | ||||
| Number of establishments | 17 | 18 | 17 | |
| Persons engaged | No. | 3,217 | 3,915 | 4,090 |
| Production costs— | ||||
| Salaries, wages | $(000) | 6,802 | 8,546 | 9,750 |
| Materials | $(000) | 48,968 | 62,864 | 75,182 |
| Other expenses | $(000) | 2,274 | 2,474 | 2,962 |
| Totals | $(000) | 58,042 | 73,884 | 87,894 |
| Value of production | $(000) | 64,480 | 83,352 | 95,920 |
| Value added in manufacture | $(000) | 15,514 | 20,488 | 20,738 |
| Net output (net value added) | $(000) | 13,318 | 18,042 | 17,798 |
| Overtime worked by wage earners | h(000) | 765 | 978 | 1,439 |
| Volume index. Base: 1956-57 (= 1000) | 1,073 | 1,447 | 1,635 | |
| Vehicles assembled— | ||||
| Cars | No. | 36,357* | 51,538* | 58,015* |
| Vans | No. | 4,452 | 4,276 | 4,843 |
| Trucks | No. | 4,093 | 4,630 | 5,198 |
| Motor-body Building | ||||
| Number of establishments | 81 | 90 | 86 | |
| Persons engaged | No. | 1,302 | 1,406 | 1,523 |
| Production costs— | ||||
| Salaries, wages | $(000) | 2,348 | 2,668 | 2,942 |
| Materials | $(000) | 3,406 | 3,752 | 4,326 |
| Other expenses | $(000) | 638 | 722 | 934 |
| Totals | $(000) | 6,392 | 7,142 | 8,202 |
| Value of production | $(000) | 7,130 | 8,020 | 8,750 |
| Value added in manufacture | $(000) | 3,724 | 4,268 | 4,424 |
| Net output (net value added) | $(000) | 3,130 | 3,606 | 3,590 |
| Overtime worked by wage earners | h(000) | 164 | 191 | 229 |
| Main materials— | ||||
| Timber | ft b.m.(000) | 755 | 1,089 | 1,031 |
| Plywood | sq. ft.(000) | 526 | 752 | 722 |
| Paints and oils | gal(000) | 50 | 32 | 38 |
| Motor bodies built— | ||||
| Buses | No. | 219 | 231 | 235 |
| Vans | No. | 252 | 337 | 322 |
| Trucks— | ||||
| Cabs | No. | 90 | 111 | 117 |
| Trays | No. | 594 | 885 | 826 |
| Caravans | No. | 634 | 881 | 1,058 |
| Repairs to Motor Vehicle | ||||
| Number of establishments | 2,009 | 2,048 | 2,199 | |
| Persons engaged | No. | 17,098 | 17,867 | 19,055 |
| Production costs— | ||||
| Salaries, wages | $(000) | 27,668 | 29,942 | 33,200 |
| Materials | $(000) | 41,616 | 45,690 | 51,522 |
| Other expenses | $(000) | 9,440 | 10,332 | 11,626 |
| Totals | $(000) | 78,724 | 85,964 | 96,346 |
| Value of production | $(000) | 84,586 | 92,122 | 103,626 |
| Value added in manufacture | $(000) | 42,970 | 46,432 | 52,106 |
| Net output (net value added) | $(000) | 34,060 | 36,674 | 41,168 |
| Overtime worked by wage earners | h(000) | 1,036 | 1.167 | 1.354 |
| Sheet-metal Working | ||||
| Number of establishments | 174 | 188 | 195 | |
| Persons engaged | No. | 4,761 | 5,040 | 5,335 |
| Production costs— | ||||
| Salaries, wages | $(000) | 9,002 | 9,974 | 11,214 |
| Materials | $(000) | 16,744 | 18,574 | 21,684 |
| Other expenses | $(000) | 4,184 | 4,802 | 5,576 |
| Totals | $(000) | 29,930 | 33,350 | 38,474 |
| Value of production | $(000) | 33,960 | 38,080 | 44,118 |
| Value added in manufacture | $(000) | 17,216 | 19,506 | 22,436 |
| Net output (net value added) | $(000) | 13,320 | 15,010 | 17,152 |
| Overtime worked by wage earners | h(000) | 1,006 | 903 | 1,224 |
| Volume index. Base: 1956-57 (= 1000) | 1,757 | 1,924 | 2,373 | |
| Metal Products n.e.i. | ||||
| Number of establishments | 261 | 291 | 316 | |
| Persons engaged | No. | 4,941 | 5,324 | 6,143 |
| Production costs— | ||||
| Salaries and wages | $(000) | 9,722 | 11,060 | 13,572 |
| Materials | $(000) | 18,440 | 18,916 | 27,076 |
| Other expenses | $(000) | 5,210 | 5,974 | 7,464 |
| Totals | $(000) | 33,370 | 35,950 | 48,112 |
| Value of production | $(000) | 35,978 | 40,672 | 54,708 |
| Value added in manufacture | $(000) | 17,538 | 21,756 | 27,634 |
| Net output (net value added) | $(000) | 12,870 | 16,344 | 20,838 |
| Overtime worked by wage earners | h(000) | 1,063 | 1,183 | 1,474 |
| Agricultural and Pastoral Machinery | ||||
| Number of establishments | 80 | 94 | 108 | |
| Persons engaged | No. | 892 | 1,022 | 1,240 |
| Production costs— | ||||
| Salaries, wages | $(000) | 1,572 | 1,888 | 2,444 |
| Materials | $(000) | 6,260 | 9,182 | 12,238 |
| Other expenses | $(000) | 598 | 736 | 958 |
| Totals | $(000) | 8,428 | 11,806 | 15,640 |
| Value of production | $(000) | 9,238 | 13,430 | 17,352 |
| Value added in manufacture | $(000) | 2,980 | 4,248 | 5,114 |
| Net output (net value added) | $(000) | 2,434 | 3,582 | 4,246 |
| Overtime worked by wage earners | h(000) | 97 | 126 | 190 |
| Machinery n.e.i | ||||
| Number of establishments | 531 | 570 | 670 | |
| Persons engaged | No. | 10,426 | 11,245 | 12,650 |
| Production costs— | ||||
| Salaries, wages | $(000) | 20,276 | 22,918 | 27,514 |
| Materials | $(000) | 27,820 | 33,972 | 40,812 |
| Other expenses | $(000) | 8,146 | 8,868 | 10,234 |
| Totals | $(000) | 56,244 | 65,758 | 78,560 |
| Value of production | $(000) | 62,364 | 72,848 | 88,314 |
| Value added in manufacture | $(000) | 34,542 | 38,876 | 47,504 |
| Net output (net value added) | $(000) | 26,926 | 30,666 | 38,020 |
| Overtime worked by wage earners | h(000) | 1,850 | 2,095 | 2,544 |
| Principal products*— | ||||
| Washing machines | No. | 39,819 | 42,102 | 45,770 |
| Refrigerators (home, commercial and freezers) | No. | 37,668 | 53,728 | 52,806 |
| Industrial machinery— | ||||
| Mining, quarrying | $(000) | 462 | 684 | 1,242 |
| Road construction | $(000) | 1,106 | 1,756 | 2,412 |
| Logging, sawmilling, woodworking | $(000) | 1,264 | 1,462 | 1,750 |
| Refrigeration | $(000) | 1,534 | 1,610 | 1,860 |
| Heating, air-conditioning | $(000) | 1,922 | 2,456 | 3,204 |
| Dairy factory | $(000) | 1,980 | 1,770 | 2,158 |
| Pumping | $(000) | 1,266 | 1,300 | 1,600 |
| Other | $(000) | 8,054 | 14,406 | 18,494 |
| Lawn mowers—hand and power | No. | 54,286 | 66,264 | 61,477 |
| Repairs to machinery | $(000) | 13,056 | 13,274 | 15,432 |
GENERAL—With minor fluctuation there has been a steady long-term increase in the building of houses and flats to meet the housing needs of a growing population, while the expansion of industry, trade, and commerce has led to extensive construction of factories, shops, warehouses, and offices. The erection of more multi-storey buildings, including blocks of flats, in the inner city areas has been a feature of building construction in recent years.
A Census of Building and Construction was taken for the production year 1963–64 and the value of work done totalled $616 million. Private enterprise contributed $398.4 million or 64.7 percent, Government Departments with their own employees $120.6 million or 19.6 percent, local authorities with their own employees $72.2 million or 11.7 percent, and owner-builders $24.6 million or 4.0 percent.
In the main analysis there was an unavoidable double count of the work done by subcontractors involving $88.4 million and this brought the aggregate figure for value of work done to $704 million. This consisted of $450.8 million or 64.0 percent on the construction, alteration, maintenance, repair, and demolition of buildings; $106.6 million or 15.1 percent on roads, railways, bridges, tunnels, dams, drains, wharves and jetties; $79.0 or 11.2 percent on power, telephone and telegraph line erection, cable laying and electric power stations; $25.0 million or 3.5 percent on land drainage, sewerage, river protection, irrigation schemes, water supply and well drilling; $22.4 million or 3.2 percent on earth moving, reclamation, land development, aerodromes and airstrips; $3.2 million on the removal of overburden for mines or quarries; and $17.4 million on plant hire and activities not otherwise included.
In the post-war years building and construction activity has absorbed a growing proportion of the labour force, and there has been phenomenal growth in the cost of buildings erected. The value of building permits issued in 1945–46 was $41.4 million, in 1950–51, $92.5 million, in 1955–56, $180.4 million, in 1960–61, $269.4 million, and in 1965–66, $381.8 million. The permit values for houses and flats in corresponding years were as follows: 1945–46, $27.8 million; 1950–51, $65.5 million; 1955–56, $103.0 million; 1960–61, $145.0 million; and 1965–66, $176.4 million.
In June 1965 the Government introduced a building programme procedure under the Economic Stabilisation Act in terms of which the issue of building permits for works of an estimated value of more than $60,000 can be deferred for periods of up to three years.
In November 1965 the Government set up a Building Industry Advisory Council with a view to assessing current and future demands on the industry and relating them to such matters as the labour situation, financial problems, improved efficiency, and building research.
In proportion to population the building rate for houses and flats is relatively high. Approximately 90 percent of the dwellings completed annually are privately built, the balance being erected by Government agencies.
Trends in Average Costs—The following table illustrates trends in the cost of building activity over a period with general characteristics of rising costs.
| Type of Building | Cost at End of Year | |||||
|---|---|---|---|---|---|---|
| 1939 | 1950 | 1955 | 1960 | 1965 | 1966 | |
| $ | $ | $ | $ | $ | $ | |
| State rental house (976 square feet) | 2,122 | 4,344 | 5,164 | 5,528 | 6,164 | 6,164 |
| Buildings (reinforced concrete): For similar size and type | 20,000 | 50,200 | 57,600 | 64,200 | 73,400 | 75,000 |
PRIVATE CONTRACTORS—The business of private contractors in building and construction in 1963–64 is summarised in the following table. Further information is given in Building and Construction 1963–64, a report of the Department of Statistics (available at Government bookshops).
| Nature of Business | Units | Persons Engaged | Salaries and Wages | Working Proprietors | Materials | Value of Work Done | ||
|---|---|---|---|---|---|---|---|---|
| As Main Contractor | As Subcontractor | Total | ||||||
| No. | No | $(m) | No. | $(m) | $(m) | $(m) | $(m) | |
| Building contractor | 4,851 | 25,812 | 49.5 | 4,377 | 109.5 | 281.8 | 11.8 | 293.6 |
| Civil engineering contractor | 444 | 5,686 | 12.5 | 232 | 18.0 | 47.7 | 6.0 | 53.6 |
| Shop and office fitter | 51 | 280 | .5 | 31 | 1.0 | 2.0 | .2 | 2.2 |
| Electrical contractor | 838 | 2,936 | 4.9 | 544 | 12.6 | 12.5 | 11.0 | 23.5 |
| Plumber | 1,078 | 3,142 | 5.3 | 893 | 15.6 | 13.8 | 14.7 | 28.6 |
| Painter | 1,237 | 3,336 | 5.9 | 1,247 | 4.6 | 9.3 | 7.5 | 16.8 |
| Drainlayer | 197 | 552 | 1.0 | 174 | 1.9 | 2.8 | 2.1 | 4.9 |
| Plasterer | 375 | 1,401 | 2.5 | 362 | 2.2 | 1.5 | 5.9 | 7.4 |
| Roofing contractor | 77 | 504 | 1.0 | 23 | 3.5 | 1.1 | 4.4 | 5.5 |
| Bricklayer | 306 | 811 | 1.4 | 304 | 2.7 | 1.0 | 5.2 | 6.2 |
| Glazier | 76 | 536 | 1.0 | 17 | 2.5 | .4 | 4.0 | 4.4 |
| Flooring contractor | 127 | 529 | 1.1 | 90 | 2.4 | 2.1 | 2.8 | 4.9 |
| Earth mover | 198 | 960 | 2.0 | 105 | 1.1 | 8.5 | 1.9 | 10.3 |
| Road sealer | 34 | 455 | 1.0 | 14 | 2.3 | 5.1 | .5 | 5.6 |
| Other | 210 | 2,615 | 5.4 | 96 | 7.8 | 9.0 | 10.3 | 19.3 |
| Totals | 10,099 | 49,555 | 95.2 | 8,509 | 187.6 | 398.5 | 88.4 | 486.9 |
HOUSING CONSTRUCTION: Government Encouragement to Housing—The impetus of post-war housing levelled off in the early 1950s and led the Government in 1953 to call a National Housing Conference. This conference, which was attended by organisations and persons associated with housing, surveyed the general housing situation and investigated ways and means of implementing the Government's housing policy of promoting the building of more houses at a reasonable cost. Every aspect of housing was discussed, and the action taken on resolutions adopted by the conference helped to effect the expansion in house building to the present level. The conference assessed the extent of the housing shortage and set a number of 206,000 houses in 10 years as a target to overcome the shortage and provide for the increase in population expected from both natural increase and immigration. At the end of the 10 years a total of 203,200 house units was actually constructed.
A National Housing Council representing all interests in the housing field meets periodically when convened by the Government to continue the work of the conference. Various housing schemes have been introduced, the most noteworthy being the group building scheme designed to give builders continuity of work and reduce non-productive time. By 1966 a total of 18,960 houses had been completed under this scheme.
In October 1966 the National Housing Council recommended to the Government that provision be made for the construction of a total of 138,000 houses over the five years to March 1971, the projected total for each year being subject to annual review.
To encourage home ownership and to show the latest developments in low-and moderate-cost housing, the National Housing Council has sponsored the holding of Parades of Homes. Since 1954 over 50 of these exhibitions have been held in major cities and towns throughout New Zealand, and they have attracted the keen interest of home seekers and others wishing to improve their existing homes.
Encouragement has been given to the construction of blocks of flats by private enterprise through the introduction of a plan for individually owned flats. A company is formed to construct or take over a new flats building, and ownership of a block of shares in the company entitles the holder to occupy a particular flat. Amendments have been made to the Companies Act to facilitate the operation of the system. In major cities most new flats are now constructed on this basis, and the scheme is rapidly gaining in popularity.
Since 1937 the State, using the services of private contractors, has been building rental dwellings. At 31 March 1966, 66,765 of these houses and flats had been built and, since 1950, 20,384 of them had been sold to the occupiers. About 1,600 of these dwellings are now built each year and let to applicants in difficult housing circumstances with an income of not more than $1,800 a year. Some 400 houses are also built by the State each year for the accommodation of Government employees.
Under the Housing Improvement Act 1945 local authorities can take action to rebuild decadent central city areas. Reclamation schemes are in progress at Auckland, Wellington, and Christchurch, assisted with Government finance. With the view to expediting the renewal of older residential areas of major cities, a committee of interested bodies has been established to study the whole question of urban renewal and to report and make recommendations to the Government.
Government Capital Assistance on New Housing—The following table gives the Government's total capital assistance on new housing in the latest two years and includes both direct expenditure by Government Departments and money advanced by way of mortgages and loans by the State Advances Corporation and Maori Affairs Department and amounts advanced in capitalisation of family benefits payable under social security. Expenditure on new housing by hospital boards, education boards, etc., is not included.
| 1964–65 | 1965–66 | |
|---|---|---|
| $(000) | ||
| Land purchase and development, State house construction, etc. | 15,340 | 14,686 |
| Expenditure by Housing Division for other Departments | 2,272 | 5,666 |
| Department of Maori Affairs | 7,294 | 7,418 |
| Department of Lands and Survey | 472 | 398 |
| State Advances and rehabilitation loans paid out for new urban houses | 46,708 | 45,694 |
| State Advances and rehabilitation loans paid out for new rural houses | 1,112 | 1,174 |
| State Advances loans paid to local authorities for rural housing, pensioners' housing, etc. | 2,398 | 3,564 |
| Department of Health subsidies paid to local authorities for pensioners' flats | 960 | 884 |
| Advances under capitalisation of family benefits | 9,328 | 8,776 |
| Totals | 85,884 | 88,260 |
HOUSES AND FLATS COMPLETED—Statistics of completed houses and flats include any new flats which are created by the conversion of existing buildings. All houses and flats completed by the Government are included.
Statistics of completions are given in the following table.
| Year Ended 31 March | Houses and Flats Completed |
|---|---|
| 1950 | 15,800 |
| 1951 | 16,400 |
| 1952 | 16,300 |
| 1953 | 16,100 |
| 1954 | 16,600 |
| 1955 | 18,500 |
| 1956 | 19,200 |
| 1957 | 19,200 |
| 1958 | 18,600 |
| 1959 | 19,600 |
| 1960 | 21,600 |
| 1961 | 23,500 |
| 1962 | 24,300 |
| 1963 | 22,100 |
| 1964 | 21,100 |
| 1965 | 23,500 |
| 1966 | 26,000 |
| 1967 | 24,700 |
In 1965–66 the number of houses and flats built was approaching the relatively high proportion of 10 per 1,000 population.
PROJECTIONS OF PERMANENT PRIVATE DWELLINGS—The following table of housing projections is a summarised version of one prepared by the Government Statistician for the Targets Subcommittee of the National Housing Council.
Projections were prepared on two bases—constant demand per 1,000 and progressively increasing demand. The figure of 0.81 percent per year, expressing the average annual increase in housing requirements per thousand persons in each age or marital group, was based on 1961 to 1966 experience.
For many years past, each census has revealed an increase in the housing requirements per thousand of population. This is a result, among other things, of progress made in overtaking housing backlogs, and of improving living standards. As living standards rise, families are less willing to share houses with relatives or to take in boarders, and the former boarders tend to move into flats; the age of marriage falls, and young married couples launch out on their own instead of living with “in-laws”: rooms are added to existing houses as growing families feel the need for more space; and more and more families are able to indulge in seaside holiday homes and baches.
The starting point for these projections was an estimated total of 714,800 inhabited permanent private dwellings and 70,000 uninhabited dwellings at the 1966 Census of Population and Dwellings. Total permanent private dwellings include both occupied and unoccupied; and allowance was made for an annual loss of dwellings through demolition, etc., amounting to 0.7 percent of the total number.
A net migration inflow of 13,000 per annum was assumed. For each 1,000 by which the actual figure exceeds (or falls short of) this total the following adjustment in the required number of new houses should be made:
1967, 1968; + or - 300: 1969–1971; + or - 400.
| (a) Housing Requirements per 1,000 Constant at 1966 Level* | ||
|---|---|---|
| Year Ended 31 March | Total Permanent Private Dwellings | Total New Dwellings Needed |
| (000) | (000) | |
| 1967 | 799.2 | 19.9 |
| 1968 | 814.2 | 20.6 |
| 1969 | 829.9 | 21.4 |
| 1970 | 846.2 | 22.1 |
| 1971 | 863.1 | 22.8 |
| 1972 | 880.6 | 23.5 |
| 1973 | 898.8 | 24.4 |
| 1974 | 971.7 | 25.2 |
| 1975 | 937.3 | 26.0 |
| 1976 | 957.5 | 26.8 |
| 1977 | 978.3 | 27.5 |
| (b) Housing Requirements per 1.000 Increase by 0.81 Percent Annually* | ||
|---|---|---|
| Year Ended 31 March | Total Permanent Private Dwellings | Total New Dwellings Needed |
* New dwellings needed if housing requirements per thousand in each age and marital status group (a) remain constant at the 1966 level ((b) start at the 1966 level and increase by 0.81 percent per annum. | ||
| (000) | (000) | |
| 1967 | 805.6 | 26.3 |
| 1968 | 827.5 | 27.5 |
| 1969 | 850.2 | 28.5 |
| 1970 | 873.9 | 29.7 |
| 1971 | 898.5 | 30.7 |
| 1972 | 924.2 | 32.0 |
| 1973 | 951.0 | 33.3 |
| 1974 | 978.9 | 34.6 |
| 1975 | 1007.9 | 35.9 |
| 1976 | 1038.0 | 37.2 |
| 1977 | 1069.1 | 38.4 |
BUILDING PERMITS—The returns from local authorities that operate a building-permit system cover all private and local authority building subject to permit. To enable a complete picture of building activity to be shown, construction commenced by Government Departments, hospital, and education boards is included, even though permits are not actually taken out.
The value shown represents in the majority of instances the total contract price or estimated cost of the building. A permit for a large building may involve work spread over several years whereas in the permit statistics the value is shown entirely for the year or month in which the permit is issued. This qualification applies more particularly to large buildings than to houses and small blocks of flats.
The value placed on a building for the purposes of the permit is usually less than the actual cost. This applies particularly to large new buildings which take a considerable time to complete. In these cases the final cost, owing to wage increases, rising costs of materials, etc., may be greater than originally estimated. This increase is not reflected in building permit figures.
The values of building permits for the latest five years are analysed by types of building in the following table. Permits cover alterations and additions as well as new buildings.
| Type of Building | Year Ended 31 March | ||||
|---|---|---|---|---|---|
| 1962 | 1963 | 1964 | 1965 | 1966 | |
| * Includes ancillary buildings. | |||||
| $(000) | |||||
| Houses and flats (new) | 138,626 | 129,238 | 139,796 | 165,306 | 176,406 |
| Houses and flats (alteration and additions) | 17,514 | 18,694 | 20,350 | 22,370 | 25,233 |
| Hotels and boarding houses | 6,566 | 10,002 | 11,212 | 10,080 | 17,084 |
| Hospitals* | 7,384 | 8,520 | 5,804 | 18,598 | 11,012 |
| Factories | 22,094 | 30,196 | 26,318 | 34,708 | 41,440 |
| Commercial buildings | 30,944 | 42,892 | 56,458 | 59,746 | 57,758 |
| Schools* | 19,540 | 17,212 | 14,300 | 23,958 | 19,690 |
| Miscellaneous (including churches, sports, and entertainment buildings) | 16,486 | 17,478 | 20,316 | 22,938 | 33,084 |
| Totals | 259,154 | 274,232 | 294,554 | 357,704 | 381,709 |
In the following table the numbers of permits for new houses and flats over a period of 11 years are shown, along with permit values.
| Year Ended 31 March | Number of New Houses and Flats | Value of New Houses and Flats | Value of Other New Buildings | Total Value All Buildings (Including Alterations and Additions) | ||
|---|---|---|---|---|---|---|
| Private | Government | Total | ||||
| $(000) | $(000) | $(000) | ||||
| 1956 | 16,234 | 3,270 | 19,504 | 102,972 | 39,180 | 180,346 |
| 1957 | 15,694 | 2,660 | 18,354 | 98,428 | 43,359 | 178,776 |
| 1958 | 16,985 | 1,970 | 18,955 | 105,008 | 55,357 | 203,533 |
| 1959 | 18,121 | 2,447 | 20,568 | 114,027 | 43,350 | 202,932 |
| 1960 | 20,527 | 3,051 | 23,578 | 132,678 | 43,754 | 228,026 |
| 1961 | 21,648 | 2,749 | 24,397 | 144,952 | 46,270 | 269,424 |
| 1962 | 20,325 | 2,069 | 22,394 | 138,627 | 40,844 | 259,154 |
| 1963 | 18,448 | 2,188 | 20,636 | 129,239 | 60,257 | 274,232 |
| 1964 | 19,822 | 1,941 | 21,763 | 139,796 | 64,639 | 294,554 |
| 1965 | 23,361x | 1,996x | 25,357 | 165,305 | 97,129 | 357,704 |
| 1966 | 23,625 | 2,307 | 25,932 | 176,406 | 81,627 | 381,709 |
The average permit value for houses and flats in 1965–66 was $6,802, compared with $6,518 in 1964–65 and $6,424 in 1963–64.
During the year ended 31 March 1966 there were permits issued for 1,568 blocks of flats, totalling 5,675 individual units.
The following diagram illustrates building-permit figures for new houses and flats.
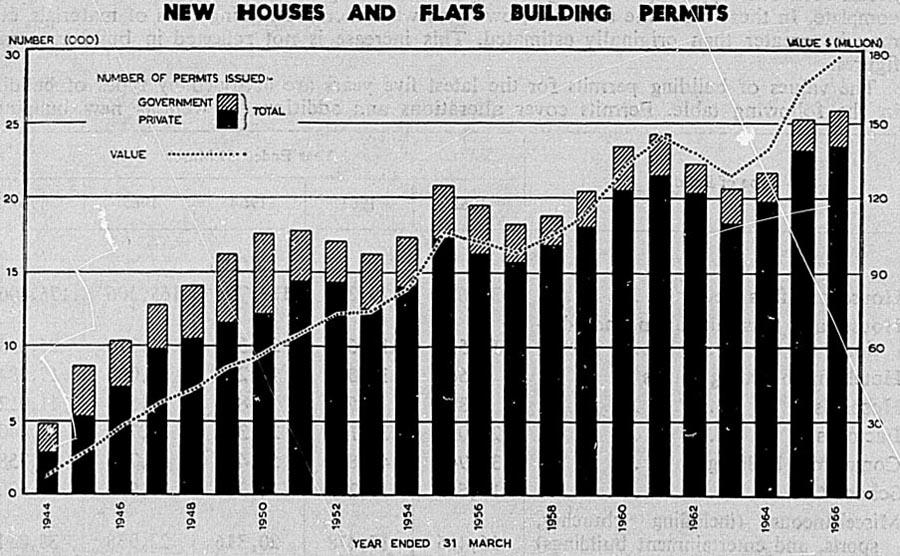
The following table shows details for the latest 12 years of blocks of flats included in the numbers of permits for houses and flats issued. These figures do not include motels or holiday flats as these are included in commercial buildings with hotels, etc.
| Year Ended 31 March | Blocks of Flats | Number of Flats in Blocks | Flats Created by Conversions | Total Flats |
|---|---|---|---|---|
| 1955 | 141 | 615 | .. | .. |
| 1956 | 140 | 613 | ||
| 1957 | 193 | 620 | 682 | 1,302 |
| 1958 | 305 | 1,041 | 711 | 1,752 |
| 1959 | 299 | 1,039 | 810 | 1,849 |
| 1960 | 390 | 1,440 | 899 | 2,339 |
| 1961 | 367 | 1,347 | 860 | 2,207 |
| 1962 | 420 | 1,577 | 470 | 2,047 |
| 1963 | 545 | 2,012 | 404 | 2,416 |
| 1964 | 1,013 | 3,375 | 752 | 4,127 |
| 1965 | 1,589 | 5,462 | 1,059 | 6,521 |
| 1966 | 1,568 | 5,675 | 1,248 | 6,923 |
Since the year 1961–62 additional information makes it reasonably certain that the figures for flats created by conversion refer to complete units. In earlier years the figures are known to include some apartments not completely self-contained.
The following table gives a summary of building permits (including State building operations) for the latest two years by number and value for urban and rural districts.
The urban districts include all cities, boroughs, and town districts, and seven urban counties; they do not conform with urban areas as defined for population statistics.
| Districts | 1964–65 | 1965–66 | ||||
|---|---|---|---|---|---|---|
| New Houses and Flats: Number | New Houses and Flats: Value | Total, All Buildings: Value | New Houses and Flats: Number | New Houses and Flats: Value | Total, All Buildings: Value | |
| $(000) | $(000) | $(000) | $(000) | |||
| Urban districts | 21,549 | 139,646 | 302,160 | 21,295 | 144,178 | 314,644 |
| Rural districts | 3,808 | 25,660 | 55,544 | 4,637 | 32,228 | 67,065 |
| Totals, New Zealand | 25,357 | 165,306 | 357,704 | 25,932 | 176,406 | 381,709 |
There were 2,307 Government houses and flats (1,521 in urban and 786 in rural districts) commenced in 1965–66 compared with 1,996 (1,674 in urban and 322 in rural districts) in 1964–65. The value of houses and flats commenced in 1965–66 was $15,567,846 as against $12,970,250 in 1964–65. The average value for Government houses and flats was $6,748 in 1965–66, as against $6,498 in 1964–65.
In 1965–66 the number of permits for houses and flats in urban districts showed a decrease of 254, or 1.18 percent, compared with 1964–65.
The value of permits for houses and flats in 1965–66 increased by $4,532,720, or 3.25 percent, on the preceding year.
The following table arranges urban local authorities with building values of over $1,000,000 in 1965–66 in descending order.
| $(000) | |
|---|---|
| Auckland city | 33,749 |
| Wellington city | 24,831 |
| Manukau city | 19,873 |
| Waitemata county | 18,552 |
| Christchurch city | 16,100 |
| Hutt county | 11,624 |
| Hamilton city | 10,690 |
| Waimairi county | 9,077 |
| Invercargill city | 8,471 |
| Lower Hutt city | 7,959 |
| Whangarei city | 7,072 |
| Dunedin city | 6,418 |
| Palmerston North city | 5,949 |
| Porirua city | 5,044 |
| Rotorua city | 5,035 |
| Hastings city | 4,162 |
| Takapuna city | 3,969 |
| Tauranga city | 3,918 |
| One Tree Hill | 3,899 |
| Napier city | 3,840 |
| New Plymouth city | 3,728 |
| Gisborne city | 3,649 |
| Mount Wellington | 3,386 |
| Onehunga | 3,023 |
| Paparua county | 2,995 |
| Nelson city | 2,909 |
| Upper Hutt city | 2,864 |
| Timaru city | 2,553 |
| Wanganui city | 2,511 |
| Birkenhead | 2,330 |
| Papakura | 2,296 |
| Mount Roskill | 2,294 |
| East Coast Bays | 2,221 |
| Levin | 2,188 |
| Mount Eden | 2,142 |
| Papatoetoe city | 2,037 |
| Northcote | 1,941 |
| Blenheim | 1,881 |
| Mount Albert | 1,733 |
| Petone | 1,666 |
| Heathcote county | 1,583 |
| Masterton | 1,580 |
| Otahuhu | 1,574 |
| Mount Maunganui | 1,571 |
| Ashburton | 1,526 |
| Howick | 1,483 |
| Kamo | 1,411 |
| Pukekohe | 1,395 |
| Whakatane | 1,375 |
| New Lynn | 1,370 |
| Tawa | 1,285 |
| Taupo | 1,197 |
| Oamaru | 1,170 |
| Ellerslie | 1,075 |
Building Permits in Rural Districts—The counties of Waitemata, Hutt, Waimairi, Heathcote, Paparua, Peninsula, and Taieri are largely urban in character and their permits are included under the urban districts. The tabulation for rural districts is therefore confined to the remaining counties and Waiheke Island.
Government building in rural districts has been included.
Excluding the seven counties which are included in urban districts, the total value of rural building in 1965–66 amounted to $67,064,932, an increase of $11,521,374 as compared with the 1964–65 figures for the same districts. The number of new dwellings was 4,637, an increase of 829 on the preceding year.
The following table arranges rural local authorities with building values of over $1,000,000 in 1965–66 in descending order.
| County | $(000) |
|---|---|
| Taupo | 5,446 |
| Southland | 3,648 |
| Matamata | 3,058 |
| Wallace | 3,031 |
| Waipa | 2,921 |
| Whangarei | 2,231 |
| Rotorua | 2,126 |
| Hawke's Bay | 1,885 |
| Rangitikei | 1,871 |
| Tauranga | 1,615 |
| Kairanga | 1,544 |
| Horowhenua | 1,439 |
| Franklin | 1,357 |
| Waimea | 1,347 |
| Waikato | 1,312 |
| Taranaki | 1,286 |
| Tuapeka | 1,285 |
| Bay of Islands | 1,238 |
| Whakatane | 1,098 |
The total value of building for the seven counties included in the total for urban districts in 1965–66 was $44,510,910, and the number of new houses and flats in these areas was 3,488. The comparable value for 1964–65 was $51,704,352 and the number of new houses and flats 4,961.
Other Government Building Operations—In 1965–66 Government buildings commenced, other than houses and flats, totalled $7,786,348 in value. The comparable figure for 1964–65 was $8,844,940. Buildings erected by or for hospital or education boards are not included in these figures but are included in the total building statistics quoted previously. For the year ended 31 March 1966 the value of buildings commenced for hospital boards amounted to $10,324,682, while work commenced for education boards was valued at $10,798,418. The comparable figures for 1964–65 were hospital boards $16,727,376; education boards $14,379,754.
Sector of Ownership—An analysis is given of the sector of ownership for permit values.
| Sector of Ownership | Commercial Buildings | Houses and Flats | All Buildings | |||
|---|---|---|---|---|---|---|
| 1964–65 | 1965–66 | 1964–65 | 1965–66 | 1964–65 | 1965–66 | |
| $(million) | ||||||
| Private enterprise | 43.2 | 45.8 | 26.0 | 27.4 | 118.6 | 137.4 |
| Households | 0.6 | 0.2 | 145.8 | 155.8 | 158.0 | 167.6 |
| Central government | 7.6 | 4.4 | 13.2 | 15.8 | 48.2 | 48.2 |
| Public corporations | 2.6 | 4.2 | 0.1 | 0.1 | 3.6 | 5.2 |
| Local government | 5.8 | 3.0 | 2.6 | 2.6 | 29.4 | 23.2 |
The values for other types of building for 1964–65 and 1965–66 respectively were: factories $34.8 million and $41.4 million (mostly private enterprises); hotels, etc., $10.0 million and $17.0 million (mostly private enterprises); hospitals, etc., $18.6 million and $11.0 million (mostly local government); schools, etc., $24.0 million and $19.6 million (mostly Central Government); miscellaneous buildings, including churches, sports, and entertainment buildings, $23.0 million and $33.0 million.
WORK PUT IN PLACE—The Department of Statistics now makes a quarterly survey of building work put in place. These statistics differ conceptually from those in the building permits section in that (i) there is a variable time lag between the issue of a permit and the commencement of building, (ii) the building work covered by a permit extends over a time period, in some cases many calendar quarters, and (iii) the total value of work carried out on a building may differ from the permit value as a result of unanticipated rises in building material costs and wage rises after the permit issue. The statistics are based on a sample survey.
| Quarter Ended | Dwellings | ||||
|---|---|---|---|---|---|
| New Houses and Flats | Alterations and Additions | Total | |||
| Government | Other | Total | |||
| Value of Work Put in Place§ $(million) | |||||
| 1965—June | 3.4 | 42.7 | 46.1 | 6.7 | 52.7 |
| September | 3.8 | 46.5 | 50.2 | 6.3 | 56.6 |
| December | 4.7 | 42.8 | 47.6 | 7.2 | 54.7 |
| 1966—March | 4.1 | 35.9 | 40.0 | 6.6 | 46.6 |
| June | 4.7 | 38.4 | 43.1 | 7.6 | 50.7 |
| September | 5.2 | 41.2 | 40.4 | 6.9 | 53.3 |
| December | 4.6 | 41.2 | 45.8 | 7.2 | 53.1 |
| Quarter Ended | Other Buildings* | Grand Total | ||||||
|---|---|---|---|---|---|---|---|---|
| Hotels, Boarding Houses† | Hospitals† | Factories | Commercial Buildings | Schools† | Miscellaneous‡ | Total | ||
* Includes alterations and additions. † And ancillary buildings. † Including churches, sports, and entertainment buildings. § Value of work actually put in place in each calendar quarter. | ||||||||
| Value of Work Put in Place § $ (million) | ||||||||
| 1965—June | 2.6 | 1.9 | 12.3 | 15.2 | 4.9 | 6.7 | 43.7 | 96.4 |
| September | 2.9 | 2.1 | 12.3 | 18.2 | 4.4 | 6.7 | 46.6 | 103.2 |
| December | 3.1 | 1.9 | 12.0 | 15.1 | 4.5 | 7.6 | 44.2 | 98.9 |
| 1966—March | 2.4 | 1.6 | 10.9 | 14.4 | 4.9 | 6.7 | 40.9 | 87.5 |
| June | 2.7 | 2.5 | 11.3 | 15.3 | 4.7 | 8.0 | 44.3 | 95.0 |
| September | 3.7 | 2.3 | 10.7 | 16.6 | 5.3 | 8.7 | 47.5 | 100.8 |
| December | 4.4 | 2.7 | 8.9 | 14.8 | 5.5 | 8.6 | 44.9 | 98.0 |
BUILDING MATERIALS—Most materials with the major exception of steel and galvanised iron are produced in New Zealand and current production is meeting demand. Although supplies of imported materials are restricted under the system of import licensing, building operations have not been seriously hampered by lack of supplies. Expansion still continues in the quantity and range of materials and fittings manufactured in New Zealand.
Availability of Principal Building Materials—The following tables show the availability of the principal building materials.
The first of the two relates to the production of materials.
| PRODUCTION OF PRINCIPAL BUILDING MATERIALS | ||||||||
|---|---|---|---|---|---|---|---|---|
| Production Year | Rough-sawn Timber* | Dressed Timber (from Rough-sawn) | Building Sheet† | Plywood | Wall-board‡ | Paints, etc. | ||
| Paints and Enamels | Varnishes | Lacquers | ||||||
* Source: New Zealand Forest Service, for years ended 31 March. †Asbestos cement and cement sheet. ‡Includes fibrous plasterboard. | ||||||||
| ft. b.m. (million) | sq. ft. (million) | gal (thousand) | ||||||
| 1955–56 | 625.8 | 121.1 | 28.4 | 35.7 | 132.0 | 2,604 | 115 | 171 |
| 1956–57 | 596.9 | 110.1 | 26.2 | 37.8 | 125.1 | 2,650 | 110 | 173 |
| 1957–58 | 596.8 | 105.7 | 28.1 | 38.8 | 125.5 | 2,763 | 140 | 211 |
| 1958–59 | 636.8 | 119.3 | 28.7 | 40.0 | 141.2 | 2,892 | 128 | 217 |
| 1959–60 | 693.8 | 128.4 | 31.6 | 43.1 | 153.1 | 3,033 | 118 | 256 |
| 1960–61 | 714.1 | 144.4 | 33.8 | 48.0 | 170.8 | 3,134 | 115 | 264 |
| 1961–62 | 692.6 | 157.0 | 31.3 | 49.3x | 188.4 | 3,016 | 130 | 270 |
| 1962–63 | 643.4 | 160.2 | 28.3 | 51.4 | 170.3 | 3,096 | 126 | 294 |
| 1963–64 | 666.0 | 154.0 | 30.1 | 52.9 | 168.7 | 3,321 | 136 | 346 |
| 1964–65 | 736.2 | 176.8 | 31.2 | 54.2 | 192.9 | 3,636 | 138 | 370 |
| 1965–66 | 756.9 | 34.6 | 56.6 | 197.5 | 3,617 | 157 | 345 | |
| Production Year | Concrete Roofing Tiles | Bricks and Blocks | Drainpipes, Salt Glazed, 6 in. and Below | Cement | ||
|---|---|---|---|---|---|---|
| Building Bricks, Clay | Concrete | |||||
| Bricks | Blocks | |||||
| * In millions of effective running feet. | ||||||
| No. (million) | tons (000) | |||||
| 1955–56 | 12.4 | 48.1 | 0.3 | 5.5 | 2.37 | 422.7 |
| 1956–57 | 10.2 | 43.8 | 0.5 | 5.7 | 2.39 | 472.1 |
| 1957–58 | 9.3 | 49.3 | 0.6 | 6.7 | 2.35 | 544.0 |
| 1958–59 | 9.4 | 52.2 | 0.6 | 8.2 | 2.28 | 542.1 |
| 1959–60 | 11.4 | 50.9 | 0.5 | 10.1 | 2.76 | 575.4 |
| 1960–61 | 11.0 | 56.4 | 0.6 | 12.5 | 2.88 | 619.6 |
| 1961–62 | 11.2 | 60.5 | 0.5 | 12.4 | 3.09 | 647.9 |
| 1962–63 | 9.4 | 46.8 | 1.4 | 12.2 | 3.06 | 653.2 |
| 1963–64 | 9.8 | 50.2 | 0.8 | 15.2 | 5.82* | 754.1 |
| 1964–65 | 8.8 | 51.7 | 0.8 | 18.6 | 6.95* | 786.5 |
| 1965–66 | 5.9 | 52.4 | 1.3 | 23.8 | 6.89* | 841.1 |
To complete the review, the second table deals with imports of materials.
| IMPORTS OF PRINCIPAL BUILDING MATERIALS | ||||||
|---|---|---|---|---|---|---|
| Year Ended | Timber, Sawn | Building Sheet* | Plywood | Wallboard | Linseed Oil | Common Window Glass |
| * Asbestos cement and cement sheet. | ||||||
| ft (b.m.) (million) | sq. ft. (000) | sq. ft. (000) | sq. ft. (000) | gal (000) | sq. ft. (000) | |
| 31 Dec | ||||||
| 1956 | 28.7 | 233 | 4,094 | 16,442 | 668 | 13,903 |
| 1957 | 38.7 | 278 | 3,847 | 13,507 | 673 | 9,752 |
| 1958 | 32.9 | 66 | 849 | 4,403 | 537 | 12,727 |
| 1959 | 23.9 | 1 | 735 | 171 | 329 | 13,110 |
| 1960 | 31.0 | 55 | 1,872 | 687 | 244 | 14,789 |
| 1961 | 37.4 | 30 | 2,133 | 985 | 67 | 13,847 |
| 1962 | 28.1 | 188 | 1,133 | 128 | 5 | 10,542 |
| 30 Jun | ||||||
| 1953 | 27.9 | 166 | 1,117 | 201 | 2 | 9,633 |
| 1964 | 27.8 | 93 | 1,087 | 388 | 2 | 13,478 |
| 1965 | 36.1 | 111 | 739 | 381 | 2 | 2,784 |
| 1966 | 38.4 | 183 | 1,478 | 194 | 222 | |
| Year Ended | Plaster of Paris | Gypsum | Asbestos Crude | Cement | Galvanised-iron Sheet | Aluminium Sheet | |
|---|---|---|---|---|---|---|---|
| Corrugated | Flat | ||||||
| cwt(000) | |||||||
| 31 Dec | |||||||
| 1956 | 354.4 | 714.0 | 55.7 | 926.1 | 509 | 229 | 26 |
| 1957 | 334.8 | 948.3 | 25.5 | 74.0 | 938 | 242 | 32 |
| 1958 | 292.1 | 1,171.9 | 78.3 | 60.8 | 636 | 247 | 47 |
| 1959 | 220.1 | 1,153.2 | 84.0 | 39.9 | 661 | 232 | 43 |
| 1960 | 282.7 | 1,307.3 | 93.6 | 64.3 | 661 | 229 | 58 |
| 1961 | 328.2 | 1,530.5 | 103.8 | 75.9 | 903 | 353 | 45 |
| 1962 | 81.1 | 1,773.2 | 116.6 | 60.3 | 596 | 289 | 21 |
| 30 Jun | |||||||
| 1963 | 34.0 | 1,780.3 | 123.2 | 67.4 | 674 | 338 | 14 |
| 1964 | 47.2 | 1,744.7 | 109.4 | 56.3 | 774 | 377 | 10 |
| 1965 | 37.2 | 2,088.4 | 150.4 | 73.1 | 699 | 441 | 12 |
| 1966 | 33.0 | 2,163.7 | 152.4 | 64.1 | 768 | 435 | 7 |
HOUSING FINANCE—The chief agency providing finance for housing in New Zealand is the State Advances Corporation, a wholly Government owned institution described in detail in Section 30B. Increases have been announced from time to time in the maximum loans which may be granted by the State Advances Corporation for the building of homes.
State Advances Corporation loans with interest rebated to 3 percent, reviewable five-yearly, are granted to families where the income of the breadwinner is not more than $2,080 a year, plus $100 for each dependent child, but excluding family benefit and war disability pension.
The standard rate of interest for loans not eligible for the rebate is 5 1/2 percent. Large numbers of borrowers have been attracted by State Advances loans at 3 percent interest, as the ruling rate for first mortgages charged by private lending institutions averages about 6 percent. For the year ended 31 March 1966, the State Advances Corporation authorised loans valued at $46.0 million for new urban dwellings, of which $16.8 million was at the 3 percent rate, and loans of $11.1 million were authorised for the purchase of existing houses, of which $1.6 million was at 3 percent. From 1964 all new 3 percent loans are subject to review every five years, and if the income of the borrower exceeds the qualifying limit existing at the review date, the standard rate will be charged for the balance of the loan term.
The Family Benefits (Home Ownership) Act 1964 provides for payment in a lump sum of the social security family benefit, the capitalised benefit to be applied towards the provision of a family home or for essential alterations or for repayment of encumbrances on a family home. The scheme became operative on 1 April 1959. Benefits in respect of any number of children may be capitalised provided the aggregate advance does not exceed $2,000. Family benefit capitalisation advances totalling $68.3 million were authorised in the first seven years of the scheme by the State Advances Corporation to applicants holding eligibility certificates issued by the Social Security Commission.
Under the Mortgage Guarantee Scheme introduced in 1961, the State Advances Corporation assists building societies, insurance companies, and other approved lending institutions to grant loans for the purchase of existing houses by guaranteeing the difference between the usual limit of 66 2/3 percent of value and 85 percent, with a loan maximum of $6,000. Guarantees are also available in respect of new houses up to limit of 90 percent of valuation and a maximum loan of $6,400.
In July 1957 the Government announced the commencement of a home lay-by scheme in the Post Office Savings Bank and this has been extended to trustee and private savings banks. A subsidy, known as a suspensory free deposit, of $10 per $200 up to a limit of $100 is credited to each home lay-by account when the money is used to acquire a new home to be occupied by the depositor. There is no limit to the amount which can be deposited but the maximum amount in any one year on which the subsidy can be credited is $500. The effect of the scheme is that a person who deposits $500 each year in a home lay-by account for four years will qualify for the maximum subsidy of $100, in addition to the normal savings bank interest. Deposits of $200 a year for 10 years can also earn the maximum subsidy.
Further information on housing finance is contained in Section 30B—State Advances Corporation.
Role of Local Authorities—The housing policy of the Government includes the provision of loans to local authorities at 3 1/2 percent to enable them to undertake the erection of accommodation for pensioners or persons in comparable circumstances. Since 1950 there has been a generous Government subsidy for pensioners' housing, and it is now half the net capital cost, with a maximum of $1,850 a unit. At 31 March 1966 Government subsidies of $5,821,600 had been granted to local authorities and also loans of $7,596,400. Local authorities have built 3,839 pensioner flats to accommodate 4,708 persons. (These subsidies are separate from those granted to religious and relief organisations—see Section 5A).
Under the Rural Housing Act 1939 the State Advances Corporation grants loans to county councils for relending to farmers for housing purposes. During the year ended 31 March 1966, 55 county councils uplifted loans of $1,750,482 in respect of 330 houses.
Borough councils are authorised under the Municipal Corporations Act to provide loans for housing purposes up to a limit of $8,080; to subdivide for such purposes any land vested in a council and not held by it in trust for any particular purpose other than housing; and to sell or lease allotments for housing purposes. Local authorities may also apply to the Local Authorities Loans Board for blanket authorities for the purchase of land for subdivision for housing purposes. Local authorities are being encouraged to play a more prominent part in the housing of their citizens.
Maori Housing—In addition to the facilities of the State Advances Corporation, financial assistance towards the erection of houses, including the purchase of building sites, additions, repairs to existing dwellings, and for the purchase of houses, is available to Maoris under the Maori Housing Act 1935, the lending authority being the Board of Maori Affairs. Section 18 of the Maori Housing Amendment Act 1938 provided for the Special Housing Fund to be set up. The use of a Special Housing Fund as a reserve enables the Board of Maori Affairs to cater for families who are unable to meet the full repayments normally required.
In addition to providing loans, the Department, through its building organisation, arranges for construction of the houses in many cases. The Department has available a comprehensive plan service to meet the special needs of the Maori people. In determining its building programme the Department endeavours to ensure that the most needy cases are given priority. The numbers of houses erected in recent years have been: 1962–63, 802; 1963–64, 800: 1964–65, 905; and 1965–66, 855. House purchases and other dwellings obtained through the agency of the State Advances Corporation, together with new houses built by the Department of Maori Affairs and the Maori Trustee, brought the total number of Maori families housed in the past five years to 7,942, of whom 1,423 were housed in 1965–66.
Loans through the Department up to set limits, rebated interest rate, and capitalisation of family benefit are similar in all respects to loans granted by the Slate Advances Corporation. Where the applicant does not qualify for the special interest concession, loans are granted at an interest rate of 5 5/8 percent.
All applications for State tenancies are dealt with by the State Advances Corporation although assistance with the applications is often given by the Department's staff. During 1965–66, 397 known tenancies were allocated to Maori families.
The Government has devoted particular attention to providing accommodation for single Maori girls in urban areas and has erected rental flats in Auckland and Wellington, and, through the agency of the Maori Trustee, has provided flats in Christchurch. Hostel accommodation for Maori boys has also been made available in Christchurch by the Maori Trustee. Pensioner accommodation has been provided in Kaikohe and plans are afoot for a further building at Waitangi.
STATE HOUSE CONSTRUCTION—A programme of building State rental houses and flats was commenced in March 1937. These are for letting (and subsequent purchase if the occupier wishes) to people in the moderate income group according to need. Since 1950 there has been an income bar (at present $1,850 per annum) on applicants for tenancies of State rental units, increased slightly in respect of special classes of accommodation.
The Housing Division of the Ministry of Works acquires and develops sites for houses and flats and arranges contracts for their construction. These activities are covered by the Housing Act 1955.
The totals of State rental units completed and handed over for occupation in the latest 12 years are shown in the following table. Up to 31 March 1966 there were 66,765 units completed.
| Year | Number of Units |
|---|---|
| 1954–55 | 2,892 |
| 1955–56 | 2,258 |
| 1956–57 | 2,746 |
| 1957–58 | 1,853 |
| 1958–59 | 1,647 |
| 1959–60 | 2,128 |
| 1960–61 | 2,148 |
| 1961–62 | 1,972 |
| 1962–63 | 1,948 |
| 1963–64 | 1,562 |
| 1964–65 | 1,646 |
| 1965–66 | 1,334 |
Flats and Multi-unit Dwellings—In compliance with Government policy, aiming at higher density housing in the interests of conserving land and at the same time arresting urban sprawl, the State has continued to build increasing numbers of multi-unit dwellings, mainly two and four units, also a number of three-storey blocks of flats each comprising 12 units. The number of multi units built by the Housing Division for State rental purposes up to 31 March 1966 was 12,152 two-unit dwellings, 554 three-unit dwellings, and 3,562 four-to-eight-unit blocks. In addition, the Housing Division built 1,494 multi-storey flats and 1,031 pensioners' flats, also for State rental purposes.
State Services Housing—State services houses are houses built for Government Departments and the armed forces. The total number of such houses erected by the Division to 31 March 1966 was 10,731. This includes houses built at the site of major construction jobs such as electric power schemes.
Finance—The cost of the State housing programme, including the acquisition and development of land, is financed from the Housing Construction vote in the Public Works Account, i.e., out of national development loan moneys.
The following table shows the annual expenditure from the Housing Construction vote.
| Year Ended 31 March | State Housing | State Services | Land Purchase and Development | Administration and General | Total |
|---|---|---|---|---|---|
| * In addition sums of $3,830,706 in 1961–62, $2,582,716, in 1962–63, $2,210,650 in 1963–64, $2,272,662 in 1964–65, and $5,665,892 in 1965–66, were spent on State services houses, these amounts being charged directly to the Departments concerned. | |||||
| $(thousand) | |||||
| 1956 | 11,616 | 2,088 | 6,052 | 1,044 | 20,798 |
| 1957 | 13,104 | 122 | 5,572 | 1,110 | 19,910 |
| 1958 | 9,632 | 112 | 5,390 | 1,140 | 16,276 |
| 1959 | 9,730 | 52 | 6,226 | 1,198 | 17,204 |
| 1960 | 14,372 | 60 | 6,402 | 1,196 | 22,032 |
| 1961 | 12,430 | 92 | 6,416 | 1,290 | 20,228 |
| 1962 | 11,638 | 68* | 5,326 | 1,354 | 18,386 |
| 1963 | 10,354 | 64* | 4,094 | 2,140 | 16,652 |
| 1964 | 10,764 | 72* | 3,960 | 1,840 | 16,636 |
| 1965 | 10,102 | 122* | 3,352 | 1,886 | 15,462 |
| 1966 | 9,394 | 136* | 3,292 | 1,864 | 14,686 |
The next table shows the annual total expenditure by the Housing Division in the latest five years.
| Year | Vote, “Housing Construction” | On Behalf of Other Departments (Charged Direct) | Total | |||
|---|---|---|---|---|---|---|
| Construction Land Purchase and Development, Administration | Land Development, Murupara | On Behalf of Other Departments* | Total | |||
| * Expenditure on behalf of other Departments charged meantime to vote, “Housing Construction”. | ||||||
| $(thousand) | ||||||
| 1961–62 | 18,258 | 60 | 68 | 18,386 | 3,830 | 22,216 |
| 1962–63 | 16,516 | 72 | 64 | 16,652 | 2,582 | 19,234 |
| 1963–64 | 16,556 | 8 | 72 | 16,636 | 2,210 | 18,846 |
| 1964–65 | 15,332 | 8 | 122 | 15,462 | 2,272 | 17,734 |
| 1965–66 | 14,536 | 14 | 136 | 14,686 | 5,666 | 20,352 |
Room Content of Units (State Houses and State Services Housing)—The types of units according to the number of bedrooms in units built during the two latest years, also the totals from 1937 to date, are shown in the following table.
| Number of Bedrooms | 1964–65 | 1965–66 | Totals to Date | |||
|---|---|---|---|---|---|---|
| Number of Units | Percentage of Total | Number of Units | Percentage of Total | Number of Units | Percentage of Total | |
| One bedroom or bed-sitting room | 107 | 5.5 | 80 | 4.0 | 4,586 | 5.9 |
| Two bedrooms | 455 | 23.4 | 367 | 18.4 | 24,037 | 31.0 |
| Three bedrooms | 1,097 | 56.5 | 1,232 | 61.9 | 43,267 | 55.9 |
| Four or more bedrooms | 286 | 14.6 | 312 | 15.7 | 5,606 | 7.2 |
| Totals | 1,945 | 100.0 | 1,991 | 100.0 | 77,496 | 100.0 |
Sheathing Materials Used (State Houses and State Services Housing)—The sheathing materials used in the units built during the two latest years, also the totals from 1937 to date, are shown in the following table.
| Materials | Units Built | ||
|---|---|---|---|
| 1964–65 | 1965–66 | Totals to Date | |
| Weatherboards | 837 | 904 | 45,505 |
| Brick | 298 | 279 | 13,486 |
| Concrete | 238 | 120 | 4,665 |
| Other sheathing | 572 | 688 | 13,840 |
| Totals | 1,945 | 1,991 | 77,496 |
Land Acquisition—During 1965–66 a total of 100 developed unit sites was purchased as a charge against the Housing Construction vote, also some 384 acres of undeveloped land estimated ultimately to yield 1,290 unit sites. Approximately one-half of these sections are intended for State rental house building, the balance being for private home building, including houses under the Government-approved group building scheme.
State Rental Housing Tender Prices—The following table shows typical tender prices being accepted in the four main centres at the end of the last 11 financial years for similar types of three-bedroom State rental houses of equivalent floor space. In each case the house is a typical single unit on a flat section, built in weatherboards with a tiled roof. The price includes drainage, fencing, paths, toolshed, revolving clothes line, and letterbox. The cost of the section is not included. The figures in parentheses represent the cost per square foot.
| Year | Auckland | Wellington | Christchurch | Dunedin | ||||
|---|---|---|---|---|---|---|---|---|
| $ | $ | $ | $ | $ | $ | $ | $ | |
| 1955–56 | 6,124 | (5.83) | 5,938 | (5.65) | 5,420 | (5.16) | 6,002 | (5.72) |
| 1956–57 | 6,170 | (5.88) | 6,014 | (5.72) | 5,114 | (4.87) | 6,108 | (5.82) |
| 1957–58 | 6,102 | (5.81) | 6,004 | (5.72) | 5,090 | (4.85) | 6,062 | (5.78) |
| 1958–59 | 6,018 | (5.73) | 6,044 | (5.76) | 5,076 | (4.83) | 5,904 | (5.62) |
| 1959–60 | 6,218 | (5.92) | 6,068 | (5.78) | 5,362 | (5.11) | 6,134 | (5.84) |
| 1960–61 | 6,338 | (6.04) | 6,134 | (5.84) | 5,500 | (5.24) | 6,218 | (5.92) |
| 1961–62 | 6,334 | (6.03) | 6,278 | (5.98) | 5,472 | (5.21) | 6,172 | (5.88) |
| 1962–63 | 6,298 | (6.00) | 6,316 | (6.02) | 5,452 | (5.20) | 6,182 | (5.88) |
| 1963–64 | 6,306 | (6.01) | 6,330 | (6.03) | 5,686 | (5.42) | 6,234 | (5.94) |
| 1964–65 | 6,726 | (6.41) | 6,888 | (6.56) | 6,104 | (5.81) | 6,632 | (6.32) |
| 1965–66 | 6,942 | (6.61) | 7,178 | (6.83) | 6,434 | (6.12). | 6,758 | (6.42) |
JOINT FAMILY HOMES—The Joint Family Homes Act 1964 makes provision for a form of ownership by which a family home will belong not to the husband and wife separately but to both of them jointly so that it may pass to the survivor on the death of one of them. The predominant purpose behind the legislation is the preservation of a family home outside the business or personal speculations of either spouse. A husband and wife, or either of them, being solvent and owning land whether freehold or leasehold on which a residence is erected or on which a residence will be erected within six months, may settle the land as a joint family home provided the residence is used exclusively or principally as a home for themselves and the members of their household. The 1964 Act makes it possible to settle flats as family homes. The settlement is cancelled when the land is sold or when both husband and wife have died or have ceased permanently to reside and have their home on the land. There are substantial benefits resulting from settlement under the Act. The husband and wife have equal rights in connection with ownership and possession while they are both living but cannot deal separately with their interest. On the death of either of them the joint family home becomes the property of the survivor. In the event of claims by creditors or an assignee in bankruptcy, the property is protected up to a sum of $4,000. Further, on the death of one of the spouses there is an exemption of $8,000 from estate duty. Settlements under the Act are exempt from gift and stamp duty.
The Joint Family Homes Amendment Act 1965 introduced new provisions to cover the system now growing up in connection with granting long-term leases to the owner-occupier of flats and vesting the fee simple in them in undivided shares. Under the Joint Family Homes Act 1964 the owner-occupier could settle his leasehold interest in the flat, but the new legislation enables him to settle also his undivided share in the fee simple.
Joint family homes under the Joint Family Homes Act registered for the last 11 years are shown in the following table.
| Year Ended 31 March | Homes Settled |
|---|---|
| 1956 | 5,363 |
| 1957 | 5,655 |
| 1958 | 6,262 |
| 1959 | 7,052 |
| 1960 | 11,195 |
| 1961 | 16,368 |
| 1962 | 16,012 |
| 1963 | 14,683 |
| 1964 | 13,056 |
| 1965 | 13,224 |
| 1966 | 14,149 |
| 1967 | 12,738 |
The Family Benefits (Home Ownership) Act caused a very substantial increase from 1959 onwards, mainly owing to the condition attaching to capitalisation of the benefits that the home, if not in the sole name of the wife, be settled as a joint family home.
CENSUS INFORMATION: Nature of Dwelling—The following table shows the nature of dwellings at the censuses at 1956 and 1961.
| Nature of Dwelling | Numbers | Percentage of Total Inhabited Dwellings | ||
|---|---|---|---|---|
| 1956 | 1961 | 1956 | 1961 | |
| A. Inhabited dwellings— | ||||
| Permanent private dwellings— | ||||
| Private house | 495,632 | 564,196 | 86.53 | 87.69 |
| Private house, partly sublet | 3,684 | 797 | 0.64 | 0.12 |
| Flat | 41,669 | 52,936 | 7.28 | 8.23 |
| Dwellings combined with shop, rooms attached to offices, etc. | 7,686 | 6,830 | 1.34 | 1.06 |
| Bach | 14,340 | 8,905 | 2.50 | 1.38 |
| Other | 41 | 43 | 0.01 | 0.01 |
| Totals | 563,052 | 633,707 | 98.30 | 98.49 |
| Mobile and temporary dwellings— | ||||
| Mobile residence (including caravans) | 1,580 | 1,248 | 0.28 | 0.19 |
| Other (including tents) | 344 | 248 | 0.06 | 0.04 |
| Totals | 1,924 | 1,496 | 0.34 | 0.23 |
| Non-private dwellings— | ||||
| Hotel, boardinghouse, apartment house, hostel | 6,071 | 6,082 | 1.06 | 0.95 |
| Public or private hospital | 490 | 534 | 0.09 | 0.08 |
| Camp | 567 | 380 | 0.10 | 0.05 |
| Other | 655 | 1,211 | 0.11 | 0.20 |
| Totals | 7,783 | 8,207 | 1.36 | 1.28 |
| Grand totals, inhabited dwellings | 572,759 | 643,410 | 100.00 | 100.00 |
| B. Uninhabited dwellings— | ||||
| Occupants temporarily away | 10,944 | 12,840 | … | … |
| Untenanted dwelling | 12,614 | 19,870 | … | … |
| Bach (weekend or summer dwelling) | 19,899 | 26,997 | … | … |
| Totals | 43,457 | 59,707 | … | … |
| C. Building— | ||||
| Dwellings in course of erection | 10,462 | 11,383 | … | … |
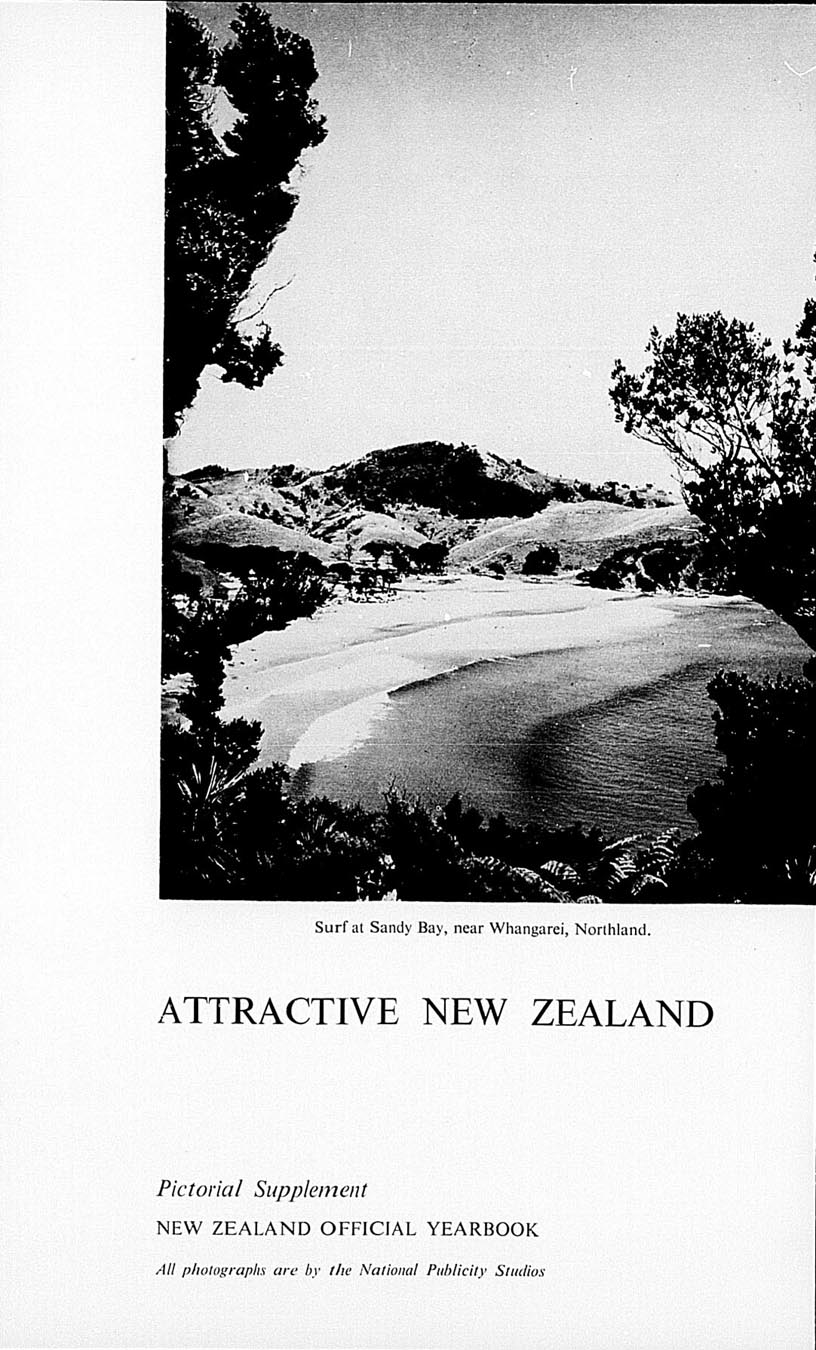
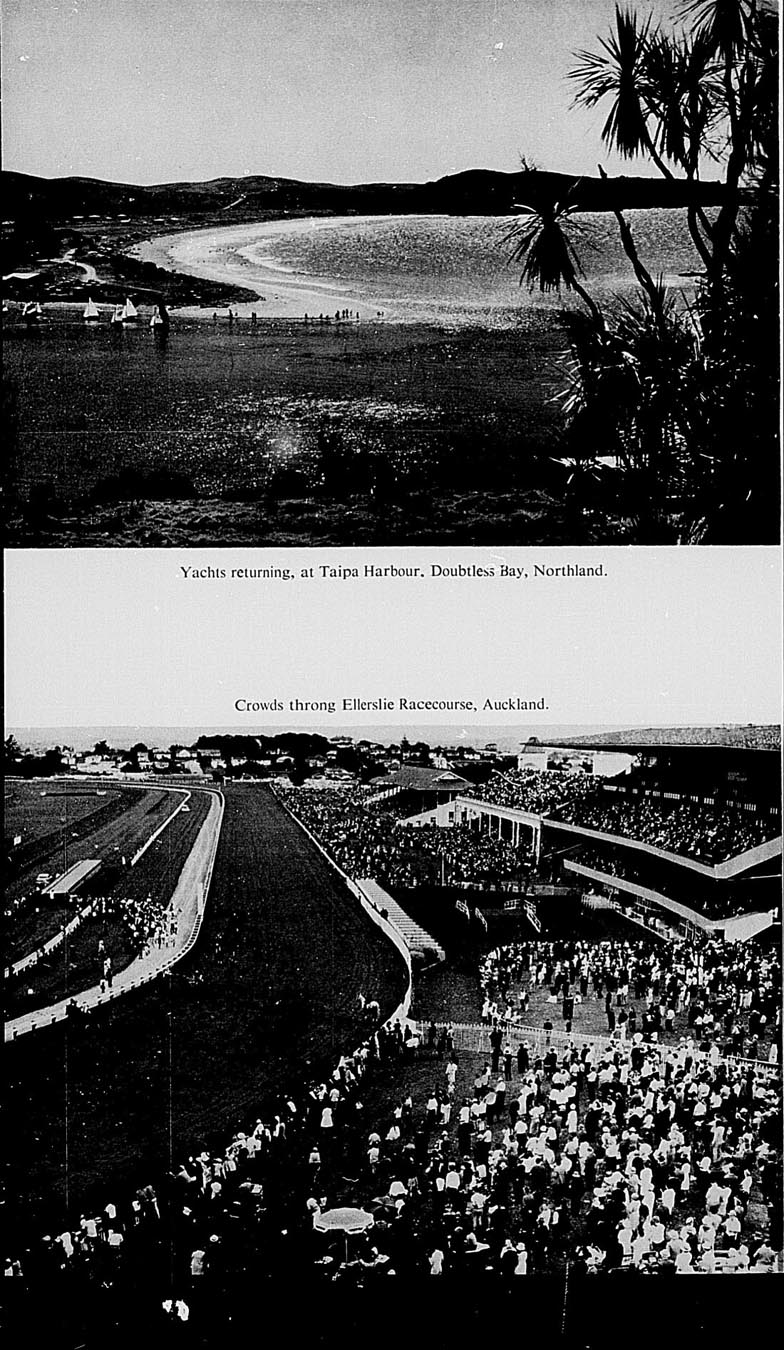
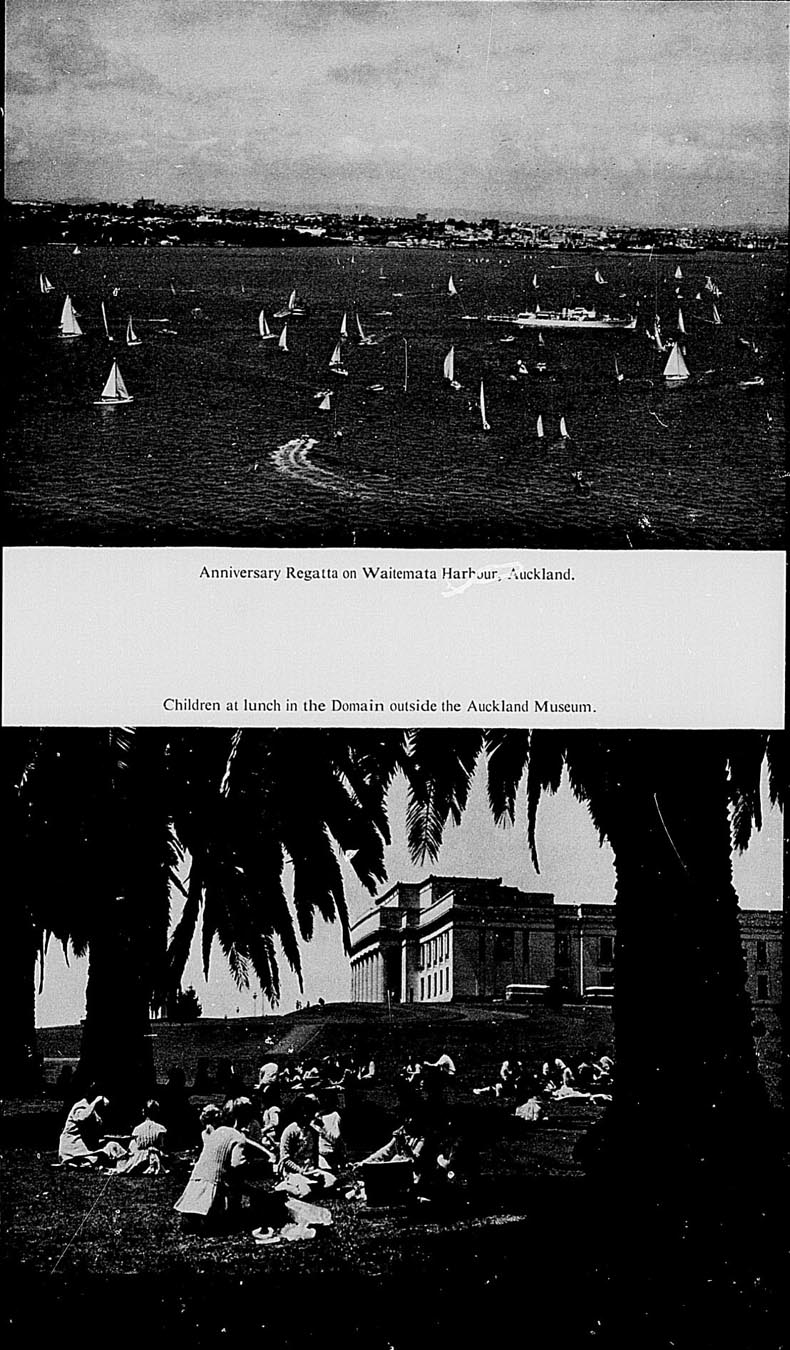
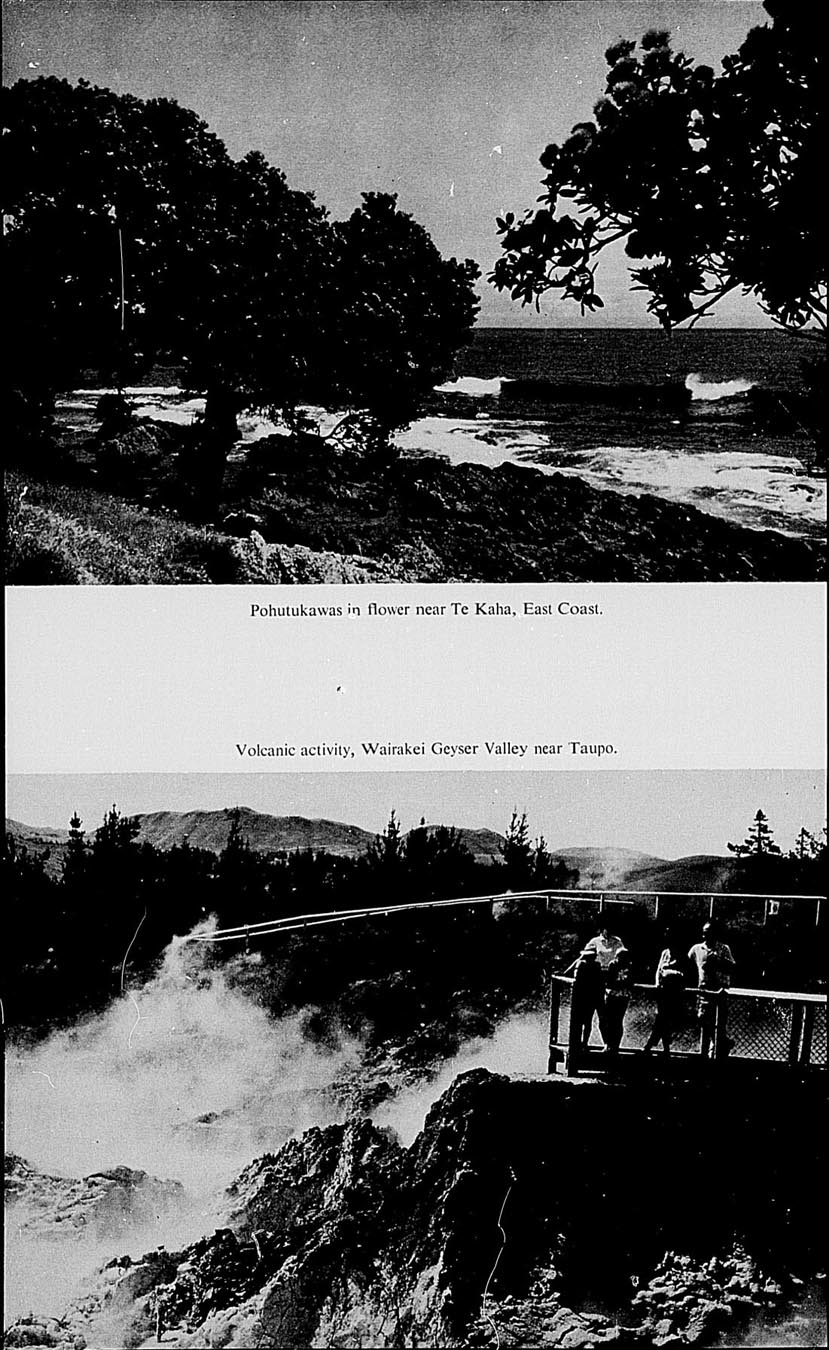
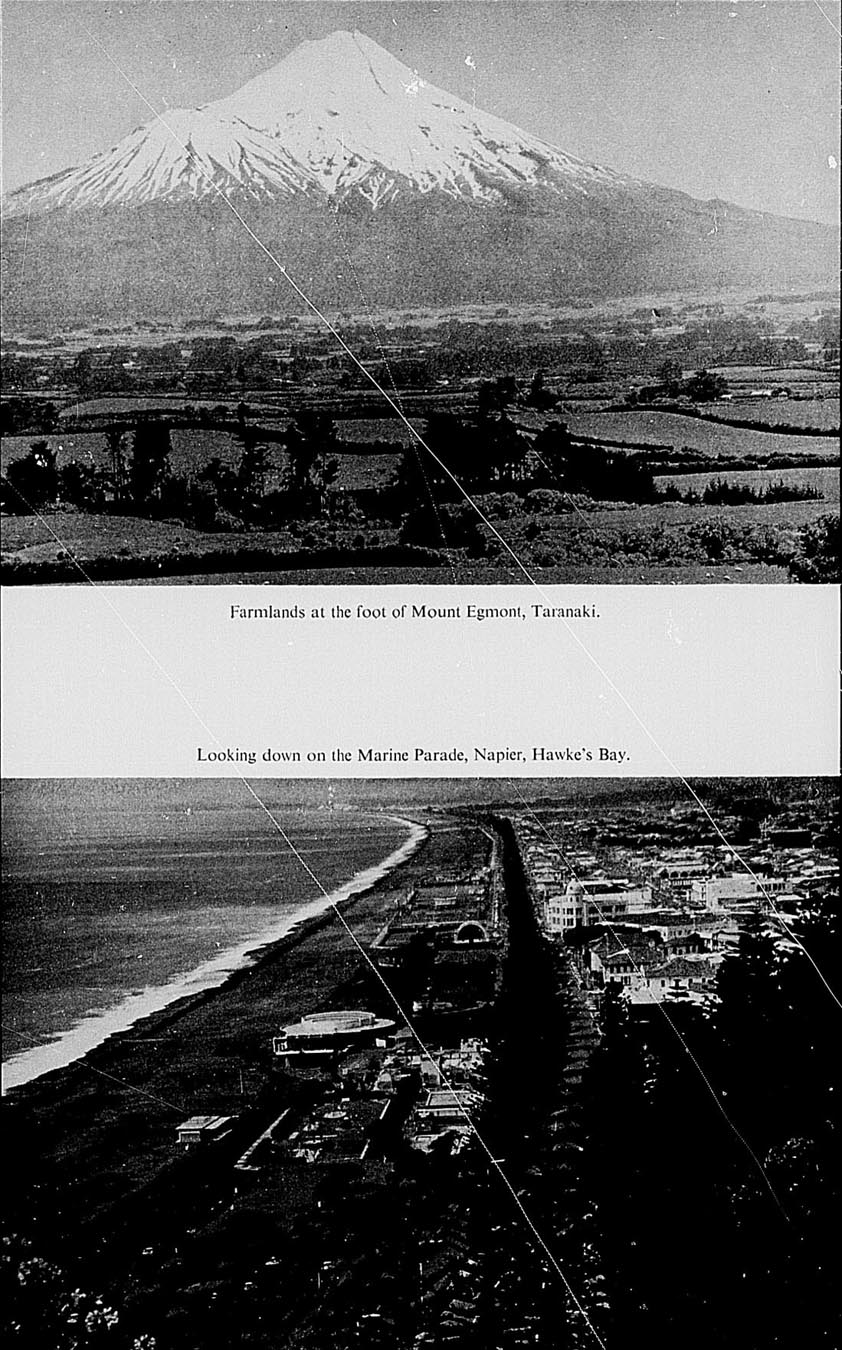
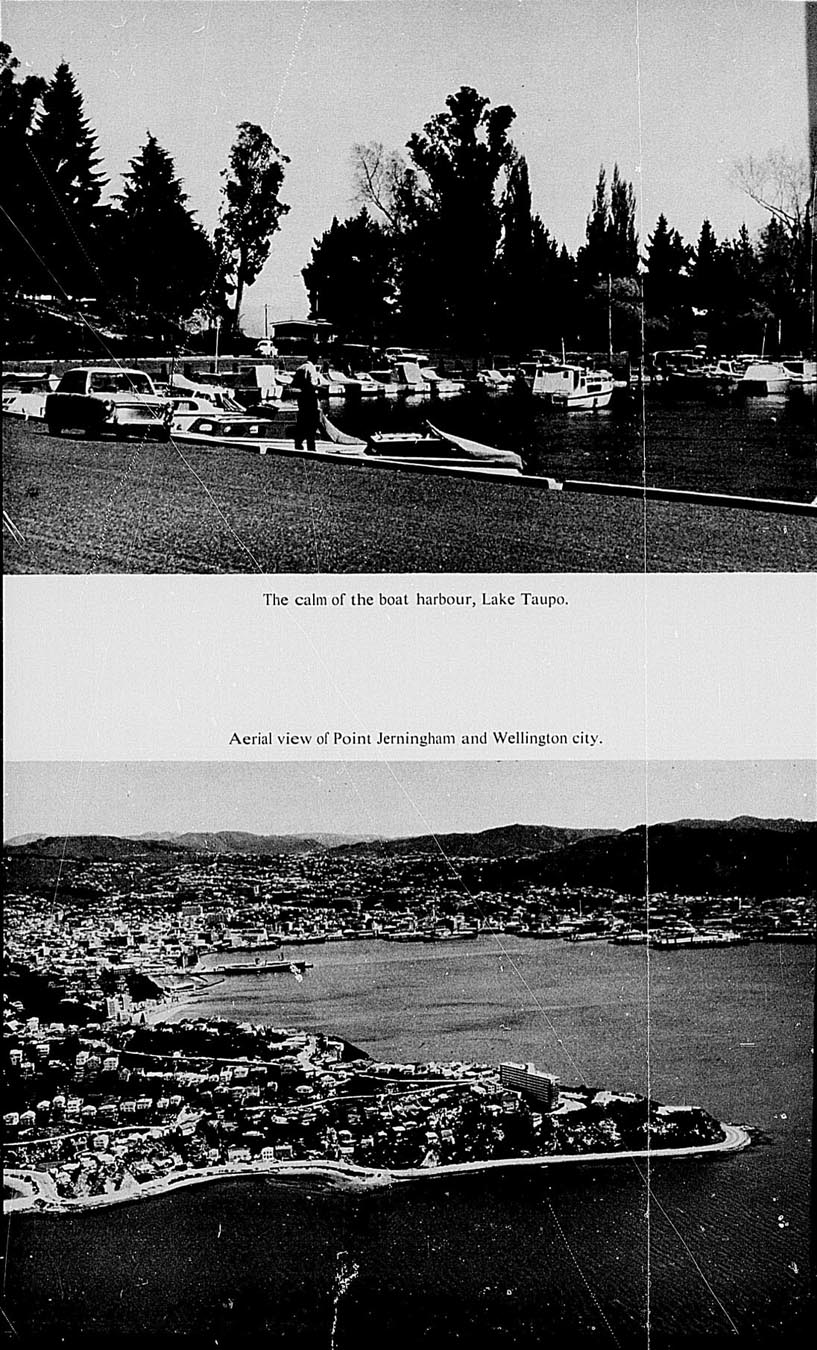
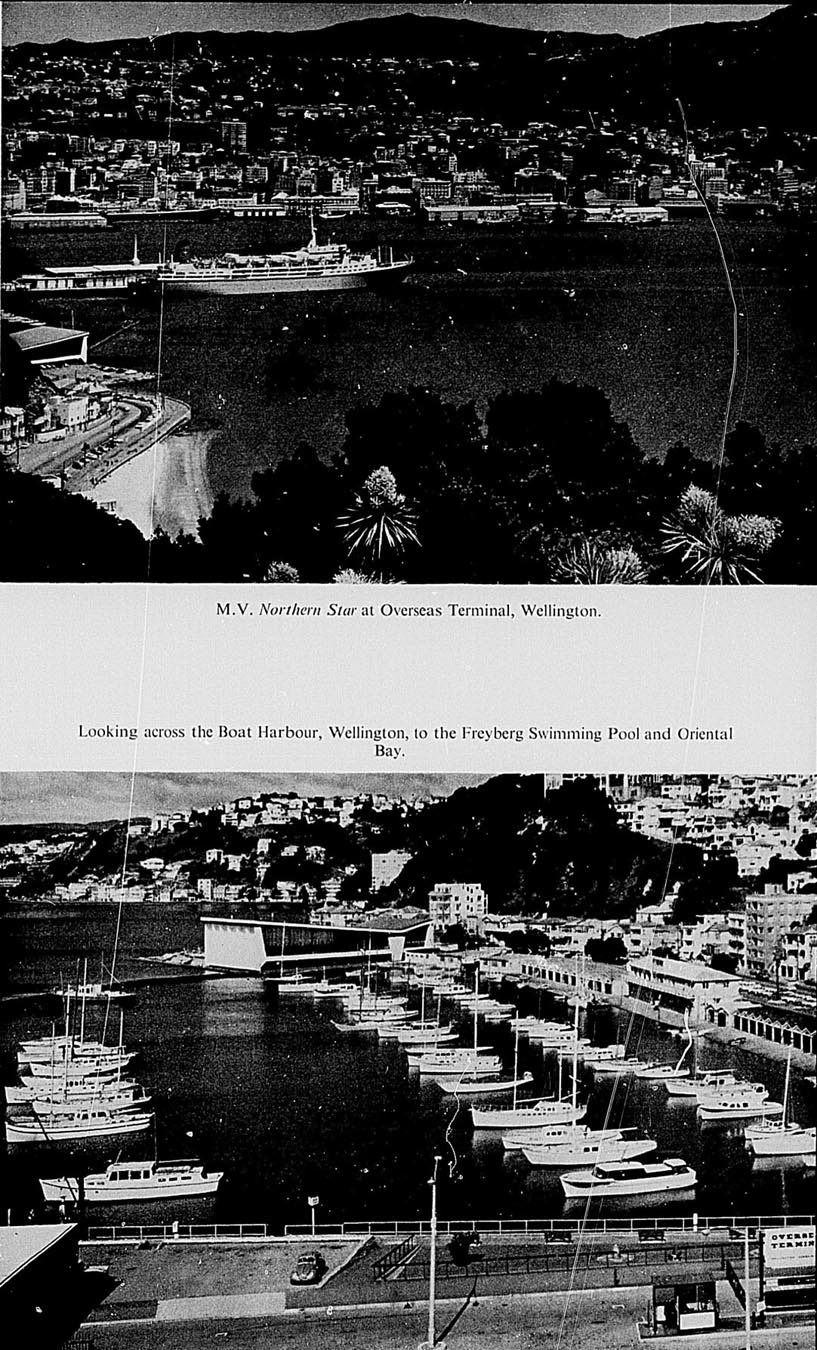
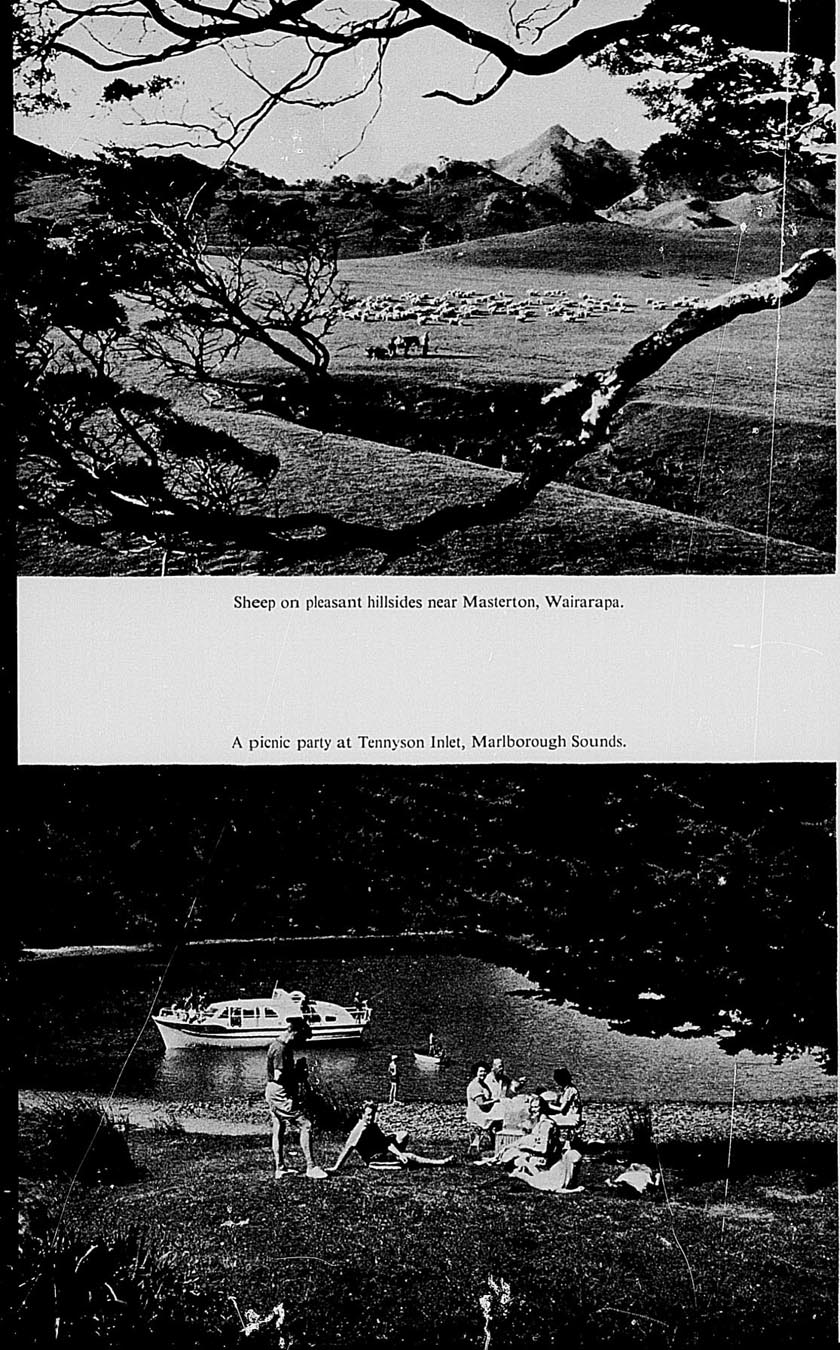
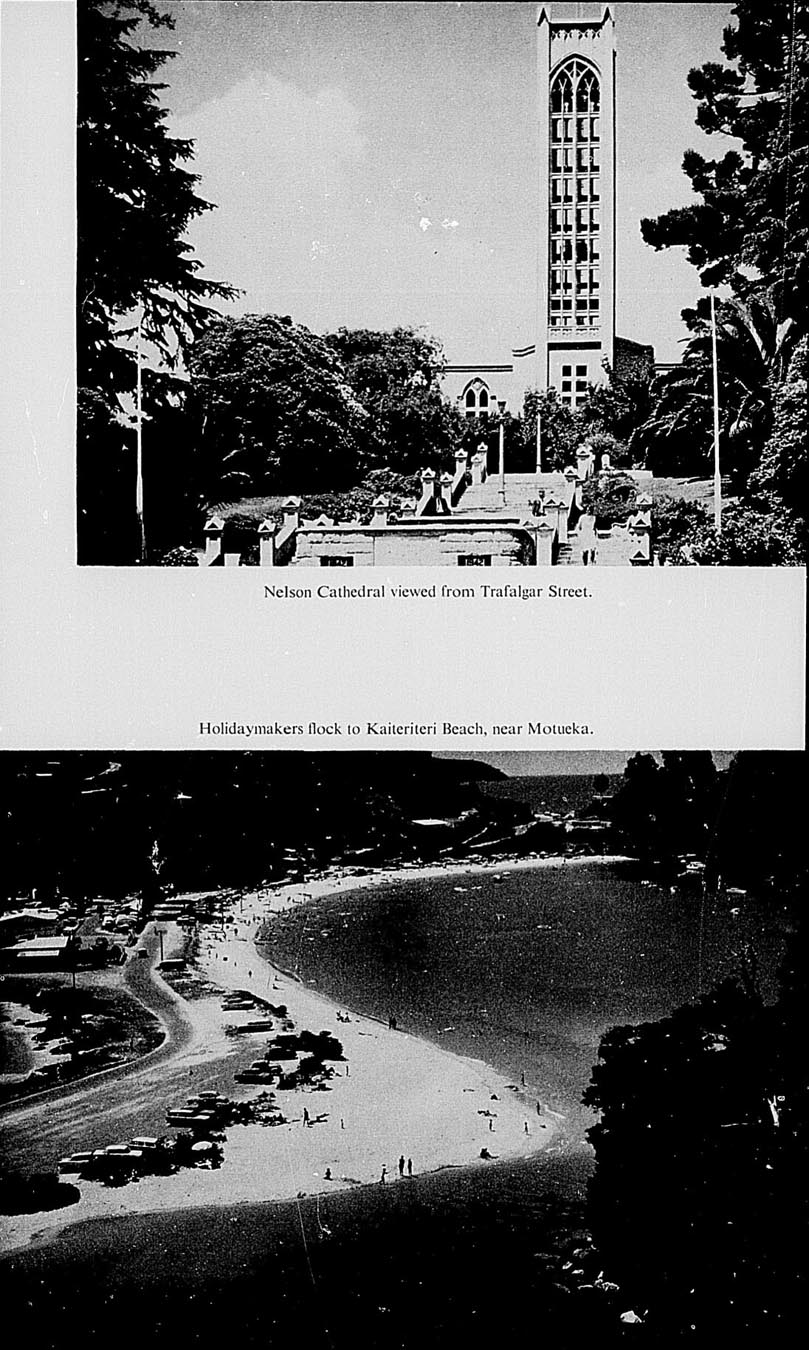
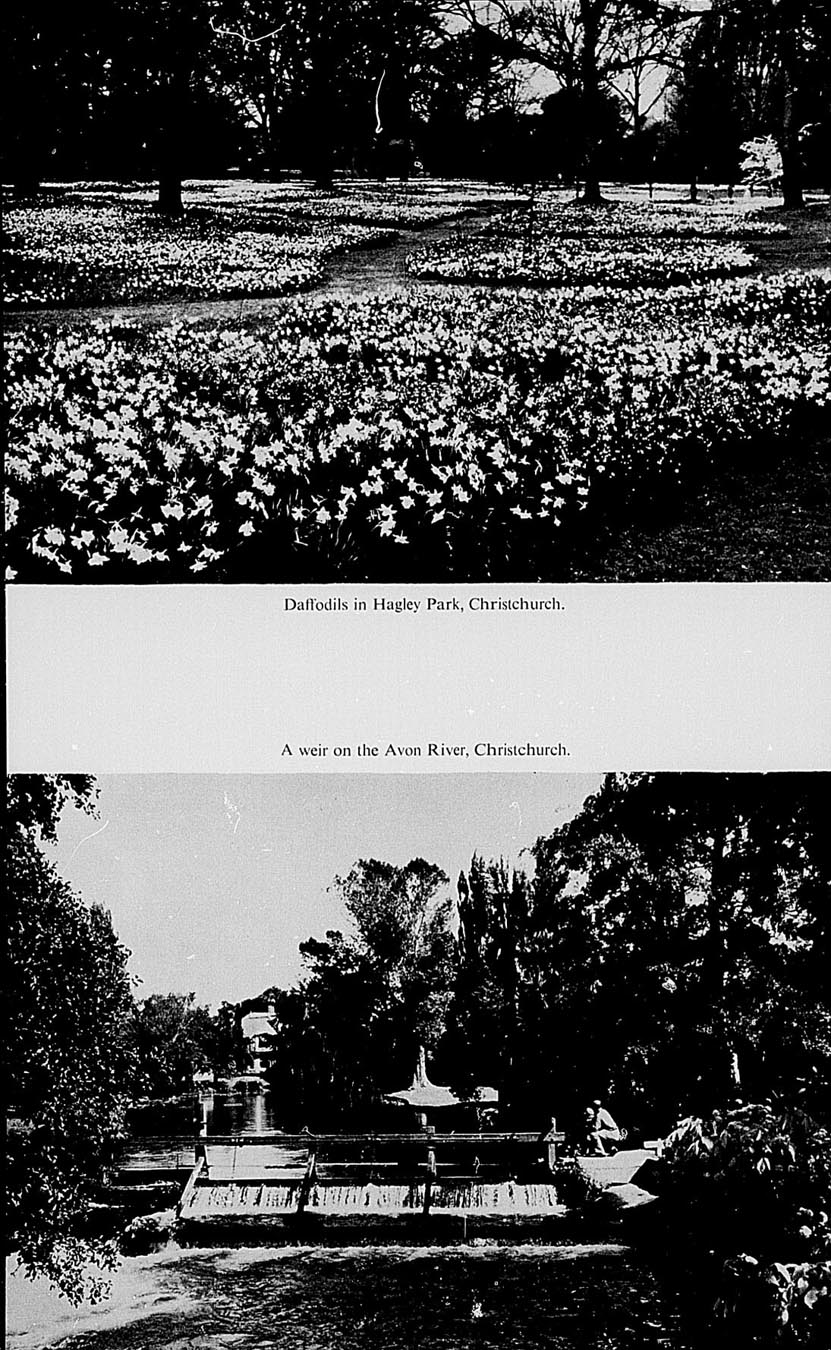
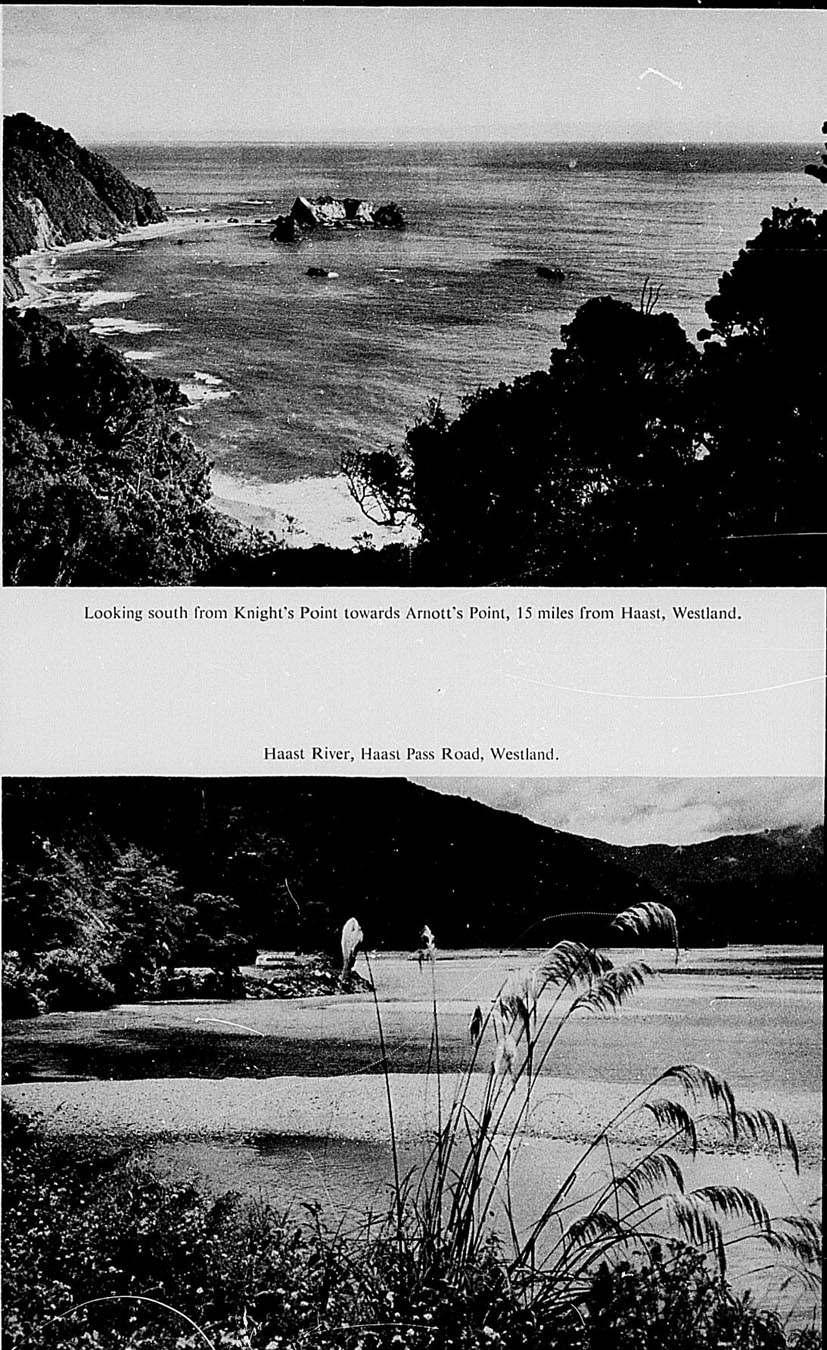
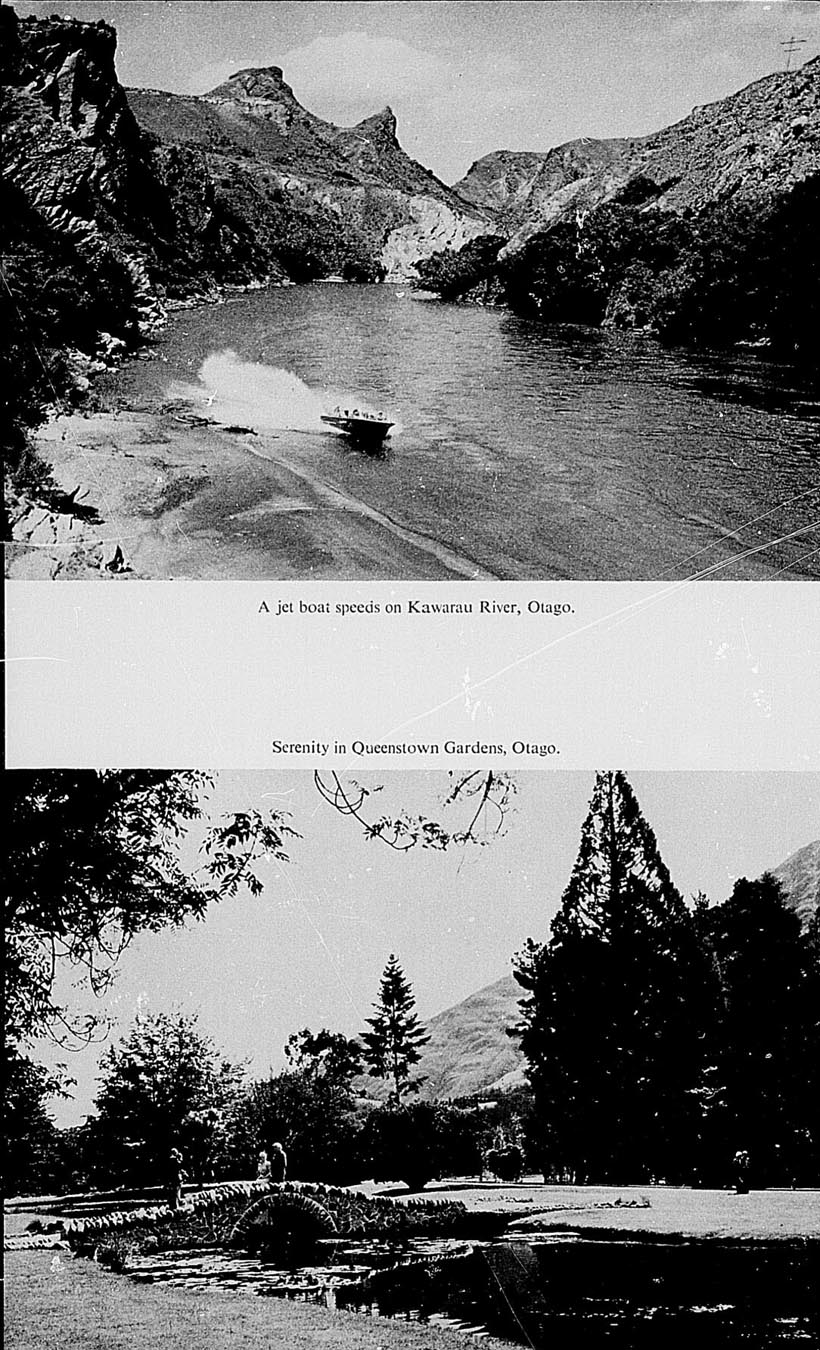
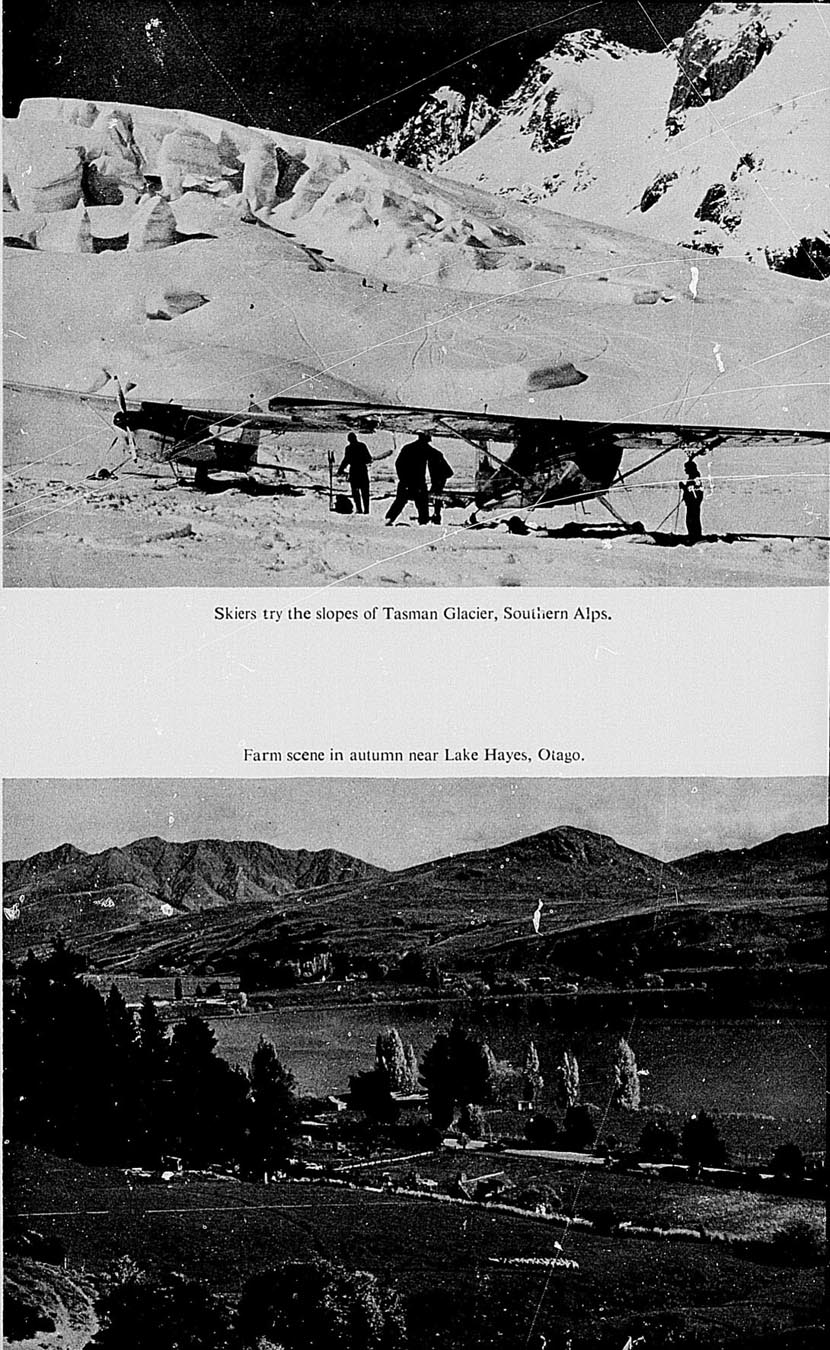
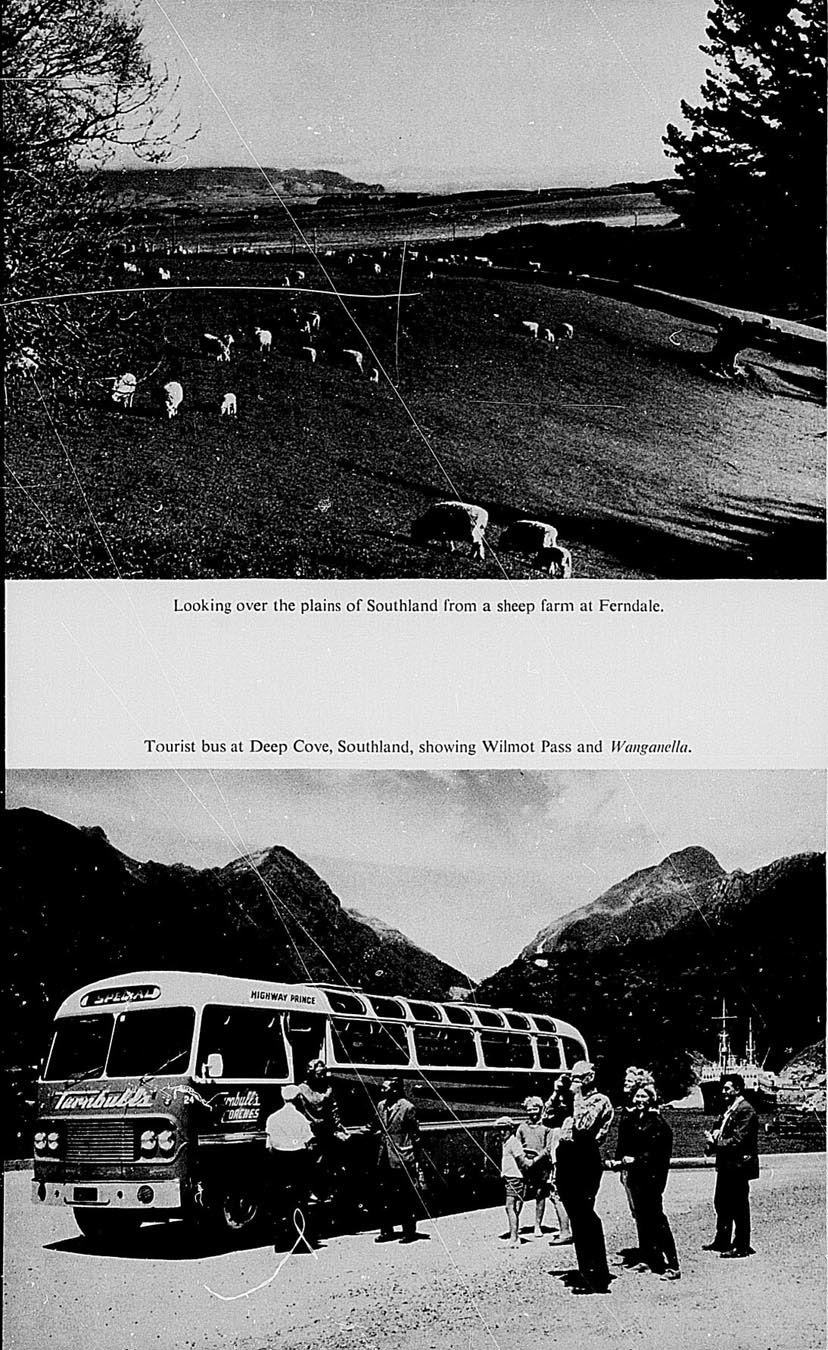
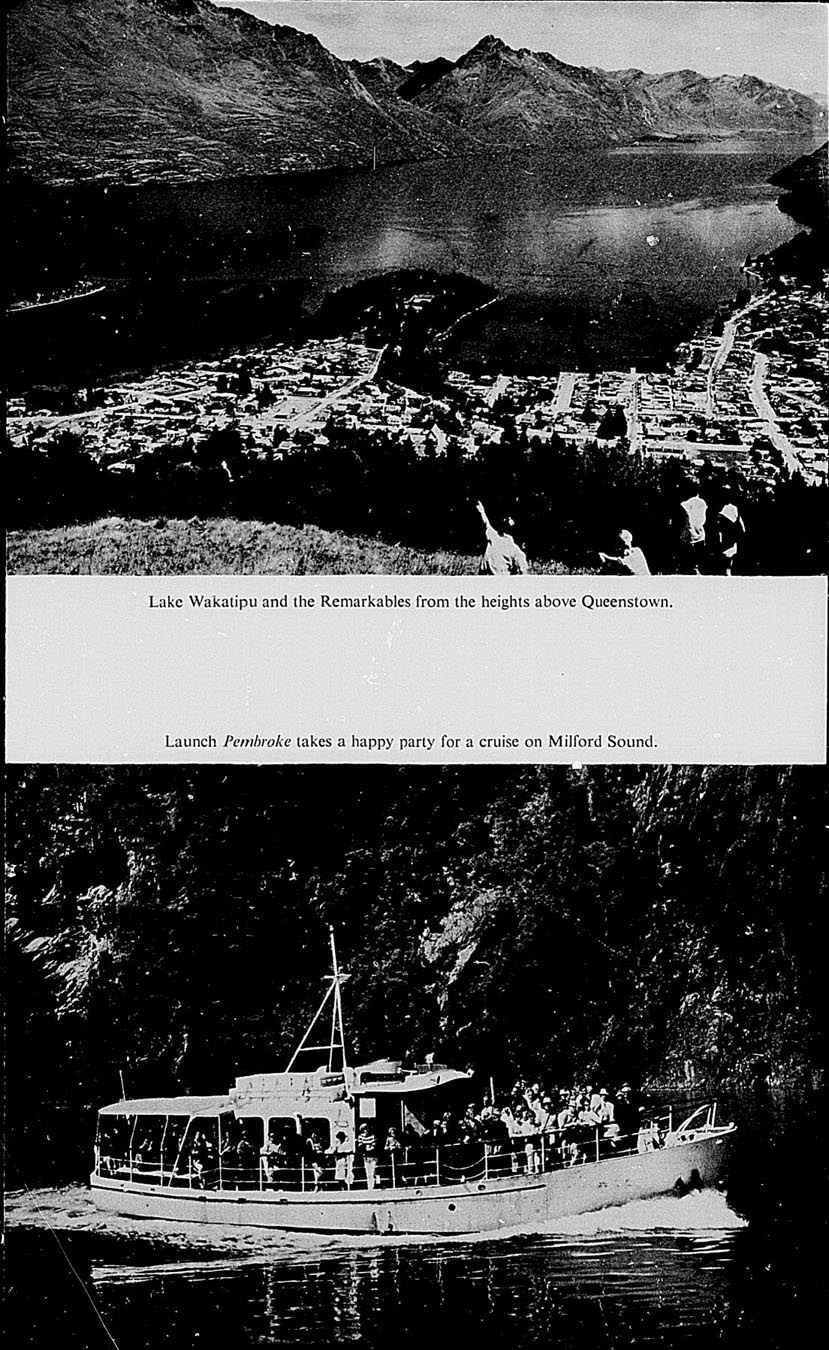
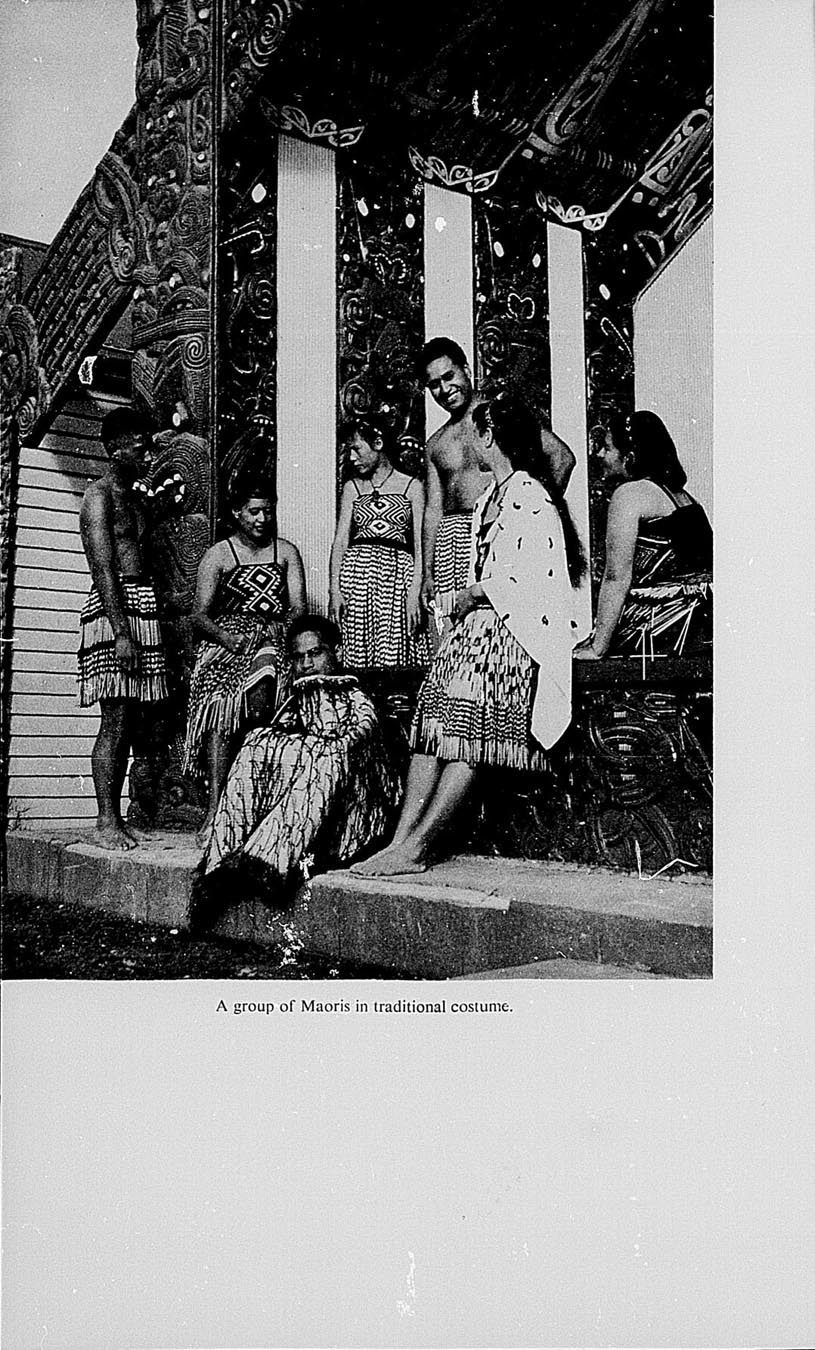
Provisional figures for the 1966 census give the total of occupied dwellings as 724,945, a 12.7 percent increase on the 643,410 in 1961. Unoccupied dwellings at the 1966 census numbered 69,977, a 17.2 percent increase over the 1961 figure. Of these, 25,800 were untenanted dwellings, 29,202 were baches, and in 14,975 cases the occupants were away temporarily. The average number of occupants for all occupied dwellings was 3.7 in 1966 compared with 3.8 in 1961. It should be noted that the category, “all occupied dwellings” includes hotels, camps, hospitals, and other types of communal dwellings, and that the inclusion of these tends to inflate the average number of occupants per dwelling. A more detailed analysis of the 1966 figures will be completed later, and this will show separately the number of inhabited permanent private dwellings. This has been provisionally assessed as 714,800, compared with 633,700 at the 1961 census. Dwellings in course of erection numbered 10,357 at the 1966 census.
In 1961 the average number of occupants per permanent private dwelling was 3.56 compared with 3.58 five years earlier.
Unoccupied dwellings are restricted to buildings intended for human habitation, e.g., houses, flats, cottages, etc., and the category omits unoccupied caravans, tents, etc.; it also excludes unoccupied dwellings which are both deserted and dilapidated.
Rents—In the following table the average weekly rent for unfurnished five-roomed dwellings is given for selected cities with the largest numbers of rental dwellings in 1961. State rental houses are included in the figures and would have a moderating effect on the rents. The average weekly rent for the 44,116 unfurnished five-roomed dwellings in New Zealand was $4.65, while it was $5.18 for the 28,985 such dwellings in centres of over 2,000 population.
| City | Number of Five-roomed Dwellings Let | Average Weekly Rent |
|---|---|---|
| $ | ||
| Auckland | 2,662 | 5.50 |
| Lower Hutt | 1,676 | 4.88 |
| Wellington | 1,572 | 6.95 |
| Christchurch | 2,139 | 5.60 |
| Dunedin | 1,171 | 5.05 |
| Hamilton | 1,049 | 5.08 |
| Palmerston North | 849 | 5.18 |
| Napier | 603 | 4.78 |
| New Plymouth | 575 | 5.05 |
| Hastings | 526 | 5.05 |
| Wanganui | 422 | 4.78 |
| Timaru | 430 | 5.22 |
| Invercargill | 476 | 5.28 |
The numbers and average weekly rents according to the number of rooms in rented dwellings and flats is shown in the following table: (These are also from the 1961 census.)
| Nature of Dwelling | Number of Rooms | Total Including Other | |||||
|---|---|---|---|---|---|---|---|
| 1 | 2 | 3 | 4 | 5 | 6 | ||
| Houses | Number | ||||||
| Furnished | 1,018 | 3,207 | 4,480 | 4,706 | 3,856 | 1,331 | 19,188 |
| Unfurnished | 1,916 | 8,338 | 17,944 | 36,345 | 44,116 | 11,272 | 123,475 |
| Partly furnished | 634 | 1,915 | 2,616 | 2,684 | 2,001 | 810 | 11,065 |
| All rented dwellings | 3,568 | 13,460 | 25,040 | 43,735 | 49,973 | 13,413 | 153,728 |
| Weekly Rent | |||||||
| $ | $ | $ | $ | $ | $ | $ | |
| Furnished | 5.30 | 7.78 | 9.28 | 8.70 | 7.88 | 10.25 | 8.52 |
| Unfurnished | 3.35 | 4.82 | 5.72 | 4.98 | 4.65 | 5.10 | 4.98 |
| Partly furnished | 4.10 | 6.45 | 7.88 | 8.02 | 8.12 | 8.80 | 7.65 |
| All rented dwellings | 4.05 | 5.78 | 6.58 | 5.58 | 5.02 | 5.82 | 5.60 |
| Flats | Number | ||||||
| Furnished | 635 | 2,547 | 3,180 | 1,727 | 513 | 147 | 8,835 |
| Unfurnished | 1,227 | 5,915 | 9,899 | 8,484 | 2,895 | 419 | 29,023 |
| Partly furnished | 317 | 1,484 | 1,837 | 1,086 | 309 | 85 | 5,171 |
| All rented flats | 2,179 | 9,946 | 14,916 | 11,297 | 3,717 | 651 | 43,029 |
| Weekly Rent | |||||||
| $ | $ | $ | $ | $ | $ | $ | |
| Furnished | 5.95 | 8.42 | 10.38 | 11.95 | 12.98 | 14.52 | 10.05 |
| Unfurnished | 3.90 | 5.35 | 6.92 | 7.10 | 6.60 | 8.32 | 6.52 |
| Partly furnished | 5.28 | 7.00 | 8.70 | 9.58 | 10.40 | 11.48 | 8.35 |
| All rented flats | 4.70 | 6.40 | 7.88 | 8.08 | 7.80 | 10.12 | 7.48 |
Tenure of Dwelling—The following table classifies the inhabited permanent private dwellings according to tenure.
| Tenure | 1956 | 1961 | ||
|---|---|---|---|---|
| Number of Dwellings | Percent of Total Specified | Number of Dwellings | Percent of Total Specified | |
| Renting or leasing | 144,721 | 25.80 | 153,728 | 24.34 |
| Free dwelling provided with job | 34,270 | 6.11 | 34,087 | 5.40 |
| Loaned without payment | 9,224 | 1.65 | 8,586 | 1.36 |
| Buying with table mortgage | 130,947 | 23.35 | 166,636 | 26.38 |
| With flat mortgage | 72,760 | 12.97 | 86,359 | 13.67 |
| Unspecified mortgage cases | 553 | 0.10 | 433 | 0.07 |
| Owned without mortgage | 168,383 | 30.02 | 181,793 | 28.78 |
| Not specified | 2,194 | … | 2,085 | … |
| Totals | 563,052 | 100.00 | 633,707 | 100.00 |
The proportion of houses classed as “occupier owned” in 1961 was 68.9 percent as against 66.4 percent in 1956, an increase of 2.5 percent, while rented dwellings decreased by 1.5 percent. The totals for all classes of mortgage were 151,200 in 1951, 204,260 in 1956, and 253,428 in 1961.
Amenities of Dwellings—The next two tables present the various amenities in permanent private dwellings in 1961 and show whether they were used solely by the occupants of a dwelling or shared by occupants of other dwellings.
| Amenity | Not Shared | Shared | Nil | Not Specified | Total |
|---|---|---|---|---|---|
| Hot water service | 588,447 | 6,419 | 37,545 | 1,296 | 633,707 |
| Bath or shower | 607,385 | 7,849 | 17,908 | 565 | 633,707 |
| Flush toilet | 552,512 | 7,825 | 72,886 | 484 | 633,707 |
| Refrigerator | 509,461 | 1,923 | 121,176 | 1,147 | 633,707 |
| Washing machine | 488,253 | 5,800 | 137,607 | 2,047 | 633,707 |
Of the specified cases, 80.8 percent of houses had the sole or shared use of refrigerators and 78.2 percent had the sole or shared use of washing machines.
| Means of Cooking — 1961 | Number of Dwellings | Percent of Total Specified |
|---|---|---|
| Electric range, stove | 434,960 | 68.80 |
| Electric cooker, stovette, rangette, plate, ring, etc. | 2,129 | 0.34 |
| Gas range, stove | 82,695 | 13.08 |
| Gas cooker, stovette, ring, etc. | 716 | 0.11 |
| Coal, wood, coke, range | 75,930 | 12.01 |
| Oil range, stove | 479 | 0.08 |
| Oil, other, including primus stove | 131 | 0.02 |
| Electric range and gas range | 3,739 | 0.59 |
| Electric range and coal, wood, coke, range | 25,467 | 4.03 |
| Gas range and coal, wood, coke range | 4,774 | 0.75 |
| Other, including open fire, primus (not stove), camp oven, etc. | 1,227 | 0.19 |
| Not specified | 1,460 | … |
| Totals | 633,707 | 100.00 |
Considering only cases where one means of cooking is used, the electric range held pride of place, being used in 68.8 percent of inhabited dwellings; the next place being held by the gas range which was used in 13.1 percent of inhabited dwellings. Including cases where alternatives are also installed, it will be noted that 73.7 percent of the dwellings in New Zealand were equipped with an electric range. When this question was first asked (1945 census), the position was that in 37.7 percent of the dwellings a coal, wood, or coke range was used and in 29.9 percent an electric range. It should be remembered that the 1945 figures do not include Maori dwellings.
At the 1961 census 74.1 percent of dwellings were heated mainly by open fireplaces, 9.8 percent by space heaters, 9.9 percent by electric fires or radiators, and 2.5 percent by kerosene heater or radiator.
In 1961, 87.8 percent of all inhabited permanent private dwellings had piped water, while 11.8 percent depended on rainwater tanks, and only 0.4 percent had no water laid on.
Materials of Outer Walls—The following table gives an analysis showing the materials of which the outer walls of inhabited permanent private dwellings were constructed. Flats are included individually and not as blocks. Therefore part of the increase, for instance, in brick and concrete construction, is accounted for by a lesser number of buildings than indicated by the difference in number of dwelling units.
| Material of Outer Walls | Number of Dwellings | |
|---|---|---|
| 1956 | 1961 | |
| Wood | 411,370 | 431,318 |
| Stone | 1,121 | 2,456 |
| Concrete, including concrete blocks | 17,869 | 22,510 |
| Concrete and wood | 1,087 | 2,039 |
| Brick, including hollow brick | 47,420 | 65,171 |
| Brick and wood | 3,332 | 6,157 |
| Brick and other material | 3,401 | 7,035 |
| Wood and iron | 3,721 | 3,314 |
| Wood and proprietary wallboard | 2,369 | 7,335 |
| Iron | 3,862 | 3,083 |
| Asbestos | 2,011 | 2,176 |
| Proprietary wallboards of asbestos type | 26,250 | 47,963 |
| Roughcast | 27,944 | 25,555 |
| Other materials | 3,922 | 6,817 |
| Not specified | 7,373 | 778 |
| Totals | 563,052 | 633,707 |
Although the number of houses and flats with outer walls of wood increased by slightly less than 20,000 between the 1956 and 1961 censuses, as a percentage of all inhabited permanent private dwellings they decreased from 73.1 to 68.1.
Houses and flats with outer walls constructed of concrete, brick, proprietary wallboards of asbestos type., and roughcast increased both in number and as a percentage of the total, thus continuing the post-war trend.
Materials for Roofs—Most dwellings (70.7 percent) in 1961 were roofed with sheet or corrugated iron with tiles the next popular choice (21.4 percent).
Numbers of Rooms and Occupants—The following table classifies inhabited permanent private dwellings in 1961 according to the number of rooms and the number of occupants.
| Number of Rooms | Number of Occupants | |||||||||
|---|---|---|---|---|---|---|---|---|---|---|
| 1 | 2 | 3 | 4 | 5 | 6 | 7 | 8 and Over | Total Dwellings | Average Per Dwelling | |
| 1 | 4,884 | 909 | 256 | 192 | 98 | 68 | 39 | 66 | 6,512 | 1.5 |
| 2 | 8,935 | 7,238 | 2,204 | 1,038 | 536 | 277 | 169 | 268 | 20,665 | 2.0 |
| 3 | 11,157 | 16,579 | 8,437 | 5,567 | 2,778 | 1,424 | 801 | 1,147 | 47,890 | 2.7 |
| 4 | 19,897 | 45,350 | 28,683 | 24,419 | 12,294 | 5,828 | 2,727 | 2,820 | 142,018 | 3.1 |
| 5 | 17,003 | 52,424 | 44,657 | 54,214 | 41,824 | 22,211 | 9,497 | 7,728 | 249,558 | 3.8 |
| 6 | 6,976 | 21,361 | 18,890 | 22,031 | 18,322 | 11,688 | 6,255 | 5,963 | 111,486 | 4.1 |
| 7 | 1,929 | 5,932 | 5,660 | 6,800 | 6,171 | 4,211 | 2,276 | 2,122 | 35,101 | 4.2 |
| 8 | 634 | 1,897 | 1,879 | 2,164 | 2,095 | 1,539 | 838 | 833 | 111,879 | 4.4 |
| 9 | 217 | 607 | 652 | 727 | 711 | 505 | 319 | 299 | 4,037 | 4.4 |
| 10 | 90 | 297 | 280 | 321 | 303 | 217 | 119 | 143 | 1,770 | 4.4 |
| 11 and over | 97 | 270 | 280 | 306 | 261 | 191 | 130 | 113 | 1,648 | 4.4 |
| Not specified | 185 | 289 | 200 | 160 | 123 | 76 | 49 | 61 | 1,143 | 3.5 |
| Totals | 72,004 | 153,153 | 112,078 | 117,939 | 85,516 | 48,235 | 23,219 | 21,563 | 633,707 | 3.6 |
Of the total number of dwellings (where number of rooms was specified) 503,062, or 79.5 percent, had either four, five, or six rooms and of these 312,029 were occupied by either two, three, or four persons.
The number of dwellings with only one occupant increased from 56,414 in 1956 to 72,004 in 1961, a rise of 27.6 percent, with those living alone in dwellings of three rooms rising from 8,210 to 11,157, those in four rooms from 14,993 to 19,897 and those in five rooms from 12,400 to 17,003. A large proportion of these persons living alone are widows.
TENANCY—The Tenancy Act 1935 administered by the Department of Labour governs rents and possession of certain houses and business premises. Because of the progressive relaxation of this legislation since 1950 the Act now has only limited application. The principal exemptions are (a) all flats erected or resulting from conversion of buildings into flats since November 1953; (b) all buildings erected since October 1955; (c) all tenancy agreements entered into since November 1961; (d) all business premises with the exception of those still protected in 1964 where application was made to a Court to have protection extended until 1967. Where the Act does apply, a landlord or a tenant may apply to a rents officer or the Magistrate's Court to fix a fair rent.
ELECTRIC POWER DEVELOPMENT—New Zealand has been generously endowed with natural resources which can be developed for the generation of electric power. Its vast lakes supply natural storage reservoirs for hydro-electric schemes, and the rain and melting snows in the mountain areas continually replace the waters which are harnessed to supply electrical energy. Natural lakes have been supplemented by man-made lakes backing up from hydro-electric dams across rivers. In the thermal regions nature has provided geothermal steam, which also is being developed to provide power.
An important factor governing future plans for electric power development is that the hydro potential is mainly in the South Island and the preponderance of population is in the North Island. In 1962, after extensive investigations, the New Zealand Electricity Department commenced the task of erecting the 379–mile 500,000–volt direct-current transmission line between Benmore in the South Island and Haywards in the North Island, which incorporates a 25–mile submarine cable-link across Cook Strait. The installation went into commercial service on 1 April 1965.
In the North Island, maximum run-off of water in the catchment areas usually occurs in the winter whereas in the South Island the maximum run-off for the snow-fed rivers such as the Waitaki and Clutha is in the summer months. For the interconnected system lake-storage problems have been greatly simplified and costs reduced.
Geothermal steam is making a material contribution to electric power generation in the centre of the North Island. The Wairakei scheme is based on tapping a vast underground hot-water system. Investigations for further steam areas are continuing in eight other parts of the thermal zone.
In the Waikato the Meremere coal-fired station makes a significant contribution to the North Island electric supply but at a much greater cost per unit than hydro power.
A number of hydro schemes are under construction or investigation, the majority in the South Island, where the present electric development programme is based primarily on hydro resources. In the North Island, however, an oil-burning steam station is being built at Marsden Point, near Whangarei, and a gas turbine station at Otahuhu. Construction in the south of the North Island of a large coal-fired steam station, to be run on coal shipped from the South Island is planned. Further thermal capacity will be required in the future. This will include nuclear generation, which is expected to start in 1977.
Electricity supply in New Zealand was pioneered by private and local enterprise. Reefton had hydro-electric supply as early as 1888. Wellington in the following year opened a water-powered plant using water from the city mains but later switched to steam generation. Auckland and Christchurch, using steam-generating stations, and Dunedin, using hydro plant situated at Haipori, all had supplies extensively developed before the advent of Government supply. By 1918 many smaller municipalities also had local electricity supply, mostly produced from local steam stations, although in some cases advantage had been taken of an adjacent water supply to develop hydro-electricity.
DEVELOPMENT OF WATER POWER: North Island—The hydro-electric power station at Horahora on the Waikato River, privately built in 1913, was purchased by the Government in 1919. Between 1920 and 1930 several Government stations were constructed, the first being the Mangahao station in the Tararuas which commenced to supply the surrounding area in 1924. After the Mangahoa station was completed a commencement was made in 1926 on the development of the Waikaremoana scheme, which consists of three stations, Kaitawa, Tuai, and Piripaua. The first station completed, Tuai, commenced supply in 1929; Piripaua station produced first power in 1943, and Kaitawa station in 1948. The three stations are within a distance of 5 miles, and the power generated by each is collected and transmitted from Tuai, the centre station.
The Waikato River constitutes the principal power source in the North Island, having, in its course of 200 miles from Lake Taupo, a total fall of 1,170 ft and a final discharge of over 10,000 cusecs. The rate of flow from Lake Taupo is controlled by gates constructed in 1941 to conserve the water previously lost in the heavy spring and summer run-off.
Arapuni, Karapiro, Maraetai, Whakamaru, Atiamuri, Ohakuri, Waipapa, and Aratiatia power stations have been constructed on the Waikato River. The stations make use of the greater part of the fall of the Waikato River from Lake Taupo to Cambridge.
Arapuni came into operation (with one unit) in 1929, but was closed down between 1930 and 1932 as a result of damage caused by an earth movement. Further extensions commenced in 1934, and by 1946 Arapuni had eight units operating. Construction at Karapiro commenced in 1940 and at Maraetai in 1946. Karapiro station came into operation in 1947–48 with three units, the Horahora station ceasing generation as its site was submerged by the newly formed Karapiro lake. This artificial lake is 15 miles long and extends up river to Arapuni. Late in 1952 the Maraetai station was brought into operation, and by April 1954 the installation of the fifth machine brought Maraetai to its full rating of 180,000 kW. Construction on Whakamaru was commenced in 1949; the station was commissioned with two machines in May 1956 and completed in December 1956 with four machines totalling 100,000 kW. Atiamuri station was begun in 1953 and the first machine was commissioned in November 1958; the station reached its full capacity of 84,000 kW from four machines in April 1962.
During 1961 three machines were commissioned at Ohakuri and the station was completed in February 1962 with a capacity of 112,000 kW from four machines. The hydro station at Waipapa was completed with three machines totalling 51,000 kW in November 1961 and the 90,000 kW Aratiatia station in May 1964. A 72,000 kW station scheduled for first operation in April 1967 is under construction at Matahina on the Rangitaiki River, and work has also commenced on a complex scheme to develop the waters of the Tongariro and Wanganui catchments for hydro-electric development. This includes a 200,000 kW station at Tokaanu. A second powerhouse to contain machines with a total capacity of 180,000 kW is being built at Maraetai, slightly downstream from the existing powerhouse. Maraetai II will share the waters of Maraetai Lake with the present station, thus total yearly output from the site will not increase, although useful peak-time capacity will be added.
All the State-owned stations are linked and operate as one system. Connections also exist with all the larger non-Government generating stations (steam and hydro). To transmit power for distribution from the new stations on the Waikato, a 220,000–volt system was added to the existing network of 110,000– and 50,000–volt transmission lines and interconnected substations. From Whakamaru collecting station, electricity is transmitted to the major substations at Otahuhu in the north and Bunnythorpe and Haywards in the south.
South Island—The Lake Coleridge station was commenced in the year following the passing of the Aid to Water Power Works Act 1910 and commissioned in 1914. This was the first station wholly designed and constructed by the Government. Its initial capacity was 4,500 kW, but by 1930 this was increased to 34,500 kW. The next station, Waitaki, commenced in 1928, came into use in 1935, and with the commissioning of its fifth machine in March 1949 was developed to its originally designed capacity of 75,000 kW. This was later increased by the addition of two further units which came into operation in May and June 1954, bringing total capacity to 105,000 kW. Further use of the Waitaki River has been made at Benmore, where a station with a capacity of 540,000 kW produced first power from one 90,000 kW machine in January 1965. The sixth and final machine was commissioned in May 1966. At Aviemore, a few miles downstream, a 220,000 kW station is being built. Further schemes for development of the Waitaki River Basin are in the planning or investigation stages. Control works were built at Lakes Pukaki and Tekapo, to ensure an adequate water supply to Waitaki stations during the winter, and a single unit of 25,200 kW, incorporated in the control works at Lake Tekapo, was commissioned in May 1951. Another single unit, also of 25,200 kW, was installed in 1945 at Highbank to make use of the surplus water available in winter from the Rangitata irrigation race.
In 1936 the Government took over the Southland Electric Power Board's system, including the generating station at Lake Monowai, and in 1937 acquired from the Grey Electric Power Board the Arnold station at Kaimata.
Construction of the Cobb River station, with a capacity of 12,000 kW, was commenced by a private company, but the project was taken over and completed by the Government. Supply from this station, which has now been expanded in capacity to 32,000 kW, commenced in 1944.
The Roxburgh station on the Clutha River has a capacity of 320,000 kW. First operation of this station was in July 1956, and by December 1956 four machines with a capacity of 160,000 kW were commissioned. Two further machines were commissioned in 1961 and the last two in 1962.
A grid system similar to that in the North Island was established in 1939, when the Lake Monowai, Arnold, Lake Coleridge, and Waitaki stations were linked. A 220,000–volt line was constructed from Roxburgh to a major substation at Islington to bring the power from Roxburgh. From Islington a 220,000–volt line was extended to Kikiwa in the Nelson Provincial District and completed in 1958. This completed the linking of the Nelson-Marlborough area with the main South Island network.
In February 1963 the Government announced that it would take over the development of the Manapouri power potential from the organisation which had originally intended to develop the scheme to provide power for an aluminium industry. This scheme involves an underground power station using the waters of Lake Manapouri which will be discharged through a 6 1/4–mile tunnel to Doubtful Sound. A first-stage development of 400,000 kW is proceeding and power not required for the aluminium industry will be fed into the national grid.
THERMAL STATIONS—In the North Island a steam station at King's Wharf, Auckland, and one at Evans Bay, Wellington, with a combined capacity of 49,000 kW are now used only for peak-load and emergency purposes. In order to provide additional power in the North Island, a coal-fired steam station was constructed near Mercer, on the Waikato River. Meremere station, as it is called, was commenced in 1956 and first commissioned with two machines in August 1958 and completed in 1960 with six machines rated at 180,000 kW. Coal to feed the boilers is obtained from Huntly mines and is also brought by aerial cableway across the swamps from opencast mines at Maramarua. A seventh machine of 30,000 kW is currently being added.
An oil-fixed station is under construction at Marsden Point and a gas turbine station at Otahuhu.
GEOTHERMAL STEAM—At Wairakei station, a few miles north of Taupo, geothermal steam is being harnessed for the generation of electricity and the first machine in the initial development commenced generating in November 1958. The station now has a capacity of 192,420 kW. Bores which are 4, 6, or 8 in. in diameter have been drilled to depths varying between 570 ft and 4,000 ft. With closed bores, well-head pressures vary between 50 and 500 lb per square inch. High-pressure valves are required to control the output from the bores. The quantity of steam discharged from the bores varies considerably, and a large quantity of water is ejected with the steam. The steam contains a trace of gas, mostly carbon dioxide; and in the water about three parts in a thousand are dissolved solids.
Steam is collected from a number of wells after being separated from the water that is ejected with it and piped to the power station through steel mains. From the mains the steam passes through high-pressure, intermediate-pressure, and low-pressure turbo-alternators, after which it is condensed to water and discharged into the Waikato River. A wide investigation is now being made of the possibilities of other geothermal resources.
COOK STRAIT SUBMARINE POWER CABLE—The Government announced in March 1956 that it had been decided to proceed immediately with a detailed investigation into the practicability of linking the power systems of the North and South Islands by a submarine cable across Cook Strait. The interconnection by a direct-current cable designed for 600,000 kW capacity was investigated and a trial length of cable which was laid in Cook Strait in May 1958 was lifted in March 1960 and returned to the manufacturers in England for inspection. An overseas firm of consultants furnished an independent report in 1959 for Government consideration. The report stated that the installation of submarine cables across Cook Strait would be difficult but the project was feasible. In March 1961 the Government decided to proceed with the project which involved not only the installation of submarine cables but also the construction of an overhead 500 kV d.c. transmission line from Benmore to the southern side of Cook Strait and from the north side to Haywards, and the installation of a.c./d.c./a.c. converting plant and equipment at Benmore and Haywards substations. The transfer of power across Cook Strait began in April 1965.
PLANNING FOR ELECTRIC POWER—Forward planning is continually under review to ensure that the increasing demand may be met at all times. New schemes have to be conceived, designed, and constructed, while at the same time provision must be made for the transmission system to be expanded so that the power will become available when and where needed for future requirements. In 1957 a Combined Committee was set up to assist in this complicated task. The Committee consisted of members of the New Zealand Electricity Department, Ministry of Works, and representatives of the electrical supply authorities.
In June 1957 the Government announced that the Committee's recommendations on how to meet future power demands were generally approved as a basic plan for the comprehensive and orderly development of the electric power system.
The use of committees has become an important feature of planning and for some years the following procedure has taken place. The Power and Finance Utilisation Committee of the Electrical Supply Authorities Association, on which the New Zealand Electricity Department is represented, collates detailed estimates for each area of unit consumption and peak demand for a period of five years in advance. These estimates, which are revised and extended each year, show when and where power will be required in all parts of New Zealand. The Committee to Review Power Requirements then considers the estimates. This committee has as chairman the General Manager of the New Zealand Electricity Department, with his Chief Engineer, a representative of the supply authorities, a representative of the Treasury, and the Government Statistician as members. Its function is to combine and project the supply authority estimates for a further five years for the North and South Island requirements and for New Zealand as a whole, also comparing them with the New Zealand requirements as arrived at by statistical methods. A Planning Committee on Electrical Power Development in New Zealand, which consists of members of the New Zealand Electricity Department, Ministry of Works, Treasury, and supply authority representatives, with the General Manager of the New Zealand Electricity Department as chairman, considers the findings of the Review Committee.
The Planning Committee recommends what projects it considers should be proceeded with, and when, in order to meet the estimated needs. The review and planning reports are submitted to the Minister of Electricity who tables them in the House of Representatives.
In 1962 the Government passed an Act to set up an Electricity Council to advise as to the extent to which an adequate supply and effective distribution of electricity is being achieved, to review the provision being made to meet the demand, and to report annually to Parliament on the plan of development.
To finance the huge outlay involved in electricity development the New Zealand Electricity Department drew up a plan which involved decreasing dependence on loan moneys, thus reducing the interest bill as well as stabilising the price. Legislation was passed in 1957 which made the Department no longer liable for income tax, provided that interest formerly capitalised be charged to revenue, and allows for revenue to provide a direct contribution towards capital requirements. This last provision came into effect in October 1961.
PROJECTED ELECTRICITY REQUIREMENTS—There has been a great upsurge in the consumption of electric power. Power generated to meet the demand doubled between 1957 and 1966 to reach 10,576 million kilowatt hours per annum. In the same period generating capacity of power plants was also doubled to reach over 2.5 million kilowatts. Projected power requirements are expected to double again by 1976, to reach over 21,700 million kilowatt hours. To meet the estimated power needs the generating capacity must be increased to 4.9 million kilowatts by 1976.
Up to 1956 some $362 million had been expended in generation, transmission, and distribution, of which the Government share was $260 million. By 1966 the capital invested by the Government had risen to $674 million, and with the further expenditure by the electrical supply authorities on distribution, the total capital outlay had increased to $919 million. By 1976 the provision of barely sufficient generating capacity to meet the expected power needs could call for a further expenditure by Government of some $870 million. To this must be added the capital needs of the electrical supply authorities who must also increase the capacity of their distribution systems in step with the increasing power demand. In all probability the capital investment in 1976 in all branches of the electrical supply system will be in the region of $1,940 million.
Huge construction projects are necessary to meet the demand. The Benmore project on the Waitaki River, came into operation in 1965 and the transmission of 600,000 kW of power to the North Island involves 354 miles overland and 25 miles across Cook Strait, a large scheme by world standards. The World Bank made a loan of $23.2 million to meet overseas costs of this project. Construction is in progress at Aviemore on the Waitaki River of a station similar to Benmore but of the lesser capacity of 220,000 kW, and a massive hydro scheme has been started at Tongariro which is estimated to cost $143 million and involves the diversion of water from some of the tributaries of the Wanganui River into Lake Rotoaira and thence into Lake Taupo, and also the diversion of the headwaters of the Moawhango River and tributaries of the Whangaehu River into the Tongariro River and thence into Lake Rotoaira. The Manapouri project will, it is hoped, begin contributing to the national grid in 1969, initially with a capacity of 200,000 kW. An oil-fired thermal station with two 120,000 kW generators is being built at Marsden Point, Whangarei, to produce power in 1967, and this will help in the transmission problems of delivering power to the Auckland area. There are other projects under construction and investigation.
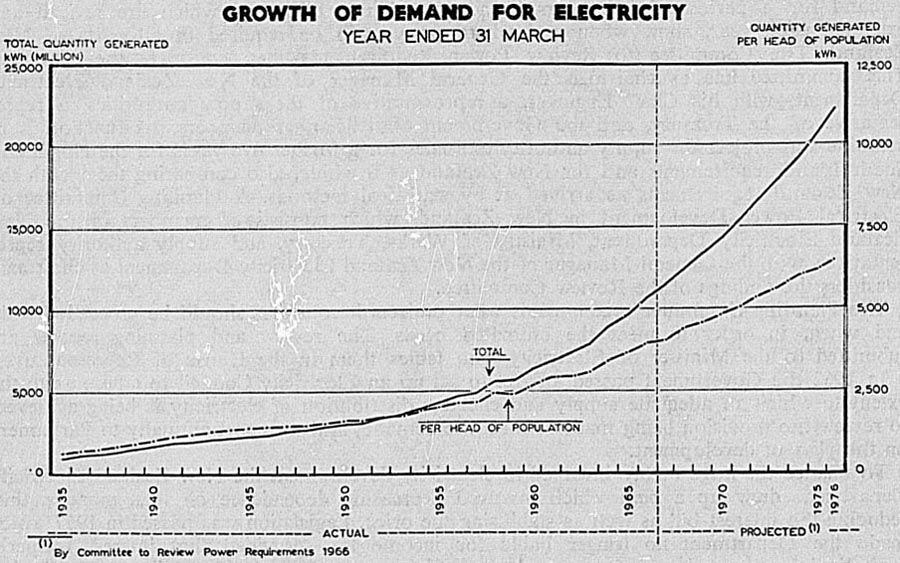
LEGISLATION—Under the Electricity Act 1945 the New Zealand Electricity Department is responsible for preparing plans to meet the expected demand for electric power and for controlling the State generating and transmission systems. In general, hydraulic investigation and civil engineering are carried out by the Ministry of Works to the requirements of the New Zealand Electricity Department. The New Zealand Electricity Department is responsible for the overall functional design of each station, detailed design and installation of all turbines, generators, and associated electrical and mechanical equipment, for the design and installation of equipment at substations, for the survey, design, and construction of transmission lines, and for the operation and maintenance of the networks which supply electricity in bulk to the distributing authorities.
ELECTRIC POWER BOARDS AND SUPPLY AUTHORITIES—Various local authority Acts from the eighteen eighties onwards made provision for counties and municipalities to supply electricity in addition to their other functions, but in 1918 legislation was passed enabling local authorities to be set up with the sole function of supplying electricity. The legislation, amended and consolidated under the Electric Power Boards Act 1925, provided for the constitution of electric power districts controlled by boards.
Of the 41 electric power boards actively functioning at 31 March 1966, 15 had generating stations of a total rated generating capacity of 35,604 kW. There were also 31 municipal electric supply authorities, 10 of them having generating stations of a total rated generating capacity of 56,132 kW. Two Government Departments, New Zealand Electricity and Tourist and Publicity, act as distributing authorities for Southland and Rotorua respectively. The licensed areas under the control of the boards and other authorities at 31 March 1966 totalled approximately 94,507 square miles, in which there are resident 99.6 percent of the total population of New Zealand.
While the constitution of electric power boards enabled power to be available to more people outside the towns, the supply to remote areas still presented difficulties because of the high cost of reticulation in comparison with the revenue from power sold. It was later agreed by the supply authorities that a council should be set up with power to make a levy of 1/4 percent on the gross revenue of all supply authorities and Government-owned electrical undertakings, and that these funds be used in the form of subsidies to meet the annual cost of supply in remote areas. (In 1961 legislation was passed to permit the application of a levy of up to 1/2 percent of the gross revenue.) The Rural Reticulation Council was set up under the Electricity Act 1945, and up to 31 March 1966 had approved subsidies on 8,458 route-miles of line to supply some 12,638 consumers. At this date 8,005 miles of line were completed and 13,086 consumers connected. The total capital expenditure was estimated at $13,318,416 and the subsidy approved for the year amounted to $511,844.
PUBLIC SUPPLY STATIONS—The following tables cover all stations whose output is fully or partially available to the public supply system as at 31 March 1967, their installed capacity, static head where applicable, and annual energy generation. Stations are State owned unless otherwise indicated.
| Name of Station | Installed capacity at 31 March 1967 | Static Head | Annual Energy Generation Year Ended 31 March 1966 | Annual Load Factor | |
|---|---|---|---|---|---|
| Number of Units | M.W. | ||||
* Owned by Dunedin City Council. † Owned by other supply authorities and industries. ‡ Commissioned 1967. | |||||
| Hydro | ft | million units | percent | ||
| Arapuni | 8 | 157.8 | 175 | 823,616 | 56.47 |
| Karapiro | 3 | 90.0 | 100 | 524,974 | 55.96 |
| Maraetai | 5 | 180.0 | 200 | 851,200 | 52.19 |
| Whakamaru | 4 | 100.0 | 124 | 489,134 | 53.90 |
| Atiamuri | 4 | 84.0 | 81 | 276,389 | 39.39 |
| Waipapa | 3 | 51.0 | 53 | 254,832 | 50.59 |
| Ohakuri | 4 | 112.0 | 115 | 381,769 | 37.44 |
| Aratiatia | 3 | 90.0 | 110 | 283,892 | 40.21 |
| Matahina‡ | 2 | 72.0 | 195 | – | – |
| Mangahao | 5 | 19.2 | 896 | 70,870 | 37.45 |
| Waikaremoana— | |||||
| Kaitawa | 2 | 32.0 | 443 | 95,646 | 36.82 |
| Tuai | 3 | 52.0 | 676 | 205,206 | |
| Piripaua | 2 | 40.0 | 370 | 135,221 | |
| Cobb | 6 | 32.0 | 1,950 | 170,124 | 58.1 |
| Arnold | 2 | 3.1 | 42 | 27,463 | 95.0 |
| Coleridge | 9 | 34.5 | 490 | 135,113 | 36.5 |
| Highbank | 1 | 25.2 | 330 | 111,542 | 44.8 |
| Waitaki | 7 | 105.0 | 70 | 393,382 | 40.3 |
| Benmore | 6 | 540.0 | 302 | 1,634,795 | 50.5 |
| Tekapo | 1 | 25.2 | 100 | 82,027 | 31.8 |
| Roxburgh | 8 | 320.0 | 150 | 1,282,817 | 43.6 |
| Monowai | 3 | 6.0 | 154 | 36,348 | 62.9 |
| Waipori* | 10 | 44.6 | – | 117,770 | – |
| Auxiliary† | 41.0 | – | 215,698 | ||
| Sub-totals | 2,256.6 | 8,599,828 | |||
| Thermal | |||||
| Meremere | 6 | 180.0 | 718,490 | 45.02 | |
| Wairakei | 13 | 192.4 | 1,255,424 | 86.33 | |
| King's Wharf | 4 | 27.0 | 2,438 | – | |
| Evans Bay | 4 | 22.0 | 632 | – | |
| Sub-totals | 421.4 | 1,976,984 | |||
| Totals | 2,678.0 | 10,576,812 | |||
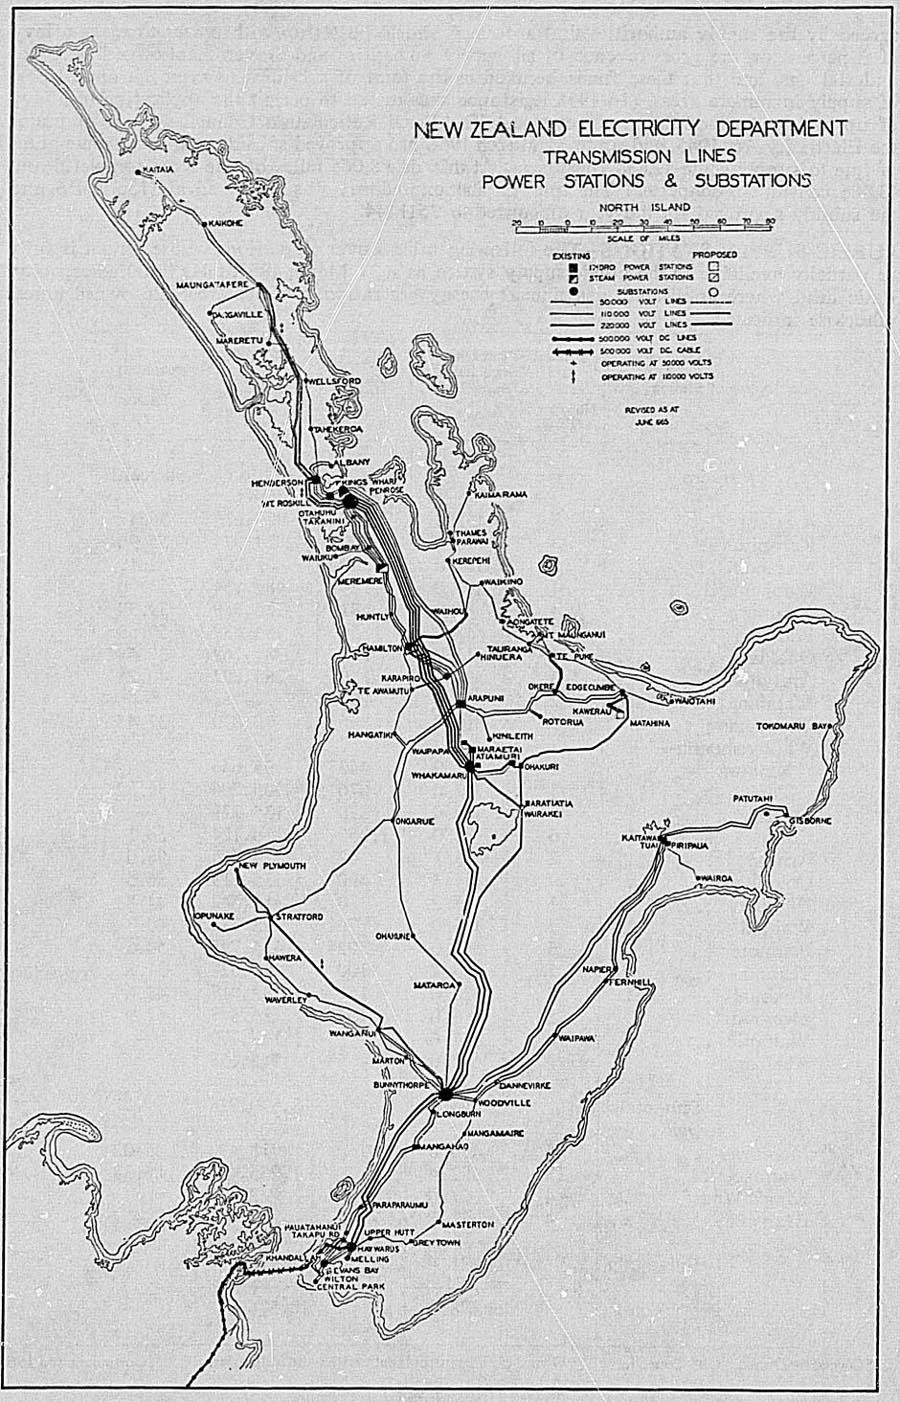
ANNUAL GENERATION—During the year ended 31 March 1966 a total of 10,565 million kWh was generated by public utilities, of which 8,588 million kWh (81 percent) was generated by water power, 1977 million kWh by steam plant, and 438,000 kWh by oil plant. A further 12.6 million kWh was purchased by public supply authorities from generating stations operated by industrial establishments and fed into the supply system, making a total of 10,578 million kWh available for distribution. By far the major portion of the generation is undertaken by Government-owned plants, which, in the period under review, generated 8,266 million kWh by the use of water power and 1,977 million kWh by use of steam power.
REVIEW OF OPERATIONS—The following table gives information concerning generation and distribution by Government establishments, local authorities, and electric power boards for the year ended 31 March 1966.
| Item | Government Establishments | Electric Power Boards | All Establishments* | |
|---|---|---|---|---|
| * Includes 12 city councils, 16 borough councils and 3 county councils. | ||||
| Establishments | No. | 24 | 41 | 96 |
| Persons engaged | No. | 4,001 | 4,840 | 10,866 |
| Salaries and wages paid | $(000) | 9,204 | 11,457 | 25,213 |
| Consumers | No. | 38,318 | 651,687 | 967,091 |
| Prime movers— | ||||
| Hydro | b.h.p. (000) | 2,837 | 36 | 2,955 |
| Thermal | b.h.p.(000) | 491 | 15 | 507 |
| Totals | b.h.p.(000) | 3,329 | 51 | 3,462 |
| Generators (capacity)— | ||||
| A.C. | kW(000) | 2,430 | 36 | 2,522 |
| Revenue— | ||||
| Sales of power – | ||||
| Retail | $(000) | 6,254 | 64,024 | 98,659 |
| Bulk and interchange | $(000) | 57,392 | 3,416 | 60,831 |
| Other (including rates) | $(000) | 446 | 1,198 | 2,141 |
| Total revenue | $(000) | 64,092 | 68,638 | 161,631 |
| Expenditure— | ||||
| Power purchased (including inter-change) | $(000) | 843 | 43,164 | 60,912 |
| Generating costs | $(000) | 7,168 | 179 | 7,590 |
| Transmission and distribution costs | $(000) | 3,320 | 7,011 | 13,580 |
| Management and general | $(000) | 3,333 | 4,919 | 10,369 |
| Capital charges | $(000) | 35,481 | 10,883 | 50,347 |
| Total expenditure | $(000) | 50,145 | 66,156 | 142,798 |
| Capital outlay— | ||||
| Total expenditure to date | $(000) | 676,907 | 177,324 | 918,794 |
| Expenditure during year | $(000) | 65,263 | 14,386 | 84,804 |
| Generation— | ||||
| Hydro | Million kWh | 8,266 | 149 | 8,586 |
| Steam | Million kWh | 1,977 | – | 1,990 |
| Oil | Million kWh | – | – | – |
| Totals | Million kWh | 10,243 | 149 | 10,577 |
| Retail sales | Million kWh | 734 | 5,838 | 9,004 |
Generation per head of mean population was 3,979 kWh for the year ended 31 March 1966.
Employment—Details concerning the number of employees and the salaries and wages paid to them are given in the following table for the year ended 31 March 1966.
| Category of Staff | Persons Engaged | Salaries and Wages Paid | ||||
|---|---|---|---|---|---|---|
| Males | Females | Total | To Males | To Females | Total | |
| No. | No. | No. | $(000) | $(000) | $(000) | |
| Charged to operation and management— | ||||||
| Managerial and clerical | 2,114 | 778 | 2,892 | 5,709 | 1,062 | 6,771 |
| Wage earners | 5,934 | 106 | 6,040 | 13,683 | 173 | 13,856 |
| Charged to capital— | ||||||
| Managerial and clerical | 108 | 7 | 115 | 298 | 11 | 309 |
| Wage earners | 1,803 | 16 | 1,819 | 4,248 | 30 | 4,278 |
| Totals | 9,959 | 907 | 10,866 | 23,938 | 1,276 | 25,214 |
Capital Expenditure—The following table gives capital expenditure during 1965–66 and total capital outlay to 31 March 1966.
| Item | Expenditure During Year | Total Capital Outlay to 31 March 1966 |
|---|---|---|
| $(000) | $(000) | |
| Generating system— | ||
| Head works, pipelines, etc. | 38,660 | 319,674 |
| Powerhouse buildings, cottages, etc. | 9,532 | 65,726 |
| Generating plant and machinery, etc. | 9,420 | 105,374 |
| Transmission and distribution lines, substations, land and houses | 18,024 | 325,594 |
| Street lighting | 472 | 4,658 |
| Office and store buildings, workshops, garages, houses, service buildings | 676 | 20,736 |
| Loose tools, meters, instruments, furniture, trucks, motorcars, equipment | 3,796 | 26,164 |
| Miscellaneous (cost of raising loans, loan conversion premiums, surveys, preliminary expenses, interest during construction) | 2,398 | 30,732 |
| Stock and materials (including trading department stocks) | 1,738 | 19,550 |
| Other items not capable of inclusion above | 88 | 586 |
| Total capital outlay | 84,804 | 918,794 |
Additions to the capital value of all electrical systems during 1965–66 totalled $85,782,000, while deductions, i.e., sales and amounts written off, amounted to $978,000. The previous table shows for each item the net expenditure only during the year.
General Balance Sheet as at 31 March 1966—The next table summarises the balance sheet at 31 March 1966 for all establishments.
| Liabilities | ||
|---|---|---|
| $(000) | $(000) | |
| Capital raised— | ||
| Original amount of current loans | 689,330 | |
| Less amounts repaid | 100,284 | |
| Balance owing on 31 March 1966 | 589,046 | |
| Temporary loans | .. | 744 |
| Sundry creditors— | ||
| Bank overdraft | .. | 1,360 |
| Other | .. | 23,726 |
| Reserves— | ||
| Loan repayment reserve | .. | 111,192 |
| Capital expenditure out of revenue | .. | 57,530 |
| Sinking fund reserve | .. | 6,770 |
| Depreciation reserve | .. | 99,500 |
| Renewal fund reserve | .. | 3,566 |
| General and other reserves | .. | 71,200 |
| Surplus in Appropriation Account | .. | 10,400 |
| Total | 975,034 | |
| Assets | |
|---|---|
| $(000) | |
| Total capital outlay | 918,794 |
| Sundry debtors | 25,468 |
| Other assets— | |
| Cash and trading bank balances | 4,414 |
| State Advances stock, balances at POSB, National Savings | 118 |
| New Zealand Government stock | 2,002 |
| Local authority stock | 1,610 |
| Public Trust and National Provident Fund | 14,038 |
| Other | 8,590 |
| Total | 975,034 |
Power—The following table sets out the number of units generated and their disposal. The excess generation of certain local factories, which is bought in for public supply, is given in the column “Other Sources”.
| Year Ended 31 March | Generated for Public Supply | Sold Retail | Nonproductive | |||
|---|---|---|---|---|---|---|
| N.Z. Electricity Department | Supply Authorities | Other Sources | Total | |||
| million kWh | ||||||
| 1962 | 7,087 | 305 | 7 | 7,399 | 6,169 | 1,230 |
| 1963 | 7,594 | 349 | 8 | 7,951 | 6,634 | 1,267 |
| 1964 | 8,652 | 300 | 11 | 8,963 | 7,577 | 1,386 |
| 1965 | 9,375 | 331 | 12 | 9,718 | 8,189 | 1,529 |
| 1966 | 10,243 | 322 | 13 | 10,578 | 9,004 | 1,573 |
Analysis of Units Retailed—The following table gives a classification of power retailed according to the various purposes for which it was sold. In this table “Domestic” includes domestic water-heating units, and “Commercial” both commercial and dairy water-heating units.
| Year Ended 31 March | Domestic | Commercial and Industrial | Street Lighting | Tramways and Trolley Buses | Electric Railways | Other Purposes | Total |
|---|---|---|---|---|---|---|---|
| million kWh | |||||||
| 1962 | 3,656 | 2,419 | 48 | 22 | 24 | – | 6,169 |
| 1963 | 3,920 | 2,661 | 58 | 22 | 23 | – | 6,684 |
| 1964 | 4,408 | 3,056 | 65 | 21 | 23 | 4 | 7,577 |
| 1965 | 4,715 | 3,354 | 72 | 22 | 23 | 2 | 8,189 |
| 1966 | 5,192 | 3,686 | 81 | 21 | 23 | 2 | 9,004 |
The following diagram portrays the growth in the use of electric power, and shows also the principal purposes for which the power was employed.
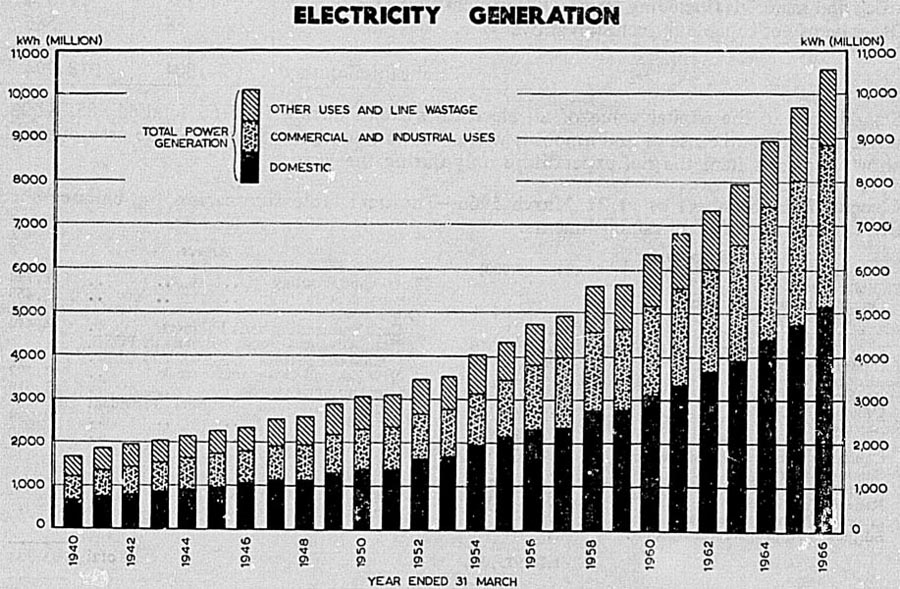
Revenue—Revenue is derived chiefly from the sale of power, and in 1965–66 this source was 97.6 percent of the total. The following table sets out the revenue from all sources (excluding bulk sales) for the latest five years.
| Year Ended 31 March | Sale of Power (Retail) | Profits from Trading | Miscellaneous | Total* |
|---|---|---|---|---|
| * Excluding revenue from interchange of power. | ||||
| $(000) | $(000) | $(000) | $(000) | |
| 1962 | 68,899 | 264 | 1,554 | 70,717 |
| 1963 | 74,941 | 254 | 1,474 | 76,669 |
| 1964 | 83,629 | 250 | 1,668 | 85,547 |
| 1965 | 89,990 | 330 | 1,889 | 92,209 |
| 1966 | 98,660 | 332 | 1,808 | 100,800 |
Expenditure—Of the total expenditure of $81,968,000 (excluding cost of interchange of power in bulk) recorded in the year ended 31 March 1966, 74.1 percent represented overhead costs (comprising management expenses and capital charges), while operating expenses of prime costs stood at 25.9 percent.
Power may be sold more than once in bulk before reaching the retailing authority, and in these tables the revenue from such interchange of power between authorities is set off against the cost, the net figure for cost of power purchased representing the cost to the industry of purchases from outside sources. In this connection mention may be made of certain contracts existing between the Government and some local authorities, whereby the latter are required to maintain their plants and to operate them, whenever called upon, to supplement the State electricity supply. The units so generated, often by fuel plants, are purchased by the Government and resold, in most cases to the generating authority, for distribution.
The table following gives an analysis of expenditure, excluding the cost of bulk interchanges.
| Item | Year Ended 31 March | |||
|---|---|---|---|---|
| 1963 | 1964 | 1963 | 1966 | |
| * Does not include the interchange of power Between supply authorities. | ||||
| $(000) | $(000) | $(000) | $(000) | |
| Operating Expenditure | ||||
| Cost of power purchased* | 30 | 58 | 52 | 82 |
| Cost of generation | 1,982 | 2,143 | 2,202 | 2,456 |
| Fuel | 1,594 | 4,296 | 2,826 | 2,787 |
| Repairs and stores | 1,016 | 1,061 | 2,064 | 2,346 |
| Cost of transmission and distribution | 10,622 | 11,255 | 12,217 | 13,272 |
| Public (street) lighting | 216 | 231 | 281 | 308 |
| Totals | 15,461 | 19,044 | 19,642 | 21,251 |
| Miscellaneous Expenditure | ||||
| Cost of management | 7,478 | 8,023 | 8,833 | 9,943 |
| Losses from trading | 15 | 19 | 24 | 17 |
| Other expenditure and insurance | 358 | 498 | 515 | 409 |
| Totals | 7,851 | 8,541 | 9,372 | 10,369 |
| Capital Charges (Including Taxation) | ||||
| Interest | 23,129 | 24,511 | 26,291 | 25,387 |
| Sinking Fund | 978 | 1,044 | 1,267 | 1,169 |
| Renewals | 2,267 | 1,819 | 2,040 | 3,022 |
| Depreciation | 6,778 | 7,480 | 8,307 | 11,387 |
| Loan repayment | 6,531 | 7,845 | 8,644 | 9,382 |
| Totals | 39,683 | 42,699 | 46,549 | 50,347 |
| Grand totals | 62,995 | 70,284 | 75,563 | 81,968 |
The distribution of the expenditure per unit sold retail is given hereunder.
| — | Year Ended 31 March | |||
|---|---|---|---|---|
| 1963 | 1964 | 1965 | 1966 | |
| cents | cents | cents | cents | |
| Operating expenses | 0.232 | 0.252 | 0.240 | 0.236 |
| Miscellaneous expenses | 0.117 | 0.112 | 0.114 | 0.115 |
| Capital charges | 0.593 | 0.563 | 0.568 | 0.559 |
| Totals | 0.942 | 0.927 | 0.922 | 0.910 |
HISTORY—Gas produced from coal was an early source of light and heating in New Zealand. The first gasworks was erected in 1862 at Auckland which at that time had a European population of about 25,000. By 1869 there was a gasworks in each of the four main centres. There were 56 establishments engaged in the generation and supply of gas to the public in 1916. Since that date the number of works has declined steadily, although the output of gas has increased through the expansion of remaining works. The number of consumers is steadily decreasing, and has dropped from 183,900 to 136,937 in the last 10 years.
In the 1950s, the decline of the gas industry was viewed with concern by the Government and the authorities which are required to supply the country with electric power, because of the additional demand for electricity which must follow any reduction of the gas supply.
The Electricity and Gas Co-ordination Act 1956 established an Electricity and Gas Co-ordination Board to advise the Minister on the co-ordination of the electricity and gas industries. Following a report from the Board regarding the difficulties to be overcome in effecting local mergers, legislation was passed in 1958 setting up a Gas Council in place of the Board. The main functions of the Council are to advise the Government and the industry regarding the preservation and expansion of gas supplies. Subsidies, grants, and loans may be made to assist the industry. The Gas Council has pursued a basic policy of spending funds available for the purpose of promoting efficiency and confidence in the gas industry. Much new plant has been installed, assisted in some cases by grants towards interest and capital repayment charges on loans until the new plant becomes revenue producing.
Natural gas was discovered at Kapuni in Taranaki in 1959 by a group of oil companies. Agreement has now been reached with the Government for a corporation to buy and treat the gas and distribute it through a pipeline north to New Plymouth, Hamilton and Auckland, and south to Hawera, Wanganui, Palmerston North, Levin, Wellington and the Hutt Valley. The estimated cost of the pipeline and treatment plant is $18 million, but it is expected the price of the gas to consumers will be competitive with electricity. Natural gas is expected to become available to consumers towards the end of 1969.
GAS SUBSIDY—Gasworks receive a subsidy from the Government; the rate is 16 2/3c per 1,000 cu. ft. of gas sold, except that for works on the West Coast and the oil plant at Hastings the rate is 20c per 1,000 cu. ft. There is a subsidy covering freight charges on coal which applies to 18 undertakings.
Annual average prices of gas in the four main centres are shown in the following table.
| AVERAGE PRICE OF GAS TO CONSUMER PER 1,000 CUBIC FEET | ||||
|---|---|---|---|---|
| Year | Auckland | Wellington | Christchurch | Dunedin |
| $ | $ | $ | $ | |
| 1929–30 | 0.70 | 0.69 | 0.70 | 0.63 |
| 1939–40 | 0.72 | 0.61 | 0.64 | 0.59 |
| 1949–50 | 0.88 | 0.68 | 0.68 | 0.62 |
| 1959–60 | 1.34 | 1.05 | 0.88 | 0.74 |
| 1963–64 | 1.43 | 1.25 | 0.93 | 0.81 |
| 1964–65 | 1.46 | 1.27 | 0.93 | 0.79 |
| 1965–66 | 1.45 | 1.26 | 0.97 | 0.90 |
RECENT STATISTICS—Statistics for the latest three years are set out in the following table.
| Item | 1963–64 | 1964–65 | 1965–66 | |
|---|---|---|---|---|
| * Including natural gas. | ||||
| Works | No. | 29 | 28 | 28 |
| Premises and plant— | ||||
| Value at end of year— | ||||
| Land and buildings | $(000) | 2,588 | 2,926 | 3,152 |
| Plant, machinery, and equipment | $(000) | 13,872 | 14,038 | 14,080 |
| Transport equipment | $(000) | .. | .. | 288 |
| Capital expenditure during year— | ||||
| Land and buildings | $(000) | 34 | 24 | 42 |
| Plant, machinery, and equipment | $(000) | 780 | 804 | 756 |
| Transport equipment | $(000) | .. | .. | 90 |
| Persons engaged | No. | 1,371 | 1,370 | 1,360 |
| Salaries and wages paid | $(000) | 2,708 | 2,810 | 2,930 |
| Coal used— | ||||
| Quantity | tons (000) | 268 | 258 | 260 |
| Cost | $(000) | 3,340 | 3,172 | 3,260 |
| Total expenditure | $(000) | 8,806 | 8,854 | 9,326 |
| Total revenue | $(000) | 8,914 | 8,882 | 9,368 |
| Consumers | No. | 149,953 | 142,892 | 136,937 |
| Gas available for distribution* | cu. ft.(000) | 6,047,566 | 5,993,788 | 6,176,622 |
| Gas sold retail— | ||||
| Quantity cu. ft. | (000) | 4,762,626 | 4,721,680 | 4,932,509 |
| Value (including subsidies) | $(000) | 6,922 | 6,942 | 7,282 |
| Average price of gas to consumer per 1,000 cu. ft. | $ | 1.23 | 1.26 | 1.28 |
There follows an analysis of the 1965–66 statistics, these being dissected by locality of gasworks (North and South Island) and character of organisation. It will be seen that 65 percent of the total quantity of gas available for distribution was in the North Island and 35 percent was in the South Island, while proportions available for distribution by registered companies and local authorities were 69 percent and 31 percent respectively.
| Item | Registered Companies | Local Authorities | Total | Registered Companies | Local Authorities | Total | |
|---|---|---|---|---|---|---|---|
* Depreciated values. † Undepreciated, Depreciated funds amounted to $78,000. ‡ Undepreciated. Depreciation funds amounted to $158,000. | |||||||
| North Island | South Island | ||||||
| Works | No. | 6 | 8 | 14 | 3 | 11 | 14 |
| Value of land and buildings | $(000) | 1,984* | 334† | 2,318 | 508* | 326‡ | 834 |
| Value of machinery, plant, and equipment | $(000) | 4,732* | 3,520† | 8,252 | 1,730* | 4,098‡ | 5,830 |
| Value of transport equipment | $(000) | 144* | 76† | 220 | 22* | 46‡ | 68 |
| Capital additions during year— | |||||||
| Land and buildings | $(000) | 18 | 4 | 20 | – | 22 | 22 |
| Machinery, plant, and equipment | $(000) | 388 | 64 | 454 | 134 | 170 | 302 |
| Transport equipment | $(000) | 72 | 8 | 78 | 4 | 8 | 12 |
| Persons engaged— | |||||||
| Males | No. | 671 | 181 | 852 | 177 | 216 | 393 |
| Females | No. | 71 | 14 | 85 | 18 | 12 | 30 |
| Totals | No. | 742 | 195 | 937 | 195 | 228 | 423 |
| Salaries and wages paid— | |||||||
| To males | $(000) | 1,512 | 398 | 1,910 | 374 | 494 | 870 |
| To females | $(000) | 94 | 16 | 110 | 24 | 16 | 40 |
| Totals | $(000) | 1,604 | 416 | 2,020 | 400 | 510 | 910 |
| Motive power— | |||||||
| Engines in use | No. | 259 | 126 | 385 | 72 | 235 | 307 |
| Total horsepower | h.p. | 3,718 | 645 | 4,363 | 915 | 1,557 | 2,472 |
| Materials used— | |||||||
| Coal | tons(000) | 130 | 34 | 164 | 52 | 44 | 96 |
| $(000) | 1,716 | 464 | 2,180 | 548 | 532 | 1,080 | |
| Oil | gal(000) | 1,447 | 100 | 1,547 | – | 858 | 858 |
| Products— | $(000) | 150 | 14 | 166 | – | 104 | 104 |
| Gas available for distribution | cu.ft.(m) | 3,214 | 826 | 4,040 | 1,053 | 1,084 | 2,136 |
| Gas sold retail | cu.ft.(m) | 2,450 | 654 | 3,104 | 944 | 885 | 1,829 |
| Value (including subsidies) | $(000) | 3,908 | 1,084 | 4,990 | 1,080 | 1,212 | 2,292 |
| Coke | tons(000) | 23 | 10 | 32 | 22 | 12 | 34 |
| $(000) | 362 | 192 | 554 | 320 | 148 | 468 | |
| Tar | gal(000) | 1,140 | 246 | 1,386 | 468 | 487 | 955 |
| $(000) | 240 | 54 | 294 | 94 | 84 | 178 | |
| Other residuals | $(000) | 192 | 12 | 204 | 36 | – | 36 |
| Total expenditure | $(000) | 4,884 | 1,444 | 6,328 | 1,272 | 1,726 | 2,998 |
| Total revenue | $(000) | 5,050 | 1,354 | 6,404 | 1,426 | 1,538 | 2,964 |
| Consumers | No. | 67,259 | 22.632 | 89,891 | 14,563 | 32,483 | 47,046 |
Table of Contents
GENERAL—Throughout its short history New Zealand has been dependent on overseas trade for its development and progress. Early trade was principally with Australia. In the 1840s the foundations of the agricultural industries were laid. Sheep had already been introduced and the first shipment of wool was exported to Hobart in 1839. Dairying was established, grain and potatoes and were cultivated, and kauri gum was dug from the ground in the far north. In 1853, when the population of New Zealand, exclusive of Maoris, was only 32,000, trade data were first compiled for New Zealand as a whole. The values of the main exports were: timber, $186,000; wool, $134,000; potatoes, $60,000; whale oil, $44,000; kauri gum, $32,000; and grain $38,000. At this time Australia was experiencing its “gold rush” period, and the demands of the rapidly increasing Australian population created an opportunity for increased exports from New Zealand, and quantities of butter and cheese were shipped across the Tasman. A rapid change then took place in the pattern of the trade. In 1855 the principal items were wool (25 percent of total value), grain (22 percent), and potatoes (25 percent). By 1860 wool accounted for 76 percent of total exports, and with the opening of the goldfields in 1861 wool and gold together accounted for 93 percent of exports in that year.
During this period imports far exceeded exports, being about double in value, and consisted mainly of capital goods for the development of new industries, together with clothing and foodstuffs to sustain the growing numbers of new settlers. The borrowing policy initiated by Vogel in 1870 for an extensive public works programme had the immediate effect of increasing imports and later gave an indirect impetus to exports.
The introduction of refrigeration in 1882 further changed the pattern of the export trade, making possible the shipment of perishable foodstuffs to more distant markets. This had a marked effect in New Zealand's trade with the United Kingdom. In 1870 only 52 percent of the exports went to the United Kingdom; by 1880 the proportion had increased to 75 percent. Australia, which had been New Zealand's main trading partner in the early years, was receiving only 21 percent of the exports by 1880 and 15 percent by 1890.
The United Kingdom has remained New Zealand's predominant market for exports and the biggest supplier of imports, although in recent years the United Kingdom's share of New Zealand's export trade has gradually been declining. In 1950 the United Kingdom took 66 percent of New Zealand's exports but by the year ended June 1966 its share had fallen to 45 percent. However, the United Kingdom remains New Zealand's best export market by far, taking almost all New Zealand's lamb, cheese, and butter, and about one-quarter of the wool. The marketing of primary products is discussed in Section 21A.
So far as export markets are concerned, New Zealand has until recently enjoyed unrestricted access to the United Kingdom, but increased competition is being met from United Kingdom producers and countries exporting primary products. Perhaps the most important development in recent years has been the expansion of British agriculture fostered by Government subsidies. New Zealand butter has also had to face competition from blended butter and margarine. Because the market became oversupplied during the European summer of 1961, the United Kingdom placed quotas on countries supplying butter. These quotas, initially for a period of six months, were placed on a formal basis in April 1962, and have since been maintained.
New Zealand has found it necessary in recent years to develop supplementary markets. There has been a marked expansion of New Zealand's overseas markets, notably in the United States, France, West Germany, and Japan. Exports to Japan, for instance, have shown a marked increase from $6.2 million in 1953 to $56.2 million in the June year 1966. Almost half of the exports to Japan in the year ended June 1966 was wool ($27.0 million). Other principal commodities were meat (mainly mutton), timber and casein.
Since the Second World War New Zealand's external trade has expanded considerably Moreover, the value per head of New Zealand's overseas trade is one of the highest for any country in the world, particularly if re-exports are excluded.
Except for the growth of trade in pulp and paper products, the composition of New Zealand's exports today does not vary greatly from that of pre-war years. About 90 percent of the total value of exports is still derived from wool, meat and dairy produce.
The following table shows the changing pattern of external trade by countries of destination and origin.
| Year | United Kingdom | Australia | United States of America | Other Countries |
|---|---|---|---|---|
| Percent | ||||
| Exports* | ||||
*Gold is included in figures up to 1950. †Provisional. ‡Alaska and Hawaii included 1965 and 1966. | ||||
| 1860 | 70 | 27 | - | 3 |
| 1870 | 52 | 46 | - | 2 |
| 1880 | 75 | 21 | 2 | 2 |
| 1890 | 75 | 15 | 6 | 4 |
| 1900 | 77 | 14 | 6 | 3 |
| 1910 | 84 | 9 | 3 | 4 |
| 1920 | 74 | 5 | 16 | 5 |
| 1930 | 80 | 3 | 5 | 12 |
| 1940 | 88 | 3 | 4 | 5 |
| 1950 | 66 | 3 | 10 | 21 |
| 1960 | 53 | 4 | 13 | 30 |
| 1961 | 51 | 4 | 15 | 30 |
| January-June | ||||
| 1962 | 50 | 3 | 14 | 33 |
| June Year | ||||
| 1963 | 47 | 4 | 17 | 32 |
| 1964 | 47 | 5 | 15 | 33 |
| 1965x | 51 | 5 | 13 | 31 |
| 1966† | 45 | 5 | 14 | 36 |
| Percent | ||||
| Imports* | ||||
| 1860 | 56 | 42 | 1 | 1 |
| 1870 | 58 | 36 | 1 | 5 |
| 1880 | 56 | 31 | 4 | 9 |
| 1890 | 67 | 17 | 6 | 10 |
| 1900 | 61 | 17 | 10 | 12 |
| 1910 | 62 | 14 | 8 | 16 |
| 1920 | 48 | 17 | 18 | 17 |
| 1930 | 47 | 8 | 18 | 27 |
| 1940 | 47 | 16 | 12 | 25 |
| 1950 | 60 | 12 | 7 | 21 |
| 1960 | 43 | 18 | 10 | 29 |
| 1961 | 45 | 16 | 9 | 30 |
| January-June | ||||
| 1962 | 43 | 21 | 8 | 28 |
| June Year | ||||
| 1963 | 42 | 19 | 9 | 30 |
| 1964 | 39 | 21 | 9 | 31 |
| 1965x | 37 | 19 | 11‡ | 33 |
| 1966† | 38 | 19 | 12‡ | 32 |
A Trade Promotion Council was set up in March 1962 as a co-ordinating and advisory agency in a concerted continuous New Zealand trade drive. The Council advises in the exploration of new or potential markets including trade surveys and missions; the coordination of promotional schemes, trade fairs, and publicity; and the improvement of facilities, both within New Zealand and overseas, which may assist exporters. An Export Development Conference was held in June 1963. The Export Development Conference was called by the Government to examine the problems to be met in a programme of expanded exports. The need to diversify markets and products was underlined when Britain applied in 1961 to join the European Economic Community. A trade drive was recognised as essential to earn more overseas exchange to continue to improve the standard of living for a steadily increasing population and to expand economic and national development; A scheme of export aids was developed by the Government following the conference, among them an export guarantee scheme to provide guarantees to exporters against losses which might result from circumstances not insurable with commercial insurers. To promote the export of manufactured goods, exhibitions have been arranged at trade fairs and trade mission conducted in selected areas overseas.
On 31 August 1965 a New Zealand - Australia Free Trade Agreement was signed. Its negotiation resulted from the imbalance of advantage in favour of Australia under the 1933 Australia - New Zealand Trade Agreement, the growing imbalance in trade between the two countries, and the need to secure markets for New Zealand's forest products. The Agreement has ensured that these forest products will, after the phasing-out period, have the certainty of duty-free access to the Australian market. Certainty of access has also been gained for frozen pears and beans, dried vegetables, lamb, fish, cheeses other than cheddar, bacon and hams, and for some manufactured goods. Special arrangements provide access for cheddar cheese and pigmeat.
The agreement has taken account of the greater degree of industrial development in Australia. A safeguard is the exclusion from the main provisions of the Agreement of goods which would be damaging to the interests of New Zealand manufacturers. There is also a provision for the temporary suspension of part of the Agreement where goods are being imported “in such increased quantities and under such conditions as to cause or threaten serious injury to producers of like goods”.
Where duties exceed 10 percent there is provision for gradual development of the free trade area by phasing out duties over an eight-year period.
The distribution of New Zealand's overseas trade by broad grouping during the latest 11 years in given in the following table (excluding gold and current coin).
| Year | Sterling Area | Dollar Area | European Economic Community | European Free Trade Association (Excluding United Kingdom) | Other Countries | Sterling Area | Dollar Area | European Economic Community | European Free Trade Association (Excluding United Kingdom) | Other Countries |
|---|---|---|---|---|---|---|---|---|---|---|
| Percentage of Export Trade | Percentage of Import Trade | |||||||||
*Provisional. | ||||||||||
| 1956 | 70.56 | 8.84 | 15.97 | 0.52 | 4.11 | 76.18 | 10.32 | 6.06 | 2.10 | 5.35 |
| 1957 | 65.21 | 10.04 | 18.36 | 0.52 | 5.87 | 75.89 | 10.44 | 5.98 | 2.40 | 5.29 |
| 1958 | 63.01 | 16.88 | 14.22 | 0.70 | 5.19 | 77.32 | 9.23 | 6.34 | 2.23 | 4.88 |
| 1959 | 63.48 | 16.48 | 14.47 | 0.58 | 4.99 | 73.67 | 10.73 | 6.30 | 2.65 | 6.65 |
| 1960 | 60.85 | 14.95 | 16.69 | 0.66 | 6.85 | 69.82 | 14.40 | 6.95 | 2.38 | 6.45 |
| 1961 | 58.46 | 16.88 | 15.75 | 0.76 | 8.15 | 68.59 | 14.19 | 8.03 | 2.46 | 6.72 |
| Jan-June | ||||||||||
| 1962 | 55.86 | 16.28 | 20.64 | 1.04 | 6.18 | 71.59 | 12.81 | 7.07 | 2.02 | 6.51 |
| June | ||||||||||
| 1963 | 55.99 | 19.32 | 17.57 | 0.70 | 6.43 | 68.86 | 13.52 | 6.60 | 2.34 | 8.68 |
| June | ||||||||||
| 1964 | 55.63 | 16.88 | 18.60 | 1.11 | 7.77 | 67.86 | 13.94 | 6.56 | 3.53 | 8.11 |
| 1965x | 60.30 | 14.94 | 16.19 | 1.17 | 7.40 | 65.03 | 15.80 | 6.39 | 3.14 | 9.64 |
| 1966* | 55.05 | 16.24 | 15.61 | 1.07 | 12.03 | 65.64 | 15.88 | 6.60 | 2.51 | 9.37 |
The direction of external trade is shown graphically in the following diagram.
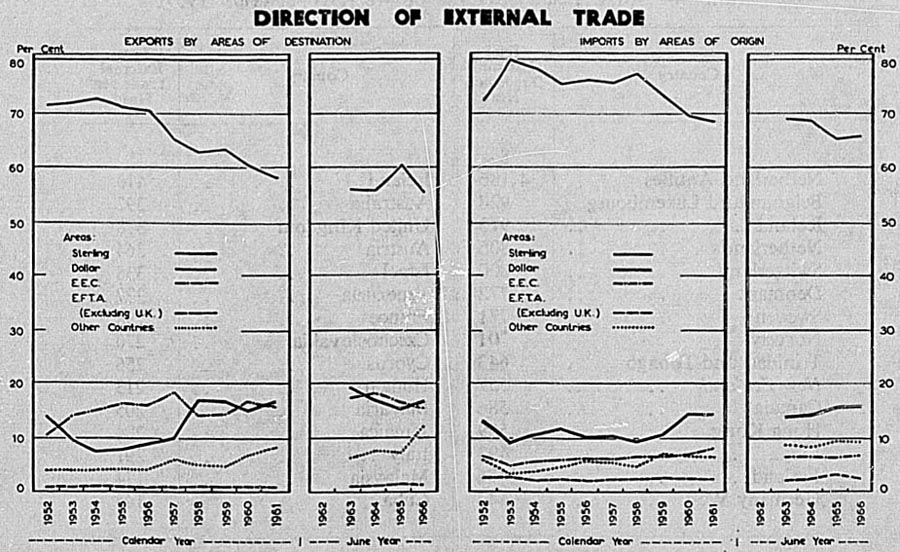
TRADE PER HEAD—The next table shows the value of exports, imports, and total trade per head of mean population. Values are expressed in terms of New Zealand currency. In this table the valuation used for imports is current domestic value in the country of origin.
| Year | Exports | Imports | Total Trade |
|---|---|---|---|
*Provisional | |||
| $ | $ | $ | |
| 1943 | 85.98 | 105.87 | 191.85 |
| 1944 | 92.24 | 94.87 | 187.11 |
| 1945 | 94.85 | 59.09 | 153.94 |
| 1946 | 113.80 | 73.95 | 187.75 |
| 1947 | 142.78 | 130.06 | 272.84 |
| 1948 | 160.48 | 127.37 | 287.85 |
| 1949 | 156.72 | 116.59 | 273.32 |
| 1950 | 191.12 | 150.41 | 341.53 |
| 1951 | 253.95 | 192.80 | 446.75 |
| 1952 | 240.22 | 229.88 | 470.10 |
| 1953 | 229.74 | 159.70 | 389.44 |
| 1954 | 232.92 | 203.48 | 436.41 |
| 1955 | 242.20 | 234.37 | 476.57 |
| 1956 | 254.02 | 215.51 | 469.52 |
| 1957 | 247.48 | 234.42 | 481.90 |
| 1958 | 218.68 | 221.14 | 439.82 |
| 1959 | 251.26 | 175.64 | 426.90 |
| 1960 | 254.35 | 212.94 | 467.29 |
| 1961 | 233.76 | 237.48 | 471.23 |
| Jan - June | |||
| 1962 | 134.32 | 95.89 | 230.21 |
| June Year | |||
| 1963 | 249.42 | 208.16 | 457.58 |
| 1964 | 286.72 | 247.88 | 534.60 |
| 1965x | 282.95 | 252.64 | 535.59 |
| 1966* | 285.44 | 273.56 | 559.00 |
New Zealand has a relatively high value of trade per head of population when compared with other countries. There are difficulties in the way of making precise comparisons with the values of trade in other countries, mainly on account of differing methods of valuation used. In the following table, however, New Zealand's position is shown in comparison with some of the main trading countries. The source, in respect of data for other countries, is a United Nations publication providing data on trade values using the c.i.f. basis for the valuation of imports. For comparative purposes the c.i.f. basis has been used to value New Zealand imports, and therefore the figure given below as a value for New Zealand trade per head of population exceeds that given in the last table.
VALUE OF TOTAL TRADE PER HEAD OF MEAN POPULATION 1965
| Country | Total External Trade per Head |
|---|---|
| $ | |
| Netherland Antilles | 4,186 |
| Belgium and Luxembourg | 928 |
| Iceland | 913 |
| Netherlands | 806 |
| Switzerland | 800 |
| Denmark | 772 |
| Sweden | 771 |
| Norway | 701 |
| Trinidad and Tobago | 643 |
| New Zealand | 557 |
| Canada | 586 |
| Hong Kong | 509 |
| Libya | 493 |
| Finland | 476 |
| Germany West | 444 |
| Ireland | 413 |
| Australia | 392 |
| United Kingdom | 378 |
| Austria | 364 |
| Israel | 338 |
| Venezuela | 327 |
| France | 298 |
| Czechoslovakia | 270 |
| Cyprus | 256 |
| Hungary | 213 |
| Bulgaria | 205 |
| Jamaica | 204 |
| Italy | 201 |
| Malaysia | 174 |
| Cuba | 145 |
VISIBLE BALANCE OF TRADE—In the following table the c.i.f. valuation of imports has been used to establish the visible balance of trade.
| Year | Visible Excess of Exports |
|---|---|
*Excess of imports. †Provisional. | |
| $(000) | |
| 1954 | -2,708* |
| 1955 | -55,690* |
| 1956 | 18,136 |
| 1957 | -41,058* |
| 1958 | -69,808* |
| 1959 | 124,482 |
| 1960 | 40,538 |
| 1961 | -81,818* |
| 1962 | 31,344 |
| June Year— | |
| 1963 | 50,914 |
| 1964 | 43,234 |
| 1965 | 17,711 x |
| 1966 | -31,931*† |
Visible trade is not the only factor to be taken into account in considering the balance of payments between countries. Debt services, capital transfers, charitable and other personal remittances, freight payments, insurances, tourist expenditure, and the like, are vitally important factors which frequently reverse a credit visible balance of trade into debit balance of payments (see Section 25B). A statement of New Zealand's overseas exchange transactions is given in Section 29, Banking and Currency.
TRADE STATISTICS—As from 1 July 1962 the processing of external trade statistics was transferred from the Customs Department to the Department of Statistics.
Provisional trade data are published in a supplement to the Monthly Abstracts of Statistics within a month of the period to which they relate. A publication entitled External Trade of New Zealand (Country Analyses) is published quarterly.
Annual volumes are also published by the Department of Statistics, the latest available issues being Exports 1964-65, Imports 1964-65 Part A Commodity by Country, and Part B Country by Commodity.
New Zealand adopted the Standard International Trade Classification as from 1 January 1955, for classifying external trade for statistical purposes; from the same date this classification was put into effect for recording the external trade of the Cook Islands and Niue. This classification remained in the use until 30 June 1962 when it was replaced by the Standard International Trade Classification (Revised); the S.I.T.C. order was also adopted on 1 July 1962 as the Customs Tariff classification, but a move to the Brussels Tariff Nomenclature was made on 1 July 1967.
Values of imports and exports are set out in the following table.
| Period | 1964-65 | 1965-66 | 1966-67 | |||||||
|---|---|---|---|---|---|---|---|---|---|---|
| Exports f.o.b. Value | Imports | Exports f.o.b. Value | Imports | Exports f.o.b. Value | Imports | |||||
| c.d. Value | c.i.f. Value | c.d. Value | c.i.f. Value | c.d. Value | c.i.f. Value | |||||
| $(million) | ||||||||||
| Month of July | 41.8 | 63.3 | 68.4 | 33.8 | 64.0 | 68.9 | 56.5 | 53.0 | 57.6 | |
| 2 months ended August | 97.3 | 117.5 | 127.0 | 76.6 | 126.2 | 135.5 | 108.5 | 124.5 | 135.0 | |
| 3 months ended September | 141.8 | 169.9 | 183.7 | 133.6 | 193.9 | 208.9 | 163.5 | 188.5 | 204.4 | |
| 4 months ended October | 192.1 | 222.6 | 241.4 | 177.2 | 252.2 | 271.6 | 209.3 | 248.0 | 269.8 | |
| 5 months ended November | 244.2 | 279.1 | 303.1 | 239.6 | 321.7 | 346.7 | 257.6 | 310.1 | 337.1 | |
| 6 months ended December | 315.9 | 332.6 | 361.3 | 302.9 | 373.7 | 403.5 | 315.5 | 366.7 | 397.7 | |
| 7 months ended January | 373.7 | 383.8 | 416.7 | 382.1 | 429.3 | 463.9 | 373.8 | 426.2 | 462.9 | |
| 8 months ended February | 451.3 | 429.3 | 467.9 | 457.0 | 491.6 | 533.0 | 464.0 | 484.6 | 526.7 | |
| 9 months ended March | 528.1 | 484.6 | 527.9 | 533.1 | 551.2 | 597.8 | 532.7 | 544.1 | 591.9 | |
| 10 months ended April | 600.7 | 540.8 | 589.4 | 604.8 | 601.2 | 653.1 | 595.3 | 597.6 | 649.5 | |
| 11 months ended May | 683.2 | 594.5 | 648.6 | 677.6 | 661.6 | 719.3 | 663.5 | 652.9 | 709.2 | |
| 12 months ended June | 742.2 | 662.7 | 724.5 | 761.3 | 729.6 | 793.2 | 725.5 | 721.5 | 783.2 | |
In the subsections dealing with exports and imports, information is given regarding the nature of the transactions which are included in the trade statistics, there being particular inclusions and exclusions which require to be considered when using the figures.
Of considerable consequence in the use of external trade statistics are the methods used in valuing the commodities comprising the trade. In New Zealand it has always been the practice to record exports at free-on-board (f.o.b.) values, except during the Second World War when a departure from this procedure was effected in respect of wool exports. Wool was valued for export at the appraisal prices and, as the prices later realised were higher than the appraisal prices, and New Zealand shared in this profit, export values for the years concerned were understated. On the other hand, the export values recorded for meat and dairy produce during the Second World War and in the years following up to 1954 were generally accurate, while for earlier and later years they can only be regarded as approximations. During the period mentioned almost all meat and dairy produce exported was sold f.o.b. at firm prices to the United Kingdom Ministry of Food under bulk contracts. Under the free marketing conditions of earlier and later years most meat and dairy produce exports have been consigned for sale on overseas markets, and necessarily valued, on export, at the f.o.b. equivalent of the prices ruling at that time in the markets to which consigned. Price changes in these markets before the actual sale of the produce could be quite substantial.
Up to the end of 1951 imports were recorded on the basis of their value for Customs purposes, this being their current domestic value (c.d.v.) in the country of export at the time of shipment, plus 10 percent. For several years the limitations of this basis of valuation for economic studies, particularly those relating to balance of trade and of payments, had been apparent. There was a tendency generally to regard the Customs value of imports as being equivalent to at least a conventional c.i.f. value (cost including freight and insurance). In fact the Customs value of some bulky low-unit-cost items such as fertilisers fell short of the actual c.i.f. cost by amounts ranging up to 50 percent or more. The domestic and export price levels in the exporting country may differ on account of price controls, subsidies, etc., while external packing, railway freights, etc., generally tend to raise the f.o.b. cost of goods above the current domestic price. For some few types of commodities the 10 percent allowance is more than adequate to cover insurance and freight charges. For a larger proportion of imports, particularly those where the value relative to weight or bulk is low, the allowance is inadequate to cover these costs.
As from 1 January 1952 a change was made in that imports were recorded in the trade statistics without the additional 10 percent required for duty purposes, i.e., at current domestic value, generally, as indicated above, equivalent to but not identical with the f.o.b. cost. Provision was also made to record statistical class totals and the grand total of imports on the c.i.f. basis. For the period of use of the Standard International Trade Classification from 1955 to June 1962, division totals replaced class totals for presentation on the c.i.f. basis. A description of the changed classification appears later in this Section. From July 1962, with the introduction of the Standard International Trade Classification, Revised, statistics on the c.i.f. basis are available at item level.
The proportional difference between the two figures of valuation now made available—viz, c.d.v. and c.i.f.—will vary from period to period depending on (1) the make-up of imports in the different periods, (2) differential changes in import prices and in freight rates, (3) differences between domestic and export prices in the exporting countries, and (4) price fluctuations between dates of purchases and of shipping. The relatively high freight rates and insurance charges in wartime resulted in c.i.f. costs rising considerably above Customs values. The high charter freights of 1951-52 had a similar effect. In all the tables imports are now shown at c.d.v., unless otherwise specified in respect of particular tables.
The exports recorded relate to goods on vessels which have cleared their final port of call in New Zealand during the period.
The trade figures for imports are compiled from the imports entries, either for home consumption or into bonded warehouse, passed by the Customs Department. Under the system in use it is possible for an importer to pay the duty involved, if any, and have the import entry passed very shortly after he receives the shipping documents; this enables him to take delivery of the goods on arrival. Thus the import may be recorded before the carrying vessel has reached New Zealand. Generally, however, the imports entries are not passed until the goods are available for discharge from the wharf. On the other hand, it may sometimes occur that goods may have been unloaded and in the custody of a harbour board for some time before the importer has the entry passed (and the import is recorded) and takes delivery.
New Zealand trade statistics were compiled on a calendar year basis up to June 1962 but since then a June year has been adopted. In New Zealand the farm production year fits reasonably well to the year ended 30 June, and trade statistics compiled for years ended 30 June accordingly include the export values of approximately a whole season's production from the pastoral and agricultural industries.
The statistics of the external trade of New Zealand given in this section (comprising the three subsections) do not include the trade of the Cook Islands, Niue, and the Tokelau Islands; statistics for these territories are given in Section 38 of this Yearbook.
In the following table are given the values of the export and import trade for years ended 31 December, 31 March, and 30 June. The movement of specie is not included in these figures and gold is excluded from 1963 onwards.
| Year | Exports f.o.b. | Imports | |
|---|---|---|---|
| c.d.v. | c.i.f. | ||
*Provisional | |||
$ (million) Year ended 31 December | |||
| 1953 | 471.7 | 327.2 | 384.4 |
| 1954 | 488.9 | 426.3 | 491.6 |
| 1955 | 518.6 | 501.3 | 574.3 |
| 1956 | 555.0 | 469.6 | 536.8 |
| 1957 | 553.1 | 523.5 | 594.2 |
| 1958 | 500.3 | 505.6 | 570.2 |
| 1959 | 587.3 | 410.2 | 462.8 |
| 1960 | 605.2 | 506.3 | 364.7 |
| 1961 | 568.0 | 576.6 | 649.8 |
| 1962 | 575.6 | 491.6 | 544.0 |
| 1963 | 664.3 | 595.7 | 650.7 |
| 1964 | 773.8 | 643.8 | 701.5 |
| 1965x | 729.2 | 703.9 | 766.9 |
| 1966* | 774.0 | 722.6 | 787.5 |
| Year ended 31 March | |||
| 1953 | 476.8 | 397.4 | 481.5 |
| 1954 | 485.6 | 346.6 | 403.8 |
| 1955 | 470.0 | 453.5 | 519.5 |
| 1956 | 557.6 | 491.4 | 562.9 |
| 1957 | 551.3 | 473.8 | 540.7 |
| 1958 | 550.9 | 534.1 | 606.9 |
| 1959 | 500.4 | 466.9 | 526.2 |
| 1960 | 627.5 | 433.6 | 487.8 |
| 1961 | 560.3 | 541.3 | 602.7 |
| 1962 | 580.6 | 536.5 | 606.1 |
| 1963 | 577.0 | 513.9 | 571.1 |
| 1964 | 720.7 | 618.2 | 672.4 |
| 1965x | 759.6 | 642.9 | 700.2 |
| 1966* | 747.2 | 735.3 | 802.3 |
| Year ended 30 June | |||
| 1953 | 488.2 | 343.2 | 416.4 |
| 1954 | 483.7 | 364.2 | 420.3 |
| 1955 | 479.5 | 483.3 | 554.4 |
| 1956 | 541.3 | 483.6 | 553.7 |
| 1957 | 555.2 | 486.4 | 553.4 |
| 1958 | 544.0 | 536.6 | 610.4 |
| 1959 | 521.5 | 434.5 | 489.3 |
| 1960 | 629.5 | 454.4 | 509.2 |
| 1961 | 561.4 | 582.7 | 649.6 |
| 1962 | 582.9 | 507.8 | 572.3 |
| 1963 | 627.6 | 523.7 | 576.6 |
| 1964 | 737.3 | 637.4 | 694.0 |
| 1965x | 742.2 | 662.7 | 724.5 |
| 1966* | 761.3 | 729.6 | 793.2 |
The following table shows for the June year 1965 the values of merchandise exports to, and imports from, each of the principal countries trading with New Zealand. Exports are valued f.o.b. New Zealand ports, and imports at current domestic value in country of purchase and in country of origin. The New Zealand trade statistics will yield different results, in respect of its trade with any given country, from those obtained from the trade statistics of that country, since in the latter New Zealand's exports will in most cases be valued c.i.f. in the given country and New Zealand's imports f.o.b. in that country.
These systems, however, are not universally used, and the methods of valuation in any particular country with whose trade statistics any comparison is attempted must be considered separately.
| TRADE BY COUNTRIES, YEAR ENDED JUNE 1965 | ||||
|---|---|---|---|---|
| Country | Exports f.o.b. | Imports c.d.v. | ||
| New Zealand Produce | Total | By Country of Origin | By Country of Purchase | |
| Sterling Area Countries— | $(000) | |||
| Aden Colony and Protectorate | 452 | 452 | 357 | 3 |
| Australia | 32,163 | 34,568 | 127,968 | 132,392 |
| Bahamas | 260 | 260 | 1 | 3 |
| Bahrain | 2 | 2 | 878 | 695 |
| Barbados | 1,064 | 1,064 | 7 | 2 |
| Bermuda | 676 | 677 | 8 | 423 |
| British Guiana | 216 | 216 | 37 | 15 |
| Brunei | - | - | 406 | - |
| Burma | 226 | 229 | 4 | 4 |
| Ceylon | 594 | 595 | 4,417 | 4,407 |
| Cyprus | 1,178 | 1,178 | 110 | 107 |
| Fiji | 3,199 | 3,628 | 811 | 868 |
| Ghana | 250 | 250 | 1,004 | 916 |
| Gilbert and Ellice Islands | 190 | 191 | 385 | 386 |
| Hong Kong | 1,438 | 1,500 | 8,618 | 9,162 |
| India, including Sikkim, etc. | 1,398 | 1,417 | 8,654 | 8,201 |
| Ireland | 597 | 597 | 150 | 180 |
| Jamaica | 3,499 | 3,499 | 352 | 339 |
| Jordan | - | - | - | 1 |
| Kenya | 205 | 205 | 618 | 654 |
| Kuwait | 57 | 57 | 12,733 | 4,154 |
| Leeward and Windward Islands | 278 | 278 | 7 | 2 |
| Malawi | - | - | 71 | 67 |
| Malaysia | 6,167 | 6,201 | 9,775 | 9,876 |
| Malta, including Gozo, etc. | 23 | 23 | 75 | 26 |
| Mauritius and Dependencies | 144 | 144 | 80 | 80 |
| Nauru | 288 | 293 | 2,528 | 2,480 |
| New Zealand Re-imports | - | - | 876 | 139 |
| Nigeria | 351 | 353 | 86 | 29 |
| Norfolk Island | 44 | 49 | - | 4 |
| Pakistan | 213 | 216 | 364 | 292 |
| Papua and New Guinea | 261 | 264 | 97 | 35 |
| Qatar and Trucial Sheikdoms | 28 | 28 | 1,394 | 688 |
| Rhodesia (Southern) | 217 | 217 | 577 | 576 |
| South Africa | 5,363 | 5,378 | 1,880 | 1,613 |
| Tanzania | 13 | 13 | 1,322 | 1,006 |
| Tonga | 463 | 501 | 324 | 343 |
| Trinidad and Tobago | 3,668 | 3,669 | 152 | 69 |
| Uganda | 1 | 1 | 734 | 455 |
| United Kingdom | 373,950 | 374,802 | 241,892 | 261,876 |
| Western Samoa | 1,608 | 1,735 | 1,101 | 1,129 |
| Other countries | 38 | 45 | 84 | 86 |
| Totals, sterling area | 440,785 | 444,797 | 430,939 | 443,781 |
| E.F.T.A. Countries (excluding United Kingdom)— | $(000) | |||
| Austria | 102 | 102 | 942 | 851 |
| Denmark | 1,759 | 1,761 | 1,594 | 1,496 |
| Norway | 962 | 962 | 1,109 | 1,071 |
| Portugal | 2,574 | 2,574 | 533 | 507 |
| Sweden | 3,045 | 3,062 | 10,379 | 10,278 |
| Switzerland and Liechtenstein | 168 | 176 | 6,247 | 5,724 |
| Totals, E.F.T.A. | 8,609 | 8,636 | 20,804 | 19,925 |
| E.E.C. Countries— | ||||
| Belgium and Luxembourg | 24,078 | 24,086 | 3,728 | 3,474 |
| France and Monaco | 33,913 | 33,942 | 4,547 | 4,146 |
| Germany, West | 29,645 | 29,791 | 18,782 | 17,674 |
| Italy and San Marino | 18,065 | 18,083 | 6,074 | 5,753 |
| Netherlands | 13,352 | 13,490 | 9,203 | 8,612 |
| Totals, E.E.C. countries | 119,051 | 119,393 | 42,334 | 39,660 |
| Dollar Area Countries— | ||||
| American Samoa | 596 | 604 | - | 3 |
| Bolivia | - | - | 31 | 2 |
| Canada | 10,489 | 10,558 | 25,676 | 25,363 |
| Colombia | - | - | 34 | 11 |
| Costa Rica | - | - | 28 | 11 |
| Dominican Republic | - | - | 772 | 768 |
| Guam | 471 | 471 | - | - |
| Haiti | 32 | 32 | 1 | - |
| Hawaii | 2,843 | 2,845 | 7 | 7 |
| Mexico | 580 | 581 | 637 | 630 |
| Panama Canal Zone | 22 | 22 | - | 10 |
| Panama Republic | 686 | 686 | - | - |
| Philippines | 3,683 | 3,685 | 220 | 198 |
| Puerto Rico and Virgin Islands | 2 | 2 | 39 | 9 |
| Ryukyu Islands | 50 | 50 | - | - |
| U.S.A. | 89,842 | 90,514 | 75,102 | 77,591 |
| Venezuela | 111 | 111 | 2,169 | 1,981 |
| Other countries | 13 | 14 | 11 | 7 |
| Totals, dollar area | 109,421 | 110,176 | 104,725 | 106,592 |
| Other Countries— | ||||
| Afghanistan | 21 | 21 | 1 | - |
| Argentina | 40 | 40 | 17 | 12 |
| Brazil | - | - | 442 | 38 |
| Canary Islands | 15 | 15 | - | - |
| Chile | 482 | 482 | 331 | 49 |
| China | 3,181 | 3,182 | 1,965 | 1,372 |
| Congo (Brazzaville) | - | - | 18 | - |
| Congo (Leopoldville) | - | - | 87 | 56 |
| Czechoslovakia | 686 | 691 | 1,122 | 1,054 |
| Ethiopia and Eritrea | 2 | 2 | 16 | 16 |
| Finland | 363 | 363 | 1,175 | 1,169 |
| Formosa | 159 | 159 | 1,862 | 1,846 |
| French Polynesia | 949 | 950 | 837 | 839 |
| French Somaliland | - | - | - | 1 |
| French West Indies | 378 | 378 | - | - |
| Germany, East | 690 | 690 | 372 | 347 |
| Greece | 2,753 | 2,753 | 12 | 11 |
| Hungary | 164 | 164 | 56 | 41 |
| Indonesia | 6 | 7 | 670 | 236 |
| Iran | 77 | 77 | 12,188 | 4,532 |
| Iraq | - | - | 100 | 80 |
| Israel | 19 | 20 | 35 | 46 |
| Ivory Coast | - | - | 53 | 50 |
| Japan | 31,817 | 32,000 | 36,684 | 36,205 |
| Korea, Republic of | 76 | 76 | 2 | 1 |
| Lebanon | 10 | 10 | 3 | 4 |
| Morocco | 56 | 56 | 7 | 3 |
| Mozambique | 287 | 287 | 11 | 10 |
| Netherlands Antilles | 809 | 809 | 1,523 | 1,294 |
| New Caledonia | 407 | 414 | - | 8 |
| North Korea | 2 | 2 | 11 | 11 |
| North Vietnam | 10 | 10 | - | - |
| Peru | 2,132 | 2,132 | 868 | 863 |
| Poland | 2,413 | 2,413 | 77 | 68 |
| Rumania | 57 | 57 | 3 | 2 |
| Saudi Arabia | 1 | 1 | 2,000 | 1,508 |
| Senegal | - | - | 38 | 38 |
| South Vietnam | 8 | 8 | - | 1 |
| Spain | 1,802 | 1,802 | 447 | 342 |
| Sudan | 70 | 70 | 34 | 24 |
| Syria | 22 | 22 | 15 | 5 |
| Thailand | 135 | 144 | 287 | 273 |
| Tunisia | - | - | 53 | - |
| Turkey | - | - | 101 | 34 |
| U.S.S.R. | 2,929 | 2,929 | 291 | 189 |
| United Arab Republic | 193 | 193 | 7 | - |
| Uruguay | 50 | 50 | - | - |
| Yugoslavia | 1,099 | 1,099 | 18 | 13 |
| Other countries | 16 | 18 | 26 | 17 |
| Totals, other, countries | 54,385 | 54,594 | 63,865 | 52,708 |
| Totals, all countries | 732,251 | 737,596 | 662,667 | 662,667 |
| Passengers | 54 | 1,294 | - | - |
| Ships' stores | 1,355 | 3,282 | - | - |
| Grand totals | 733,660 | 742,172 | 662,667 | 662,667 |
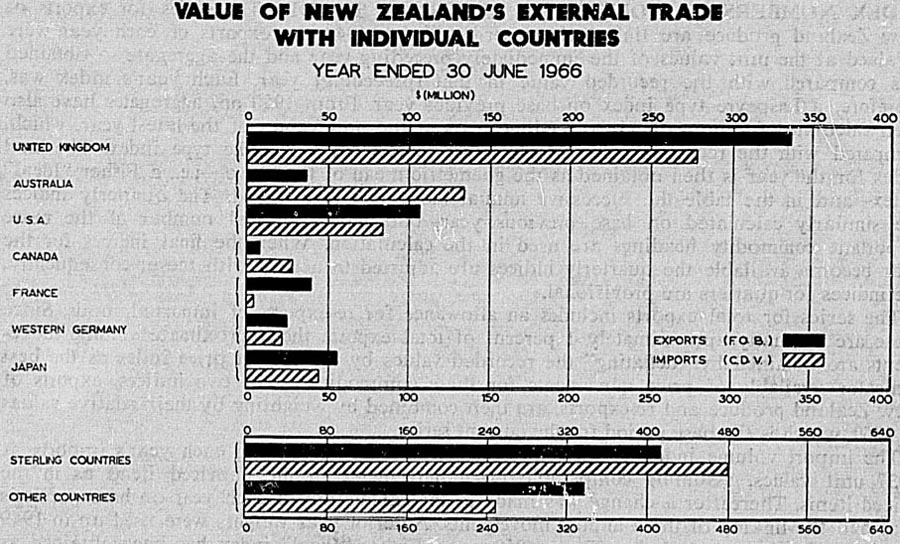
VALUE OF NEW ZEALAND'S EXTERNAL TRADE WITH INDIVIDUAL COUNTRIES YEAR ENDED 30 JUNE 1966
The next table shows the values of New Zealand's trade with several groupings of countries since 1959.
| Year | Exports (Excluding Ships' Stores) | Imports | Exports (Excluding Ships' Stores) | Imports | ||
|---|---|---|---|---|---|---|
| According to Country of Origin | According to Country of Purchase | According to Country of Origin | According to Country of Purchase | |||
*Provisional. †Belgium, Luxembourg, France, West Germany, Italy, and Netherlands. ‡Austria, Denmark, Norway, Portugal, Sweden, and Switzerland. | ||||||
| $(million) | ||||||
| Sterling Area | Dollar Area | |||||
| 1959 | 371.4 | 302.1 | 302.3 | 96.4 | 44.0 | 43.0 |
| 1960 | 367.2 | 353.4 | 359.5 | 90.4 | 72.9 | 71.6 |
| 1961 | 329.7 | 359.4 | 400.7 | 95.2 | 81.8 | 80.4 |
| Jan - June | ||||||
| 1962 | 184.9 | 169.9 | 172.9 | 53.9 | 30.4 | 29.9 |
| June Year— | ||||||
| 1963 | 349.9 | 360.7 | 371.0 | 120.7 | 70.8 | 68.8 |
| 1964 | 408.4 | 432.5 | 442.5 | 123.9 | 88.9 | 85.9 |
| 1965x | 440.8 | 430.9 | 443.8 | 109.4 | 104.7 | 106.6 |
| 1966* | 408.7 | 478.9 | .. | 121.1 | 115.9 | .. |
| EEC Countries† | EFTA Countries‡ | |||||
| 1959 | 84.7 | 25.8 | 25.3 | 3.4 | 10.9 | 10.5 |
| 1960 | 100.7 | 35.2 | 34.1 | 4.0 | 12.0 | 11.5 |
| 1961 | 88.8 | 46.3 | 44.8 | 4.3 | 14.2 | 13.6 |
| Jan - June | ||||||
| 1962 | 68.3 | 16.8 | 16.0 | 3.4 | 4.8 | 4.6 |
| June Year— | ||||||
| 1963 | 109.8 | 34.6 | 32.8 | 4.4 | 12.3 | 11.9 |
| 1964 | 136.5 | 41.8 | 40.0 | 8.2 | 22.5 | 21.9 |
| 1965x | 119.1 | 42.3 | 39.7 | 8.6 | 20.8 | 19.9 |
| 1966* | 117.2 | 48.2 | .. | 7.9 | 18.3 | .. |
INDEX NUMBERS OF VOLUME OF EXTERNAL TRADE—The series for exports of New Zealand produce are linked chain series. Up to 1949 the exports of each year were revalued at the unit values of the immediately preceding year and the aggregate so obtained was compared with the recorded value in that (preceding) year. Each year's index was, therefore, a Laspeyre type index on base previous year. From 1950 on, aggregates have also been calculated for immediately preceding years at the unit values of the latest year, which, compared with the recorded value in the latest year, gives a Paasche type index. The final index for the year is then obtained as the goemetric mean of these two—i.e., a Fisher “Ideal” index—and in the table the successive annual movements are linked. The quarterly indices are similarly calculated on base previous year, but only a limited number of the more important commodity headings are used in the calculation. When the final indices for the year become available the quarterly indices are adjusted to accord with these; consequently, the indices for quarters are provisional.
The series for total exports includes an allowance for re-exports of imported goods. Since these are normally approximately 1 percent of total exports the approximate volume movements are obtained by “deflating” the recorded values by the import price index as the best indicator available of price movements for these commodities. The two indices, exports of New Zealand produce and re-exports, are then combined by weighting by their relative values in 1960, which is the base period for the current series.
The import volume index up to 1946 was calculated by revaluing each year's imports at 1937 unit values, assuming comparable price movements in the unpriced items as in the priced items. Thereafter a change was made to the calculation of each year on base previous year and the linking of these annual movements. Anterior year weights were used up to 1949 to give a Laspeyre type index. From 1950 on, a Fisher “Ideal” index has been obtained as the geometric mean of both anterior year and current year weighted indices. The quarterly indices, too, are calculated on base previous year, and, like the export series, are provisional until the calculation of the annual index. Currently, the items for which quantities are recorded (and consequently unit values obtained) represent approximately two-thirds of the total value of imports. Price movements are imputed to the remaining third on the basis of the price movements of items in the same statistical groupings.
The total exports and imports series are combined into the total trade series by weighting by their relative values in 1960, being the base period for the current combined series. Index numbers of volume of external trade for the latest 11 years are given below on the base: calendar year 1960 (= 1000). Since July 1962 trade statistics have been compiled on a June year basis and consequently the figures given in this table cover June years only, but quarterly figures are published in the Monthly Abstracts of Statistics and in the annual Analysis of External Trade Statistics. These also give series for calendar and March years.
VOLUME INDEX NUMBERS OF EXTERNAL TRADE Base: calendar year 1960 (= 1000) | |||||||
|---|---|---|---|---|---|---|---|
| June Year | Exports | Imports | Total Trade | ||||
| New Zealand Produce | Total Exports | ||||||
| Dairy Produce | Meat | Wool | Total | ||||
*Provisional. | |||||||
| 1954 | 945 | 795 | 730 | 797 | 797 | 772 | 785 |
| 1955 | 812 | 781 | 746 | 758 | 758 | 1,032 | 890 |
| 1956 | 1,011 | 914 | 772 | 864 | 864 | 995 | 927 |
| 1957 | 981 | 944 | 795 | 893 | 892 | 969 | 929 |
| 1958 | 1,065 | 876 | 878 | 935 | 935 | 1,068 | 999 |
| 1959 | 1,057 | 917 | 985 | 976 | 975 | 874 | 926 |
| 1960 | 1,124 | 957 | 1,009 | 1,019 | 1,019 | 914 | 967 |
| 1961 | 975 | 1,017 | 984 | 988 | 988 | 1,151 | 1,066 |
| 1962 | 1,122 | 1,004 | 1,110 | 1,072 | 1,076 | 1,008 | 1,043 |
| 1963 | 1,070 | 1,130 | 1,107 | 1,111 | 1,114 | 1,053 | 1,084 |
| 1964 | 1,161 | 1,136 | 1,087 | 1,149 | 1,153 | 1,250 | 1,200 |
| 1965x | 1,241 | 1,104 | 1,021 | 1,143 | 1,147 | 1,238 | 1,191 |
| 1966* | 1,246 | 1,037 | 1,175 | 1,178 | 1,184 | 1,363 | 1,271 |
IMPORT AND EXPORT PRICES AND TERMS OF TRADE—Descriptions of the index numbers of export and import prices compiled in New Zealand and of the terms of trade are given in Section 23, together with the index numbers.
MOVEMENT OF SPECIE—There is no mint in New Zealand and all new coin is imported from the Royal Mint in England. In section 29 dealing with Banking and Currency is a description of the coinage in use in New Zealand. The movement of specie to and from New Zealand is recorded in the trade statistics, but the value is not included in the totals of merchandise exports and imports. All records of specie are at face value.
The following table shows exports and imports of specie stated at face value for each of the latest 11 years.
| Year | Specie Imported | Specie Exported | Excess of Specie Imports (+) or Exports (-) |
|---|---|---|---|
| $ | $ | $ | |
*Provisional. | |||
| 1955 | 87,452 | 26,510 | + 60,942 |
| 1956 | 22,854 | 5,126 | + 17,728 |
| 1957 | 77,662 | 30,052 | +47,610 |
| 1958 | 195,154 | 323,094 | -127,940 |
| 1959 | 58,656 | 77,646 | - 18,990 |
| 1960 | 204,298 | 72,748 | + 131,550 |
| 1961 | 479,304 | 51,128 | +428,176 |
| Jan-June 1962 | 4,958 | 28,656 | - 23,698 |
| June Year | |||
| 1963 | 157,934 | 13,926 | + 144,008 |
| 1964 | 85,304 | 27,504 | + 57,800 |
| 1965 | 509,822 | 27,050 | +482,772 |
| 1966* | 373,188 | 19,150 | +354,038 |
IMPORT AND EXPORT CONTROL AND EXCHANGE ALLOCATION—To ensure that overseas debt services would be met and sufficient funds be available for essential imports, there have been import control and export licences regulations since December 1938.
The Import Control Regulations 1938 prohibited the import of goods except under a licence or an exemption. The Export Licences Regulations 1938 provided (with minor exceptions) that an export licence must be obtained before goods could be exported. In addition, the requirement of an export permit was introduced by the Export Prohibition Emergency Regulations 1939, which have since been replaced by the Export Prohibition Regulations 1953. The Import Licensing Control Regulations 1964 (related to the authority of the Customs Act 1913) consolidated and amended the Import Control Regulations 1938 and their amendments. Under the Import Control Regulations 1964 importation into New Zealand of any goods is prohibited except by a written licence, an exemption or a written permit granted by the Minister of Customs.
Export Control—Three classes of export licences are provided for, viz, particular, general, and purchaser's. The particular licence applies to an occasional shipment, the general licence is issued to exporters who make regular or frequent shipments, while the purchaser's licence applies to those cases where goods have been purchased in New Zealand for export and credits have been established from overseas funds (e.g., wool purchases). A condition of the issue of any export licence is that the overseas exchange earned must be sold to a New Zealand bank for New Zealand currency.
Whereas the purpose of the Export Licences Regulations is to ensure that all foreign exchange earned is sold to the New Zealand banking system, the Export Prohibition Regulations 1953 control the export of essential goods in short supply, of goods on which subsidies have been granted, and of goods shipped to strategic destinations.
Import Selection—The Import Control Regulations are administered through Import Licensing Schedules. The first four Schedules were for six-monthly periods and the first three were confidential to Government Departments. From 1941 to 1961 the Schedules were issued for calendar year, with occasional extensions into the following year. From 1 July 1962 the Schedules have been for years ending 30 June.
The items in the Import Licensing Schedules were originally divided into: basic items for which licences were allocated according to the applicant's import history in a base year; items subject to individual consideration (C); and items for which no licences were available (D). In the case of basic items there were differentiations between the sources of supply, with emphasis on sterling area countries, and several hard-currency countries were excluded from the allocation of basic licences.
Import licences are issued by the Customs Department which is advised by the Department of Industries and Commerce on the import of materials and machinery for existing or planned New Zealand manufacturing industries and on the import of goods of a kind made in New Zealand.
In the 1949 Schedule provision was made for token licences to allow old-established business connection with United Kingdom exporters to be maintained on a small scale in cases where no allocation for such items had been made. The amount of token licences was a percentage of 1938 imports from the United Kingdom.
An extension of import licences on sterling area countries to all non-scheduled countries commenced with the 1951 Schedule. Scheduled countries were those enumerated in the annual Import Licensing Schedule for which only individual licences, limited to the specific country, were issued, and remained in force until 1961. From 1962 on, however, the restriction was withdrawn and imports are now permitted from any source.
In May 1950, as a further liberalisation of import licensing, the Government made provision for the issue of no-remittance licences which could be financed out of the applicant's own overseas funds. As no limit was placed on the nature or extent of imports that could be made, nor of the funds to be used, abuses soon became apparent and it was necessary to amend the scheme. A limitation was placed on the type of overseas funds which could be used and the amended scheme applied in general only to imports required by private individuals for their own use and not for purposes of resale.
From 1 December 1950 innovations were: the freeing of a large number of items from licensing if the goods were imported from non-scheduled countries; the introduction of world exemption items ("EE"); and the introduction of two categories of modified “D” items.
The 1958 Import Licensing Schedule was initially released in August 1957 but, because of New Zealand's balance of payments crisis it had to be replaced by one which restored import control on virtually all private imports. The allocations for items were based on 1956 imports but some items were given a “B” category (or “B” plus percentage classification) and these allocations were related to the old 1958 Schedule provision. Other categories were the “C” (individual consideration) and “D” (no allocation), but the “E” (exempt) and “EE” (world exempt) categories were cancelled. It was also necessary to withdraw the scheme for token imports. However, a new category “A” was introduced under which licences were granted for imports from non-scheduled countries up to the full value sought.
Because of the further deterioration of New Zealand's balance of payments, the 1959 Schedule provided for lower imports than in 1958. One feature of the Schedule was the reintroduction of “global” licences, which could be used for imports from any source, for all items except a limited number designated “M”. Licences for “M” items were available for non-scheduled countries only. However, it was later decided to issue licences for scheduled countries on the same basis as that which applied to the same goods from other countries.
Towards the end of 1958 there was a considerable improvement in the overseas prices received for New Zealand's exports. This rise continued in 1959 and enabled the Government to make additional funds available for imports. Two major relaxations in April 1959 and June 1959 greatly extended the 1959 provision for imports.
The improvement in New Zealand's overseas reserves was reflected in the 1960 Import Licensing Schedule. The 1960 Schedule provided for a much higher value of imports than in 1959 and introduced several new features in licensing procedures. These new departures were aimed at giving the maximum flexibility to importers while retaining those minimum restrictions which were necessary for the effective protection of the balance of payments.
The 1960 Schedule had an increased number of basic allocations, a total of 401 items being in this category. The basis was mainly the value of 1959 Licences, although in several cases other bases were used. Many items which were previously considered individually were made basic to let the importer know his entitlement as soon as possible, so eliminating delays in dealing with applications for licences.
The exemption of items from import licensing was reintroduced. Although the number of items was not large, their import value was a considerable sum. The items were: raw sugar, crude oil, motor spirits, certain bulk oils (kerosene and lubricating oils), explosives, crude sulphur in bulk, and manures. These items were particularly suited for exemption as they are essential, of major value, and are imported by relatively few firms so that actual and likely expenditure can be readily ascertained.
The token licence provision which had been cancelled because of the critical circumstances at the beginning of 1958 was reintroduced in a new form. Over a wide range of items, for which no other allocation had been made, token licences were available for imports from any source to the extent of 10 percent of the value of imports of the same goods from any source in 1956. For a few items which were severely restricted in 1956 the basis was 100 percent of the value of 1956 licences. The token licence procedure permitted overseas suppliers and their New Zealand customers to maintain trading contact; it also introduced variety and kept overseas standards before manufacturers and consumers.
The most important new features of the Schedule were the replacement licence ("R") scheme and the industry group scheme. The replacement scheme permitted an importer to obtain his genuine import needs for an item. (In 1960 an importer was entitled to an initial licence representing 50 percent of the value of his normal 1959 licence for the “R” items. Further licences were issued up to the ceiling of 150 percent in replacement of the value of actual imports made under his 1960 licence.) The “R” system applied also to new importers.
The application of “global” licences introduced in the 1959 Schedule was extended in 1960 so that the only goods remaining in the “M” category were motor vehicles (excluding spare parts). For this item the allocation for “scheduled” countries was the same as “non-scheduled” countries.
The 1961 Import Licensing Schedule further liberalised the import licensing allocations. The number of “Replacement” ("R") and “A” items was increased and the initial entitlement to “R” licences raised from 50 to 100 percent. It was estimated that 55 percent of private imports was either exempt from import licensing or subject to the “R” or “A” allocations which made licences available to regular or prospective new importers.
A fall in export receipts, particularly from dairy produce, and a large increase in private imports forced the Government to adopt more restrictive measures in 1961. In April 1961 the replacement ("R") scheme was suspended and the “A” category abolished in June 1961.
The qualifying date for the use of overseas funds for personal imports, mainly of motorcars, was advanced from 18 November 1953 to 31 December 1958.
In June 1961 two major decisions were taken to reduce imports to the level of lower export earnings. The 1961 licences were spread over an 18 months' period to 30 June 1962 and a limited Supplementary Schedule was introduced for the first half of 1962 to cover urgent needs beyond the 1961 entitlements. The Supplementary Schedule provided for a reduction of $100 million on current import levels.
While the exempt items of the 1961 Schedule were continued in the Supplementary Schedules, the “A” and “R” category remained cancelled, token licences were eliminated, and the number of items without allocation ("D") or subject to individual consideration ("C") was greatly increased.
Import Licensing Schedules now apply to the 12 months ending 30 June, the first Schedule covering the period from 1 July 1962 to 30 June 1963. This Schedule issued in March 1962 provided for private imports at a level of about $500 million and represented a considerable easing in relation to the supplementary period in the first half of 1962. In general the provision made for essential raw-material imports was expected to allow manufacturers to maintain actual usage at a level consistent with that for 1960. The Schedule was based on the new Customs Tariff which came into force on 1 July 1962. A new “A” category was introduced for a limited number of items to ensure continuity of supply while avoiding any undue build-up of stocks. The token licence scheme was withdrawn but was reintroduced in October 1962 and is still operative.
In October 1962 provision was made for increased basic licences for a wide range of goods and for the reintroduction of token licences. Most of the increases in basic licences were for those consumer goods which had been severely restricted before. No extra provision of funds Was involved, the reallocation being possible through a review of actual licence issue and use.
Innovations of major importance introduced in 1962 were the Free Funds and the Export Incentive schemes.
The Free Funds Scheme extended the no-remittance policy to commercial imports. It permitted the use of privately held funds of the following kinds: (a) Legitimately acquired overseas earnings held by the applicant on or before 28 February 1962. These funds comprised mainly royalties and commissions; (b) Sterling area currencies or securities, including shares, purchased legitimately from other New Zealand residents on or before 31 December 1958.
To offset inequities between those importers who had repatriated or never held “approved” funds and those who had retained such funds it was decided that for every $10 of approved funds $2 must be repratriated to New Zealand through normal banking channels, only the balance of $8 being available for imports. Where goods were purchased for resale, licences would be granted only to those with a history of importing goods of a similar class.
The Export Incentive Scheme was made available to all manufacturers who manufacture for export or who undertake to do so, whether or not they have an entitlement to import licences for raw materials or components. Licences issued under the scheme are either replacement, assistance, or bonus licences. A manufacturer already holding a licence or entitlement to a licence for raw materials or components may obtain a replacement licence to the value of the imported content of the goods exported, produced for export, or in the course of manufacture against confirmed overseas orders. Assistance licences will be granted either in the case of confirmed overseas orders where production has not been commenced, or when a manufacturer not holding overseas orders makes a declaration of intention to export and shows that active steps to open up an export market have been taken. Bonus licences are available to manufacturers who have actually exported; they may obtain licences for raw materials or components either of the same kind and value as those used in the manufacture of the exported goods, or of a different kind provided that the latter have a basic allocation and that the grant is not likely to affect adversely the efficient operation of an existing New Zealand industry. Bonus licences are in addition to licences issued as replacement or assistance licences. Once a bonus licence has been granted the materials or components may be used to manufacture goods for sale either overseas or in New Zealand as the manufacturer decides.
For the 1963-64 import licensing year $500 million was provided for private import payments-the same as for the previous year. Particular efforts were made to increase the flexibility of operation of the licensing system. Over 100 items were included in the “A” category compared with 15 in the previous schedule. These covered a wide range of industrial raw materials together with many essential goods for retail sale. Licences for “A” items were granted initially to the extent of 75 percent of the value of licences (other than “special” licences) granted for imports of similar goods during the 1962-63 licensing period. On evidence of full commitment of their initial licence, importers were granted further licence in the light of sales performance or use in manufacture.
Two general schemes were introduced for the 1963-64 year to assist manufacturers holding licences for raw materials for use in their own plant: (a) General “A” licences—Manufacturers entitled to “A” licences in more than one item were permitted to amalgamate these into one general licence which might be used at the licence holder's discretion to import goods up to the full monetary limit of the combined licences. This gave greater freedom of choice and enabled changes in demand to be met more readily; (b) General entitlement licences—A similar arrangement was introduced to provide for amalgamation of licences covering over 100 items relating to raw materials or components for use in manufacture.
Additional flexibility was provided by placing approximately 140 items in 14 “interchange-ability groups”. A licence holder with a 1963-64 licence for one or more of the items in a group might use 25 percent of that licence to import any of the other items in that group.
Following experience with the new Customs Tariff, and a study of the pattern of imports during the 1962-63 period, it was possible to reduce the number of item codes by 15 percent. To the existing list of exempt items was added the major item of printed books (other than magazines, periodicals, newspapers, and comics). The issue of separate licences for motor vehicles from dollar and non-dollar sources was discontinued and licences became available for imports from any source.
During the 1963-64 import licensing period commercial and industrial growth expanded rapidly. Additional funds totalling slightly more than $16 million were made available for further imports of cars, agricultural tractors, on extension of the “token” import scheme, additional components for television manufacture, and further industrial raw materials.
However, by the time of issue of the 1964-65 Import Licensing Schedule in April 1964, it became apparent that private import payments for the licensing period 1 July 1963 to 30 June 1964 would reach a considerably higher figure than the $516 million provided. This was due to three main factors: (a) The value of imports of goods exempt from import licensing control had increased sharply, due principally to the large increase in the price of raw sugar, greater use of petrol, and of agricultural fertilisers; (b) There was a larger carry-over than usual from the previous period of goods imported and paid for under 1962-63 licences; (c) Increased flexibility in the 1963-64 Schedule provisions, together with increasing demand, resulted in a greater utilisation of licences than normal.
In preparing the Schedule for 1964-65 it was decided that the principle of allowing as much flexibility as possible in the use of licences should be continued. An increase in the range of industry groups and provision for further transfers to interchangeability groups reflected this decision. Accordingly it was considered wise to budget on a non-utilisation figure of 10 percent for 1964-65 compared with the previous 15 percent. Therefore, although the Schedule was framed on approximately the same funds basis, a reduction was necessary in calculating the total value of licences that could be issued. This meant that the level of allocations for individual items had to be reduced in many cases. However, the position was reviewed in September of that year, when in most cases, the allocations were increased to 100 percent 1963-64 licences. Licences for 1964-65 for “A” items were again based initially on 75 percent of the value of licences (other than “special” licences) granted on or before 31 January 1964 for imports of similar goods during the 1963-64 licensing period. Licences for additional requirements were to be considered in the light of commitment of basic licences, usage in manufacture or sales performance, and stock holdings. In line with the general reduction of allocations, it was necessary to place a ceiling on the value of “A” licences issued. This was fixed at 100 percent of licences issued in 1963-64.
A revision was undertaken of the industry groups, and the items which might be imported under each group were set out in detail in the Schedule. Previously, these groups were defined in terms of the former Customs Tariff. Opportunity was taken to bring the contents of these groups into line with current demands, and attention was given to the effect of growing domestic manufacture of many components. In order to extend the advantages of the industry group scheme to further defined manufacturing industries, some additional groups were introduced—those for materials and components for the manufacture of garments, carpets, and electric storage batteries; and materials for use in the tanning of hides and skins. Two groups which were deleted from the 1963-64 Schedule, because of the introduction of the Manufacturers' General Entitlement Scheme, were revived. These were the groups relating to the manufacture of soaps and paints. A major departure was to permit the inclusion of “A” items in industry groups.
Following the revision of existing industry groups and the introduction of further groups, together with the inclusion of “A” items, there was no further need for the manufacturers' “A” and “General” licence groups. These were accordingly cancelled. Interchangeability groups, which were introduced during the 1963-64 period, were continued, and, generally speaking, licence holders were permitted to transfer a further 25 percent of their individual item entitlements to these groups. Where materials or components for use in manufacture did not fit into an industry group, it was decided to give consideration, on individual application, to the “consolidation” or “aggregation” of licences. In these cases, one “consolidated” licence, specifying the item codes for which it was valid, would be issued.
In accordance with New Zealand's undertaking to assist the trade of less fully economically developed countries, tea imported in packages of 51b net weight or over was removed from import control. This was previously an “A” item, and actual requirements were freely imported. Tea in smaller packages, that is, for retail sale, continued to be a restricted item. Control was also removed from fresh, chilled, or frozen meat (except poultry); dried, salted, or smoked meat; greasy or scoured wool; undressed hides and skins (except furskins).
A major innovation in 1964-65 was the introduction of a new procedure under which importers were relieved of the need to make application for basic licences under a wide range of items. For the great bulk of basic items, licences were issued automatically with considerable saving in time and paper work.
Under the review held in September 1965, additional overseas funds were allocated to restore licences, chiefly for manufacturers' raw materials, to 100 percent of 1963-64 licences. As a result of the review 10 more items were exempted from import licensing. The more important of these were cotton meat wraps, crude rubber, raw tanning materials, crude gypsum, and timber preservatives.
In the 1965-66 Import Licensing Schedule 90 items representing imports then valued at $90 million were exempted from licensing as from 1 July 1965. With this increase, about $200 million, or 33 1/3 percent, of New Zealand's import trade was free of licensing. The items exempted were: (a) raw materials—coffee beans, cocoa beans, unground spices, sausage casings, artificial and jute fibres, asbestos, shellac, kapoc, certain base metals, and a wide range of textile piece goods; (b) consumer goods—iodised salt, certain drugs, razor blades, keys and key blanks, x-ray film, pipe cleaners, and sewing threads; (c) various agricultural equipment e.g. tractors,, combine harvesters, corn pickers, pick-up hay balers, cream separators, and parts for the repair of many classes of agricultural equipment; (d) heavy-duty trucks.
The ceiling on “A” licences was raised to a maximum of 1331 percent of licences issued in 1964-65.
The principle of licence aggregation was extended in 1965-66. Importers automatically received in aggregate form basic licences for which they qualified under certain item codes and industry groups. In addition, consideration was given on application to aggregation of or transfers from licences held under other item codes.
Some progress was made in meeting the needs of established businesses which did not hold licences. Businesses which had been in operation for at least three years and which had to rely on obtaining goods classified in the “A” category from regular licence-holders could apply for a licence based on the c.i.f. value of 25 percent of their average annual purchases from importers of such goods over the last three licensing years.
The 1965-66 Schedule also continued arrangements for industry and interchangeability groups, token licences, the export incentive scheme, and the automatic issue of basic licence against the bulk of the basic items appearing in the Schedule.
The 1966-67 Import Licensing Schedule reflected the need for some restraint on the level of importing in view of the balance of payments position. It provided for general reductions in th allocations for licensed imports including a reduction of 15 percent of the value of 1965-66 licences for most raw materials and components used for manufacturing. Other reductions were for consumer goods, a reduction of 20 percent for motor vehicles, a more restricted level of imports of industrial plant and machinery, and an initial allocation of 66 2/3 percent of the value of 1965-66 licences for woollen piece goods. As a result of a public inquiry into woollen and synthetic fibres, yarns and fabrics by the Tariff and Development Board, lightweight woollen piecegoods were removed from import licensing for the 1966-67 licensing period and the import allocation for heavier weight woollen piece goods weighing more than 5 1/2 ounces was increased to 90 percent of imports of the same goods under 1965-66 licences.
Under the New Zealand - Australia Free Trade Agreement (NAFTA) some goods of Australian origin were exempted from import licensing. Classes of goods covered under the agreement include strawberries; peas; beans; lentils; dried, dehydrated, or evaporated vegetables; dressed and undressed timber; veneer plywood; and flooring of laminated wood.
All other exempt items, with minor exceptions, were continued in the 1966-67 Schedule and comprised approximately one-third of the value of private imports.
The token licence scheme was continued, the “A” Scheme was suspended and no continuation or extension of the provisions relating to new importers were made. New importers, however, who had received licences under previous provisions had their entitlement continued in terms of the allocation in the 1966-67 Schedule.
Overall, the 1966-67 Schedule provision was the second highest on record being exceeded only by that provided for in 1965-66.
The 1967-68 Import Licensing Schedule provided for further general reductions in the allocations for licensed imports; allocations were in the main reduced by 20 percent.
TARIFF AND DEVELOPMENT BOARD—The Tariff and Development Board was established under the Tariff and Development Board Act 1961. The Board was constituted on 1 June 1962 and since then has comprised between four and six members. The Board has the functions, when so requested by the Minister of Customs or the Minister of Industries and Commerce or the Minister of Overseas Trade, to inquire into and report on any of the following matters, with such recommendations as it thinks fit:
The desirability of new, increased, or reduced Customs duties, or of exemption from such duties;
The general effect of the operation of the Tariff on the trade and commerce, and the farming, manufacturing, and distributing industries of New Zealand and also on the interests of consumers;
The desirability of providing or continuing to provide assistance, whether by means of subsidies, grants, bounties, Tariff concessions or preferences, or otherwise, for the protection and encouragement of any New Zealand industry or for the development of New Zealand's overseas trade;
The relationship between the rates of Customs duties on raw materials and those on finished or partly finished products;
Any matter relating to the licensing of imports, including any appeal against a decision to decline, in whole or in part, any application for an import licence;
Any matter relating to the application of Customs duty under any item of the Tariff, or to the granting of concessions as provided for in the Tariff or in the Customs Acts;
Any other matter affecting the protection or development of industry or the development of overseas trade, whether by means of the Tariff or otherwise.
The Board may also from time to time, of its own motion, inquire into and make recommendations to any of the said Ministers on any matter of policy.
Two of the first questions which the Board had referred to it for inquiry and report were “the need for criteria in the light of which industrial growth and development should proceed” and “the need for additional medium- and long-term establishment and developmental finance”. Reports have been furnished on these subjects, and published as parliamentary papers, H. 48 and H. 49, 1963. The Board has held a number of public inquiries into other subjects, including the commercial, economic, and social implications of hire purchase and credit transactions and practices in New Zealand. It has also inquired into the rates of import duty which should be imposed on various classes of goods and during 1966 public inquiries were held concerning fork lift trucks; lightweight woollen piece goods; abrasive cloth and paper; hinges; odiferous compounds; and microporous materials used as substitutes for leather.
TRADE COMMISSIONER SERVICE—Facilities for the promotion of overseas trade are provided by the Department of Industries and Commerce through the service of Trade Commissioners who are stationed in 24 posts—Accra, Athens, Auckland (for the Pacific), Bonn, Brisbane, Brussels, Canberra, Hong Kong, Kuala Lumpur, London, Los Angeles, Melbourne, Montreal, New Delhi, New York, Paris, Rome, San Francisco, Singapore, Sydney, Tokyo, Trinidad, Vancouver, and Washington. While this representation is modest in comparison with other countries, it reflects the country's growing interest in the desirability of diversifying export markets. This is further exemplified by the fact that 14 posts have been established in the last eight years: Trinidad in 1958, San Francisco, and Kuala Lumpur in 1959, Hong Kong in 1960, Paris in 1961, Accra and Vancouver in 1962, Canberra in 1963, Athens in 1964, Brussels and Los Angeles in 1965, and Bonn, Brisbane, and Rome in 1966. In addition, agreement was reached with Air New Zealand in 1961 that some of its overseas managers should act as trade correspondents of the Department of Industries and Commerce. At present there are Air New Zealand correspondents in Fiji, Tahiti, and Honolulu. Most Trade Commissioners have appropriate diplomatic or consular status in the countries to which they are accredited.
While the selling of goods in overseas markets is basically the responsibility of New Zealand exporters, the Trade Commissioner can be of considerable help in conducting market surveys and supplying information on import and exchange restrictions, Customs duty, sales tax, normal sources of supply (local production and imported), marketing methods, freight rates, statutory or customary requirements for packing, labelling, etc., and reliable importers in his territory. He may also assist New Zealand importers to locate new sources of supply of essential commodities. New Zealand businessmen travelling overseas may be saved much time and trouble by enlisting the services of the Trade Commissioner, whose knowledge of local conditions and whose connections with businessmen and Government officials in his territory enable him to give valuable advice. His task is made easier if he is given adequate notice of the visit.
The Trade Commissioner keeps a careful watch on the pattern of New Zealand trade with his territory and reports on significant changes. Where imports from New Zealand are affected, for example, by a new interpretation of an agricultural inspection regulation, or by the imposition of import restrictions, the Trade Commissioner is often called upon to make representations at the official level.
Trade Commissioners are also engaged in numerous other activities, some of which are: representing New Zealand at international conferences, reporting on economic and industrial developments in their territories, acting on behalf of Government Departments in the procurement of stores, payment of accounts, etc., and maintaining liaison where they are stationed with business and Government circles.
Businessmen may write for information direct to the New Zealand Trade Commissioner in the country concerned but, where convenient, it is preferred that requests be made through the Department of Industries and Commerce in New Zealand, which is often able to give preliminary advice and assistance.
The addresses of overseas representatives are listed in Section 41, Official.
GENERAL—In New Zealand the Customs Department requires for every package exported a declared statements of the contents, value and destination, and the export statistics are compiled from the analysis and totals of these statements.
Exports are valued in New Zealand currency “free on board at the port of shipment”, except re-exports ex bonded warehouse or under drawback of duty, which are recorded at the original import values. Where goods are not sold till arrival at their destination, values are assessed at current prices at time of shipment. Meat and dairy-produce exports are valued like other commodities, on the basis of overseas realisation, not on the basis of the prices payable to producers under the internal purchasing procedures.
The ultimate destination of the goods is distinguished as far as practicable, but it is impossible to discover what proportion of the exports is intended for home consumption in the country of destination. A distinction is made between exports of New Zealand produce and re-exports of imported goods.
With the adoption of the Standard International Trade Classification (Revised) for classifying external trade for statistical purposes from 1 July 1962, June year figures are separately tabled, and are the commencement of a new series from June year 1963.
CLASSIFICATION OF EXPORTS—The table following gives merchandise exports (i.e., excluding gold and current coin) for the latest 9 years fox the four main commodity groups.
| Year Ended June | New Zealand Produce | ||||||
|---|---|---|---|---|---|---|---|
| Meat and Meat Preparations | Dairy Products | Fruit and Vegetables | Hides, Skins and Pelts | Wool | |||
| Butter | Cheese | Total | |||||
* Including commodities not listed. † Provisional | |||||||
| f.o.b. value $(million) | |||||||
| 1958 | 138.9 | 69.2 | 26.3 | 125.3 | 8.2 | 19.8 | 194.3 |
| 1959 | 153.4 | 77.4 | 34.2 | 120.2 | 8.4 | 21.0 | 160.5 |
| 1960 | 142.4 | 122.7 | 46.7 | 180.8 | 7.8 | 29.0 | 207.5 |
| 1961 | 157.5 | 80.2 | 32.0 | 121.5 | 6.7 | 23.7 | 188.8 |
| 1962 | 139.9 | 84.4 | 43.0 | 136.6 | 9.9 | 26.7 | 207.4 |
| 1963 | 173.0 | 90.9 | 37.0 | 138.0 | 7.5 | 25.4 | 214.4 |
| 1964 | 183.2 | 109.6 | 35.0 | 157.0 | 9.6 | 30.4 | 271.4 |
| 1965 | 212.5 | 119.6 | 40.7 | 180.9 | 10.7 | 31.7 | 208.6 |
| 1966† | 195.1 | 109.0 | 41.1 | 173.5 | 12.1 | 39.7 | 231.3 |
| Year Ended June | Sausage Casings | Tallow | Casein | Pulp, Paper, and Paper Board | Total* | Re-exports | Total Exports |
| f.o.b. value $(million) | |||||||
| 1958 | 9.8 | 6.7 | 5.4 | 6.8 | 538.9 | 5.2 | 544.0 |
| 1959 | 8.7 | 7.1 | 8.1 | 13.3 | 516.9 | 4.5 | 521.5 |
| 1960 | 7.5 | 5.8 | 8.4 | 12.9 | 624.3 | 5.3 | 629.5 |
| 1961 | 7.3 | 6.2 | 7.5 | 11.7 | 555.9 | 5.5 | 561.4 |
| 1962 | 8.9 | 6.2 | 10.9 | 575.1 | 7.8 | 582.9 | |
| 1963 | 10.5 | 4.8 | 8.4 | 13.8 | 620.0 | 7.6 | 627.6 |
| 1964 | 12.0 | 7.1 | 11.3 | 17.3 | 728.4 | 8.8 | 737.3 |
| 1965 | 11.1 | 7.0 | 16.8 | 17.0 | 733.7 | 8.5 | 742.2 |
| 1966† | 10.6 | 6.5 | 19.4 | 18.4 | 751.0 | 10.3 | 761.3 |
The commodity groups shown above normally account for more than 90 percent of the total value of merchandise exports.
The relative importance of dairy produce, meat, and wool as the main individual constituents of New Zealand's export trade has varied considerably, as is seen from the figures in the preceding table. In the preceding subsection is set out a table of volume index numbers for these commodities. A table showing the export price index numbers and terms of trade is given in Section 23, Prices.
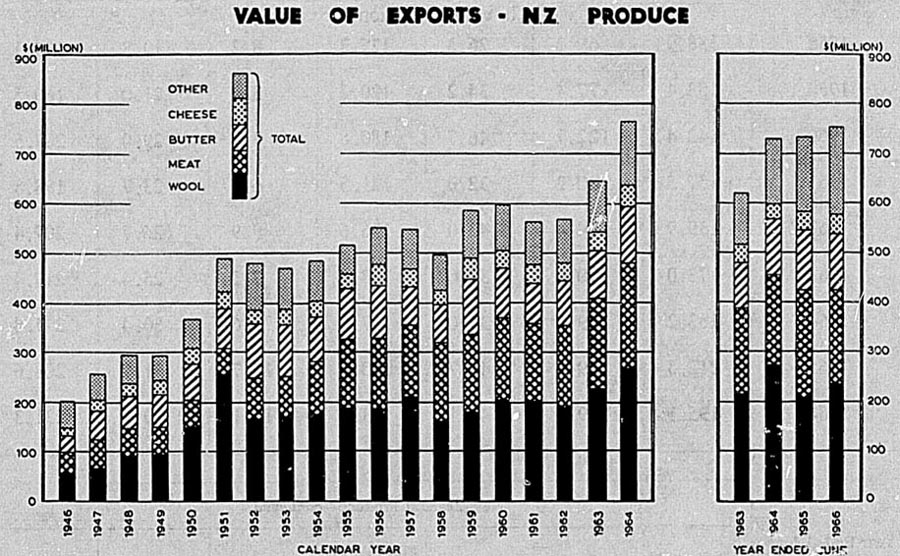
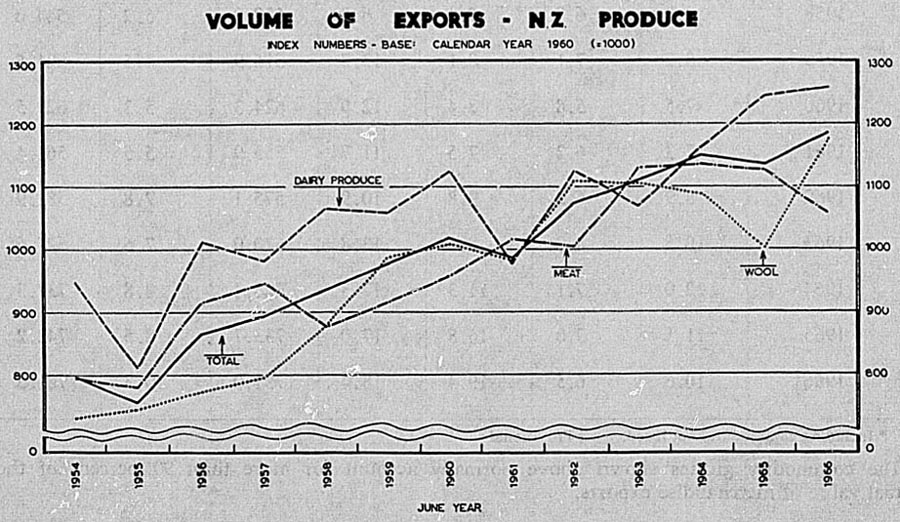
New Zealand's reliance upon grassland farming for her exports is brought out by the figures in the next table showing total exports of pastoral products and the percentage which they represent of the total exports of New Zealand produce.
| EXPORTS OF PASTORAL PRODUCTS | ||
|---|---|---|
| Year | Value | Percentage of Total Exports of N.Z. Produce |
†Provisional. | ||
| $(000) | ||
| 1941 | 124,475 | 95.6 |
| 1942 | 148,722 | 94.3 |
| 1943 | 122,058 | 88.8 |
| 1944 | 117,896 | 83.9 |
| 1945 | 136,224 | 88.4 |
| 1946 | 179,164 | 90.4 |
| 1947 | 240,684 | 95.0 |
| 1948 | 275,499 | 94.4 |
| 1949 | 277,404 | 95.3 |
| 1950 | 348,799 | 96.3 |
| 1951 | 478,273 | 97.4 |
| 1952 | 456,358 | 96.0 |
| 1953 | 447,493 | 95.9 |
| 1954 | 458,408 | 94.7 |
| 1955 | 492,186 | 95.8 |
| 1956 | 519,334 | 94.5 |
| 1957 | 515,351 | 94.0 |
| 1958 | 462,565 | 93.4 |
| 1959 | 546,541 | 94.0 |
| 1960 | 561,588 | 93.7 |
| 1961 | 526,665 | 94.0 |
| 1962 | 530,689 | 93.4 |
| June year | ||
| 1963 | 579,700 | 93.5 |
| 1964 | 678,985 | 93.2 |
| 1965 | 675,564 | 92.1 |
| 1966* | 682,965 | 90.9 |
Of exports other than pastoral the principal ones of economic significance in the June year 1966 were: newsprint ($11.9 m.), woodpulp ($6.0 m.), apples ($6.6 m.), grass and clover seeds ($3.2 m.), fish and fish products ($5.5 m.), logs of radiata pine (4.3 m.), sawn timber ($1.9 m.).
Quantity figures of exports of the principal items of New Zealand produce of primary source are next given for the three latest years, while the Statistical Summary, towards the end of the book, shows the figures for some of the more important commodities for the last 50 years. For some purposes, especially for comparisons between recent and more remote years, quantities are preferable to values, since the latter are affected by price variations.
| Commodity (New Zealand Produce) | June Year 1964 | June Year 1965x | June Year 1966* | |
|---|---|---|---|---|
*Provisional. | ||||
| Mining products— | ||||
| Coal | (ton) | 149 | 19 | 7 |
| Pumice | (cwt) | 17,024 | 18,668 | 16,440 |
| Cement | (cwt) | 210 | 200 | 308 |
| Fishery products— | ||||
| Fish, fresh and frozen | (cwt) | 48,669 | 60,626 | 54,397 |
| Crayfish | (cwt) | 24,610 | 28,975 | 30,022 |
| Whale oil | (gal) | - | 381,095 | - |
| Fish oils and fish-liver oils | (gal) | 16,551 | 2,588 | 7,441 |
| Forest products— | ||||
| Kauri gum | (ton) | 53 | 35 | 820 |
| Timber— | ||||
| Logs, radiata pine | (cu. ft.) | 10,854,083 | 14,456,741 | 17,810,126 |
| Sawn | (sup. ft.) | 29,470,446 | 38,099,033 | 30,554,709 |
| For cases in shooks | (sup. ft.) | 4,011,367 | 3,852,915 | 2,257,609 |
| Wood pulp | (ton) | 65,601 | 55,850 | 70,332 |
| Newsprint | (cwt) | 2,147,067 | 2,218,801 | 2,341,210 |
| Building board | (sq. ft.) | 2,396,356 | 2,842,600 | 3,291,350 |
| Plywood | (sq. ft.) | 7,074 | 43,065 | 10,016 |
| Pastoral products— | ||||
| Butter | (cwt) | 3,639,105 | 3,782,883 | 3,787,010 |
| Casein | (cwt) | 830,454 | 1,035,253 | 818,034 |
| Cheese | (cwt) | 1,751,874 | 1,864,983 | 1,900,557 |
| Milk, dried and condensed | (cwt) | 1,452,069 | 1,733,184 | 1,940,443 |
| Sugar of milk | (cwt) | 85,966 | 102,301 | 109,511 |
| Eggs— | ||||
| In shell | (doz) | 33,377 | 34,743 | 53,835 |
| Not in shell | (lb) | 1,322,394 | 429,982 | 1,019,152 |
| Honey | (lb) | 2,734,415 | 1,723,499 | 753,660 |
| Meat, frozen and chilled | (cwt) | 10,295,245 | 10,235,159 | 9,817,777 |
| Meat, canned | (cwt) | 60,610 | 71,226 | 70,696 |
| Meat extract | (lb) | 355,984 | 452,578 | 347,041 |
| Other preserved meat | (cwt) | 44,552 | 41,928 | 31,857 |
| Sausage casings | (hanks) | 6,536,506 | 5,948,930 | 6,113,608 |
| Liver meal | (cwt) | 24,999 | 19,818 | 9,040 |
| Cattle hides | (number) | 1,013,909 | 1,059,310 | 953,960 |
| Horse hides | (number) | 3,563 | 5,585 | 3,428 |
| Calfskins | (number) | 1,173,245 | 1,091,230 | 957,520 |
| Deer skins | (number) | 55,717 | 78,553 | 73,061 |
| Opossum skins | (number) | 916,589 | 418,056 | 534,593 |
| Sheep skins and pelts | (number) | 31,365,969 | 28,562,630 | 27,517,657 |
| Horse hair and other coarse animal hair | (lb) | 59,898 | 37,794 | 42,669 |
| Wool | (lb) | 564,910,289 | 531,449,757 | 611,321,730 |
| Lard | (cwt) | 515 | 456 | 301 |
| Edible tallow | (ton) | 13,367 | 4,489 | 3,110 |
| Edible stearine | (ton) | 1,098 | 1,148 | 963 |
| Inedible tallow | (ton) | 62,258 | 52,563 | 45,502 |
| Neatsfoot oil | (ton) | 653 | 698 | 528 |
| Live cattle | (number) | 49 | 775 | 941 |
| Live sheep | (number) | 507 | 498 | 3,441 |
| Live horses | (number) | 689 | 712 | 737 |
| Agricultural products— | ||||
| Apples | (lb) | 78,557,998 | 94,694,687 | 104,708,694 |
| Pears | (lb) | 7.661,057 | 7,349,249 | 8,369,830 |
| Hops | (lb) | 5,560 | 42,580 | 235,391 |
| Potatoes | (ton) | 4,410 | 11,115 | 14,920 |
| Onions | (ton) | 8,236 | 3,962 | 2,846 |
| Canned vegetables | (lb) | 1,303,378 | 4,524,359 | 3,581,246 |
| Frozen vegetables | (cwt) | 114,454 | 56,180 | 73,912 |
| Peas, food | (cental) | 140,366 | 151,851 | 162,538 |
| Peas, seed | (cental) | 172,908 | 176,197 | 210,725 |
| Seeds, grass and clover | (cwt) | 182,244 | 91,216 | 202,654 |
| Seeds, other | (cwt) | 9,577 | 15,429 | 10,696 |
| Miscellaneous— | ||||
| Biscuits | (cwt) | 5,913 | 5,373 | 7,556 |
| Ale, beer, stout | (gal) | 252,843 | 316,182 | 375,275 |
| Sugar | (cwt) | 2,857 | 1,012 | 1,025 |
| Cigarettes | (lb) | 61,342 | 55,916 | 61,918 |
| Cut tobacco | (lb) | 225,334 | 177,861 | 192,827 |
| Textile waste | (lb) | 2,416,320 | 2,227,950 | 2,607,600 |
| Soaps | (lb) | 1,556,458 | 1,379,280 | 2,661,760 |
| Chamois leather | (sq. ft.) | 379,923 | 474,364 | 454,881 |
The values of the principal exports are given in the following table.
| Commodity (New Zealand Produce) | June Year 1964 | June Year 1965x | June Year 1966* | |
|---|---|---|---|---|
| Mining products— | $(000) | $(000) | $(000) | |
†Provisional. | ||||
| Coal | 1 | - | - | |
| Pumice | 21 | 24 | 22 | |
| Cement | 1 | 1 | 1 | |
| Other | 51 | 61 | 65 | |
| Totals | 74 | 86 | 90 | |
| Fishery products— | ||||
| Fish, fresh and frozen | 865 | 1,202 | 1,091 | |
| Fish, other | 69 | 204 | 132 | |
| Crayfish | 2,188 | 3,705 | 4,218 | |
| Whale oil | .. | 143 | - | |
| Fish oils and fish-liver oils | 119 | 23 | 82 | |
| Totals | 3,241 | 5,278 | 5,523 | |
| Forest products— | ||||
| Kauri gum | 23 | 18 | 24 | |
| Timber— | ||||
| Logs, radiata pine | 2,827 | 3,705 | 4,327 | |
| Sawn | 1,750 | 2,329 | 1,937 | |
| For cases in shooks | 431 | 416 | 246 | |
| Wood pulp | 5,512 | 4,746 | 5,980 | |
| Newsprint | 11,518 | 11,936 | 11,917 | |
| Other paper and paper board | 179 | 199 | 306 | |
| Building board | 72 | 90 | 125 | |
| Plywood | 2 | 3 | 2 | |
| Other | 5 | 3 | - | |
| Totals | 22,318 | 23,446 | 24,863 | |
| Pastoral products— | ||||
| Butter | 109,581 | 119,647 | 108,975 | |
| Casein | 11,347 | 16,806 | 19,382 | |
| Cheese | 35,080 | 40,681 | 41,105 | |
| Milk, dried and condensed | 10,955 | 18,890 | 21,299 | |
| Sugar of milk | 856 | 1,055 | 1,160 | |
| Other dairy, produce | 1,458 | 1,683 | 2,086 | |
| Eggs— | ||||
| In shell | 10 | 11 | 22 | |
| Not in shell | 203 | 55 | 123 | |
| Honey | 345 | 219 | 109 | |
| Meat, frozen and chilled | 180,171 | 208,605 | 191,575 | |
| Meat, canned | 2,149 | 2,686 | 2,593 | |
| Meat extract | 177 | 477 | 316 | |
| Other preserved meat | 745 | 766 | 572 | |
| Sausage casings | 11,995 | 11,056 | 10,584 | |
| Liver meal | 158 | 182 | 90 | |
| Cattle hides | 4,233 | 4,867 | 5,725 | |
| Horse hides | 11 | 17 | 14 | |
| Calfskins | 1,309 | 1,589 | 2,042 | |
| Deer skins | 116 | 157 | 299 | |
| Opossum skins | 795 | 362 | 411 | |
| Sheep skins and pelts | 23,699 | 24,483 | 31,235 | |
| Horse hair and other coarse animal hair | 22 | 13 | 19 | |
| Wool | 271,410 | 208,640 | 231,276 | |
| Inedible offals (including dried blood) | 2,158 | 2,102 | 1,938 | |
| Lard | 8 | 8 | 5 | |
| Edible tallow | 1,416 | 662 | 492 | |
| Edible stearine | 133 | 158 | 145 | |
| Inedible tallow | 5,712 | 6,364 | 5,964 | |
| Neatsfoot oil | 110 | 123 | 112 | |
| Live cattle | 10 | 134 | 247 | |
| Live sheep | 55 | 71 | 154 | |
| Live horses | 1,140 | 1,570 | 1,880 | |
| Other | 1,421 | 1,423 | 1,180 | |
| Totals | 678,985 | 675,564 | 682,965 | |
| Agricultural products— | ||||
| Apples | 4,937 | 6,010 | 6,638 | |
| Pears | 479 | 460 | 524 | |
| Hops | 1 | 25 | 135 | |
| Potatoes | 183 | 566 | 704 | |
| Onions | 512 | 235 | 197 | |
| Canned vegetables | 215 | 568 | 535 | |
| Frozen vegetables | 1,465 | 705 | 1,011 | |
| Peas, food | 574 | 641 | 544 | |
| Peas, seed | 1,004 | 960 | 1,055 | |
| Seeds, grass and clover | 3,456 | 2,013 | 3,244 | |
| Other seeds | 190 | 214 | 178 | |
| Other | 305 | 456 | 875 | |
| Totals | 13,320 | 12,853 | 15,640 | |
| Miscellaneous— | ||||
| Biscuits | 98 | 114 | 168 | |
| Ale, beer, stout | 213 | 277 | 310 | |
| Sugar | 28 | 10 | 8 | |
| Soups | 10 | 13 | 2 | |
| Infant and invalid food (cereal) | 135 | 124 | 117 | |
| Cigarettes | 115 | 125 | 135 | |
| Cut tobacco | 226 | 178 | 193 | |
| Textile waste | 369 | 325 | 338 | |
| Soaps | 111 | 96 | 198 | |
| Scrap metal | 913 | 1,077 | 1,673 | |
| Dairy machinery | 361 | 308 | 501 | |
| Chamois leather | 111 | 138 | 164 | |
| Vitamins and concentrates | - | - | 1 | |
| Other | 7,780 | 13,645 | 18,114 | |
| Totals | 10,470 | 16,432 | 21,926 | |
| Totals, New Zealand produce (excluding gold) | 728,409 | 733,660 | 751,009 | |
| Gold (excluded from above) | 212 | 189 | 122 | |
In the following table exports for the years ended June 1965 and 1966 are classified according to the Standard International Trade Classification (Revised).
| Exports, New Zealand Produce—Section and Division | Year Ended | |||
|---|---|---|---|---|
| June 1965x | June 1966* | |||
*Provisional. | ||||
| Section 0. Food and Live Animals | $(thousand) | |||
| Div. 00 Live animals | 1,810 | 2,317 | ||
| Div. 01 Meat and meat preparations | 212,534 | 195,056 | ||
| Div. 02 Dairy products and eggs | 180,968 | 173,610 | ||
| Div. 03 Fish and fish preparations | 5,052 | 5,424 | ||
| Div. 04 Cereals and cereal preparations | 333 | 383 | ||
| Div. 05 Fruit and vegetables | 10,717 | 12,069 | ||
| Div. 06 Sugar and sugar preparations | 1,314 | 1,314 | ||
| Div. 07 Coffee, tea, cocoa, spices, and manufactures thereof | 48 | 43 | ||
| Div. 08 Feeding stuff for animals (not including unmilled cereals) | 1,229 | 1,207 | ||
| Div. 09 Miscellaneous food preparations | 371 | 351 | ||
| Totals, Section 0 | 414,378 | 391,773 | ||
| Section 1. Beverages and Tobacco | ||||
| Div. 11 Beverages | 312 | 348 | ||
| Div. 12 Tobacco and tobacco manufactures | 345 | 340 | ||
| Totals, Section 1 | 658 | 688 | ||
| Section 2. Crude Materials, Inedible, Except Fuels | ||||
| Div. 21 Hides, skins, and fur skins, undressed | 31,700 | 39,746 | ||
| Div. 22 Oil seeds, oil nuts, and kernels | 80 | 46 | ||
| Div. 23 Crude rubber, including synthetic and reclaimed | - | - | ||
| Div. 24 Wood and cork | 6,038 | 6,265 | ||
| Div. 25 Pulp and waste paper | 4,775 | 6,003 | ||
| Div. 26 Textile fibres (not manufactured into yarn, thread, or fabrics) and waste | 209,134 | 231,848 | ||
| Div. 27 Crude fertilisers and crude minerals, excluding coal, petroleum, and precious stones | 132 | 114 | ||
| Div. 28 Metalliferous ores and metal scrap | 1,165 | 1,820 | ||
| Div. 29 Animal and vegetable crude materials, n.e.s. | 17,214 | 18,210 | ||
| Totals, Section 2 | 270,238 | 304,051 | ||
| Section 3. Mineral Fuels, Lubricants and Related Materials | ||||
| Div. 32 Coal, coke, and briquettes | 14 | - | ||
| Div. 33 Petroleum and petroleum products | 2,822 | 4,842 | ||
| Div. 34 Gas | - | - | ||
| Totals, Section 3 | 2,836 | 4,843 | ||
| Section 4. Animal and Vegetable Oils and Fats | ||||
| Div. 41 Animal oils and fats | 7,618 | 7,000 | ||
| Div. 42 Vegetable oils and fats, unprocessed | 1 | - | ||
| Div. 43 Animal and vegetable oils and fats processed | 57 | 33 | ||
| Totals, Section 4 | 7,676 | 7,033 | ||
| Section 5. Chemicals | $(thousand) | |||
| Div. 51 Chemical elements and compounds | 294 | 576 | ||
| Div. 52 Mineral tar and crude chemicals from coal, petroleum, and natural gas | - | - | ||
| Div. 53 Dyeing, tanning, and colouring materials | 62 | 54 | ||
| Div. 54 Medicinal and pharmaceutical products | 446 | 351 | ||
| Div. 55 Essential oils and perfume materials, toilet, polishing, and cleansing preparations | 216 | 328 | ||
| Div. 56 Fertilisers, manufactured | 30 | 20 | ||
| Div. 57 Explosives and pyrotechnic products | 9 | 14 | ||
| Div. 58 Plastic materials, regenerated cellulose, artificial resins | 146 | 153 | ||
| Div. 59 Miscellaneous chemical materials and products | 17,107 | 20,249 | ||
| Totals, Section 5 | 18,310 | 21,745 | ||
| Section 6. Manufactured Goods Classified Chiefly by Material | ||||
| Div. 61 Leather, leather manufactures n.e.i., and dressed furs | 308 | 371 | ||
| Div. 62 Rubber manufactures, n.e.s. | 313 | 330 | ||
| Div. 63 Wood and cork manufactures (excluding furniture) | 459 | 333 | ||
| Div. 64 Paper, paperboard, and manufactures thereof | 12,391 | 12,609 | ||
| Div. 65 Textile yarn, fabrics, made-up articles, and related products | 808 | 1,009 | ||
| Div. 66 Non-metallic mineral manufactures n.e.s. | 478 | 280 | ||
| Div. 67 Iron and steel | 19 | 29 | ||
| Div. 68 Non-ferrous metals | 790 | 1,185 | ||
| Div. 69 Manufactures of metal | 395 | 626 | ||
| Totals, Section 6 | 15,960 | 16,770 | ||
| Section 7. Machinery and Transport Equipment | ||||
| Div. 71 Machinery other than electric | 1,440 | 1,624 | ||
| Div. 72 Electric machinery, apparatus, and appliances | 498 | 590 | ||
| Div. 73 Transport equipment | 144 | 193 | ||
| Totals, Section 7 | 2,082 | 2,407 | ||
| Section 8. Miscellaneous Manufactured Articles | ||||
| Div. 81 Sanitary, plumbing, heating and lighting fixtures, and fittings | 37 | 28 | ||
| Div. 82 Furniture and fixtures | 76 | 45 | ||
| Div. 83 Travel goods, handbags, and similar articles | 6 | 8 | ||
| Div. 84 Clothing | 308 | 134 | ||
| Div. 85 Footwear | 95 | 75 | ||
| Div. 86 Professional, scientific and controlling instruments; photographic and optical goods, watches, and clocks | 44 | 97 | ||
| Div. 89 Miscellaneous manufactured articles n.e.s. | 923 | 1,067 | ||
| Totals, Section 8 | 1,489 | 1,455 | ||
| Section 9. Commodities and Transactions not Classified According to Kind | ||||
| Goods under $20 in value | 15 | 19 | ||
| Other | 20 | 224 | ||
| Totals Section 9 | 34 | 243 | ||
| Total New Zealand Produce Exports | 733,660 | 751,009 | ||
| Re-exports | 8,512 | 10,292 | ||
| Grand total, merchandise exports | 742,172 | 761,301 | ||
| Exports of gold (excluded from above) | 189 | 119 | ||
DESTINATION OF NEW ZEALAND EXPORTS—Since the 1850s the United Kingdom has been New Zealand's principal trading partner, replacing Australia, which took the bulk of the trade in the early days of settlement. The proportion of our exports going to the United Kingdom market in the years prior to the Second World War was between 70 and 80 percent of the total value of all exports. With the growing diversification of our markets in recent years the proportion of New Zealand's exports going to this market has fallen and by 1966 (June year) represented only 45 percent of the total value of exports to all countries.
Trade with the Commonwealth countries has always greatly exceeded that with foreign countries. During recent years, however, there has been a decline in the proportion of the export trade going to Commonwealth countries, occasioned mainly by the export of wool to European countries and meat to the United States of America. In 1948 Commonwealth countries took 80 percent of the total exports. By 1966 (June year) this proportion had fallen to 53 percent.
In recent years trade has been recorded with over 100 countries each year.
TOTAL EXPORTS TO INDIVIDUAL COUNTRIES—The following table gives exports (including re-exports but excluding gold and current coin) to each country for the latest June years.
| EXPORTS TO INDIVIDUAL COUNTRIES | ||||
|---|---|---|---|---|
| Country | June Year 1963 | June Year 1964 | June Year 1965x | June Year 1966* |
*Provisional. †Burma, Iceland and Jordan included in Sterling Area from 1964 onwards. ‡Federation of Malaya, North Borneo, Sarawak, and Singapore merged to form Malaysia, September 1963. Singapore independent from August 1965. §Federation of Rhodesia and Nyasaland shown separately as Zambia (Northern Rhodesia), Southern Rhodesia, and Malawi (Nyasaland) from 1965 onwards. ¶French Oceania and Society Islands shown as French Polynesia from 1964 onwards. ||Netherlands New Guinea included with Indonesia from 1964 onwards. | ||||
| Sterling Area | $(000) | $(000) | $(000) | $(000) |
| Aden Colony and Protectorate | 110 | 183 | 452 | 289 |
| Antarctic Stations (British) | - | - | - | 1 |
| Australia | 27,475 | 34,048 | 34,568 | 36,322 |
| Bahamas | 150 | 119 | 260 | 280 |
| Bahrein | - | - | 2 | - |
| Barbados | 792 | 676 | 1,064 | 903 |
| Bermuda | 503 | 603 | 677 | 957 |
| British Guiana | 292 | 246 | 216 | 112 |
| British Honduras | 15 | 3 | 4 | 6 |
| British Solomon Islands | 9 | 3 | 6 | 3 |
| Brunei | - | - | - | 3 |
| Burma | † | 169 | 229 | 206 |
| Ceylon | 762 | 644 | 595 | 721 |
| Cyprus | 415 | 849 | 1,178 | 1,285 |
| Enderbury-Canton | 3 | 1 | 2 | - |
| Falkland Islands | 4 | 5 | - | 2 |
| Fiji | 2,149 | 2,784 | 3,628 | 3,905 |
| Ghana | 433 | 375 | 250 | 291 |
| Gibraltar | - | 1 | - | - |
| Gilbert and Ellice Islands | 163 | 189 | 191 | 203 |
| Hong Kong | 1,206 | 1,511 | 1,500 | 1,576 |
| Iceland | † | - | 1 | - |
| India, including Sikkim, etc. | 2,601 | 1,115 | 1,417 | 2,118 |
| Ireland, Republic of | 585 | 922 | 597 | 653 |
| Jamaica | 3,548 | 2,477 | 3,499 | 3,369 |
| Jordan | † | 9 | - | 14 |
| Kenya | 167 | 160 | 205 | 155 |
| Kuwait | 8 | 34 | 57 | 49 |
| Leeward and Windward Islands | 271 | 215 | 278 | 194 |
| Malawi | § | § | - | 11 |
| Malaya, Federation of | 1,757 | ‡ | ‡ | ‡ |
| Malaysia | ‡ | 4,338 | 6,201 | 4,580 |
| Malta, including Gozo | - | 18 | 23 | 17 |
| Mauritius and Dependencies | 64 | 106 | 144 | 85 |
| Nauru | 270 | 250 | 293 | 286 |
| New Hebrides | 6 | 3 | 10 | 11 |
| Nigeria | 323 | 281 | 353 | 229 |
| Norfolk Island | 14 | 20 | 49 | 133 |
| North Borneo | 18 | ‡ | ‡ | ‡ |
| Pakistan | 196 | 364 | 216 | 472 |
| Papua, etc. | 410 | 128 | 264 | 307 |
| Pitcairn Island | 7 | 7 | 5 | 5 |
| Qatar and Trucial Sheikdoms | - | - | 28 | 1 |
| Rhodesia and Nyasaland | 139 | 340 | § | § |
| Ross Dependency | - | 1 | - | - |
| Sarawak | 7 | ‡ | ‡ | ‡ |
| St. Helena, Ascension, etc. | - | - | 1 | - |
| Seychelles | - | - | 1 | 1 |
| Sierra Leone | - | - | 3 | - |
| Singapore | 1,598 | ‡ | ‡ | 3,228 |
| South Africa and S.W. Africa | 1,625 | 2,703 | 5,378 | 9,106 |
| Southern Rhodesia | § | § | 217 | 130 |
| Tanzania | 3 | 1 | 13 | 89 |
| Tonga | 370 | 463 | 501 | 651 |
| Trinidad and Tobago | 3,174 | 2,523 | 3,669 | 2,965 |
| Uganda | 5 | 1 | 1 | 4 |
| United Kingdom | 296,449 | 347,811 | 374,802 | 336,702 |
| Western Samoa | 1,771 | 1,900 | 1,735 | 1,748 |
| Zambia | § | § | 12 | 109 |
| Totals, sterling countries | 349,867 | 408,600 | 444,797 | 414,487 |
| E.F.T.A. (Excluding U.K.) | ||||
| Austria | 2 | 4 | 102 | 10 |
| Denmark | 1,020 | 1,706 | 1,761 | 1,926 |
| Norway | 473 | 973 | 962 | 566 |
| Portugal | 1,167 | 2,729 | 2,574 | 1,887 |
| Sweden | 1,526 | 2,595 | 3,062 | 3,158 |
| Switzerland and Liechtenstein | 168 | 161 | 176 | 529 |
| Totals, E.F.T.A. countries | 4,355 | 8,168 | 8,636 | 8,077 |
| E.E.C. | ||||
| Belgium and Luxembourg | 16,738 | 22,934 | 24,086 | 21,094 |
| France and Monaco | 41,053 | 46,927 | 33,942 | 40,304 |
| Germany, West | 22,398 | 28,267 | 29,791 | 25,828 |
| Italy and San Marino | 19,236 | 25,127 | 18,083 | 19,794 |
| Netherlands | 10,341 | 13,291 | 13,490 | 10,473 |
| Totals, E.E.C. countries | 109,767 | 136,546 | 119,393 | 117,493 |
| Dollar Countries | ||||
| American Samoa | 523 | 650 | 604 | 681 |
| Antarctic Territories (U.S.) | 524 | 9 | - | 5 |
| Canada | 9,029 | 8,795 | 10,558 | 9,554 |
| Colombia | 52 | - | - | 6 |
| Ecuador | - | 1 | 5 | - |
| El Salvador | - | - | - | - |
| Dollar Countries | $(000) | $(000) | $(000) | $(000) |
| Guam | 283 | 615 | 471 | 646 |
| Haiti | 34 | 9 | 32 | 12 |
| Liberia | - | - | - | 2 |
| Mexico | 262 | 339 | 581 | 492 |
| Panama Canal Zone | 30 | 34 | 22 | 36 |
| Panama Republic | 571 | 492 | 686 | 545 |
| Philippines | 1,307 | 2,007 | 3,685 | 3,912 |
| Puerto Rico, etc. | 42 | 67 | 2 | 97 |
| Ryukus Islands, etc. | 136 | 130 | 50 | 48 |
| U.S. Trust Territories in Pacific | 3 | 30 | 8 | 8 |
| United States of America (including Alaska and Hawaii) | 107,764 | 110,705 | 93,371 | 106,111 |
| Venezuela | 170 | 34 | 101 | 101 |
| Totals, dollar countries | 120,728 | 123,916 | 110,176 | 122,257 |
| Other Countries | ||||
| Afghanistan | - | - | 21 | 5 |
| Albania | - | - | - | - |
| Algeria | - | 1 | - | - |
| Angola, including Cabinda | 2 | - | - | - |
| Argentina | 15 | 20 | 40 | 164 |
| Brazil | - | 16 | - | 31 |
| Bulgaria | - | 161 | - | 677 |
| Burundi | - | - | - | 2 |
| Burma | 332 | † | † | † |
| Cambodia | 2 | - | - | - |
| Cameroon | - | - | 2 | - |
| Canary Islands | 3 | 29 | 15 | 10 |
| Cape Verde Islands | 15 | - | - | - |
| Chile | 38 | 52 | 482 | 1,029 |
| China | 3,050 | 5,602 | 3,182 | 6,267 |
| Congo (Leopoldville) | 21 | - | - | - |
| Czechoslovakia | 268 | 2,062 | 691 | 995 |
| Ethiopia and Eritrea | - | - | 2 | 5 |
| Finland | 221 | 169 | 363 | 389 |
| Formosa | 21 | 46 | 159 | 330 |
| French Guiana | - | 3 | 4 | 27 |
| French Oceania | 16 | ∂ | ∂ | ∂ |
| French Polynesia | ∂ | 659 | 950 | 1,934 |
| French West Indies | 53 | 62 | 378 | 179 |
| Germany, East | 215 | 371 | 690 | 895 |
| Greece | 983 | 3,481 | 2,753 | 3,697 |
| Hungary | 75 | 184 | 164 | 172 |
| Iceland | - | † | † | † |
| Indonesia | 19 | 7 | 7 | 139 |
| Iran | 8 | 11 | 77 | 220 |
| Iraq | 4 | 5 | - | 7 |
| Israel | 80 | 26 | 20 | 724 |
| Japan | 25,534 | 32,303 | 33,300 | 56,452 |
| Jordan | 244 | † | † | † |
| Korea, Republic of | 428 | 310 | 76 | 449 |
| Laos | - | - | - | 2 |
| Lebanon | 14 | 4 | 10 | 17 |
| Mauritania | - | - | - | 1 |
| Morocco | 45 | 29 | 56 | 24 |
| Mozambique | 166 | 115 | 287 | 278 |
| Nepal | 1 | 1 | - | - |
| Netherlands Antilles | 557 | 414 | 809 | 694 |
| Netherlands New Guinea | 2 | || | || | || |
| New Caledonia | 126 | 150 | 414 | 359 |
| North Korea | - | - | 2 | - |
| North Vietnam | 15 | 37 | 10 | 33 |
| Peru | 1,853 | 527 | 2,132 | 1,862 |
| Poland | 1,993 | 3,016 | 1,413 | 1,445 |
| Rumania | - | - | 57 | - |
| Rwanda | - | - | - | 1 |
| Saudi Arabia | 13 | 6 | 1 | 29 |
| Senegal | - | 10 | - | 4 |
| Society Islands | 506 | ∂ | ∂ | ∂ |
| Somalia | 1 | 3 | 5 | - |
| South Vietnam | 13 | 9 | 8 | 4 |
| Spain | 2,251 | 2,786 | 1,802 | 3,439 |
| Sudan | 35 | 4 | 70 | 7 |
| Surinam | - | 1 | 7 | 6 |
| Syria | 1 | - | 22 | - |
| Thailand | 78 | 71 | 144 | 540 |
| Turkey | 30 | 20 | 17 | |
| United Arab Republic | 415 | 585 | 193 | 303 |
| U.S.S.R. | 170 | 2,096 | 2,929 | 5,895 |
| Uruguay | 21 | 12 | 50 | 21 |
| Yemen | - | - | - | 1 |
| Yugoslavia | 216 | 1,409 | 1,099 | 780 |
| Totals, other countries | 40,167 | 56,883 | 54,594 | 90,563 |
| Totals, all countries | 624,884 | 734,113 | 737,596 | 752,876 |
| Ships' stores | 2,556 | 2,585 | 3,282 | 4,141 |
| Passengers | 109 | 554 | 1,294 | 1,531 |
| Destination optional | - | - | - | 2,753 |
| Grand totals | 627,549 | 737,253 | 742,172 | 761,301 |
The table which follows shows for each of the last 10 years the percentage of total exports (excluding gold, current coin, and ships' stores) taken by each of the principal countries trading with New Zealand.
| Country | 1957 | 1958 | 1959 | 1960 | 1961 | Jan-June 1962 | June Year 1963 | June Year 1964 | June Year 1965x | June Year 1966* |
|---|---|---|---|---|---|---|---|---|---|---|
*Provisional. †Included with U.S.A. | ||||||||||
| STERLING | percent | |||||||||
| Australia | 3.56 | 4.03 | 3.62 | 4.35 | 3.79 | 3.23 | 4.40 | 4.64 | 4.69 | 4.82 |
| Fiji | 0.38 | 0.42 | 0.39 | 0.37 | 0.39 | 0.32 | 0.34 | 0.38 | 0.49 | 0.52 |
| India | 0.59 | 0.30 | 0.23 | 0.34 | 0.33 | 0.29 | 0.42 | 0.15 | 0.19 | 0.28 |
| Jamaica | 0.40 | 0.49 | 0.54 | 0.52 | 0.42 | 0.44 | 0.57 | 0.34 | 0.47 | 0.45 |
| Trinidad and Tobago | 0.28 | 0.31 | 0.40 | 0.35 | 0.45 | 0.29 | 0.51 | 0.34 | 0.50 | 0.39 |
| United Kingdom | 58.85 | 55.83 | 56.63 | 53.14 | 51.07 | 49.54 | 47.44 | 47.38 | 50.81 | 44.72 |
| Western Samoa | 0.17 | 0.30 | 0.28 | 0.26 | 0.27 | 0.22 | 0.28 | 0.26 | 0.24 | 0.23 |
| Other | 0.99 | 1.34 | 1.38 | 1.51 | 1.75 | 1.54 | 2.03 | 2.15 | 2.91 | 3.63 |
| Totals, sterling countries | 65.22 | 63.01 | 63.48 | 60.85 | 58.46 | 55.86 | 55.99 | 55.63 | 60.30 | 55.05 |
| E.F.T.A. (excluding U.K.) | ||||||||||
| Austria | 0.02 | - | 0.01 | - | - | - | - | - | 0.01 | - |
| Denmark | 0.19 | 0.21 | 0.14 | 0.17 | 0.21 | 0.22 | 0.16 | 0.23 | 0.24 | 0.26 |
| Norway | 0.02 | 0.02 | 0.05 | 0.04 | 0.08 | 0.07 | 0.08 | 0.13 | 0.13 | 0.08 |
| Portugal | 0.07 | 0.15 | 0.13 | 0.18 | 0.18 | 0.36 | 0.19 | 0.37 | 0.35 | 0.25 |
| Sweden | 0.19 | 0.28 | 0.24 | 0.27 | 0.28 | 0.37 | 0.24 | 0.35 | 0.42 | 0.42 |
| Switzerland | 0.03 | 0.02 | 0.01 | 0.01 | 0.01 | 0.02 | 0.03 | 0.02 | 0.02 | 0.07 |
| Totals, E.F.T.A. countries | 0.52 | 0.70 | 0.58 | 0.66 | 0.76 | 1.04 | 0.70 | 1.11 | 1.17 | 1.07 |
| E.E.C. | ||||||||||
| Belgium and Luxembourg | 2.29 | 1.81 | 1.78 | 2.54 | 2.93 | 4.05 | 2.68 | 3.12 | 3.27 | 2.80 |
| France | 7.88 | 5.89 | 5.89 | 6.72 | 6.17 | 7.47 | 6.57 | 6.39 | 4.60 | 5.35 |
| Germany, West | 4.45 | 2.82 | 3.31 | 3.53 | 2.84 | 3.76 | 3.58 | 3.85. | 4.04 | 3.43 |
| Italy | 2.26 | 2.50 | 2.05 | 2.51 | 2.39 | 3.75 | 3.08 | 3.43 | 2.45 | 2.63 |
| Netherlands | 1.48 | 1.20 | 1.43 | 1.38 | 1.41 | 1.62 | 1.66 | 1.81 | 1.83 | 1.39 |
| Totals, E.E.C. countries | 18.36 | 14.22 | 14.47 | 16.69 | 15.75 | 20.64 | 17.57 | 18.60 | 16.19 | 15.61 |
| DOLLAR | ||||||||||
| Canada | 1.61 | 1.63 | 1.04 | 1.21 | 1.33 | 1.48 | 1.45 | 1.20 | 1.43 | 1.27 |
| Hawaii | 0.13 | 0.29 | 0.31 | 0.36 | 0.41 | 0.25 | 0.42 | 0.36 | 0.39 | † |
| Philippines | 0.18 | 0.09 | 0.09 | 0.20 | 0.29 | 0.21 | 0.21 | 0.27 | 0.50 | 0.52 |
| U.S.A. | 7.89 | 14.63 | 14.72 | 12.76 | 14.54 | 13.99 | 16.78 | 14.70 | 12.27 | 14.09 |
| Other | 0.23 | 0.25 | 0.31 | 0.43 | 0.31 | 0.35 | 0.46 | 0.35 | 0.35 | 0.36 |
| Totals, dollar countries | 10.04 | 16.88 | 16.48 | 14.95 | 16.88 | 16.28 | 19.32 | 16.88 | 14.94 | 16.24 |
| OTHER | ||||||||||
| China | 0.22 | 0.39 | 0.85 | 0.77 | 0.47 | 0.30 | 0.49 | 0.76 | 0.43 | 0.83 |
| Czechoslovakia | 0.35 | 0.40 | 0.47 | 0.58 | 0.53 | 0.27 | 0.04 | 0.28 | 0.10 | 0.13 |
| Egypt | 0.03 | 0.13 | 0.06 | 0.09 | 0.10 | 0.07 | 0.07 | 0.08 | 0.03 | 0.04 |
| Japan | 2.84 | 2.21 | 2.29 | 2.96 | 5.26 | 3.39 | 4.09 | 4.40 | 4.34 | 7.50 |
| Poland | 1.09 | 1.01 | 0.43 | 0.79 | 0.34 | 0.67 | 0.32 | 6.41 | 0.33 | 0.19 |
| U.S.S.R. | 0.97 | 0.28 | 0.05 | 0.83 | 0.54 | 0.49 | 0.03 | 0.29 | 0.40 | 0.78 |
| Other | 0.37 | 0.77 | 0.84 | 0.85 | 0.91 | 0.99 | 1.40 | 1.55 | 1.79 | 2.55 |
| Totals, other countries | 5.87 | 5.19 | 4.98 | 6.85 | 8.15 | 6.18 | 6.43 | 7.77 | 7.40 | 12.03 |
| Grand totals | 100.00 | 100.00 | 100.00 | 100.00 | 100.00 | 100.00 | 100.00 | 100.00 | 100.00 | 100.00 |
The principal destinations of New Zealand's exports of merchandise (including re-exports) during the; last 21 years are given in the table below. The nomenclature used in this and subsequent tables in regard to the countries of destination refers generally to status and territories in the years indicated and not necessarily to the present position.
| Year | United Kingdom | Canada | Australia | France | West Germany | United States of America | Other Countries* | Total Merchandise Exports |
|---|---|---|---|---|---|---|---|---|
*Including ships' stores and passengers' duty free stores. †Provisional. ‡Including Alaska and Hawaii. §Including exports for which the final country of destination is not yet known. | ||||||||
| $(thousand) | ||||||||
| 1946 | 141,844 | 5,606 | 4,910 | 6,930 | 3,278 | 19,424 | 18,240 | 200,234 |
| 1947 | 197,362 | 6,120 | 6,604 | 8,894 | 156 | 15,902 | 21,730 | 256,768 |
| 1948 | 215,816 | 5,982 | 6,778 | 16,616 | 5,450 | 14,470 | 29,310 | 294,424 |
| 1949 | 215,410 | 4,392 | 6,284 | 15,316 | 5,988 | 11,024 | 34,936 | 293,346 |
| 1950 | 243,362 | 7,114 | 6,946 | 16,154 | 11,878 | 36,774 | 42,656 | 364,882 |
| 1951 | 284,722 | 17,130 | 8,540 | 35,708 | 17,672 | 57,718 | 73,078 | 494,566 |
| 1952 | 312,892 | 10,424 | 6,548 | 20,912 | 10,454 | 54,534 | 63,760 | 479,524 |
| 1953 | 315,836 | 5,916 | 8,722 | 31,190 | 12,168 | 36,758 | 60,106 | 470,694 |
| 1954 | 326,386 | 5,994 | 12,130 | 29,350 | 20,982 | 27,792 | 65,326 | 487,958 |
| 1955 | 339,286 | 8,460 | 12,890 | 30,574 | 25,376 | 30,200 | 71,270 | 518,056 |
| 1956 | 357,510 | 8,052 | 16,376 | 33,522 | 20,806 | 39,016 | 79,196 | 554,478 |
| 1957 | 324,262 | 8,870 | 19,604 | 43,394 | 24,520 | 43,460 | 88,408 | 552,516 |
| 1958 | 278,210 | 8,132 | 20,068 | 29,360 | 14,056 | 72,898 | 77,158 | 499,880 |
| June Year | ||||||||
| 1959 | 286,602 | 6,728 | 19,294 | 28,626 | 15,988 | 89,254 | 74,502 | 520,994 |
| 1960 | 343,054 | 7,252 | 24,064 | 42,350 | 23,030 | 77,244 | 111,786 | 628,780 |
| 1961 | 296,106 | 7,370 | 24,868 | 34,626 | 15,460 | 78,318 | 103,966 | 560,712 |
| 1962 | 287,300 | 7,576 | 21,270 | 36,946 | 19,896 | 83,944 | 125,572 | 582,502 |
| 1963 | 296,450 | 9,030 | 27,476 | 41,052 | 22,398 | 104,882 | 126,262 | 627,550 |
| 1964 | 347,812 | 8,796 | 34,048 | 46,926 | 28,266 | 107,910 | 163,494 | 737,252 |
| 1965x | 374,802 | 10,558 | 34,568 | 33,942 | 29,791 | 90,514 | 167,996 | 742,172 |
| 1966† | 336,702 | 9,554 | 36,322 | 40,304 | 25,828 | 106,111‡ | 206,480§ | 761,301 |
The statistics quoted in the foregoing table indicate the destination of New Zealand exports as recorded on the Customs documents; In some instances the ultimate destination of exports is not known at the time of export, such goods being entered as exported to the country to which they are being shipped. This applies more particularly to wool, considerable quantities of which are shipped to the United Kingdom, and, in normal times subsequently re-exported to the Continent. It should be observed, however, that in all instances where the final destination is known at the time of export, the exports are credited to that destination in the New Zealand trade statistics. It is possible of course that the destination of goods may be changed while in transit; and this, in fact, happens occasionally. In such cases the actual destination will be different from that to which the goods have, been credited in the statistics; however, it is quite impossible to keep a record of all movements of this nature.
A further point of some importance is the fact that an appreciable quantity of wool is exported on an “optional” basis—United Kingdom, option Continent In these cases, however, subsequent information is received as to the actual destination of the goods, and the entries are amended.
It will be realised, therefore, that the actual final destinations of New Zealand exports may vady appreciably from the classification shown in the table. For these reasons it is probable, that exports to Continental countries are normally somewhat higher than the figures indicate; conversely, exports to the United Kingdom for retention in that country are lower than the totals quoted in the table.
In the following table figures are given for the value of New Zealand's export trade to European countries. This table shows the importance of wool as the chief commodity in New Zealand's trade with Europe.
| Country | 1961 | 1962 | June Year | |||
|---|---|---|---|---|---|---|
| 1963 | 1964 | 1965x | 1966* | |||
*Provisional. †Included in U.S.S.R. | ||||||
| $(000) | ||||||
| Austria | 16 | 11 | 2 | 4 | 102 | 10 |
| Belgium | 16,534 | 17,798 | 16,738 | 22,934 | 24,086 | 21,094 |
| Bulgaria | - | - | - | 161 | - | 677 |
| Czechoslovakia | 2,974 | 1,108 | 268 | 2,062 | 691 | 995 |
| Denmark | 1,161 | 1,163 | 1,020 | 1,706 | 1,761 | 1,926 |
| Lithuania | 825 | - | - | † | † | † |
| Finland | 325 | 362 | 221 | 169 | 363 | 389 |
| France | 34,780 | 35,583 | 41,053 | 46,927 | 33,942 | 40,304 |
| Germany, West | 16,040 | 18,265 | 22,398 | 28,267 | 29,791 | 25,828 |
| Germany, East | 27 | 150 | 215 | 371 | 690 | 895 |
| Greece | 795 | 771 | 983 | 3,481 | 2,753 | 3,697 |
| Hungary | - | 55 | 75 | 184 | 164 | 172 |
| Italy | 13,503 | 18,946 | 19,236 | 25,127 | 18,083 | 19,794 |
| Netherlands | 7,941 | 8,472 | 10,341 | 13,291 | 13,490 | 10,473 |
| Norway | 441 | 337 | 473 | 973 | 962 | 566 |
| Poland | 1,933 | 2,961 | 1,993 | 3,016 | 2,413 | 1,445 |
| Portugal | 1,010 | 1,429 | 1,167 | 2,729 | 2,574 | 1,887 |
| Spain | 128 | 1,620 | 2,251 | 2,786 | 1,802 | 3,439 |
| Sweden | 1,580 | 1,726 | 1,526 | 2,595 | 3,062 | 3,158 |
| Switzerland | 79 | 194 | 168 | 161 | 176 | 529 |
| Turkey | 13 | 25 | 30 | 20 | - | 17 |
| U.S.S.R. | 3,040 | 1,788 | 170 | 2,096 | 2,929 | 5,895 |
| Yugoslavia | 80 | 105 | 216 | 1,409 | 1,099 | 780 |
| Totals | 103,224 | 112,870 | 120,545 | 160,468 | 140,933 | 143,971 |
| Percent | ||||||
Percentage of total New Zealand exports taken by European countries | 18.17 | 19.16 | 19.21 | 21.77 | 18.99 | 18.91 |
| Value $(000) | ||||||
Value of wool exported to European countries | 86,636 | 91,572 | 98,963 | 129,923 | 102,841 | 104,572 |
| Percent | ||||||
Percentage of wool exports to total exports to European countries (value basis) | 83.93 | 81.13 | 82.10 | 80.96 | 72.97 | 72.63 |
Percentage of total New Zealand wool exports taken by European countries (value basis) | 43.18 | 47.44 | 46.16 | 47.87 | 49.29 | 45.22 |
DESTINATION OF MAIN EXPORTS—The table which follows shows quantities and values of the principal exports of New Zealand produce sent to various destinations during the June years 1963, 1964, and 1965.
| Country to Which Exported | June Year 1963 | June Year 1964 | June Year 1965 | |||
|---|---|---|---|---|---|---|
| Quantity | Value | Quantity | Value | Quantity | Value | |
*Malaysia includes states of Malaya, Singapore, Sarawak, and Sabah. †French Oceania and Society Islands. ‡Includes northern and southern Rhodesia and Nyasaland. | ||||||
| Wool (Greasy, Slipe, and Scoured) | ||||||
| 1b(000) | $(000) | lb(000) | $(000) | lb(000) | $(000) | |
| Australia | 6,094 | 2,545 | 4,695 | 2,270 | 3,893 | 1,896 |
| Belgium | 41,503 | 14,554 | 43,574 | 20,362 | 54,700 | 19,999 |
| Canada | 3,590 | 1,443 | 4,463 | 2,381 | 6,944 | 3,116 |
| China | 3,903 | 1,644 | 6,786 | 3,738 | 5,745 | 2,459 |
| Czechoslovakia | 693 | 207 | 4,077 | 1,905 | 1,862 | 686 |
| Denmark | 1,627 | 777 | 2,425 | 1,416 | 2,605 | 1,365 |
| Egypt | 1,003 | 386 | 1,063 | 568 | 324 | 171 |
| Finland | 139 | 62 | 196 | 111 | 230 | 117 |
| France | 103,117 | 38,099 | 89,097 | 43,293 | 79,571 | 29,540 |
| Germany, East | 530 | 200 | 746 | 371 | 1,775 | 683 |
| Germany, West | 41,972 | 16,535 | 40,170 | 20,585 | 43,613 | 18,696 |
| Greece | 999 | 467 | 1,101 | 629 | 2,182 | 1,186 |
| India | 4,152 | 1,662 | 162 | 86 | 143 | 76 |
| Ireland, Republic of | 839 | 315 | 1,102 | 552 | 663 | 278 |
| Italy | 39,163 | 14,721 | 38,752 | 18,930 | 30,339 | 12,126 |
| Japan | 33,531 | 13,663 | 32,251 | 15,885 | 32,332 | 13,923 |
| Mexico | 682 | 216 | 589 | 256 | 1,029 | 354 |
| Netherlands | 20,670 | 7,478 | 18,886 | 8,866 | 18,423 | 6,825 |
| Norway | 590 | 293 | 1,205 | 732 | 1,214 | 667 |
| Poland | 4,609 | 1,843 | 5,174 | 2,723 | 4,987 | 2,010 |
| Portugal | 3,045 | 1,157 | 5,573 | 2,719 | 6,679 | 2,549 |
| South Africa | 1,432 | 591 | 1,430 | 765 | 1,473 | 766 |
| Spain | 3,949 | 1,249 | 4,413 | 1,970 | 2,296 | 829 |
| Sweden | 2,545 | 1,132 | 3,594 | 2,023 | 3,838 | 1,948 |
| Switzerland | 287 | 114 | 241 | 113 | 49 | 23 |
| United Kingdom | 154,651 | 58,051 | 161,840 | 77,180 | 130,200 | 49,875 |
| United States of America | 100,584 | 34,740 | 85,086 | 37,679 | 84,724 | 32,705 |
| Other countries | 634 | 240 | 6,219 | 3,302 | 9,618 | 3,772 |
| Totals | 576,534 | 214,383 | 564,910 | 271,410 | 531,450 | 208,640 |
| Frozen and Chilled Beef and Veal | ||||||
| lb(000) | $(000) | lb(000) | $(000) | lb(000) | $(000) | |
| Aden Colony and Prot. | 280 | 47 | 471 | 86 | 481 | 111 |
| Alaska | 1,085 | 243 | 738 | 158 | - | - |
| American Samoa | 220 | 44 | 183 | 44 | 203 | 51 |
| Bahamas | 242 | 49 | 221 | 44 | 208 | 45 |
| Barbados | 2,344 | 333 | 1,713 | 275 | 2,555 | 507 |
| Belgium | 1,593 | 187 | 460 | 86 | 3,503 | 592 |
| Bermuda | 471 | 172 | 652 | 226 | 698 | 260 |
| Canada | 11,457 | 2,261 | 5,696 | 1,305 | 4,213 | 1,004 |
| Cyprus | 794 | 141 | 2,011 | 439 | 2,868 | 655 |
| Fiji | 79 | 20 | 146 | 34 | 136 | 36 |
| France | 19 | 3 | 869 | 217 | 3,867 | 852 |
| French Polynesia† | 719 | 174 | 1,070 | 307 | 1,529 | 507 |
| Germany, West | 473 | 60 | 1,555 | 255 | 16,611 | 2,883 |
| Ghana | 28 | 9 | 113 | 25 | 73 | 15 |
| Greece | 1,608 | 203 | 5,161 | 1,011 | 4,515 | 1,020 |
| Guam | 1,177 | 254 | 2,328 | 568 | 1,706 | 442 |
| Hawaii | 8,314 | 2,013 | 7,367 | 1,926 | 7,356 | 1,930 |
| Hong Kong | 373 | 93 | 423 | 182 | 576 | 269 |
| Italy | 688 | 96 | 5,362 | 969 | 2,301 | 470 |
| Jamaica | 2,449 | 396 | 1,609 | 296 | 2,347 | 437 |
| Japan | 3,362 | 473 | 1,815 | 261 | 2,252 | 345 |
| Leeward and Windward Islands | 343 | 66 | 255 | 52 | 362 | 87 |
| Malaysia* | 1,183 | 254 | 1,692 | 437 | 4,082 | 1,006 |
| Netherlands | 229 | 28 | 2,282 | 429 | 6,429 | 1,348 |
| Netherlands Antilles | 1,642 | 315 | 1,031 | 208 | 2,256 | 488 |
| Nigeria | 142 | 39 | 191 | 57 | 211 | 68 |
| Philippines | 196 | 43 | 547 | 122 | 931 | 276 |
| Puerto Rico | - | - | 244 | 65 | 1 | 1 |
| Ryukyu Islands | 526 | 132 | 423 | 111 | 158 | 48 |
| Sweden | - | - | 234 | 65 | 1,264 | 329 |
| Tonga | 111 | 18 | 89 | 17 | 51 | 11 |
| Trinidad and Tobago | 3,962 | 754 | 2,990 | 611 | 4,206 | 966 |
| United Kingdom | 13,343 | 1,821 | 20,616 | 3,792 | 61,940 | 11,929 |
| United States of America | 223,922 | 47,985 | 196,175 | 43,300 | 124,158 | 27,704 |
| U.S.A. Pacific Trust Territories | 8 | 3 | 106 | 29 | 21 | 6 |
| Western Samoa | 103 | 17 | 75 | 13 | 78 | 16 |
| Other countries | 424 | 94 | 285 | 66 | 3,479 | 698 |
| Totals | 283,905 | 58,838 | 267,194 | 58,088 | 267,625 | 57,409 |
| Frozen Lamb and Mutton | ||||||
| lb(000) | $(000) | lb(000) | $(000) | lb(000) | $(000) | |
| Barbados | 245 | 35 | 223 | 30 | 414 | 65 |
| Belgium | 1,246 | 94 | 1,039 | 89 | 883 | 104 |
| Bulgaria | - | - | 551 | 42 | - | - |
| Bermuda | 415 | 89 | 442 | 95 | 498 | 127 |
| Canada | 15,909 | 2,064 | 8,286 | 1,178 | 15,410 | 2,490 |
| Cyprus | 1,003 | 134 | 1,588 | 232 | 1,920 | 319 |
| Czechoslovakia | 1,151 | 61 | 2,097 | 157 | - | - |
| Denmark | 332 | 38 | 335 | 42 | 400 | 60 |
| Egypt | 24 | 3 | 20 | 3 | 5 | 1 |
| Fiji | 1,768 | 146 | 2,551 | 236 | 2,537 | 301 |
| France | 290 | 17 | 373 | 32 | 606 | 65 |
| French West Indies | 185 | 33 | 295 | 49 | 728 | 138 |
| Germany, West | 6,807 | 390 | 8,276 | 668 | 10,669 | 1,087 |
| Ghana | 2,523 | 145 | 3,168 | 200 | 1,745 | 153 |
| Greece | 4,146 | 225 | 20,467 | 1,807 | 3,919 | 384 |
| Hawaii | 374 | 53 | 339 | 53 | 276 | 53 |
| Hong Kong | 574 | 75 | 516 | 70 | 301 | 51 |
| Hungary | - | - | 1,680 | 137 | 1,062 | 86 |
| Italy | 253 | 30 | 941 | 149 | 711 | 129 |
| Jamaica | 841 | 86 | 549 | 56 | 850 | 110 |
| Japan | 68,585 | 4,144 | 93,405 | 6,213 | 66,451 | 5,981 |
| Jordan | 3,831 | 231 | - | - | - | - |
| Malaysia* | 1,759 | 227 | 2,699 | 331 | 2,479 | 354 |
| Mozambique | - | - | 224 | 32 | 313 | 51 |
| Netherlands | 774 | 55 | 1,560 | 139 | 1,180 | 184 |
| Nigeria | 837 | 90 | 360 | 59 | 307 | 56 |
| Norway | 498 | 37 | 680 | 55 | 554 | 56 |
| Papua and New Guinea | 309 | 33 | 231 | 26 | 180 | 24 |
| Peru | 1,329 | 84 | 737 | 58 | 694 | 60 |
| Philippines | 98 | 15 | 127 | 21 | 160 | 30 |
| Rhodesia and Nyasaland | 112 | 16 | 214 | 30 | 36 | 5 |
| Sweden | 417 | 44 | 513 | 78 | 451 | 109 |
| Tonga | 892 | 39 | 1,002 | 63 | 846 | 87 |
| Trinidad and Tobago | 1,728 | 162 | 1,304 | 129 | 1,359 | 178 |
| U.S.S.R. | 2,900 | 170 | - | - | 2,807 | 285 |
| United Kingdom | 650,795 | 86,681 | 642 372 | 92,458 | 676,013 | 119,984 |
| United States of America | 14,583 | 2,190 | 11,564 | 1,933 | 8,078 | 1,459 |
| Western Samoa | 1,320 | 105 | 1,520 | 118 | 1,081 | 78 |
| Other countries | 1,428 | 184 | 1,145 | 181 | 1,426 | 268 |
| Totals | 790,281 | 98,222 | 813,490 | 107,249 | 807,849 | 134,972 |
| Frozen Pork | ||||||
| lb(000) | $(000) | lb(000) | $(000) | lb(000) | $(000) | |
| Aden | 135 | 32 | 129 | 31 | 255 | 64 |
| Australia | 4,272 | 843 | 5,784 | 1,255 | 2,793 | 636 |
| Belgium | 415 | 85 | 471 | 97 | 466 | 96 |
| Cyprus | 85 | 18 | 228 | 39 | 227 | 46 |
| Fiji | 132 | 24 | 168 | 35 | 199 | 48 |
| France | - | - | 162 | 25 | 347 | 86 |
| Hawaii | 65 | 14 | 34 | 8 | 1 | 1 |
| Hong Kong | 290 | 56 | 480 | 101 | 207 | 47 |
| Jamaica | 71 | 11 | 4 | 1 | 7 | 1 |
| Japan | 6 | 1 | 423 | 92 | 27 | 8 |
| Malaysia* | 797 | 162 | 743 | 156 | 828 | 203 |
| Nauru | 151 | 31 | 125 | 26 | 137 | 34 |
| Netherlands | - | - | 96 | 22 | 212 | 46 |
| Netherlands Antilles | 54 | 11 | 50 | 8 | 40 | 7 |
| New Caledonia | 48 | 10 | 102 | 22 | 188 | 47 |
| Papua | 250 | 74 | 237 | 74 | 134 | 47 |
| South Africa | - | - | 673 | 126 | - | - |
| Trinidad and Tobago | 1,335 | 265 | 1,066 | 215 | 1,195 | 277 |
| United Kingdom | 1,435 | 266 | 1,073 | 195 | 397 | 65 |
| Other countries | 438 | 81 | 446 | 95 | 681 | 173 |
| Totals | 9,978 | 1,983 | 12,494 | 2,623 | 8,341 | 1,932 |
| Other Frozen Meat | ||||||
| lb(000) | $(000) | lb(000) | $(000) | lb(000) | $(000) | |
| Belgium | 265 | 45 | 347 | 58 | 223 | 42 |
| Canada | 571 | 121 | 735 | 193 | 367 | 114 |
| Cyprus | 214 | 43 | 317 | 59 | 452 | 78 |
| Fiji | 127 | 18 | 198 | 31 | 358 | 50 |
| France | 1,596 | 232 | 3,293 | 605 | 3,769 | 909 |
| Germany, West | 800 | 201 | 1,317 | 354 | 4,127 | 1,454 |
| Hawaii | 220 | 39 | 96 | 20 | 34 | 10 |
| Hong Kong | 434 | 54 | 219 | 28 | 141 | 22 |
| Italy | 529 | 40 | 1,172 | 72 | 941 | 80 |
| Jamaica | 1,597 | 183 | 1,329 | 165 | 1,327 | 181 |
| Japan | 233 | 30 | 352 | 42 | 324 | 39 |
| Malaysia* | 1,152 | 146 | 692 | 112 | 623 | 11 |
| Netherlands | 241 | 58 | 1,553 | 402 | 3,293 | 1,101 |
| Netherlands Antilles | 323 | 46 | 288 | 38 | 464 | 67 |
| Peru | 165 | 7 | 44 | 2 | - | - |
| Philippines | 79 | 8 | 229 | 26 | 78 | 11 |
| Trinidad and Tobago | 469 | 64 | 472 | 67 | 633 | 91 |
| United Kingdom | 41,708 | 8,484 | 43,812 | 9,133 | 45,638 | 10,509 |
| United States of America | 1,801 | 535 | 1,435 | 485 | 865 | 316 |
| Western Samoa | 244 | 19 | 331 | 24 | 289 | 19 |
| Other countries | 1,082 | 120 | 1,043 | 155 | 1,797 | 278 |
| Totals | 54,250 | 10,494 | 59,276 | 12,073 | 65,744 | 15,582 |
| Canned and Other Preserved Meats | ||||||
| lb(000) | $(000) | lb(000) | $(000) | lb(000) | $(000) | |
| American Samoa | 516 | 185 | 797 | 276 | 697 | 236 |
| Fiji | 564 | 162 | 830 | 235 | 647 | 187 |
| French Polynesia† | 173 | 67 | 237 | 100 | 140 | 58 |
| Gilbert and Ellice Islands | 206 | 80 | 285 | 111 | 238 | 93 |
| Italy | 945 | 36 | 1,769 | 79 | 867 | 60 |
| Jamaica | 633 | 157 | 423 | 96 | 484 | 125 |
| Nauru | 353 | 137 | 248 | 97 | 352 | 118 |
| Papua and New Guinea | 148 | 40 | 48 | 13 | 62 | 16 |
| Tonga | 218 | 60 | 280 | 76 | 302 | 89. |
| United Kingdom | 3,891 | 1,266 | 2,658 | 842 | 4,191 | 1,501 |
| Western Samoa | 614 | 206 | 844 | 247 | 748 | 210 |
| Other countries | 1,246 | 94 | 1,006 | 96 | 2,002 | 196 |
| Totals | 9,508 | 2,490 | 9,426 | 2,268 | 10,729 | 2,880 |
| Butter | ||||||
| Tons | $(000) | Tons | $(000) | Tons | $(000) | |
| American Samoa | 42 | 22 | 55 | 31 | 46 | 30 |
| Bahamas | 135 | 75 | 92 | 53 | 250 | 161 |
| Barbados | 191 | 109 | 168 | 104 | 195 | 134 |
| Bermuda | 304 | 173 | 323 | 208 | 309 | 206 |
| British Guiana | 146 | 82 | 102 | 61 | 144 | 101 |
| Ceylon | 239 | 128 | 206 | 120 | 104 | 69 |
| Cyprus | 134 | 72 | 97 | 55 | 70 | 49 |
| Fiji | 282 | 211 | 330 | 244 | 429 | 324 |
| French Polynesia† | 42 | 22 | 81 | 48 | 103 | 68 |
| Germany, West | 1,221 | 725 | 2,907 | 1,746 | 365 | 222 |
| Ghana | 115 | 63 | 85 | 42 | 28 | 20 |
| Haiti | 27 | 15 | 12 | 7 | 30 | 19 |
| Hawaii | 162 | 139 | 243 | 199 | 340 | 313 |
| Hong Kong | 360 | 204 | 457 | 268 | 273 | 194 |
| Jamaica | 2,839 | 1,754 | 1,508 | 932 | 1,811 | 1,216 |
| Leeward and Windward Islands | 76 | 42 | 54 | 34 | 69 | 49 |
| Malaysia* | 1,001 | 619 | 1,173 | 797 | 468 | 329 |
| Netherlands Antilles | 255 | 131 | 201 | 123 | 274 | 190 |
| Nigeria | 267 | 143 | 189 | 103 | 248 | 169 |
| Panama Canal Zone | 30 | 18 | 48 | 30 | 26 | 19 |
| Panama Republic | 956 | 555 | 764 | 472 | 973 | 670 |
| Peru | 2,355 | 1,357 | 265 | 155 | 628 | 527 |
| Philippines | 609 | 357 | 513 | 287 | 706 | 511 |
| South Africa | - | - | 505 | 352 | 4,350 | 3,015 |
| Tonga | 49 | 29 | 56 | 33 | 54 | 35 |
| Trinidad and Tobago | 1,219 | 712 | 860 | 529 | 805 | 555 |
| United Kingdom | 150,750 | 82,574 | 170,191 | 102,228 | 174,941 | 109,606 |
| United States of America | 526 | 447 | 231 | 172 | 47 | 33 |
| Western Samoa | 107 | 60 | 115 | 68 | 106 | 69 |
| Other countries | 147 | 88 | 126 | 77 | 953 | 743 |
| Totals | 164,585 | 90,925 | 181,955 | 109,581 | 189,144 | 119,647 |
| Cheese | ||||||
| Tons | $(000) | Tons | $(000) | Tons | $(000) | |
| Australia | 182 | 114 | 330 | 179 | 276 | 168 |
| Barbados | 319 | 134 | 280 | 120 | 359 | 168 |
| Bermuda | 79 | 35 | 89 | 39 | 87 | 42 |
| British Guiana | 189 | 75 | 173 | 67 | 151 | 66 |
| Fiji | 38 | 18 | 42 | 21 | 42 | 21 |
| French Polynesia† | 50 | 28 | 65 | 35 | 87 | 52 |
| Germany, West | 1,831 | 639 | 1,692 | 577 | 1,696 | 715 |
| Italy | 266 | 105 | 367 | 121 | 713 | 290 |
| Jamaica | 989 | 494 | 1,052 | 526 | 1,292 | 721 |
| Japan | 1,352 | 503 | 1,350 | 550 | 1,329 | 557 |
| Leeward and Windward Islands | 180 | 88 | 146 | 75 | 126 | 68 |
| Malaysia* | 156 | 66 | 190 | 81 | 265 | 123 |
| Netherlands | - | - | 157 | 63 | 236 | 97 |
| South Africa | 503 | 205 | 1,000 | 400 | 750 | 377 |
| Trinidad and Tobago | 936 | 381 | 820 | 341 | 1,017 | 471 |
| United Kingdom | 80,933 | ‡,460 | 75,654 | 30,223 | 80,487 | 34,912 |
| United States of America | 3,954 | 1,541 | 3,941 | 1,549 | 3,957 | 1,649 |
| Other countries | 251 | 107 | 248 | 113 | 378 | 185 |
| Totals | 92,209 | 36,994 | 87,594 | 35,080 | 93,249 | 40,681 |
| Milk(Dried, Condensed, etc.) | ||||||
| Tons | $(000) | Tons | $(000) | Tons | $(000) | |
| Barbados | 121 | 16 | 134 | 18 | 191 | 40 |
| Canary Islands | 25 | 3 | 225 | 28 | 25 | 6 |
| Ceylon | 401 | 193 | 527 | 216 | 680 | 284 |
| Fiji | 505 | 142 | 722 | 187 | 712 | 207 |
| French Polynesia† | 148 | 41 | 175 | 45 | 179 | 53 |
| Germany, West | 1,456 | 170 | 180 | 22 | 61 | 10 |
| Hawaii | 48 | 6 | 33 | 4 | 48 | 8 |
| Hong Kong | 493 | 76 | 484 | 94 | 213 | 78 |
| India | 1,679 | 224 | 2,082 | 281 | 3,887 | 896 |
| Jamaica | 2,813 | 323 | 1,758 | 286 | 3,207 | 605 |
| Japan | 3,231 | 385 | 3,332 | 448 | 3,453 | 598 |
| Kuwait | 65 | 8 | 241 | 32 | 255 | 57 |
| Leeward and Windward Islands | 91 | 23 | 76 | 21 | 87 | 24 |
| Malaysia* | 7,025 | 1,329 | 6,365 | 1,176 | 7,262 | 1,627 |
| Mauritius | 460 | 63 | 774 | 105 | 374 | 66 |
| Netherlands | 1,407 | 141 | 282 | 36 | 952 | 172 |
| Nigeria | 130 | 16 | 223 | 29 | 95 | 22 |
| Pakistan | 1,201 | 160 | 682 | 102 | 794 | 169 |
| Peru | 3,040 | 348 | 2,410 | 297 | 5,512 | 1,245 |
| Philippines | 4,714 | 628 | 8,512 | 1,068 | 10,679 | 2,483 |
| Rhodesia and Nyasaland | 20 | 3 | 1,025 | 133 | 300 | 60 |
| South Africa | 290 | 35 | 399 | 51 | 805 | 222 |
| Sweden | 12 | 3 | 173 | 24 | 50 | 9 |
| Thailand | 113 | 39 | 137 | 43 | 111 | 40 |
| Trinidad and Tobago | 1,925 | 636 | 1,240 | 484 | 1,968 | 859 |
| United Kingdom | 30,095 | 3,985 | 39,229 | 5,483 | 43,174 | 8,631 |
| United States of America | 650 | 224 | 69 | 7 | 3 | 1 |
| Western Samoa | 184 | 58 | 200 | 61 | 218 | 65 |
| Other countries | 1,009 | 180 | 916 | 173 | 1,364 | 353 |
| Totals | 63,350 | 9,458 | 72,603 | 10,955 | 86,659 | 18,890 |
| Edible Tallow | ||||||
| Tons | $(000) | Tons | $(000) | Tons | $(000) | |
| Australia | 5 | - - | 21 | 2 | 1 | - - |
| Burma | 540 | 54 | 100 | 12 | 110 | 20 |
| China | 2,363 | 213 | 4,828 | 489 | 164 | 25 |
| Germany, West | 10 | 1 | 30 | 3 | 20 | 3 |
| India | 2,699 | 254 | 1,710 | 190 | 581 | 85 |
| Japan | 308 | 28 | 658 | 61 | 246 | 29 |
| Malaysia* | 1,140 | 101 | 1,418 | 156 | 744 | 113 |
| Netherlands | 116 | 10 | 137 | 15 | 35 | 5 |
| United Kingdom | 2,293 | 195 | 4,167 | 453 | 1,957 | 291 |
| Other countries | 699 | 66 | 298 | 35 | 631 | 92 |
| Totals | 10,173 | 923 | 13,367 | 1,416 | 4,489 | 662 |
| Inedible Tallow | ||||||
| tons | $(000) | tons | $(000) | tons | $(000) | |
| Australia | 10 | 1 | 38 | 4 | 365 | 42 |
| British Guiana | 390 | 36 | 756 | 82 | 100 | 12 |
| Burma | 2,924 | 248 | 1,279 | 126 | 1,294 | 195 |
| Ceylon | 4,209 | 342 | 1,655 | 153 | 269 | 34 |
| China | 11,609 | 915 | 15,036 | 1,361 | 5,049 | 605 |
| Fiji | 435 | 36 | 744 | 76 | 325 | 41 |
| Finland | 50 | 4 | - | - | 124 | 13 |
| Ghana | 2,298 | 179 | 939 | 90 | 290 | 42 |
| Germany, West | - | - | 986 | 85 | 314 | 35 |
| Greece | 497 | 42 | 100 | 9 | - | - |
| Haiti | 251 | 18 | - | - | 102 | 13 |
| India | 1,578 | 140 | 1,972 | 204 | 567 | 77 |
| Jamaica | 631 | 54 | 323 | 31 | - | - |
| Japan | 1,979 | 163 | 7,498 | 671 | 6,591 | 814 |
| Kenya | ,1816 | 145 | 1,455 | 136 | 1,592 | 194 |
| Malaysia | 1,374 | 111 | 2,837 | 268 | 3,741 | 444 |
| Mozambique | 2,046 | 159 | 701 | 68 | 1,647 | 202 |
| Netherlands | 50 | 4 | 1,023 | 83 | 1,873 | 208 |
| Pakistan | 230 | 20 | 50 | 5 | 189 | 23 |
| Rhodesia-Nyasaland Federation‡ | 1,486 | 110 | 2,010 | 170 | 1,441 | 159 |
| South Africa | 6,446 | 470 | 6,400 | 546 | 5,029 | 552 |
| Spain | - | - | 611 | 52 | 545 | 75 |
| Sudan | 408 | 35 | 46 | 4 | - | - |
| Thailand | 205 | 19 | 95 | 9 | - | - |
| Trinidad and Tobago | 1,852 | 150 | 1,194 | 114 | 1,433 | 184 |
| United Kingdom | 5,519 | 413 | 14,405 | 1,345 | 18,299 | 2,221 |
| North Vietnam | 164 | 15 | 350 | 37 | 76 | 10 |
| Other countries | 378 | 29 | 259 | 25 | 2,181 | 271 |
| Totals | 48,835 | 3,859 | 62,762 | 5,756 | 53,436 | 6,466 |
| Cattle and Horse Hides | ||||||
| lb(000) | $(000) | lb(000) | $(000) | lb(000) | $(000) | |
| Australia | 4,701 | 548 | 3,277 | 330 | 1,675 | 197 |
| Finland | 69 | 7 | 124 | 11 | 219 | 20 |
| France | 1,010 | 114 | 253 | 21 | 42 | 5 |
| Germany, West | 5,559 | 596 | 4,035 | 352 | 7,148 | 691 |
| Israel | 350 | 41 | 87 | 9 | - | - |
| Italy | 15,992 | 1,719 | 18,049 | 1,778 | 13,775 | 1,538 |
| Japan | 8,061 | 826 | 3,290 | 307 | 2,024 | 213 |
| Netherlands | 1,802 | 204 | 1,434 | 140 | 3,230 | 335 |
| Norway | 860 | 91 | 1,339 | 125 | 1,374 | 131 |
| Poland | 1,211 | 149 | 2,496 | 293 | 3,183 | 403 |
| South Africa | 1,686 | 209 | 1,367 | 152 | 794 | 94 |
| Spain | 1,747 | 204 | 574 | 57 | 1,414 | 153 |
| United Kingdom | 2,014 | 219 | 2,311 | 214 | 5,195 | 529 |
| United States of America | 37 | 4 | 14 | 1 | - | - |
| Yugoslavia | 1,016 | 113 | 3,463 | 366 | 1,009 | 119 |
| Other countries | 859 | 96 | 867 | 89 | 4,088 | 458 |
| Totals | 46,974 | 5,140 | 42,980 | 4,244 | 45,170 | 4,884 |
| Calf and Kip Skins | ||||||
| lb(000) | $(000) | lb(0C0) | $(000) | lb(000) | $(000) | |
| Australia | 838 | 279 | 184 | 40 | 122 | 25 |
| France | 84 | 25 | 114 | 22 | 259 | 70 |
| Germany, West | 885 | 271 | 530 | 112 | 607 | 166 |
| Italy | 1,124 | 353 | 1,612 | 326 | 1,412 | 376 |
| Japan | 911 | 207 | 1,472 | 241 | 558 | 110 |
| Netherlands | 1,081 | 340 | 350 | 65 | 657 | 166 |
| Spain | 206 | 64 | 497 | 102 | 325 | 79 |
| United Kingdom | 946 | 303 | 584 | 122 | 1,381 | 348 |
| United States of America | 1 | - | 839 | 171 | 615 | 148 |
| Yugoslavia | - | - | 519 | 105 | 227 | 47 |
| Other countries | 22 | 6 | 17 | 3 | 309 | 54 |
| Totals | 6,098 | 1,847 | 6,718 | 1,309 | 6,471 | 1,589 |
| Sheep Skins (with Wool) | ||||||
| lb(000) | $(000) | lb(000) | $(000) | lb(000) | $(000) | |
| Belgium | 245 | 66 | 292 | 98 | 463 | 142 |
| France | 4,613 | 1,035 | 5,404 | 1,568 | 4,305 | 1,069 |
| Italy | 494 | 135 | 942 | 328 | 727 | 208 |
| Netherlands | - | - | 97 | 28 | 50 | 14 |
| Spain | 2,140 | 561 | 1,379 | 452 | 1,626 | 447 |
| United Kingdom | 780 | 200 | 284 | 89 | 478 | 154 |
| Other countries | 73 | 14 | 56 | 19 | 122 | 30 |
| Totals | 8,345 | 2,012 | 8,455 | 2,582 | 7,771 | 2,065 |
| Sheep Skins (Without Wool) | ||||||
| doz(000) | $(000) | doz(000) | $(000) | doz(000) | $(000) | |
| Australia | - - | 1 | 2 | 8 | 3 | 18 |
| Belgium | 152 | 1,159 | 152 | 1,594 | 183 | 2,279 |
| Canada | 2 | 14 | 8 | 54 | 6 | 41 |
| Finland | 23 | 131 | 7 | 43 | 19 | 117 |
| France | 188 | 943 | 102 | 651 | 32 | 230 |
| Germany, West | 112 | 731 | 84 | 679 | 26 | 288 |
| Italy | 38 | 283 | 41 | 422 | 30 | 384 |
| Mexico | 5 | 42 | 6 | 52 | 21 | 219 |
| Netherlands | 103 | 774 | 123 | 1,265 | 125 | 1,531 |
| Spain | 9 | 53 | 7 | 43 | - - | 5 |
| Sweden | 5 | 37 | - - | 1 | - | - |
| United Kingdom | 260 | 1,800 | 377 | 3,511 | 416 | 4,300 |
| United States of America | 1,379 | 8,894 | 1,582 | 12,762 | 1,411 | 12,999 |
| Venezuela | 4 | 22 | - | - | - | - |
| Other countries | 5 | 30 | 4 | 30 | 1 | 7 |
| Totals | 2,288 | 14,915 | 2,495 | 21,117 | 2,275 | 22,419 |
| Sausage Casings | ||||||
| Hanks (000) | $(000) | Hanks (000) | $(000) | Hanks (000) | $(000) | |
| Australia | 58 | 37 | 70 | 94 | 75 | 105 |
| Canada | 1,625 | 2,766 | 1,713 | 3,117 | 1,699 | 3,301 |
| Denmark | 1 | 3 | 2 | 5 | 1 | 2 |
| Germany, West | 243 | 464 | 253 | 484 | 212 | 408 |
| Mexico | - | - | 10 | 25 | - | - |
| Netherlands | 73 | 160 | 43 | 92 | 93 | 190 |
| United Kingdom | 3,223 | 5,382 | 3,728 | 6,662 | 3,114 | 5,421 |
| United States of America | 763 | 1,539 | 694 | 1,472 | 713 | 1,547 |
| Yugoslavia | 48 | 102 | 10 | 17 | 27 | 55 |
| Other countries | 3 | 6 | 13 | 26 | 15 | 28 |
| Totals | 6,038 | 10,460 | 6,537 | 11,995 | 5,949 | 11,056 |
| Casein | ||||||
| tons | $(000) | tons | $(000) | tons | $(000) | |
| Belgium | 195 | 55 | 249 | 68 | 558 | 181 |
| Canada | 15 | 4 | 248 | 67 | 132 | 50 |
| France | 81 | 24 | 130 | 43 | 2,040 | 712 |
| Germany, West | 2,188 | 631 | 3,921 | 1,081 | 7,840 | 2,507 |
| India | 400 | 116 | 204 | 60 | 114 | 45 |
| Italy | 5,647 | 1,478 | 6,861. | 1,777 | 6,707 | 1,889 |
| Japan | 8,151 | 2,291 | 8,965 | 2,454 | 9,063 | 2,692 |
| Netherlands | 1,696 | 508 | 4,087 | 1,115 | 3,041 | 922 |
| Spain | 199 | 55 | 239 | 67 | 457 | 179 |
| Sweden | 454 | 124 | 751 | 204 | 1,298 | 427 |
| United Kingdom | 6,457 | 1,915 | 7,246 | 2,099 | 7,247 | 2,523 |
| United States of America | 3,992 | 1,097 | 8,391 | 2,248 | 12,788 | 4,492 |
| Other countries | 294 | 86 | 230 | 65 | 478 | 187 |
| Totals | 29,768 | 8,383 | 4,1523 | 11,347 | 51,763 | 16,806 |
| Apples (Fresh) | ||||||
| lb(000) | $(000) | lb(000) | $(000) | lb(000) | $(000) | |
| Belgium | 5,372 | 336 | 4,664 | 292 | 6,470 | 404 |
| Canada | 2,786 | 174 | 2,287 | 143 | 1,957 | 122 |
| Denmark | - | - | 584 | 37 | 606 | 38 |
| Fiji | 313 | 20 | 447 | 28 | 512 | 32 |
| France | 3,660 | 229 | 626 | 39 | 160 | 10 |
| Germany, West | 7,943 | 496 | 7,938 | 496 | 6,283 | 393 |
| Hawaii | 379 | 24 | 567 | 35 | 200 | 13 |
| Hong Kong | 1,102 | 69 | 1,128 | 71 | 949 | 59 |
| Ireland, Republic of | - | - | 725 | 45 | - | - |
| Malaysia* | 1,911 | 119 | 1,223 | 76 | 2,009 | 126 |
| Netherlands | 992 | 62 | 1,894 | 118 | 1,808 | 113 |
| Norway | 600 | 38 | 680 | 43 | 601 | 38 |
| Sweden | 1,969 | 121 | 2,163 | 135 | 2,100 | 131 |
| United Kingdom | 36,712 | 2,295 | 48,814 | 3,051 | 61,569 | 3,868. |
| United States of America | 1,496 | 94 | 2,031 | 129 | 1,073 | 67 |
| Venezuela | 2,360 | 147 | 538 | 34 | 1,241 | 78 |
| Other countries | 1,664 | 105 | 1,018 | 65 | 2,261 | 145 |
| Totals | 69,260 | 4,327 | 77,326 | 4,837 | 89,799 | 5,635 |
| Seeds (Grass and Clover) | ||||||
| cwt | $(000) | cwt | $(000) | cwt | $(000) | |
| Australia | 14,028 | 543 | 64,339 | 1,159 | 41,889 | 762 |
| Belgium and Luxembourg | 434 | 12 | 1,246 | 32 | 273 | 6 |
| Canada | 668 | 48 | 1,678 | 52 | 196 | 13 |
| Chile | 295 | 18 | 2,003 | 38 | 2,089 | 46 |
| Denmark | 1,613 | 102 | 478 | 12 | 10 | - - |
| France | 3,782 | 130 | 7,484 | 170 | 5,146 | 111 |
| Germany, West | 315 | 8 | 4,267 | 132 | 1,806 | 36 |
| Ireland, Republic of | 1,844 | 92 | 11,981 | 177 | 8,895 | 167 |
| Italy | 366 | 10 | 26 | 1 | - | - |
| Japan | 441 | 9 | 885 | 24 | 918 | 18 |
| Netherlands | 1,219 | 32 | 1,839 | 40 | 832 | 18 |
| United Kingdom | 24,178 | 1,244 | 80,612 | 1,452 | 24,360 | 719 |
| United States of America | 4,143 | 97 | 3,458 | 135 | 1,118 | 34 |
| Uruguay | 394 | 21 | 98 | 3 | 936 | 37 |
| Other countries | 637 | 27 | 1,850 | 30 | 2,748 | 46 |
| Totals | 54,357 | 2,393 | 182,244 | 3,456 | 91,216 | 2,013 |
| Peas (Food) | ||||||
| cental | $(000) | cental | $(000) | cental | $(000) | |
| Australia | 747 | 4 | 6,419 | 28 | 4,543 | 21 |
| Belgium | 9,792 | 35 | 8,647 | 34 | 9,736 | 39 |
| Fiji | 4,044 | 18 | 3,715 | 18 | 5,044 | 23 |
| Netherlands | 5,702 | 20 | 4,123 | 17 | 3,711 | 16 |
| United Kingdom | 92,978 | 327 | 103,537 | 420 | 111,616 | 469 |
| United States of America | 5,940 | 21 | 9,165 | 37 | 8,674 | 36 |
| Other countries | 5,052 | 19 | 4,760 | 21 | 8,524 | 36 |
| Totals | 124,255 | 444 | 140,366 | 574 | 151,848 | 641 |
| Peas (Seed) | ||||||
| cental | $(000) | cental | $(000) | cental | $(000) | |
| Australia | 88,725 | 542 | 70,184 | 399 | 87,117 | 457 |
| South Africa | 2,538 | 14 | 5,371 | 28 | 2,148 | 11 |
| United Kingdom | 66,500 | 380 | 90,172 | 534 | 67,866 | 388 |
| Other countries | 5,556 | 28 | 7,181 | 42 | 19,066 | 104 |
| Totals | 163,319 | 964 | 172,908 | 1,004 | 176,197 | 960 |
| Wood Pulp and Waste Paper | ||||||
| tons | $(000) | tons | $(000) | tons | $(000) | |
| Australia | 63,276 | 5,150 | 61,975 | 5,231 | 53,353 | 4,553 |
| China | 4,000 | 234 | - | - | - | - |
| Japan | 676 | 45 | 1,932 | 143 | 2,401 | 184 |
| Philippines | 1,115 | 71 | 1,694 | 137 | 99 | 10 |
| Other countries | - | - | 527 | 14 | 1,302 | 29 |
| Totals | 69,067 | 5,500 | 66,128 | 5,525 | 57,155 | 4,775 |
| Timber (Sawn Conifer) | ||||||
| Sup. ft. (000) | $(000) | Sup. ft. (000) | $(000) | Sup. ft. (000) | $(000) | |
| Australia | 27,108 | 1,546 | 27,211 | 1,593 | 35,039 | 2,053 |
| Fiji | 465 | 30 | 762 | 54 | 2,112 | 175 |
| Nauru | 182 | 23 | 106 | 14 | 134 | 17 |
| Western Samoa | 329 | 31 | 432 | 44 | 343 | 30 |
| Other countries | 127 | 17 | 905 | 39 | 195 | 18 |
| Totals | 28,212 | 1,647 | 29,417 | 1,744 | 37,823 | 2,294 |
| Saw logs and Veneer (Logs, conifer) | ||||||
| Cu. ft. (000) | $(000) | Cu. ft. (000) | $(000) | Cu. ft. (000) | $(000) | |
| Australia | 41 | 8 | 5 | 3 | 77 | 18 |
| Japan | 6,424 | 1,629 | 9,842 | 2,554 | 14,296 | 3,648 |
| Korea, Republic of | 1,339 | 354 | 1,008 | 270 | 84 | 39 |
| Fiji | - | - | - | - | 5 | - - |
| Other countries | 2 | 1 | - | - | - | - |
| Totals | 7,806 | 1,992 | 10,855 | 2,827 | 14,461 | 3,706 |
| Fish (Other than Canned) | ||||||
| cwt | $(000) | cwt | $(000) | cwt | $(000) | |
| Australia | 41,742 | 779 | 43,356 | 859 | 53,006 | 1,149 |
| France | 454 | 39 | 582 | 56 | 221 | 13 |
| Hawaii | 2,231 | 218 | 3,240 | 330 | 2,614 | 341 |
| United States of America | 25,643 | 2,161 | 20,347 | 1,757 | 25,844 | 3,305 |
| Western Samoa | 3,209 | 24 | 3,322 | 24 | 2,664 | 21 |
| Other countries | 2,776 | 66 | 3,684 | 65 | 6,624 | 115 |
| Totals | 76,055 | 3,287 | 74,531 | 3,090 | 90,973 | 4,945 |
| Newsprint | ||||||
| cwt (000) | $(000) | cwt (000) | $(000) | cwt (000) | $(000) | |
| Australia | 1,437 | 8,011 | 2,074 | 11,258 | 2,163 | 11,769 |
| Philippines | - | - | 68 | 231 | 48 | 120 |
| Other countries | 4 | 26 | 5 | 29 | 8 | 46 |
| Totals | 1,441 | 8,037 | 2.147 | 11,518 | 2,219 | 11,936 |
EXPORTS BY PORTS—The following table shows for the latest years the value of total exports according to the ports at which the Customs entries were passed.
| Port | 1959 | 1960 | 1961 | Jan-June 1962 | Year Ended June | ||
|---|---|---|---|---|---|---|---|
| 1963 | 1964 | 1965 | |||||
| $m | $m | $m | $m | $m | $m | $m | |
| Whangarei | - | - | - | - | - | 6.9 | 8.0 |
| Auckland | 210.0 | 197.3 | 173.0 | 94.1 | 196.6 | 220.8 | 246.3 |
| Hamilton | - | - | - | - | - | - | - |
| Tauranga | 15.4 | 16.4 | 14.5 | 8.2 | 18.3 | 23.5 | 24.7 |
| Gisborne | 5.8 | 5.5 | 8.1 | 4.2 | 7.7 | 8.1 | 7.5 |
| Napier | 47.4 | 58.0 | 60.1 | 31.5 | 60.2 | 77.7 | 70.2 |
| Taranaki | 48.8 | 52.2 | 56.3 | 30.2 | 53.7 | 57.8 | 64.3 |
| Wanganui | - - | - - | - - | - - | 0.4 | 0.2 | 0.3 |
| Palmerston North | - | - | - | - | - | - - | - - |
| Wellington | 92.0 | 89.6 | 81.7 | 47.9 | 86.4 | 105.0 | 91.4 |
| Picton | 0.5 | 2.7 | 2.7 | 2.5 | 1.8 | 3.4 | 3.7 |
| Nelson | 3.6 | 4.4 | 4.4 | 3.5 | 5.7 | 5.1 | 6.8 |
| Greymouth | 0.7 | 0.7 | 0.5 | 0.1 | 0.2 | - | - - |
| Lyttelton | 46.4 | 49.8 | 45.7 | 29.0 | 56.4 | 62.0 | 61.5 |
| Timaru | 31.4 | 35.9 | 32.3 | 21.8 | 35.5 | 42.8 | 36.3 |
| Oamaru | - | - - | - - | - - | - - | - - | - - |
| Otago | 37.4 | 39.3 | 35,8 | 23.8 | 40.3 | 47.0 | 44.6 |
| Bluff | 47.8 | 53.2 | 52.9 | 35.8 | 64.4 | 76.8 | 76.6 |
| Totals | 587.3 | 605.2 | 568.0 | 332.7 | 627.5 | 737.3 | 742.2 |
Auckland occupies a commanding position in the export trade of New Zealand, usually about one-third of all exports being dispatched from that port. Wellington occupies second place, with approximately one-eighth of the trade. As will be seen from the above table, the order of the other ports varies from year to year. The general rise in the value of exports through Tauranga is attributed to the pulp, paper, and timber industries of the district.
RE-EXPORTS—Until recent years the forwarding trade of New Zealand has never been of great significance. In most years, ships' and international aircraft stores, in which aviation spirit and bunker and lubricating, oils loom largely,; make up between one-quarter and one-third of the total re-exports. The balance is made up principally of miscellaneous stores sent to the Pacific Islands and goods returned to the United Kingdom and Australia.
Particulars of re-exports are contained in the next table. Specie is not included in the figures.
| $(000) | |
|---|---|
*Provisional. | |
| 1946 | 1,989 |
| 1947 | 3,406 |
| 1948 | 2,710 |
| 1949 | 2,389 |
| 1950 | 2,840 |
| 1951 | 3,466 |
| 1952 | 4,284 |
| 1953 | 4,773 |
| 1954 | 4,187 |
| 1955 | 4,278 |
| 1956 | 4,767 |
| 1957 | 4,528 |
| 1958 | 4,377 |
| 1959 | 5,321 |
| 1960 | 5,400 |
| 1961 | 7,189 |
| Jan-June | |
| 1962 | 3,335 |
| June Year | |
| 1963 | 7,563 |
| 1964 | 8,844 |
| 1965 | 8,512x |
| 1966 | 10,292* |
The destination of this re-export trade for the latest June years are shown in the following table.
| Country | June Year | |||
|---|---|---|---|---|
*Provisional. | ||||
| 1,963 | 1,964 | 1965x | 1966* | |
| $(000) | $(000) | $(000) | $(000) | |
| Australia | 2,312 | 2,972 | 2,405 | 3,530 |
| Fiji | 290 | 349 | 429 | 605 |
| Hong Kong | 16 | 29 | 62 | 73 |
| Malaysia | 14 | 198 | 34 | 53 |
| Tonga | 18 | 22 | 37 | 39 |
| United Kingdom | 811 | 778 | 852 | 1,187 |
| Western Samoa | 118 | 115 | 127 | 136 |
| Germany, West | 64 | 171 | 146 | 195 |
| Netherlands | 54 | 39 | 138 | 84 |
| Canada | 25 | 78 | 70 | 180 |
| United States of America (excluding Alaska and Hawaii) | 553 | 901 | 672 | 957 |
| Japan | 40 | 68 | 184 | 239 |
| Other countries | 830 | 267 | 189 | 523 |
| Ships' stores | 2,309 | 2,347 | 1,927 | 1,020 |
| Passengers | 109 | 509 | 1,240 | 1,471 |
| Totals (excluding gold and current coin) | 7,563 | 8,844 | 8,512 | 10,292 |
GOODS SHIPPED TO COOK, NIUE, AND TOKELAU ISLANDS—Trade with the Cook, Niue, and Tokelau Islands is not regarded as external to New Zealand, but merely as interchange between different parts of the country, and it is therefore not included in the account of the external trade. The trade of these islands with other countries is also omitted from New Zealand trade statistics. Separate returns are made of the transactions between New Zealand and these islands, and the values of goods shipped to the islands are summarised below.
| Year | Exports |
|---|---|
| $(000) | |
| 1954 | 1,120 |
| 1955 | 1,175 |
| 1956 | 1,132 |
| 1957 | 1,313 |
| 1958 | 1,501 |
| 1959 | 1,298 |
| 1960 | 1,490 |
| 1961 | 2,081 |
| 1962 | 1,888 |
| June Year | |
| 1963 | 2,001 |
| 1964 | 2,397 |
| 1965 | 3,020 |
| 1966 | 2,847 |
Further particulars regarding the trade of the islands will be found in Section 38.
GENERAL—Statistics of imports are compiled from entries passed at the Customs. The basis of valuation is usually c.d.v. (current domestic value in the country of export at the time of shipment). However in certain tables the value c.i.f. (cost including insurance and freight) is also given. Import values are expressed in terms of New Zealand currency, and import totals are exclusive of gold and current coin, except where the contrary is expressely stated.
Reference should be made to Section 22A for details of the systems of valuation of imports as now used in these tables. Section 22A also gives a summary of import totals for recent years and index numbers of the volume of import trade.
IMPORT CONTROL—Reference to import control is made in Section 22A.
CLASSIFICATION OF IMPORTS—The following table classifies imports by Sections of the Standard International Trade Classification (Revised). It illustrates the great variety of imports which New Zealand receives in exchange for its relatively few basic exports.
| Year Ended June | Imports (c.d.v.) | |||||
|---|---|---|---|---|---|---|
| Food and Live Animals | Beverages and Tobacco | Crude Materials, Except Fuels | Mineral Fuels, Lubricants, and Related Materials | Animal and Vegetable Oils and Fats | Chemicals | |
| $(thousand) | ||||||
| 1959 | 33,774 | 6,774 | 18,932 | 40,360 | 1,632 | 37,330 |
| 1960 | 34,148 | 7,174 | 20,112 | 39,610 | 1,084 | 37,076 |
| 1961 | 34,956 | 9,398 | 25,352 | 41,046 | 1,078 | 46,052 |
| 1962 | 30,832 | 5,626 | 23,466 | 45,932 | 892 | 44,740 |
| 1963 | 35,254 | 7,520 | 22,606 | 44,336 | 950 | 47,706 |
| 1964 | 48,628 | 7,004 | 27,530 | 47,818 | 1,104 | 55,450 |
| 1965 | 35,470 | 7,744 | 31,028 | 51,692 | 1,088 | 65,380 |
| 1966* | 37,128 | 8,146 | 34,972 | 40,070 | 1,274 | 80,198 |
| Year Ended June | Imports (c.d.v.) | ||||
|---|---|---|---|---|---|
| Manufactured Goods Classified Chiefly by Material | Machinery and Transport Equipment | Miscellaneous Manufactured Articles | Commodities and Transactions not Classified According to Kind | Total Merchandise Imports | |
*Provisional | |||||
| $(thousand) | |||||
| 1959 | 148,928 | 118,054 | 26,860 | 1,880 | 434,524 |
| 1960 | 154,190 | 128,054 | 29,890 | 3,072 | 454,412 |
| 1961 | 204,430 | 175,408 | 40,570 | 4,360 | 582,652 |
| 1962 | 162,334 | 156,178 | 33,208 | 4,616 | 507,828 |
| 1963 | 167,334 | 159,454 | 35,446 | 3,138 | 523,740 |
| 1964 | 187,870 | 217,960 | 41,482 | 2,522 | 637,368 |
| 1965 | 195,224 | 230,984 | 42,226 | 1,834 | 662,666 |
| 1966* | 216,332 | 263,502 | 46,780 | 1,236 | 729,634 |
The next table gives fuller details of imports according to sections and divisions for the two latest June years.
| Section and Division, S.I.T.C., Revised | June Year 1965 | June Year 1966* | ||
|---|---|---|---|---|
| c.d.v. | c.i.f. | c.d.v. | c.i.f. | |
*Provisional. | ||||
| Section 0. Food and Live Animals— | $(thousand) | |||
| Div. 00 Live animals | 418 | 484 | 562 | 619 |
| Div. 01 Meat and meat preparations | 65 | 70 | 94 | 106 |
| Div. 02 Dairy products; and eggs | 22 | 26 | 142 | 154 |
| Div. 03 Fish and fish preparations | 1,750 | 1,912 | 2,000 | 2,178 |
| Div. 04 Cereals and cereal preparations | 8,258 | 9,927 | 7,037 | 8,377 |
| Div. 05 Fruits and vegetables | 8,468 | 11,495 | 10,677 | 14,102 |
| Div. 06 Sugar and sugar preparations | 7,721 | 8,788 | 5,894 | 7,122 |
| Div. 07 Coffee, tea, cocoa, spices, and manufactures thereof | 8,390 | 10,216 | 10,251 | 12,650 |
| Div. 08 Feeding stuff for animals (not including unmilled cereals) | 105 | 108 | 122 | 124 |
| Div. 09 Miscellaneous food preparations | 232 | 242 | 348 | 367 |
| Totals, Section 0 | 35,469 | 43,268 | 37,128 | 45,799 |
| Section 1. Beverages and Tobacco— | ||||
| Div. 11 Beverages | 4,550 | 5,206 | 4,526 | 5,221 |
| Div. 12 Tobacco and tobacco manufactures | 3,195 | 3,559 | 3,619 | 3,985 |
| Totals, Section 1 | 7,745 | 8,764 | 8,145 | 9,206 |
| Section 2. Crude Materials, Inedible, Except Fuels— | ||||
| Div. 21 Hides, skins, and fur skins, undressed | 177 | 189 | 270 | 289 |
| Div. 22 Oil seeds, oil nuts, and oil kernels | 1,045 | 1,177 | 1,097 | 1,261 |
| Div. 23 Crude rubber, including synthetic and reclaimed | 4,971 | 5,410 | 4,418 | 4,838 |
| Div. 24 Wood and cork | 4,531 | 6,672 | 5,135 | 7,456 |
| Div. 25 Pulp and waste paper | 1,609 | 1,891 | 1,960 | 2,370 |
| Div 26 Textile fibres (not manufactured into yarn, thread, or fabrics) and waste | 6,187 | 6,963 | 6,921 | 7,659 |
| Div. 27 Crude fertilisers and crude minerals, excluding coal, petroleum, and precious stones | 10,226 | 19,987 | 12,576 | 22,428 |
| Div. 28 Metalliferous ores and metal scrap | 72 | 79 | 102 | 111 |
| Div. 29 Animal and vegetable crude materials n.e.i. | 2,210 | 2,398 | 2,494 | 2,690 |
| Totals, Section 2 | 31,028 | 44,766 | 34,972 | 49,104 |
| Section 3. Mineral Fuels, Lubricants, and Related Materials— | ||||
| Div. 32 Coal, coke, and briquettes | 4 | 9 | 133 | 208 |
| Div. 33 Petroleum and petroleum products | 51,619 | 64,344 | 39,874 | 51,334 |
| Div. 34 Gas | 68 | 68 | 62 | 73 |
| Totals, Section 3 | 51,691 | 64,420 | 40,069 | 51,615 |
| Section 4. Animal and Vegetable Oils and Fats— | $(thousand) | |||
| Div. 41 Animal oils and fats | 40 | 47 | 74 | 86 |
| Div. 42 Vegetable oils and fats, unprocessed | 917 | 1,045 | 1,023 | 1,164 |
| Div. 43 Animal and vegetable oils and fats, processed, and waxes of animal or vegetable origin | 131 | 145 | 176 | 200 |
| Totals, Section 4 | 1,088 | 1,238 | 1,273 | 1,450 |
| Section 5. Chemicals— | ||||
| Div. 51 Chemical elements and compounds | 17,100 | 18,664 | 18,401 | 19,909 |
| Div. 52 Mineral tar and crude chemicals from coal, petroleum, and natural gas | 268 | 351 | 323 | 395 |
| Div. 53 Dyeing, tanning and colouring materials. | 3,035 | 3,185 | 4,827 | 4,935 |
| Div. 54 Medicinal and pharmaceutical products | 12,772 | 11,822 | 16,494 | 15,136 |
| Div. 55 Essential oils and perfume materials; toilet, polishing, and cleansing preparations | 1,821 | 1,919 | 2,397 | 2,501 |
| Div. 56 Fertilisers, manufactured | 5,336 | 6,783 | 6,012 | 7,983 |
| Div. 57 Explosives | 1,687 | 1,665 | 1,814 | 1,876 |
| Div. 58 Plastic materials, regenerated cellulose, artificial resins | 15,487 | 15,509 | 19,823 | 19,600 |
| Div. 59 Miscellaneous chemical materials and products | 7,872 | 8,499 | 10,108 | 10,992 |
| Totals, Section 5 | 65,379 | 68,396 | 80,198 | 83,327 |
| Section 6. Manufactured Goods Classified Chiefly by Material— | ||||
| Div. 61 Leather, leather manufactures n.e.i., and dressed furs | 1,272 | 1,319 | 1,387 | 1,442 |
| Div. 62 Rubber manufactures n.e.i. | 5,048 | 4,867 | 5,733 | 5,459 |
| Div. 63 Wood and cork manufactures (excluding furniture) | 1,565 | 1,987 | 1,534 | 1,875 |
| Div. 64 Paper, paperboard, and manufactures thereof | 9,188 | 10,178 | 9,247 | 10,126 |
| Div. 65 Textile yarn, fabrics, made-up articles, and related products | 70,192 | 74,590 | 74,929 | 80,014 |
| Div. 66 Non-metallic mineral manufactures n.e.i. | 9,897 | 11,070 | 10,080 | 11,336 |
| Div. 67 Iron and steel | 54,617 | 58,730 | 62,562 | 67,315 |
| Div. 68 Non-ferrous metals | 21,406 | 21,505 | 25,166 | 25,470 |
| Div. 69 Manufactures of metals | 22,039 | 22,680 | 25,692 | 26,333 |
| Totals, Section 6 | 195,223 | 206,927 | 216,331 | 229,370 |
| Section 7. Machinery and Transport Equipment— | ||||
| Div. 71 Machinery other than electric | 85,355 | 88,602 | 115,536 | 119,309 |
| Div. 72 Electric machinery, apparatus, and appliances | 57,611 | 58,491 | 50,906 | 51,453 |
| Div. 73 Transport and equipment | 88,017 | 94,386 | 97,060 | 103,573 |
| Totals, Section 7 | 230,983 | 241,479 | 263,502 | 274,335 |
| Section 8. Miscellaneous Manufactured Articles— | $(thousand) | |||
| Div. 81 Sanitary, plumbing, heating, lighting fittings, and fixtures | 1,034 | 1,611 | 1,062 | 1,187 |
| Div. 82 Furniture and fixtures | 145 | 159 | 171 | 193 |
| Div. 83 Travel goods, handbags, and similar articles | 69 | 76 | 91 | 100 |
| Div. 84 Clothing | 3,348 | 3,532 | 3,087 | 3,271 |
| Div. 85 Footwear | 1,149 | 1,240 | 1,278 | 1,390 |
| Div. 86 Professional, scientific and controlling instruments: photographic and optical goods, watches, and clocks. | 14,323 | 13,542 | 16,177 | 15,301 |
| Div. 89 Miscellaneous manufactured articles n.e.i. | 22,159 | 23,592 | 24,914 | 26,287 |
| Totals, Section 8 | 42,226 | 43,303 | 46,780 | 47,730 |
| Section 9. Commodities and Transactions Not Classified According to Kind | 1,833 | 1,899 | 1,236 | 1,296 |
| Grand totals, merchandise imports | 662,667 | 724,460 | 729,635 | 793,232 |
DIRECTION OF IMPORT TRADE—The United Kingdom has been the chief supplier of New Zealand imports since the eighties of last century. Prior to that the main supply was from Australia. In the years following the Second World War, the proportion of the import trade received from the United Kingdom rose from 47.8 percent in 1946 to a maximum of 60.1 percent in 1950. Since 1950 there has been an overall decline, and for the June year 1966 only 38.1 percent of imports came from that source. The trade with Australia from 1950 to 1956 was between 10 and 15 percent of the total. In 1957 and 1958, however, it rose to 17 percent, and in 1959 and 1960 to 18 percent. Following a slight fall in 1961, the proportion rose to 18.5 percent for the June year 1966.
The principal changes in the direction of the import trade are illustrated in the table in Section 22A giving the percentages received from the United Kingdom, other Commonwealath countries, European, and other countries. It will be seen that European countries are now playing a greater part in providing New Zealand's import requirements.
The table which follows shows imports (valuation c.d.v.) during the latest 11 years from the United Kingdom, Australia, and the United States of America.
| Year | Country Where Purchased | Country of Origin | Total Merchandise Imports | ||||
|---|---|---|---|---|---|---|---|
| United Kingdom | Australia | U.S.A. | United Kingdom | Australia | U.S.A. | ||
*Provisional. | |||||||
| Calendar Year— | $(million). | ||||||
| 1956 | 258 | 67 | 35 | 252 | 67 | 36 | 469 |
| 1957 | 272 | 91 | 40 | 269 | 90 | 41 | 523 |
| 1958 | 267 | 89 | 33 | 266 | 87 | 34 | 505 |
| 1959 | 195 | 75 | 33 | 194 | 74 | 33 | 410 |
| 1960 | 222 | 93 | 53 | 220 | 91 | 53 | 506 |
| 1961 | 260 | 97 | 53 | 258 | 94 | 54 | 576 |
| 1962 | .. | .. | .. | 206 | 99 | 44 | 491 |
| June Year— | |||||||
| 1963 | 229 | 97 | 46 | 219 | 97 | 48 | 524 |
| 1964 | 259 | 132 | 57 | 247 | 133 | 59 | 637 |
| 1965 | 262 | 132 | 78 | 242 | 128 | 75 | 663 |
| 1966* | .. | .. | .. | 278 | 135 | 84 | 730 |
The next table gives imports on a c.d.v. basis by countries of origin for June years 1965 and 1966.
| Country | June Year 1965 | June Year 1966* |
|---|---|---|
*Provisional. †lncluded with Malaysia in 1965. | ||
| Sterling Area— | $(000) | $(000) |
| Aden Colony and Protectorate | 357 | 357 |
| Australia | 127,968 | 135,093 |
| Bahrain | 878 | 249 |
| Brunei | 406 | 2,073 |
| Ceylon | 4,417 | 4,791 |
| Cyprus | 110 | 193 |
| Fiji | 811 | 1,266 |
| Ghana | 1,004 | 1,945 |
| Gilbert and Ellice Islands | 385 | 652 |
| Hong Kong | 8,618 | 9,306 |
| India, including Sikkim, etc. | 8,654 | 10,904 |
| Ireland, Republic of | 150 | 149 |
| Jamaica | 352 | 357 |
| Kenya | 618 | 702 |
| Kuwait | 12,733 | 13,226 |
| Malaysia | 9,775 | 6,122 |
| Nauru | 2,528 | 2,914 |
| New Zealand re-imports | 876 | 401 |
| Nigeria | 86 | 164 |
| Pakistan | 364 | 553 |
| Papua and New Guinea | 97 | 212 |
| Qatar and Trucial Sheikdoms | 1,394 | 444 |
| Singapore | † | 1,225 |
| South Africa and S.W. Africa | 1,880 | 2,489 |
| Southern Rhodesia | 577 | 1,004 |
| Tanzania | 1,322 | 1,179 |
| Tonga | 324 | 535 |
| Trinidad and Tobago | 152 | 53 |
| Uganda | 734 | 799 |
| United Kingdom | 241,892 | 278,231 |
| Western Samoa | 1,101 | 996 |
| Other sterling countries | 377 | 324 |
| Totals | 430,939 | 478,909 |
| E.F.T.A. (Excluding U.K.) | ||
| Austria | 942 | 943 |
| Denmark | 1,594 | 1,831 |
| Norway | 1,109 | 1,136 |
| Portugal | 533 | 472 |
| Sweden | 10,379 | 6,700 |
| Switzerland and Liechtenstein | 6,247 | 7,227 |
| Totals | 20,804 | 18,309 |
| E.E.C.— | $(000) | $(000) |
| Belgium and Luxembourg | 3,728 | 3,307 |
| France and Monaco | 4,547 | 5,238 |
| Germany, West | 18,782 | 22,318 |
| Italy and San Marino | 6,074 | 7,667 |
| Netherlands | 9,203 | 9,652 |
| Totals | 42,334 | 48,183 |
| Dollar Area— | ||
| Canada | 25,676 | 29,589 |
| Dominican Republic | 772 | 317 |
| Ecuador | 5 | 347 |
| Mexico | 637 | 889 |
| Philippines | 220 | 348 |
| U.S.A. (including Alaska and Hawaii) | 75,109 | 83,934 |
| Venezuela | 2,169 | 292 |
| Other countries | 138 | 142 |
| Totals | 104,725 | 115,859 |
| Other Countries— | ||
| Brazil | 442 | 537 |
| Chile | 331 | 163 |
| China (Mainland) | 1,965 | 2,749 |
| Czechoslovakia | 1,122 | 1,168 |
| Finland | 1,175 | 1,016 |
| Formosa | 1,862 | 1,725 |
| French Polynesia | 837 | 1,043 |
| Germany, East | 372 | 402 |
| Indonesia | 670 | 2,126 |
| Iran | 12,188 | 6,665 |
| Iraq | 100 | 19 |
| Ivory Coast | 53 | 106 |
| Japan | 36,684 | 44,744 |
| Netherlands Antilles | 1,523 | 27 |
| Peru | 868 | 37 |
| Reunion | - - | 906 |
| Saudi Arabia | 2,000 | 2,796 |
| Spain | 447 | 518 |
| Thailand | 287 | 244 |
| Turkey | 101 | 70 |
| U.S.S.R. | 291 | 348 |
| United Arab Republic (Egypt) | 7 | 365 |
| Other countries | 540 | 601 |
| Totals | 63,865 | 68,375 |
| Grand Total | 662,667 | 729,635 |
On a country of origin basis the following table shows for the latest 11 years the percentage of the value (c.d.v.) of total New Zealand imports.
| Country | 1956 | 1957 | 1958 | 1959 | 1960 | 1961 | Jan-June 1962 | June Year 1963 | June Year 1964 | June Year 1965x | June Year 1966† |
|---|---|---|---|---|---|---|---|---|---|---|---|
*Federation of Malaya, North Borneo, Sarawak, and Singapore together formed Malaysia on 16 September 1963. Singapore independent from August 1965. †Provisional. ‡ Alaska and Hawaii included in 1966 figure. | |||||||||||
| Sterling Area— | percent | ||||||||||
| Australia | 14.18 | 17.25 | 17.26 | 18.08 | 17.98 | 16.26 | 20.55 | 18.55 | 20.82 | 19.31 | 18.52 |
| Bahrein | 1.36 | 0.35 | 0.37 | 0.48 | 0.48 | 0.20 | 0.40 | 0.77 | 0.23 | 0.13 | 0.03 |
| Ceylon | 0.95 | 0.99 | 0.87 | 1.08 | 0.95 | 0.86 | 0.98 | 0.92 | 0.76 | 0.67 | 0.66 |
| Fiji | 0.62 | 0.55 | 0.48 | 0.48 | 0.19 | 0.23 | 0.15 | 0.52 | 0.84 | 0.12 | 0.17 |
| Ghana | - | 0.11 | 0.20 | 0.26 | 0.24 | 0.18 | 0.30 | 0.25 | 0.18 | 0.15 | 0.27 |
| Hong Kong | 0.40 | 0.37 | 0.38 | 0.39 | 0.78 | 0.79 | 0.91 | 1.12 | 1.19 | 1.30 | 1.28 |
| India | 1.47 | 1.90 | 2.37 | 2.10 | 2.13 | 2.02 | 1.73 | 1.81 | 1.70 | 1.31 | 1.49 |
| Malaya and Singapore* | 1.35 | 1.23 | 1.18 | 1.30 | 1.40 | 1.24 | 1.82 | 1.04 | 1.38 | 1.48 | 0.84 |
| Nauru | 0.27 | 0.24 | 0.21 | 0.25 | 0.29 | 0.23 | 0.40 | 0.30 | 0.36 | 0.38 | 0.40 |
| South Africa | 0.43 | 0.46 | 0.46 | 0.53 | 0.66 | 0.70 | 0.33 | 0.43 | 0.31 | 0.28 | 0.34 |
| United Kingdom | 53.73 | 51.39 | 52.54 | 47.29 | 43.45 | 44.74 | 42.85 | 41.88 | 38.68 | 36.50 | 38.13 |
| Western Samoa | 0.11 | 0.13 | 0.22 | 0.33 | 0.23 | 0.16 | 0.23 | 0.18 | 0.17 | 0.17 | 0.14 |
| Other | 1.31 | 0.94 | 0.77 | 1.11 | 1.05 | 0.97 | 0.97 | 1.09 | 1.24 | 3.23 | 3.37 |
| Totals sterling countries | 76.18 | 75.89 | 77.32 | 73.67 | 69.82 | 68.59 | 71.59 | 68.86 | 67.86 | 65.03 | 65.64 |
| E.F.T.A. (excluding U.C.)— | percent | ||||||||||
| Austria | 0.16 | 0.17 | 0.17 | 0.16 | 0.15 | 0.18 | 0.20 | 0.18 | 0.15 | 0.14 | 0.13 |
| Denmark | 0.13 | 0.18 | 0.15 | 0.15 | 0.16 | 0.15 | 0.13 | 0.17 | 0.16 | 0.24 | 0.25 |
| Norway | 0.29 | 0.28 | 0.33 | 0.33 | 0.28 | 0.28 | 0.24 | 0.25 | 0.20 | 0.17 | 0.16 |
| Portugal | 0.08 | 0.08 | 0.10 | 0.08 | 0.07 | 0.07 | 0.07 | 0.13 | 0.08 | 0.08 | 0.06 |
| Sweden | 0.78 | 0.97 | 0.78 | 1.13 | 0.78 | 0.90 | 0.70 | 0.74 | 2.05 | 1.57 | 0.92 |
| Switzerland | 0.66 | 0.71 | 0.69 | 0.79 | 0.93 | 0.88 | 0.68 | 0.88 | 0.89 | 0.94 | 0.99 |
| Totals E.F.T.A. countries | 2.10 | 2.40 | 2.23 | 2.65 | 2.38 | 2.46 | 2.02 | 2.34 | 3.53 | 3.14 | 2.51 |
| E.E.C.— | |||||||||||
| Belgium | 0.90 | 0.77 | 0.77 | 0.74 | 0.92 | 0.81 | 0.82 | 0.66 | 0.79 | 0.56 | 0.45 |
| France | 0.83 | 0.68 | 0.72 | 0.64 | 0.83 | 1.01 | 0.92 | 0.89 | 0.92 | 0.69 | 0.72 |
| Germany, West | 2.81 | 2.99 | 3.01 | 3.02 | 3.09 | 3.46 | 3.00 | 2.96 | 2.75 | 2.83 | 3.06 |
| Italy | 0.63 | 0.61 | 0.59 | 0.72 | 0.74 | 0.79 | 1.13 | 0.97 | 0.88 | 0.92 | 1.05 |
| Netherlands | 0.89 | 0.94 | 1.24 | 1.19 | 1.37 | 1.96 | 1.20 | 1.12 | 1.21 | 1.39 | 1.32 |
| Totals E.E.C. countries | 6.06 | 5.98 | 6.34 | 6.30 | 6.95 | 8.03 | 7.07 | 6.60 | 6.56 | 6.39 | 6.60 |
| Dollar Area— | |||||||||||
| Canada | 2.67 | 2.53 | 2.34 | 2.34 | 3.18 | 3.76 | 3.46 | 3.41 | 3.41 | 3.87 | 4.06 |
| U.S.A.‡ | 7.58 | 7.85 | 6.79 | 8.16 | 10.49 | 9.43 | 8.48 | 9.16 | 9.27 | 11.33 | 11.50 |
| Other | 0.07 | 0.06 | 0.09 | 0.23 | 0.73 | 1.01 | 0.87 | 0.95 | 1.26 | 0.60 | 0.32 |
| Totals dollar countries | 10.32 | 10.44 | 9.23 | 10.73 | 14.40 | 14.19 | 12.81 | 13.52 | 13.94 | 15.80 | 15.88 |
| Other Countries— | |||||||||||
| China | 0.14 | 0.13 | 0.17 | 0.20 | 0.17 | 0.15 | 0.17 | 0.20 | 0.23 | 0.30 | 0.38 |
| Czechoslovakia | 0.15 | 0.17 | 0.18 | 0.13 | 0.17 | 0.21 | . 0.15 | 0.16 | 0.17 | 0.17 | 0.16 |
| Indonesia | 2.69 | 2.18 | 1.22 | 1.04 | 1.04 | 0.37 | 0.79 | 0.80 | 0.87 | 0.10 | 0.29 |
| Iran | 0.67 | 0.54 | 0.53 | 0.82 | 0.80 | 0.59 | 0.79 | 0.83 | 0.37 | 1.84 | 0.91 |
| Japan | 0.95 | 0.85 | 1.12 | 1.75 | 2.85 | 2.91 | 2.59 | 4.62 | 4.81 | 5.54 | 6.13 |
| Netherlands Antilles | 0.17 | 0.63 | 0.79 | 1.48 | 0.36 | 0.83 | 0.74 | 0.59 | 0.36 | 0.23 | - - |
| Saudi Arabia | 0.22 | 0.25 | 0.26 | 0.66 | 0.41 | 0.63 | 0.58 | 0.20 | 0.15 | 0.30 | 0.38 |
| Other | 0.36 | 0.54 | 0.60 | 0.58 | 0.64 | 1.04 | 0.69 | 1.27 | 1.16 | 1.16 | 1.11 |
| Totals other countries | 5.35 | 5.29 | 4.88 | 6.65 | 6.45 | 6.72 | 6.51 | 8.68 | 8.11 | 9.64 | 9.37 |
| Grand totals | 100.00 | 100.00 | 100.00 | 100.00 | 100.00 | 100.00 | 100.00 | 100.00 | 100.00 | 100.00 | 100.00 |
ORIGIN OF PRINCIPAL IMPORTS—The table which follows shows details of principal commodity imports by country of origin for years ended June 1964 and 1965. C.d.v. basis of valuation is used.
| Commodity and Countries of Origin | Value of Imports | |
|---|---|---|
| 1963-64 | 1964-65 | |
*Malaysia includes States of Malaya, Singapore, Sarawak, and Sabah. †French Oceania and Society Islands. | ||
| $(000) | ||
| Unmilled Wheat— | ||
| Australia | 7,652 | 7,146 |
| All countries | 7,652 | 7,146 |
| Oranges— | ||
| Australia | 1,020 | 1,281 |
| All countries | 1,636 | 1,741 |
| Bananas— | ||
| Western Samoa | 514 | 409 |
| All countries | 714 | 627 |
| Dried Fruits— | ||
| Australia | 2,472 | 2,584 |
| U.S.A. | 554 | 503 |
| All countries | 3,340 | 3,366 |
| Pineapples— | $(000) | |
| Australia | 300 | 246 |
| Malaysia | 476 | 405 |
| All countries | 924 | 796 |
| Sugar (not refined)— | ||
| Australia | 9,474 | 3,149 |
| Dominican Republic | 3,310 | 763 |
| Fiji | 4,990 | 517 |
| Reunion | 1,296 | - |
| All countries | 19,074 | 6,991 |
| Coffee (Raw)— | ||
| Brazil | 390 | 365 |
| Tanzania | 264 | 225 |
| Uganda | 598 | 664 |
| All countries | 1,764 | 1,724 |
| Cocoa— | $(000) | |
| Ghana | 888 | 624 |
| Netherlands | 648 | 624 |
| All countries | 1,658 | 1,449 |
| Tea— | ||
| Ceylon | 4,742 | 4,293 |
| India | 278 | 392 |
| All countries | 5,148 | 4,976 |
| Wine— | ||
| Australia | 150 | 191 |
| France | 152 | 173 |
| South Africa | 90 | 114 |
| All countries | 588 | 724 |
| Whisky— | ||
| United Kingdom | 2,912 | 2,964 |
| All countries | 2,954 | 2,998 |
| Tobacco (Unmanufactured)— | ||
| Rhodesian Federation | 448 | 568 |
| U.S.A. | 1,858 | 2,133 |
| All countries | 2,410 | 2,926 |
| Rubber (Crude and Synthetic)— | ||
| Canada | 354 | 492 |
| Malaysia | 2,384 | 2,713 |
| United Kingdom | 522 | 521 |
| U.S.A. | 668 | 708 |
| All countries | 4,398 | 4,971 |
| Wood (Shaped or Simply Worked)— | ||
| Australia | 922 | 1,044 |
| Canada | 472 | 737 |
| U.S.A. | 922 | 1,625 |
| All countries | 2,938 | 4,158 |
| Pulp and Waste Paper— | ||
| Finland | 1,254 | 1,076 |
| Sweden | 358 | 190 |
| All countries | 1,730 | 1,609 |
| Wool and Other Animal Hair— | ||
| Australia | 1,824 | 2,262 |
| United Kingdom | 456 | 609 |
| All countries | 2,304 | 2,911 |
| Natural Phosphates— | $(000) | |
| French Polynesia | 846 | 825 |
| Gilbert and Ellice Islands | 332 | 385 |
| Nauru | 2,292 | 2,528 |
| All countries | 3,584 | 4,614 |
| Sulphur (Other Than Sublimed, etc.)— | ||
| Mexico | 578 | 452 |
| U.S.A. | 1,680 | 1,932 |
| All countries | 2,438 | 2,732 |
| Motor Spirit— | ||
| Australia | 3,836 | 3,665 |
| Bahrein | 1,444 | 625 |
| India | 2,932 | - |
| Indonesia | 4,764 | 35 |
| Iran | 1,326 | 2,205 |
| Malaysia | 3,868 | 2,438 |
| Venezuela | 3,282 | 1,563 |
| All countries | 23,466 | 12,293 |
| Distillate Fuels— | ||
| Australia | 8,030 | 1,930 |
| Saudi-Arabia | 370 | 422 |
| All countries | 9,834 | 3,644 |
| Lubricating Oils and Greases— | ||
| Australia | 502 | 825 |
| United Kingdom | 1,538 | 1,611 |
| U.S.A. | 1,008 | 891 |
| All countries | 3,190 | 3,451 |
| Organic Chemicals— | ||
| Australia | 1,060 | 1,188 |
| Germany, West | 580 | 889 |
| United Kingdom | 2,508 | 2,813 |
| U.S.A. | 2,458 | 2,966 |
| All countries | 7,716 | 9,214 |
| Inorganic Chemicals— | ||
| Australia | 1,268 | 2,086 |
| Japan | 700 | 784 |
| United Kingdom | 2,518 | 2,219 |
| U.S.A. | 918 | 1,156 |
| All countries | 6,806 | 7,861 |
| $(000) | ||
| Medicinal and Pharmaceutical Products— | ||
| Australia | 2,952 | 3,735 |
| Germany, West | 606 | 803 |
| Switzerland | 1,356 | 1,447 |
| United Kingdom | 5,422 | 5,808 |
| U.S.A. | 570 | 606 |
| All countries | 11,278 | 12,772 |
| Manufactured Fertilisers— | ||
| Belgium and Luxembourg | 398 | 294 |
| Canada | - | 766 |
| Germany, West | 902 | 626 |
| U.S.A. | 878 | 3,050 |
| All countries | 3,398 | 5,336 |
| Plastic Materials, Regenerated Cellulose, and Artificial Resins— | ||
| Australia | 1,542 | 2,797 |
| United Kingdom | 5,586 | 6,143 |
| U.S.A. | 2,836 | 3,044 |
| All countries | 12,880 | 15,487 |
| Materials of Rubber— | ||
| Canada | 78 | 238 |
| United Kingdom | 788 | 706 |
| U.S.A. | 394 | 342 |
| All countries | 1,826 | 1,684 |
| Rubber Tyres and Tubes— | ||
| United Kingdom | 742 | 694 |
| U.S.A. | 638 | 645 |
| All countries | 1,836 | 1,767 |
| Paper and Paperboard— | ||
| Australia | 1,348 | 1,250 |
| Canada | 1,160 | 671 |
| United Kingdom | 4,528 | 3,954 |
| All countries | 9,322 | 8,116 |
| Textile Yam and Thread— | ||
| Australia | 2,846 | 3,000 |
| Hong Kong | 1,020 | 1,135 |
| United Kingdom | 4,838 | 4,450 |
| All countries | 10,824 | 11,615 |
| Fabrics Suitable for the Manufacture of Apparel— | ||
| Hong Kong | 2,350 | 2,793 |
| Japan | 5,096 | 4,227 |
| United Kingdom | 1,872 | 1,423 |
| U.S.A. | 904 | 651 |
| All countries | 12,266 | 11,249 |
| Furnishing and Household Fabrics— | ||
| Hong Kong | 630 | 836 |
| India | 1,248 | 929 |
| United Kingdom | 1,622 | 1,343 |
| All countries | 4,840 | 4,367 |
| Woven Woollen Fabrics— | ||
| Australia | 416 | 494 |
| United Kingdom | 2,954 | 2,890 |
| All countries | 3,870 | 3,815 |
| Woven Fabrics of Synthetic Fibres— | ||
| Japan | 2,052 | 2,373 |
| United Kingdom | 956 | 692 |
| U.S.A. | 904 | 766 |
| All countries | 4,738 | 4,888 |
| Woven Fabrics of Regenerated Artificial Fibres— | ||
| Japan | 2,080 | 2,026 |
| United Kingdom | 2,582 | 3,251 |
| U.S.A. | 1,136 | 1,431 |
| All countries | 7,844 | 8,786 |
| Knitted or Crocheted Fabrics— | ||
| Hong Kong | 1,054 | 1,257 |
| United Kingdom | 920 | 916 |
| All countries | 2,740 | 3,258 |
| Household Linens— | ||
| Hong Kong | 486 | 444 |
| India | 272 | 275 |
| Japan | 292 | 275 |
| United Kingdom | 808 | 636 |
| All countries | 2,596 | 2,450 |
| Glass— | $(000) | |
| Australia | 764 | 147 |
| Belgium and Luxembourg | 840 | 348 |
| Netherlands | 384 | 549 |
| United Kingdom | 1,968 | 1,775 |
| All countries | 4,654 | 3,875 |
| Bars and Rods of Iron or Steel— | ||
| Australia | 1,970 | 1,589 |
| Japan | 1,754 | 1,740 |
| United Kingdom | 1,182 | 1,083 |
| All countries | 5,234 | 4,757 |
| Angles, Shapes, and Sections of Iron or Steel— | ||
| Australia | 972 | 987 |
| Japan | 1,342 | 2,293 |
| United Kingdom | 2,786 | 2,354 |
| All countries | 5,216 | 5,831 |
| Universals, Plates, and Sheets of Iron or Steel— | ||
| Australia | 10,754 | 12,431 |
| Japan | 4,668 | 6,933 |
| United Kingdom | 5,236 | 5,016 |
| All countries | 21,848 | 25,447 |
| Iron and Steel Wire— | ||
| Australia | 2,394 | 1,763 |
| Belgium and Luxembourg | 1,206 | 965 |
| United Kingdom | 2,434 | 1,905 |
| All countries | 6,504 | 4,893 |
| Tubes, Pipes, and Fittings of Iron or Steel— | ||
| Australia | 1,988 | 2,617 |
| United Kingdom | 3,786 | 3,518 |
| All countries | 6,146 | 6,737 |
| Copper and Copper Alloys— | ||
| Australia | 3,886 | 3,726 |
| Canada | 1,764 | 2,988 |
| United Kingdom | 3,268 | 3.387 |
| All countries | 9,110 | 10,716 |
| Aluminium and Aluminium Alloys— | $(000) | |
| Canada | 1,986 | 2,955 |
| United Kingdom | 786 | 715 |
| U.S.A. | 1,014 | 864 |
| All countries | 4,376 | 5,574 |
| Nails, Screws, Nuts, Bolts, etc., of Iron, Steel, Copper— | ||
| Australia | 276 | 422 |
| United Kingdom | 1,250 | 1,279 |
| All countries | 2,054 | 2,453 |
| Cutlery— | ||
| Japan | 334 | 314 |
| United Kingdom | 1,270 | 1,072 |
| All countries | 2,116 | 1,924 |
| Internal Combustion Engines, Not Aircraft— | ||
| Australia | 622 | 950 |
| Canada | 490 | 632 |
| United Kingdom | 2,358 | 2,224 |
| U.S.A. | 1,412 | 1,400 |
| All countries | 5,092 | 5,487 |
| Agricultural Machinery and Appliances— | ||
| Australia | 146 | 71 |
| Germany, West | 216 | 317 |
| Sweden | 174 | 239 |
| United Kingdom | 854 | 908 |
| U.S.A. | 826 | 882 |
| All countries | 2,658 | 2,882 |
| Tractors— | ||
| United Kingdom | 6,454 | 6,056 |
| U.S.A. | 3,922 | 4,010 |
| All countries | 11,102 | 10,790 |
| Office Machines— | ||
| France | 216 | 117 |
| Germany, West | 802 | 459 |
| United Kingdom | 3,426 | 3,121 |
| U.S.A. | 888 | 1,484 |
| All countries | 6,304 | 6,620 |
| Metal-working Machinery— | $(000) | |
| Australia | 530 | 636 |
| Germany, West | 440 | 404 |
| United Kingdom | 2,518 | 1,927 |
| U.S.A. | 314 | 474 |
| All countries | 4,446 | 4,258 |
| Textile Machinery— | ||
| Germany, West | 580 | 821 |
| United Kingdom | 2,070 | 2,768 |
| U.S.A. | 210 | 430 |
| All countries | 3,648 | 4,943 |
| Domestic Sewing Machines— | ||
| Australia | 464 | 286 |
| Japan | 326 | 297 |
| Switzerland | 360 | 361 |
| All countries | 1,414 | 1,200 |
| Excavating, Levelling, Boring, etc., Machinery— | ||
| United Kingdom | 1,796 | 1,469 |
| U.S.A. | 1,726 | 1,455 |
| All countries | 4,164 | 3,766 |
| Pumps and Centrifuges— | ||
| Australia | 1,296 | 1,347 |
| United Kingdom | 2,798 | 2,840 |
| All countries | 5,512. | 6,117 |
| Mechanical Handling Equipment— | ||
| Australia | 396 | 414 |
| United Kingdom | 2,424 | 2,069 |
| U.S.A. | 956 | 988 |
| All countries | 4,372 | 3,969 |
| Electrical Power Machinery and Switchgear— | ||
| Australia | 1,898 | 2,147 |
| Canada | 2,356 | 596 |
| Sweden | 7,864 | 4,992 |
| United Kingdom | 9,152 | 9,091 |
| All countries | 24,068 | 20,183 |
| Equipment for Distributing Electricity— | ||
| Australia | 222 | 316 |
| Japan | 266 | 295 |
| United Kingdom | 3,754 | 8,138 |
| All countries | 4,548 | 9,231 |
| Television Broadcast Receivers— | $(000) | |
| Australia | 306 | 234 |
| Netherlands | 438 | 527 |
| United Kingdom | 192 | 192 |
| All countries | 994 | 1,082 |
| Telecommunications Equipment— | ||
| United Kingdom | 8,344 | 7,430 |
| All countries | 9,054 | 9,618 |
| Railway Vehicles— | ||
| Canada | 1,242 | 3,030 |
| United Kingdom | 990 | 400 |
| All countries | 4,356 | 5,098 |
| Motorcars— | ||
| Australia | 14,382 | 15,051 |
| Canada | 1,016 | 1,053 |
| France | 628 | 526 |
| Germany, West | 530 | 424 |
| United Kingdom | 33,590 | 31,221 |
| All countries | 51,226 | 49,696 |
| Lorries and Trucks— | ||
| Australia | 512 | 693 |
| United Kingdom | 7,962 | 8,901 |
| All countries | 9,066 | 10,220 |
| Motor Cycles and Motorised Cycles— | ||
| Japan | 184 | 341 |
| United Kingdom | 274 | 176 |
| All countries | 598 | 703 |
| Aircraft— | ||
| United Kingdom | 546 | 378 |
| U.S.A. | 1,038 | 6,977 |
| All countries | 1,810 | 8,432 |
| Ships and Boats— | ||
| Australia | 412 | 35 |
| United Kingdom | 3,110 | 1,891 |
| All countries | 3,716 | 2,137 |
| Clothing— | ||
| Hong Kong | 432 | 375 |
| United Kingdom | 1,918 | 1,882 |
| All countries | 3,230 | 3,331 |
| Photographic and Cinematographic Cameras and Equipment— | $(000) | |
| Germany, West | 346 | 366 |
| Japan | 374 | 415 |
| United Kingdom | 464 | 644 |
| U.S.A. | 280 | 338 |
| All countries | 1,670 | 1,975 |
| Photographic Films, Plates, and Paper (Not Developed Cinematographic Film)— | ||
| Australia | 1,630 | 2,000 |
| Germany, West | 350 | 325 |
| United Kingdom | 758 | 867 |
| U.S.A. | 308 | 446 |
| All countries | 3,178 | 3,812 |
| Printed Books and Pamphlets— | $(000) | |
| Australia | 832 | 873 |
| United Kingdom | 4,992 | 4,459 |
| U.S.A. | 1,652 | 1,573 |
| All countries | 7,880 | 7,371 |
| Newspapers and Periodicals— | ||
| Australia | 1,786 | 1,732 |
| United Kingdom | 1,896 | 1,963 |
| U.S.A. | 434 | 561 |
| All countries | 4,232 | 4,391 |
QUANTITIES OF PRINCIPAL ITEMS IMPORTED—The following table shows the quantity imported during June years 1963 to 1966 of a large number of the principal items.
| Item | Unit of Quantity | Year Ended 30 June | |||
|---|---|---|---|---|---|
| 1963 | 1964 | 1965 | 1966* | ||
*Provisional. | |||||
| Fish, canned, and fish preparations | lb(000) | 4,429 | 6,453 | 5,824 | 6,338 |
| Wheat, unmilled | bushels(000) | 6,643 | 6,499 | 6,104 | 5,461 |
| Rice | cwt(000) | 59.9 | 66.1 | 76.3 | 66.0 |
| Oranges | lb(000) | 30,968 | 32,257 | 34,505 | 39,481 |
| Bananas | lb(000) | 69,680 | 66,839 | 56,032 | 66,557 |
| Fruit— | |||||
| Dried | lb(000) | 19,743 | 22,789 | 21,336 | 28,868 |
| Canned | lb(000) | 9,828 | 11,312 | 9,778 | 11,292 |
| Desiccated coconut | lb(000) | 2,023 | 3,034 | 2,702 | 2,876 |
| Edible nuts | lb(000) | 1,646 | 1,951 | 2,010 | 2,030 |
| Sugar | cwt(000) | 2,721 | 2,746 | 2,409 | 2,837 |
| Coffee, raw | lb(000) | 6,100 | 8,196 | 6,906 | 7,988 |
| Tea | lb(000) | 16,668 | 17,509 | 16,612 | 18,286 |
| Cocoa | lb(000) | 9,904 | 8,187 | 7,030 | 17,608 |
| Wine | gal(000) | 246 | 232 | 253 | 295 |
| Whisky | proof gal(000) | 603 | 577 | 574 | 550 |
| Tobacco, unmanufactured | lb(000) | 5,507 | 4,396 | 5,720 | 6,926 |
| Synthetic and artificial fibres | lb(000) | 2,820 | 3,995 | 4,670 | 5,576 |
| Woven fabrics— | |||||
| Synthetic fibres | sq. yd(000) | 7,591 | 9,910 | 10,488 | 12,821 |
| Artificial fibres | sq. yd(000) | 14,425 | 18,307 | 20,598 | 23,270 |
| Yarn and thread of silk, rayon, and synthetic fibres | lb(000) | 3,746 | 4,517 | 5,276 | 3,652 |
| Yarn of wool and animal hair | lb(000) | 756 | 692 | 523 | 591 |
| Meat wraps, cotton | lb(000) | 2,995 | 3,522 | 3,648 | 3,771 |
| Textile fabrics coated with plastic | sq. yd(000) | 2,252 | 2,166 | 1,610 | 1,204 |
| Bags, sacks, wool packs | doz(000) | 855 | 798 | 788 | 977 |
| Cotton yarn and thread | lb(000) | 4,729 | 5,195 | 5,683 | 6,524 |
| Cotton fabrics, woven, unbleached | sq. yd(000) | 8,973 | 10,534 | 10,868 | 11,306 |
| Cotton, canvas, and duck | sq. yd(000) | 1,570 | 1,686 | 1,330 | 1,626 |
| Cotton fabrics suitable for the manufacture of Apparel— | |||||
| Flannelette, winceyette, diaper cloth | sq. yd(000) | 9,254 | 10,234 | 10,881 | 9,964 |
| Other kinds | sq. yd(000) | 35,102 | 38,219 | 33,414 | 31,725 |
| Cotton furnishing and household fabrics | sq. yd(000) | 15,091 | 18,682 | 16,748 | 19,694 |
| Woven silk fabrics | sq. yd(000) | 330.5 | 345.8 | 409.3 | 363.8 |
| Woven woollen fabrics | sq. yd(000) | 3,130.6 | 3,447.2 | 3,340.3 | 3,517.2 |
| Woven linen, ramie, and hemp fabrics | sq. yd(000) | 1,458.7 | 1,054.1 | 1,391.6 | 1,720.7 |
| Woven jute fabrics | sq. yd(000) | 13,835 | 15,276 | 19,422 | 19,448 |
| Rubber | cwt(000) | 208.2 | 263.5 | 298.9 | 270.1 |
| Timber, sawn | sup. ft(000) | 27,709 | 27,327 | 35,998 | 38,499 |
| Wood and paper pulp | tons | 16,254 | 19,889 | 17,557 | 21,673 |
| Nitrate of soda | tons | 2,117 | 1,462 | 3,705 | 3,923 |
| Fertilisers, phosphatic | tons | 625,631 | 748,570 | 955,827 | 1,041,323 |
| Gypsum, crude | cwt(000) | 1,780 | 1,745 | 2,088 | 2,164 |
| Sulphur | tons | 108,717 | 174,202 | 205,107 | 211,548 |
| Salt | cwt(000) | 1,123 | 1,282 | 990 | 1,005 |
| Asbestos | cwt(000) | 140.1 | 109.4 | 151.3 | 152.4 |
| Petroleum, crude | tons | - | 151,536 | 1,878,066 | 1,399,720 |
| Petroleum, partly refined | gal(000) | - | 14,989 | 176,816 | 317,816 |
| Motor spirit | gal(000) | 300,323 | 311,614 | 156,305 | 30,853 |
| Distillate fuels | gal(000) | 105,978 | 129,404 | 52,908 | 24,043 |
| Kerosene and white spirit | gal(000) | 27,615 | 35,625 | 41,134 | 40,649 |
| Residual fuel oil | gal(000) | 88,393 | 91,459 | 16,405 | - |
| Lubricating oils and preparations | gal(000) | 10,312 | 10,312 | 11,862 | 14,076 |
| Cream of tartar and substitutes | cwt(000) | 31.3 | 36.9 | 38.3 | 47.0 |
| Acids | cwt(000) | 23.7 | 45.4 | 43.6 | 34.1 |
| Caustic soda | cwt(000) | 86.3 | 80.2 | 97.9 | 115.2 |
| Carbonate of soda | cwt(000) | 269.8 | 316.0 | 346.5 | 466.7 |
| Calcium carbide | cwt(000) | 59.2 | 49.2 | 66.1 | 56.8 |
| Sulphate of ammonia | tons | 9,850 | 6,745 | 13,723 | 12,587 |
| Potash | tons | 86,240 | 100,603 | 147,855 | 177,358 |
| Pig iron and ingots | cwt(000) | 228.4 | 159.1 | 198.0 | 191.1 |
| Bars and rods of iron or steel | cwt(000) | 1,123.5 | 1,652.5 | 1,669.3 | 2,087.1 |
| Angles, etc., shapes and sections of iron or steel | cwt(000) | 1,013.0 | 1,303.4 | 1,422.8 | 1,742.5 |
| Universals, plates and sheets of iron or steel | cwt(000) | 2,963.2 | 3,221.3 | 3,746.1 | 3,993.9 |
| Hoop and strip of iron or steel | cwt(000) | 165.9 | 211.3 | 256.4 | 280.7 |
| Rails of iron or steel—fish plates etc. | cwt(000) | 431.3 | 364.8 | 304.3 | 363.0 |
| Iron and steel wire | cwt(000) | 960.5 | 1,093.0 | 740.7 | 535.2 |
| Tubes, pipes, and fittings of iron or steel | cwt(000) | 678.1 | 753.6 | 758.6 | 1,049.4 |
| Silver and platinum not fully worked | oz(000) | 1,845.5 | 1,696.0 | 1,680.9 | 2,001.8 |
| Copper and copper alloys | cwt(000) | 243.4 | 266.5 | 267.5 | 310.6 |
| Aluminium and aluminium alloys | cwt(000) | 156.6 | 187.5 | 229.5 | 216.7 |
| Lead and lead alloys | cwt(000) | 103.8 | 120.0 | 122.9 | 146.8 |
| Finished structural parts and constructions | cwt(000) | 179.2 | 46.1 | 95.8 | 87.7 |
| Wire products | cwt(000) | 212.0 | 203.2 | 101.7 | 146.4 |
| Nails, screws, nuts, bolts, etc. | cwt(000) | 73.4 | 64.2 | 89.9 | 76.2 |
| Hand tools | doz(000) | 478.1 | 534.3 | 528.1 | 618.5 |
| Knives, kitchen and table | doz(000) | 116.8 | 117.3 | 116.8 | 96.5 |
| Spoons and forks | doz(000) | 252.8 | 319.7 | 301.5 | 281.4 |
| Internal combustion engines (not aircraft) | number | 61,472 | 66,091 | 80,408 | 77,036 |
| Agricultural mowers—crops, lawn, weed, scrub cutting | number | 2,264 | 2,473 | 3,140 | 4,395 |
| Agricultural harvesters and threshers—forage, tobacco | number | 250 | 279 | 300 | 446 |
| Earthmoving machines | number | 301 | 321 | 338 | 347 |
| Typewriting, calculating, and accounting machines | number | 18,079 | 22,480 | 21,872 | 25,864 |
| Domestic sewing machines | number | 28,736 | 30,470 | 27,480 | 27,049 |
| Electric motors— | |||||
| Under 1 b.h.p. | number | 263,006 | 372,828 | 386,607 | 391,618 |
| 1 b.h.p. and over | number | 15,830 | 20,332 | 18,974 | 27,269 |
| Sparking plugs | (000) | 2,628 | 2,288 | 2,387 | 1,192 |
| Tractors | number | 5,264 | 5,499 | 4,977 | 9,570 |
| Motor cars— | |||||
| Unassembled | number | 38,003 | 61,680 | 56,775 | 58,718 |
| Assembled | number | 4,006 | 7,150 | 8,572 | 8,043 |
| Lorries, trucks, buses, vans, etc.— | |||||
| Unassembled | number | 8,075 | 8,871 | 9,505 | 13,164 |
| Assembled | number | 180 | 122 | 135 | 118 |
| Motor cycles | number | 3,785 | 3,877 | 5,331 | 4,434 |
| Bicycles | number | 31,050 | 27,505 | 26,353 | 14,106 |
| Rubber tyres and tubes (excl. bicycle) | (000) | 118 | 116 | 120 | 157 |
| Plywood | sq. ft. (000) | 1,117 | 1,087 | 739 | 1,478 |
| Newsprint paper | cwt (000) | 122.5 | 129.2 | 90.6 | 60.1 |
| Printing and writing paper— | |||||
| Machine made, not processed | cwt (000) | .. | 280.1 | 190.4 | 133.4 |
| Impregnated, coated, or printed | cwt (000) | .. | 95.5 | 104.9 | 124.3 |
| Machine made paper and paperboard n.e.s. | cwt (000) | .. | 71.6 | 67.1 | 79.7 |
| Grease proof paper, etc. | cwt (000) | 43.8 | 45.0 | 44.5 | 52.2 |
| Wallpaper | rolls (000) | 1,234.7 | 972.9 | 656.2 | 482.4 |
| Linoleum and similar floor coverings | sq. yd. (000) | 2,870.5 | 3,083.2 | 2,671.2 | 2,819.0 |
| Carpets and carpeting of or with wool | sq. yd. (000) | 171.7 | 186.5 | 122.4 | 104.2 |
| Glass plate and sheet | sq. ft. (000) | 16,021 | 20,899 | 11,033 | 8,976 |
| Table ware and toilet pottery | lb (000) | 2,722.9 | 2,963.4 | 2,929.0 | 3,060.0 |
| Footwear | doz. pr. (000) | 76.2 | 89.5 | 96.3 | 109.6 |
| Cameras, photographic | (000) | 87.4 | 144.8 | 132.6 | 72.6 |
| Watches | (000) | 180.0 | 185.1 | 162.7 | 183.5 |
| Clocks, other than electric | (000) | 242.9 | 219.5 | 237.1 | 273.8 |
| Electric clocks | (000) | 28.7 | 31.8 | 28.9 | 35.6 |
| Electrical capacitors | (000) | 13,205 | 23,585 | 29,182 | 19,336 |
| Insulating wires and cables | cwt(000) | 137.9 | 125.3 | 249.3 | 185.7 |
| Telephone handsets | (000) | 67.2 | 114.3 | 94.8 | 67.8 |
| Electric accumulators | (000) | 37.6 | 19.8 | 19.0 | 24.5 |
| Electric lamp bulbs and tubes | (000) | 5,862.6 | 5,135.9 | 6,425.0 | 6,362.1 |
| Thermionic, etc., valves and tubes | (000) | 2,131 | 3,253 | 3,763 | 2,526 |
| Crystal valves | (000) | 1,313 | 2,123 | 3,115 | 2,349 |
IMPORTS BY PORTS—In 1966 New Zealand had 18 ports of entry for Customs purposes—ten in the North Island and eight in the South Island. The following table gives the total value of imports of merchandise for the several ports of entry. The value of overseas cargo landed at other ports is included with the appropriate port of entry. Basis of valuation is c.d.v.
| Port | 1960 | 1961 | January-June 1962 | June Year 1963 | June Year 1964 | June Year 1965x | June Year 1966* |
|---|---|---|---|---|---|---|---|
| $(thousand) | |||||||
*Provisional. | |||||||
| Whangarei | - | - | - | - | 7,964 | 30,179 | 32,231 |
| Auckland | 205,036 | 229,704 | 97,142 | 215,504 | 256,738 | 267,345 | 291,312 |
| Hamilton | - | - | - | - | 1,390 | 1,598 | 2,535 |
| Tauranga | 6,196 | 8,286 | 3,788 | 8,996 | 9,750 | 7,736 | 9,208 |
| Gisborne | 852 | 1,002 | 352 | 1,190 | 870 | 844 | 830 |
| Napier | 8,476 | 9,768 | 4,530 | 9,940 | 12,106 | 11,288 | 14,188 |
| Taranaki | 6,254 | 8,500 | 3,260 | 8,006 | 8,422 | 9,716 | 8,865 |
| Wanganui | 2,100 | 2,538 | 350 | 724 | 878 | 952 | 980 |
| Palmerston North | - | - | - | - | 1,878 | 2,175 | 2,666 |
| Wellington | 165,744 | 184,902 | 78,000 | 168,934 | 209,960 | 206,747 | 227,113 |
| Picton | 184 | 184 | 52 | 870 | 438 | 301 | 425 |
| Nelson | 2,228 | 2,682 | 1,136 | 2,228 | 2,694 | 1,969 | 4,900 |
| Greymouth | 698 | 628 | 382 | 400 | 1,048 | 543 | 531 |
| Lyttelton | 70,664 | 85,522 | 32,296 | 71,946 | 79,938 | 79,721 | 91,635 |
| Timaru | 2,480 | 3,430 | 804 | 3,852 | 6,690 | 6,402 | 3,381 |
| Oamaru | 454 | 768 | 192 | 686 | 610 | 780 | 487 |
| Otago | 27,714 | 29,832 | 11,594 | 23,394 | 25,880 | 25,788 | 27,894 |
| Bluff | 7,234 | 8,838 | 3,602 | 7,072 | 10,112 | 8,582 | 10,453 |
| Totals | 506,314 | 576,582 | 237,480 | 523,740 | 637,368 | 662,667 | 729,635 |
Almost three-quarters of the total imports usually come in by way of Auckland or Wellington. Lyttelton occupies third place and with the advent of the oil refinery plant at Whangarei this port has now reached fourth place in importance. Following these, the relative importance of the ports varies from year to year.
It should be mentioned that imports by air have been credited to the port in whose district the airport is located. Thus goods which came in through Whenuapai (Mangere since November 1965) were included in the Auckland figures, imports through Wellington Airport and Ohakea in the Wellington figures, and through Harewood in the Lyttelton figures.
GOODS SHIPPED FROM COOK, NIUE, AND TOKELAU ISLANDS—Trade with the Cook and associated islands is not included in the export and import totals for New Zealand, but is shown separately in official publications. The following table shows the movement of, goods from these islands to the main islands of New Zealand. Particulars of the trade of the islands with other countries will be found in the section dealing with New Zealand territory overseas.
| Year | Value of Goods from Cook Islands |
|---|---|
*Provisional. | |
| $ | |
| 1955 | 566,886 |
| 1956 | 596,546 |
| 1957 | 579,090 |
| 1958 | 594,142 |
| 1959 | 686,014 |
| 1960 | 656,990 |
| 1961 | 942,872 |
| Jan-June 1962 | 451,758 |
| June Year 1963 | 1,186,938 |
| 1964 | 1,561,986 |
| 1965x | 1,866,990 |
| 1966* | 1,582,264 |
The value of principal goods brought to New Zealand from the Cook and associated islands in recent years is as follows:
| Item | Year Ended June | ||
|---|---|---|---|
| 1964 | 1965x | 1966* | |
*Provisional. | |||
| $ | $ | $ | |
| Oranges | 141,882 | 101,194 | 26,386 |
| Tangerines and mandarins | 53,986 | 66,404 | 21,364 |
| Lemons, grapefruit, etc. | 13,778 | 15,458 | 4,812 |
| Bananas | 6,974 | 8,120 | 8,468 |
| Coconuts | 3,010 | 1,874 | 908 |
| Pineapples | 10,302 | 5,130 | 17,126 |
| Pulped, processed, or preserved fruit | 56,846 | 92,496 | 105,512 |
| Citrus fruit juices | 343,518 | 455,372 | 451,156 |
| Pineapple juice | 84,880 | 134,760 | 164,868 |
| Other fruit juices | 185,466 | 113,708 | 6,578 |
| Tomatoes | 133,652 | 69,860 | 177,200 |
| Copra | 205,684 | 356,404 | 313,600 |
| Men's and boys' outer clothing | 221,230 | 267,918 | 170,034 |
| Other clothing | 13,088 | 47,858 | 26,778 |
| Other | 87,690 | 130,434 | 87,474 |
| Totals | 1,561,986 | 1,866,990 | 1,582,264 |
THE TARIFF—Briefly the Customs tariff, apart from the obtaining of revenue, has for its objects the following:
The development of New Zealand industries.
The maintenance and extension of markets for New Zealand produce.
The encouragement of intra-Commonwealth trade.
When New Zealand's first Customs Ordinance was proclaimed in 1841 the intention was to raise revenue and to some extent to give preference to goods of British origin. The tariff changes of 1851 and 1864 widened the scope of the tariff but retained its revenue aspects, though at this time the duties were mainly specific rather than ad valorem. In 1888 ad valorem rates became more general and the rate of duty was raised to 20 percent, which was double the amount charged in earlier years.
The prevailing economic philosophy was, of course, that of free trade, and in New Zealand's case it was underlined by the fact that Parliament predominantly represented the farming community. Even so, the depression of the eighties had so affected some of New Zealand's manufacturing industries that protection by tariffs became practical politics in 1888. The tariff revision of 1895 was aimed at protecting a small range of industries, and at the same time it eliminated the duties on many items which entered into the cost of living of those residing in urban areas. These tendencies were continued in 1900, 1907, and 1921, with British preferences becoming more evident.
In 1921 provision was made for an extra rate of duty on goods from countries with a depreciated rate of exchange. This was the first occasion when the legislature tried to cope with twentieth century economic conditions which threatened to cut across tariffs designed to give protection to industries which were supposed to develop in a manner normal to the nineteenth century. In 1921 provision was made for anti-dumping duties, another attempt to meet so-called abnormal practices. The depreciated currency duties ranged from 2 1/2 to 20 percent; the dumping duty was not to exceed the difference between the sale price and the current domestic value.
The 1927 tariff revision extended further British preferences and increased the number of duties imposed for protection purposes. Further important items, if of British origin, were also placed on the free list. In 1930 surtaxes on dutiable goods were imposed for revenue purposes and the general tariff rate was increased by about 5 percent. In 1931 a primage of 3 percent was charged on imports (except in specified cases) which were otherwise free of duty.
In the meantime there had been a change in trade policy, which had tended to become one of protection rather than one of free trade.
As a result of the changing conditions the Ottawa Conference was called. The outcome of this conference was the Ottawa Agreement of 1932, the effect of which was to give further preference to British goods and to inhibit the use of the tariff by New Zealand for purely protective purposes. (The United Kingdom, for its part, granted duty-free entry for practically all New Zealand products and applied tariff rates on butter and cheese from foreign countries and undertook to place quota restrictions on meats from foreign countries. See Section 21A—Marketing of Primary Produce.)
In 1934 a Tariff Commission submitted a report which in the main adhered to the already established principle of British preference, and actually reduced the protection for New Zealand industries in more cases than it provided protection. The adoption of this report by the Customs Acts Amendment Act 1934 resulted in a wide range of items being made dutiable for revenue purposes, while a small group of items with a low to moderate duty gave limited protection against goods of British origin. Thus New Zealand's tariff remained an expression of the fact that New Zealand placed its economic emphasis on primary production, the market for which was mainly in the United Kingdom.
This tariff remained practically unchanged until 1960, although extended in its scope by subsequent trade agreements. In 1960 some amendments were made.
An agreement signed in Wellington in August 1959 between New Zealand and the United Kingdom made provision for the minimum margin of preference of 20 percent accorded to British goods under the Ottawa Agreement to be reduced.
The Board of Trade, in November 1957, completed a comprehensive review of the whole structure and incidence of the tariff and reported to Government.
The Customs Acts Amendment Act 1961 introduced, with effect from 1 July 1962, a revised Tariff which took its structure from the Standard International Trade Classification (Revised), a document of the United Nations Economic and Social Council, designed to list in a systematic manner the goods of world commerce according to their economic significance. It was keyed to the Brussels Tariff Nomenclature, (B.T.N.), an internationally agreed nomenclature which has carefully drafted rules of definition and in which articles are grouped in logical sequence according to the nature of the material of which they are made. A new tariff based on the Brussels Tariff Nomenclature was introduced on 1 July 1967. The duty rates remain unchanged and the statistical details conform to the requirements of the S.I.T.C. (Revised).
The rates of Customs and excise duty in force in New Zealand are set out in the publication entitled The Customs Tariff of New Zealand. This publication, as well as the ancillary publication The Explanatory Notes to the Customs Tariff, is available from the Government Printer, Wellington.
As the rates of duty on goods vary according to their country of origin as well as their classification, the tariff is printed in “multi-column” form listing rates of duty under the British preferential tariff, special rates under Australian and Canadian agreements being shown against the items concerned, the most-favoured-nation tariff (under which goods from countries adhering to the General Agreement on Tariffs and Trade are admitted), and the general tariff.
CUSTOMS DUTIES—Duties on some of the commodities in general use are now given.
Tea—Since 12 June 1964 all tea imported in bulk has been free of duty. Prior to 12 June 1964 foreign tea imported in bulk was dutiable at either 1c per lb or 2c per lb, depending on the country of origin. These duties were removed as a means of facilitating trade with developing countries.
Sugar—The duty on sugars of a polarisation of 99° or more is $1.16 per cwt. Raw sugar imported for refining at Auckland enters free of duty under bond, an excise duty of $18.66 per ton being levied on the refined products. The duty on other raw sugar is 93c per cwt.
Tobacco—Customs duties on tobacco are at the following rates. Cigarettes not exceeding 2 1/2 lb per 1,000: British preferential tariff and most-favoured-nation tariff, $10.10 per 1,000; general tariff, $10.32 per 1,000. Cigarettes exceeding 2 1/2 lb per 1,000 pay $4.06 per pound under the British preferential and most-favoured-nation tariffs, and $4.16 per pound under the general tariff. Cigars and cheroots pay $4.08 per pound under the British preferential tariff, $4.28 per pound under the most-favoured-nation tariff, and $4.48 per pound under the general tariff. In each case these rates of duty on cigars are plus 12 1/2 percent. Unmanufactured tobacco imported for manufacturing in a bonded tobacco factory into cigarettes, tobacco, or snuff pays $33.33 per 100 lb under all three tariffs. The excise duties on tobacco, etc., made in New Zealand are shown later under Excise Duties.
Alcoholic Beverages—There are specific rates for alcoholic beverages which vary according to the type of beverage imported. These rates are set out in full in the tariff.
Motor Vehicles—Motor vehicles imported in an unassembled or completely knocked-down condition pay 6 1/4 percent duty under the British preferential tariff, 45 percent under the most-favoured-nation tariff, and 65 percent under the general tariff. Under the Canadian Trade Agreement motor vehicles imported unassembled from Canada pay from 13 3/4 percent to 45 percent, depending on the percentage of Canadian materials and labour involved. Motor vehicles imported in an assembled condition pay 20 percent duty under the British preferential tariff, 55 percent under the most-favoured-nation tariff, and 75 percent under the general tariff. Vehicles from Canada pay from 33 1/3 percent to 55 percent. Motor vehicles, autocycles, and scooters pay 12 1/2 percent under the British preferential tariff, 32 1/2 percent under the most-favoured-nation tariff, and 50 percent under the general tariff.
Motor Spirits—Under the Motor Spirits Duty Act 1961 the rate of duty on motor spirits is 18.1c per gallon, and is payable by wholesale distributors under a procedure similar to that used for the collection of sales tax.
IMPORT CONTROL—Import licensing applies to two-thirds of private imports and is explained in Section 22A.
EXCISE DUTIES:Beer—As from 22 August 1947 the excise duty on beer became 30c per gallon where the specific gravity of the worts used did not exceed 1,036, increased by .84c for every unit of specific gravity above 1,036. From 27 June 1958 the excise duty on beer was increased to 60c a gallon where the specific gravity does not exceed 1,036, advancing by 1.67c for every unit of specific gravity above 1,036. The specific gravity of distilled water at 60°F is taken as 1,000, and the specific gravity of the worts is determined in relation thereto.
Tobacco—From 27 June 1958 the excise duty on tobacco was increased to the following amounts: tobacco, cut, $2.27 per pound; tobacco, plug, $2.27 per pound; cigars and snuff, $1.20 per pound; cigarettes not exceeding 2 1/2 lb weight for 1,000, $7.00 per 1,000; cigarettes exceeding 2 1/2 lb per 1,000, $2.80 per pound. From 22 July 1960 the duty was reduced, on both cut and plug tobaccos, by 25c per pound, on cigarettes not exceeding 2 1/2 lb weight for 1,000, by 60c per 1,000, and on other cigarettes, by 24c per pound. These rates were increased as from 4 May 1967 to the following: tobacco, manufactured, $2.82 per pound, cigars and snuff, $2.38 per pound; cigarettes not exceeding 2 1/2 lb weight per 1,000, $8.90 per 1,000; cigarettes exceeding 2 1/2 lb per 1,000, $3.56 per pound. An excise duty of 7c is levied on each 1,000 cigarette tubes or papers or the equivalent thereof.
Sugar—There is an excise duty of $18.66 per ton on sugar manufactured in New Zealand.
Alcohol—Excise duties were formerly levied direct on certain manufactures the preparation of which involved the use of a considerable proportion of spirits. In lieu of excise duty on the finished manufactured article, however, a special schedule of duties has been provided since 1921 on imported alcohol used in manufacturing these articles in licensed warehouses. The present rates are: on alcohol used in the manufacture of: perfumed spirits, $3.60 per proof gallon; toilet preparations, $3.40; culinary and flavouring essences, $2.00; medical preparations containing more than 50 percent of proof spirit, 45c per proof gallon. In similar medicinal preparations containing not more than 50 percent, the alcohol used is duty free.
CUSTOMS REVENUE—In the earlier years of New Zealand's history the revenue derived from Customs and excise duties represented a greater proportion of the total revenue from taxation than it has in recent years when it has generally been less than one-fifth of total taxation. The figures for the last 11 years are as follows.
| Year Ended 31 March | Total Taxation | Customs and Excise Duties | |
|---|---|---|---|
| Amount | Percentage of Total Taxation | ||
| $(000) | $(000) | percent | |
| 1956 | 489,658 | 73,266 | 14.96 |
| 1957 | 505,704 | 71,382 | 14.12 |
| 1958 | 489,764 | 78,006 | 15.93 |
| 1959 | 610,486 | 102,580 | 16.80 |
| 1960 | 594,576 | 113,580 | 19.10 |
| 1961 | 668,926 | 116,428 | 17.43 |
| 1962 | 716,406 | 113,776 | 15.82 |
| 1963 | 684,028 | 108,940 | 15.92 |
| 1964 | 742,344 | 117,002 | 15.76 |
| 1965 | 844,538 | 114,490 | 13.56 |
| 1966 | 908,240 | 121,702 | 13.40 |
Motor-spirits tax paid into the National Roads Fund has been excluded from Customs duties. Such taxation is, however, included in total taxation. From 27 June 1958 until 31 March 1964 the increased duty on motor spirits was paid into the Consolidated Fund and this portion of the motor-spirits tax collected was included in the totals of Customs and excise duties for this period as well as being included in the total taxation figures.
PREFERENCE AND RECIPROCITY—The following are the classes of goods which are deemed to be the produce or manufacture of countries which are entitled to be entered for duty at British preferential rates:
Goods wholly the produce of such countries.
Goods wholly manufactured in such countries from unmanufactured raw material and/or from one or more of the imported partly manufactured raw materials which are enumerated in the regulations.
Goods partly manufactured in such countries, provided that the final process of manufacture has been performed in such countries, and also that the expenditure in material produced in such countries and/or labour performed within such countries in each and every article is not less than one-half of the factory or works cost of such article in its finished state.
The conditions applying to British Commonwealth countries, the products of which are admissible under the British preferential tariff pursuant to agreements made by New Zealand with such countries, may be varied to suit the provisions of such agreements.
Under the reciprocal trade agreements with Australia and Canada discussed hereunder, the duties on certain items are sometimes higher than the corresponding duties under the British preferential tariff and in a few cases lower.
By an Order in Council dated 18 November 1965 the General Tariff is applied to Rhodesian goods.
Reciprocity With United Kingdom—Under the Ottawa Agreement New Zealand undertook to preserve the existing margins of preference on United Kingdom goods where the margin of preference did not exceed 20 percent, and where the margin exceeded that figure not to reduce it below 20 percent without the consent of the Government of the United Kingdom.
In 1958 New Zealand sought new arrangements with the United Kingdom and on 25 November 1958 the two Governments signed Heads of Agreement. This provided the basis for a new agreement to give New Zealand the right to reduce the margins of preference applied to United Kingdom goods entering New Zealand to 5 percent on certain imports essential for industry, to 7 1/2 percent on an extensive list of welfare and producer goods, and to 10 percent on all other goods. The formal text of the New Zealand - United Kingdom Trade Agreement was signed in Wellington on 12 August 1959.
On 28 June 1966 a “Record of Understanding” was agreed between New Zealand and United Kingdom extending until 1 January 1970 the 1959 Trade Agreement between the two countries. This formed the basis of the New Zealand - United Kingdom Trade Agreement 1966 signed on 24 November 1966 under which New Zealand undertakes to maintain duty-free entry for a short list of items and minimum margins of preference ranging from 10 percent to 20 percent on a number of other items. The margins of preference in the 1959 Agreement are continued except for any items for which the 1966 Agreement sets a different margin.
Reciprocity With Australia—
An agreement, completed in April 1933 and confirmed by the Trade Agreement (New Zealand and Australia) Ratification Act of that year, came into operation on 1 December 1933, and remains in force until terminated by either party.
Under the agreement each country grants to the goods of the other the benefits of its British preferential tariff, except with regard to certain classes of goods, enumerated in the Schedules to the agreement, on which special rates are fixed.
The agreement provided for lower duties than those prescribed under Australia's British preferential tariff on many classes of New Zealand products entering Australia, including fresh and frozen fish and fish pastes; dried peas; fresh, smoked, and preserved meats; onions; lucerne seed; wine; furs; hats; caps; floor rugs; various agricultural and dairying implements; whale oil; casein; sugar of milk; and timber.
Minor modifications have been made to the Schedules of the agreement from time to time, but they remain substantially the same as originally negotiated.
The agreement must be read subject to the 1965 Free Trade Agreement with Australia.
The setting up of an Australian - New Zealand Consultative Committee on Trade was agreed on by the Australian and New Zealand Governments in August 1960.
The New Zealand - Australia Free Trade Agreement which came into force on 1 January 1966 provides for periodic reduction and ultimate elimination of duties on the goods listed in a schedule to the agreement when such goods qualify for admission into either country as the produce or manufacture of the other country. This agreement modifies or supersedes some of the provisions of the 1933 agreement and, in particular, 1933 Agreement rates which are higher than the equivalent British Preferential rates are to be reduced to the British Preferential level not later than 1 January 1974, and some of these rates have been so reduced.
The goods listed in the schedule to the agreement cover 60 percent of the imports from Australia and include forest products (timber, pulp, packaging materials, plywood and veneers), petroleum products, meat, fish, cheese, lead, zinc and other metals, copper rods and bars, wool, and some machinery and chemicals.
The agreement provides for reviews of trade between the two countries with a view to progressive inclusion of additional items within the agreement. The agreement is to remain in force for 10 years and thereafter shall remain in force unless terminated 180 days after appropriate notice is given by one country and the prescribed consultations between the two countries have been held.
Reciprocity With Canada—Reciprocal trade arrangements between Canada and New Zealand are governed by an agreement negotiated in 1932, and this agreement remains in force until terminated by either party.
Under the terms of the agreement sausage casings, hides and skins, wool, apples, seeds, kauri gum, and phormium fibre are amongst the New Zealand products admitted free of duty. Certain other items such as butter, cheese, mutton, and lamb are admitted at rates of duty lower than the British preferential tariff.
Reciprocity With Malaysia—A trade agreement between Malaysia and New Zealand was signed in February 1961 by which each country accords preferential rates of duty to the other. Both countries agreed to guarantee minimum margins of tariff preference which apply to certain important items in each other's trade. The agreement remains in force until six months from the date on which notice of termination is given by either Government.
Other Trade Arrangements—New Zealand is also a party to certain commercial treaties, conventions, or arrangements with countries outside the Commonwealth. In some earlier cases New Zealand automatically became a party to arrangements concluded by the United Kingdom; in others she became a party by signifying her willingness to adhere to such arrangements. Other arrangements again resulted from direct negotiations between New Zealand and the countries concerned. In practice many of these arrangements (which generally provided for reciprocal most-favoured-nation tariff treatment) are superseded by New Zealand's accession to the General Agreement on Tariffs and Trade. However, some remain separately in force, and, in addition to those countries which are contracting parties to the General Agreement, New Zealand grants most-favoured-nation tariff treatment to Argentina, China, Egypt, Liberia, Poland, Tunisia, and Somalia.
The trade arrangements between Switzerland and New Zealand dating from 1938, under which New Zealand receives a guaranteed import quota for apples and pears, continues in force but the portion of the arrangement relating to most-favoured-nation treatment for imports has been superseded since Switzerland became a contracting party to GATT on 1 August 1966. Since 1957 the arrangement has been extended also to Liechtenstein.
The Federal Republic of Germany and New Zealand concluded a trade agreement in April 1959. The agreement is designed to facilitate as far as possible the exchange of goods and services between the two countries. New Zealand is granted quotas on certain primary products while for some others New Zealand will be considered as a source of supply for imports into Germany under the import programme. The agreement was concluded following international discussions under the General Agreement on Tariffs and Trade on problems arising out of the Federal Republic's import restrictions. The circumstances under which the negotiations with the Federal Republic were initiated were thus somewhat different from the usual, and because of this New Zealand is not required under the agreement to make any special arrangements regarding German exports. As contracting parties to the General Agreement the two countries already granted each other most-favoured-nation tariff treatment.
A trade agreement with the Union of Soviet Socialist Republics entered into force on 1 August 1963 and it will remain in force initially for four years, and thereafter will continue indefinitely, but subject to three months' notice of termination on either side.
The trade agreement provides for the mutual grant of most-favoured-nation treatment in matters concerning trade and shipping between New Zealand and the Soviet Union. In particular each country has agreed to grant to the other, most-favoured-nation treatment with respect to Customs duties and charges of any kind imposed on the importation or exportation of products from the other country. Similarly most-favoured-nation treatment will apply in relation to prohibitions or restrictions whether in the form of quotas, import or export licences, or other controls.
A trade agreement with the Polish People's Republic entered into force on 7 July 1965 and will remain in force for a period of five years and thereafter continue in force until the expiration of six months' notice of termination from either country. This agreement provides for mutual grant of most-favoured-nation treatment in matters relating to import and export duties and charges, and also in regard to prohibitions or restrictions whether by way of quotas, import or export licences, foreign-exchange controls, regulations, directions, or other control measures.
GENERAL AGREEMENT ON TARIFFS AND TRADE (GATT)—Tariff negotiations took place in Geneva in 1947, and the concessions given by each participating country were embodied in schedules to a General Agreement on Tariffs and Trade. The tariff negotiations themselves were bilateral but all the concessions were applied multilaterally, so that New Zealand receives the benefit of reductions made by all participants, and, conversely, New Zealand's concessions apply to all the other countries which took part. Concessions are of two kinds—actual reductions of duties and bindings of duties against increase. The Agreement, which provides for concessions under both the British preferential and most-favoured-nation tariffs, was applied provisionally by New Zealand on 26 July 1948.
The foreign countries to whose products the concessionary rates (i.e., the most-favoured-nation rates) of duty apply by virtue of their membership in GATT or some special arrangement in GATT are: Algeria, Austria, Belgium, Brazil, Burma, Burundi, Cambodia, Cameroon, Central African Republic, Chad, Chile, Congo (Brazzaville), Congo (Leopoldville), Cuba, Czechoslovakia, Dahomey, Denmark, Dominican Republic, Finland, France (including overseas territories), Gabon, Federal Republic of Germany, Greece, Haiti, Indonesia, Israel, Italy, Ivory Coast, Japan, Kuwait, Luxemburg, Malagasy, Mali, Mauritania, Netherlands (including overseas territories), Nicaragua, Niger, Norway, Peru, Portugal, Rwanda, Senegal, South Africa, Spain, Sweden, Switzerland, Togo, Turkey, United States of America, Upper Volta, Uruguay, Yugoslavia.
The following Commonwealth countries are members of GATT: Australia, Canada, Ceylon, Cyprus, Gambia, Ghana, Guyana, India, Jamaica, Kenya, Malawi, Malaysia, Malta, Nigeria, Pakistan, Rhodesia, Sierra Leone, Tanzania, Trinidad and Tobago, Uganda, United Kingdom and Ireland (and dependent territories), Zambia, Barbados.
Some other Commonwealth countries, as newly independent states, apply the GATT on a de facto basis: Botswana, Lesotho, Maldive Islands, Singapore, and Zambia.
While the reduction of tariffs and other barriers to trade has been the principal aim of the General Agreement it has also provided an internationally accepted code of rules in world trade, and its regular sessions have been useful as a forum for the discussion and settlement of international trade problems and disputes.
Developments have tended to whittle away most of the trading advantages which countries relying heavily on agricultural exports reasonably expected to get from GATT membership. There has been a growing disparity between the benefits accruing under GATT to the industrialised countries and the far less tangible advantages it provides for primary producing countries like New Zealand. This has been due primarily to the growing use of quantitative restrictions on agricultural products by most of the large industrialised countries as an aspect of their policies of agricultural protectionism.
Another round of comprehensive trade negotiations, known as the Kennedy Round, commenced formally on 4 May 1964. These negotiations are designed to achieve greater liberalisation in trade in both industrial and agricultural products.
INTERNATIONAL WHEAT AGREEMENT—The first International Wheat Agreement was negotiated in March 1949 and, with minor amendments, was renewed in 1953 and 1956. In 1959 a new three-year agreement was negotiated which differed in some major points from its predecessors. These features were carried over into the current agreement which came into force in August 1962.
The objectives of the International Wheat Agreement are to assure supplies of wheat to importing countries, and markets for wheat to exporting countries at equitable and stable prices. Under the terms of the 1956 Agreement New Zealand guaranteed to import 160,000 metric tons (5,878,994 bushels) of wheat annually. The guarantee to purchase became operative only when the price was at the minimum laid down in the agreement, and a similar guarantee to sell by exporters operated only when the price reached the maximum under the agreement. The maximum and minimum prices were $2.00 and $1.50 in Canadian currency based on Manitoba, Northern No. 1 wheat, in bulk, in store, Fort William/Port Arthur.
In the agreement which came into force on 1 August 1959, New Zealand, as a signatory, had a contractual obligation to purchase 90 percent of its imports under the agreement while the price was between the maximum and minimum prices. The maximum price for the basic wheat was reduced to $1.90 (Canadian), but the minimum remained at $1.50 (Canadian). At the maximum price, importers were released from their obligation to purchase, while exporters were required to supply the average of each importer's purchases over the first five of the previous six years.
In the current agreement the price limit has increased by 12 1/2 cents (Canadian) a bushel and, at the maximum price, exporters are now required to supply the average of each importer's purchases over the first four of the previous five years. New Zealand retained its 90 percent undertaking. The current agreement was due to expire on 31 July 1965. In view of trade negotiations on wheat and other cereals which have been taking place within the context of the General Agreement on Tariffs and Trade (GATT), the members of the agreement decided not to embark upon separate negotiations for a new wheat agreement. Instead the 1962 Agreement has been extended by means of protocols until July 1967, pending the outcome of the GATT negotiations.
INTERNATIONAL SUGAR AGREEMENT—The International Sugar Agreement of 1958, to which New Zealand acceded on 28 November 1960, came into effect on 1 January 1959. The agreement was negotiated at conferences held in Geneva in October 1958 under the auspices of the Economic and Social Council of the United Nations Organisation. It replaced the agreement negotiated in 1953 which had marked the end of several unsuccessful attempts over a long period from before 1939 to secure international collaboration on sugar matters.
The main objectives of the agreement, which differs little from the previous one, are to assure supplies of sugar to importing countries and markets for sugar exporting countries at equitable and stable prices. Under the agreement, as negotiated in 1958, participating importing countries undertook to restrict quantities of sugar purchased from non-participating exporting countries. When prevailing prices did not exceed 4 cents per lb U.S. currency, exporting countries were restricted in the quantities they might offer on the “free market” and were allocated specific quantities as “basic export tonnages”.
Provision was made in the agreement for a review of the price range and of basic export tonnages after three years. Accordingly a United Nations Sugar Conference was held in Geneva in September and again in December 1961, but there was failure to agree on export quotas for 1962 and 1963 and since that time the provisions of the agreement relating to limitation of imports, regulation of exports, and stabilisation of prices, have been inoperative.
The Agreement expired on 31 December 1963 but was extended by protocols until the end of 1966, although those articles that related to quotas and prices remained ineffective. Attempts have been made to negotiate a new agreement, establishing export, import, and price provisions. Until a successful conclusion to these negotiations is reached, further protocol extensions of the 1958 Agreement are likely.
New Zealand's annual requirements of raw sugar are now about 125,000 tons. Under a Memorandum of Understanding with the parties to the Commonwealth Sugar Agreement (New Zealand is not a party to the Agreement itself) Commonwealth exporters have agreed to supply 75,000 tons annually. Since 1 January 1957 this quantity has been purchased at the world price plus the margin of tariff preference ($7.50 per ton) which Commonwealth exporters would otherwise secure by selling in the United Kingdom. The arrangement continues indefinitely, although there is provision in the Memorandum of Understanding for review if circumstances warrant it. The sugar has been supplied by Queensland and Fiji. Much of the remainder of New Zealand's needs has been bought from the same sources, but purchases have sometimes been made from more distant foreign suppliers.
Before 1 January 1957 the guaranteed quantity of 75,000 tons was purchased at the Negotiated Price incorporated in the Commonwealth Sugar Agreement which is set annually after negotiations between the parties to the Agreement. At times, and especially in 1963 and for part of 1964, world prices were above the Negotiated Price, but over the whole period 1957 to 1965 New Zealand achieved considerable savings by buying under the revised pricing arrangements.
PRICE TRIBUNAL—The general duties and functions of the Price Tribunal under the Control of Prices Act 1947 include the fixing of prices for goods and services, the investigation of complaints with respect to prices, maintenance of a survey of the prices of goods or services, the institution of legal proceedings for offences in relation to prices, and the taking of such other steps as in its opinion may be necessary to prevent profiteering or the exploitation of the public. Sittings of the Tribunal are open to the public unless the Tribunal determines otherwise.
The Price Tribunal has power with respect to items subject to direct price control, to:
Make price orders fixing, in such manner as it thinks fit, the actual or the maximum or the minimum price for any goods sold in a specified market and under specified conditions. Price orders are published in the New Zealand Gazette, and must generally be displayed in any shop where the goods to which they relate are sold.
Authorise selling prices, which may be of general or special application.
The Tribunal has, in the case of some commodities, issued price orders which prescribe that maximum prices are to be calculated by adding specified percentages or amounts to costs. In other cases, where there has been a general cost increase resulting from the reduction or removal of subsidies, the raising of freight charges, or a wage increase prescribed by a general order of the Court of Arbitration, the position has sometimes been met by the issue of general price adjustment orders under which most manufacturers have been permitted to recover by means of price increases the whole or a specified part of such increased costs.
Since 1948 a policy of progressive decontrol has been followed. Those goods and services which remain under price control in terms of Part II of the Control of Prices Act are now set out in the Control of Prices (Positive List) Notice 1966 and fall mainly into two broad categories:
The first category comprises such essential food items as standard types of bread, flour, butter, and eggs. Charges for gas supply and drugs coming within the scope of the pharmaceutical benefits provided under the Social Security Scheme are also subject to price control.
The second category comprises items where retention of price control is considered necessary, because conditions of monopoly or quasi-monopoly apply at the level of manufacture or distribution or other factors exist which impede the operation of competition as an effective regulator of prices.
Important items coming within this group are sugar, yeast, imported bananas and oranges, wheat, tobacco and cigarettes, woolpacks, sacks, bottles and jars, electric light bulbs and cables, inorganic fertilisers, motor vehicles, storage batteries, motor tyres, diesel and fuel oil. Price control is also exercised over ferrous and non-ferrous metals as well as over a limited range of builders' and plumbers' requisites, such as baths, basins, sanitary earthenware, pipes, and nails.
It should be observed that certain prices controlled under other legislation do not come within the scope of the Control of Prices Act 1947. For example, the maximum price of motor spirits is fixed by Order in Council (on the recommendation of the Minister of Industries and Commerce) under the Motor Spirits (Regulation of Prices) Act 1933. Milk and cream prices are set by Order in Council on the recommendation of the New Zealand Milk Board under the Milk Act 1944.
TRADE PRACTICES ACT 1958—Under the Trade Practices Act 1958 a Trade Practices and Prices Commission was established, and an Examiner of Trade Practices and Prices was appointed. The functions of the Commission are to inquire into trade practices for the purpose of ascertaining whether any such practices are contrary to the public interest and to make orders requiring the amendment, discontinuance, or prohibiting the repetition of any such practices which it finds to be contrary to the public interest. There is a right of appeal to the Trade Practices Appeal Authority.
The Trade Practices and Prices Commission has conducted 25 inquiries. In 20 of these the trade practices, which were held by the Commission to be contrary to the public interest, were collective agreements among traders for the pricing of goods or the submitting of tenders for the supply of goods or services, and concerned glazing, wire netting, phonograph records, aerated waters, wire mattresses, male hairdressing, groceries, funerals, electric lamps, imported books, electric goods, bread at Masterton, New Zealand sea passage booking agencies, toys, quarry metals and building in the Waikato district, hormone weedkillers, the retreading of motor tyres, the marketing of television receivers and the sale of beer by breweries.
In the electric lamps case, the Commission did not order discontinuance of the collective pricing arrangements, but ordered the industry to discontinue its preferential discount scheme and to pass the resultant savings on to consumers. The agreement relating to wire mattresses was abandoned voluntarily and an undertaking given to the Commission that it would not be revived. The Commission deferred making an order in the case of television receivers but instead gave the parties the opportunity to revoke voluntarily their collective pricing arrangements and substitute individual agreements between each manufacturer and each retailer if they so desired. In taking this course the Commission wished to avoid the disruption which might have been caused by the making of a rigid order, having regard to the immaturity of the market in television receivers. The Commission's stand in this case is not to be regarded as an endorsement of the principle of individual resale price maintenance. The Commission did not make an order in respect of collective pricing of beer. In the other 17 cases, where the Commission has found collective pricing and tendering agreements or arrangements contrary to the public interest, it ordered their discontinuance.
The Trade Practices Appeal Authority has heard appeals against the orders relating to wire netting, hairdressing, grocery prices, books, drugs, the sea passage booking agencies, the retendering rule of the Waikato Master Builders, and the marketing of hormone weedkillers. The appeal was allowed in respect of two of the four grocers' associations, on the basis of the respective degrees of adherence to list prices, and, in respect of imported books, because of special characteristics of the bookselling trade and the importance of books in the fields of education, technology, and culture. The appeal by the distributor of drugs was also allowed on the ground that in the particular circumstances his refusal to continue to supply the complainant wholesaler was not adversely affecting the public interest. The appeal relating to the sea passage booking agencies was also allowed on the ground that in fact the agreement did not unreasonably reduce or limit competition or limit the supply of services (that is shipping services to intending passengers) within the meaning of the Act. In all other cases the appeals were disallowed.
In addition to the termination or amendment of trade practices by orders of the Commission an appreciable number of other trade practices have been terminated or amended following upon negotiations conducted by the Examiner with the parties concerned. The consultative provisions written into the Act in 1965 are facilitating this and have noticeably reduced the number of cases coming to public inquiry before the Commission. In the year after the passing of the 1965 legislation there were two public hearings but five further cases were dealt with by the consultative procedure. In four of these cases the Commission made orders without requiring any public hearing.
CONSUMER COUNCIL—A Consumer Council, whose functions are to protect and promote the interests of consumers of goods and services was established in 1959. Since 1 April 1967 it has operated with a new constitution under the Consumer Council Act 1966. The Council consists of 12 members appointed solely on the basis of personal qualifications by a representative Appointments Committee, and additional members are the Secretary of Industries and Commerce, the Director-General of the Department of Scientific and Industrial Research, and the Director-General of Health. District consumer committees are appointed by the Consumer Council.
Citizens may become associate members of Consumers Institute on payment of a fee of $1 a year, which entitles them to receive copies of a quarterly magazine, information broadsheets, newsletters, and other assistance from the organisation By October 1966, 54,500 persons had joined Consumers Institute. Those associate members who wish to take a more active part in the work may become members of local consumers' associations which have been formed in many centres.
MONETARY AND ECONOMIC COUNCIL-A Monetary and Economic Council was established under the Monetary and Economic Council Act 1961 to report on the extent to which stability in prices and other economic objectives are being achieved. In its first reports the Council dealt with the economic situation and the longer-term problems of slow growth and instability, and subsequent reports have dealt largely with the current economic situation and outlook.
PRICE STATISTICS—Actual prices of many goods and services at various levels are collected periodically by the Department of Statistics. The fields covered are retail prices, wholesale prices, export prices, import prices, share prices, and wool prices. In the case of retail and wholesale prices, direct inquiry is made; export and import prices (or strictly, unit values) are mainly derived from trade statistics, share prices from records of the stock exchanges, and wool prices from the New Zealand Wool Commission. In addition, average prices of many materials and products of manufacture are available from the statistics of industrial production. Some retail prices are given in the following table, and a wider coverage is published in the annual Report on Prices, Wages, and Labour Statistics; the chief use made of the prices collected, however, is in the compilation of price index numbers. These are, fundamentally, weighted averages of price ratios, the weighting being so arranged that the index numbers give a general indication of price movements in the field covered. The usual technique employs fixed weights with, however, provision for revision of the weighting pattern at suitable intervals.
Retail Prices—New Zealand retail prices (weighted average prices over 25 centres) at 15 November 1966 of a number of the commodities which enter into the Consumers' Price Index are shown hereunder.
| Item | Unit | Price |
|---|---|---|
| Cents | ||
| Potatoes | lb | 5.0 |
| Apples | lb | 14.1 |
| Cabbage | lb | 6.9 |
| Carrots | lb | 11.1 |
| Onions | lb | 10.3 |
| Oranges | lb | 13.3 |
| Peaches, canned | 29 oz tin | 37.9 |
| Peas, fresh, frozen | 10 oz packet | 21.2 |
| Beef— | ||
| Sirloin | lb | 43.5 |
| Prime rib | lb | 39.6 |
| Rump steak | lb | 55.2 |
| Blade steak | lb | 41.1 |
| Mince | lb | 33.7 |
| Corned silverside | lb | 41.2 |
| Sausages, beef | lb | 21.0 |
| Hogget— | ||
| Leg, knuckle end | lb | 34.3 |
| Forequarter | lb | 19.6 |
| Chops, middle loin | lb | 32.9 |
| Pork— | ||
| Leg | lb | 43.7 |
| Loin chops | lb | 44.8 |
| Tripe | lb | 14.6 |
| Sheep's liver | lb | 33.4 |
| Sheep's tongue | each | 5.4 |
| Ham, cooked, sliced | lb | 98.9 |
| Bacon, side | lb | 59.9 |
| Tarakihi, fillets | lb | 38.1 |
| Groper (Hapuku), pieces | lb | 39.5 |
| Sole or flounder, gutted | lb | 34.6 |
| Smoked fish | lb | 38.5 |
| Salmon, fancy pink | 7 3/4 oz tin | 37.2 |
| Milk, fresh, delivered | pint | 3.9 |
| Butter | lb | 19.6 |
| Cheese, mild | lb | 40.5 |
| Milk powder, full cream | 2 1/2 lb tin | 86.8 |
| Bread | 28 oz loaf | 6.3 |
| Block cake, madeira | lb | 31.2 |
| Flour | 25 lb | 67.4 |
| Breakfast cereal, oat type | 3 1b | 41.4 |
| Breakfast cereal, wheat type | 24 oz | 26.4 |
| Biscuits, chocolate, wheaten | 7 1/8 oz packet | 20.4 |
| Rice | lb | 9.8 |
| Sugar | 6 lb | 33.1 |
| Honey | 1 lb carton | 25.9 |
| Jam, apricot | 14 oz tin | 23.9 |
| Tea | lb | 68.0 |
| Cocoa | 1/4 lb packet | 25.7 |
| Coffee, ground, loose | lb | 85.0 |
| Coffee, instant | 4 oz jar | 67.8 |
| Salt | 5 lb bag | 22.5 |
| Baked beans | 16 oz tin | 20.3 |
| Tomato sauce | 10 oz bottle | 22.6 |
| Tomato soup | 11 oz tin | 13.9 |
| Aerated water | 10 oz bottle | 7.2 |
| Ice cream | pint block | 20.3 |
| Chocolate | 6 1/4 oz tablet | 25.0 |
| Meal, restaurant, three-course | each | 85.1 |
| Eggs | dozen | 41.4 |
| $ | ||
| Weekly dwelling rent, unfurnished | each dwelling | 7.56 |
| Concrete blocks | per 100 | 23.76 |
| Wallpaper | roll | 1.42 |
| Paint | gallon tin | 8.37 |
| Weekly costs of owner—occupancy of dwellings—Rates | each dwelling | 1.27 |
| Coal, domestic | 1/4 ton | 5.02 |
| Coke | cwt | 1.40 |
| Electric current (excluding water heating) | 150 kWh per month | 1.91 |
| Electric current (including water heating) | 510 kWh per month | 4.75 |
| Gas, domestic | 1,600 cub ft per month | 2.58 |
| Kerosene, domestic use | gallon | 0.28 |
| Fuel oil, domestic heating, delivered | gallon | 0.19 |
| Refrigerator, 9.25 cu. ft. dual temp. | each | 199.00 |
| Washing machine, semi-automatic, spin-dry | each | 219.00 |
| Vacuum cleaner | each | 53.75 |
| Radio, table model | each | 43.61 |
| Radio, transistor, portable | each | 51.19 |
| Television set, 23 inch consolette | each | 261.66 |
| Television hire | 2 years | 219.60 |
| $ | ||
| Electric radiator | each | 39.90 |
| Electric fry pan | each | 29.38 |
| Electric jug | each | 10.38 |
| Electric toaster | each | 8.18 |
| Electric iron, dry | each | 9.95 |
| Electric blanket | each | 31.50 |
| Electric hand drill | each | 23.10 |
| Lawnmower, hand type | each | 23.32 |
| Lawnmower, rotary type | each | 138.84 |
| Piano, upright | each | 400,87 |
| Perambulator | each | 51.65 |
| Dining room suite | each | 81.48 |
| Cocktail cabinet | each | 103.18 |
| Tallboy | each | 23,72 |
| Child's cot | each | 20.32 |
| Lounge suite | each | 195.48 |
| Bedstead | each | 20.42 |
| Mattress, kapok | each | 15.64 |
| Mattress, inner-spring | each | 63.60 |
| Mattress, foam rubber | each | 51.88 |
| Venetian blinds, 72 inch wide, 54 inches drop | each | 22.22 |
| Alarm clock | each | 6.26 |
| Linoleum | yard | 4.01 |
| Floor tiles, vinyl, 9 in. by 9 in. (veneer) | each | 0.12 |
| Carpet, 27 in. | yard | 5.20 |
| Doormat, coir | each | 1.37 |
| Drapery— | ||
| Blankets, single, all wool | pair | 16.95 |
| Sheets, single | pair | 5.42 |
| Pillow, kapok | each | 1.60 |
| Towel, turkish | each | 1.34 |
| Tea towel, linen | each | 0.60 |
| Plate, 10 in., replacement type | each | 0.48 |
| Tea set, 21 piece, bone china | set | 13.51 |
| Knives, table, stainless | 1/2 doz | 4.80 |
| Forks, table, E.P.N.S. | 1/2 doz | 4.53 |
| Preserving jars, glass, quart, 8 in. | doz | 1.78 |
| Casserole dish | each | 1.83 |
| Piedish, enamel, 11 in. | each | 0.80 |
| Mixing bowl, stainless steel 8 in. | each | 2.32 |
| Saucepan, aluminium, 8 in. | each | 5.02 |
| Dustbin, standard size | each | 3.68 |
| Broom | each | 2.73 |
| Scrubbing brush | each | 0.52 |
| Bucket, plastic, 2 gallon | each | 1.09 |
| Hammer carpenters, steel shaft | each | 3.52 |
| Plane | each | 5.44 |
| Spade, garden | each | 4.45 |
| Soap, powder | 36 oz packet | 0.36 |
| Detergent, plastic container | 19 1/2 oz can | 0.48 |
| Household cleaning paste | standard tin | 0.28 |
| Disinfectant | 4 oz bottle | 0.32 |
| Fly spray | 12 flu oz can | 1.06 |
| Boot polish | 2 3/4 oz tin | 0.14 |
| Floor polish | 8 oz tin | 0.52 |
| Electric light bulb, 100 watt | each | 0.22 |
| Torch battery, dry cell | each | 0.12 |
| Telephone rental, private (main exchange) | 1 year | 34.00 |
| Telegram, 15 words | each | 0.20 |
| Postage, letter | each | 0.03 |
| Dry cleaning, men's two-piece suit | per suit | 1.17 |
| Laundering sheets | 6 single | 0.67 |
| Men's— | ||
| Raincoat, woollen garberdine | each | 31.11 |
| Parka, unlined | each | 9.32 |
| Raincoat, nylon | each | 8.02 |
| Hat, felt | each | 6.02 |
| Suit, worsted, ready made, two-piece | each | 43.16 |
| Sports coat, ready made | each | 26.57 |
| Trousers, sports | pair | 13.99 |
| Trousers, jeans | pair | 2.87 |
| Shirt, cotton, white | each | 4.11 |
| Shirt, brushed cotton | each | 2.02 |
| Cardigan, all wool | each | 11.96 |
| Bathing trunks, bri-nylon | each | 3.63 |
| Pyjamas, flannelette | pair | 3.48 |
| Singlet, athletic | each | 0.82 |
| Socks | pair | 1.14 |
| Handkerchief | each | 0.25 |
| Women's— | ||
| Suit, coat and skirt, ready made each | each | 40.86 |
| Coat, woollen, winter | each | 38.50 |
| Raincoat, proofed poplin | each | 18.43 |
| Frock, polished cotton | each | 7.58 |
| Skirt, permanent, full pleated | each | 12.90 |
| Slacks, tailored, ready made | pair | 9.17 |
| Cardigan, all wool | each | 9.28 |
| Wool, hand knitting | 1 oz | 0.28 |
| Women's— | ||
| Swimsuit, brinylon | each | 11.92 |
| Nightdress, nylon | each | 5.69 |
| Nightdress, whaceyette | each | 3.35 |
| Underslip, | each | 4.99 |
| Vest, silk and wool | each | 1.72 |
| Panties, interlock | pair | 0.90 |
| Brassiere, cotton | each | 2.65 |
| Corset, lycra | each | 9.95 |
| Nylons, seamless, 15 denier | pair | 1.18 |
| Umbrella, nylon | each | 6.23 |
| Boys— | ||
| Raincoat, cotton | each | 10.19 |
| Blazer | each | 11.71 |
| Trousers, shorts, worsted | pair | 4.49 |
| Shirt, cotton, college style | each | 2.79 |
| Shirt, T-shirt, cotton | each | 1.12 |
| Pullover, woollen | each | 5.20 |
| Socks | pair | 1.22 |
| Girls— | ||
| Hat, Panama | each | 1.36 |
| Beret | each | 0.86 |
| Gymfrock | each | 10.35 |
| Frock, summer uniform | each | 6.48 |
| Blouse, college, cotton | each | 2.38 |
| Pyjamas, winceyette | pair | 2.52 |
| Bloomers, interlock | pair | 0.66 |
| Sockettes | pair | 0.63 |
| Infants'— | ||
| Nursery squares | doz | 4.17 |
| Baby's vest | each | 0.44 |
| Baby wool | 1 oz | 0.31 |
| Piece goods— | ||
| Tweed, velour coating | yard | 3.30 |
| Viyella | yard | 1.92 |
| Sail cloth | yard | 0.75 |
| Rayon | yard | 1.10 |
| Dress pattern | each | 0.60 |
| Men's— | ||
| Boots, heavy | pair | 11.68 |
| Shoes, light | pair | 12.03 |
| Sandshoes | pair | 1.68 |
| Jandals (thongs) | pair | 1.63 |
| Slippers, leather | pair | 4.74 |
| Shoe repairs, half soled and heeled | pair | 2.38 |
| Women's | ||
| Shoes, heavy | pair | 9.46 |
| Shoes, light | pair | 9.48 |
| Slippers, felt | pair | 2.36 |
| Shoe repairs, cemented leather sole, heel tip, and toe plates | pair | 1.72 |
| Boys— | ||
| Football boots | pair | 6.15 |
| Shoes, heavy | pair | 6.02 |
| Gumboots | pair | 3.78 |
| Shoe repairs | pair | 1.79 |
| Girls— | ||
| Shoes, school | pair | 5.22 |
| Shoes, light | pair | 5.24 |
| Shoe repairs | pair | 1.36 |
| Infants' shoes, plastic sole | pair | 1.32 |
| Petrol, 83 octane | gallon | 0.32 |
| Bicycle, men's sports roadster | each | 49.00 |
| Bicycle tyre | each | 1.98 |
| Bicycle tube | each | 0.92 |
| Cigarettes | packet of 20 | 0.27 |
| Tobacco, cigarette | 2 oz packet | 0.46 |
| Aspirin, packet of 25 | per packet | 0.20 |
| Toothbrush | each | 0.22 |
| Toothbrush, large tube | per tube | 0.30 |
| Toilet soap, bath size tablet | each | 0.12 |
| Toilet paper | per 3 rolls | 0.28 |
| Face powder, block type | each | 0.35 |
| Hair rinse | each | 0.65 |
| Razor blades, stainless steel | packet | 0.25 |
| Electric razor | each | 19.75 |
| Baby talcum powder | small tin | 0.26 |
| Attache case, fibre | each | 2.16 |
| Leather brief case | each | 14.31 |
| Suitcase, large | each | 8.72 |
| Men's watch, wristlet | each | 29.87 |
| Newspaper, daily | each | 0.03 |
| Library subscription | per book | 0.09 |
| Popular book, paper back | each | 0.55 |
| Writing pad | each | 0.15 |
| Envelopes, 3 3/4 in. by 4 3/4 in. | packet of 16 | 0.09 |
| Developing and printing black and white film | per film | 0.60 |
| Camera film, colour | each | 3.16 |
| Tricycle, child's | each | 21.28 |
| Teddy bear | each | 5.62 |
| Junior engineering construction set | each | 4.50 |
| Tennis racquet | each | 7.11 |
| Tennis balls | pair | 0.66 |
| Bowls, outdoor | set of 4 | 24.50 |
| Rifle | each | 28.94 |
| Ammunition, .303 | box of 20 | 2.57 |
| Optician fees, full examination and spectacles with case | each | 14.47 |
| Dental extraction | each | 2.14 |
| Dental fillings | each | 1.74 |
| Dentures | set | 57.32 |
| Medical expenses (excess over Social Security) private general hospital | per day | 4.38 |
| Cinema admission | seat | 0.41 |
| Football admission | each | 0.22 |
| Football club subscriptions | each | 2.12 |
| Tennis subscriptions | each | 9.34 |
| Radio licence | 1 year | 3.00 |
| Television licence | 1 year | 13.00 |
| Haircut, men | each | 0.47 |
| Haircut, women | each | 0.50 |
| Hairset | each | 1.15 |
| Permanent wave | each | 5.32 |
| Union dues (annual subscription) | per member | 5.37 |
| Funeral, burials | each | 171.45 |
| Funeral, cremation | each | 143.32 |
International Comparisons—The two tables next following provide comparisons of retail and wholesale prices respectively between New Zealand and certain other countries. All the prices, which relate generally to the month of September 1966, have been converted into New Zealand currency and the Imperial liquid and dry measures has been adopted as a common unit of quantity basis. In the first table prices shown for the United States of America do not include sales tax.
| INTERNATIONAL COMPARISON OF RETAIL PRICES OF BASIC FOODSTUFFS | |||||||
|---|---|---|---|---|---|---|---|
| (At September 1966 in New Zealand Currency) | |||||||
| Item | Unit | New Zealand (Average 25 Centres) | Australia (Sydney) | Canada (Dominion Average) | Great Britain* (London) | South Africa (Cape Town) | United States of America (Average 46 Large Cities) |
* November 1966. † 1 3/4 lb. ‡ At price for 3 lb lots. § Loose. || September quarter, 1966. ¶ Sirloin. Cooking quality only available. g Hogget. p 29 oz. Sources: Australia: Commonwealth Statistician. Canada: Dominion Bureau of Statistics. Great Britain: New Zealand High Commissioner. South Africa: Bureau of Census and Statistics. U.S.A.: Monthly Labor Review. | |||||||
| cents | cents | cents | cents | cents | cents | ||
| Bread | 2 lb | 6.2† | 14.4 | 25.7 | 12.5† | 9.0 | 32.8 |
| Flour | 25 lb | 67.4 | 152.7 | 193.7 | 116.3‡ | 106.9 | 216.4 |
| Tea | lb | 68.1 | 49.2 | .. | 59.2 | 73.8 | .. |
| Coffee | lb | 85.6§ | .. | 61.8 | 74.2 | 80.7 | 58.9 |
| Sugar | lb | 5.9 | 7.6 | 6.2 | 6.7 | 6.0 | 8.7 |
| Milk (fresh) | quart | 7.7 | 18.3 | 18.3 | 16.7 | 14.2 | 18.3 |
| Butter | lb | 19.6 | 41.1 | 44.6 | 32.5 | 41.0 | 62.9 |
| Cheese | lb | 40.5 | 34.4 | 50.2 | 31.7 | 35.0 | 63.0 |
| Bacon | lb | 59.0 | 74.9 | 94.6 | 47.9 | 53.1 | 71.6 |
| Prunes | lb | 32.2 | .. | .. | 20.4 | 30.9 | .. |
| Canned peaches | 30 oz tin | 38.1p | 24.9 | 40.4 | 25.0 | 25.0 | .. |
| Beef, rib roast | lb | 38.9 | 40.7|| | 69.4 | 40.0 | 38.9¶ | 66.5 |
| Mutton, leg | lbg | 34.1 | 24.3|| | 60.2 | .. | 39.9 | .. |
| Pork— | |||||||
| Leg | lb | 42.6 | 48.2|| | .. | 41.7 | 37.1 | .. |
| Chops | lb | 44.1 | 49.2|| | 60.8 | 58.3 | 37.4 | 76.7 |
| Margarine | lb | ** | 30.7 | 24.7 | 20.0 | 20.6 | 20.7 |
| COMPARISON OF WHOLESALE PRICES OF CERTAIN COMMODITIES | |||||
|---|---|---|---|---|---|
| Item | Unit | New Zealand, August 1966* | Canada, September 1966 | Great Britain, September 1966 | United States of America, September 1966 |
* Priced once each quarter. † Price excluding tax (including tax the price ranges from $U.S. 0.18 to $0.20 according to the State). Sources: Canada: Prices and Price Indexes - Dominion Bureau of Statistics. Great Britain: Wheat and Oats - Ministry of Agriculture, Fisheries, and Food: butter and cheese-New Zealand Dairy Board: motor spirits - Ministry of Power. U.S.A.: Survey of Current Business. | |||||
| $ | $ | $ | $ | ||
| Wheat | bushel | 1.45 | 1.39 | 1.13 | 1.49 |
| Oats | bushel | 0.75 | 0.73 | 0.72 | 0.67 |
| Flour | short ton | 23.07 | 107.20 | .. | 97.43 |
| Sugar | cwt | 5.71 | 4.44 | .. | 7.76 |
| Butter | lb | 0.19 | 0.42 | 0.27 | 0.54 |
| Cheese | lb | 0.22 | .. | 0.23 | 0.40 |
| Motor spirits | gallon | 0.29 | .. | 0.53 | 0.10† |
CONSUMERS' PRICE INDEX—An historical survey of retail prices in New Zealand was given in the report Consumers' Price Index, 1955 Revision. Extracts from that publication were also reprinted as an appendix to the 1957 Yearbook (pages 1214-37).
The Consumers' Price Index was revised in 1965 and index numbers on base 1965 = 1000 have been published in the Monthly Abstract of Statistics commencing with the January 1966 All Food Index. Complete details of the new revised index are contained in the Report on Consumers' Price Index Revision 1965. Certain Consumers' Price Index numbers for the first quarter of 1967 on the new base 1965 = 1000 are given in the Latest Statistical Information at the end of this volume. A brief summary of the salient features of the latest index is as follows:
The basic formula used is that of Laspeyres in its aggregative form.
The index relates primarily to urban and country town dwellers living as families.
About 90 percent of personal expenditure is covered.
The number of items regularly priced is 535.
The base is: 1962-63 consumption costed at 1965 prices.
The sources of group and commodity weights were (1) Census of Distribution 1962-63; (2) Industrial or factory statistics; (3) Import and export data; (4) extension of regularly compiled statistics of consumable goods. Where considered desirable the base weight assigned to selected items was broadened to allow for expenditure on kindred items not selected for pricing.
Prices are collected by field officers in 27 centres, including two combined areas.
A scientific sample of rented houses and flats was selected.
Special techniques are employed for costs of owner-occupiers, for prices of seasonal fruits, vegetables and eggs, and for transport charges.
Index numbers are compiled for all food and its subgroups at monthly intervals, and for all other groups and subgroups at quarterly intervals.
Individual index numbers are published for the four chief centres, 10 larger centres, six smaller North Island centres combined and similarly five smaller South Island centres, showing each centre or group of centres on a common base and on its own base.
To provide a continuous series the pre-revision all-groups index has been converted to a 1965 base.
Costs of the following items are, for various reasons, outside the scope of the index: hotel accommodation, licensed and private; air transport; legal fees, commissions on sales, other than those incurred in the erection of house properties; gambling; church and charitable donations; private and boarding school fees; instalment credit interest and similar financial charges; personal accident insurance; photographers' charges; wages of domestic servants, jobbing gardeners, etc.; fees to chiropractors, herbalists, chiropodists, etc.; sundry licences (marriage, dog, etc.); direct taxation; savings, including amortisations of capital debts, investments, and life insurance; spirits and wine; jewellery and florists' goods; durable goods other than replacements; private holiday transport.
In general the index assumes a constant pattern of expenditure for all centres, whether large cities or provincial centres, whether with warm or cool climates, etc. In transportation, however, the index compromises by setting up a constant base expenditure on transport for all centres, but allowing a varying dissection between the various modes of transport from centre to centre, according to local circumstances. Consequently there are no true “each on all” indices for transportation, but “each on each” indices can be used to produce “all on all” indices. (“Each on all” means an index for an individual centre which uses as base the average for all centres, etc.)
Long-term Linked Series—The table immediately following provides a long-term linked series of retail price (all groups) index numbers combining the present Consumers' Price Index with its predecessors back to 1907, the whole being placed on a uniform base, i.e., the calendar year 1965.
| CONSUMERS' PRICES INDEX (ALL GROUPS) | |
|---|---|
| LONG-TERM LINKED SERIES | |
| Base: Calendar year 1965 (= 1000) | |
| Year | Index Number |
| 1907 | 234 |
| 1908 | 235 |
| 1909 | 232 |
| 1910 | 234 |
| 1911 | 233 |
| 1912 | 240 |
| 1913 | 245 |
| 1914 | 252 |
| 1915 | 271 |
| 1916 | 291 |
| 1917 | 315 |
| 1918 | 341 |
| 1919 | 366 |
| 1920 | 409 |
| 1921 | 415 |
| 1922 | 382 |
| 1923 | 385 |
| 1924 | 395 |
| 1925 | 403 |
| 1926 | 405 |
| 1927 | 402 |
| 1928 | 404 |
| 1929 | 403 |
| 1930 | 394 |
| 1931 | 364 |
| 1932 | 336 |
| 1933 | 319 |
| 1934 | 324 |
| 1935 | 336 |
| 1936 | 347 |
| 1937 | 370 |
| 1938 | 382 |
| 1939 | 397 |
| 1940 | 415 |
| 1941 | 431 |
| 1942 | 445 |
| 1943 | 455 |
| 1944 | 464 |
| 1945 | 470 |
| 1946 | 474 |
| 1947 | 488 |
| 1948 | 527 |
| 1949 | 536 |
| 1950 | 566 |
| 1951 | 629 |
| 1952 | 678 |
| 1953 | 709 |
| 1954 | 741 |
| 1955 | 760 |
| 1956 | 786 |
| 1957 | 803 |
| 1958 | 839 |
| 1959 | 871 |
| 1960 | 877 |
| 1961 | 893 |
| 1962 | 916 |
| 1963 | 935 |
| 1964 | 967 |
| 1965 | 1,000 |
| 1966 | 1,028 |
The following diagram shows the movement in consumers' price index numbers, the data being drawn from the figures given in the preceding table (long-terms linked series) and the quarterly table following.
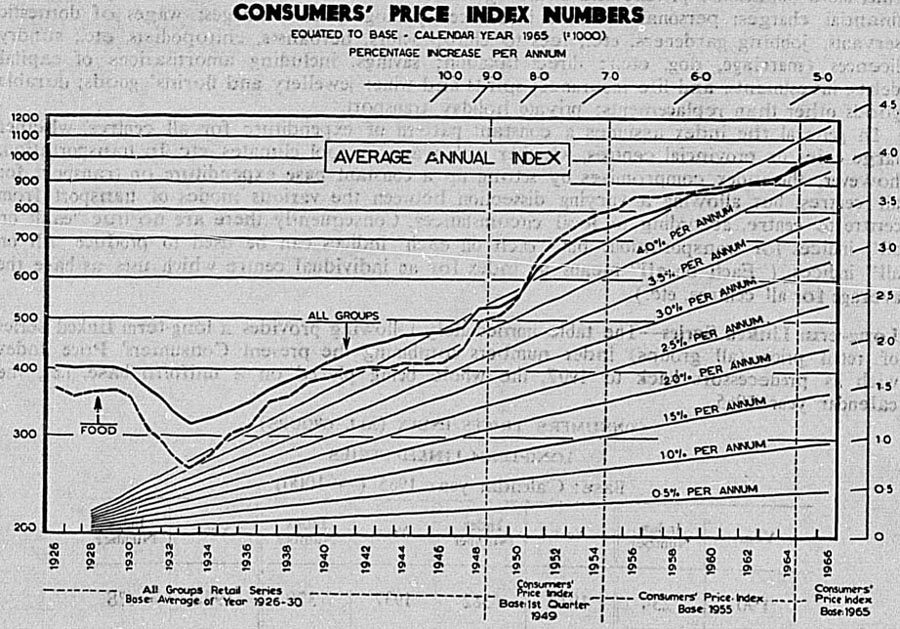
Current Consumers' Price Index—The tables which now follow relate to the current Consumers' Price Index only.
The first table supplies all-groups index numbers and index numbers of individual groups and subgroups for 25 centres combined. The group and subgroup weights are also shown as percentages of the base expenditure.
| CONSUMERS' PRICE INDEX—QUARTERLY INDEX NUMBERS (ALL GROUPS) TWENTY-FIVE CENTRES COMBINED | |||||||
|---|---|---|---|---|---|---|---|
| Base: Weighted average twenty-five centres, 1965 (= 1000) | |||||||
| Food | Housing | Household Operation | Apparel | Transportation | Miscellaneous | All Groups | |
| Groups— | |||||||
| Percentages of base expenditure | 30.09 | 17.99 | 11.21 | 13.12 | 9.44 | 18.15 | 100.00 |
| Calendar year— | |||||||
| 1965 | 1,000 | 1,000 | 1,000 | 1,000 | 1,000 | 1,000 | 1,000 |
| 1966 | 1,018 | 1,053 | 1,010 | 1,016 | 1,037 | 1,034 | 1,028 |
| Quarter ended— | |||||||
| 1966— | |||||||
| 31 March | 1,020 | 1,033 | 1,003 | 1,007 | 1,026 | 1,021 | 1,019 |
| 30 June | 1,019 | 1,046 | 1,007 | 1,012 | 1,037 | 1,027 | 1,025 |
| 30 September | 1,018 | 1,062 | 1,010 | 1,020 | 1,039 | 1,039 | 1,031 |
| 31 December | 1,015 | 1,073 | 1,021 | 1,026 | 1,048 | 1,047 | 1,036 |
| Food | Housing | Household Operation | ||||||
|---|---|---|---|---|---|---|---|---|
| Fruits and Vegetables | Meat, Fish and poultry | Other Foods and Eggs | Rent | Home Ownership | Fuel and Light | Home Furnishings | Domestic Supplies and Services | |
| Subgroups— | ||||||||
| Percentages of base expenditure | 5.89 | 9.22 | 14.98 | 5.50 | 12.49 | 2.82 | 5.59 | 2.80 |
| Calendar year— | ||||||||
| 1965 | 1,000 | 1,000 | 1,000 | 1,000 | 1,000 | 1,000 | 1,000 | 1,000 |
| 1966 | 1,030 | 1,040 | 1,000 | 1,048 | 1,056 | 1,020 | 1,003 | 1,014 |
| Quarter ended— | ||||||||
| 1966— | ||||||||
| 31 March | 1,056 | 1,029 | 1,000 | 1,035 | 1,032 | 1,010 | 999 | 1,005 |
| 30 June | 1,062 | 1,027 | 997 | 1,045 | 1,046 | 1,012 | 1,000 | 1,014 |
| 30 September | 1,013 | 1,040 | 1,006 | 1,054 | 1,065 | 1,021 | 1,001 | 1,017 |
| 31 December | 989 | 1,063 | 996 | 1,058 | 1,079 | 1,039 | 1,011 | 1,022 |
| Apparel | Transportation | Miscellaneous | All Groups | |||||
|---|---|---|---|---|---|---|---|---|
| Clothing | Footwear | Public Transport | Private Transport | Tobacco and Alcohol | Other Supplies | Other Services | ||
| Subgroups— | ||||||||
| Percentages of base expenditure | 10.91 | 2.21 | 2.38 | 7.06 | 7.64 | 5.66 | 4.85 | 100.00 |
| Calendar year— | ||||||||
| 1965 | 1,000 | 1,000 | 1,000 | 1,000 | 1,000 | 1,000 | 1,000 | 1,000 |
| 1966 | 1,013 | 1,030 | 1,021 | 1,043 | 1,023 | 1,037 | 1,047 | 1,028 |
| Quarter ended— | ||||||||
| 1966— | ||||||||
| 31 March | 1,006 | 1,009 | 1,005 | 1,033 | 1,023 | 1,011 | 1,029 | 1,019 |
| 30 June | 1,009 | 1,028 | 1,015 | 1,045 | 1,023 | 1,024 | 1,038 | 1,025 |
| 30 September | 1,017 | 1,037 | 1,014 | 1,047 | 1,023 | 1,050 | 1,053 | 1,031 |
| 31 December | 1,022 | 1,045 | 1,052 | 1,047 | 1,023 | 1,062 | 1,069 | 1,036 |
In the table which follows monthly figures for the food group are shown for all index centres combined.
| CONSUMERS' PRICE INDEX—MONTHLY INDEX NUMBERS (FOOD), TWENTY-FIVE CENTRES COMBINED | ||||
|---|---|---|---|---|
| Base: Weighted average twenty-five centres, 1965 (= 1000) | ||||
| Period | Fruits and Vegetables | Meat and Fish | Other Foods | All Food |
| Calendar year— | ||||
| 1965 | 1,000 | 1,000 | 1,000 | 1,000 |
| Month— | ||||
| 1966—January | 1,064 | 1,029 | 1,000 | 1,021 |
| February | 1,035 | 1,030 | 1,000 | 1,016 |
| March | 1,071 | 1,030 | 1,000 | 1,023 |
| April | 1,073 | 1,028 | 997 | 1,021 |
| May | 1,052 | 1,026 | 997 | 1,017 |
| June | 1,060 | 1,027 | 998 | 1,019 |
| July | 1,045 | 1,032 | 998 | 1,017 |
| August | 1,011 | 1,038 | 1,001 | 1,014 |
| September | 984 | 1,051 | 1,019 | 1,022 |
| October | 989 | 1,059 | 998 | 1,015 |
| November | 976 | 1,064 | 991 | 1,010 |
| December | 1,001 | 1,065 | 1,000 | 1,020 |
The following tables distinguish individual centres and groupings of centres, but the subgroup indices are omitted. Attention is called, however, to the two-fold method of presentation: in the first place current prices in each centre are compared with prices in the same centre during the base period; in the second, current prices in each centre are compared with average prices over all the 25 centres in the base period. Where the base is the individual centre, the index numbers are specially designed to show price movements in each centre. Vertical comparisons can also be made but they will show the relative amount of price movements in respective centres, not relative current price levels.
In the second method, where the base is average prices over the 25 centres, horizontal or vertical comparisons may be made to compare relative price levels. However, these index numbers do not indicate how much dearer or cheaper it is to live in one centre or another, but only how much higher or lower retail price levels are in one centre than another. The construction of the index assumes the same consumption habits in all centres, regardless of size, climate, etc.
| CONSUMERS' PRICE INDEX—GROUP INDEX NUMBERS FOR INDIVIDUAL CENTRES AND GROUPINGS OF CENTERS—continued | ||||||||||||
|---|---|---|---|---|---|---|---|---|---|---|---|---|
| Base: Weighted average each centre, and grouping, separately, 1965 (= 1000) | ||||||||||||
| Centre | Food | Housing | ||||||||||
| Annual | First Quarter | Second Quarter | Third Quarter | Fourth Quarter | Annual | Annual | First Quarter | Second Quarter | Third Quarter | Fourth Quarter | Annual | |
| 1965 | 1966 | 1966 | 1966 | 1966 | 1966 | 1965 | 1966 | 1966 | 1966 | 1966 | 1966 | |
| Auckland | 1,000 | 1,028 | 1,025 | 1,012 | 1,006 | 1,018 | 1,000 | 1,041 | 1,053 | 1,070 | 1,077 | 1,060 |
| Wellington-Hutt | 1,000 | 1,017 | 1,024 | 1,023 | 1,017 | 1,020 | 1,000 | 1,031 | 1,045 | 1,061 | 1,076 | 1,053 |
| Christchurch | 1,000 | 1,026 | 1,006 | 1,009 | 1,016 | 1,014 | 1,000 | 1,037 | 1,044 | 1,062 | 1,074 | 1,054 |
| Dunedin | 1,000 | 1,025 | 1,014 | 1,017 | 1,028 | 1,021 | 1,000 | 1,025 | 1,047 | 1,056 | 1,069 | 1,049 |
| Four chief centres | 1,000 | 1,025 | 1,019 | 1,014 | 1,014 | 1,018 | 1,000 | 1,036 | 1,049 | 1,065 | 1,075 | 1,056 |
| Hamilton | 1,000 | 1,015 | 1,021 | 1,026 | 1,022 | 1,021 | 1,000 | 1,034 | 1,045 | 1,059 | 1,066 | 1,051 |
| Tauranga | 1,000 | 1,027 | 1,035 | 1,029 | 1,007 | 1,025 | 1,000 | 1,042 | 1,052 | 1,069 | 1,084 | 1,061 |
| Rotorua | 1,000 | 1,026 | 1,034 | 1,026 | 1,015 | 1,025 | 1,000 | 1,056 | 1,069 | 1,093 | 1,109 | 1,082 |
| New Plymouth | 1,000 | 1,022 | 1,023 | 1,013 | 1,011 | 1,018 | 1,000 | 1,018 | 1,032 | 1,046 | 1,057 | 1,038 |
| Napier-Hastings | 1,000 | 1,003 | 1,014 | 1,010 | 1,008 | 1,009 | 1,000 | 1,027 | 1,048 | 1,052 | 1,064 | 1,048 |
| Wanganui | 1,000 | 1,011 | 1,018 | 1,027 | 1,019 | 1,019 | 1,000 | 1,032 | 1,040 | 1,051 | 1,067 | 1,047 |
| Palmerston North | 1,000 | 1,013 | 1,014 | 1,016 | 1,007 | 1,013 | 1,000 | 1,032 | 1,041 | 1,061 | 1,076 | 1,053 |
| Nelson | 1,000 | 1,014 | 1,021 | 1,021 | 1,018 | 1,019 | 1,000 | 1,041 | 1,035 | 1,056 | 1,069 | 1,050 |
| Timaru | 1,000 | 1,017 | 1,004 | 1,011 | 1,020 | 1,013 | 1,000 | 1,028 | 1,037 | 1,062 | 1,070 | 1,049 |
| Invercargill | 1,000 | 1,022 | 1,007 | 1,026 | 1,032 | 1,022 | 1,000 | 1,021 | 1,031 | 1,043 | 1,064 | 1,040 |
| Ten larger centres | 1,000 | 1,016 | 1,018 | 1,021 | 1,016 | 1,018 | 1,000 | 1,032 | 1,043 | 1,058 | 1,071 | 1,051 |
| Six smaller North Island centres | 1,000 | 1,013 | 1,023 | 1,024 | 1,017 | 1,019 | 1,000 | 1,027 | 1,039 | 1,060 | 1,077 | 1,051 |
| Five smaller South Island centres | 1,000 | 1,015 | 1,013 | 1,015 | 1,021 | 1,016 | 1,000 | 1,015 | 1,044 | 1,052 | 1,049 | 1,040 |
| Twenty-five centres combined | 1,000 | 1,020 | 1,019 | 1,018 | 1,015 | 1,018 | 1,000 | 1,033 | 1,046 | 1,062 | 1,073 | 1,053 |
| Centre | Household Operation | Apparel | ||||||||||
|---|---|---|---|---|---|---|---|---|---|---|---|---|
| Annual | First Quarter | Second Quarter | Third Quarter | Fourth Quarter | Annual | Annual | First Quarter | Second Quarter | Third Quarter | Fourth Quarter | Annual | |
| 1965 | 1966 | 1966 | 1966 | 1966 | 1966 | 1965 | 1966 | 1966 | 1966 | 1966 | 1966 | |
| Auckland | 1,000 | 1,006 | 1,012 | 1,016 | 1,029 | 1,016 | 1,000 | 1,011 | 1,016 | 1,028 | 1,031 | 1,021 |
| Wellington-Hutt | 1,000 | 1,010 | 1,010 | 1,012 | 1,050 | 1,021 | 1,000 | 1,008 | 1,010 | 1,017 | 1,026 | 1,016 |
| Christchurch | 1,000 | 1,002 | 1,000 | 1,006 | 1,011 | 1,005 | 1,000 | 1,012 | 1,012 | 1,027 | 1,036 | 1,024 |
| Dunedin | 1,000 | 1,001 | 1,004 | 1,005 | 1,011 | 1,005 | 1,000 | 1,001 | 1,008 | 1,013 | 1,016 | 1,009 |
| Four chief centres | 1,000 | 1,005 | 1,008 | 1,012 | 1,028 | 1,013 | 1,000 | 1,009 | 1,015 | 1,024 | 1,029 | 1,020 |
| Hamilton | 1,000 | 1,000 | 1,005 | 1,012 | 1,013 | 1,008 | 1,000 | 1,000 | 1,007 | 1,012 | 1,013 | 1,008 |
| Tauranga | 1,000 | 1,004 | 1,007 | 1,006 | 1,033 | 1,012 | 1,000 | 1,004 | 1,009 | 1,017 | 1,017 | 1,012 |
| Rotorua | 1,000 | 1,000 | 1,002 | 999 | 1,005 | 1,002 | 1,000 | 1,001 | 1,003 | 1,018 | 1,019 | 1,008 |
| New Plymouth | 1,000 | 999 | 1,002 | 1,010 | 1,013 | 1,006 | 1,000 | 1,010 | 1,015 | 1,024 | 1,018 | 1,020 |
| Napier-Hastings | 1,000 | 999 | 1,004 | 1,004 | 1,014 | 1,005 | 1,000 | 1,005 | 1,014 | 1,019 | 1,026 | 1,016 |
| Wanganui | 1,000 | 998 | 1,007 | 1,009 | 1,011 | 1,006 | 1,000 | 1,009 | 1,015 | 1,022 | 1,026 | 1,018 |
| Palmerston North | 1,000 | 1,000 | 1,001 | 1,019 | 1,021 | 1,010 | 1,000 | 1,005 | 1,007 | 1,015 | 1,018 | 1,011 |
| Nelson | 1,000 | 1,012 | 1,013 | 1,015 | 1,022 | 1,016 | 1,000 | 1,007 | 1,011 | 1,017 | 1,017 | 1,013 |
| Timaru | 1,000 | 998 | 1,001 | 1,005 | 1,009 | 1,003 | 1,000 | 1,004 | 1,011 | 1,020 | 1,026 | 1,015 |
| Invercargill | 1,000 | 995 | 1,000 | 1,002 | 1,006 | 1,001 | 1,000 | 1,003 | 1,006 | 1,013 | 1,015 | 1,009 |
| Ten larger centres | 1,000 | 1,000 | 1,004 | 1,009 | 1,014 | 1,007 | 1,000 | 1,004 | 1,009 | 1,016 | 1,019 | 1,012 |
| Six smaller North Island centres | 1,000 | 1,003 | 1,008 | 1,007 | 1,014 | 1,008 | 1,000 | 1,005 | 1,013 | 1,019 | 1,032 | 1,017 |
| Five smaller South Island centres | 1,000 | 1,004 | 1,005 | 1,008 | 1,011 | 1,007 | 1,000 | 1,002 | 1,008 | 1,013 | 1,019 | 1,011 |
| Twenty-five centres combined | 1,000 | 1,003 | 1,007 | 1,010 | 1,021 | 1,010 | 1,000 | 1,007 | 1,012 | 1,020 | 1,026 | 1,016 |
| Base: Weighted average each centre, and grouping, separately, 1965 (= 1000) | ||||||||||||
| Auckland | 1,000 | 1,022 | 1,030 | 1,032 | 1,058 | 1,035 | 1,000 | 1,024 | 1,030 | 1,043 | 1,051 | 1,037 |
| Wellington-Hutt | 1,000 | 1,024 | 1,032 | 1,033 | 1,058 | 1,037 | 1,000 | 1,018 | 1,023 | 1,032 | 1,041 | 1,028 |
| Christchurch | 1,000 | 1,025 | 1,034 | 1,036 | 1,035 | 1,032 | 1,000 | 1,025 | 1,032 | 1,047 | 1,058 | 1,041 |
| Dunedin | 1,000 | 1,022 | 1,069 | 1,070 | 1,070 | 1,058 | 1,000 | 1,019 | 1,029 | 1,041 | 1,050 | 1,035 |
| Four chief centres | 1,000 | 1,023 | 1,036 | 1,038 | 1,054 | 1,038 | 1,000 | 1,022 | 1,028 | 1,041 | 1,050 | 1,035 |
| Hamilton | 1,000 | 1,025 | 1,034 | 1,036 | 1,036 | 1,033 | 1,000 | 1,019 | 1,027 | 1,037 | 1,041 | 1,031 |
| Tauranga | 1,000 | 1,038 | 1,048 | 1,050 | 1,050 | 1,046 | 1,000 | 1,020 | 1,026 | 1,038 | 1,047 | 1,033 |
| Rotorua | 1,000 | 1,024 | 1,033 | 1,635 | 1,034 | 1,031 | 1,000 | 1,016 | 1,023 | 1,035 | 1,040 | 1,029 |
| New Plymouth | 1,000 | 1,029 | 1,039 | 1,041 | 1,055 | 1,041 | 1,000 | 1,020 | 1,025 | 1,036 | 1,043 | 1,031 |
| Napier-Hastings | 1,000 | 1,028 | 1,038 | 1,040 | 1,040 | 1,037 | 1,000 | 1,019 | 1,024 | 1,036 | 1,046 | 1,031 |
| Wanganui | 1,000 | 1,031 | 1,041 | 1,043 | 1,043 | 1,040 | 1,000 | 1,022 | 1,027 | 1,036 | 1,042 | 1,032 |
| Palmerston North | 1,000 | 1,028 | 1,039 | 1,041 | 1,040 | 1,037 | 1,000 | 1,016 | 1,024 | 1,037 | 1,040 | 1,029 |
| Nelson | 1,000 | 1,027 | 1,040 | 1,042 | 1,041 | 1,038 | 1,000 | 1,021 | 1,027 | 1,037 | 1,044 | 1,032 |
| Timaru | 1,000 | 1,027 | 1,037 | 1,039 | 1,039 | 1,036 | 1,000 | 1,019 | 1,031 | 1,047 | 1,053 | 1,037 |
| Invercargill | 1,000 | 1,027 | 1,037 | 1,039 | 1,056 | 1,040 | 1,000 | 1,017 | 1,026 | 1,044 | 1,044 | 1,033 |
| Ten larger centres | 1,000 | 1,028 | 1,038 | 1,040 | 1,042 | 1,037 | 1,000 | 1,019 | 1,026 | 1,033 | 1,043 | 1,031 |
| Six smaller North Island centres | 1,000 | 1,030 | 1,040 | 1,042 | 1,042 | 1,039 | 1,000 | 1,020 | 1,026 | 1,938 | 1,045 | 1,032 |
| Five smaller South Island centres | 1,000 | 1,027 | 1,039 | 1,041 | 1,040 | 1,037 | 1,000 | 1,020 | 1,029 | 1,041 | 1,048 | 1,034 |
| Twenty-five centres combined | 1,000 | 1,026 | 1,037 | 1,039 | 1,048 | 1,037 | 1,000 | 1,021 | 1,027 | 1,039 | 1,047 | 1,034 |
| Base: Weighted average twenty-five centres, 1965 (= 1000) | ||||||||||||
|---|---|---|---|---|---|---|---|---|---|---|---|---|
| Centre | Food | Housing | ||||||||||
| Annual | First Quarter | Second Quarter | Third Quarter | Fourth Quarter | Annual | Annual | First Quarter | Second Quarter | Third Quarter | Fourth Quarter | Annual | |
| 1965 | 1966 | 1966 | 1966 | 1966 | 1966 | 1965 | 1966 | 1966 | 1966 | 1966 | 1966 | |
| Auckland | 1,014 | 1,042 | 1,039 | 1,026 | 1,020 | 1,032 | 1,114 | 1,160 | 1,160 | 1,192 | 1,200 | 1,181 |
| Wellington-Hutt | 1,012 | 1,029 | 1,036 | 1,035 | 1,029 | 1,032 | 1,182 | 1,219 | 1,236 | 1,254 | 1,272 | 1,245 |
| Christchurch | 1,002 | 1,029 | 1,008 | 1,011 | 1,019 | 1,017 | 926 | 960 | 966 | 983 | 994 | 976 |
| Dunedin | 1,012 | 1,038 | 1,026 | 1,029 | 1,041 | 1,033 | 895 | 918 | 937 | 945 | 957 | 939 |
| Four chief centres | 1,011 | 1,036 | 1,030 | 1,025 | 1,024 | 1,029 | 1,061 | 1,100 | 1,113 | 1,130 | 1,141 | 1,121 |
| Hamilton | 985 | 1,000 | 1,005 | 1,010 | 1,006 | 1,005 | 967 | 1,000 | 1,011 | 1,024 | 1,631 | 1,017 |
| Tauranga | 1,021 | 1,049 | 1,057 | 1,051 | 1,028 | 1,046 | 1,104 | 1,150 | 1,161 | 1,180 | 1,196 | 1,172 |
| Rotorua | 1,002 | 1,028 | 1,036 | 1,028 | 1,017 | 1,027 | 1,011 | 1,067 | 1,080 | 1,105 | 1,120 | 1,093 |
| New Plymouth | 979 | 1,000 | 1,001 | 996 | 990 | 997 | 926 | 943 | 956 | 968 | 979 | 962 |
| Napier-Hastings | 962 | 965 | 976 | 972 | 970 | 971 | 912 | 936 | 956 | 960 | 970 | 955 |
| Wanganui | 973 | 984 | 991 | 999 | 991 | 991 | 813 | 839 | 846 | 854 | 867 | 852 |
| Palmerston North | 979 | 992 | 992 | 995 | 986 | 991 | 918 | 948 | 956 | 974 | 988 | 967 |
| Nelson | 955 | 968 | 975 | 975 | 972 | 972 | 931 | 969 | 963 | 982 | 995 | 977 |
| Timaru | 993 | 1,010 | 997 | 1,004 | 1,013 | 1,006 | 1,017 | 1,046 | 1,054 | 1,080 | 1,088 | 1,067 |
| Invercargill | 1,024 | 1,046 | 1,031 | 1,050 | 1,057 | 1,046 | 953 | 973 | 982 | 994 | 1,014 | 991 |
| Ten larger centres | 985 | 1,001 | 1,003 | 1,006 | 1,001 | 1,003 | 951 | 981 | 992 | 1,006 | 1,018 | 999 |
| Six smaller North Island centres | 1,002 | 1,015 | 1,025 | 1,026 | 1,019 | 1,022 | 915 | 939 | 950 | 970 | 986 | 962 |
| Five smaller South Island centres | 986 | 1,001 | 999 | 1,001 | 1,007 | 1,002 | 897 | 911 | 937 | 944 | 941 | 933 |
| Twenty-five centres combined | 1,000 | 1,020 | 1,019 | 1,018 | 1,015 | 1,018 | 1,000 | 1,033 | 1,046 | 1,062 | 1,073 | 1,053 |
| Base: Weighted average twenty-five centres, 1965 (= 1000) | ||||||||||||
| Auckland | 995 | 1,001 | 1,007 | 1,012 | 1,024 | 1,011 | 1,013 | 1,023 | 1,029 | 1,042 | 1,044 | 1,035 |
| Wellington-Hutt | 979 | 988 | 989 | 991 | 1,028 | 999 | 999 | 1,007 | 1,009 | 1,016 | 1,025 | 1,014 |
| Christchurch | 1,001 | 1,003 | 1,003 | 1,007 | 1,012 | 1,006 | 990 | 1,001 | 1,011 | 1,017 | 1,026 | 1,013 |
| Dunedin | 1,023 | 1,024 | 1,027 | 1,027 | 1,034 | 1,028 | 1,010 | 1,101 | 1,018 | 1,023 | 1,027 | 1,020 |
| Four chief centres | 996 | 1,001 | 1,005 | 1,008 | 1,024 | 1,009 | 1,004 | 1,013 | 1,019 | 1,028 | 1,034 | 1,024 |
| Hamilton | 964 | 964 | 969 | 976 | 977 | 972 | 985 | 985 | 992 | 996 | 997 | 993 |
| Tauranga | 972 | 976 | 979 | 978 | 1,004 | 984 | 1,004 | 1,009 | 1,013 | 1,022 | 1,022 | 1,016 |
| Rotorua | 1,004 | 1,004 | 1,006 | 1,003 | 1,010 | 1,006 | 993 | 994 | 996 | 1,001 | 1,012 | 1,001 |
| New Plymouth | 984 | 984 | 986 | 993 | 997 | 990 | 995 | 1,005 | 1,009 | 1,019 | 1,022 | 1,014 |
| Napier-Hastings | 1,036 | 1,036 | 1,040 | 1,041 | 1,050 | 1,042 | 1,006 | 1,012 | 1,021 | 1,025 | 1,033 | 1,023 |
| Wanganui | 981 | 979 | 987 | 989 | 992 | 987 | 994 | 1,004 | 1,010 | 1,016 | 1,021 | 1,013 |
| Palmerston North | 980 | 981 | 982 | 999 | 1,001 | 991 | 1,019 | 1,024 | 1,026 | 1,034 | 1,037 | 1,030 |
| Nelson | 971 | 983 | 984 | 986 | 993 | 986 | 1,005 | 1,012 | 1,016 | 1,022 | 1,021 | 1,018 |
| Timaru | 1,022 | 1,020 | 1,022 | 1,027 | 1,031 | 1,025 | 1,005 | 1,008 | 1,016 | 1,025 | 1,031 | 1,020 |
| Invercargill | 1,042 | 1,037 | 1,042 | 1,044 | 1,048 | 1,043 | 1,008 | 1,011 | 1,015 | 1,021 | 1,024 | 1,018 |
| Ten larger centres | 993 | 993 | 997 | 1,002 | 1,007 | 1,000 | 1,000 | 1,005 | 1,010 | 1,016 | 1,020 | 1,013 |
| Six smaller North Island centres | 1,030 | 1,032 | 1,037 | 1,037 | 1,044 | 1,038 | 981 | 986 | 994 | 1,000 | 1,012 | 998 |
| Five smaller South Island centres | 1,022 | 1,026 | 1,027 | 1,030 | 1,033 | 1,029 | 994 | 996 | 1,002 | 1,007 | 1,013 | 1,004 |
| Twenty-five centres combined | 1,000 | 1,003 | 1,007 | 1,010 | 1,021 | 1,010 | 1,000 | 1,007 | 1,012 | 1,020 | 1,026 | 1,016 |
| Centre | Transportation | Miscellaneous | ||||||||||
|---|---|---|---|---|---|---|---|---|---|---|---|---|
| Annual | First Quarter | Second Quarter | Third Quarter | Fourth Quarter | Annual | Annual | First Quarter | Second Quarter | Third Quarter | Fourth Quarter | Annual | |
| 1965 | 1966 | 1966 | 1966 | 1966 | 1966 | 1965 | 1966 | 1966 | 1966 | 1966 | 1966 | |
| Auckland | 1,000 | 1,022 | 1,030 | 1,032 | 1,058 | 1,035 | 999 | 1,023 | 1,028 | 1,041 | 1,050 | 1,036 |
| Wellington-Hutt | 1,000 | 1,024 | 1,032 | 1,033 | 1,058 | 1,037 | 1,019 | 1,036 | 1,042 | 1,051 | 1,061 | 1,047 |
| Christchurch | 1,000 | 1,025 | 1,034 | 1,036 | 1,035 | 1,032 | 998 | 1,023 | 1,030 | 1,045 | 1,056 | 1,038 |
| Dunedin | 1,000 | 1,022 | 1,069 | 1,070 | 1,070 | 1,058 | 983 | 1,003 | 1,012 | 1,023 | 1,032 | 1,017 |
| Four chief centres | 1,000 | 1,023 | 1,036 | 1,038 | 1,054 | 1,038 | 1,001 | 1,024 | 1,030 | 1,042 | 1,051 | 1,037 |
| Hamilton | 1,000 | 1,025 | 1,034 | 1,036 | 1,036 | 1,033 | 993 | 1,012 | 1,020 | 1,030 | 1,034 | 1,024 |
| Tauranga | 1,000 | 1,038 | 1,048 | 1,050 | 1,050 | 1,046 | 999 | 1,019 | 1,025 | 1,037 | 1,046 | 1,032 |
| Rotorua | 1,000 | 1,024 | 1,033 | 1,035 | 1,034 | 1,031 | 1,016 | 1,032 | 1,039 | 1,051 | 1,056 | 1,045 |
| New Plymouth | 1,000 | 1,029 | 1,039 | 1,041 | 1,055 | 1,041 | 996 | 1,016 | 1,021 | 1,032 | 1,039 | 1,027 |
| Napier-Hastings | 1,000 | 1,028 | 1,038 | 1,040 | 1,040 | 1,037 | 994 | 1,013 | 1,018 | 1,030 | 1,040 | 1,025 |
| Wanganui | 1,000 | 1,031 | 1,041 | 1,043 | 1,043 | 1,040 | 997 | 1,019 | 1,025 | 1,033 | 1,039 | 1,029 |
| Palmerston North | 1,000 | 1,028 | 1,039 | 1,041 | 1,040 | 1,037 | 993 | 1,009 | 1,017 | 1,029 | 1,033 | 1,022 |
| Nelson | 1,000 | 1,027 | 1,040 | 1,042 | 1,041 | 1,038 | 989 | 1,010 | 1,015 | 1,025 | 1,032 | 1,021 |
| Timaru | 1,000 | 1,027 | 1,037 | 1,039 | 1,039 | 1,036 | 1,010 | 1,030 | 1,041 | 1,057 | 1,063 | 1,048 |
| Invercargill | 1,000 | 1,027 | 1,037 | 1,039 | 1,056 | 1,040 | 991 | 1,008 | 1,017 | 1,034 | 1,035 | 1,024 |
| Ten larger centres | 1,000 | 1,028 | 1,038 | 1,040 | 1,042 | 1,037 | 996 | 1,015 | 1,022 | 1,024 | 1,039 | 1,027 |
| Six smaller North Island centres | 1,000 | 1,030 | 1,040 | 1,042 | 1,042 | 1,039 | 1,009 | 1,030 | 1,036 | 1,047 | 1,055 | 1,042 |
| Five smaller South Island centres | 1,000 | 1,027 | 1,039 | 1,041 | 1,040 | 1,037 | 995 | 1,015 | 1,034 | 1,036 | 1,043 | 1,029 |
| Twenty-five centres combined | 1,000 | 1,026 | 1,037 | 1,039 | 1,048 | 1,037 | 1,000 | 1,021 | 1,027 | 1,039 | 1,047 | 1,034 |
| Auckland | 1,000 | 1,025 | 1,029 | 1,033 | 1,038 | 1,031 | 1,026 | 1,051 | 1,056 | 1,060 | 1,065 | 1,058 |
| Wellington-Hutt | 1,000 | 1,019 | 1,026 | 1,031 | 1,042 | 1,029 | 1,037 | 1,057 | 1,064 | 1,070 | 1,081 | 1,068 |
| Christchurch | 1,000 | 1,023 | 1,021 | 1,029 | 1,038 | 1,028 | 986 | 1,008 | 1,007 | 1,015 | 1,023 | 1,013 |
| Dunedin | 1,000 | 1,018 | 1,025 | 1,031 | 1,039 | 1,028 | 986 | 1,003 | 1,010 | 1,016 | 1,024 | 1,013 |
| Four chief centres | 1,000 | 1,022 | 1,026 | 1,032 | 1,039 | 1,030 | 1,015 | 1,037 | 1,041 | 1,047 | 1,054 | 1,045 |
| Hamilton | 1,000 | 1,017 | 1,024 | 1,031 | 1,032 | 1,026 | 982 | 999 | 1,006 | 1,013 | 1,014 | 1,008 |
| Tauranga | 1,000 | 1,024 | 1,032 | 1,036 | 1,037 | 1,032 | 1,022 | 1,047 | 1,055 | 1,060 | 1,060 | 1,055 |
| Rotorua | 1,000 | 1,023 | 1,031 | 1,035 | 1,038 | 1,032 | 1,005 | 1,028 | 1,036 | 1,040 | 1,043 | 1,037 |
| New Plymouth | 1,000 | 1,017 | 1,023 | 1,028 | 1,031 | 1,025 | 977 | 994 | 1,000 | 1,005 | 1,008 | 1,002 |
| Napier-Hastings | 1,000 | 1,012 | 1,023 | 1,025 | 1,031 | 1,023 | 977 | 989 | 999 | 1,001 | 1,007 | 999 |
| Wanganui | 1,000 | 1,017 | 1,024 | 1,031 | 1,033 | 1,026 | 955 | 971 | 978 | 985 | 986 | 980 |
| Palmerston North | 1,000 | 1,016 | 1,020 | 1,030 | 1,031 | 1,024 | 978 | 993 | 998 | 1,007 | 1,008 | 1,002 |
| Nelson | 1,000 | 1,020 | 1,024 | 1,031 | 1,034 | 1,027 | 969 | 989 | 993 | 999 | 1,002 | 996 |
| Timaru | 1,000 | 1,017 | 1,018 | 1,030 | 1,036 | 1,025 | 1,006 | 1,023 | 1,024 | 1,036 | 1,042 | 1,031 |
| Invercargill | 1,000 | 1,016 | 1,016 | 1,027 | 1,037 | 1,024 | 1,003 | 1,019 | 1,019 | 1,032 | 1,040 | 1,027 |
| Ten larger centres | 1,000 | 1,017 | 1,023 | 1,030 | 1,033 | 1,026 | 985 | 1,002 | 1,008 | 1,015 | 1,018 | 1,011 |
| Six smaller North Island centres | 1,000 | 1,016 | 1,025 | 1,032 | 1,036 | 1,027 | 988 | 1,004 | 1,012 | 1,019 | 1,024 | 1,015 |
| Five smaller South Island centres | 1,000 | 1,014 | 1,022 | 1,027 | 1,031 | 1,024 | 978 | 992 | 1,000 | 1,005 | 1,008 | 1,001 |
| Twenty-five centres combined | 1,000 | 1,019 | 1,025 | 1,031 | 1,036 | 1,028 | 1,000 | 1,019 | 1,025 | 1,031 | 1,036 | 1,028 |
WHOLESALE PRICES INDEX—The latest Wholesale Prices Index is described in the special supplement to the October 1959 issue of the Monthly Abstract of Statistics under the title Index Numbers of Wholesale Prices. A brief summary of the salient features of this revision appeared in the 1960 Yearbook (pages 992-994).
The index is not a single wholesale prices index, but a series of price index numbers related to broad groupings of the inter-industry transactions distinguished in the Department's input-output tables for the New Zealand economy. Thus each of the index numbers relates to a group of commodity transactions occurring at certain price-levels between defined sectors in the economy. Capital goods as well as goods for current consumption or usage are represented in the various commodity flows.
Wholesale Prices Index Numbers—The table which follows is divided into two parts; the first covers “input” prices and the second “output” prices. Within the first part of the table there is a break-up into goods for industrial use (analysed by sector destinations), for consumption, and for export. In each flow imported goods are distinguished from locally produced goods. In this part of the table all prices are inclusive of sales tax and excise duties and net of subsidies; the prices for exports marketed overseas are the prices in these markets brought to an f.o.b. basis, i.e., their “input” prices to other countries.
In the second part of the table the broad producing sectors are distinguished. Here the prices of their outputs are used. They are taken before the addition of sales tax and excise duties or the deduction of subsidies. The prices for export meat and dairy products are those payable to producers under the different stabilisation and minimum export-meat-prices schemes.
The primary produce processing industries group comprises the two major industries, meat export works and dairy factories, processing farm products mainly for export.
The expression base for the index is the calendar year 1958.
| WHOLESALE PRICES INDEX | |||||||||||||
|---|---|---|---|---|---|---|---|---|---|---|---|---|---|
| Base: 1958 (= 1000) | |||||||||||||
| Index Numbers of Commodity Prices by Sectors of Destination* | |||||||||||||
| Period | Prices Paid for Commodities Used by— | Other Countries (Exported) | All Commonalities | ||||||||||
| Domestic Industry | Consumers | Domestic Industry and Consumers | |||||||||||
| Imported | Home Produced | Total | Imported | Home Produced | Total | Imported | Home Produced | Total | Imported | Home Produced | Total | ||
| Calendar year— | |||||||||||||
| 1958 | 1,000 | 1,000 | 1,000 | 1,000 | 1,000 | 1,000 | 1,000 | 1,000 | 1,000 | 1,000 | 1,000 | 1,000 | 1,000 |
| 1959 | 1,015 | 998 | 1,004 | 1,055 | 1,034 | 1,039 | 1,025 | 1,011 | 1,015 | 1,141 | 1,025 | 1,039 | 1,035 |
| 1960 | 1,008 | 1,018 | 1,015 | 1,019 | 1,028 | 1,026 | 1,010 | 1,022 | 1,018 | 1,139 | 1,010 | 1,047 | 1,038 |
| 1961 | 1,012 | 1,005 | 1,008 | 1,025 | 1,034 | 1,032 | 1,015 | 1,015 | 1,015 | 1,023 | 1,015 | 1,017 | 1,016 |
| 1962 | 1,011 | 992 | 998 | 1,033 | 1,033 | 1,035 | 1,016 | 1,007 | 1,009 | 1,049 | 1,016 | 1,016 | 1,016 |
| 1963 | 1,034 | 1,013 | 1,020 | 1,040 | 1,050 | 1,047 | 1,035 | 1,025 | 1,028 | 1,160 | 1,035 | 1,054 | 1,050 |
| 1964 | 1,039 | 1,071 | 1,060 | 1,037 | 1,088 | 1,076 | 1,038 | 1,077 | 1,065 | 1,259 | 1,038 | 1,116 | 1,097 |
| 1965 | 1,058 | 1,111 | 1,093 | 1,054 | 1,111 | 1,097 | 1,057 | 1,111 | 1,094 | 1,184 | 1,057 | 1,126 | 1,109 |
| 1966 | 1,075 | 1131† | 1113† | 1,076 | 1,124 | 1,113 | 1,075 | 1129† | 1,113 | 1159† | 1,075 | 1135† | 1120† |
| Quarter ended | |||||||||||||
| 1964—31 March | 1,047 | 1,039 | 1,042 | 1,039 | 1,070 | 1,062 | 1,045 | 1,050 | 1,048 | 1,281 | 1,045 | 1,100 | 1,086 |
| 30 June | 1,036 | 1,068 | 1,057 | 1,032 | 1,074 | 1,064 | 1,035 | 1,070 | 1,059 | 1,287 | 1,035 | 1,117 | 1,096 |
| 30 September | 1,030 | 1,083 | 1,066 | 1,035 | 1,093 | 1,079 | 1,031 | 1,087 | 1,070 | 1,252 | 1,031 | 1,122 | 1,099 |
| 31 December | 1,044 | 1,094 | 1,077 | 1,042 | 1,114 | 1,097 | 1,043 | 1,101 | 1,083 | 1,218 | 1,043 | 1,126 | 1,105 |
| 1965—31 March | 1,046 | 1,100 | 1,083 | 1,047 | 1,089 | 1,079 | 1,047 | 1,097 | 1,082 | 1,176 | 1,047 | 1,114 | 1,097 |
| 30 June | 1,067 | 1,110 | 1,096 | 1,048 | 1,095 | 1,084 | 1,062 | 1,105 | 1,092 | 1,178 | 1,062 | 1,121 | 1,106 |
| 30 September | 1,057 | 1,122 | 1,101 | 1,055 | 1,121 | 1,106 | 1,057 | 1,122 | 1,102 | 1,193 | 1,057 | 1,137 | 1,117 |
| 31 December | 1,062 | 1,109 | 1,094 | 1,064 | 1,138 | 1,121 | 1,062 | 1,119 | 1,102 | 1,188 | 1,062 | 1,134 | 1,116 |
| 1966—31 March | 1,068 | 1,124 | 1,105 | 1,073 | 1,113 | 1,107 | 1,069 | 1,122 | 1,106 | 1,189 | 1,069 | 1,136 | 1,119 |
| 30 June | 1,067 | 1138† | 1115† | 1,065 | 1,112 | 1,101 | 1,066 | 1129† | 1110† | 1200† | 1,066 | 1145† | 1125† |
| 30 September | 1,016 | 1141† | 1120† | 1,079 | 1,125 | 1,114 | 1,077 | 1,136 | 1,118 | 1153† | 1,077 | 1139† | 1124† |
| 31 December | 1,089 | 2321† | 1110† | 1,089 | 1,141 | 1,129 | 1,089 | 1128† | 1116† | 1093† | 1,089 | 1120† | 1112† |
| Period | Prices Paid for Commodities Used by Domestic Industry | ||||||||||
|---|---|---|---|---|---|---|---|---|---|---|---|
| Primary Industries | Primary Produce Processing Industries | Other Manufacturing Industries | |||||||||
| Imported | Home Produced | Total | Imported | Home Produced | Total | Imported | Home Produced | Total | |||
| Farming | All Other Industries | Other Manufacturing Industries | All Other Industries | ||||||||
| Calendar year— | |||||||||||
| 1958 | 1,000 | 1,000 | 1,000 | 1,000 | 1,000 | 1,000 | 1,000 | 1,000 | 1,000 | 1,000 | 1,000 |
| 1959 | 996 | 927 | 1,010 | 972 | 1,021 | 978 | 980 | 1,008 | 1,013 | 1,030 | 1,014 |
| 1960 | 986 | 958 | 1,014 | 985 | 1,007 | 1,005 | 1,005 | 1,006 | 1,024 | 1,066 | 1,025 |
| 1961 | 1,012 | 948 | 1,016 | 986 | 1,045 | 940 | 943 | 1,006 | 1,026 | 1,069 | 1,026 |
| 1962 | 1,003 | 839 | 1,023 | 940 | 990 | 919 | 921 | 1,006 | 1,034 | 1,038 | 1,021 |
| 1963 | 989 | 848 | 1,026 | 943 | 964 | 952 | 953 | 1,048 | 1,039 | 1,113 | 1,061 |
| 1964 | 999 | 967 | 1,030 | 997 | 995 | 1,049 | 1,047 | 1,043 | 1,080 | 1,181 | 1,085 |
| 1965 | 1,028 | 1,149 | 1,056 | 1,091 | 1,059 | 1,091 | 1,090 | 1,044 | 1,084 | 1,172 | 1,084 |
| 1966 | 1,046 | 1,261 | 1,106 | 1,162 | 1,088 | 1075† | 1075† | 1,063 | 1,092 | 1,209 | 1,105 |
| Quarter ended— | |||||||||||
| 1964—31 March | 989 | 912 | 1,026 | 970 | 961 | 984 | 983 | 1,069 | 1,070 | 1,168 | 1,093 |
| 30 June | 993 | 958 | 1,024 | 990 | 978 | 1,056 | 1,053 | 1,044 | 1,072 | 1,176 | 1,082 |
| 30 September | 1,000 | 981 | 1,027 | 1,002 | 1,006 | 1,076 | 1,074 | 1,026 | 1,078 | 1,203 | 1,081 |
| 31 December | 1,013 | 1,014 | 1,045 | 1,026 | 1,036 | 1,079 | 1,077 | 1,030 | 1,099 | 1,178 | 1,083 |
| 1965—31 March | 1,019 | 1,083 | 1,048 | 1,058 | 1,038 | 1,092 | 1,091 | 1,027 | 1,087 | 1,159 | 1,073 |
| 30 June | 1,027 | 1,138 | 1,047 | 1,083 | 1,073 | 1,103 | 1,107 | 1,063 | 1,087 | 1,150 | 1,090 |
| 30 September | 1,028 | 1,158 | 1,052 | 1,094 | 1,048 | 1,117 | 1,115 | 1,040 | 1,084 | 1,191 | 1,087 |
| 31 December | 1,036 | 1,219 | 1,077 | 1,131 | 1,079 | 1,047 | 1,048 | 1,046 | 1,080 | 1,188 | 2,088 |
| 1966—31 March | 1,041 | 1,236 | 1,084 | 1,142 | 1,090 | 1,076 | 1,076 | 1,057 | 1,085 | 1,203 | 1,099 |
| 30 June | 1,043 | 1,270 | 1,086 | 1,157 | 1,101 | 1107† | 1107† | 1,055 | 1,093 | 1,206 | 1,100 |
| 30 September | 1,047 | 1,266 | 1,126 | 1,172 | 1,085 | 1092† | 1092† | 1,064 | 1,093 | 1,233 | 1,111 |
| 31 December | 1,054 | 1,273 | 1,130 | 1,178 | 1,074 | 1025† | 1026† | 1,077 | 1,098 | 1,195 | 1,110 |
| Period | Prices Paid for Commodities Used by Domestic Industry | ||||||||
|---|---|---|---|---|---|---|---|---|---|
| Building and Construction | Transport and Communication | Other Industries† | |||||||
| Imported | Home Produced | Total | Imported | Home Produced | Total | Imported | Home Produced | Total | |
| Calendar year— | |||||||||
| 1958 | 1,000 | 1,000 | 1,000 | 1,000 | 1,000 | 1,000 | 1,000 | 1,000 | 1,000 |
| 1959 | 1,032 | 1,015 | 1,021 | 1,038 | 1,039 | 1,039 | 1,016 | 1,017 | 1,017 |
| 1960 | 1,042 | 1,030 | 1,034 | 987 | 1,042 | 1,002 | 1,003 | 1,027 | 1,020 |
| 1961 | 1,052 | 1,056 | 1,054 | 980 | 1,051 | 999 | 1,009 | 1,042 | 1,033 |
| 1962 | 1,046 | 1,072 | 1,063 | 992 | 1,072 | 1,014 | 1,016 | 1,060 | 1,048 |
| 1963 | 1,042 | 1,072 | 1,061 | 1,009 | 1,066 | 1,025 | 1,021 | 1,063 | 1,051 |
| 1964 | 1,070 | 1,095 | 1,086 | 1,017 | 1,054 | 1,027 | 1,034 | 1,086 | 1,071 |
| 1965 | 1,096 | 1,141 | 1,124 | 1,072 | 1,072 | 1,072 | 1,083 | 1,103 | 1,097 |
| 1966 | 1,110 | 1,171 | 1,149 | 1,073 | 1,082 | 1,076 | 1,108 | 1,106 | 1,107 |
| Quarter ended— | |||||||||
| 1964— | |||||||||
| 31 March | 1,048 | 1,075 | 1,065 | 1,007 | 1,062 | 1,022 | 1,024 | 1,067 | 1,055 |
| 30 June | 1,064 | 1,089 | 1,080 | 1,002 | 1,050 | 1,015 | 1,028 | 1,076 | 1,063 |
| 30 September | 1,077 | 1,095 | 1,088 | 1,003 | 1,050 | 1,016 | 1,029 | 1,094 | 1,076 |
| 31 December | 1,092 | 1,122 | 1,111 | 1,055 | 1,055 | 1,055 | 1,054 | 1,105 | 1,091 |
| 1965— | |||||||||
| 31 March | 1,097 | 1,127 | 1,116 | 1,064 | 1,065 | 1,065 | 1,080 | 1,102 | 1,096 |
| 30 June | 1,093 | 1,132 | 1,118 | 1,068 | 1,066 | 1,067 | 1,077 | 1,101 | 1,095 |
| 30 September | 1,098 | 1,150 | 1,131 | 1,076 | 1,077 | 1,076 | 1,087 | 1,105 | 1,100 |
| 31 December | 1,096 | 1,154 | 1,133 | 1,081 | 1,078 | 1,080 | 1,090 | 1,101 | 1,098 |
| 1966— | |||||||||
| 31 March | 1,098 | 1,164 | 1,139 | 1,075 | 1,078 | 1,076 | 1,092 | 1,103 | 1,100 |
| 30 June | 1,102 | 1,170 | 1,145 | 1,075 | 1,080 | 1,076 | 1,086 | 1,101 | 1,097 |
| 30 September | 1,102 | 1,172 | 1,147 | 1,075 | 1,078 | 1,076 | 1,122 | 1,107 | 1,111 |
| 31 December | 1,138 | 1,178 | 1,163 | 1,066 | 1,093 | 1,074 | 1,130 | 1,114 | 1,119 |
| Index Numbers of Commodity Prices by Sector of Origin‡ | ||||||||
|---|---|---|---|---|---|---|---|---|
| Period | Prices Received for Commodities Produced in New Zealand | |||||||
| Output of | Used by | |||||||
| Farming | Other Primary Industries | Primary Produce Processing Industries | Other Manufacturing Industries | Public Utilities | All Domestic Industry§ | Industry and Consumers | Other Countries (Exported) | |
* The prices used in this part of the table are those payable by the using or consuming sectors, i.e., including indirect taxation and net after subsidies; the export prices are f.o.b. equivalent of overseas market prices. † Includes wholesale and retail trade, banking and finance, public utilities, and services. ‡ The prices used in this part of the table are those receivable by producers, i.e., before addition of indirect taxation or deduction of consumer or user subsidies; prices for dairy produce and meat are those payable to producers under the schemes to stabilise returns from year to year. § Comprises the outputs of the five sectors mentioned in this part of the table. || Provisional. | ||||||||
| Calendar year | ||||||||
| 1958 | 1,000 | 1,000 | 1,000 | 1,000 | 1,000 | 1,000 | 1,000 | 1,000 |
| 1959 | 1,010 | 2,005 | 1,000 | 1,010 | 1,041 | 1,009 | 1,001 | 1,036 |
| 1960 | 1,043 | 1,052 | 1,037 | 1,025 | 1,035 | 1,034 | 1,020 | 1,079 |
| 1961 | 997 | 5,113 | 941 | 1,038 | 1,044 | 1,009 | 1,014 | 992 |
| 1962 | 957 | 1,146 | 954 | 1,041 | 1,066 | 1,003 | 1,005 | 995 |
| 1963 | 1,020 | 1,136 | 979 | 1,062 | 1,076 | 1,037 | 1,024 | 1,079 |
| 1964 | 1,111 | 1,186 | 1,071 | 1,096 | 1,094 | 1,099 | 1,078 | 1,166 |
| 1965 | 1,113 | 1,231 | 1,095 | 1,109 | 1,106 | 1,111 | 1,114 | 1,103 |
| 1966 | 1118|| | 1,286 | 1117|| | 1,126 | 1,116 | 1126|| | 1133|| | 1105|| |
| Quarter ended | ||||||||
| 1964— | ||||||||
| 31 March | 1,099 | 1,155 | 1,021 | 1,089 | 1,087 | 1,081 | 1,050 | 1,186 |
| 30 June | 1,118 | 1,177 | 1,071 | 1,091 | 1,096 | 1,098 | 1,071 | 1,189 |
| 30 September | 1,121 | 1,191 | 1,097 | 1,095 | 1,096 | 1,107 | 1,089 | 1,164 |
| 31 December | 1,105 | 1,222 | 1,096 | 1,109 | 1,100 | 1,108 | 1,104 | 1,124 |
| 1965— | ||||||||
| 31 March | 1,084 | 1,228 | 1,087 | 1,097 | 1,100 | 1,095 | 1,099 | 1,082 |
| 30 June | 1,100 | 1,214 | 1096x | 1,103 | 1,105 | 1,104 | 1,108 | 1,093 |
| 30 September | 1,144 | 1,217 | 1112x | 1,115 | 1,106 | 1126x | 1,126 | 1127x |
| 31 December | 1,126 | 1,264 | 1107x | 1,119 | 1,113 | 1123x | 1,123 | 1123x |
| 1966— | ||||||||
| 31 March | 1120|| | 1,280 | 1,135 | 1,120 | 1,110 | 1127|| | 1,126 | 1132|| |
| 30 June | 1131|| | 1,280 | 1166|| | 1,121 | 1,113 | 1137|| | 1134|| | 1147|| |
| 30 September | 1129|| | 1,289 | 1112|| | 1,129 | 1,115 | 1130|| | 1140|| | 1098|| |
| 31 December | 1093|| | 1,295 | 1057|| | 1,133 | 1,125 | 1111|| | 1132|| | 1041|| |
Long-term Linked Series—Since the index incorporates a major change in construction method, linking to obtain a long-term series is not very satisfactory.: Nevertheless, some such link will be required occasionally in making longer-term surveys of price movements. Accordingly, in the table which follows, the previous index, converted to base 1958 (= 1000), has been linked to the component “Commodities; used by Domestic Industry and Consumers”. The subdivisions “Imported” and “Home Produced” commodities have similarly been linked. When using these linked series it should be borne in mind that the price sources and weighting pattern of the current index are quite different from its predecessors.
| WHOLESALE PRICES INDEX NUMBERS—LONG-TERM LINKED SERIES | |||
|---|---|---|---|
| Base: Calendar year 1958 (= 1000) | |||
| Year | Imported | Home Produced | Total |
| * Provisional. | |||
| 1913 | 268 | 254 | 263 |
| 1914 | 270 | 274 | 271 |
| 1915 | 274 | 319 | 292 |
| 1916 | 312 | 331 | 320 |
| 1917 | 379 | 360 | 372 |
| 1918 | 481 | 389 | 444 |
| 1919 | 504 | 407 | 465 |
| 1920 | 626 | 455 | 557 |
| 1921 | 555 | 463 | 518 |
| 1922 | 461 | 392 | 433 |
| 1923 | 412 | 393 | 405 |
| 1924 | 406 | 407 | 406 |
| 1925 | 400 | 410 | 404 |
| 1926 | 375 | 393 | 382 |
| 1927 | 352 | 380 | 363 |
| 1928 | 344 | 385 | 361 |
| 1929 | 341 | 385 | 358 |
| 1930 | 335 | 370 | 349 |
| 1931 | 328 | 326 | 327 |
| 1932 | 326 | 307 | 319 |
| 1933 | 345 | 301 | 327 |
| 1934 | 341 | 310 | 329 |
| 1935 | 342 | 335 | 340 |
| 1936 | 342 | 344 | 343 |
| 1937 | 371 | 370 | 371 |
| 1938 | 375 | 378 | 376 |
| 1939 | 379 | 403 | 389 |
| 1940 | 448 | 412 | 434 |
| 1941 | 503 | 436 | 476 |
| 1942 | 552 | 456 | 514 |
| 1943 | 609 | 461 | 549 |
| 1944 | 629 | 472 | 565 |
| 1945 | 638 | 481 | 575 |
| 1946 | 636 | 489 | 577 |
| 1947 | 650 | 523 | 598 |
| 1948 | 730 | 574 | 667 |
| 1949 | 714 | 586 | 662 |
| 1950 | 758 | 667 | 721 |
| 1951 | 883 | 777 | 840 |
| 1952 | 996 | 842 | 933 |
| 1953 | 947 | 891 | 924 |
| 1954 | 904 | 932 | 915 |
| 1955 | 920 | 935 | 926 |
| 1956 | 944 | 985 | 960 |
| 1957 | 968 | 977 | 972 |
| 1958 | 1,000 | 1,000 | 1,000 |
| 1959 | 1,025 | 1,011 | 1,015 |
| 1,060 | 1,010 | 1,022 | 1,018 |
| 1961 | 1,015 | 1,015 | 1,015 |
| 1,062 | 1,016 | 1,007 | 1,009 |
| 1963 | 1,035 | 1,025 | 1,028 |
| 1964 | 1,038 | 1,077 | 1,065 |
| 1965 | 1,057 | 1,111 | 1,094 |
| 1966 | 1,075 | 1129* | 1113* |
EXPORT PRICES—The Export Prices Index has a weighting base of 1959 quantities at 1960 prices. The wool prices used are derived from the clean, on-floor prices used in the Wool Price Index brought to an f.o.b. basis. For dairy produce the prices used are selling prices at time of shipment brought to an f.o.b. basis. Meat exporting is conducted by numerous private operators, and there is no central organisation capable of reporting realised selling prices; prices obtaining in the Smithfield market, in the United Kingdom, converted to f.o.b. New Zealand equivalents, are used. Unit values from export statistics are used for other commodities. The prices for those goods which are consigned for sale in overseas markets therefore represent generally the ruling prices in those markets at time of export rather than the realised prices on sale.
Owing to fluctuations in the proportions of the different exports consigned to the United Kingdom and to other countries it was considered desirable, during 1963, to alter the published group and all-groups index numbers to an “all-exports” basis, that is, a single all-destinations unit-value (or price) with a single weight was substituted for the separate unit-values and weights for the two destinations used previously. The differentiated destination weights and unit-values for each commodity are, of course, still used in the separate indexes for the two destinations.
A description of earlier indices may be found in the 1960 and earlier issues of the Yearbook.
In the following table are given export price index numbers for calendar years and for years ended 30 June.
| EXPORT PRICES INDEX | |||||||
|---|---|---|---|---|---|---|---|
| Base: Export prices during 1960 (= 1000) | |||||||
| Period | Butter | Cheese | All Dairy Produce | Meat | Wool | Meat, Wool, and By products | All Pastoral and Dairy Produce |
| Calendar year— | |||||||
| 1954 | 1,232 | 880 | 1,123 | 950 | 1,116 | 1,052 | 1,075 |
| 1955 | 1,269 | 931 | 1,142 | 1,080 | 1,113 | 1,084 | 1,103 |
| 1956 | 1,035 | 1,204 | 1,080 | 1,056 | 1,099 | 1,076 | 1,077 |
| 1957 | 955 | 703 | 892 | 1,097 | 1,213 | 1,148 | 1,064 |
| 1958 | 821 | 847 | 843 | 1,046 | 857 | 929 | 901 |
| 1959 | 1,212 | 1,215 | 1,201 | 970 | 922 | 952 | 1,033 |
| 1960 | 1,000 | 1,000 | 1,000 | 1,000 | 1,000 | 1,000 | 1,000 |
| 1961 | 890 | 990 | 920 | 949 | 950 | 951 | 942 |
| 1962 | 1,047 | 998 | 1,022 | 955 | 929 | 936 | 961 |
| 1963 | 1,145 | 973 | 1,077 | 1,012 | 1,116 | 1,055 | 1,061 |
| 1964 | 1,206 | 990 | 1,139 | 1,112 | 1,223 | 1,168 | 1,160 |
| 1965 | 1,185 | 1,050 | 1,178 | 1,226 | 956 | 1,091 | 1,116 |
| 1966* | 1,068 | 1,050 | 1,116 | 1,215 | 945 | 1,105 | 1,108 |
| Year ended 30 June— | |||||||
| 1954 | 1,234 | 918 | 1,140 | 908 | 1,141 | 1,053 | 1,082 |
| 1955 | 1,194 | 803 | 1,062 | 1,037 | 1,121 | 1,076 | 1,072 |
| 1956 | 1,231 | 1,124 | 1,179 | 1,070 | 1,054 | 1,057 | 1,098 |
| 1957 | 987 | 1,000 | 994 | 1,054 | 1,248 | 1,148 | 1,098 |
| 1958 | 798 | 650 | 770 | 1,059 | 953 | 990 | 918 |
| 1959 | 971 | 1,161 | 1,029 | 1,030 | 843 | 921 | 956 |
| 1960 | 1,196 | 1,102 | 1,159 | 953 | 1,031 | 1,008 | 1,059 |
| 1961 | 896 | 991 | 927 | 992 | 948 | 966 | 955 |
| 1962 | 968 | 995 | 972 | 905 | 930 | 921 | 936 |
| 1963 | 1,095 | 986 | 1,048 | 1,003 | 1,003 | 993 | 1,009 |
| 1964 | 1,181 | 962 | 1101x | 1,066 | 1,270 | 1,167 | 1148x |
| 1965 | 1,226 | 1,038 | 1,185 | 1,226 | 987 | 1,101 | 1,125 |
| 1966* | 1,105 | 1,034 | 1,136 | 1,187 | 972 | 1,105 | 1,114 |
| Period | All Foods | All Non-foods | All Exports | All Groups | |
|---|---|---|---|---|---|
| To United Kingdom | To Other Countries | ||||
| Calendar year | |||||
| 1954 | 1,046 | 1,109 | 1,073 | 1,071 | 1,076 |
| 1955 | 1,113 | 1,088 | 1,102 | 1,134 | 1,037 |
| 1956 | 1,069 | 1,082 | 1,075 | 1,089 | 1,042 |
| 1957 | 985 | 1,162 | 1,059 | 1,042 | 1,095 |
| 1958 | 936 | 854 | 902 | 922 | 858 |
| 1959 | 1,099 | 937 | 1,030 | 1,068 | 951 |
| 1960 | 1,000 | 1,000 | 1,000 | 1,000 | 1,000 |
| 1961 | 937 | 954 | 945 | 933 | 954 |
| 1962 | 992 | 930 | 964 | 982 | 931 |
| 1963 | 1,049 | 1,067 | 1,056 | 1,069 | 1,036 |
| 1964 | 1,131 | 1,174 | 1,150 | 1,167 | 1,128 |
| 1965 | 1,201 | 1,002 | 1,111 | 1,170 | 1,034 |
| 1966* | 1,155 | 1,037 | 1,102 | 1,101 | 1,090 |
| Base: Export Prices during 1960 (= 1000) | |||||
|---|---|---|---|---|---|
| Period | All Foods | All Non-foods | All Exports | All Groups | |
| To United Kingdom | To Other Countries | ||||
| * Provisional. | |||||
| Year ended 30 June | |||||
| 1954 | 1,037 | 1,132 | 1,078 | 1,063 | 1,109 |
| 1955 | 1,051 | 1,097 | 1,071 | 1,080 | 1,051 |
| 1956 | 1,128 | 1,045 | 1,093 | 1,130 | 1,014 |
| 1957 | 1,021 | 1,196 | 1,095 | 1,083 | 1,121 |
| 1958 | 901 | 938 | 917 | 910 | 934 |
| 1959 | 1,031 | 853 | 955 | 999 | 864 |
| 1960 | 1,067 | 1,036 | 1,054 | 1,064 | 1,034 |
| 1961 | 960 | 953 | 957 | 954 | 961 |
| 1962 | 942 | 934 | 938 | 938 | 933 |
| 1963 | 1,029 | 982 | 1,008 | 1,034 | 974 |
| 1964 | 1,089 | 1,199 | 1139x | 1141x | 1,134 |
| 1965 | 1,210 | 1,009 | 1,119 | 1,185 | 1,034 |
| 1966* | 1,153 | 1,053 | 1,108 | 1,119 | 1,084 |
The fact that the calendar year does not coincide with the farm production year is especially significant in New Zealand, since the great bulk of export goods is farm produce. For a number of purposes the portion of the foregoing tables relative to years ended 30 June is the more important, in that the figures relate to the farming year.
The next table shows export prices index numbers for all pastoral and dairy produce groups and for all groups combined.
| Base: Export prices during 1960 (= 1000) | ||
|---|---|---|
| Year | Index Numbers | |
| All Pastoral and Dairy Produce | All Groups Combined | |
* Upward trend in 1949 masked by appreciation in August 1948 of New Zealand pound to parity with sterling. † Provisional. | ||
| 1914 | 283 | 283 |
| 1915 | 323 | 321 |
| 1916 | 384 | 380 |
| 1917 | 431 | 430 |
| 1918 | 438 | 438 |
| 1919 | 466 | 463 |
| 1920 | 475 | 472 |
| 1921 | 451 | 449 |
| 1922 | 349 | 353 |
| 1923 | 417 | 416 |
| 1924 | 466 | 462 |
| 1925 | 491 | 486 |
| 1926 | 396 | 396 |
| 1927 | 394 | 393 |
| 1928 | 439 | 435 |
| 1929 | 421 | 419 |
| 1930 | 327 | 329 |
| 1931 | 247 | 253 |
| 1932 | 224 | 230 |
| 1933 | 222 | 230 |
| 1934 | 277 | 283 |
| 1935 | 268 | 276 |
| 1936 | 310 | 315 |
| 1937 | 366 | 369 |
| 1938 | 336 | 342 |
| 1939 | 328 | 335 |
| 1940 | 381 | 386 |
| 1941 | 389 | 396 |
| 1942 | 401 | 406 |
| 1943 | 418 | 423 |
| 1944 | 440 | 446 |
| 1945 | 476 | 481 |
| 1946 | 521 | 526 |
| 1947 | 659 | 661 |
| 1948 | 733 | 734 |
| 1949 | 711 | 710* |
| 1950 | 1,010 | 1,003 |
| 1951 | 1,186 | 1,177 |
| 1952 | 947 | 947 |
| 1953 | 1,057 | 1,053 |
| 1954 | 1,075 | 1,073 |
| 1955 | 1,103 | 1,102 |
| 1956 | 1,077 | 1,075 |
| 1957 | 1,064 | 1,059 |
| 1958 | 901 | 902 |
| 1959 | 1,033 | 1,030 |
| 1960 | 1,000 | 1,000 |
| 1961 | 942 | 945 |
| 1962 | 961 | 964 |
| June year | ||
| 1963 | 1,009 | 1,008 |
| 1964 | 1,148 | 1,139 |
| 1965 | 1,125 | 1,119 |
| 1966* | 1,114 | 1,108 |
The brisk demand for New Zealand wool displayed after the resumption of auction sales in September 1946, and greatly heightened during 1950 and the early part of 1951, resulted in the peak index numbers reached in 1951. After that wool prices fell away, and this, combined with low prices for dairy produce resulted in troughs in the index in 1958 and 1961.
IMPORT PRICES—Since 1949 the Import Prices Index has been derived from chained Fisher “Ideal” indexes. In this method two price indexes are calculated for each year on base previous year, one using the quantitative weighting pattern of the previous year and the other the quantitative weighting pattern of the latest year. The geometric mean of these two becomes the definitive index for the year, on base previous year, and is linked on to the index for that year on some earlier expression base. Since the trade statistics are now prepared for years ended June, the definitive import and export price indexes, and consequently terms of trade, are calculated accordingly. As from 1959 the price index is designed to reflect changes in the true c.i.f. cost of imports. Previously the calculations were based solely on the current domestic values of imports in the countries of origin as verified by the Customs Department. Over a half of the total tonnage of imports is made up of fertilisers and mineral oils and fuels, with a low value per unit of weight, for which freights constitute a substantial proportion of the total c.i.f. cost. In a further range of items from salt, wheat, sugar, fresh fruits, and timber to iron and steel, pulp and paper, freights make up a significant proportion of the total c.i.f. cost. Consequently differential changes in prices and freight rates can result in current domestic valuation changes being only a poor indication of c.i.f. cost movements. By measuring current domestic valuation price changes at the item level, and adjusting for changes in c.d.v. and c.i.f. valuation ratios at the divisional level, the index now shows more accurately than in the past, changes in the true cost of imports to the New Zealand economy.
The year 1959 has now been adopted as the standard expression base. The following table includes the series for past years converted to this base.
| IMPORT PRICES INDEX | |
|---|---|
| Base: 1959 (= 1000) | |
| Year | Index Number |
| * Provisional. | |
| 1926 | 435 |
| 1927 | 416 |
| 1928 | 393 |
| 1929 | 386 |
| 1930 | 382 |
| 1931 | 356 |
| 1932 | 337 |
| 1933 | 346 |
| 1934 | 341 |
| 1935 | 336 |
| 1936 | 335 |
| 1937 | 355 |
| 1938 | 356 |
| 1939 | 357 |
| 1940 | 411 |
| 1941 | 457 |
| 1942 | 501 |
| 1943 | 555 |
| 1944 | 581 |
| 1945 | 592 |
| 1946 | 661 |
| 1947 | 787 |
| 1948 | 803 |
| 1949 | 731 |
| 1950 | 801 |
| 1951 | 938 |
| 1952 | 1,024 |
| 1953 | 965 |
| 1954 | 952 |
| 1955 | 972 |
| 1956 | 997 |
| 1957 | 1,030 |
| 1958 | 1,025 |
| 1959 | 1,000 |
| 1960 | 1,015 |
| 1961 | 1,020 |
| 1962 | 1,001 |
| June year | |
| 1963 | 993 |
| 1964 | 1005x |
| 1965 | 1016x |
| 1966† | 1031* |
TERMS OF TRADE—The terms of trade is the expression of the ratio of export prices to import prices, i.e., an index of the purchasing power (in units of imports) of a fixed quantity of exports. In the table that follows terms of trade are expressed on base 1957 (= 100). However, an index above or below 100 means only that terms of trade are more or less favourable than in 1957. The choice of 100 is made for arithmetical convenience, not to indicate that 1957 was a normal or standard year. For the purposes of this table both import prices and export prices indexes have also been converted to a 1957 base.
The table below shows index numbers of import prices and of export prices and terms of trade for major commodity groups and total exports.
| INDEX NUMBERS OF IMPORT AND EXPORT PRICES AND TERMS OF TRADE | |||||||||||
|---|---|---|---|---|---|---|---|---|---|---|---|
| All Countries—Base: 1957 (= 100) | |||||||||||
| Year | Import Prices | Butter | Cheese | Meat | Wool | All Exports | |||||
| Export Price | Terms of Trade | Export Price | Terms of Trade | Export Price | Terms of Trade | Export Price | Terms of Trade | Export Price | Terms of Trade | ||
| * Provisional. | |||||||||||
| 1954 | 92 | 129 | 140 | 125 | 136 | 87 | 94 | 92 | 100 | 101 | 110 |
| 1955 | 94 | 133 | 141 | 132 | 140 | 98 | 104 | 92 | 97 | 104 | 110 |
| 1956 | 97 | 108 | 112 | 171 | 177 | 96 | 100 | 91 | 94 | 102 | 105 |
| 1957 | 100 | 100 | 100 | 100 | 100 | 100 | 100 | 100 | 100 | 100 | 100 |
| 1958 | 100 | 86 | 86 | 120 | 121 | 95 | 96 | 71 | 71 | 85 | 86 |
| 1959 | 97 | 127 | 131 | 173 | 178 | 88 | 91 | 76 | 78 | 97 | 100 |
| 1960 | 99 | 105 | 106 | 142 | 144 | 91 | 93 | 82 | 84 | 94 | 96 |
| 1961 | 99 | 93 | 94 | 141 | 142 | 87 | 87 | 78 | 79 | 89 | 90 |
| 1962 | 97 | 110 | 113 | 142 | 146 | 87 | 90 | 77 | 79 | 91 | 94 |
| Year ended 30 June— | |||||||||||
| 1963 | 96 | 115 | 119 | 140 | 146 | 91 | 95 | 83 | 86 | 95 | 99 |
| 1964 | 97 | 127x | 127x | 137 | 140x | 97 | 100x | 105 | 107x | 108 | 110 |
| 1965 | 99x | 128 | 130x | 148 | 150x | 112 | 113x | 81 | 83x | 106 | 107x |
| 1966* | 100 | 116 | 116 | 147 | 147 | 108 | 108 | 80 | 80 | 105 | 104 |
SHARE PRICES INDEX—The latest Share Prices Index is described in the special supplement to the March 1961 issue of the Monthly Abstract of Statistics under the title of Share Prices Index—1960 Revision. The index is designed to reflect changes in the aggregate value of holdings of parcels of ordinary shares in representative selections of companies listed on the New Zealand Stock Exchanges and trading in New Zealand. In selecting the companies the frequency with which shares are traded was used as a criterion as well as the value of the New Zealand shareholding. Within the subgroups the weights of the different companies are determined by the New Zealand shareholding, and appropriate methods take account of capital changes in the companies concerned.
The weights used to combine the subgroup indexes to obtain the group and all-groups indexes are fixed and are based on the aggregate value in 1960 of the total New Zealand shareholdings in all the exchange-listed companies which qualified for representation in the index.
Shares of overseas registered companies have not been traded to any extent on the New Zealand Stock Exchange since restrictions were imposed by the Government in June 1966, Such companies, previously included in the regimen, have been excluded from the June 1966 and later index calculations. Another result is that banks are no longer represented. The various index series have been adjusted to take account of these changes.
Share Price Index Numbers—The table which follows shows index numbers for each month in 1966, and the averages for the calendar years 1960 to 1966 inclusive for the three groups and all groups.
| SHARE PRICES—CROUP INDEX NUMBERS | ||||
|---|---|---|---|---|
| Base: 1960 (= 1000) | ||||
| Period | Industrial | Distribution | Finance | All Groups |
| Calendar Month— | ||||
| 1960 | 1,000 | 1,000 | 1,000 | 1,000 |
| 1961 | 990 | 930 | 944 | 968 |
| 1962 | 958 | 864 | 1,026 | 963 |
| 1963 | 1,094 | 974 | 1,142 | 1,089 |
| 1964 | 1,330 | 1,143 | 1,153 | 1,252 |
| 1965 | 1,369 | 1,119 | 1,058 | 1,245 |
| Month— 1966 | ||||
| Jan | 1,283 | 987 | 1,009 | 1,162 |
| Feb | 1,280 | 960 | 1,048 | 1,167 |
| Mar | 1,315 | 964 | 1,042 | 1,186 |
| Apr | 1,326 | 948 | 1,039 | 1,189 |
| May | 1,289 | 917 | 1,010 | 1,155 |
| Jun | 1,309 | 914 | 1,057 | 1,177 |
| Jul | 1,316 | 883 | 1,079 | 1,181 |
| Aug | 1,283 | 869 | 1,038 | 1,150 |
| Sep | 1,270 | 861 | 1,054 | 1,145 |
| Oct | 1,224 | 826 | 1,028 | 1,105 |
| Nov | 1,218 | 852 | 1,053 | 1,111 |
| Dec | 1,227 | 846 | 1,042 | 1,113 |
A table showing annual averages follows.
| SHARE PRICES INDEX—SUBGROUP AND GROUP INDEX NUMBERS | |||||
|---|---|---|---|---|---|
| Base: 1960 (= 1000) | |||||
| Group | Year Ended | ||||
| 31 December 1965 | 31 Match 1966 | 30 June 1965 | 30 September 1966 | 31 December 1966 | |
| Industrial— | |||||
| Frozen meat | 1,691 | 1,633 | 1,559 | 1,503 | 1,441 |
| Other foods | 1,263 | 1,267 | 1,268 | 1,275 | 1,286 |
| Beverage industries | 1,103 | 1,072 | 1,061 | 1,055 | 1,047 |
| Textiles and apparel | 1,175 | 1,128 | 1,112 | 1,108 | 1,103 |
| Wood, pulp, paper | 1,492 | 1,464 | 1,473 | 1,470 | 1,438 |
| Leather, rubber, chemicals | 1,478 | 1,425 | 1,357 | 1,284 | 1,224 |
| Construction and materials | 1,362 | 1,333 | 1,314 | 1,311 | 1,310 |
| Other industrial | 1,552 | 1,524 | 1,498 | 1,473 | 1,446 |
| All industrial | 1,369 | 1,338 | 1,316 | 1,299 | 1,279 |
| Distribution | |||||
| Chain stores | 987 | 927 | 866 | 802 | 758 |
| Department stores | 1,184 | 1,114 | 1,052 | 994 | 947 |
| Other distribution | 1,142 | 1,091 | 1,036 | 981 | 935 |
| All distribution | 1,119 | 1,063 | 1,005 | 948 | 902 |
| All finance | 1,058 | 1,041 | 1,036 | 1,040 | 1,042 |
| All groups | 1,245 | 1,213 | 1,191 | 1,173 | 1,153 |
Long-term Linked Series—A long-term linked series is presented in the following table. It was thought reasonable to link the old finance group with the latest finance group. There is, however, no old series comparable with the distribution group of the latest series.
| SHARE PRICES INDEX NUMBERS—LONG-TERM LINKED SERIES | |||
|---|---|---|---|
| Base: 1960 (= 1000) | |||
| Year | Industrial | Finance | All Groups |
| 1926 | 376 | 404 | 398 |
| 1927 | 352 | 399 | 386 |
| 1928 | 363 | 414 | 399 |
| 1929 | 397 | 423 | 418 |
| 1930 | 345 | 365 | 362 |
| 1931 | 279 | 293 | 291 |
| 1932 | 276 | 271 | 276 |
| 1933 | 333 | 309 | 322 |
| 1934 | 412 | 349 | 378 |
| 1935 | 456 | 356 | 400 |
| 1936 | 444 | 332 | 380 |
| 1937 | 444 | 339 | 384 |
| 1938 | 413 | 318 | 359 |
| 1939 | 396 | 301 | 342 |
| 1940 | 423 | 311 | 359 |
| 1941 | 422 | 313 | 360 |
| 1942 | 415 | 323 | 363 |
| 1943 | 478 | 378 | 422 |
| 1944 | 516 | 415 | 460 |
| 1945 | 531 | 445 | 484 |
| 1946 | 567 | 509 | 534 |
| 1947 | 597 | 540 | 564 |
| 1948 | 591 | 512 | 546 |
| 1949 | 566 | 498 | 527 |
| 1950 | 620 | 571 | 592 |
| 1951 | 647 | 645 | 646 |
| 1952 | 526 | 540 | 534 |
| 1953 | 503 | 556 | 533 |
| 1954 | 561 | 652 | 612 |
| 1955 | 599 | 689 | 650 |
| 1956 | 608 | 719 | 670 |
| 1957 | 680 | 770 | 731 |
| 1958 | 659 | 716 | 691 |
| 1959 | 749 | 809 | 783 |
| Industrial | Distribution | Financial | All Groups | |
|---|---|---|---|---|
| 1960 | 1,000 | 1,000 | 1,000 | 1,000 |
| 1961 | 990 | 930 | 944 | 968 |
| 1962 | 958 | 864 | 1,026 | 963 |
| 1963 | 1,094 | 974 | 1,142 | 1,089 |
| 1964 | 1,330 | 1,143 | 1,153 | 1,252 |
| 1965 | 1,369 | 1,119 | 1,058 | 1,245 |
| 1966 | 1,279 | 902 | 1,042 | 1,153 |
The trend in share prices is clearly shown in the accompanying diagram, which is based on the foregoing index numbers.
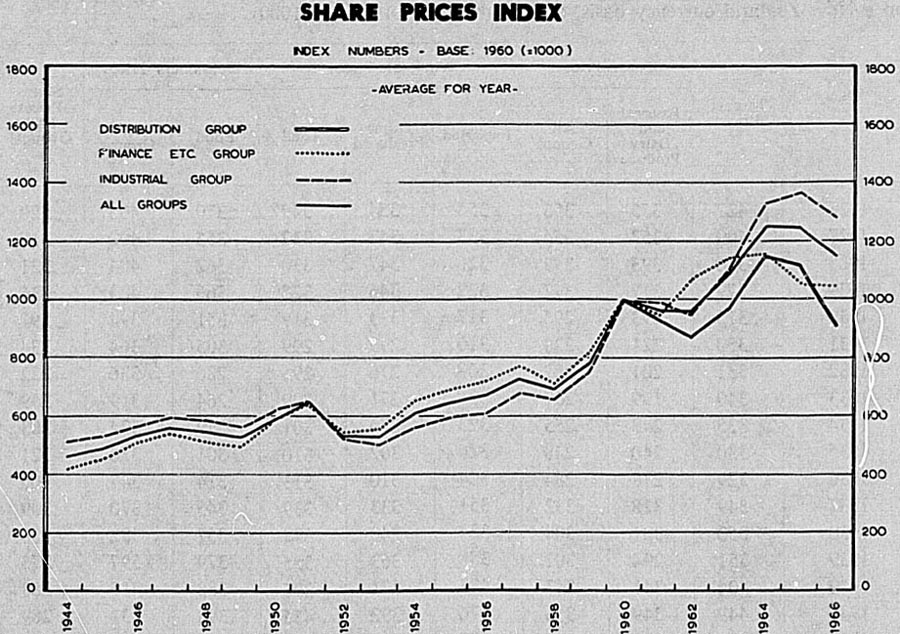
Dividend Yield Index—An indication of changes over time in the yields obtainable on investments, at current market prices in representative parcels of company shares, is measured by means of this index. The index is complementary to the 1960-based Share Prices Index and uses the same companies with appropriate weightings.
| INDEX NUMBERS OF DIVIDEND YIELDS ON MARKET PRICES OF COMPANY SHARES | ||||
|---|---|---|---|---|
| Base: 1960 (= 1000) | ||||
| Period | Industrial | Distribution | Financial | All Groups |
| Calendar year— | ||||
| 1960 | 1,000 | 1,000 | 1,000 | 1,000 |
| 1961 | 1,151 | 1,125 | 1,135 | 1,143 |
| 1962 | 1,257 | 1,261 | 1,159 | 1,228 |
| 1963 | 1,159 | 1,176 | 1,130 | 1,153 |
| 1964 | 1,037 | 1,070 | 1,133 | 1,067 |
| 1965 | 1,054 | 1,138 | 1,282 | 1,120 |
| 1966 | 1,166 | 1,432 | 1,368 | 1,250 |
| Month— | ||||
| 1966—Jan | 1,120 | 1,313 | 1,395 | 1,211 |
| Feb | 1,120 | 1,327 | 1,343 | 1,201 |
| Mar | 1,091 | 1,322 | 1,351 | 1,183 |
| Apr | 1,106 | 1,343 | 1,352 | 1,194 |
| May | 1,165 | 1,403 | 1,391 | 1,249 |
| June | 1,169 | 1,418 | 1,330 | 1,242 |
| July | 1,157 | 1,469 | 1,335 | 1,240 |
| Aug | 1,185 | 1,493 | 1,388 | 1,273 |
| Sept | 1,195 | 1,508 | 1,366 | 1,278 |
| Oct | 1,234 | 1,578 | 1,400 | 1,320 |
| Nov | 1,239 | 1,529 | 1,377 | 1,314 |
| Dec | 1,231 | 1,542 | 1,393 | 1,313 |
SUMMARY OF PRICE MOVEMENTS—A comparative table of index numbers of various related prices series from the year 1926 onward is as follows. All index numbers are quoted on a New Zealand currency basis, and on the base: 1965 (= 1000).
| Year | Import Prices | Export Prices | Wholesale Prices* | Consumers' Prices | Share Prices (All Groups) | ||||
|---|---|---|---|---|---|---|---|---|---|
| Pastoral and Dairy Produce | All Groups | Imported | Home Produced | Total | Food | All Groups | |||
*The three series have been individually linked. †Provisional. | |||||||||
| 1926 | 427 | 355 | 356 | 354 | 354 | 349 | 370 | 405 | 320 |
| 1927 | 409 | 353 | 354 | 333 | 342 | 332 | 355 | 402 | 310 |
| 1928 | 386 | 393 | 392 | 326 | 347 | 330 | 362 | 404 | 321 |
| 1929 | 379 | 377 | 377 | 322 | 346 | 328 | 365 | 403 | 336 |
| 1930 | 375 | 293 | 296 | 317 | 333 | 319 | 351 | 394 | 391 |
| 1931 | 350 | 221 | 228 | 310 | 293 | 299 | 305 | 364 | 234 |
| 1932 | 331 | 201 | 207 | 308 | 276 | 291 | 280 | 336 | 222 |
| 1933 | 340 | 199 | 207 | 326 | 271 | 299 | 264 | 319 | 259 |
| 1934 | 335 | 248 | 255 | 323 | 279 | 301 | 279 | 324 | 303 |
| 1935 | 330 | 240 | 248 | 324 | 302 | 310 | 301 | 336 | 321 |
| 1936 | 329 | 278 | 284 | 324 | 310 | 313 | 314 | 347 | 305 |
| 1937 | 349 | 328 | 332 | 351 | 333 | 339 | 345 | 370 | 309 |
| 1938 | 350 | 301 | 308 | 354 | 340 | 344 | 357 | 382 | 389 |
| 1939 | 351 | 294 | 302 | 358 | 363 | 355 | 379 | 397 | 275 |
| 1940 | 404 | 341 | 347 | 423 | 371 | 396 | 388 | 415 | 288 |
| 1941 | 449 | 349 | 356 | 476 | 392 | 435 | 398 | 431 | 289 |
| 1942 | 492 | 359 | 365 | 523 | 411 | 470 | 407 | 445 | 292 |
| 1943 | 545 | 375 | 381 | 576 | 415 | 502 | 409 | 455 | 339 |
| 1944 | 571 | 394 | 401 | 595 | 425 | 517 | 416 | 464 | 369 |
| 1945 | 582 | 427 | 433 | 604 | 433 | 525 | 415 | 470 | 389 |
| 1946 | 649 | 467 | 473 | 602 | 440 | 527 | 416 | 474 | 429 |
| 1947 | 773 | 591 | 595 | 615 | 471 | 547 | 442 | 488 | 453 |
| 1948 | 789 | 657 | 661 | 691 | 517 | 609 | 499 | 527 | 439 |
| 1949 | 718 | 637 | 639 | 676 | 528 | 605 | 513 | 536 | 424 |
| 1950 | 787 | 905 | 903 | 717 | 601 | 659 | 563 | 566 | 476 |
| 1951 | 921 | 1,063 | 1,059 | 836 | 699 | 763 | 647 | 629 | 519 |
| 1952 | 1,006 | 849 | 852 | 942 | 758 | 853 | 713 | 678 | 429 |
| 1953 | 948 | 947 | 948 | 895 | 802 | 844 | 756 | 709 | 428 |
| 1954 | 935 | 963 | 966 | 855 | 839 | 837 | 795 | 741 | 492 |
| 1955 | 955 | 988 | 992 | 870 | 841 | 846 | 814 | 760 | 522 |
| 1956 | 979 | 965 | 968 | 893 | 887 | 878 | 860 | 786 | 538 |
| 1957 | 1,012 | 953 | 953 | 916 | 880 | 889 | 858 | 803 | 587 |
| 1958 | 1,007 | 807 | 812 | 946 | 900 | 914 | 871 | 839 | 555 |
| 1959 | 982 | 926 | 927 | 970 | 910 | 928 | 876 | 871 | 629 |
| 1960 | 997 | 896 | 900 | 956 | 920 | 931 | 889 | 877 | 803 |
| 1961 | 1,002 | 844 | 851 | 960 | 914 | 928 | 897 | 893 | 778 |
| 1962 | 979 | 861 | 868 | 961 | 906 | 922 | 902 | 916 | 773 |
| 1963 | 978 | 951 | 950 | 979 | 923 | 940 | 919 | 935 | 875 |
| 1964 | 998 | 1,039 | 1,035 | 982 | 969 | 973 | 972 | 967 | 1,006 |
| 1965 | 1,000 | 1,000 | 1,000 | 1,000 | 1,000 | 1,000 | 1,000 | 1,000 | 1,000 |
| 1966 | 1012† | 993† | 992† | 1,017 | 1016† | 1017† | 1,018 | 1,028 | 926 |
Various price index numbers for March and June years are given in the following table.
| Year | Base: Calendar Year 1965 (= 1000) | |||||||
|---|---|---|---|---|---|---|---|---|
| Import Prices (All Groups) | Export Prices (All Groups) | Wholesale Prices* | Consumers' Prices | Share Prices (All Groups) | ||||
| Imported | Home Produced | Total | Food | All Groups | ||||
*The two component series have been individually linked. †Provisional. | ||||||||
| Year ended 31 March | ||||||||
| 1940 | .. | .. | 368 | 367 | 362 | 384 | 401 | 280 |
| 1941 | .. | .. | 442 | 374 | 409 | 389 | 418 | 286 |
| 1942 | .. | .. | 482 | 400 | 441 | 401 | 433 | 287 |
| 1943 | .. | .. | 538 | 412 | 479 | 407 | 448 | 303 |
| 1944 | .. | .. | 584 | 421 | 509 | 411 | 457 | 349 |
| 1945 | .. | .. | 597 | 425 | 518 | 415 | 465 | 371 |
| 1946 | .. | .. | 607 | 432 | 527 | 416 | 471 | 400 |
| 1947 | .. | .. | 596 | 447 | 527 | 417 | 474 | 437 |
| 1948 | .. | .. | 637 | 484 | 565 | 460 | 500 | 452 |
| 1949 | .. | .. | 690 | 521 | 611 | 502 | 530 | 434 |
| 1950 | 735 | .. | 679 | 534 | 610 | 517 | 539 | 432 |
| 1951 | 804 | 1,087 | 738 | 634 | 685 | 584 | 580 | 493 |
| 1952 | 963 | 879 | 875 | 720 | 799 | 669 | 647 | 498 |
| 1953 | 993 | 863 | 937 | 764 | 853 | 723 | 685 | 419 |
| 1954 | 947 | 964 | 881 | 814 | 842 | 768 | 718 | 442 |
| 1955 | 937 | 975 | 855 | 846 | 840 | 801 | 747 | 504 |
| 1956 | 959 | 1,001 | 876 | 840 | 849 | 819 | 764 | 527 |
| 1957 | 989 | 962 | 900 | 885 | 882 | 862 | 792 | 543 |
| 1958 | 1,013 | 915 | 917 | 889 | 893 | 865 | 809 | 596 |
| 1959 | 1,004 | 822 | 959 | 909 | 924 | 875 | 853 | 549 |
| 1960 | 984 | 948 | 966 | 913 | 929 | 876 | 872 | 675 |
| 1961 | 997 | 881 | 956 | 919 | 931 | 894 | 881 | 823 |
| 1962 | 998 | 842 | 961 | 913 | 927 | 899 | 900 | 758 |
| 1963 | 972 | 888 | 964 | 906 | 924 | 902 | 921 | 791 |
| 1964 | 982 | 990 | 984 | 932 | 948 | 929 | 941 | 913 |
| 1965 | 1,002 | 1,023 | 983 | 980 | 982 | 985 | 978 | 1,026 |
| 1966 | 1007† | 994† | 1,006 | 1,019 | 1,019 | 1,006 | 1,007 | 974 |
| Year ended 30 June | ||||||||
| 1940 | .. | 341 | 383 | 371 | 373 | 387 | 405 | 284 |
| 1941 | .. | 352 | 457 | 377 | 418 | 391 | 423 | 284 |
| 1942 | .. | 365 | 493 | 405 | 450 | 402 | 436 | 288 |
| 1943 | .. | 376 | 553 | 415 | 489 | 408 | 451 | 316 |
| 1944 | .. | 392 | 589 | 422 | 513 | 413 | 460 | 358 |
| 1945 | .. | 426 | 599 | 426 | 520 | 416 | 467 | 374 |
| 1946 | .. | 445 | 609 | 435 | 529 | 416 | 472 | 411 |
| 1947 | .. | 548 | 594 | 452 | 527 | 419 | 475 | 446 |
| 1948 | .. | 660 | 650 | 500 | 585 | 479 | 513 | 447 |
| 1949 | .. | 634 | 687 | 523 | 609 | 504 | 532 | 428 |
| 1950 | 751 | 732 | 687 | 549 | 621 | 528 | 545 | 443 |
| 1951 | 831 | 1,134 | 767 | 657 | 711 | 605 | 596 | 508 |
| 1952 | 991 | 857 | 903 | 734 | 822 | 687 | 560 | 474 |
| 1953 | 972 | 917 | 926 | 775 | 851 | 732 | 692 | 415 |
| 1954 | 942 | 970 | 870 | 827 | 840 | 783 | 728 | 459 |
| 1955 | 940 | 964 | 860 | 846 | 842 | 806 | 751 | 512 |
| 1956 | 971 | 984 | 880 | 849 | 855 | 827 | 769 | 533 |
| 1957 | 998 | 986 | 908 | 888 | 887 | 865 | 797 | 555 |
| 1958 | 1,009 | 825 | 919 | 889 | 894 | 867 | 813 | 587 |
| 1959 | 996 | 860 | 972 | 912 | 930 | 875 | 864 | 557 |
| 1960 | 994 | 949 | 962 | 918 | 931 | 876 | 873 | 726 |
| 1961 | 994 | 861 | 957 | 917 | 930 | 897 | 884 | 827 |
| 1962 | 995 | 844 | 962 | 910 | 925 | 902 | 907 | 755 |
| 1963 | 975 | 907 | 971 | 908 | 927 | 906 | 926 | 808 |
| 1964 | 987 | 1,024 | 982 | 945 | 956 | 941 | 948 | 945 |
| 1965 | 998 | 1,007 | 990 | 988 | 989 | 993 | 986 | 1,034 |
| 1966 | 1013† | 997† | 1,007 | 1,024 | 1,023 | 1,015 | 1,014 | 957 |
CONSUMPTION IN NEW ZEALAND—The figures given for the consumption of various foodstuffs, as well as liquor and tobacco, represent available supplies in New Zealand. They are obtained by deducting exports from the aggregates of local production and imports. Adjustments are made for changes in stocks, wastage, and industrial and other non-food usage. It must be realised that, owing to a lack of comparability in the basic data of production and trade, these estimates cannot be compiled with absolute accuracy. Nevertheless, they do provide a useful indication of the levels of consumption in the country; these levels are apparently fairly uniform throughout the community.
Farm Products—The proportions of the main farm products which are consumed in New Zealand and the proportions which are exported are shown in the next table, giving percentages over the three-year period 1963-64 to 1965-66.
| Product | Consumed in New Zealand | Exported |
|---|---|---|
| percent | percent | |
| Butter | 20.7 | 79.3 |
| Cheese | 8.5 | 91.5 |
| All meats | 33.6 | 66.4 |
| Beef and veal | 44.9 | 55.1 |
| Mutton | 50.5 | 49.5 |
| Lamb | 6.8 | 93.2 |
| Pig meat | 89.6 | 10.4 |
Dairy Produce—Measured in terms of butterfat content, it is estimated that 23.0 percent of total dairy production in 1965-66 was used for local human consumption. A further 3.1 percent was accounted for by stock feeding, wastage, etc., leaving 73.9 percent for export in the form of butter, cheese, processed milk, and casein. Estimated figures of annual consumption levels for the main items of dairy produce are given below.
| Product | 1933-38 | 1949-54 | 1962-63 | 1963-64 | 1964-65 | 1965-66 |
|---|---|---|---|---|---|---|
| *Provisional. | ||||||
| Whole milk (pint) | 220.0 | 321.5 | 290.0 | 290.0* | 290.0* | 290.0* |
| Cream (pint) | 6.9 | 3.9 | 5.2 | 5.3* | 5.4* | 5.4* |
| Ice cream (pint) | 3.2 | 13.2 | 18.8 | 20.8 | 20.4 | 21.0 |
| Cheese (lb) | 4.5 | 5.9 | 6.6 | 7.9 | 7.4 | 7.1 |
| Butter (lb) | 41.2 | 39.2 | 42.9 | 43.2 | 43.1 | 43.0 |
| Condensed milk and whole milk powders (lb) | 4.7 | 7.0 | 5.6 | 6.1 | 5.1 | 5.4 |
Meats—In estimating the average annual consumption of meats an allowance has been made for killings on farms. The consumption levels for the various items are as follows, the weights in each case being on a bone-in dressed-carcass basis.
| Product | 1937-40 | 1949-52 | 1963-64 | 1964-65 | 1965-66 |
|---|---|---|---|---|---|
| Beef (lb) | 114.0 | 111.1 | 97.2x | 101.6x | 101.3 |
| Veal (lb) | 7.5 | 5.7 | 8.2x | 7.9 | 7.2 |
| Mutton (lb) | 69.0 | 64.8 | 76.3x | 73.0x | 64.0 |
| Lamb (lb) | 10.2 | 18.0x | 16.3 | 18.4 | |
| Pork, including chopper meat (lb) | 9.0 | 11.1 | 16.0x | 15.2 | 14.5 |
| Ham and bacon (lb) | 17.0 | 19.5 | 19.5x | 17.1 | 16.3 |
| Edible offal (lb) | 9.0 | 9.7 | 9.3x | 9.2 | 9.7 |
Vegetables and Fruits—Domestic garden production is taken into account for fruit and vegetables, although it is difficult to calculate likely consumption from this source. The estimates include, at fresh weights, New Zealand produced fruits and vegetables canned for local consumption; imports of canned produce are excluded. Consumption levels for individual items are estimated as follows.
| Product | 1936-39 | 1949-52 | 1964 | 1965 |
|---|---|---|---|---|
| *Includes cauliflower, lettuce, silver beet, sprouts, and spinach. | ||||
| Potatoes (lb) | 119 | 113 | 134 | 136 |
| Kumeras (lb) | 7.5 | 5.0 | 3.0 | 3.6 |
| Cabbages and leaf greens* (lb) | 30-35 | 35-45 | 60-80 | 60-80 |
| Carrots (lb) | 10-15 | 10-15 | 15-20 | 20-25 |
| Tomatoes (lb) | 20 | 20 | 30 | 25 |
| Apples (lb) | 45 | 37 | 47 | 42 |
| Pears and quinces (lb) | 6 | 9 | 11 | 11 |
| Stone fruits (lb) | 13 | 16 | 22 | 27 |
| Citrus fruits (lb) | 22 | 18 | 20 | 20 |
| Bananas (lb) | 20 | 10 | 24 | 24 |
| Pineapples (lb) | 0.9 | 0.5 | 0.2 | 0.1 |
Canned Fruit and Vegetables—Total annual consumption of canned fruits and vegetables per head is estimated as follows. The figures include New Zealand produced canned fruit and vegetables already accounted for as fresh fruit in the preceding table.
| Product | 1936-39 | 1949-52 | 1963 | 1964 | 1965 |
|---|---|---|---|---|---|
| Canned fruit (lb) | 10.1 | 13.0 | 13.5 | 15.8 | 14.9 |
| Canned tomatoes, including sauces and soups (lb) | - | 4.2 | 4.1 | 5.7 | 5.4 |
| Canned vegetables (lb) | 1.6 | 9.1 | 13.8 | 12.8 | 8.8 |
Consumption of (net) imports of canned fruit is as follows:
| Product | 1936-39 | 1949-52 | 1963 | 1964 | 1965 |
|---|---|---|---|---|---|
| Canned fruit (lb) | 7.6 | 10.2 | 4.8 | 4.2 | 3.2 |
Before the war approximately 70 to 80 percent of canned fruit requirements were imported and consisted mainly of pineapples, peaches, and apricots, but except for pineapples the market is now largely met from local canning factories.
Most of the demand for canned vegetables is now met from local production. With the falling off in production of canned peas in favour of quick-frozen peas, baked beans have increased in relative importance, as have canned asparagus and sweet corn.
Quick-frozen Fruit and Vegetables—There has been a remarkable development in the quick-frozen foods industry in recent years coupled with a growing export trade. Consumption per head in New Zealand for the latest five years is estimated as follows.
| Product | 1961 | 1962 | 1963 | 1964 | 1965 |
|---|---|---|---|---|---|
| Fruits (lb) | 0.1 | 0.1 | 0.1 | 0.1 | 0.1 |
| Vegetables (lb)— | |||||
| Peas | 7.1 | 8.4 | 8.6 | 6.9 | 7.7 |
| Beans | 1.3 | 1.7 | 1.3 | 0.7 | 1.5 |
| Other | 0.6 | 1.0 | 1.5 | 1.5 | 1.3 |
Other Foodstuffs—Estimated annual consumption levels for other items of foodstuffs are given hereunder.
| Product | 1937-39 | 1949-51 | 1963-65 |
|---|---|---|---|
| *Cocoa powder equivalent of imports for all purposes, including chocolate manufacture. | |||
| Poultry (lb) | 3.5 | 3.5 | 5.0 |
| Fish—edible portion, excluding processed imports (lb) | 11.0 | 11.0 | 10.7 |
| Shellfish—edible portion (lb) | 1.3 | 2.0 | 1.6 |
| Eggs (dozen) | 20.0 | 22.0 | 24.7 |
| Honey (lb) | .. | 5.1 | 3.6 |
| Refined sugar (lb) | 97.0 | 99.0 | 85.4 |
| Dried peas and beans (lb) | 1.6 | 3.0 | 3.2 |
| Flour, wheaten (lb) | 178.0 | 182.0 | 180.5 |
| Oatmeal, oaten products (lb) | 9.1 | 7.7 | 4.6 |
| Rice (lb) | 5.4 | 2.6 | 2.9 |
| Tea (lb) | 6.6 | 7.3 | 6.7 |
| Cocoa (lb)* | 1.9 | 2,0 | 1.8 |
| Coffee (lb) | 0.3 | 0.6 | 2.8 |
Beer, Wine, Spirits, and Tobacco—Total consumption per head of these items is estimated at:
| Product | 1938 | 1951 | 1963 | 1964 | 1965 |
|---|---|---|---|---|---|
| * Figures relate to 12 months ended 30 June of year stated. | |||||
| Beer (gallons) | 11.1 | 18.8 | 22.2 | 22.4 | 22.7 |
| Grape wine (gallons) | 0.22 | 0.44 | 0.51 | 0.56 | 0.61 |
| Spirits (proof gallons) | 0.28 | 0.45 | 0.42 | 0.45 | 0.47 |
| Tobacco (lb) | 3.8 | 5.4 | 5.2* | 5.6* | 5.0* |
In interpreting the big increase in beer consumption from pre-war years it should not be overlooked that as a war measure the alcoholic strength of beer was, in 1942, reduced by about one-quarter, and it is possible that, on account of this, consumption was higher than it would otherwise have been. Although this restriction was removed at the end of 1948 the additional duty on beer exceeding the reduced strength has had much the same effect as the former restriction in limiting the production of stronger beers. In 1965 beer consumption per head in Australia was 24.2 gallons and in the United Kingdom 20.0 gallons.
Domestic wine production has increased during recent years and now accounts for over 80 percent of total consumption of wines. The production of spirits is now being undertaken in New Zealand and 450,000 proof gallons of locally produced gin were released for home consumption in 1965.
Tobacco consumption in Australia in 1965 was 5.3 lb per head and in the United Kingdom 4.4 lb per head. Over half the tobacco leaf used to produce cigarettes and tobacco is grown in New Zealand.
COMPARISON WITH OTHER COUNTRIES—The table which follows presents for selected countries statistics on food consumption from the Food and Agriculture Organisation's Production Yearbook, and the United Nations Statistical Yearbook. A total figure is given showing calories per person per day, and the percentage derived from livestock products (meat, poultry, eggs, fish, milk, butter, cheese, slaughter fats, marine oils). The total calories figure includes also foodstuffs not specifically mentioned in the table.
| Country | Cereals | Potatoes, etc. | Sugar | Pulses and Nuts | Meat | Milk and Milk Products* | Fats† and Oils | Calories | ||
|---|---|---|---|---|---|---|---|---|---|---|
| Fat | Protein | Per Person Per Day | Percentage of Animal Origin | |||||||
*Excluding butter. †Including butter. ‡ Negligible. § Percentages for earlier post-war years in these cases. ||Includes present territory of Pakistan. ¶Tentative data. | ||||||||||
| Kilogrammes per Person per Year | ||||||||||
| Australia Pre-war | 101 | 49 | 53 | 2 | 120 | 6 | 5 | 16 | 3,300 | 40 |
| 1963-64 | 85 | 47 | 49 | 4 | 111 | 8 | 7 | 14 | 3,160 | 42 |
| Canada Pre-war | 93 | 60 | 43 | 6 | 6 | 8 | 7 | 19 | 3,020 | 39 |
| 1963-64 | 68 | 60 | 43 | - | 81 | 7 | 8 | 20 | 3,020 | .. |
| New Zealand Pre-war | 87 | 50 | 48 | 3 | 109 | 8 | 8 | 17 | 3,260 | 48 |
| 1965 | 86 | 62 | 40 | 6 | 111 | 10 | 10 | 24 | 3,460 | 51 |
| United Kingdom Pre-war | 95 | 82 | 42 | 5 | 67 | 5 | 5 | 21 | 3,110 | 38 |
| 1963-64 | 80 | 101 | 46 | 6 | 70 | 8 | 8 | 24 | 3,280 | 44 |
| Ireland, Republic of Pre-war | 131 | 195 | 38 | 2 | 55 | 5 | 9 | 14 | 3,400 | 35 |
| 1963 | 105 | 138 | 48 | 4 | 68 | 9 | 9 | 19 | 3,480 | 40 |
| South Africa Pre-war | 156 | 16 | 21 | 2 | 38 | 3 | 3 | 3 | 2,340 | 19 |
| 1960-61 | 166 | 14 | 41 | 4 | 44 | 3 | 3 | 5 | 2,820 | 20 |
| United States of Pre-war | 92 | 67 | 44 | 8 | 72 | 8 | 7 | 21 | 3,280 | 37 |
| America 1964 | 66 | 46 | 40 | 7 | 103 | 8 | 9 | 22 | 3,120 | 40 |
| Argentina Pre-war | 106 | 66 | 27 | 2 | 107 | 5 | 5 | 9 | 2,780 | 38 |
| 1962 | 76 | 69 | 37 | 2 | 101 | 4 | 4 | 16 | 2,660 | 36 |
| Denmark Pre-war | 94 | 120 | 50 | 5 | 75 | 8 | 8 | 27 | 3,450 | 35 |
| 1963-64 | 77 | 109 | 47 | 8 | 63 | 9 | 9 | 28 | 3,360 | 44 |
| France Pre-war | 124 | 143 | 24 | 8 | 55 | 4 | 5 | 16 | 2,880 | .. |
| 1960-61|¶ | 99 | 104 | 29 | 7 | 74 | 6 | 7 | - | .. | .. |
| Netherlands Pre-war | 107 | 116 | 29 | 5 | 38 | 7 | 8 | 21 | 2,840 | 32 |
| 1963-64 | 76 | 99 | 45 | 4 | 51 | 8 | 9 | 21 | 3,100 | .. |
| Sweden Pre-war | 95 | 122 | 44 | 3 | 49 | 11 | 10 | 18 | 3,120 | 38 |
| 1963-64 | 69 | 96 | 39 | 3 | 52 | 10 | 9 | 22 | 2,950 | 42 |
| India Pre-war|| | 139 | 8 | 13 | 22 | 3 | 3† | 2 | 2* | 1,950 | 8 |
| 1962-63 | 134 | 10 | 17 | 21 | 1 | 3† | 2† | 4* | 1,940 | 6 |
| Japan Pre-war | 1,513 | 46 | 13 | 17 | 3 | ‡ | ‡ | 1 | 2,050 | 4 |
| 1963 | 148 | 66 | 16 | 16 | 8 | 1 | 1 | 6 | 2,280 | 9 |
Butter and cheese consumption per head in selected countries is shown in the following table. (Source: Commonwealth Secretariat.)
| Country | Butter | Cheese | ||||
|---|---|---|---|---|---|---|
| 1938 or 1938-39 | 1950 or 1950-51 | 1964 or 1964-65 | 1938 or 1938-39 | 1950 or 1950-51 | 1964 or 1964-65 | |
| lb | lb | lb | lb | lb | lb | |
| Australia | 32.6 | 30.1 | 22.8 | 4.3 | 6.5 | 7.1 |
| Canada | 31.9 | 22.1 | 19.0 | 3.6 | 5.5 | 8.6 |
| Denmark | 18.3 | 10.6 | 23.4 | 14.1 | 11.5 | 20.3 |
| Netherlands | 12.3 | 6.0 | 11.0 | 17.0 | 11.6 | 19.0 |
| New Zealand | 42.8 | 37.2 | 43.1 | 4.5 | 5.9 | 7.4 |
| Sweden | 24.1 | 30.0 | 20.9 | 12.8 | 17.9 | 17.6 |
| United Kingdom | 24.1 | 16.9 | 18.9 | 8.9 | 10.1 | 10.5 |
| United States of America | 16.6 | 10.6 | 6.8 | 5.9 | 7.6 | 9.5 |
In considering New Zealand's relatively high consumption of butter it should be noted that the use of margarine as a spread, common in some countries, is unknown in New Zealand.
SUBSIDIES—Government subsidies were introduced in 1942 as part of the stabilisation policy during the war. Subsidies in operation at the beginning of the financial year in April 1966 were as follows.
| $ c | $ c | ||
|---|---|---|---|
| Butter (lb) | 0 7.71 | Flour (25 lb) | 0 50.0 |
| Milk (quart) | 0 3.67 | Eggs (doz) | 0 3.33 |
| Bread (2 lb) | 0 3.68 | Gas (1.000 cu. ft.) | 0 20.0 |
The following table shows the cost of the subsidies for the five latest financial years.
| Subsidy Items | Year Ended 31 March | ||||
|---|---|---|---|---|---|
| 1963 | 1964 | 1965 | 1966 | 1967 | |
| $(thousand) | |||||
| Butter | 7,514 | 7,628 | 9,858 | 10,270 | 8,991 |
| Milk | 9,085 | 9,170 | 10,774 | 12,397 | 14,187 |
| Eggs | 941 | 1,046 | 1,040 | 1,060 | 1,254 |
| Bread and flour | 9,980 | 10,570 | 11,590 | 11,680 | 9,730 |
| Gas | 1,000 | 876 | 1,126 | 1,152 | 1,229 |
| Industrial coal (rail transport) | - | 238 | 261 | 607 | 420 |
| Totals | 28,520 | 29,528 | 34,649 | 37,166 | 35,811 |
The subsidies on butter, bread, and flour were abolished from 11 February 1967.
Table of Contents
INTRODUCTORY—National accounting can be described as the preparation of a comprehensive statistical statement about the economic activity of a country. One of its main objectives is to measure the overall value of production in a country's economy. The system of accounts presents the inter-relationships as well as the magnitudes of the major economic flows of the country in terms of the consolidated transactions of the principal sectors.
The principal aggregate is that of “National Income”, which, in general terms, measures the total value of all incomes (before deduction of taxation) earned by the residents of New Zealand in producing the current output of goods and services.
Income can be earned in a variety of ways, and accrues to individuals according to the mariner in which they participate in current production. Salary and wage payments represent the return to labour for services rendered, and include in this concept supplementary income in kind such as board and keep provided by the employer.
Rental value of owner-occupied houses is a non-monetary item representing the imputed net rent (before payment of rates, but after deductions for depreciation, mortgage interest, insurance, and repairs and maintenance) of all owner-occupied houses (except farm houses).
Other personal income (excluding company dividends) represents the aggregate income of professional men, farmers, and individual traders, as well as income other than salary and wages received by salary and wage earners—e.g., rent and interest. Included under this heading as current income is the surplus of primary-produce stabilisation accounts, and moneys retained under authority of the Wool Proceeds Retention Act 1950.
Company income represents the total income (distributed and undistributed) of companies. This means that dividends distributed to individuals are included under this heading, and not as personal income.
Apart from these incomes, which result from current productive activities on the part of individuals receiving them, there are other incomes of a “non-productive” nature in the form of social security benefits, pensions, and interest on public debt. These transfer incomes, as they are called, do not arise from the current production of goods and services and must therefore be excluded from the national income. They do, however, form part of the intermediate concept of private income, which represents the aggregate of earned incomes and unearned transfer incomes received by or accruing to persons. The deduction of direct taxation gives the concept of private disposable income. Capital receipts—e.g., from deceased persons' estates, repayment of debt, etc.—are, however, excluded both from private income and national income.
In general, only incomes arising from the production of goods and services destined for the market form part of the national income; it follows, therefore, that the services of housewives, or the produce of home gardens are excluded. On the other hand, farm produce consumed on farms is part of the national income.
The addition to private income of Government and local authority trading profits and the deduction of transfer incomes, as already detailed, gives the concept of net national income at factor cost or, more briefly, national income. This may be defined as the income (before tax) earned by or accruing to the factors of production, in or only temporarily absent from New Zealand, in producing the current output of goods and services of all kinds. The further addition of indirect taxes (net of subsidies) is necessary to bring the national income to market price valuation.
Gross national product is obtained by adding depreciation allowances to national income at market prices, and represents the value of output before deduction of allowances for depreciation and obsolescence attributable to the factors of production supplied by New Zealand residents during the year.
The following table shows the principal of the above aggregates and the manner in which they are derived one from the other for the years 1938-39 to 1965-66.
| PRINCIPAL INCOME AGGREGATES | |||||||||||
|---|---|---|---|---|---|---|---|---|---|---|---|
| *March Year | Private Income | Plus | Less Transfer Incomes | National Income at Factor Cost | Plus Indirect Taxation | Less Subsidies | National Income at Market Prices | Plus Depreciation Allowances | Gross National Product | ||
| Public Authority Trading Income | Lump Sum Payments From United Kingdom Government | Social Security Benefits and Pensions | Interest on Public Debt Paid in New Zealand | ||||||||
| * Provisional. | |||||||||||
| $(million) | |||||||||||
| 1938-39 | 400.1 | 18.4 | ... | -14.8 | -14.0 | 389.7 | 41.2 | -1.2 | 429.7 | 34.0 | 463.7 |
| 1939-40 | 431.3 | 22.0 | 6.0 | -22.3 | -15.0 | 422.0 | 42.0 | -1.0 | 463.0 | 36.0 | 499.0 |
| 1940-41 | 469.7 | 25.0 | 6.0 | -24.4 | -15.6 | 460.7 | 44.6 | -3.2 | 502.1 | 36.0 | 538.1 |
| 1941-42 | 512.7 | 28.2 | 6.0 | -25.2 | -16.8 | 504.9 | 46.4 | -5.4 | 545.9 | 36.0 | 581.9 |
| 1942-43 | 589.3 | 34.2 | 6.0 | -27.8 | -18.8 | 582.9 | 56.0 | -6.6 | 632.3 | 38.0 | 670.3 |
| 1943-44 | 662.8 | 36.4 | 6.0 | -30.9 | -22.6 | 651.7 | 63.6 | -6.2 | 709.1 | 40.0 | 749.1 |
| 1944-45 | 678.5 | 30.1 | 10.0 | -34.3 | -25.8 | 658.5 | 68.0 | -9.2 | 717.3 | 42.0 | 759.3 |
| 1945-46 | 720.5 | 31.7 | 10.0 | -41.1 | -27.6 | 693.5 | 74.6 | -13.2 | 754.9 | 44.0 | 798.9 |
| 1946-47 | 795.2 | 30.4 | 10.0 | -68.6 | -30.2 | 736.8 | 86.0 | -23.6 | 799.2 | 52.0 | 851.2 |
| 1947-48 | 394.1 | 28.2 | 10.0 | -74.1 | -30.6 | 827.6 | 106.0 | -27.2 | 906.4 | 58.0 | 964.4 |
| 1948-49 | 928.3 | 25.5 | ... | -77.6 | -31.0 | 845.2 | 92.2 | -23.0 | 914.4 | 64.0 | 978.4 |
| 1949-50 | 1,048.1 | 29.2 | ... | -83.9 | -32.4 | 961.0 | 99.6 | -29.2 | 1,031.4 | 70.0 | 1,101.4 |
| 1950-51 | 1,318.7 | 34.1 | ... | -93.6 | -34.0 | 1,225.2 | 111.2 | -18.8 | 1,317.6 | 78.0 | 1,395.6 |
| 1951-52 | 1,350.2 | 40.3 | ... | -105.4 | -34.9 | 1,250.2 | 142.0 | -32.2 | 1,360.0 | 86.0 | 1,446.0 |
| 1952-53 | 1,420.0 | 38.5 | ... | -106.8 | -34.4 | 1,317.3 | 134.0 | -30.0 | 1,421.3 | 96.0 | 1,517.3 |
| 1953-54 | 1,572.4 | 49.7 | ... | -114.7 | -36.7 | 1,470.7 | 135.0 | -31.0 | 1,574.7 | 106.0 | 1,680.7 |
| 1954-55 | 1,705.8 | 60.0 | ... | -122.1 | -40.5 | 1,603.2 | 161.4 | -26.8 | 1,737.8 | 122.0 | 1,859.8 |
| 1955-56 | 1,793.7 | 63.9 | ... | -128.2 | -41.8 | 1,687.6 | 170.6 | -24.8 | 1,833.4 | 132.0 | 1,965.4 |
| 1956-57 | 1,891.3 | 60.7 | ... | -131.9 | -46.7 | 1,773.4 | 168.2 | -26.6 | 1,915.0 | 146.0 | 2,061.0 |
| 1957-58 | 1,997.0 | 65.2 | ... | -139.4 | -52.5 | 1,870.3 | 182.4 | -27.2 | 2,025.5 | 158.0 | 2,183.5 |
| 1958-59 | 2,065.4 | 74.2 | ... | -159.6 | -56.8 | 1,923.2 | 208.2 | -27.0 | 2,104.4 | 166.0 | 2,270.4 |
| 1959-60 | 2,250.3 | 81.6 | -... | 197.4 | - 59.4 | 2,075.1 | 216.8 | -25.6 | 2,266.3 | 168.0 | 2,434.3 |
| 1960-61 | 2,428.6 | 91.3 | ... | -212.4 | -65.0 | 2,242.5 | 225.8 | -30.6 | 2,437.7 | 184.0 | 2,621.7 |
| 1961-62 | 2,502.2 | 99.6 | ... | -217.6 | -70.2 | 2,314.0 | 231.2 | -28.4 | 2,516.8 | 204.0 | 2,720.8 |
| 1962-63 | 2,695.4 | 106.1 | ... | -218.6 | -77.3 | 2,505.6 | 228.2 | -29.4 | 2,704.4 | 220.0 | 2,924.4 |
| 1963-64 | 2,938.8 | 123.8 | ... | -229.4 | -88.6 | 2,744.6 | 253.8 | -30.2 | 2,968.2 | 232.0 | 3,200.2 |
| 1964-65 | 3,190.1 | 136.6 | ... | -233.6 | -94.7 | 2,998.4 | 275.6 | -35.4 | 3,238.6 | 250.0 | 3,488.6 |
| 1965-66* | 3,440.1 | 149.5 | ... | -242.2 | -104.8 | 3,242.6 | 289.4 | -39.2 | 3,492.8 | 266.0 | 3,758.8 |
Estimates of gross national product from 1932-33 to 1937-38 are as follows:
| 1932-33 | 1933-34 | 1934-35 | 1935-36 | 1936-37 | 1937-38 | |
| Gross national product—$(million) | 227.4 | 254.0 | 271.2 | 310.8 | 384.6 | 423.8 |
These estimates are based upon former computations of aggregate private income, with suitable adjustments to bring them into line with present-day concepts.
The various aggregates are conventionally measured in New Zealand over periods of one year, ending 31 March. Monetary values in all cases are given in New Zealand currency without adjustment for price changes between individual years. Full details of the methods used and a description of the items in the following tables are given in National Income and Expenditure 1965-66, obtainable from the Government Printer, Auckland, Wellington, Hamilton, Christchurch, and Dunedin.
NATIONAL INCOME AND EXPENDITURE—It is necessary to point out that the estimates of national expenditure should be used with some caution, owing to the fact that not all of the items of expenditure can be estimated directly. On the other hand it is well to realise that, whatever inherent error there may exist in the absolute values of individual expenditure items, year-to-year changes are likely to be much more accurate, simply because the method of estimation remains the same.
The method adopted by necessity does not permit a check to be made on the present national income aggregates, in which no allowances have been made for any possible understatement of incomes shown in the taxation returns on which the estimates are based. Nor do these aggregates take into account “negative” incomes or losses of previous years allowed as a set-off against current profits for taxation purposes. Any understatement of the gross product total arising from these omissions will therefore be reflected in a similar understatement of personal consumption which is shown as a residual item in the break up of national expenditure (refer table on page 718). Direct estimates are made of public authority current expenditure on goods and services, gross capital formation in New Zealand by private and public authority sectors, and the balance of overseas payments on current account (sometimes termed net overseas investment or net lending abroad).
After ascertaining personal consumption in the manner outlined above, it becomes possible to make an estimate of private savings. By deducting personal expenditure and direct taxation from aggregate private income, another residual is obtained—viz, private savings (refer table on page 718). Being a residual item it will, of course, contain certain minor errors of estimation inherent in the aggregates from which it is derived. It will be free, however, from the major apparent error which is caused by the understatement of incomes through tax evasion; this is due to the fact that the underestimate is cancelled out by being included both in the minuend and subtrahend, and the residual is consequently not affected.
The various tables are given and their derivation and composition discussed later, but before presenting this detail it is of interest to examine the relationships existing between some of the more important aggregates. The following table gives the principal of these.
| PRINCIPAL AGGREGATES OF INCOME AND EXPENDITURE | |||||||
|---|---|---|---|---|---|---|---|
| Item | 1938-39 | 1960-61 | 1961-62 | 1962-63 | 1963-64 | 1964-65 | 1965-66* |
| *Provisional. | |||||||
| National income $m | 390 | 2,243 | 2,314 | 2,506 | 2,745 | 2,998 | 3,243 |
| Gross national product $m | 464 | 2,622 | 2,721 | 2,924 | 3,200 | 3,489 | 3,759 |
| Personal expenditure on consumer goods and $m services | 322 | 1,721 | 1,798 | 1,887 | 2,028 | 2,167 | 2,391 |
| As percentage of gross national product | 69 | 66 | 66 | 65 | 63 | 62 | 64 |
| Gross capital formation in New Zealand $m | 79 | 600 | 633 | 645 | 716 | 809 | 903 |
| As percentage of gross national product | 17 | 23 | 23 | 22 | 22 | 23 | 24 |
| Public authority current expenditure on goods $m and services | 63 | 346 | 363 | 395 | 416 | 459 | 494 |
| As percentage of gross national product | 14 | 13 | 13 | 14 | 13 | 13 | 13 |
| Private income $m | 400 | 2,429 | 2,502 | 2,695 | 2,939 | 3,190 | 3,400 |
| Private savings $m | 28 | 206 | 164 | 295 | 361 | 383 | 334 |
| As percentage of private income | 7 | 8 | 7 | 11 | 12 | 12 | 10 |
New Zealand's gross national product attained $3,759 million in the year ended March 1966. This constituted a 7.7 percent advance over the preceding year which, in turn, was 9.0 percent higher than the level achieved in 1963-64. Gross national product figures are expressed in current prices and the percentage increases reflect therefore the growth in real production as well as price rises which took place over the year.
National income increased by 8.1 percent in 1965-66; of the principal factor incomes that go to make up national income, the largest item, namely salary and wage payments, rose by 10.7 percent from $1,723 million to $1,908 million. This is approximately comparable to the 10.9 percent increase in 1964-65. On the other hand, other personal income (which is the income of unincorporated businesses, and self-employed persons, plus interest and rent receipts) rose by only $13 million or 1.7 percent. This small increase was due to the fact that net farming incomes are a large component of this item and these rose by only $11 million. Company income before distribution, which is the third major item of national income and of total private income, increased by 6.1 percent from $413 million to $438 million. In the previous year it had increased by 11.9 percent.
Other significant increases; of income were the imputed rental value of owner-occupied houses $16 million ($99 million to $115 million), social security benefits and pensions $9 million ($234 million to $242 million), and public authority trading income by $13 million ($137 million to $150 million).
While the growth of incomes and production in the latest year has been substantial, in both instances it has been exceeded by the rise in expenditures. Gross domestic expenditure is comprised of expenditure on personal consumption, provision of services by public authorities, gross capital formation and the increment to commercial stocks. Whereas the gross national product rose by $270 million or 7.7 percent, gross domestic expenditure at $3,921 million was 11.3 percent greater in 1965-66 than in 1964-65. The increment of 5398 million was made up as follows: personal consumption expenditure $224 million (which is an increase of 10.3 percent), public expenditure $35 million (an increase of 7.6 percent), gross capital formation $94 million (an increase of 11.6 percent), and additions to stocks.
Gross capital formation was 24.0 percent of gross national product, which is the highest percentage ever recorded in New Zealand; it was 23.7 percent in 1954-55. Direct taxation increased from $630 million in 1964-65 to $698 million and it now amounts to 20.3 percent of total private income as compared with 19.7 percent in 1964-65.
Imports of goods and services rose from $798 million to $930. million. Exports of goods and services at $827 million were almost the same as the previous year's total of $829 million. This substantial rise in imports was responsible for a deficit in New Zealand's current account with the rest of the world of $186 million.
The heavy demand originating from personal consumption expenditure, purchases of capital assets by the private sector and a record build-up of stocks (commercial stocks, produce stored overseas and livestock) totalling $133 million meant that a much larger proportion of resources than usual had to be obtained from overseas, particularly so because total domestic savings remained practically stationary. The private sector in fact reduced its savings by $34 million—from $597 to $563 million but this was compensated by an increase in the savings of the public sector by $38 million, leaving only a small ($2 million) increase to the previous year's total savings of $848 million.
Gross National Product and Expenditure—This table gives the composition of the national income by factor shares plus net indirect taxation and depreciation allowances entering into the market prices of all goods and services the production of which can be attributed to New Zealand residents (gross national product); the other side of the product account is a description of final expenditure on gross national product by type of expenditure. As mentioned previously, personal expenditure on consumer goods and services is obtained as a residual item in this table, all other aggregates being obtained by direct estimates.
Private Income and Outlay—This table gives in detail the break-up Of private income and, on the expenditure side, the manner in which these incomes are spent on personal expenditure on consumer goods and services, paid in direct taxation, or saved. An analysis of other personal income is given for each of the years.
The total of personal consumption derived from the preceding table is carried forward to this table and this time private savings is obtained as a residual item. The limitations of these two residual items have already been mentioned.
Revenue Account of Public Authorities—The Government sector is discussed in more detail later in this section, but this table gives, a consolidated statement of central Government and local authority revenue and expenditure, showing as a balance that portion of the revenue which was available for capital investment and other capital transactions.
Combined Capital Account—This account indicates the manner in which resources for capital formation have been made available (a) from private savings, (b) from revenue surpluses of public authorities, and (c) from amounts set aside as depreciation. Gross capital formation represents the construction in New Zealand or purchase from overseas of durable capital assets by the private, central Government, and local authority sectors, plus the net change in stocks by trading concerns.
Rest of World Account—An account of external economic transactions, between New Zealand and other countries; it is, in essence, a balance of payments on current account for the period, presented here in abridged form.
These five tables, then, give a comprehensive picture in broad terms of the changing pattern of New Zealand's economy over a period of 28 years which has included the dislocating effects of a major war. One important point to consider when examining the tables, however, is that all the figures are at prices current during the period and consequently are inflated to a greater or less extent by price movements over the period.
The following are the five tables mentioned.
| GROSS NATIONAL PRODUCT AND EXPENDITURE | ||||||||||||||
|---|---|---|---|---|---|---|---|---|---|---|---|---|---|---|
| March Year | Salary and Wage Payments | Pay and Allowances of Armed Forces | Rental Value, Owner occupied Houses | Other Personal Income | Company Income | Public Authority Trading Income | Lump Sum Payments from United Kingdom Government | Less Public Debt Interest Paid in New Zealand | National Income at Factor Cost | Plus Indirect Taxation | Less Subsidies | National Income at Market Prices | Plus Depreciation Allowances | Gross National Product |
| * Provisional. | ||||||||||||||
| PRODUCT $(million) | ||||||||||||||
| 1938-39 | 223 | 2 | 13 | 109 | 39 | 18 | ... | - 14 | 390 | 41 | -1 | 430 | 34 | 464 |
| 1947-48 | 420 | 13 | 22 | 260 | 106 | 28 | 10 | -31 | 828 | 106 | -27 | 906 | 58 | 964 |
| 1948-49 | 454 | 9 | 23 | 268 | 97 | 26 | ... | -31 | 845 | 92 | -23 | 914 | 64 | 978 |
| 1949-50 | 500 | 9 | 25 | 314 | 116 | 29 | ... | -32 | 961 | 100 | -29 | 1,031 | 70 | 1,101 |
| 1950-51 | 557 | 12 | 27 | 487 | 142 | 34 | ... | -34 | 1,225 | 111 | -19 | 1,318 | 78 | 1,396 |
| 1951-52 | 656 | 17 | 30 | 383 | 160 | 40 | ... | -35 | 1,250 | 142 | -32 | 1,360 | 86 | 1,446 |
| 1952-53 | 696 | 21 | 33 | 408 | 155 | 39 | ... | -34 | 1,317 | 134 | -30 | 1,421 | 96 | 1,517 |
| 1953-54 | 769 | 24 | 37 | 448 | 181 | 50 | ... | -37 | 1,471 | 135 | -31 | 1,575 | 106 | 1,681 |
| 1954-55 | 862 | 24 | 40 | 463 | 195 | 60 | ... | -41 | 1,603 | 161 | -27 | 1,738 | 122 | 1,860 |
| 1955-56 | 937 | 24 | 43 | 473 | 188 | 64 | ... | -42 | 1,688 | 171 | -25 | 1,833 | 132 | 1,965 |
| 1956-57 | 990 | 24 | 46 | 502 | 197 | 61 | ... | -47 | 1,773 | 168 | -27 | 1,915 | 146 | 2,061 |
| 1957-58 | 1,068 | 26 | 48 | 504 | 211 | 65 | ... | -53 | 1,870 | 182 | -27 | 2,026 | 158 | 2,184 |
| 1958-59 | 1,116 | 25 | 50 | 497 | 219 | 74 | ... | -57 | 1,923 | 208 | -27 | 2,104 | 166 | 2,270 |
| 1959-60 | 1,181 | 26 | 51 | 553 | 242 | 82 | ... | -59 | 2,075 | 217 | -26 | 2,266 | 168 | 2,434 |
| 1960—61 | 1,277 | 27 | 52 | 569 | 291 | 91 | ... | -65 | 2,243 | 226 | -31 | 2,438 | 184 | 2,622 |
| 1961-62 | 1,365 | 27 | 61 | 545 | 287 | 100 | ... | -70 | 2,314 | 231 | -28 | 2,517 | 204 | 2,721 |
| 1962-63 | 1,445 | 29 | 81 | 598 | 324 | 106 | ... | -77 | 2,506 | 228 | -29 | 2,704 | 220 | 2,924 |
| 1963-64 | 1,554 | 30 | 88 | 668 | 369 | 124 | ... | -89 | 2,745 | 254 | -30 | 2,968 | 232 | 3,200 |
| 1964-65 | 1,723 | 32 | 99 | 690 | 413 | 137 | ... | -95 | 2,998 | 276 | -35 | 3,239 | 250 | 3,489 |
| 1965-66* | 1,908 | 35 | 115 | 702 | 438 | 150 | ... | -105 | 3,243 | 289 | -39 | 3,493 | 266 | 3,759 |
| NATIONAL INCOME AND EXPENDITURE | |||||||||||
|---|---|---|---|---|---|---|---|---|---|---|---|
| March Year | Personal Expenditure on Consumer Goods and Services | Public Authority Current Expenditure on Goods and Services | Gross Capital Formation in New Zealand | Changes in Stocks | Gross Domestic Expenditure | Exports of Goods and Services | Imports of Goods and services | Expenditure on Gross Domestic Product | Net Factor Payments of Rest of World | Expenditure on Gross National Product | |
| Private | Public Authority | ||||||||||
| *Provisional. | |||||||||||
| EXPENDITURE $(million) | |||||||||||
| 1938-39 | 322 | 63 | 35 | 44 | 10 | 474 | 6 | 480 | -16 | 464 | |
| 1947-48 | 581 | 123 | 89 | 65 | 112 | 970 | 6 | 976 | -12 | 964 | |
| 1948-49 | 697 | 126 | 101 | 78 | -38 | 964 | 26 | 990 | -12 | 978 | |
| 1949-50 | 709 | 140 | 116 | 94 | 28 | 1,087 | 20 | 1,107 | -6 | 1,101 | |
| 1950-51 | 831 | 153 | 152 | 100 | 98 | 1,334 | 428 | -353 | 1,409 | -13 | 1,396 |
| 1951-52 | 958 | 186 | 186 | 106 | 74 | 1,510 | 525 | -575 | 1,460 | -14 | 1,446 |
| 1952-53 | 940 | 212 | 202 | 147 | 26 | 1,527 | 515 | -513 | 1,529 | -12 | 1,517 |
| 1953-54 | 1,050 | 226 | 215 | 158 | -42 | 1,607 | 523 | -438 | 1,692 | -11 | 1,631 |
| 1954-55 | 1,202 | 227 | 277 | 164 | 58 | 1,928 | 507 | -556 | 1,879 | -19 | 1,860 |
| 1955-56 | 1,279 | 249 | 266 | 187 | 38 | 2,019 | 565 | -602 | 1,982 | -17 | 1,965 |
| 1956-57 | 1,329 | 274 | 256 | 203 | 20 | 2,082 | 595 | -596 | 2,081 | -20 | 2,061 |
| 1957-58 | 1,447 | 287 | 287 | 214 | 32 | 2,267 | 593 | -657 | 2,203 | -19 | 2,184 |
| 1958-59 | 1,463 | 302 | 290 | 214 | 31 | 2,300 | 576 | -578 | 2,298 | -28 | 2,270 |
| 1959-60 | 1,477 | 324 | 297 | 225 | 12 | 2,335 | 671 | -549 | 2,457 | -23 | 2,434 |
| 1960-61 | 1,721 | 346 | 366 | 234 | 49 | 2,716 | 630 | -683 | 2,663 | -41 | 2,622 |
| 1961-62 | 1,798 | 363 | 392 | 241 | 23 | 2,817 | 633 | -694 | 2,756 | -35 | 2,721 |
| 1962-63 | 1,887 | 395 | 390 | 255 | 29 | 2,956 | 669 | -651 | 2,974 | -50 | 2,924 |
| 1963-64 | 2,028 | 416 | 430 | 286 | 60 | 3,220 | 788 | -761 | 3,247 | -47 | 3,200 |
| 1964-65 | 2,167 | 459 | 497 | 312 | 88 | 3,523 | 829 | -798 | 3,554 | -65 | 3,489 |
| 1965-66* | 2,391 | 494 | 553 | 350 | 133 | 3,921 | 827 | -930 | 3,818 | -59 | 3,759 |
The graph which follows demonstrates the use to which resources available in New Zealand were put during selected years. The numerical values for this graph are derived from the expenditure part of the preceding account, and total resources available in New Zealand are equivalent to gross national product plus deficit or minus surplus on current balance of payments accounts.
| PRIVATE INCOME AND OUTLAY | ||||||||||||
|---|---|---|---|---|---|---|---|---|---|---|---|---|
| March Year | Salary and Wage Payments | Pay and Allowances of Armed Forces | Social Security Benefits and Pensions | Rental Value of Owner occupied Houses | Other Personal Income | Company Income Before Distribution | Private Income (Before Tax) | |||||
| Farming | Manufacturing and Commerce | Professional and Other Services | Surplus of Primary Produce Stabilisation Accounts | Wool Retention Moneys | Interest, Rent, etc. | |||||||
| *Provisional. | ||||||||||||
| INCOME $(million) | ||||||||||||
| 1938-39 | 223 | 2 | 15 | 13 | 51 | 22 | 10 | -3 | - | 29 | 39 | 400 |
| 1947-48 | 420 | 13 | 74 | 22 | 120 | 60 | 22 | 26 | - | 32 | 106 | 894 |
| 1948-49 | 454 | 9 | 78 | 23 | 128 | 62 | 24 | 22 | - | 32 | 97 | 928 |
| 1949-50 | 500 | 9 | 84 | 25 | 168 | 68 | 28 | 18 | - | 32 | 116 | 1,048 |
| 1950-51 | 557 | 12 | 94 | 27 | 236 | 82 | 32 | 35 | 66 | 36 | 142 | 1,319 |
| 1951-52 | 656 | 17 | 105 | 30 | 209 | 96 | 36 | 11 | -5 | 36 | 160 | 1,350 |
| 1952-53 | 696 | 21 | 107 | 33 | 232 | 104 | 38 | 8 | -12 | 38 | 155 | 1,420 |
| 1953-54 | 769 | 24 | 115 | 37 | 259 | 115 | 42 | 3 | -11 | 40 | 181 | 1,572 |
| 1954-55 | 862 | 24 | 122 | 40 | 263 | 126 | 44 | 1 | -11 | 40 | 195 | 1,706 |
| 1955-56 | 937 | 24 | 128 | 43 | 257 | 132 | 46 | 11 | -13 | 40 | 188 | 1,794 |
| 1956-57 | 990 | 24 | 132 | 46 | 290 | 142 | 50 | -10 | -12 | 42 | 197 | 1,891 |
| 1957-58 | 1,068 | 26 | 139 | 48 | 287 | 156 | 58 | -39 | - | 42 | 211 | 1,997 |
| 1958-59 | 1,116 | 25 | 160 | 50 | 249 | 145 | 58 | 1 | - | 44 | 219 | 2,065 |
| 1959-60 | 1,181 | 26 | 197 | 51 | 279 | 151 | 58 | 19 | - | 46 | 242 | 2,250 |
| 1960-61 | 1,277 | 27 | 212 | 52 | 289 | 177 | 66 | -11 | - | 48 | 291 | 2,429 |
| 1961-62 | 1,365 | 27 | 218 | 61 | 251 | 186 | 68 | -10 | - | 50 | 287 | 2,502 |
| 1962-63 | 1,445 | 29 | 219 | 81 | 272 | 194 | 74 | 6 | - | 52 | 324 | 2,695 |
| 1963-64 | 1,554 | 30 | 229 | 88 | 315 | 204 | 76 | 9 | 8 | 56 | 369 | 2,939 |
| 1964-65 | 1,723 | 32 | 234 | 99 | 320 | 216 | 84 | 10 | 2 | 58 | 413 | 3,190 |
| 1965-66* | 1,908 | 35 | 242 | 115 | 331 | 228 | 88 | 2 | -5 | 58 | 438 | 3,440 |
| March Year | Personal Expenditure on Consumer Goods and Services | Net Transfers to Rest of World | Direct Taxation | Private Savings | Private Outlay | |
|---|---|---|---|---|---|---|
| Undistributed Profits of Companies | Other Private Savings | |||||
| * Provisional. | ||||||
| OUTLAY $(million) | ||||||
| 1938-39 | 322 | 2 | 48 | 28 | 400 | |
| 1947-48 | 581 | 2 | 154 | 42 | 115 | 894 |
| 1948-49 | 697 | 2 | 188 | 17 | 24 | 928 |
| 1949-50 | 709 | 4 | 192 | 36 | 107 | 1,048 |
| 1951-51 | 831 | 4 | 226 | 57 | 201 | 1,319 |
| 1952-52 | 958 | -4 | 284 | 49 | 63 | 1,350 |
| 1952-53 | 940 | -3 | 292 | 39 | 152 | 1,420 |
| 1953-54 | 1,050 | 1 | 308 | 58 | 155 | 1,572 |
| 1954-55 | 1,202 | 2 | 336 | 57 | 109 | 1,706 |
| 1955-56 | 1,279 | - | 348 | 42 | 125 | 1,794 |
| 1956-57 | 1,329 | - | 370 | 46 | 146 | 1,891 |
| 1957-58 | 1,447 | -1 | 345 | 45 | 161 | 1,997 |
| 1958-59 | 1,463 | 3 | 442 | 64 | 93 | 2,065 |
| 1959-60 | 1,477 | 6 | 420 | 77 | 270 | 2,250 |
| 1960-61 | 1,721 | 8 | 494 | 85 | 121 | 2,429 |
| 1961-62 | 1,798 | 8 | 532 | 60 | 104 | 2,502 |
| 1962-63 | 1,887 | 8 | 505 | 87 | 208 | 2,695 |
| 1963-64 | 2,028 | 7 | 543 | 108 | 253 | 2,939 |
| 1964-65 | 2,167 | 10 | 630 | 107 | 276 | 3,190 |
| 1965-66* | 2,391 | 17 | 698 | 118 | 216 | 3,440 |
The following diagram presents the distribution of private outlay (shown in the second part of the preceding table) in graphical form.
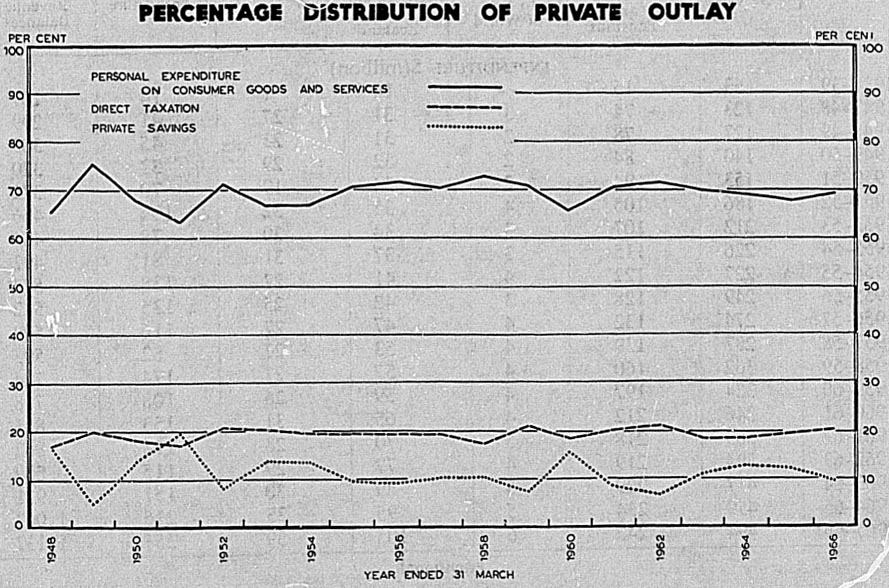
| REVENUE ACCOUNT OF PUBLIC AUTHORITIES (CENTRAL GOVERNMENT AND LOCAL AUTHORITIES) | ||||||
|---|---|---|---|---|---|---|
| March Year | Taxation | Trading Income | Less Direct Taxes Paid by Public Authority Trading Undertakings | Lump Sum Payments From United Kingdom Government | Total Revenue | |
| Direct | Indirect | |||||
| * Provisional. | ||||||
| REVENUE $(million) | ||||||
| 1938-39 | 48 | 41 | 18 | - | - | 107 |
| 1947-48 | 158 | 106 | 28 | -3 | 10 | 299 |
| 1948-49 | 190 | 92 | 26 | -3 | - | 305 |
| 1949-50 | 194 | 100 | 29 | -3 | - | 320 |
| 1950-51 | 229 | 111 | 34 | -3 | - | 372 |
| 1951-52 | 288 | 142 | 40 | -4 | - | 466 |
| 1952-53 | 296 | 134 | 39 | -5 | - | 464 |
| 1953-54 | 311 | 135 | 50 | -4 | - | 492 |
| 1954-55 | 342 | 161 | 60 | -5 | - | 558 |
| 1955-56 | 354 | 171 | 64 | -6 | - | 582 |
| 1956-57 | 376 | 168 | 61 | -6 | - | 599 |
| 1957-58 | 350 | 182 | 65 | -5 | - | 593 |
| 1958-59 | 447 | 208 | 74 | -5 | - | 724 |
| 1959-60 | 425 | 217 | 82 | -6 | - | 718 |
| 1960-61 | 499 | 226 | 91 | -6 | - | 811 |
| 1961-62 | 538 | 231 | 100 | -7 | - | 862 |
| 1962-63 | 512 | 228 | 106 | -7 | - | 839 |
| 1963-64 | 551 | 254 | 124 | -8 | - | 921 |
| 1964-65 | 640 | 276 | 137 | -9 | - | 1,043 |
| 1965-66* | 708 | 289 | 150 | -11 | - | 1,137 |
| March Year | Current Expenditure on Goods and Services | Transfer Income | Subsidies | Balance of Revenue Over Expenditure | Total Expenditure Plus or Minus Revenue Balances | ||
|---|---|---|---|---|---|---|---|
| Social Security Benefits and Pensions | Net Transfers to Rest of World | Interest on Public Debt Paid in New Zealand | |||||
| *Provisional. | |||||||
| EXPENDITURE $(million) | |||||||
| 1938-39 | 63 | 15 | - | 14 | 1 | 14 | 107 |
| 1947-48 | 123 | 74 | 3 | 31 | 27 | 41 | 299 |
| 1948-49 | 127 | 78 | 2 | 31 | 23 | 45 | 305 |
| 1949-50 | 140 | 84 | 2 | 32 | 29 | 33 | 320 |
| 1950-51 | 153 | 94 | 2 | 34 | 19 | 70 | 372 |
| 1951-52 | 186 | 105 | 4 | 35 | 32 | 104 | 466 |
| 1952-53 | 212 | 107 | 3 | 34 | 30 | 78 | 464 |
| 1953-54 | 226 | 115 | 3 | 37 | 31 | 81 | 492 |
| 1954-55 | 227 | 122 | 4 | 41 | 27 | 138 | 558 |
| 1955-56 | 249 | 128 | 3 | 42 | 25 | 135 | 582 |
| 1956-57 | 274 | 132 | 4 | 47 | 27 | 116 | 599 |
| 1957-58 | 287 | 139 | 4 | 53 | 27 | 82 | 593 |
| 1958-59 | 302 | 160 | 4 | 57 | 27 | 174 | 724 |
| 1959-60 | 324 | 197 | 4 | 59 | 26 | 108 | 718 |
| 1960-61 | 346 | 212 | 4 | 65 | 31 | 153 | 811 |
| 1961-62 | 363 | 218 | 5 | 70 | 28 | 178 | 862 |
| 1962-63 | 394 | 219 | 4 | 77 | 29 | 115 | 839 |
| 1963-64 | 417 | 229 | 5 | 89 | 30 | 151 | 921 |
| 1964-65 | 459 | 234 | 5 | 95 | 35 | 215 | 1,043 |
| 1965-66* | 494 | 242 | 6 | 105 | 39 | 251 | 1,137 |
| COMBINED CAPITAL ACCOUNT | ||||||||||||
|---|---|---|---|---|---|---|---|---|---|---|---|---|
| March Year | Private Savings | Revenue Balances of Public Authorities | Gross Capital Formation in New Zealand | Total Savings | Depreciation Allowances | Changes in Stocks | Net Investment Overseas | Total Investments | ||||
| Private | Central Government Trading Undertakings | Local Authorities Trading Undertakings | Private | Central Government | Local Authorities | |||||||
| *Provisional. | ||||||||||||
| SAVINGS $(million) | INVESTMENTS $(million) | |||||||||||
| 1938-39 | 28 | 34 | 77 | 35 | 32 | 12 | 10 | - 12 | 77 | |||
| 1947-48 | 157 | 41 | 58 | 254 | 89 | 51 | 14 | 112 | - 12 | 254 | ||
| 1948-49 | 41 | 45 | 64 | 151 | 101 | 62 | 16 | -38 | 10 | 151 | ||
| 1949-50 | 143 | 33 | 70 | 246 | 116 | 76 | 18 | 28 | 8 | 246 | ||
| 1950-51 | 258 | 70 | 78 | 405 | 152 | 80 | 20 | 98 | 55 | 405 | ||
| 1951-52 | 112 | 104 | 86 | 303 | 186 | 81 | 25 | 74 | - 63 | 303 | ||
| 1952-53 | 191 | 78 | 96 | 365 | 202 | 109 | 38 | 26 | - 10 | 365 | ||
| 1953-54 | 213 | 80 | 92 | 11 | 3 | 400 | 215 | 114 | 44 | -42 | 69 | 400 |
| 1954-55 | 166 | 138 | 106 | 14 | 3 | 425 | 277 | 115 | 49 | 58 | - 74 | 425 |
| 1955-56 | 167 | 135 | 114 | 15 | 3 | 433 | 266 | 129 | 58 | 38 | - 58 | 433 |
| 1956-57 | 192 | 115 | 127 | 16 | 4 | 455 | 256 | 138 | 65 | 20 | - 24 | 455 |
| 1957-58 | 206 | 82 | 135 | 18 | 4 | 446 | 287 | 140 | 74 | 32 | - 87 | 446 |
| 1958-59 | 157 | 175 | 141 | 20 | 5 | 497 | 290 | 137 | 77 | 31 | - 38 | 497 |
| 1959-60 | 347 | 108 | 141 | 22 | 5 | 623 | 297 | 141 | 84 | 12 | 89 | 623 |
| 1960-61 | 206 | 153 | 155 | 24 | 6 | 544 | 366 | 149 | 85 | 49 | -105 | 544 |
| 1961-62 | 164 | 178 | 174 | 24 | 6 | 548 | 392 | 148 | 93 | 23 | -108 | 548 |
| 1962-63 | 295 | 115 | 186 | 26 | 7 | 629 | 390 | 154 | 101 | 29 | - 45 | 629 |
| 1963-64 | 361 | 151 | 197 | 27 | 8 | 743 | 430 | 180 | 106 | 60 | - 33 | 743 |
| 1964-65 | 383 | 215 | 214 | 27 | 9 | 848 | 497 | 196 | 116 | 88 | - 49 | 848 |
| 1965-66* | 334 | 251 | 229 | 28 | 10 | 850 | 553 | 218 | 132 | 133 | -186 | 850 |
| REST OF WORLD ACCOUNT | ||||||
|---|---|---|---|---|---|---|
| March Year | Exports of Goods and Services | Imports of Goods and Services | Net Factor Payments | Net Transfers | Surplus on Current Account | |
| Private | Public Authorities | |||||
| *Provisional. | ||||||
| $(million) | ||||||
| 1938-39 | 6 | -16 | -2 | - | -12 | |
| 1947-48 | 6 | -13 | -2 | -4 | -12 | |
| 1948-49 | 26 | -12 | -2 | -2 | 10 | |
| 1949-50 | 20 | -6 | -4 | -2 | 8 | |
| 1950-51 | 428 | -353 | -13 | -4 | -2 | 55 |
| 1951-52 | 525 | -575 | -14 | +4 | -4 | -63 |
| 1952-53 | 515 | -513 | -12 | +3 | -3 | -10 |
| 1953-54 | 523 | -438 | -11 | -1 | -3 | 69 |
| 1954-55 | 507 | -556 | -19 | -2 | -4 | -74 |
| 1955-56 | 565 | -602 | -17 | - | -3 | -58 |
| 1956-57 | 595 | -596 | -20 | - | -4 | -24 |
| 1957-58 | 593 | -657 | -19 | +1 | -4 | -87 |
| 1958-59 | 576 | -578 | -28 | -3 | -4 | -38 |
| 1959-60 | 671 | -549 | -23 | -6 | -4 | 89 |
| 1960-61 | 630 | -683 | -41 | -8 | -4 | -105 |
| 1911-62 | 633 | -694 | -35 | -8 | -5 | -108 |
| 1962-63 | 669 | -651 | -50 | -8 | -4 | -45 |
| 1963-64 | 788 | -761 | -47 | -7 | -5 | -33 |
| 1964-65 | 829 | -798 | -65 | -10 | -5 | -49 |
| 1965-66* | -27 | -930 | -59 | -17 | -6 | -186 |
THE DISTRIBUTION OF PRIVATE INCOME—The following table gives an analysis of private income, direct taxes paid on that income, and private disposable income over the years. In the two following tables the items of private income and private disposable income are shown as percentages of the whole, and as index numbers on base 1938-39 (= 100).
| PRIVATE INCOME AND INCIDENCE OF DIRECT TAXATION | |||||||
|---|---|---|---|---|---|---|---|
| March Year | Salary and Wage Payments | Pay and Allowances of Armed Forces | Social Security Benefits and Pensions | Rental Value, Owner-occupied Houses | Other Personal Income† (Excluding Company Dividends) | Company Income (Before Distribution) | Private Income |
| * Provisional | |||||||
| $(million) | |||||||
| 1938-39 | 222.5 | 1.8 | 14.8 | 12.8 | 109.0 | 39.2 | 400.1 |
| 1939-40 | 221.5 | 5.8 | 22.3 | 13.4 | 118.8 | 49.5 | 431.3 |
| 1940-41 | 235.6 | 31.2 | 24.4 | 14.8 | 116.5 | 47.2 | 469.7 |
| 1941-42 | 241.5 | 51.0 | 25.2 | 15.4 | 124.4 | 55.2 | 512.7 |
| 1942-43 | 253.7 | 92.0 | 27.8 | 16.2 | 133.9 | 65.7 | 589.3 |
| 1943-44 | 281.1 | 116.6 | 30.9 | 17.2 | 144.2 | 72.8 | 662.8 |
| 1944-45 | 294.3 | 96.9 | 34.3 | 17.8 | 159.4 | 75.8 | 678.5 |
| 1945-46 | 323.9 | 78.7 | 41.1 | 18.8 | 174.6 | 83.4 | 720.5 |
| 1946-47 | 373.1 | 16.4 | 68.6 | 20.2 | 221.0 | 95.9 | 795.2 |
| 1947-48 | 420.1 | 12.8 | 74.1 | 21.8 | 259.8 | 105.5 | 894.1 |
| 1948-49 | 454.3 | 9.0 | 77.6 | 23,2 | 267.6 | 96.6 | 928.3 |
| 1949-50 | 500.1 | 9.2 | 83.9 | 25.4 | 313.8 | 115.7 | 1,048.1 |
| 1950-51 | 557.0 | 11.8 | 93.6 | 27.2 | 487.0 | 142.1 | 1,318.7 |
| 1951-52 | 655.6 | 16.9 | 105.4 | 29.6 | 382.5 | 160.2 | 1,350.2 |
| 1952-53 | 696.0 | 21.1 | 106.8 | 32.6 | 408.2 | 155.3 | 1,420.0 |
| 1963-54 | 768.8 | 23.9 | 114.7 | 36.6 | 447.6 | 180.8 | 1,572.4 |
| 1954-55 | 862.2 | 24.2 | 122.1 | 39.6 | 463.0 | 194.7 | 1,705.8 |
| 1955-56 | 936.0 | 24.1 | 128.2 | 43.2 | 472.9 | 188.4 | 1,793.7 |
| 1956-57 | 990.2 | 24.1 | 131.9 | 46.4 | 502.0 | 196.7 | 1,891.3 |
| 1957-58 | 1,068.4 | 25.8 | 139.4 | 48.2 | 503.9 | 211,3 | 1,997.0 |
| 1958-59 | 1,115.8 | 24.5 | 159.6 | 50.0 | 496.5 | 219.0 | 2,065.4 |
| 1959-60 | 1,181.1 | 25.9 | 197.4 | 51.4 | 552.6 | 241.9 | 2,250.3 |
| 1960-61 | 1,277.4 | 26.9 | 212.4 | 51.8 | 569.1 | 291.0 | 2,428.6 |
| 1961-62 | 1,364.9 | 27.3 | 217.6 | 60.8 | 544.5 | 287,1 | 2,502.2 |
| 1962-63 | 1,445.2 | 28.8 | 218.6 | 80.8 | 598.0 | 324.0 | 2,695.4 |
| 1963-64 | 1,553.6 | 30.0 | 229.4 | 88.4 | 668.3 | 369.1 | 2,938.8 |
| 1964-65 | 1,723.0 | 32.0 | 233.6 | 99.4 | 689.5 | 412.6 | 3,190.1 |
| 1965-66* | 1,908.4 | 34.5 | 242.2 | 115.0 | 702.1 | 437.9 | 3,440.1 |
| DIRECT TAXES† $(million) | ||||||
|---|---|---|---|---|---|---|
| March Year | Salary and Wage Payments | Pay and Allowances of Armed Forces | Social Security Benefits and Pensions | Other Personal Income (Including Rental Value of Owner-occupied Houses) | Company Income (Before Distribution) | Total |
* Provisional. †Excludes direct taxes on Government trading profits. | ||||||
| 1938-39 | 9.8 | - | ... | 23.7 | 14.1 | 47.6 |
| 1939-40 | 16.0 | - | ... | 26.6 | 18.4 | 61.0 |
| 1940-41 | 25.0 | 1.6 | ... | 37.6 | 27.0 | 91.2 |
| 1941-42 | 31.0 | 2.2 | ... | 41.4 | 28.0 | 102.6 |
| 1942-43 | 39.0 | 6.4 | ... | 48.1 | 39.3 | 132.8 |
| 1943-44 | 46.8 | 7.0 | ... | 51.7 | 45.5 | 151.0 |
| 1944-45 | 48.6 | 7.6 | ... | 52.9 | 53.3 | 162.4 |
| 1945-46 | 53.2 | 6.6 | ... | 59.2 | 50.8 | 169.8 |
| 1946-47 | 47.6 | 2.4 | ... | 58.4 | 48.0 | 156.4 |
| 1947-48 | 47.2 | 0.8 | ... | 61.8 | 45.0 | 154.8 |
| 1948-49 | 49.4 | 1.0 | ... | 75.5 | 61.1 | 187.0 |
| 1949-50 | 53.0 | 1.0 | ... | 79.0 | 58.2 | 191.2 |
| 1950-51 | 65.0 | 1.0 | ... | 96.0 | 64.2 | 226.2 |
| 1951-52 | 72.0 | 1.2 | ... | 131.9 | 78.9 | 284.0 |
| 1952-53 | 87.8 | 1.6 | ... | 120.2 | 81.8 | 291.4 |
| 1953-54 | 92.8 | 1.6 | ... | 131.1 | 81.7 | 307.2 |
| 1954-55 | 99.8 | 2.0 | ... | 142.9 | 91.9 | 336.6 |
| 1955-56 | 104.4 | 2.0 | ... | 141.6 | 99.8 | 347.8 |
| 1956-57 | 122.9 | 2.0 | ... | 143.8 | 101.0 | 369.7 |
| 1957-58 | 93.4 | 2.2 | ... | 147.2 | 102.3 | 345.1 |
| 1958-59 | 133.7 | 2.6 | ... | 200.3 | 105.7 | 442.3 |
| 1959-60 | 146.0 | 3.0 | ... | 164.5 | 106.3 | 419.8 |
| 1960-61 | 147.7 | 3.2 | ... | 218.5 | 124.3 | 493.7 |
| 1961-62 | 167.6 | 3.0 | ... | 213.5 | 147.4 | 531.5 |
| 1962-63 | 173.3 | 3.3 | ... | 186.7 | 141.5 | 504.8 |
| 1963-64 | 176.7 | 3.2 | ... | 202.1 | 161.1 | 543.1 |
| 1964-65 | 206.1 | 3.5 | ... | 226.6 | 194.2 | 630.4 |
| 1965-66* | 237.0 | 4.0 | ... | 248.0 | 208.7 | 697.7 |
| March Year | Salary and Wage Payments | Pay and Allowances of Armed Forces | Social Security Benefits and Pensions | Other Personal Income (Including Rental Value of Owner-occupied Houses) | Company Income (Before Distribution) | Total |
|---|---|---|---|---|---|---|
| * Provision | ||||||
| DISPOSABLE INCOME $(million) | ||||||
| 1938-39 | 212.7 | 1.8 | 14.8 | 98.1 | 25.1 | 352.5 |
| 1939-40 | 205.5 | 5.8 | 22.3 | 105.6 | 31.1 | 370.3 |
| 1940-41 | 210.6 | 29.6 | 24.4 | 93.7 | 20.2 | 378.5 |
| 1941-42 | 210.5 | 48.8 | 25.2 | 98.4 | 27.2 | 410.1 |
| 1942-43 | 214.7 | 85.6 | 27.8 | 102.0 | 26.4 | 456.5 |
| 1943-44 | 234.3 | 109.6 | 30.9 | 109.7 | 27.3 | 511.8 |
| 1944-45 | 245.7 | 89.3 | 34.3 | 124.3 | 22.5 | 516.1 |
| 1945-46 | 270.7 | 72.1 | 41.1 | 134.2 | 32.6 | 550.7 |
| 1946-47 | 325.5 | 14.0 | 68.6 | 182.8 | 47.9 | 638.8 |
| 1947-48 | 372.9 | 12.0 | 74.1 | 219.8 | 60.5 | 739.3 |
| 1948-49 | 404.9 | 8.0 | 77.6 | 215.3 | 35.5 | 741.3 |
| 1949-50 | 447.1 | 8.2 | 83.9 | 260.2 | 57.5 | 856.9 |
| 1950-51 | 492.0 | 10.8 | 93.6 | 418.2 | 77.9 | 1,092.5 |
| 1951-52 | 583.6 | 15.7 | 105.4 | 280.2 | 81.3 | 1,066.2 |
| 1952-53 | 608.2 | 19.5 | 106.8 | 320.6 | 73.5 | 1,128.6 |
| 1953-54 | 676.0 | 22.3 | 114.7 | 353.1 | 99.1 | 1,265.2 |
| 1954-55 | 762.4 | 22.2 | 122.1 | 359.7 | 102.8 | 1,369.2 |
| 1955-56 | 832.5 | 22.1 | 128.2 | 374.5 | 88.6 | 1,445.9 |
| 1956-57 | 867.3 | 22.1 | 131.9 | 404.6 | 95.7 | 1,521.6 |
| 1957-58 | 975.0 | 23.6 | 139.4 | 404.9 | 109.0 | 1,651.9 |
| 1958-59 | 982.1 | 21.9 | 159.6 | 346.2 | 113.3 | 1,623.1 |
| 1959-60 | 1,035.1 | 22.9 | 197.4 | 439.5 | 135.6 | 1,830.5 |
| 1960-61 | 1,129.7 | 23.7 | 212.4 | 402.4 | 166.7 | 1,934.9 |
| 1961-62 | 1,197.3 | 24.3 | 217.6 | 391.8 | 139.7 | 1,970.7 |
| 1962-63 | 1,271.9 | 25.5 | 218.6 | 492.1 | 182.5 | 2,190.6 |
| 1963-64 | 1,376.9 | 26.8 | 229.4 | 554.6 | 208.0 | 2,395.7 |
| 1964-65 | 1,516.9 | 28.5 | 233.6 | 562.3 | 218.4 | 2,559.7 |
| 1965-66* | 1,671.4 | 30.5 | 242.2 | 569.1 | 229.2 | 2,742.4 |
| PRIVATE INCOME | |||||||
|---|---|---|---|---|---|---|---|
| March Year | Salary and Wage Payments | Pay and Allowances of Armed Forces | Social Security Benefits and Pensions | Rental Value, Owner-occupied Houses | Other Personal Income† (Excluding Company Dividends) | Company Income (Before Distribution) | Private Income |
* Provisional. †Includes changes in primary-produce stabilisation accounts and wool retention moneys. | |||||||
| AS PERCENTAGE OF PRIVATE INCOME | |||||||
| 1938-39 | 55.6 | 0.4 | 3.7 | 3.2 | 27.2 | 9.8 | 100.0 |
| 1939-40 | 51.4 | 1.3 | 5.2 | 3.1 | 27.5 | 11.5 | 100.0 |
| 1940-41 | 50.2 | 6.6 | 5.2 | 3.2 | 24.8 | 10.0 | 100.0 |
| 1941-42 | 47.1 | 9.9 | 4.9 | 3.0 | 24.3 | 10.8 | 100.0 |
| 1942-43 | 43.1 | 15.6 | 4.7 | 2.7 | 22.7 | 11.1 | 100.0 |
| 1943-44 | 42.4 | 17.6 | 4.6 | 2.6 | 21.8 | 11.0 | 100.0 |
| 1944-45 | 43.4 | 14.3 | 5.0 | 2.6 | 23.5 | 11.2 | 100.0 |
| 1945-56 | 45.0 | 10.9 | 5.7 | 2.6 | 24.2 | 11.6 | 100.0 |
| 1946-47 | 46.9 | 2.1 | 8.6 | 2.5 | 27.8 | 12.1 | 100.0 |
| 1947-48 | 47.0 | 1.4 | 8.3 | 2.4 | 29.1 | 11.8 | 100.0 |
| 1948-49 | 48.9 | 1.0 | 8.4 | 2.5 | 28.8 | 10.4 | 100.0 |
| 1949-50 | 47.7 | 0.9 | 8.0 | 2.4 | 29.9 | 11.0 | 100.0 |
| 1950-51 | 42.2 | 0.9 | 7.1 | 2.1 | 36.9 | 10.8 | 100.0 |
| 1951-52 | 48.6 | 1.3 | 7.8 | 2.2 | 28.3 | 11.9 | 100.0 |
| 1952-53 | 49.0 | 1.5 | 7.5 | 2.3 | 28.7 | 10.9 | 100.0 |
| 1953-54 | 48.9 | 1.5 | 7.3 | 2.3 | 28.5 | 11.5 | 100.0 |
| 1954-55 | 50.5 | 1.4 | 7.2 | 2.3 | 27.1 | 11.4 | 100.0 |
| 1955-56 | 52.2 | 1.3 | 7.1 | 2.4 | 26.4 | 10.5 | 100.0 |
| 1956-57 | 52.4 | 1.3 | 7.0 | 2.5 | 26.5 | 10.4 | 100.0 |
| 1957-58 | 53.5 | 1.3 | 7.0 | 2.4 | 25.2 | 10.6 | 100.0 |
| 1958-59 | 54.0 | 1.2 | 7.7 | 2.4 | 24.0 | 10.6 | 100.0 |
| 1959-60 | 52.5 | 1.2 | 8.8 | 2.3 | 24.6 | 10.7 | 100.0 |
| 1960-61 | 52.6 | 1.1 | 8.7 | 2.1 | 23.4 | 12.0 | 100.0 |
| 1961-62 | 54.5 | 1.1 | 8.7 | 2.4 | 21.8 | 11.5 | 100.0 |
| 1962-63 | 53.6 | 1.1 | 8.1 | 3.0 | 22.2 | 12.0 | 100.0 |
| 1963-64 | 52.9 | 1.0 | 7.8 | 3.0 | 22.7 | 12.6 | 100.0 |
| 1964-65 | 54.0 | 1.0 | 7.3 | 3.1 | 21.6 | 12.9 | 100.0 |
| 1965-66* | 55.5 | 1.0 | 7.0 | 3.3 | 20.4 | 12.7 | 100.0 |
| AS INDEX NUMBERS (1938-39 = 100) | |||||||
| 1938-39 | 100 | ... | 100 | 100 | 100 | 100 | 100 |
| 1939-40 | 100 | ... | 151 | 105 | 109 | 126 | 108 |
| 1940-41 | 106 | ... | 165 | 116 | 107 | 120 | 117 |
| 1941-42 | 109 | ... | 170 | 120 | 114 | 141 | 128 |
| 1942-43 | 114 | ... | 188 | 127 | 123 | 168 | 147 |
| 1943-44 | 126 | ... | 209 | 134 | 132 | 186 | 166 |
| 1944-45 | 132 | ... | 232 | 139 | 146 | 193 | 170 |
| 1945-46 | 146 | ... | 278 | 147 | 160 | 213 | 180 |
| 1946-47 | 168 | ... | 464 | 158 | 203 | 245 | 199 |
| 1947-48 | 189 | ... | 501 | 170 | 238 | 269 | 223 |
| 1948-49 | 204 | ... | 524 | 181 | 246 | 246 | 232 |
| 1949-50 | 225 | ... | 567 | 198 | 288 | 295 | 262 |
| 1950-51 | 250 | ... | 632 | 213 | 447 | 362 | 330 |
| 1951-52 | 295 | ... | 712 | 231 | 351 | 409 | 337 |
| 1952-53 | 313 | ... | 722 | 255 | 374 | 396 | 355 |
| 1953-54 | 346 | ... | 775 | 286 | 411 | 461 | 393 |
| 1954-55 | 388 | ... | 825 | 309 | 425 | 497 | 426 |
| 1955-56 | 421 | ... | 866 | 338 | 434 | 481 | 448 |
| 1956-57 | 445 | ... | 891 | 363 | 461 | 502 | 473 |
| 1957-58 | 480 | ... | 942 | 377 | 462 | 539 | 499 |
| 1958-59 | 501 | ... | 1,078 | 391 | 456 | 559 | 516 |
| 1959-60 | 531 | ... | 1,334 | 402 | 507 | 617 | 562 |
| 1960-61 | 574 | ... | 1,435 | 405 | 522 | 742 | 607 |
| 1961-62 | 613 | ... | 1,470 | 475 | 500 | 732 | 625 |
| 1962-63 | 650 | ... | 1,477 | 631 | 549 | 827 | 674 |
| 1963-64 | 698 | ... | 1,550 | 691 | 613 | 942 | 735 |
| 1964-65 | 774 | ... | 1,578 | 777 | 633 | 1,053 | 797 |
| 1965-66* | 858 | ... | 1,636 | 898 | 644 | 1,117 | 860 |
| PRIVATE DISPOSABLE INCOME | |||||||
|---|---|---|---|---|---|---|---|
| March Year | Salary and Wage Payments | Pay and Allowances of Armed Forces | Social Security Benefits and Pensions | Other Personal Income (Including Rental Value of Owner-occupied Houses) | Company Income (Before Distribution) | Private Disposable Income | |
| *Provisional. | |||||||
| AS PERCENTAGE OF PRIVATE DISPOSABLE INCOME | |||||||
| 1938-39 | 60.3 | 0.5 | 4.2 | 27.8 | 7.1 | 100.0 | |
| 1939-40 | 55.5 | 1.6 | 6.0 | 28.5 | 8.4 | 100.0 | |
| 1940-41 | 55.6 | 7.8 | 6.4 | 24.8 | 5.3 | 100.0 | |
| 1941-42 | 51.3 | 11.9 | 6.1 | 24.0 | 6.6 | 100.0 | |
| 1942-43 | 47.0 | 18.8 | 6.1 | 22.3 | 5.8 | 100.0 | |
| 1943-44 | 45.8 | 21.4 | 6.0 | 21.4 | 5.3 | 100.0 | |
| 1944-45 | 47.6 | 17.3 | 6.6 | 24.1 | 4.4 | 100.0 | |
| 1945-46 | 49.2 | 13.1 | 7.5 | 24.4 | 5.9 | 100.0 | |
| 1946-47 | 51.0 | 2.2 | 10.7 | 28.6 | 7.5 | 100.0 | |
| 1947-48 | 50.4 | 1.6 | 10.0 | 29.7 | 8.2 | 100.0 | |
| 1948-49 | 54.6 | 1.1 | 10.5 | 29.0 | 4.8 | 100.0 | |
| 1949-50 | 52.2 | 1.0 | 9.8 | 30.4 | 6.7 | 100.0 | |
| 1950-51 | 45.0 | 1.0 | 8.6 | 38.3 | 7.1 | 100.0 | |
| 1951-52 | 54.7 | 1.5 | 9.9 | 26.3 | 7.6 | 100.0 | |
| 1952-53 | 53.9 | 1.7 | 9.5 | 28.4 | 6.5 | 100.0 | |
| 1953-54 | 53.4 | 1.8 | 9.1 | 27.9 | 7.8 | 100.0 | |
| 1954-55 | 55.7 | 1.6 | 8.9 | 26.3 | 7.5 | 100.0 | |
| 1955-56 | 57.6 | 1.5 | 8.9 | 25.9 | 6.1 | 100.0 | |
| 1956-57 | 57.0 | 1.5 | 8.7 | 26.6 | 6.3 | 100.0 | |
| 1957-58 | 59.0 | 1.4 | 8.4 | 24.5 | 6.6 | 100.0 | |
| 1958-59 | 60.5 | 1.3 | 9.8 | 21.3 | 7.0 | 100.0 | |
| 1959-60 | 56.5 | 1.3 | 10.8 | 24.0 | 7.4 | 100.0 | |
| 1960-61 | 58.4 | 1.2 | 11.0 | 20.8 | 8.6 | 100.0 | |
| 1961-62 | 60.8 | 1.2 | 11.0 | 19.9 | 7.1 | 100.0 | |
| 1962-63 | 58.1 | 1.2 | 10.0 | 22.5 | 8.3 | 100.0 | |
| 1963-64 | 57.5 | 1.1 | 9.6 | 23.1 | 8.7 | 100.0 | |
| 1964-65 | 59.3 | 1.1 | 9.1 | 22.0 | 8.5 | 100.0 | |
| 1965-66* | 60.9 | 1.1 | 8.8 | 20.8 | 8.4 | 100.0 | |
| AS INDEX NUMBERS (1938-39 = 100) | |||||||
| 1938-39 | 100 | ... | 100 | 100 | 100 | 100 | |
| 1939-40 | 97 | ... | 151 | 108 | 124 | 105 | |
| 1940-41 | 99 | ... | 165 | 96 | 80 | 107 | |
| 1941-42 | 99 | ... | 170 | 100 | 108 | 116 | |
| 1942-43 | 101 | ... | 188 | 104 | 105 | 130 | |
| 1943-44 | 110 | ... | 209 | 112 | 109 | 145 | |
| 1944-45 | 116 | ... | 232 | 127 | 90 | 146 | |
| 1945-46 | 127 | ... | 278 | 137 | 130 | 156 | |
| 1946-47 | 153 | ... | 464 | 186 | 191 | 181 | |
| 1947-48 | 175 | ... | 501 | 224 | 241 | 210 | |
| 1948-49 | 190 | ... | 524 | 219 | 141 | 210 | |
| 1949-50 | 210 | ... | 567 | 265 | 229 | 243 | |
| 1950-51 | 231 | ... | 632 | 426 | 310 | 310 | |
| 1951-52 | 274 | ... | 712 | 286 | 324 | 302 | |
| 1952-53 | 286 | ... | 722 | 327 | 293 | 320 | |
| 1953-54 | 318 | ... | 775 | 360 | 395 | 359 | |
| 1954-55 | 358 | ... | 825 | 367 | 410 | 388 | |
| 1955-56 | 391 | ... | 866 | 332 | 353 | 410 | |
| 1956-57 | 408 | ... | 891 | 412 | 381 | 432 | |
| 1957-58 | 458 | ... | 942 | 413 | 434 | 469 | |
| 1958-59 | 462 | ... | 1,078 | 353 | 451 | 460 | |
| 1959-60 | 487 | ... | 1,334 | 448 | 540 | 519 | |
| 1960-61 | 531 | ... | 1,435 | 410 | 664 | 549 | |
| 1961-62 | 563 | ... | 1,470 | 399 | 557 | 559 | |
| 1962-63 | 598 | ... | 1,477 | 502 | 727 | 621 | |
| 1963-64 | 647 | ... | 1,550 | 565 | 829 | 680 | |
| 1964-65 | 713 | ... | 1,578 | 573 | 870 | 726 | |
| 1965-66 | 786 | ... | 1,636 | 580 | 913 | 778 | |
THE PUBLIC AUTHORITY SECTOR—The Revenue account of public authorities shown on page 719 is a consolidation and simplification of a separate and more detailed Central Government Revenue Account on pages 728 and 729 and the local authorities Revenue Account on page 730. The Consolidated Account eliminates all transfers between the two levels of Government and aggregates the respective totals of economically significant flows.
The publication The Accounts of the Government Sector 1959-60 to 1965-66 contains an integrated Government account which will ultimately replace the account presented herein. There are certain differences between the two which are due to differences in coverage, concepts employed in analysis, and improved methods. The new account is a preferable description of Government transactions, being more complete and exact. In the meantime, it cannot be used here for several important reasons. The new account is available for a limited number of years and as yet it has not been possible to revise earlier years. Furthermore, the national accounting concepts employed in the new Government account have not been extended to the rest of the national accounts and its introduction into the present system would cause incompatibilities in the various flows between the Government and private sector. Finally, the organisational work of obtaining primary information for the new account has not improved sufficiently to obtain the data in time for inclusion in national income and expenditure estimates.
It is for these reasons that the existing presentation has been retained for the time being. Although the account on pages 728-729 is incomplete, its present advantage is that it can be speedily compiled.
(a) Central Government—The Revenue Account of the Central Government has been obtained by an analysis of the various accounts within the Public Account. In the case of trading Department operations, which are treated separately, profits only are brought into the main account as a revenue item. Expenditure has been taken “net” in all cases, sundry departmental receipts being set off against departmental expenditure. The account covers only current revenue items and therefore excludes capital receipts and payments of all kinds, thus accounting in part for the differences between the details given here and those given in the published statement of the Public Accounts in parliamentary paper B. 1 [Pt. I].
Government current expenditure on goods and services (shown as item 6 on page 728) increased from $346.8 million in 1964-65 to $381.0 million in 1965-66, i.e., by 9.9 percent. The proportion of Government expenditure to gross national product provides, however, a better measure of its significance. In 1964-65 this expenditure amounted to 9.9 percent of gross national product but it increased to 10.1 percent in 1965-66. The average for the post-war period of 20 years is 10.2 percent.
Although all Government transfer expenditure—social security cash benefits and pensions, interest on public debt, and subsidies—is also paid from the Government's taxation revenue and trading profits, it is not part of Government final consumption. It only becomes final consumption in the hands of recipients, or, in the case of subsidies, can be looked upon as an offset to indirect taxation which reduces prices to consumers. For this reason the best measure of transfers is the national income itself on which they are a charge and which they redistribute.
Social security benefits and pensions, the most important item of the transfer group, increased from $233.6 million in 1964-65 to $242.2 million in 1965-66, i.e., by 3.7 percent. However, the 1965-66 figure shows a decrease when expressed as a percentage of national income, this being 7.5 percent against 7.8 percent in 1964-65. The average for the 20 post-war years is 8.3 percent. Advances on capitalisation of family benefits, a portion of this item, started to decline in 1961-62 and have continued to do so since.
Subsidies are of a much lesser importance than social security benefits both absolutely and relatively. The subsidy bill was $35.4 million in 1964-65 and increased to $39.2 million in 1965-66, remaining at 1.2 percent of national income. Interest on Government debt paid in New Zealand (interest paid overseas being treated as a factor payment to non-residents and is included in current expenditure totals) increased from $71.9 million to $79.3 million, amounting to 2.4 percent of national income in 1965-66 compared with 2.4 percent in the previous year. The figure for the last pre-war year was 2.4 percent.
Transfers to local authorities is a flow which can be most usefully measured against current Government revenue from taxation and trading profits as it represents a shift from local to national taxation. In 1965-66, $124.6 million was transferred to local authorities against $109.6 million in the preceding year, constituting an increase from 11.6 percent of Government revenue in 1964-65 to 12.1 percent in the latest year.
The balance of revenue over expenditure is the Government's surplus on current transactions and is, together with the depreciation provisions of Government trading undertakings, available for capital formation, lending, and debt repayment. Its magnitude changes appreciably from year to year both absolutely and in relation to total current revenue and is the result of short-term changes in fiscal and economic policies pursued by the administration. Year to year changes in the Government's surplus are, however, complementary to changes (in the opposite direction) in private savings. This is of course, merely a reflection of the fact that changes in taxation policies are a major cause of the redistribution of total savings as between the private and Government sector. From a long-term point of view, however, it is important to observe the changes in Government fiscal policy from pre-war to present days: in 1938-39, 4.8 percent of the Government's revenue was saved, but in 1965-66 the figure stood at 15.1 percent.
| CENTRAL GOVERNMENT—REVENUE ACCOUNT | |||||||
|---|---|---|---|---|---|---|---|
| 1938-39 | 1960-61 | 1961-62 | 1962-63 | 1963-64 | 1964-65 | 1965-66* | |
* Provisional. †In 1964-65 the Government stopped paying hospital benefits and made direct grants to hospital boards instead. Items 6 (e) and 9 (a) are affected in this year. | |||||||
| 1. TAXATION— | |||||||
| (a) Direct: | REVENUE $(million) | ||||||
| Income tax | 18.6 | 263.0 | 296.2 | 268.2 | 288.7 | 362.3 | 401.2 |
| Social security taxation | 11.6 | 150.8 | 160.8 | 164.6 | 177.8 | 185.4 | 204.7 |
| Land tax | 2.2 | 3.6 | 4.0 | 2.4 | 2.3 | 2.6 | 3.2 |
| Death duties | 3.6 | 33.4 | 26.0 | 21.6 | 21.5 | 20.5 | 22.3 |
| Other | 0.2 | - | - | - | - | - | - |
| Totals | 35.6 | 450.8 | 487.2 | 456.8 | 490.3 | 570.8 | 631.4 |
| (b) Indirect: | |||||||
| Sales tax | 7.2 | 47.4 | 51.2 | 52.4 | 64.2 | 77.0 | 76.6 |
| Customs and excise duties | 23.4 | 110.4 | 108.8 | 103.8 | 111.6 | 114,4 | 121.6 |
| Motor vehicles taxation | 6.2 | 47.6 | 51.6 | 52.2 | 56.8 | 61.0 | 65.8 |
| Other | 3.4 | 18.4 | 17.8 | 17.6 | 18.8 | 20.4 | 22.0 |
| Totals | 40.0 | 223.8 | 229.4 | 226.2 | 251.4 | 272.8 | 286.0 |
| 2. Totals, all taxation | 75.6 | 674.6 | 716.4 | 683.0 | 741.7 | 843.6 | 917.4 |
| 3. TRADING INCOME | 11.6 | 67.7 | 75.8 | 81.9 | 96.9 | 109.6 | 120.3 |
| 4. Less direct taxation paid by trading departments | -0.4 | -5.8 | -6.9 | -7.4 | -7.8 | -9.2 | -10.7 |
| Totals | 11.2 | 61.9 | 68.9 | 74.5 | 89.1 | 100.4 | 109.6 |
| 5. TOTAL REVENUE | 86.8 | 736.5 | 785.3 | 757.5 | 830.8 | 944.0 | 1,027.0 |
| 6. CURRENT EXPENDITURE ON GOODS GOODS AND SERVICES— | EXPENDITURE $(million) | ||||||
| (a) General administration | 4.4 | 33.2 | 39.4 | 40.6 | 42.4 | 45.0 | 52.0 |
| (b) Interest | 13.6 | 10.4 | 10.2 | 13.0 | 14.0 | 15.2 | 15.2 |
| (c) Law and order | 1.6 | 7.8 | 7.6 | 8.6 | 9.2 | 10.4 | 10.6 |
| (d) Development of primary and secondary industries | 1.4 | 22.6 | 23.0 | 25:6 | 26.6 | 32.2 | 35.4 |
| (e) Health | 1.6 | 58.2 | 63.4 | 67.4 | 70.2 | 58.8 | 64.2 |
| (f) Education | 8.4 | 67.2 | 71.0 | 78.8 | 87.0 | 99.0† | 110.4 |
| (g) Other social services | 6.6 | 4.0 | 4.0 | 4.6 | 4.6 | 5.2 | 4.6 |
| (h) Defence | 4.2 | 56.8 | 53.4 | 54.2 | 56.2 | 72.2 | 79.4 |
| (i) Rehabilitation | ... | 2.4 | 1.6 | 1.6 | 1.6 | 1.4 | 1.4 |
| (j) Maintenance of public works and services | 4.6 | 4.0 | 6.8 | 7.8 | 8.4 | 7.4 | 7.8 |
| 46.4 | 266.6 | 280.4 | 302.2 | 320.2 | 346.8 | 381.0 | |
| EXPENDITURE $(million) | |||||||
| 7. TRANSFER INCOME— | |||||||
| (a) Monetary Social Security benefits and pensions | 14.8 | 198.6 | 206.4 | 208.6 | 220.8 | 225.6 | 234.8 |
| (b) Family benefit advances | - | 13.8 | 11.2 | 10.0 | 8.6 | 8.0 | 7.4 |
| (c) Net transfers to rest of world | 0.2 | 4.0 | 4.6 | 4.2 | 5.0 | 4.8 | 5.8 |
| 8. Interest on central Government debt paid in New Zealand | 9.4 | 49.7 | 53.2 | 58.7 | 67.8 | 71.9 | 79.3 |
| Totals | 24.4 | 266.1 | 275.4 | 281.5 | 302.2 | 310.3 | 327.3 |
| 9. TRANSFERS TO LOCAL AUTHORITIES— | |||||||
| (a) Hospital Boards | 1.8 | 39.2 | 40.6 | 45.6 | 51.0 | 73.2† | 83.8 |
| (b) Other | 8.8 | 28.6 | 29.8 | 32.6 | 33.8 | 36.4 | 40.8 |
| Totals | 10.6 | 67.8 | 70.4 | 78.2 | 84.8 | 109.6 | 124.6 |
| 10. SUBSIDIES— | |||||||
| (a) Shipping and transport | - | 0.2 | 0.2 | 0.7 | 0.4 | 0.4 | 0.4 |
| (b) Primary production | 0.8 | - | - | - | 0.2 | 0.3 | 0.6 |
| (c) Foodstuffs | 0.4 | 29.6 | 26.8 | 27.5 | 28.4 | 33.3 | 35.4 |
| (d) Miscellaneous | - | 0.8 | 1.3 | 1.2 | 1.2 | 1.4 | 2.9 |
| (e) Housing suspensory loans | - | - | - | - | - | - | - |
| Totals | 1.2 | 30.6 | 28.4 | 29.4 | 30.2 | 35.4 | 39.2 |
| 11. TOTAL EXPENDITURE | 82.6 | 631.1 | 654.6 | 691.3 | 737.4 | 802.1 | 872.1 |
| 12. Balance of revenue over expenditure | 4.2 | 105.4 | 130.7 | 66.2 | 93.4 | 141.9 | 154.9 |
| 13. TOTAL EXPENDITURE PLUS REVENUE BALANCES | 86.8 | 736.5 | 785.3 | 757.5 | 830.8 | 944.0 | 1,027.0 |
(b) Local Authorities—The revenue account of local authorities is in all respects similar to that of the central Government and has been obtained by an analysis of the accounts of all local authorities including hospital boards. The Central Government contributed 53.2 percent of the total revenue of local authorities through transfers. Of the remainder, 12.5 percent was derived from trading profits and 34.3 percent from rates and licence fees. For 1964-65, the proportions were, 52.6, 13.0, and 34.4 percent respectively. Over the 20 post-war years, the averages are 46.4, 15.3, and 38.3 percent respectively. The limitations in the scope of local government activities as compared with those of the central Government do not call for a detailed analysis of expenditure items and therefore current expenditure on the provision of goods and services by local authorities is shown as a single total.
| LOCAL AUTHORITIES—REVENUE ACCOUNT | |||||||
|---|---|---|---|---|---|---|---|
| 1938-39 | 1960-61 | 1961-62 | 1962-63 | 1963-64 | 1964-65 | 1965-66* | |
| * Provisional. | |||||||
| REVENUE $(million) | |||||||
| 14. TAXATION— | |||||||
| (a) Direct: Rates | 12.4 | 48.6 | 51.2 | 55.4 | 60.6 | 68.8 | 77.0 |
| (b) Indirect: Licence fees | 1.2 | 2.0 | 2.0 | 2.0 | 2.2 | 2.8 | 3.4 |
| Totals | 13.6 | 50.6 | 53.2 | 57.4 | 62.8 | 71.6 | 80.4 |
| 15. Trading income | 6.8 | 23.6 | 23.8 | 24.2 | 26.9 | 27.0 | 29.2 |
| 16. Transfers from central Government | 10.6 | 67.8 | 70.4 | 78.2 | 84.8 | 109.6 | 124.6 |
| 17. TOTAL REVENUE | 31.0 | 142.0 | 147.4 | 159.8 | 174.5 | 208.2 | 234.2 |
| EXPENDITURE $(million) | |||||||
| 18. Current expenditure on goods and services | 17.0 | 79.0 | 82.8 | 92.2 | 96.3 | 112.5 | 113.0 |
| 19. Interest on local authority debt paid in New Zealand | 4.6 | 15.3 | 17.0 | 18.6 | 20.8 | 22.8 | 25.5 |
| 20. TOTAL EXPENDITURE | 21.6 | 94.3 | 99.8 | 110.8 | 117.1 | 135.3 | 138.5 |
| 21. Balance of revenue over expenditure | 9.4 | 47.7 | 47.6 | 49.0 | 57.4 | 72.9 | 95.7 |
| 22. TOTAL EXPENDITURE PLUS REVENUE BALANCES | 31.0 | 142.0 | 147.4 | 159.8 | 174.5 | 208.2 | 234.2 |
THE ACCOUNTS OF THE GOVERNMENT SECTOR—The accounts of the Government sector as set out in the preceding pages 728-729, have now been complemented by the publication The Accounts of the Government Sector 195:9-60 to 1965-66 issued as a special supplement to the report on the National Income and Expenditure for the Year 1965-66 and available from the Government Printer. The publication of these accounts is the first stage in a major revision of the national accounts, but until this revision is completed it will not be possible to integrate the accounts of the Government sector into the overall national accounting structure.
The accounts of the Government sector present the first comprehensive and consistently classified statement of all central Government transactions. In preparing these accounts coverage has been extended to all Government accounting units, and all transactions have been classified according to a consistent economic analysis of receipts and payments. As it stands, the new system of accounts is a valuable addition to the material on Government finance available to the public and to the policy maker. The bulk of Government accounting material hitherto available has been of a detailed nature designed to permit parliamentary and audit control of various departmental expenditures. Although this detailed presentation is essential for these purposes, it has had the undesirable effect of obscuring the broad pattern of Government operations.
The assumption by Governments of overall responsibility for the health of the national economy has created a need for a presentation of Government accounts in a form which reveals the broad types of financial flows through which the Government can influence the growth and stability of the economy. Although most of the main items included in such flows as direct taxation, subsidies, and Government transfer payments are easily obtainable by any person familiar with the public accounts, it has not been possible to obtain total figures for any of these flows. The accounts of the Government sector enable such a view to be obtained.
In addition to providing improved measures of the current account transactions as recorded in the central Government Revenue Account, the new accounts include a full analysis of the Government's capital transactions. Details of Government lending and borrowing are classified according to changes in claims on, and in liabilities to, local authorities, the private sector, and the rest of the world.
A major problem encountered in the preparation of the new accounts has been the elimination of numerous transfers between the many separate Government accounting units. The existence of these interaccount transfers has made it difficult for the public to understand the net effect of Government transactions. For example, public attention is frequently drawn to changes in the public debt, which is usually regarded as measuring changes in Government borrowing from non-Government sources. In fact the Government is one of the main holders of New Zealand Government securities and what appear as changes in the public debt may in fact reflect no more than the transfer of Government money from one Government account to another.
It is hoped that the new Government accounts by eliminating all such internal transactions and by classifying transactions in a consistent manner will, in addition to assisting those concerned with policy, improve general understanding of the nature of Government transactions.
GENERAL—A balance of payments account is a statement in money terms of economic transactions, over a period, between one country and the rest of the world. An economic transaction may consist of goods and services supplied and received for some valuable consideration; transfers or goods and services supplied and received without some such consideration; and changes in a country's foreign assets and liabilities. The balance of payments is part of the national accounting system and describes the economic link between the domestic economy and the rest of the world. The present series of New Zealand balance of payments estimates is largely based on the principles set out in the Balance of Payments Manual published by the International Monetary Fund and is in conformity with the methods used in other countries. For a more detailed description of statistical concepts and methods used in preparing balance of payments estimates, refer to the Report on the Balance of Payments for the year 1965–66 obtainable from the Government Printer.
The statement is divided into a current and capital account. The balances on both accounts are, by definition, the same; the capital account shows how the surplus or deficit on current account was financed.
Current Account—The current account records all transactions between New Zealand and the rest of the world other than changes in overseas assets and liabilities. As far as possible transactions are recorded on a gross credit-debit basis rather than on the basis of net settlements. The current account includes credits and debits for goods, services (invisibles), and transfers (donations). The difference between current credits and current debits is the balance of payments surplus (deficit) on current account. This is the measure of the extent to which a country does or dots not live within its current income and it is the most significant datum emerging from a balance of payments compilation.
Capital Account—The capital account records changes in claims on, or liabilities to, the rest of the world. These may consist of overseas private investment in New Zealand and New Zealand private investment overseas; borrowing or repayments overseas by the Government and official institutions and changes in Government overseas cash balances, net overseas assets and monetary gold, multilateral transfers, and other short-term capital movements. Of the items comprising the capital account, the category of net overseas assets (the overseas exchange holdings of New Zealand's banking system) is most widely known and appreciated. Its importance lies in the fact that it records changes in overseas liquid resources which by their nature can be made immediately available for purposes of imports, public debt repayments, capital investments, etc. But within the confines of the balance of payments capital account the movement in net overseas assets is only one of several other capital movements with which it forms an integral part; it is the combination of all these capital changes which must be studied in order to understand the financing of the current surplus or deficit.
MERCHANDISE TRANSACTIONS: Exports—The source of export figures is Customs information on total exports (exclusive of ships' stores) at f.o.b. valuation; exports from New Zealand to its island territories have been excluded from Customs figures, but exports from island territories to other countries have been added to New Zealand totals. The remaining adjustments are for items which are either omitted from Customs statistics (relief supplies, ships and aircraft sold and leaving under their own power), items where the valuation requires correction, e.g. parcel post, or items which are accounted for elsewhere in the balance of payments (export of gold).
Imports—The basic import figures also originate in Customs statistics. New Zealand imports from its island territories have been excluded from the Customs figures, but imports into island territories from other countries have been added and also aircraft and ships arriving in New Zealand under their own power.
It is necessary to comment here on the valuation method adopted for imports. Balance of payments accounts treat freight and marine insurance payments on imports (as far as they are made to non-residents) as invisible payments. As a result, merchandise transactions are shown on a f.o.b. valuation basis for imports and exports alike. This method of treatment has many advantages, and international comparability of merchandise movements is one of them.
There is, however, no provision in New Zealand statistics for a f.o.b. valuation of imports; imports are valued either on the basis of “current domestic value” or c.i.f. A special estimate is therefore made of imports f.o.b. for balance of payments accounts.
BALANCE OF PAYMENTS AND EXCHANGE RECORD—There are several very important differences between a balance of payments statement and the statistics of overseas receipts and payments which are included in an exchange record, such as is given in Section 29, Banking and Currency. The main differences are:
The balance of payments attempts to show all economic transactions between residents of one country and residents of other countries, whereas the exchange record shows only transactions involving remittances.
The import and export figures in the balance of payments are based on trade (Customs) statistics, which enable goods to be valued at a definite and uniform valuation boundary—viz, f.o.b. country of export; the exchange record, on the other hand, records remittances for imports and exports whenever these are made and without adhering to any valuation boundary (f.o.b. or c.i.f.). The result is a difference both in timing and valuation between the two statements.
Whereas exchange statistics record net settlements resulting from a number of possible contra-entries or off-sets, the balance of payments shows these transactions as far as possible on a gross basis.
Other differences arise from the fact that the balance of payments is constructed on a basis of country of purchase for imports and country of destination for exports, country of residence of remittor or remittee, and nationality in the case of shipping companies, whereas the record of exchange transactions is based on the country of monetary settlement.
In essence, the exchange record is a statement of cash flows, or using the terminology of commercial accounting it is the “cash book” of the nation's transactions with other countries; the balance of payments statement on the other hand is based on the accrual principle and approaches an “income and expenditure” account.
GEOGRAPHICAL DIVISION—The regional break-up of the balance of payments is on a geographical, as distinct from a currency, basis. This means that it is not the currency in which any economic transaction is settled but the residence of New Zealand's immediate partner of the transaction which determines in which regional column the transaction is recorded. Any exception to this rule is due to statistical necessity—insufficiency of basic data, etc., rather than choice.
The New Zealand figures include transactions of New Zealand's dependent island territories. In this respect they differ from the rest of the world account included in the national income and expenditure estimates, where the rest of the world account refers to New Zealand only, and does not cover the island territories. However, this difference in coverage only slightly affects the gross figures, and the final outcome of the balance of payments current account differs very little from that of the rest of the world account. The regional areas and countries comprising them have been defined as follows:
Other Sterling Countries—Commonwealth countries (excluding the United Kingdom and Canada) and their trustee and dependent territories, the colonies, protectorates, and trustee territories, etc., of the United Kingdom, the Republic of Ireland, Burma, Iceland, and South Africa.
EEC Countries—The six members of the European Economic Community which formed a common market in 1958; Belgium, the Netherlands, Luxembourg, France, Italy, and West Germany, together with their associated and dependent overseas territories.
Other Countries—All countries not included in any other group.
International Organisations—Transactions with the United Nations and its agencies, the International Monetary Fund, the International Bank for Reconstruction and Development, the International Finance Corporation, South Pacific Air Transport Council, and other international organisations are included here.
ACCOUNTING PERIOD—All estimates are for financial years ended 31 March.
RESIDENTS AND NON-RESIDENTS—The balance of payments is a record of economic transactions between residents and non-residents.
Residents are all people living permanently in New Zealand (or for a period exceeding 12 months), subsidiaries and branches of overseas companies being treated as residents, while subsidiaries and branches of New Zealand companies operating overseas are regarded as residents of the country in which they operate.
In order to simplify the rather complex operations of overseas shipping companies, the shipping transactions of their branches in New Zealand (such as their receipt of freights, port disbursements, administrative expenses in New Zealand) are regarded as transactions of non-residents, by way of exception to the general rule stated above; on the other hand, their investment activity is included in the data on New Zealand branches of overseas companies and conforms to the general rule.
BALANCE OF PAYMENTS 1965–66: CURRENT ACCOUNT—For the year ended 31 March 1966, New Zealand's transactions on current account with other countries resulted in a balance of payments deficit of $185.0 million; this can be compared with deficits of $33.8 million in 1963–64 and $50.2 million in 1964–65. The higher deficit for 1965–66 was largely caused by a sharp rise in value of imports (measured f.o.b. in supplying country) from $620.1 million to $725.4 million combined with a slight fall in value of exports (f.o.b.) from $757.1 million to $750.5 million. The small surplus on merchandise trade in 1965–66, 825.1 million, was heavily offset by a deficit on net invisibles and transfers of $210.1 million.
Analysing transactions of merchandise and services by trading areas, there was a deterioration in 1965–66 in all areas with the exception of the European Economic Community. In recent years New Zealand has achieved a surplus on current account with the United Kingdom and also with the United States and Canada but in the latest year deficits of $39.0 million and $54.0 million were recorded with these countries.
New Zealand normally experiences a balance of payments deficit with the other sterling area countries (principally Australia) and other countries and the latest year was no exception with deficits of $153.0 million and $2.9 million respectively. The usual surplus with the European Economic Community, however, increased from $66.1 million in 1964–65 to $69.0 million in 1965–66.
(a) Merchandise Transactions—Overall, the deterioration in New Zealand's trade surplus with all countries in 1965–66 was the result of an increase in imports (valued f.o.b. in exporting countries) from $620.1 million in 1964–65 to $725.4 million in 1965–66 and a decrease in exports (f.o.b.) from $757.1 million to $750.5 million in the latest year.
The long-term trend of change in the direction of New Zealand's merchandise trade has continued. This is shown by a decline in the United Kingdom's share of New Zealand's imports and exports (45.9 percent of exports and 39.6 percent of imports in 1965–66 compared with 49.4 percent of exports and 41.2 percent of imports in 1964–65) and a rise in the share of the United States and Canada and the other sterling area countries.
The following table gives a short analysis of total merchandise transactions by defined geographical areas and shows the comparative changes that occurred in 1965–66.
| TRADE BY AREAS | ||||||
|---|---|---|---|---|---|---|
| Item | United Kingdom | Other Sterling Countries | U.S.A. and Canada | EEC Countries | Other* Countries | Total, All Countries |
| *Includes International Organisations. | ||||||
| Exports (f.o.b. New Zealand ports)— | NZ$ (million) | |||||
| 1. 1964–65 | 374.4 | 69.6 | 127.0 | 117.0 | 69.0 | 757.1 |
| 2. 1965–66 | 344.6 | 90.2 | 108.4 | 120.2 | 87.1 | 750.5 |
| Imports (f.o.b. exporting country)— | ||||||
| 3. 1964–65 | 255.3 | 175.7 | 91.0 | 38.2 | 60.0 | 620.1 |
| 4. 1965–66 | 287.4 | 190.6 | 135.5 | 43.7 | 68.2 | 725.4 |
| Net trade— | ||||||
| 5. 1964–65 | 119.1 | −106.0 | 36.0 | 78.8 | 9.0 | 136.9 |
| 6. 1965–66 | 57.2 | −100.4 | −27.1 | 76.5 | 18.9 | 25.1 |
| Annual changes, 1964–65 to 1965–66— | ||||||
| 7. Exports | −29.8 | 20.6 | −18.6 | 3.2 | 18.1 | −6.6 |
| 8. Imports | 32.1 | 14.9 | 44.5 | 5.5. | 8.2 | 105.3 |
| Net trade (6–5 or 7–8) | −61.9 | +5.6 | −63.1 | −2.3 | +9.9 | −111.8 |
(b)Invisibles—Although New Zealand traditionally has a deficit on invisible items, the gap between payments and receipts has increased sharply in the last few years from $135.8 million in 1963–64 to $172.2 million in 1964–65 and $187.4 million in 1965–66. The two items which play the most important part in the invisible account are the cost of transporting goods to New Zealand and the servicing in the form of profits, dividends, and interest, of overseas direct investment, and Central Government borrowing. Other types of invisible transactions—travel expenditures, miscellaneous business transactions, and Government expenditures—also yield a permanent deficit, but are of less importance individually.
Gross payments on transportation account (import freights and passenger fares to non-resident shipping lines and air operators, and port disbursements of New Zealand operators overseas) rose from $81.1 million in 1964–65 to $89.8 million in 1965–66. This could be expected with the increased volume of imports. Transportation receipts, a large portion of which are port expenditures of non-resident shipping operators, increased from $36.0 million to $38.2 million. The net deficit on transportation increased from $45.1 million to $51.5 million.
Payments of dividends, profits, and interest on private investment and Government borrowing decreased from $84.0 million in $964–65 to $78.1 million in 1965–66 (of this total, government interest payments were $15.2 million and $15.4 million respectively.) The largest component of this group of outgoings concerned direct private investment.
Receipts in the investment income account were $18.6 million in 1965–66 compared with $19.4 million in 1963–64, with the direct investment portion increasing from $4.9 million in 1964–65 to $5.5 million in 1965–66.
| INVESTMENT INCOME RELATING TO OVERSEAS PRIVATE DIRECT INVESTMENT IN NEW ZEALAND | ||||||
|---|---|---|---|---|---|---|
| Year | United Kingdom | Other Sterling Countries | U.S.A. and Canada | EEC Countries | Other Countries | Total, All Countries |
| NZ$ (million) | ||||||
| 1964–65 | 28.3 | 16.5 | 15.7 | 1.6 | 0.5 | 62.4 |
| 1965–66 | 22.1 | 18.6 | 12.7 | 0.5 | 1.3 | 55.2 |
The following table gives a concise picture of invisible transactions by areas.
| NET DEFICITS ON INVISIBLES ACCOUNT BY AREAS | |||||||
|---|---|---|---|---|---|---|---|
| Year | United Kingdom | Other Sterling Countries | U.S.A. and Canada | EEC Countries | Other Countries | International Organisations | Total, All Countries |
| NZ$ (million) | |||||||
| 1964–65 | 91.2 | 32.5 | 26.2 | 12.6 | 9.7 | – | 172.2 |
| 1965–66 | 96.0 | 38.5 | 26.2 | 7.1 | 19.6 | – | 187.4 |
| Increase (+) or decrease (−) in deficit | +4.8 | +6.0 | – | −5.4 | +9.8 | – | +15.3 |
The preceding table shows that on 1965–66 transactions with the United Kingdom accounted for 51 percent of the invisible deficit, the other sterling area countries accounted for 21 percent, and the United States and Canada for 14 percent.
Transfers—Transfers, in the form of Government contributions to international agencies, migrants' funds, gifts, and donations in cash or kind, differ from other current account items in that a good or service is not received in exchange. In recent years there has been a steady increase in transfer receipts; there was a rise from $22.0 million in 1964–65 to $23.3 million in 1965–66. Transfer payments rose more sharply from $37.0 million to $46.0 million, principally due to the increase in personal remittances and emigrants' funds.
Capital Account—The capital account of the balance of payments represents changes in claims on and liabilities to other countries; such changes have direct reference to current transactions and the net difference between acquisition of new claims and the increase in liabilities must be capable of explaining the current outcome of the balance of payments.
A concise picture of the 1965–66 capital account is now presented.
| Nature of Capital | Net Outflows of Capital (Increase in Claims) | Net Inflows of Capital (Increase in Liabilities) |
|---|---|---|
| Long term— | NZ$(million) | |
| Private | – | 65.1 |
| Government | – | 33.7 |
| Official and banking | – | 49.1 |
| Short term— | ||
| Private (including errors and omissions) | 3.5 | – |
| Government | 2.6 | – |
| Net exchange reserves | −43.2 | – |
| Excess of capital outflows over inflows (equals balance on current account) | 185.0 | – |
| Totals | 147.9 | 147.9 |
The preceding table serves the purpose of placing the decrease in net overseas assets (i.e. liquid exchange reserves of the banking system) within its proper context. There is no necessary connection between the balance of payments current outcome (surplus or deficit as the case may be) and movements in exchange reserves. The latter constitute only one of the items in the capital account and they may be directly affected by other capital transactions (e.g. long-term Government borrowing) rather than by current account transactions.
The most important category of private capital movements is that of direct investment by overseas firms. In 1965–66 the amount so invested attained $51.6 million against $44.2 million in the preceding year. Of the total amount invested, 29 percent was in the form of additional paid-up capital, 32 percent in the form of additional company reserves and 38 percent was added to intercompany account liabilities, net branch assets, and other minor items. By residence of suppliers of direct investment capital, United Kingdom supplied 39 percent, other sterling countries 33 percent and the United States and Canada 29 percent of the total; the reduction in other areas was 1 percent.
Private capital inflows other than direct investment were $16.3 million, the largest portion of which was in the form of liquidation of assets held overseas by New Zealand residents in order to pay for no-remittance and free funds imports.
Inflows of capital on Central Government account consisted of long-term borrowing of $2.4 million added to public debt and a reduction in overseas investments of $11.3 million.
A reconciliation of movements in the external public debt with actual amounts raised is given in the following statement.
| NZ$ (million) | |
|---|---|
| Public loan raised in United States | 25.2 |
| Public loan raised in United Kingdom | 19.9 |
| International Bank of Reconstruction and Development Loan | 12.5 |
| Total | 57.6 |
| Less— | |
| Debt repayment in London | −34.1 |
| Debt repayment in United States | −3.7 |
| Transfer of securities from London to New Zealand register | −17.4 |
| Net addition to external public debt | 2.4 |
SUMMARY TABLES, CURRENT AND CAPITAL ACCOUNTS—The following table summarises current transactions with all countries.
| Current Account | 1961–62 | 1962–63 | 1963–64 | 1964–65 | 1965–66 |
|---|---|---|---|---|---|
| $(000) | |||||
| Credits | |||||
| Exports | 580,000 | 606,000 | 718,400 | 757,100 | 750,500 |
| Non-monetary gold | – | – | – | – | – |
| Transportation | 33,100 | 30,700 | 30,400 | 36,000 | 38,200 |
| Travel | 8,400 | 8,600 | 11,100 | 12,600 | 13,500 |
| Insurance | – | 200 | – | – | – |
| International investment income— | 12,500 | 14,100 | 16,000 | 19,400 | 18,600 |
| Income from direct investment | 2,100 | 5,400 | 4,200 | 4,900 | 5,500 |
| Other private investment | 4,500 | 2,300 | 4,500 | 6,400 | 4,400 |
| Government and official institutions | 5,800 | 6,500 | 7,300 | 8,100 | 8,600 |
| Government transactions— | 3,300 | 5,900 | 7,800 | 6,300 | 4,800 |
| Foreign Government expenditure | 2,500 | 3,100 | 3,200 | 3,800 | 3,100 |
| New Zealand Government receipts | 900 | 2,700 | 4,700 | 2,500 | 1,700 |
| Miscellaneous receipts | 8,000 | 17,800 | 17,900 | 14,300 | 16,600 |
| Transfers— | 17,800 | 17,700 | 20,700 | 22,000 | 23,300 |
| Government transfers | 100 | 100 | – | – | – |
| Personal remittances and other donations and transfers | 10,200 | 11,000 | 11,900 | 12,900 | 14,800 |
| Migrants' funds | 5,200 | 4,500 | 6,300 | 6,600 | 5,900 |
| Legacies | 2,300 | 2,200 | 2,500 | 2,500 | 2,600 |
| Total credits | 663,100 | 701,100 | 822,300 | 867,700 | 865,500 |
| Current Account | 1961–62 | 1962–63 | 1963–64 | 1964–65 | 1965–66 |
|---|---|---|---|---|---|
| $(000) | |||||
| Debits | |||||
| Imports f.o.b. | 551,000 | 508,600 | 604,200 | 620,100 | 725,400 |
| Non-monetary gold | ... | ... | ... | ... | ... |
| Transportation | 66,300 | 68,800 | 71,200 | 81,100 | 89,800 |
| Travel | 28,500 | 28,200 | 30,200 | 35,100 | 41,000 |
| Insurance | 2,300 | 2,600 | 2,900 | 5,700 | 4,800 |
| International investment income— | 47,200 | 64,200 | 63,300 | 84,000 | 78,100 |
| Income from direct investment | 33,300 | 46,000 | 46,800 | 62,400 | 55,200 |
| Other private investment | 3,500 | 5,100 | 3,000 | 6,300 | 7,400 |
| Government and official institutions | 10,300 | 13,000 | 13,500 | 15,200 | 15,400 |
| Local authority interest | 100 | – | 100 | – | – |
| Government transactions— | 14,500 | 15,400 | 19,900 | 19,000 | 25,200 |
| New Zealand Government expenditure | 14,500 | 15,400 | 19,900 | 19,000 | 25,200 |
| Miscellaneous payments | 33,600 | 29,300 | 31,600 | 36,000 | 40,300 |
| Transfers— | 29,900 | 30,300 | 32,900 | 37,000 | 46,000 |
| Government transfers and contribution to Colombo Plan | 4,500 | 4,200 | 5,100 | 4,700 | 5,900 |
| Personal remittances and other donations and transfers | 12,000 | 11,300 | 11,800 | 12,600 | 15,200 |
| Migrants' funds | 9,600 | 10,700 | 11,200 | 14,600 | 19,100 |
| Legacies | 3,700 | 4,000 | 4,800 | 5,000 | 5,700 |
| Total debits | 773,300 | 747,400 | 856,200 | 918,000 | 1,050,500 |
| Balance on current account | −110,200 | −46,300 | −33,800 | −50,200 | −185,000 |
The consolidated capital account shown below summarises capital transactions with all countries; some of the items are presented in simplified form (by adding or offsetting capital movements where these have occurred in respect of equally denned items).
| Capital Account Assets | 1961–62 | 1962–63 | 1963–64 | 1964–65 | 1965–66 | |||||
|---|---|---|---|---|---|---|---|---|---|---|
| Increase in | Increase in | Increase in | It crease in | Increase in | ||||||
| Assets | Liabilities | Assets | Liabilities | Assets | Liabilities | Assets | Liabilities | Assets | Liabilities | |
| Minus (—) sign denotes decrease. | ||||||||||
| NZ$ (thousand) | ||||||||||
| Long-term capital (private)— | ||||||||||
| Overseas direct investment in New Zealand | ... | 36,200 | ... | 55,400 | ... | 38,100 | ... | 44,200 | ... | 51,600 |
| New Zealand direct investment overseas | 1,500 | ... | 4,000 | ... | 3,700 | ... | −300 | ... | 2,800 | ... |
| Other long-term capital movements | – | 19,800 | – | 10,600 | – | 9,200 | – | 18,800 | – | 16,300 |
| Long-term capital | ||||||||||
| (Government)— | ||||||||||
| Government investments | 79,700 | ... | 13,200 | ... | −10,700 | ... | 2,800 | ... | −11,300 | ... |
| Public debt | ... | 103,000 | ... | 34,800 | ... | 7,800 | ... | 9,100 | ... | 2,400 |
| Local authority debt | ... | −400 | ... | – | ... | −700 | ... | −300 | ... | – |
| Other | – | 1,300 | – | −1,300 | – | −1,600 | – | −800 | – | 20,000 |
| Long-term capital (Official and banking institutions)— | ||||||||||
| International Monetary Fund | – | – | – | – | – | – | – | – | – | 50,400 |
| New Zealand Wool Commission | 400 | – | 300 | – | 300 | – | 400 | – | 1,300 | – |
| Short-term capital | ||||||||||
| (Government)— | ||||||||||
| Government cash balances | 1,200 | – | −500 | – | 24,700 | – | −24,500 | – | 1,800 | – |
| Other | 4,100 | – | −11,300 | – | – | – | 27,500 | – | 800 | – |
| Short-term capital and monetary gold (official and banking institutions)— | ||||||||||
| Net overseas assets | 6,700 | – | 59,000 | – | −6,200 | – | −7,000 | ... | −43,000 | – |
| Monetary gold | −24,400 | – | – | – | – | – | – | – | − 200 | – |
| Other short-term capital movements including errors and omissions | – | 19,500 | – | 11,700 | 7,200 | – | 21,900 | – | 3,500 | – |
| Balance on capital account | −110,200 | −46,300 | −33,800 | −50,200 | −185,000 | |||||
DIRECTION OF TRADE—The following table shows exports and imports by areas as percentages of the total and reveals the direction of New Zealand's trade for financial years.
| Percent | |||||||
|---|---|---|---|---|---|---|---|
| — | United Kingdom | Other Sterling Countries | U.S.A. and Canada | EEC Countries | Other OEEC Countries | Other Countries | Total, all Countries |
| *Provisional. | |||||||
| Exports (f.o.b.)— | |||||||
| 1950–51 | 64.2 | 3.6 | 12.6 | 14.2 | 5.4 | 100.0 | |
| 1955–56 | 64.9 | 5.7 | 8.9 | 16.2 | 4.3 | 100.0 | |
| 1960–61 | 52.9 | 8.1 | 15.3 | 15.9 | 7.8 | 100.0 | |
| 1961–62 | 50.0 | 7.3 | 16.7 | 16.7 | 9.3 | 100.0 | |
| 1962–63 | 50.8 | 7.7 | 14.8 | 17.9 | 8.8 | 100.0 | |
| 1963–64 | 47.7 | 8.3 | 18.2 | 16.9 | 8.9 | 100.0 | |
| 1964–65 | 49.4 | 9.2 | 16.8 | 15.5 | 9.1 | 100.0 | |
| 1965–66* | 45.9 | 12.0 | 14.5 | 16.0 | 11.6 | 100.0 | |
| Imports (f.o.b.)— | |||||||
| 1950–51 | 60.1 | 20.5 | 9.9 | 4.6 | 4.9 | 100.0 | |
| 1955–56 | 55.6 | 21.2 | 11.8 | 8.2 | 3.2 | 100.0 | |
| 1960–61 | 46.1 | 25.2 | 13.6 | 7.5 | 7.6 | 100.0 | |
| 1961–62 | 44.8 | 26.0 | 11.9 | 8.1 | 9.2 | 100.0 | |
| 1962–63 | 45.0 | 27.3 | 12.0 | 6.9 | 8.8 | 100.0 | |
| 1963–64 | 42.2 | 28.6 | 13.0 | 6.0 | 10.2 | 100.0 | |
| 1964–65 | 41.2 | 28.3 | 14.7 | 6.1 | 9.7 | 100.0 | |
| 1965–66* | 39.6 | 26.3 | 18.7 | 6.0 | 9.4 | 100.0 | |
REGIONAL ACCOUNTS—The tables on the following pages give detailed figures relating to the overall current and capital accounts in the balance of payments as well as particulars for each of the main countries and currency regions. The accounts are divided into current credits (gross), current debits (gross), and the capital account.
Current Credits—The item non-monetary gold represents the purchase by the Reserve Bank of gold produced in this country. Transportation represents mainly port disbursements of overseas shipping companies operating in New Zealand; their establishment expenses, however, are included in miscellaneous receipts. The regional break-up of travel receipts is subject to revision; at present it is still shown on the basis of currency received rather than residence (nationality) of traveller. The all-countries total is, however, not affected. International investment income consists of net (after overseas taxes) earnings of New Zealand companies operating overseas, irrespective of whether these have been remitted to New Zealand or reinvested overseas.
Current Debits—Transportation consists mainly of freight and marine insurance on imports paid to non-resident shipping companies and port disbursements by New Zealand companies overseas and charters. Travel is exclusive of fares paid in New Zealand, which are included in the transportation account. International investment income is based on total earnings of overseas companies operating in New Zealand, irrespective of whether these are remitted or re-invested in New Zealand. (Refer also to Summary of Overseas Direct Investment in New Zealand.) Transfers is the general term for donations or transactions where there is no quid pro quo; the item in the tables consists both of monetary payments as shown in the exchange record and Government and private supplies in kind, such as the estimated value of gift parcels, relief supplies, etc. Migrants' funds and legacies are included in the same group because, from a country's point of view, there is no “consideration” in the ordinary meaning of the word.
Capital Account—The capital account explains how the current surplus or deficit has been financed or, in other words, what changes have occurred to various overseas assets and liabilities (long term, short term, gold reserves) to account for the balance on current account. The tables are largely self-explanatory, but one or two points require mention. The item “Net overseas assets” (of official and banking institutions) is shown in the column of the United Kingdom, although this is not strictly correct. Gross overseas assets and gross overseas liabilities of the Reserve Bank and trading banks arising out of New Zealand business are to a small extent owned or due in currencies other than sterling. At present is has been found impossible to separate movements in other than net sterling assets, but the resulting error is believed to be not very significant. There is another point in connection with this item which should be explained: Net overseas assets are shown here under the description of “Short-term capital and monetary gold - official and banking institutions”. It is well known, of course, that a portion of what is commonly known as sterling exchange is held in the form of investments in United Kingdom stock or short-dated United Kingdom Government paper; these are purchased or sold according to whether there is need for liquidity or not. It is largely a matter of interpretation whether these investments should be treated as short term or long term. The treatment according to the item in the table is largely one of convenience.
Attention is drawn to the items “Other short-term capital movements (including errors and omissions)” and “Multilateral transfers”. At the present stage it is impossible to separate the two items on an area-by-area basis, and they are bracketed together. They are shown in one figure in the regional columns, and are merely the residual between the balance on capital account for each area and the capital items which are estimated and shown separately in the same area column.
In the way in which these are shown in the regional columns, they represent (a) short-term capital movements between each respective area and New Zealand, (b) multilateral transfers, i.e., the differences between current account transactions between New Zealand residents and the residents of the respective areas and the movement of financial assets or liabilities in the same area. To give an example, a difference of this kind would arise in the following instance: New Zealand imports of oil from say, Indonesia may be settled by a remittance to the United Kingdom. While the current account between New Zealand and Indonesia (included in the regional column “Other countries”) would show a debit in that column, the decrease in our overseas assets (from which the payment is made) is shown in the column for the United Kingdom. The purpose of the multilateral transfer entry is to credit the capital account of the United Kingdom, and debit the capital account of the “Other countries” column, in order to compensate the divergent movement in the current and capital accounts.
Because all multilateral transfers, as included in the area column, necessarily cancel each other out, the entry for multilateral transfers in the “Total, All Countries” column is nil; the amount shown in this column represents other short-term capital movements (including errors and omissions only.
| REGIONAL BALANCE OF PAYMENTS 1965–66* | |||||||
|---|---|---|---|---|---|---|---|
| A. CURRENT ACCOUNT | |||||||
| Item | United Kingdom | Other Sterling Countries | U.S.A. and Canada | EEC Countries | Other Countries | International Organisations | Total, All Countries |
| *Provisional. | |||||||
| NZ$(thousand) | |||||||
| Credits | |||||||
| Exports f.o.b. | 344,600 | 90,200 | 108,400 | 120,200 | 87,000 | 100 | 750,500 |
| Non-monetary gold | ... | ... | ... | ... | ... | ... | – |
| Transportation | 24,600 | 9,400 | 1,700 | 1,100 | 1,500 | ... | 38,200 |
| Travel | 3,400 | 6,600 | 3,400 | 100 | – | ... | 13,500 |
| Insurance | – | – | – | – | – | ... | – |
| International investment income— | |||||||
| Income from direct investment overseas | 1,800 | 3,400 | 200 | 200 | – | ... | 5,500 |
| Other private investment income | 1,800 | 2,300 | 200 | 100 | 100 | ... | 4,500 |
| Interest on investments of Government and official institutions | 8,500 | – | 100 | – | – | – | 8,600 |
| Government transactions— | |||||||
| Expenditure by foreign government in New Zealand | 900 | 1,000 | 700 | 200 | 300 | ... | 3,100 |
| New Zealand Government current receipts from overseas | 1,300 | – | 400 | – | – | ... | 1,700 |
| Miscellaneous receipts | 8,500 | 3,800 | 3,000 | 600 | 600 | ... | 16,600 |
| Transfers— | |||||||
| Government transfers | – | – | – | – | – | ... | – |
| Personal remittances and other donations and transfers | 8,400 | 3,800 | 2,000 | 400 | 300 | ... | 14,800 |
| Immigrants' funds | 4,200 | 1,200 | 400 | 100 | 100 | ... | 5,900 |
| Legacies | 1,800 | 600 | 100 | 100 | – | ... | 2,600 |
| Total credits | 409,700 | 122,100 | 120,700 | 123,100 | 89,900 | 100 | 865,500 |
| Debits | |||||||
| Imports f.o.b. | 287,400 | 190,600 | 125,500 | 43,700 | 68,200 | ... | 725,400 |
| Transportation | 51,700 | 3,100 | 3,100 | 5,700 | 16.100 | ... | 89,800 |
| Travel | 16,500 | 18,200 | 4,100 | 1,300 | 800 | ... | 41,000 |
| Insurance | 2,500 | 2,300 | −200 | – | 100 | ... | 4,800 |
| International investment income— | |||||||
| Income from direct investment in New Zealand | 22,100 | 18,600 | 12,700 | 500 | 1,300 | ... | 55,200 |
| Other private investment income | 4,100 | 2,800 | 400 | – | 100 | ... | 7,400 |
| Interest on Government debt | 12,000 | – | 2,400 | – | 1,000 | ... | 15,400 |
| Interest on Local Authority debt | – | – | – | – | – | ... | – |
| Government transactions— | |||||||
| Current Government expenditure | 9,900 | 8,800 | 4,900 | 300 | 1,300 | ... | 25,200 |
| Miscellaneous payments | 17,900 | 10,900 | 8,700 | 1,500 | 1,400 | ... | 40,300 |
| Transfers— | |||||||
| Government transfers and contribution to Colombo Plan | 200 | 400 | – | – | – | 5,300 | 5,900 |
| Personal remittances and other donations and transfers | 4,600 | 7,200 | 900 | 400 | 2,100 | ... | 15,200 |
| Emigrants' funds | 6,300 | 10,300 | 1,800 | 400 | 300 | ... | 19,100 |
| Legacies | 3,300 | 1,800 | 400 | 100 | 100 | ... | 5,700 |
| Total debits | 448,700 | 275,200 | 174,600 | 54,000 | 92,800 | 5,300 | 1,050,500 |
| Balance on current account (minus sign (—) denotes deficit) | −39,000 | −153,000 | −54,000 | 69,000 | −2,900 | −5,200 | −185,000 |
| B. CAPITAL ACCOUNT | ||||||
|---|---|---|---|---|---|---|
| Item | United Kingdom | Other Sterling Countries | U.S.A. and Canada | |||
| Increase in | Increase in | Increase in | ||||
| Assets | Liabilities | Assets | Liabilities | Assets | Liabilities | |
| NZ$(thousand) | ||||||
| Long-term capital (private)— | ||||||
| Overseas direct investment in New Zealand | ... | 20,200 | ... | 16,900 | ... | 15,000 |
| New Zealand direct investment overseas | −500 | ... | 3,400 | ... | −100 | ... |
| Other long-term capital movements | −12,800 | 700 | −4,200 | −2,100 | −1,000 | −700 |
| Long-term capital (Government)— | ||||||
| Government investments | −12,300 | ... | 400 | ... | 500 | ... |
| Public dept | ... | −31,600 | ... | – | ... | 21,400 |
| Local authority debt | ... | – | ... | – | ... | – |
| Other | – | – | – | – | – | 20,000 |
| Long-term capital (official and banking institutions)— | ||||||
| International Monetary Fund | ... | ... | ... | ... | ... | ... |
| New Zealand Wool Commission | 1,300 | – | – | – | – | – |
| Short-term capital (Government)— | ||||||
| Government cash balances | 1,600 | – | 200 | – | – | – |
| Other | 800 | – | – | – | – | – |
| Short-term capital and monetary gold (official and banking institutions)— | ||||||
| Net overseas assets | −43,000 | – | ... | ... | ... | ... |
| Monetary gold | ... | ... | ... | ... | ... | ... |
| Other short-term capital movements, including errors and omissions | 15,200 | – | – | 138.000 | 2,300 | – |
| Multilateral transfers | ||||||
| Balance on capital account | −39,000 | −153,000 | −54,000 | |||
| Item | EEC Countries | Other Countries | International Organisations | Total, All Countries | ||||
|---|---|---|---|---|---|---|---|---|
| Increase in | Increase in | Increase in | Increase in | |||||
| Assets | Liabilities | Assets | Liabilities | Assets | Liabilities | Assets | Liabilities | |
| NZ$(thousand) | ||||||||
| Long-term capital (private)— | ||||||||
| Overseas direct investment in New Zealand | ... | 1,900 | ... | −2,300 | ... | ... | ... | 51,600 |
| New Zealand direct investment overseas | – | ... | – | ... | ... | ... | 2,800 | ... |
| Other long-term capital movements | – | −200 | – | 400 | ... | ... | −18,100 | −1,800 |
| Long-term capital (Govt.)— | ||||||||
| Government investments | – | ... | – | ... | – | ... | −11,300 | ... |
| Public debt | ... | – | ... | – | ... | 12,500 | ... | 2,400 |
| Local authority debt | ... | – | ... | – | ... | ... | ... | – |
| Other | – | – | – | – | – | – | 20,000 | |
| Long-term capital (official and banking institutions)— | ||||||||
| International Monetary Fund | ... | ... | ... | ... | ... | 50,400 | – | 50,400 |
| New Zealand Wool Commission | – | – | – | – | – | – | 1,300 | – |
| Short-term capital (Govt.)— | ||||||||
| Government cash balances | – | – | – | – | ... | ... | 1,800 | – |
| Other | – | – | – | – | – | – | 800 | – |
| Short-term capital and monetary gold (official and banking institutions)— | ||||||||
| Net overseas assets | ... | ... | ... | ... | ... | ... | −43,000 | – |
| Monetary gold | ... | ... | ... | ... | ... | ... | −200 | – |
| Other short-term capital movements, including errors and omissions | 70,700 | – | – | 4,800 | 57,700 | – | 3,500 | ... |
| Multilateral transfers | ||||||||
| Balance on capital account | 69,000 | −2,900 | −5,200 | −185,000 | ||||
The following diagram shows New Zealand's balance of payments by monetary areas for the latest five years.
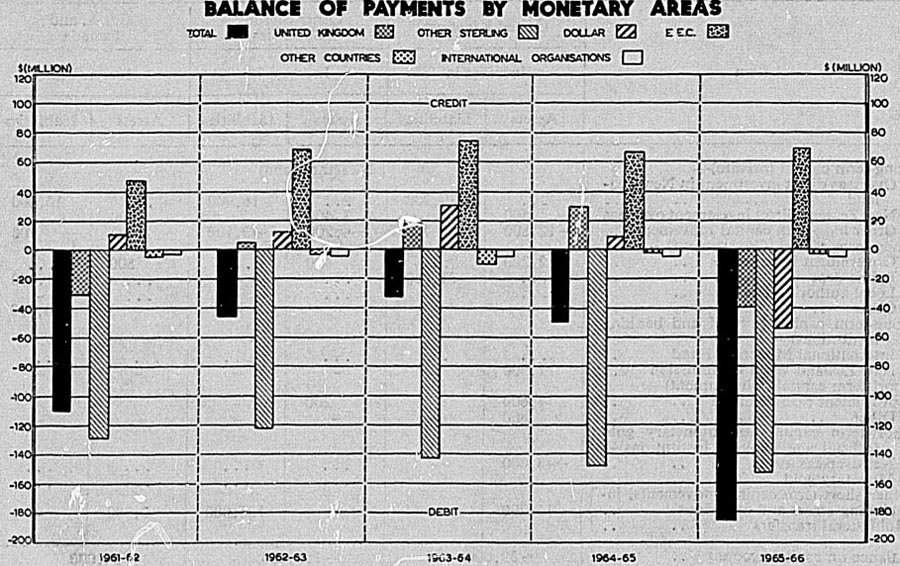
SURVEY OF COMPANIES WITH OVERSEAS AFFILIATIONS—The picture of international capital movements would be incomplete without the consideration of investment flows originating with private commercial firms. While such investment takes place in response to usual economic motivations, its effect on a country's balance of payments differs in no respect from other capital movements, such as Government lending or borrowing abroad, investment or repatriation of assets from abroad by private individuals, etc.
The type of investment referred to here is that defined as direct private investment. Subsidiaries under control of an overseas company, branches of overseas companies, companies where the majority of shareholders reside overseas, or any other companies where overseas shareholders exercise a controlling interest, fall under this category. The question of control is decided in some cases on the strength of the parent company's holdings (a 25 percent holding of the subsidiary's ordinary share capital is deemed as the qualifying minimum), in others on the actual circumstances of the case. The same criteria apply for direct investment by New Zealand companies and residents overseas.
Direct investment flows assume various forms: they may be by remittances of cash, the provision of plant, machinery, or goods without corresponding payments, charging up of services rendered by the parent company, the reinvestment in New Zealand of undistributed profits, or the partial remittance only of declared dividends and branch earnings. The inclusion of undistributed profits may require some explanation: the non-remittance abroad of the whole of the current year's earnings, or any portion of them involves, where no statutory constraints exist on remittances of current profits, a decision to invest which is in every respect equal to a decision to bring additional investment capital into the country. By treating, as already mentioned previously, total New Zealand earnings of subsidiaries and branches as a current account debit or payment to the rest of the world, the unremitted portions of such earnings are treated as an inflow of investment capital which, together with other forms of investment capital (cash, goods, services), make up the total of the private direct investment item in the capital account
The information tabulated in the following tables is based on an annual survey of companies with overseas affiliations in which the companies report on the distribution of paid-up capital and its changes, dividends and dividend remittances, intercompany accounts with the parent company or affiliated company, and head office accounts in the case of branches.
It should be noted that investment figures given in the following four tables are in terms of annual changes at current prices. The total worth of direct investment assets is extremely difficult to establish in view of the fact that book values may bear little relationship to what such investments would realise on sale; annual changes on the other hand are capable of precise expression, and define exactly their relationship to other capital movements.
Overseas Private Direct Investment in New Zealand—Data on overall private direct investment in New Zealand are shown in the following table. The figures are totals reflecting investment changes in firms resident in New Zealand and controlled from overseas irrespective of their legal organisation. They include therefore subsidiaries incorporated in New Zealand, companies incorporated in New Zealand which have a majority of shareholders resident overseas or are controlled by overseas residents, and New Zealand branches of overseas companies.
The figures shown in the country or regional area columns refer to the country of incorporation of the New Zealand firm's parent company, head office, or associate company from which the investment flow originates, or the country of residence of individual shareholders who either individually or collectively hold a major interest in the New Zealand company or who exercise de facto control.
| Year | United Kingdom | Other Sterling Countries | U.S.A. and Canada | EEC Countries | Other OEEC Countries | Other Countries | Total, All Countries |
|---|---|---|---|---|---|---|---|
| NZ$(Thousand) | |||||||
| 1950–51 | 9,940 | −310 | 1,110 | 520 | – | 11,250 | |
| 1955–56 | 26,930 | 3,080 | 1,680 | −210 | - | 31,490 | |
| 1960–61 | 20,690 | 9,280 | 2,360 | 7,100 | 1,210 | 24,250 | |
| 1961–62 | 19,830 | 6,960 | 10,160 | −10 | −770 | 36,160 | |
| 1962–63 | 31,630 | 13,310 | 10,730 | −720 | 420 | 55,380 | |
| 1963–64 | 16,800 | 10,240 | 9,650 | −750 | 2,160 | 38,110 | |
| 1964–65 | 20,570 | 9,880 | 8,380 | 2,030 | 3,380 | 44,240 | |
| 1965–66 | 20,230 | 16,870 | 14,950 | 1,880 | −2,300 | 51,630 | |
The graph now presented shows changes in the overseas direct investment in New Zealand for the latest five years.
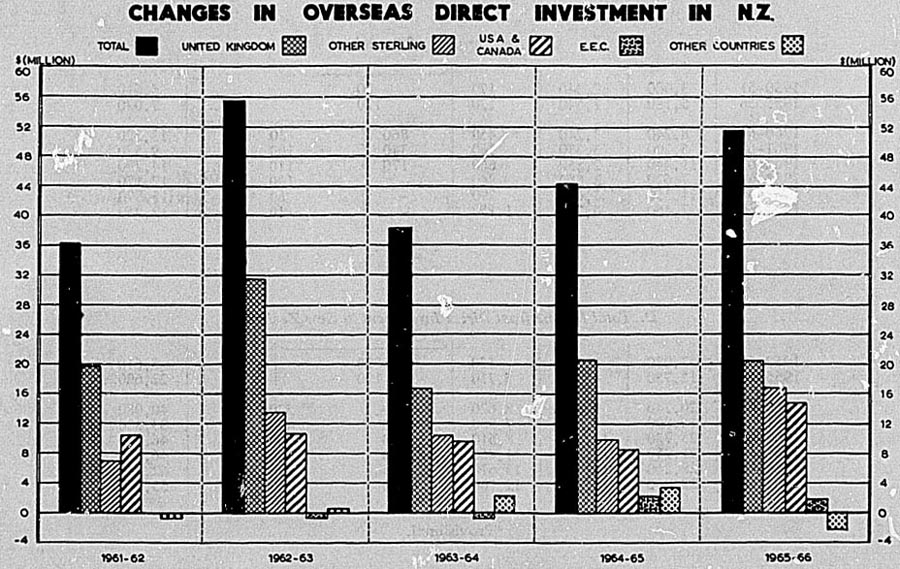
Income from Direct Investment in New Zealand—The following table provides a subdivision of total direct investment income derived by all enterprises controlled from overseas and operating in New Zealand. The investment income is given net (after payment of New Zealand taxation). The regional totals as well as the “all countries” total correspond to the “Income from Direct Investment” debits shown in the regional current accounts.
| Year | United Kingdom | Other Sterling Countries | U.S.A. and Canada | EEC Countries | Other OEEC Countries | Other Countries | Total, All Countries |
|---|---|---|---|---|---|---|---|
| *Provisional. | |||||||
| NZ$(thousand) | |||||||
| A. Dividends | |||||||
| 1950–51 | 1,200 | 870 | 1,180 | 50 | – | 3,310 | |
| 1955–56 | 1,770 | 1,030 | 3,540 | 10 | – | 6,360 | |
| 1960–61 | 4,690 | 3,110 | 5,390 | 50 | 200 | 13,440 | |
| 1961–62 | 5,750 | 3,460 | 5,550 | 60 | 160 | 14,970 | |
| 1962–63 | 6,260 | 3,890 | 5,930 | 210 | 200 | 16,490 | |
| 1963–64 | 5,520 | 5,700 | 3,960 | 130 | 260 | 15,570 | |
| 1964–65 | 4,440 | 5,180 | 8,260 | 80 | 270 | 18,230 | |
| 1965–66* | 5,900 | 4,750 | 6,730 | 120 | 980 | 18,480 | |
| B. Undistributed Profits | |||||||
| 1950–51 | 2,660 | 680 | 2,300 | 120 | – | 5,740 | |
| 1955–56 | 4,800 | 2,300 | 2,040 | 60 | – | 9,180 | |
| 1960–61 | 6,810 | 3,480 | 2,780 | −40 | 300 | 13,320 | |
| 1961–62 | 3,940 | 2,800 | 1,870 | 40 | 170 | 8,820 | |
| 1962–63 | 8,130 | 4,510 | 1,920 | −10 | 190 | 14,730 | |
| 1963–64 | 8,110 | 3,210 | 6,670 | 870 | 230 | 19,080 | |
| 1964–65 | 12,470 | 7,620 | 6,620 | 1,470 | 140 | 28,310 | |
| 1965–66 | 8,690 | 9,550 | 4,820 | 400 | 290 | 23,740 | |
| C. Net Earnings of Branches | |||||||
| 1950–51 | 3,080 | 2,340 | 170 | 20 | ... | 5,610 | |
| 1955–56 | 5,180 | 1,640 | 130 | 120 | ... | 7,070 | |
| 1960–61 | 8,740 | 3,240 | 450 | 860 | 30 | 13,320 | |
| 1961–62 | 5,200 | 3,330 | 560 | 340 | 100 | 9,530 | |
| 1962–63 | 11,340 | 2,850 | 660 | −170 | 110 | 14,790 | |
| 1963–64 | 7,620 | 3,580 | 840 | - | 130 | 12,170 | |
| 1964–65 | 11,350 | 3,670 | 790 | – | 80 | 15,890 | |
| 1965–66* | 7,460 | 4,350 | 1,150 | – | −10 | 12,950 | |
| D. Total Income from Direct Investment in New Zealand | |||||||
| 1950–51 | 3,080 | 2,340 | 170 | 20 | – | 5,610 | |
| 1955–56 | 11,750 | 4,960 | 5,710 | 190 | – | 22,620 | |
| 1960–61 | 20,240 | 9,830 | 8,620 | 870 | 530 | 40,080 | |
| 1961–62 | 14,890 | 9,590 | 7.980 | 450 | 430 | 33,330 | |
| 1962–63 | 25,730 | 11,240 | 8,510 | 30 | 500 | 46,010 | |
| 1963–64 | 21,250 | 12,490 | 11,460 | 1,000 | 620 | 46,820 | |
| 1964–65 | 28,260 | 16,460 | 15,670 | 1,550 | 490 | 62,440 | |
| 1965–66* | 22,050 | 18,650 | 12,700 | 520 | 1,260 | 55,170 | |
Industrial Classification of Overseas Private Direct Investment and Income from Direct Investment in New Zealand—The following table shows details of overseas direct investment and income from overseas direct investment classified by major industry groupings.
| Industry | 1963–64 | 1964–65 | 1965–66* |
|---|---|---|---|
| *Provisional. | |||
| NZ$(thousand) | |||
| Direct Investment | |||
| Farming, hunting, fishing | 40 | −220 | −420 |
| Forestry and logging | |||
| Mining and quarrying | −600 | 1,220 | −520 |
| Manufacturing— | |||
| Food, drink, and tobacco | 1,800 | −2,120 | −3,740 |
| Meat and dairy products | −1,500 | 5,580 | 240 |
| Textiles, clothing, and footwear | 660 | 2,260 | 970 |
| Wood, cork, and furniture production | 380 | −20 | −390 |
| Pulp, paper, and printing | 1,720 | 1,820 | 2,450 |
| Leather and rubber products | 140 | 260 | 1,170 |
| Chemical and mineral products | 3,180 | 2,860 | 4,640 |
| Metalworking | 1,680 | 880 | 2,120 |
| Engineering and transport equipment | 7,520 | 8,740 | 8,670 |
| Miscellaneous manufacturing | 2,140 | 1,680 | 2,090 |
| Building and construction | 140 | −120 | 1,100 |
| Electricity, gas. water | – | – | – |
| Wholesale and retail trade | 8,380 | 15,240 | 25,110 |
| Banking, insurance, and ownership of property | 11,840 | 4,760 | 6,150 |
| Transport and communications | −140 | 1,720 | 1,840 |
| Services | 720 | −300 | 160 |
| Totals | 38,100 | 44,240 | 51,630 |
| Income from Direct Investment | |||
| Farming, hunting, fishing | 40 | 80 | 30 |
| Forestry and logging | |||
| Mining and quarrying | 720 | 420 | 60 |
| Manufacturing— | |||
| Food, drink, and tobacco | 4,600 | 4,360 | 4,210 |
| Meat and dairy products | 1,720 | 7,720 | −2,320 |
| Textiles, clothing, and footwear | 1,180 | 1,860 | 2,050 |
| Wood, cork, and furniture production | 1,000 | 800 | 540 |
| Pulp, paper, and printing | 2,080 | 1,920 | 4,570 |
| Leather and rubber products | 1,500 | 1,160 | 1,320 |
| Chemical and mineral products | 4,840 | 4,780 | 6,800 |
| Metalworking | 1,000 | 1,400 | 2,140 |
| Engineering and transport equipment | 7,340 | 13,120 | 9,780 |
| Miscellaneous manufacturing | 1,280 | 1,400 | 1,460 |
| Building and construction | 60 | −280 | −140 |
| Electricity, gas, water | – | – | – |
| Wholesale and retail trade | 11,200 | 14,620 | 15,590 |
| Banking, insurance, and ownership of property | 7,300 | 7,380 | 7,780 |
| Transport and communications | −260 | 1,300 | 350 |
| Services | 1,220 | 400 | 950 |
| Totals | 46,820 | 62,440 | 55,170 |
Investment by New Zealand Companies Overseas—The following table presents the converse picture of those immediately preceding, viz., direct investment and income for direct investment by New Zealand companies in their overseas subsidiaries and branches.
| Year | United Kingdom | Other Sterling Countries | U.S.A. and Canada | EEC Countries | Other Countries† | Total, All Countries |
|---|---|---|---|---|---|---|
*Provisional. †Includes small amounts from companies in E.E.C. Countries. | ||||||
| NZ$(thousand) | ||||||
| Direct Investment | ||||||
| 1950–51 | −310 | 3,030 | 540 | – | −30 | 3,230 |
| 1955–56 | 1,670 | −910 | 630 | – | 110 | 1,510 |
| 1960–61 | 110 | 1,900 | 70 | – | 50 | 2,120 |
| 1961–62 | 60 | 1,020 | 410 | – | – | 1,500 |
| 1962–63 | 1,970 | 3,770 | −1,690 | – | −30 | 4,020 |
| 1963–64 | 4,330 | 710 | −1,460 | – | 150 | 3,730 |
| 1964–65 | 2,060 | −1,530 | −510 | – | −270 | −250 |
| 1965–66* | −510 | 3,370 | −130 | – | 30 | 2,760 |
| Income from Direct Investment | ||||||
| 1950–51 | 1,150 | 2,410 | 560 | – | −150 | 3,980 |
| 1955–56 | 1,190 | 2,390 | 440 | – | 50 | 4,060 |
| 1960–61 | 1,220 | 1,290 | −20 | 70 | 180 | 2,730 |
| 1961–62 | 660 | 450 | 730 | 100 | 170 | 2,110 |
| 1962–63 | 1,290 | 2,920 | 1,000 | 70 | 90 | 5,370 |
| 1963–64 | 820 | 3,110 | 130 | 170 | – | 4,230 |
| 1964–65 | −40 | 3,170 | 310 | – | 60 | 3,510 |
| 1965–66* | 1,750 | 3,380 | 210 | 160 | 10 | 5,510 |
As a background to economic policy formation, intensive studies are required of patterns and relationships in the New Zealand economy. The Department of Statistics has completed its third inter-industry study. This concerns the year 1959–60 and has been published in four parts. Commodities and services in New Zealand have been classified and then analysed into current inputs, capital and current outputs for some 110 industries. It is possible to read from an input-output table what proportion of a particular industry is derived from imports, which other industries have supplied materials or services and, finally, what contribution the particular industry has made to national income in the form of wages, profits and interest paid.
Table of Contents
GENERAL—Central Government is concerned with the future of the nation and therefore with the economic and social development of the people as a whole. In New Zealand the State is fairly broadly concerned in national development and social welfare and therefore Central Government finance is an important sector of the economy. The Central Government raises money by way of taxation and loans. It controls expenditure on capital works such as electricity supply, land settlement, housing, public buildings, forest development, railway, road, and telegraph construction, and on other functions such as social security, other social services, defence, administration, teaching, interest on the public debt and development of industry. The Public Revenues Act 1963 is the governing legislation on the administration of public money.
The extended interpretation of the role of the Central Government in the welfare State has greatly complicated the problem of presenting comprehensive accounts covering all Government activities. In New Zealand the Department of Statistics has published a consolidated review of Government transactions, described in terms of economic flows, in the publication The Accounts of the Government Sector 1959–60 to 1965–66. In this, the Government sector of the economy is divided into two broad sections—the Public Account, including dependent administrative bodies; and Government enterprises and life accounts, outside the Public Account. In turn, each of these sections is divided into three subsections. The Public Account section is subdivided into Public Account non-trading, Public Account enterprises, and dependent administrative bodies. The Government enterprises section is subdivided into life accounts (the Government Superannuation Fund, the National Provident Fund, and the Government Life Insurance Office); financial enterprises; and trading enterprises. Details of these comprehensive accounts are given in the various sections of the Yearbook dealing with the relative activity.
THE PUBLIC ACCOUNT—The present subsection of the Yearbook deals only with those accounts included within the framework of the Public Account as such. This is a single financial account held at the Reserve Bank, but the records of the Public Account in the books of the Treasury consist of a number of ledger accounts for separate funds and accounts within the Public Account. The bank balance is apportioned among these. The following funds and accounts are included in the Public Account: the Consolidated Revenue Account, Works and Trading Account, Trust Account, Loans Redemption Account, National Development Loans Account, Reserve Fund, and National Roads Fund. The Trust Account represents only lodgments or withdrawals of (mainly) non-Government money. The Loans Redemption Account is dealt with in the subsection on indebtedness.
Simplification of the Public Accounts—From 1 April 1964 a number of major changes were made in the presentation of the public accounts. These changes were:
A new account, called the Consolidated Revenue Account, was substituted for the Consolidated Fund, the Social Security Fund, and the Gas Industry Account, which were abolished.
A further new account, called the Works and Trading Account, amalgamated in one account the transactions formerly recorded in the Public Works Account, the Electric Supply Account, the Land Settlement Account, the State Coal Mines Account, and the Working Railways Account.
Further changes were the renaming of the Deposits Account as the Trust Account, and the removal of the Earthquake and War Damage Fund outside the Public Account.
The receipts and payments of the Consolidated Fund over a long period will be found in the Statistical Summary near the end of this volume.
Financial Year—The financial year commences on 1 April and ends on 31 March. The expenditure of public money is authorised by an annual Appropriation Act, which lapses at the end of the financial year. However, the Minister of Finance is authorised to pay money for services for a period of three months from the commencement of the next financial year, pending the granting of supplies by Parliament, which normally meets in June.
SUMMARY OF THE PUBLIC ACCOUNT—The figures shown under the various headings in this subsection are on the basis of receipts and payments. In some sections devoted to the operations of various Departments, the figures are given on an income and expenditure basis, and accordingly differ to some extent from those appearing here.
| Receipts | Years Ended 31 March | Expenditure | Years Ended 31 March | ||
|---|---|---|---|---|---|
| 1965 | 1966 | 1965 | 1966 | ||
| $ (million) | |||||
| Consolidated Revenue Account | |||||
| Taxation receipts— | Expenditure— | ||||
| Income tax | 362.3 | 401.2 | Social services | 500.6 | 534.2 |
| Social security income tax | 185.4 | 204.7 | Defence | 74.0 | 81.2 |
| Customs duty | 83.4 | 88.9 | Administration, etc. | 77.8 | 85.2 |
| Beer duty | 31.1 | 32.8 | Stabilisation | 34.6 | 37.2 |
| Sales tax | 76.9 | 76.6 | Maintenance of works, etc. | 35.4 | 37.8 |
| Stamp, racing, and estate duties | 41.1 | 44.4 | Development of industry | 49.4 | 55.0 |
| Other taxation | 3.0 | 3.5 | Interest and management of public debt | 88.2 | 95.4 |
| Total taxation | 783.2 | 852.2 | 860.0 | 926.0 | |
| Other receipts— | Transfer from Consolidated Revenue Account to— | ||||
| Interest | 54.0 | 59.3 | Loans Redemption Account | 29.6 | 38.0 |
| Profits from trading undertakings | 10.6 | 11.6 | National Development Loans Account | – | 4.0 |
| Departmental receipts | 55.8 | 51.3 | National Roads Fund | 2.0 | – |
| Trust Account | 3.0 | 3.0 | |||
| Total receipts | 903.7 | 974.5 | Total expenditure | 894.6 | 971.0 |
| Other Accounts Within the Public Account | |||||
| Transfers from Consolidated Revenue Account to— | Miscellaneous expenditure— | ||||
| National Roads Fund | 59.2 | 69.8 | |||
| Loans Redemption Account | 29.5 | 38.0 | 59.2 | 69.8 | |
| National Roads Fund | 2.0 | – | Works and other capital expenditure— | ||
| Trust Account | 3.0 | 3.0 | Expenditure from Works and Trading Account for— | ||
| National Development Loans Account | – | 4.0 | Housing | 15.4 | 14.6 |
| 34.5 | 45.0 | Forest development | 8.4 | 9.0 | |
| Miscellaneous receipts— | Public buildings | 12.2 | 12.6 | ||
| Highways revenue | 61.8 | 66.6 | Airport development | 4.4 | 3.0 |
| Sinking Fund contributions, etc. | 9.4 | 9.4 | University and technical institute building | 7.0 | 8.8 |
| Miscellaneous capital receipts | 8.8 | 10.4 | Railway construction | – | 0.4 |
| Excess receipts of trading accounts, etc., within the Public Account | 9.4 | -5.8 | Transfer from National Development Loans Account for— | ||
| 89.4 | 80.6 | Electric supply | 31.0 | 43.0 | |
| Receipts from borrowing— | Land settlement | 12.0 | 13.0 | ||
| In New Zealand— | State coal mines | 0.4 | 0.6 | ||
| Public and departmental | 147.2 | 150.4 | Railways | 10.0 | 4.4 |
| Post Office Savings Bank | 41.0 | 15.6 | Post Office | 8.6 | 9.2 |
| Overseas— | State Advances Corporation | 51.4 | 46.0 | ||
| United Kingdom | 4.4 | 19.4 | Other | 2.0 | 3.2 |
| United States of America | – | 23.8 | 162.8 | 167.8 | |
| IBRD Interisland transmission | 14.4 | 11.8 | IBRD Port Development Loan | 1.2 | 0.8 |
| IBRD Port Development Loan | 1.2 | 0.8 | International Finance Agreements Act 1961— | ||
| Total—Borrowing | 208.2 | 221.8 | Further subscription to IMF | – | 5.8 |
| International Finance Agreements Act 1961— | Further security in favour of IMF | – | 17.2 | ||
| Securities issued to IMF | – | 17.2 | Repayment of loans— | ||
| In New Zealand | 46.0 | 73.0 | |||
| Overseas | 3.0 | 37.8 | |||
| 49.0 | 110.8 | ||||
| Net purchase of miscellaneous investments— | |||||
| In New Zealand | -15.8 | – | |||
| Overseas | +30.0 | + 5.6 | |||
| + 14.2 | +5.6 | ||||
| Balancing items— | |||||
| Reserve Bank: Purchase (+) or sale (-) of Government securities | +53.0 | – | |||
| Increase (+) or decrease (-) in cash balances in the Public Account | + 1.8 | + 1.4 | |||
| +54.8 | + 1.4 | ||||
| Totals | 1,235.8 | 1,339.0 | Totals | 1,235.8 | 1,339.0 |
REVENUE AND EXPENDITURE—Tables are now given to show receipts and payments of the Consolidated Revenue Account.
By including the receipts of both the Consolidated Revenue Account and the National Roads Fund the following table shows the total receipts of direct and indirect taxation during the latest five years.
| Item | Years Ended 31 March | ||||
|---|---|---|---|---|---|
| 1962 | 1963 | 1964 | 1965 | 1966 | |
* Now included in Highways taxation. † Includes $1,400,000 profit on sale of silver and bronze coinage transferred from Deposits Account. ‡ Includes 5400,000 profit on sale of silver and bronze coinage transferred from Deposits Account. | |||||
| Direct taxation— | $ (million) | ||||
| Income and social security income tax | 457.0 | 432.8 | 466.5 | 547.7 | 605.9 |
| Estate and gift duty | 26.0 | 22.7 | 22.1 | 21.0 | 23.0 |
| Land tax | 4.0 | 2.3 | 2.3 | 2.6 | 3.2 |
| Total—Direct taxation | 487.0 | 457.8 | 490.9 | 571.3 | 632.1 |
| Indirect taxation— | |||||
| Customs duty | 78.8 | 72.7 | 80.3 | 83.4 | 88.9 |
| Beer duty | 30.0 | 31.2 | 31.3 | 31.1 | 32.8 |
| Sales tax | 51.1 | 52.4 | 64.2 | 76.9 | 76.6 |
| Racing duty | 9.5 | 9.5 | 10.2 | 10.6 | 11.5 |
| Stamp and other duties | 7.5 | 7.5 | 8.0 | 9.5 | 9.8 |
| Motor spirits duty | 5.0 | 5.0 | 5.4 | -* | -* |
| Highways taxation | 47.3 | 47.9 | 52.0 | 61.1 | 65.8 |
| Other taxation | 0.5 | 0.5 | 0.5 | 0.3 | 0.4 |
| Total—Indirect taxation | 229.7 | 226.7 | 252.0 | 273.0 | 285.9 |
| Total—Taxation receipts | 716.8 | 684.5 | 742.8 | 844.3 | 918.0 |
| Interest— | |||||
| On capital liability— | |||||
| Electric supply | 17.2 | 18.1 | 19.0 | 20.3 | 21.7 |
| Post Office | 6.3 | 7.7 | 8.2 | 8.8 | 9.3 |
| Other | 14.2 | 17.8 | 20.0 | 21.1 | 24.1 |
| On other public moneys | 2.9 | 3.6 | 4.0 | 3.8 | 4.3 |
| Total—Interest | 40.4 | 47.2 | 51.2 | 54.0 | 59.3 |
| Profits from trading undertakings | 11.1 | 11.9 | 12.5 | 10.6 | 11.6 |
| Departmental receipts | 43.5 | 44.5† | 49.2‡ | 56.5 | 52.0 |
| Transfer from Reserve Fund | – | – | 10.0 | – | – |
| Total—Other | 95.0 | 103.6 | 123.0 | 121.2 | 123.0 |
| Total—Receipts | 811.8 | 788.1 | 865.8 | 965.5 | 1,041.0 |
| Total taxation as percentage of national income | 31.0%x | 27.3%x | 27.1%x | 28.1%x | 28.3%x |
The following table shows expenditure from the Consolidated Revenue Account.
| Item | Years Ended 31 March | ||||
|---|---|---|---|---|---|
| 1962 | 1963 | 1964 | 1965 | 1966 | |
* Includes $3.0 million for transfer to Decimal Currency Account. * Expenditure on Airport Development now charged to Works and Trading Account. † Trading activities (departmental sawmills) now included in Works and Trading Account. ‡ University and Technical Institute buildings now charged to Works and Trading Account. | |||||
| $ (million) | |||||
| Permanent appropriations— | |||||
| Under special Acts of Legislature— | |||||
| Civil List | 0.4 | 0.5 | 0.5 | 0.6 | 0.6 |
| Debt services— | |||||
| Interest | 63.4 | 71.2 | 81.8 | 87.1 | 94.5 |
| Transfer to Loans Redemption Account— | |||||
| New Zealand Loans Act 1953— | |||||
| Section 59 | 19.3 | 10.0 | 18.0 | 23.2 | 24.7 |
| Section 57 (c) | 1.3 | 1.3 | 1.3 | 1.3 | 11.3 |
| Administration and management | 3.3 | 1.2 | 0.9 | 1.0 | 1.0 |
| Total—Debt services | 87.3 | 83.7 | 102.0 | 112.6 | 131.5 |
| Special Acts— | |||||
| Superannuation Act 1956 | 11.4 | 12.5 | 13.8 | 13.9 | 15.1 |
| Miscellaneous | 2.1 | 2.8 | 2.5 | 2.0 | 2.8 |
| Total—Special Acts | 13.6 | 15.4 | 16.3 | 15.9 | 17.9 |
| Total—Total—Permanent appropriations | 101.3 | 99.6 | 118.8 | 129.1 | 150.0 |
| Annual appropriations— | |||||
| Vote– | |||||
| Legislative | 0.6 | 0.6 | 0.6 | 0.7 | 0.8 |
| Prime Minister's Office | 0.1 | 0.1 | 0.1 | 0.1 | – |
| External Affairs | 7.4 | 7.1 | 7.6 | 8.2 | 9.6 |
| Finance— | |||||
| Audit | 0.6 | 0.6 | 0.6 | 0.6 | 0.6 |
| Customs | 1.5 | 1.6 | 1.8 | 2.0 | 2.1 |
| Inland Revenue | 4.4 | 4.7 | 5.1 | 5.6 | 5.6 |
| Stabilisation | 27.8 | 28.5 | 29.5 | 34.7 | 37.2 |
| Treasury | 1.1 | 1.3 | 1.4 | 1.5 | 4.6* |
| Total—Finance | 35.4 | 36.8 | 38.4 | 44.5 | 50.1 |
| General Administration— | |||||
| Broadcasting | – | – | – | – | – |
| Government Printing Office | 3.9 | 3.7 | 4.2 | 4.9 | 5.8 |
| Internal Affairs | 4.3 | 5.5 | 5.2 | 5.5 | 6.0 |
| Island Territories | 3.0 | 3.0 | 3.0 | 3.1 | 3.4 |
| Labour | 4.0 | 3.9 | 4.5 | 4.6 | 4.7 |
| Maori Affairs | 2.6 | 2.8 | 2.6 | 2.9 | 2.9 |
| Marine | 1.9 | 2.0 | 1.8 | 2.1 | 3.0 |
| State Advances Corporation | – | – | – | – | – |
| State Services Commission | 0.4 | 0.4 | 0.5 | 0.6 | 0.6 |
| Statistics | 0.9 | 0.9 | 0.9 | 0.9 | 1.0 |
| Valuation | 1.0 | 1.0 | 1.1 | 1.2 | 1.3 |
| Total—General Administration | 21.8 | 23.2 | 23.7 | 25.8 | 28.8 |
| Law and Order— | |||||
| Crown Law Office | 0.1 | 0.1 | 0.1 | 0.2 | 0.1 |
| Justice | 5.3 | 6.0 | 7.0 | 7.2 | 7.8 |
| Police | 7.1 | 7.7 | 8.1 | 9.3 | 9.7 |
| Total—Law and Order | 12.5 | 13.8 | 15.2 | 16.7 | 17.6 |
| Defence— | |||||
| Air | 14.3 | 18 1 | 18.6 | -73.9 | 81.2 |
| Army | 16.0 | 19.6 | 20.4 | ||
| Defence | – | – | – | ||
| Defence Construction and Maintenance | 4.2 | 4.4 | 4.8 | ||
| Navy | 9.9 | 14.1 | 14.5 | ||
| Total—Defence | 44.4 | 56.2 | 58.2 | 73.9 | 81.2 |
| Maintenance— | |||||
| Public Works and Services | 24.5 | 26.3 | 28.5 | 33.3 | 35.7 |
| Roads, etc. | 3.9 | 4.1 | 4.0 | 4.0 | 2.0 |
| Total—Maintenance | 28.4 | 30.5 | 32.6 | 37.4 | 37.7 |
| Development of Primary and Secondary Industries— | |||||
| Agriculture | 12.2 | 12.7 | 13.6 | 15.8 | 17.8 |
| Civil Aviation and Meteorological Services | 8.7 | 10.5 | 12.2 | 8.5* | 9.3* |
| Forest Service | 6.7 | 7.3 | 7.5 | 5.3† | 5.6† |
| Industries and Commerce | 1.3 | 2.1 | 2.0 | 2.2 | 2.2 |
| Lands and Survey | 4.4 | 4.0 | 3.9 | 4.4 | 4.6 |
| Mines | 0.2 | 0.2 | 0.4 | 0.7 | 1.0 |
| Scientific and Industrial Research | 4.4 | 4.8 | 5.2 | 6.1 | 7.1 |
| Tourist and Publicity | 2.8 | 3.1 | 3.3 | 3.7 | 4.2 |
| Transport | 1.7 | 2.1 | 2.3 | 2.7 | 2.9 |
| Total—Development of Primary and Secondary Industries | 42.6 | 46.6 | 50.4 | 49.5 | 54.9 |
| Social services— | |||||
| Social Security Monetary Benefits— | |||||
| Age | 49.7 | 49.0 | 49.4 | 51.0 | 51.5 |
| Invalids | 4.4 | 4.5 | 4.6 | 4.8 | 4.8 |
| Widows | 8.7 | 9.1 | 9.6 | 10.2 | 10.5 |
| Sickness | 3.4 | 3.1 | 4.5 | 3.9 | 4.1 |
| Family | 66.9 | 64.6 | 68.5 | 65.9 | 70.2 |
| Miners | 0.2 | 0.2 | 0.2 | 0.2 | 0.1 |
| Orphans | 0.1 | 0.1 | 0.1 | 0.1 | 0.1 |
| Unemployment | 0.2 | 0.3 | 0.3 | 0.2 | 0.1 |
| Universal superannuation | 46.3 | 50.2 | 54.4 | 59.3 | 62.6 |
| Education | 94.4 | 103.6 | 114.4 | 122.9‡ | 132.8‡ |
| Family benefit capitalisation | 11.5 | 10.3 | 9.1 | 8.8 | 8.6 |
| Health | 8.3 | 9.6 | 10.6 | 11.6 | 11.5 |
| Health benefits | 28.7 | 30.0 | 30.1 | 32.9 | 35.4 |
| Hospitals | 68.8 | 75.4 | 82.7 | 91.6 | 103.8 |
| Social security expenses and emergency benefits | 5.8 | 5.7 | 7.0 | 7.3 | 7.6 |
| War and other pensions | 27.5 | 28.3 | 29.7 | 29.9 | 30.5 |
| Total—Social services | 424.8 | 444.1 | 475.0 | 500.7 | 534.1 |
| Total—Annual appropriations | 617.9 | 659.0 | 701.7 | 757.4 | 814.9 |
| Item | Years Ended 31 March | ||||
|---|---|---|---|---|---|
| 1962 | 1963 | 1964 | 1965 | 1966 | |
| Unauthorised expenditure— | $ (million) | ||||
| Services not provided for | 1.2 | 0.1 | 0.3 | 3.0 | – |
| Transfer to Loans Redemption Account | 48.0 | – | – | 5.0 | 2.0 |
| Transfer to National Development Loans Account | – | – | – | – | 4.0 |
| Total expenditure | 600.6 | 581.2 | 635.9 | 894.5 | 970.9 |
NATIONAL DEVELOPMENT LOANS ACCOUNT—Since the inauguration of the National Development Loans Account in April 1942 all loan moneys raised for public works and other capital purposes are first paid into this account and then transferred to the various accounts covering the activities for which the moneys are required.
Particulars of receipts and payments of the National Development Loans Account were as follows.
| Item | 1963–64 | 1964–65 | 1965–66 |
|---|---|---|---|
* IBRD harbour projects. | |||
| Receipts $ (thousand) | |||
| Stock issued | 157,120 | 149,344 | 152,928 |
| Advance subscriptions | 600 | 1,970 | – |
| Securities issued to IMF— | |||
| Non-negotiable non-interest-bearing notes | – | – | 17,260 |
| Transfer from Consolidated Revenue Account | – | – | 4,000 |
| Totals | 157,720 | 151,314 | 174,187 |
| Payments $ (thousand) | |||
| International Finance Agreements Act: Encashment of securities in favour of I.M.F. | 4 | 8 | 4 |
| Charges and expenses on raising and repaying loans | 1,610 | 176 | 2,188 |
| Transfers to Works and Trading Account— | |||
| Public Works | 23,000 | 38,000 | 37,000 |
| Electric Supply | 30,000 | 31,000 | 43,000 |
| Land Settlement | 11,000 | 12,000 | 13,000 |
| State Coal Mines | 1,000 | 500 | 600 |
| Working Railways | 11,000 | 10,000 | 4,477 |
| Advances to— | |||
| Post Office | 9,000 | 8,500 | 9,200 |
| New Zealand Broadcasting Corporation | – | – | – |
| New Zealand Steel Ltd. | – | – | 1,182 |
| State Advances Corporation | 37,000 | 51,400 | 46,000 |
| Tourist Hotel Corporation | 870 | 1,746 | 1,058 |
| Calls on shares in New Zealand Steel Investigating Co. Ltd. | 38 | 176 | 25 |
| Acquisition of shares in Air New Zealand Ltd. | 1,622 | – | 859 |
| Loans to Harbour Boards*— | |||
| Auckland | – | 302 | 221 |
| Lyttelton | – | 318 | 192 |
| Napier | – | 38 | 20 |
| Timaru | – | 50 | 160 |
| Whangarei | 1,868 | 420 | 179 |
| Further subscription to IMF | – | – | 5,754 |
| Further security in favour of IMF | – | – | 17,260 |
| Advance subscriptions from previous year allocated | – | 600 | 1,970 |
| Totals | 128,012 | 155,232 | 184,349 |
The balance in the account at the end of each year was as follows: 1963–64, $45.2 million; 1964–65, $41.3 million; and 1965–66, $31.1 million.
WORKS AND TRADING ACCOUNT—The Works and Trading Account receipts and payments are shown in the following table.
| Item | 1963–64 | 1964–65 | 1965–66 |
|---|---|---|---|
| Receipts $ (thousand) | |||
| Airport development | – | 550 | 762 |
| Electric supply | 52,271 | 56,274 | 65,071 |
| Forest development | 4,945 | 9,275 | 10,498 |
| Housing construction | 4,177 | 2,480 | 1,723 |
| Land settlement— | |||
| Crown lands | 17,794 | 18,784 | 19,131 |
| Maori land settlement | 7,807 | 8,903 | 8,729 |
| Public buildings | 336 | 10 | 1,217 |
| State coal mines | 15,248 | 14,743 | 14,355 |
| University and technical institute buildings | – | 2 | 1 |
| Working railways | 79,804 | 86,300 | 89,292 |
| Miscellaneous | 280 | 209 | 293 |
| Sub-totals | 182,663 | 197,531 | 211,072 |
| Contributions from National Development Loans Account | 76,000 | 91,500 | 98,077 |
| Contributions from Consolidated Revenue Account— | |||
| From vote “Maori Affairs” | 60 | 100 | 90 |
| From vote “Mines” | 200 | 350 | 600 |
| Totals | 258,923 | 289,481 | 309,839 |
| Payments $ (thousand) | |||
| Annual Appropriations— | |||
| Vote— | |||
| Airport development | – | 4,419 | 3,040 |
| Electric supply | 60,475 | 63,268 | 84,348 |
| Forest development | 6,496 | 11,681 | 12,918 |
| Housing construction | 16,636 | 15,340 | 14,686 |
| Land settlement— | |||
| Crown lands | 16,410 | 18,258 | 19,393 |
| Maori land settlement | 9,639 | 11,406 | 12,087 |
| Public buildings | 9,801 | 12,162 | 12,534 |
| Railway construction | – | – | 418 |
| State coal mines | 15,407 | 15,905 | 16,004 |
| University and technical institute buildings | – | 7,047 | 8,753 |
| Working railways | 86,448 | 90,950 | 94,771 |
| Sub-totals | 221,312 | 250,436 | 278,954 |
| Subsidies to Government Superannuation Fund | 1,066 | 1,178 | 1,304 |
| Interest on capital liability paid to Consolidated Revenue Account— | |||
| Electric supply | 18,982 | 20,287 | 21,695 |
| Land settlement | 6,498 | 7,212 | 7,906 |
| Contribution to Loans Redemption Account | 22,288 | 3,097 | 3,489 |
| Land acquired other than from annual votes | 4,434 | 2,555 | 2,006 |
| Miscellaneous expenditure | 733 | 295 | 285 |
| Totals | 275,313 | 285,061 | 315,639 |
NATIONAL ROADS FUND—The National Roads Act 1953 established a National Roads Fund within the Public Account, the revenue of the Fund being derived mainly from motor taxation together with an annual contribution from the Consolidated Revenue Account. Expenditure from the Fund is for the purpose of developing State highways to modern standards and of subsidising the reading programmes of local authorities.
Receipts and payments of the National Roads Fund were as follows.
| Item | 1963–64 | 1964–65 | 1965–66 |
|---|---|---|---|
| Receipts $ (thousand) | |||
| Highways revenue | 52,014 | 61,056 | 65,804 |
| Contribution from Consolidated Revenue Account | 2,000 | 2,000 | 10 |
| Miscellaneous | 892 | 694 | 619 |
| Interest | 44 | 42 | 85 |
| Totals | 54,950 | 63,792 | 66,518 |
| Payments $ (thousand) | |||
| State Highways maintenance | 8,916 | 8,972 | 9,326 |
| State Highways construction | 21,656 | 21,648 | 29,182 |
| Local authorities' subsidised works | 22,796 | 24,218 | 26,887 |
| Administration and general expenses | 4,082 | 4,346 | 4,488 |
| Unauthorised expenditure | 4 | 6 | 5 |
| Totals | 57,454 | 59,192 | 69,888 |
The balance of this account at the end of March was: 1963, $4,136,000; 1964, $1,632,692; 1965, $6,234,030; and 1966, $2,863,660.
SUMMARY OF BALANCES—A summary of the balances in the Public Accounts is given in the following table.
| Account | Balance at 31 March | |
|---|---|---|
| 1965 | 1966 | |
* Cash received but not yet allocated. | ||
| $(000) | ||
| Consolidated Revenue Account | 16,866 | 20,387 |
| Works and Trading Account | 28,852 | 23,052 |
| Loans Redemption Account | 14,500 | 24,079 |
| National Development Loans Account | 41,278 | 31,117 |
| National Roads Fund | 6,234 | 2,864 |
| Reserve Fund | 27,760 | 28,582 |
| Suspense Account* | 650 | 106 |
| Trust Account | 21,392 | 23,634 |
| Totals | 157,530 | 153,820 |
The composition of the total balances is shown in the following table.
| Nature | At 31 March | |
|---|---|---|
| 1965 | 1966 | |
| $(000) | ||
| Cash | 41,758 | 43,060 |
| Imprests | 5,986 | 6,588 |
| Investments in New Zealand | 42,682 | 42,684 |
| Investments overseas | 67,104 | 61,488 |
| Totals | 157,530 | 153,820 |
TOTAL TAXATION—A summary of taxation revenue during the last 11 March years is given in the following table. In addition to total taxation the amounts received from direct taxes on income are also shown.
| Year Ended 31 March | Direct Taxes on Income (i.e., Income Tax and Social Security Taxation on Income) | Total Taxation | |||
|---|---|---|---|---|---|
| Amount | Percentage of Total Taxation (All Sources) | Amount | |||
| Total | Per Head of Mean Population | Total | Per Head of Mean Population | ||
* Excludes $1,866,000 in 1958–59, $4,652,000 in 1959–60, $1,986,000 in 1960–61, $798,000 in 1961–62, $774,000 in 1962–63, and $792,000 in 1963–64 of duty on motor spirits refunded under the Transport Act; this comprises refunds to persons entitled to exemption from the additional payment of Customs duty from 27 June 1958. | |||||
| $ (million) | $ | $ (million) | $ | ||
| 1956 | 301.2 | 140.10 | 61.5 | 489.7 | 227.70 |
| 1957 | 319.5 | 145.60 | 63.2 | 505.7 | 230.50 |
| 1958 | 288.1 | 128.30 | 58.8 | 489.8 | 218.10 |
| 1959 | 380.0 | 165.30 | 62.1 | 610.4* | 265.60 |
| 1960 | 351.8 | 150.00 | 59.2 | 594.6* | 253.50 |
| 1961 | 413.8 | 173.30 | 61.9 | 668.9* | 280.10 |
| 1962 | 457.0 | 187.10 | 63.8 | 716.4* | 293.30 |
| 1963 | 432.8 | 172.90 | 63.3 | 684.0* | 273.30 |
| 1964 | 466.5 | 182.40 | 62.8 | 742.3* | 290.30 |
| 1965 | 547.7 | 209.80 | 64.8 | 844.5 | 323.40 |
| 1966 | 606.0 | 227.80 | 66.0 | 918.2 | 345.20 |
The following table shows receipts, under the various heads, of taxation during the latest five years.
| Head | Revenue for Year Ended 31 March | ||||
|---|---|---|---|---|---|
| 1962 | 1963 | 1964 | 1965 | 1966 | |
* Excludes $798,000 in 1961–62, $774,000 in 1962–63, and $792,000 in 1963–64 of duty on motor spirits refunded under the Transport Act; this comprises refunds to persons entitled to exemption from the additional payment of Customs duty from 27 June 1958. † Excludes motor spirit duty now included in National Roads Fund. ‡ Included in National Roads Fund. | |||||
| $(million) | |||||
| Consolidated Revenue Account— | |||||
| Customs revenue | 82.9* | 77.0* | 85.0* | 83.4† | 88.9† |
| Beer duty | 30.0 | 31.2 | 31.3 | 31.1 | 32.8 |
| Milage tax | 0.1 | 0.1 | 0.2 | ‡ | ‡ |
| Land tax | 4.0 | 2.3 | 2.3 | 2.6 | 3.2 |
| Income tax (ordinary) | 296.3 | 268.1 | 288.7 | 362.3 | 401.2 |
| Sales tax | 51.1 | 52.3 | 64.2 | 76.9 | 76.6 |
| Estate and gift duties | 26.0 | 22.7 | 22.1 | 21.0 | 23.0 |
| Racing taxation | 9.5 | 9.5 | 10.2 | 10.6 | 11.5 |
| Duty on instruments | 4.7 | 4.1 | 5.1 | 6.6 | 7.1 |
| Amusement tax | 1.1 | 1.0 | 0.5 | 0.4 | 0.1 |
| Other taxation | 2.2 | 2.7 | 2.6 | 2.8 | 2.8 |
| Film-hire tax | 0.4 | 0.3 | 0.3 | 0.3 | 0.4 |
| Social security income tax | 160.8 | 164.7 | 177.8 | 185.4 | 204.7 |
| National Roads Fund— | |||||
| Highways revenue (less rebates) | 47.3 | 47.9 | 52.0 | 61.1 | 65.8 |
| Totals | 716.4* | 684.0* | 742.3* | 844.5 | 918.2 |
| Taxation receipts per head of mean population | $ 293.30 | $ 273.30 | $ 290.30 | $ 323.40 | $ 345.20 |
The sources of revenue are shown in the following diagrams.
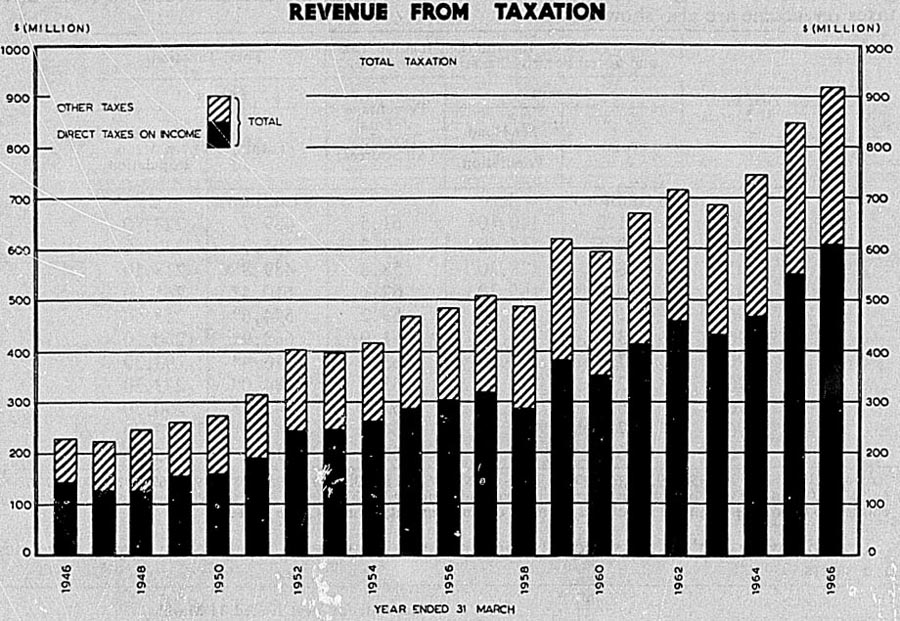
REVENUE FROM TAXATION
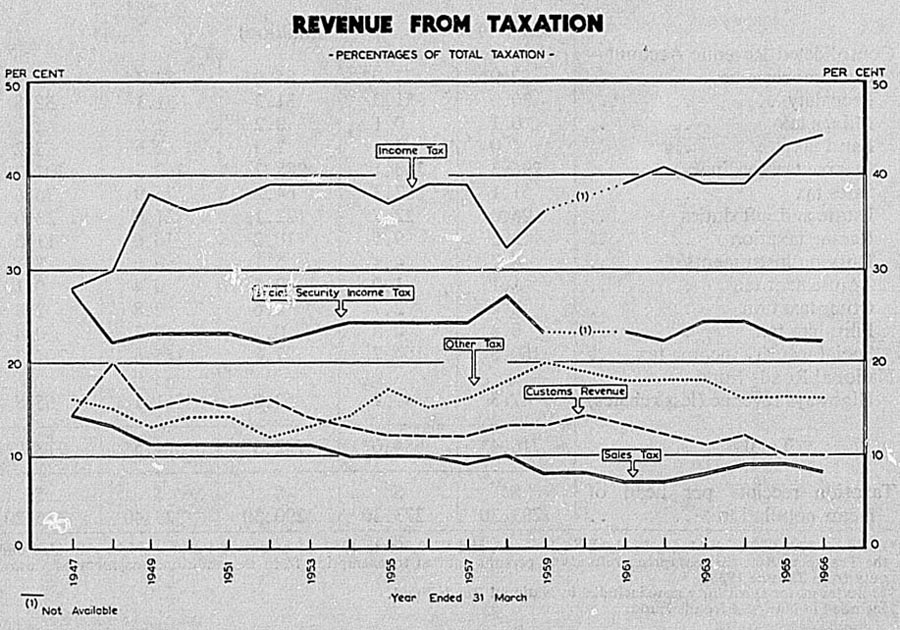
REVENUE FROM TAXATION
A comparison of taxation revenue and total private income and national income is afforded by the following table, which also shows taxation as a percentage of private income and national income.
| Year | Total Private Income | National Income at Factor Cost | Taxation Revenue | ||
|---|---|---|---|---|---|
| Total | As a Percentage of— | ||||
| Private Income | National Income | ||||
* Provisional. | |||||
| $(million) | percent | ||||
| 1955–56 | 1,793.7 | 1,687.6 | 489.7 | 27.3 | 29.0 |
| 1956–57 | 1,891.3 | 1,773.4 | 505.7 | 26.7 | 28.5 |
| 1957–58 | 1,997.0 | 1,870.3 | 489.8 | 24.5 | 26.2 |
| 1958–59 | 2,065.4 | 1,923.2 | 610.4 | 29.6 | 31.7 |
| 1959–60 | 2,250.3 | 2,075.1 | 594.6 | 26.4 | 28.7 |
| 1960–61 | 2,428.6 | 2,242.5 | 668.9 | 27.5 | 29.8 |
| 1961–62 | 2,502.2 | 2,314.0 | 716.4 | 28.6 | 31.0 |
| 1962–63 | 2,695.4 | 2,505.6 | 684.0 | 25.4 | 27.3 |
| 1963–64 | 2,938.8 | 2,744.6 | 742.3 | 25.3x | 27.0 |
| 1964–65 | 3,190.1 | 2,998.4 | 844.5 | 26.5 | 28.2 |
| 1965–66 | 3,440.1* | 3,242.6* | 918.2 | 26.7* | 28.3* |
CUSTOMS AND EXCISE TAXATION—Revenue included under the heading of Customs is exclusive of receipts from tyre tax and from motor spirits tax. Sales tax receipts are not counted as ordinary Customs revenue, although collected by the Customs Department. The following figures show Customs and excise revenue, for ordinary revenue purposes, for the latest five years.
| Year Ended 31 March | Customs Duties* | Beer Duty | Total Customs and Excise Duties | Proportion of Total Taxation |
|---|---|---|---|---|
* Excise duties other than beer duty are here included with Customs duties, and exclude motor spirit duty from 1965. | ||||
| $(thousand) | percent | |||
| 1962 | 82,941 | 30,036 | 112,977 | 15.8 |
| 1963 | 76,990 | 31,176 | 108,166 | 15.8 |
| 1964 | 84,951 | 31,260 | 116,211 | 15.7 |
| 1965 | 83,405 | 31,088 | 114,493 | 13.6 |
| 1966 | 88,875 | 32,828 | 121,703 | 13.3 |
Information in regard to Customs and excise duties generally is contained in Section 22D—Customs Tariff and Revenue.
ROADS TAXATION—The National Roads Fund derives its revenues from a tax on motor spirits (at present 16c per gallon for this purpose), registration and licence fees of motor vehicles, heavy traffic licence fees, a milage tax on vehicles not using motor spirits, and a tax on imported tyres (details of the origin of these are also given in earlier Yearbooks). In terms of section 3 of the National Roads Amendment Act 1965, tyre tax formerly credited to the Fund, reverted to the Consolidated Revenue Account. Other revenues of the Fund, which are not classed as taxation, consist of a Government contribution, interest earned, and miscellaneous receipts—e.g., from the sale of materials, etc.
Taxation receipts for roads purposes have been as follows during the latest five years.
| Year Ended 31 March | Registration and Licence Fees, etc., Under Transport Act 1962* | Tyre Tax | Motor Spirits Taxation | Milage Tax | Heavy Traffic Fees | Total |
|---|---|---|---|---|---|---|
* Diverted to Consolidated Revenue Account from 1 July 1967. | ||||||
| $(thousand) | ||||||
| 1962 | 5,518 | 42 | 34,788 | 1,156 | 5,800 | 47,304 |
| 1963 | 5,874 | 52 | 34,728 | 1,320 | 5,940 | 47,916 |
| 1964 | 6,162 | 72 | 37,810 | 1,564 | 6,404 | 52,014 |
| 1965 | 6,956 | 74 | 45,489 | 1,910 | 6,627 | 61,056 |
| 1966 | 7,322 | - | 48,651 | 2,605 | 7,225 | 65,804 |
Although it does not affect the table until the 1964–65 year it should be noted that from 27 June 1958 an additional 10c a gallon tax (reduced to 7c a gallon on 4 November 1959, to 3c a gallon on 22 December 1959, and to 2c a gallon on 22 July 1960) was imposed on motor spirits, and this was credited not to the National Roads Fund but to the Consolidated Revenue account for general revenue purposes. From 1 April 1964 the remaining 2c a gallon has been credited to the National Roads Fund. On 4 May 1967 the tax was increased by 3.3c a gallon for general revenue purposes.
INCOME TAX—Income tax is levied under the Land and Income Tax Act 1954, the Income Tax Assessment Act 1957, and amendments.
Income tax is divided into ordinary income tax and social security income tax. Social security income tax is payable by both individuals and companies. It is assessed at the rate of 1c in every 13 1/3 cents. The rates of ordinary income tax are given later in this Section.
Exemptions—Certain specified incomes and types of income are exempt from income tax. The incomes of local and public authorities (excepting for certain Government trading departments), building societies, co-operative dairy and milk treatment companies, trustees of superannuation funds, friendly societies, charitable societies, and others of similar character are exempt from income tax. The general principle is where any society or association carries on business exclusively for the purposes for which it was established and does not operate for the private pecuniary profit of any individual, the income is exempt from income tax. Monetary benefits from the Social Security Fund (excepting the universal superannuation benefit), sick benefits from friendly societies, workers' compensation payments, war pensions, etc., and for individuals the first $60 of income from interest are exempt from income tax.
Deduction of Expenditure from Total Income—Any expenditure or loss exclusively incurred in the production of the assessable income may be deducted from the total income derived. Depreciation is allowed.
There are some special incentive measures. Taxpayers may claim a special deduction of one and a half times the amount of expenditure on export market development or tourist promotion.
Interest on convertible notes offered by a company after 8 September 1960 is not allowed as a deduction from the company's assessable income and is treated as a dividend in the hands of the holder, but since 28 June 1962 interest may be deducted up to the date of conversion (but not for longer than five years) in the case of a New Zealand company listed on the stock exchange.
Depreciation Allowances—On buildings the allowable depreciation rates vary from 2 1/2 percent of cost price for wooden-walled and framed buildings to 1 percent of cost price for buildings of reinforced concrete. There are higher rates for buildings used as cool stores, chemical works, glasshouses, etc. Various rates of depreciation allowances have been fixed by the Commissioner of Inland Revenue for different classes of plant, machinery, and equipment. These are normally expressed as percentages of the diminishing value of the asset.
There are special depreciation allowances for plant and machinery, motorcars excepted. These are in addition to ordinary depreciation allowances and the total allowance of 20 percent is, where the cost of the asset is over $4,000, spread over a period of five years. In the case of assets acquired after 1 April 1962, the special depreciation may, at the taxpayer's option, be spread over a period of five years or four years, the rates being respectively 6 percent, 5 percent, 4 percent, 3 percent, 2 percent, or 10 percent, 5 percent, 3 percent, 2 percent. Farming taxpayers may claim, in addition to ordinary depreciation, but as an alternative to initial depreciation, special depreciation on new farm buildings other than residences.
Initial Depreciation on Buildings Erected or Acquired for the Accommodation of Employees—An allowance at the rate of 20 percent of the cost is given in one sum in the year in which the building is first used. This allowance is additional to the ordinary depreciation allowance.
Farming taxpayers may also claim the initial depreciation allowance on farm buildings (other than homesteads), e.g., fodder sheds, roofing over stockyards, etc. The allowance in this case is alternative to the special depreciation allowance, but once again additional to the ordinary depreciation.
Taxation of Companies:Rates—The rates of ordinary income tax in 1966 were as follows.
Resident Companies and Public Authorities—The rate of ordinary income tax for every $1 of taxable income in the case of companies and public authorities is (1) where the taxable income does not exceed $7,200, 12 1/2c increased by 1/48,000 of $1 for every $1 of taxable income; (2) where the taxable income exceeds $7,200, tax on the first $7,200 is calculated as given above, and there is a flat rate tax of 42 1/2c for every $1 of income in excess of $7,200. Social security income tax at 1c in every 13 1/3 cents is additional to these rates.
Non-resident Companies—(1) Where the taxable income does not exceed $7,200, the rate of ordinary income tax for every $1 of taxable income is 17 1/2c increased by 1/48,000 of $1 for every $1 of taxable income; (2) where the taxable income exceeds $7,200, tax on the first $7,200 is calculated as in (1) above and tax on the excess is charged at a flat rate of 47 1/2c in the $1. Social security income tax at 1c in every 13 1/3 cents is additional to these rates of ordinary income tax.
Excess Retention Tax—A new feature in New Zealand income tax law was introduced by the 1958 Land and Income Tax Amendment Act. This was the taxation of company dividends in the hands of individual (but not company) shareholders, and the imposition of an excess retention tax on companies which applies if the amount of dividends is less than 40 percent of the income after taxation. The basic rate of excess retention tax is 35c per $1 of the insufficient distribution of income.
Excess retention tax was abolished in 1961, except for companies of the privately controlled type, that is, companies in which the public is not substantially interested and where the company is under the control of not more than four persons. A subsidiary of a public company is not classed as a privately controlled company.
Excess retention tax is not payable if the Commissioner is satisfied that the income retained is required for essential development of buildings, plant, or machinery. Companies are given three years in which to expend or definitely commit such retained income.
Bonus Issue Tax—This was introduced in 1965. Bonus share issues made on or after 11 June 1965 are generally subject to a flat rate tax of 17 1/2c in the dollar, which is payable by the company making the bonus share issue. Bonus issues arising from capitalisations of capital profits, share premium reserves, and the writing up of capital assets are exempt.
All companies which are, or are deemed to be, resident in New Zealand are liable for the bonus issue tax on bonus share issues they make. The sole exception is a petroleum mining company.
Non-resident Investment Companies—The 1959 Land and Income Tax Amendment Act limits the income tax payable by a non-resident investment company on income from investments or assets which are used wholly or principally for developing New Zealand.
Unit Trusts—Unit trusts are treated as companies, and income and other payments to unit holders are treated as dividends.
Livestock Values—A farmer's livestock is treated as trading stock. Apart from the usual valuation options for trading stock used in a business, farmers are permitted to use a “standard value” for each class of livestock thus reducing in some degree fluctuations in income which might occur if market prices or other valuations were used. The standard value system is universally used except for high-value stud stock. The value adopted for any particular class of animal is usually somewhat below actual cost and also usually below sale value. If a farmer disposes of all or a substantial part of his livestock the result may be that his income for the year is unduly high. The tax law provides special measures designed to alleviate the tax burden if that happens in the following circumstances (1) Death of the farmer, (2) Retirement from farming, (3) Expiry of a lease or acquisition of the farm land by the Crown, (4) Forced sale of livestock due to an adverse event (e.g., fire, flood, drought, disease among livestock, etc.).
The term “adverse event” means any happening which is declared by the Minister of Finance to be an adverse event.
Penalty—The penalty for tax remaining unpaid after due date is 10 percent, subject to a remission of one half of the additional tax if paid within three months after due date.
Board of Review—The Inland Revenue Department Act provides for the establishment of one or more Boards of Review. There is at present only one such board. Members of a board are appointed by the Governor-General and consist of a chairman who is a barrister or solicitor of the Supreme Court of not less than seven years' practice, and two other members. The functions of a board are to sit as a judicial authority for hearing and determining such objections to assessments of tax or duty or the decisions or determinations of the Commissioner as are authorised by the Inland Revenue Acts. A determination of a board is final as to any question of fact, but subject to appeal to the Supreme Court on any question of law. However, questions of fact may be referred direct to the Supreme Court if both parties consent or if the Court considers it desirable that the objection be determined by it.
Taxation of Individuals:Rates—The basic rates of ordinary income tax are as follows: On so much of the taxable income as does not exceed $1,000, the rate of tax per $1 is 15c. For each succeeding $200 or part thereof the rate of tax increases by 2 1/2c until the taxable income reaches $1.800. From this point the rate of tax increases by 1 1/4c in the dollar for each additional $200 (or part thereof) of taxable income. The maximum rate of 60c in the dollar applies where the taxable income exceeds $7,200. The effective rate of tax for any income is ascertained by calculating tax on that income in accordance with the above rates and dividing the tax so calculated by the number of dollars included in that income.
For the income year commencing 1 April 1966 there was a rebate of 10 percent of the amount of ordinary income tax with a maximum of $200.
Social security income tax at 1c in every 13 1/3 cents is additional to these rates, and the special exemptions do not apply to social security income tax with the exception of, since 1960, a special exemption of $208 from income liable to social security income tax.
Dividends—Dividends received by individual shareholders are included as part of their assessable income. After deduction of any exemptions to which the taxpayer is entitled, he pays ordinary income tax at normal rates on the total taxable income. The dividend income is not liable for social security income tax, and ordinary income tax on the dividends is limited to an average rate of 35c per $1. Dividends in cash are exempted if made from capital profits in addition, where capital assets (excluding goodwill) are written up, dividends by way of bonus shares or credits against unpaid capital may be exempted.
Taxable Income—In the case of individuals, ordinary income tax is assessed on the taxable income. This comprises the total income less (a) any income exempted from ordinary income tax, (b) any income classified as non-assessable income, (c) the amount of the special exemptions.
A summary of the changes in the principal special exemptions and in the rates of ordinary income tax for the last 11 years is given in the following table. The tax on 1957–58 incomes was remitted in full.
| Income Year Ended 31 March | Special Exemptions | Ordinary Income Tax | ||||||
|---|---|---|---|---|---|---|---|---|
| Personal | Wife | Child | Gifts (Maximum) | Insurance (Maximum) | Basic Rates Employed | Rebates | ||
| Rate | Maximum | |||||||
| $ | $ | $ | $ | $ | $ | |||
| 1956 | 750 | 250 | 150 | - | 350 | 1,954 | 10% | 80 |
| 1957 | 750 | 250 | 150 | - | 350 | 1,954 | $200 | 200 |
| 1958 | - | - | - | - | - | - | - | - |
| 1959 | 676 | 324 | 150 | - | 350 | 1,954 | 12 1/2% | 74 |
| 1960 | 600 | 400 | 150 | - | 350 | 1,954 | 10% | 60 |
| 1961 | 936 | 312 | 156 | - | 500 | 1,961 | - | - |
| 1962 | 936 | 312 | 156 | - | 500 | 1,961 | - | - |
| 1963 | 936 | 312 | 156 | 50 | 500 | 1,961 | 5% | 100 |
| 1964 | 936 | 312 | 156 | 100 | 500 | 1,961 | 7 1/2% | 150 |
| 1965 | 936 | 312 | 156 | 100 | 500 | 1,961 | 10% | 200 |
| 1966 | 936 | 312 | 156 | 100 | 500 | 1,961 | 10% | 200 |
The following points should be noted.
Basic Rates—The 1954 rates were 15c in the dollar on the first $200 of taxable income plus 2 1/2c in the dollar for each additional $200 of taxable income. The maximum rate was 60c in the dollar. The current rates have been given earlier.
Insurance—In 1959 and 1960 the maximum was $500 where contributions to superannuation funds for self-employed were included. For 1964 and 1965 the maximum was $650 for persons who were not members of employer-insured and superannuation funds.
Persons Over 65 Years—There was an additional personal exemption of $90 from 1954 up to and including 1960.
Amendments to Legislation During 1966—Amendments during 1966 included:
Special Exemption for Life Insurance Premiums and Superannuation Contributions—The field of exemption was extended to include premiums paid by a taxpayer in respect of policies on the life of his (or her) spouse and children. The limitation which restricted the exemption to 20 percent of the taxpayer's assessable income was removed.
Dependants—The allowable income limit for a dependent relative for the purpose of dependancy in a tax code has been increased to $650.
Increased Livestock Incentive Scheme—This is an incentive aimed at maintaining and accelerating the growth of livestock numbers. The incentive applies to sheep, cattle, and pigs in a farming business. The scheme is optional and provides for the establishment of base livestock numbers. The whole or any part of subsequent increases over the established base may be accounted for at a nil value. Because there may be changes in the type of livestock carried from year to year a system of equivalents has been provided, namely, one head of cattle equals six sheep, one head of cattle equals four pigs, three sheep equal two pigs. The equivalents fixed are not based on standard or market values but on food intake.
Fertiliser and Lime Deduction—Farmers who have incurred expenditure on fertiliser and lime in one year may now elect from year to year how much of the expenditure they will claim for the four subsequent years.
Farm Development Expenditure—The qualifying period in which farm development expenditure incurred may be deducted has been extended to 31 March 1968. The provisions relating to farm development expenditure have been extended to cover the cost of constructing feeding platforms, feeding yards, plunge sheep dips, and self-feed ensilage pits. Similar provisions to that of fertiliser and lime are made regarding the spreading forward of expenditure the period being five years.
Donations for Research—The scope of allowable deductions to companies was extended to cover donations to the Medical Research Council or any research body recommended by either the Medical Research Council or the National Research Advisory Council and approved by the Minister of Finance.
Voluntary Pensions—A new section was introduced which specifically allows a deduction for voluntary pensions paid to former employees or their dependants in consideration of past services in the business. Special requirements are set out in the case of pensions paid in respect of company directors.
Increased Export Sales—Important changes were made regarding the deduction for increased exports. The definition of base period for the years 1967 and 1968 has been changed to the first three of the five years preceding the year in which a claim for the deduction is made. In addition, the existing formula for calculating the deduction has been altered to 15 percent of the increase in export sales. This amendment also applies to the years ending 31 March 1967 and 1968. It has the effect of allowing a deduction in a year in which a loss has been incurred. A transitional provision is made whereby any taxpayer may elect to take advantage of the existing provisions where they provide a greater tax benefit. The transitional stage applied only to the year ended 31 March 1967.
Farm Income Equalisation—Substantial amendments have been made to this scheme. Deposits may be made subsequently in respect of an accounting year for which there has been a refund from the scheme. The Commissioner is also given discretionary power to extend the specified period for relating refunds from the scheme to a particular year.
Pay As You Earn Income Tax—Payment of income tax on a “pay as you earn” basis came into operation on 1 April 1958 under the Income Tax Assessment Act 1957. It applies to salary and wage earners, to self employed individuals, to other incomes of individuals and to estates. It does not apply to companies, unless incorporated after 25 July 1957, or unless the company voluntarily elects to come within the provisions of the Act.
The main features of the scheme, as subsequently amended, are:
Income tax and social security income tax became one combined tax on income.
The combined tax on salary and wages is deducted by the employer. In the main, taxpayers whose income consists solely of salary and wages are required to furnish a return of income only where their income during the year exceeds $2,600. However, they may furnish a return if they wish to have an adjustment made. In such cases the taxpayer is assessed on the basis of the annual return and receives a refund where tax assessed is less than the tax deducted by the employer.
All other individuals (including self employed), estates, and companies within the scheme, pay provisional tax in two instalments on a provisional declaration of the then current year's income. The actual income of the previous year is commonly used as a basis for computing the provisional tax. Farmers in some circumstances may pay in three instalments. There is a final adjustment at the end of the year when the return of income is furnished.
Tax Code Declarations—Employees are required to deliver a tax code declaration to the employer each year before 1 April. The tax code declaration specifies whether or not the taxpayer has a dependent wife, and the number of other dependants.
There is no obligation on the employer to check the accuracy of the tax code declaration. Except for cases where the employee ends and commences employment during the week, the employee must not have more than one tax code declaration current during the pay period. There is, however, provision for secondary tax code declarations where the employee has two or more employers at the same time.
If the employee does not wish to deliver the tax code declaration to the employer, he may deliver it to the Commissioner. The Commissioner may, on application by the employee, issue to the employer a tax code certificate which specifies the employee's tax code as determined on the basis that some or all of the employee's dependants are omitted. In such cases the Commissioner will make an appropriate tax adjustment at the end of the year. There are other circumstances such as, for example, where the employer is not the principal employer, where the Commissioner may issue a tax code certificate specifying the tax code or tax deduction rate applicable to the employee.
At the end of the year the employer completes the tax code declaration by entering the amount of wages and salary paid and the amount of tax deductions made, hands one copy to the employee, and sends the other copies to the Commissioner.
Alteration of Tax Code Declaration During Year—When the employee changes employment during the year, he must deliver a declaration to the new employer. If the declaration is delivered before the end of the first pay period, it applies from and including the first pay.
Employees who become entitled to claim allowances for new dependants during the year may deliver a new tax code declaration immediately the event occurs (e.g., marriage or the birth of a child). The new tax code applies to the pay period commencing after the pay period in which the declaration was delivered.
When it becomes apparent that a dependent wife's income will exceed $312 for the year, the employee must deliver a new tax code declaration immediately and the new code applies to the pay period following that in which it was delivered.
In other cases where a dependant ceases to be a dependant during the year—i.e., where a dependent wife dies or a child dies or reaches the age of 18 years—the employee is entitled to retain the tax code including them as dependants until the following 31 March. This applies even when the employee delivers a new tax code declaration on a change of employment.
A housekeeper exemption may be claimed when the taxpayer is a widow, widower, divorced or separated person, or an unmarried person who employs a housekeeper to care for a child under the age of 18 years, or any child who by reason of mental or physical infirmity is unable to earn his own living. It may also be claimed when a housekeeper is employed to look after the taxpayer's home because of the mental or physical infirmity to the taxpayer or his spouse. The amount of the exemption is $312 or the amount of wages (including keep) paid to the housekeeper. When the housekeeper is employed for part of the year the allowable exemption is scaled down by one 1/12th for every complete month during which no housekeeper was employed.
Tax Deduction Tables: Principal Tables—The tax code declaration bears a code (M, if the taxpayer is entitled to a wife's exemption; S if not so entitled; and a number which represents the number of other dependants) and the tax deduction tables specify for each code and number the amount of tax to be deducted from the salary or wage payment for the period.
The following principles have been observed in the calculation of the amounts of tax shown in the deduction tables which came into force on 1 October 1963.
That part of the weekly income which corresponds to the amount of the ordinary income tax exemption allowances is taxed at the rate for social security income tax (1c in every 13 1/3 cents). The first $4 of weekly income are also exempt from social security income tax. The annual exemptions (personal, wife, dependants) to which the taxpayer is entitled have been converted into proportionate weekly parts.
The residue of the weekly income attracts both ordinary income tax and social security income tax. The tax deduction tables are based on proportionate weekly parts of the annual income tax at basic rates.
Amounts paid by an employee to a superannuation fund are deducted from the gross salary for the period. The amount of the tax deduction is then the table deduction appropriate to the net payment to the employee, plus the social security income tax on the amount of the superannuation contribution.
When there is no tax code declaration or tax code certificate, the tax deduction is at the “no declaration” rate shown in the tables. This deduction is at the flat rate of 28c in the dollar.
Special Tables—Special tables are provided for shearers and for casual agricultural employees. These are tables of deductions from daily earnings. There is also a table of deductions at a flat rate of 21c in the $1. This applies to payments of extra emoluments and to secondary employment unless a special tax code is issued by the Commissioner.
Extra emoluments, e.g., end of year bonuses and retrospective wage increases, are treated as separate payments. Secondary employment exists where the taxpayer has two or more employers at the same time. The secondary employer deducts tax according to the flat rate table, while the principal employer uses the normal table.
Employer's Duties—The employer is required to keep a record for each employee showing the amount of the source deduction payment and the amount of tax deducted. Not later than 20 April each year he must deliver to each employee a signed certificate showing the total amounts of payments and tax deductions for the year (or period of employment if less than one year). A similar certificate must be given to the employee within seven days from the cessation of employment.
The aggregate amount of all tax deductions is to be remitted to the Commissioner each month. Not later than 15 May each year the employer must deliver to the Commissioner a reconciliation statement showing the total amount of tax deductions paid to the Commissioner in respect of deductions made during the year, and the total amount of tax deductions shown in the employee's certificates, together with an explanation if the two totals do not agree. The reconciliation statement is accompanied by signed copies of all tax deduction certificates and all tax code declarations.
Withholding Payments—These are payments made for services rendered, but in circumstances where there is no real employer-employee relationship. Instances are company director's fees, agricultural contract work, fees for free-lance journalists, etc. Tax is deducted from the gross amounts of such payments at flat rates which vary from 7 1/2c to 25c in the dollar according to the nature of the work. The Commissioner may determine from time to time that a proportion of the withholding payment to specified classes is to be regarded as expenditure incurred in the production of the income. In such cases, tax is deducted from the balance of the payment. An exemption certificate may be issued by the Commissioner to any person specifying that no tax deduction is to be made from payments to that person. The income so exempted will later be included in the recipient's annual return of income.
Provisional Taxpayers—Provisional taxpayers are those who derive any assessable income which is not subject to tax at source. However, the first $60 of interest is exempted from income tax, and is therefore not assessable income. Estates, trusts, and companies incorporated after 25 July 1957 are also provisional taxpayers. Companies existing at that date may voluntarily elect to become provisional taxpayers.
Tax on provisional incomes is payable in two instalments during the year—on 7 August and on 7 February. Normally the provisional income is an amount equal to the taxpayer's income for the preceding year. When the taxpayer anticipates that the income will be less than that of the preceding year, he may make an estimate of the provisional income and pay provisional tax on the estimated income. The taxpayer may estimate or re-estimate his provisional income at any time before one month after the due date for payment of any provisional tax instalment. If he does this and his estimate of his provisional income is less than the normal provisional income (actual income of the previous year) and less than 80 percent of his actual income for the year he may be liable to a penalty of 10 percent on the amount of provisional tax underpaid.
Employees who derive in addition to their income from employment, interest, dividends, or rents not exceeding $100 in the aggregate are not required to pay provisional tax on this income which has not been taxed at source.
Provisional taxpayers are required to furnish returns of income, irrespective of the amount of income. The Commissioner makes an assessment of tax, and any difference between that assessment and the amounts of tax deducted at source or paid as provisional tax is payable by the taxpayer or credited or refunded to him.
Statistics relating to the incidence of income tax are given in Section 28 of this volume.
PAYE Tax Deductions—The tax rates for the purposes of PAYE tax deductions at source are actually the amounts shown in the tax deduction tables. These deductions are fixed according to the current amount of exemptions and tax rates. Some examples of these tax deductions are given for selected weekly incomes in the table which follows: social security income tax and ordinary income tax are combined to form one deduction.
| Weekly Earnings | Not Entitled to Wife's Exemption | Entitled to Wife's Exemption | Entitled to Exemption for Wife and for— | ||
|---|---|---|---|---|---|
| One Child | Two Children | Three Children | |||
| Operative from 1 October 1963 | |||||
| $ | $ | $ | $ | $ | $ |
| 10 | 0.45 | 0.45 | 0.45 | 0.45 | 0.45 |
| 12 | 0.60 | 0.60 | 0.60 | 0.60 | 0.60 |
| 14 | 0.75 | 0.75 | 0.75 | 0.75 | 0.75 |
| 16 | 0.90 | 0.90 | 0.90 | 0.90 | 0.90 |
| 18 | 1.05 | 1.05 | 1.05 | 1.05 | 1.05 |
| 20 | 1.47 | 1.20 | 1.20 | 1.20 | 1.20 |
| 22 | 1.88 | 1.35 | 1.35 | 1.35 | 1.35 |
| 24 | 2.31 | 1.50 | 1.50 | 1.50 | 1.50 |
| 26 | 2.72 | 1.92 | 1.65 | 1.65 | 1.65 |
| 28 | 3.15 | 2.33 | 1.93 | 1.80 | 1.80 |
| 30 | 3.57 | 2.76 | 2.35 | 1.95 | 1.95 |
| 32 | 3.98 | 3.18 | 2.78 | 2.37 | 2.10 |
| 34 | 4.41 | 3.60 | 3.19 | 2.78 | 2.38 |
| 36 | 4.82 | 4.02 | 3.61 | 3.21 | 2.80 |
| 38 | 5.27 | 4.43 | 4.03 | 3.62 | 3.22 |
| 40 | 5.72 | 4.86 | 4.45 | 4.05 | 3.64 |
| 50 | 8.40 | 7.18 | 6.63 | 6.17 | 5.74 |
| 60 | 11.52 | 10.06 | 9.38 | 8.72 | 8.11 |
| 70 | 14.94 | 13.30 | 12.52 | 11.78 | 11.05 |
| 80 | 18.65 | 16.84 | 15.98 | 15.12 | 14.32 |
| 90 | 22.66 | 20.67 | 19.72 | 18.78 | 17.88 |
| 100 | 26.95 | 24.78 | 23.74 | 22.73 | 21.74 |
In considering the incidence of ordinary and social security income taxes in New Zealand as illustrated by the table it should be noted that under the provisions of the Social Security Act a family benefit of $78 a year is paid, usually to the mother, for every child under 16 years of age irrespective of the income of the parents or the child. The allowance may continue to be paid up to age 18 years if the child is still attending school full time.
LAND TAX—Land tax is levied on the total unimproved value of land held at 31 March by each owner after making by way of special exemption from that value the following deduction: where the value does not exceed $12,000, a deduction of $12,000; where the value exceeds $12,000, a deduction of $12,000 diminished at the rate of $1 for each $1 of that excess, so as to leave no deduction when that value amounts to or exceeds $24,000.
Where the land is subject to a registered mortgage an alternative exemption, generally called the mortgage exemption, is available. The taxpayer is entitled to claim the ordinary or the mortgage exemption, whichever is the greater.
The mortgage exemption is the smaller of $20,000 or the amount of the mortgage outstanding at 31 March, subject to a limitation if the unimproved value of the land is more than $20,000. In such a case the mortgage exemption may not exceed the sum of $20,000 reduced by $1 for every $1 of unimproved value in excess of $20,000. Thus no mortgage exemption is allowable if the unimproved value of the land is $40,000 or more and no ordinary exemption is allowable either. The Commissioner has discretionary powers to grant relief in certain specified cases of hardship.
Subject to deductions provided, life tenants are liable to tax, and joint owners are assessed jointly as regards the land held in conjunction, and are liable severally in respect of each owner's interest in such land and any other land. This liability for joint assessment also applies to companies owning land if half of the paid-up capital or half (in nominal value) of the allotted shares of each company is held by or on behalf of shareholders in the other.
In case of default by a taxpayer in respect of land tax the amount of tax may be demanded from his successor in title, from a tenant of the taxpayer or his successor, or from a mortgagee of the estate or interest concerned. Land tax constitutes a charge on the land, and, notwithstanding any disposition of it, such land continues to be liable in the hands of a purchaser or other holder thereof for the payment of the tax so long as the charge remains in force. Registration of the charge is required and no disposition of the land or of any interest in it may be registered while the charge remains in force. Provision is made for relief in cases of hardship.
Where the unimproved value on which land tax is payable does not exceed $20,000 the rate of land tax is one dollar for every 240 dollars. This rate is increased on a “step” system as follows:
| Taxable value | Tax rate |
|---|---|
| $ $ | |
| 20,001–30,000 | one dollar for every 120 dollars |
| 30,001–40,000 | one dollar for every 80 dollars |
| 40,001 and over | one dollar for every 60 dollars |
There is a rebate of a sum equal to 50 percent of the tax so assessed.
ESTATE AND GIFT DUTIES—The legislation dealing with estate duty and gift duty is contained in the Estate and Gift Duties Act 1955 and its amendments.
Where the final balance of the dutiable estate of a deceased person exceeds $8,000, estate duty is levied on the amount thereof. Exemptions are provided for the successions of a wife, husband, or infant child of a deceased person. (For this purpose an infant child is widely defined to include not only an infant adopted child but also an infant stepchild or infant dependant of the deceased.) These exemptions are subject to the following limitations and operate by way of a deduction from the duty of so much as is attributable to the exempted succession or exempted portion of the succession. In the case of a wife, the exemption applies to the value of her succession or $30,000 whichever is the less; in the case of a husband, to the value of his succession or $14,000 whichever is the less; and in the case of an infant child to the value of the child's succession or $1,000 whichever is the less.
There are also various exemptions which operate by way of the exclusion of certain property in computing the amount of the final balance of the estate as, for example, for an interest in a home settled under the Joint Family Homes Act 1964 which passes to the surviving spouse; the property in an outright gift made before death to a charity; certain superannuation allowances for widows and infant children; and the wood value of growing trees on any land, a proprietary interest in which forms part of the dutiable estate.
Relief is provided for quick successions where estate duty is payable twice on the same property by reason of the two deaths occurring within a short period. The duty is reduced in the second estate according to the interval between the two deaths as follows: second death within four months, 75 percent reduction; within eight months, 60 percent reduction; within one year, 50 percent reduction; within two years, 40 percent reduction; within three years, 30 percent reduction; within four years, 20 percent reduction; within five years, 10 percent reduction.
Ordinary income tax and social security income tax in respect of a deceased person up to the date of death are treated as a debt of the deceased in all cases.
Estate duty is due and payable to the Commissioner of Inland Revenue on assessment, an additional 5 percent penalty being payable if duty is not paid within three months after notice. Interest is charged on all duty unpaid within four months after death, at the rate of 4 percent on duty paid within 15 months after death and at the rate of 5 percent on all duty unpaid within 15 months (though this period may be extended in certain cases).
There is a right of appeal to the Board of Review constituted under the Inland Revenue Department Amendment Act 1960, against decisions of the Commissioner in the exercise of his discretion under certain sections of the Act. There is also a right of appeal on points of law or of fact by way of a case stated to the Supreme Court.
The following table gives the scale of rates of estate duty which applies to estates of persons dying on or after 25 June 1964.
| Final Balance of Estate | Rate |
|---|---|
| Not exceeding $8,000 | Nil |
| $ $ | |
| 8,001–10,000 | 5 percent of excess over $8,000 |
| $ $ | |
| 10,001–12,000 | 100 plus 7 percent of excess over 10,000 |
| 12,001–14,000 | 240 plus 9 percent of excess over 12,000 |
| 14,001–16,000 | 420 plus 11 percent of excess over 14,000 |
| 16,001–18,000 | 640 plus 13 percent of excess over 16,000 |
| 18,001–20,000 | 900 plus 15 percent of excess over 18,000 |
| 20,001–22,000 | 1,200 plus 17 percent of excess over 20,000 |
| 22,001–24,000 | 1,540 plus 19 percent of excess over 22,000 |
| 24,001–28,000 | 1,920 plus 15 percent of excess over 24,000 |
| 28,001–32,000 | 2,520 plus 17 percent of excess over 28,000 |
| 32,001–36,000 | 3,200 plus 19 percent of excess over 32,000 |
| 36,001–40,000 | 3,960 plus 21 percent of excess over 36,000 |
| 40,001–44,000 | 4,800 plus 23 percent of excess over 40,000 |
| 44,001–48,000 | 5,720 plus 25 percent of excess over 44,000 |
| 48,001–52,000 | 6,720 plus 27 percent of excess over 48,000 |
| 52,001–56,000 | 7,800 plus 29 percent of excess over 52,000 |
| 56,001–60,000 | 8,960 plus 31 percent of excess over 56,000 |
| 60,001–64,000 | 10,200 plus 33 percent of excess over 60,000 |
| 64,001–68,000 | 11,520 plus 35 percent of excess over 64,000 |
| 68,001–72,000 | 12,920 plus 37 percent of excess over 68,000 |
| 72,001–76,000 | 14,400 plus 39 percent of excess over 72,000 |
| 76,001–80,000 | 15,960 plus 41 percent of excess over 76,000 |
| 80,001–84,000 | 17,600 plus 43 percent of excess over 80,000 |
| 84,001–88,000 | 19,320 plus 45 percent of excess over 84,000 |
| 88,001–92,000 | 21,120 plus 47 percent of excess over 88,000 |
| 92,001–96,000 | 23,000 plus 49 percent of excess over 92,000 |
| 96,001–102,000 | 24,960 plus 43 percent of excess over 96,000 |
| 102,001–108,000 | 27,540 plus 45 percent of excess over 102,000 |
| 108,001–114,000 | 30,240 plus 47 percent of excess over 108,000 |
| 114,001–120,000 | 33,060 plus 49 percent of excess over 114,000 |
| 120,001–126,000 | 36,000 plus 51 percent of excess over 120,000 |
| 126,001–132,000 | 39,060 plus 53 percent of excess over 126,000 |
| 132,001–138,000 | 42,240 plus 55 percent of excess over 132,000 |
| 138,001–144,000 | 45,540 plus 57 percent of excess over 138,000 |
| 144,001–150,000 | 48,960 plus 59 percent of excess over 144,000 |
| 150,001–160,000 | 52,500 plus 51 percent of excess over 150,000 |
| 160,001–170,000 | 57,600 plus 53 percent of excess over 160,000 |
| 170,001–180,000 | 62,900 plus 55 percent of excess over 170,000 |
| 180,001–190,000 | 68,400 plus 57 percent of excess over 180,000 |
| 190,001–200,000 | 74,100 plus 59 percent of excess over 190,000 |
| Over 200,000 | 40 percent |
Gift Duty—A gift means any disposition of property (situate in New Zealand or of personal property outside New Zealand if the donor is domiciled in New Zealand at the time of the gift) which is made otherwise than by will, whether with or without an instrument in writing, without fully adequate consideration in money or its equivalent. There is provision for a deduction from the value of the gift of money payments adequately secured to the donor which were fixed or ascertainable at the date of the gift. No duty is payable on a gift which, together with the value of all other gifts (not exempt from duty by reason of their nature) made at the same time or within 12 months previously or subsequently by the same donor to the same or any other beneficiary does not exceed the value of $2,000. Gifts up to $200 in any year to the same person are not taken into account for gift duty (or estate duty) if made as part of the donor's normal expenditure. Various other exemptions, including gifts to any charitable trust, are contained in the Act.
The amount of the gift duty is payable by either the donor or the beneficiary, but the beneficiary is entitled to be indemnified by the donor unless the terms of the gift provide otherwise. Particulars of any gift made exceeding $2,000 (or the value of which when aggregated with the value of all gifts made by the donor within 12 months previously exceeds $2,000) are required to be furnished for assessment of duty, if any, within one month of the date of the gift, and if not paid within one year of making of the gift a 10 percent penalty is imposed. Where duty is payable, the rate is based on the following scale.
| Value of Gift (Together With Value of All Aggregated Gifts) | Rate |
|---|---|
| Not exceeding $2,000 | Nil |
| $ $ | |
| 2,001–3,000 | 9 percent of excess over $2,000 |
| $ $ | |
| 3,001–4,000 | 90 plus 10 percent of excess over 3,000 |
| 4,001–6,000 | 190 plus 9 percent of excess over 4,000 |
| 6,001–8,000 | 370 plus 11 percent of excess over 6,000 |
| 8,001–10,000 | 590 plus 13 percent of excess over 8,000 |
| 10,001–12,000 | 850 plus 15 percent of excess over 10,000 |
| 12,001–14,000 | 1,150 plus 17 percent of excess over 12,000 |
| 14,001–16,000 | 1,490 plus 19 percent of excess over 14,000 |
| 16,001–18,000 | 1,870 plus 21 percent of excess over 16,000 |
| 18,001–20,000 | 2,290 plus 23 percent of excess over 18,000 |
| 20,001–22,000 | 2,750 plus 25 percent of excess over 20,000 |
| 22,001–24,000 | 3,250 plus 27 percent of excess over 22,000 |
| 24,001–28,000 | 3,790 plus 23 percent of excess over 24,000 |
| 28,001–32,000 | 4,710 plus 25 percent of excess over 28,000 |
| 32,001–36,000 | 5,710 plus 27 percent of excess over 32,000 |
| 36,001–40,000 | 6,790 plus 29 percent of excess over 36,000 |
| 40,001–44,000 | 7,950 plus 31 percent of excess over 40,000 |
| 44,001–48,000 | 9,190 plus 33 percent of excess over 44,000 |
| 48,001–52,000 | 10,510 plus 35 percent of excess over 48,000 |
| 52,001–56,000 | 11,910 plus 37 percent of excess over 52,000 |
| 56,001–60,000 | 13,390 plus 39 percent of excess over 56,000 |
| over 60,000 | 25 percent less $50 |
The net revenue received from estate duty and gift duty during each of the latest six years is given below.
| Year Ended 31 March | Estate Duty | Gift Duty | Total Estate and Gift Duties |
|---|---|---|---|
| $(thousand) | |||
| 1961 | 24,157 | 3,488 | 27,645 |
| 1962 | 23,430 | 2,543 | 25,973 |
| 1963 | 20,525 | 2,205 | 22,731 |
| 1964 | 20,286 | 1,784 | 22,070 |
| 1965 | 18,836 | 2,121 | 20,957 |
| 1966 | 20,928 | 2,102 | 23,031 |
ESTATES PASSED FOR DEATH DUTY—Particulars of deceased persons' estates certified during the calendar year 1965 are given in the tables following. Comparative totals for the previous four years are appended. Estates of Maoris, in value a negligible proportion of the total, are included, other than hereditary interests in Maori land.
| Size of Estate (Net Value) | Number of Estates | Aggregate Net Value of Estates | Estate Duties Assessed | ||
|---|---|---|---|---|---|
| of Males | Total | of Males | Total | ||
| Estates Passed for Duty, 1965 | |||||
| $(000) $(000) | $(thousand) | ||||
| Under 2 | 753 | 1,399 | 908 | 1,708 | 1 |
| 2 and under 4 | 1,201 | 2,265 | 3,610 | 6,773 | 3 |
| 4 and under 6 | 1,103 | 1,996 | 5,483 | 9,923 | 4 |
| 6 and under 8 | 924 | 1,600 | 6,416 | 11,093 | 5 |
| 8 and under 10 | 610 | 1,024 | 5,475 | 9,172 | 32 |
| 10 and under 12 | 451 | 712 | 4,931 | 7,777 | 72 |
| 12 and under 14 | 308 | 521 | 3,998 | 6,759 | 109 |
| 14 and under 16 | 263 | 434 | 3,940 | 6,520 | 142 |
| 16 and under 18 | 199 | 321 | 3,391 | 5,459 | 149 |
| 18 and under 20 | 182 | 287 | 3,444 | 5,442 | 184 |
| 20 and under 22 | 145 | 228 | 3,046 | 4,783 | 193 |
| 22 and under 24 | 137 | 219 | 3,159 | 5,045 | 241 |
| 24 and under 30 | 298 | 435 | 7,993 | 11,673 | 658 |
| 30 and under 40 | 356 | 494 | 12,476 | 17,192 | 1,233 |
| 40 and under 50 | 223 | 302 | 9,959 | 13,539 | 1,325 |
| 50 and under 60 | 153 | 199 | 8,355 | 10,825 | 1,274 |
| 60 and under 70 | 115 | 150 | 7,457 | 9,692 | 1,404 |
| 70 and under 80 | 73 | 94 | 5,430 | 6,988 | 1,112 |
| 80 and under 90 | 54 | 69 | 4,539 | 5,810 | 1,120 |
| 90 and under 100 | 32 | 45 | 3,047 | 4,271 | 903 |
| 100 and under 120 | 61 | 74 | 6,669 | 8,087 | 1,916 |
| 120 and under 140 | 27 | 32 | 3,498 | 4,147 | 1,124 |
| 140 and under 160 | 16 | 21 | 2,374 | 3,129 | 981 |
| 160 and under 180 | 14 | 15 | 2,373 | 2,535 | 837 |
| 180 and under 200 | 4 | 7 | 752 | 1,311 | 445 |
| 200 and over | 22 | 32 | 8,047 | 11,352 | 5,165 |
| Totals, 1965 | 7,724 | 12,975 | 130,770 | 191,007 | 20,632 |
| Totals, 1964 | 7,656 | 13,134 | 122,532 | 176,856 | 19,560 |
| Totals, 1963 | 7,685 | 13,011 | 118,823 | 171,261 | 19,837 |
| Totals, 1962 | 7,402 | 12,496 | 110,286 | 159,253 | 19,132 |
The average net value per estate certified in 1965 was $14,722 (males, $16,930; females, $11,472) as compared with $13,466 (males, $16,004; females, $9,916) in 1964; duty on estates of males amounted to $14,812,452 and on estates of females, $5,819,616, the respective figures for 1964 being $14,333,704 and $5,226,058.
The law relating to death duties is contained in the Estate and Gift Duties Act 1955. From 10 June 1965 the exemption for a widow has been $30,000 and for a widower $14,000.
The table of averages and percentages given below illustrates the increase in the amount of duty assessed in proportion to the final net value of the estate.
| Size of Estate (Net Value) | Average Duty Assessed per Estate | Average Duty as Percentage of Average Value | ||||
|---|---|---|---|---|---|---|
| of Males | of Females | Total | of Males | of Females | Total | |
| $(000) $(000) | $ | $ | $ | percent | percent | percent |
| Under 8 | 6 | 8 | 6 | 0.1 | 0.2 | 0.1 |
| 8 and under 10 | 22 | 46 | 32 | 0.2 | 0.5 | 0.3 |
| 10 and under 12 | 72 | 152 | 102 | 0.7 | 1.4 | 0.9 |
| 12 and under 14 | 156 | 288 | 210 | 1.2 | 2.2 | 1.6 |
| 14 and under 16 | 222 | 492 | 328 | 1.5 | 3.3 | 2.2 |
| 16 and under 18 | 322 | 698 | 464 | 1.9 | 4.1 | 2.7 |
| 18 and under 20 | 460 | 954 | 640 | 2.4 | 5.0 | 3.4 |
| 20 and under 22 | 618 | 1,242 | 846 | 2.9 | 5.9 | 4.0 |
| 22 and under 24 | 804 | 1,596 | 1,100 | 3.5 | 6.9 | 4.8 |
| 24 and under 30 | 1,192 | 2,208 | 1,512 | 4.4 | 8.2 | 5.6 |
| 30 and under 40 | 2,160 | 3,362 | 2,496 | 6.2 | 9.8 | 7.2 |
| 40 and under 50 | 3,904 | 5,756 | 4,388 | 8.7 | 12.7 | 9.8 |
| 50 and under 60 | 5,982 | 7,796 | 6,402 | 11.0 | 14.5 | 11.8 |
| 60 and under 70 | 8,822 | 11,126 | 9,360 | 13.6 | 17.4 | 14.5 |
| 70 and under 80 | 10,910 | 15,034 | 11,832 | 14.7 | 20.3 | 15.9 |
| 80 and under 90 | 15,734 | 18,022 | 16,232 | 18.7 | 21.3 | 19.3 |
| 90 and under 100 | 19,050 | 22,600 | 20,076 | 20.0 | 24.0 | 21.2 |
| 100 and under 120 | 25,636 | 27,088 | 25,892 | 23.4 | 24.8 | 23.7 |
| 120 140 | 34,268 | 39,694 | 35,116 | 26.5 | 30.6 | 27.1 |
| 140 and under 160 | 46,184 | 48,370 | 46,706 | 31.1 | 32.1 | 31.3 |
| 160 and under 180 | 55,516 | 59,962 | 55,812 | 32.8 | 37.0 | 33.0 |
| 180 and under 200 | 64,294 | 62,684 | 63,604 | 34.2 | 33.7 | 34.0 |
| 200 and over | 175,706 | 129,936 | 161,402 | 48.0 | 39.3 | 45.5 |
| All estates, 1965 | 1,918 | 1,108 | 1,590 | 11.3 | 9.7 | 10.8 |
| All estates, 1964 | 1,872 | 954 | 1,490 | 11.7 | 9.6 | 11.1 |
| All estates, 1963 | 1,848 | 1,056 | 1,524 | 12.0 | 10.7 | 11.6 |
| All estates, 1962 | 1,854 | 1,062 | 1,532 | 12.4 | 11.0 | 12.0 |
A summary showing gross assets, notional estate, and debts and charges, classified in broad groups according to size of estate, is now given. The small difference between the earlier table of aggregate net values of estates and the table showing a break-up of assets is due to rounding off to the nearest thousand in both tables.
| ESTATES PASSED FOR DUTY 1965 | |||||||||
|---|---|---|---|---|---|---|---|---|---|
| — | Under $6,000 | $6,000–$9,999 | $10,000 -$19,999 | $20,000–$23,999 | $24,000–$39,999 | $40,000–$99,999 | $100,000 -$199,999 | $200,000 and Over | All Estates |
| Gross Assets— | $(000). except average per estate $ | ||||||||
| Cash | 5,967 | 4,945 | 7,439 | 1,884 | 4,895 | 6,413 | 1,907 | 3,225 | 36,675 |
| Average per estate | 1,054 | 1,884 | 3,270 | 4,214 | 5,270 | 7,466 | 12,802 | 100,778 | 2,826 |
| Furniture, effects, etc. | 1,772 | 1,580 | 1,853 | 388 | 937 | 1,250 | 300 | 123 | 8,203 |
| Average per estate | 314 | 602 | 814 | 868 | 1,008 | 1,454 | 2,016 | 3,854 | 632 |
| Farm stock, implements, etc. | 108 | 140 | 371 | 175 | 623 | 2,095 | 1,051 | 288 | 4,851 |
| Average per estate | 20 | 54 | 162 | 392 | 672 | 2,440 | 7,056 | 3,994 | 374 |
| Private business interests | 99 | 99 | 597 | 288 | 868 | 1,852 | 481 | 305 | 4,589 |
| Average per estate | 18 | 38 | 262 | 644 | 934 | 2,156 | 3,228 | 9,542 | 354 |
| Assurance policies | 1,413 | 1,436 | 2,388 | 665 | 1,929 | 3,196 | 762 | 612 | 12,401 |
| Average per estate | 250 | 548 | 1,050 | 1,486 | 2,076 | 3,720 | 5,114 | 19,136 | 956 |
| Loans | 919 | 1,150 | 3,208 | 1,371 | 4,571 | 7,960 | 2,830 | 034 | 22,943 |
| Average per estate | 162 | 438 | 1,410 | 3,068 | 4,920 | 9,266 | 18,992 | 29,198 | 1,768 |
| Shares, stocks, etc. | 830 | 1,257 | 3,966 | 1,710 | 5,922 | 12,878 | 5,735 | 5,072 | 37,369 |
| Average per estate | 146 | 478 | 1,744 | 3,824 | 6,374 | 14,992 | 38,490 | 158,512 | 2,880 |
| Real property | 7,767 | 9,073 | 10,373 | 2,647 | 7,572 | 12,775 | 3,916 | 964 | 55,086 |
| Average per estate | 1,372 | 3,458 | 4,560 | 5,922 | 8,150 | 14,872 | 26,282 | 30,134 | 4,246 |
| Other property | 877 | 831 | 1,601 | 611 | 1,258 | 1,950 | 593 | 163 | 7,884 |
| Average per estate | 154 | 316 | 704 | 1,366 | 1,354 | 2,270 | 3,982 | 5,106 | 608 |
| Notional estate | 1,257 | 1,281 | 1,849 | 559 | 1,595 | 2,347 | 1,477 | 501 | 10,866 |
| Average per estate | 226 | 488 | 812 | 1,252 | 1,718 | 2,732 | 9,912 | 15,642 | 840 |
| Foreign property | 132 | 175 | 471 | 227 | 636 | 1,462 | 970 | 1,384 | 5,458 |
| Average per estate | 24 | 66 | 208 | 508 | 686 | 1,701 | 6,512 | 43,242 | 420 |
| Debts— | |||||||||
| Unsecured | 1,265 | 701 | 1,028 | 313 | 971 | 1,433 | 514 | 186 | 6,410 |
| Secured | 1,489 | 1,000 | 1,130 | 385 | 1,569 | 1,619 | 300 | 34 | 7,528 |
| Total | 2,755 | 1,701 | 2,159 | 697 | 2,540 | 3,052 | 814 | 220 | 13,938 |
| Average per estate | 486 | 648 | 948 | 1,560 | 2,734 | 3,554 | 5,462 | 6,876 | 1,074 |
The number of estates in each age group for 1965 are classified below according to net value of estate.
| Age Group in Years | Under $2,000 | $2,000–$3,999 | $4,000–$5,999 | $6,000–$7,999 | $8,000–$9,999 | $10,000–$19,999 | $20,000–$23,999 | $24,000–$29,999 | $30,000–$39,999 | $40,000–$59,999 | $60,000–$79,999 | $80,000–$99,999 | $100,000–$199,999 | $200,000 and Over | Total |
|---|---|---|---|---|---|---|---|---|---|---|---|---|---|---|---|
| Under 20 | 15 | 19 | 10 | 5 | – | 3 | – | – | – | – | – | – | – | – | 52 |
| 20–24 | 8 | 32 | 22 | 9 | 6 | 12 | 1 | 1 | – | – | – | – | – | – | 91 |
| 25–29 | 12 | 18 | 15 | 9 | 8 | 22 | 2 | 4 | 2 | 1 | 1 | – | – | – | 94 |
| 30–34 | 5 | 15 | 11 | 13 | 9 | 18 | 3 | 2 | 4 | 5 | 1 | 1 | – | – | 87 |
| 35–39 | 14 | 20 | 17 | 9 | 8 | 29 | 2 | 6 | 3 | 9 | 2 | – | 1 | – | 120 |
| 40–44 | 35 | 38 | 37 | 20 | 18 | 42 | 10 | 8 | 10 | 10 | 5 | 2 | 2 | 1 | 238 |
| 45–49 | 43 | 76 | 57 | 40 | 25 | 74 | 9 | 8 | 12 | 18 | 14 | 1 | 3 | 1 | 381 |
| 50–54 | 59 | 99 | 82 | 76 | 48 | 115 | 25 | 28 | 23 | 18 | 10 | 2 | 8 | 2 | 595 |
| 55–59 | 98 | 134 | 113 | 106 | 64 | 154 | 43 | 40 | 31 | 44 | 18 | 11 | 11 | 2 | 869 |
| 60–64 | 113 | 196 | 158 | 138 | 111 | 232 | 51 | 45 | 42 | 45 | 26 | 11 | 12 | 4 | 1,184 |
| 65–69 | 137 | 236 | 223 | 172 | 110 | 231 | 48 | 50 | 61 | 66 | 27 | 16 | 17 | 3 | 1,397 |
| 70–74 | 170 | 307 | 283 | 221 | 129 | 309 | 42 | 43 | 70 | 56 | 27 | 16 | 16 | 5 | 1,694 |
| 75–79 | 232 | 364 | 322 | 272 | 148 | 380 | 66 | 71 | 80 | 83 | 38 | 19 | 33 | 5 | 2,113 |
| 80–84 | 207 | 324 | 306 | 272 | 180 | 304 | 77 | 60 | 82 | 76 | 33 | 13 | 23 | 3 | 1,960 |
| 85–89 | 126 | 246 | 210 | 145 | 104 | 231 | 41 | 45 | 47 | 43 | 31 | 17 | 10 | 5 | 1,301 |
| 90–94 | 48 | 91 | 94 | 63 | 37 | 80 | 18 | 17 | 17 | 18 | 8 | 4 | 10 | 1 | 506 |
| 95–99 | 18 | 23 | 22 | 21 | 11 | 23 | 6 | 5 | 5 | 5 | 2 | – | 1 | – | 142 |
| Unspecified | 59 | 27 | 14 | 9 | 8 | 16 | 3 | 2 | 5 | 4 | 1 | 1 | 2 | – | 151 |
| Totals | 1,399 | 2,265 | 1,996 | 1,600 | 1,024 | 2,275 | 447 | 435 | 494 | 501 | 244 | 114 | 149 | 32 | 12,975 |
| Percent | 10.78 | 17,47 | 15.38 | 12.33 | 7.89 | 17.53 | 3.45 | 3.35 | 3.81 | 3.86 | 1.88 | 0.88 | 1.14 | 0.25 | 100.00 |
OTHER DUTIES—These cover a miscellany of items of taxation.
In the next table the receipts for the last five years are shown under the various heads; receipts under agreement on sales of overseas lottery tickets in New Zealand have been added to the revenue items handled by the Duties Division of the Inland Revenue Department.
| Duty | Year Ended 31 March | ||||
|---|---|---|---|---|---|
| 1962 | 1963 | 1964 | 1965 | 1966 | |
* Abolished as from 14 June 1965. | |||||
| $(thousand) | |||||
| Duty on instruments | 4,728 | 4,108 | 5,148 | 6,644 | 7,173 |
| Duty on cheques | 1,435 | 1,479 | 1,604 | 1,703 | 1,732 |
| Racing taxation | 9,527 | 9,497 | 10,242 | 10,632 | 11,510 |
| Amusement tax | 1,072 | 1,014 | 547 | 360 | 153* |
| Lottery duty | 289 | 948 | 681 | 807 | 898 |
| Overseas lottery duty | 441 | 290 | 290 | 255 | 217 |
| Totals | 17,492 | 17,335 | 18,512 | 20,401 | 21,683 |
Some of the more important items included in the foregoing table are dealt with in more detail under subsequent headings.
RACING TAXATION—The Government taxation on totalisator turnover is, under the Stamp Duties Amendment Act 1965, effective from 1 August 1965, 2 1/2 percent on the first $100,000 of the gross investments received by a club in any one year, and 5 percent on the balance in excess of $100,000. The former tax of 1 percent on the total value of all stakes was abolished on 1 August 1965. In addition there is a dividend tax of 5 percent on the total amount available for dividends after the following deductions have been made: (a) totalisator tax; (b) Totalisator Agency Board or club's commission of 7 1/2 percent; (c) 1/2 percent levy as provided by the Gaming Amendment Act 1953. Where the latter levy is deducted by a racing or hunt club it is paid to the New Zealand Racing Conference and where it is deducted by a trotting club it is paid to the New Zealand Trotting Conference. Each Conference pays the moneys received by it into a separate account, which is applied solely for the purpose of assisting clubs to provide, maintain, and replace amenities for the public and course improvements on their racecourses. The proceeds of the levy and the amounts paid to clubs are not subject to taxation. The legislation provides that the levy is to cease on 1 November 1970.
The Totalisator Agency Board, established by the Gaming Amendment Act 1949 to conduct off-course betting, receives 7 1/2 percent of the turnover made through the totalisator agencies. This is the same percentage as that retained by clubs for on-course turnover.
The Gaming Act 1908 and amendments provide for the Minister of Internal Affairs to grant totalisator licences for not more than 404 days in any racing year. Of these 404 days, 271 are allocated to racing and hunt clubs and 133 to trotting clubs. An amendment to the Act in 1963 enabled clubs to increase the number of races at a meeting from eight to nine.
The following table gives figures of Government taxes, and the amount of turnover retained by clubs or the Totalisator Agency Board.
| Item | Year ended 31 July | ||||
|---|---|---|---|---|---|
| 1962 | 1963 | 1964 | 1965 | 1966 | |
* Tax abolished 1 August 1965. † Retained by clubs and T.A.B. | |||||
| Government taxes— | $(thousand) | ||||
| On totalisator turnover | 5,003 | 5,072 | 5,446 | 6,064 | 5,958 |
| On dividends | 4,464 | 4,527 | 4,850 | 5,392 | 5,470 |
| On stakes | 33 | 34 | 36 | 40 | * |
| Totals | 9,501 | 9,633 | 10,331 | 11,497 | 11,428 |
| Amount of totalisator turnover retained by clubs or T.A.B. | 7,832 | 7,936 | 8,491 | 9,431 | 9,763 |
| Unpaid fractions† | 236 | 230 | 245 | 270 | 270 |
| Levy of 1/2 percent | 513 | 520 | 557 | 620 | 629 |
For the financial year ended 31 March 1966, Consolidated Revenue Account receipts from racing taxation amounted to $11.5 million, as compared with $10.6 million in 1964–65. The following figures relate to the racing year, which ends on 31 July.
| Item | Galloping | Trotting | ||||
|---|---|---|---|---|---|---|
| 1963–64 | 1964–65 | 1965–66 | 1963–64 | 1964–65 | 1965–66 | |
| Number of racing days | 259 | 271 | 271 | 121 | 133 | 133 |
| Number of races | 2,141 | 2,221 | 2,225 | 1,018 | 1,126 | 1,136 |
| Amount of stakes $(000) | 2,474 | 2,781 | 2,888 | 1,095 | 1,252 | 1,248 |
| Average per race $ | 1,156 | 1,252 | 1,298 | 1,076 | 1,112 | 1,098 |
| Totalisator turnover— | $(million) | |||||
| On course | 33.6 | 35.7 | 35.7 | 14.3 | 15.7 | 15.4 |
| Off course | 48.1 | 53.2 | 55.4 | 15.6 | 19.3 | 19.3 |
| Totals | 81.7 | 89.0 | 91.1 | 29.8 | 35.0 | 34.7 |
| Doubles (included above) | 31.8 | 35.9 | 37.9 | 9.1 | 11.6 | 12.0 |
| Amount paid in dividends | 67.3 | 73.4 | 75.1 | 24.6 | 28.8 | 28.6 |
On-course betting at galloping meetings in the 1965–66 racing year was the same as that for the previous year. Off-course betting, on the other hand, increased by 4.1 percent, although this was not as great as the preceding annual increase of 10.6 percent. On-course betting at trotting meetings was slightly down in 1965–66 as compared with 1964–65, while off-course betting remained unchanged. Doubles investments at both galloping and trotting meetings were up in the latest year as compared with 1964–65, the increases being 5.6 percent and 3.4 percent respectively.
Of the amount placed on the totalisator in 1965–66, 82.4 percent was returned to bettors by way of dividends. Government taxes absorbed 9.1 percent, 8.0 was retained by the racing clubs, and a special levy amounted to 1/2 percent.
FILM-HIRE TAX—A film-hire tax is payable monthly by holders of renters' licences under Part IV of the Cinematograph Films Act 1928.
The film-hire tax payable is assessed on the net monthly receipts derived by the renter from renting sound-picture films. On British Commonwealth films the tax is 10 percent and on foreign films 25 percent of the net receipts. Films made wholly in New Zealand are exempt from the tax. The film-hire tax yielded a revenue of $379,812 in 1961–62, $340,600 in 1962–63, $343,070 in 1963–64, $337,348 in 1964–65, and $374,500 in 1965–66.
SALES TAX—Sales tax is collected under the authority of the Sales, Tax Act 1932—33 and its amendments. Numerous classes of goods were originally exempt from the tax, these being, in the main, commodities of primary production, articles used in the primary industries, machinery for use in manufacture, and the more important foodstuffs for household consumption. Goods exported from New Zealand were exempt, as were also certain commodities (e.g., motor spirits) which were subject to special taxation. In the post-war years a wide range of goods has been exempted from sales tax. The Sales Tax Exemption Order 1967 consolidates in one list all the existing exemptions from sales tax. Beer and manufactured tobacco were exempted from sales tax on 4 November 1959. The rate of tax is normally 20 percent; for motor vehicles it was increased to 40 percent in June 1958, reduced to 33 1/3 percent in July 1960, and increased to 40 percent again in May 1967. The tax is not a turnover tax, being payable only once and, as far as possible, at the point where the goods pass to the retailer. The Sales Tax Act is administered by the Customs Department. The net amount yielded by the sales tax during each of the latest five March years has been: 1961–62, $51,107,000; 1962–63, $52,356,000; 1963–64, $64,225,000; 1964–65, $76,945,000; and 1965–66, $76,633,000.
Monthly figures of sales tax collected by the Customs Department during recent calendar years have been as follows.
| Month | Total Sales Tax Receipts | ||||
|---|---|---|---|---|---|
| 1962 | 1963 | 1964 | 1965 | 1966 | |
| $(thousand) | |||||
| January | 6,164 | 6,375 | 6,841 | 5,140 | 4,134 |
| February | 1,195 | 1,932 | 6,661 | 6,309 | 6,750 |
| March | 5,664 | 5,049 | 6,092 | 9,273 | 10,070 |
| April | 1,708 | 5,888 | 9,139 | 6,901 | 7,378 |
| May | 6,057 | ||||
| June | 2,950 | 4,365 | 6,157 | 6,174 | 6,421 |
| July | 5,477 | 5,509 | 6,142 | 6,179 | 6,461 |
| August | 5,022 | 4,523 | 6,192 | 6,751 | 6,587 |
| September | 1,288 | 5,490 | 6,683 | 6,567 | 6,470 |
| October | 7,655 | 5,965 | 6,513 | 6,569 | 6,843 |
| November | 4,898 | 6,228 | 6,852 | 6,925 | 7,218 |
| December | 3,894 | 6,660 | 8,546 | 9,613 | 7,250 |
The collections during a month relate in general to sales during the preceding month. Sales tax for any one month must be paid by the twenty-eighth of the following month to secure the discount. When the twenty-eighth falls on a Friday in a thirty-day month last-minute payments posted on the Friday are actually received in the succeeding month, e.g., sales tax on January sales posted on 28 February (when this is the last day of the month) is credited in March receipts.
The following table of receipts from the sales tax gives some indication of comparative trading operations in the principal centres. These figures and those in the preceding table are compiled from monthly departmental returns and in most cases differ slightly from the final Treasury figures shown earlier.
| Year Ended 31 March | Auckland | Wellington | Rest of North Island | Christchurch | Dunedin | Rest of South Island | Total* |
|---|---|---|---|---|---|---|---|
* Includes receipts through the Post Office. | |||||||
| $(thousand) | |||||||
| 1962 | 13,132 | 28,994 | 1,295 | 5,112 | 1,678 | 799 | 51,095 |
| 1963 | 15,326 | 27,783 | 1,540 | 4,978 | 1,833 | 790x | 52,306 |
| 1964 | 17,600 | 35,926 | 2,086 | 5,750 | 1,956 | 903 | 64,221 |
| 1965 | 21,067 | 43,474 | 2,370 | 6,668 | 2,304 | 1,061 | 76,945 |
| 1966 | 20,367 | 41,378 | 3,077 | 7,393 | 2,375 | 1,092 | 75,683 |
LOCAL TAXATION—Local governing authorities have power under various Acts of the Legislature to impose taxes for general or special purposes, as set out in Section 27 of this Yearbook. The amount of revenue collected by local authorities curing the latest five March years was as follows.
| Year Ended 31 March | General Rates | Other Rates | Licences and Inspection Charges | Per Head of Mean Population |
|---|---|---|---|---|
| $(thousand) | $ | |||
| 1962 | 40,956 | 16,960 | 1,914 | 24.50 |
| 1963 | 44,182 | 18,260 | 1,900 | 25.70 |
| 1964 | 46,116 | 22,224 | 2,284 | 27.60 |
| 1965 | 54,650 | 22,522 | 2,828 | 30.60 |
| 1966 | 55,778 | 24,678 | 2,888 | 31.40 |
The figures are exclusive of wharfage dues, tolls, etc., received by harbour boards, such receipts being regarded as charges for services.
GENERAL—The principal legislative measure which is concerned with public indebtedness is the New Zealand Loans Act 1953.
The money composing the public debt has been borrowed on the security of the public revenues of New Zealand. No portion of the public estate is pledged for payment of either principal or interest.
Whereas in 1934, 56 percent of the public debt was owing to overseas investors, the percentage has now dropped to 15 percent. Almost 50 percent of the public debt is held by Government-owned institutions, and by reserve accounts set up for the benefit of the primary industries.
Most of the present public debt was borrowed for national development. There was established within the Public Account, as from 1 April 1942, a National Development Loans Account into which all moneys from loans for national development are paid. The amounts raised by loans since the inception of this account to 31 March 1966 totalled $1,822,010,238, of which $152,927,426 was raised in 1965–66. Moneys are transferred from this account as required, the amounts transferred during the last three years being given in Section 26A.
GROSS INDEBTEDNESS—The gross indebtedness of the central Government and the amount of indebtedness per head of population are given in the following table. Figures for previous years are shown in a table in the Statistical Summary.
| At 31 March | Amount | Per Head of Population |
|---|---|---|
| $(000) | $ | |
| 1951 | 1,334,466 | 688.60 |
| 1952 | 1,307,324 | 658.70 |
| 1953 | 1,335,376 | 655.40 |
| 1954 | 1,408,742 | 674.80 |
| 1955 | 1,457,186 | 683.80 |
| 1956 | 1,470,402 | 675.90 |
| 1957 | 1,514,240 | 681.70 |
| 1958 | 1,564,222 | 687.40 |
| 1959 | 1,633,104 | 702.20 |
| 1960 | 1,689,032 | 712.60 |
| 1961 | 1,736,346 | 718.99 |
| 1962 | 1,807,688 | 730.50 |
| 1963 | 1,934,286 | 765.18 |
| 1964 | 2,021,744 | 782.89 |
| 1965 | 2,139,584 | 813.87 |
| 1966 | 2,255,966 | 842.78 |
CONTINGENT LIABILITIES—The table following shows contingent liabilities outstanding on 31 March 1965. In addition, the Government guarantees by statute the obligations of the Government Life Insurance Office and the State Insurance Office to their respective policy holders; the Reserve Bank is guaranteed against losses arising from variations in the rate of exchange of the $(N.Z.) against other currencies (this guarantee was last exercised in 1948 when the £(N.Z.) was placed on a parity with the £(stg.)); and there are also certain contingent State liabilities in connection with the Government Superannuation Fund.
On becoming a member of the International Bank for Reconstruction and Development and of the International Monetary Fund, New Zealand in 1961 issued $10,682,132 of non-interest-bearing, non-negotiable demand notes to the International Bank and $66,520,000 of similar notes to the Fund.
| CONTINGENT LIABILITIES OUTSTANDING ON 31 MARCH 1966 | |||
|---|---|---|---|
* Excludes overdrafts of Dairy Industry and Apple and Pear Industry accounts secured on stocks, etc., in terms of statute | |||
| State Advances Corporation— | $(000) | $(000) | $(000) |
| Stock held by Government agencies | 337,608 | ||
| Stock held by public | 20,336 | ||
| 357,944 | |||
| Loans to industries | 13,111 | ||
| 371,055 | |||
| Hospital boards: Stock and debentures | 81,632 | ||
| Other local authorities— | |||
| Stock and debentures | 19,194 | ||
| Overdrafts up to | 307 | ||
| 19,501 | |||
| Licensed trade— | |||
| Licensing trusts: Debentures and overdrafts up to | 343 | ||
| Tourist Hotel Corporation: Overdraft up to | 60 | ||
| Other loans | 466 | ||
| 869 | |||
| Marketing authorities:* Overdrafts up to | 18,823 | ||
| Primary production: Overdrafts up to | 80 | ||
| Secondary production: Timber and paper industry— | |||
| Overdrafts up to | 200 | ||
| Gas companies: Debentures | 1,231 | ||
| Miscellaneous: Overdrafts up to | 639 | ||
| 2,070 | |||
| Aviation loan | 19,643 | ||
| Western Samoan Government loan | 2,000 | ||
| International Finance Organisation— | |||
| Notes portion of subscriptions | 94,442 | ||
CLASSIFICATION OF PUBLIC DEBT—A broad classification of the public debt according to nature or purpose is contained in the following table, the distinction being made on the basis of whether raised for ordinary purposes, war purposes, or housing. It should be noted that the debt is expressed in terms of nominal amounts, these differing from figures in terms of New Zealand currency for the 1940 year only.
| Class | Gross Debt at 31 March | |||||
|---|---|---|---|---|---|---|
| 1940 | 1950 | 1960 | 1964 | 1965 | 1966 | |
| $(thousand) | ||||||
| Ordinary | 490,434 | 716,534 | 1,170,828 | 1,625,246 | 1,753,828 | 1,888,012 |
| Housing | 23,118 | 114,662 | 239,658 | 272,708 | 280,520 | 289,134 |
| War loans (1914–18) | 73,708 | 53,514 | – | – | – | – |
| War loans (1939–45) | 6,172 | 403,052 | 278,546 | 123,790 | 105,236 | 78,819 |
| Totals | 593,432 | 1,287,762 | 1,689,032 | 2,021,744 | 2,139,584 | 2,255,965 |
A more detailed allocation of the public debt as at 31 March 1966 is now given.
* Includes $5.0 million excess development costs not represented by sale value and not bearing interest. | ||
|---|---|---|
| (a) Earning full interest at 4 1/2 percent— | $(thousand) | |
| Electric power | 487,542 | |
| Electric power (IBRD Interisland Transmission Project loan at 5 1/2 percent) | 21,702 | |
| Post Office | 216,220 | |
| Housing under construction and land development | 26,458* | |
| Bank of New Zealand shares (annual dividend as declared) | 12,656 | |
| Land settlement | 151,834 | |
| New Zealand National Airways Corporation | 5,000 | |
| State Advances Corporation | 282,764 | |
| IBRD Harbour Project loan at 5 1/2 percent | 3,766 | |
| Air New Zealand Ltd. (annual dividend as declared) | 8,000 | |
| Tasman Pulp and Paper Co. Ltd. at various 4 1/4–5 1/4 percent | 13,296 | |
| New Zealand Broadcasting Corporation | 800 | |
| Railways (IBRD Railway Project loan at 6 1/4 percent) | 4,476 | |
| 1,234,474 | ||
| (b) Earning interest but not at full rate— | ||
| Housing at 3 percent | 262,676 | |
| (c) Not earning interest though represented by permanent assets or development works— | ||
| Airport development | 6,148 | |
| Education buildings | 44,550 | |
| Forests (State) | 36,474 | |
| Roads and highways | 112,704 | |
| General public works | 48,438 | |
| International Finance Organisations— | ||
| Cash portion of subscriptions | 18,630 | |
| New Zealand Steel Ltd. | 1,182 | |
| Railways | 178,744 | |
| Railway Capital Reserve Account | 140,000 | |
| State coal mines | 26,006 | |
| Tourist Hotel Corporation | 6,572 | |
| 619,452 | ||
| (d) Non-productive debt— | ||
| War Loans 1939–45 | 72,246 | |
| Reserve Bank exchange adjustment | 40,000 | |
| New loan moneys on hand— | ||
| National Development Loans Account | 27,116 | |
| 139,362 | ||
| Total | 2,255,964 | |
MOVEMENT IN PUBLIC DEBT DURING 1965–66—A summary of transactions in connection with the public debt during the year ended 31 March 1966 is as follows.
| Type of Debt | Amount Outstanding at | ||
|---|---|---|---|
| 31 March 1965 | 31 March 1966 | +Increase -Decrease | |
| $(thousand) | |||
| External debt: London | 276,466 | 244,839 | - 31,627 |
| United States of America | 36,882 | 58,402 | + 21,520 |
| IBRD | 17,450 | 29,945 | + 12,495 |
| Internal debt— | |||
| Long-term debt | 1,794,586 | 1,908,579 | +113,993 |
| Floating debt | 14,200 | 14,200 | - |
| Totals | 2,139,584 | 2,255,965 | +116,381 |
A more detailed statement which shows also the main purposes for which loan moneys were raised during the year 1965–66 is now given.
| External debt— | $(000) | $(000) | $(000) |
|---|---|---|---|
| London— | |||
| Increases— | |||
| New issues— | |||
| Loans Redemption Account | 19,872 | ||
| Decreases— | |||
| Repayments from Loans Redemption Account From loan moneys | 34,095 | ||
| Transfers to New Zealand Register | 17,404 | ||
| 51,499 | |||
| Decrease in London debt | 31,627 | ||
| IBRD— | |||
| Increases— | |||
| New issues— | |||
| National Development Loans Account | 12,494 | ||
| United States of America— | -19,133 | ||
| Increases— | |||
| New issues— | |||
| National Development Loans Account | 25,199 | ||
| Decreases— | |||
| Repayments from Loans Redemption Account | 3,678 | ||
| From revenue— | |||
| Increase in U.S.A. debt | 21,521 | ||
| Increase in external debt | 2,388 | ||
| Internal debt— | |||
| Increases— | |||
| New issues— | |||
| National Development Loans Account | 115,234 | ||
| Loans Redemption Account | 170,420 | ||
| Transfers from London Register | 17,404 | ||
| 303,058 | |||
| Decreases— | |||
| Repayments from Loans Redemption Account— | |||
| From revenue | 34,200 | ||
| From loan moneys | 38,791 | ||
| New issues in New Zealand | 117,074 | ||
| 190,065 | |||
| Increase in internal debt | 113,993 | ||
| Total increase in public debt | 116,381 |
PUBLIC DEBT CONVERSION SCHEMES AND NEW LOANS—Details of conversions and loans for preceding periods are given in earlier issues of the Yearbook.
Conversion Loans—In April 1966 a conversion loan of $47.2 million was offered. Stock in conversion was 4 3/4 percent maturing 15 June 1969 at par, 5 percent maturing 15 June 1972 at par, and 5 percent 15 June 1982 at 98 percent. An amount of approximately $41.4 million was converted.
In June 1966 a conversion loan of $39 million was offered. Stock in conversion was 4 7/8 percent 15 July 1969 at par, 5 1/8 percent 15 July 1972 at par, and 5 1/4 percent 15 July 1982 at 98 1/2 percent. An amount of approximately $30.8 million was converted.
A further conversion loan of $13.8 million was offered in October 1966. Stock in conversion was 4 7/8 percent 15 November 1969 at par, 5 1/8 percent 15 November 1972 at par, and 5 1/4 percent 15 November 1982 at 98 1/2 percent. An amount of approximately $5.8 million was converted.
London Loans—A loan of £20 million was raised in London in April 1958. It consisted of New Zealand Government 6 percent stock issued at £99 percent and maturing in 1976–80. In May 1961 a further loan of £20 million of New Zealand Government 6 percent stock issued at £981 percent and maturing 15 November 1972 was raised in London.
A loan of £10 million was raised in London in August 1962, with 6 percent stock issued at £97 percent maturing 15 March 1975–76.
In January 1964 a loan of £15 million was floated on the London market with 5 1/2 percent stock issued at £96 1/2 percent maturing 28 February 1974.
In August 1965 a loan of £10 million was raised in London, with 6 3/4 percent stock issued at £98 1/2 percent maturing 6 December 1971.
In October 1966 a loan of £(stg.)12 million was raised in London with 7 1/2 percent stock issued at £98 percent maturing 15 June 1983–86.
United States Loans—New Zealand raised a public loan in the United States of America in December 1958. An amount of U.S.$10,000,000 bearing interest at 5 1/2 percent and maturing in. 1970 was raised in New York.
In 1961 a loan of U.S.$20,000,000 was raised in New York, with 5 3/4 percent bonds maturing 15 October 1971–76. In May 1962 a further loan of U.S.$25,000,000 of 5 1/4 percent bonds maturing 1 May 1972–77 was raised.
In 1963 a loan of U.S.$7,100,000 bearing interest at 5 1/2 percent and maturing on 15 February 1989 was authorised by the International Bank for Reconstruction and Development for port development; a loan of U.S.$32,500,000 bearing interest at 5 1/2 percent and maturing on 15 March 1984 for the inter-Island power transmission project was authorised in 1964; and at the end of 1965 a loan of N.Z.$44.6 million bearing interest at 6 1/4 percent for 15 years was granted, two-thirds being for railways modernisation and one-third for power development.
In 1965 a loan of U.S.$20,000,000 was raised in New York, with 5 3/4 percent bonds maturing 1 July 1985.
In March 1966 a loan of U.S.$15,000,000 was raised in New York with 6 1/2 percent bonds maturing 15 March 1986. In September 1966 a further loan of U.S.$10,000,000 of 7 percent bonds maturing 15 September 1976 was raised.
Cash Loans—A cash loan was opened in June 1966 and the following stocks were offered: 4 7/8 percent 15 July 1969 at par, 5 1/3 percent 15 July 1972 at par, and 5 1/4 percent 15 July 1982 at 98 1/2 percent. An amount of $46.2 million was subscribed. A further loan of $50 million was opened in February 1967. The stocks offered were 5 percent 15 February 1970, 5 1/4 percent 15 February 1973, 5 1/2 percent 15 February 1983, at par.
DOMICILE OF DEBT—The table, following shows, for each of the latest 11 years ended 31 March, the amount of New Zealand's public debt domiciled in London, United States of America, and New Zealand. All amounts shown are exclusive of the contingent liability due to the United Kingdom Government to which reference has been made elsewhere in this subsection.
| At 31 March | Amount | Percentage of Total on New Zealand Currency Basis | ||||||
|---|---|---|---|---|---|---|---|---|
| London | United States of America | IBRD | New Zealand | London | United States of America | IBRD | New Zealand | |
| $N.Z. (thousand) | Percent | |||||||
| 1956 | 191,608 | – | – | 1,278,794 | 13.03 | – | – | 86.97 |
| 1957 | 200,850 | 8,858 | – | 1,304,530 | 13.26 | 0.59 | - | 86.15 |
| 1958 | 199,152 | 7,926 | – | 1,357,144 | 12.73 | 0.51 | – | 86.76 |
| 1959 | 236,554 | 47,096 | – | 1,349,456 | 14.49 | 2.88 | – | 82.63 |
| 1960 | 235,528 | 37,930 | – | 1,415,574 | 13.94 | 2.25 | – | 83.81 |
| 1961 | 216,326 | 36,996 | – | 1,483,022 | 12.46 | 2.13 | – | 85.41 |
| 1962 | 254,026 | 25,084 | – | 1,528,578 | 14.05 | 1.39 | – | 84.56 |
| 1963 | 272,478 | 41,450 | – | 1,620,358 | 14.09 | 2.14 | – | 83.77 |
| 1964 | 279,906 | 39,952 | 1,868 | 1,700,018 | 13.84 | 1.98 | 0.09 | 84.09 |
| 1965 | 276,466 | 36,882 | 17,450 | 1,808,786 | 12.91 | 1.72 | 0.84 | 84.53 |
| 1966 | 244,838 | 58,402 | 29,946 | 1,922,780 | 10.85 | 2.59 | 1.33 | 85.23 |
MATURITY YEARS OF DEBT—The maturity years of the debt outstanding at 31 March 1966 are shown in the following statement, which distinguishes between the various countries of domicile. All amounts shown may be regarded as being either in New Zealand dollars or in nominal amounts.
| Loans Maturing in Financial Year Ending 31 March* | Due in | Total Debt (Nominal Amount) | |||
|---|---|---|---|---|---|
| U.S.A. (in New Zealand Currency) | London (in New Zealand Currency) | New Zealand | |||
| Public | Departmental and Other | ||||
* In respect of many of the loans the Government has the option to redeem the securities at an earlier date. † IBRD loan. | |||||
| $(thousand) | |||||
| Treasury bills | – | – | – | 14,200 | 14,200 |
| 1966 | 3,212 | 13,392 | 51,028 | 48,036 | 115,668 |
| 1967 | 2,746 | – | 48,100 | 38,754 | 89,600 |
| 1968 | 2,746 | 30,430 | 72,536 | 67,916 | 173,628 |
| 1969 | 2,746 | – | 57,802 | 65,352 | 125,900 |
| 1970 | 4,250 | – | 43,562 | 38,748 | 86,560 |
| 1971 | 2,178 | 29,440 | 36,028 | 13,120 | 80,766 |
| 1972 | 2,180 | 38,968 | 52,040 | 41,556 | 134,744 |
| 1973 | 2,180 | 46,366 | 65,792 | 99,440 | 213,778 |
| 1974 | 2,180 | – | 7,206 | 80,904 | 90,290 |
| 1975 | 2,180 | 15,208 | 53,246 | 93,560 | 164,194 |
| 1976 | 3,928 | – | 24,732 | 99,972 | 128,632 |
| 1977 | 2,680 | 10,152 | 18,796 | 58,304 | 89,932 |
| 1978 | – | 15,164 | 19,866 | 63,014 | 98,044 |
| 1979 | – | 25,572 | 37,218 | 59,538 | 122,328 |
| 1980 | 4,476 | – | – | 70,000 | 74,476 |
| 1981 | – | – | 39,836 | 37,028 | 76,864 |
| 1982 | – | 7,208 | 2,742 | 50 | 10,000 |
| 1983 | 21,702 | – | 30,286 | 30,310 | 82,298 |
| 1984 | – | 12,938 | 73,004 | 38,492 | 124,434 |
| 1985 | 25,198 | – | 71,774 | 58,890 | 155,862 |
| 1989 | 3,766 | – | – | – | 3,766 |
| Totals | 88,348 | 244,838 | 805,594 | 1,117,184 | 2,255,964 |
DEPARTMENTAL INVESTMENTS—As shown in the preceding table, $1,117,184,000 of the public debt outstanding at 31 March 1966 was held by various Government Departments and quasi-Government organisations. A summary of these investments for the latest two years is as follows.
| — | At 31 March | |
|---|---|---|
| 1965 | 1966 | |
| $(thousand) | ||
| Investments held by accounts within the Public Account | 42,698 | 42,692 |
| Earthquake and War Damage Commission | 60,910 | 68,608 |
| Government Life Insurance | 24,744 | 33,002 |
| Government Superannuation Board | 93,598 | 99,656 |
| Maori Trustee | 4,998 | 5,202 |
| National Provident Fund | 77,148 | 76,844 |
| Post Office | 432,552 | 452,590 |
| Post Office: National Savings | 82,338 | 78,338 |
| Public Trustee | 7,732 | 6,566 |
| Reserve Bank | 67,240 | 80,612 |
| State Advances Corporation | 18,628 | 22,876 |
| State Insurance Office | 9,066 | 9,266 |
| Meat Industry Account | 75,466 | 77,124 |
| Wool Commission Account | 63,408 | 63,808 |
| Totals | 1,060,526 | 1,117,184 |
PRICES OF NEW ZEALAND STOCKS—The following table gives the quotations in London for the principal new stocks (excluding accrued interest).
| Date | 4 1/4 Percent, 1970–73 | 5 Percent, 1956–71 | 6 Percent, 1976–80 | 6 Percent, 1972 | 6 Percent, 1975–76 | 5 1/2 Percent, 1974 | ||||||||||||
|---|---|---|---|---|---|---|---|---|---|---|---|---|---|---|---|---|---|---|
| £ | s. | d. | £ | s. | d. | £ | s. | d. | £ | s. | d. | £ | s. | d. | £ | s. | d. | |
| 1959–4 December | 89 | 9 | 4 1/2 | 99 | 6 | 10 1/2 | 106 | 0 | 0 | ... | ... | ... | ||||||
| 1960–1 December | 84 | 16 | 3 | 91 | 16 | 3 | 99 | 15 | 7 1/2 | ... | ... | ... | ||||||
| 1961–1 December | 81 | 11 | 10 1/2 | 89 | 19 | 4 1/2 | 93 | 19 | 4 1/2 | 95 | 5 | 0 | ... | ... | ||||
| 1962–7 December | 89 | 3 | 9 | 96 | 12 | 6 | 101 | 0 | 7 1/2 | 101 | 2 | 6 | 100 | 19 | 4 1/2 | ... | ||
| 1963–6 December | 91 | 10 | 0 | 97 | 5 | 7 1/2 | 100 | 1 | 10 1/2 | 100 | 3 | 1 1/2 | 108 | 8 | 1 1/2 | ... | ||
| 1964–6 March | 89 | 5 | 0 | 95 | 5 | 7 1/2 | 100 | 11 | 3 | 99 | 18 | 1 1/2 | 100 | 11 | 3 | 96 | 8 | 1 1/2 |
| 5 June | 88 | 11 | 3 | 94 | 16 | 10 1/2 | 100 | 1 | 3 | 100 | 9 | 4 1/2 | 100 | 0 | 7 1/2 | 97 | 6 | 10 1/2 |
| 4 September | 88 | 2 | 6 | 94 | 5 | 7 1/2 | 96 | 17 | 6 | 100 | 3 | 1 1/2 | 99 | 11 | 3 | 96 | 17 | 6 |
| 4 December | 86 | 12 | 6 | 92 | 13 | 1 1/2 | 97 | 15 | 0 | 98 | 7 | 6 | 98 | 0 | 0 | 94 | 5 | 7 1/2 |
| 1965–4 March | 84 | 19 | 4 1/2 | 90 | 5 | 7 1/2 | 95 | 5 | 7 1/2 | 96 | 8 | 9 | 95 | 11 | 3 | 92 | 12 | 6 |
| 2 June | 83 | 10 | 0 | 88 | 18 | 1 1/2 | 93 | 7 | 6 | 94 | 13 | 9 | 93 | 13 | 9 | 90 | 10 | 7 1/2 |
| 2 September | 83 | 6 | 3 | 89 | 6 | 10 1/2 | 94 | 14 | 4 1/2 | 94 | 5 | 7 1/2 | 94 | 2 | 6 | 90 | 13 | 1 1/2 |
| 2 December | 85 | 7 | 6 | 90 | 18 | 9 | 96 | 6 | 3 | 96 | 6 | 10 1/2 | 95 | 12 | 6 | 92 | 13 | 1 1/2 |
| 1966–3 March | 84 | 10 | 7 | 90 | 18 | 9 | 94 | 13 | 9 | 94 | 18 | 9 | 94 | 7 | 6 | 91 | 8 | 9 |
| 2 June | 84 | 7 | 6 | 90 | 11 | 3 | 94 | 4 | 4 | 94 | 9 | 4 | 94 | 8 | 9 | 91 | 6 | 9 |
| 1 September | 80 | 11 | 3 | 87 | 13 | 9 | 87 | 18 | 9 | 90 | 19 | 4 | 87 | 14 | 4 | 86 | 8 | 9 |
| 1 December | 81 | 0 | 7 | 89 | 3 | 9 | 88 | 18 | 9 | 92 | 10 | 0 | 90 | 1 | 7 | 88 | 16 | 3 |
INTEREST—The amount of interest on the debt domiciled in the respective markets during the year ended 31 March 1966 are given in the following table:
| Domicile of Debt | Amount of Interest |
|---|---|
| $ | |
| London | 12,093,598 |
| United States of America | 3,193,858 |
| New Zealand | 79,217,774 |
| All debt | 94,505,230 |
The total amount of interest credited to the Consolidated Revenue Account on account of capital liability of various enterprises during 1965–66 was $55,082,000. The contributing accounts were: Post Office, $9,276,000; Electric Supply, $21,696,000; Housing, $7,288,000; Housing Construction, $936,000; Land Settlement, $5,906,000; Land Settlement under Land Act, $2,000,000; State Advances Corporation, $7,934,000; and New Zealand Broadcasting Corporation, $46,000.
Interest is also received from the investment of other public moneys, the total under this heading being $4,260,000–$2,160,000 from the Public Account Cash Balance Investment Account; $212,000 from the Christmas Island Phosphate Commission; $38,000 from the British Phosphate Commission; $584,000 from the Trust Account; $38,000 from the Loans Redemption Account; and $524,000 from the Tasman Pulp and Paper Co. Ltd. The total interest receipts of the Consolidated Revenue Account were thus $59,342,000, leaving the net interest charges for the year $35,164,000.
The following table shows the gross payments of interest together with the net interest charges for the last eleven financial years.
| Year Ended 31 March | Gross Payments | Receipts | Gross Payments Less Receipts | Net Interest as Percentage of Total Taxation |
|---|---|---|---|---|
| $N.Z. (thousand) | ||||
| 1956 | 42,002 | 18,294 | 23,708 | 4.84 |
| 1957 | 45,458 | 23,108 | 22,348 | 4.42 |
| 1958 | 50,632 | 24,784 | 25,848 | 5.28 |
| 1959 | 54,554 | 27,570 | 26,984 | 4.42 |
| 1960 | 57,518 | 29,954 | 27,564 | 4.64 |
| 1961 | 60,170 | 32,606 | 27,564 | 4.12 |
| 1962 | 63,356 | 40,388 | 22,968 | 3.21 |
| 1963 | 71,154 | 47,096 | 24,058 | 3.52 |
| 1964 | 81,818 | 51,242 | 30,576 | 4.06 |
| 1965 | 87,136 | 54,042 | 33,094 | 4.20 |
| 1966 | 94,506 | 59,342 | 35,164 | 4.16 |
Administration and management charges in respect of debt services amounted to $984,000 in 1965–66.
The following table shows the movement in external debt and annual interest charges on external debt expressed as percentages of export earnings.
| Year Ended 31 March | External Debt | Interest Charges | ||
|---|---|---|---|---|
| Amount | Percentage of Total Public Debt | Amount | Percentage of Export Receipts | |
| $(m) | $(m) | |||
| 1931 | 264.4 | 52.9 | 11.0 | 15.9 |
| 1936 | 268.2 | 52.3 | 11.6 | 14.5 |
| 1941 | 266.0 | 42.5 | 13.4 | 11.8 |
| 1946 | 189.0 | 16.6 | 4.2 | 7.9 |
| 1951 | 155.6 | 11.7 | 5.2 | 1.3 |
| 1956 | 191.6 | 13.0 | 6.8 | 1.3 |
| 1961 | 253.4 | 14.6 | 10.4 | 1.8 |
| 1962 | 279.2 | 15.4 | 10.2 | 1.7 |
| 1963 | 314.0 | 16.2 | 13.0 | 2.0 |
| 1964 | 321.8 | 15.9 | 14.0 | 1.9 |
| 1965 | 330.8 | 15.5 | 15.2 | 2.0 |
| 1966 | 333.2 | 14.8 | 15.2 | 2.0 |
AMORTISATION OF DEBT: Public Debt Repayment—With certain exceptions, the repayment of the public debt is now subject to the provisions of the New Zealand Loans Act 1953. In 1925 provision was made to repay the public debt within 60 years from 1925 or from the date of raising subsequent loans.
An appropriation annual contribution is made to the Loans Redemption Account and is utilised to redeem such securities as the Public Debt Commission determines, which are a charge upon the public revenues of New Zealand. All other moneys raised or available for the purpose of repayment of any loan forming a charge on public revenues are similarly paid into the Loans Redemption Account and utilised for the redemption of such securities charged upon the public revenues as the Minister of Finance from time to time determines.
The repayment scheme provided for under the New Zealand Loans Act 1953 does not apply to the whole of the public debt, moneys borrowed on the security of Treasury bills issued under section 41 of the Public Revenues Act 1953 being excluded. The funded debt and a contingent liability linked with it are not part of the debt nor are they covered by the repayment provisions.
Amounts devoted to the repayment or redemption of the public debt during each of the last five years are set out below, together with a brief statement of the class of debt affected by redemption operations.
| Year Ended 31 March | Repayments Section 58 (a) of 1953 Act | Amounts Utilised for Redemption | Class of Debt Affected by Redemption | |||
|---|---|---|---|---|---|---|
| Section 58 (b) of 1953 Act | Section 58 (c) of 1953 Act | Total Amount Utilised | Item | Amount | ||
| $(thousand) | ||||||
| 1962 | 89,272 | 21,742 | 52,204 | 73,946 | War loans | 67,234 |
| Other debt | 6,712 | |||||
| 1963 | 274,060 | 6,000 | 33,250 | 39,250 | War loans | 25,328 |
| Other debt | 13,922 | |||||
| 1964 | 474,010 | 20,262 | 34,108 | 54,370 | War loans | 25,726 |
| Other debt | 28,644 | |||||
| 1965 | 190,688 | 18,280 | 13,218 | 31,498 | War loans | 18,554 |
| Other debt | 12,944 | |||||
| 1966 | 190,292 | 16,928 | 20,952 | 37,880 | War loans | 26,418 |
| Other debt | 11,462 | |||||
The following table shows the amounts available for redemption for each of the last five years under the repayment scheme provided for by the New Zealand Loans Act 1953, the amounts utilised, and the nominal value of securities redeemed and cancelled to date.
| Year Ended 31 March | Balance of Amortisation Contributions Unspent at Beginning of Year | Transfers from Consolidated Fund | Utilised to Redeem and Cancel Securities | Nominal Value of Securities Redeemed and Cancelled from 1 April 1925 to Date | ||
|---|---|---|---|---|---|---|
| 1/2 Percent of Public Debt Outstanding at Beginning of Year | 4 Percent of Total Amount of Public Debt Redeemed or Repaid to Beginning of Year | Total | ||||
| $(thousand) | ||||||
| 1962 | 2,452 | 9,038 | 11,380 | 20,418 | 21,742 | 284,426 |
| 1963 | – | 9,672 | 12,196 | 21,868 | 6,000 | 290,426 |
| 1964 | 4,000 | 10,108 | 13,070 | 23,178 | 20,262 | 310,686 |
| 1965 | 1,738 | 10,698 | 13,998 | 24,696 | 18,280 | 328,966 |
| 1966 | 6,638 | 11,280 | 14,986 | 26,266 | 16,928 | 345,894 |
GOVERNMENT INVESTMENTS—In the course of the year's financial transactions securities are bought and sold by Treasury accounts, and the investments held as at 31 March in each year, while forming part of the debt, do not represent amounts due directly or indirectly to the public. New Zealand Government investments held by Treasury accounts as at 31 March of the last five years have been: 1962, $139,442,000; 1963, $117,226,000; 1964, $100,018,000; 1965, $42,682,000; 1966, $42,618,000.
In addition to the above, Government investments in corporations, etc., held at 31 March 1966 (shown in the return required by the Public Revenues Act 1953 and published in parliamentary paper B. 1 [Pt. 1]) are given in the following table.
| Investment | Amount at 31 March 1966 |
|---|---|
| Owned by New Zealand Government— | $(thousand) |
| Air New Zealand Ltd. | 8,000 |
| Bank of New Zealand | 24,037 |
| Commonwealth Fabric Corporation | 1,000 |
| Linen Flax Corporation | 360 |
| New Zealand Broadcasting Corporation | 800 |
| New Zealand National Airways Corporation | 5,000 |
| New Zealand Steel Ltd. | 1,182 |
| New Zealand Steel Investigating Co. | 500 |
| Reserve Bank of New Zealand | 3,000 |
| Tourist Hotel Corporation of New Zealand | 9,347 |
| Owned jointly with other Government— | |
| British Phosphate Commission | 904 |
| Christmas Island Phosphate Commission | 4,535 |
| Shareholdings in limited companies— | |
| Bay of Plenty Cooperative Fertiliser Co. Ltd. | 405 |
| Dominion Salt Ltd. | 300 |
| East Coast Farmers' Fertiliser Co. Ltd. | 110 |
| Maramarua Coalfields Ltd. | 188 |
| New Zealand Woolpack and Textiles Ltd. | 400 |
| Southland Co-op. Phosphate Co. Ltd. | 96 |
| Tasman Pulp and Paper Co. Ltd. | 6,400 |
| Miscellaneous | 141 |
| International finance organisations— | |
| Cash portion of subscriptions | 31,120 |
| Total | 97,823 |
CENTRAL AND LOCAL GOVERNMENT DEBT—The statistics given throughout this subsection refer to the indebtedness of the Central Government only, and do not include the debt of local authorities, which is dealt with in the section of this volume relating to local government finance.
Local authorities had at 31 March 1966 gross indebtedness equivalent to $546 million and if this amount be added to the gross debt of the Central Government at 31 March 1966 ($2,256 million) the aggregate becomes $2,802 million.
The figures relating to local authorities' indebtedness in the foregoing paragraph are inclusive of hospital boards, and to this extent differ from those generally given in the section on local government. Hospital board gross indebtedness at 31 March 1966 totalled $76 million.
GENERAL—The constitution and franchise of local authorities are described in Section 2, History, Constitution, and Government.
Local government is concerned with the provision of facilities for the population of a limited area, with finances levied from that area. The major authorities are city, borough, and county councils. These authorities raise money mainly by rates on property and by loans. They expend it on the provision of roads, water supply, sewerage, transport, recreational, and other services. Electric power boards and harbour boards, among the larger of the other local authorities, collect revenue from consumers or users in payment for the facilities or services provided.
Detailed statistics relating to each local authority, other than hospital boards, are contained in the Report on the Local Authority Statistics, an annual publication of the Department of Statistics. Hospital boards, which supply their returns to the Department of Health, are omitted from most of the statistics contained in this section. A special note is made where they are included, while summarised data relating to them will be found in Section 5B.
In general, the local authority year ends on 31 March. Exceptions are harbour boards (other than Mokau and Greymouth) where the year ends on the preceding 30 September, the Hutt Valley Drainage Board where the year ends on the last day of February, and Chatham Islands County, where the financial year now ends on 31 December.
RATING—Local authorities are largely dependent on revenue from rates to carry out their activities, and even loans raised for special purposes are, except where the assets purchased provide revenue to meet the loan charges, ultimately liquidated by rate revenues—known then as special rates. Three broad classes of rates are distinguished:
General, for general purposes;
Special rates imposed to secure the repayment of loan money, being sufficient to produce interest and sinking fund, or interest and instalment of principal, as the case may be; and
Separate rates levied for the construction of public works, for the acquisition of land and buildings, or for the benefit of the whole or part of a local district.
There are three main systems of rating: (a) by capital (land and improvements) value; (b) by annual value; and (c) by unimproved value.
For rating on either the capital value or the unimproved value, the rating roll is based on the district valuation roll prepared annually by the Valuation Department. Where the rating is on the annual value, the local authority generally prepares its valuation roll on the basis of the valuations made by its own valuers. There is, however, provision that annual values may be prepared on the basis of the annual value being equal to $6 percent of the capital value, and also that a rate of 5c in the dollar on the annual value is equivalent to 0.31c in the dollar on the capital value. Provision is also made for the Valuer-General to act as a local authority valuer where an annual value roll is to be prepared.
For Chatham Islands county, import and export dues are charged in lieu of rates on land. In the case of rabbit boards the system normally used is by rating on an acreage basis, though occasionally some boards rate according to the number of sheep and/or cattle carried.
The system of rating normally attributed to a local authority is that applicable to the general rate, but it is stressed that, in many instances, subsidiary rates of the local authority are levied in accordance with other systems.
With harbour boards, two types of rates are applicable, namely: (a) harbour improvement rates, based on so much per ton of cargo by weight or measurement; and (b) harbour rates on rateable property, which are levied according to the system of rating in force by each of the local authorities within the harbour boards rating area. However, the Rating Act 1925 gives to harbour boards the power to have a system of rating different from that in force in all or some of its constituent local authority districts.
TERRITORIAL LOCAL AUTHORITIES—The following table shows the amounts levied under the various systems of rating and by annual fees or charges by the territorial local authorities for the year ended 31 March 1965. Amounts levied on behalf of other authorities are included.
| System of Rating | Counties | Cities and Boroughs | Town Districts | Road Districts | Total |
|---|---|---|---|---|---|
| $(thousand) | |||||
| Unimproved value | 15,922 | 35,386 | 218 | 62 | 51,588 |
| Capital value | 5,994 | 2,514 | 46 | 10 | 8,564 |
| Annual value | 28 | 11,016 | 12 | – | 11,056 |
| Uniform fees and charges | 164 | 806 | 20 | – | 990 |
| Totals | 22,108 | 49,724 | 296 | 72 | 72,200 |
The total of all rates collected by counties was equal to $7.05 per $1,000 of rateable capital value at the beginning of the year. The corresponding figure for cities and boroughs was $11.17; for independent town districts, $11.99; for dependent town districts, $6.46 (excluding rates levied by county councils).
Receipts and payments for counties, cities and boroughs, town districts, and road districts for the latest three years are shown in the following table.
| Receipts | Year Ended 31 March | ||
|---|---|---|---|
| 1964 | 1965 | 1966* | |
| $(000) | |||
| Rates and levies | 60,294 | 65,720 | 69,840 |
| Public utilities, licences, rents, and interest | 69,434 | 72,592 | 77,196 |
| Government grants and subsidies | 28,744 | 30,764 | 33,422 |
| Loan money | 36,074 | 35,428 | 30,336 |
| Other receipts | 9,434 | 9,748 | 9,794 |
| Total receipts | 203,980 | 214,252 | 220,588 |
| Payments | Year Ended 31 March | ||
|---|---|---|---|
| 1964 | 1965 | 1966* | |
| * Provisional. | |||
| $(000) | |||
| Construction and maintenance | 149,156 | 163,538 | 176,656 |
| Administration | 9,986 | 11,074 | 12,680 |
| Interest on loans | 8,634 | 9,760 | 9,902 |
| Loans repaid | 15,984 | 17,244 | 16,342 |
| Other payments | 13,746 | 13,086 | 14,630 |
| Total payments | 197,506 | 214,702 | 230,210 |
RECEIPTS—The sources of revenue of all local authorities are shown by broad classes in the following table.
| Year Ended 31 March | Rates and Levies | Inspection Charges and Licence Fees | Receipts from Public Utilities, Rents, and Interest | Government Grants and Subsidies | Other Receipts (Including Loan Money) | Total Receipts |
|---|---|---|---|---|---|---|
| $(thousand) | ||||||
| 1955 | 36,520 | 1,524 | 69,102 | 17,032 | 25,058 | 149,236 |
| 1956 | 37,766 | 1,496 | 75,296 | 20,718 | 30,128 | 165,404 |
| 1957 | 41,318 | 1,322 | 77,808 | 23,100 | 37,636 | 181,184 |
| 1958 | 45,416 | 1,398 | 83,288 | 23,942 | 47,192 | 201,236 |
| 1959 | 48,784 | 1,462 | 96,344 | 24,554 | 45,066 | 216,210 |
| 1960 | 51,488 | 1,870 | 99,846 | 25,428 | 58,132 | 236,764 |
| 1961 | 54,948 | 2,046 | 106,712 | 28,236 | 59,898 | 251,840 |
| 1962 | 57,914 | 1,914 | 116,970 | 30,488 | 48,288 | 255,574 |
| 1963 | 62,444 | 1,900 | 123,590 | 33,368 | 62,828 | 284,130 |
| 1964 | 68,342 | 2,284 | 150,908 | 34,400 | 85,596 | 341,530 |
| 1965 | 77,172 | 2,828 | 161,122 | 36,954 | 85,718 | 363,794 |
During the financial year 1964–65 local authorities received by way of rates, inspection charges, and licence fees a total amount of $80,000,136, which, for a total mean population of 2,611,020 is equivalent to $30.64 per head.
Of the total receipts for 1964–65, rates yielded 21.2 percent; licences, etc., 0.8 percent; public utilities, rents, and interest, 44.3 percent; Government, 10.2 percent; and other receipts, 23.5 percent.
A fairly large proportion of the receipts of urban local authorities result from the sales of commodities or services, for instance, sales of electric light, power and gas, and fares collected for public transport. Government grants and subsidies to county councils exceed the amount collected in rates.
The next table shows the receipts for 1964–65 (classified as in the preceding table) for each type of local authority.
| Local Authority | Rates | Inspection Charges and Licence Fees | Receipts from Public Utilities, Rents, and Interest | Government Grants and Subsidies | Other Receipts (Including Loan Money) | Total Receipts |
|---|---|---|---|---|---|---|
* Fees received from classified licences issued amounted to $878,460, the difference of $131,284 representing other inspection charges, including income from fines and pounds, hydatids control fees, and fees for service rendered, e.g., testing fees † Levy on milk. ‡ Harbour improvement rate of 51,449,552, and rates on land in harbour rating areas, $889,160. § Of this total $3,674,008 represented transport receipts. $27,800,324 sales of electric light and power, and $2,501,658 sales of gas. | ||||||
| $(thousand) | ||||||
| Catchment boards | 1,560 | – | 148 | 3,438 | 1,892 | 7,038 |
| City and borough councils | 44,930 | 1,788 | 56,754§ | 11,226 | 35,658 | 150,356 |
| County councils | 20,430 | 1,010* | 12,864 | 19,326 | 9,336 | 62,966 |
| Electric power boards | – | – | 62,766 | – | 9,012 | 71,778 |
| Fire boards | – | – | 2,832 | 296 | 386 | 3,514 |
| Gas boards | – | – | 336 | 6 | – | 342 |
| Harbour boards | 2,338‡ | – | 17,838 | 76 | 14,094 | 34,346 |
| Harbour bridge authority | – | – | 1,682 | – | 1,194 | 2,876 |
| Land drainage boards | 324 | – | 6 | 146 | 70 | 546 |
| Local railway board | – | – | 66 | – | 8 | 74 |
| Milk boards | 16† | 12 | 112 | – | 22 | 162 |
| Museum authority | 80 | – | 32 | – | 88 | 200 |
| Nassella tussock boards | – | – | 72 | 146 | 20 | 238 |
| Plantation board | – | – | 50 | – | 4 | 54 |
| Rabbit boards | 1,326 | – | 184 | 1,688 | 116 | 3,314 |
| Regional authority | – | – | – | 8 | 1,344 | 1,352 |
| River boards | 144 | – | 10 | 232 | 130 | 516 |
| Road boards | 72 | 2 | 36 | 100 | 10 | 220 |
| Road tunnel authority | – | – | 272 | – | 38 | 310 |
| Town boards— | ||||||
| Dependent | 56 | 2 | 24 | 20 | 10 | 112 |
| Independent | 232 | 14 | 96 | 90 | 164 | 596 |
| Underground water authorities | – | – | – | – | 30 | 30 |
| Urban drainage boards | 5,308 | – | 230 | 8 | 11,376 | 16,922 |
| Urban transport boards | 338 | – | 4,712 | – | 630 | 5,680 |
| Valley authority | – | – | – | 148 | 86 | 234 |
| Water supply board | 18 | – | – | – | – | 18 |
| Totals | 77,172 | 2,828 | 161,122 | 36,954 | 85,718 | 363,794 |
Of the total rates of $77,171,700 collected during 1964–65, general rates levied brought in $54,649,974 and other rates (including penalty on overdue rates) $22,521,726. Of the latter, $19,108,938 was received by cities and boroughs, and $2,152,882 by counties. The whole of the rates collected by harbour boards, $2,338,712, were classed as general rates.
Receipts from Central Government—In earlier issues of the Yearbook a detailed statement of revenue receipts by local authorities from the Central Government was given. This detailed breakdown is no longer available, the last analysis appearing on page 844 of the 1961 issue of the Yearbook.
EXPENDITURE—The expenditure of all local authorities during each of the latest 11 years has been as follows.
| Year Ended 31 March | Maintenance and Construction | Hospital Boards Levies | Administration | Interest on Loans | Other | Total Expenditure |
|---|---|---|---|---|---|---|
| $(thousand) | ||||||
| 1955 | 116,188 | 2,910 | 9,166 | 5,748 | 13,948 | 147,962 |
| 1956 | 132,836 | 2,160 | 9,714 | 6,314 | 16,094 | 167,118 |
| 1957 | 145,502 | 1,320 | 10,856 | 7,318 | 16,480 | 181,480 |
| 1958 | 159,238 | – | 11,714 | 8,450 | 17,174 | 196,576 |
| 1959 | 171,738 | – | 12,382 | 10,266 | 18,814 | 213,198 |
| 1960 | 180,184 | – | 12,464 | 11,452 | 27,092 | 231,192 |
| 1961 | 190,450 | – | 13,248 | 13,150 | 28,162 | 245,010 |
| 1962 | 207,860 | – | 14,324 | 14,514 | 30,846 | 267,544 |
| 1963 | 222,840 | – | 15,420 | 15,816 | 32,400 | 286,476 |
| 1964 | 241,516 | – | 18,116 | 17,520 | 52,470 | 329,624 |
| 1965 | 262,838 | – | 19,974 | 19,178 | 59,116 | 361,106 |
Included in the total of other payments for 1964–65 is an amount of $39,445,906 in respect of loans repaid, which compares with the figure of $31,966,776 in 1963–64.
The main items of expenditure of the various classes of local authorities during 1964–65 are shown below.
| Local Authority | Maintenance and Construction | Administration | Interest on Loans | Loans Repaid | Other Payments | Total Expenditure |
|---|---|---|---|---|---|---|
| $(thousand) | ||||||
| Catchment boards | 5,182 | 846 | 134 | 234 | 468 | 6,862 |
| City and borough councils | 111,512 | 6,996 | 8,336 | 15,152 | 9,314 | 151,312 |
| County Councils | 51,344 | 4,006 | 1,392 | 2,064 | 3,742 | 62,548 |
| Electric power boards | 56,988 | 4,438 | 2,632 | 4,866 | 2,724 | 71,650 |
| Fire boards | 2,818 | 152 | 150 | 330 | 26 | 3,476 |
| Gas boards | 372 | 18 | 4 | 18 | 12 | 426 |
| Harbour boards | 18,454 | 1,896 | 2,974 | 5,416 | 2,600 | 31,340 |
| Harbour bridge authority | 674 | 90 | 632 | 1,154 | 64 | 2,614 |
| Land drainage boards | 394 | 56 | 16 | 24 | 32 | 520 |
| Local railway board | 50 | 4 | – | – | 4 | 58 |
| Milk boards | 114 | 38 | – | – | 8 | 162 |
| Museum authority | 30 | 80 | – | – | 2 | 112 |
| Nassella tussock boards | 222 | 20 | – | – | 4 | 246 |
| Plantation board | 44 | 2 | – | – | 4 | 52 |
| Rabbit boards | 2,968 | 315 | 10 | 22 | 26 | 3,344 |
| Regional authority | 1,240 | 78 | 104 | 42 | 4 | 1,466 |
| River boards | 412 | 30 | 14 | 18 | 10 | 484 |
| Road boards | 198 | 22 | – | 2 | 4 | 226 |
| Road tunnel authority | 808 | 32 | – | – | 98 | 938 |
| Town boards— | ||||||
| Dependent | 94 | 12 | 2 | 2 | 4 | 116 |
| Independent | 388 | 40 | 28 | 26 | 20 | 502 |
| Underground water authorities- | 22 | 8 | – | – | – | 28 |
| Urban drainage boards | 4,288 | 464 | 2,466 | 9,258 | 266 | 16,742 |
| Urban transport boards | 4,124 | 258 | 282 | 818 | 232 | 5,712 |
| Valley authority | 84 | 66 | 2 | – | 2 | 154 |
| Water supply board | 14 | 4 | – | – | – | 16 |
| Totals | 262,838 | 19,974 | 19,178 | 39,446 | 19,670 | 361,106 |
The next table shows the main items as percentages of total expenditure for some of the more important classes of local authorities for 1964–65.
| Local Authority | Maintenance and Construction | Administration | Interest on Loans | Loans Repaid | Other Payments | Total Expenditure |
|---|---|---|---|---|---|---|
| * Includes authorities not listed. | ||||||
| percent | ||||||
| Catchment boards | 75.5 | 12.3 | 2.0 | 3.4 | 6.8 | 100.0 |
| City and borough councils | 73.7 | 4.6 | 5.5 | 10.0 | 6.2 | 100.0 |
| County councils | 82.1 | 6.4 | 2.2 | 3.3 | 6.0 | 100.0 |
| Electric power boards | 79.5 | 6.2 | 3.7 | 6.8 | 3.8 | 100.0 |
| Fire boards | 81.1 | 4.4 | 4.3 | 9.5 | 0.7 | 100.0 |
| Harbour boards | 58.9 | 6.0 | 9.5 | 17.3 | 8.3 | 100.0 |
| Rabbit boards | 88.8 | 9.5 | 0.3 | 0.7 | 0.7 | 100.0 |
| Town boards | 78.0 | 8.4 | 4.9 | 4.5 | 4.2 | 100.0 |
| Urban drainage boards | 25.6 | 2.8 | 14.7 | 55.3 | 1.6 | 100.0 |
| Urban transport boards | 72.2 | 4.5 | 4.9 | 14.3 | 4.1 | 100.0 |
| All authorities* | 72.8 | 5.5 | 5.3 | 10.9 | 5.5 | 100.0 |
The table following gives, in respect of cities and boroughs only, the expenditure on new works out of loan money during the latest 11 years, classified under various heads.
| Year Ended 31 March | Roads, Streets, and Bridges | Drainage and Sewerage | Reserves, Domains, Halls, Community Centres, Libraries, Baths, and Recreational Facilities | Gasworks and Electrical Works | Water Supply | Other Public Works (Including Housing) | Total |
|---|---|---|---|---|---|---|---|
| * Includes $485,860 for aerodromes; $2,336,154 for housing construction; and $1,259,544 for parking meters, buildings, and areas; and $406,158 for central plant. | |||||||
| $(thousand) | |||||||
| 1955 | 2,602 | 1,174 | 884 | 902 | 3,274 | 1,636 | 10,472 |
| 1956 | 2,638 | 1,704 | 1,374 | 732 | 3,604 | 1,692 | 11,744 |
| 1957 | 3,406 | 1,626 | 1,454 | 682 | 4,018 | 2,520 | 13,706 |
| 1958 | 3,656 | 1,544 | 1,242 | 1,082 | 6,716 | 3,802 | 18,042 |
| 1959 | 3,606 | 1,972 | 1,410 | 1,456 | 3,046 | 4,270 | 15,760 |
| 1960 | 4,158 | 2,680 | 1,212 | 1,460 | 2,746 | 3,804 | 16,060 |
| 1961 | 3,672 | 2,440 | 526 | 1,518 | 2,550 | 2,718 | 13,424 |
| 1962 | 3,436 | 2,984 | 496 | 2,334 | 3,370 | 4,128 | 16,748 |
| 1963 | 2,608 | 3,354 | 1,230 | 1,368 | 4,032 | 4,566 | 17,158 |
| 1964 | 2,888 | 4,120 | 1,406 | 1,546 | 3,812 | 6,220 | 19,992 |
| 1965 | 3,246 | 5,140 | 1,900 | 1,122 | 4,122 | 9,418* | 24,948 |
ASSETS AND LIABILITIES—The assets and liabilities of local authorities at the end of the financial year 1964–65 were as shown in the table following.
| Local Authority | Assets | Liabilities | |||
|---|---|---|---|---|---|
| Cash and Investments. | Other (as Estimated by Authority) | Net Debt (Gross Public Debt, Less Sinking Funds Held) | Other | Total Net Liabilities | |
| * Includes works in progress. | |||||
| $(thousand) | |||||
| Catchment boards | 2,028 | 16,592 | 2,870 | 452 | 3,322 |
| City and borough councils | 57,336 | 355,022 | 174,446 | 15,036 | 189,482 |
| County councils | 13,268 | 65,236 | 30,544 | 5,552 | 36,096 |
| Electric power boards | 20,722 | 172,414 | 55,908 | 11,962 | 67,870 |
| Fire boards | 968 | 9,170 | 3,110 | 108 | 3,218 |
| Gas boards | 4 | 662 | 190 | 4 | 194 |
| Harbour boards | 25,774 | 113,976 | 69,686 | 4,462 | 74,148 |
| Harbour bridge authority | 1,424 | 16,502 | 13,418 | 150 | 13,568 |
| Land drainage boards | 300 | 372 | 308 | 38 | 346 |
| Local railway board | 30 | 388 | – | 6 | 6 |
| Milk boards | 124 | 260 | – | 2 | 2 |
| Museum authority | 410 | 1,960 | – | 6 | 6 |
| Nassella tussock boards | 16 | 156 | – | 2 | 2 |
| Plantation board | 88 | 282 | – | 2 | 2 |
| Rabbit boards | 1,172 | 3,532 | 156 | 142 | 298 |
| Regional authority | 472 | 3,572 | 3,570 | 256 | 3,826 |
| River boards | 454 | 348 | 244 | 60 | 304 |
| Road boards | 36 | 228 | 18 | 22 | 40 |
| Road tunnel authority | 158 | 5,676 | 5,704 | 26 | 5,730 |
| Town boards— | |||||
| Dependent | 108 | 388 | 50 | 2 | 52 |
| Independent | 220 | 1,664 | 670 | 36 | 706 |
| Underground water authorities | 8 | 8 | – | 2 | 2 |
| Urban drainage boards | 5,976 | 64,350 | 47,656 | 1,016 | 48,672 |
| Urban transport boards | 2,780 | 13,126 | 5,158 | 820 | 5,978 |
| Valley authority | 92 | 58 | 22 | 12 | 34 |
| Water supply board | 6 | 8 | – | – | – |
| Totals | 133,974 | 845,950* | 413,728 | 40,176 | 453,904 |
The figures shown in the column “Other Assets” are taken from the annual statistical returns submitted by the authorities to the Department of Statistics, but are far from complete, inasmuch as no estimates are made for certain items. This applies particularly to roads which, although representing considerable wealth to the community, do not figure at all in the assets. The greater part of the expenditure of counties and road districts is made in this direction. For cities and boroughs, although the proportion is very much less, 20.17 percent of the loan-money expenditure during the last 11 years (as given in the lower table on page 789) was on roads, streets, and bridges. Assets of local authorities (excluding hospital boards) as returned for the latest available 12 years are as under.
| As at 31 March | Cash Assets | Other Assets (Estimated) |
|---|---|---|
| $(000) | ||
| 1954 | 54,590 | 280,620 |
| 1955 | 58,872 | 310,956 |
| 1956 | 59,850 | 345,540 |
| 1957 | 64,410 | 382,988 |
| 1958 | 74,202 | 427,372 |
| 1959 | 80,502 | 470,498 |
| 1960 | 77,910 | 551,834 |
| 1961 | 90,518 | 596,770 |
| 1962 | 90,014 | 653,820 |
| 1963 | 99,278 | 712,362 |
| 1964 | 132,564 | 768,420 |
| 1965 | 133,974 | 845,950 |
Cash assets are made up chiefly of loan balances, reserve investments, and cash in hand. Sinking funds, which amounted to $22,466,054 at 31 March 1965, do not appear in the foregoing table, but are shown as a deduction from the gross loan indebtedness of local authorities. Other assets are composed mainly of fixed assets and of stocks of stores and materials.
Cities and boroughs are responsible for 42.1 percent of the total assets, electric power districts for 19.7 percent and harbour boards for 14.3 percent. Counties show the comparatively low percentage of 8.0 but this is due to the fact that practically the whole of county expenditure is made on roads, bridges, etc., for which no estimates are available.
REGISTERED STOCK—The Local Authorities Amendment Act 1955 authorised local authorities to issue registered stock and nominated the Reserve Bank as Registrar. Prior to 1955 securities given by local authorities for loan moneys were in bearer form, being either debentures for a fixed term with interest coupons attached or table debentures providing for periodic repayments of principal and interest. The following table indicates the growth in this form of security. (Source: Reserve Bank of New Zealand.)
| Date | Amount | Total Gross Debt of Local Authorities at 31 March* | Registered Stock as a Percentage of Gross Debt |
|---|---|---|---|
* Includes hospital boards. † Estimated. | |||
| $(000) | percent | ||
| March 1959 | 68,684 | 294,518 | 23.32 |
| March 1960 | 109,852 | 337,318 | 32.64 |
| March 1961 | 149,834 | 373,698 | 40.06 |
| March 1962 | 170,838 | 395,434 | 43.20 |
| March 1963 | 208,878 | 434,090 | 48.12 |
| March 1964 | 259,858 | 474,356 | 54.78 |
| March 1965 | 302,484 | 511,416 | 59.15 |
| March 1966 | 336,520 | 544,448† | 61.81 |
BORROWING—Under the Local Authorities Loans Act 1956 all loan proposals of local authorities, except in regard to money borrowed in anticipation of revenue, require the sanction of the Local Authorities Loans Board.
As a general rule local authorities may raise a loan by special order and without a poll of ratepayers, but, in the case of a local authority that is a rating body, a poll of ratepayers is to be taken if—
The Local Authorities Loans Board requires a poll to be taken; or
Before the date fixed for the meeting of the local authority to confirm the resolution to raise the loan not less than 5 percent of the ratepayers demand a poll; or
The local authority itself decides to take a poll.
A poll cannot be required in cases such as renewal loans, loans raised for emergency expenditure by reason of flood, storm, earthquake, etc., or loans for work of national and local importance and carried out by an agreement between the Government and a local authority.
Where a poll is required it shall be deemed to be carried if a bare majority of the valid votes recorded is in favour of the proposal. The properties and revenue of the local authority may be pledged as security for the repayment of any principal sum or interest thereon, or a special rate may be levied for the same purpose.
The borrowing activities of certain types of local authority are subject to special provisions. Under the Hospitals Act 1957 a hospital board must first obtain the approval of the Minister of Health before exercising its power to borrow; under the Fire Services Act 1949 the boards of urban fire authorities must obtain the prior consent of the Fire Service Council, while the Fire Services Amendment Act 1963 brings the procedure for borrowing by fire authorities into line with the procedures of the Local Authorities Loans Act 1956. Harbour boards derive their authority to borrow for harbour works from special empowering legislation, and similar authority is given for the capital works of certain other local authorities.
INDEBTEDNESS—The total gross public debt of local authorities at 31 March 1965 amounted to $436,193,508, while net indebtedness (i.e., after deducting accumulated sinking funds from debentures and other securities) was $413,727,454, at face value according to country of domicile. If the amount domiciled overseas is converted to New Zealand currency, the total gross public debt at 31 March 1965, at the then rate of exchange, was $436,100,708. When hospital boards were included, the total gross public debt of local authorities at 31 March 1965 was $511,416,650. Hospital board loans are shown in Section 5B. Since 1 April 1958 the Government has assumed complete financial responsibility for public hospital finance, apart from the raising by hospital boards of loans for major capital construction, and these must be approved by the Minister of Health.
Included in the gross public debt figure in the previous paragraphs are amounts owing by local authorities to Government Departments, and the amounts of the securities held at 31 March for the last five years are shown in the following table. The percentages to the total gross public debt are given at the foot of the table.
| Department | As at 31 March | ||||
|---|---|---|---|---|---|
| 1962 | 1963 | 1964 | 1965 | 1966 | |
| $(thousand) | |||||
| Government Life Insurance Office | 23,572 | 24,440 | 23,360 | 22,800 | 22,444 |
| National Provident Fund Board | 56,472 | 66,596 | 74,254 | 82,806 | 88,008 |
| Public Trustee | 7,832 | 8,664 | 9,256 | 9,482 | 9,726 |
| State Advances Corporation— | |||||
| Trading | 18,286 | 17,466 | 16,762 | 15,992 | 15,104 |
| Housing Account | 3,770 | 4,558 | 5,564 | 6,742 | 8,342 |
| Rural Housing Act 1939 | 2,642 | 3,234 | 3,840 | 4,492 | 5,776 |
| Other | 10,196 | 10,668 | 11,500 | 12,964 | 13,714 |
| Totals | 122,772 | 135,626 | 144,536 | 155,278 | 163,114 |
| percent | percent | percent | percent | percent | |
| Percentage of total gross public debt | 31.1 | 31.2 | 30.5x | 30.4 | 30.0 |
The outstanding loans of local authorities (other than hospital boards) at the end of each of the latest 11 years are shown in the following table.
| At 31 March | Gross Public Debt | Net Debt (i.e., Less Accumulated Sinking Funds) |
|---|---|---|
| $(thousand) | ||
| 1955 | 158,640 | 144,150 |
| 1956 | 175,968 | 161,050 |
| 1957 | 198,176 | 183,340 |
| 1958 | 229,350 | 214,478 |
| 1959 | 255,940 | 240,990 |
| 1960 | 287,114 | 273,008 |
| 1961 | 318,828 | 303,772 |
| 1962 | 337,552 | 320,756 |
| 1963 | 370,186 | 350,070 |
| 1964 | 401,794 | 381,462 |
| 1965 | 436,194 | 413,728 |
Of the total net indebtedness of $413,727,454 at 31 March 1965, cities and boroughs were responsible for $174,446,148, which represents 3.9 percent of their rateable capital value at that date. For counties, which have a much lower expenditure per head on works, etc., the aggregate net indebtedness was $30,543,374, and the percentage of rateable capital value at 31 March 1965 was only 1.0.
The following table shows, per head of the population, the gross public debt of local authorities and the annual charge thereon for the latest 11 years.
| At 31 March | Population | Gross Public Debt | Annual Loan Charge | ||
|---|---|---|---|---|---|
| Amount | Rate Per Head | Amount | Rate Per Head | ||
| $(000) | $ | $(000) | $ | ||
| 1955 | 2,130,927 | 158,640 | 74.45 | 15,444 | 7.25 |
| 1956 | 2,175,373 | 175,968 | 80.89 | 17,956 | 8.25 |
| 1957 | 2,221,169 | 198,176 | 89.22 | 19,448 | 8.76 |
| 1958 | 2,275,515 | 229,350 | 100.79 | 21,622 | 9.50 |
| 1959 | 2,326,129 | 255,940 | 110.03 | 24,094 | 10.36 |
| 1960 | 2,370,166 | 287,114 | 121.14 | 26,608 | 11.23 |
| 1961 | 2,414,984 | 318,828 | 132.02 | 30,306 | 12.55 |
| 1962 | 2,474,588 | 337,552 | 136.41 | 32,400 | 13.09 |
| 1963 | 2,527,868 | 370,186 | 146.44 | 35,918 | 14.21 |
| 1964 | 2,582,407 | 401,794 | 155.59 | 46,326 | 17.93 |
| 1965 | 2,628,900 | 436,194 | 165.92 | 52,338 | 19.91 |
It should be noted that the debt of electric power districts shown in the following table does not represent the complete local authority debt on account of electric power activities, since a considerable portion of the city and borough debt, and a small part of the county and town district debt also, was incurred for that purpose.
| At 31 March | Cities, Boroughs and Town Districts | Counties and Road Districts | Electric Power Districts | Harbour Districts | Urban Drainage Districts | Urban Transport Districts | Other Districts | Total |
|---|---|---|---|---|---|---|---|---|
| $(thousand) | ||||||||
| 1955 | 73,632 | 9,192 | 34,426 | 21,624 | 7,922 | 6,164 | 5,682 | 158,640 |
| 1956 | 80,502 | 10,272 | 37,654 | 23,238 | 9,866 | 6,752 | 7,684 | 175,968 |
| 1957 | 89,666 | 11,900 | 39,578 | 26,120 | 13,450 | 7,494 | 9,966 | 198,176 |
| 1958 | 103,162 | 13,580 | 42,600 | 31,378 | 17,976 | 8,298 | 12,356 | 229,350 |
| 1959 | 111,818 | 14,858 | 45,860 | 35,124 | 24,254 | 7,816 | 16,208 | 255,940 |
| 1960 | 124,430 | 17,470 | 47,768 | 40,066 | 32,184 | 7,608 | 17,588 | 287,114 |
| 1961 | 132,922 | 19,810 | 49,290 | 45,956 | 40,146 | 7,146 | 23,558 | 318,828 |
| 1962 | 141,926 | 22,326 | 51,362 | 48,020 | 43,456 | 6,622 | 23,840 | 337,552 |
| 1963 | 157,138 | 23,982 | 54,102 | 56,074 | 47,662 | 6,346 | 24,882 | 370,186 |
| 1964 | 173,032 | 28,402 | 53,716 | 65,408 | 49,404 | 5,862 | 25,970 | 401,794 |
| 1965 | 187,926 | 31,844 | 58,142 | 72,070 | 51,002 | 5,284 | 29,926 | 436,194 |
The debt of road districts at 31 March 1965, which is included with that of counties, was $17,924; the town district debt at the same date was $722,182. The debt of “Other Districts” at 31 March 1965 was mainly that of river districts ($303,872), catchment districts ($2,998,408), land-drainage districts ($345,358), gas districts ($189,820), fire districts ($3,216,084), a harbour bridge authority ($13,417,502), a road tunnel authority ($5,704,660), and Auckland regional authority ($3,570,000).
Previously it was possible to classify indebtedness according to the purpose for which the loans were raised. This analysis is no longer available, the last figures of the series appearing on page 851 of the 1961 issue of the Yearbook.
Domicile of Debt—A five-year summary of the domicile of loans outstanding is given hereunder.
| At 31 March | Amount | Percentage of Total | ||||
|---|---|---|---|---|---|---|
| New Zealand | United Kingdom | Australia | New Zealand | United Kingdom | Australia | |
| $(000) | percent | |||||
| 1961 | 316,921 | 1,404 | 503 | 99.40 | 0.44 | 0.16 |
| 1962 | 336,068 | 1,004 | 480 | 99.56 | 0.30 | 0.14 |
| 1963 | 368,703 | 1,004 | 479 | 99.60 | 0.27 | 0.13 |
| 1964 | 401,029 | 300 | 465 | 99.81 | 0.07 | 0.12 |
| 1965 | 435,730 | – | 464 | 99.89 | – | 0.11 |
Debt Charges—Particulars of the annual loan charge of local authorities during each of the latest 12 years are as follows.
| At 31 March | On Debentures and Other Securities | On Inscribed Debt | Total |
|---|---|---|---|
| $(000) | |||
| 1954 | 13,992 | – | 13,992 |
| 1955 | 15,443 | – | 15,443 |
| 1956 | 17,955 | – | 17,955 |
| 1957 | 19,447 | – | 19,447 |
| 1958 | 21,622 | – | 21,622 |
| 1959 | 24,095 | – | 24,095 |
| 1960 | 26,608 | – | 26,608 |
| 1961 | 30,305 | – | 30,305 |
| 1962 | 32,400 | – | 32,400 |
| 1963 | 35,919 | – | 35,919 |
| 1964 | 46,327 | – | 46,327 |
| 1965 | 52,339 | – | 52,339 |
Loan repayment charges are included in the above, the anticipated payments during 1965–66 on debt at 31 March 1965 being $30,715,360. Anticipated interest charges payable during 1965–66 on the debt outstanding at 31 March 1965 aggregated $21,623,256.
As the information is no longer available, it is not possible to classify loans outstanding according to country of domicile, by rates of interest, and maturity dates. The last analyses of these series appeared on page 852 of the 1961 issue of the Yearbook.
Loans Sanctioned, Authorised, Raised, and Uplifted—The following summary of the operations of the Local Authorities Loans Board during the last 11 years shows concisely the trend of local authority borrowing during that period. Hospital boards are included in this instance.
| Year | Total Applications | Sanctioned | |
|---|---|---|---|
| New Works | Redemption Loans | ||
| $(thousand) | |||
| 1955–56 | 45,008 | 30,924 | 874 |
| 1956–57 | 41,902 | 34,466 | 60 |
| 1957–58 | 63,868 | 51,600 | 1,700 |
| 1958–59 | 43,020 | 41,076 | 1,084 |
| 1959–60 | 65,696 | 57,946 | 474 |
| 1960–61 | 75,372 | 69,298 | 950 |
| 1961–62 | 60,682 | 48,086 | 3,602 |
| 1962–63 | 62,718 | 51,506 | 7,158 |
| 1963–64 | 88,980 | 62,474 | 24,364 |
| 1964–65 | 90,360 | 59,042 | 20,316 |
| 1965–66 | 111,130 | 80,006 | 15,216 |
From statistics of borrowing, which local authorities are required to furnish quarterly, it is possible to ascertain the amount of loan authorisations granted and exercised. The next two tables show summaries of borrowing at 31 March 1966 by each class of local authority.
| LOANS AUTHORISED DURING YEAR ENDED 31 MARCH 1965—WITH AMOUNTS RAISED AND UPLIFTED TO 31 MARCH 1966 ON THESE AUTHORISATIONS | ||||||
|---|---|---|---|---|---|---|
| Local Authority | Amounts Authorised Year Ended 31 March 1965* | Amounts Raised | Balance Not Raised at 31 March 1966 | Amounts Uplifted | ||
| To 31 March 1965 | To 31 March 1966 | To 31 March 1965 | To 31 March 1966 | |||
* Adjusted for amounts revoked or lapsed. † Original amount was $89,125,488. | ||||||
| $(thousand) | ||||||
| Catchment boards | 798 | 240 | 326 | 472 | 212 | 322 |
| City and borough councils | 29,304 | 13,170 | 19,998 | 9,306 | 12,352 | 19,520 |
| County councils | 7,046 | 2,512 | 5,298 | 1,748 | 2,200 | 5,130 |
| Electric power and gas boards | 10,364 | 6,186 | 9,190 | 1,174 | 6,100 | 9,090 |
| Fire boards | 656 | 472 | 622 | 34 | 282 | 600 |
| Harbour boards | 12,412 | 5,962 | 10,364 | 2,048 | 5,960 | 10,364 |
| Hospital boards | 13,430 | 9,368 | 12,906 | 524 | 9,358 | 12,906 |
| Harbour bridge authority | 1,580 | 1,194 | 1,580 | – | 1,194 | 1,580 |
| Rabbit boards | 46 | 4 | 4 | 42 | 4 | 4 |
| Regional authority | 13,328 | 5,338 | 6,804 | 6,524 | 5,338 | 6,804 |
| River boards | 80 | 40 | 40 | 40 | – | – |
| Town boards | 120 | 90 | 120 | – | 90 | 120 |
| Urban drainage boards | 2,200 | 1,576 | 2,200 | – | 1,576 | 2,200 |
| Totals | 91,364† | 46,152 | 69,452 | 21,912 | 44,666 | 68,640 |
| LOANS AUTHORISED DURING YEAR ENDED 31 MARCH 1966—WITH AMOUNTS RAISED AND UPLIFTED TO 31 MARCH 1966 ON THESE AUTHORISATIONS | ||||
|---|---|---|---|---|
| Local Authority | Amounts Authorised Year Ended 31 March 1966* | Amounts Raised to 31 March 1966 | Balance Not Raised at 31 March 1966 | Amounts Uplifted to 31 March 1966 |
* Adjusted for amounts revoked or lapsed. † Original amount was $104,394,760. | ||||
| $(thousand) | ||||
| Catchment boards | 684 | 124 | 560 | 124 |
| City and borough councils | 32,794 | 10,722 | 22,072 | 10,148 |
| County councils | 7,614 | 2,360 | 5,254 | 1,904 |
| Electric power and gas boards | 12,100 | 5,574 | 6,526 | 5,342 |
| Fire boards | 348 | 126 | 222 | 92 |
| Harbour boards | 13,682 | 4,718 | 8,964 | 4,718 |
| Hospital boards | 13,138 | 6,642 | 6,496 | 6,304 |
| Harbour bridge authority | 12,898 | 444 | 12,454 | 398 |
| Land drainage boards | 16 | 16 | – | – |
| Rabbit boards | 64 | 22 | 42 | 22 |
| Regional authority | 5,798 | 2,842 | 2,956 | 2,842 |
| Town boards | 218 | 76 | 142 | 76 |
| Urban drainage boards | 5,176 | 986 | 4,190 | 986 |
| Urban transport boards | 64 | 64 | – | 64 |
| Totals | 104,594† | 34,716 | 69,878 | 33,020 |
The following table shows comparative debt figures.
| Year Ended 31 March | Amounts Sanctioned by Loans Board | Amounts Authorised by Orders in Council | Gross Indebtedness at Beginning of Year | Amount Uplifted | Principal Repaid | Gross Indebtedness at End of Year |
|---|---|---|---|---|---|---|
* Estimated. † As returned by local authorities. | ||||||
| $(thousand) | ||||||
| 1956 | 31,800 | 36,682 | 181,868 | 30,172 | 10,276 | 201,764 |
| 1957 | 34,526 | 39,276 | 201,764 | 40,778 | 13,208 | 229,334 |
| 1958 | 53,300 | 51,434 | 229,334 | 48,858 | 14,126 | 264,066 |
| 1959 | 42,160 | 50,858 | 264,066 | 45,306 | 14,852 | 294,518 |
| 1960 | 58,420 | 50,070 | 294,518 | 59,896 | 17,096 | 337,318 |
| 1961 | 70,246 | 58,134 | 337,318 | 53,798 | 17,418 | 373,698 |
| 1962 | 51,688 | 60,726 | 373,698 | 42,128 | 20,392 | 395,434 |
| 1963 | 58,664 | 68,828 | 395,434 | 59,268 | 20,612 | 434,090 |
| 1964 | 86,840 | 91,818 | 434,090 | 82,918 | 42,652 | 474,356 |
| 1965 | 79,358 | 89,126 | 474,356 | 82,558 | 45,498 | 511,416† |
| 1966 | 95,222 | 104,394 | 511,416† | 67,874 | 34,844* | 544,448* |
Interest Rates—The Local Authorities Loans Act 1956 places the determination of rates of interest in the hands of the Local Authorities Loans Board, subject to the approval of the Minister of Finance of the maximum rate. The following maximum rates have been approved.
| Percent | |
|---|---|
| October 1955 | 4 1/4 |
| March 1956 | 4 3/4 |
| June 1956 | 4 7/8 |
| July 1957 | 5 |
| July 1960 | 4 7/8 |
| July 1961 | 5 1/8 |
| February 1962 | 5 3/8 |
| September 1963 | 5 1/4 |
| May 1966 | 5 1/2 |
| April 1967 | 5 3/4 |
The current local authorities rates, for the different terms, are: under 6 years. 5 1/8 percent; 6–9 years, 5 1/2 percent; 10 years and over, 5 3/4 percent.
EMPLOYMENT BY LOCAL AUTHORITIES—Employees of local authorities are principally engaged in the construction and maintenance of roads and streets, the operation and maintenance of public-utility industries (gas, electric and water supply, and transport), and community services.
In the following table particulars are given of the number of all direct wage-earning employees who were actually in the employ of the various classes of local authorities (hospital boards excluded) at 31 March of each of the five years 1961 to 1965 inclusive. Besides permanent staff, including administrative and professional employees, the statistics include part-time, casual, and temporary employees, and subsidised workers, but exclude those employed by contractors.
| Local Authority | Number of Employees at 31 March | ||||
|---|---|---|---|---|---|
| 1961 | 1962 | 1963 | 1964 | 1965 | |
| * As at 30 September. | |||||
| Catchment boards | 603 | 681 | 702 | 715 | 716 |
| City and borough councils | 13,738 | 13,245 | 14,853 | 14,730 | 15,257 |
| County councils | 5,519 | 5,802 | 5,847 | 6,091 | 5,956 |
| Electric power boards | 4,084 | 4,181 | 4,364 | 4,459 | 4,658 |
| Fire boards | 719 | 862 | 892 | 839 | 893 |
| Gas boards | 58 | 47 | 34 | 30 | 29 |
| Harbour boards* | 3,768 | 3,894 | 3,982 | 4,038 | 4,021 |
| Harbour bridge authority | 76 | 85 | 91 | 141 | 150 |
| Land drainage boards | 127 | 109 | 107 | 122 | 93 |
| Local railway board | 18 | 19 | 16 | 15 | 15 |
| Milk boards | 31 | 33 | 38 | 36 | 36 |
| Museum authority | – | – | – | 32 | 36 |
| Nassella tussock boards | 65 | 72 | 80 | 56 | 143 |
| Plantation board | 10 | 15 | 10 | 13 | 12 |
| Rabbit boards | 1,084 | 1,097 | 1,172 | 1,200 | 1,203 |
| Regional authority | – | – | – | – | 12 |
| River boards | 41 | 34 | 34 | 33 | 38 |
| Road boards | 24 | 25 | 27 | 28 | 27 |
| Road tunnel authority | 1 | 1 | 4 | 39 | 39 |
| Town boards— | |||||
| Dependent | 33 | 39 | 41 | 33 | 37 |
| Independent | 52 | 81 | 59 | 89 | 81 |
| Underground water authorities | 4 | 3 | 3 | 3 | 4 |
| Urban drainage boards | 572 | 621 | 651 | 640 | 643 |
| Urban transport boards | 1,471 | 1,472 | 1,439 | 1,416 | 1,393 |
| Valley authority | 15 | 15 | 15 | 14 | 18 |
| Water supply boards | 5 | 5 | 5 | 5 | 5 |
| Totals | 32,118 | 32,438 | 34,466 | 34,817 | 35,515 |
The number of staff employed in public hospitals and other institutions and activities controlled by hospital boards was as follows for each of the latest five years ended 31 March. (Source: Department of Health.)
| Nature of Staff | Numbers Employed | ||||
|---|---|---|---|---|---|
| 1961 | 1962 | 1963 | 1964 | 1965 | |
| Institutional medical (whole-time and part-time) | 1,389 | 1,421 | 1,516 | 1,583 | 1,648 |
| Other professional and technical | 1,655 | 1,760 | 1,854 | 2,072 | 2,231 |
| Nursing | 10,434 | 10,845 | 11,580 | 12,012 | 12,646 |
| Other treatment staff | 391 | 394 | 406 | 418 | 411 |
| Domestic and other institutional staff | 8,676 | 8,971 | 9,252 | 9,429 | 9,812 |
| Administrative staff | 525 | 523 | 544 | 573 | 614 |
| District nursing | 197 | 267 | 235 | 268 | 777 |
| Farm (including vegetable gardening) | 49 | 36 | 32 | 22 | 24 |
| Miscellaneous | 180 | 211 | 363 | 575 | 258 |
| Totals | 23,496 | 24,428 | 25,782 | 26,952 | 28,421 |
GENERAL—Comparisons between money incomes in different years should be subject to qualifications. With the changing value of money, comparisons should be made in terms of effective or real income, i.e. money in relation to the costs of goods and services. However, it is not easy to measure these changes as there is no one index that adequately gives a measure of the changing purchasing power in all circumstances. This is because the purchasing power of money is conditional to a large extent on the patterns of expenditure out of income, and these may and do differ substantially from person to person. While not an ideal measure of the changes in purchasing power, in all these circumstances the Consumers' Price Index, which measures prices changes in a wide range of goods and services purchased, may be used as the best available indicator insofar as income, if expended, would be spent on these kinds of goods and services.
Statistics of incomes and income tax are compiled annually by the Department of Statistics. Complete details and methods of compilations are given in the annual statistical report on Incomes and Income Tax.
TREND OF INCOMES: Individuals—The data required for statistical compilation of incomes do not become available for a lengthy period after the end of the income year. This, coupled with the necessary time taken by the statistical processing, means an unduly long time lag before results of the compilation are available. To meet this situation provisional estimates are made on a sample basis.
Past experience has shown that provisional estimates similar to those given in the following tables have normally been sufficiently accurate for most practical uses. However, it is emphasised that the data in the provisional estimates are definitely provisional and are liable to be revised substantially at a later date.
The next table gives data for the principal sources of incomes of individuals.
| Source of Total Income | Income Years | |||||
|---|---|---|---|---|---|---|
| 1963–64 | 1964–65 | 1965–66 | ||||
| Number of Returns | Total Income | Number of Returns | Total Income | Number of Returns | Total Income | |
| $(m) | $(m) | $(m) | ||||
| Self employed— | ||||||
| Sheep farming | 27,000 | 114.0 | 26,600 | 110.6 | 26,600 | 109.6 |
| Dairy farming | 30,000 | 69.4 | 30,800 | 83.2 | 29,500 | 87.4 |
| Other farming | 26,300 | 66.0 | 26,000 | 68.4 | 26,200 | 72.4 |
| Totals, farming | 83,300 | 249.4 | 83,400 | 262.2 | 82,300 | 269.4 |
| Manufacturing | 7,400 | 20.4 | 7,500 | 22.2 | 7,600 | 23.8 |
| Construction | 16,000 | 42.6 | 16,100 | 47.2 | 16,700 | 50.2 |
| Commerce | 19,200 | 46.2 | 19,200 | 48.0 | 19,300 | 49.0 |
| Transport | 5,500 | 15.6 | 5,600 | 16.6 | 5,700 | 17.0 |
| Service— | ||||||
| Professional | 8,700 | 51.6 | 8,600 | 56.4 | 8,700 | 58.4 |
| Other | 9,900 | 20.4 | 10,100 | 21.8 | 10,200 | 23.0 |
| Miscellaneous (forestry mining, etc.) | 4,500 | 11.0 | 4,600 | 11.4 | 4,700 | 11.8 |
| Totals, self employed | 154,500 | 457.2 | 155,100 | 485.8 | 155,200 | 502.6 |
| Salary and wages | 957,000 | 1,645.4 | 987,000 | 1,816.0 | 1,017,000 | 1,956.6 |
| Investment income | 72,600 | 110.2 | 73,500 | 119.8 | 73,300 | 118.0 |
| Totals | 1,184,100 | 2,212.8 | 1,215,600 | 2,421.6 | 1,245,500 | 2,577.2 |
Farming incomes are rather more than one-half of the total incomes of all self-employed persons and are decidedly the most volatile section as far as income levels are concerned. Therefore fluctuations in the total income of self-employed largely follows the fortunes of the farming section. In 1963–64 farming incomes rose by an estimated $26.2 million, the increase being mainly due to high wool prices. Significant rises in dairy farming incomes offset decreases in sheep farming incomes to give further increases of $12.8 million and $7.2 million in farming incomes for 1964–65 and 1965–66. The non-farming section of self-employed individuals shows increases in the estimated incomes of approximately $15.8 million in 1964–65 and $9.6 million in 1965–66.
The following table shows an analysis by the amount of total income for the three major sources (self-employment, salary and wages, and investment incomes) combined.
| ALL SOURCES | ||||||
|---|---|---|---|---|---|---|
| Amount of Total Income | Income Years | |||||
| 1963–64 | 1964–65 | 1965–66 | ||||
| Number of Returns | Total Income | Number of Returns | Total Income | Number of Returns | Total Income | |
| * An “unknown” group has been included to cover cases still under investigation mainly because of problems in matching tax deduction certificates for broken periods of work; this applies to salary and wage earners with incomes of less than, $2,600 (previously $2,080) who are not required to furnish a return of income. | ||||||
| $ $ | $(m) | $(m) | $(m) | |||
| Losses | 2,500 | – | 2,400 | – | 2,300 | – |
| 0– 199 | 83,200 | 8.4 | 76,100 | 8.0 | 72,300 | 7.2 |
| 200– 399 | 61,700 | 18.6 | 52,900 | 16.2 | 52,700 | 16.0 |
| 400– 599 | 53,800 | 26.8 | 49,600 | 25.6 | 46,900 | 23.8 |
| 600– 799 | 69,200 | 48.6 | 64,100 | 45.0 | 59,100 | 41.8 |
| 800– 999 | 75,800 | 68.2 | 75,100 | 67.8 | 74,700 | 68.0 |
| 1,000–1,199 | 73,600 | 80.8 | 73,300 | 80.8 | 70,100 | 77.6 |
| 1,200–1,399 | 66,400 | 86.2 | 66,800 | 87.2 | 62,800 | 82.4 |
| 1,400–1,599 | 77,300 | 116.0 | 78,200 | 117.2 | 73,100 | 110.2 |
| 1,600–1,799 | 88,700 | 150.8 | 90,400 | 153.8 | 88,500 | 151.2 |
| 1,800–1,999 | 94,700 | 180.0 | 97,500 | 185.4 | 91,800 | 175.8 |
| 2,000–2,399 | 170,600 | 375.0 | 182,000 | 407.4 | 205,400 | 456.0 |
| 2,400–2,799 | 97,300 | 253.0 | 110,800 | 292.0 | 121,600 | 319.4 |
| 2,800–3,199 | 53,900 | 162.0 | 62,900 | 191.0 | 75,900 | 229.8 |
| 3,200–3,599 | 30,500 | 103.6 | 34,000 | 115.8 | 39,500 | 135.6 |
| 3,600–3,999 | 18,800 | 71.4 | 22,500 | 86.4 | 26,000 | 99.4 |
| 4,000–5,999 | 42,000 | 209.6 | 48,100 | 242.4 | 50,800 | 255.2 |
| 6,000–7,999 | 14,000 | 98.0 | 17,500 | 123.2 | 19,800 | 138.4 |
| 8,000–9,999 | 5,000 | 45.2 | 5,500 | 49.8 | 5,900 | 53.2 |
| 10,000 and over | 5,100 | 78.6 | 5,900 | 94.6 | 6,300 | 104.2 |
| Unknown* | – | 32.0 | – | 32.0 | – | 32.0 |
| Totals | 1,184,100 | 2,212.8 | 1,215,600 | 2,421.6 | 1,245,500 | 2,577.2 |
The number of persons with incomes of $2,000 and over is increasing steadily. In the period covered by the preceding table such persons represented 59.0 percent of the total numbers in 1963–64, 61.3 percent in 1964–65, and 64.4 percent in 1965–66. A similar trend is evident for persons with incomes of $4,000 and over: they represented 22.3 percent of the total numbers in 1963–64, 24.3 percent in 1964–65, and 25.3 percent in 1965–66.
The next table provides an analysis of the incomes of self-employed individuals by the amount of total income.
| SELF-EMPLOYED PERSONS | ||||||
|---|---|---|---|---|---|---|
| Amount of Total Income | Income Years | |||||
| 1963–64 | 1964–65 | 1965–66 | ||||
| Number of Returns | Total Income | Number of Returns | Total Income | Number of Returns | Total Income | |
| $ $ | $(m) | $(m) | $(m) | |||
| Losses | 1,800 | – | 1,800 | – | 1,900 | – |
| 0– 199 | 4,100 | 0.4 | 3,000 | 0.4 | 2,400 | 0.2 |
| 200– 399 | 4,200 | 1.2 | 3,400 | 1.0 | 3,300 | 1.0 |
| 400– 599 | 4,500 | 2.2 | 4,400 | 2.2 | 3,500 | 1.8 |
| 600– 799 | 5,000 | 3.6 | 4,900 | 3.4 | 4,500 | 3.4 |
| 800– 999 | 6,000 | 5.4 | 5,800 | 5.2 | 5,200 | 4.8 |
| 1,000–1,199 | 6,400 | 7.0 | 6,200 | 6.8 | 5,900 | 6.6 |
| 1,200–1,399 | 7,300 | 9.4 | 7,000 | 9.2 | 7,200 | 9.6 |
| 1,400–1,599 | 7,200 | 10.8 | 7,100 | 10.6 | 6,700 | 10.2 |
| 1,600–1,799 | 8,600 | 14.6 | 8,400 | 14.4 | 7,500 | 12.8 |
| 1,800–1,999 | 8,300 | 15.8 | 8,100 | 15.4 | 7,200 | 13.8 |
| 2,000–2,399 | 16,400 | 36.0 | 15,900 | 35.6 | 16,300 | 36.0 |
| 2,400–2,799 | 13,900 | 36.2 | 14,200 | 37.0 | 14,400 | 37.6 |
| 2,800–3,199 | 11,500 | 34.6 | 11,700 | 35.4 | 12,300 | 37.2 |
| 3,200–3,599 | 8,300 | 28.2 | 8,500 | 29.0 | 8,900 | 30.4 |
| 3,600–3,999 | 6,500 | 24.8 | 7,000 | 26.8 | 8,800 | 33.6 |
| 4,000–5,999 | 20,200 | 101.0 | 20,700 | 104.0 | 21,000 | 105.0 |
| 6,000–7,999 | 8,300 | 58.2 | 10,400 | 73.0 | 11,400 | 79.8 |
| 8,000–9,999 | 3,200 | 28.8 | 3,400 | 30.6 | 3,600 | 32.4 |
| 10,000 and over | 2,800 | 39.0 | 3,200 | 45.8 | 3,200 | 46.4 |
| Totals | 154,500 | 457.2 | 155,100 | 485.8 | 155,200 | 502.6 |
These estimates provide for only comparatively small increases in numbers; the principal reason is that in recent years the numbers of companies have risen substantially, with corresponding deductions from the numbers of individuals operating as sole traders or as partnerships.
This practice of changing to company ownership has reached dimensions which are large enough to have some effect on the income trends disclosed in these statistics of individuals. There is a greater tendency for the higher income units to adopt company ownership.
The incomes of salary and wage earners are given in the following table.
| SALARY AND WAGE EARNERS | ||||||
|---|---|---|---|---|---|---|
| Amount of Total Income | Income Years | |||||
| 1963–64 | 1964–65 | 1965–66 | ||||
| Number of Returns | Total Income | Number of Returns | Total Income | Number of Returns | Total Income | |
| * An “unknown” group has been included to cover cases still under investigation mainly because of problems in matching tax deduction certificates for broken periods of work; this applies to salary and wage earners with incomes of less than $2.600 (previously $2,080) who are not required to furnish a return of income. | ||||||
| $ $ | $(m) | $(m) | $(m) | |||
| Losses | 300 | – | 300 | – | 200 | – |
| 0– 199 | 74,000 | 7.4 | 68,100 | 7.0 | 65,000 | 6.6 |
| 200– 399 | 51,000 | 15.4 | 43,000 | 13.2 | 42,900 | 13.0 |
| 400– 599 | 41,300 | 20.6 | 37,200 | 19.2 | 35,400 | 18.0 |
| 600– 799 | 55,000 | 38.6 | 50,000 | 35.0 | 45,400 | 32.0 |
| 800– 999 | 61,200 | 55.0 | 60,600 | 54.6 | 60,800 | 55.4 |
| 1,000–1,199 | 61,100 | 67.2 | 61,000 | 67.2 | 58,100 | 64.2 |
| 1,200–1,399 | 54,500 | 70.8 | 55,200 | 72.0 | 51,000 | 66.8 |
| 1,400–1,599 | 66,600 | 100.0 | 67,500 | 101.2 | 62,800 | 94.6 |
| 1,600–1,799 | 77,200 | 131.2 | 79,100 | 134.4 | 78,100 | 133.6 |
| 1,800–1,999 | 84,000 | 159.6 | 87,000 | 165.4 | 82,200 | 157.4 |
| 2,000–2,399 | 150,200 | 330.2 | 162,000 | 362.6 | 185,000 | 411.0 |
| 2,400–2,799 | 80,900 | 210.4 | 94,000 | 248.2 | 104,600 | 275.0 |
| 2,800–3,195 | 40,600 | 122.0 | 49,300 | 149.8 | 61,700 | 186.8 |
| 3,200–3,599 | 20,900 | 71.0 | 24,100 | 82.0 | 29,200 | 100.4 |
| 3,600–3,999 | 11,100 | 42.0 | 14,300 | 55.0 | 16,000 | 61.2 |
| 4,000–5,999 | 19,200 | 96.0 | 24,600 | 123.4 | 27,100 | 136.0 |
| 6,000–7,999 | 4,700 | 33.0 | 6,000 | 42.4 | 7,200 | 50.8 |
| 8,000–9,999 | 1,500 | 13.6 | 1,700 | 15.6 | 1,900 | 17.2 |
| 10,000 and over | 1,700 | 29.4 | 2,000 | 35.8 | 2,400 | 44.6 |
| Unknown* | – | 32.0 | – | 32.0 | – | 32.0 |
| Totals | 957,000 | 1,645.4 | 987,000 | 1,816.0 | 1,017,000 | 1,956.6 |
The next table gives corresponding data for individuals whose incomes were principally derived from interest, rents and royalties, “estate” income, and also company dividends if there was no other major source of income.
| INVESTMENT INCOMES | ||||||
|---|---|---|---|---|---|---|
| Total Amount of Income | Income Years | |||||
| 1963–64 | 1964–65 | 1965–66 | ||||
| Number of Returns | Total Income | Number of Returns | Total Income | Number of Returns | Total Income | |
| $ $ | $(m) | $(m) | $(m) | |||
| Losses | 400 | – | 300 | – | 2,00 | – |
| 0– 199 | 5,100 | 0.6 | 5,000 | 0.6 | 4,900 | 0.4 |
| 200– 399 | 6,500 | 2.0 | 6,500 | 2.0 | 6,500 | 2.0 |
| 400– 599 | 8,000 | 4.0 | 8,000 | 4.2 | 8,000 | 4.0 |
| 600– 799 | 9,200 | 6.4 | 9,200 | 6.6 | 9,200 | 6.4 |
| 800– 999 | 8,600 | 7.8 | 8,700 | 8.0 | 8,700 | 7.8 |
| 1,000–1,199 | 6,100 | 6.6 | 6,100 | 6.8 | 6,100 | 6.8 |
| 1,200–1,399 | 4,600 | 6.0 | 4,600 | 6.0 | 4,600 | 6.0 |
| 1,400–1,599 | 3,500 | 5.2 | 3,600 | 5.4 | 3,600 | 5.4 |
| 1,600–1,799 | 2,900 | 5.0 | 2,900 | 5.0 | 2,900 | 4.8 |
| 1,800–1,999 | 2,400 | 4.6 | 2,400 | 4.6 | 2,400 | 4.6 |
| 2,000–2,399 | 4,000 | 8.8 | 4,100 | 9.2 | 4,100 | 9.0 |
| 2,400–2,799 | 2,500 | 6.4 | 2,600 | 6.8 | 2,600 | 6.8 |
| 2,800–3,199 | 1,800 | 5.4 | 1,900 | 5.8 | 1,900 | 5.8 |
| 3,200–3,599 | 1,300 | 4.4 | 1,400 | 4.8 | 1,400 | 4.8 |
| 3,600–3,999 | 1,200 | 4.6 | 1,200 | 4.6 | 1,200 | 4.6 |
| 4,000–5,999 | 2,600 | 12.6 | 2,800 | 15.0 | 2,700 | 14.2 |
| 6,000–7,999 | 1,000 | 6.8 | 1,100 | 7.8 | 1,200 | 7.8 |
| 8,000–9,999 | 300 | 2.8 | 400 | 3.6 | 400 | 3.6 |
| 10,000 and over | 600 | 10.2 | 700 | 13.0 | 700 | 13.2 |
| Totals | 72,600 | 110.2 | 73,500 | 119.8 | 73,300 | 118.0 |
As there is a special exemption of $208 of income from social security income tax, incomes of under this amount do not have to be reported unless the individual normally receives income from self-employment or seeks a refund of tax deducted at sources. Numbers of purely investment incomes of under $208 are not available.
Companies—The provisional estimates of assessable income for companies are given in the next table. They are calculations based on the income trends revealed by a small sample of returns. The sample is confined to those income returns which are available at an early date. Companies with balance dates later than 30 June would be almost completely unrepresented in the sample.
The estimates are given with the warring that the figures are subject to a possible considerable margin of error and should therefore be used with caution.
| Industry Group | 1963–64 | 1964–65 | 1965–66 | |||
|---|---|---|---|---|---|---|
| Number of Returns | Assessable Income | Number of Returns | Assessable Income | Number of Returns | Assessable Income | |
| $(m) | $(m) | $(m) | ||||
| Agriculture and livestock production | 3,371 | 9.6 | 3,825 | 10.0 | 4,050 | 11.2 |
| Manufacturing | 7,604 | 159.8 | 7,900 | 171.2 | 8,100 | 178.2 |
| Construction | 3,437 | 15.0 | 3,775 | 17.6 | 3,975 | 19.0 |
| Commerce— | ||||||
| Wholesale and retail trade | 14,722 | 135.2 | 15,875 | 153.4 | 16,650 | 166.2 |
| Other | 9,585 | 64.6 | 10,000 | 74.0 | 10,500 | 80.4 |
| Transport, storage, and communication | 1,919 | 11.8 | 2,000 | 14.8 | 2,000 | 15.6 |
| Services, community | 3,614 | 12.6 | 3,825 | 14.0 | 3,950 | 15.4 |
| Miscellaneous | 480 | 3.2 | 525 | 3.6 | 575 | 4.0 |
| Totals | 44,732 | 411.8 | 47,725 | 458.6 | 49,800 | 490.0 |
Assessable income increased by $49.9 million in 1963–64 and in doing so exceeded $400 million for the first time. Further increases of $46.8 million and $31.4 million are indicated by the estimated assessable incomes for 1964–65 and 1965–66 respectively.
COMPILATION OF STATISTICS—In the case of individuals, the statistics are in normal years substantially based on a 10 percent sample for all incomes of less than $8,000; there is a complete enumeration of all incomes of $8,000 and over.
In 1957–58, the statistics included incomes of $750 and upwards in the case of salary and wage earners and all incomes, irrespective of amount, from other sources. There was an exception in connection with incomes derived from interest. The first $24 of such incomes was exempt from income taxation, and there was no available data for interest incomes of less than this amount.
For the 1958–59 income year the statistical coverage was extended to include all salary and wage incomes, while remaining the same as in 1957–58 in respect of incomes from other sources. The first $208 of income was exempted from social security income tax from 1959–60. This exemption did not affect the statistical coverage of incomes of salary and wage earners or those of self-employed persons, but purely investment incomes (interest, rents, dividends, etc.) of under $208 no longer had to be reported. Consequently the 1959–60 income year statistics show a major fall in the numbers of investment incomes; the new level has been maintained in subsequent years. Because of staff shortages, individuals' income statistics for the 1961–62, income year were neither processed nor published and a footnote to this effect has been added to all the relevant tables contained in this section of the Yearbook.
The broad principle adopted in calculating the assessable income is that any expenditure or loss exclusively incurred in the production of assessable income for any year may be deducted from the total income from any assessable source for that year. Depreciation is allowed, varying dates for different classes of assets being fixed. The assessable income is approximately equivalent to the net profit as determined by the normal commercial accounting systems. It is, on the whole, rather higher than the commercial net profit, since certain types of expenditure which are regarded as a revenue charge in commercial accounts are not permissible deductions for income tax purposes.
Where the operations of a source of income which would be assessable for income tax have resulted in a loss for the year, the loss may be set off against assessable profits from other sources (if any) or, in default thereof, may be set off against assessable profits in the six following years.
Capital profits are not assessable and capital losses are not deductible.
In these statistics the incomes given for individuals are the net incomes after deducting losses from the same source which have been carried forward from previous years. Losses for the current year which have been set off against income from some other source are recorded in the tables in this volume as the difference between the total of the component income items and the given total income.
For companies, incomes before deduction of losses carried forward from previous years are shown in a separate column and the assessable and returnable incomes given are those after the deduction of such losses. Losses during the current year from any source are deducted from the income from any other source.
CLASSES OF TAXPAYERS—“Individuals” comprise all assessments for individual persons. Partnership returns are ignored in the compilation, as the individual shares of partnership income are included in the individual tax assessments. The incomes of deceased persons' estates are not included, as the greater part of these are transferred to assessments of the beneficiaries.
The term “companies” not only covers companies incorporated under the Companies Act and other Acts relating to the formulation of companies, but also includes local and public authorities, associations (incorporated or unincorporated), and aggregations of individuals (other than partnerships) which form separate and distinct entities for income tax purposes. Government Departments which are liable to pay income tax are included, but local and public authorities are generally not taxable even in respect of their trading operations, and consequently are not included in these statistics.
Apart from the next two tables, statistics of the incomes of individuals and of companies are presented as two distinct parts of this section. The latest statistics are generally for the income year 1962–63 for individuals, and for 1963–64 in the case of companies.
SUMMARY OF INCOMES, EXEMPTIONS, AND TAX—The following tables briefly summarise the main items of information for income years. Individuals and companies are given in separate tables.
| INDIVIDUALS | |||||||
|---|---|---|---|---|---|---|---|
| Year | Number of Returns | Number of Taxpayers | Assessable Income | Total Income | Exemptions | Taxable Income | Ordinary Income Tax Assessed |
* Includes social security income tax. † There is no annual equivalent for exemptions and taxable income available where incomes and tax data have been derived from tax deduction certificates. ‡ Returns neither processed nor published. | |||||||
| $(000) | $(000) | $(000) | $(000) | $(000) | |||
| 1959–60 | 1,050,130 | 980,240 | 1,675,320 | 1,684,920 | 585,660† | 611,180† | 270,660* |
| 1960–61 | 1,085,320 | 1,028,160 | 1,839,980 | 1,849,260 | 833,610† | 580,990† | 271,800* |
| 1961–62‡ | .. | .. | .. | .. | .. | .. | .. |
| 1962–63 | 1,156,830 | 1,115,210 | 2,048,300 | 2,057,680 | 1,141,930† | 731,750† | 285,630* |
| COMPANIES | |||||||
|---|---|---|---|---|---|---|---|
| Year | Number of Returns | Number of Taxpayers | Assessable Income* | Returnable Income | Taxable Income* | Income Tax Assessed | |
| Ordinary | Social Security | ||||||
| * Assessable income and taxable income are identical, as “exemptions” are normally nil. In ascertaining assessable income any expenditure exclusively incurred in the production of the income for the year may be deducted. | |||||||
| $(000) | $(000) | $(000) | $(000) | $(000) | |||
| 1959–60 | 34,968 | 26,514 | 268,994 | 283,344 | 268,994 | 101,116 | 19,146 |
| 1960–61 | 37,541 | 28,881 | 324,674 | 340,902 | 324,674 | 123,170 | 23,198 |
| 1961–62 | 39,785 | 30,230 | 323,460 | 344,946 | 323,460 | 118,176 | 23,130 |
| 1962–63 | 42,011 | 30,453 | 361,781 | 389,770 | 361,781 | 134,092 | 25,810 |
| 1963–64 | 44,732 | 33,492 | 411,700 | 450,534 | 411,700 | 154,868 | 29,458 |
A strict comparison of the figures for one year with those of another is not possible, as changes in compilation practice and numerous amendments in income tax law have affected the comparability of the figures.
INCOMES OF INDIVIDUALS—The numbers of returns and the amounts of total income are shown in the following table.
Total income is used in the sense that it is the total of the various component items of income. It does not include income which is exempt from taxation, such as social security benefits (other than universal superannuation), the first $24 of income from interest in 1959–60 (raised to $60 from 1960–61), war pensions, workers compensation payments, and certain other types of income.
| Amount of Total Income | Number of Returns* | Total Income* | ||||
|---|---|---|---|---|---|---|
| 1959–60 | 1960–61 | 1962–63 | 1959–60 | 1960–61 | 1962–63 | |
| * 1961–62 neither processed nor published. | ||||||
| $(000) | $(000) | $(000) | ||||
| Losses | 3,740 | 3,810 | 3,780 | – | – | – |
| 0–199 | 115,760 | 94,220 | 90,600 | 9,280 | 9,460 | 8,400 |
| 200–399 | 58,280 | 63,560 | 65,450 | 16,820 | 18,280 | 18,780 |
| 400–599 | 53,390 | 55,110 | 54,170 | 26,800 | 27,640 | 27,160 |
| 600–799 | 68,200 | 69,640 | 69,290 | 47,860 | 49,020 | 48,720 |
| 800–999 | 73,800 | 75,570 | 75,780 | 66,380 | 67,920 | 68,060 |
| 1,000–1,199 | 68,000 | 70,490 | 74,170 | 74,500 | 77,180 | 81,220 |
| 1,200–1,399 | 71,500 | 67,830 | 66,220 | 93,120 | 88,100 | 86,000 |
| 1,400–1,599 | 86,700 | 77,450 | 75,780 | 130,280 | 116,220 | 113,840 |
| 1,600–1,799 | 92,440 | 87,100 | 86,530 | 156,960 | 148,040 | 147,140 |
| 1,800–1,999 | 82,550 | 87,890 | 89,340 | 156,460 | 166,840 | 169,560 |
| 2,000–2,399 | 115,870 | 132,630 | 159,460 | 252,240 | 289,560 | 348,720 |
| 2,400–2,799 | 56.940 | 76,400 | 94,130 | 146,500 | 196,860 | 242,660 |
| 2,800–3,199 | 28,820 | 38,150 | 50,860 | 85,840 | 113,640 | 151,400 |
| 3,200–3,599 | 17,630 | 20,930 | 27,170 | 59,680 | 70,740 | 91,940 |
| 3,600–3,999 | 11,620 | 13,640 | 17,240 | 43,980 | 51,620 | 65,240 |
| 4,000–5,999 | 28,300 | 32,570 | 37,300 | 135,720 | 156,040 | 178,540 |
| 6,000–7,999 | 9,840 | 10,760 | 11,450 | 67,180 | 73,320 | 78,220 |
| 8,000–9,999 | 3,314 | 3,669 | 3,803 | 29,416 | 32,608 | 33,780 |
| 10,000–11,999 | 1,486 | 1,682 | 1,800 | 16,128 | 18,240 | 19,582 |
| 12,000–13,999 | 735 | 818 | 953 | 9,484 | 10,506 | 12,266 |
| 14,000–15,999 | 408 | 458 | 477 | 6,086 | 6,822 | 7,128 |
| 16,000–17,999 | 234 | 240 | 288 | 3,976 | 4,068 | 4,878 |
| 18,000–19,999 | 150 | 167 | 2.09 | 2,828 | 3,158 | 3,976 |
| 20,000–39,999 | 372 | 448 | 483 | 9,648 | 11,536 | 12,468 |
| 40,000–59,999 | 42 | 56 | 60 | 2,006 | 2,564 | 2,922 |
| 60,000 and over | 18 | 31 | 31 | 1,300 | 2,972 | 2,494 |
| Unknown | – | – | – | 34,440 | 36,300 | 32,580 |
| Totals | 1,050,130 | 1,085,320 | 1,156,830 | 1,684,920 | 1,849,260 | 2,057,680 |
There is an explanation on an earlier page concerning the methods adopted to estimate the figures given in the table. Data relating to “investment” incomes of less than $208 were not generally available from 1959–60 onwards on account of the introduction of a special exemption of $208 of income from social security income tax.
Where salary and wage income returns were not available (and there was between 1958–59 and 1963–64 no obligation to furnish returns if the income was from salary and wages only and was less than $2,080 raised to $2,600 in 1964–65), the statistical information was derived from the tax deduction certificates.
There were 779,790 males and 377,040 females included in the 1962–63 income year statistics. The respective numbers of these for each total income group appear in the next table, which also gives comparisons with data for 1959–60 and 1960–61.
| Amount of Total Income | 1959–60 | 1960–61 | 1962–63* | |||
|---|---|---|---|---|---|---|
| Males | Females | Males | Females | Males | Females | |
| * 1961–62 neither processed nor published. | ||||||
| $ $ | ||||||
| Losses | 2,660 | 1,080 | 2,720 | 1,090 | 2,650 | 1,130 |
| 0–199 | 43,420 | 72,340 | 41,630 | 52,590 | 31,270 | 59,330 |
| 200–399 | 17,330 | 40,940 | 18,290 | 45,270 | 20,070 | 45,380 |
| 400–599 | 17,580 | 35,790 | 17,360 | 37,750 | 16,750 | 37,420 |
| 600–799 | 24,320 | 43,880 | 23,620 | 46,020 | 24,890 | 44,400 |
| 800–999 | 31,400 | 42,370 | 27,590 | 47,980 | 27,490 | 48,290 |
| 1,000–1,199 | 35,870 | 32,130 | 32,690 | 37,780 | 32,040 | 42,120 |
| 1,200–1,399 | 49,310 | 22,210 | 41,400 | 26,430 | 37,060 | 29,160 |
| 1,400–1,599 | 74,540 | 12,180 | 61,310 | 16,130 | 54,880 | 20,900 |
| 1,600–1,799 | 84,560 | 7,880 | 77,440 | 9,650 | 72,180 | 14,340 |
| 1,800–1,999 | 77,830 | 4,710 | 81,600 | 6,300 | 79,810 | 9,520 |
| 2,000–2,399 | 110,360 | 5,520 | 125,680 | 6,950 | 148,650 | 10,820 |
| 2,400–2,799 | 54,140 | 2,800 | 72,930 | 3,470 | 89,220 | 4,910 |
| 2,800–3,199 | 27,030 | 1,800 | 36,060 | 2,080 | 48,040 | 2,830 |
| 3,200–3,599 | 16,610 | 1,030 | 19,730 | 1,200 | 25,330 | 1,840 |
| 3,600–3,999 | 10,940 | 680 | 12,840 | 810 | 16,030 | 1,210 |
| 4,000–5,999 | 26,750 | 1,550 | 30,890 | 1,690 | 35,070 | 2,230 |
| 6,000–7,999 | 9,230 | 610 | 10,090 | 680 | 10,830 | 620 |
| 8,000–9,999 | 3,132 | 182 | 3,479 | 190 | 3,597 | 206 |
| 10,000–11,999 | 1,376 | 110 | 1,576 | 106 | 1,675 | 125 |
| 12,000–13,999 | 676 | 59 | 758 | 60 | 882 | 71 |
| 14,000–15,999 | 372 | 36 | 407 | 51 | 433 | 44 |
| 16,000–17,999 | 213 | 21 | 216 | 24 | 259 | 29 |
| 18,000–19,999 | 130 | 20 | 147 | 20 | 188 | 21 |
| 20,000–39,999 | 309 | 63 | 388 | 60 | 407 | 76 |
| 40,000 and over | 53 | 7 | 74 | 13 | 82 | 9 |
| Totals | 720,140 | 330,000 | 740,920 | 344,400 | 779,790 | 377,040 |
The preponderance of females in the lower income groups is very evident. In 1962–63 males exceeded females from the income group $1,200–51,399 upwards. For males, the modal $200 range income group has been $1,800–1,999 in both 1960–61 and 1962–63.
Broad trends in total income movements over the three latest available income years appear in the percentages which are given in the following table.
| Amount of Total Income | Number of Returns | Total Income | ||||
|---|---|---|---|---|---|---|
| 1959–60 | 1960–61 | 1962–63* | 1959–60 | 1960–61 | 1962–63* | |
| * 1961–62 neither processed nor published. | ||||||
| $ $ | ||||||
| Percent | ||||||
| 0–1,199 | 42.01 | 39.84 | 37.25 | 14.34 | 13.49 | 12.26 |
| 1,200–1,999 | 31.72 | 29.51 | 27.57 | 31.86 | 28.08 | 25.10 |
| 2,000–3,999 | 21.99 | 25.96 | 30.25 | 34.91 | 39.07 | 43.74 |
| 4,000–9,999 | 3.95 | 4.33 | 4.56 | 13.79 | 14.16 | 14.12 |
| 10,000 and over | 0.33. | 0.36 | 0.37 | 5.10 | 5.20 | 4.78 |
| Totals | 100.00 | 100.00 | 100.00 | 100.00 | 100.00 | 100.00 |
Incomes of $2,000 upwards have been expanding rapidly in recent years as more and more salary and wage earners passed the $2,000 milestone.
The main subdivision into incomes derived principally from self-employment, from investments, and from salary and wages by amount of total income forms the subject of the next table, which relates to the income year 1962–63.
| Amount of Total Income | Number of Returns | Total Income | ||||
|---|---|---|---|---|---|---|
| Self-employed | Investments | Salary and Wage Earners | Self-employed | Investments | Salary and Wage Earners | |
| $ $ | Percent | |||||
| 0–1,199 | 21.55 | 60.72 | 37.99 | 5.09 | 25.35 | 13.62 |
| 1,200–1,999 | 21.33 | 18.62 | 29.28 | 12.37 | 19.12 | 29.67 |
| 2,000–3,999 | 37.47 | 14.62 | 30.29 | 38.04 | 26.71 | 47.52 |
| 4,000–9,999 | 18.17 | 5.27 | 2.28 | 37.14 | 19.83 | 7.52 |
| 10,000 and over | 1.48 | 0.77 | 0.16 | 7.36 | 8.99 | 1.67 |
| Totals | 100.00 | 100.00 | 100.00 | 100.00 | 100.00 | 100.00 |
Only 2.3 percent of salary and wage earners received $4,000 or over, compared with 18.2 percent for self-employed individuals and 5.3 percent for those with incomes principally derived from investments. The percentages in the above table related to individuals who were so classified because they obtained the largest part of their income from that source. They did not refer to amounts of income actually derived from those sources.
The 1962–63 data relating to the major sources of income are given in the next table.
| Source of Income | Number of Returns | Income | |||||
|---|---|---|---|---|---|---|---|
| Taxed at Source (Salary and Wages) | Not Taxed at Source | Assessable Dividends | Non-assessable | Total | |||
| Self-employed | Other | ||||||
| $(000) | $(000) | $(000) | $(000) | $(000) | $(000) | ||
| Self-employment | 154,070 | 10,480 | 392,860 | 12,850 | 5,280 | 500 | 421,940 |
| Investments | 72,430 | 5,280 | 3,120 | 66,080 | 29,340 | 4,400 | 107,520 |
| Salary and wages | 930,330 | 1,418,400 | 11,760 | 65,780 | 29,940 | 4,500 | 1,528,240 |
| Totals | 1,156,830 | 1,434,160 | 407,740 | 144,700 | 64,560 | 9,380 | 2,057,680 |
As the terms used in this table were adopted as a consequence of the introduction of PAYE taxation, the meanings attached to them are:
Income Taxed at Source—This is essentially salary and wages, including bonuses, taxable allowances, and the like. Also included are withholding payments, which are substantially salary and wage payments made in circumstances where no true employer-employee relationship exists (e.g., company directors' fees, fees for contributions to newspapers, jurors' fees) and some “estate” income.
Income Not Taxed at Source—The principal component is income derived from self-employment, which is given separately in the table. Subdivisions of “other” such income for which statistics are available were income from estates $12,350,000 and from social security universal superannuation $29,760,000. The balance is mainly income from interest and rents, but it includes salaries of shareholder-employees of companies. In certain circumstances, such salaries are not subject to tax deduction at source.
Non-assessable Income—Primarily this is either overseas income or some dividends from companies. The latter are now generally assessable income. Details of assessable company dividends are shown separately in the 1962–63 statistics.
As has been previously mentioned, in the preceding table, as in the other statistical tables relating to individuals, the aggregate of the component income items may be greater than the given totals. This is due to the fact that “losses” for particular income sources are deducted in order to arrive at the total income. Negative incomes are, however, ignored in the totalling of incomes from any particular source.
These same 1962–63 data about sources of income are in the following table analysed by amount of total income.
| Amount of Total Income | Number of Returns | Taxed at Source (Salary and Wages) | Not Taxed at Source | Assessable Dividends | Non-Assessable | Total | Income Tax Assessed | |
|---|---|---|---|---|---|---|---|---|
| Self-employed | Other | |||||||
| * See note to table on page 801. | ||||||||
| $ $ | $(000) | $(000) | $(000) | $(000) | $(000) | $(000) | $(000) | |
| Losses | 3,780 | 260 | – | 200 | 40 | – | – | – |
| 0–199 | 90,600 | 7,620 | 360 | 600 | 80 | – | 8,400 | 280 |
| 200–399 | 65,450 | 15,440 | 1,260 | 1,940 | 320 | 20 | 18,780 | 660 |
| 400–599 | 54,170 | 20,660 | 2,200 | 3,960 | 540 | 20 | 27,160 | 1,260 |
| 600–799 | 69,290 | 38,280 | 3,680 | 6,140 | 720 | – | 48,720 | 2,680 |
| 800–999 | 75,780 | 53,860 | 5,840 | 7,360 | 1,120 | 20 | 68,060 | 4,160 |
| 1,000–1,199 | 74,170 | 65,060 | 7,640 | 7,520 | 1,160 | 60 | 81,220 | 6,340 |
| 1,200–1,399 | 65,220 | 68,460 | 9,040 | 7,160 | 1,420 | 60 | 86,000 | 8,020 |
| 1,400–1,599 | 75,780 | 94,280 | 11,500 | 6,700 | 1,400 | 60 | 113,840 | 11,560 |
| 1,600–1,799 | 86,530 | 124,840 | 14,500 | 6,340 | 1,540 | 80 | 147,140 | 15,540 |
| 1,800–1,999 | 89,340 | 145,640 | 16,240 | 5,910 | 1,760 | 120 | 169,560 | 18,700 |
| 2,000–2,399 | 159,460 | 296,640 | 35,640 | 12,860 | 3,520 | 280 | 348,720 | 40,720 |
| 2,400–2,799 | 94,130 | 192,820 | 36,100 | 10,400 | 3,200 | 260 | 242,660 | 31,160 |
| 2,800–3,199 | 50,860 | 105,440 | 33,220 | 9,280 | 3,240 | 300 | 151,400 | 21,660 |
| 3,200–3,599 | 27,170 | 53,680 | 28,360 | 7,160 | 2,580 | 200 | 91,940 | 14,520 |
| 3,600–3,999 | 17,240 | 29,680 | 25,480 | 6,640 | 3,220 | 260 | 65,240 | 11,260 |
| 4,000–5,999 | 37,300 | 58,280 | 84,820 | 21,830 | 12,040 | 1,640 | 178,540 | 37,020 |
| 6,000–7,999 | 11,450 | 16,060 | 43,520 | 9,740 | 7,940 | 980 | 78,220 | 20,920 |
| 8,000–9,999 | 3,803 | 4,742 | 20,248 | 4,568 | 3,852 | 412 | 33,780 | 10,990 |
| 10,000–11,999 | 1,800 | 2,800 | 10,798 | 2,616 | 2,960 | 422 | 19,582 | 7,128 |
| 12,000–13,999 | 953 | 2,034 | 6,068 | 1,618 | 2,178 | 374 | 12,266 | 4,788 |
| 14,000–15,999 | 477 | 1,262 | 3,088 | 1,016 | 1,468 | 322 | 7,128 | 2,880 |
| 16,000–17,999 | 288 | 828 | 1,772 | 688 | 1,302 | 288 | 4,878 | 1,952 |
| 18,000–19,999 | 209 | 670 | 1,544 | 440 | 992 | 328 | 3,976 | 1,618 |
| 20,000–39,999 | 483 | 1,784 | 3,942 | 1,340 | 3,976 | 1,466 | 12,468 | 5,014 |
| 40,000–59,999 | 60 | 328 | 694 | 304 | 870 | 746 | 2,922 | 1,058 |
| 60,000 and over | 31 | 142 | 190 | 378 | 1,130 | 656 | 2,494 | 810 |
| Unknown* | – | 32,580 | – | – | – | – | 32,580 | 2,940 |
| Totals | 1,156,830 | 1,434,160 | 407,740 | 144,700 | 64,560 | 9,380 | 2,057,680 | 285,630 |
An interesting feature is that assessable dividends and non-assessable income are heavily concentrated in the hands of individuals who have incomes of $4,000 or more. They received 62.7 percent of the total of these two classes of income.
Industrial Classification of Incomes—Incomes of individuals who were classified as mainly deriving income from self-employment in 1962–63 are in the next table analysed by industrial affiliation. For the sake of completeness, the table also includes the totals for salary and wage earners and for individuals deriving income from investments, but there is no information available concerning the industrial classification of these two classes of individuals.
| Amount of Total Income | Number of Returns | Income Tax | Income Tax Assessed | |||||
|---|---|---|---|---|---|---|---|---|
| Taxed at Source (Salary and Wages) | Not Taxed at Source | Assessable Dividends | Non-Assessable | Total* | ||||
| Self-employed | Other | |||||||
| * There are differences between the totals of component items and the given cross totals; “rounding off” may account for plus or minus $10,000 of the differences, but the principal reason is that “losses” have been offset against income from other sources in arriving at the given total income. | ||||||||
| $(000) | $(000) | $(000) | $(000) | $(000) | $(000) | $(000) | ||
| Self-employed— | ||||||||
| Agriculture and live-stock Production— | ||||||||
| Sheep farming | 26,620 | 1,820 | 85,260 | 4,060 | 1,360 | 100 | 92,620 | 20,880 |
| Dairy farming | 29,950 | 1,280 | 63,160 | 2,040 | 320 | 40 | 66,820 | 9,760 |
| Other farming | 26,710 | 1,840 | 59,520 | 1,900 | 460 | 20 | 63,720 | 10,960 |
| Total farming | 83,280 | 4,940 | 207,940 | 8,000 | 2,140 | 160 | 223,160 | 41,600 |
| Forestry, hunting, and fishing | 2,870 | 260 | 3,560 | 40 | 20 | – | 3,880 | 680 |
| Mining and quarrying | 230 | 40 | 840 | 20 | – | 900 | 200 | |
| Manufacturing— | ||||||||
| Food, drink, and tobacco | 830 | 60 | 2,060 | 80 | 20 | – | 2,200 | 460 |
| Apparel, textiles, and footwear | 1,740 | 80 | 2,500 | 80 | 60 | – | 2,720 | 420 |
| Metals, and Metal products | 2,630 | 240 | 6,660 | 100 | 40 | – | 7,040 | 1,140 |
| Other | 2,250 | 120 | 5,300 | 120 | 60 | 10 | 5,620 | 1,000 |
| Construction | 15,970 | 920 | 40,500 | 740 | 200 | – | 42,340 | 6,660 |
| Electricity, gas, water, and sanitary services | 10 | – | 60 | – | – | – | 60 | 20 |
| Commerce— | ||||||||
| Wholesale and retail trade | 19,050 | 1,200 | 42,580 | 1,300 | 600 | 60 | 45,760 | 7,800 |
| Other | 1,560 | 260 | 4,880 | 300 | 260 | 40 | 5,720 | 1,400 |
| Transport, storage and communication | 5,420 | 440 | 13,220 | 260 | 60 | – | 13,900 | 2,160 |
| Services, community— | ||||||||
| Professional | 8,690 | 1,300 | 45,220 | 1,300 | 1,620 | 220 | 49,680 | 14,520 |
| Other | 9,280 | 600 | 17,360 | 520 | 180 | – | 18,640 | 3,120 |
| Unknown | 270 | 20 | 180 | – | 20 | – | 220 | 40 |
| Totals: Self-employed | 154,070 | 10,480 | 392,860 | 12,850 | 5,280 | 500 | 421,920 | 81,220 |
| Salary and Wages | 930,330 | 1,418,400 | 11,760 | 65,780 | 29,940 | 4,500 | 1,528,240 | 190,080 |
| Investment income | 72,430 | 5,280 | 3,120 | 66,080 | 29,340 | 4,400 | 107,520 | 14,320 |
| Grand totals | 1,156,830 | 1,434,160 | 407,740 | 144,700 | 64,560 | 9,380 | 2,057,680 | 285,630 |
As the table gives the amounts received from each major source of income, it will be appreciated that the classification is based on the source of the largest component item of total income. The United Nations' “enterprise” concept has been adopted for classification purposes. Under this concept, if an individual receives income from two or more of the separately classifiable industries, the whole of the income is classed as if derived from the industry which provided the largest amount of income, and no attempt is made to allocate the component portions of the income to the different industries from which derived. These statistics are therefore not exactly comparable with most other types of statistics where the “establishment” concept is generally used. This provides for the sub-division of the “enterprise” where more than one separately classifiable industry is carried on and each subdivision is then appropriately classified.
Exemptions—In the case of individuals certain statutory deductions are made from the assessable income, and income tax is paid on the balance. Absentees are not usually entitled to the benefit of exemptions other than the personal exemption. These exemptions in 1962–63 were:
A personal exemption of $936.
An exemption of $312 in respect of a dependent wife (or husband), diminished by $2 for every $2 on the wife's income in excess of $312.
An exemption not exceeding $312 in respect of a housekeeper employed by a widow, widower, or divorced person to have the care and control of any child or children of the taxpayer. This is included with the wife's exemption in the statistics.
An exemption for contributions not exceeding $156 towards the support of a relative by blood, marriage, or adoption, who was dependent on the taxpayer. Children of the taxpayer were included in this definition, the exemption normally continuing until the child reaches the age of 18 years.
Life assurance premiums, National Provident Fund, superannuation, and similar contributions. An exemption was allowed up to a maximum of 20 percent of assessable income or $500 whichever amount was the lesser.
Donations and school fees. An exemption not exceeding in aggregate $50 in any income year paid by the taxpayer by way of gifts of money to certain organisations or funds or by way of school fees.
The scope of some of the above exemptions has been extended in later income years. Details of the later exemptions are given in Section 26B.
The next table which shows the amounts of the insurance, gifts and school fees, total and excess exemptions for the income year 1962–63, classified by size of total income, departs from the former procedure. Potential exemptions have been recorded and the “excess” column gives the amounts by which the exemptions exceed the assessable income (excluding from that term company dividends, which are now assessable income). The amounts of taxable income are also given in the table.
| Amount of Total Income | Exemptions | Taxable Income | |||
|---|---|---|---|---|---|
| Insurance | Gifts and School Fees | Total | Excess | ||
| $ $ | $(000) | $(000) | $(000) | $(000) | $(000) |
| Losses | 120 | – | 4,820 | 4,820 | – |
| 0–199 | 100 | – | 31,300 | 27,780 | – |
| 200–399 | 140 | 20 | 33,000 | 23,060 | 40 |
| 400–599 | 260 | – | 32,170 | 15,980 | 60 |
| 600–799 | 460 | 40 | 39,940 | 11,820 | 120 |
| 800–999 | 800 | 60 | 52,380 | 6,220 | 440 |
| 1,000–1,199 | 1,240 | 80 | 54,440 | 2,960 | 6,180 |
| 1,200–1,399 | 1,500 | 100 | 50,880 | 2,100 | 12,480 |
| 1,400–1,599 | 2,180 | 120 | 59,820 | 1,760 | 20,060 |
| 1,600–1,799 | 3,100 | 160 | 77,880 | 1,620 | 29,410 |
| 1,800–1,999 | 4,260 | 180 | 93,280 | 1,000 | 39,580 |
| 2,000–2,399 | 11,520 | 460 | 221,240 | 860 | 115,160 |
| 2,400–2,799 | 9,780 | 400 | 144,120 | 120 | 98,420 |
| 2,800–3,199 | 6,620 | 280 | 79,480 | 20 | 71,640 |
| 3,200–3,599 | 4,640 | 200 | 43,420 | – | 48,320 |
| 3,600–3,599 | 3,300 | 140 | 27,860 | 20 | 37,140 |
| 4,000–5,999 | 8,820 | 380 | 62,260 | 20 | 114,640 |
| 6,000–7,999 | 3,420 | 160 | 19.940 | 20 | 57,300 |
| 8,000–9,999 | 1,216 | 68 | 6,560 | – | 26,800 |
| 10,000 and over | 1,422 | 78 | 7,148 | – | 53,962 |
| Totals | 64,890 | 2,930 | 1,141,930 | 100,180 | 731,750 |
The preceding figures include only the exemptions and taxable incomes for the 877,710 assessments of income which have been incorporated in these statistics. Where income and tax data were derived from tax deduction certificates, there is no information available concerning the amounts of exemptions or taxable income.
COMPANY INCOMES—It is perhaps desirable to draw attention to the fact that the term “companies” as it is used in connection with these statistics has been given a wider meaning than that which is commonly assigned to it. A definition of the term will be found on page 804.
The various statutory exemptions which are granted to individuals do not apply in the case of companies. The amounts of assessable income and taxable income are identical in the case of companies.
These statistics for companies have been compiled from returns for all companies, and are not estimates based on a sample survey.
The following table gives particulars of the number of companies and their aggregate assessable incomes for 1963–64 and the two preceding income years.
| Amount of Assessable Income | Number of Returns | Assessable Income | ||||
|---|---|---|---|---|---|---|
| 1961–62 | 1962–63 | 1963–64 | 1961–62 | 1962–63 | 1963–64 | |
| * Assessable income before deduction of losses brought forward from previous years. | ||||||
| $ $ | ||||||
| $(000) | $(000) | $(000) | ||||
| 0-199 | 4,245 | 3,769 | 5,231 | 254 | 280 | 296 |
| 200–399 | 1,937 | 1,993 | 2,115 | 566 | 586 | 614 |
| 400–599 | 1,705 | 1,739 | 1,924 | 844 | 862 | 944 |
| 600–799 | 1,524 | 1,535 | 1,607 | 1,064 | 1,066 | 1,124 |
| 800–999 | 1,332 | 1,359 | 1,371 | 1,192 | 1,224 | 1.228 |
| 1,000–1,199 | 1,348 | 1,348 | 1,431 | 1,464 | 1,470 | 1,558 |
| 1,200–1,399 | 1,113 | 1,148 | 1,230 | 1,444 | 1,490 | 1,594 |
| 1,400–1,599 | 983 | 1,036 | 1,059 | 1,472 | 1,554 | 1,584 |
| 1,600–1,799 | 908 | 904 | 910 | 1,542 | 1,534 | 1,542 |
| 1,800–1,999 | 802 | 844 | 862 | 1,518 | 1,598 | 1,634 |
| 2,000–3,999 | 5,399 | 5,582 | 5,837 | 15,398 | 15,936 | 16,736 |
| 4,000–5,999 | 2,588 | 2,595 | 2,779 | 12,596 | 12,704 | 13,548 |
| 6,000–7,999 | 1,482 | 1,529 | 1,645 | 10,242 | 10,582 | 11,314 |
| 8,000–9,999 | 915 | 965 | 998 | 8,150 | 8,636 | 8,878 |
| 10,000–11,999 | 582 | 615 | 637 | 6,360 | 6,728 | 6,960 |
| 12,000–13,999 | 425 | 450 | 485 | 5,496 | 5,818 | 6,280 |
| 14,000–15,999 | 337 | 344 | 411 | 5,040 | 5,144 | 6,154 |
| 16,000–17,999 | 268 | 250 | 296 | 4,542 | 4,232 | 5,026 |
| 18,000–19,999 | 247 | 234 | 231 | 4,692 | 4,426 | 4,386 |
| 20,000–39,999 | 1,008 | 1,048 | 1,153 | 27,822 | 29,120 | 32,426 |
| 40,000–59,999 | 347 | 359 | 379 | 16,790 | 17,534 | 18,350 |
| 60,000–79,999 | 150 | 191 | 221 | 10,400 | 13,134 | 15,278 |
| 80,000–99,999 | 122 | 94 | 123 | 11,066 | 8,398 | 10,914 |
| 100,000–199,999 | 237 | 258 | 249 | 34,074 | 36,362 | 34,590 |
| 200,000–399,999 | 118 | 132 | 163 | 32,650 | 36,706 | 45,528 |
| 400,000–599,999 | 45 | 50 | 43 | 23,038 | 23,884 | 21,312 |
| 600,000–799,999 | 17 | 19 | 28 | 11,782 | 13,248 | 18,444 |
| 800,000–999,999 | 13 | 20 | 23 | 11,876 | 18,160 | 20,840 |
| 1,000,000–1,999,999 | 26 | 31 | 34 | 36,336 | 42,102 | 47,078 |
| 2,000,000 and over | 7 | 12 | 17 | 23,750 | 37,260 | 55,540 |
| Current net loss | 6,800 | 7,761 | 8,114 | – | – | – |
| Assessable income before losses* | 2,755 | 3,797 | 3,126 | – | – | – |
| Totals | 39,785 | 42,011 | 44,732 | 323,460 | 361,781 | 411,700 |
The item “assessable income before losses”, which appears in the preceding table and also in subsequent tables, requires a little further explanation. Companies, and also individuals, are permitted to offset losses for one particular source of assessable income against the profits from any other source of assessable income during the same income year. The remainder of the loss, if any, can be carried forward and offset against the assessable profits of the next six income years. This item represents the number of companies whose assessable incomes for the current year have been reduced to “nil” by the offsetting of losses incurred in previous income years.
In 1963–64, including those with “current net loss” and “assessable income before losses”, about 65 percent of all companies had assessable incomes of under $2,000. Most of these companies are virtually owned and controlled by one person or are the equivalent of a small partnership. In such cases the managerial salaries paid to the proprietors are an important element in the total income drawn from the company by the proprietors.
After an increase of $38,321,000 in assessable income in 1962–63, there was a further increase of $49,919,000 in 1963–64.
In the following table the amount of assessable income of companies is classified for the 1963–64 income year.
| Amount of Assessable Income | Number of Returns | Assessable Income Before Losses* | Assessable Income | Returnable Income | Current Net Loss | Income Tax Assessed | |
|---|---|---|---|---|---|---|---|
| Ordinary | Social Security | ||||||
| * Assessable income before deduction of losses brought forward from previous years. | |||||||
| $ $ | |||||||
| $(thousand) | |||||||
| 0–199 | 5,231 | 532 | 296 | 11,694 | 22 | 148 | 22 |
| 200–399 | 2,115 | 754 | 614 | 912 | – | 84 | 44 |
| 400–599 | 1,924 | 1,080 | 944 | 1,056 | – | 130 | 70 |
| 600–799 | 1,607 | 1,258 | 1,124 | 2,034 | – | 178 | 82 |
| 800–999 | 1,371 | 1,344 | 1,228 | 6,428 | – | 180 | 90 |
| 1,000–1,199 | 1,431 | 1,652 | 1,558 | 1,584 | – | 232 | 116 |
| 1,200–1,399 | 1,230 | 1,722 | 1,594 | 1,662 | 6 | 246 | 118 |
| 1,400–1,599 | 1,059 | 1,692 | 1,584 | 1,698 | – | 252 | 118 |
| 1,600–1,799 | 910 | 1,592 | 1,542 | 1,568 | – | 248 | 116 |
| 1,800–1,999 | 862 | 1,708 | 1,634 | 1,694 | 30 | 270 | 122 |
| 2,000–3,999 | 5,837 | 17,158 | 16,736 | 17,878 | 50 | 3,178 | 1,246 |
| 4,000–5,999 | 2,779 | 13,752 | 13,548 | 14,180 | – | 3,130 | 1,012 |
| 6,000–7,999 | 1,645 | 11,424 | 11,314 | 11,526 | – | 3,086 | 848 |
| 8,000–9,999 | 998 | 8,968 | 8,878 | 9,346 | – | 2,738 | 664 |
| 10,000–11,999 | 637 | 6,976 | 6,960 | 7,318 | – | 2,294 | 520 |
| 12,000–13,999 | 485 | 6,312 | 6,280 | 6,370 | – | 2,160 | 468 |
| 14,000–15,999 | 411 | 6,204 | 6,154 | 6,644 | – | 2,186 | 462 |
| 16,000–17,999 | 296 | 5,066 | 5,026 | 5,658 | – | 1,846 | 374 |
| 18,000–19,999 | 231 | 4,410 | 4,386 | 4,632 | – | 1,646 | 328 |
| 20,000–39,999 | 1,153 | 32,486 | 32,426 | 34,740 | – | 12,660 | 2,424 |
| 40,000–59,999 | 379 | 18,406 | 18,350 | 18,888 | – | 7,484 | 1,366 |
| 60,000–79,999 | 221 | 15,346 | 15,278 | 16,488 | – | 6,320 | 1,142 |
| 80,000–99,999 | 123 | 10,928 | 10,914 | 11,324 | – | 4,514 | 776 |
| 100,000–199,999 | 249 | 34,743 | 34,590 | 36,272 | – | 14,572 | 2,570 |
| 200,000–399,999 | 163 | 45,740 | 45,528 | 47,016 | – | 19,216 | 3,346 |
| 400,000–599,999 | 43 | 21,312 | 21,312 | 22,658 | – | 8,968 | 1,564 |
| 600,000–799,999 | 28 | 18,444 | 18,444 | 18,774 | – | 7,888 | 1,384 |
| 800,000–999,999 | 23 | 20,840 | 20,840 | 22,822 | – | 8,365 | 1,472 |
| 1,000,000–1,999,999 | 34 | 47,078 | 47,078 | 48,182 | – | 19,204 | 3,212 |
| 2,000,000 and over | 17 | 55,540 | 55,540 | 59,040 | – | 21,442 | 3,374 |
| Net loss | 8,114 | – | – | 218 | 22,326 | – | – |
| Assessable income before losses | 3,126 | 4,640 | – | 232 | – | – | 6 |
| Totals, 1963–64 | 44,732 | 419,112 | 411,700 | 450,534 | 22,434 | 154,868 | 29,458 |
| 1962–63 | 42,011 | 370,720 | 361,781 | 389,770 | 21,862 | 134,092 | 25,810 |
| 1961–62 | 39,785 | 331,470 | 323,460 | 344,946 | 20,964 | 118,176 | 23,130 |
Companies are classified by industry, the classification being identical with that used for individuals, with the minor exception that community services—professional—do not form a separate group. Attention is drawn to the remarks on page 809 regarding the difference between the enterprise and the establishment concepts. The statistics are based on the enterprise concept, i.e., the whole of the company's activities are classified according to the predominant activity. The figures in the next table give the results of this classification for the income years 1963–64.
| Industry Group | Number of Returns | Assessable Income Before Losses* | Assessable Income | Returnable Income | Current Net Loss | Income Tax Assessed | |
|---|---|---|---|---|---|---|---|
| Ordinary | Social Security | ||||||
| * Assessable income before deduction of losses brought forward from previous years. | |||||||
| $(thousand) | |||||||
| Agriculture and livestock production | 3,371 | 10,624 | 9,632 | 9,730 | 1,186 | 2,794 | 720 |
| Forestry, hunting, and fishing | 162 | 648 | 542 | 596 | 114 | 176 | 40 |
| Mining and quarrying | 291 | 2,264 | 2,202 | 2,210 | 1,566 | 810 | 166 |
| Manufacturing— | |||||||
| Food, beverages, and tobacco | 892 | 41,598 | 41,156 | 42,874 | 6,218 | 17,246 | 3,082 |
| Textiles, wearing apparel, made-up textiles, and footwear | 914 | 16,796 | 16,606 | 17,238 | 464 | 6,600 | 1,246 |
| Metals and metal products | 2,879 | 34,892 | 34,510 | 34,918 | 1,710 | 13,276 | 2,590 |
| Wood, paper, and chemical products (including miscellaneous) | 2,919 | 68,272 | 67,456 | 70,913 | 1,634 | 27,258 | 5,058 |
| Construction | 3,437 | 15,718 | 15,006 | 15,148 | 1,800 | 4,946 | 1,124 |
| Electricity, gas, water, and sanitary services | 24 | 438 | 434 | 434 | 18 | 172 | 32 |
| Commerce— | |||||||
| Wholesale and retail | 14,722 | 136,976 | 135,214 | 141,458 | 4,722 | 52,328 | 10,126 |
| Other | 9,585 | 65,604 | 64,598 | 89,804 | 1,120 | 20,872 | 3,454 |
| Transport, storage, and communication | 1,919 | 12,316 | 11,772 | 12,204 | 662 | 3,970 | 876 |
| Services, community and business, and recreation | 3,614 | 12,966 | 12,572 | 13,004 | 1,216 | 4,420 | 944 |
| Unknown or not stated | 3 | – | – | – | 4 | – | – |
| Totals—1963–64 | 44,732 | 419,112 | 411,700 | 450,534 | 22,434 | 154,868 | 29,458 |
| 1962–63 | 42,011 | 370,720 | 361,781 | 389,770 | 21,862 | 134,092 | 25,810 |
| 1961–62 | 39,785 | 331,470 | 323,460 | 344,946 | 20,964 | 118,176 | 23,130 |
The principal sharers of the additions to the numbers of companies in 1963–64 were “commerce—other” (900) and “commerce—wholesale and retail trade” (797).
A large proportion of the companies in the “commerce—other” group were at one time actively engaged in some type of business operations but on the death or retirement of the principal shareholders the companies have become property holders receiving income from interest or rents. The farming community has also contributed a share of the increase in “commerce—other”. Many companies have been formed for the purpose of owning farming land and buildings, with the farmers owning and controlling the farming operations either as individuals or partnerships. An additional factor contributing to the increase in the numbers of companies in the “commerce—other” group is the formation of “own your own flat” companies.
Rates of Tax: Companies—For incomes received during the income year 1963–64 the rate of ordinary income tax payable by a company was 12 1/2c, increased by 1/120c for each $1 of taxable income up to $7,200. Above $7,200 the rate was 42 1/2c in the dollar. Social security income tax was levied at the rate of 1c in every 13 1/3c of income and excess retention tax was levied at a flat rate of 35c in the dollar but not all companies were liable to pay these taxes. More information about taxation rates will be found in the section on Taxation.
The next table shows some additional data concerning companies which relate to the income year 1963–64.
| Industry Group | Stocks at End of Period | Income | Expenditure | Gross Profit | |||||
|---|---|---|---|---|---|---|---|---|---|
| Sales and Services | Interest and Gross Rents | Purchases | Salaries and Wages | Interest | Rent | Depreciation | |||
| * Gross profit not normally available. | |||||||||
| $(thousand) | |||||||||
| Agriculture and livestock production | 28,990 | 83,350 | 888 | 18,410 | 20,496 | 3,178 | 1,906 | 4,802 | 48,602 |
| Forestry, hunting, and fishing | 762 | 11,454 | 340 | ... | 2,764 | 268 | 238 | 981 | 3,802 |
| Mining and quarrying | 1,022 | 31,860 | 166 | ... | 11,034 | 223 | 596 | 2,948 | * |
| Manufacturing— | |||||||||
| Food, beverages, and tobacco | 103,132 | 945,192 | 2,780 | 660,730 | 101,920 | 4,610 | 3,090 | 16,024 | 150,764 |
| Textiles, wearing apparel, made-up textiles, and footwear | 52,600 | 220,168 | 738 | 112,106 | 56,928 | 1,766 | 3,044 | 4,636 | 52,178 |
| Metals and metal products | 77,720 | 436,428 | 1,660 | 259,794 | 88,522 | 2,774 | 4,406 | 8,900 | 94,986 |
| Wood, paper, and chemical products (including miscellaneous) | 124,320 | 678,536 | 4,132 | 327,662 | 141,518 | 7,640 | 7,216 | 26,484 | 180,060 |
| Construction | 47,516 | 327,470 | 1,118 | 169,112 | 81,191 | 1,735 | 1,492 | 8,168 | 55,382 |
| Electricity, gas, water, and sanitary services | 1,316 | 6,814 | 58 | 2,874 | 1,732 | 218 | 8 | 560 | 3,006 |
| Commerce— | |||||||||
| Wholesale and retail | 448,252 | 3,024,440 | 13,654 | 2,386,402 | 244,550 | 14,963 | 22,023 | 27,394 | 494,188 |
| Other | 6,660 | 201,734 | 148,338 | 8,460 | 56,070 | 41,444 | 2,746 | 6,920 | * |
| Transport, storage, and communication | 1,798 | 158,540 | 1,024 | 13,552 | 51,932 | 1,750 | 1,704 | 13,734 | * |
| Services, community and business and recreation | 8,054 | 175,440 | 3,064 | 63,696 | 47,952 | 1,794 | 4,796 | 5,614 | 36,586 |
| Unknown or not stated | – | 6 | – | – | 2 | – | – | – | – |
| Totals, 1963–64 | 902,140 | 6,301,432 | 177,962 | 4,022,800 | 906,614 | 82,360 | 53,262 | 127,168 | 1,119,556 |
| 1962–63 | 829,560 | 5,618,524 | 156,102 | 3,534,462 | 838,150 | 69,878 | 47,156 | 111,324 | 1,009,402 |
| 1961–62 | 794,656 | 5,331,498 | 143,672 | 3,384,512 | 796,124 | 64,372 | 44,146 | 101,840 | 936,826 |
One point which should be noted is that the purchases figures have not been given for the forestry and mining industry groups. It was found that there was a considerable lack of uniformity in such data for these two groups, which was probably connected with differing treatments of royalty and equivalent payments.
The amount of gross profit shown in the accounts is used in these statistics, despite the wide variations in the conceptions of gross profit. No attempt has been made to secure uniformity of calculation for individual companies, but of course the total gross profit for each industry should correspond with that industry's average conception of gross profit. In some industries, such as the transport industry, it is not normal practice to calculate gross profit, and in some cases the gross profit is recorded in these statistics as nil. Estimates of the amount of gross profit were, however, made when any company did not calculate the gross profit, and it was the custom of the industry concerned to show this figure.
The abridged version of the full industry classification for which data are given in this publication does not reveal the individual industries where the gross profit is not generally calculated. Apart from “Mining and Quarrying”, “Commerce, other” and “Transport, etc.”, there are a number of industries included in “Services, community” which do not show gross profit.
The assessable income, dividends, paid-up capital, and shareholders' funds for 1963–64 are given in the two following tables.
| Industry Group | Number of Returns | Assessable Income | Dividends Paid | Shareholders' Funds | |
|---|---|---|---|---|---|
| Total | Paid-up Capital | ||||
| * Debit balance, i.e., negative amount. | |||||
| $(000) | $(000) | $(000) | $(000) | ||
| Agriculture and livestock production | 3,371 | 9,632 | 3,716 | 109,963 | 55,143 |
| Forestry, hunting, and fishing | 162 | 542 | 244 | 11,224 | 6,028 |
| Mining and quarrying | 291 | 2,202 | 708 | 41,774 | 7,038 |
| Manufacturing— | |||||
| Food, beverages, and tobacco | 892 | 41,156 | 10,618 | 255,452 | 119,917 |
| Textiles, wearing apparel, made-up textiles, and footwear | 914 | 16,606 | 5,214 | 88,803 | 40,256 |
| Metals and metal products | 2,879 | 34,510 | 9,370 | 147,594 | 71,437 |
| Wood, paper, and chemical products (including miscellaneous) | 2,919 | 67,456 | 22,210 | 360,456 | 208,598 |
| Construction | 3,437 | 15,006 | 4,956 | 73,736 | 31,153 |
| Electricity, gas, water, and sanitary services | 24 | 434 | 168 | 5,462 | 3,102 |
| Commerce— | |||||
| Wholesale and retail | 14,722 | 135,214 | 45,672 | 725,845 | 341,193 |
| Other | 9,585 | 64,598 | 28,824 | 589,181 | 299,577 |
| Transport, storage, and communication | 1,919 | 11,772 | 3,978 | 91,386 | 49,008 |
| Services, community and business, and recreation | 3,614 | 12,572 | 4,002 | 88,595 | 28,481 |
| Unknown or not stated | 3 | – | – | -2* | 2 |
| Totals 1963–64 | 44,732 | 411,700 | 139,682 | 2,589,476 | 1,260,934 |
| 1962–63 | 42,011 | 361,781 | 125,320 | 2,394,354 | 1,192,116 |
| 1961–62 | 39,785 | 323,460 | 113,880 | 2,175,156 | 1,090,096 |
In 1963–64 dividends paid were equal to 33.9 percent of the assessable income compared with 34.6 percent in 1962–63 and 35.2 percent in 1961–62.
For the purposes of these statistics, the shareholders funds of a company are defined, briefly, as the amount which would be available to shareholders if the assets were realised and the liabilities discharged at the net values shown in the balance sheet. In the case of New Zealand branches of overseas companies, either the paid-up capital and the shareholders' funds are apportioned on some equitable basis, or the balance of the branch's head office account is taken. The capital loan liabilities of those Government Departments which are included in these statistics have been omitted from both paid-up capital and shareholders' funds. Advances from shareholders have been added to shareholders' funds and advances to shareholders deducted.
An analysis of companies by amount of paid-up capital for 1963–64 discloses the position shown in the next table. Those with no paid-up capital are mostly industrial and provident societies, clubs, associations, and similar incorporated bodies.
| Amount of Paid-up Capital | Number of Returns | Paid-up Capital | Shareholders' Funds | Dividends Paid |
|---|---|---|---|---|
| $ $ | ||||
| $(000) | $(000) | $(000) | ||
| Nil | 2,795 | – | 90,575 | 6,000 |
| 1–999 | 2,828 | 1,034 | 28,962 | 1,994 |
| 1,000–1,999 | 3,500 | 4,185 | 26,508 | 1,758 |
| 2,000–3,999 | 8,399 | 20,194 | 94,270 | 5,208 |
| 4,000–5,999 | 6,282 | 27,546 | 84,806 | 4,872 |
| 6,000–7,999 | 3,964 | 25,102 | 62,128 | 3,476 |
| 8,000–9,999 | 2,463 | 20,583 | 45,352 | 2,636 |
| 10,000–11,999 | 2,745 | 27,936 | 65,992 | 3,290 |
| 12,000–13,999 | 1,573 | 19,363 | 42,515 | 2,268 |
| 14,000–15,999 | 975 | 14,185 | 29,120 | 1,544 |
| 16,000–17,999 | 809 | 13,201 | 26,490 | 1,620 |
| 18,000–19,999 | 583 | 10,774 | 19,963 | 1,098 |
| 20,000–39,999 | 4,113 | 101,950 | 220,988 | 11,492 |
| 40,000–59,999 | 1,358 | 61,896 | 120,702 | 5,132 |
| 60,000–79,999 | 614 | 40,040 | 77,426 | 4,372 |
| 80,000–99,999 | 296 | 25,396 | 48,526 | 2,390 |
| 100,000–119,999 | 278 | 28,860 | 57,914 | 3,454 |
| 120,000–139,999 | 136 | 17,018 | 34,398 | 1,558 |
| 140,000–159,999 | 101 | 14,798 | 24,852 | 1,310 |
| 160,000–179,999 | 66 | 10,953 | 24,412 | 1,400 |
| 180,000–199,999 | 40 | 7,520 | 15,024 | 844 |
| 200,000–399,999 | 395 | 102,101 | 187,622 | 12,440 |
| 400,000–599,999 | 119 | 55,458 | 109,638 | 5,854 |
| 600,000–799,999 | 73 | 49,844 | 85,445 | 4,500 |
| 800,000–999,999 | 35 | 30,924 | 52,596 | 3,760 |
| 1,000,000–1,199,999 | 32 | 33,404 | 56,603 | 2,500 |
| 1,200,000–1,399,999 | 30 | 38,100 | 60,194 | 4,308 |
| 1,400,000–1,599,999 | 21 | 31,034 | 52,132 | 3,592 |
| 1,600,000–1,799,999 | 17 | 27,796 | 49,218 | 2,014 |
| 1,800,000–1,999,999 | 11 | 20,358 | 45,534 | 1,976 |
| 2,000,000 and over | 81 | 379,380 | 649,568 | 31,022 |
| Totals 1963–64 | 44,732 | 1,260,934 | 2,589,476 | 139,682 |
| 1962–63 | 42,011 | 1,192,116 | 2,394,354 | 125,320 |
| 1961–62 | 39,785 | 1,090,096 | 2,175,156 | 113,880 |
In 1963–64 there were 814 companies with paid-up capital of $200,000 and over. Corresponding figures for 1962–63 and 1961–62 were respectively 748 and 713. These companies had 60.9 percent of the total paid-up capital and 52.1 percent of the total shareholders' funds.
The number of companies increased by 6.5 percent in 1963–64 and paid-up capital rose by 5.8 percent. The same percentages for 1962–63 were respectively 5.6 percent and 9.4 percent.
An analysis by the type of company—i.e., private, public, overseas, etc.—is given in the three following tables, which present some of the principal data for the year 1963–64.
| Industry Croup | Number of Returns | Assessable Income | Ordinary and Social Security Income Tax | Net Business Loss | Shareholders' Funds | Dividends Paid | |
|---|---|---|---|---|---|---|---|
| Paid-up Capital | Total | ||||||
| * Debit balance, i.e., negative amount. | |||||||
| New Zealand Private Companies | |||||||
| $(000) | $(000) | $(000) | $(000) | $(000) | $(000) | ||
| Agriculture and livestock production | 3,358 | 9,410 | 3,404 | 1,178 | 53,384 | 107,661 | 3,130 |
| Forestry, hunting, and fishing | 149 | 460 | 182 | 112 | 3,696 | 8,556 | 186 |
| Mining and quarrying | 268 | 1,334 | 548 | 204 | 4,596 | 37,804 | 366 |
| Manufacturing— | |||||||
| Food, beverages, and tobacco | 636 | 13,626 | 6,492 | 5,630 | 35,850 | 74,220 | 4,172 |
| Textiles, wearing apparel, madeup textiles, and footwear | 861 | 9,908 | 4,526 | 390 | 16,970 | 41,439 | 2,824 |
| Metals and metal products | 2,801 | 26,858 | 12,108 | 1,404 | 51,600 | 110,246 | 7,520 |
| Wood, paper, and chemical products (including miscellaneous) | 2,685 | 35,528 | 16,376 | 1,064 | 65,894 | 146,114 | 11,002 |
| Construction | 3,420 | 14,100 | 5,624 | 1,760 | 28,350 | 68,410 | 4,752 |
| Electricity, gas, water and sanitary services | 13 | 26 | 8 | – | 30 | 152 | 8 |
| Commerce— | |||||||
| Wholesale and retail | 14,252 | 89,274 | 39,330 | 4,280 | 207,272 | 451,975 | 27,876 |
| Other | 8,838 | 16,234 | 5,510 | 834 | 144,082 | 255,918 | 18,020 |
| Transport, storage, and communication | 1,783 | 8,954 | 3,678 | 426 | 23,707 | 49,564 | 2,718 |
| Services (community, business, and recreation) | 2,619 | 8,942 | 3,658 | 662 | 23,188 | 46,578 | 3,554 |
| Unknown or not stated | 3 | – – | – – | 4 | 2 | -2* | – |
| Totals 1963–64 | 41,686 | 234,654 | 101,446 | 17,950 | 658,618 | 1,398,638 | 86,126 |
| 1962–63 | 39,028 | 206,046 | 88,002 | 16,412 | 616,498 | 1,282,412 | 75,908 |
| 1961–62 | 36,768 | 187,174 | 79,002 | 14,874 | 566,200 | 1,159,608 | 70,616 |
| New Zealand Public Companies | |||||||
| Agriculture and livestock production | 8 | 90 | 40 | 2 | 628 | 847 | 36 |
| Forestry, hunting, and fishing | 34 | 946 | 460 | 1,364 | 4,772 | 6,628 | 400 |
| Mining and quarrying | |||||||
| Manufacturing— | |||||||
| Food, beverages, and tobacco | 289 | 30,484 | 15,124 | 650 | 99,424 | 212,152 | 8,740 |
| Textiles, wearing apparel, madeup textiles, and footwear | |||||||
| Metals and metal products | 57 | 5,894 | 2,874 | 34 | 15,256 | 30,938 | 1,602 |
| Wood, paper, and chemical products (including miscellaneous) | 191 | 29,364 | 14,620 | 536 | 138,274 | 204,048 | 11,018 |
| Construction | 11 | 764 | 374 | 32 | 2,752 | 4,732 | 204 |
| Electricity, gas, water, and sanitary services | 11 | 408 | 196 | 18 | 3,072 | 5,310 | 160 |
| Commerce— | |||||||
| Wholesale and retail | 271 | 31,706 | 15,698 | 360 | 117,652 | 213,327 | 13,906 |
| Other | 339 | 23,438 | 10,286 | 70 | 123,654 | 237,821 | 10,730 |
| Transport, storage, and communication | 117 | 2,484 | 1,026 | 236 | 24,766 | 40,942 | 1,168 |
| Services (community, business, and recreation) | 55 | 2,154 | 1,052 | 130 | 5,166 | 19,093 | 366 |
| Unknown or not stated | – | – | – | – | – | – | – |
| Totals 1963–64 | 1,383 | 127,730 | 61,750 | 3,434 | 535,416 | 975,838 | 48,330 |
| 1962–63 | 1,398 | 116,208 | 56,580 | 3,900 | 507,612 | 917,232 | 42,806 |
| 1961–62 | 1,415 | 99,276 | 47,770 | 4,212 | 457,000 | 834,168 | 37,684 |
| Remainder of Companies (overseas, industrial, and provident societies, etc.) | |||||||
| Agriculture and livestock production | 7 | 138 | 70 | 6 | 1,134 | 1,463 | 552 |
| Forestry, hunting, and fishing Mining and quarrying | |||||||
| Manufacturing— | |||||||
| Foods, beverages, and tobacco | 20 | 3,744 | 2,032 | 10 | 7,932 | 16,444 | 96 |
| Textiles, wearing apparel, and made-up textiles | |||||||
| Metals and metal products | 21 | 1,758 | 884 | 272 | 4,582 | 6,410 | 248 |
| Wood, paper, and chemical products (including miscellaneous) | 43 | 2,564 | 1,320 | 34 | 4,430 | 10,294 | 192 |
| Construction | 6 | 140 | 72 | 8 | 50 | 594 | – |
| Electricity, gas, water, and sanitary services | – | – | – | – | – | – | – |
| Commerce— | |||||||
| Wholesale and retail | 199 | 14,236 | 7,426 | 82 | 16,268 | 60,545 | 3,891 |
| Other | 408 | 24,924 | 8,530 | 216 | 31,842 | 95,442 | 74 |
| Transport, storage, and communication | 19 | 334 | 142 | – | 536 | 880 | 92 |
| Services (community, business, and recreation) | 940 | 1,476 | 656 | 424 | 126 | 22,924 | 82 |
| Unknown or not stated | – | — | – | – | – | – | – |
| Totals—1963–64 | 1,663 | 49,314 | 21,130 | 1,050 | 66,900 | 214,997 | 5,226 |
| 1962–63 | 1,585 | 39,526 | 15,326 | 1,548 | 68,000 | 194,716 | 6,604 |
| 1961–62 | 1,602 | 37,004 | 14,530 | 1,874 | 66,892 | 181,376 | 5,584 |
Government Departments which are liable for income tax have been classified as New Zealand public companies. In a percentage of cases, precise information concerning the type of company was not available and there consequently may be some instances of incorrect classifications.
The numbers of public and of overseas companies, industrial and provident societies, etc., have shown little change in recent years. Any slight trend exhibited is rather in a downwards direction. The whole of the large annual increase in the number of companies is concentrated in the New Zealand private companies. This does not mean that overseas companies are no longer venturing into the New Zealand field. Most of the overseas companies now doing this are establishing a Subsidiary company, usually registered as a New Zealand private company, instead of setting up a New Zealand branch of the overseas company. On average, private companies are much smaller than are public companies, but in the aggregate they employ a larger amount of paid-up capital. Their shareholders' funds are also a rather higher percentage of the paid-up capital (212 percent against 182 percent for public companies). However, as shareholders' funds include advances from shareholders ($249,146,000), the bulk of which relate to private companies, it is evident that the relation of retained income to paid-up capital is nearly identical for both types of companies. The earning power per unit of shareholders' funds employed is considerably higher in the case of private companies, since their assessable incomes are 16.8 percent of shareholders funds against the 13.1 percent for public companies.
While on the subject of dividends paid, it should be pointed out that the disposable profits of the New Zealand branches of overseas companies are remitted to their overseas head offices and that these disposable profits are not included as dividends paid in New Zealand. Where the overseas company operates through a New Zealand subsidiary company, the New Zealand company is classified as either public or private and any dividends paid will be included in the statistics.
BALANCE DATE OF COMPANIES—A classification of companies by the month in which the balance date fell was made for the income year 1963–64. As the results could be of some general interest, the table below shows for each industry group the number of companies by month of balance date. More complete descriptions of the industry groups will be found in earlier tables.
| Industry Group | January | February | March | April | May | June | July | August | September | October | November | December |
|---|---|---|---|---|---|---|---|---|---|---|---|---|
| Agriculture | 10 | 14 | 1,819 | 46 | 164 | 1,074 | 55 | 23 | 22 | 104 | 20 | 20 |
| Forestry | 9 | 119 | 6 | 9 | 5 | 6 | 8 | |||||
| 9 | 6 | 7 | 17 | |||||||||
| Mining | 220 | 11 | 5 | 16 | ||||||||
| Manufacturing— | ||||||||||||
| Food | 26 | 12 | 428 | 25 | 92 | 122 | 32 | 21 | 31 | 49 | 14 | 40 |
| Textiles | 48 | 24 | 593 | 12 | 18 | 50 | 50 | 8 | 10 | 32 | 19 | 50 |
| Wood | 54 | 56 | 2,141 | 40 | 45 | 151 | 47 | 42 | 60 | 106 | 28 | 148 |
| Metals | 47 | 58 | 2,324 | 29 | 33 | 101 | 29 | 19 | 37 | 91 | 33 | 78 |
| Construction | 45 | 30 | 3,034 | 8 | 22 | 42 | 14 | 14 | 21 | 88 | 37 | 81 |
| Electricity | – | – | 15 | 9 | ||||||||
| Commerce— | ||||||||||||
| Wholesale and retail | 362 | 648 | 10,919 | 190 | 248 | 689 | 364 | 244 | 194 | 397 | 165 | 305 |
| Other | 167 | 157 | 7,357 | 99 | 129 | 582 | 139 | 124 | 169 | 233 | 106 | 323 |
| Transport | 35 | 28 | 1,498 | 15 | 22 | 104 | 22 | 27 | 39 | 59 | 31 | 39 |
| Services | 71 | 79 | 2,473 | 58 | 76 | 237 | 109 | 68 | 91 | 129 | 39 | 183 |
| Unknown | – | – | 1 | – | – | – | 2 | – | – | – | – | – |
| Totals | 875 | 1,114 | 32,941 | 529 | 855 | 3,173 | 870 | 597 | 681 | 1,310 | 494 | 1,293 |
CENSUS 1961: INCOMES OF INDIVIDUALS—The following statistics on incomes were compiled from the population census taken on 18 April 1961.
The table divides into income groups the persons actively engaged, and also the total population, including those not actively engaged in employment.
The questionnaire on the schedule asked for income for the year ended 31 March 1961 from all sources without deduction of taxes, superannuation, life insurance, rates, etc. Social security benefits (age, family, etc.) and war pensions were not included.
| Income Group | Persons Actively Engaged | Total Population | ||||
|---|---|---|---|---|---|---|
| Males | Females | Total | Males | Females | Total | |
| $ $ | ||||||
| Nil | 3,547 | 4,104 | 7,651 | 492,692 | 871,039 | 1,363,731 |
| 1– 199 | 6,773 | 11,961 | 18,734 | 22,057 | 53,384 | 75,441 |
| 200– 599 | 19,322 | 35,867 | 55,189 | 31,593 | 70,179 | 101,772 |
| 600– 999 | 43,982 | 79,373 | 123,355 | 51,895 | 94,470 | 146,365 |
| 1,000–1,399 | 82,828 | 58,164 | 140,992 | 88,661 | 65,673 | 154,334 |
| 1,400–1,799 | 169,348 | 20,170 | 189,518 | 172,953 | 23,675 | 196,628 |
| 1,800–2,199 | 147,163 | 6,641 | 153,804 | 149,631 | 8,818 | 158,449 |
| 2,200–2,599 | 75,951 | 2,252 | 78,203 | 77,787 | 3,355 | 81,142 |
| 2,600–2,999 | 35,046 | 972 | 36,018 | 35,962 | 1,664 | 37,626 |
| 3,000 and over | 79,520 | 2,099 | 81,619 | 81,985 | 4,335 | 86,320 |
| Not specified | 7,026 | 3,254 | 10,280 | 8,160 | 5,016 | 13,176 |
| Totals | 670,506 | 224,857 | 895,363 | 1,213,376 | 1,201,608 | 2,414,984 |
Included in the “nil” income group for actively engaged persons are those people who entered the labour force between 1 and 18 April 1961, and thus did not have income for the year ended 31 March 1961.
There would also be, in the smaller income group, considerable numbers of people who began work towards the end of the year 1960–61.
The largest income group for males actively engaged was the $1,400 to $1,799 group, with 169,348, or 25.3 percent of those males actively engaged. This was followed closely by the $1,800 to $2,199 group with 147,163, or 22.0 percent. The actively engaged males with incomes of $3,000 and over numbered 79,520, or 11.9 percent.
The largest income group for actively engaged females was the $600 to $999 group with 79,373, representing 35.3 percent of all actively engaged females. There were only 2,099, or 0.9 percent, of actively engaged females with incomes of $3,000 and over.
Income Earners in Each Household—An analysis of income earners in each household was made for the first time from the information collected at the census of population in 1961. For this analysis an income earner was defined as one who received $200 or more a year, excluding social security benefits, universal superannuation, and war pensions. A summary of the analysis is given in the following table.
| Number of Occupants | Number of Households with— | Total Dwellings | |||||
|---|---|---|---|---|---|---|---|
| No Income Earners | 1 Income Earner | 2 Income Earners | 3 Income Earners | 4 Income Earners | 5 or more Income Earners | ||
| 1 | 28,127 | 43,877 | – | – | – | – | 72,004 |
| 2 | 26,734 | 74,612 | 51,807 | – | – | – | 153,153 |
| 3 | 5,306 | 56,082 | 37,331 | 13,359 | – | – | 112,078 |
| 4 | 2,803 | 66,961 | 28,990 | 14,444 | 4,741 | – | 117,939 |
| 5 | 1,500 | 49,742 | 19,533 | 9,352 | 4,173 | 1,216 | 85,516 |
| 6 | 846 | 27,139 | 10,960 | 5,558 | 2,616 | 1,116 | 48,235 |
| 7 | 472 | 11,902 | 5,559 | 2,956 | 1,485 | 845 | 23,219 |
| 8 | 250 | 5,261 | 2,528 | 1,456 | 780 | 497 | 10,772 |
| 9 | 147 | 2,230 | 1,140 | 794 | 447 | 351 | 5,109 |
| 10 | 81 | 1,208 | 637 | 389 | 224 | 204 | 2,743 |
| 11 | 47 | 550 | 340 | 195 | 134 | 116 | 1,382 |
| 12 | 30 | 269 | 205 | 104 | 78 | 66 | 752 |
| 13 | 10 | 130 | 91 | 83 | 42 | 48 | 404 |
| 14 | 6 | 27 | 34 | 46 | 16 | 36 | 165 |
| 15 and over | 9 | 36 | 46 | 47 | 47 | 51 | 236 |
| Totals | 66,368 | 340,026 | 159,201 | 48,783 | 14,783 | 4,546 | 633,707 |
GENERAL—The core of the New Zealand banking system comprises a central bank (the Reserve Bank of New Zealand) and five commercial or trading banks. There are also 13 trustee savings banks and the Post Office Savings Bank, while each trading bank has had a private savings bank since 1 October 1964. In addition, a number of trading companies, investment societies, etc., perform quasi-banking functions, accepting deposits and granting credits (short-term and long-term) to clients. In some instances deposits are repayable to the client's order at call—virtually a system of cheque issuing. An expansion in the size and scope of near-banks (or non-banking financial institutions) has been a feature in recent years in New Zealand as in many other countries. This is discussed in detail in an article on Banks and Near-Banks in the September 1965 issue of the Reserve Bank of New Zealand Bulletin and a further article in the June 1966 issue of the Bulletin gives the results of the first statistical survey of finance companies carried out by the Reserve Bank. Report No. 10 of the Monetary and Economic Council The New Zealand Financial System, published in March 1966, presents a comprehensive description of the financial and credit system; it covers mainly the period 1955 to 1965.
THE RESERVE BANK: Previous Legislation—The Reserve Bank of New Zealand was established by the Reserve Bank of New Zealand Act 1933. Prior to the consolidation in 1964, there had been 16 amendments to that Act and other legislation affecting the Bank, with four important series of changes—in 1936, 1939, 1950, and 1960—which altered the constitution, powers, functions, and ownership of the Bank, and its statutory relationships with Parliament, the Government, and the Minister of Finance.
Initially the Reserve Bank was a privately owned institution with a share capital widely held throughout New Zealand. Of the seven full directors other than the Governor and Deputy Governor, three only were appointed by the Governor-General. The secretary to the Treasury, although a member of the Board, did not have the right to vote. The Bank was therefore to a large extent independent of the Government, but the original Act required it, as its primary duty, to exercise control over monetary circulation and credit to the end that the economic welfare of the Dominion might be promoted and maintained.
Considerable care was taken to see that the Bank was free from political interference. The first Governor of the Bank made it clear, however, that the Board of the Bank accepted the view that the ultimate responsibility for the monetary policy of the Dominion must rest with the Government of the day. The Board, nevertheless, held it was the duly of the Bank to tender to the Government impartial advice on monetary and financial matters, and to exercise its own judgment in carrying out those functions entrusted to it.
The business of the Bank was strictly defined, however, and the 1933 Act laid down limitations designed to ensure that the Bank did not become an easy source of credit for the community, or a source of inflationary finance for the Government. The Bank was given power to determine the exchange rates at which it bought and sold sterling, was required to be prepared at all times to sell sterling at the rates so fixed, and was also required to hold overseas exchange reserves equivalent to at least 25 percent of its notes and other demand liabilities. In addition, the trading banks were deprived of the right to issue notes and were required to hold minimum balances with the Reserve Bank.
Through this 1933 legislation, Parliament substantially increased its control over the monetary affairs of the country, and set up a national institution, with the sole right of note issue, to manage the currency. The legislation was the culmination of proposals, ranging back to 1886 that a central bank, or a State trading bank, should be set up in New Zealand.
In 1936 the Bank became a State-owned institution, the whole of the Board being appointed by the Government, and the Secretary to the Treasury was given the right to vote at Board meetings. Its general function was changed to that of giving effect to the monetary policy of the Government, as communicated to it by the Minister of Finance. For this purpose, and the promotion of economic and social welfare, the Bank was still required to regulate and control currency and credit, but was also empowered to control the transfer of money to and from New Zealand, and the disposal of export proceeds. Power was taken to suspend the Bank's duty to sell sterling on demand and to make regulations, when needed, to implement these limited exchange control powers.
In 1936 also, some of the restraints on Reserve Bank lending were relaxed, but the ability of the Reserve Bank to influence monetary conditions was greatly enhanced by empowering the Governor of the Bank, with the authority of the Minister of Finance, to vary the minimum balances that the trading banks were required to hold at the Reserve Bank. In the same year, the Reserve Bank became Registrar of Government Stock.
In 1939 the Government's authority was reinforced by adding a requirement for the Bank to have regard to any representations made by the Minister in respect of any functions or business of the Bank, and to give effect to any decision of the Government in relation thereto conveyed to the Governor in writing. The Minister of Finance was given power to suspend indefinitely the duty of the Bank to hold overseas reserves equal to not less than 25 percent of its demand liabilities, which could previously be suspended for short periods only. Provision was made whereby the Governor-General in Council could authorise the Bank to exercise some activities, such as engaging in trade or holding an interest in other financial institutions, which were previously prohibited.
In 1950 the 1939 amendment relating to representations by the Minister and decisions of the Government in respect of the functions and business of the Bank was repealed. A new requirement—to give effect to any resolution of Parliament in respect of the Bank's functions or business—was substituted, this change being designed to restore to the Bank a degree of independence, while still requiring it ultimately to carry out Government policy. The duty of the Bank to hold overseas reserves was changed to a duty to hold reserves which the Board considered would provide a reasonable margin for contingencies. A further change in 1950 was to add to the criteria for monetary action the safeguarding of a stable internal price level and the promotion of the highest degree of production, trade, and employment that could be achieved by monetary action.
Towards the end of 1960, an amending Act removed the reference to a resolution of Parliament, reinserted the 1939 requirement regarding representations by the Minister and decisions of the Government, and recast, without significant change, the criteria for monetary policy. It declared the sovereign right of the Crown to control currency and credit, and introduced wide general powers for the Bank, on behalf of the Government, to regulate and control “money, banking, credit, and currency” and interest rates, together with specific power to give directions to the trading banks. The existing right of the Bank to determine overseas exchange rates was made subject to a prior right for the Minister of Finance, after consultation with the Governor, to determine the basic rate of exchange with sterling.
Present Legislation—The Reserve Bank of New Zealand Act 1964 was designed to bring the provisions of existing legislation into line with modern central banking practice and monetary policy. It provides the Government and the Reserve Bank with flexible authority to take such monetary action within, and to some extent outside, the conventional banking system as may be appropriate to the times. Where specific powers are given, the aim was to set them out fully, so that the Act is clear as to their extent. A further objective was the abolition of the last of the wartime emergency regulations, which relates to exchange control, and the provision of the necessary authority in the permanent legislation.
Section 8 is the most important section in the Act. It restates the primary functions of the Bank, its basic relationships with Parliament, the Government, and the Minister of Finance, and lays down the criteria for Government monetary policy. The section reads:
The primary functions of the Bank shall be—
To act as the central bank for New Zealand; and
To advise the Government on matters relating to monetary policy, banking, and overseas exchange; and
Within the limits of its powers, to give effect to the monetary policy of the Government as communicated in writing to the Bank under subsection (2) of this section, and to any resolution of Parliament in relation to that monetary policy.
For the purposes of this Act, the Minister may from time to time communicate to the Bank the monetary policy of the Government, which shall be directed to the maintenance and promotion of economic and social welfare in New Zealand having regard to the desirability of promoting the highest degree of production, trade, and employment and of maintaining a stable internal price level.
The Bank may, on behalf of the Government, regulate and control—
Money, banking, banking transactions, credit, and currency;
Rates of interest in respect of such classes of transactions as may from time to time be prescribed;
Overseas exchange and overseas exchange transactions.”
Whilst the Bank must still give effect to Government monetary policy or to resolutions of Parliament related thereto, the directors were given a greater degree of independence and responsibility in the carrying out of the policy laid down, and in the management of the Bank and the conduct of its business.
Wherever possible, the particular powers of the Bank have been expressed broadly. The exercise of these powers is at the discretion of the directors, but the consent of the Minister is required in certain special cases. The consent of the Governor-General in Council is required before the Bank can engage in trade or have a direct interest in any commercial, industrial, or financial institution, or purchase, or lend against, the shares of a trading bank or financial institution. The Government is required to entrust to the Bank, and the Bank to undertake, free of charge to the Government, all Government banking transactions.
The Reserve Bank has 10 directors, comprising the Governor, the Deputy Governor, the Secretary to the Treasury, and seven other directors appointed by the Governor-General in Council.
Bank Notes—The Bank retains the sole right of issue, and a new provision gives authority for the calling in, with the consent of the Minister, of any note or series of notes issued by the Bank. Notes called in cease to be legal tender, but remain a liability of the Bank. Provisions covering the defacing of bank notes and their reproduction or imitation without the prior consent of the Bank are in the Reserve Bank Act.
Overseas Exchange—Part IV of the Reserve Bank Act 1964 deals with the overseas exchange and other transactions affecting the overseas resources of New Zealand. The right of the Minister, after consultation with the Governor, to determine the basic relationship between New Zealand currency and United Kingdom currency is preserved, and the Bank retains the authority to fix the actual exchange rates used in its operations. Statutory authority is given for the Bank to prescribe or approve rates of exchange to be used by other persons in foreign exchange transactions, a power which had, since 1940, been contained in the Finance Emergency Regulations but not in the statute law.
In recognition of the fact that the holding of external reserves is dependent on aspects of economic policy and conditions beyond the control of the Reserve Bank, the description of its duty “to endeavour, within the limits of its powers, to maintain, in addition to any holdings of gold, an adequate level of overseas reserves”. The Bank keeps the Minister of Finance informed of the overseas exchange position and prospects, and of the level of overseas exchange reserves it regards as adequate. To assist it in carrying out this duty to hold reserves, particularly in the event of the eventual abolition of exchange control, the Bank has a statutory power to require trading banks to sell to it their foreign exchange holdings in excess of maximum amounts prescribed by the Reserve Bank.
Comprehensive permissive provisions for exchange control regulations are set out in this Part. There are adequate powers for control of take-overs in New Zealand by overseas interests, and for control over overseas companies commencing business in New Zealand and control of capital issues.
Since the passing of the 1964 Act, regulations have been promulgated for the control of (a) overseas remuneration received by New Zealand residents for services rendered to nonresidents (subsequently included in the Exchange Control Regulation 1965); (b) control of company takeovers by overseas residents; (c) capital issues by overseas companies in New Zealand or issues overseas by New Zealand companies; (d) capital issues by finance companies.
Regulations of Banking and Credit—In Part V of the 1964 Act, Trading banks are required to make monthly returns to the Reserve Bank detailing their principal liabilities and assets, separating demand and time deposits by customers from other demand and time liabilities. This facilitates the operation of the reserve ratio procedure. Statutory authority has been provided for obtaining of such subsidiary returns and other information from trading banks as the Reserve Bank may require.
There is complete flexibility, subject to the approval of the Minister, in the application of reserve ratios or assets ratios. The trading banks may be required to hold balances at the Reserve Bank or to hold assets of a specified kind including balances at the Reserve Bank. The minimum requirements may be laid down as a percentage of deposit liabilities or of assets, as a percentage of parts of such deposit liabilities or assets or as percentages of both, or in any other manner. Different percentages may be laid down for different classes of deposit liabilities or assets. Under earlier legislation, the minimum requirements could not be reduced below 7 percent of demand plus 3 percent of time liabilities; there is now no minimum. In actual operation, however, the required balances are, on average, much higher than the previous minimum, but seasonal swings make it desirable to have complete flexibility.
The Reserve Bank is authorised to give directions to trading banks as to the policy to be followed in relation to advances, discounts, and investments and in relation to rates of interest or discount
To enable the Reserve Bank to obtain information on the activities of the “fringe-banking” institutions and exercise some degree of control over their activities, the Bank is authorised to request any person or class of persons who, as a substantial part of their New Zealand business, accept deposits or carry on any banking business, or grant credit or make loans for the financing of industry, trade, or commerce, to supply information concerning such business. With the prior authority of the Minister of Finance, the Bank may, by notice in the Gazette, require such information to be supplied. The Bank may also make recommendations to them in respect of the policy to be followed in respect of such business. Statistics collected were presented in an article in the June 1966 issue of the Bank's Bulletin, and will appear regularly in the Bulletin from 1967 onwards.
The net profits of the Bank are paid to the Consolidated Revenue Account, after certain provisions have been met. The net profits for the year ended 31 March 1966, which were subsequently paid to the Consolidated Revenue Account, amounted to $7,789,580 as compared with $7,250,580 for the previous year.
Any appreciation or depreciation of assets due to alteration in the exchange rate is to be credited to or borne by the Consolidated Revenue Account In accordance with this provision, the Reserve Bank was credited with the sum of $41,152,000 in early 1949 by the Government as a result of the alteration of the exchange rate to parity with sterling as from 20 August 1948.
Discount Rate—In effect, the Reserve Bank's discount rate is the minimum rate at which trading banks may borrow from the Bank if they need to do so in order to maintain the statutory minimum balances which they are required to deposit with the Bank, and the rate at which the Bank lends to short-term money market dealers.
So far the Reserve Bank's discount rate has applied mainly to transactions with trading banks and the short-term money market dealers. The discount rate therefore is mainly used as a supplement to the reserve ratio system as an aid to regulating bank credit. When a trading bank is short of cash—that is, when its balance at the Reserve Bank is approaching or below statutory minimum—it may borrow from another bank either in New Zealand or London, or it may sell sterling to the Reserve Bank. The most likely and normal procedure, however, is to borrow from the Reserve Bank. For this money it pays a rate of interest related to the bank's discount rate. If the trading banks have a safe margin of free cash there would be no need for them to borrow from the Reserve Bank and the discount rate would then be a formality (though it has some psychological impact); but when this margin is small the discount rate acquires a much greater significance.
The discount rate does not apply to advances to the State and to marketing organisations, these being made at 1 percent from 22 February 1946. Advances to the State may be in the form of Treasury bills, overdrafts, or 1 percent Government stock. During the financial year 1959-60 the Bank's holdings of Treasury bills were exchanged for 1 percent stock and short-term borrowing is now by overdraft or Treasury bills and longer-term borrowing by 1 percent stock.
Liabilities and Assets—Details of the liabilities and assets of the Reserve Bank at the end of June for the latest five years, and weekly averages for the latest 11 calendar years are shown in the following tables.
| LIABILITIES OF RESERVE BANK | |||||||
|---|---|---|---|---|---|---|---|
| Year | Bank Notes | Demand Deposits | Other Liabilities* | Total Liabilities | |||
| State | Marketing | Banks | Other | ||||
| $(million) | |||||||
| Weekly Average for Calendar Year | |||||||
| 1956 | 141.8 | 25.1 | 3.9 | 120.1 | 3.3 | 19.8 | 314.0 |
| 1957 | 148.5 | 22.9 | 2.5 | 124.7 | 2.9 | 21.0 | 322.5 |
| 1958 | 152.5 | 24.2 | 1.4 | 115.0 | 2.2 | 23.0 | 318.2 |
| 1959 | 154.1 | 23.2 | 1.0 | 124.5 | 2.4 | 24.2 | 329.4 |
| 1960 | 163.0 | 22.2 | 1.6 | 175.9 | 2.6 | 21.4 | 386.6 |
| 1961 | 168.9 | 30.4 | 4.1 | 132.5 | 3.5 | 20.9 | 360.3 |
| 1962 | 167.8 | 33.2 | 5.1 | 148.5 | 4.7 | 20.6 | 379.8 |
| 1963 | 169.6 | 36.0 | 3.0 | 141.8 | 4.3 | 19.9 | 374.7 |
| 1964 | 166.6 | 36.9 | 2.6 | 138.8 | 4.6 | 20.4 | 369.9 |
| 1965 | 166.1 | 35.6 | 2.5 | 98.2 | 12.3 | 21.6 | 336.3 |
| 1966 | 164.2 | 34.0 | 3.8 | 66.4 | 56.4 | 30.2 | 355.0 |
| At End of June | |||||||
| 1962 | 160.9 | 28.2 | 7.1 | 160.1 | 10.4 | 17.2 | 383.9 |
| 1963 | 162.6 | 32.5 | 1.6 | 150.4 | 4.4 | 16.8 | 368.2 |
| 1964 | 159.3 | 38.2 | 2.0 | 166.0 | 4.5 | 17.2 | 387.2 |
| 1965 | 160.1 | 38.3 | 1.5 | 109.8 | 5.5 | 18.0 | 333.1 |
| 1966 | 158.4 | 37.9 | 3.0 | 60.0 | 58.5 | 17.8 | 335.6 |
| ASSETS OF THE RESERVE BANK | ||||||||
|---|---|---|---|---|---|---|---|---|
| Year | Overseas Assets | Investments in New Zealand | Advances in New Zealand | All Other Assets in New Zealand | ||||
| Gold | Short-term | Investments | State | Marketing Organisations | Other Advances and Discounts | |||
| * Includes General Reserve Fund of $3,000,000 throughout the period. | ||||||||
| $ (million) | ||||||||
| Weekly Average for Calendar Year | ||||||||
| 1962 | 0.5 | 65.8 | 33.7 | 144.5 | 39.6 | 73.2 | 19.0 | 3.6 |
| 1963 | 0.5 | 80.7 | 41.6 | 140.4 | 35.6 | 69.8 | 3.7 | 2.5 |
| 1964 | 0.5 | 77.1 | 46.0 | 125.0 | 51.4 | 62.3 | 4.2 | 3.5 |
| 1965 | 0.5 | 57.5 | 47.7 | 79.3 | 53.9 | 78.4 | 13.2 | 5.2 |
| 1966 | 0.2 | 52.6 | 31.2 | 71.6 | 76.2 | 103.0 | 14.4 | 5.8 |
| At End of June | ||||||||
| 1962 | 0.5 | 78.1 | 32.9 | 142.2 | 25.3 | 83.0 | 19.0 | 3.1 |
| 1963 | 0.5 | 105.1 | 41.6 | 138.0 | 0.4 | 79.1 | - | 3.6 |
| 1964 | 0.5 | 105.6 | 48.7 | 121.2 | 18.9 | 72.0 | 16.9 | 3.4 |
| 1965 | 0.5 | 80.5 | 49.1 | 67.2 | 20.0 | 91.9 | 14.4 | 9.5 |
| 1966 | 0.1 | 54.5 | 26.4 | 76.5 | 41.1 | 114.6 | 13.9 | 8.5 |
TRADING BANKS—There have been trading banks in New Zealand since the early days of settlement and they have conducted their business according to the general principles which have long been traditional in British banking institutions. With the exception of the Bank of New Zealand, which became a fully State-owned bank with the passing of the Bank of New Zealand Act 1945, the banks are owned by private shareholders and their shares are traded on the stock exchanges. New Zealand has a branch banking system with more than 1,000 branches and agencies in New Zealand and a world-wide network of agents and correspondents. The general business of banking is governed by the Banking Act 1908. Part II of the Bills of Exchange Act 1908 and the Cheques Act 1960 are the law relating to cheques on a bank.
Banks accept deposits from the public for either a fixed term or on a “on demand” basis. Fixed term or time deposits bear interest, but unlike demand deposits cannot be operated on by cheque and for this reason are not included in statistics of money supply. Cheques drawn on current accounts are efficient instruments for the settlement of commercial and private debts. The number of current accounts (creditor and debtor) on the banks' books is approximately 700,000. The fundamental principle of bank lending is to confine advances as far as possible to financing customers' current trade or seasonal requirements, and to avoid tying up available resources in fixed or long-term finance. The major form of bank lending to customers is by way of overdraft.
With the enactment of the Private Savings Banks Act 1964 the trading banks established savings banks from 1 October 1964 on a similar basis to that of the Post Office Savings Bank, including ordinary accounts, investment, thrift club, home lay-by, and special purpose accounts.
There are five trading banks in New Zealand, two of these institutions—the Bank of New Zealand and the National Bank of New Zealand—being incorporated by special Acts of the General Assembly of New Zealand, although the National Bank is domiciled in the United Kingdom. The other three banks—the Australia and New Zealand Bank, the Bank of New South Wales, and the Commercial Bank of Australia—which are predominantly Australian institutions, have in the aggregate much greater capital resources, etc., than the two New Zealand banks, but the New Zealand banks' advances are about 55 percent of total advances. The close Australian affiliations of the Australian banks operating in New Zealand resulted in the past in an interlocking between the Australian and New Zealand financial structures, the separation of New Zealand business being one of the major motives leading up to the founding of the Reserve Bank.
Bank of New Zealand—The Bank of New Zealand became a wholly State-owned trading bank on the passing of the Bank of New Zealand Act in 1945. At 31 March 1966 it had 185 branches and 216 agencies in New Zealand, and overseas branches in London, Australia, and Fiji. In addition, in common with the other trading banks, it operated a savings bank, deposits in which exceeded $40 million after 18 months operation. A finance company promoted by the bank commenced operations on 1 April 1966.
Gross profits of the Bank of New Zealand during the year ended 31 March 1966 totalled $16.7 million giving a net profit of $2.0 million. Comparable figures for the previous year were $15.5 million and $1.8 million. The total assets amounted to $452.7 million. Among the main items were loans and advances to customers ($240.6 million); securities of, or guaranteed by, the New Zealand Government ($67.1 million); remittances in transit between branches ($58.7 million); and cash in hand and deposits with bankers, $25.3 million. Bank properties and equipment were valued at $15.2 million. The principal item of liabilities was deposits, at $373.1 million. The paid-up capital remained unaltered at $12.7 million.
Liabilities and Assets of Trading Banks—Since the Reserve Bank commenced operations the trading banks have been required to submit at monthly intervals a return of certain liabilities and assets in respect of New Zealand business. Monthly averages for the latest five calendar years and figures as at the last Wednesday in June are given in the next table.
| SELECTED LIABILITIES OF TRADING BANKS* | ||||||
|---|---|---|---|---|---|---|
| Year | Liabilities in New Zealand | Liabilities Outside New Zealand | Total Liabilities | |||
| Deposits | Other Liabilities | |||||
| Demand | Time | |||||
| Wool Retention | Other | |||||
| * Trading bank business only, excludes liabilities of savings bank subsidiaries, shareholders' funds, capital liabilities to overseas head offices, contingencies, interbank accounts, and transit items within New Zealand. | ||||||
| $(million) | ||||||
| Monthly Average for Calendar Year | ||||||
| 1962 | 545.6 | - | 103.4 | 26.7 | 16.3 | 692.0 |
| 1963 | 575.7 | - | 102.6 | 11.4 | 15.4 | 705.1 |
| 1964 | 618.1 | 10.4 | 101.2 | 13.9 | 18.2 | 761.8 |
| 1965 | 623.4 | 8.3 | 105.6 | 28.1 | 12.3 | 777.7 |
| 1966 | 615.3 | 3.9 | 121.3 | 31.8 | 8.2 | 780.5 |
| At end of June | ||||||
| 1962 | 550.5 | - | 105.1 | 22.3 | 17.5 | 695.5 |
| 1963 | 582.1 | - | 104.5 | 2.8 | 16.1 | 705.5 |
| 1964 | 624.2 | 12.9 | 100.1 | 20.5 | 19.0 | 776.9 |
| 1965 | 644.7 | 8.4 | 95.8 | 23.3 | 12.8 | 785.2 |
| 1966 | 618.9 | 4.3 | 116.5 | 21.5 | 8.2 | 769.4 |
| SELECTED ASSETS OF TRADING BANKS | ||||||||
|---|---|---|---|---|---|---|---|---|
| Year | Coin and Bullion | Reserve Bank Notes | Balances Held in Reserve Bank | Overseas Assets | Securities Held | Advances and Discounts* | Land, Buildings, etc. | Total Selected Assets |
| * Excludes inter-bank borrowing, but includes term loans and export finance. | ||||||||
| $(million) | ||||||||
| Monthly Average for Calendar Year | ||||||||
| 1956 | 2.7 | 21.5 | 120.5 | 51.7 | 47.6 | 334.8 | 12.3 | 591.0 |
| 1957 | 2.6 | 25.5 | 127.7 | 52.5 | 47.3 | 325.6 | 13.7 | 594.9 |
| 1958 | 2.8 | 28.0 | 121.1 | 44.8 | 47.1 | 343.8 | 14.5 | 602.1 |
| 1959 | 2.9 | 28.5 | 129.6 | 51.2 | 47.0 | 332.8 | 15.9 | 607.8 |
| 1960 | 2.9 | 31.6 | 178.0 | 53.9 | 46.8 | 352.0 | 17.3 | 682.5 |
| 1961 | 3.0 | 33.1 | 134.4 | 47.1 | 46.6 | 428.5 | 18.7 | 711.5 |
| 1962 | 3.2 | 34.6 | 154.7 | 44.9 | 46.4 | 393.5 | 20.3 | 697.5 |
| 1963 | 3.2 | 36.4 | 147.4 | 53.9 | 46.2 | 396.2 | 21.5 | 704.9 |
| 1964 | 3.4 | 36.6 | 148.1 | 62.9 | 46.2 | 430.9 | 23.8 | 751.9 |
| 1965 | 3.4 | 38.0 | 103.7 | 47.6 | 53.3 | 484.0 | 26.7 | 756.7 |
| 1966 | 3.2 | 39.4 | 72.0 | 41.8 | 64.7 | 503.0 | 30.2 | 754.3 |
| At End of June | ||||||||
| 1962 | 3.3 | 30.5 | 159.9 | 53.5 | 46.4 | 390.3 | 20.1 | 703.9 |
| 1963 | 3.1 | 31.6 | 149.8 | 61.0 | 46.2 | 393.0 | 21.1 | 705.9 |
| 1964 | 3.3 | 32.3 | 166.0 | 67.2 | 46.1 | 437.3 | 23.5 | 775.7 |
| 1965 | 3.3 | 36.4 | 109.8 | 44.2 | 47.0 | 493.6 | 26.1 | 760.4 |
| 1966 | 3.0 | 37.9 | 60.0 | 50.9 | 62.3 | 512.7 | 28.8 | 755.6 |
Deposits and Advances—The weekly averages of total deposits (together with the amount per head of mean population), and of total advances, and the ratio of advances to deposits for each of the last 11 calendar years, are given in the following table.
| Year | Deposits | Advances† | ||||
|---|---|---|---|---|---|---|
| Not Bearing Interest | Bearing Interest | Total* | Per Head of Mean Population | Total Amount | Ratio to Deposits | |
* Including Government deposits. $ Exclusive of transfers by the Bank of New Zealand to its Long-term Mortgage Department. ‡ Includes certain current accounts, operated by non-profit organisations, for which interest is payable on monthly minimum balances; these accounts were previously included in “deposits not bearing interest” column. | ||||||
| $(m) | $ | $(m) | percent | |||
| 1956 | 458.7 | 70.5 | 537.5 | 246.20 | 341.3 | 63.5 |
| 1957 | 471.6 | 77.4 | 557.7 | 249.80 | 329.8 | 59.1 |
| 1958 | 464.8 | 84.3 | 558.1 | 244.20 | 350.8 | 62.9 |
| 1959 | 449.8 | 106.9‡ | 566.7 | 242.80 | 340.2 | 60.0 |
| 1960 | 505.9 | 129.8‡ | 647.8 | 272.50 | 355.5 | 54.9 |
| 1961 | 501.2 | 138.8‡ | 652.0 | 268.60 | 434.9 | 66.7 |
| 1962 | 493.1 | 143.1‡ | 646.7 | 260.00 | 400.9 | 60.3 |
| 1963 | 518.3 | 147.6‡ | 676.5 | 266.00 | 403.8 | 59.7 |
| 1964 | 567.3 | 146.8‡ | 724.8 | 279.00 | 439.9 | 60.7 |
| 1965 | 565.3 | 152.6‡ | 729.9 | 276.00 | 493.3 | 67.6 |
| 1966 | 549.1 | 170.4‡ | 731.8 | 272.33 | 513.4 | 70.2 |
The fall in free deposits in 1959 was caused by the transfer of non-profit making organisations' deposits mentioned in the footnote given. The marked increase during 1960 was mainly due to an increase in trading bank advances and the deficit in the public accounts. Fixed deposits have shown an upward trend in recent years.
Since 1955 credit restraint policies have tended to limit advances, although in 1958 lower export prices, an increased level of stocks (through higher imports), and an increased use of credit in New Zealand to finance meat exports combined to expand average advances. In 1959 the demand for advances fell as a result of slack economic conditions and this, in conjunction with higher farm incomes and the reversal of the above-mentioned trend in meat export financing, caused the average of advances to fall. In 1960 advances rose again, the main factor being inflationary economic conditions with a general expansion of expenditures, coupled with a high rate of importing and some increase in meat export finance. During 1961 efforts were made to check the sudden rise in bank advances, without however forcing the liquidation of stocks. The reserve ratios were adjusted, forcing the banks to borrow from the Reserve Bank continuously. The tighter credit policy was continued during 1962 and 1963. In March 1964 there was a marked upsurge in bank advances associated with a higher than usual tax flow and higher seasonal demands by export industries. The increase in activity was financed from more intensive use of the community's liquid resources. A moderated higher level continued during 1964. In March 1965 advances again rose markedly for the same reasons as in 1964 and thereafter they fell only very slowly. The reserve ratios were raised to force the banks to borrow heavily from the Reserve Bank for the rest of the year until advances moved down towards the targets established. In 1966 the increase in advances was associated mainly with farm development and financing exports.
The following diagram illustrates the movements that have occurred in deposits and advances, the figures used, as in the foregoing table, being the weekly averages for calendar years.
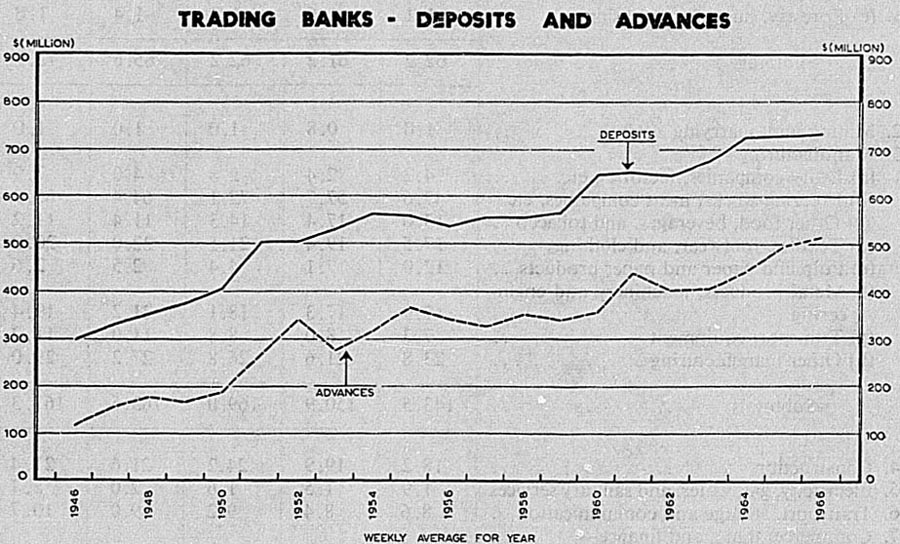
The average amount on deposit during each quarter for the latest five years is shown in the next table.
| Quarter Ended | 1962 | 1553 | 1964 | 1965 | 1966 |
|---|---|---|---|---|---|
| $(million) | |||||
| March | 657.4 | 682.4 | 724.1 | 754.4 | 742.5 |
| June | 648.1 | 680.3 | 726.5 | 727.5 | 728.0 |
| September | 645.7 | 673.0 | 730.7 | 722.5 | 726.5 |
| December | 634.5 | 670.3 | 717.4 | 715.1 | 730.1 |
An analysis of advances of the New Zealand trading banks is given in the following table.
| Nature of Advance | 13 March 1963 | 11 March 1964 | 10 March 1965 | 9 March 1966 | 8 March 1967 |
|---|---|---|---|---|---|
| BUSINESS AND FARMING ADVANCES | $(million) | ||||
| 1. Farming, forestry, hunting, and fishing— | |||||
| (a) Mainly dairy farming | 24.0 | 25.0 | 23.2 | 22.8 | 23.1 |
| (b) Mainly sheep farming | 25.7 | 23.6 | 26.3 | 30.3 | 35.6 |
| (c) Other farming | 9.1 | 9.1 | 9.1 | 9.0 | 10.2 |
| (d) Farm services | 1.8 | 1.8 | 2.1 | 2.1 | 2.2 |
| (e) Forestry, hunting, and fishing | 1.1 | 1.6 | 1.4 | 1.4 | 1.8 |
| Subtotals | 62.2 | 61.2 | 62.2 | 65.6 | 72.9 |
| 2. Mining and quarrying | 1.0 | 0.8 | 1.0 | 1.0 | 1.0 |
| 3. Manufacturing— | |||||
| (a) Dairy companies, factories, etc. | 4.2 | 2.4 | 2.8 | 4.0 | 7.9 |
| (b) Freezing works, meat companies, etc. | 47.6 | 57.7 | 72.1 | 64.4 | 65.9 |
| (c) Other food, beverages, and tobacco | 13.0 | 17.4 | 14.3 | 11.4 | 11.2 |
| (d) Textiles, footwear, and clothing | 17.5 | 19.4 | 21.5 | 22.0 | 20.0 |
| (e) Pulp and paper and paper products | 12.0 | 7.1 | 4.4 | 2.5 | 2.6 |
| (f) Metal products, machinery and engineering | 17.9 | 17.3 | 18.1 | 21.2 | 19.4 |
| (g) Transport equipment | 7.3 | 8.0 | 8.8 | 11.0 | 11.2 |
| (h) Other manufacturing | 23.8 | 21.6 | 26.8 | 27.2 | 29.0 |
| Subtotals | 143.5 | 150.9 | 169.0 | 163.6 | 167.3 |
| 4. Construction | 18.2 | 19.9 | 24.2 | 21.6 | 21.4 |
| 5. Electricity, gas, water, and sanitary services | 1.9 | 1.5 | 1.6 | 2.0 | 2.7 |
| 6. Transport, storage and communication | 8.6 | 8.4 | 9.2 | 9.0 | 10.7 |
| 7. Commerce, trade, and finance— | |||||
| (a) Wholesalers, mainly importers | 23.9 | 26.8 | 25.1 | 27.6 | 25.5 |
| (b) Wholesalers, other | 11.6 | 12.7 | 13.0 | 12.8 | 13.8 |
| (c) Retailers | 35.9 | 39.9 | 39.5 | 39.9 | 37.6 |
| (d) Woolbuyers | 19.1 | 27.0 | 20.8 | 24.4 | 20.6 |
| (e) Stock and station agents | 10.0 | 7.3 | 14.3 | 25.7 | 24.7 |
| (f) Finance companies (mainly hire purchase) | 3.0 | 3.8 | 3.9 | 3.5 | 3.2 |
| (g) Other financial institutions | 6.7 | 8.1 | 8.0 | 10.8 | 10.5 |
| Subtotals | 110.2 | 125.6 | 124.6 | 144.7 | 135.8 |
| 8. Local authorities n.e.i. | 2.0 | 1.5 | 1.9 | 2.1 | 2.2 |
| 9. Services | 18.3 | 19.5 | 21.5 | 22.1 | 22.0 |
| PERSONAL ADVANCES | |||||
| 10. (a) For housing purposes | 17.2 | 19.7 | 22.3 | 20.5 | 21.1 |
| (b) Other personal advances | 27.2 | 31.0 | 33.3 | 30.7 | 31.3 |
| Subtotals | 44.4 | 50.7 | 55.5 | 51.2 | 52.3 |
| Total advances | 410.3 | 439.9 | 471.7 | 482.8 | 488.5 |
The following diagram illustrates the level of trading bank advances in March of the last three years.
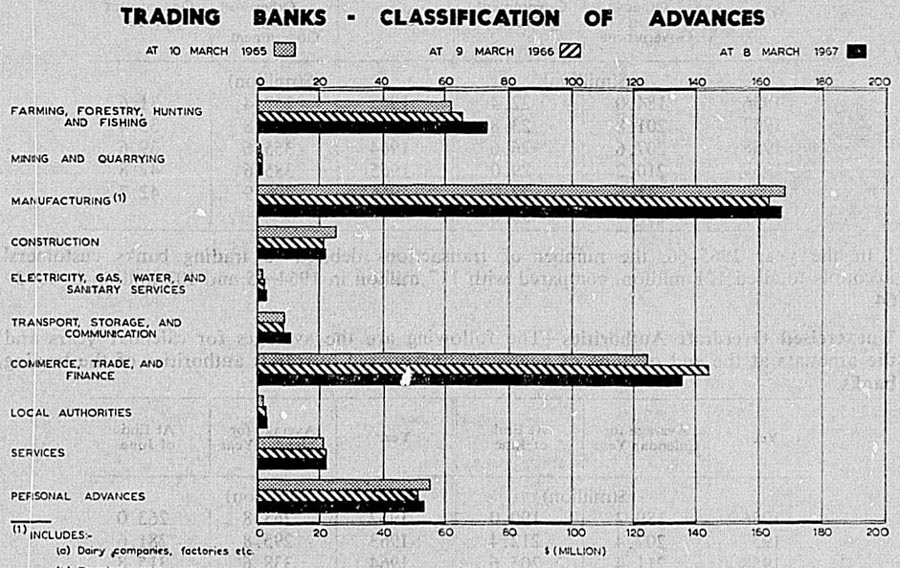
Advance Control Policy—Qualitative—An instrument of credit control used by the Reserve Bank since 1942 was a selective control of bank advances which sought to restrict the availability of credit to certain kinds of borrowers for certain purposes. On the whole the application of the rules prescribed by the Reserve Bank was left to the trading banks themselves, with only marginal cases referred to the Reserve Bank for decision. The main emphasis throughout was on avoidance of the use of bank credit for long-term capital purposes, hire-purchase finance, speculation, and the financing of excessive imports. As from 1 January 1963, the operation and administration of qualitative control was handed back to the trading banks without, however, any relaxation.
Quantitative—The advance control policy outlined above was supplemented in 1952 by the quantitative control of advances and reliance was placed mainly on the quantitative method of control through the reserve ratio procedure and discount rate policy. The minimum balances the trading banks were required to maintain at the Reserve Bank were adjusted from time to time through the reserve ratio procedure and the discount rate so as to reduce the margin of free cash (balances in excess of the minimum required) held by the trading banks from time to time through the reserve ratio procedure and the discount rate. Since 1957 a flexible policy of control has been followed. The aim generally has been to allow for a small growth in advances. Quarterly targets for bank advances were used generally from 1962 on, but from 1966 targets were established on a two-monthly basis. If these targets are met, banks are allowed small margins of free cash, the reserve ratios being changed as often as necessary to achieve this. If the targets are exceeded the ratios are raised sufficiently to ensure that the banks are required to borrow from the Reserve Bank. Generally, some small growth has been permitted in the targets for advances, particularly in the export field. Targets are now set for farming and export advances and for “other advances” on a differential basis. From 1966 targets were also set for total credit limits and, on 4 May 1967, the Minister of Finance announced that total credit limits were to be cut by 10 percent by July 1967, although some flexibility would be permitted to ensure that farming and other essential industries continued to receive adequate finance, especially for exports. The general aim is to reduce bank advances in the second half of 1967 to the level operating in 1966.
Debits—The following table shows weekly averages of bank debits to customers' accounts.
| Year | Debits Other Than Government | Government Debits |
|---|---|---|
| $(million) | ||
| 1956 | 184.0 | 22.4 |
| 1957 | 201.8 | 23.8 |
| 1958 | 207.6 | 26.6 |
| 1959 | 210.2 | 29.0 |
| 1960 | 241.6 | 32.0 |
| 1961 | 257.4 | 33.6 |
| 1962 | 257.4 | 31.6 |
| 1963 | 301.8 | 33.4 |
| 1964 | 355.6 | 39.6 |
| 1965 | 385.6 | 42.8 |
| 1966 | 406.9 | 42.7 |
In the year 1965-66, the number of transactions debited to trading banks customers' accounts totalled 121 million, compared with 117 million in 1964-65 and 107 million in 1963-64.
Unexercised Overdraft Authorities—The following are the averages for calendar years and the amounts at the end of June of aggregate unexercised overdraft authorities of the trading banks.
| Year | Average for Calendar Year | At End of June |
|---|---|---|
| $(million) | ||
| 1956 | 189.2 | 190.0 |
| 1957 | 207.4 | 212.4 |
| 1958 | 211.4 | 205.6 |
| 1959 | 234.6 | 233.4 |
| 1960 | 262.6 | 262.0 |
| 1961 | 246.6 | 248.6 |
| 1962 | 263.8 | 263.0 |
| 1963 | 295.8 | 281.6 |
| 1964 | 338.6 | 315.8 |
| 1965 | 339.8 | 325.6 |
| 1966 | 326.7 | 317.4 |
NOTES IN CIRCULATION—The following table shows the weekly average note circulation for the latest 11 calendar years, and the position as at the last Wednesday in June for the latest five years.
| Year | Total Note Issue | Notes Held by Trading Banks | Net Note Circulation |
|---|---|---|---|
| $(million) | |||
| Weekly Average for Calendar Year | |||
| 1956 | 141.8 | 21.8 | 120.0 |
| 1957 | 148.5 | 26.1 | 122.4 |
| 1958 | 152.5 | 28.3 | 124.2 |
| 1959 | 154.1 | 28.7 | 125.4 |
| 1960 | 163.0 | 31.7 | 131.3 |
| 1961 | 168.9 | 33.9 | 135.0 |
| 1962 | 167.7 | 34.6 | 133.2 |
| 1963 | 169.5 | 36.6 | 133.0 |
| 1964 | 166.6 | 37.1 | 229.5 |
| 1965 | 166.1 | 38.0 | 128.1 |
| 1966 | 203.2 | 39.0 | 164.2 |
| At End of June | |||
| 1962 | 161.0 | 30.5 | 130.4 |
| 1963 | 162.7 | 31.6 | 131.0 |
| 1964 | 159.3 | 32.3 | 127.0 |
| 1965 | 160.1 | 36.4 | 123.7 |
| 1966 | 196.3 | 37.9 | 158.4 |
From 1932 to 1961 the proportion of notes to the total volume of money remained at a level of approximately 20 percent. From 1962 to 1965 the note issue fell slightly each year in total, and as a proportion of the volume of money. Two main reasons are thought to have been responsible for this change. Firstly, the steady growth in the use of cheques instead of cash, and secondly the facility offered by some trustee savings banks whereby they will pay customers' accounts, debiting the customers' balances at the bank; many of these accounts would otherwise have been paid in cash.
VOLUME OF MONEY IN CIRCULATION—The amount of money in circulation in the form of coin, notes, and demand deposits of the Reserve Bank and of the trading banks as at the last balance day in January is shown in the following table.
| Nature of Money | 1959 | 1960 | 1961 | 1962 | 1963 | 1964 | 1965 | 1966 | 1967 |
|---|---|---|---|---|---|---|---|---|---|
* Government and other demand deposits at Reserve Bank, excluding trading banks' balances at Reserve Bank. † Trading banks' total demand liabilities in New Zealand. | |||||||||
| $(million) | |||||||||
| Coin (estimated) | 9.4 | 9.8 | 10.4 | 10.8 | 11.2 | 11.6 | 12.4 | 15.9 | 15.4 |
| Notes held by public | 124.0 | 128.6 | 135.2 | 133.0 | 132.8 | 129.0 | 127.4 | 125.8 | 122.3 |
| Demand deposits at— | |||||||||
| Reserve Bank* | 21.8 | 24.2 | 23.0 | 42.2 | 29.2 | 32.8 | 26.8 | 30.3 | 39.4 |
| Trading banks† | 462.4 | 522.6 | 592.6 | 559.8 | 578.8 | 616.2 | 653.4 | 631.7 | 651.6 |
| Totals | 617.6 | 685.4 | 761.2 | 745.8 | 752.0 | 789.6 | 820.2 | 803.6 | 828.8 |
| Change during year | -40.6 | + 67.8 | +75.8 | -15.2 | + 6.2 | +37.8 | +30.4 | -16.6 | +25.2 |
The cumulative of the changes in the volume of money during the last 10 years to January 1967 is contained in the following summary.
| $(m) | |
|---|---|
* Government and other demand deposits at Reserve Bank, excluding trading banks' balances at Reserve Bank. †Trading banks' total demand liabilities in New Zealand. | |
| Coin estimated | + 6.5 |
| Notes held by public | + 1.0 |
| Demand deposits at— | |
| Reserve Bank* | +13.9 |
| Trading banks† | +147.6 |
| Total | +169.1 |
Finance Company Links—In the 1965 Budget the Minister of Finance announced that the Government had accepted in principle a recommendation from the Tariff and Development Board that the trading banks should be permitted to participate in finance companies, and that each bank had been informed that it might purchase a minor equity interest in a finance company, if it had not already done so, through its overseas head office. As a result, the four overseas trading banks have invested in existing finance companies and the Bank of New Zealand has formed a wholly New Zealand-owned public company, B.N.Z. Finance Company limited, in which it holds 40 percent of the issued capital.
MONETARY POLICY AND SAVINGS—The main emphasis on credit restraint is directed to the limitation of bank credit but in August 1965 the Minister of Finance announced further measures to curb the level of spending in the community by further reducing the flow of credit to the private sector. Agreement had been reached with the larger trustee savings banks, the private savings banks and insurance companies, that during the succeeding 12 months they would increase the ratio of their purchases of Government securities to those of other assets. (In addition, certain groups of financial institutions which engage in financing hire purchase transactions or make credit available for extended periods, had agreed to take up in quarterly instalments, Government securities equivalent to 7 1/2 percent of their new lending in the same period.)
In September 1966 agreement was reached with the savings banks that they would continue the policy of the previous 12 months while the finance companies agreed to take up additional amounts of Government securities. At the same time the credit restraint was extended to include most credit financing except normal retail store monthly accounts. The insurance companies agreed to take up additional amounts of Government securities and to increase their rate of lending to the farming sector.
On 11 February 1967 the voluntary credit restraints applicable to finance companies were superseded by regulations controlling the capital issues of finance companies. Since this date any company wishing to raise money for the purpose of carrying on the business of a finance company must first obtain the consent of the Minister of Finance. Banks, building societies, and authorised dealers on the short-term market, and for borrowing not exceeding $2,000 in any period of 12 months, were exempt from the regulations. Initially policy was to grant no approvals to increase the volume of funds employed by finance companies.
SMALL SAVINGS—While the main repositories for small savings in this country are the Post Office Savings Bank, the trustee savings banks, and the savings banks operated by the trading banks, there are a number of other financial institutions such as building and investment societies, stock and station agents, and finance companies, competing with them for deposits. In recent years there have been major changes in savings bank operations. Following an amendment to the Trustee Savings Bank Act passed in 1957, the five trustee savings banks that had survived from the middle of the last century were joined by eight new trustee savings banks between 1959 and 1964. Another major change was the formation of private savings banks by the five trading banks, following the passing of the Private Savings Bank Act in 1964.
The following table shows the total amounts of transactions in small savings accounts, including accounts in the Post Office Savings Bank and trustee savings banks, also National Savings accounts, but excluding national savings bonds and i School Savings Bank accounts. From 1965 private savings banks are included.
| Year Ended 31 March | Total Amount of Deposits | Interest | Excess of Amount or Withdrawals* | Excess of Deposits Plus Interest Over Withdrawals | Total Amount to Credit of Depositors at End of March |
|---|---|---|---|---|---|
* From January 1958 includes interest paid out on Investment accounts. †Encludes $612,000 transferred to Western Samoa. | |||||
| $(million) | |||||
| 1957 | 347.4 | 19.3 | 329.5 | 37.2 | 706.0 |
| 1958 | 393.4 | 21.4 | 363.8 | 50.9 | 757.0 |
| 1959 | 374.0 | 22.2 | 386.6 | 9.7 | 766.7 |
| 1960 | 418.5 | 22.7 | 394.5 | 46.7 | 813.4 |
| 1961 | 487.8 | 24.4 | 450.2 | 62.0 | 875.4 |
| 1962 | 508.0 | 25.7 | 500.5 | 33.3 | 908.1† |
| 1963 | 559.9 | 27.2 | 530.6 | 56.5 | 964.6 |
| 1964 | 672.4 | 29.6 | 616.2 | 85.8 | 1,050.4 |
| 1965 | 836.9 | 32.1 | 744.7 | 124.2 | 1,174.6 |
| 1966 | 993.5 | 35.7 | 905. 7 | 123.5 | 1,298.1 |
| 1967 | 1,102.1 | 39.3 | 1,044.5 | 97.0 | 1,395.1 |
In the following table the 3.3 million accounts in the three types of savings banks are classified by amount groups It will be noted that over two-thirds of the accounts have balances of less than $200.
Balances in the Post Office Savings Bank and the trustee savings banks are as at 31 March 1966. In the private savings banks, balance dates range between 31 March and 30 September.
| SAVING BANK ACCOUNTS BY AMOUNT GROUPS | ||||||
|---|---|---|---|---|---|---|
| Balance | Post Office Savings Bank | Trustee Savings Banks | Private Savings Banks | |||
| Number of Accounts | Percentage of total | Number of Accounts | Percentage of total | Number of Accounts | Percentage of total | |
| No. | No. | No. | ||||
| Under $2 | 469,531 | 20.4 | 128,069 | 16.5 | 21,802 | 10.2 |
| $2 and under $200 | 1,216,135 | 52.9 | 371,809 | 47.9 | 95,213 | 44.3 |
| $200 and under $1,000 | 382,308 | 16.6 | 175,638 | 22.7 | 51,626 | 24.0 |
| $1,000 and under $2,000 | 122,159 | 5.3 | 54,583 | 7.0 | 22,072 | 10.3 |
| $2,000 and under $4,000 | 71,741 | 3.1 | 38,777 | 5.0 | 19,598 | 9.1 |
| $4,000 and over | 37,919 | 1.7 | 6,581 | 0.9 | 4,585 | 2.1 |
| All accounts | 2,299,793 | 100.0 | 775,457 | 100.0 | 214,896 | 100.0 |
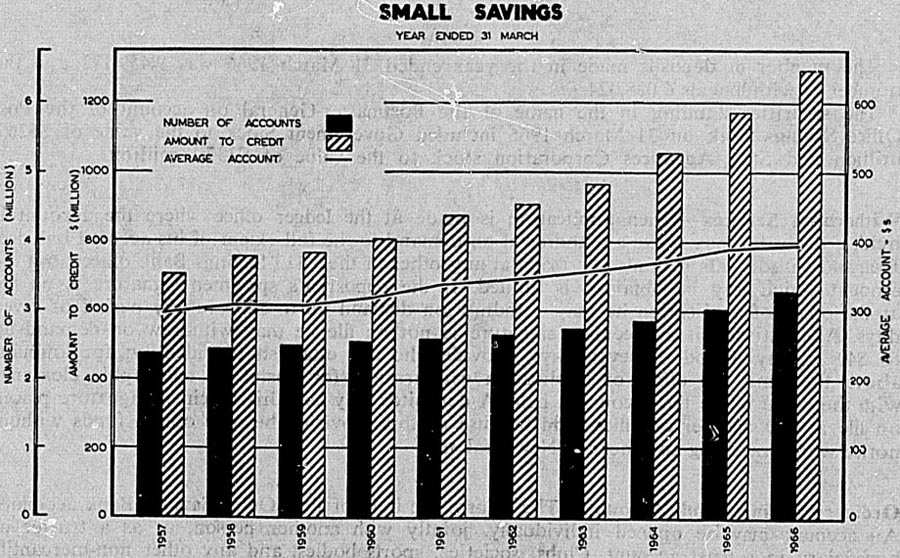
POST OFFICE SAVINGS BANK: Operation—The business of the Post Office Savings Bank started on 3 February 1867, when branches were established at Auckland, Wellington, Christchurch, Dunedin, and Hokitika. There are now 1,113 branches of the bank throughout New Zealand. Deposits may be made at any of these branches. A full demand withdrawal service is provided at 178 branches which have ledgers, and a limited service is provided at the remaining non-ledger offices.
The following table covering the activities of the Post Office Savings Bank includes ordinary Savings Bank, Special Purpose, Thrift Club, Home Lay-by, Investment accounts and National Savings Investment accounts, but does not include School Savings Bank accounts, which are referred to later.
| Year Ended 31 March | Number of Accounts at End of March | Total Amount of Deposits | Interest | Total Amount of Withdrawals* | Excess of Deposits, Plus Interest, Over Withdrawals | Total Amount to Credit of Depositors at End of March |
|---|---|---|---|---|---|---|
* From January 1958 includes interest paid out on investment accounts. †$612,306 and 15,459 accounts transferred to the Western Samoa Administration. | ||||||
| (000) | $(thousand) | |||||
| 1957 | 1,972 | 279,066 | 16,252 | 265,848 | 29,470 | 594,132 |
| 1958 | 2,014 | 311,738 | 17,930 | 291,216 | 38,452 | 632,586 |
| 1959 | 2,053 | 294,176 | 18,566 | 307,452 | 5,290 | 637,874 |
| 1960 | 2,085 | 326,260 | 18,886 | 311,044 | 34,102 | 671,976 |
| 1961 | 2,117 | 374,600 | 20,076 | 350,082 | 44,594 | 716,570 |
| 1962 | 2,144 | 383,358 | 21,012 | 383,678 | 20,692 | 736,652† |
| 1963 | 2,191 | 409,124 | 21,996 | 397,184 | 33,936 | 770,586 |
| 1964 | 2,245 | 471,590 | 23,634 | 442,952 | 52,272 | 822,858 |
| 1965 | 2,276 | 505,488 | 24,968 | 500,602 | 29,854 | 852,712 |
| 1966 | 2,312 | 506,574 | 25,754 | 520,646 | 11,680 | 864,394 |
| 1967 | 2,331 | 524,296 | 25,930 | 540,814 | 9,412 | 873,804 |
The number of deposits made in the year ended 31 March 1966 was 9,459,172 and the number of withdrawals 6,088,024.
The securities standing in the name of the Postmaster-General on account of the Post Office Savings Bank on 31 March 1966 included Government Stock to the value of $526.2 million and State Advances Corporation stock to the value of $337.1 million.
Withdrawal Services—When application is made at the ledger office where the account is held, a depositor may make a withdrawal on demand to the full extent of his account balance. Demand withdrawals may also be made at any other of the 1,113 Savings Bank offices, but the amount which may be obtained is limited. If the depositor's specimen signature is on file at the office of application he may withdraw on demand up to $200 in any period of seven days. Alternatively, if a specimen signature is not on file he may withdraw on demand up to $40 in any period of seven days, provided he can establish his identity; for amounts above the limit the office of application can arrange for postal or telegraphic clearance with the office where the account is held, A depositor may have his specimen signature placed on file at any number of offices and because of this provision he may obtain funds without notice while travelling anywhere in New Zealand.
Ordinary Savings Bank Accounts—These form the bulk of Post Office Savings Bank accounts. An account may be opened individually, jointly with another person, or as a trustee or beneficiary in a trust account. Clubs, societies, sports bodies, and any other non-mercantile body may also have these accounts, and organisations of this type have been able to operate under a cheque system since 1 March 1959.
Special Purpose Accounts—Introduced 1 October 1962; these accounts are intended for any person who desires to accumulate separate funds towards specific objectives. A. depositor may have five different Special Purpose accounts in addition to any other Post Office Savings Bank accounts. Each Special Purpose account is subject to an interest-bearing limit of $1,000. The rate of interest is 3 percent per year.
Thirft Club Accounts—These accounts are designed to meet the needs of salary and wage earners who wish to save something each pay day to provide for annual recurring charges. Thrift Club accounts may be opened by any group of persons. In most cases, employees have a nominated amount deducted from their salary or wages each pay day for crediting to a Thrift Club account in their own name. Where this system does not operate the persons may themselves appoint an agent to collect from members and make deposits. A passbook is issued to each depositor who may operate on the account in the same way as an ordinary account.
At 31 March 1966 there were 170,317 accounts open, the amount at credit being $22,966,496.
Home Lay-by Accounts—These accounts were introduced on 1 July 1957. Their main feature is a suspensory free deposit of $10 for every $200 saved with a maximum of $100. These accounts may be operated on in the same way as ordinary accounts and they earn the same rates of interest, in addition to the suspensory free deposit. The free deposit does not become payable until evidence is furnished that the funds are being used for the purchase or building of a home for the depositor's own occupancy. The first free deposits under this system became payable on 1 July 1959.
At 31 March 1966 mere were 2,209 accounts open, the amount at credit being $1,660,418.
Investment Accounts—These accounts were introduced on 1 October 1957. They are a type of fixed deposit and accounts may be opened by any person or any organisation, including business concerns. The minimum deposit is $200 and deposits above $200 must be in multiples of $20. Any number of deposits may be made, but they must not exceed $20,000 in the aggregate in any year commencing on 1 October. The minimum term of investment is one year and deposits not withdrawn are automatically reinvested. Withdrawals are permitted at any time, but if any are required in the first year one week's notice in writing is required except in the case of business concerns.
Interest runs from the date of deposit at 4 1/2 percent a year on amounts that remain on deposit for the first and each subsequent 12-monthly period. (Investments made prior to 17 June 1966, at 4 percent a year will commence to earn interest at 4 1/2 percent a year from the date they fall due for renewal.) If the deposit or any portion of it is withdrawn before the expiration of the first year or any subsequent 12-monthly period, special rates apply in respect of the amount withdrawn. These are:
On amounts withdrawn less than 12 months from the date of deposit: 2 1/2 percent a year is payable.
On amounts withdrawn before the expiration of the second or any subsequent 12-monthly period of deposit: 3 percent a year is payable.
On deposits made before 1 October 1964, interest on amounts withdrawn after two years from the date of deposit is computed at 4 percent a year.
On 31 March 1966, 29,651 Investment accounts were open with a total credit balance of $95,287,508.
Estates—The Postmaster-General may pay deposits to a maximum of $1,000 from any type of account to the legal representative of a deceased depositor without requiring him to take out letters of administration or to prove the will. Where there is more than one type of account the aggregate balances must not exceed $1,000, except in the case of a National Savings account, for which a separate maximum of $1,000 is permitted. This provision, together with another whereby a depositor may nominate one or more persons to receive part or all of the amount at credit of an ordinary Sayings Bank, Special Purpose, Thrift Club, or a Home Lay-by account after the depositor's death, enables the next-of-kin to obtain possession of perhaps much-needed funds without delay or cost.
School Savings Bank—the School Savings Bank scheme was introduced in 1934 with the object of encouraging thrift amongst young people. The lodgment of deposits is made to teachers at the school, the cash and deposits slips being handed in later at the Post Office.
A table showing the transactions in School Savings Bank accounts during the last 11 years is appended.
| Year Ended 31 December | Number of Schools Operating at End of Year | Total Number of Deposit Transactions Daring Year | Total Amount of Deposits During Year | Total Number of Withdrawal Transactions During Year | Total Amount of Withdrawals During Year* | Excess of Deposits Over Withdrawals | Interest Credited | Total Amount to Credit of Depositors at End of Year |
|---|---|---|---|---|---|---|---|---|
| * Includes amounts transferred to Post Office Savings Bank. | ||||||||
| (000) | $(000) | $(000) | $(000) | $(000) | $(000) | |||
| 1956 | 1,832 | 1,482 | 569 | 30,265 | 426 | 143 | 42 | 1,703 |
| 1957 | 1,983 | 1,967 | 732 | 32,282 | 463 | 269 | 51 | 2,023 |
| 1958 | 2,102 | 2,258 | 818 | 38,625 | 580 | 238 | 60 | 2,321 |
| 1959 | 2,136 | 2,407 | 863 | 49,814 | 845 | 18 | 67 | 2,407 |
| 1960 | 2,202 | 2,627 | 958 | 49,106 | 793 | 165 | 72 | 2,643 |
| 1961 | 2,235 | 2,709 | 1,003 | 49,403 | 861 | 141 | 77 | 2,861 |
| 1962 | 2,255 | 2,764 | 1,072 | 51,629 | 958 | 114 | 82 | 3,057 |
| 1963 | 2,280 | 2,793 | 1,053 | 56,458 | 1,016 | 37 | 86 | 3,179 |
| 1964 | 2,294 | 3,009 | 1,139 | 59,792 | 1,131 | 8 | 89 | 3,276 |
| 1965 | 2,317 | 3,129 | 1,193 | 58,521 | 1,180 | 13 | 91 | 3,380 |
| 1966 | 2,342 | 3,458 | 1,332 | 58,535 | 1,154 | 179 | 96 | 3,655 |
On 31 December 1965 there were 291,666 School Savings Bank accounts open.
PRIVATE SAVINGS BANKS—The Private Savings Bank Act 1964 came into force on 1 October 1964. Under this Act the five trading banks all formed private savings banks. These savings banks may transact business only in premises ordinarly occupied and used by the parent bank. In addition to ordinary deposits, these banks may accept investments similar to the trustee savings banks, by way of deposits in Home Lay-by, Investment accounts, Thrift Club, and Special Purpose accounts.
| Year Ended 31 March | Number of Accounts at End of Year | Total Amount of Deposits During Year | Total Amount of Withdrawals During Year | Excess of Deposits Over Withdrawals | Interest Credited | Total Amount to Credit of Depositors at End of Year |
|---|---|---|---|---|---|---|
| * From October 1964 to end of March year. | ||||||
| $(thousand) | ||||||
| 1965* | 74,991 | 69,270 | 15,935 | 53,334 | 120 | 53,455 |
| 1966 | 192,177 | 161,537 | 90,336 | 71,200 | 1,570 | 126,226 |
| 1967 | 313,927 | 205,502 | 152,384 | 53,118 | 3,968 | 183,312 |
Private savings banks assets at 31 March 1966 included $15,304,852 invested in mortgages and other loans, $104,223,990 in New Zealand Government Securities out of the total asset figure of $130,117,316.
TRUSTEE SAVINGS BANKS—The trustee savings bank movement is generally regarded as having originated in Scotland in 1810. The movement spread quickly, and the first such New Zealand Bank was established in Wellington in 1846, 20 years before the New Zealand Post Office Savings Bank commenced business. By 1870 nine trustee banks were in existence, but four, namely Lyttelton, Wellington, Napier, and Nelson did not survive the turn of the century. The five remaining banks—Auckland (1847), New Plymouth (1850), Dunedin (1864), Southland (1864), and Hokitika (1866)—grew in strength and their activities became an important factor in New Zealand's economic structure. Since 1957 a number of new trustee saving banks have been established.
The legislation dealing with trustee savings banks is contained chiefly in the Trustee Sayings Banks Act 1948. Not less than 50 percent of investments must be held in the form of Government stock, and a proportion of depositors' balances must be kept as cash in hand or on current account, namely 5 percent up to $20 million, and 2 1/2 percent of the amount in excess of $20 million. Repayment of deposits is guaranteed by the State.
In addition to ordinary deposits, trustee savings banks may accept investments similarly to the Post Office Savings Bank, by way of deposits in Home Lay-by or Investment accounts. The maximum rates of interest payable on deposits are fixed by Order in Council. Maximum rates payable on these and other deposits are given later in this Section.
The following tables relate only to trustee savings banks.
| Year Ended 31 March | Number of Accounts at End of Year | Total Amount of Deposits During Year | Total Amount of Withdrawals During Year | Excess of Deposits Over Withdrawals | Interest Credited | Total Amount to Credit of Depositors at End of Year |
|---|---|---|---|---|---|---|
| NOTE—This statement includes national savings investment accounts. | ||||||
| No. | $(thousand) | |||||
| 1957 | 415,150 | 68,358 | 63,618 | 4,739 | 3,029 | 111,938 |
| 1958 | 426,691 | 81,646 | 72,598 | 9,048 | 3,431 | 124,417 |
| 1959 | 436,801 | 79,843 | 79,114 | 730 | 3,646 | 128,792 |
| 1960 | 455,400 | 92,238 | 83,453 | 8,786 | 3,847 | 141,425 |
| 1961 | 477,647 | 113,231 | 100,141 | 13,090 | 4,276 | 158,791 |
| 1962 | 501,747 | 124,715 | 116,831 | 7,884 | 4,732 | 171,407 |
| 1963 | 536,981 | 150,827 | 133,383 | 17,444 | 5,159 | 194,010 |
| 1964 | 588,124 | 200,769 | 173,244 | 27,524 | 5,966 | 227,500 |
| 1965 | 665,835 | 262,133 | 228,203 | 33,930 | 7,003 | 268,433 |
| 1966 | 775,339 | 325,352 | 294,697 | 30,655 | 8,386 | 307,475 |
| 1967 | 884,223 | 372,297 | 351,272 | 21,125 | 9,347 | 337,947 |
The following table shows the results of the transactions, inclusive of National Savings investment accounts, of each of the trustee savings banks during 12 months ended 31 March 1966.
| Bank | Number of Accounts at End of Year | Total Amount of Deposits During Year | Total Amount of Withdrawals During Year | Excess of Deposits Over Withdrawals | Interest Credited | Total Amount to Credit of Depositors at End of Year |
|---|---|---|---|---|---|---|
| No. | $(thousand) | |||||
| Auckland | 420,989 | 133,919 | 128,885 | 5,034 | 4,133 | 147,081 |
| Waikato | 51,883 | 25,588 | 23,300 | 2,288 | 612 | 21,703 |
| Bay of Plenty | 15,016 | 11,313 | 7,886 | 3,426 | 154 | 7,221 |
| Taranaki | 47,309 | 16,386 | 15,470 | 916 | 608 | 21,119 |
| Hawke's Bay & Gisborne | 15,187 | 12,973 | 10,701 | 2,271 | 241 | 9,249 |
| Wanganui | 10,905 | 7,865 | 5,964 | 1,901 | 109 | 5,035 |
| Manawatu-Wairarapa | 12,186 | 9,565 | 6,072 | 3,493 | 150 | 7,281 |
| Wellington | 9,857 | 6,527 | 4,235 | 2,292 | 63 | 3,523 |
| Westland | 4,668 | 1,390 | 1,058 | 331 | 62 | 2,447 |
| Canterbury | 47,276 | 32,775 | 27,381 | 5,393 | 558 | 21,055 |
| South Canterbury | 5,955 | 3,771 | 2,243 | 1,527 | 66 | 3,140 |
| Otago | 79,412 | 21,069 | 19,551 | 1,518 | 814 | 28,675 |
| Southland | 54,696 | 42,212 | 41,949 | 264 | 816 | 29,946 |
| Totals | 775,339 | 325,352 | 294,697 | 30,655 | 8,386 | 307,475 |
Following is a summary of trustee savings banks' assets at 31 March 1966. The total assets include an amount of $7,162,000 securing National Savings deposits all of which is invested in New Zealand Government securities. Under the Trustee Savings Banks Act, however, National Savings deposits are not regarded as assets of the Trustee Savings Banks, and for this reason are shown separately.
| Bank | Mortgages | New Zealand Government Securities | Local Authority Debentures | Cash in Hand and on Call at Bank | Total Assets (Includes Other Assets but not National Savings Deposits) | National Savings Deposits | Total Held Including National Savings Deposits |
|---|---|---|---|---|---|---|---|
| * Total assets include $8,544,000 fixed deposits. | |||||||
| $(thousand) | |||||||
| Auckland | 39,460 | 86,905 | 17,599 | 1,609 | 153,310 | 4,096 | 157,406 |
| Waikato | 4,939 | 14,428 | 1,349 | 38 | 22,180 | - | 22,180 |
| Bay of Plenty | 622 | 5,674 | 326 | 138 | 7,344 | - | 7,344 |
| Taranaki | 7,595 | 12,144 | 167 | 818 | 21,820 | 678 | 22,498 |
| Hawke's Bay and Gisborne | 1,712 | 6,819 | 270 | 244 | 9,484 | - | 9,484 |
| Wanganui | 401 | 4,149 | 137 | 180 | 5,155 | - | 5,155 |
| Manawatu - Wairarapa | 628 | 5,954 | 207 | 388 | 7,462 | - | 7,462 |
| Wellington | 268 | 3,018 | 41 | 93 | 3,672 | - | 3,672 |
| Westland | 934 | 1,410 | 55 | 32 | 2,672 | - | 2,672 |
| Canterbury | 5,470 | 14,029 | 675 | 432 | 21,768 | - | 21,768 |
| South Canterbury | - | 2,886 | 118 | 46 | 3,254 | - | 3,254 |
| Otago | 9,494 | 14,902 | 1,616 | 682 | 28,570 | 2,006 | 30,576 |
| Southland | 6,163 | 15,589 | 6,321 | 961 | 31,282 | 382 | 31,664 |
| Totals | 77,688 | 187,908 | 28,884 | 5,662 | 317,974 | 7,162 | 325,136 |
STOCK AND STATION AGENCIES—Many of the existing stock and station agencies first commenced business as general merchants or retailers in the early days of the country's settlement. However, during the greater part of their history, the main financial operations have been in the supply of merchandise, machinery and implements, and the provision of finance to the farming community. The companies have developed a specialised banking business involving the maintenance of current accounts for farmers, the acceptance of time deposits and the granting of secured and unsecured advances. It is a widespread practice for farmers to have current accounts with their stock and station agents to which the proceeds of the sale of livestock and produce are placed and farm and personal expenses charged. Any surplus may be left on current account or placed with the agents on fixed deposit.
Financial data as at 30 June 1966 (with totals for previous years) are given in two tables of deposits, advances, etc., for stock and station agencies operating in New Zealand. The statistics refer to the whole of the companies' trading operations including, in some cases, activities additional to normal stock and station transactions, such as retail trading in consumer goods.
The deposit figures include only moneys received for an agreed term and rate of interest and exclude amounts secured by mortgage or debenture, and amounts in credit on current account. Secured advances to customers include those made on mortgage or chattel security. The figure for merchandise and commodity stocks includes all types of trading stock which are regarded as current assets, but excludes livestock, goods held on consignment, or motor vehicles used by the company.
Returns were collected from 27 agencies.
| DEPOSITS HELD (ORIGINAL TERM) | |||||||
|---|---|---|---|---|---|---|---|
| Rate of Interest | Call and Under 3 Months | 3 Months and Under 6 Months | 6 Months and Under 12 Months | 12 Months and Under 2 Years | 2 Years and Over | Totals, 30 June 1966 | Totals, 30 June 1965 |
| $(thousand) | |||||||
| percent | $(000) | $(000) | $(000) | $(000) | $(000) | $(000) | $(000) |
| 1 1/2 | 303 | - | - | - | - | 303 | 233 |
| 2 | 525 | 5 | - | - | - | 530 | 583 |
| 2 1/2 | 156 | - | - | 27 | - | 183 | 212 |
| 3 | 1,132 | 26 | 8 | 4 | 24 | 1,194 | 1,411 |
| 3 1/4 | - | - | - | 1 | 14 | 15 | 25 |
| 3 1/2 | 541 | 101 | 39 | 43 | 35 | 759 | 1,229 |
| 3 3/4 | 111 | - | 18 | 20 | 14 | 163 | 148 |
| 4 | 3,860 | 1 | 159 | 1,106 | 476 | 5,602 | 6,098 |
| 4 1/8 | - | - | - | - | - | - | 10 |
| 4 1/4 | 89 | - | - | 6 | 122 | 217 | 670 |
| 4 3/8 | - | - | - | - | 2 | 2 | - |
| 4 1/2 | 799 | 90 | 113 | 651 | 841 | 2,494 | 1,451 |
| 4 3/4 | 141 | - | - | - | 69 | 209 | 79 |
| 4 7/8 | 31 | - | - | - | - | 31 | - |
| 5 | 1,628 | 45 | 45 | 258 | 5,715 | 7,690 | 6,377 |
| 5 1/4 | 507 | - | - | - | 276 | 783 | 306 |
| 5 1/2 | - | - | - | 22 | 1,497 | 1,519 | 1,044 |
| 5 5/8 | - | - | - | - | 62 | 62 | - |
| 5 3/4 | - | - | - | - | 674 | 674 | 515 |
| 6 | - | - | - | - | 111 | 111 | 65 |
| 6 1/4 | - | - | - | - | 10 | 10 | - |
| 6 1/2 | - | - | - | - | 5 | 5 | 2 |
| Totals, 1966 | 9,824 | 268 | 380 | 2,139 | 9,946 | 22,557 | 20,460 |
| Totals, 1965 | 8,865 | 397 | 394 | 1,856 | 8,948 | 20,460 | - |
| Totals, 1964 | 4,852 | 164 | 244 | 1,318 | 6,935 | 13,512 | - |
Deposits at call or under three months comprised 35.9 percent of total deposits at 30 June 1964, 43.3 percent at 30 June 1965, and 43.6 percent at 30 June 1966. At the same date deposits for terms of two years or more comprised 51.3 percent, 43.7 percent, and 44.1 percent respectively of total deposits.
The downward movement in the proportion of deposits at the lowest rates of interest continued during the latest two years.
| Interest Rates Paid | Proportion of Total Deposits on Which Interest Paid | ||
|---|---|---|---|
| At 30 June 1964 | At 30 June 1965 | At 30 June 1966 | |
| Percent | Percent | Percent | |
| Under 3 percent | 10.2 | 5.0 | 4.5 |
| 3 percent and under 5 percent | 47.6 | 54.4 | 47.4 |
| 5 percent and over | 42.2 | 40.6 | 48.1 |
| 100.0 | 100.0 | 100.0 | |
A summary of the liquid position of stock and station agencies is given below.
| Item | 1965 | 1966 | ||||||
|---|---|---|---|---|---|---|---|---|
| Mar | Jun | Sep | Dec | Mar | Jun | Sep | Dec | |
| $(thousand) | ||||||||
| Deposits held | 17,660 | 20,460 | 23,359 | 24,517 | 22,501 | 22,557 | 20,472 | 23,899 |
| Customers' credit balances on current account | 37,964 | 37,118 | 28,145 | 31,655 | 35,953 | 36,602 | 28,814 | 28,638 |
| Advances to customers- | ||||||||
| (a) On current account (unsecured) | 67.076 | 62.083 | 69,839 | 70,879 | 80,731 | 63,576 | 70,283 | 71,978 |
| (b) Other advances (secured) | 38,568 | 39,026 | 46,689 | 48,264 | 48,809 | 43,588 | 50,934 | 53,714 |
The following table summarises the financial statements of stock and station agents.
| Item | At 30 June | ||||
|---|---|---|---|---|---|
| 1962 | 1963 | 1964 | 1965 | 1966 | |
| $(thousand) | |||||
| Customers' credit balances on current account | 28,136 | 33,732 | 37,444 | 37,118 | 36,602 |
| Advances to customers— | |||||
| (a) On current account (unsecured) | 35,359 | 41,899 | 44,973 | 62,083 | 63,576 |
| (b) Other advances (secured) | 44,756 | 34,690 | 35,046 | 39,026 | 43,588 |
| Investments— | |||||
| (a) Government securities | 3,6117 | 3,680 | 4,520 | 5,458 | 4,932 |
| (b) Fixed deposits | 1,203 | 6,145 | 8,854 | 930 | 105 |
| (c) Other investments | 10,515 | 13,328 | 7,325 | 9,160 | 9,673 |
| Cash balances (in hand and at bank) | 1,283 | 4,033 | 4,207 | 4,002 | 4,057 |
| Bank overdrafts outstanding | .. | 3,778 | 6,791 | 14,032 | 11,684 |
| Merchandise and commodity stocks | 27,636 | 26,430 | 30,403 | 33,900 | 35,146 |
The unsecured advances by agents of $63.6 million at 30 June 1966 was nearly equal to that of trading banks advances to farmers of $66.2 million.
DEPOSITS WITH COMPANIES, ETC.—A summary of deposits with societies, finance companies, firms, and businesses as at 31 March 1966 (with totals for the previous year) is now-given. The figures refer to interest-bearing deposits held for an agreed term, and exclude moneys received on mortgage or debenture security, or in the course of a mercantile current account. The figures of deposits with stock and station agents, given previously, are not included in the following table.
For this survey the coverage is believed to include nearly all companies, etc. accepting deposit moneys as defined.
| Rate of Interest per Annum (percent) | Call and Under 3 Months | 3 Months and Under 6 Months | 6 Months and Under 12 Months | 12 Months and Under 2 Years | 2 Years and Over | Totals |
|---|---|---|---|---|---|---|
| $(thousand) | ||||||
| 1/2 | 102 | - | - | - | - | 102 |
| 1 | 10 | - | - | - | - | 10 |
| 1 1/2 | 140 | - | - | - | - | 140 |
| 2 | 25 | - | - | - | - | 25 |
| 2 1/2 | 130 | - | - | 14 | - | 144 |
| 2 3/4 | 504 | - | - | - | - | 504 |
| 3 | 15,999 | 30 | 387 | 4 | 30 | 16,450 |
| 3 1/8 | 196 | - | - | - | - | 196 |
| 3 1/4 | 1,274 | 9 | - | - | - | 1,284 |
| 3 3/8 | 565 | 24 | - | - | - | 589 |
| 3 1/2 | 4,854 | 480 | 149 | 33 | 19 | 5,535 |
| 3 5/8 | 1,007 | 72 | 37 | - | - | 1,117 |
| 3 7/10 | 216 | 20 | - | - | - | 236 |
| 3 3/4 | 5,134 | 260 | 271 | 1 | 2 | 5,669 |
| 3 7/8 | 700 | - | - | - | - | 700 |
| 4 | 18,318 | 436 | 156 | 1,884 | 1,291 | 22,085 |
| 4 1/8 | 560 | - | - | - | - | 560 |
| 4 1/4 | 2,819 | 252 | 143 | 957 | 111 | 4,283 |
| 4 3/10 | 1,514 | - | - | - | - | 1,514 |
| 4 3/8 | - | - | - | 109 | - | 109 |
| 4 1/2 | 296 | 356 | 4 | 57 | 3,161 | 3,873 |
| 4 3/4 | 13 | 19 | 255 | 2 | 409 | 699 |
| 4 7/8 | - | - | - | - | 66 | 66 |
| 5 | 2,715 | 574 | 1,127 | 1,450 | 14,279 | 20,144 |
| 5 1/8 | 1 | - | - | - | 261 | 262 |
| 5 1/4 | 198 | 16 | 110 | 676 | 17,054 | 18,053 |
| 5 3/8 | - | - | - | - | 315 | 315 |
| 5 1/2 | 308 | 21 | 85 | 532 | 5,824 | 6,770 |
| 5 5/8 | - | - | - | - | 58 | 58 |
| 5 3/4 | 498 | - | 16 | 70 | 1,174 | 1,758 |
| 5 7/8 | - | - | - | - | 11 | 11 |
| 6 | 1,935 | 467 | 363 | 551 | 4,479 | 7,795 |
| 6 1/4 | 5 | - | - | - | 1,015 | 1,020 |
| 6 1/2 | 730 | 6 | 44 | 48 | 1,045 | 1,874 |
| 6 3/4 | 165 | - | 4 | - | 105 | 274 |
| 7 | 3,473 | 595 | 209 | 535 | 1,317 | 6,129 |
| 7 1/4 | - | - | - | - | 52 | 52 |
| 7 1/2 | 222 | 52 | - | 73 | 256 | 603 |
| 7 3/4 | - | - | - | - | 205 | 205 |
| 8 | 1,407 | 318 | 334 | 489 | 703 | 3,251 |
| 8 1/4 | - | - | - | 61 | - | 61 |
| 8 1/2 | 42 | - | - | 14 | 34 | 90 |
| 9 | 30 | 43 | - | 6 | - | 79 |
| 9 1/2 | 29 | - | - | - | - | 29 |
| 10 | 442 | 82 | 49 | 85 | 738 | 1,397 |
| 12 | - | - | - | - | 1 | 1 |
| 12 1/2 | 20 | 1 | - | - | 2 | 23 |
| 13 | 4 | - | - | - | - | 4 |
| 15 | 2 | - | - | 30 | 47 | 79 |
| Totals, Mar 1966 | 66,603 | 4,132 | 3,744 | 7,683 | 54,064 | 136,226 |
| Totals, Mar 1965 | 66,005 | 6,091 | 4,240 | 6,633 | 44,791 | 127,759 |
| Totals, Mar 1964 | 56,275 | 7,447 | 3,312 | 3,544 | 35,509 | 106,088 |
In the preceding table the latest figures are not strictly comparable with those published for earlier years owing to the extension of coverage through new companies, etc., being added each year. The Reserve Bank has five approved dealers in this short-term money market and the aggregate deposits of these dealers as at 31 March 1966 was $34.8 million.
However, the following summary table showing interest-bearing deposits held as at 31 March in the three latest years relates only to those companies in the 1964 collection from which statistics were obtained again, and can be used for purposes of comparability.
| Period of Deposit | Amount as at 31 March | ||
|---|---|---|---|
| 1964 | 1965 | 1966 | |
| $(000) | |||
| Call and under three months | 56,275 | 64,816 | 60,206 |
| 3 months and under 6 months | 7,447 | 6,095 | 3,383 |
| 6 months and under 12 months | 3,312 | 4,172 | 3,180 |
| 12 months and under 2 years | 3,544 | 6,511 | 6,335 |
| 2 years and over | 35,509 | 44,647 | 49,062 |
| Totals | 106,088 | 126,242 | 122,166 |
Interest rates paid and periods of deposits are shown in the following tables.
| Interest Rates Paid | Proportion of Total Deposits at 31 March | ||
|---|---|---|---|
| 1964 | 1965 | 1966 | |
| Percent | |||
| Under 3 percent | 0.5 | 0.8 | 0.7 |
| 3 percent and under 5 percent | 64.9 | 55.3 | 47.7 |
| 5 percent and over | 34.6 | 43.9 | 51.6 |
| Totals | 100.0 | 100.0 | 100.0 |
| Term of Deposit | Proportion of Total Deposits at 31 March | ||
|---|---|---|---|
| 1964 | 1965 | 1966 | |
| Percent | |||
| Call and under three months | 53.1 | 51.7 | 48.9 |
| 3 months and under 6 months | 7.0 | 4.8 | 3.0 |
| 6 months and under 12 months | 3.1 | 3.3 | 2.8 |
| 12 months and under 2 years | 3.3 | 5.2 | 5.6 |
| 2 years and over | 33.5 | 35.0 | 39.7 |
| Totals | 100.0 | 100.0 | 100.0 |
OVERDRAFT RATES—The maximum permitted average interest rate on bank overdrafts, which had been 5.84 percent since June 1962, was raised to 6.0 percent on 31 August 1965.
DEPOSIT AND INTEREST RATES: Trading Banks—The following is a schedule of the rates paid by the Associated Banks in New Zealand for moneys lodged on fixed deposit.
| Date Operative From | 3 Months and Under 6 Months | 6 Months and Under 12 Months | 12 Months and Under 24 Months | 24 Months and Upwards |
|---|---|---|---|---|
| Percent | ||||
| 1 August 1931 | 3 1/2 | 3 3/4 | 4 | 4 1/2 |
| 1 June 1932 | 3 | 3 1/4 | 3 1/2 | 4 |
| 2 December 1932 | 2 1/2 | 2 3/4 | 3 | 3 1/4 |
| 11 July 1933 | 2 | 2 1/2 | 2 3/4 | 3 |
| 5 July 1934 | 1 1/2 | 2 | 2 1/2 | 2 3/4 |
| 2 November 1934 | 1 1/4 | 1 3/4 | 2 1/4 | 2 1/2 |
| 18 September 1940 | 3/4 | 1 1/4 | 2 1/4 | 2 1/2 |
| 17 July 1941 | 3/4 | 1 1/4 | 1 3/4 | 2 |
| 16 February 1956 | 1 1/2 | 1 3/4 | 2 1/4 | 2 1/2 |
| 14 June 1956 | 2 | 2 1/4 | 2 3/4 | 3 |
| 1 October 1957 | 2 | 2 1/2 | 3 1/4 | 3 1/2 |
On 1 July 1965 the following rates were adopted: 30-180 days, 2 1/2 percent; 7-9 months, 2 3/4 percent; 10-23 months, 3 1/4 percent; 24 months and over, 3 1/2 percent. The following rates have been paid since 21 June 1966: 30-180 days 3 percent; six months and under 12 months, 3 1/2 percent; 12 months and under 24 months, 4 percent; 24 months and over 4 1/2 percent. As previously, variations in these rates and terms may be negotiated on deposits in excess of $20,000.
Post Office Savings Bank—The Post Office Savings Bank pays interest on all deposits. The present rates on ordinary, Thrift Club, Home Lay-by, and School Savings Bank deposits are 3 percent per year on deposits of up to $20,000. For Special Purpose accounts the rate is 3 percent per year on balances up to $1,000 in each of the five accounts permitted.
The rate of interest on National Savings accounts is 31 percent per year but if withdrawals are made before maturity date of the deposits, interest on the amount withdrawn is credited at Savings Bank rates.
Following is a table of interest rates payable in respect of Post Office Savings Bank deposits.
| Date Operative From | Amount of Deposit | ||||||
|---|---|---|---|---|---|---|---|
| $1-$600 | $601-$1,000 | $1,001-$2,000 | $2,001-$4,000 | $4,001-$10,000 | $10,001-$15,000 | $15,001-$20,000 | |
| Percent | |||||||
| 1 August 1931 | 3 3/4 | 3 3/4 | 3 1/4 | 3 1/4 | Nil | Nil | Nil |
| 1 April 1933 | 3 | 3 | 3 | 3 | Nil | Nil | Nil |
| 1 August 1933 | 3 | 3 | 3 | 2 3/4 | Nil | Nil | Nil |
| 1 August 1934 | 3 | 3 | 2 1/4 | 2 1/2 | Nil | Nil | Nil |
| 1 August 1941 | 3 | 3 | 2 | 2 | Nil | Nil | Nil |
| 1 June 1942 | 2 1/2 | 2 1/2 | 2 | 2 | Nil | Nil | Nil |
| 1 September 1952 | 2 1/2 | 2 1/2 | 2 | 2 | 1 1/2 | Nil | Nil |
| 1 May 1956 | 3 | 3 | 3 | 2 1/2 | 2 1/2 | Nil | Nil |
| 1 August 1957 | 3 | 3 | 3 | 2 1/2 | 2 1/2 | 2 1/2 | Nil |
| 1 August 1959 | 3 | 3 | 3 | 2 1/2 | 2 1/2 | 2 1/2 | 2 1/2 |
| 1 August 1962 | 3 | 3 | 3 | 3 | 3 | 3 | 3 |
Trustee Savings Banks—From 1 May 1956 the allowable maximum rate on all deposits was increased to 3 percent on amounts up to $1,500, this limit being raised to $2,000 from 26 October 1956. A rate of 2 1/2 percent was payable between $2,002 and $,4000 but this was raised to 3 percent as from 1 August 1962. On deposits in investment accounts the rate is 2 1/2 percent for periods less than 12 months, 4 percent for each complete period of 12 months with 3 percent payable on deposits withdrawn during the year after the first year.
Private Savings Banks—The rate of interest payable on deposits in private savings banks is 3 percent a year up to $4,000. This applies to the savings banks operated by trading banks from 1 October 1964. On deposits in investment accounts the rate is 2 1/2 percent for periods less than 12 months, 4 percent for each complete period of 12 months with 3 percent payable on deposits withdrawn during the year after the first year.
Company, etc., Deposits—Since 5 July 1962 there has been no control on interest rates payable on deposits held by stock and station agents, trading companies, and building and investment societies.
Other Deposits and Interest Rates—References to rates of interest on mortgages will be found in Section 30 A (Mortgages), while interest on Government debt is referred to in Section 26 c (State Indebtedness), interest on local authority debt in Section 27 (Local Government Finance), and interest on the Common Fund of the Public Trust Office in Section 40.
COINAGE AND CURRENCY: New Zealand Coin—Under the Coinage Act 1933 the Minister of Finance arranges for the issue of silver or cupro-nickel and bronze coins. Distinctive New Zealand silver coinage first came into circulation in 1933 and New Zealand bronze coins in December 1939. In 1947 cupro-nickel coins were issued in place of silver coins.
Decimal Currency—Under the Decimal Currency Act 1964 a system of decimal currency was introduced in New Zealand on 10 July 1967 with the dollar as the monetary unit. The dollar is equivalent to the previous 10s. The equivalent in decimal currency of the shilling is 10 cents. There are coins for 50 cents, 20 cents, 10 cents, 5 cents, 2 cents, and 1 cent, and a commemorative one dollar, and the Reserve Bank notes for 1, 2, 5, 10, 20, and 100 dollars. During a transitional period from 10 July 1967 both old and new currencies are in circulation.
A Decimal Currency Board was set up on 11 May 1964. Conversion of office machines was met in part by the Government. Savings will follow in accounting and administration work and in the teaching of arithmetic to school children.
In the following conversion table the equivalents in cents are shown for shillings and pence from 11d. to 9s. 11d.
| 0d. | 1d. | 2d. | 3d. | 4d. | 5d. | 6d. | 7d. | 8d. | 9d. | 10d. | 11d. | |
|---|---|---|---|---|---|---|---|---|---|---|---|---|
| Cents | ||||||||||||
| 0 | 0 | 1 | 2 | 2 | 3 | 4 | 5 | 6 | 7 | 8 | 8 | 9 |
| 1s. | 10 | 11 | 12 | 12 | 13 | 14 | 15 | 16 | 17 | 18 | 18 | 19 |
| 2s. | 20 | 21 | 22 | 22 | 23 | 24 | 25 | 26 | 27 | 28 | 28 | 29 |
| 3s. | 30 | 31 | 32 | 32 | 33 | 34 | 35 | 36 | 37 | 38 | 38 | 39 |
| 4s. | 40 | 41 | 42 | 42 | 43 | 44 | 45 | 46 | 47 | 48 | 48 | 49 |
| 5s. | 50 | 51 | 52 | 52 | 53 | 54 | 55 | 56 | 57 | 58 | 58 | 59 |
| 6s. | 60 | 61 | 62 | 62 | 63 | 64 | 65 | 66 | 67 | 68 | 68 | 69 |
| 7s. | 70 | 71 | 72 | 72 | 73 | 74 | 75 | 76 | 77 | 78 | 78 | 79 |
| 8s. | 80 | 81 | 82 | 82 | 83 | 84 | 85 | 86 | 87 | 88 | 88 | 89 |
| 9s. | 90 | 91 | 92 | 92 | 93 | 94 | 95 | 96 | 97 | 98 | 98 | 99 |
Restrictions on Export of Currency—Under the Exchange Control Regulations 1965 the taking or sending of money from New Zealand is forbidden except with the consent of the Minister of Finance. The Exchange Control Exemption Notice 1965, Amendment No. 2, restricts the amount of New Zealand money taken out, by travellers to $10 (which may be in notes of $2 or $1 or in coin up to $4). The export of any other notes or coin of any country requires specific consent.
Legal Tender and Issue of Notes—Under the Decimal Currency Act 1964, dollar coins are legal tender for any amount, coins of. 5, 10, 20, and 50 cents for an amount up to 5 dollars, and coins of 1 and 2 cents for an amount up to 20 cents.
Since 1 August 1934 the Reserve Bank has had the sole right to issue bank notes in New Zealand: Reserve Bank notes are constituted legal tender up to any amount. The rate of exchange for overseas transactions is fixed by the Bank, subject to a right of the Minister of Finance, after consultation with the Governor, to determine the relationship with sterling.
The issue of decimal currency notes consist of the following denominations: $1, $2, $5, $10, $20, and $100. Notes are issued solely in response to the demands of the public. In assessing likely requirements there are seasonal factors to be considered, as well as basic economic conditions, such as national income, the levels of salaries and wages, changes in price levels generally, and in the total volume of money. In addition, methods and frequency of payments affect the amount to be issued.
Government postal notes (issued in 39 denominations of from 10c to $4) sometimes enjoy a certain length of life in the form of currency.
EXCHANGE RATES—The significance of the exchange rate in the case of New Zealand depends chiefly upon the country's position in regard to overseas trade and to overseas borrowings. The course of development of New Zealand has not reached a stage where the country is fully self-contained, and the external trade per head is greater than that of most countries of the world. Most of this external trade is with the United Kingdom, while the function of London as an international clearing house is also of importance in this connection. New Zealand's borrowings from the London financial market as noted elsewhere (see State Indebtedness) require considerable annual payments in London. New Zealand is a member of the International Monetary Fund, and as such is required to maintain buying and selling rates for exchange transactions in its currency within one percent on either side of its established par value. The par value may be changed, i.e., the exchange rate altered, with the approval of the International Monetary Fund; this must be given if the proposed change does not exceed 10 percent, or if a “fundamental disequilibrium” exists in the country's balance of payments.
New Zealand and Sterling Exchange—The relationship of New Zealand currency to sterling gained added significance from December 1929. Prior to that date the New Zealand currency was at virtual parity with British currency, only slight deviations occurring from time to time, but then commenced to depreciate gradually, reaching, in January of 1931 a level of approximately £110 New Zealand = £100 London for telegraphic transfers. At that level it remained fairly stationary until January 1933, when as a result of Government intervention it was abruptly depreciated to a further degree. The relationship existing from 20 January 1933 until the establishment of the Reserve Bank of New Zealand on 1 August 1934, was £125 (selling) and £124 10s. (buying) New Zealand = £100 London for telegraphic transfers.
From 1 August 1934 Reserve Bank quotations for £100 sterling for immediate delivery in London were: buying rate, £124, selling rate, £125. It was intimated that the policy of the Bank would aim at retaining these rates unchanged for a long period unless there occurred marked changes in existing conditions. While prepared to fulfil its statutory obligations, the Reserve Bank did not desire to compete for exchange business, provided adequate facilities were available elsewhere.
Following the statement of the Reserve Bank's policy, the trading banks adopted as from 1 August 1934 a scale of rates representing a reduction of 10s. per £100 on the rates ruling from 20 January 1933 to 31 July 1934. The rates were slightly changed on 21 October 1938, and further changes were made in the selling rates as from 1 December 1943 and in the buying rate as from 6 November 1940. During the year 1945-46 the Reserve Bank agreed to certain alterations in the trading banks' on-demand and usance rates.
The position was materially altered as from 20 August 1948, following the announcement by the Government on the previous night of the appreciation of New Zealand currency to parity with sterling. The Reserve Bank quotations from 20 August 1948 for £100 sterling for immediate deliver in London were: buying rate, £100; selling rate, £101 Consequential adjustments to the scale of rates of trading banks in New Zealand were also made. The quotations current for New Zealand on London at the end of March 1967 are given in the following table. On-demand and usance buying rates change with changes in the Bank of England discount rate.
| Category | Buying (on Basis of £(Stg.)100) | Selling (on Basis of £(Stg.)100) | |
| Telegraphic transfers (cable) | £(N.Z.)100 7s. 6d. | £(N.Z.)101 0s. 0d. | |
| Sterling notes | £(N.Z.) 97 10s. 3d. | £(N.Z.)101 0s. 0d. | |
| Air Mail | Sea Mail | Air and Sea Mail | |
| Bills, cheques, and drafts payable on demand | £(N.Z.)99 17s. 6d. | £(N.Z.)99 5s. 0d. | £(N.Z.)101 0s. 0d. |
| Bills or drafts 3 days sight | £(N.Z.)99 15s. 6d. | £(N.Z.)99 3s. 0d. | No quotation |
| Bills or drafts 30 days sight | £(N.Z.)99 6s. 6d. | £(N.Z.)98 14s. 0d. | £(100N.Z.) 19s. 3d. |
| Bills or drafts 60 days sight | £(N.Z.)98 16s. 9d. | £(N.Z.)98 4s. 3d. | £(N.Z.)100 18s. 6d. |
| Bills or drafts 90 days sight | £(N.Z.)98 16s. 9d. | £(N.Z.)97 14s. 3d. | £(N.Z.)100 17s. 6d. |
| Bills or drafts 120 days sight | £(N.Z.)97 17s. 0d. | £(N.Z.)97 4s. 6d. | No quotation |
On the occasion of the devaluation of sterling in terms of gold and the United States of America dollar in September 1949 it was decided that New Zealand should maintain the value of its currency at parity with sterling.
As most of the export credits in normal times are utilised for financing imports it is advisable to note that the full exchange rate is not operative in respect of dutiable goods. This arises from the fact that, although Customs duties are assessed in sterling, payment of Customs duties are accepted in New Zealand currency without addition of exchange.
New Zealand Exchange Rates with Other Currencies—The change in the sterling-dollar parity was followed by a change in the, dollar value of a large number of currencies. Some countries maintained the sterling value of their currencies, others maintained the dollar value, and others again altered the exchange value of their currencies in relation to both sterling and the United States of America dollar. In the latter cases there was a consequent alteration in the rate at which New Zealand currency was exchangeable for the currency of the country concerned.
The following table shows exchange rates (since 17 December 1951 the exchange rates have been free to fluctuate within certain limits) for telegraphic transfers quoted by the New Zealand trading banks for various currencies.
| New Zealand on | At 29 March 1966 | At 29 March 1967 | ||
|---|---|---|---|---|
| Buying | Selling | Buying | Selling | |
| United States of America (dollars per £(N.Z.)) | 2.7885 | 2.7570 | 2.7939 | 2.7623 |
| Canada (dollars per £(N.Z.)) | 3.0028 | 2.9644 | 3.0210 | 2.9824 |
| France (francs per £(N.Z.)) | 13.74 | 13.45 | 13.91 | 13.61 |
| Belgium (francs per £(N.Z.)) | 139.60 | 136.60 | 139.60 | 136.60 |
| Switzerland (francs per £(N.Z.)) | 12.17 | 11.91 | 12.18 | 11.91 |
| Pakistan (N.Z. pence per rupee) | 13.406 | 13.080 | 13.406 | 13.080 |
The rates applicable for telegraphic transfer to Australia from 14 February 1967 are $A2,4908 buying and $A2,4800 selling per N.Z.$2.
OVERSEAS RESERVES—The trading banks are required to supply returns to the Reserve Bank at monthly intervals, showing among other things overseas assets held and liabilities incurred on account of New Zealand business.
The figures for net overseas assets in the following table include, in addition to sterling exchange, the Reserve Bank holdings of foreign exchange and overseas investments, less its liabilities in other currencies.
| As at | Overseas Assets and Liabilities of Banks (On Account of New Zealand Business only) | Treasury-held Overseas Securities | ||||||
|---|---|---|---|---|---|---|---|---|
| Trading Banks Overseas Assets | Reserve Bank's Overseas Assets | Gross Overseas Assets | Overseas Liabilities of | Net Overseas Assets of Banks | ||||
| Short-term* | Investments | Trading Batiks | Reserve Bank | |||||
* Current accounts and short-term bills. †After 31 March 1964 excludes overseas securities held by Earthquake and War Damage Fund, as the fund is now outside the Public Account, these securities were valued at $12.4 million at the time of their exclusion. ‡From April 1965 an equal amount of assets and liabilities not attributable to New Zealand business has been deleted from both gross assets and liabilities. The net figures are, however, still comparable with earlier figures. §Includes £ stg 10 million under stand-by arrangement with the Midland Bank Limited, England. | ||||||||
| $N.Z.(million) | ||||||||
| End of June | ||||||||
| 1956 | 51.2 | 103.4 | 56.6 | 211.2 | 11.8 | - | 199.3 | .. |
| 1957 | 70.6 | 110.0 | 56.4 | 237.2 | 11.0 | - | 226.1 | .. |
| 1958 | 50.0 | 45.4 | 29.0 | 124.4 | 18.6 | - | 105.8 | 55.2 |
| 1959 | 59.8 | 125.6 | 28.2 | 213.8 | 12.2 | 0.2 | 201.4 | 59.8 |
| 1960 | 61.6 | 134.2 | 53.8 | 249.8 | 12.0 | 0.4 | 237.5 | 90.9 |
| 1961 | 56.2 | 26.8 | 64.4 | 147.4 | 23.0 | 0.4 | 124.1 | 80.3 |
| 1962 | 53.6 | 63.2 | 47.8 | 164.4 | 17.4 | 0.2 | 146.7 | 67.4 |
| 1963 | 61.0 | 103.6 | 43.0 | 207.6 | 16.0 | 0.2 | 191.4 | 60.7 |
| 1964 | 67.2 | 104.1 | 50.2 | 221.4 | 19.0 | 0.2 | 202.3 | 65.0† |
| 1965 | 44.2† | 80.4 | 49.0 | 173.6 | 12.8‡ | 0.2 | 160.8 | 67.9 |
| 1966 | 50.9 | 54.5 | 26.4 | 131.8 | 8.2 | - | 123.5 | 61.7 |
| End of December | ||||||||
| 1956 | 50.2 | 58.2 | 57.4 | 165.8 | 12.2 | 0.4 | 153.0 | .. |
| 1957 | 41.0 | 22.4 | 52.2 | 115.4 | 24.4 | - | 90.9 | .. |
| 1958 | 33.2 | 81.4 | 28.2 | 142.8 | 17.8 | 14.8 | 110.2 | 58.9 |
| 1959 | 61.6 | 102.0 | 28.4 | 192.0 | 17.0 | - | 175.1 | 81.8 |
| 1960 | 44.0 | 38.2 | 63.4 | 145.4 | 13.4 | - | 131.9 | 81.4 |
| 1961 | 46.8 | 29.4 | 38.2 | 114.4 | 15.8 | 0.4 | 98.2 | 43.2 |
| 1962 | 41.6 | 62.8 | 34.8 | 139.4 | 16.0 | 0.2 | 123.2 | 68.5 |
| 1963 | 57.8 | 31.8 | 48.4 | 137.8 | 17.0 | - | 120.8 | 62.0 |
| 1964 | 50.0 | 55.8 | 40.6 | 146.6 | 18.4 | 0.4 | 127.8 | 66.5† |
| 1965 | 43.8‡ | 23.0 | 46.6 | 113.4 | 10.4‡ | 0.4 | 102.6 | 54.8 |
| 1966 | 34.8 | 37.2 | 31.1 | 103.1 | 12.0 | 0.5 | 90.6§ | 60.5 |
A greater volume of imports associated with reduced export prices for dairy produce brought net overseas assets of banks in December 1957 to their lowest December figure since 1902.
The overseas assets were supplemented in 1958 by Government borrowing overseas. The volume of imports was reduced by over 3 percent at prices comparable with 1957, whilst the volume of exports increased by 6 percent but at prices 15 percent lower than in 1957. There was thus a deterioration of 15 percent in New Zealand's terms of trade. A substantial improvement in the terms of trade occurred in 1959, as well as another significant increase in the volume of exports. There was also a marked fall in the volume of imports as a result of import control and reduced domestic demand. These factors were the main causes of a 73 percent rise in the overseas assets of the banking system. The rise would have been greater had not the Government repaid $7.2 million in respect of one of the short-term loans raised in 1958, and invested $24.0 million (net) overseas. In 1960 higher payments for private imports and a slight decrease in export receipts resulted in overseas assets dropping from $175 million at the end of 1959 to $132 million at the end of 1960. This pattern was repeated in 1961 and overseas assets dropped to $98 million by the end of 1961. The controlled reduction of private imports and an increase in export receipts led to a recovery to $123.2 million by the end of 1962. The level had receded a little to $120.8 million at the end of 1963. The increase of $73.3 million in export receipts in 1964 was greater than the combined increase in payments for imports and in the net deficit on invisible transactions. Thus despite a lower level of capital inflow the net overseas assets of the banking system rose by $7 million to $127.8 million. In 1965 export receipts fell by $20.7 million, mainly as a result of a fall in wool prices, payments for imports continued to rise, and there was a further increase in the net deficit on invisible transactions. Most of the resultant current account deficit of $96.0 million was financed by an inflow of official capital, including the first drawing of $44.6 million from the International Monetary Fund, and, in addition, there was a reduction of $25.2 million in the net overseas assets.
During 1966 export receipts increased by $54.9 million, while the deficit on invisible transactions increased by $24.7 million. A capital account surplus of $71.5 million financed most of the current account deficit, the balance being absorbed by a drop of $12 million in the net overseas assets. The capital inflow included an additional $5.8 million from the International Monetary Fund and $24.0 million from the Reserve Bank of Australia.
The following diagram shows the overseas reserves, the first portion showing the figures as at the end of December and the second portion those as at the end of June in each year quoted.
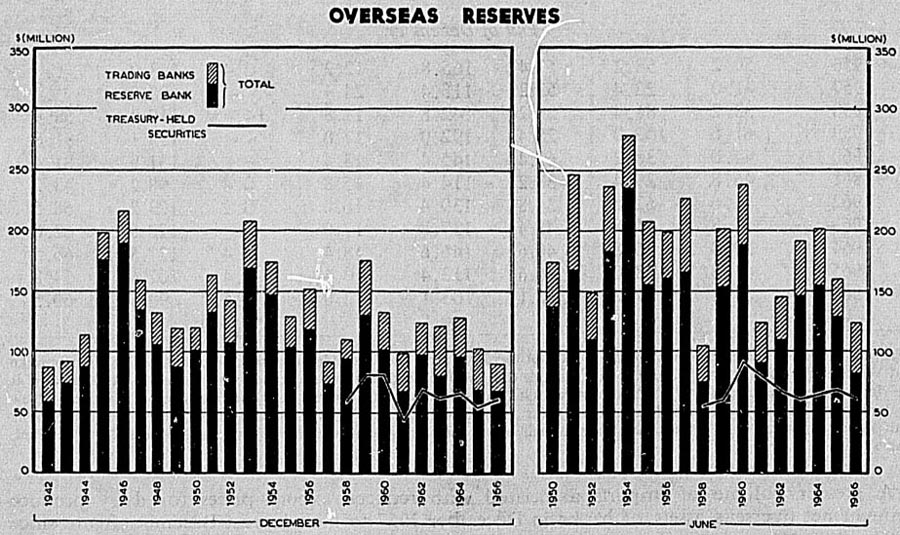
OVERSEAS EXCHANGE TRANSACTIONS—Statistics of overseas exchange transactions include transactions both through the banking system and through the Government's overseas accounts. A full classification of overseas exchange transactions for the two latest calendar years is now given.
| OVERSEAS EXCHANGE TRANSACTIONS | ||||||
|---|---|---|---|---|---|---|
| Item | 1965 | 1966 | ||||
| U.K. | Other Countries | Total | U.K. | Other Countries | Total | |
| NOTE—Minus sign (-) denotes a deficit. | ||||||
| $N.Z.(million) | ||||||
| Receipts | ||||||
| Exports— | ||||||
| Butter | 99.6 | 12.2 | 111.8 | 97.6 | 13.7 | 111.3 |
| Cheese | 38.4 | 7.4 | 45.9 | 37.2 | 13.6 | 50.8 |
| Meat | 143.8 | 73.2 | 216.9 | 124.2 | 88.0 | 212.2 |
| Wool | 55.1 | 167.9 | 222.9 | 56.4 | 190.4 | 246.8 |
| Other | 41.5 | 126.2 | 167.7 | 42.7 | 156.5 | 199.2 |
| Totals, export receipts | 378.5 | 386.9 | 765.4 | 358.1 | 462.2 | 820.3 |
| Cook Island Exports | - | 0.1 | 0.1 | - | - | - |
| Transport | 7.2 | 8.1 | 15.3 | 7.2 | 9.9 | 17.0 |
| Insurance | 1.7 | 1.4 | 3.1 | 2.1 | 1.7 | 3.8 |
| Travel (excluding fares) | 3.3 | 10.0 | 13.3 | 3.3 | 11.2 | 14.5 |
| International investment income— | ||||||
| Interest and dividends | 9.4 | 2.4 | 11.9 | 8.3 | 1.7 | 10.0 |
| Other investment income | 1.4 | 1.4 | 2.7 | 1.1 | 0.7 | 1.7 |
| New Zealand Government receipts and expenditure by other Governments in New Zealand | 2.1 | 3.3 | 5.4 | 2.3 | 2.4 | 4.7 |
| Miscellaneous— | ||||||
| Commissions, royalties | 2.3 | 2.3 | 4.6 | 4.0 | 2.8 | 6.7 |
| Expenses of business firms | 0.8 | 1.6 | 2.4 | 0.8 | 1.8 | 2.6 |
| Personal receipts, legacies and immigrants' transfers | 14.2 | 8.8 | 22.9 | 16.3 | 9.4 | 25.7 |
| Other current transactions | 1.0 | 1.7 | 2.6 | 1.1 | 2.6 | 3.7 |
| Totals, current | 421.9 | 428.0 | 849.9 | 404.6 | 506.3 | 910.9 |
| Capital transfers— | ||||||
| Private | 10.9 | 11.6 | 22.6 | 12.2 | 13.2 | 25.4 |
| Government | 59.7 | 34.2 | 93.9 | 70.0 | 37.4 | 107.4 |
| I.M.F. drawing | - | 44.6 | 44.6 | - | 5.8 | 5.8 |
| Other official borrowing | - | - | - | - | 24.0 | 24.0 |
| Total, capital | 70.7 | 90.4 | 161.0 | 82.2 | 80.4 | 162.6 |
| Grand totals, receipts | 492.6 | 518.4 | 1,011.0 | 486.8 | 586.7 | 1,073.5 |
| Payments | ||||||
| Current items— | ||||||
| Imports— | ||||||
| Private | 331.3 | 312.5 | 643.8 | 335.1 | 326.4 | 661.4 |
| Government | 41.7 | 30.6 | 72.3 | 39.3 | 36.2 | 75.5 |
| Totals, import payments | 373.0 | 343.2 | 716.2 | 374.3 | 362.6 | 736.9 |
| Cook Islands Imports | 0.1 | 0.4 | 0.5 | 0.2 | 0.3 | 0.5 |
| Transport | 35.0 | 4.6 | 39.6 | 37.3 | 6.7 | 44.0 |
| Insurance— | ||||||
| Premiums | 1.2 | 0.1 | 1.3 | 1.4 | 0.2 | 1.6 |
| Claims | 0.1 | 0.2 | 0.3 | 0.2 | 0.3 | 0.5 |
| Other transfers | 4.9 | 1.0 | 5.9 | 4.9 | 0.8 | 5.7 |
| Travel (excluding fares) | 16.3 | 24.1 | 40.4 | 17.9 | 26.6 | 44.5 |
| International investment income— | ||||||
| Private | 16.7 | 16.1 | 32.8 | 15.6 | 18.4 | 34.1 |
| Government interest | 12.7 | 2.9 | 15.6 | 12.4 | 5.6 | 18.1 |
| Local authority interest | - | - | - | - | - | - |
| Government expenditure overseas | 8.3 | 15.8 | 24.1 | 11.5 | 19.3 | 30.8 |
| Miscellaneous— | ||||||
| Commissions, royalties, and rebates | 3.4 | 5.6 | 9.0 | 3.4 | 6.9 | 10.2 |
| Expenses of business firms | 10.4 | 7.1 | 17.5 | 13.2 | 10.2 | 23.4 |
| Film hire and entertainment | 0.2 | 2.3 | 2.5 | 0.3 | 2.1 | 2.4 |
| Religious and charitable | 1.4 | 3.3 | 4.7 | 1.3 | 3.3 | 4.6 |
| Personal remittances, legacies, and emigrant's transfers | 8.5 | 12.9 | 21.4 | 8.5 | 14.6 | 23.1 |
| Transfers by temporary residents | 3.4 | 6.0 | 9.4 | 3.6 | 8.0 | 11.7 |
| Other current transactions | 1.2 | 3.2 | 4.4 | 1.5 | 3.9 | 5.4 |
| Totals, current | 497.1 | 448.9 | 945.9 | 507.6 | 489.9 | 997.5 |
| Capital transfers— | ||||||
| Private | 10.1 | 16.6 | 26.7 | 11.4 | 13.8 | 25.2 |
| Government | 58.6 | 4.2 | 62.8 | 55.8 | 10.2 | 65.9 |
| Local authority | - | - | - | - | - | - |
| Totals, capital | 68.6 | 20.8 | 89.4 | 67.2 | 23.9 | 91.1 |
| Grand totals, payments | 565.7 | 469.7 | 1,035.4 | 574.8 | 513.8 | 1,088.6 |
| Surplus of receipts over payments | -73.1 | +48.7 | -24.4 | -88.0 | +72.9 | -15.1 |
The next table gives overseas exchange transactions in summary form for a number of June years, which fit more closely to the farm-production export season than do calendar years. Information for calendar years over a similar period is in the Monthly Abstract of Statistics.
| Item | Year Ended 30 June | |||||
|---|---|---|---|---|---|---|
| 1961 | 1962 | 1963 | 1964 | 1965 | 1966 | |
| * Includes local authority debt repayment. | ||||||
| $N.Z.(million) | ||||||
| Receipts | ||||||
| Exports— | ||||||
| Butter | 80.6 | 86.5 | 103.5 | 113.1 | 111.0 | 106.9 |
| Cheese | 36.7 | 39.8 | 38.5 | 45.2 | 44.2 | 48.5 |
| Meat | 165.2 | 157.6 | 186.1 | 198.4 | 213.0 | 217.4 |
| Wool | 200.0 | 200.8 | 228.9 | 277.3 | 217.3 | 245.6 |
| Other | 105.7 | 102.7 | 114.7 | 139.4 | 158.8 | 184.6 |
| Total exports | 588.2 | 587.4 | 671.7 | 773.4 | 744.2 | 803.1 |
| Other current receipts | 62.5 | 60.1 | 60.6 | 71.7 | 79.8 | 85.2 |
| Total current receipts | 650.7 | 647.5 | 732.4 | 845.1 | 824.0 | 888.3 |
| Capital receipts— | ||||||
| Government— | ||||||
| Reducing assets | 18.0 | 43.2 | 11.6 | 13.7 | 3.1 | 50.9 |
| Increasing liabilities | 16.1 | 53.4 | 19.1 | 30.5 | 16.0 | 57.1 |
| I.M.F. Drawing | - | - | - | - | - | 50.3 |
| Private | 19.0 | 24.0 | 16.8 | 24.7 | 28.5 | 21.5 |
| Total capital receipts | 53.1 | 120.6 | 47.6 | 69.0 | 47.6 | 179.8 |
| Total receipts | 703.8 | 768.1 | 780.0 | 914.1 | 871.6 | 1068.1 |
| Payments | ||||||
| Imports— | ||||||
| Government | 51.1 | 48.8 | 51.0 | 58.3 | 65.6 | 74.6 |
| Private | 575.0 | 467.9 | 494.6 | 586.4 | 595.8 | 679.3 |
| Total imports | 626.1 | 316.7 | 545.7 | 644.7 | 661.5 | 753.9 |
| Other current payments— | ||||||
| Government | 32.2 | 35.8 | 35.1 | 39.9 | 40.1 | 47.4 |
| Private | 126.3 | 132.3 | 140.4 | 156.6 | 176.7 | 195.4 |
| Total current payments | 784.7 | 684.7 | 721.2 | 841.2 | 878.2 | 996.7 |
| Capital payments— | ||||||
| Government— | ||||||
| Increasing assets | 7.6 | 34.9 | 5.3 | 30.5 | 7.3 | 46.4 |
| Reduced liabilities | 13.9 | 23.0 | 1.5 | 18.4 | 3.7 | 37.4 |
| Private* | 12.9 | 11.7 | 10.0 | 15.1 | 26.7 | 25.5 |
| Total capital payments | 34.3 | 69.5 | 16.9 | 64.0 | 37.7 | 109.3 |
| Total payments | 818.9 | 754.2 | 738.0 | 905.2 | 916.0 | 1106.0 |
| Balance on trade transactions | - 38.0 | + 70.8 | + 126.1 | +128.7 | + 82.8 | + 49.2 |
| Balance on current account invisible transactions | - 96.0 | -108.0 | -114.9 | -124.8 | -137.0 | -157.5 |
| Balance on current account | -134.0 | - 37.2 | + 11.2 | + 3.9 | - 54.3 | -108.4 |
| Balance on capital account | + 18.8 | + 51.1 | + 30.7 | + 5.0 | + 9.9 | + 70.5 |
| Overall balance | -115.2 | + 13.9 | + 41.9 | + 8.9 | - 44.4 | - 37.9 |
| Exchange valuation differences, timing differences and omissions, etc. | + 1.8 | + 8.8 | + 2.8 | + 2.0 | + 2.9 | + 0.7 |
| Change in net overseas assets of the banking system | -113.4 | + 22.7 | + 44.7 | + 10.9 | - 41.5 | - 37.2 |
Overseas Travel Allowances— The Reserve Bank controls the allocation of funds to New Zealand residents for overseas travel, whether for business or non-business purposes.
Since 1958 there have been restrictions on the amount of travel funds made available for non-business purposes, and from July 1961 the limit has been $1,200 for travellers who have not received an allocation for pleasure travel during the previous five years.
Exchange Allocation Scheme—In order to assist in measures for strengthening the sterling area reserves and the balance of payments generally, the Government of New Zealand in March 1952 made certain decisions designed to ensure an improvement in New Zealand's overall balance of payments.
Except with the approval of the Reserve Bank, trading banks were advised not to sell to any importer during 1952 more than 80 percent of the 1950 amount of exchange sold to him. This amount was the importer's basic allocation, and where foreign exchange in excess of this basic allocation was required application was to be made to the Reserve Bank.
This was followed in August 1952 by a decision to retain the existing exchange allocation scheme, with modifications, in 1953. With the high level of demand for exchange still continuing and the need to maintain reserves to provide a reasonable margin for contingencies in view of the 1952 deficit in overseas receipts over payments, the Reserve Bank was not prepared to draw further on reserves. Accordingly, except with the approval of the Reserve Bank, trading banks were advised not to sell to any importer during the whole of 1953 more than 40 percent of the amount of exchange sold in 1950 to that importer for non-Government imports other than motor vehicles, and goods paid for under third-party certificates received from other licensed importers. This procedure provided, as formerly, for the basic allocations of exchange, and where importers required more than this quota they could make application to the Reserve Bank.
In July 1953 the Reserve Bank announced that, because of the high level of demand for overseas exchange to pay for imports, the exchange allocation scheme inaugurated in April 1952 would be continued in 1954. An important modification of the scheme was the announcement of a list of goods, payment for which would not require the authority of an exchange allocation. The trading banks were advised that, without the approval of the Reserve Bank and excepting payment for goods classed as “released items”, they were not to sell to any importer in 1954 more than 50 percent (increased in November 1953 to 75 percent) of the exchange sold in 1950 to that importer for non-Government imports other than motor vehicles, paid for under third-party certificates received, and goods which in 1954 would be classed as “released items”. This procedure provided, as formerly, for basic allocations of exchange, and where importers required more than this quota they could make application to the Reserve Bank.
The Prime Minister announced on 22 July 1954 that the exchange allocation system introduced in August 1952 was to be terminated as from 1 January 1955. Following this statement, the Reserve Bank made certain relaxations for the remainder of the 1954 year (e.g., additional allocations already granted could be used to pay for items mentioned in the application instead of only those items specifically detailed in the approval, and could be used at any time during the rest of 1954), while allocations made up to termination date would not be linked to tariff items.
The Prime Minister announced on 1 January 1958 that a policy of overall import licensing would be instituted immediately. The new measures were designed to meet the deterioration in overseas reserves, which fell to $91 million on 25 December 1957. Under the new policy overseas funds would be allocated to meet all basic needs for imported foodstuffs and as far as possible factories would get raw materials to the full amount required.
On 2 January 1958 the Minister of Customs gave details of the new policy and stated that, as from 1 January 1958, all imports, apart from a few necessary exceptions, would require licences. The former Import Licensing Schedule for 1958, released in August 1957, was withdrawn and a new schedule made available in its place.
Although the overseas exchange position improved during 1958 and 1959, the improvement was not sufficient to justify any major relaxations of exchange control policy. The Import Licensing Schedule for 1960 provided for a much higher value of imports than was permitted in 1958 and 1959, and the 1961 Schedule provided for another easing of the import licensing allocations. In 1961 the reserves of overseas exchange fell to a dangerously low level, and the Government adopted restrictive measures for imports and extended the 1961 licensing period to 30 June 1962. For the period 1 July 1962 to 30 June 1963 the Government provided licences at a level to allow an expenditure of $500 million for private import payments. Some overseas borrowing was necessary to sustain that level. Licences for a similar level of private import payments were provided for 1963-64 and 1964-65. There was some relaxation of import licence control in 1965-66; trading banks were enjoined to keep a strict eye on importers' exchange applications, but this did not prevent a substantial rise in import payments.
Exchange Control—Although exchange-control approval is required for all overseas remittances it is not practicable to curtail payments, other than for imports, to any significant extent by a more restrictive exchange-control policy, as they are predominantly legitimate commercial transactions of a contractual nature. Here variations of polity have to be virtually confined to personal remittances and to travel expenditure. Transactions affecting overseas exchange are governed by the Exchange Control Regulations 1965, made under the Reserve Bank of New Zealand Act 1964 and gazetted on 16 September 1965. The degree of control existing under preceding regulations was not greatly changed. The exemption in respect of dealings in sterling area currencies and securities in the hands of New Zealand residents was continued by the Exchange Control Exemption Notice 1965 issued at the same time as the latest regulations.
Certain new measures in exchange control and related fields were introduced by the Minister of Finance in the Budget of 16 June 1966.
(a) Sterling Area Securities and Currencies: The facility previously available to New Zealand residents to sell overseas sterling area securities or currencies for New Zealand currency or other assets in New Zealand was withdrawn. These securities may now be sold only for other sterling area securities or for sterling area currencies. Therefore, if a New Zealand resident seeks cash in New Zealand for his sterling area securities the only avenue available at law is to sell overseas and transfer the proceeds to New Zealand through the banking system.
This measure, in effect, closed the market in sterling area securities in exchange for New Zealand currency. A limited market has since been re-opened (see (f) below).
The position regarding non-sterling securities and currencies remains unchanged—they may not be dealt with in any way without the consent of the Reserve Bank, except for the transfer of currency to New Zealand through the banking system.
(b) Export and Import of New Zealand Notes: Although for many years the export of New Zealand notes had been prohibited, except for small amounts that travellers were allowed to take out, the import of New Zealand notes had not been controlled. A limit was set in June 1966 on the export of notes at $10 for all travellers, regardless of destination.
The importation of New Zealand money (including postal notes, money orders, cheques, and promissory notes, but excluding travellers' cheques) was also prohibited, except that travellers to New Zealand could bring in with them up to $10 in New Zealand notes.
(c) Supervision of Non-Residents' Accounts in New Zealand: The Reserve Bank was given power to exercise supervision over specific accounts in New Zealand of non-residents, with banks or elsewhere. The following accounts were initially declared to be controlled accounts:
a) Those of non-resident banks;
(b) those of non-resident agencies:
(c) a group of seven individual accounts connected with international currency dealers.
A subsequent notice to banks had the effect of bringing under control any accounts for the credit to which New Zealand money was received from overseas without the consent of the Reserve Bank. No change of policy was involved, this being a technical measure to ensure that transfers of funds outside the banking system were not facilitated by the operation of New Zealand accounts.
(d) London-domiciled New Zealand Government Stock: Since 1920 New Zealand residents have been permitted to transfer holdings of London-domiciled New Zealand stock to the New Zealand register, a facility which provided a moans of transferring funds to New Zealand outside the banking system. The volume of such transactions had in recent years become excessive, particularly in the present strained overseas reserves situation; the following conditions were therefore applied to transfers to the New Zealand register:
(a) stock must have been registered in the applicant's name for at least six months;
(b) after stock has been transferred to the New Zealand register it may not be sold for six months.
(e) Capital Issues Control: Formerly control over capital issues applied only to overseas companies wishing to start business in New Zealand, and to borrowing overseas by New Zealand companies. Amended regulations provide that any borrowing in New Zealand of $10,000 or more in any 12-month period by subsidiaries and branches of overseas companies now requires the consent of the Minister of Finance; this was necessary to prevent undue pressure on the New Zealand capital market. The regulations exempt bank advances from control in order to allow the day-to-day financial needs of the companies to be met without formality. However, requests for higher overdraft limits or term loans by these companies (other than limits for seasonal or short-term purposes) are subject to Reserve Bank approval.
(f) Limited Market in Overseas Sterling Area Securities: In September 1966 the Minister of Finance announced a scheme to re-open a limited market in overseas sterling area securities in exchange for New Zealand currency. Trading was confined to New Zealand residents, and to securities which were registered in the names of New Zealand residents on 16 June 1966. All dealings must be effected through a member of a New Zealand stock exchange, and both seller and purchaser must supply details of the transaction to an Approved Depository, with whom the scrip must be lodged. Securities so purchased may be sold for New Zealand currency under the same conditions, or sold for overseas currency through a member of a New Zealand stock exchange, provided the proceeds are either remitted to New Zealand or re-invested in similar securities within one month. The new scrip must also be lodged with an approved depository. The approved depositories are the Reserve Bank in Wellington and its branches in Auckland and Christchurch and the Bank of New South Wales (in respect of its own shares only). Up to 31 March 1967 some 2,450 transactions involving approximately 660,000 shares had taken place under these arrangements.
Administrative details on import and export control and exchange allocation are set out in Section 22A.
ROYAL COMMISSION ON MONETARY, BANKING, AND CREDIT SYSTEMS—The report of the Royal Commission, which was released in April 1956 (as parliamentary paper B.3, 1956) gives a general background on the monetary, banking, and credit systems of New Zealand. The Royal Commission examined and reported on these systems and made recommendations within its order of reference which had the stated objectives of fostering a greater degree of stability in prices, maintaining full employment of labour, ensuring the healthy development of natural resources, and promoting generally the economic, financial, and social welfare of the people.
Section 4 of the report outlines the history of monetary, banking, and credit systems from 1934 to 1955. As recommended by the Royal Commission, New Zealand has joined the International Monetary Fund, a Monetary and Economic Council has been established, and the Reserve Bank of New Zealand Act has been amended to give the Government full and final responsibility for decisions on monetary policy. (A summary of the report was given as Appendix (d) of the 1956 issue of the Yearbook.)
INTERNATIONAL MONETARY FUND, INTERNATIONAL BANK FOR RECONSTRUCTION AND DEVELOPMENT, AND INTERNATIONAL FINANCE CORPORATION—New Zealand became a member of these three organisations on 31 August 1961 under the International Finance Agreements Act 1961. The organisations are specialised agencies of the United Nations, and their objectives and the implications of New Zealand membership are set out in parliamentary paper A.12, 1961. One of the purposes of the International Monetary Fund is to give confidence to members by making the Fund's resources available to them under adequate safeguards, thus providing them with opportunity to correct maladjustments in their balance of payments without resorting to measures destructive of national or international prosperity. By paying in some gold and the balance of its fund quota in its own currency a member is able to draw against its gold for a nominal cost. New Zealand's fund quota was increased in March 1966, with the result that drawing rights have risen to a maximum of $141.1 million.
The International Bank for Reconstruction and Development (World Bank) is designed to promote the international flow of capital for productive purposes and to assist in financing the development of the resources of its member countries.
New Zealand paid $24.4 million in gold and $1.0 million in New Zealand currency to join the three agencies, and in addition $77.2 million of non-negotiable non-interest bearing bonds were lodged with the Reserve Bank of New Zealand.
The World Bank made a loan of $5.6 million to New Zealand in November 1963. The loan is for a term of 25 years and bears interest at 5 1/2 percent, including the 1 percent commission which is allocated to the Bank's special reserve. It has assisted in financing improvements at the ports of Auckland, Lyttelton, Napier, Timaru, and Whangarei, and applied to the overseas-currency content of capital works. A loan of $23.4 million was received for the Cook Strait electricity cable project. These loan agreements are set out in parliamentary papers A. 21 and A. 23, 1964.
In December 1965 the World Bank agreed to lend $30.2 million for railways modernisation and $14.7 million for power development. The railways loan is being used to buy additional diesel locomotives and rolling stock, while part was used to pay for the second rail-road ferry Aranui. The electricity development loan is being used to meet the overseas costs in the building of the thermal power station at Marsden Point, Whangarei. The term of the loans is 15 years with interest at 6 1/4 percent.
In November 1965 the International Monetary Fund agreed to a drawing by New Zealand of $44.6 million to help finance a current account balance of payments deficit and support the Government's import liberalisation policy. The loan was used to augment external reserves. No interest is payable on $22.5 million drawn against New Zealand gold held by the Fund, but the balance of the money bears a charge ranging from 2 percent at three months to 3 1/2 percent on the balance outstanding after two and a half years. There was a single service charge of 1/2 percent on the whole transaction. Repayment is normally expected by the Fund within three to five years.
In March 1966 New Zealand drew a further $5.8 million from the International Monetary Fund to meet the gold payment due on its increased subscription to the Fund following general agreement by members to increase all quotas in the Fund by 25 percent. This brought the total New Zealand drawings to $50.3 million of which $22.2 million is subject to the graduated scale of charges mentioned above.
ASIAN DEVELOPMENT BANK—New Zealand is participating in the Asian Development Bank whose main objective is to accelerate the economic development of the ECAFE region. New Zealand's contribution will be $U.S. 22.56 million, or just over $N.Z. 16 million. Half the capital stock is being paid up. Half of the $N.Z.8 million which will thus be payable will be paid in convertible currency and half in New Zealand currency. The cost in overseas funds will therefore be about $800,000 a year over five years from 1966. The local currency portion is restricted to payments for goods and services produced in New Zealand.
MONETARY AND ECONOMIC COUNCIL—In 1961, in line with a recommendation of the Royal Commission on Monetary, Banking, and Credit Systems, there was established a Monetary and Economic Council whose principal functions are to report from time to time on the extent to which stability in the prices of goods and services, economic growth, full employment, and higher standards of living are being achieved, and to make recommendations as to measures that should be taken to promote such developments. Among other matters, the Council is required to consider the provision of finance for the expansion of primary and secondary industries and of services, and the ensuring of a balanced relationship between the creation and issue of money and the production and provision of goods and services. A series of reports have been made to the Government and have been published.
DEVELOPMENT FINANCE CORPORATION—The Development Finance Corporation of New Zealand with the general function of assisting in the financing of new or expanding industries was set up under the Development Finance Corporation Act 1964. The Act provides for a share capital of $4 million. Of the $2 million that has been issued, 30 percent has been taken up by the Reserve Bank and the remainder by the financial institutions such as trading banks and insurance offices. The objective of the Corporation is to supplement, and not compete with, existing financial services. Proposals are supported only where they have significant development features, such as increased productivity. Encouragement is given to the establishment or expansion of industries in areas where that will assist the development of those areas and benefit the economy as a whole.
Table of Contents
MORTGAGE LAW—The borrowing of money on mortgage is a principal means of financing the erection or purchase of houses and commercial buildings, and the purchase of farms. Under the Land Transfer Act 1952 “mortgage” means and includes any charge on land crested under the provisions of that Act for securing:
The repayment of a loan or satisfaction of an existing debt.
The repayment of future advances, or payment or satisfaction of any future or unascertained debt or liability, contingent or otherwise.
The payment to the holders for the time being of any bonds, debentures, promissory notes, or other securities, negotiable or otherwise, made or issued by the mortgagor before or after the creation of such charge.
The payment to any person or persons by yearly or periodical payments or otherwise of an annuity, rent charge, or sum of money other than a debt.
Where the ownership of land is registered under the Land Transfer Act (as, see Section 10A, the great majority of land titles now are) mortgages on that land are granted by virtue of the provisions of that Act; they take effect as securities and do not operate as transfers of the estate or interest charged. In the case of other land or property a mortgage is granted under what is known as the deeds or deeds-registration system; the mortgage in this instance operating as a conveyance or assignment of the land or property mortgaged, for the mortgagee becomes the registered proprietor of the land, subject to the right of the mortgagor to have the property reregistered in his name on the discharge of his obligations under the mortgage. Although in form a mortgage under the deeds system is a conveyance, in equity it is treated as merely a charge on the land.
SUMMARY OF MORTGAGES REGISTERED AND DISCHARGED—A table is given showing the net numbers and amounts represented by mortgages registered and discharged during each of the last 21 years. The average rate of interest on new mortgages is also given.
| Year Ended 31 March | Mortgages Registered | Average Rate of Interest on New Mortgages Registered | Mortgages Discharged | ||
|---|---|---|---|---|---|
| Number | Amount | Number | Amount | ||
| *Includes a small number of duplicate registrations. | |||||
| $(m) | Percent | $(m) | |||
| 1946 | 24,516 | 45.0 | 4.10 | 29,174 | 46.6 |
| 1947 | 29,882 | 62.2 | 3.85 | 32,234 | 51.9 |
| 1948 | 29,893 | 64.1 | 3.90 | 29,002 | 50.8 |
| 1949 | 29,578 | 70.6 | 3.98 | 26,642 | 46.8 |
| 1950 | 30,352 | 72.0 | 3.99 | 26,093 | 46.2 |
| 1951 | 43,875 | 91.6 | 4.09 | 35,503 | 64.5 |
| 1952 | 49,840 | 135.9 | 4.15 | 37,926 | 74.5 |
| 1953 | 50,633 | 147.4 | 4.29 | 34,160 | 62.8 |
| 1954 | 52,807 | 140.8 | 4.49 | 36,728 | 72.0 |
| 1955 | 57,992 | 169.2 | 4.69 | 37,931 | 82.3 |
| 1956 | 55,544 | 192.5 | 4.76 | 34,078 | 70.7 |
| 1957 | 51,230 | 182.4 | 5.09 | 32,663 | 75.4 |
| 1958 | 55,437 | 199.1 | 5.24 | 37,441 | 92.2 |
| 1959 | 56,195 | 217.1 | 5.15 | 36,920 | 88.8 |
| 1960 | 57,834 | 239.0 | 5.01 | 39,931 | 102.3 |
| 1961 | 64,605 | 300.8 | 5.01 | 46,469 | 136.6 |
| 1962 | 62,501 | 331.5 | 5.27 | 44,494 | 133.8 |
| 1963 | 59,263 | 295.1 | 5.51 | 43,979 | 135.6 |
| 1964 | 63,992 | 339.8 | 5.70 | 49,661 | 168.8 |
| 1965* | 71,531 | 420.0 | 5.78 | 56,262 | 206.8 |
| 1966 | 76,960 | 487.7 | 6.07 | 59,473 | 230.0 |
The figures given in the preceding table have been adjusted to exclude duplicate registrations, i.e., cases in which a mortgage has been registered in more than one district. It should also be noted that the figures include collateral and guarantee mortgages not representing money indebtedness. On the other hand, no amount is shown as secured in a proportion of cases where a mortgage is given in anticipation of advances, etc. In addition there are numbers of privately arranged advances which are not registered, and stock and crop liens, bills of sale, and instruments under the Chattels Transfer Act are not included in the statistics.
Many discharges are not registered, particularly in the case of leaseholds and also of second or other further mortgages when the power of sale has been exercised by the first mortgagee. The figures for discharges are further affected by the high proportion of table mortgages. This is particularly so in cases where the mortgage is approaching maturity, since the whole amount remains on the register until finally discharged, despite the fact that the original amount of indebtedness has been considerably reduced.
MORTGAGES REGISTERED: Value by Districts—The total amount for which mortgages were registered, under the Land Transfer Act, in each registration district is given in the next table.
| District | 1961–62 | 1962–63 | 1963–64 | 1964–65 | 1965–66 |
|---|---|---|---|---|---|
| $ (thousand) | |||||
| North Auckland | 98,134 | 88,552 | 97,454 | 120,286 | 143,125 |
| South Auckland | 49,940 | 42,074 | 49,480 | 63,586 | 71,236 |
| Gisborne | 4,294 | 3,736 | 4,442 | 4,044 | 5,594 |
| Hawke's Bay | 17,364 | 13,210 | 15,464 | 19,706 | 21,932 |
| Taranaki | 12,802 | 11,106 | 10,852 | 13,166 | 16,408 |
| Wellington | 56,866 | 57,762 | 65,180 | 76,804 | 96,690 |
| Marlborough | 3,242 | 3,334 | 3,450 | 4,846 | 4,791 |
| Nelson | 7,232 | 9,288 | 7,768 | 7,792 | 8,578 |
| Westland | 1,098 | 1,256 | 3,126 | 3,244 | 1,513 |
| Canterbury | 47,144 | 41,112 | 40,106 | 53,802 | 62,559 |
| Otago | 22,698 | 22,636 | 22,546 | 30,724 | 27,870 |
| Southland | 16,150 | 14,962 | 20,410 | 22,002 | 27,702 |
| Gross totals | 336,964 | 309,030 | 340,276 | 420,002 | 487,996 |
| Duplications | 5,476 | 13,904 | 518 | 267 | |
| Net totals | 331,488 | 295,128 | 339,758 | 420,002 | 487,729 |
Classification by Amount—The following table shows urban and rural mortgages by amount groups for 1965–66. The different distribution patterns for urban and rural mortgages are due to the different types of property on which the bulk of urban and rural mortgages are raised. Among urban mortgages, $171.4 million out of the aggregate total of $308 million was made up of mortgages from $2,000 to $7,999 with $84.2 million (27.4 percent of the urban total) representing mortgages of $4,000 to $5,999. The bulk of urban mortgages are relatively low advances on house property. Among rural mortgages, on the other hand, $130.0 million out of the aggregate total of $180.0 million represented mortgages of $15,000 and above, mainly representing farms and farm property. Individual mortgages for very large amounts are more usually urban representing commercial or industrial properties in high-priced city areas.
An indication of this is given by the difference between the average amounts involved in urban and rural mortgages of $15,000 and above. For urban mortgages, the average amount for mortgages in this amount group was $41,178; for rural mortgages, it was $28,334.
| Amount Group | Urban | Rural | All Properties | ||||
|---|---|---|---|---|---|---|---|
| Number | Amount | Number | Amount | Number | Amount | Percentage of Amount | |
| $ | $(000) | $(000) | $(000) | ||||
| Under 1,000 | 6,394 | 3,776 | 396 | 228 | 6,790 | 4,003 | 0.82 |
| 1,000– 1,999 | 7,498 | 9,912 | 595 | 791 | 8,093 | 10,703 | 2.19 |
| 2,000– 3,999 | 11,375 | 30,951 | 1,451 | 3,904 | 12,826 | 34,855 | 7.14 |
| 4,000– 5,999 | 17,057 | 84,254 | 1,559 | 7,253 | 18,616 | 91,507 | 18.75 |
| 6,000– 7,999 | 8,734 | 56,159 | 1,140 | 7,393 | 9,874 | 63,551 | 13.02 |
| 8,000– 9,999 | 2,973 | 25,144 | 999 | 8,465 | 3,972 | 33,609 | 6.89 |
| 10,000–14,999 | 2,389 | 27,092 | 1,854 | 21,922 | 4,243 | 49,014 | 10.04 |
| 15,000 and over | 1,717 | 70,701 | 4,590 | 130,052 | 6,307 | 200,753 | 41.14 |
| Unspecified | 4,672 | … | 1,585 | … | 6,257 | … | … |
| Totals | 62,809 | 307,988 | 14,169 | 180,008 | 76,978 | 487,996 | 100.00 |
Excluding mortgages for which no amounts were shown, the average amount for each mortgage registered in 1965–66 was $6,340, as compared with $5,900 in 1964–65.
Mortgages on Urban and Rural Securities—Mortgages are regarded as urban if secured on properties situated within cities or boroughs or on small holdings in the nature of building allotments which are not definitely distinguishable as country properties. New mortgages classified as urban in 1965–66 were secured on areas averaging less than half an acre in extent, as compared with an average of some 319, acres in the case of rural securities. Urban securities accounted for 82 percent of the number and 63 percent of the aggregate value of new mortgages in 1964—65 as compared with 18 percent and 37 percent respectively in the case of rural properties.
The following table shows urban and rural mortgages by land registration district. Auckland urban area, the largest centre of population in New Zealand, is in the North Auckland district.
| Land Registration District | Urban | Rural | ||||
|---|---|---|---|---|---|---|
| Number | Area | Amount | Number | Area | Amount | |
| acres(000) | $(000) | acres(000) | $(000) | |||
| North Auckland | 21,641 | 6,178 | 112,988 | 2,929 | 473 | 30,136 |
| South Auckland | 6,936 | 3,089 | 32,535 | 2,986 | 690 | 38,701 |
| Gisborne | 568 | 208 | 2,661 | 302 | 139 | 2,932 |
| Hawke's Bay | 2,291 | 624 | 11,908 | 675 | 266 | 10,024 |
| Taranaki | 1,290 | 455 | 5,664 | 896 | 262 | 10,744 |
| Wellington | 13,552 | 3,617 | 75,091 | 1,552 | 650 | 21,598 |
| Marlborough | 503 | 6,380 | 2,060 | 286 | 174 | 2,731 |
| Nelson | 1,333 | 610 | 5,433 | 466 | 143 | 3,146 |
| Westland | 296 | 95 | 973 | 84 | 28 | 540 |
| Canterbury | 8,280 | 2,099 | 35,117 | 1,945 | 664 | 27,442 |
| Otago | 4,078 | 1,095 | 14,122 | 967 | 566 | 13,748 |
| Southland | 2,041 | .1,830 | 9,437 | 1,081 | 464 | 18,265 |
| Totals | 62,809 | 26,278 | 307,988 | 14,169 | 4,519 | 180,008 |
Since the Second World War the trend in mortgage registrations has passed through several distinct stages. Prior to the lifting of controls on land sales there was a steady increase in the number of mortgage agreements due in large measure to the resettlement of ex-servicemen. Restrictions were removed from the sale of all lands other than farm lands in February 1950, and farm lands were released in November 1950. Following these changes there was a marked increase in activity during the next two years, and since 1953–54 the level of mortgage business has remained high, and though there has been considerable fluctuation from year to year the general trend has been upward.
| Year Ended 31 March | Registrations | Area | Amount Secured | ||||||
|---|---|---|---|---|---|---|---|---|---|
| Urban | Rural | Total | Urban | Rural | Total | Urban | Rural | Total | |
| acres | acres (000) | acres (000) | $(m) | $(m) | $(m) | ||||
| 1956 | 45,526 | 10,060 | 55,586 | 11,261 | 3,149 | 3,160 | 128.8 | 67.4 | 196.3 |
| 1957 | 41,881 | 9,376 | 51,257 | 10,401 | 2,640 | 2,651 | 117.3 | 65.4 | 182.7 |
| 1958 | 44,813 | 10,655 | 55,468 | 11,251 | 3,194 | 3,206 | 124.6 | 77.1 | 201.7 |
| 1959 | 46,550 | 9,668 | 56,218 | 11,876 | 2,740 | 2,751 | 146.2 | 72.2 | 218.4 |
| 1960 | 47,242 | 10,625 | 57,867 | 11,526 | 2,976 | 2,987 | 158.9 | 83.2 | 242.0 |
| 1961 | 52,549 | 12,088 | 64,637 | 12,894 | 3,685 | 3,698 | 198.2 | 110.0 | 308.1 |
| 1962 | 51,109 | 11,442 | 62,551 | 12,454 | 3,321 | 3,334 | 211.6 | 125.3 | 337.0 |
| 1963 | 48,784 | 10,528 | 39,312 | 12,607 | 3,213 | 3,226 | 205.1 | 103.9 | 309.0 |
| 1964 | 52,613 | 11,408 | 64,021 | 27,706 | 3,683 | 3,711 | 222.9 | 117.4 | 340.3 |
| 1965 | 58,232 | 13,299 | 71,531 | 46,517 | 4,296 | 4,343 | 257.2 | 162.8 | 420.0 |
| 1966 | 62,809 | 14,169 | 76,978 | 26,278 | 4,519 | 4,545 | 308.0 | 180.0 | 488.0 |
NOTE—These figures exclude certain miscellaneous registrations, but have not been adjusted to exclude duplications.
The annual movement in numbers and values of new urban and rural mortgages in recent years is shown on a percentage basis in the following table.
| Year Ended 31 March | Movement in Urban Mortgages | Movement in Rural Mortgages | ||
|---|---|---|---|---|
| Registrations | Amount Secured | Registrations | Amount Secured | |
| Percent | ||||
| 1961 | + 11.2 | +25.0 | + 13.8 | +32.0 |
| 1962 | - 2.7 | + 6.8 | - 5.3 | + 14.0 |
| 1963 | - 4.5 | - 3.1 | - 8.0 | -17.1 |
| 1964 | + 7.8 | + 8.6 | + 8.3 | + 12.9 |
| 1965 | + 10.7 | +15.4 | + 16.6 | +38.7 |
| 1966 | + 7.9 | + 19.8 | + 6.5 | + 10.6 |
Rates of Interest—The average rate of interest on new mortgages was maintained at over 6 percent per year from 1922 to 1932, but with the advent of the depression period and the effect of the mortgage relief legislation, subsequent years showed decreases. The inclusion of State Advances Corporation mortgages from the year 1935–36 onwards no doubt also had the effect of reducing the average rate, and in addition the advent of 3 percent rehabilitation mortgages to ex-servicemen for residential and farm properties in the earlier post-war years and their gradual diminution in later years affected the rate. The average rate showed a rising trend from. 1947–48 to 1957–58 and, though falls were recorded in 1958–59 and 1959–60, it remained steady in 1960–61. Each of the five latest years has shown an increase. The average rate of interest for urban properties for 1965–66 was 6.18 percent, as compared with 5.90 percent for' rural properties. The comparable figures for 1964–65 were 5.82 and 5.73 respectively.
In 1965–66 the number and amount of 3 percent mortgages continued to decline, and both were considerably less than half the comparable totals in 1960–61, the peak year for 3 percent home-building loans under family benefit capitalisation. In 1965–66 there were 3,951 mortgages at 3 percent compared with 10,936 at 6 percent, 10,927 at 6 1/2 percent, 10,762 at 5 percent, and 9,852 at 7 percent.
An analysis showing amounts classified by interest rate groups is given below. It should be noted that some mortgages, notably those of trading banks, do not specify the rate of interest.
| Year Ended 31 March | Not Exceeding 3 Percent | Over 3 Percent to 4 Percent | Over 4 Percent to 4 1/2 Percent | Over 4 1/2 Percent to 4 3/4 Percent | Over 4 3/4 Percent to 5 Percent | Over 5 Percent to 5 1/2 Percent | Over 5 1/2 Percent to 6 Percent | Exceeding 6 Percent |
|---|---|---|---|---|---|---|---|---|
| Amount $ (million) | ||||||||
| 1956 | 16.3 | 5.4 | 43.0 | 4.2 | 87.4 | 9.0 | 10.2 | 5.7 |
| 1957 | 12.6 | 3.4 | 19.9 | 13.7 | 43.1 | 48.6 | 15.6 | 9.5 |
| 1958 | 12.5 | 3.6 | 5.6 | 23.8 | 33.9 | 67.9 | 22.0 | 11.7 |
| 1959 | 28.2 | 3.0 | 4.2 | 21.0 | 27.4 | 69.4 | 23.0 | 17.7 |
| 1960 | 42.3 | 4.7 | 3.8 | 12.8 | 28.7 | 77.2 | 27.8 | 14.5 |
| 1961 | 57.1 | 4.6 | 3.1 | 14.0 | 36.0 | 91.9 | 42.5 | 18.5 |
| 1962 | 51.0 | 4.8 | 2.9 | 14.0 | 42.3 | 64.2 | 78.1 | 40.0 |
| 1963 | 39.4 | 2.8 | 2.2 | 1.2 | 54.5 | 31.9 | 72.5 | 64.4 |
| 1964 | 34.2 | 2.9 | 2.1 | 0.4 | 57.5 | 26.5 | 71.8 | 95.9 |
| 1965 | 33.1 | 3.4 | 1.9 | 0.3 | 81.1 | 27.3 | 92.4 | 121.3 |
| 1966 | 27.3 | 4.6 | 2.3 | 0.1 | 84.6 | 28.3 | 81.7 | 203.2 |
| Percentage of Total | ||||||||
| 1956 | 9.0 | 3.0 | 23.7 | 2.3 | 48.2 | 5.0 | 5.6 | 3.2 |
| 1957 | 7.6 | 2.0 | 12.0 | 8.3 | 25.9 | 29.2 | 9.4 | 5.7 |
| 1958 | 6.9 | 2.0 | 3.1 | 13.2 | 18.7 | 37.5 | 12.2 | 6.5 |
| 1959 | 14.6 | 1.5 | 2.2 | 10.8 | 14.1 | 35.8 | 11.9 | 9.1 |
| 1960 | 20.0 | 2.2 | 1.8 | 6.0 | 13.6 | 36.5 | 13.1 | 6.8 |
| 1961 | 21.3 | 1.7 | 1.2 | 5.2 | 13.5 | 34.3 | 15.9 | 6.9 |
| 1962 | 17.2 | 1.6 | 1.0 | 4.7 | 14.2 | 21.6 | 26.3 | 13.4 |
| 1963 | 14.7 | 1.0 | 0.8 | 0.4 | 20.3 | 11.8 | 27.0 | 24.0 |
| 1964 | 11.7 | 1.0 | 0.7 | 0.2 | 19.7 | 9.1 | 24.7 | 32.9 |
| 1965 | 9.2 | 0.9 | 0.5 | 0.1 | 22.5 | 7.6 | 25.6 | 33.6 |
| 1966 | 6.3 | 1.1 | 0.5 | – | 19.6 | 6.6 | 18.9 | 47.0 |
A similar analysis by interest rate groups is shown (together with the annual average interest rate) in the following diagram.
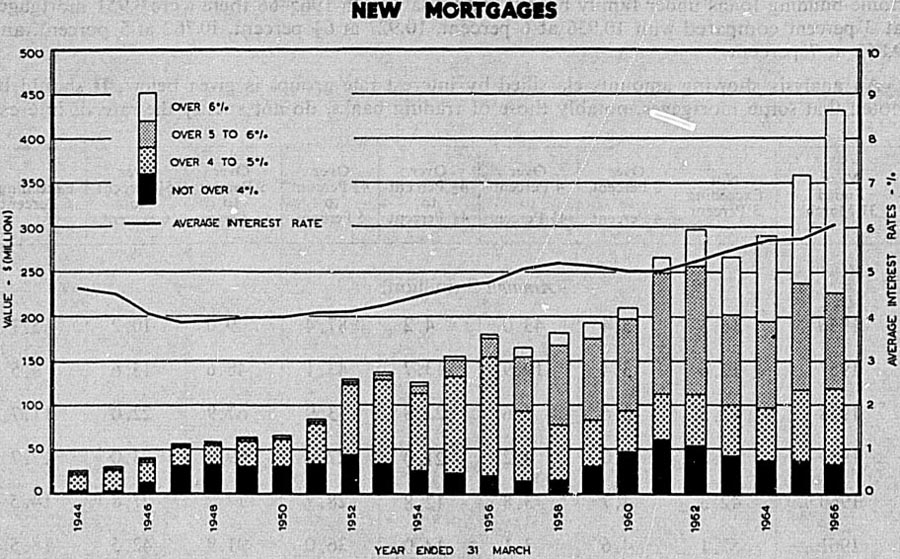
Mortgages by Class—In this section, mortgages are tabulated by class, i.e., as first flat, subsequent flat, first table, subsequent table, and as increases on existing mortgages. The majority of housing mortgages, especially those from Government agencies, are table (or instalment) mortgages. At the 1961 Census, out of a total of 633,707 inhabited permanent private dwellings, 166,636 were being bought on table mortgage or with time payment compared with 86,359 being bought on flat mortgages (181,793 dwellings were owned without mortgages, 153,728 were rented or leased, and the balance of the dwellings were free with job, loaned without payment, or the tenure was unspecified).
The following table shows the amounts advanced and average interest rates of mortgages on urban and rural property by class. Mortgages for which the interest rates are not specified are excluded from the calculations of average rates.
| Year Ended 31 March | Class of Mortgage | Total, Urban and Rural | |||||
|---|---|---|---|---|---|---|---|
| Urban | Rural | ||||||
| First Flat | First Table | Total (Including Other) | First Flat | First Table | Total (Including Other) | ||
| Amount advanced ($m) | |||||||
| 1961 | 37.9 | 114.8 | 198.2 | 36.8 | 51.8 | 110.0 | 308.1 |
| 1962 | 54.9 | 142.6 | 211.6 | 43.9 | 61.0 | 125.3 | 337.0 |
| 1963 | 48.2 | 138.5 | 205.1 | 36.6 | 46.6 | 103.9 | 309.0 |
| 1964 | 59.3 | 141.4 | 222.9 | 36.4 | 57.2 | 117.4 | 340.3 |
| 1965 | 78.8 | 153.5 | 257.2 | 49.9 | 82.8 | 162.8 | 420.0 |
| 1966 | 88.7 | 184.0 | 308.0 | 61.4 | 80.7 | 180.0 | 488.0 |
| Average interest rate (percent) | |||||||
| 1961 | 5.75 | 4.48 | 4.83 | 5.49 | 5.24 | 5.34 | 5.01 |
| 1962 | 6.01 | 4.64 | 5.12 | 5.74 | 5.38 | 5.53 | 5.27 |
| 1963 | 6.35 | 4.91 | 5.42 | 5.95 | 5.46 | 5.67 | 5.51 |
| 1964 | 6.51 | 5.19 | 5.69 | 6.00 | 5.55 | 5.71 | 5.70 |
| 1965 | 6.58 | 5.22 | 5.82 | 6.15 | 5.51 | 5.73 | 5.78 |
| 1966 | 6.69 | 5.68 | 6.18 | 6.24 | 5.64 | 5.90 | 6.07 |
The effect on average interest rates of the State Advances Corporation 3 percent housing loan is seen in the movement in annual average rates on urban first table mortgages. Loans at 3 percent reached a peak in 1960–61, when 10,953 were granted, involving a total amount of $56.4 million. They have declined steadily in later years to a total of 3,951, involving $26.2 million in 1965–66. The average interest rate on urban first table mortgages declined to 4.48 percent in 1960–61, the peak years for 3 percent mortgages, and has risen in each succeeding year partly because the volume of 3 percent loans included in the category has fallen.
If mortgages at 3 percent interest are excluded from the calculations, the average rate of interest on all mortgages during recent years becomes 5.55 percent in 1960–61, 5.72 percent in 1961–62, 5.92 percent in 1962–63, 6.05 percent in 1963–64, 6.06 percent in 1964–65, and 6.27 percent in 1965–66.
SOURCES OF MORTGAGE FINANCE—The following table indicates the sources of finance for mortgages registered in the year ended 31 March 1966. For mortgages on town and suburban properties, 22.3 percent of the aggregate advances were obtained from Government agencies (of which the principal one is the State Advances Corporation) compared with 27 percent in 1964–65. Of the total of $68.6 million advanced by Government agencies on urban properties in 1965–66, $16.8 million was in the form of 3 percent loans, and $38.8 million in the form of 5 percent loans. The total of 3 percent loans on urban properties from all sources was $18.7 million, and of 5 percent loans, $45 million. In 1964–65 the comparable figures were $68.7 million advanced by Government agencies on urban properties, of which $26.7 million was at 3 percent, and $28.1 million at 5 percent.
In 1965–66 over 19 percent (by number) of urban mortgages were from Government sources, compared with nearly 21 percent during the previous year.
Among sources of finance other than Government agencies the most frequently occurring interest rates during 1965–66 were in the range of 5 1/2 percent to 7 percent. Of the total of $239.4 million advanced on urban properties by other than Government agencies, $39.2 million was at 6 percent, $60.6 million at 6 1/2 percent, $40.1 million at 7 percent, and $15.1 million at 5 1/2 percent. For advances totalling $38.4 million the interest rates were not specified.
About a quarter of the total amount advanced on rural properties during 1965–66 was from Government agencies. This amounted to $45.8 million (of which $29 million was at 5 percent interest rate) out of a total of $180 million. During the previous year, Government agencies advanced 29 percent of the consideration on rural properties, amounting to $48 million ($37.2 million at 5 percent) out of a total of $162.8.
Of the total of $134.2 million advanced on rural properties during 1965–66 by other than Government agencies, $31.4 million was at 6 percent, $39.4 million at 6 1/2 percent, $10.5 million at 5 percent, and $6.3 million at 5 1/2 percent. Loans at unspecified interest rates totalled $16.9 million.
Points to note in considering statistics of mortgages by source of finance are that most trading bank mortgages specify neither interest rates nor the amounts involved; and that the Government Life Insurance Office and the State Insurance Office are included among Government agencies, not with insurance companies.
| Source of Finance | Urban | Rural | Total | |||
|---|---|---|---|---|---|---|
| Number | Amount | Number | Amount | Number | Amount | |
| $(000) | $(000) | $(000) | ||||
| Government | 12,223 | 68,607 | 2,964 | 45,824 | 15,187 | 114,431 |
| Local authorities | 60 | 227 | 24 | 284 | 84 | 511 |
| Trading banks | 4,571 | 958 | 1,314 | 1,070 | 5,885 | 2,027 |
| Trustee savings banks | 2,764 | 14,872 | 459 | 4,834 | 3,223 | 19,706 |
| Building societies | 7,730 | 37,334 | 671 | 5,556 | 8,401 | 42,890 |
| Insurance companies | 4,073 | 52,962 | 845 | 19,872 | 4,918 | 72,834 |
| Private individuals | 23,508 | 89,481 | 6,416 | 80,570 | 29,924 | 170,050 |
| All other | 7,880 | 43,547 | 1,476 | 22,000 | 9,356 | 65,547 |
| Totals | 62,809 | 307,988 | 14,169 | 180,008 | 76,978 | 487,996 |
Supplementary details on sources of mortgage finance with numbers and amounts of mortgages at various rates of interest are given in a supplement to the September 1966 issue of the Monthly Abstract of Statistics.
MORTGAGES DISCHARGED—The value of mortgages registered normally exceeds the value of mortgages released, although discharges exceeded registrations for a period of five years commencing with the year 1933–34, and again from 1941–42 to 1945–46. Registrations exceeded discharges by $171.6 million in 1963–64, $213.2 million in 1964–65, and by $257.9 million in 1965–66.
Details of urban and rural discharges for the latest two years are given in the following table.
| District | 1964–65 | 1965–66 | Total Amount | ||||||
|---|---|---|---|---|---|---|---|---|---|
| Urban | Rural | Urban | Rural | ||||||
| Number | Amount | Number | Amount | Number | Amount | Number | Amount | ||
| $(000) | $(000) | $(000) | $(000) | $(000) | |||||
| North Auckland | 13,795 | 44,322 | 2,468 | 13,302 | 14,935 | 51,932 | 2,655 | 16,020 | 67,952 |
| South Auckland | 4,143 | 13,238 | 2,123 | 10,902 | 5,187 | 16,654 | 2,518 | 13,330 | 29,984 |
| Gisborne | 453 | 1,226 | 196 | 1,220 | 522 | 1,376 | 255 | 1,366 | 2,742 |
| Hawke's Bay | 1,754 | 4,982 | 615 | 4,984 | 1,821 | 5,436 | 593 | 4,914 | 10,350 |
| Taranaki | 1,067 | 2,886 | 674 | 4,284 | 1,143 | 3,312 | 732 | 4,478 | 7,790 |
| Wellington | 9,788 | 30,752 | 1,393 | 10,076 | 9,967 | 33,268 | 1,394 | 10,818 | 44,086 |
| Marlborough | 444 | 1,106 | 306 | 1,590 | 425 | 1,180 | 266 | 1,650 | 2,830 |
| Nelson | 1,050 | 2,512 | 429 | 1,418 | 1,038 | 3,156 | 422 | 1,526 | 4,682 |
| Westland | 282 | 804 | 73 | 236 | 369 | 700 | 91 | 306 | 1,006 |
| Canterbury | 6,507 | 18,852 | 1,538 | 11,400 | 6,477 | 19,474 | 1,672 | 12,994 | 32,468 |
| Otago | 3,957 | 10,014 | 945 | 6,160 | 3,890 | 8,958 | 843 | 6,002 | 14,960 |
| Southland | 1,441 | 4,636 | 821 | 5,906 | 1,488 | 4,908 | 776 | 6,300 | 11,208 |
| Totals | 44,681 | 135,328 | 11,581 | 71,476 | 47,262 | 150,356 | 12,217 | 79,704 | 230,058 |
GENERAL—Government first entered the field of mortgage finance in 1894 with the passing of the Government Advances to Settlers Act—the objective being to provide loans at economic interest rates and on stable terms and conditions to farmers for land development purposes. The functions of the office, later known as the State Advances Department, were subsequently enlarged to allow loans to workers for the erection and purchase of houses and to local authorities for the provision of public facilities. A public corporation was established with the passing of the Mortgage Corporation Act 1934–35—the share capital of $2,000,000 being subscribed equally by Government and public. The business of the State Advances Department and certain operations of the Lands and Survey Department and Public Trust Office were absorbed by the new corporation.
In terms of the State Advances Corporation Act 1936, the Government acquired the privately-owned shares of the Mortgage Corporation, extended its functions and changed its name to the State Advances Corporation of New Zealand. The State Advances Corporation Act 1965 transferred the management of the Corporation from a Board of Management to a body corporate consisting of the managing director, deputy managing director (both full-time executive officers), one or more other directors not exceeding four, all appointed by the Governor-General in Council, and an ex-officio director being an officer of Treasury. The body corporate may exercise all the powers and discharge all the functions of the Corporation in accordance with the statutory provisions of the Act. The $2,000,000 capital formerly an appropriation from the Consolidated Fund was redeemed by a loan from the National Development Loans Account, The principal business of the Corporation is the making of loans for approved purposes and it has power to deal in and manage property. In the exercise of its functions and powers the Corporation is required to give effect to the policies of Government as communicated to it by the Minister of Finance.
Since 1937 when Government embarked upon the scheme for the erection of State rental houses, the Corporation has been responsible for the letting and subsequent administration of these properties. The operations of the Corporation can be classified under two main headings, these being, firstly, the lending of money on mortgage (and certain allied functions) in accordance with the State Advances Corporation Act 1965, and, secondly, the letting and administration of State rental houses in terms of the Housing Act 1955.
STATE ADVANCES CORPORATION ACT: Rural Loans—Loan finance is granted by the Corporation for the purchase and/or development of farm properties. Present policy is directed towards stimulating increased production and assisting suitable young farmers and farm workers who can demonstrate a need for finance from the Corporation, and who have not previously owned an economic property. Loans may be granted for the purchase of land and improvements and stock and plant, the erection of necessary buildings, and for essential development work. Loans are generally limited to two-thirds of the Corporation's value of the land and improvements, although loans in excess of this margin may be approved where collateral security over stock and plant is available. It has been found that the aim of assisting suitable applicants to acquire properties with adequate stock and plant can be achieved with loans up to $20,000 in the case of dairy farms, and $32,000 for sheep farms, and these are the maximum loans normally available. However, loans in excess of these amounts will be considered in special circumstances. Repayment is on a table basis over terms of up to 35 years, with interest at 5 1/2 percent per annum. Loan assistance is not normally available to refinance existing mortgages. Where a farmer whose property is already mortgaged elsewhere requires finance for development and for increasing production the Corporation is able in appropriate cases to grant loans by way of second (or subsequent) mortgage with interest at 6 percent.
Loans on Stock and Plant—Loans by way of first security over stock and plant only can be granted by the Corporation to farmers, including share milkers and lessees of farms, for the purchase of stock and plant or for other farming purposes. These loans are limited to 60 percent of the value of the stock and plant with a maximum of $8,000 for one man. The loans are repayable over a short term, usually five years with interest at 5 1/2 percent In the case of young farmers between the ages of 21 and 35 years, loans are available up to 75 percent of the value of stock and plant but when this extended margin applies the maximum loan limit is $5,000 for a one-man herd and $7,000 for a two-man herd.
Urban Loans—In view of the heavy calls on its funds and the need to overtake the housing shortage, the Corporation was in recent years concentrating its residential lending on the provision of loans for the erection of houses or the acquisition of houses not previously occupied. However, in 1964 the provision of loans to assist home seekers (with one or more children living at home) to purchase previously occupied houses was reinstated. The loans are made on the security of a first mortgage of land. Each case is considered on its merits taking into account the financial position of the applicant and the cost of the proposition. Each applicant is expected to make a reasonable contribution himself. Loans for the erection of houses or the purchase of houses which have not previously been occupied are generally limited to a maximum of $5,300 rising to $5,400 when there are three dependent children, $5,500 where there are four dependent children, and $5,600 where there are five or more dependent children. Where the applicant owns an unencumbered freehold section an extended maximum of $6,000 applies.
In February 1958 a scheme was introduced whereby loans with the interest rebated to 3 percent were made available for the erection of houses or the acquisition of houses not previously occupied to borrowers who had not owned a property within a period of five years prior to date of the loan application and where the income of the breadwinner did not exceed $2,000 per annum, increased by $100 for each dependent child (including overtime and bonuses) but without taking into account family benefit or war pensions. In the period from 12 February 1958 to 31 March 1966 there were approved under this scheme 53,705 loans of a total value of $280,121,760, the figures for the year ended 31 March 1966 being 2,991 loans involving $16,767,820.
Loans for the purchase of houses which have been previously occupied are in general limited to two-thirds of the assessed value of the property with a maximum of $5,000 rising to $5,300 depending on the number of children. An applicant whose income is within the limits outlined earlier can qualify for interest rebated to 3 percent.
Where an applicant does not qualify for 3 percent interest any loan granted is at the Corporation's normal lending rate. Loans now being granted at 3 percent interest provide for a five-yearly review of the interest rate and if the borrower does not qualify on income for rebate to 3 percent at the time of review the interest rate is increased to the normal interest rate for the balance of the term of the loan.
Family Benefit Capitalisation—A further scheme of housing finance administered by the Corporation is that established by the Family Benefits (Home Ownership) Act 1958, which came into operation on 1 April 1959, the moneys for which are provided by the Social Security Department and paid out by the Corporation. Applications for advances under this Act are received only from applicants who have already been declared eligible by the Social Security Commission. For the year ended 31 March 1966, 6,356 advances, totalling $7,485,102, were authorised by the Corporation under this agency, compared with 6,866 advances totalling $8,065,880 in 1964–65.
Mortgage Guarantee Scheme for Housing—The Corporation, has statutory authority to guarantee to an approved lending institution the repayment of that portion of a housing loan granted by the institution in excess of its normal limits (usually two-thirds of value).. The guarantee operates up to 90 percent of value for a total loan not exceeding $8,000 for the erection of a house and up to 85 percent of value for a total loan not exceeding $7,200 for the purchase of an existing house. The borrower is required to pay to the credit of the Corporation's General Reserve Fund an amount equal to 2 percent of the portion of the loan guaranteed.
Loans to Local Authorities—In addition to its primary function of providing cheap long-term finance in the form of first mortgage on property, the Corporation has been authorised to make loans to local authorities for the purpose of erecting pensioner and approved community housing schemes and farm dwellings.
Loans to Industry—The Corporation is also authorised to make loans for the development of existing industries or the establishment of new industries where they are in the public interest. Guarantees may also be given to other lenders, in terms of Government schemes designed to promote the provision of tourist accommodation and the development of the fishing industry.
Rehabilitation—The Corporation is the principal agent for the Rehabilitation Board regarding loans granted on rehabilitation terms to eligible ex-servicemen for the purchase and improvement of farms and the purchase or erection of dwellings. Loan moneys for these purposes are made available from the Corporation's own funds. The securities taken by the Corporation are similar to mortgages taken for the purpose of securing loans made under the Corporation's ordinary lending activities except that the Reserve Fund contribution on loans within the respective rehabilitation loan limits is paid to the Corporation by the Consolidated Fund which also meets the difference between the Corporation's normal interest rate and the reduced interest rate charged to ex-servicemen. All forms of rehabilitation assistance available to ex-servicemen of the Second World War and K Force ceased on 31 March 1965. The classes of loans granted are set out in Section 6B (War Pensions and Rehabilitation).
Co-operative Rural Intermediate Credit Associations—Loans may be granted by the Corporation to co-operative rural intermediate credit associations operating in terms of the Rural Intermediate Credit Act 1927 and amendments. The interest rate charged by the Corporation to the associations is 4 1/2 percent and the associations relend to their members at 5 1/2 percent for the purchase of farm stock and plant or other farming purposes. The loans are secured over the stock and plant and are repayable by the farmer borrowers over a short term, usually five years. At 31 March 1966 there were six co-operative rural intermediate credit associations in operation. The loans authorised through this channel during the year 1965–66 amounted to $730,940 and there were 475 loans current at the end of the year for an aggregate amount of $1,196,606.
Conditions of Loans—The large majority of the loans granted by the Corporation are secured by table mortgages for terms varying from 10 to 30 years, but the Corporation also has power to make advances on flat mortgage on certain conditions.
When loans are granted in excess of normal lending margins, mortgagors may be required to offer some form of collateral security (e.g., mortgage of life policy).
All mortgagors who receive from the Corporation a loan secured by a mortgage of land are required to pay as a contribution to the Corporation's General Reserve Fund, an amount equal to 2 percent of the amount of the loan and this amount may be borrowed as an addition to the principal sum if so desired. This contribution may be waived, or reduced, in respect of a loan granted within five years of repaying an earlier loan from the Corporation. These amounts, together with the transfer from profits referred to later, form the General Reserve Fund.
Interest Rates—The Corporation is required from time to time to fix the rates of interest to be paid under mortgages to it, so as to make adequate provision to cover the costs of administration and for all other matters incidental to the proper functioning of the Corporation. After such provision as the Minister of Finance thinks proper has been made for the depreciation of securities or other assets, and for such other matters as in his opinion are necessary for the efficient conduct of the business of the Corporation, the surplus for each financial year after payment of income tax is, to be paid into the Public Account unless the Minister, in his discretion, authorises the board to credit it, in whole or in part, to the General Reserve Fund of the Corporation.
The lending rate of the Corporation was maintained until the end of 1953 at 4 1/8 percent. Interest rates were increased from 1 April 1956 on loans for the purchase of approved rural properties from 4 7/8 percent to 5 percent and, from 13 February 1967 to 5 1/2 percent. The interest rate applicable to loans for the building of new houses was increased from 4 1/8 percent to 4 3/4 percent as from 1 April 1956, to 5 percent as from 27 July 1961, and to 5 1/2 percent from 13 February 1967. On loans for the purchase of previously occupied houses the rate is 5 percent.
Since 12 February 1958 in respect of loans for the erection of houses, and since 25 March 1964 in respect of loans for the purchase of houses which have been previously occupied, there has been provision for a rebate of interest to 3 percent for applicants whose income for the 12 months prior to the date of lodging their loan application does not exceed the prescribed limits.
As already stated, where loans are granted by the Corporation for the development of farm properties by way of second (or subsequent) mortgage ranking after an outside mortgage the interest rate is 6 percent.
Annual Repayment Costs—The following summary shows the annual cost—i.e., interest and principal payments—per $100 borrowed on table mortgage at 3 percent and 5 percent and 5 1/2 percent for the various periods.
| Term | Annual Amount Payable Per $100 Borrowed | ||
|---|---|---|---|
| 3 Percent | 5 Percent | 5 1/2 Percent | |
| $ | $ | $ | |
| 10 years | 11.64 | 12.82 | 13,14 |
| 15 years | 8.32 | 9.56 | 9.90 |
| 20 years | 6.68 | 7.96 | 8.30 |
| 25 years | 5.72 | 7.06 | 7.40 |
| 30 years | 5.08 | 6.48 | 6.84 |
HOUSING ACT 1955—In addition to its lending activities the State Advances Corporation has the important function of administering the Housing Act 1955 on behalf of the Crown. Under the Housing Act 1955 the Corporation administers State houses and flats which become available for letting or for sale to tenants, as well as loans to local authorities granted under the provisions of this Act. The following are the main operations:
Applications for State tenancies.
The subsequent administration of these tenancies.
The sale of State houses to tenants desiring to purchase.
Housing loans to local authorities for projects within defined Government policy.
The number of additional dwelling units handed over to the Corporation during the year ended 31 March 1966 totalled 1,334. New State houses under administration on a tenancy basis at 1 April 1965 were 46,201. After adding the new units taken over and allowing for sales and repurchases, there was a net total of 47,160 for the year ended 31 March 1966, an increase of 959 over the previous year. In addition to these houses the Corporation also administers a group of older houses acquired for rental purposes, the number being 1,184 at 31 March 1966.
Substantial responsibilities are involved in the administration of the 48,344 tenancies which were current at 31 March 1966. The percentage of tenants in arrears at 31 March 1966 was 3.94 percent, compared with 3.76 percent at 31 March 1965.
Rents received from these tenancies amounted to $13,886,948. In addition the sum of 5465,596 was recouped by deduction from interest payable on National Development Loans capital to offset rental concessions granted to pensioners, etc., thus bringing the total receipts to $14,352,544, compared with $13,997,088 for 1964–65. Apart from interest, the largest single item of expenditure charged against rentals was the provision for maintenance of State houses. For the year ended 31 March 1966 this amounted to $2,397,050 against $2,349,200 for the previous year. Rates payable to local authorities showed an increase for the year ended 31 March 1966, being $2,443,292 compared with the previous year's figure of $2,345,914.
As in the preceding year, the interest rate payable on National Development Loans capital in 1965–66 was 3 percent. The year's revenue transactions in the Housing Account produced a total profit of $792,998 which together with a surplus of $1,460,522 brought forward from 1964–65, resulted in a revenue surplus of $2,253,500 being carried forward at the close of 1965–66.
Reference to the Government's housing scheme under the Housing Act 1955, together with particulars of the numbers of houses erected, etc., are contained in Section 19 (Building and Housing).
Sale of State Houses—Should they desire to own their own homes, State house tenants are given the opportunity of buying the houses they occupy.
The current purchase terms available to tenants include:
A minimum deposit usually of 5 percent of the gross purchase price but where, however, the financial position of the purchaser warrants, the Corporation may require a greater deposit.
The balance of the purchase money, together with interest, payable over a period of years on an instalment-table basis.
Interest at 5 percent reducible to 3 percent while conditions of sale are complied with in the case of purchasers who would qualify for a 3 percent housing loan.
From the inception of the sale of State rental houses up to 31 March 1966 the number sold to the tenants was 20,384, for a total sale price of $103,439,718. Of the houses sold, 1,293 have been repurchased by the Corporation for $6,464,200. The repurchases comprise properties which have been bought back in terms of the sale agreement—generally from purchasers who have transferred to other towns in the course of their employment.
SUMMARY OF ACTIVITIES: Classification of Accounts and Balance Sheet Assets at 31 March 1966—As already indicated, the Corporation, in addition to its normal lending functions, administers a number of other State activities, and a general summary of the business under administration as at 31 March 1966 is as follows.
| Item | Number of Accounts | Amount |
|---|---|---|
| State Advances Corporation— | ||
| Investments and accrued interest— | ||
| Rural— | $(000) | |
| Mortgages | 24,378 | 179,935 |
| Seasonal current accounts (in debit) | 108 | 1,616 |
| Seasonal current accounts (in credit) | 66 | |
| Urban (mortgages) | 125,980 | 450,434 |
| Loans to industries | 38 | 12,513 |
| Government and local authority securities | 517 | 38,466 |
| Fixed and current assets | 3,691 | |
| Totals | 151,087 | 686,655 |
| Agencies— | ||
| Advances under Rehabilitation Act 1941— | ||
| Furniture, business, and miscellaneous | 129 | 23 |
| Interest-free supplementary loans— | ||
| Corporation loan current | – | 2,243 |
| Corporation loan repaid | 561 | 129 |
| Health Department | 109 | 2,655 |
| Licensing Control Commission | 11 | 339 |
| Gas companies | 12 | 381 |
| Suspensory loans (rural and urban) | 2,191 | 2,763 |
| Agriculture Department | 1 | 3 |
| Mines Department suspensory loans | 10 | 9 |
| Miscellaneous rentals, etc. | 2,003 | – |
| Totals | 5,027 | 8,545 |
| Housing Account— | ||
| Investments and accrued interest— | ||
| Properties sold | 15,206 | 56,037 |
| Loans to local authorities | 283 | 8,417 |
| Loans to employers | 12 | 53 |
| Rural Housing Act (loans to local authorities) | 155 | 5,817 |
| Properties let— | ||
| Dwellings | 48,344 | 232,070 |
| Shops, halls, and communal garages | 174 | |
| Current assets | – | 548 |
| Timber workers' rentals | 81 | – |
| Totals | 64,255 | 302,942 |
| Grand Totals | 220,369 | 998,142 |
Farm loans and residential loans to ex-servicemen under the Rehabilitation Act 1941 are included in the table with mortgage investments. Particulars of all rehabilitation loan authorisations will be found in Section 6B (War Pensions and Rehabilitation).
Financial—Balance-sheet figures show that at 31 March 1966 stock and debentures outstanding were 5360,957,232, the same as at 31 March 1965. National Development Loans capital was $282,723,230, compared with $338,618,300 at 31 March 1965.
The General Reserve Fund at 31 March 1966 amounted to $34,142,875, and in addition there were specific reserves amounting to $3,290,076, making total reserves of $37,432,951, as compared with $34,754,792 at 31 March 1965.
Funds available to the Corporation from National Development Loans Account were subject to an interest rate of 4 1/2 percent from 1 April 1963, and a total of $44,000,000 was advanced during the year. This sum, however, included $2,000,000 raised to repay the original authorised capital.
As from the same date the Corporation was reimbursed for interest concessions on civilian rebated housing loans (that is, for the difference between its normal lending rate and the rebated rate). This reimbursement is effected by deduction from interest payments due by the Corporation to the Public Account in respect of National Development Loans capital, and the interest concessions so reimbursed amounted to $3,825,956 for the year ended 31 March 1966.
Mortgages and accrued interest at 31 March 1966 totalled $642,754,042, an increase of $41,487,324 as compared with 31 March 1965, while Government and local authority securities and accrued interest at $38,466,006 were greater by $2,832,118.
The details of profits in respect of operations during each of the latest three financial years are given in the following table.
| Disposition and Appropriation of Profits | 1963–64 | 1964–65 | 1965–66 |
|---|---|---|---|
| $(000) | $(000) | $(000) | |
| Gross income | 25,146 | 28,736 | 31,583 |
| Less interest on Reserve Fund investments | 1,385 | 1,524 | 1,688 |
| Less interest on loan capital | 19,769 | 22,181 | 24,446 |
| Gross Profit | 3,992 | 5,031 | 5,449 |
| Less management expenses | 1,670 | 1,794 | 1,927 |
| Net Profit | 2,322 | 3,237 | 3,522 |
| Less reserve for taxes | 1,160 | 1,628 | 1,766 |
| Less transfer to General Reserve | 40 | 40 | 40 |
| Less transfer to Premises Capital Reserve | 300 | 500 | 500 |
| Surplus payable to Public Account | 822 | 1,069 | 1,216 |
The gross income of $31,583,000 in 1965–66 included $24,563,000 interest on mortgages and current accounts, $1,732,000 interest on Government and local authority securities, $1,362,000 recovery from the Rehabilitation Division on account of interest concessions to ex-servicemen on rehabilitation advances, and $3,926,000 for interest concessions on civilian rebated advances. Corresponding figures for 1964–65 were $28,736,000, $22,119,000, $1,559,000, and $1,438,000 respectively for the first four items.
New Business—A summary of loan operations (new business) for the latest two financial years is given in the following table.
| Loans Authorised | 1964–65 | 1965–1966 | ||
|---|---|---|---|---|
| Number | Value | Number | Value | |
| $(000) | $(000) | |||
| Urban securities— | ||||
| Erection of dwellings | 8,906 | 49,663 | 8,142 | 46,035 |
| Purchase | 2,064 | 9,919 | 2,205 | 11,093 |
| Other purposes | 485 | 719 | 448 | 550 |
| Suspensory | (63) | 19 | (51) | 17 |
| Totals, urban | 11,455 | 60,320 | 10,765 | 57,695 |
| Rural securities— | ||||
| Purchase, refinanced, and other purposes | 3,028 | 41,712 | 3,693 | 40,033 |
| Suspensory | (50) | 126 | (30) | 67 |
| Totals, rural | 3,028 | 41,838 | 3,693 | 40,100 |
| Loans to industry | 6 | 7,422 | 12 | 1,711 |
| Grand totals | 14,489 | 109,580 | 14,500 | 99,506 |
The preceding figures include rehabilitation loans in respect of farms and houses.
A statement is now given of the aggregate number and amount of loans approved since the Corporation commenced business in 1935.
| Type of Loan | Number | Amount $(000) |
|---|---|---|
| Farm (including supplementary) | 39,100 | 353,822 |
| Residential (including supplementary) | 210,379 | 805,057 |
| Local authorities | 1,131 | 38,260 |
| Industries | 109 | 26,814 |
| Totals | 250,719 | 1,223,953 |
GENERAL—Building societies are a relatively popular means of saving and investment in New Zealand and have over 380,000 members. There are 72 building societies with total assets of $211.8 million. They provide finance for home ownership to the extent of over $30 million a year. Building societies have assisted the national economy by developing the field of contractual saving. They are encouraged by legislation, as in other countries, and are exempt from taxation. The relevant legislation is the Building Societies Act 1965, which came into force on 1 January 1966, and supersedes the Act passed in 1908.
There are two types of building society—permanent and terminating. The co-operative terminating societies account for 64.1 percent of total building society assets and have over 345,000 members. They have no fixed capital or proprietary interests but obtain their funds purely from subscriptions paid by members on their shares. Field staffs are employed to recruit new members who take up subscription shares, each share entitling a member in due course to a loan of $400, with a contractual payment of 10 cents weekly per share. Ballots for interest-free loans are held at set intervals and members may also secure home loans by tendering competitively for them. Although a member drawing an interest-free ballot may use it to finance a home, the majority, enrolled in any case purely as savers, accept from the societies a set tax-free profit on their loan rights, with their savings remaining intact. This releases funds for ordinary interest-bearing mortgages invested at market rates. Terminating societies do not pay an annual dividend or interest. Shareholders on withdrawal receive, after 10 years or later, a share of accrued profits in the same way as life assurance offices add bonuses to premium savings. Shares are segregated into groups which terminate after 25 to 30 years, when all remaining members have either received a loan or the equivalent cash value.
Permanent societies, whilst encouraging systematic savings, rely substantially for their funds on the acceptance of deposits or single investments. Some permanent societies also have fixed share capital. Investments are made in what are virtually gilt-edged securities (principally mortgages on homes and Government stock) and dividends are paid. Some permanent societies also operate savings bank accounts with interest rates varying according to the period of fixed deposit.
Home finance for members of both types of societies is usually available up to two-thirds of valuation at an interest rate generally below the ruling market rate for mortgage finance. Mortgages are usually table mortgages for periods up to 20 years.
Returns of each society's operations are furnished annually to the Department of Statistics.
NUMBER OF SOCIETIES AND SHARES—The number of societies functioning in 1965–66 was 72, of which 54 were permanent and 18 terminating. The number of societies has shown little variation in recent years.
Permanent Societies—The following table shows for each of the latest five years particulars of permanent societies, including data on number and value of investing and capital shares. Other fully-paid shares are shown separately, as these are included as deposits in the liabilities table.
| Item | 1961–62 | 1962–63 | 1963–64 | 1964–65 | 1965–66 | |
|---|---|---|---|---|---|---|
| Number of societies | 54 | 54 | 54 | 53 | 54 | |
| Investing Shares | ||||||
| Number of shares | (000) | 860 | 911 | 1,074 | 1,170 | 1,458 |
| Members holding | 26,148 | 26,314 | 27,011 | 28,850 | 32,026 | |
| Aggregate value | $(000) | 11,449 | 12,211 | 12,295 | 13,636 | 15,671 |
| Other Classes of Shares (Fully Paid) | ||||||
| Number of shares | (000) | 175 | 179 | 257 | 276 | 297 |
| Aggregate value | $(000) | 8,768 | 8,944 | 12,937 | 13,882 | 14,964 |
| Capital Shares | ||||||
| Number of shares | (000) | 1,429 | 1,509 | 1,548 | 1,629 | 1,975 |
| Members holding | 6,289 | 6,122 | 6,140 | 6,175 | 6,080 | |
| Aggregate value | $(000) | 5,324 | 5,560 | 5,671 | 5,990 | 6,201 |
At March 1966 the average value of each investing share was $10.75, and the average value of such shares held by each member was $489. The comparative figures for capital shares were $3.10 and $1,020.
Terminating Societies—Total membership and value of shares continue to grow steadily. One person may hold shares in several groups of a terminating society. The next table shows the progress of terminating societies during the latest five years.
| Year | Societies | Groups | Members Holding Shares | Investing Shares | |
|---|---|---|---|---|---|
| Number | Value | ||||
| (000) | $(000) | ||||
| 1961–62 | 18 | 519 | 259,634 | 2,416 | 60,614 |
| 1962–63 | 18 | 554 | 280,733 | 2,734 | 69,267 |
| 1963–64 | 18 | 566 | 301,352 | 3,042 | 78,786 |
| 1964–65 | 18 | 598 | 323,281 | 3,371 | 89,266 |
| 1965–66 | 18 | 613 | 345,798 | 3,741 | 100,189 |
The average value per share in 1965–66 was $26.78, and the average value of shares held by each member was $290. The figures for 1961–62 were, respectively, $25.08 and $233.
RECEIPTS AND PAYMENTS—Following is a summary of receipts and payments for all societies during each of the latest five years.
| Item | 1961–62 | 1962–63 | 1963–64 | 1964–65 | 1965–66 |
|---|---|---|---|---|---|
| Receipts $(thousand) | |||||
| Investors' subscriptions and capital shares | 14,490 | 15,799 | 17,943 | 20,430 | 22,240 |
| Advances repaid | 15,020 | 15,582 | 18,593 | 22,685 | 25,853 |
| Deposits | 10,982 | 11,311 | 15,841 | 22,129 | 25,520 |
| Interest | 2,866 | 3,170 | 3,613 | 4,330 | 4,939 |
| Other receipts | 2,400 | 2,286 | 3,165 | 6,103 | 6,068 |
| Total receipts | 45,758 | 48,149 | 59,155 | 75,677 | 84,620 |
| Withdrawals | 4,392 | 4,803 | 5,434 | 6,322 | 7,910 |
| Advances | 25,354 | 25,009 | 31,067 | 37,378 | 42,111 |
| Expenses of management | 1,270 | 1,380 | 1,475 | 1,624 | 1,870 |
| Dividends paid | 340 | 361 | 383 | 421 | 464 |
| Deposits repaid | 9,056 | 8,595 | 10,453 | 15,679 | 19,143 |
| Interest paid | 1,212 | 1,359 | 1,552 | 1,869 | 2,211 |
| Other payments | 4,828 | 4,607 | 7,162 | 10,591 | 10,713 |
| Total payments | 46,452 | 47,114 | 57,526 | 73,884 | 84,422 |
The ratio of loan repayments to advances was 59.2 percent in 1961–62, 59.9 percent in 1962–63, 59.8 percent in 1963–64, 60.7 percent in 1964–65, and 61.4 percent in 1965–66.
LOANS—The number of borrowers and amount of loans outstanding at the end of each of the five years quoted were as follows. Advances on shares are excluded, as are the outstanding balances on premiums on loans where possible. In a few cases however, it has not been possible to separate this figure from the amount of loans and in such cases the outstanding balance owing on premiums on loans is included.
| As at End of Year | Permanent Societies | Terminating Societies | Totals | |||
|---|---|---|---|---|---|---|
| Number of Loans | Amount | Number of Loans | Amount | Number of Loans | Amount | |
| $(000) | $(000) | $(000) | ||||
| 1961–62 | 16,295 | 48,676 | 32,030 | 55,442 | 48,325 | 104,118 |
| 1962–63 | 16,515 | 52,159 | 34,989 | 63,135 | 51,504 | 115,294 |
| 1963–64 | 17,242 | 56,946 | 37,897 | 71,164 | 55,139 | 128,109 |
| 1964–65 | 17,899 | 63,579 | 39,429 | 80,945 | 57,328 | 144,524 |
| 1965–66 | 18,214 | 70,345 | 40,161 | 91,636 | 58,375 | 161,981 |
The average amount owing by each borrower at the end of each of the five years is given below.
| Class | 1961–62 | 1962–63 | 1963–64 | 1964–65 | 1965–66 |
|---|---|---|---|---|---|
| $ | $ | $ | $ | $ | |
| Permanent societies | 2,988 | 3,158 | 3,302 | 3,574 | 3,862 |
| Terminating societies | 1,730 | 1,804 | 1,878 | 2,052 | 2,281 |
| All societies | 2,154 | 2,238 | 2,324 | 2,520 | 2,775 |
For terminating societies, if all outstanding balances owing on premiums on loans are added to the loan totals outstanding, the 1965–66 figures would be $109.8 million, compared with $96.8 million in 1964–65 and $85.2 million in 1963–64.
Particulars of loans granted during each of the latest five years follow.
| During Year | Permanent Societies | Terminating Societies | |||||
|---|---|---|---|---|---|---|---|
| By Ballot | By Auction | ||||||
| Number of Loans | Amount | Number of Loans | Amount | Number of Loans | Amount | Premiums | |
| $(000) | $(000) | $(000) | $(000) | ||||
| 1961–62 | 2,797 | 9,374 | 1,526 | 5,328 | 2,550 | 9,454 | 4,180 |
| 1962–63 | 2,680 | 9,069 | 1,612 | 5,995 | 2,221 | 8,534 | 3,867 |
| 1963–64 | 3,339 | 13,120 | 1,854 | 7,132 | 2,379 | 9,470 | 4,484 |
| 1964–65 | 3,567 | 14,917 | 2,096 | 8,333 | 3,067 | 12,475 | 5,878 |
| 1965–66 | 3,496 | 15,711 | 2,091 | 9,339 | 3,272 | 14,996 | 7,052 |
The totals for loans in the above table represent loans granted and differ slightly from the figures shown as advances in the table relating to receipts and payments, where the amounts refer to payments actually made in respect of loans. The average loan granted by permanent societies amounted to $4,494, and by terminating societies (ballot) $4,466 and (auction) $4,583. The average premium on auctioned loans, representing total interest payments over the period of the loan, was $2,155.
Premium rates on auctioned loans during the last five years have been: 1961–62, $88.5 percent; 1962–63, $90.6 percent; 1963–64, $94.7 percent; 1964–65, $94.3 percent, and 1965–66, $94.1 percent.
The next table gives a classification of loans into those granted to finance the erection of new dwellings, and those granted to finance the purchase of dwellings already built. For the purposes of the statistics new dwellings are deemed to include those which have been built by the borrower during the 12 months preceding the granting of the loan. Particulars for 1965–66, with totals for earlier years, are given in the following table.
| Item | To Finance the Erection of New Dwellings | To Finance the Purchase of Dwellings Already Built | For Other and Unspecified Purposes | Totals | ||||
|---|---|---|---|---|---|---|---|---|
| No. | Amount | No. | Amount | No. | Amount | No. | Amount | |
| $(000) | $(000) | $(000) | $(000) | |||||
| Permanent societies | 429 | 2,347 | 2,123 | 8,611 | 944 | 4,753 | 3,496 | 15,711 |
| Terminating societies— | ||||||||
| By ballot | 336 | 1,574 | 1,340 | 6,175 | 415 | 1,591 | 2,091 | 9,340 |
| By auction | 476 | 2,345 | 2,226 | 10,207 | 570 | 2,444 | 3,272 | 14,996 |
| Totals all societies— | ||||||||
| 1965–66 | 1,241 | 6,266 | 5,689 | 24,993 | 1,929 | 8,788 | 8,859 | 40,047 |
| 1964–65 | 1,103 | 5,437 | 5,392 | 21,893 | 2,235 | 8,394 | 8,730 | 35,724 |
| 1963–64 | 950 | 4,112 | 4,581 | 17,723 | 2,041 | 7,886 | 7,572 | 29,721 |
| 1962–63 | 958 | 4,079 | 3,954 | 14,928 | 1,601 | 4,590 | 6,513 | 23,597 |
| 1961–62 | 1,009 | 4,204 | 4,300 | 15,530 | 1,564 | 4,422 | 6,873 | 24,156 |
Loan authorisations in 1965–66 showed an increase of $4.3 million on 1964–65, which was shared by both permanent and terminating societies.
The considerable number of loans shown for other and unspecified purposes is partly due to the fact that some societies are unable to give the necessary classification, so that it may be taken that the foregoing table understates the number of loans actually granted for the erection or purchase of dwellings.
LIABILITIES AND ASSETS—The liabilities and assets of building societies for each of the latest five years are given in the next table.
| Year | To Shareholders (Including Reserve Funds and Undivided Profits) | Deposits | Appropriations Not Taken Up, or in Trust | To Bankers and Other Creditors | Total Liabilities |
|---|---|---|---|---|---|
| $(thousand) | |||||
| 1961–62 | 92,532 | 29,142 | 4,136 | 3,288 | 129,098 |
| 1962–63 | 104,754 | 32,454 | 4,463 | 2,592 | 144,263 |
| 1963–64 | 117,560 | 38,676 | 4,806 | 2,906 | 163,949 |
| 1964–65 | 133,690 | 45.980 | 4,891 | 3,568 | 188,129 |
| 1965–66 | 151,132 | 51,261 | 5,131 | 3,275 | 211,799 |
| Year | Advances on Mortgage* | Advances on Shares | Other Investments and Assets | Cash in Hand and at Bank | Total Assets |
|---|---|---|---|---|---|
| *Includes balance owing on premiums on loans. | |||||
| $(thousand) | |||||
| 1961–62 | 114,670 | 1,906 | 12,182 | 340 | 129,098 |
| 1962–63 | 127,509 | 2,539 | 13,580 | 635 | 144,263 |
| 1963–64 | 142,081 | 3,008 | 18,255 | 605 | 163,949 |
| 1964–65 | 160,413 | 3,268 | 23,740 | 708 | 188,129 |
| 1965–66 | 180,161 | 3,792 | 27,069 | 777 | 211,799 |
The ratio of advances on mortgage to total assets for 1965–66 was 85.1 percent, a decrease on the figure for 1964–65, which was 85.3 percent.
GENERAL—The method of carrying on business by companies is now a proved system, a system for the incorporation of persons into a separate entity for trading purposes and providing a convenient method for the investment of capital and for the limitation of liability of the people associated in the company. The incorporation of a company with limited liability provides the framework of commercial and industrial life; private companies have become a usual form of business organisation for the small trader.
LEGISLATION—Comprehensive legislation relating to companies is contained in the Companies Act 1955, which came into force on 1 January 1957. An important principle in the legislation is the protection of shareholders, creditors, and the general public by the requirement that there must be the fullest practicable disclosure of information concerning the activities of companies. The annual financial statements must exhibit a true and complete account of a company's affairs and transactions. A prescribed form of presentation is required, and comparative figures for the previous year must be shown. A prospectus must be deposited with the Registrar of Companies before it is issued.
Any number of persons from two to 25 may form a private company; a public company must have at least seven members. A private company of not less than seven members may, under certain conditions, be reregistered as a public company.
The Companies Amendment Act 1963 restricts company takeovers and the Companies Amendment Act 1966 deals with deposits and debentures.
NEW COMPANIES REGISTERED—The following table shows for the last 11 years the number and aggregate nominal capital of new private companies registered.
In comparing one year with another it should not be overlooked that reregistrations, on account of reconstruction of companies or for other reasons, are included. Such reregistrations of large companies may have a considerable effect on the year's total, so far as capital is concerned.
The nominal capital shown for overseas companies is the total nominal capital of these companies and, of course, bears no relationship to their capital resources employed in New Zealand. It is shown merely as some indication of the relative size of overseas companies commencing business in this country.
| Year | Private Companies | Public Companies | Overseas Companies | |||
|---|---|---|---|---|---|---|
| Number | Nominal Capital | Number | Nominal Capital | Number | Nominal Capital | |
*Of this number one company was limited (as to capital) by guarantee. †Of this number one company was created under special, overseas Government charter and no capital information is available. ‡Of this number two companies were limited (as to capital) by guarantee. | ||||||
| $(000) | $(000) | $(000) | ||||
| 1955 | 2,564 | 24,401 | 19* | 9,083 | 12 | 3,210 |
| 1956 | 3,214 | 27,467 | 20 | 2,984 | 21 | 40,735 |
| 1957 | 3,462 | 28,222 | 25 | 2,888 | 26* | 129,854 |
| 1958 | 2,995* | 24,517 | 12 | 856 | 27 | 33,316 |
| 1959 | 2,685* | 28,009 | 24* | 819 | 28† | 65,380 |
| 1960 | 3,691 | 29,857 | 46‡ | 19,759 | 30 | 24,376 |
| 1961 | 3,531 | 30,204 | 25 | 24,166 | 11 | 17,339 |
| 1962 | 3,301 | 22,920 | 25 | 10,588 | 25* | 11,581 |
| 1963 | 4,107* | 30,358 | 26‡ | 6,315 | 32‡ | 37,460 |
| 1964 | 5,009* | 43,832 | 26 | 14,307 | 19 | 31,814 |
| 1965 | 5,504 | 36,779 | 37 | 25,379 | 22 | 23,602 |
The table following gives a classification of new companies registered in 1965 according to the amount of nominal capital.
| Amount of Nominal Capital | Private Companies | Public Companies | Overseas Companies | |||
|---|---|---|---|---|---|---|
| Number | Nominal Capital | Number | Nominal Capital | Number | Nominal Capital | |
| $ | $(000) | $(000) | $(000) | |||
| Under 2,000 | 1,364 | 920 | 1 | — | 2 | — |
| 2,000– 3,999 | 1,544 | 3,472 | 3 | 6 | 1 | 2 |
| 4,000– 5,999 | 985 | 4,190 | – | – | 2 | 8 |
| 6,000– 7,999 | 440 | 2,725 | – | – | 1 | 6 |
| 8,000– 9,999 | 235 | 1,944 | – | – | – | – |
| 10,000– 11,999 | 312 | 3,142 | – | – | 1 | 10 |
| 12,000– 13,999 | 113 | 1,371 | – | – | – | – |
| 14,000– 15,999 | 48 | 696 | 1 | 14 | – | – |
| 16,030– 17,999 | 42 | 680 | – | – | – | – |
| 18,000– 19,999 | 37 | 677 | – | – | 1 | 20 |
| 20,000– 29,999 | 209 | 4,469 | 2 | 40 | 1 | 20 |
| 30,000– 39,999 | 44 | 1,406 | 1 | 30 | – | – |
| 40,000– 99,999 | 104 | 5,626 | 6 | 350 | 3 | 170 |
| 100,000–199–999 | 14 | 2,005 | 5 | 611 | – | – |
| 200,000 and over | 13 | 3,456 | 17 | 24,327 | 6 | 23,366 |
| Limited by guarantee, etc. | – | – | 1 | – | 4 | – |
| Totals | 5,504 | 36,779 | 37 | 25,379 | 22 | 23,602 |
The number of private company registrations in 1965 was 5,504. This represented an increase of 495 (9.0 percent) over the 5,009 registered in 1964. The nominal capital of companies registered showed an increase of 17.1 million, or 16.9 percent.
The extent of changes in the number and nominal capital of new registrations of private companies between 1955 and 1965, expressed as percentages of the totals, is shown in the following table.
| Amount of Nominal Capital | Number | Amount of Capital | ||
|---|---|---|---|---|
| 1955 | 1965 | 1955 | 1965 | |
| $ | percent | |||
| Under 2,000 | 15.7 | 24.8 | 1.3 | 2.5 |
| 2,000– 9,999 | 55.5 | 58.2 | 25.4 | 33.5 |
| 10,000–19,999 | 17.8 | 10.0 | 23.3 | 17.9 |
| 20,000 and over | 11.0 | 7.0 | 50.0 | 46.1 |
| Totals | 100.0 | 100.0 | 100.0 | 100.0 |
Compiled from published sources, the following summary gives the stated objects of all new companies registered during 1963–1965. Because of possible inaccuracies in the source data, and the difficulty of precise classification by industrial group from the information available, the figures should be regarded as approximate only.
| Industry Group | 1963 | 1964 | 1965 |
|---|---|---|---|
| Agriculture and livestock production | 377 | 545 | 648 |
| Forestry, hunting, and fishing | 21 | 44 | 40 |
| Mining and quarrying | 18 | 21 | 24 |
| Manufacturing— | |||
| Food, beverages, and tobacco | 23 | 37 | 41 |
| Textile, footwear, and apparel | 38 | 42 | 49 |
| Woodwork and furniture | 49 | 69 | 66 |
| Machinery | 78 | 75 | 136 |
| Transport equipment | 156 | 125 | 163 |
| Other | 153 | 199 | 189 |
| Construction | 347 | 502 | 624 |
| Commerce— | |||
| Wholesale and retail | 1,609 | 1,808 | 1,787 |
| Banks and other financial institutions | 195 | 209 | 207 |
| Real estate | 460 | 608 | 677 |
| Other | 10 | 10 | 15 |
| Transport, storage, and communication | 128 | 174 | 200 |
| Services— | |||
| Community and business | 89 | 116 | 136 |
| Personal | 319 | 355 | 382 |
| Other | 23 | 33 | 31 |
| Miscellaneous or not known | 72 | 82 | 148 |
| Totals | 4,165 | 5,054 | 5,563 |
Companies Carrying on Business—Detailed statistics of all companies carrying on business were last compiled for the 1947 year. Apart from numbers on the register, data for subsequent years deal only with new registrations, deletions, and changes in nominal capital.
For the calendar year 1965, 3,987 public and private companies which previously had a total nominal capital of $285.5 million increased their nominal capital by $209.8 million to $495.3 million. There were 14 cases with increases of $2 million or more and these accounted for $74.8 million of the total increase. Overseas companies registered in New Zealand but not included in the preceding figures increased their nominal capital by $25.8 million from $47.3 million to $73.1 million. In 28 cases local companies reduced their nominal capital by a total of $1.7 million from $3.6 million to $1.9 million. During 1965 there were 878 companies deleted from the Company Register, their total nominal capital being $5.8 million; in the previous year 740 companies with total nominal capital of $5 4 million were, deleted.
Companies on Register—The number of public companies on the register at 31 March 1965 was 1,609, and the number of private companies 52,638. At 31 March 1966 public companies numbered 1,651 and private companies 57,101. These figures were supplied by the Registrar of Companies, no further particulars being available.
ANALYSIS OF PUBLIC COMPANY FINANCIAL STATEMENTS—Since 1953 the Reserve Bank of New Zealand has undertaken an analysis of the annual financial statements of a sample of public companies in New Zealand to obtain information concerning company finance and the capital market. Results of these analyses are published in the Reserve Bank Bulletin.
The basis of coverage includes only companies of New Zealand domicile whose income is wholly or mainly from New Zealand sources. This definition excludes, among others, companies carrying on insurance, some stock and station agents, and shipping companies. The number of companies covered has been: 1962–63, 303; 1963–64, 308; 1964–65, 308; 1965–66, 300. The surveys for 1964–65 and 1965–66 analyses accounts received during the 12 months ended 30 June 1966, whereas previous surveys covered accounts of companies balancing during a March year. Interpretation over periods longer than two years should therefore be based on the direction and relative size of changes in aggregates rather than on their absolute size.
Changes in sources of funds over the latest four years are shown in the following table.
| Source of Funds | 1962–63 | 1963–64 | 1964–65 | 1965–66 |
|---|---|---|---|---|
| percent | ||||
| Retained profits and depreciation | 46.3 | 48.5 | 47.7 | 46.3 |
| Other long-term sources | 41.0 | 25.8 | 29.0 | 24.9 |
| All long-term sources | 87.3 | 74.3 | 76.7 | 71.2 |
| Short-term sources | 12.7 | 25.7 | 23.3 | 28.8 |
| Totals | 100.0 | 100.0 | 100.0 | 100,0 |
The next table sets out proportionately the use of funds.
| Use of funds | 1962–63 | 1963–64 | 1964–65 | 1965–66 |
|---|---|---|---|---|
| percent | ||||
| Property and plant | 64.4 | 54.6 | 51.7 | 56.7 |
| Long-term investment | 7.4 | 15.0 | 7.5 | 4.3 |
| 71.8 | 69.6 | 59.2 | 61.0 | |
| Stocks | 10.9 | 13.0 | 20.1 | 16.6 |
| Debtors | 10.1 | 12.6 | 19.1 | 19.5 |
| Other short-term | 7.2 | 4.8 | 1.6 | 2.9 |
| Totals | 100.0 | 100.0 | 100.0 | 100.0 |
Appropriation of income of 300 New Zealand public companies in the latest two years is shown in the following table.
| Item | 1964–65 | 1965–66 |
|---|---|---|
| Income for year— | $(000) | |
| Trading | 154,550 | 170,108 |
| Investment income | 3,500 | 3,902 |
| Other non-trading income | 816 | 1,056 |
| Total income | 158,866 | 175,066 |
| Deductions— | ||
| Depreciation | 38,172 | 42,760 |
| Interest on fixed liabilities | 9,834 | 11,372 |
| Directors' fees | 1,228 | 1,312 |
| Tax on current year's income | 52,842 | 57,370 |
| Minority interests | 758 | 876 |
| Total deductions | 102,834 | 113,690 |
| Net profit after tax | 56,032 | 61,376 |
| Previous year's adjustments— | ||
| Tax | 210 | 678 |
| Other | 1,992 | 1,816 |
| Available for appropriation | 58,234 | 63,870 |
| Appropriations— | ||
| Goodwill, etc., written off | 1,490 | 1,430 |
| Ordinary dividends | 28,186 | 31,614 |
| Preference dividends | 1,732 | 2,008 |
| Retained in reserves | 26,826 | 28,818 |
| Total appropriations | 58,234 | 63,870 |
Table of Contents
DEVELOPMENT OF LIFE ASSURANCE—Life assurance has expanded beyond the basic original concept of enabling a breadwinner to secure substantial death cover by means of small periodic payments and so provide resources for his dependants on the occurrence of his death. Whole-life assurance has been widely supplemented by endowment assurance which provides a sum payable at the expiry of a specified period or the death of the life assured if that should occur first. Under this category life insurance companies sell policies with titles such as “family-income”, “education”, “mortgage-protection”, or “retirement”, and persons taking out policies regard them as a means of systematic saving. Government encouragement is given by way of income-tax concessions on premiums paid, this approach being common to the governments of many countries. A specialised form of savings and insurance service given by the life offices which has grown tremendously in recent years is that involving the underwriting of the benefits of private superannuation schemes. The life offices also offer a superannuation scheme, approved for special tax concessions, which is available to any self-employed person and indeed to any person not already a member of an approved scheme.
The steady flow of funds to insurance companies by the payment of premiums are in the form of contractual saving, and the investment of reserve funds has become a major influence on the financial market. Life-assurance companies are leading lenders of long-term funds to the private sector and important investors in Government and local authority securities. Life-assurance and annuity funds in 1966 had reached $837.5 million, of which nearly 42 percent was invested in mortgages on property, 20 percent in Government securities, and nearly 10 percent in local authority securities. Premium income for the year 1965–66 totalled $95.8 million.
In the year 1965–66 there were 165,958 new policies issued for a total sum assured of $674.0 million, or approximately $252 per head of population. The total number of policies in force at the end of the year was 1,910,642 for a total life assurance of $4,069.8 million. (These figures exclude annuities. Annuity policies issued during 1965–66 numbered 176 assuring $2.1 million. The total annuities in force at the end of the year was 1,874 assuring an annual amount of $10.3 million).
INTERNATIONAL COMPARISON—On the basis of the ratio of the value of life insurance in force to the national income, New Zealand is third to Canada and the United States, as shown in the following table. (Source: Life Insurance Fact Book, 1966.)
| Country | 1959 | 1964 |
|---|---|---|
| percent | ||
| Canada | 162 | 190 |
| United States | 135 | 154 |
| New Zealand | 105 | 131 |
| Netherlands | 112 | 120 |
| Australia | 67 | 87 |
| United Kingdom | 68 | 84 |
GENERAL—The statutory provisions affecting life assurance in New Zealand are in the main contained in the Life Insurance Act 1908; the Inalienable Life Annuities Act 1910; and the Government Life Insurance Act 1953.
There are 22 life-assurance offices conducting business in New Zealand at the present time. Of these, three are purely New Zealand institutions—namely, the Government Life Insurance Office, New Zealand Insurance (Life and General) Co. Ltd., and the Metropolitan Life Assurance Co. of New Zealand Ltd., whilst two, the Provident Life Assurance Co. and the Dominion Life Assurance Office of New Zealand Ltd., are registered in this country.
The balance dates of the offices vary between June and May of the following year, the financial year of the majority ending in December. The statistics here given relate exclusively to business transacted in New Zealand. Further information is available in the Report on Insurance Statistics.
LIFE ASSURANCES Ordinary and Industrial—The progress of life assurance in New Zealand is illustrated by the following diagram, which shows the amount of new business transacted.
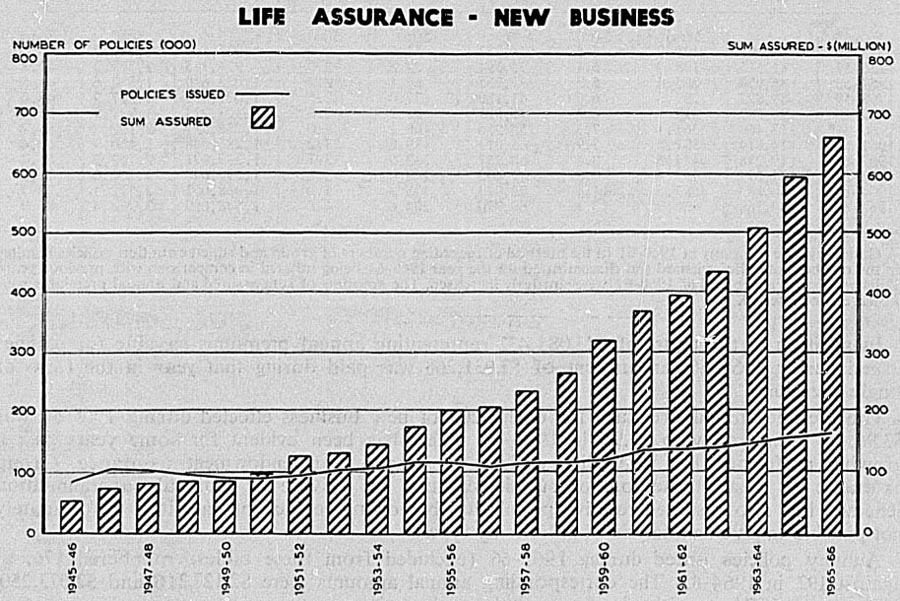
A summary of annual life assurance business is given in the following table.
| Year | Value of Policies Issued | Value of Policies Discontinued | Value of Policies Existing at End of Year | Annual Premiums on Existing Policies | Number of Policies in Force |
|---|---|---|---|---|---|
| $(m) | $(m) | $(m) | $(m) | (000) | |
| 1955–56 | 200.1 | 59.4 | 1,324.3 | 41.5 | 1,463 |
| 1956–57 | 206.3 | 66.2 | 1,464.4 | 44.9 | 1,494 |
| 1957–58 | 233.3 | 74.3 | 1,623.4 | 48.6 | 1,528 |
| 1958–59 | 264.5 | 84.0 | 1,803.9 | 52.1 | 1,561 |
| 1959–60 | 319.8 | 97.9 | 2,025.7 | 55.4 | 1,598 |
| 1960–61 | 368.0 | 115.2 | 2,278.4 | 59.7 | 1,695 |
| 1961–62 | 396.6 | 127.4 | 2,547.8 | 64.4 | 1,723 |
| 1962–63 | 435.2 | 140.2 | 2,842.8 | 69.4 | 1,751 |
| 1963–64 | 508.6 | 156.0 | 3,195.5 | 75.5 | 1,793 |
| 1964–65 | 595.6 | 183.3 | 3,609.1 | 82.8 | 1,846 |
| 1965–66 | 674.0 | 213.3 | 4,069.8 | 91.1 | 1,911 |
While the upward trend shown in the figures has been influenced both by the rate of monetary depreciation and the normal growth of population, the course of life-assurance business, particularly during the past decade, has been one of steady progress. In the last 11 years the face value of new business written and the amount of cover in force have more than trebled.
Total discontinuances include surrenders and lapses, as well as policies maturing or terminated by death.
ORDINARY LIFE ASSURANCE: Progress of Business—A table showing the progress of business over a' period of 11 years is given below. Annuities are excluded from these figures.
| Year | Policies Issued | Policies Discontinued | Policies Existing at End of Year | ||||||
|---|---|---|---|---|---|---|---|---|---|
| Number | Sum Assured | Annual Premiums | Number | Sum Assured | Annual Premiums | Number | Sum Assured | Annual Premiums | |
| *A change by one company in 1960–61 in the method of recording numbers of group and superannuation policies resulted in the number of policies issued and discontinued for the year 1960–61 being inflated in comparison with previous years. Policies existing at the end of 1960–61 were similarly increased. The amounts of sum assured and annual premiums were however, not affected. | |||||||||
| $(m) | $(m) | $(m) | $(m) | $(m) | $(m) | ||||
| 1955–56 | 83,391 | 191.2 | 5.5 | 34,251 | 52.8 | 2.0 | 927,934 | 1,240.7 | 37.4 |
| 1956–57 | 81,575 | 198.0 | 5.4 | 35,394 | 59.5 | 2.0 | 974,115 | 1,379.3 | 40.8 |
| 1957–58 | 86,950 | 225.4 | 5.9 | 37,255 | 67.1 | 2.2 | 1,023,810 | 1,537.6 | 44.5 |
| 1958–59 | 89,822 | 257.3 | 6.0 | 41,180 | 77.0 | 2.5 | 1,072,452 | 1,717.9 | 48.0 |
| 1959–60 | 96,582 | 313.1 | 6.2 | 45,821 | 91.2 | 2.8 | 1,123,213 | 1,939.9 | 51.4 |
| 1960–61* | 117,468 | 361.1 | 7.3 | 55,956 | 108.2 | 3.0 | 1,238,797 | 2,192.8 | 55.7 |
| 1961–62 | 114,874 | 387.5 | 7.9 | 65,011 | 119.8 | 3.2 | 1,288,688 | 2,460.7 | 60.4 |
| 1962–63 | 119,238 | 424.5 | 8.4 | 68,757 | 132.0 | 3.3 | 1,339,171 | 2,753.2 | 65.4 |
| 1963–64 | 131,279 | 497.4 | 9.8 | 71,403 | 148.0 | 3.7 | 1,399,047 | 3,102.6 | 71.5 |
| 1964–65 | 140,865 | 583.5 | 11.4 | 72,074 | 175.3 | 4.2 | 1,468,051 | 3,512.1 | 78.7 |
| 1965–66 | 149,768 | 660.9 | 13.1 | 69,720 | 204.6 | 4.8 | 1,548,099 | 3,968.4 | 86.9 |
In addition to the figure of $13,081,432 representing annual premiums payable for policies issued during 1965–66, an amount of $3,931,268 was paid during that year in the form of single premiums.
The average annual premium for each $200 of new business effected during 1965–66 was $3.96, as compared with $3.95 in 1964–65. There has been evident for some years past a growing preference for whole-life policies or longer term endowment assurance. Group assurance as a substitute for, or supplementation of, private or national superannuation schemes, has also assumed relative popularity, but owing to lack of data it is unfortunately not possible to give an analysis of policies by types.
Annuity policies issued during 1965–66 (excluded from these tables) numbered 176, as against 192 in 1964–65. The corresponding annual amounts were $2,127,216 and $2,073,250. There were 1,874 annuities in force at the end of the year assuring an annual amount of $10,327,816.
A prominent feature of new insurances of recent years has been the increase in the average amount of the sum assured per policy.
| Year | Average Amount | Increase |
|---|---|---|
| *Decrease influenced by change in method of recording by one company. | ||
| $ | $ | |
| 1954–55 | 1,994 | 168 |
| 1955–56 | 2,294 | 300 |
| 1956–57 | 2,428 | 134 |
| 1957–58 | 2,594 | 166 |
| 1958–59 | 2,864 | 270 |
| 1959–60 | 3,242 | 378 |
| 1960–61 | 3,074 | -168* |
| 1961–62 | 3,374 | 300 |
| 1962–63 | 3,560 | 186 |
| 1963–64 | 3,788 | 228 |
| 1964–65 | 4,142 | 354 |
| 1965–66 | 4,412 | 270 |
The growth in the average amount of the sum assured per policy shown in the above table is due to several factors, including the changing types of policies being issued, and the increasing numbers of such policies which have a high cover, for example, cover for staff superannuation purposes by business concerns, temporary insurance with a high death-risk cover, multiple death benefit and family benefit policies having a high initial cover, and “unit” policies whereby a single premium provides a high initial death cover.
The average face value of discontinued policies during 1965–66 was $2,934, while the average face value of policies in force at the end of the year was $2,564.
Particulars of Policies Discontinued—The causes of discontinuances during each of the latest five years are contained in the next table.
| Year | Death | Maturity | Surrender | Lapse | Other Causes | Total |
|---|---|---|---|---|---|---|
| Number of Policies | ||||||
| 1961–62 | 5,906 | 15,514 | 23,333 | 11,454 | 8,804 | 65,011 |
| 1962–63 | 6,240 | 15,535 | 24,434 | 12,168 | 10,380 | 68,757 |
| 1963–64 | 6,537 | 16,566 | 24,058 | 14,719 | 9,523 | 71,403 |
| 1964–65 | 6,538 | 17,260 | 27,168 | 14,430 | 6,684 | 72,080 |
| 1965–66 | 6,978 | 18,143 | 25,370 | 15,046 | 4,183 | 69,720 |
| Sum Assured $(m) | ||||||
| 1961–62 | 8.2 | 9.8 | 49.2 | 31.1 | 21.4 | 119.8 |
| 1962–63 | 8.9 | 10.3 | 55.5 | 36.0 | 21.2 | 132.0 |
| 1963–64 | 9.6 | 10.7 | 62.2 | 38.3 | 27.3 | 148.0 |
| 1964–65 | 10.4 | 11.7 | 72.3 | 46.8 | 34.1 | 175.3 |
| 1965–66 | 12.6 | 12.6 | 84.5 | 51.7 | 43.1 | 204.6 |
Reducing the sums assured in the previous table to a percentage basis, the results are as follows.
| Year | Death | Maturity | Surrender | Lapse | Other Causes | Total |
|---|---|---|---|---|---|---|
| percent | ||||||
| 1961–62 | 6.9 | 8.2 | 41.1 | 26.0 | 17.8 | 100.0 |
| 1962–63 | 6.7 | 7.8 | 42.1 | 27.3 | 16.1 | 100.0 |
| 1963–64 | 6.4 | 7.2 | 42.0 | 25.9 | 18.4 | 100.0 |
| 1964–65 | 5.9 | 6.7 | 41.2 | 26.7 | 19.5 | 100.0 |
| 1965–66 | 6.2 | 6.1 | 41.3 | 25.3 | 21.1 | 100.0 |
Revenue and Expenditure—A statement of revenue and expenditure under the various heads illustrates the course of ordinary life-assurance business in New Zealand during the past five years. Transfers between head offices and branches are included. The ratios of management expenses to premium income and to total revenue are also given.
| Item | 1961–62 | 1962–63 | 1963–64 | 1964–65 | 1965–66 |
|---|---|---|---|---|---|
| Revenue | $(000) | ||||
| New and renewal premiums | 63,128 | 67,929 | 73,869 | 82,134 | 91,739 |
| Consideration for annuities | 2,078 | 564 | 690 | 688 | 1,186 |
| Interest, rents, etc. | 27,323 | 30,434 | 34,596 | 39,054 | 44,138 |
| Transfers | 867 | 227 | 721 | 444 | 292 |
| Other revenue | 325 | 327 | 239 | 334 | 1,170 |
| Totals, revenue | 93,721 | 99,481 | 110,115 | 122,654 | 138,525 |
| Expenditure | |||||
| Claims by death and maturity | 22,297 | 22,948 | 25,537 | 27,827 | 31,185 |
| Annuities | 367 | 435 | 449 | 490 | 559 |
| Surrenders | 6,234 | 7,103 | 7,945 | 9,548 | 11,491 |
| Cash bonuses | 110 | 131 | 133 | 147 | 181 |
| Commissions | 4,584 | 4,933 | 5,873 | 6,740 | 7,738 |
| Other management | 5,671 | 6,269 | 6,852 | 7,786 | 8,715 |
| Rates and taxes | 2,651 | 2,921 | 3,224 | 3,445 | 3,854 |
| Transfers | 854 | 248 | 261 | 109 | 2,374 |
| Other expenditure | 443 | 526 | 393 | 394 | 498 |
| Totals, expenditure | 43,211 | 45,515 | 50,667 | 56,486 | 66,595 |
| Ratios | percent | ||||
| Management expenses to premium income | 16.2 | 16.5 | 17.2 | 17.7 | 17.9 |
| Management expenses to total revenue | 10.9 | 11.3 | 11.6 | 11.8 | 11.9 |
Of the excess of revenue as shown in the above statements a large proportion is transferred annually to reserves to meet future payments under policies.
INDUSTRIAL LIFE ASSURANCE: Progress of Business—In principle there is no difference between ordinary and industrial assurance. With the latter class of insurance the premiums are payable at shorter intervals than three months and are usually collected personally by agents. Companies are required to deposit with the Minister of Finance forms of policy tables, rates of premiums, and other documents. Restrictions are placed on the forfeiture of policies in default of payments or other requirements. During the last decade particularly, the popularity of this type of life assurance has declined, the number of policies issued in 1965–66 being only 54.2 percent of the 1955–56 total. Of the 22 life offices, only five engage in industrial business.
A summary of the course of industrial-assurance business is given in the following table.
| Year | Policies Issued | Policies Discontinued | Policies Existing at End of Year | ||||||
|---|---|---|---|---|---|---|---|---|---|
| Number | Sum Assured | Annual Premiums | Number | Sum Assured | Annual Premiums | Number | Sum Assured | Annual Premiums | |
| $(m) | $(000) | $(m) | $(000) | $(m) | $(000) | ||||
| 1955–56 | 29,885 | 8.8 | 409 | 42,435 | 6.5 | 352 | 535,188 | 83.6 | 4,070 |
| 1956–57 | 27,410 | 8.2 | 383 | 42,085 | 6.8 | 356 | 520,513 | 85.0 | 4,097 |
| 1957–58 | 26,506 | 7.9 | 368 | 42,734 | 7.1 | 376 | 504,285 | 85.8 | 4,089 |
| 1958–59 | 23,676 | 7.2 | 338 | 39,329 | 6.9 | 361 | 488,632 | 86.0 | 4,065 |
| 1959–60 | 21,848 | 6.6 | 315 | 35,312 | 6.8 | 360 | 475,168 | 85.8 | 4,019 |
| 1960–61 | 20,312 | 6.9 | 317 | 38,822 | 7.1 | 370 | 456,658 | 85.7 | 3,966 |
| 1961–62 | 20,577 | 9.1 | 376 | 43,250 | 7.6 | 391 | 433,985 | 87.2 | 3,952 |
| 1962–63 | 19,284 | 10.6 | 415 | 41,026 | 8.2 | 408 | 412,243 | 89.6 | 3,959 |
| 1963–64 | 18,144 | 11.3 | 423 | 36,827 | 8.0 | 380 | 393,560 | 92.9 | 4,001 |
| 1964–65 | 17,242 | 12.1 | 444 | 32,675 | 8.0 | 374 | 378,127 | 97.0 | 4,072 |
| 1965–66 | 16,190 | 13.1 | 463 | 31,774 | 8.7 | 388 | 362,543 | 101.4 | 4,147 |
The average sum assured under each policy of new business effected in 1965–66 amounted to $810 with an average annual premium of $28.60. Corresponding averages for 1955–56 were $296 and $13.70.
Particulars of Policies Discontinued—A summary of the number of industrial policies and the corresponding assurances discontinued according to the several causes is now given in the form of a five-year table. A minus sign before items in this and the next table indicates an increase in number or value following adjustments concerned with revision of policies.
| Year | Death | Maturity | Surrender | Lapse | Other Causes | Total |
|---|---|---|---|---|---|---|
| Number of Policies | ||||||
| 1961–62 | 1,694 | 29,841 | 6,414 | 5,187 | 114 | 43,250 |
| 1962–63 | 1,598 | 27,295 | 6,614 | 5,693 | -174 | 41,026 |
| 1963–64 | 1,741 | 23,400 | 6,641 | 4,936 | 109 | 36,827 |
| 1964–65 | 1,616 | 19,451 | 6,443 | 4,807 | 358 | 32,675 |
| 1965–66 | 1,529 | 18,390 | 5,900 | 5,199 | 756 | 31,774 |
| Sum Assured $(000) | ||||||
| 1961–62 | 226 | 3,293 | 1,967 | 2,108 | 31 | 7,626 |
| 1962–63 | 222 | 3,050 | 2,037 | 2,917 | -12 | 8,214 |
| 1963–64 | 263 | 2,723 | 2,003 | 2,969 | 8 | 7,966 |
| 1964–65 | 233 | 2,486 | 2,009 | 3,188 | 66 | 7,982 |
| 1965–66 | 255 | 2,405 | 2,001 | 3,898 | 138 | 8,697 |
The amount written off in each year is proportionately greater in the industrial than in the ordinary branch. Of the assurance in force at the end of the previous year, 5.8 percent of the ordinary became void in 1965–66, as compared with 9.0 percent of the industrial.
In the following table the sums assured for the various classes of discontinuances are expressed as percentages of the total discontinuances.
| Year | Death | Maturity | Surrender | Lapse | Other Causes | Total |
|---|---|---|---|---|---|---|
| percent | ||||||
| 1961–62 | 3.0 | 43.2 | 25.8 | 27.6 | 0.4 | 100.0 |
| 1962–63 | 2.7 | 37.1 | 24.8 | 35.5 | -0.1 | 100.0 |
| 1963–64 | 3.3 | 34.2 | 25.1 | 37.3 | 0.1 | 100.0 |
| 1964–65 | 2.9 | 31.2 | 25.2 | 39.9 | 0.8 | 100.0 |
| 1965–66 | 2.9 | 27.7 | 23.0 | 44.8 | 1.6 | 100.0 |
Discontinuances by death are relatively lower in industrial than in ordinary business, and the proportion of policies reaching maturity is higher. The explanation probably lies in the comparatively short terms for which industrial policies are issued, and the fact that premiums are usually collected personally by agents. A trend is noticeable in the above table of the fall in the percentage of discontinuance due to maturities and the marked increase in the percentage of lapsed policies.
Revenue and Expenditure—The several items of revenue and expenditure in industrial business are shown in the following five-yearly table, together with the ratios of management expenses to premium income and to total revenue. Transfers between head offices and branches are again included.
| Item | 1961–62 | 1962–63 | 1963–64 | 1964–65 | 1965–66 |
|---|---|---|---|---|---|
| *Includes a large transfer from an overseas branch to one life company. | |||||
| Revenue | $(000) | ||||
| Premiums | 3,902 | 3,907 | 3,920 | 3,994 | 4,053 |
| Interest, rents, etc. | 1,818 | 1,898 | 1,967 | 2,133 | 2,218 |
| Transfers | 49 | 14 | 971* | 39 | 41 |
| Other revenue | 17 | 24 | 35 | 15 | 59 |
| Totals, revenue | 5,786 | 5,844 | 6,893 | 6,181 | 6,371 |
| Expenditure | |||||
| Claims by death and maturity | 4,075 | 3,808 | 3,518 | 3,328 | 3,365 |
| Surrenders | 388 | 461 | 471 | 503 | 523 |
| Commissions | 536 | 476 | 477 | 516 | 527 |
| Other management | 651 | 817 | 811 | 831 | 863 |
| Rates and taxes | 191 | 170 | 181 | 181 | 191 |
| Transfers | – | – | – | — | — |
| Other expenditure | 43 | 97 | 99 | 61 | 102 |
| Totals, expenditure | 5,884 | 5,830 | 5,558 | 5,421 | 5,571 |
| Ratio | percent | ||||
| Management expenses to premium income | 30.4 | 33.1 | 32.9 | 33.7 | 34.3 |
| Management expenses to total revenue | 20.5 | 22.1 | 18.7 | 21.8 | 21.8 |
The fall in the ratio of management expenses to total revenue in 1963–64 was due to the increase in transfers in the latter. The ratio excluding transfers was 21.8 percent.
The higher ratio of management expenses to premium income in the industrial branch is largely accounted for by the cost of renewal commissions on collection of premiums and the greater amount of office work involved in relation to the amount assured. In the ordinary branch, commission (new and renewal) in 1965–66 was equivalent to 8.4 percent of the premium income, and in the industrial branch to 13.0 percent. Excluding commission, the ratio of management expenses to premium income was 21.3 percent in the industrial branch, as against 9.5 percent in the ordinary.
LIFE-ASSURANCE DEATH RATES—The following table shows for the period 1955–56 to 1965–66 the death rate per thousand policies exposed to risk in each year. In computing these rates all policies which were in force for any portion of the year have been taken into account. The much lower death rate among policyholders, compared with that for the general population (8.68 at 31 December 1965), points to a lower average age in the insured group, a normal consequence of rapid growth in the life-assurance field.
| Year | Death Rate per 1,000 Policies | ||
|---|---|---|---|
| Ordinary Life Assurance | Industrial Life Assurance | Ordinary and Industrial Combined | |
| 1955–56 | 4.21 | 4.12 | 4.18 |
| 1956–57 | 4.34 | 3.65 | 4.09 |
| 1957–58 | 4.31 | 3.87 | 4.16 |
| 1958–59 | 4.57 | 3.58 | 4.25 |
| 1959–60 | 4.36 | 3.60 | 4.13 |
| 1960–61 | 4.40 | 3.26 | 4.08 |
| 1961–62 | 4.36 | 3.55 | 4.15 |
| 1962–63 | 4.43 | 3.53 | 4.21 |
| 1963–64 | 4.44 | 4.05 | 4.35 |
| 1964–65 | 4.25 | 3.93 | 4.18 |
| 1965–66 | 4.31 | 3.88 | 4.23 |
LIABILITIES AND ASSETS—The principal items in the balance sheets of life-assurance companies are summarised below for the three latest years. Both classes of assurance are represented in the figures, which, as in the previous tables, relate to New Zealand business only. In the case of some companies other branches of insurance business are included.
Aggregate liabilities are first shown.
| Liabilities | 1963–64 | 1964–65 | 1965–66 |
|---|---|---|---|
| $(m) | |||
| Paid-up share capital | 440 | 1,616 | 1,626 |
| Life-assurance and annuity funds | 697,876 | 764,736 | 837,512 |
| Depreciation, reserve, and other special funds | 10,666 | 12,191 | 13,407 |
| Claims admitted but not paid | 5,313 | 5,649 | 5,386 |
| Other liabilities | 9,723 | 12,921 | 15,486 |
| Totals | 724,018 | 797,113 | 873,418 |
The assets of the New Zealand branches at the end of each of the three latest years were as follows.
| Assets | Amount | Percentage of Totals | ||||
|---|---|---|---|---|---|---|
| 1963–64 | 1964–65 | 1965–66 | 1963–64 | 1964–65 | 1965–66 | |
| $(m) | percent | |||||
| Mortgages on property | 315.4 | 332.9 | 364.6 | 43.6 | 41.8 | 41.8 |
| Loans on policies | 21.2 | 23.6 | 27.1 | 2.9 | 2.9 | 3.1 |
| New Zealand Government securities | 141.2 | 157.7 | 174.6 | 19.5 | 19.8 | 20.0 |
| Securities of other Governments | – – | 0.6 | 0.5 | – – | 0.1 | 0.1 |
| Local authority securities | 93.2 | 89.9 | 85.0 | 12.9 | 11.3 | 9.7 |
| Land, buildings and houses | 51.1 | 62.1 | 69.2 | 7.0 | 7.8 | 7.9 |
| Other investments | 80.6 | 105.5 | 127.6 | 11.1 | 13.2 | 14.6 |
| Outstanding premiums | 7.2 | 8.2 | 9.2 | 1.0 | 1.0 | 1.0 |
| Interest accrued, etc. | 7.1 | 7.9 | 8.3 | 1.0 | 1.0 | 1.0 |
| Cash | 2.6 | 3.8 | 2.1 | 0.4 | 0.5 | 0.2 |
| Other assets | 4.3 | 4.9 | 5.2 | 0.6 | 0.6 | 0.6 |
| Totals | 724.0 | 797.1 | 873.4 | 100.0 | 100.0 | 100.0 |
Investments in mortgages, which rose steadily to 46.9 percent of total assets in 1961–62, have since declined to 41.8 percent in 1965–66, as against 41.3 percent in 1955–56; increased investment has been made in Government securities in recent years, but investments in local authority securities continue to decline. Other investments (chiefly company shares and debentures) are gaining in popularity and now comprise 14.6 percent of the total.
For 1965–66 the average rate of interest earned on the life funds of both departments was $12.24 percent, compared with $11.69 during 1964–65. This rate was calculated by taking the arithmetic mean of funds at the beginning and end of the year less half the amount of interest, etc., earned.
The following diagram illustrates the expansion that has taken place in recent years in the assets of the New Zealand branches of life-assurance companies. This, of course, is a natural consequence of the huge increase in the amount of business. In composite insurance offices, receipts of life assurance and annuity business must be treated as a separate fund, and the interests of the policyholders are safeguarded by the fact that these funds are available only for liabilities arising from such business.
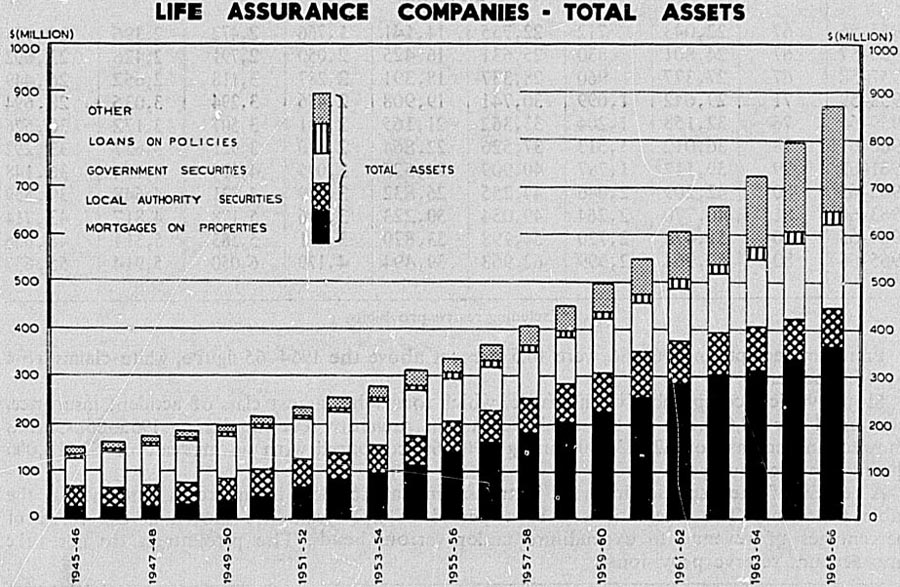
The diagram also shows the trend in the class of security in which the funds have been invested. Over the last 20 years there has been a large expansion in investment on property mortgages, which include loans for home ownership as well as commercial premises, although the percentage of these funds to total assets has declined in recent years.
GENERAL—There are three principal classes of accident insurance transacted in New Zealand. These are: (a) personal, covering accidents, sickness, etc.; (b) Employers' liability under statutory or common law; and (c) Motor vehicle insurance, providing both comprehensive coverage and compulsory third-party risks cover. Other classes of accident insurance include the Insurance of plate glass, television sets, luggage, and livestock.
The number of accident insurance offices represented in the statistics for 1965–66 is 80, the head offices of the companies concerned being domiciled as follows: Great Britain, 29; Australia, 17; United States of America, 4; Hong Kong, 2; and New Zealand, 28.
Of the New Zealand offices only 13, including the State Insurance Office, may be stated to be competitive in the ordinary sense of the term, the remainder having been formed by trade associations, etc., on a more or less co-operative basis. In the main an office of this latter type conducts one class of accident insurance business only, according to the nature of the association with which it is connected.
REVENUE AND EXPENDITURE—The following table shows the principal items of revenue and expenditure. Premiums and claims are net, i.e., after deductions for acceptances of reinsurance, whether effected locally or overseas, have been taken into account.
| Year | Number of Offices | Revenue | Expenditure | ||||||
|---|---|---|---|---|---|---|---|---|---|
| Premiums | Other Revenue | Total* | Claims* | Commission | Salaries | Other Expenses | Total* | ||
| *Excluding reserve provisions. | |||||||||
| $(thousand) | |||||||||
| 1955–56 | 67 | 22,043 | 712 | 22,755 | 14,141 | 1,766 | 2,472 | 2,396 | 20,774 |
| 1956–57 | 67 | 24,801 | 830 | 25,631 | 16,425 | 2,050 | 2,791 | 2,426 | 23,692 |
| 1957–58 | 67 | 27,377 | 960 | 28,337 | 18,391 | 2,287 | 3,118 | 2,652 | 26,449 |
| 1958–59 | 71 | 29,642 | 1,099 | 30,741 | 19,908 | 2,456 | 3,294 | 3,036 | 28,694 |
| 1959–60 | 76 | 32,158 | 1,204 | 33,362 | 21,165 | 2,681 | 3,507 | 3,172 | 30,526 |
| 1960–61 | 78 | 36,012 | 1,513 | 37,526 | 22,864 | 2,870 | 3,921 | 3,637 | 33,292 |
| 1961–62 | 79 | 39,112 | 1,797 | 40,909 | 24,525 | 3,095 | 4,374 | 4,154 | 36,148 |
| 1962–63 | 80 | 42,209 | 2,046 | 44,255 | 26,832 | 3,249 | 4,831 | 4,648 | 39,559 |
| 1963–64 | 81 | 46,770 | 2,264 | 49,034 | 30,223 | 3,496 | 5,178 | 4,817 | 43,714 |
| 1964–65 | 80 | 51,478 | 2,720 | 54,198 | 33,870 | 3,891 | 5,583 | 5,311 | 48,656 |
| 1965–66 | 80 | 59,964 | 2,999 | 62,963 | 39,494 | 4,179 | 6,050 | 5,914 | 55,637 |
Premium receipts in 1965–66 were 16.5 percent above the 1964–65 figure, while claims rose by 16.6 percent.
Motor vehicle comprehensive insurance, which forms the largest class of accident insurance, accounted for $2,617,000 of the total increase in premium revenue during 1965–66. Claims showed an increase of $2,313,000 during 1965–66 compared with an increase of $2,518,000 during the previous year.
A review of the expenses incurred in transacting all accident insurance is contained in the table following. The fluctuations over a period of five years are shown in the form of percentages of revenue to expenditure under various heads. The percentages do not take into account reserve provisions.
| Year | Claims to Premiums | Commission to Premiums | Salaries to Premiums | Other Expenses to Premiums | Total Expenses (other than Claims) to Premiums | Total Expenditure to Premiums | Total Expenditure to Total Revenue |
|---|---|---|---|---|---|---|---|
| percent | |||||||
| 1961–62 | 62.7 | 7.9 | 11.2 | 10.6 | 29.7 | 92.4 | 88.4 |
| 1962–63 | 63.6 | 7.7 | 11.4 | 11.0 | 30.2 | 93.7 | 89.4 |
| 1963–64 | 64.6 | 7.5 | 11.1 | 10.3 | 28.8 | 93.5 | 89.2 |
| 1964–65 | 65.8 | 7.6 | 10.8 | 10.3 | 28.7 | 94.5 | 89.8 |
| 1965–66 | 65.9 | 7.0 | 10.1 | 9.9 | 26.9 | 92.8 | 88.4 |
Working expenses (excluding taxation) amounted to $12,208,564 in 1963–64, $13,395,450 in 1964–65, and $14,601,098 in 1965–66. The ratios of working expenses to premium income claims for the three classes of accident insurance are given for the last five years. Reinsurances for each of the three years were respectively 26.1, 26.0, and 24.4 percent.
ANALYSIS OF PREMIUMS AND CLAIMS—In the next table particulars of premiums and claims for the three main classes of accident insurance are given for the last five years. Reinsurances effected outside New Zealand are not taken into account in the figures presented below.
| Year | Employers' Liability | Personal Accident and Sickness | Motor Vehicle Comprehensive | Motor Vehicle Third-party Risks | Other Forms | Total |
|---|---|---|---|---|---|---|
| $(thousand) | ||||||
| Premiums Received | ||||||
| 1961–62 | 10,510 | 3,545 | 17,387 | 4,001 | 5,002 | 40,446 |
| 1962–63 | 10,605 | 3,704 | 19,125 | 4,344 | 5,793 | 43,571 |
| 1963–64 | 11,308 | 4,221 | 21,382 | 4,586 | 6,642 | 48,138 |
| 1964–65 | 12,368 | 4,697 | 23,447 | 4,965 | 7,192 | 52,668 |
| 1965–66 | 13,803 | 5,266 | 26,064 | 8,616 | 8,254 | 62,003 |
| Claims Paid | ||||||
| 1961–62 | 6,573 | 1,335 | 12,446 | 2,864 | 1,690 | 24,908 |
| 1962–63 | 6,510 | 1,651 | 14,271 | 3,304 | 1,899 | 27,635 |
| 1963–64 | 7,201 | 1,755 | 15,453 | 3,210 | 2,616 | 30,236 |
| 1964–65 | 7,532 | 2,002 | 17,972 | 3,040 | 2,806 | 33,353 |
| 1965–66 | 8,855 | 1,995 | 20,285 | 3,594 | 3,467 | 38,196 |
Premiums and claims for motor vehicle third-party risks insurance relate to the years ended 30 June.
The total claims under motor-vehicle comprehensive policies rose from 76.7 percent of the total premiums in 1964–65 to 77.8 percent in 1965–66, while claims under third-party risks policies fell from 61.2 percent of premiums in 1964–65 to 41.7 percent in 1965–66. The fall in the percentage of claims to premiums is due to the extension of the insurance to cover non-paying passengers which took effect from 1 July 1965.
Reducing the figures of each class for the years 1963–64 to 1965–66 to a percentage basis, the following results are obtained.
| Class of Insurance | Claims to Premiums | Premiums to Total Premiums | Claims to Total Claims | ||||||
|---|---|---|---|---|---|---|---|---|---|
| 1963–64 | 1964–65 | 1965–66 | 1963–64 | 1964–65 | 1965–66 | 1963–64 | 1964–65 | 1965–66 | |
| percent | |||||||||
| Employers' liability | 63.7 | 60.9 | 64.2 | 23.5 | 23.5 | 22.3 | 23.8 | 22.6 | 23.2 |
| Personal accident and sickness | 41.5 | 42.6 | 37.9 | 8.8 | 8.9 | 8.5 | 5.8 | 6.0 | 5.2 |
| Motor vehicle comprehensive | 72.3 | 76.7 | 77.8 | 44.4 | 44.5 | 42.0 | 51.1 | 53.9 | 53.1 |
| Motor vehicle third-party risks | 70.0 | 61.2 | 41.7 | 9.5 | 9.4 | 13.9 | 10.6 | 9.1 | 9.4 |
| Other | 39.4 | 39.0 | 42.0 | 13.8 | 13.7 | 13.3 | 8.7 | 8.4 | 9.1 |
| All classes | 62.8 | 63.3 | 61.6 | 100.0 | 100.0 | 100.0 | 100.0 | 100.0 | 100.0 |
MOTOR VEHICLES INSURANCE (THIRD-PARTY RISKS)—The Transport Act 1962 requires owners of motor vehicles to insure against their liability, through their negligence, to pay damages on account of the death or of bodily injury to another person. The payment of the insurance premiums is made annually to Deputy Registrars of Motor Vehicles at the same time as the annual licence fee is paid. Owners of motor vehicles are required to nominate each year the insurance company with which the contract of insurance is to be made, and the contract is deemed to be complete on the payment of the premium.
Premium receipts and claims actually paid have been shown in the earlier tables, but the claims figures given later also show amounts on account of the estimated liability for claims still outstanding at 30 June 1966, which are necessarily subject to revision.
The following table gives the premium rates for the various classes of motor vehicles over the last four years. The rates for omnibuses, service cars, and contract motor vehicles are subject to increases according to seating capacity.
| Class of Motor Vehicle | 1964–65 | 1965–66 | 1966–67 | 1967–68 |
|---|---|---|---|---|
| $ | $ | $ | $ | |
| Motor cycles | 3.60 | 7.10 | 7.10 | 6.00 |
| Power cycles | 0.80 | 1.20 | 1.20 | 1.00 |
| E-plate vehicles | 0.70 | 1.10 | 1.10 | 1.10 |
| Private cars and business cars (including station wagons) | 3.40 | 9.25 | 9.25 | 8.65 |
| Trucks and vans | 6.90 | 9.40 | 9.40 | 8.80 |
| Taxis, public | 32.00 | 32.00 | 32.00 | 32.00 |
| Buses, over 30 seats (maximum) | 54.00 | 48.00 | 48.00 | 48.00 |
| Service coaches, up to 30 seats (maximum) | 54.00 | 46.00 | 46.00 | 46.00 |
| Contract motor vehicles (maximum) | 10.00 | 9.00 | 9.00 | 9.00 |
| Trailers | 0.40 | 0.40 | 0.40 | 0.40 |
| Rental cars | 24.00 | 44.00 | 44.00 | 40.00 |
| Fire brigade vehicles, ambulances, and miscellaneous | 5.40 | 12.00 | 12.00 | 12.00 |
A sum of 25 cents for every contract of insurance is deducted for administration expenses, and the balance paid to the insurance company concerned.
Two important changes brought about by the Transport Amendment Act 1963 and effective from 1 July 1965 were that third-party risks insurance was extended to cover claims by passengers in the insured vehicle (previously only fee-paying passengers in vehicles plying for hire were covered), and that the limit of $150,000 in respect of all claims by passengers in any vehicle plying for hire was removed.
Claims by passengers are subject to a limit of $10,000 for any one passenger, or $15,000 for any one fee-paying passenger in a vehicle plying for hire. With these exceptions, the liability of an insurance company under contract under the Act is unlimited.
A further change made by the Transport Amendment Act 1963 was the revocation of the current agreement between the Crown and insurance companies for dealing with claims for personal injury against unidentified or uninsured motorists. This agreement was replaced by provisions permitting claims of this kind to be made against a nominal defendant (the manager of the State Insurance Office) on behalf of all insurers under the Transport Act.
Statistics of third-party risks insurance during the latest five years, with a summary covering the latest 10 years, are given in the following table. It should be noted that the liability for outstanding claims is usually over-estimated, and that the total claims for any particular year when finally settled may be expected to be somewhat smaller than the amounts now given. For instance, taking a period of five years 1953–54 to 1957–58 inclusive, for which virtually all claims had been settled by 30 June 1966, it is found that premiums received totalled $14,103,232, while total claims paid up to 30 June 1966 in respect of accidents during the five year period quoted totalled $10,734,200, a ratio of claims to premiums of 76.1 percent. The actual claims payments made during the five-year period itself totalled $8,815,702, of which a proportion was on account of accidents occurring prior to 1953–54. It follows that the ratios given below are also likely to be reduced in course of time, particularly those for the most recent years.
| Item | Registration Year Ended 30 June | 1966 Total for Ten Years to 30 June 1966 | ||||
|---|---|---|---|---|---|---|
| 1962 | 1963 | 1964 | 1965 | 1966 | ||
| *All claims up to 1956–57 have been settled. | ||||||
| $(000) | $(000) | $(000) | $(000) | $(000) | $(000) | |
| Premiums received | 4,001 | 4,344 | 4,586 | 4,965 | 8,616 | 43,124 |
| Claims actually paid to 30 June 1966 | 3,340 | 3,412 | 2,332 | 841 | 154 | 24,475 |
| Estimated liability for claims still outstanding at 30 June 1966 | 315 | 984 | 1,921 | 4,299 | 5,917 | 13,668* |
| Ratio percent of claims paid and outstanding to premiums | 91.3 | 101.2 | 92.7 | 103.5 | 70.5 | 88.5 |
A summary showing the experience over the last three registration years for each of the principal classes of motor vehicle is given in the table following.
| Class of Motor Vehicle | Net Premiums Received | Claims Paid | Estimated Claims Outstanding | ||
|---|---|---|---|---|---|
| Arising during Year | Arising during Previous Years | Arising during Year | Arising during Previous Years | ||
| $ | |||||
| 1963–64 | |||||
| Motor cycles | 105,090 | 1,286 | 44,660 | 109,566 | 126,904 |
| Private and business cars | 3,213,544 | 92,042 | 1,999,464 | 2,898,660 | 4,105,532 |
| Goods-service vehicles | 898,288 | 23,554 | 630,738 | 685,306 | 1,444,058 |
| Public taxicabs | 87,988 | 4,526 | 138,634 | 169,250 | 358,410 |
| Public omnibuses | 105,624 | 2,924 | 74,494 | 189,200 | 264,298 |
| Other classes | 175,272 | 2,788 | 195,310 | 150,994 | 278,700 |
| Totals | 4,585,806 | 127,120 | 3,083,300 | 4,202,976 | 6,577,902 |
| 1964–65 | |||||
| Motor cycles | 99,734 | 604 | 28,630 | 105,150 | 174,240 |
| Private and business cars | 3,500,398 | 93,828 | 2,152,382 | 3,105,624 | 4,317,128 |
| Goods-service vehicles | 955,012 | 26,298 | 463,146 | 947,114 | 1,322,044 |
| Public taxicabs | 88,568 | 5,088 | 119,480 | 45,870 | 254,518 |
| Public omnibuses | 130,698 | 7,042 | 66,960 | 176,960 | 404,820 |
| Other classes | 190,722 | 1,812 | 74,996 | 138,052 | 278,230 |
| Totals | 4,965,132 | 134,672 | 2,905,594 | 4,518,770 | 6,750,980 |
| 1965–66 | |||||
| Motor cycles | 199,658 | 712 | 49,816 | 63,008 | 189,310 |
| Private and business cars | 6,571,428 | 107,860 | 2,506,568 | 4,497,218 | 5,085,692 |
| Goods-service vehicles | 1,342,398 | 36,198 | 602,304 | 924,794 | 1,793,632 |
| Public taxicabs | 90,022 | 1,834 | 126,198 | 50,074 | 117,918 |
| Public omnibuses | 108,608 | 3,606 | 64,942 | 106,332 | 290,826 |
| Other classes | 303,436 | 3,902 | 89,722 | 275,764 | 273,766 |
| Totals | 8,615,550 | 154,112 | 3,439,550 | 5,917,190 | 7,751,144 |
The increase in premiums for some classes of vehicles in 1965–66 was due to the extension of the insurance to cover non-paying passengers.
GENERAL—Fire is still the main cause of property damage, but today many property owners seek protection not only against fire damage but also against a wide range of other dangers including water, windstorm, explosion, breakages, theft, aircraft, and impact by motor vehicles. Under houseowners' and householders' comprehensive policies, which have largely superseded fire insurance policies for covering dwellings and their contents, many thousands of additional claims are now dealt with each year. Increasing numbers of commercial property owners, too, are extending their fire policies to include damage from other causes.
In 1966 there were 62 fire insurance companies conducting business in New Zealand. Of these, the head offices of 18 were in New Zealand, while 29 were in Great Britain, 10 in Australia, 3 in the United States of America, and 2 in Hong Kong. The statistics in this section relate to the calendar year for about two-thirds of these companies; for the remaining companies the financial year nearest to the calendar year is used.
SUMMARY OF BUSINESS—The increase in extent and value of property over the years is reflected in the statistics of policies issued and business underwritten.
The statistics in the following summary of business relate to the business conducted with the insuring public. Reinsurance transactions are not taken into account.
| Item | 1963–64 | 1964–65 | 1965–66 |
|---|---|---|---|
| Amounts Underwritten | |||
| Gross amount of insurance cover in force in New Zealand on 31 December | $m8,969.3 | $m9,555.9 | $m10,399.9 |
| Number of policies representing the foregoing | 1,664,045 | 1,722,612 | 1,739,031 |
| Gross amount of new and renewal business underwritten during year | $m10,117.4 | $m10,936.3 | $m11,667.5 |
| Number of policies representing the foregoing | 1,826,129 | 1,899,437 | 1,909,140 |
| Premiums | |||
| Total gross premiums charged on business (new and renewal) underwritten during year | $m23.3 | $m26.0 | $m27.8 |
| Average gross premiums per $100 of business underwritten | $0.23 | $0.24 | $0.24 |
| Total premiums (as shown above), less premiums refunded to insured other than to other offices | $m20.3 | $m22.6 | $m24.0 |
| Losses | |||
| Total number of separate fire losses with which offices were concerned | 41,695 | 43,138 | 44,287 |
| Gross losses | $m7.0 | $m7.3 | $m8.4 |
| Percentage of gross loss to amount underwritten (new and renewal) during year (as shown above) | 0.1 | 0.1 | 0.1 |
| Percentage of gross loss to total premiums less refunds to insured (as shown above) | 34.6 | 32.4 | 34.9 |
| Average loss | $168 | $170 | $190 |
The next table shows the position of premium income and claims during the latest. 11 years. While the bulk of the claims represent fire losses the figures also include the numerous, frequently minor, claims made under comprehensive policies for damage from other causes. The percentage of claims to premium income increased to 34.9 percent in 1965–66 as against 32.4 percent in 1964–65.
| Year | Premium Income | Claims | Percentage of Claims to Premium Income |
|---|---|---|---|
| *Excludes figures for one company in liquidation. | |||
| $(000) | $(000) | percent | |
| 1955–56 | 2,483 | 4,156 | 33.3 |
| 1956–57 | 12,794 | 4,348 | 34.0 |
| 1957–58 | 13,229 | 6,937 | 52.4 |
| 1958–59 | 14,294 | 6,319 | 44.1 |
| 1959–60 | 15,314 | 5,353 | 35.0 |
| 1960–61* | 16,171 | 5,317 | 32.9 |
| 1961–62 | 17,526 | 5,790 | 33.0 |
| 1962–63 | 18,995 | 7,531 | 39.6 |
| 1963–64 | 20,269 | 7,010 | 34.6 |
| 1964–65 | 22,574 | 7,305 | 32.4 |
| 1965–66 | 24,033 | 8,387 | 34.9 |
LIABILITIES AND ASSETS—The following table indicates generally the extent to which fire insurance offices have funds available to meet losses and liabilities. The figures refer to all departments of business underwritten. Funds of life departments are added for completeness, but by the Life Insurance Act 1908 (which follows the provisions of the United Kingdom statute on the subject) life funds must be accounted for separately, and form a security for life-policy holders which is not available for other classes of insurance transacted. Of the 62 fire offices, 18 also engage in life assurance business, but only five of these conduct such business in New Zealand. The amount of funds (other than life) in New Zealand and elsewhere is, it will be seen, approximately $6,462 million.
| Item | 1965–66* | 1964–65* (Total) | 1963–64* (Total) | ||
|---|---|---|---|---|---|
| Overseas Companies | Local Companies | Total | |||
| *Liabilities and assets of Australian companies have been converted into New Zealand currency. | |||||
| $(million) | |||||
| Paid-up capital | 394.5 | 32.4 | 426.9 | 419.8 | 413.0 |
| Reserves | 3,001.1 | 35.3 | 3,036.4 | 3,006.0 | 2,842.2 |
| Other liabilities | 2,915.7 | 83.2 | 2,998.9 | 2,820.9 | 2,616.6 |
| Totals | 6,311.3 | 151.0 | 6,462.3 | 6,246.7 | 5,871.8 |
| Life funds | 7,117.9 | 0.7 | 7,118.6 | 7,818.4 | 7,094.8 |
| Total liabilities | 13,429.2 | 151.7 | 13,580.9 | 14,065.1 | 12,966.6 |
| Total assets | 13,429.2 | 151.7 | 13,580.9 | 14,065.1 | 12,966.6 |
NOTE—The decrease in life funds is due to an overseas company discontinuing operations in New Zealand.
The following table gives the amount of assets in New Zealand as at the end of each of the last five years classified under various heads. The figures given include all investments in New Zealand securities and do not relate merely to the assets held by the New Zealand branches of the companies concerned. The assets of other departments—accident, life, marine, etc.—are also included.
| Assets in New Zealand | 1961–62 | 1962–63 | 1963–64 | 1964–65 | 1965–66 |
|---|---|---|---|---|---|
| $(million) | |||||
| House and landed property | 10.93 | 12.07 | 13.70 | 16.29 | 17.67 |
| New Zealand Government securities | 29.52 | 29.15 | 32.53 | 33.04 | 34.20 |
| New Zealand local authority securities | 6.45 | 6.09 | 8.81 | 10.04 | 10.84 |
| Company stocks and shares | 12.92 | 12.58 | 16.02 | 20.39 | 24.34 |
| Mortgages, etc. | 9.45 | 12.36 | 16.31 | 18.12 | 21.73 |
| Outstanding premiums | 7.11 | 7.37 | 9.29 | 10.15 | 11.97 |
| Cash and other assets in New Zealand | 17.20 | 17.34 | 21.83 | 24.20 | 27.67 |
| Total New Zealand assets | 93.58 | 97.47 | 118.49 | 132.24 | 148.42 |
REVENUE AND EXPENDITURE—A statement of the total revenue and expenditure, both gross and net, of all offices is now given in respect of New Zealand business. The gross figures include reinsurance business accepted, while the net figures comprise insurances with the public, plus reinsurances accepted, and less amounts reinsured with other offices.
It is insurance practice at the closing date of the accounts of a fire insurance company to transfer to a reserve a proportion of the income received during the year, to allow for policies whose currency extends into the following accounting year. Thus, if the amount transferred to reserve at the end of the current year is greater than that transferred at the end of the previous year, the net effect is equivalent to an increase in this year's expenditure and the difference is therefore shown as expenditure. Similarly, if the amount transferred this year is less than last year, then the difference will be shown as revenue.
The entry of net effect of reserve provision in the gross, figures, it should be noted, is calculated on the assumption that it bears the same proportion to gross premium income as does the actual net reserve to the net premium income.
| Item | 1964–65 | 1965–66 | ||
|---|---|---|---|---|
| Gross | Net | Gross | Net | |
| Revenue | $(thousand) | |||
| Net effect of reserve provisions | 59 | 36 | 40 | 23 |
| Amount of fire premiums received during year | 26,194 | 16,180 | 28,422 | 17,793 |
| Interest and dividends on stock, mortgages, etc. | 1,114 | 1,114 | 1,413 | 1,413 |
| Rents | 295 | 295 | 415 | 415 |
| Other revenue | 19 | 19 | 24 | 24 |
| Totals | 27,681 | 17,644 | 30,314 | 19,668 |
| Expenditure | ||||
| Net effect of reserve provisions | 642 | 398 | 1,390 | 851 |
| Amount of fire claims paid during year, including adjustment and other expenses of settlement, but less salvage | 7,755 | 5,403 | 9,878 | 5,913 |
| Fire authority levies | 1,524 | 1,201 | 1,623 | 1,290 |
| New Zealand Government taxes | 2,721 | 2,226 | 2,521 | 2,000 |
| Rents | 262 | 242 | 286 | 267 |
| Depreciation | 182 | 174 | 215 | 207 |
| Allowance and commissions on premiums to agents, subagents, and others | 2,990 | 1,175 | 3,297 | 1,376 |
| Salaries and wages, including commissions, on profits or bonuses | 2,927 | 2,756 | 3,156 | 3,011 |
| Other expenses of management | 1,483 | 1,448 | 1,722 | 1,664 |
| Totals | 20,487 | 15,022 | 24,088 | 16,580 |
The principal items of net revenue and expenditure for 1965–66 of the overseas and local companies operating in New Zealand are contained in the next table.
| Class of Office | Net Revenue | Net Expenditure | |||
|---|---|---|---|---|---|
| Premiums | Total* (including other) | Claims | Salaries and Commissions | Total* (including other) | |
| *Excluding net effect of reserve provisions. | |||||
| $(000) | $(000) | $(000) | $(000) | $(000) | |
| Overseas companies | 8,877 | 9,584 | 3,142 | 2,044 | 7,928 |
| Local companies | 8,916 | 10,060 | 2,772 | 2,344 | 7,801 |
| Totals | 17,793 | 19,645 | 5,913 | 4,388 | 15,729 |
Excluding the net effect of reserve provisions, the excess of net revenue over net expenditure (after tax) for 1965–66 of $3.92 million compares with surpluses of $2.98 million and $2.74 million for 1964–65 and 1963–64 respectively.
The following table shows the percentage ratio of working expenses to premium income for the years 1961–62 to 1965–66. Under the Fire Services Act 1949 fire insurance companies are required to make a return of premium income to the Fire Service Council which makes a levy, normally just under 10 percent of the returnable figure, for the administration of fire services. This levy meets almost half the cost of the services. It is sometimes contended that contribution to the fire-prevention authority are not a working expense, but should be added to the total of fire losses. While this view is not subscribed to in the compilation of the statistics, there is a definite relationship between the items, and this table shows the ratio both inclusive and exclusive of such levies.
| Item | 1961–62 | 1962–63 | 1963–64 | 1964–65 | 1965–66 |
|---|---|---|---|---|---|
| percent | |||||
| Net working expenses (excluding taxes) to net premium income | 43.9 | 45.3 | 44.7 | 43.2 | 43.9 |
| Net working expenses (excluding taxes and fire-service levies) to net premium income | 36.7 | 38.0 | 37.2 | 35.8 | 36.7 |
| Gross working expenses (excluding taxes) to gross premium income (excluding reinsurances from other offices) | 36.0 | 35.6 | 36.5 | 35.8 | 36.2 |
| Gross working expenses (excluding taxes and fire-service levies) to gross premium income (including reinsurances from other offices) | 30.2 | 30.1 | 30.4 | 29.9 | 30.5 |
FIRES AND LOSSES—Annual fire losses in New Zealand have been estimated to average approximately $6 million. This is allowing 15 percent above the known figures of insured losses as the estimated cost of fire damage not covered by insurance. The Government, for example, usually bears its own risk, and only a small proportion of the loss involved in the major fire in Aotea Quay, Wellington, of 1961 was included in the gross loss figure for that year.
A summary of fire losses over the latest 10 calendar years follows. The figures are subject to considerable annual fluctuations as a result of the severe losses that can be caused by individual major fires. During 1965 there were 14 payments of $40,000 or more, the aggregate amount of loss being $1,106,878, as compared with 16 payments involving a loss of $1,217,290 in 1964.
| Year | Number of Fire-loss Payments | Gross Loss | Average Fire-loss Payments |
|---|---|---|---|
| $(000) | $ | ||
| 1956 | 22,199 | 3,961 | 178 |
| 1957 | 25,790 | 6,051 | 234 |
| 1958 | 27,428 | 5,416 | 198 |
| 1959 | 28,459 | 5,222 | 184 |
| 1960 | 29,484 | 4,154 | 140 |
| 1961 | 32,030 | 4,726 | 148 |
| 1962 | 32,227 | 5,834 | 182 |
| 1963 | 36,785 | 5,675 | 154 |
| 1964 | 37,546 | 6,192 | 164 |
| 1965 | 38,690 | 5,863 | 152 |
The average insurance claim paid for material fire damage per head of total population was $2.32 in 1962, $2.20 in 1963, $2.36 in 1964, and $2.19 in 1965.
The classification by fire districts for 1965 which follows is based on the schedules to the Fire Services Act 1949, which set out in full the districts (and their status) originally constituted under the Act. Additions, deletions, and alterations in status are periodically gazetted. The administrative authority appointed by the Act is the Fire Service Council, responsible to the Minister of Internal Affairs.
At 31 December 1966 there were 16 united urban, 102 urban and 131 secondary urban fire districts constituted.
| Type of Fire District | Number of Fire-loss Payments | Gross Amount of Loss Paid on Risks Affected | Proportion of Loss to Total Loss |
|---|---|---|---|
| 1965 | $(000) | percent | |
| United urban fire districts | 17,001 | 2,235 | 38.1 |
| Urban fire districts | 16,450 | 2,333 | 39.8 |
| Secondary urban fire districts | 2,125 | 393 | 6.7 |
| Remainder of New Zealand (including floating risks) | 3,114 | 901 | 15.4 |
| Totals | 38,690 | 5,863 | 100.0 |
The relationship between the number of payments and loss incurred is fairly closely sustained for the main types of district; 92.0 percent of payments related to fires which occurred in urban (including united urban) fire districts, the loss amounting to 84.6 percent of the total.
Causes of Fires—Particulars regarding causes of fires are contained in the following table. A more detailed table of causes of fires is given in the annual Report on Insurance Statistics.
| Cause of Fire | 1963 | 1964 | 1965 | |||
|---|---|---|---|---|---|---|
| Number of Fire-loss Payments | Amount of Loss | Number of Fire-loss Payments | Amount of Loss | Number of Fire-loss Payments | Amount of Loss | |
| $(000) | $(000) | $(000) | ||||
| Electricity | 10,691 | 703 | 11,358 | 1,057 | 12,885 | 1,184 |
| Gas | 419 | 48 | 415 | 29 | 402 | 32 |
| Chimneys and flues | 842 | 104 | 744 | 66 | 677 | 180 |
| Fireplaces and stoves | 11,024 | 450 | 11,322 | 483 | 11,385 | 441 |
| Smoking and matches | 7,687 | 365 | 7,874 | 426 | 7,774 | 422 |
| Inflammable spirits and materials | 1,135 | 299 | 1,013 | 636 | 940 | 248 |
| Outside causes | 1,175 | 205 | 1,250 | 213 | 1,136 | 206 |
| Arson and incendiarism | 98 | 58 | 104 | 75 | 147 | 73 |
| Other specified causes | 902 | 169 | 727 | 109 | 941 | 207 |
| Unknown causes | 2,812 | 3,275 | 2,739 | 3,098 | 2,403 | 2,870 |
| Totals | 36,785 | 5,675 | 37,546 | 6,192 | 38,690 | 5,863 |
The actual cause of many fires is not easily ascertainable, especially in cases of total, or near-total loss, where evidence as to origin is obliterated. This accounts for the high proportion of loss due to unknown causes and for the fact that the average loss payment is much greater in these instances. During 1965 the average payment for specified causes was $82, while the average for the unspecified group amounted to $1,194. As most major fires result from unknown causes this accounts for the large difference between the averages.
The Fire Services Amendment Act 1952 provides that the Minister of Internal Affairs may appoint any person to hold an inquiry into any fire and the steps taken to deal with it.
Extent of Loss—The next table gives particulars of fire losses during the latest three years, classified according to the amount of loss. The vast majority of fires cause only minor damage. During 1965 payments of less than $20 accounted for 63.9 percent of the total number, but only 3.6 percent of the total loss sustained. On the other hand, payments of $20,000 or over, numbering only 25, represented 23.5 percent of the insured loss.
| Loss Category | 1963 | 1964 | 1965 | |||
|---|---|---|---|---|---|---|
| Number of Fire-loss Payments | Amount of Loss | Number of Fire-loss Payments | Amount of Loss | Number of Fire-loss Payments | Amount of Loss | |
| $ | $(000) | $(000) | $(000) | |||
| Under 20 | 23,618 | 196 | 23,770 | 199 | 24,709 | 213 |
| 20–49 | 7,315 | 216 | 7,786 | 229 | 7,904 | 233 |
| 50–199 | 3,517 | 320 | 3,655 | 325 | 3,765 | 1,336 |
| 200–1,999 | 1,738 | 1,148 | 1,743 | 1,143 | 1,726 | 1,117 |
| 2,000–3,999 | 348 | 956 | 318 | 878 | 322 | 863 |
| 4,000–9,999 | 191 | 1,093 | 194 | 1,123 | 195 | 1,120 |
| 10,000–39,999 | 44 | 727 | 66 | 1,078 | 55 | 874 |
| 40,000 and over | 14 | 1,020 | 16 | 1,217 | 14 | 1,107 |
| Totals | 36,785 | 5,675 | 37,546 | 6,192 | 38,690 | 5,863 |
Class Groups—Losses classified in broad groups according to the nature of the risk are presented in the next table. Fires in private dwellings accounted for 88.7 percent of the total number of payments during 1965, but the proportion of loss sustained was only 38.5 percent.
It should be noted that the “contents”, where insured, are included in the various class groups. Consequently the total for the houses and flats group is swollen by the numerous small claims on account of damage to personal effects, etc., the actual building not being affected by the fire in many instances. The miscellaneous risks group also includes those cases where a fire has affected two or more buildings, which individually are classifiable into more than one of the other groups shown in the table, or, in some instances, single buildings housing occupiers of different groupings.
| Class Group | 1965 | 1964 | 1965 | |||
|---|---|---|---|---|---|---|
| Number of Fire-loss Payments | Amount of Loss | Number of Fire-loss Payments | Amount of Loss | Number of Fire-loss Payments | Amount of Loss | |
| $(000) | $(000) | $(000) | ||||
| Private houses and flats, boarding houses, etc. | 32,643 | 2,322 | 33,307 | 2,409 | 34,331 | 2,257 |
| Hotels and restaurants | 689 | 273 | 666 | 314 | 624 | e415 |
| Offices and public buildings | 368 | 305 | 411 | 256 | 424 | 218 |
| Theatres and entertainment places | 114 | 207 | 110 | 54 | 134 | 105 |
| Bulk stores and warehouses | 205 | 497 | 148 | 158 | 220 | 280 |
| Shops | 707 | 563 | 712 | 730 | 688 | 450 |
| Factories and industrial risks | 1,094 | 1,183 | 1,195 | 1,441 | 1,230 | 1,781 |
| Farm risks (other than dwellings) | 406 | 227 | 426 | 176 | 462 | 240 |
| Miscellaneous (including unclassified) | 201 | 59 | 216 | 629 | 240 | 85 |
| Floating and travelling risks | 358 | 40 | 355 | 24 | 337 | 32 |
| Totals | 36,785 | 5,675 | 37,546 | 6,192 | 38,690 | 5,863 |
FIRE BRIGADES—At 31 March 1966 there were 249 fire brigades under the administrative authority of the Fire Service Council.
MUTUAL INSURANCE ASSOCIATIONS—Mutual associations are governed by the Mutual Insurance Act 1955, which allows 200 or more owners or occupiers of isolated or farm properties to subscribe to a declaration, and form themselves into a mutual association to insure against loss to an amount in the aggregate of not less than $400,000. The Act permits these associations to conduct accident business in addition to fire insurance. Such associations effect insurance on the premium note principle, and accept premium notes to be assessed for losses in the proportion of the total amount of such notes. The amount of a member's premium notes limits his liability. Mutual insurance associations carrying on employer's liability insurance business are now required to deposit approved securities to a specified value with the Public Trustee.
The Mutual Insurance Regulations, gazetted in 1956, permit these associations to carry on additional types of insurance (other than life assurance).
Summarised figures for the two associations formed under the Act appear below; prior to 1963 there were three associations.
| Year Ended 31 March | Net Premium Income | Total Net Income | Net Claims | Reserves and Funds | Assets* | ||
|---|---|---|---|---|---|---|---|
| Fire | Accident | Fire | Accident | ||||
| *Including premium notes. | |||||||
| $(000) | |||||||
| 1962 | 269 | 411 | 734 | 58 | 192 | 592 | 1,621 |
| 1963 | 183 | 238 | 465 | 41 | 135 | 358 | 1,263 |
| 1964 | 186 | 253 | 487 | 51 | 109 | 399 | 1,383 |
| 1965 | 202 | 270 | 518 | 49 | 105 | 418 | 1,419 |
| 1966 | 234 | 284 | 562 | 59 | 136 | 466 | 1,474 |
LIFE ASSURANCE—The New Zealand Government Life Insurance Office was founded in 1869 at a time when New Zealanders had comparatively poor facilities in regard to life assurance. In earlier years there had been numerous disastrous failures of life offices in Great Britain and the United States, and it was, in part, to prevent the possibility of such disasters occurring in New Zealand that a Government Department was established to handle life insurance. The new Department possessed the unique advantage among life insurance institutions of being based on State security. The payment of all policies has always been guaranteed by the Government. The success of the Government Life Insurance Office was immediate and continuing. From a total of 59 policies, assuring a sum of $60,500, issued during 1869–70, its first year of operations, the business of the Office has grown to a stage when, at the end of 1965, policies in force numbered 358,907 and the total sum assured reached almost $728 million. Among life insurance companies, the Government Life Insurance Office handles the second largest volume of business in New Zealand.
The total income of the Office for the year ended 31 December 1965 was $24,758,356, of which premium income amounted to $16,596,046, annuity purchase money $6,916, and interest, dividends, and net rent, $8,155,394.
During the year 1965 payments were made under the following heads: matured policies (including bonus additions), $3,035,066; claims by death (including bonuses), $2,077,814; annuities, $243,688, surrendered policies and bonuses cashed, $2,574,378; commission, 51,323,544; other management expenses, $915,312; rates and taxes, $649,516; and other expenditure, $57,018.
Income and expenditure figures of the Government Life Insurance Office are now given for each of the latest five years.
| Year | Premium Income (Including Purchase of Annuities) | Total Income | Management Expenses | Total Expenditure | Ratio of Expenses to Total Income | Ratio of Management Expenses to Premium Income |
|---|---|---|---|---|---|---|
| $(thousand) | percent | percent | ||||
| 1961 | 11,579 | 16,622 | 1,504 | 6,580 | 9.05 | 12.99 |
| 1962 | 12,243 | 17,904 | 1,591 | 7,318 | 8.88 | 12.99 |
| 1963 | 13,432 | 19,875 | 1,875 | 8,232 | 9.44 | 13.91 |
| 1964 | 14,633 | 21,880 | 2,071 | 9,270 | 9.46 | 14.14 |
| 1965 | 16,603 | 24,758 | 2,239 | 10,876 | 9.04 | 13.48 |
Figures showing the progress of the Office are contained in the next table. Annuities are excluded.
| Year | New Business | Policies Discontinued | Policies in Force at End of Year | ||||||
|---|---|---|---|---|---|---|---|---|---|
| Number of Policies | Sum Assured | Annual* Premiums | Number | Sum Assured | Annual Premiums | Number | Sum Assured | Annual Premiums | |
| *Excludes single premiums. | |||||||||
| $(000) | $(000) | $(000) | $(000) | $(000) | $(000) | ||||
| 1961 | 25,027 | 64,294 | 1,337 | 11,724 | 21,366 | 486 | 304,969 | 506,194 | 10,848 |
| 1962 | 25,058 | 66,566 | 1,430 | 12,331 | 23,888 | 556 | 317,696 | 548,871 | 11,722 |
| 1963 | 27,226 | 80,603 | 1,719 | 12,918 | 25,596 | 617 | 332,004 | 603,878 | 12,824 |
| 1964 | 27,692 | 88,682 | 1,758 | 14,165 | 29,141 | 668 | 345,531 | 663,420 | 13,914 |
| 1965 | 27,866 | 96,212 | 1,932 | 14,490 | 32,031 | 787 | 358,907 | 727,600 | 15,059 |
During 1965 there was an increase of 8.5 percent over the previous year in the value of new policies written and an increase of 9.9 percent in the amount of annual premiums represented. The average sum assured per policy was $2,656 in 1962, $2,960 in 1963, $3,202 in 1964, and $3,453 in 1965. In addition to the total sum assured at the end of the year, accrued reversionary bonuses amounted to $48,646,974. Immediate, deferred, and contingent annuities totalled $7,393,668, representing 425 policies. Single premium income for the years 1962 to 1965 was $971,640, $1,065,782, $1,074,816, and $1,739,622 respectively.
The Office's balance sheet as at 31 December 1965 showed that the total assets amounted to $156,045,286, and were invested as shown in the following statement, which also gives the distribution of the assets at the end of the two preceding years for purposes of comparison.
| Class of Investment | Amount | Percentages | ||||
|---|---|---|---|---|---|---|
| 1963 | 1964 | 1965 | 1963 | 1964 | 1965 | |
| * Mainly due and overdue premiums and interest, interest accrued, and company stocks, shares, and debentures. | ||||||
| $(thousand) | percent | percent | percent | |||
| Mortgages on freehold property | 57,731 | 59,616 | 63,750 | 44.89 | 42.12 | 40.86 |
| Loans on policies | 5,617 | 6,383 | 7,373 | 4.37 | 4.51 | 4.72 |
| Government securities | 20,178 | 25,697 | 30,717 | 15.69 | 18.16 | 19.68 |
| Local authority securities | 23,343 | 22,493 | 22,802 | 18.15 | 15.89 | 14.61 |
| Landed and house property | 5,577 | 7,137 | 8,417 | 4.34 | 5.04 | 5.39 |
| Miscellaneous assets* | 16,153 | 20,205 | 22,97 | 12.56 | 14.28 | 14.74 |
| Totals | 128,599 | 141,530 | 156,045 | 100.00 | 100.00 | 100.00 |
Assurance, annuity, and endowment funds, apart from special reserves of $2,930,000, amounted to $150,453,096, an increase (the largest ever recorded) of $13,882,020 over the corresponding figure at the end of the previous year.
FIRE, ACCIDENT, AND OTHER INSURANCE—In 1901 the Government Life Insurance Office opened an Accident Insurance Branch. This was intended principally to conduct insurance under the Workers' Compensation Act, but general accident business was undertaken and, through the years, became increasingly important.
At the beginning of 1925 accident business was transferred from the Government Life Insurance Office to the State Fire Office, which had commenced business in 1905. Since 1947 the State Fire Office has also undertaken marine insurance.
The State Insurance Act 1963 was, in the main, a rewriting of the legislation relating to State insurance in respect of fire, accident, marine risks, and all other forms of insurance other than life insurance. The functions formerly exercised by the State Fire Office and the Accident Insurance Branch of that Office were combined under the State Insurance Office, which was empowered to carry on any class of insurance business other than life insurance.
The steadily growing income is an indicator of the increasing extent to which the public is using the services now available from the State Insurance Office. The following combined figures at 10-yearly intervals and the latest year 1965 illustrate the growth:
| Year | Net Premiums | Claims | Working Expenses |
|---|---|---|---|
| $(000) | $(000) | $(000) | |
| 1913 | 165 | 79 | 43 |
| 1923 | 357 | 137 | 93 |
| 1933 | 502 | 195 | 141 |
| 1943 | 1,123 | 438 | 185 |
| 1953 | 3,118 | 1,652 | 916 |
| 1963 | 8,632 | 5,217 | 1,801 |
| 1964 | 9,642 | 5,681 | 1,960 |
| 1965 | 11,308 | 7,320 | 2,176 |
Claims increased by $1,639,000 in 1965, and the premium income rose by $1,666,000. The main classes of accident insurance transacted are motor vehicle (comprehensive and third-party risk), employers' liability, personal accident, public risk, and plate glass.
Fire insurance is perhaps more accurately described as property insurance, since the houseowners' and householders' policies which have largely superseded fire insurance policies for covering dwellings and their contents provide coverage not only against fire but also against a wide range of other possible causes of damage. Commercial property owners, too, are increasingly extending their fire policies to cover other dangers.
The total assets of the State Insurance Office at 31 December 1965 amounted to $25,500,696, which included $16,861,188 in the form of investments ($9,201,136 in Government securities), and $3,544,740 in fixed assets, mainly land, buildings, and plant. Of the total liabilities, reserves amounted to $11,874,440, unexpired risks to $5,654,224, and unadjusted claims to $5,445,028.
EARTHQUAKE AND WAR DAMAGE INSURANCE—Under the Earthquake and War Damage Act 1944 there exists the Earthquake and War Damage Fund, which is administered by a Commission. All property insured against fire is deemed to be insured to the extent of the indemnity value against earthquake and war damage. Premiums at the rate of 10c for each $200 of insurance cover are collected by the insurance companies and paid into the Fund (less commission of 2 1/2 percent).
The Act provides for both compulsory and voluntary insurance against earthquake and war damage. Under the compulsory provisions of the original Act all property insured to any amount under any contract of fire insurance with an insurance company is deemed to be insured to the same amount against earthquake damage and war damage. An amending Act passed in 1951, however, provides that where the contract of fire insurance provides for the settlement of the claim upon the basis of the replacement value, the compulsory earthquake and war damage insurance will be for the amount of the indemnity or present value only. If the present value is certified by a registered architect or a registered valuer, the earthquake and war damage premium will be charged on the amount so certified. Under the voluntary provisions of the Act any person having an insurable interest in any property may make application to the Commission for earthquake or war damage insurance, and a contract may be made for the insurance of any property that is not insured under the compulsory section of the Act, or for the insurance to an additional amount of any property that is so insured.
Advances may be made from the Consolidated Revenue Account if at any time the amount in the Earthquake and War Damage Fund is not sufficient to meet the claims thereon.
“Earthquake damage” is defined as damage occurring as the direct result of earthquake or of fire occasioned by or in consequence of earthquake. It also includes damage occurring as the direct result of measures taken under proper authority to avoid the spreading of, or otherwise to mitigate the consequence of, any such damage. In addition to damage occurring as a direct result of action by the enemy, “war damage” included damage occurring as the direct result of measures taken in combating the enemy or precautionary or preparatory measures taken under proper authority with a view to preventing or hindering any enemy or anticipated enemy action. It also includes accidental damage occurring as the direct result of any explosion or fire which involves any explosives or munitions, etc., required for war purposes.
During the financial year 1949–50 an extension of the scheme was instituted to provide some measure of protection to the insured against storm and flood of an abnormal or widespread nature. Finance is provided by crediting 10 percent of the premiums compulsorily collected under the Act to a special Disaster Fund, without further liability on the Earthquake and War Damage Fund.
On 1 November 1954 the definition of disaster damage was extended to include volcanic eruption, and authority was given to the Commission to accept insurance against landslip. This latter type of cover does not apply automatically.
The Earthquake and War Damage Regulations 1956 came into force on 1 June 1956. The amount of the franchise (proportion of loss to be borne by the insured) was fixed for all cases as 1 percent of the loss, but not less than $20, and limited to $100 where the loss exceeds $10,000. The franchise may be fixed at a higher rate where the property is more than normally susceptible to damage. Cover under the disaster provisions was widened by the deletion of the word “widespread” from the definition.
The following is a comparative statement for the last six years of the financial operations under the Earthquake and War Damage Act, together with a statement showing the position from the inception of the Fund to 31 March 1966.
| Item | 1960–61 | 1961–62 | 1962–63 | 1963–64 | 1964–65 | 1965–66 | 19 Dec 1941 to 31 Mar 1966 |
|---|---|---|---|---|---|---|---|
* At end of each period. From commencement in November 1949. | |||||||
| $(thousand) | |||||||
| Income— | |||||||
| Premiums— | |||||||
| Earthquake and war damage | 3,441 | 3,736 | 3,946 | 4,244 | 4,605 | 4,876 | 60,445 |
| Storm and flood | 381 | 412 | 436 | 469 | 509 | 538 | 5,277 |
| Interest | 1,651 | 1,982 | 2,446 | 2,572 | 2,888 | 3,382 | 24,757 |
| Totals | 5,473 | 6,130 | 6,828 | 7,285 | 8,002 | 8,796 | 90,479 |
| Outgo— | |||||||
| Claims— | |||||||
| Earthquake and war damage | 31 | 17 | 248 | 10 | 5 | 243 | 811 |
| Storm and flood | 86 | 228 | 225 | 713 | 122 | 360 | 3,570 |
| Salaries and expenses of management | 22 | 21 | 26 | 28 | 44 | 40 | 386 |
| Discount to insurance offices | 94 | 102 | 108 | 116 | 126 | 133 | 1,432 |
| Exchange adjustments | – | – | – | – | – | – | 679 |
| Totals | 234 | 368 | 608 | 867 | 296 | 776 | 6,878 |
| Surplus | 5,239 | 5,763 | 6,221 | 6,418 | 7,706 | 8,020 | 83,601 |
| Earthquake and War Damage Fund* | 48,424 | 53,983 | 59,957 | 66,590 | 73,904 | 81,703 | 81,703 |
| Disaster Fund† | 1,049 | 1,252 | 1,500 | 1,284 | 1,676 | 1,898 | 1,898 |
The item “exchange adjustment” of $679,050 was the depreciation in the New Zealand value of the Commission's overseas funds as the result of the alteration in the exchange rate to parity with sterling which came into operation during 1948.
During the year ended 31 March 1966, 1,945 earthquake and 1,600 storm and flood claims were lodged, compared with 86 and 700 for the previous year. The majority of the earthquake claims during 1965–66 were on account of the Gisborne earthquake of 5 March 1966. Claims were still being reported at the closing of the accounts at the end of the financial year. In the year 1965–66 there was an increase in the Disaster Fund of $222,000, compared with an increase of $392,000 in 1964–65, and a decrease of $216,000 in 1963–64.
GENERAL—A considerable proportion of the persons comprising the labour force of New Zealand have their working conditions determined either directly or indirectly by virtue of the provisions of the Factories Act 1946, the Coal Mines Act 1925, the Shops and Offices Act 1955, the Shipping and Seamen Act 1952, the Agricultural Workers' Act 1962, the Industrial Conciliation and Arbitration Act 1954, the Construction Act 1959, the Machinery Act 1950, and the Shearers' Act 1962. Legislative authority covering the working conditions of substantially the greater portion of the remaining participants in the labour force is contained in the State Services Act 1962 and the Government Service Tribunal Act 1965, the Government Railways Act 1949, the Post Office Act 1959, the Police Act 1958, the Education Act 1964, the Hospitals Act 1957, and the Hospital Employment Regulations 1963, and the Waterfront Industry Act 1953.
Notes on Acts which have as their prime purpose the protection of workers from accidents in the course of their employment have been included in Section 37 D—Occupational Safety.
In the following pages a survey is made first of the Court of Arbitration and then of the working and other conditions laid down by legislation.
COURT OF ARBITRATION—The Court of Arbitration, which dates from 1894 and whose jurisdiction is set out in the Industrial Conciliation and Arbitration Act 1954, consists of three members appointed by the Governor-General, one of whom is the Judge of the Court. No one may be appointed as the Judge unless he is a barrister or solicitor of not less than seven years' standing. One of the two other members is appointed on the recommendation of the industrial unions of employers and the other on the recommendation of the industrial unions of workers. Although the members other than the Judge are appointed for a term of three years only, in practice it has been found that they have usually served much longer terms on the Court.
The work of the Court may be divided into two sections—the making of laws through the promulgation of awards, apprenticeship orders, etc., and the interpretation and enforcement of industrial laws, including industrial agreements and certain statutes. The second function is similar to the functions of other Courts, but in making industrial law the Court of Arbitration has a unique role. In addition the Court has wide powers and responsibilities associated with the making of general wage orders (see Section 33 of the Yearbook).
Jurisdiction of Court—The following is a general account of the present jurisdiction, powers, and functions of the Court of Arbitration, some of which are legislative in character and others judicial.
Under the Industrial Conciliation and Arbitration Act 1954:
The principal function of the Court is to settle any matters which are outstanding after the representatives of workers' unions and employers or employers' unions in any industry have failed under the procedure laid down in the Industrial Conciliation and Arbitration Act to reach complete agreement in conciliation upon the minimum rates of wages and conditions of work which are to govern employment in the industry for a limited future period. This function of the Court is really legislative in character, for Parliament in effect has delegated authority to the Court to make law in a restricted field but its awards must not be inconsistent with any statute. For a large proportion (approximately one-half) of the labour force, the determining factor in minimum rates of wages and working conditions is the series of awards issued by the Court of Arbitration, and industrial agreements made by representatives of employers and workers. The number of awards and agreements in force is quite large—691 at 31 March 1966—and each is subject to individual negotiation by the unions or associations concerned during its formulation.
Included in the respective awards and agreements are provisions covering minimum rates of remuneration, the hours of work, overtime, holidays, safety, health, and welfare. Initiated by the Industrial Conciliation and Arbitration Amendment Act 1936 a 40-hour week is now prescribed in almost all awards and industrial agreements.
The Court does not settle strikes or lockouts. If there is a strike or lockout in an industry, access to the Court is not usually available to the parties unless and until work is resumed.
The provisions of awards and industrial agreements are enforced through Magistrate's Courts and the Court of Arbitration. There are limited rights of appeal against the judgments of Magistrates to the Court of Arbitration, the determination of which is final. Inspectors of Awards, who are officers of the Department of Labour, may proceed directly in the Court of Arbitration for the recovery of penalties. In the Magistrate's Court actions for penalties may be brought at the suit of an Inspector of Awards or at the suit of any party to the award or industrial agreement.
The Court has power to impose penalties for a number of offences against special provisions of the Industrial Conciliation and Arbitration Act; for example, being a party to a strike or lockout when bound by an award or industrial agreement, combining to defeat an award, contempt of Court, obstruction of a conciliation council or the Court, failure to comply with a summons to give evidence, victimisation, and so forth.
Actions to recover moneys, including holiday pay, due to workers under awards and industrial agreements may be brought by Inspectors of Awards in the Court of Arbitration or the Magistrates' Court.
The Court of Arbitration upon application of Inspectors of Awards or upon applications of parties, joint or otherwise, may give its opinion upon any question connected with the construction of any award or industrial agreement or upon any particular determination or direction of the Court or upon the construction of any statute relating to matters within the jurisdiction of the Court. This function is largely availed of and enables many legal disputes to be settled with a minimum of friction and at a minimum cost.
The Court of Arbitration is vested with a jurisdiction to hear appeals from decisions of disputes committees set up to consider differences arising between parties to awards and industrial agreements as to any matter arising out of or connected with an award or agreement but not specifically dealt with therein.
The Court has a special jurisdiction to conduct inquiries into allegations of irregularities in connection with election of the officers of any industrial union and to make and enforce orders relating to such matters.
Under the Economic Stabilisation Act 1948 and regulations made thereunder:
The Court of Arbitration has power to make general orders amending the rates of remuneration in all awards and industrial agreements either of its own motion or on the application of any industrial union or association of workers or employers. For this purpose, the expression "rates of remuneration'' has a very wide connotation.
Under the Shops and Offices Act 1955:
The Court has power when making an award in any trade to fix the opening and closing hours of all shops in the particular trade in that locality and also to provide that such shops shall not be open for business on one working day in each week or on any award holiday.
Under the Annual Holidays Act 1944:
The Court has power to impose penalties for offences against the provisions of the Act.
Under the Apprentices Act 1948:
The Court has power to make apprenticeship orders, in respect of any industry or branch thereof to which the Act applies, prescribing the wages, hours, and other conditions of employment to be incorporated in contracts of apprenticeship, the period of apprenticeship in any industry and the minimum age at which a person may commence to serve as an apprentice in any industry, and pre-requisite education.
The Court on the application of certain parties may give its opinion upon any question connected with the construction of any apprenticeship order or with any determination or direction of the Court under the Act.
The Court may hear appeals from decisions of apprenticeship committees and district commissioners of apprenticeship, and its decisions are final and conclusive.
The Court has jurisdiction to decide actions in respect of alleged breaches of any contract of apprenticeship order of the Court or requirement of the Apprentices Act.
Under the Agricultural Workers Act 1962:
Matters in dispute between certain classes of agricultural workers and their employers may be referred to the Court of Arbitration for the purpose of making a recommendation to the Minister of Labour as to how matters in dispute should be settled.
General—The Court of Arbitration early in its history expanded beyond the limited function originally conceived for it. It has been the major force in the formulation of industrial codes. In its evolution and in its task of establishing uniform wage rates, the Court has risen to a commanding position in the economic life of the country. Apart from occasional legislation to meet special economic conditions, or as in 1936 to introduce the 40-hour week, no attempt has been made by Parliament to express in law the social and economic policy to be followed by the Court. There is no right of appeal from the decisions of the Court on any matters coming within its exclusive jurisdiction.
HOURS OF WORK—Employees in most occupations have had the benefit of a 40-hour five-day week since 1946, with the first legislation in this regard being enacted in 1936.
HOLIDAYS—The Annual Holidays Act 1944 provides for an annual holiday of two weeks' duration on ordinary pay for all workers who are not otherwise provided for in this respect. Where a worker has been employed for less than one year, on termination of employment he is entitled to payment equal to one twenty-fifth of his ordinary pay for the period of employment. An employer is required to keep a record (holiday book) containing particulars of employment, annual holidays, and amounts paid in respect of each worker in his employment.
The Industrial Conciliation and Arbitration Amendment Act 1965 provides that the Court of Arbitration must make provision in every award for workers to have at least 10 whole holidays on pay, in addition to annual holidays. The holidays so provided include Christmas Day, Boxing Day, New Year's Day, 2 January (or a day in lieu), Good Friday, Easter Monday, Anzac Day, Labour Day, the Sovereign's Birthday, and the provincial anniversary day (or a day in lieu).
The Public Holidays Act 1955 gives rules which are applicable to the provisions of any Act, award, or industrial agreement when Christmas Day and New Year's Day fall on a Friday, Saturday, or Sunday. The effect of the Act is broadly to provide that provisions regarding the granting of a holiday or observance of certain hours of labour or payment of certain specified rates of wages carried over from Saturday and Sunday to Monday (or Tuesday). In a similar way, where an anniversary day of any province falls on a Friday, Saturday, or Sunday, the provisions governing holiday, pay, etc., on anniversary day apply on the next succeeding Monday; if it falls on a Tuesday, Wednesday, or Thursday, the provisions apply to the immediately preceding Monday as if it were the anniversary day. Labour Day is deemed to be the fourth Monday in October.
ANZAC DAY ACT—Anzac Day (the 25th day of April) is a day of commemoration, being the anniversary of the first landing of troops on Gallipoli in 1915, and in terms of employment is observed as if it were a holiday.
FACTORIES ACT—The Factories Act 1946 applies to "any building, office, or place in which two or more persons are engaged or in which one or more persons are employed . . . directly or indirectly, in any handicraft, or in preparing or manufacturing goods for trade or sale . . .''
Restrictions on Employment—No boy or girl under 15 years of age may be employed in any factory. No boy or girl under 16 years of age may be employed in any factory unless a certificate of fitness is issued by an Inspector of Factories.
Overtime—No boy or girl under 16 years of age is permitted to work overtime. No woman may work more than three hour's overtime in one day (excluding time worked before noon on Saturday), or more than nine hours in any week, but there is no restriction on the yearly total overtime hours.
There are special provisions in regard to work for industries where raw materials which, in the opinion of the inspector are subject to rapid deterioration, are processed for sale as foodstuffs or where, in the opinion of the inspector, extended hours are necessary in order to meet a public demand.
Safely, Health, and Welfare—The safety measures have reference to machinery, dangerous liquids, means of access and safety of employment, and means of escape in case of fire. The employer is required to keep a register of all accidents of which he has any knowledge, and first-aid appliances must be provided and maintained. The health and welfare provisions are very extensive and include reference to such matters as air space, cleaniness, ventilation, canteens, the care of employees, amenities and other things to be supplied by the employer to secure employees' health or welfare.
SHOPS AND OFFICES ACT: Hours of Work—For shop assistants the hour of commencing work for persons under 16 years must not be earlier than 7 a.m., except that newspapers may be delivered from 6 a.m. by persons aged 12 years and under 16, and milk by persons aged 14 years and under 16 from the same hour. Boys under 18 or females may not be employed after 10.30 p.m. The Act provides that female assistants and boys under 18 cannot be employed in restaurants before 5 a.m. or after 10.30 p.m. However, it is not unlawful to employ female assistants over the age of 18 up to 11.30 p.m. or to midnight in connection with social functions (or if over 21 years, between midnight and 5.30 a.m.), if satisfactory provision for conveying these assistants to their homes be made. There is no limit under the Act to the time at which adult male hotel and restaurant employees may be required to commence or cease work.
Opening and Closing Hours of Shops—The Court of Arbitration has power when making an award in any trade to fix the opening and closing hours on weekdays of any shops substantially (i.e., at least 20 percent of turnover) carrying on the particular trade in that industrial district, and also to provide that such shops shall not be open for business on one working day in each week or on any award holiday.
Sunday Trading—Sunday trading is prohibited except (a) if provision is made in an award, the prior consent of the Minister being required to such inclusion, (b) for sale of exempted goods listed later, (c) if individual shops are granted exemption by the Shops and Offices Exemptions Tribunal or the Minister to permit them to open on Sunday. This is designed to enable shops in motor camps and other holiday resorts to cater for the needs of the travelling public.
Exempted Goods—The term "exempted goods'' means (a) tobacco, cigarettes, cigarette papers, cigars, and matches; (b) confectionery and sweetmeats; (c) milk, cream, eggs, butter, and cheese; (d) motor spirits, petrol, and oil; (e) motor accessories urgently and necessarily required for the functioning of a motor vehicle; (f) fruit, vegetables, and flowers, if for sale by the grower on the premises where grown; (g) newspapers; (h) goods of a class exempted from the provisions of the Act relating to the closing of shops by Order in Council. The list of exempted goods is given in the Shops and Offices Exempted Goods Order.
Non-exempted goods must be properly locked away from the view of the public after normal closing hours.
Safety, Health, and Welfare Provisions—The Act also makes provision for the welfare, health, and safety of assistants. Particular matters that are covered relate to dangerous liquids and noxious gases, limitation of loads, safe means of access, construction and maintenance of floors, passages, stairs, fire precautions, lighting, cleanliness, ventilation, drinking water, drainage, washing facilities, clothing accommodation, seating and first-aid facilities, rest rooms for women, sanitary conveniences, temperature and heating appliances, accommodation for meals, etc.
AGRICULTURAL WORKERS ACT—In the Agricultural Workers Act 1962 there is provision for the making of regulations prescribing minimum standards of accommodation and for Orders in Council prescribing minimum rates of pay.
Restrictions on Employment of Children—Under the Agricultural Workers' Act no child under the age of 15 years may: (a) be employed in any agricultural work during such times as the child is required to attend school under the Education Act; (b) be required to lift any weights, or to perform any task, likely to be injurious to his health; (c) work more than eight hours in any one day.
SHEARERS ACT—Under the Shearers Act 1962 an employer is required to provide amenities for all shearers employed by him, and where five or more shearers are employed and accommodated on the farm then accommodation is also to be provided. Minimum standards of both amenities and accommodation are set out by the Shearers Regulations 1963.
SHIPPING AND SEAMEN LEGISLATION—The general superintendence of matters relating to merchant ships and seamen in New Zealand is with the Marine Department.
Competence, Safety, and Welfare Provisions—The Shipping and Seamen Act 1952 makes adequate provision to ensure competence on the part of controlling officers of ships. Home-trade ships of 90 ft or more register length require two certificated mates unless running under 300 miles between terminal ports when only one mate is required; a ship less than 90 ft register length requires one certificated mate if running over 100 miles between terminal ports. A foreign-going ship is required to carry two certificated mates. Foreign-going certificated mates are entitled to ship as mates in the home-trade. Provision is made for issuing certificates of competency of mates of home-trade ships. Some certificates of masters, mates, and engineers granted in countries of the British Commonwealth are recognised as being valid in New Zealand.
Further sections dealing with the safety of the ship require the adjustment of compasses to be carried out under regulations, while the Minister may define restricted limits for ships. The Governor-General in Council makes regulations as to the loading and stowage of ballast and the loading of grain cargo in bulk. It is an offence to ship wool, flax, tow, or skins in such a condition as to be liable to spontaneous combustion.
MINING LEGISLATION—The present law relating to mining and quarrying is contained for the most part in the Coal Mines Act 1925 and subsequent amendments, the Mining Act 1926 and the amendments, and the Quarries Act 1944 and its amendments. A noteworthy feature of such Acts is the appointment of inspectors with wide powers.
Working Conditions—In the coal-mining industry working conditions are usually determined by direct negotiation between the coal-mine owners and the workers and the workers' organisations.
Since 1948 an underground shift of seven hours has applied in the mining industry in lieu of the former eight-hour limit.
Restriction on Employment—No person under the age of 16 years may be employed underground in any coal mine, or in any alluvial mine, or on or about any dredge; while the minimum age in respect of underground work in a quartz mine is 19 years. No youth may be employed in a mine for more than eight hours per day or 48 hours per week except in cases of emergency.
CONSTRUCTION ACT—Working conditions on a wide range of building and engineering works are governed in large measure by the Construction Act 1959 and regulations made under the Act.
LEGISLATION GOVERNING WORKING CONDITIONS IN THE VARIOUS BRANCHES OF THE GOVERNMENT SERVICE—The principal measures which are concerned with the majority of persons employed either directly or indirectly by the State and which have reference to their working conditions are given in the succeeding paragraphs.
Members of the Public Service are governed by the State Services Act 1962. Included in the functions of the Commission are the provision of suitable office accommodation, the prescription and supervision of physical working conditions, and also the regulation of a variety of points connected with personnel control—e.g., leave, hours of work, and salary and wage rates, payment of allowances, etc.
The Government Service Tribunal Act 1965 provides for the establishment of a tribunal with functions, in relation to the remuneration and conditions of service of employees, of making (a) principal and other orders, and (b) recommendations to the Prime Minister on any matters other than those contained in the principal orders.
The Government Railways Act 1949 furnishes the legislative framework for determination of the working conditions of railway employees. In 1944 there was established the Government Railways Industrial Tribunal, the principal functions of which are to prescribe scales of salaries and rates of wages; conditions in regard to hours of work, overtime, etc.; and terms and conditions in respect of leave of absence, railway concessions, etc. The Government Railways (Staff) Regulations 1953 are also of relevance in this connection.
Working conditions for Post Office employees are determined by the administrative authority, the Postmaster-General, with the Director-General as executive head. Power is vested in the Minister by virtue of the Post Office Act 1959. There is a Post Office Staff Tribunal whose function it is to make recommendations to the Minister on such matters as may be referred to it by the Minister, the Director-General or the New Zealand Post Office Association (Incorporated).
There are other legislative enactments which apply to the relevant sections of general Government employees. Members of the Police are governed by the Police Act 1958 and the Police Regulations 1959, while there is also a Police Staff Tribunal. The three fighting services are controlled at present by the Army Act 1950, the Navy Act 1954, and the Royal New Zealand Air Force Act 1950.
The Education Act 1964 and amendments provide the legislative background authorising, either by regulation or through the agency of education boards, the determination of the conditions of employment, pay, leave of absence, etc., for the members of the teaching profession.
LEGISLATIVE PROVISION FOR CERTAIN OTHER GROUPS: Hospital Board Employees—The provisions relating to working conditions of hospital board employees, such as nurses, etc., will be found in the Hospitals Act 1957 while the Hospital Employment Regulations 1963 bear directly on these matters.
Waterfront Industry—The legislation at present governing waterside work is contained in the Waterside Industry Act 1953, which defines waterside work as "the loading and unloading of ships, barges, lighters, and other vessels; and, in relation to any port where the harbour board acts as wharfinger, includes the work of receiving and delivering cargo customarily performed by waterside workers at that port''. The functions of government are shared between two types of bodies—one legislative and judicial, the other administrative only.
The legislative and judicial body is the Waterfront Industry Tribunal which consists of a Chairman and two other members appointed by the Governor-General on the recommendation of the Minister of Labour. The Tribunal is appointed for a term of three years and is a Commission of Inquiry under the Commissions of Inquiry Act 1908. The functions of the Tribunal are, firstly, to prescribe the terms and conditions of employment for waterside work, and here the Tribunal's procedure is similar to that followed by the Government Service Tribunal. To assist with this function, the Act also provides for the setting up by the Minister of Labour of a National Conciliation Committee to be appointed for a term not exceeding two years and consisting of eight employer and eight worker representatives, with an independent Chairman, to conduct conciliation proceedings on any application to the Tribunal which concerns two or more ports. Secondly, the Tribunal is required to settle any disputes that arise in relation to waterside work, and for this function has the assistance of Port Conciliation Committees which consist of an equal number of employers' and workers' representatives with an independent Chairman. Thirdly, the Tribunal is a general Appeal Court from decisions of Port Conciliation Committees (with certain limitations), National Amenities Committees, and orders of the Waterfront Industry Commission imposing levies or charges.
The Waterfront Industry Commission, which is the administrative body, consists of one Commissioner appointed for a term of five years by the Governor-General on the recommendation of the Minister of Labour. The functions of the Commission are, firstly, to carry out all administrative work in connection with the engagement of, and payment of wages to, waterside workers, including administrative work in connection with guaranteed minimum payments, annual and statutory holiday payments and systems of payment by results for waterside workers. Secondly, the Commission is responsible for the provision of amenities for waterside workers (subject to the direction of the National Amenities Committee) and for the equipping, operation, and management of these amenities which include waiting rooms or assembly halls, restaurants, canteens, and first-aid rooms. The National Amenities Committee, which is associated with the Commission in the function of provision of amenities, consists of six nominated representatives of employers, workers, and harbour boards and the Waterfront Industry Commissioner as Chairman, and is appointed by the Minister of Labour. This committee acts in an advisory capacity in authorising the Commission to provide amenities costing not more than $10,000 each at any port, and in approving schemes for the provision by harbour boards of amenities costing more than $10,000 each at any port.
The organisation of "registered'' waterside workers is on the basis of separate port unions with two associations or federations of unions, one of North Island port unions and the Lyttelton port union but excluding the Onehunga port union, and one of the South Island port unions excluding Lyttelton. There is also a joint committee of the executive officers of the two associations. Registration of the port unions and of the two associations is under the provisions of the Industrial Conciliation and Arbitration Act 1954—that is, through the Registrar of Industrial Unions in the Department of Labour.
GENERAL—About half of New Zealand's wage and salary earners are subject to awards and industrial agreement made under the Industrial Conciliation and Arbitration Act 1954 (a re-enactment of a measure which was originally enacted in 1894). The Industrial Conciliation and Arbitration Act enables minimum wage rates to be determined, industry by industry, by agreement between organisations of employers and workers concerned, or, failing such agreement, by awards made by the Court of Arbitration after hearing the parties. In about 90 percent of cases the parties reach full agreement in the conciliation proceedings. There has been an increasing gap between award rates and ruling rates and this has resulted in recent years in more wage bargaining outside the conciliation and arbitration system than ever before. Ruling rates have been recognised as subject to a consequential adjustments in many cases when award minimum rates are amended. (There are also considerable numbers of employees in supervisory and executive positions whose wage rates or salaries are determined by individual contracts of service. Groups whose wage rates or salaries are determined under other legislation are mentioned separately later.)
GENERAL WAGE ORDERS—In addition to its original jurisdiction, the Court of Arbitration is vested with the power to make general wage orders from time to time which have the effect of simultaneously increasing or reducing the rates of remuneration prescribed in all awards and industrial agreements in operation. The Court also has the power to exclude any class or section of workers from the operation of a general order, and to make such special provision as it considers just and equitable for that class or section.
General orders may be made by the Court of its own accord or on the application of any industrial union or industrial association of employers or workers.
The authority to make general orders is not derived from the Industrial Conciliation and Arbitration Act, but from regulations made under the Economic Stabilisation Act 1948.
Initially, the general wage order was a mechanism primarily to maintain real wages (i.e., wage purchasing power) in face of rapid changes in retail prices, but the Court possessed and exercised a discretion to modify any increase based on price changes so as to take account of general economic conditions and outlook at the time. The net effect of general wage orders has been to keep the minimum rates of wages specified in awards and industrial agreements roughly in line with changes in consumer prices.
In making a general order the Court is directed by the current regulations to take into account the following matters:
Any rise or fall in retail prices as indicated by any index published by the Government Statistician.
The economic conditions affecting finance, trade, and industry in New Zealand.
Any increase or decrease in productivity and in the volume and value of production in primary and secondary industries of New Zealand.
Relative movements in the incomes of different sections of the community.
Any other considerations that the Court deems relevant.
In dealing with applications the Court is required to afford such opportunity to be heard as it thinks proper to representatives appointed by the parties bound by awards and industrial agreements. Provision is made to permit parties bound by orders of special authorities to appear when applications for general orders are before the Court, although the parties themselves cannot initiate applications. In practice the major burden of conducting the cases has been accepted by the New Zealand Federation of Labour and the New Zealand Employers' Federation.
All the main aspects of the economy of the country are examined in considerable detail, and expert evidence is usually called in support of the submissions or to assist the Court in its task. For example, such persons as the Governor of the Reserve Bank, the Secretary to the Treasury, and the Government Statistician have frequently given evidence. The Court itself has no research staff. For basic information it relies for the most part on the comprehensive statistics published by the Government Statistician, the reports of the Reserve Bank of New Zealand, official economic and other surveys, and reports of Government departments, such as the Treasury, Department of Labour, Department of Agriculture, and the Department of Industries and Commerce. The advocates for the parties are invariably persons with long experience in the industrial arena. No professional lawyer has been engaged on the hearing of an applicant for a general order. The applications have varied in nature and magnitude from time to time.
The most recent general wage orders are now mentioned. A general order made on 4 July 1962 increased the minimum rates of remuneration determined by awards and industrial agreements (including agreements filed under the Labour Disputes Investigation Act 1913), then in force by 2 1/2 percent. Five awards and four industrial agreements covering dairy and farm workers were excluded from the order. There was no limiting amount to which the order applied. Another general order was made on 19 August 1964, with effect from 10 September 1964; minimum rates of wages in awards and industrial agreements were increased by a further 6 percent without exclusions or limit. A general order was made on 10 November 1966, with effect from 1 December 1966; it increased the minimum rate of wages specified in awards and industrial agreements by 2 1/2 percent.
STANDARD WAGE PRONOUNCEMENTS—In making a standard wage pronouncement the Court of Arbitration states separately the minimum award rates it considers appropriate for skilled, semi-skilled, and unskilled adult male workers. Unevenness between awards is reduced by the application of standard rates as awards come up for renewal. Ability to make a standard wage pronouncement is inherent in the jurisdiction of the Court of Arbitration, but not the power to apply a standard wage pronouncement to awards and agreement during their currency. At various times in the 20 years up to 1952 the Court of Arbitration was vested with special powers to make individual amendments simultaneously and immediately to every award and industrial agreement, in order to enable the rates of wages prescribed therein to conform to any new pronouncement on standard wage rates; the last occasion on which the Court was granted such powers was in 1952; the powers being withdrawn in May 1953 following strong criticism by workers' organisations and not having since been re-enacted.
MINIMUM WAGE—Enforceable minimum wage rates are determined under various statutes, the most universally applicable being the Minimum Wage Act 1945. This Act provides that workers of the age of 21 years and upwards must receive not less than the rates prescribed under the Act. In the great majority of cases, however, workers are subject to wage orders, awards, or industrial agreements relating to the particular industries in which they are employed and which provide somewhat higher enforceable minimum rates. The minimum wage for males is currently set at a rate which is lower than the standard rate for unskilled labour.
Since 23 February 1967 the minima have been: males, $4.55 a day, $22.25 a week; females, $3.05 a day, $14.89 a week.
BASIC WAGE—There is now no "basic wage'' in New Zealand; nor is there any formula for determining such a wage. In 1936 an amendment of the Industrial Conciliation and Arbitration Act required the Court to determine a basic wage for adult males and for adult females and directed that the basic wage for adult males should be sufficient to maintain a man, his wife, and three children in a fair and reasonable standard of comfort. The basic wage rates so determined by the Court, being below the prevailing minimum adult rates in awards and industrial agreements, were of little practical effect. The relevant provisions were dropped from the Act in 1954.
GROUPS COVERED BY PARTICULAR LEGISLATION—Certain groups of workers have their wages fixed by special authorities. Minimum rates for agricultural workers are prescribed by the Agricultural Workers Act 1962 and the various extension orders made under the Act. Rates of remuneration for waterside work are fixed by the Waterfront Industry Tribunal, constituted under the Waterfront Industry Act 1953. Rates of pay for workmen engaged on public-works construction have been determined by the State Services Commission since 1965 in the form of wage worker determinations.
Salaries and wages in the New Zealand Railways are, by the Government Railways Act 1949, prescribed by the Government Railways Industrial Tribunal. The legislative authority covering rates of remuneration for employees of the Post Office is contained in the Post Office Act 1959, while certain questions may be referred to the Post Office Staff Tribunal.
The State Services Act 1962 vests in the State Services Commission the power to make wage and salary determinations in relation to the remuneration of most public servants, while the Education Act 1964 vests in the Director-General of Education the power to make "teacher determinations'' in connection with the salary scales for teachers under the Act. In both cases there are rights of appeal to the Government Service Tribunal under the Government Service Tribunal Act 1965.
Pay and allowances for the Armed Services are prescribed in regulations under the New Zealand Army Act 1950, the Navy Act 1954, and the Royal New Zealand Air Force Act 1950. Salary and wages rates for hospital board employees not under awards and agreements are covered by the Hospitals Act 1957 and the Hospital Employment Regulations 1963. In 1965 a Police Staff Tribunal was established under the Police Act 1958 to make orders as to the remuneration and conditions of service of members of the Police.
PROTECTION OF WAGES—Workers' wages are safeguarded by the Wages Protection Act 1964. The entire amount of wages due to a worker must be paid in money unless he consents in writing to the employer making deductions for any lawful purposes or to the employer paying such wages by postal order, money order, cheque, or by lodgment to the worker's bank account.
Wages are further safeguarded by certain sections of the Bankruptcy Act which give priority of payments for wages or salaries of workers in preference to certain other debts, and wages take precedence over rents. Similarly, under the Companies Act, wages are a first claim on the assets of a company being wound up.
Various individual labour laws contain provisions with the special intent of protecting the payment of wages of the workers to whom such legislation applies.
AGRICULTURAL WORKERS ACT—Under the Agricultural Workers Act 1962, Orders in Council may prescribe minimum rates of wages and other conditions of employment for the various categories of agricultural workers covered by the Act, including workers employed on agricultural, pastoral, horticultural, and silvicultural work, flax milling, and also bush workers and sawmill workers. The administration of the Act is carried out by the Department of Labour. Orders made under the previous Act passed in 1936 still apply to workers on dairy farms, farms and stations, and market gardens, and Orders made under the latest Act apply to workers employed in orchards and in tobacco growing.
Minimum Rates of Pay—The minimum rates prescribed by Orders in Council for specified classes of agricultural workers are as follows.
Dairy Farms—The minimum rate is $20.55 a week, increased by $4.25 a week if the worker is not provided with board and lodging by the employer. The rate is taken to include allowance for work done at weekends and on holidays as part of the normal week's work. The minimum rate for casual workers is 53 cents an hour, with rations. Lesser rates for permanent adult female workers $21.50 a week. The minimum rates for casual workers are have not been amended since 1960 and are now subject to the Minimum Wage Order 1967 which fixes the minimum wage for adult males at $22.25 a week.
Farms and Stations—In the case of workers on farms and stations for whom the hours of work are not definitely laid down, the minimum weekly rate for an adult male worker is $16.82, increased by $4.25 a week if the worker is not provided with board and lodging by the employer, or by $3.25 a week if provided with only lodging or a free house. These rates have not been amended since 1959 and are now subject to the Minimum Wage Order 1967 which fixes the minimum wages for adult males at $22.25 a week.
Orchardists—The minimum rate for permanent adult male workers is $29.67 a week and for permanent adult female workers $21.50 a week. The minimum rates for casual workers are 72 cents an hour for adult males and 52 cents an hour for adult females. Lesser minimum rates are prescribed for junior permanent and casual workers, according to specified ages. The minimum rate for managers is $34.33.
Market Gardens—The minimum rates for adult males are $26.45 a week and 61.875 cents an hour, and for adult females $17.64 a week and 41.25 cents an hour. Lesser minimum rate for juniors (male and female) are prescribed.
Tobacco Companies and Tobacco Growers—The minimum rate for permanent adult male workers is $29.67 a week, and for permanent adult female workers $22 a week. The minimum rate for casual workers is 72 cents an hour for adult males and 52 cents an hour for females 20 years of age or over. Lesser minimum rates are prescribed for junior casual workers (male and female) according to specified ages.
SHAREMILKING AGREEMENTS ACT—Another important measure dealing with farm workers is the Sharemilking Agreements Act 1937, which defines the respective responsibilities of employers and sharemilkers in farm management and control of stock, and prescribes the minimum percentages of returns to sharemilkers. The Act contains provisions for terms and conditions to be altered by Order in Council, the current order being the Sharemilking Agreements Order 1966.
INDUSTRIAL CLASSIFICATION OF SALARY AND WAGE PAYMENTS—The data in the following table represent the results of an industrial classification of the salary and wage payments to employees during the latest three years ended 31 March. This information is extracted from returns required in connection with the "pay as you earn'' income tax legislation. Therefore all employees are covered and the payments are those which are made during a year which is uniform for all employers.
Actual gross payments made during a year are not the exact equivalent of the earnings of the employees during that year. Accrued wages at the beginning of the year are taken into account but those accrued at the end of the year are not. The effect of this is normally insignificant.
The "enterprise'' concept has been used in this classification. Under this concept where an individual or a company is concerned in two or more industries for which separate classifications are provided, the whole of the wage payments have been classified according to the predominant activity. In most statistical analyses the enterprise is subdivided into separate units where two or more industries are involved, and each unit is then appropriately classified. A minor exception to the general rule has been made in the case of the road passenger transport and the electricity supply services of local authorities. These activities have been included in the appropriate industries.
| Industry Group | Salary and Wage Payments | ||
|---|---|---|---|
| 1962-63 | 1963-64 | 1964-65 | |
| $(million) | |||
| Agriculture and livestock production | 75.2 | 80.2 | 87.4 |
| Forestry, hunting, and fishing | 4.6 | 5.2 | 6.0 |
| Mining and quarrying | 11.5 | 11.7 | 12.6 |
| Manufacturing, food, beverages, and tobacco | 105.1 | 109.7 | 119.6 |
| Manufacturing, textiles, wearing apparel, and made-up textiles | 56.1 | 59.7 | 65.9 |
| Manufacturing, wood, paper, chemical, etc., products (including miscellaneous manufacturing) | 148.1 | 160.2 | 174.4 |
| Manufacturing, metals and metal products | 88.8 | 100.3 | 117.9 |
| Construction | 128.2 | 139.7 | 162.5 |
| Electricity, gas, water, and sanitary services (not construction) | 23.1 | 24.4 | 25.7 |
| Commerce—wholesale and retail trade | 240.7 | 258.3 | 284.9 |
| Commerce—other | 69.2 | 75.3 | 84.6 |
| Transport, storage, and communication | 182.9 | 189.7 | 208.3 |
| Services, community, business, recreation, and personal | 320.2 | 347.5 | 385.0 |
| Activities not adequately described | 2.8 | 2.1 | 1.2 |
| Totals | 1,456.4 | 1,563.9 | 1,736.0 |
All industry groups showed increases in the amount of wages paid in 1964-65 compared with the previous year. Percentage rates of increase during the last three years were: 1961-62 to 1962-63, 5.8 percent; 1962-63 to 1963-64, 7.4 percent; 1963-64 to 1964-65, 11.0 percent.
WEEKLY EARNINGS—The Department of Labour carries out surveys at half-yearly intervals; returns are required from all establishments in which at least two persons (including working proprietors) are engaged; Government and local authority employment is included, but not farming, hunting, fishing, waterfront and seagoing work, domestic service in private households and armed forces. In the following table average hourly earnings derived from this survey (covering males, females, adults and juveniles) are compared with nominal minimum award rates for adult males.
| Date of Survey | Weekly Wage Payout
per Person (Including Overtime, Bonus Earnings, etc.) Aggregate Payout for One Week Divided by— | Nominal Minimum
Weekly Wage for Adult Males as Prescribed in Awards and Industrial Agreements as at End of Preceding Month | |
|---|---|---|---|
| Full-time Employees | Full-time and Part-time Employees | ||
| $ | $ | $ | |
| 1957—April | 28.30 | 26.98 | 23.97 |
| October | 28.45 | 27.07 | 24.06 |
| 1958—April | 28.85 | 27.39 | 24.26 |
| October | 29.05 | 27.54 | 24.32 |
| 1959—April | 29.52 | 27.99 | 24.49 |
| October | 28.88 | 28.25 | 24.48 |
| 1960—April | 31.48 | 29.73 | 25.82 |
| October | 31.87 | 29.89 | 26.10 |
| 1961—April | 33.21 | 31.10 | 26.24 |
| October | 33.38 | 31.10 | 26.41 |
| 1962—April | 34.02 | 31.82 | 26.68 |
| October | 34.53 | 32.21 | 27.44 |
| 1963—April | 35.40 | 33.07 | 27.64 |
| October | 35.92 | 33.38 | 27.92 |
| 1964—April | 36.66 | 34.09 | 28.05 |
| October | 38.64 | 35.46 | 29.72 |
| 1965—April | 39.89 | 36.80 | 30.21 |
| October | 40.57 | 37.37 | 30.60 |
| 1966—April | 41.48 | 38.06 | 30.89 |
| October | 42.65 | 38.95 | 31.33 |
HOURLY EARNINGS—In the following table average hourly earnings from the half-yearly surveys are shown; estimated average ordinary time worked by full-time employees has been obtained by dividing aggregate ordinary-time hours worked during one week by the sum of full-time employees plus half of the part-time employees; hence if there are any part-time workers the sum of the average ordinary-time hours and overtime hours will not be equal to the average time worked by full-time and part-time employees as shown in the last column.
| Date | Average Minimum Hourly Rates as Prescribed in Awards and Industrial Agreements for Adult Males in 13 Industrial Groups (Excluding Farming) as at End of Preceding Month | Average Hourly Earnings for All Workers Covered by Half-yearly Survey | Average Weekly Hours Worked by Workers Covered by Half-yearly Survey | ||||
|---|---|---|---|---|---|---|---|
| Ordinary Time | Overtime | Ordinary Time and Overtime Combined | Ordinary Time (Estimated) Worked by Full-time Employees | Overtime (Estimated) Worked by Full-time Employees | Ordinary Time and Overtime Worked by Full-time and Part-time Employees Combined | ||
| $ | $ | $ | $ | hours | hours | hours | |
| 1960—April | 0.662 | 0.731 | 1.087 | 0.754 | 37.9 | 2.7 | 39.4 |
| October | 0.668 | 0.740 | 1.102 | 0.763 | 37.9 | 2.6 | 39.2 |
| 1961—April | 0.672 | 0.762 | 1.176 | 0.792 | 37.6 | 3.0 | 39.3 |
| October | 0.677 | 0.774 | 1.123 | 0.798 | 37.6 | 2.8 | 38.9 |
| 1962—April | 0.686 | 0.790 | 1.177 | 0.814 | 37.8 | 2.7 | 39.1 |
| October | 0.707 | 0.808 | 1.199 | 0.831 | 37.8 | 2.4 | 38.8 |
| 1963—April | 0.714 | 0.818 | 1.242 | 0.845 | 37.9 | 2.7 | 39.1 |
| October | 0.721 | 0.831 | 1.230 | 0.856 | 37.8 | 2.7 | 39.0 |
| 1964—April | 0.725 | 0.839 | 1.252 | 0.868 | 37.7 | 3.0 | 39.2 |
| October | 0.775 | 0.880 | 1.306 | 0.917 | 37.8 | 2.8 | 39.0 |
| 1965—April | 0.784 | 0.908 | 1.337 | 0.939 | 37.6 | 3.1 | 39.0 |
| October | 0.796 | 0.927 | 1.367 | 0.956 | 37.7 | 3.1 | 39.0 |
| 1966—April | 0.804 | 0.939 | 1.418 | 0.375 | 37.7 | 3.2 | 39.0 |
| October | 0.817 | 0.967 | 1.432 | 1.000 | 37.8 | 3.1 | 38.9 |
The preceding table combines all industries. A dissection by industrial groups of the last line of that table—relating to October 1966—is now provided. Minimum hourly rates are omitted.
| Industrial Group | Average Hourly Earnings for All Workers Covered by Half-yearly Survey | Average Weekly Hours Worked by Workers Covered by Half-yearly Survey | ||||
|---|---|---|---|---|---|---|
| Ordinary Time | Overtime | Ordinary Time and Overtime Combined | Ordinary Time (Estimated) Worked by Full-time Employees | Overtime (Estimated) Worked by Employees | Ordinary Time and Overtime Worked by Full-time and Part-time Employees Combined | |
| $ | $ | $ | hours | hours | hours | |
| Forestry, logging, mining, and quarrying— | ||||||
| Forestry | 1.008 | 1.441 | 1.019 | 37.9 | 1.0 | 38.7 |
| Logging | 1.246 | 1.524 | 1.279 | 38.5 | 5.3 | 43.7 |
| Coal mining | 1.340 | 1.557 | 1.358 | 32.7 | 2.8 | 35.5 |
| Other mining | 1.078 | 1.467 | 1.140 | 38.0 | 7.3 | 44.6 |
| Quarrying (not lime, cement) | 0.948 | 1.413 | 1.040 | 38.7 | 9.6 | 47.7 |
| Totals | 1.139 | 1.482 | 1.172 | 36.6 | 3.8 | 40.2 |
| Seasonal manufacturing— | ||||||
| Meat processing, etc. | 1.063 | 1.603 | 1.122 | 35.1 | 4.3 | 39.1 |
| Fruit and vegetable preserving | 0.809 | 1.359 | 0.864 | 34.7 | 3.9 | 38.2 |
| Dairy, factories | 0.943 | 1.513 | 1.054 | 39.0 | 9.5 | 48.2 |
| Totals | 1.009 | 1.549 | 1.080 | 36.0 | 5.5 | 41.1 |
| Food, drink, and tobacco (other than seasonal)— | ||||||
| Grain milling | 0.974 | 1.418 | 1.008 | 38.1 | 3.1 | 40.5 |
| Bread bakeries | 0.933 | 1.471 | 1.014 | 37.4 | 7.4 | 39.9 |
| Biscuit making | 0.801 | 1.265 | 0.861 | 37.9 | 6.1 | 40.0 |
| Cake and pastry making | 0.749 | 1.354 | 0.787 | 37.6 | 2.9 | 34.8 |
| Sugar and confectionery | 0.808 | 1.204 | 0.848 | 37.7 | 4.4 | 40.2 |
| Other food | 0.888 | 1.282 | 0.936 | 37.4 | 5.3 | 41.3 |
| Beverages | 0.944 | 1.479 | 1.011 | 38.1 | 5.6 | 42.6 |
| Tobacco manufacture | 0.758 | 1.198 | 0.821 | 38.0 | 6.4 | 43.3 |
| Totals | 0.862 | 1.350 | 0.918 | 37.7 | 5.2 | 40.1 |
| Textiles, clothing, and leather— | ||||||
| Tanneries | 1.013 | 1.372 | 1.049 | 37.6 | 4.2 | 41.3 |
| Fur dressing and manufacture | 0.847 | 1.203 | 0.857 | 37.2 | 1.2 | 35.2 |
| Leather goods | 0.759 | 1.105 | 0.779 | 37.5 | 2.5 | 37.8 |
| Knitted wear and hosiery | 0.821 | 1.216 | 0.843 | 36.9 | 2.3 | 38.2 |
| Flax, rope and twine | 1.028 | 1.193 | 1.043 | 36.4 | 3.5 | 39.5 |
| Woollen mills | 0.836 | 1.258 | 0.879 | 36.3 | 4.3 | 38.9 |
| Other textile production | 0.988 | 1.326 | 1.026 | 36.0 | 4.6 | 40.1 |
| Clothing manufacture | 0.704 | 1.013 | 0.712 | 36.3 | 1.0 | 35.8 |
| Footwear manufacture | 0.852 | 1.149 | 0.871 | 37.0 | 2.1 | 38.5 |
| Footwear repair | 0.836 | 1.373 | 0.852 | 38.4 | 1.3 | 36.1 |
| Other textile goods | 0.754 | 1.265 | 0.788 | 36.3 | 2.7 | 37.4 |
| Totals | 0.792 | 1.203 | 0.814 | 36.5 | 2.2 | 37.4 |
| Building materials and furnishings— | ||||||
| Sawmilling, plywood etc. | 0.993 | 1.500 | 1.048 | 37.7 | 4.7 | 41.9 |
| Builders' woodwork | 0.910 | 1.304 | 0.954 | 38.5 | 5.0 | 42.6 |
| Furniture and cabinets | 0.907 | 1.311 | 0.946 | 38.3 | 4.3 | 41.2 |
| Other wood manufacture | 0.848 | 1.318 | 0.884 | 37.7 | 3.3 | 39.5 |
| Structural clay products | 1.082 | 1.313 | 1.122 | 36.8 | 7.7 | 43.7 |
| Pottery and glass | 1.015 | 1.459 | 1.063 | 37.9 | 4.6 | 42.1 |
| Lime, cement, etc. | 1.005 | 1.415 | 1.069 | 38.1 | 7.1 | 44.6 |
| Totals | 0.972 | 1.411 | 1.024 | 38.0 | 5.3 | 42.5 |
| Industrial Group | Average Hourly Earnings for All Workers Covered by Half-yearly Survey | Average Weekly Hours Worked by Workers Covered by Half-yearly Survey | ||||
|---|---|---|---|---|---|---|
| Ordinary Time | Overtime | Ordinary Time and Overtime Combined | Ordinary Time (Estimated) Worked by Full-time Employees | Overtime (Estimated) Worked by Full-time Employees | Ordinary Time and Overtime Worked by Full-time and Part-time Employee-Combined | |
| $ | $ | $ | hours | hours | hours | |
| Engineering and metalworking— | ||||||
| Engineering and machinery | 0.991 | 1.466 | 1.049 | 38.0 | 5.4 | 42.6 |
| Electrical manufacture | 0.933 | 1.380 | 0.969 | 37.7 | 3.3 | 40.3 |
| Ships, locomotives, etc. | 0.973 | 1.413 | 1.013 | 38.4 | 3.8 | 42.0 |
| Vehicle and cycle manufacture | 1.004 | 1.456 | 1,071 | 37.9 | 6.6 | 44.2 |
| Vehicle repair and aircraft | 0.900 | 1.415 | 0.931 | 38.4 | 2.5 | 39.5 |
| Totals | 0.954 | 1.444 | 1.003 | 38.1 | 4.2 | 41.4 |
| Miscellaneous manufacturing— | ||||||
| Chemicals and chemical products | 1.013 | 1.469 | 1.055 | 37.7 | 3.8 | 40.8 |
| Rubber manufacture | 1.120 | 1.480 | 1.153 | 38.8 | 4.0 | 42.2 |
| Paper and paper products | 1.122 | 1.581 | 1.180 | 37.2 | 5.5 | 42.2 |
| Printing, publishing, and allied | 0.979 | 1.562 | 1.018 | 38.4 | 2.8 | 39.4 |
| Instruments, clocks, jewellery | 0.818 | 1.308 | 0.839 | 37.9 | 1.8 | 37.6 |
| Other manufacturing | 0.901 | 1.374 | 0.956 | 37.6 | 5.2 | 41.1 |
| Totals | 1.008 | 1.501 | 1.053 | 38.0 | 3.9 | 40.6 |
| Totals, manufacturing industries (including seasonal) | 0.937 | 1.432 | 0.985 | 37.6 | 4.1 | 40.6 |
| Power, water and sanitary services | 1.041 | 1.546 | 1.082 | 38.5 | 3.5 | 41.6 |
| Building and construction | 0.973 | 1.445 | 1.033 | 38.9 | 5.7 | 44.6 |
| Transport and communication— | ||||||
| Rail transport | 1.058 | 1.268 | 1.083 | 39.8 | 5.3 | 45.0 |
| Road transport | 0.949 | 1.430 | 1.015 | 38.3 | 6.3 | 42.8 |
| Water transport (not waterfront work) | 1.092 | 1.778 | 1.178 | 38.7 | 5.6 | 43.8 |
| Air transport | 1.306 | 1.408 | 1.314 | 39.0 | 3.2 | 41.6 |
| Post Office | 0.960 | 1.603 | 1.002 | 38.4 | 2.7 | 40.2 |
| Totals | 1.012 | 1.456 | 1.057 | 38.8 | 4.5 | 42.3 |
| Commerce— | ||||||
| Wholesale and retail trade | 0.913 | 1.362 | 0.926 | 38.1 | 1.2 | 36.7 |
| Storage | 0.973 | 1.543 | 1.057 | 40.0 | 6.9 | 46.6 |
| Finance | 1.049 | 1.409 | 1.056 | 37.1 | 0.6 | 37.2 |
| Insurance | 1.095 | 1.397 | 1.103 | 37.5 | 0.4 | 37.3 |
| Real estate | 1.111 | 1.333 | 1.111 | 38.1 | - | 36.7 |
| Totals | 0.940 | 1.368 | 0.952 | 37.9 | 1.1 | 36.8 |
| Wool and grain stores (seasonal) | 0.923 | 1.423 | 0.979 | 36.8 | 4.8 | 40.8 |
| Subtotals (including wool and grain stores) | 0.939 | 1.372 | 0.952 | 37.9 | 1.2 | 36.9 |
| Domestic and personal services— | ||||||
| Provision of lodging, food, etc. | 0.788 | 1.263 | 0.810 | 35.8 | 2.2 | 31.2 |
| Portrait and photo studies | 0.333 | 1.404 | 0.843 | 37.2 | 0.8 | 35.0 |
| Laundries, cleaning, etc. | 0.717 | 1.102 | 0.735 | 36.3 | 2.5 | 29.1 |
| Barbers, beauty shops, etc. | 0.511 | 0.753 | 0.513 | 38.5 | 0.4 | 37.2 |
| Recreation, sports, etc. | 1.033 | 1.305 | 1.044 | 32.1 | 1.9 | 25.8 |
| Undertaking, etc. | 0.980 | 1.444 | 1.004 | 38.7 | 2.2 | 39.2 |
| Totals | 0.801 | 1.230 | 0.819 | 35.4 | 2.0 | 30.1 |
| Industrial Group | Average Hourly Earnings for All Workers Covered by Half-yearly Survey | Average Weekly Hours Worked by Workers Covered by Half-yearly Survey | ||||
|---|---|---|---|---|---|---|
| Ordinary Time | Overtime | Ordinary Time and Overtime Combined | Ordinary Time (Estimated) Worked by Full-time Employees | Overtime (Estimated) Worked by Full-time Employees | Ordinary Time and Overtime Worked by Full-time and Part-time Employees Combined | |
| $ | $ | $ | hours | hours | hours | |
| Administration and professional— | ||||||
| Hospitals | 0.883 | 1.389 | 0.913 | 39.0 | 2.6 | 38.3 |
| Medical and allied services | 0.931 | 1.486 | 0.932 | 36.3 | 0.1 | 33.9 |
| Education and instruction | 1.160 | 1.828 | 1.161 | 36.6 | 0.1 | 34.3 |
| Arts, science, and religion | 1.110 | 1.622 | 1.116 | 37.6 | 0.4 | 35.8 |
| Government (n.e.i.) | 1.148 | 1.556 | 1.157 | 37.8 | 0.8 | 37.4 |
| Local authorities (n.e.i.) | 1.049 | 1.459 | 1.077 | 38.6 | 2.9 | 40.2 |
| Miscellaneous services and agencies | 0.934 | 1.349 | 0.938 | 36.6 | 0.4 | 35.0 |
| Totals | 1.044 | 1.440 | 1.055 | 37.6 | 1.1 | 36.5 |
| Grand totals, all industries (including seasonal) | 0.967 | 1.432 | 1.000 | 37.8 | 3.1 | 38.9 |
NOMINAL WAGE RATES—The Department of Statistics compiles statistics of nominal wage rates in New Zealand from the awards made by, and the industrial agreements filed in, the Court of Arbitration, and decisions of other wage-fixing tribunals. In appropriate cases wage rates specified in agreements which have not been filed in the office of the Clerk of Awards are used. The rates specified in these awards and orders are minimum rates; they take into account neither overtime nor ruling rates, which may be above the prescribed minima.
The award rates for the four principal districts—Northern, Wellington, Canterbury, and Otago and Southland—are in general taken as being representative of nominal wages throughout New Zealand. Where an important centre of an industry is situated outside the geographical boundaries of the four principal districts, the award rates for that centre are used; for instance, the rates used for sawmilling in the Canterbury District are those prescribed by the awards for the Westland Industrial District.
There are 14 industrial groups in the series of index numbers covering predominantly wage rates of manual workers; such occupations as clerical and office workers, professional technical, and related workers, managers, officials, and administrators, and most service workers being excluded. Besides all primary and secondary industries the following distributive trades and services are, however, included: retailing of meat, groceries, soft goods, and coal and firewood; provision of accommodation, meals, and personal services; transport industries.
Four series of wage-rates index numbers are compiled; these comprise indices for adult males, adult females, juvenile males, and juvenile females only. The adult male index covers all 14 industrial groups.
Wage Rates of Adult Workers—Index numbers of annual averages of nominal weekly wage rates of adult males are given in the following table in a "long-term linked series.''
| NOMINAL WEEKLY
WAGE-RATES INDEX NUMBERS (ADULT MALES), ALL INDUSTRIAL GROUPS | |
|---|---|
| Base: 1954. (= 1000) | |
| Year | Index Number |
Provisional.* | |
| 1914 | 253 |
| 1915 | 263 |
| 1916 | 273 |
| 1917 | 289 |
| 1918 | 303 |
| 1919 | 329 |
| 1920 | 371 |
| 1921 | 402 |
| 1922 | 389 |
| 1923 | 375 |
| 1924 | 378 |
| 1925 | 387 |
| 1926 | 393 |
| 1927 | 401 |
| 1928 | 413 |
| 1929 | 414 |
| 1930 | 414 |
| 1931 | 383 |
| 1932 | 351 |
| 1933 | 339 |
| 1934 | 341 |
| 1935 | 349 |
| 1936 | 386 |
| 1937 | 421 |
| 1938 | 440 |
| 1939 | 447 |
| 1940 | 460 |
| 1941 | 476 |
| 1942 | 497 |
| 1943 | 513 |
| 1944 | 518 |
| 1945 | 562 |
| 1946 | 583 |
| 1947 | 606 |
| 1948 | 646 |
| 1949 | 682 |
| 1950 | 729 |
| 1951 | 829 |
| 1952 | 871 |
| 1953 | 929 |
| 1954 | 1,000 |
| 1955 | 1,035 |
| 1956 | 1,055 |
| 1957 | 1,104 |
| 1958 | 1,116 |
| 1959 | 1,136 |
| 1960 | 1,193 |
| 1961 | 1,212 |
| 1962 | 1,242 |
| 1963 | 1,276 |
| 1964 | 1,315 |
| 1965 | 1395x |
| 1966 | 1430* |
The next table shows the index numbers of nominal weekly wage rates of adult males for each industrial group and for all groups combined.
| NOMINAL WEEKLY WAGE-RATES INDEX NUMBERS (ADULT MALES) | |||||||
|---|---|---|---|---|---|---|---|
| Base: All groups combined, 1954 (= 1000) | |||||||
| Industrial Group | Calendar Year | 1966 | |||||
| 1954 | 1965 | 1966* | 31 Mar | 30 Jun | 30 Sep* | 31 Dec* | |
* Provisional. NOTE—The index numbers in this table are comparable both vertically and horizontally. | |||||||
| Provision of— | |||||||
| Food, drink, etc. | 1,037 | 1498x | 1,536 | 1,525 | 1,526 | 1,547 | 1,578 |
| Clothing, footwear, and textiles | 989 | 1,407 | 1,435 | 1,420 | 1,435 | 1,444 | 1,487 |
| Building and construction | 252 | 1376x | 1,412 | 1,394 | 1,424 | 1,425 | 1,458 |
| Power, heat, and light | 927 | 1324x | 1,356 | 1,337 | 1,337 | 1,385 | 1,421 |
| Transport by water and air | 1,165 | 1674x | 1,737 | 1,708 | 1,746 | 1,752 | 1,796 |
| Transport by land | 991 | 1474x | 1,511 | 1,494 | 1,494 | 1,529 | 1,551 |
| Accommodation, meals, and personal service | 962 | 1,383 | 1,419 | 1,412 | 1,416 | 1,420 | 1,467 |
| Working in or on— | |||||||
| Wood, wicker, seagrass, etc. | 1,015 | 1,427 | 1,453 | 1,440 | 1,444 | 1,450 | 1,516 |
| Metal | 1,058 | 1,498 | 1,557 | 1,556 | 1,566 | 1,566 | 1,614 |
| Stone, clay, glass, chemicals, etc. | 944 | 1339x | 1,370 | 1,349 | 1,363 | 1,385 | 1,443 |
| Paper, printing, etc. | 1,064 | 1,525 | 1,640 | 1,666 | 1,666 | 1,666 | 1,707 |
| Skins, leather, etc. | 968 | 1367x | 1,404 | 1,388 | 1,408 | 1,418 | 1,453 |
| Mines and quarries | 977 | 1,334 | 1,344 | 1,334 | 1,350 | 1,350 | 1,384 |
| The land (farming pursuits) | 929 | 1098x | 1,100 | 1,099 | 1,099 | 1,099 | 1,108 |
| All groups combined | 1,000 | 1395x | 1,430 | 1,420 | 1,430 | 1,440 | 1,475 |
In the groups "accommodation, meals, and personal service'', and "transport by water and air'', the estimated value of board and lodging, and in the "working on the land'' group, the value of rations as well as the estimated value of board and lodging, are where applicable, added to the money wage rate in order to make a legitimate comparison with other industries. Also included in the wages for workers in the "transport by water and air'' group is a seagoing allowance where applicable. In the case of waterside workers (an important subgroup of the "water and air transport'' group) these allowances are not, of course, applicable.
Movement in Individual Groups—The following table brings out the movements in the various groups more clearly as the respective bases are the average weekly wage rates for each industrial group, 1954 (= 1000).
| NOMINAL WEEKLY WAGE-RATES INDEX NUMBERS (ADULT MALES) | |||||||
|---|---|---|---|---|---|---|---|
| Base: Each group separately, 1954 (= 1000) | |||||||
| Industrial Group | 1914 | 1939 | 1954 | 1963 | 1964 | 1965 | 1966* |
*Provisional. | |||||||
| Provision of— | |||||||
| Food, drink, etc. | 257 | 488 | 1,000 | 1,318 | 1,362 | 1445x | 1,482 |
| Clothing, footwear, and textiles | 246 | 454 | 1,000 | 1,286 | 1,334 | 1,422 | 1,450 |
| Building and construction | 274 | 472 | 1,000 | 1,294 | 1,347 | 1430x | 1,468 |
| Power, heat, and light | 266 | 483 | 1,000 | 1,305 | 1,341 | 1428x | 1,463 |
| Transport by water and air | 237 | 440 | 1,000 | 1,309 | 1,346 | 1436x | 1,491 |
| Transport by land | 256 | 463 | 1,000 | 1,331 | 1,377 | 1488x | 1,524 |
| Accommodation, meals, and personal service | 282 | 460 | 1,000 | 1,314 | 1,350 | 1,438 | 1,476 |
| Working in or on— | |||||||
| Wood, wicker, seagrass, etc. | 253 | 470 | 1,000 | 1,288 | 1,320 | 1407x | 1,432 |
| Metal | 274 | 475 | 1,000 | 1,290 | 1,337 | 1,416 | 1,471 |
| Stone, clay, glass, chemicals, etc. | 252 | 486 | 1,000 | 1,292 | 1,334 | 1419x | 1,452 |
| Paper, printing, etc. | 287 | 472 | 1,000 | 1,312 | 1,371 | 1,432 | 1,541 |
| Skins, leather, etc. | 262 | 487 | 1,000 | 1,258 | 1,301 | 1411x | 1,450 |
| Mines and quarries | 268 | 450 | 1,000 | 1,278 | 1,305 | 1,365 | 1,375 |
| The land (farming pursuits) | 226 | 373 | 1,000 | 1,124 | 1,134 | 1181x | 1,183 |
| All groups combined | 253 | 447 | 1,000 | 1,276 | 1,315 | 1395x | 1,430 |
Care must be exercised in drawing inferences from this table, for, while horizontal comparisons are quite valid, the vertical comparison between the various groups is valid only in so far as it shows in which groups the greater or the smaller movements have occurred.
Wage Rates for All Adult Workers—The following table gives an index for all adult workers.
| NOMINAL WEEKLY
WAGE-RATES INDEX NUMBERS (ADULT MALES AND FEMALES COMBINED), ALL INDUSTRIAL GROUPS | |
|---|---|
| Base: 1954 (= 1000) | |
| Year | Index No. |
*Provisional. | |
| 1952 | 869 |
| 1953 | 929 |
| 1954 | 1,000 |
| 1955 | 1,036 |
| 1956 | 1,055 |
| 1957 | 1,105 |
| 1958 | 1,117 |
| 1959 | 1,137 |
| 1960 | 1,195 |
| 1961 | 1,214 |
| 1962 | 1,245 |
| 1963 | 1,280 |
| 1964 | 1,320 |
| 1965 | 1401x |
| 1966 | 1437* |
Indexes of Hourly Wage Rates—The indexes which follow cover 13 only out of the 14 industrial groups commonly adopted (as is also the case in respect of the indexes of standard weekly hours of labour), since working hours on farms (which would be essential to the fourteenth group) cannot for this purpose be satisfactorily treated statistically. The base of the first table is the average hourly wage rate (computed as described after the two following tables) for all groups combined, 1954 (= 1000).
| NOMINAL HOURLY WAGE-RATES INDEX NUMBERS (ADULT MALES) | |||||
|---|---|---|---|---|---|
| Base: All groups combined, 1954 (= 1000) | |||||
| Industrial Group | 1954 | 1953 | 1964 | 1965 | 1966* |
*Provisional. | |||||
| Provision of— | |||||
| Food, drink, etc. | 1,024 | 1,349 | 1,394 | 1479x | 1,517 |
| Clothing, footwear, and textiles | 977 | 1,257 | 1,303 | 1,389 | 1,417 |
| Building and construction | 950 | 1,229 | 1,279 | 1359x | 1,395 |
| Power, heat, and light | 916 | 1,195 | 1,228 | 1308x | 1,339 |
| Transport by water and air | 1,108 | 1,450 | 1,491 | 1591x | 1,651 |
| Transport by land | 979 | 1,302 | 1,347 | 1456x | 1,492 |
| Accommodation, meals, and personal service | 950 | 1,248 | 1,282 | 1,365 | 1,401 |
| Working in or on— | |||||
| Wood, wicker, seagrass, etc. | 1,002 | 1,291 | 1,323 | 1,409 | 1,434 |
| Metal | 1,045 | 1,348 | 1,397 | 1,479 | 1,537 |
| Stone, clay, glass, chemicals, etc. | 932 | 1,203 | 1,243 | 1,322 | 1,353 |
| Paper, printing, etc. | 1,051 | 1,379 | 1,441 | 1,506 | 1,619 |
| Skins, leather, etc. | 956 | 1,203 | 1,244 | 1350x | 1,387 |
| Mines and quarries | 1,038 | 1,327 | 1,355 | 1,417 | 1,428 |
| All groups combined | 1,000 | 1,302 | 1,346 | 1,432 | 1,473 |
The next table shows the movement in individual groups. The base is the average hourly wage rate for each group individually, 1954 (= 1000).
| NOMINAL HOURLY WAGE-RATES INDEX NUMBERS (ADULT MALES) | |||||||
|---|---|---|---|---|---|---|---|
| Base: Each group separately, 1954 (= 1000) | |||||||
| Industrial Group | 1914 | 1939 | 1954 | 1963 | 1964 | 1965 | 1966* |
*Provisional. | |||||||
| Provision of— | |||||||
| Food, drink, etc. | 196 | 448 | 1,000 | 1,318 | 1,362 | 1445x | 1,482 |
| Clothing, footwear, and textiles | 213 | 443 | 1,000 | 1,286 | 1,334 | 1,422 | 1,450 |
| Building and construction | 241 | 473 | 1,000 | 1,294 | 1,347 | 1431X | 1,468 |
| Power, heat, and light | 221 | 481 | 1,000 | 1,305 | 1,341 | 1428x | 1,462 |
| Transport by water and air | 188 | 418 | 1,000 | 1,309 | 1,346 | 1436x | 1,491 |
| Transport by land | 213 | 443 | 1,000 | 1,331 | 1,377 | 1488x | 1,524 |
| Accommodation, meals, and personal service | 185 | 447 | 1,000 | 1,314 | 1,350 | 1438x | 1,476 |
| Working in or on— | |||||||
| Wood, wicker, seagrass, etc. | 220 | 471 | 1,000 | 1,288 | 1,320 | 1407x | 1,431 |
| Metal | 236 | 475 | 1,000 | 1,290 | 1,337 | 1,416 | 1,471 |
| Stone, clay, glass, chemicals, etc. | 212 | 483 | 1,000 | 1,292 | 1,334 | 1419x | 1,452 |
| Paper, printing, etc. | 261 | 473 | 1,000 | 1,312 | 1,371 | 1,432 | 1,540 |
| Skins, leather, etc. | 218 | 468 | 1,000 | 1,258 | 1,301 | 1411x | 1,450 |
| Mines and quarries | 218 | 415 | 1,000 | 1,278 | 1,305 | 1,365 | 1,375 |
| All groups combined | 217 | 455 | 1,000 | 1,302 | 1,346 | 1432x | 1,473 |
The figures shown in the last two tables are derived from average hourly rates calculated in every case by dividing the corresponding average minimum weekly rate by the standard number of hours worked in the week.
Wage Rates of Adult Female Workers—Index numbers showing movements in wage rates of women workers are compiled, using the award rates of the Court of Arbitration; a much smaller list of occupations is used than is the case in computing index numbers of wage movements for male workers. Although only 21 occupations are taken into consideration in the case of women workers, these occupations normally cover a large proportion of the total number of women in industry—more than sufficient to constitute a representative sample for measuring movements in wages.
The following table shows index numbers of women's wage rates for the principal industries in which women workers are normally engaged. In the compilation of these indices, the value of such perquisites as board and lodging in the case of hotel workers has been added to the money wage rates.
| NOMINAL WEEKLY WAGE-RATES INDEX NUMBERS (ADULT FEMALES) | |||||
|---|---|---|---|---|---|
| Base: All groups combined, 1954 (= 1000) | |||||
| Industrial Group | 1954 | 1963 | 1964 | 1965 | 1966* |
*Provisional. | |||||
| Provision of— | |||||
| Food, drink, etc. | 909 | 1,160 | 1,249 | 1,328 | 1,352 |
| Clothing, footwear, and textiles | 981 | 1,272 | 1,317 | 1,405 | 1,441 |
| Accommodation, meals, and personal service | 1,083 | 1,479 | 1,529 | 1,634 | 1,709 |
| Working in paper, printing, etc. | 919 | 1,247 | 1,338 | 1,402 | 1,477 |
| All groups combined | 1,000 | 1,317 | 1,369 | 1460x | 1,507 |
Movements within the various groups are brought out more clearly in the next table, the base in this case being weighted average weekly rate of each group, 1954 (= 1000). As with the similar table relating to male wage rates horizontal comparisons are valid, but vertical comparisons merely show in which groups the greater or smaller movements have occurred.
| NOMINAL WEEKLY WAGE-RATES INDEX NUMBERS (ADULT FEMALES) | |||||||
|---|---|---|---|---|---|---|---|
| Base: Each group separately, 1954 (= 1000) | |||||||
| Industrial Group | 1914 | 1939 | 1954 | 1963 | 1964 | 1965 | 1966* |
*Provisional. | |||||||
| Provision of— | |||||||
| Food, drink, etc. | 153 | 375 | 1,000 | 1,277 | 1,374 | 1,462 | 1,488 |
| Clothing, footwear, and textiles | 192 | 372 | 1,000 | 1,297 | 1,343 | 1,432 | 1,469 |
| Accommodation, meals and personal service | 275 | 441 | 1,000 | 1,365 | 1,411 | 1,508 | 1,578 |
| Working in paper, printing, etc. | 199 | 376 | 1,000 | 1,356 | 1,455 | 1,526 | 1,607 |
| All groups combined | 213 | 390 | 1,000 | 1,317 | 1,369 | 1460x | 1,507 |
Wage Rates of Juvenile Workers—Index numbers of wage rates of juveniles, male and female, are compiled for each calendar year. Owing to the fact that a number of industries utilise juvenile labour to a limited extent only, or not at all, it has not been possible to cover a very wide field, but 36 occupations representing 12 out of 14 industrial groups are included in the case of juvenile males, and five occupations representing three industrial groups in the case of juvenile females.
Wherever possible the weekly rate adopted in the compilation of the indexes is that provided for a worker having attained the age of 18 years or having completed three years' service, according to the terms of the award.
| NOMINAL WEEKLY WAGE-RATES INDEX NUMBERS (JUVENILE WORKERS) | |||||||
|---|---|---|---|---|---|---|---|
| Base: Each group and each sex separately, 1954 (= 1000) | |||||||
| Industrial Group | 1914 | 1939 | 1954 | 1963 | 1964 | 1965 | 1966† |
*No provision made in awards for juvenile females. †Provisional. | |||||||
| Juvenile Males | |||||||
| Provision of— | |||||||
| Food, drink, etc. | 215 | 407 | 1,000 | 1,427 | 1,499 | 1682x | 1,742 |
| Clothing, footwear, and textiles | 173 | 329 | 1,000 | 1,376 | 1,428 | 1,526 | 1,559 |
| Building and construction | 177 | 321 | 1,000 | 1,351 | 1,382 | 1,484 | 1,614 |
| Transport by land and air | 255 | 485 | 1,000 | 1,425 | 1,488 | 1611x | 1,661 |
| Accommodation, meals, and personal service | 168 | 339 | 1,000 | 1,472 | 1,521 | 1,619 | 1,664 |
| Working in or on— | |||||||
| Wood, wicker, seagrass, etc. | 176 | 361 | 1,000 | 1,599 | 1,621 | 1,749 | 1,945 |
| Metal | 146 | 361 | 1,000 | 1,347 | 1,391 | 1,473 | 1,562 |
| Stone, clay, glass, chemicals, etc. | 192 | 487 | 1,000 | 1,446 | 1,509 | 1,629 | 1,675 |
| Paper, printing, etc. | 184 | 295 | 1,000 | 1,379 | 1,433 | 1,493 | 1,629 |
| Skins, leather, etc. | 266 | 431 | 1,000 | 1,415 | 1,475 | 1568x | 1,623 |
| Mines and quarries | 264 | 468 | 1,000 | 1,352 | 1,375 | 1,431 | 1,433 |
| The land (farming pursuits) | 190 | 340 | 1,000 | 1,135 | 1,139 | 1,146 | 1,148 |
| All industrial groups | 184 | 354 | 1,000 | 1,310 | 1,340 | 1414x | 1,476 |
| Juvenile Females | |||||||
| Provision of— | |||||||
| Food, drink, etc. | 144 | 374 | 1,000 | 1,315 | 1,372 | 1,441 | 1,485 |
| Clothing, footwear, and textiles | 182 | 386 | 1,000 | 1,459 | 1,519 | 1,611 | 1,651 |
| Working in paper, printing, etc. | * | 395 | 1,000 | 1,425 | 1,482 | 1,544 | 1,660 |
| All industrial groups | 180 | 385 | 1,000 | 1,447 | 1,506 | 1,594 | 1,639 |
In the preceding table horizontal comparisons are valid, but vertical comparisons merely show in which groups the greater or smaller movements have occurred.
EFFECTIVE WEEKLY WAGE RATES—The index numbers quoted in the foregoing paragraphs relate to nominal weekly wage rates only—that is, they are based on actual or equivalent money rates without any allowance being made for changes during the period under review in the prices of those goods and services which are purchased out of wages earned. It is obvious that this factor is of considerable importance, for a rise in wage rates may be offset by a fall in the purchasing power of the monetary unit, while, on the other hand, a fall in money wages may be offset by a rise in the purchasing power of money. Index numbers of effective (or "real'') wage rates are arrived at by dividing the index numbers of nominal wage rates by the corresponding all-groups index numbers of consumer prices (both series of index numbers having first been set on a common time base) and multiplying the result by the base value of 1000.
The following table accordingly shows a comparison of nominal and effective weekly wage rates of adult male and female workers. The base of the index numbers is in each case the calendar year 1954 (= 1000).
| Year | Consumer Prices (All Groups) | Nominal Weekly Wage Rates | Effective Weekly Wage Rates | ||
|---|---|---|---|---|---|
| Males | Females | Males | Females | ||
*Provisional. | |||||
| 1954 | 1,000 | 1,000 | 1,000 | 1,000 | 1,000 |
| 1955 | 1,024 | 1,035 | 1,039 | 1,011 | 1,015 |
| 1956 | 1,061 | 1,055 | 1,056 | 994 | 995 |
| 1957 | 1,083 | 1,104 | 1,106 | 1,019 | 1,021 |
| 1958 | 1,132 | 1,116 | 1,128 | 986 | 996 |
| 1959 | 1,175 | 1,136 | 1,146 | 967 | 975 |
| 1960 | 1,183 | 1,193 | 1,210 | 1,008 | 1,023 |
| 1961 | 1,204 | 1,212 | 1,244 | 1,007 | 1,033 |
| 1962 | 1,236 | 1,242 | 1,274 | 1,005 | 1,031 |
| 1963 | 1,261 | 1,276 | 1,317 | 1,012 | 1,044 |
| 1964 | 1,305 | 1,315 | 1,359 | 1,008 | 1,049 |
| 1965 | 1,349 | 1395x | 1460x | 1034x | 1,082 |
| 1966* | 1,387 | 1,430 | 1,507 | 1,031 | 1,087 |
The continuous index of consumer prices required for the foregoing table has been obtained by linking together the successive series of the Consumers' Price Index and converting the whole to the base: calendar year 1954 (= 1000).
In making use of these results it should not be overlooked that the index numbers of nominal rates apply only to full-time employment at award rates of pay. They do not take into account either, on the one hand, above-award rates or overtime earnings, or, on the other, short-time deductions or wages tax imposed (a summary of the rates of wages tax in force during different periods has been set out earlier). Nor do the consumer prices index numbers take cognisance of all classes of household expenditure; income tax, charitable and other gifts, sea and air travel, domestic help, etc., being omitted.
To the extent that female wages are not normally devoted to purchasing the full range of household requirements, the results of employing the all-groups consumer prices index to determine effective wages for females are subject to certain limitations.
AVERAGE RATES OF WAGES—The following table shows the New Zealand minimum weekly rates in various occupations. The figures given are simple averages for the four principal industrial districts as at 31 March in the years indicated. The rates shown throughout this table are money rates, and do not include any allowance for the value of board and lodging, which is a usual perquisite of the employment of some workers, e.g., seamen and hotel employees. Further information on this latter point is available in the note given at the end of the table.
| Occupation | Average Minimum Wage (Four Principal Districts) at 31 March | ||||
|---|---|---|---|---|---|
| 1962 | 1963 | 1964 | 1965 | 1966 | |
*Based on weekly killing of 300 sheep, up to 48 lb in weight. *After three years' service. †18 years of age. NOTE—The following perquisites (as assessed for statistical purposes) as at 31 March 1966 should be added to the listed occupations: dairy-farm workers, $4.25 per week for board and lodging; general farm workers, ploughmen, shepherds, and youths (18 years of age) employed on agricultural and dairy (mixed) farms, $4.25 per week for board and lodging; shearers and wool pressers, $1.00 per day for rations; assistant stewards (first and second grade), chief and second cooks, able seamen and ordinary seamen (first class), $6.43 per week as value of board and lodging; and hotel first cooks and waiters, female cooks, housemaids, and waitresses, $7.50 per week as value of board and lodging. Varying amounts in this connection would also have been added to the occupations affected for earlier years. | |||||
| Adult Males | |||||
| Bakers— | $ | $ | $ | $ | $ |
| Journeymen | 28.00 | 29.25 | 29.25 | 32.00 | 32.00 |
| Labourers | 23.75 | 24.75 | 24.75 | 27.00 | 27.00 |
| Butchers— | |||||
| First shopmen | 30.00 | 30.75 | 31.25 | 34.02 | 34.25 |
| Second shopmen | 27.70 | 28.39 | 28.75 | 30.48 | 30.73 |
| Butter-factory employees—Churning and buttermaking: Others | 26.12 | 27.11 | 28.00 | 29.68 | 30.83 |
| Flourmilling— | |||||
| Kilnmen | 26.42 | 28.08 | 28.08 | 31.33 | 31.33 |
| Assistant smuttermen | 25.00 | 26.67 | 26.67 | 29.67 | 29.67 |
| Rollermen | 29.00 | 30.83 | 30.83 | 34.33 | 34.33 |
| Meat freezing— | |||||
| Slaughtermen, per 100 sheep* | 12.02 | 12.32 | 12.32 | 13.64 | 13.89 |
| Workers not otherwise specified | 28.33 | 30.08 | 30.08 | 32.58 | 33.58 |
| Meat preserving— | |||||
| Boners | 33.75 | 35.67 | 35.67 | 38.50 | 39.50 |
| Others | 29.17 | 30.92 | 30.92 | 33.50 | 34.50 |
| Sausage-casing making: Workers not otherwise specified | 30.25 | 32.08 | 32.08 | 34.75 | 35.75 |
| Aerated water and cordial making— | |||||
| Cordial makers | 25.38 | 26.88 | 26.88 | 28.82 | 29.62 |
| Others | 24.36 | 25.75 | 25.15 | 27.62 | 28.44 |
| Brewing: Others | 26.75 | 28.19 | 28.32 | 31.00 | 31.00 |
| Tailors— | |||||
| Journeymen | 26.50 | 28.33 | 28.33 | 31.09 | 31.09 |
| Stock cutters (factory) | 26.42 | 28.00 | 28.00 | 30.57 | 30.57 |
| Footwear manufacturing— | |||||
| Workers | 27.75 | 28.68 | 29.42 | 31.18 | 32.38 |
| Woollen mills— | |||||
| Spinners | 27.58 | 28.38 | 29.33 | 31.09 | 32.17 |
| General hands | 24.92 | 25.54 | 26.50 | 28.09 | 29.17 |
| Building— | |||||
| Bricklayers | 27.75 | 29.72 | 29.72 | 32.87 | 33.24 |
| Carpenters and joiners | 28.42 | 29.11 | 30.33 | 32.12 | 33.67 |
| Plasterers | 28.53 | 29.85 | 30.11 | 32.97 | 32.98 |
| Plumbers | 29.67 | 30.39 | 30.39 | 33.00 | 33.00 |
| Builders' labourers | 24.80 | 26.18 | 26.44 | 28.80 | 28.80 |
| General labourers | 22.98 | 24.81 | 25.06 | 27.19 | 27.19 |
| Sawmilling— | |||||
| Sawyers | 29.38 | 30.11 | 30.62 | 32.47 | 33.52 |
| Tailers-out | 27.00 | 27.68 | 28.25 | 29.95 | 31.00 |
| Yardmen, head | 28.83 | 29.56 | 30.08 | 31.89 | 32.92 |
| Workers not specified | 26.50 | 27.17 | 27.67 | 29.32 | 30.33 |
| Boatbuilding: Shipwrights | 29.06 | 30.47 | 30.47 | 33.51 | 34.17 |
| Metal workers, etc.— | |||||
| Boilermakers, journeymen | 28.33 | 29.04 | 30.00 | 31.80 | 34.17 |
| Iron and brass moulders | 28.43 | 29.14 | 30.10 | 31.90 | 32.96 |
| Tinsmiths, journeymen | 28.67 | 29.38 | 30.33 | 32.13 | 32.13 |
| Engineering fitters, etc. | 28.00 | 29.63 | 29.63 | 32.39 | 34.83 |
| Electrical wiremen | 29.15 | 29.86 | 30.57 | 32.93 | 34.38 |
| Motor mechanics | 29.25 | 29.96 | 31.00 | 32.80 | 33.83 |
| Printing— | |||||
| Linotype (day) | 30.03 | 30.78 | 31.70 | 33.60 | 37.20 |
| Letterpress machinist (day) | 29.00 | 29.72 | 30.64 | 32.48 | 35.75 |
| Skin and leather workers— | |||||
| Hand fleshers | 26.11 | 26.99 | 27.56 | 29.52 | 30.08 |
| All other workers | 23.39 | 24.19 | 24.75 | 26.55 | 27.11 |
| Mineral and stone workers— | |||||
| Flangers and moulders | 26.48 | 27.23 | 27.98 | 30.58 | 30.58 |
| All other workers | 23.94 | 24.63 | 25.38 | 27.87 | 27.87 |
| Mining (coal)— | |||||
| Surface: tippers | 29.29 | 30.54 | 30.54 | 32.92 | 32.92 |
| Miners (on day wages, per shift) | 5.63 | 5.78 | 5.78 | 6.12 | 6.12 |
| Truckers | 25.54 | 26.17 | 26.17 | 27.75 | 27.75 |
| Quarrying: Quarrymen | 22.93 | 24.98 | 25.22 | 27.36 | 27.36 |
| Agricultural and pastoral workers— | |||||
| General farm workers | 16.82 | 16.82 | 16.82 | 17.42 | 17.42 |
| Agricultural contractors' employees (per hour) | 0.59 | 0.67 | 0.67 | 0.63 | 0.63 |
| Ploughmen | 16.82 | 16.82 | 16.82 | 17.42 | 17.42 |
| Shearers (per 100 sheep shorn) | 7.23 | 7.13 | 7.37 | 8.40 | 8.40 |
| Shepherds | 16.82 | 16.82 | 16.82 | 17.42 | 17.42 |
| Wool pressers | 28.60 | 28.23 | 28.97 | 29.33 | 29.33 |
| Dairy-farm hands | 20.55 | 20.55 | 20.55 | 20.55 | 20.55 |
| Railways— | |||||
| Enginedrivers, average third and sixth years | 34.83 | 36.08 | 37.17 | 38.92 | 42.25 |
| Locomotive assistants, average second and ninth years | 30.75 | 31.75 | 32.71 | 34.33 | 36.88 |
| Guards, average first and third years | 33.42 | 34.62 | 35.71 | 38.29 | 40.21 |
| Bus services— | |||||
| Drivers | 27.00 | 28.83 | 28.83 | 31.67 | 31.67 |
| Bus loaders (after six months) | 26.00 | 27.83 | 27.83 | 30.58 | 30.58 |
| Shipping and cargo working— | |||||
| Assistant stewards, first grade | 26.12 | 26.77 | 27.62 | 29.28 | 31.00 |
| Assistant stewards, second grade | 25.72 | 26.36 | 27.20 | 28.83 | 30.50 |
| Chief cooks | 31.69 | 32.48 | 33.32 | 35.32 | 37.00 |
| Second cooks | 28.72 | 29.45 | 30.28 | 32.10 | 33.75 |
| Able seamen | 27.92 | 28.62 | 29.46 | 31.22 | 33.00 |
| Ordinary seamen, 18 years or over | 21.38 | 21.92 | 22.28 | 23.61 | 28.25 |
| Waterside workers: Ordinary cargo | 28.33 | 29.83 | 29.83 | 33.33 | 33.33 |
| Hotel workers— | |||||
| First cooks | 25.96 | 26.61 | 27.16 | 29.19 | 29.89 |
| Waiters | 19.27 | 19.75 | 20.30 | 21.92 | 22.82 |
| Miscellaneous— | |||||
| Retailing of apparel— | |||||
| Shop assistants | 26.46 | 27.37 | 28.03 | 30.88 | 30.88 |
| Grocers' assistants | 25.61 | 26.99 | 27.37 | 29.75 | 30.12 |
| Warehouse storemen | 25.58 | 26.22 | 27.08 | 29.58 | 29.58 |
| Adult Females | |||||
| Biscuit and confectionery factory workers | 16.50 | 16.92 | 17.50 | 18.55 | 19.25 |
| Tailoresses (factory): Journeywomen | 17.33 | 18.25 | 18.25 | 20.05 | 20.05 |
| Footwear manufacturing workers | 17.50 | 18.49 | 19.02 | 20.17 | 20.75 |
| Woollen-mill workers | 17.83 | 18.28 | 18.83 | 19.97 | 20.75 |
| Hotel workers— | |||||
| Cooks | 19.62 | 20.11 | 21.04 | 22.71 | 23.41 |
| Housemaids | 13.74 | 14.08 | 14.64 | 15.92 | 16.82 |
| Waitresses | 13.74 | 14.08 | 14.64 | 15.92 | 16.82 |
| Restaurant workers— | |||||
| Cooks | 21.24 | 22.39 | 22.39 | 24.83 | 24.83 |
| Waitresses | 15.47 | 16.47 | 16.47 | 18.55 | 18.55 |
| Pantrymaids | 15.47 | 16.47 | 16.47 | 18.55 | 18.55 |
| Printing workers | 17.50 | 17.94 | 18.60 | 19.72 | 21.25 |
| Retailing of apparel: Shop assistants | 17.83 | 18.45 | 18.87 | 20.88 | 20.88 |
| Juvenile Males | |||||
| Bakers' apprentice | 18.76 | 19.60 | 19.60 | 21.44 | 21.44 |
| Butchers' assistant† | 15.20 | 15.58 | 16.19 | 17.16 | 17.37 |
| Butter and cheese factory: Youth† | 17.51 | 18.28 | 18.95 | 20.08 | 21.00 |
| Flour-mill—Youth* | 14.16 | 15.16 | 15.16 | 20.67 | 20.67 |
| Meat freezing and preserving: Youth† | 16.78 | 17.88 | 17.88 | 21.91 | 22.91 |
| Aerated water and cordial manufacture: Youth† | 14.43 | 15.66 | 15.66 | 16.82 | 17.38 |
| Tailoring, etc.: Apprentice* | 16.38 | 17.36 | 17.36 | 18.95 | 18.95 |
| Footwear manufacturing: Apprentice* | 16.89 | 17.78 | 18.23 | 19.33 | 20.08 |
| Woollen mill: Youth† | 17.00 | 17.42 | 18.00 | 19.08 | 20.00 |
| Bricklayers' apprentice* | 17.33 | 18.55 | 18.55 | 20.62 | 20.86 |
| Carpenters' apprentice* | 17.20 | 17.62 | 17.62 | 18.63 | 21.12 |
| Plasterers' apprentice* | 17.88 | 18.70 | 18.87 | 20.97 | 20.97 |
| Plumbers' apprentice* | 19.40 | 19.87 | 19.87 | 21.47 | 21.47 |
| Sawmill: Youth† | 23.00 | 23.58 | 24.12 | 25.58 | 26.62 |
| Engineering: Apprentice* | 17.52 | 18.52 | 18.52 | 20.24 | 21.78 |
| Brick, tile, etc., works: Youth† | 14.92 | 15.45 | 15.96 | 17.86 | 17.86 |
| Tannery: Youth† | 14.42 | 14.93 | 15.54 | 16.68 | 17.19 |
| Coalmining: Trucker† | 23.42 | 24.00 | 24.00 | 25.46 | 25.46 |
| Agriculture and dairying: Youth† | 12.28 | 12.28 | 12.28 | 12.28 | 12.28 |
| Retailing of apparel: Shop assistant* | 16.28 | 16.93 | 18.00 | 19.90 | 19.90 |
| Grocers' assistant* | 17.49 | 18.44 | 18.83 | 22.62 | 23.15 |
| Juvenile Females | |||||
| Biscuit and confectionery factory: Assistant* | 14.13 | 14.48 | 14.95 | 15.85 | 16.45 |
| Footwear manufacturing: Assistant* | 13.50 | 14.35 | 14.85 | 15.74 | 16.00 |
| Woollen mill: Worker* | 17.83 | 18.28 | 18.83 | 19.97 | 20.75 |
| Clothing factory: Improver* | 15.00 | 15.83 | 15.83 | 17.49 | 17.49 |
| Printing trade: Worker* | 15.50 | 15.89 | 16.40 | 17.38 | 17.38 |
EMPLOYMENT SITUATION—in the years since the Second World War the labour situation has been characterised by overfull employment and a high number of vacancies in industry. The employment situation is still buoyant, with the demand for labour matching the supply and with comparatively limited unemployment.
LABOUR FORCE—The size of the labour force as a percentage of population has been affected by various factors, notably by changes in the birthrate causing variations in the percentage of the population in working-age groups, by changes in the school-leaving age, and by the changing proportion of married women seeking work. In the decade prior to the last few years, the age structure of the population, due to the high birthrate after the war, reduced the proportion of those available for work and the increasing percentage receiving secondary education for longer periods has had a similar effect. Thus, in 1936, when fewer young people stayed so long at secondary school or proceeded to a university, 12.1 percent of employed males were in the 16-20 years age group, but from that year the percentage declined until in 1956, when it was 9.9 percent. By 1961 it had risen to 11.1 percent; mainly because the children born immediately after the war were then entering the lower age groups of the working population.
On the other hand, the increasing numbers of married women seeking work has helped to offset labour shortages. Thus, while the percentage of males who were working fell from 57.0 percent in 1956 to 55.3 percent in 1961, there was an increase in females actively engaged from 18.0 percent in 1956 to 18.7 percent in 1961. Married women working rose from 12.9 percent in 1956 to 16.0 percent in 1961. By age group the most marked change occurred in the group 35-54 years, the proportion of females actively engaged in this group rising from approximately 21.0 percent in 1936 to 33.9 percent in 1961. Increasing numbers of married women were entering the labour force after their family responsibilities had lightened.
In recent years, however, there has been an expanded intake as young people born shortly after the war have reached working age and this enabled the labour force to recover to a more normal proportion of the total population.
| GROWTH OF LABOUR FORCE | |||||||
|---|---|---|---|---|---|---|---|
| As at April | Males | Females | Total | Labour Force as a
Percentage of Total Population | |||
| Number | Annual Increase | Number | Annual Increase | Number | Annual Increase | ||
| (000) | Percent | (000) | Percent | (000) | Percent | Percent | |
| 1955 | 609.2 | 1.2 | 191.1 | 3.2 | 800.3 | 1.7 | 37.6 |
| 1956 | 619.5 | 1.7 | 194.4 | 1.7 | 813.9 | 1.7 | 37.4 |
| 1957 | 629.6 | 1.6 | 200.3 | 3.0 | 829.9 | 2.0 | 37.4 |
| 1958 | 641.7 | 1.9 | 206.2 | 2.9 | 847.9 | 2.2 | 37.3 |
| 1959 | 651.3 | 1.5 | 210.5 | 2.1 | 861.8 | 1.6 | 37.0 |
| 1960 | 660.6 | 1.4 | 215.0 | 2.1 | 875.6 | 1.6 | 36.9 |
| 1961 | 670.5 | 1.5 | 224.8 | 4.6 | 895.3 | 2.2 | 37.1 |
| 1962 | 680.4 | 1.5 | 231.0 | 2.8 | 911.4 | 1.8 | 36.9 |
| 1963 | 692.9 | 1.8 | 236.8 | 2.5 | 929.7 | 2.0 | 36.8 |
| 1964 | 708.5 | 2.3 | 248.0 | 4.7 | 956.5 | 2.9 | 37.0 |
| 1965 | 727.2 | 2.6 | 261.5 | 5.4 | 938.7 | 3.4 | 37.6 |
| 1966 | 744.5 | 2.4 | 277.3 | 6.0 | 1,021.8 | 3.4 | 38.2 |
The average annual increase for males was 1.8 percent as compared with 3.4 percent for females and 2.2 percent for the total labour force.
The broad consequence of the distorted age pattern resulting from low birth rates from 1928 to 1935 coupled with a post-war expansion in the economy, is that over a major portion of the post-war period there has not been sufficient young people available to meet the demand for labour force recruits. The "baby boom'' which followed the Second World War has meant, furthermore, a sudden rise in the economically dependent population at the younger ages. As a consequence the relatively depleted labour force has had to provide for the needs of a relatively larger dependent population in building maternity hospitals, schools, dwellings, providing teaching services, etc. The shortage of numbers in the labour force ages has been offset to some extent by large scale immigration, both private and Government assisted. This migration inflow has had a significant partial effect in overcoming the distortion in the working-age groups.
Though year-to-year fluctuatons have been considerable during the past 10 years, the average migration gain to the population has been just under 11,000 a year, representing approximately one-fifth of the annual increase in population as a whole. As immigrants as a body have a higher proportion in the working-age group than the normal cross-section of population, a period of high net immigration adds rapidly to the labour force and is particularly valuable where vacancies requiring particular skills are filled by migrants. The low birthrates in the depression and war years have been partly offset by immigration and a better balance in the age structure of the population has resulted.
EMPLOYMENT STRUCTURE—The growth of population has been accompanied by a changing emphasis in employment. In the nineteenth century the major activities of farming, mining, and lumbering gave rise to manufacturing industries and to commercial and professional occupations. In 1881, 11.2 percent of the total population was engaged in agriculture, 13.1 percent in industries, which included mining, and 6.6 percent in commercial and professional occupations. By 1901 the proportion in tertiary activities and fanning had increased while that in secondary industries had remained constant, and mining had declined relatively in importance. The proportions were then 14.5 percent in farming, 13.1 percent in industry, and 11.0 percent in services.
The more recent rapid development of larger urban centres has been associated with a trend away from primary into secondary industries, a trend which developed noticeably after the depression of the 1930s and which was given marked impetus by the war. The broad change is revealed by a comparison of the 1936 and 1961 census totals.
| Group | 1936 Census | 1961 Census | ||
|---|---|---|---|---|
| Number Employed | Percent | Number Employed | Percent | |
| Primary production | 175,113 | 27.1 | 136,098 | 15.2 |
| Secondary industry | 156,858 | 24.2 | 321,241 | 35.8 |
| Services | 314,912 | 48.7 | 438,024 | 49.0 |
DISTRIBUTION OF LABOUR FORCE—The table which follows shows the estimated distribution of the labour force by broad industrial groups in April of the latest 11 years. The figures include estimates for industries (e.g., farming) and persons (in "one-man'' businesses) not covered by the half-yearly surveys.
| Year | Industry Group | Armed Forces | Unemployed | Totals, Labour Force | ||||||||
|---|---|---|---|---|---|---|---|---|---|---|---|---|
| Primary Industry | Manufacturing Industry | Power, Water, and Sanitary Services | Building and Construction | Transport and Communication | Commerce | Domestic and Personal Services | Administration and Professional | Totals | ||||
| (thousand) | ||||||||||||
| Males | ||||||||||||
| 1956 | 133.5 | 154.1 | 11.1 | 74.4 | 70.9 | 91.3 | 19.1 | 56.1 | 610.5 | 8.9 | 0.1 | 619.5 |
| 1957 | 132.9 | 156.1 | 11.3 | 74.4 | 72.8 | 94.6 | 19.7 | 58.2 | 620.0 | 9.2 | 0.4 | 629.6 |
| 1958 | 132.0 | 160.4 | 11.4 | 76.6 | 74.4 | 96.8 | 20.0 | 60.8 | 632.4 | 8.9 | 0.4 | 641.7 |
| 1959 | 130.7 | 166.4 | 11.7 | 78.3 | 74.5 | 97.1 | 19.8 | 62.9 | 641.4 | 8.8 | 1.1 | 651.3 |
| 1960 | 129.3 | 170.5 | 11.8 | 79.5 | 74.8 | 99.0 | 20.1 | 65.1 | 650.1 | 10.0 | 0.5 | 660.6 |
| 1961 | 127.3 | 176.3 | 11.8 | 80.2 | 75.9 | 102.9 | 20.2 | 66.6 | 661.2 | 9.1 | 0.2 | 670.5 |
| 1962 | 126.0 | 180.9 | 12.3 | 79.2 | 77.8 | 104.5 | 20.5 | 68.3 | 669.5 | 10.2 | 0.7 | 680.4 |
| 1963 | 124.9 | 186.6 | 12.8 | 79.6 | 79.6 | 106.9 | 21.1 | 71.1 | 682.6 | 9.6 | 0.7 | 692.9 |
| 1964 | 123.7 | 194.1 | 12.9 | 83.0 | 79.8 | 109.5 | 21.6 | 73.2 | 697.8 | 10.2 | 0.5 | 708.5 |
| 1965 | 123.5 | 201.7 | 13.2 | 86.1 | 81.3 | 113.1 | 22.3 | 74.8 | 716.0 | 10.7 | 0.5 | 727.2 |
| 1966 | 122.5 | 209.5 | 13.3 | 89.2 | 82.4 | 116.2 | 23.0 | 77.3 | 733.4 | 10.8 | 0.3 | 744.5 |
| Females | ||||||||||||
| 1956 | 10.8 | 46.1 | 0.8 | 1.4 | 9.6 | 46.3 | 24.6 | 54.1 | 193.7 | 0.7 | - | 194.4 |
| 1957 | 10.8 | 46.8 | 0.8 | 1.4 | 10.0 | 48.0 | 24.9 | 56.9 | 199.6 | 0.7 | - | 200.3 |
| 1958 | 10.7 | 49.7 | 0.9 | 1.5 | 10.3 | 49.2 | 24.9 | 58.4 | 205.6 | 0.6 | - | 206.2 |
| 1959 | 10.6 | 51.1 | 0.9 | 1.5 | 10.3 | 49.5 | 24.6 | 61.4 | 209.9 | 0.5 | 0.1 | 210.5 |
| 1960 | 10.5 | 52.3 | 0.9 | 1.5 | 10.3 | 50.4 | 24.9 | 63.5 | 214.3 | 0.6 | 0.1 | 215.0 |
| 1961 | 10.3 | 55.7 | 0.9 | 1.6 | 11.0 | 53.9 | 25.4 | 65.4 | 224.2 | 0.5 | 0.1 | 224.8 |
| 1962 | 10.2 | 56.9 | 0.9 | 1.6 | 11.8 | 55.5 | 25.7 | 67.9 | 230.5 | 0.4 | 0.1 | 231.0 |
| 1963 | 10.1 | 57.3 | 1.0 | 1.7 | 12.1 | 56.7 | 26.1 | 70.9 | 236.1 | 0.5 | 0.2 | 236.8 |
| 1964 | 9.9 | 61.9 | 1.0 | 1.8 | 12.3 | 59.0 | 26.8 | 74.6 | 247.3 | 0.6 | 0.1 | 248.0 |
| 1965 | 9.9 | 64.7 | 1.0 | 2.1 | 13.7 | 62.6 | 28.3 | 78.5 | 260.8 | 0.6 | 0.1 | 261.5 |
| 1966 | 9.9 | 68.2 | 1.1 | 2.3 | 14.6 | 66.0 | 29.6 | 84.9 | 276.6 | 0.6 | 0.1 | 277.3 |
| Totals | ||||||||||||
| 1956 | 144.3 | 200.2 | 11.9 | 75.8 | 80.5 | 137.6 | 43.7 | 110.2 | 804.2 | 9.6 | 0.1 | 813.9 |
| 1957 | 143.7 | 202.9 | 12.1 | 75.8 | 82.8 | 142.6 | 44.6 | 115.1 | 819.6 | 9.9 | 0.4 | 829.9 |
| 1958 | 142.7 | 210.1 | 12.3 | 78.1 | 84.7 | 146.0 | 44.9 | 119.2 | 838.0 | 9.5 | 0.4 | 847.9 |
| 1959 | 141.3 | 217.5 | 12.6 | 79.8 | 84.8 | 146.6 | 44.4 | 124.3 | 851.3 | 9.3 | 1.2 | 861.8 |
| 1960 | 139.8 | 222.8 | 12.7 | 81.0 | 85.1 | 149.4 | 45.0 | 128.6 | 864.4 | 10.6 | 0.6 | 875.6 |
| 1961 | 137.6 | 232.0 | 12.7 | 81.8 | 86.9 | 156.8 | 45.6 | 132.0 | 885.4 | 9.6 | 0.3 | 895.3 |
| 1962 | 136.2 | 237.8 | 13.2 | 80.8 | 89.6 | 160.0 | 46.2 | 136.2 | 900.0 | 10.6 | 0.8 | 911.4 |
| 1963 | 135.0 | 244.1 | 13.8 | 81.3 | 91.7 | 163.6 | 47.2 | 142.0 | 918.7 | 10.1 | 0.9 | 929.7 |
| 1964 | 133.6 | 256.0 | 13.9 | 84.8 | 92.1 | 168.5 | 48.4 | 147.8 | 945.1 | 10.8 | 0.6 | 956.5 |
| 1965 | 133.4 | 266.4 | 14.2 | 88.2 | 95.0 | 175.7 | 50.6 | 153.3 | 976.8 | 11.3 | 0.6 | 988.7 |
| 1966 | 132.4 | 277.7 | 14.4 | 91.5 | 97.0 | 182.2 | 52.6 | 162.2 | 1,010.0 | 11.4 | 0.4 | 1,021.8 |
LABOUR FORCE PROJECTIONS—Revised labour force projections have been made for the period up to 1990.
In the projection in the following table it is assumed that estimated average 1965 specific age-of-mother and marital status birthrates will continue and also the 1961 census specific age and marital status (females only) labour force participation rates.
| As at 31 December | Projected Labour
Force* Estimated Average 1965 Specific Age-of-Mother and Marital Status Birthrates Continue, and Net Immigration of | |||||
|---|---|---|---|---|---|---|
| 10,000 per Year | 15,000 per Year | |||||
| Males | Females | Total | Males | Females | Totals | |
*These projections have as base the estimated total population and labour force at 31 December 1966, and are based on 1961 Census specific age and marital status (females only) labour force participation rates, but adjusted to allow for actual labour force growth up to 31 December 1966. | ||||||
| (000) | ||||||
| 1966 (Base) | 748 | 285 | 1,033 | 748 | 285 | 1,033 |
| 1967 | 764 | 291 | 1,055 | 766 | 291 | 1,057 |
| 1968 | 780 | 296 | 1,076 | 784 | 297 | 1,081 |
| 1969 | 796 | 301 | 1,097 | 802 | 303 | 1,105 |
| 1970 | 813 | 307 | 1,120 | 820 | 309 | 1,129 |
| 1971 | 830 | 312 | 1,142 | 839 | 315 | 1,154 |
| 1972 | 847 | 318 | 1,165 | 859 | 321 | 1,180 |
| 1973 | 865 | 323 | 1,188 | 879 | 327 | 1,206 |
| 1974 | 884 | 329 | 1,213 | 900 | 334 | 1,234 |
| 1975 | 903 | 335 | 1,238 | 921 | 341 | 1,262 |
| 1976 | 922 | 342 | 1,264 | 942 | 348 | 1,290 |
| 1977 | 941 | 349 | 1,290 | 963 | 356 | 1,319 |
| 1978 | 961 | 355 | 1,316 | 985 | 363 | 1,348 |
| 1979 | 981 | 360 | 1,341 | 1,007 | 368 | 1,375 |
| 1980 | 1,000 | 364 | 1,364 | 1,028 | 373 | 1,401 |
| 1981 | 1,019 | 368 | 1,387 | 1,048 | 378 | 1,426 |
| 1982 | 1,037 | 372 | 1,409 | 1,069 | 383 | 1,452 |
| 1983 | 1,056 | 377 | 1,433 | 1,091 | 388 | 1,479 |
| 1984 | 1,076 | 383 | 1,459 | 1,113 | 394 | 1,507 |
| 1985 | 1,097 | 390 | 1,487 | 1,136 | 401 | 1,537 |
| 1986 | 1,119 | 398 | 1,517 | 1,160 | 410 | 1,570 |
| 1987 | 1,141 | 407 | 1,548 | 1,185 | 420 | 1,605 |
| 1988 | 1,165 | 416 | 1,581 | 1,211 | 430 | 1,641 |
| 1989 | 1,190 | 426 | 1,616 | 1,238 | 441 | 1,679 |
| 1990 | 1,215 | 437 | 1,652 | 1,266 | 454 | 1,720 |
| As at 31 December | Projected Labour Force as Percentage of Projected Population, Assuming 1965 Birthrates Continue and Net Immigration of | |||||
|---|---|---|---|---|---|---|
| 10,000 per Year | 15,000 per Year | |||||
| Males | Females | Total | Males | Females | Totals | |
| Percent | ||||||
| 1966 (Base) | 55.0 | 21.1 | 38.1 | 55.0 | 21.1 | 38.1 |
| 1967 | 55.1 | 21.1 | 38.2 | 55.1 | 21.1 | 38.2 |
| 1968 | 55.2 | 21.1 | 38.2 | 55.3 | 21.1 | 38.3 |
| 1969 | 55.2 | 21.1 | 38.2 | 55.3 | 21.1 | 38.3 |
| 1970 | 55.3 | 21.1 | 38.3 | 55.3 | 21.0 | 38.3 |
| 1971 | 55.3 | 21.0 | 38.2 | 55.3 | 21.0 | 38.3 |
| 1972 | 55.3 | 21.0 | 38.2 | 55.5 | 21.0 | 38.3 |
| 1973 | 55.3 | 20.9 | 38.2 | 55.5 | 20.9 | 38.3 |
| 1974 | 55.4 | 20.8 | 38.2 | 55.6 | 20.9 | 38.3 |
| 1975 | 55.4 | 20.8 | 38.2 | 55.6 | 20.8 | 38.3 |
| 1976 | 55.3 | 20.8 | 38.1 | 55.5 | 20.8 | 38.3 |
| 1977 | 55.3 | 20.7 | 38.1 | 55.5 | 20.8 | 38.3 |
| 1978 | 55.3 | 20.7 | 38.1 | 55.5 | 20.7 | 38.2 |
| 1979 | 55.2 | 20.5 | 38.0 | 55.4 | 20.5 | 38.1 |
| 1980 | 55.1 | 20.3 | 37.8 | 55.3 | 20.4 | 38.0 |
| 1981 | 54.9 | 20.1 | 37.6 | 55.1 | 20.2 | 37.8 |
| 1982 | 54.7 | 19.9 | 37.4 | 54.9 | 20.0 | 37.6 |
| 1983 | 54.5 | 19.7 | 37.2 | 54.8 | 19.8 | 37.4 |
| 1984 | 54.4 | 19.6 | 37.1 | 54.7 | 19.7 | 37.3 |
| 1985 | 54.3 | 19.6 | 37.0 | 54.5 | 19.6 | 37.2 |
| 1986 | 54.2 | 19.6 | 37.0 | 54.5 | 19.6 | 37.2 |
| 1987 | 54.1 | 19.6 | 37.0 | 54.5 | 19.6 | 37.2 |
| 1988 | 54.1 | 19.6 | 37.0 | 54.4 | 19.7 | 37.2 |
| 1989 | 54.1 | 19.7 | 37.0 | 54.5 | 19.8 | 37.3 |
| 1990 | 54.2 | 19.8 | 37.1 | 54.5 | 19.9 | 37.4 |
PROMOTION OF EMPLOYMENT: National Employment Service—As from 1 April 1946 a National Employment Service was established under the Employment Act 1945 with the principal function of promoting and maintaining full employment in New Zealand. In fact, provision for Government Employment Bureaux had been made as early as 1891. From 1930 to 1936, the period of the operations of the Unemployment Board, the bureaux functioned rather as unemployment registration offices than as placement services. In 1936 the activities of the Unemployment Board were transferred to the Employment Division of the Department of Labour and the bureaux replaced by a State Placement Service, which operated a widely used system of local labour exchanges. From 1942 to the end of March 1946 this became merged in the Industrial Manpower Division of the National Service Department, and, with an augmented staff, carried out the wider and more complex functions of manpower direction and control. In this work the Industrial Manpower Division placed a much greater emphasis on the collection and use of employment and other economic data, on the research and planning aspects of employment, and on the co-ordination of industrial activities with manpower resources. The National Employment Service was built upon these foundations. After 12 months' activity as a separate department, the National Employment Service was, however, on 1 April 1947, amalgamated with the Department of Labour.
The functions and duties of the Department are set out in the Labour Department Act 1954. On the employment side the duties include: the provision of a complete employment service for the purposes of placing workers in employment, assisting employers to provide employment, helping persons to find better or more suitable employment, and aiding persons who require occupational readjustment or training; the collection and publication of information relating to employment and unemployment; the making of surveys and forecasts of the classes of employment required or available; the promotion of voluntary placing of suitable persons in such employment; and in general the promotion and maintenance of full employment. In particular the Department may operate hostels for workers, provide a home-aid service, and arrange for the selection, transport, and accommodation of immigrants.
Accordingly the Department seeks to maintain a policy of full employment at the highest productive level, operates 23 district employment offices, provides through a home-aid service domestic help for families in urgent circumstances, and administers employment schemes, subsidised where necessary, for those unfit to complete in the ordinary labour market.
The 11 hostels operated by or for the Department at 31 March 1966—comprising industrial workers' hostels, immigration hostels, Public Service hostels, miners' hostels, and Maori youth hostels—provided accommodation for 1,389 workers.
Immigration matters, including the maintenance of immigration hostels, are, as already indicated, handled by the Department. Reference to assisted immigration has been made in Section 3 of this volume. To advise the Minister of Immigration on immigration matters and to aid the Department in the implementing of the immigration policy, an Immigration Advisory Council has functioned since April 1967. Throughout the country there are also immigration welfare committees whose function is to co-ordinate welfare activities in respect of new settlers.
Of recent years, special attention has been directed to the problem of Maori employment. Outstanding features of the Maori population are its rate of growth and the fact that the Maori people are largely resident in localities remote from the main centres of industrial activity. Practical measures for ensuring the continuing, absorption of the Maori race into full employment have included the fostering of Maori apprenticeships and the establishment of Maori youth hostels.
STATISTICS OF EMPLOYMENT: Half-yearly Surveys—Commencing in 1946 the Department of Labour has carried out at half-yearly intervals a general survey of employment in New Zealand. These surveys are conducted by means of inquiries sent out to employers of labour, the results being published in the Labour and Employment Gazette. Returns are required from all establishments in which at least two persons (including working proprietors) are engaged. Government and local authority employment is included. Each return covers six consecutive months, the inital survey (apart from a pilot survey taken for April 1946) relating to the period May to October 1946. Particulars of working proprietors, number of establishments, reported vacancies, and hours of work and earnings are available at half-yearly intervals only. Employers in farming, hunting, trapping, fishing, waterfront work, seagoing work, private domestic service and armed forces are not required to submit half-yearly returns. The following tables, which are based on these surveys, have been extracted from the Labour and Employment Gazette. Separate tables are given for males and females, except for part-time employees where combined figures only are given. Working proprietors are in general distinguished from employees and the numbers of vacancies reported and of establishments covered are appended. All figures are shown by industrial groups.
Since the introduction of half-yearly employment surveys there have been several changes in the industrial classification of units to bring the New Zealand classification into line with the United Nations Standard Industrial Classification. The figures in the following tables are on the latest revised basis.
A summary of employment is given in the following table.
| Date of Survey | Full-time Employees and Working Proprietors | Vacancies | Part-time Workers | Half-yearly Percentage Rate of Labour Turnover* | |||||||
|---|---|---|---|---|---|---|---|---|---|---|---|
| Males | Females | Total | Males | Females | Total | Males | Females | Total | Males | Females | |
*The relationship between the number of terminations over the previous half-year and the average number of employees during the same period. | |||||||||||
| April— | percent | percent | |||||||||
| 1956 | 412,676 | 154,915 | 567,591 | 15,951 | 6,534 | 22,485 | 9,665 | 14,669 | 24,334 | 20 | 32 |
| 1957 | 423,720 | 159,606 | 583,326 | 11,983 | 5,562 | 17,545 | 11,221 | 15,408 | 26,629 | 19 | 31 |
| 1958 | 436,062 | 164,498 | 600,560 | 10,669 | 5,280 | 15,949 | 12,397 | 17,437 | 29,834 | 18 | 32 |
| 1959 | 447,003 | 167,802 | 614,805 | 8,490 | 4,026 | 12,516 | 12,855 | 18,401 | 31,256 | 18 | 32 |
| 1960 | 456,816 | 171,605 | 628,421 | 9,910 | 6,004 | 15,914 | 14,139 | 20,290 | 34,429 | 19 | 32 |
| 1961 | 468,113 | 180,181 | 648,294 | 16,980 | 8,921 | 25,901 | 15,884 | 24,946 | 40,830 | 21 | 34 |
| 1962 | 478,036 | 185,630 | 663,666 | 9,373 | 5,323 | 14,690 | 16,443 | 26,193 | 42,636 | 20 | 34 |
| 1963 | 491,568 | 190,830 | 682,398 | 8,601 | 4,233 | 12,834 | 16,908 | 27,906 | 44,814 | 18 | 32 |
| 1964 | 507,174 | 200,596 | 707,770 | 11,264 | 4,089 | 15,353 | 18,481 | 30,800 | 49,281 | 20 | 32 |
| 1,565 | 526,455 | 211,599 | 738,054 | 14,218 | 4,720 | 18,938 | 20,386 | 34,669 | 55,055 | 21 | 33 |
| 1966 | 542,943 | 223,955 | 766,898 | 16,366 | 6,030 | 22,396 | 23,813 | 39,814 | 63,627 | 23 | 35 |
| October— | |||||||||||
| 1966 | 540,024 | 227,372 | 767,396 | 15,368 | 6,509 | 21,877 | 24,389 | 43,390 | 67,779 | 22 | 32 |
Employment in industry on 15 April of the latest 11 years, and on 15 October 1966, is given in the following table. No industrial dissection of part-time employment is available prior to April 1957.
| Date of Survey | Primary Industry (Other Than Farming, Fishing, and Hunting) | Manufacturing Industry | Power, Water, and Sanitary Services | Building and Construction | Transport and Communication (Other Than Waterfront Work) | Commerce | Domestic and Personal Services | Administration and Professional | Total, All Industries Covered |
|---|---|---|---|---|---|---|---|---|---|
| Male Employees, Full Time | |||||||||
| April— | |||||||||
| 1956 | 10,339 | 137,805 | 11,022 | 49,197 | 51,755 | 67,785 | 11,251 | 43,957 | 383,111 |
| 1957 | 10,705 | 139,011 | 11,303 | 49,331 | 53,746 | 69,749 | 11,496 | 45,887 | 391,228 |
| 1958 | 10,754 | 143,061 | 11,415 | 51,188 | 54,846 | 71,104 | 11,666 | 48,373 | 402,407 |
| 1959 | 10,617 | 148,923 | 11,727 | 52,718 | 54,752 | 71,436 | 11,474 | 50,262 | 411,909 |
| 1960 | 10,637 | 152,939 | 11,784 | 53,743 | 55,188 | 72,543 | 11,726 | 52,216 | 420,776 |
| 1961 | 10,414 | 158,545 | 11,755 | 54,643 | 55,307 | 75,224 | 11,692 | 53,611 | 431,191 |
| 1962 | 10,516 | 163,032 | 12,249 | 54,067 | 56,914 | 76,673 | 12,039 | 55,205 | 440,695 |
| 1963 | 10,458 | 168,873 | 12,764 | 54,466 | 58,356 | 79,130 | 12,369 | 57,724 | 454,140 |
| 1964 | 10,540 | 176,632 | 12,906 | 57,014 | 58,378 | 81,501 | 12,583 | 59,558 | 469,112 |
| 1965 | 10,704 | 183,964 | 13,096 | 60,091 | 59,501 | 84,185 | 12,916 | 61,567 | 486,024 |
| 1966 | 10,834 | 191,464 | 13,183 | 62,679 | 60,163 | 86,483 | 13,233 | 62,863 | 500,902 |
| October— | |||||||||
| 1966 | 11,155 | 187,213 | 13,366 | 62,387 | 60,264 | 86,235 | 13,403 | 63,753 | 497,776 |
| Date of Survey | Primary Industry (Other Than Farming, Fishing, and Hunting) | Manufacturing Industry | Power, Water, and Sanitary Services | Building and Construction | Transport and Communication (Other Than Waterfront Work) | Commerce | Domestic and Personal Services | Administration and Professional | Totals, All Industries Covered |
|---|---|---|---|---|---|---|---|---|---|
*Not included in any other figures in this table. | |||||||||
| Male Working Proprietors | |||||||||
| April— | |||||||||
| 1956 | 351 | 8,821 | 9 | 6,038 | 1,756 | 9,124 | 2,970 | 496 | 29,565 |
| 1957 | 456 | 9,776 | 9 | 6,344 | 1,969 | 10,105 | 3,260 | 573 | 32,492 |
| 1958 | 443 | 10,093 | 8 | 6,482 | 2,084 | 10,634 | 3,420 | 491 | 33,655 |
| 1959 | 483 | 10,263 | 8 | 7,049 | 2,267 | 10,972 | 3,515 | 537 | 35,094 |
| 1960 | 481 | 10,396 | 11 | 7,317 | 2,252 | 11,418 | 3,617 | 548 | 36,040 |
| 1961 | 444 | 10,495 | 6 | 7,294 | 2,314 | 12,043 | 3,704 | 622 | 36,922 |
| 1962 | 450 | 10,427 | 9 | 7,287 | 2,372 | 12,443 | 3,776 | 577 | 37,341 |
| 1963 | 423 | 10,226 | 10 | 7,268 | 2,383 | 12,777 | 3,824 | 517 | 37,428 |
| 1964 | 406 | 10,381 | 17 | 7,326 | 2,365 | 13,009 | 4,054 | 504 | 38,062 |
| 1965 | 488 | 10,646 | 21 | 7,747 | 2,854 | 13,776 | 4,347 | 552 | 40,431 |
| 1966 | 514 | 11,026 | 28 | 8,158 | 2,830 | 14,244 | 4,527 | 714 | 42,041 |
| October— | |||||||||
| 1966 | 489 | 10,972 | 32 | 8,269 | 2,756 | 14,373 | 4,623 | 734 | 42,248 |
| Female Employees, Full Time | |||||||||
| April— | |||||||||
| 1956 | 237 | 42,353 | 809 | 1,203 | 8,575 | 37,887 | 13,966 | 43,571 | 148,601 |
| 1957 | 257 | 42,764 | 792 | 1,194 | 8,985 | 38,747 | 14,159 | 45,673 | 152,571 |
| 1958 | 295 | 45,375 | 819 | 1,257 | 9,233 | 39,390 | 14,258 | 46,599 | 157,226 |
| 1959 | 288 | 46,337 | 834 | 1,310 | 9,279 | 39,182 | 14,020 | 48,709 | 159,959 |
| 1960 | 292 | 47,265 | 839 | 1,283 | 9,332 | 39,850 | 14,296 | 50,195 | 163,352 |
| 1961 | 302 | 50,279 | 842 | 1,356 | 9,874 | 42,571 | 14,735 | 51,448 | 171,407 |
| 1962 | 316 | 51,207 | 863 | 1,414 | 10,623 | 43,670 | 15,072 | 53,361 | 176,526 |
| 1963 | 310 | 51,755 | 877 | 1,444 | 10,860 | 44,640 | 15,499 | 55,913 | 181,298 |
| 1964 | 304 | 55,606 | 884 | 1,536 | 11,025 | 46,377 | 15,911 | 58,680 | 190,323 |
| 1965 | 316 | 58,029 | 930 | 1,773 | 12,030 | 49,029 | 16,852 | 61,455 | 200,414 |
| 1966 | 369 | 61,012 | 991 | 1,936 | 12,852 | 50,964 | 17,474 | 66,339 | 211,937 |
| October— | |||||||||
| 1966 | 365 | 62,168 | 1,010 | 1,993 | 13,400 | 50,873 | 17,291 | 68,197 | 215,297 |
| Female Working Proprietors | |||||||||
| April— | |||||||||
| 1956 | - | 1,210 | - | 1 | 49 | 2,979 | 1,901 | 174 | 6,314 |
| 1957 | 2 | 1,278 | - | - | 70 | 3,426 | 2,070 | 189 | 7,035 |
| 1958 | 2 | 1,290 | - | - | 84 | 3,593 | 2,114 | 189 | 7,272 |
| 1959 | 2 | 1,369 | - | - | 99 | 3,900 | 2,264 | 209 | 7,843 |
| 1960 | 8 | 1,378 | - | - | 107 | 4,205 | 2,345 | 210 | 8,253 |
| 1961 | 12 | 1,437 | - | - | 125 | 4,517 | 2,472 | 211 | 8,774 |
| 1962 | 7 | 1,464 | 1 | - | 147 | 4,787 | 2,478 | 220 | 9,104 |
| 1963 | 4 | 1,494 | 1 | 2 | 150 | 5,065 | 2,602 | 214 | 9,532 |
| 1964 | 3 | 1,533 | 1 | - | 144 | 5,527 | 2,839 | 226 | 10,273 |
| 1965 | 9 | 1,574 | 1 | 1 | 246 | 5,949 | 3,181 | 224 | 11,185 |
| 1966 | 9 | 1,667 | 2 | 1 | 261 | 6,339 | 3,484 | 255 | 12,018 |
| October— | |||||||||
| 1966 | 16 | 1,680 | 3 | 1 | 277 | 6,353 | 3,499 | 246 | 12,075 |
| Part-time Employees—Males and Females Combined* | |||||||||
| April— | |||||||||
| 1959 | 81 | 5,484 | 110 | - | 1,161 | 7,192 | 9,200 | 8,028 | 31,256 |
| 1960 | 87 | 5,999 | 105 | - | 1,245 | 8,086 | 9,784 | 9,123 | 34,429 |
| 1961 | 54 | 8,136 | 131 | - | 1,543 | 10,091 | 10,891 | 9,984 | 40,830 |
| 1962 | 47 | 7,880 | 154 | - | 1,766 | 10,427 | 11,701 | 10,661 | 42,636 |
| 1963 | 67 | 8,026 | 164 | - | 1,788 | 11,240 | 11,865 | 11,664 | 44,814 |
| 1964 | 65 | 9,130 | 188 | - | 1,901 | 12,316 | 12,732 | 12,919 | 49,251 |
| 1965 | 82 | 9,993 | 186 | - | 2,315 | 13,583 | 14,597 | 14,299 | 55,055 |
| 1966 | 90 | 11,422 | 234 | - | 2,800 | 15,554 | 17,538 | 15,990 | 63,628 |
| October— | |||||||||
| 1966 | 96 | 12,650 | 245 | - | 2,965 | 16,796 | 17,850 | 17,177 | 67,779 |
A dissection of the manufacturing industry column shown in the preceding table is now given over the same period.
| Date of Survey | Seasonal Manufacturing | Food, Drink, and Tobacco (Other Than Seasonal) | Textiles, Clothing, Leather | Building Materials and Furnishings | Engineering and Metal Working | Miscellaneous Manufacturing | Total Manufacturing Industry |
|---|---|---|---|---|---|---|---|
*Not included in any other figures in this table. | |||||||
| Male Employees, Full Time | |||||||
| April— | |||||||
| 1956 | 21,548 | 8,897 | 11,866 | 24,993 | 51,347 | 19,154 | 137,805 |
| 1957 | 21,998 | 9,068 | 11,588 | 24,310 | 52,313 | 19,734 | 139,011 |
| 1958 | 23,144 | 9,111 | 12,100 | 24,546 | 53,701 | 20,459 | 143,061 |
| 1959 | 25,433 | 9,210 | 12,659 | 25,792 | 54,442 | 21,387 | 148,923 |
| 1960 | 25,801 | 9,265 | 12,739 | 26,305 | 56,313 | 22,516 | 152,939 |
| 1961 | 26,079 | 9,607 | 13,373 | 27,408 | 58,535 | 23,543 | 158,545 |
| 1962 | 26,392 | 9,906 | 13,848 | 27,362 | 61,395 | 24,129 | 163,032 |
| 1963 | 28,152 | 10,084 | 13,558 | 26,731 | 64,637 | 25,711 | 168,873 |
| 1964 | 28,380 | 9,938 | 14,027 | 28,150 | 69,239 | 26,898 | 176,632 |
| 1965 | 27,781 | 10,137 | 14,340 | 29,666 | 73,403 | 28,637 | 183,964 |
| 1966 | 29,130 | 10,489 | 14,450 | 30,409 | 76,943 | 30,043 | 191,464 |
| October— | |||||||
| 1966 | 21,789 | 10,722 | 14,769 | 30,538 | 78,503 | 30,892 | 187,213 |
| Male Working Proprietors | |||||||
| April— | |||||||
| 1956 | 64 | 1,001 | 1,027 | 1,891 | 3,922 | 916 | 8,821 |
| 1957 | 83 | 1,049 | 1,159 | 2,053 | 4,410 | 1,022 | 9,776 |
| 1958 | 99 | 1,053 | 1,178 | 2,066 | 4,653 | 1,044 | 10,093 |
| 1959 | 95 | 1,051 | 1,200 | 2,028 | 4,863 | 1,026 | 10,263 |
| 1960 | 95 | 1,040 | 1,197 | 2,010 | 4,939 | 1,115 | 10,396 |
| 1961 | 90 | 1,063 | 1,173 | 2,040 | 5,036 | 1,093 | 10,495 |
| 1962 | 94 | 999 | 1,199 | 1,988 | 5,076 | 1,071 | 10,427 |
| 1963 | 102 | 963 | 1,052 | 1,915 | 5,157 | 1,037 | 10,226 |
| 1964 | 113 | 956 | 1,012 | 1,915 | 5,356 | 1,029 | 10,381 |
| 1965 | 116 | 938 | 1,070 | 1,892 | 5,530 | 1,100 | 10,646 |
| 1966 | 116 | 882 | 1,056 | 1,913 | 5,905 | 1,154 | 11,026 |
| October— | |||||||
| 1966 | 119 | 866 | 1,059 | 1,856 | 5,914 | 1,158 | 10,972 |
| Female Employees, Full Time | |||||||
| April— | |||||||
| 1956 | 1,748 | 4,764 | 22,763 | 1,506 | 5,059 | 6,513 | 42,353 |
| 1957 | 1,960 | 4,976 | 22,546 | 1,453 | 5,127 | 6,702 | 42,764 |
| 1958 | 2,179 | 5,064 | 24,079 | 1,531 | 5,420 | 7,102 | 45,375 |
| 1959 | 2,179 | 4,879 | 24,470 | 1,708 | 5,527 | 7,574 | 46,337 |
| 1960 | 2,256 | 5,028 | 24,015 | 1,867 | 5,978 | 8,121 | 47,265 |
| 1961 | 2,231 | 5,229 | 25,547 | 1,927 | 6,821 | 8,524 | 50,279 |
| 1962 | 2,513 | 5,075 | 25,970 | 1,881 | 7,230 | 8,538 | 51,207 |
| 1963 | 2,597 | 5,232 | 25,061 | 1,860 | 7,923 | 9,082 | 51,755 |
| 1964 | 2,802 | 5,251 | 26,772 | 2,012 | 9,162 | 9,607 | 55,606 |
| 1965 | 2,860 | 5,344 | 27,290 | 2,187 | 10,026 | 10,322 | 58,029 |
| 1966 | 3,223 | 5,529 | 28,232 | 2,395 | 10,578 | 11,055 | 61,012 |
| October— | |||||||
| 1966 | 2,823 | 5,849 | 28,550 | 2,343 | 11,025 | 11,578 | 62,168 |
| Female Working Proprietors | |||||||
| April— | |||||||
| 1956 | 7 | 451 | 555 | 27 | 78 | 92 | 1,210 |
| 1957 | 9 | 452 | 552 | 36 | 124 | 105 | 1,278 |
| 1958 | 9 | 451 | 540 | 37 | 144 | 109 | 1,290 |
| 1959 | 5 | 467 | 556 | 57 | 177 | 107 | 1,369 |
| 1960 | 5 | 457 | 531 | 46 | 215 | 124 | 1,378 |
| 1961 | 4 | 471 | 531 | 48 | 252 | 131 | 1,437 |
| 1962 | 8 | 468 | 545 | 49 | 269 | 125 | 1,464 |
| 1963 | 8 | 469 | 509 | 60 | 314 | 134 | 1,494 |
| 1964 | 9 | 485 | 485 | 69 | 338 | 147 | 1,533 |
| 1965 | 9 | 469 | 476 | 80 | 372 | 168 | 1,574 |
| 1966 | 12 | 447 | 466 | 106 | 449 | 187 | 1,667 |
| October— | |||||||
| 1966 | 13 | 435 | 451 | 105 | 475 | 201 | 1,680 |
| Part-time Employees Males and Females Combined* | |||||||
| April— | |||||||
| 1959 | 160 | 952 | 1,447 | 544 | 1,319 | 1,062 | 5,484 |
| 1960 | 152 | 1,026 | 1,555 | 610 | 1,436 | 1,220 | 5,999 |
| 1961 | 203 | 1,602 | 2,205 | 688 | 1,964 | 1,474 | 8,136 |
| 1962 | 246 | 1,346 | 2,255 | 612 | 1,925 | 1,496 | 7,880 |
| 1963 | 165 | 1,476 | 1,955 | 607 | 2,148 | 1,675 | 8,026 |
| 1964 | 213 | 1,616 | 2,355 | 736 | 2,493 | 1,717 | 9,130 |
| 1965 | 276 | 1,823 | 2,316 | 862 | 2,700 | 2,016 | 9,993 |
| 1966 | 296 | 1,991 | 2,521 | 1,023 | 3,434 | 2,157 | 11,422 |
| October— | |||||||
| 1966 | 350 | 2,198 | 2,872 | 1,058 | 3,708 | 2,464 | 12,650 |
The following table shows the number of vacancies reported by employers in the half-yearly surveys.
| Date of Survey | Primary Industry (Other Than Farming, Fishing, and Hunting) | Manufacturing Industry | Power, Water, and Sanitary Services | Building and Construction | Transport and Communication (Other Than Waterfront Work) | Commerce | Domestic and Personal Services | Administration and Professional | Totals, All Industries Covered |
|---|---|---|---|---|---|---|---|---|---|
*Excluding seasonal manufacturing. †A reduction from and including May 1959, an increase from and including June 1961, and a reduction in and from November 1965 in vacancies for Railways Department, resulted from a reassessment of their stalling requirements. | |||||||||
| Males | |||||||||
| April— | |||||||||
| 1956 | 303 | 5,307 | 530 | 2,323 | 3,920 | 1,777 | 259 | 1,532 | 15,951 |
| 1957 | 133 | 4,018 | 316 | 1,528 | 3,204 | 1,399 | 224 | 1,161 | 11,983 |
| 1958 | 109 | 3,755 | 275 | 1,753 | 2,390 | 1,081 | 184 | 1,122 | 10,669 |
| 1959 | 53 | 2,955 | 153 | 957 | 2,221 | 824 | 149 | 1,178 | 8,490 |
| 1960 | 100 | 3,368† | 187 | 1,958 | 1,410 | 1,306 | 197 | 1,384 | 9,910 |
| 1961 | 236 | 6,414 | 371 | 3,222 | 2,249 | 2,140 | 402 | 1,946 | 16,980 |
| 1962 | 123 | 3,310† | 329 | 1,147 | 1,487 | 1,048 | 280 | 1,649 | 9,373 |
| 1963 | 135 | 3,134 | 225 | 1,454 | 1,104 | 1,012 | 191 | 1,346 | 8,601 |
| 1964 | 130 | 3,900 | 290 | 1,894 | 2,159 | 1,220 | 218 | 1,453 | 11,264 |
| 1965 | 209 | 5,281 | 453 | 2,521 | 2,385 | 1,444 | 274 | 1,651 | 14,218 |
| 1966 | 244 | 6,114 | 610 | 2,552 | 2,630 | 1,888 | 312 | 2,016 | 16,366 |
| October— | |||||||||
| 1966 | 281 | 5,623 | 558 | 2,231 | 2,219 | 1,941 | 375 | 2,140 | 15,368 |
| Females | |||||||||
| April— | |||||||||
| 1956 | 7 | 2,680 | 27 | 1 | 228 | 1,170 | 393 | 2,028 | 6,534 |
| 1957 | 12 | 2,204 | 21 | - | 184 | 979 | 417 | 1,745 | 5,562 |
| 1958 | 5 | 2,372 | 10 | - | 181 | 854 | 371 | 1,487 | 5,280 |
| 1959 | 2 | 1,404 | 5 | - | 177 | 695 | 279 | 1,464 | 4,026 |
| 1960 | 5 | 2,332 | 10 | - | 196 | 968 | 414 | 2,079 | 6,004 |
| 1961 | 16 | 3,753 | 17 | - | 344 | 1,696 | 673 | 2,422 | 8,921 |
| 1962 | 10 | 1,684 | 12 | 1 | 245 | 821 | 397 | 2,153 | 5,323 |
| 1963 | 3 | 1,502 | 11 | - | 132 | 711 | 303 | 1,571 | 4,233 |
| 1964 | 6 | 1,634 | 6 | - | 232 | 636 | 348 | 1,227 | 4,089 |
| 1965 | 3 | 1,816 | 15 | 1 | 276 | 809 | 409 | 1,391 | 4,720 |
| 1966 | 12 | 2,458 | 11 | - | 215 | 1,190 | 495 | 1,649 | 6,030 |
| October— | |||||||||
| 1966 | 8 | 2,509 | 10 | 3 | 250 | 1,413 | 631 | 1,685 | 6,509 |
Reported vacancies in manufacturing industry included in the previous table are now shown separately.
| Date of Survey | Food, Drink, and Tobacco (Other Than Seasonal) | Textiles, Clothing, and Leather | Building Materials and Furnishings | Engineering and Metal Working | Miscellaneous Manufacturing | Totals, Manufacturing Industry* |
|---|---|---|---|---|---|---|
*Excluding seasonal manufacturing. †A reduction from and including May 1959, an increase from and including June 1961, and a reduction in and from November 1965 in vacancies for Railways Department, resulted from a reassessment of their staffing requirements. | ||||||
| Males | ||||||
| April— | ||||||
| 1956 | 160 | 392 | 975 | 3,080 | 700 | 5,307 |
| 1957 | 135 | 3,54 | 799 | 2,286 | 444 | 4,018 |
| 1958 | 129 | 330 | 822 | 2,102 | 372 | 3,755 |
| 1959 | 85 | 199 | 450 | 1,925 | 296 | 2,955 |
| 1960 | 107 | 300 | 700 | 1,822† | 439 | 3,368 |
| 1961 | 260 | 634 | 1,264 | 3,503 | 753 | 6,414 |
| 1962 | 102 | 243 | 484 | 2,171† | 310 | 3,310 |
| 1963 | 75 | 195 | 553 | 1,986 | 325 | 3,134 |
| 1964 | 97 | 225 | 785 | 2,362 | 431 | 3,900 |
| 1965 | 185 | 293 | 929 | 3,284 | 590 | 5,281 |
| 1966 | 133 | 370 | 1,050 | 3,791 | 770 | 6,114 |
| October— | ||||||
| 1966 | 185 | 381 | 901 | 3,536 | 620 | 5,623 |
| Females | ||||||
| April— | ||||||
| 1956 | 137 | 2,075 | 33 | 156 | 279 | 2,680 |
| 1957 | 111 | 1,783 | 19 | 106 | 185 | 2,204 |
| 1958 | 116 | 1,881 | 62 | 121 | 192 | 2,372 |
| 1959 | 102 | 1,045 | 20 | 104 | 133 | 1,404 |
| 1960 | 171 | 1,685 | 36 | 213 | 227 | 2,332 |
| 1961 | 382 | 2,586 | 73 | 317 | 395 | 3,753 |
| 1962 | 166 | 1,181 | 32 | 141 | 164 | 1,684 |
| 1963 | 103 | 1,063 | 25 | 144 | 167 | 1,502 |
| 1964 | 95 | 1,139 | 45 | 198 | 157 | 1,634 |
| 1965 | 157 | 1,214 | 49 | 210 | 186 | 1,816 |
| 1966 | 224 | 1,539 | 50 | 342 | 303 | 2,458 |
| October— | ||||||
| 1966 | 277 | 1,637 | 55 | 253 | 287 | 2,509 |
The number of establishments covered by the half-yearly surveys is now shown, the second part of the table giving an analysis of the manufacturing industry column contained in the first part.
| Date of Survey | Primary Industry (Other Than Farming, Fishing, and Hunting) | Manufacturing Industry | Power, Water, and Sanitary Services | Building and Construction | Transport and Communication (Other Than Waterfront Work) | Commerce | Domestic and Personal Services | Administration and Professional | Totals, All Industries Covered |
|---|---|---|---|---|---|---|---|---|---|
| April— | |||||||||
| 1956 | 625 | 12,599 | 247 | 5,675 | 2,513 | 14,720 | 4,445 | 3,724 | 44,548 |
| 1957 | 632 | 12,544 | 242 | 5,899 | 2,543 | 15,143 | 4,501 | 3,739 | 45,243 |
| 1958 | 621 | 12,611 | 251 | 6,057 | 2,605 | 15,604 | 4,626 | 3,822 | 46,197 |
| 1959 | 634 | 12,656 | 257 | 6,609 | 2,688 | 15,950 | 4,736 | 3,884 | 47,414 |
| 1960 | 634 | 12,708 | 267 | 6,507 | 2,684 | 16,384 | 4,841 | 4,008 | 48,033 |
| 1961 | 603 | 12,742 | 266 | 6,621 | 2,709 | 17,141 | 4,994 | 4,032 | 49,108 |
| 1962 | 599 | 12,723 | 269 | 6,653 | 2,718 | 17,557 | 5,132 | 4,025 | 49,676 |
| 1963 | 575 | 12,715 | 269 | 6,610 | 2,738 | 18,004 | 5,259 | 4,108 | 50,278 |
| 1964 | 570 | 12,969 | 281 | 6,649 | 2,741 | 18,657 | 5,493 | 4,223 | 51,583 |
| 1965 | 624 | 13,350 | 282 | 7,027 | 3,112 | 19,493 | 5,962 | 4,394 | 54,244 |
| 1966 | 673 | 13,719 | 296 | 7,422 | 3,162 | 20,286 | 6,292 | 4,611 | 56,461 |
| October— | |||||||||
| 1966 | 661 | 13,785 | 296 | 7,500 | 3,102 | 20,434 | 6,374 | 4,656 | 56,808 |
| Date of Survey | Seasonal Manufacturing | Food, Drink, and Tobacco (Other Than Seasonal) | Textiles, Clothing, and Leather | Building Materials and Furnishings | Engineering and Metal Working | Miscellaneous Manufacturing | Totals, Manufacturing Industry |
|---|---|---|---|---|---|---|---|
| April— | |||||||
| 1956 | 527 | 1,315 | 1,975 | 2,661 | 4,735 | 1,386 | 12,599 |
| 1957 | 529 | 1,285 | 1,875 | 2,599 | 4,866 | 1,390 | 12,544 |
| 1958 | 518 | 1,254 | 1,861 | 2,588 | 4,973 | 1,417 | 12,611 |
| 1959 | 504 | 1,249 | 1,850 | 2,555 | 5,098 | 1,400 | 12,656 |
| 1960 | 495 | 1,222 | 1,832 | 2,528 | 5,176 | 1,455 | 12,708 |
| 1961 | 479 | 1,228 | 1,810 | 2,530 | 5,263 | 1,432 | 12,742 |
| 1962 | 483 | 1,187 | 1,802 | 2,481 | 5,358 | 1,412 | 12,723 |
| 1963 | 481 | 1,169 | 1,674 | 2,436 | 5,518 | 1,437 | 12,715 |
| 1964 | 471 | 1,152 | 1,644 | 2,468 | 5,754 | 1,480 | 12,969 |
| 1965 | 460 | 1,134 | 1,652 | 2,475 | 6,017 | 1,558 | 13,296 |
| 1966 | 450 | 1,095 | 1,667 | 2,506 | 6,385 | 1,616 | 13,719 |
| October— | |||||||
| 1966 | 443 | 1,074 | 1,643 | 2,505 | 6,472 | 1,648 | 13,785 |
The table now following shows the half-yearly survey totals of full-time employment in industry, under a more detailed industrial classification, as at 15 April 1965 and 1966; employment by the Central Government, by local authorities, and by private employers being distinguished at the same time in the 1966 figures.
| Industry | Number of Persons* in Industry at 15 April 1965 | Number of Persons* in Industry at 15 April 1966 | ||||||
|---|---|---|---|---|---|---|---|---|
| Males | Females | |||||||
| Males | Females | Government | Local Authorities | Private* | Government | Local Authorities | Private* | |
*These figures are inclusive of working proprietors. | ||||||||
| Primary industry (other than farming, fishing, and hunting)— | ||||||||
| Forestry | 3,373 | 200 | 3,072 | 8 | 330 | 225 | - | 14 |
| Logging | 2,642 | 48 | 144 | - | 2,554 | - | - | 53 |
| Coal mining | 3,391 | 41 | 2,594 | - | 799 | 43 | - | 8 |
| Other mining | 240 | 15 | - | - | 197 | - | - | 13 |
| Quarrying (n.e.i.) | 1,546 | 21 | - | 84 | 1,566 | - | 2 | 20 |
| Seasonal manufacturing— | ||||||||
| Meat processing, etc. | 22,192 | 1,197 | - | 263 | 23,179 | - | 1 | 1,370 |
| Fruit and vegetable preserving | 1,272 | 1,156 | - | - | 1,325 | - | - | 1,361 |
| Dairy factories | 4,433 | 516 | - | - | 4,479 | - | - | 503 |
| Food, drink, and tobacco (other than seasonal)— | ||||||||
| Grain milling | 806 | 93 | - | - | 798 | - | - | 90 |
| Bread bakeries | 2,027 | 464 | - | - | 2,031 | - | - | 416 |
| Biscuit making | 750 | 523 | - | - | 767 | - | - | 629 |
| Cake and pastry making | 1,402 | 1,511 | - | - | 1,439 | - | - | 1,525 |
| Sugar and confectionery | 1,297 | 1,145 | - | - | 1,316 | - | - | 1,154 |
| Other food | 1,670 | 997 | - | - | 1,719 | - | - | 1,041 |
| Beverages | 2,636 | 418 | 15 | - | 2,807 | 3 | - | 508 |
| Tobacco manufacture | 487 | 662 | - | - | 479 | - | - | 610 |
| Textiles, clothing, and leather— | ||||||||
| Tanneries | 1,305 | 154 | - | - | 1,282 | - | - | 173 |
| Fur dressing and manufacture | 78 | 90 | - | - | 78 | - | - | 87 |
| Leather goods | 470 | 544 | - | - | 489 | - | - | 604 |
| Knitted wear and hosiery | 2,016 | 3,821 | - | - | 2,099 | - | - | 3,926 |
| Flax, rope, and twine | 402 | 80 | - | - | 406 | - | - | 77 |
| Woollen mills | 2,162 | 1,821 | - | - | 2,166 | - | - | 1,945 |
| Other textile production | 2,251 | 935 | - | - | 2,341 | - | - | 1,040 |
| Clothing manufacture | 3,160 | 16,558 | - | - | 3,169 | - | - | 16,892 |
| Footwear manufacture | 2,513 | 2,704 | - | - | 2,462 | - | - | 2,805 |
| Footwear repair | 248 | 37 | - | - | 237 | - | - | 39 |
| Other textile articles | 805 | 1,022 | - | - | 777 | - | - | 1,110 |
| Building materials and furnishings— | ||||||||
| Sawmilling, plywoods, etc. | 10,972 | 504 | 642 | - | 10,557 | 22 | - | 517 |
| Builders' woodwork | 4,884 | 158 | - | 26 | 5,055 | - | - | 182 |
| Furniture and cabinets | 4,722 | 538 | - | - | 4,618 | - | - | 572 |
| Other wood manufacture | 995 | 232 | - | - | 1,010 | - | - | 272 |
| Structural clay products | 1,130 | 40 | - | - | 1,166 | - | - | 38 |
| Pottery and glass | 2,176 | 555 | - | - | 2,324 | - | - | 611 |
| Lime, cement, etc. | 6,679 | 240 | - | 30 | 6,894 | - | - | 287 |
| Engineering and metal working— | ||||||||
| Engineering and machinery | 31,342 | 3,827 | - | 1 | 33,656 | - | - | 4,285 |
| Electrical manufacture | 6,827 | 3,048 | - | - | 6,773 | - | - | 2,813 |
| Ships, locomotives, etc. | 7,097 | 71 | 5,616 | - | 1,381 | 53 | - | 32 |
| Vehicle and cycle manufacture | 5,752 | 671 | - | - | 6,077 | - | - | 758 |
| Vehicle repair and aircraft | 27,915 | 2,771 | 24 | 968 | 28,352 | - | 23 | 3,063 |
| Miscellaneous manufacturing— | ||||||||
| Chemicals and by-products | 5,783 | 2,084 | - | 19 | 6,166 | - | - | 2,399 |
| Rubber manufacture | 3,384 | 800 | - | - | 3,417 | - | - | 794 |
| Paper and paper products | 5,284 | 1,543 | - | - | 5,616 | - | - | 1,596 |
| Printing, publishing, and allied | 10,741 | 3,523 | 684 | - | 10,504 | 289 | - | 3,488 |
| Instruments, clocks, jewellery | 1,204 | 509 | - | - | 1,183 | - | - | 576 |
| Other manufacturing (n.e.i.) | 3,341 | 2,031 | - | - | 3,608 | - | - | 2,100 |
| Power, water, and sanitary services | 13,117 | 931 | 3,596 | 8,693 | 922 | 177 | 715 | 101 |
| Building and construction | 67,838 | 1,774 | 12,758 | 2,929 | 55,150 | 596 | 102 | 1,239 |
| Transport and communication— | ||||||||
| Rail transport | 16,425 | 1,182 | 16,011 | 12 | - | 1,178 | 2 | - |
| Road transport | 20,258 | 1,369 | 1,451 | 1,847 | 17,812 | 62 | 71 | 1,324 |
| Water transport (not waterfront) | 5,080 | 575 | 169 | 3,275 | 1,655 | 5 | 109 | 469 |
| Air transport | 2,803 | 735 | 952 | 65 | 2,222 | 116 | 6 | 729 |
| Post Office | 17,789 | 8,415 | 17,522 | - | - | 9,042 | - | - |
| Commerce— | ||||||||
| Wholesale and retail trade | 80,786 | 45,171 | 33 | 188 | 82,248 | 19 | 11 | 46,795 |
| Storage | 226 | 13 | - | - | 221 | - | - | 4 |
| Finance | 8,687 | 6,065 | 1,242 | - | 7,976 | 830 | - | 5,600 |
| Insurance | 4,743 | 3,300 | 746 | - | 4,154 | 554 | - | 2,957 |
| Real estate | 1,089 | 393 | - | - | 1,307 | - | - | 452 |
| Wool and grain stores (seasonal) | 2,430 | 36 | - | - | 2,612 | - | - | 81 |
| Domestic and personal services— | ||||||||
| Provision of lodging, food, etc. | 8,492 | 11,455 | 57 | 1 | 8,684 | 103 | 16 | 11,858 |
| Portrait and photo studios | 622 | 707 | - | - | 620 | - | - | 700 |
| Laundries, cleaning, etc. | 2,261 | 3,145 | - | - | 2,307 | - | - | 3,265 |
| Barbers, beauty shops, etc. | 964 | 3,098 | - | - | 957 | - | - | 3,309 |
| Recreation, sport, etc. | 4,623 | 1,588 | 88 | 1,043 | 3,691 | 25 | 47 | 1,593 |
| Undertaking | 301 | 40 | - | 86 | 226 | - | - | 42 |
| Administration and professional— | ||||||||
| Hospitals | 7,964 | 23,066 | 2,081 | 5,793 | 152 | 2,162 | 20,119 | 2,331 |
| Medical and allied services | 456 | 2,541 | 59 | - | 413 | 1,649 | - | 1,039 |
| Education and instruction | 19,295 | 19,163 | 2,290 | 15,913 | 1,390 | 1,675 | 17,724 | 2,132 |
| Arts, sciences, and religion | 2,511 | 1,132 | 826 | - | 1,909 | 246 | - | 930 |
| Government (n.e.i.) | 16,185 | 6,298 | 16,328 | - | - | 6,545 | - | - |
| Local authorities (n.e.i.) | 9,971 | 1,406 | - | 10,256 | - | - | 1,487 | - |
| Miscellaneous services and agencies | 5,737 | 8,073 | 286 | - | 5,994 | 170 | - | 8,385 |
| Totals | 526,455 | 211,599 | 89,286 | 51,500 | 402,270 | 25,789 | 40,435 | 157,731 |
| 543,056 | 223,955 | |||||||
NOTE—The preceding table does not include armed forces personnel, numbering 11,300 in April 1965 and 11,400 in April 1966, or persons engaged in farming, fishing, hunting, waterfront work, seagoing work, domestic service in private households, and one-man business units, etc., estimated to total 238,700 in April 1965 and 243,100 in April 1966.
An effective correlation of the figures shown in the preceding tables with those of employment in factories found in Section 18 of this volume is precluded by the differing definitions of "manufacturing industry''; furthermore, the tabulations of half-yearly surveys differ from factory-production statistics in including managers and foremen, clerical workers, and distributing staff attached to manufacturing establishments in one figure with factory operatives.
VACANCIES, PLACEMENTS, AND DISENGAGED PERSONS—In addition to the half-yearly surveys of the employment position as a whole, the Department of Labour maintains a month-to-month record of vacancies, placements, and disengaged persons seeking work. The following tables are derived from this record and hence relate only to the Department's operations as a labour exchange.
Notified Vacancies—Particulars of notified vacancies at the end of each month from December 1965 to December 1966 (together with monthly averages for calendar years) are shown by district groupings in the following table. This table does not necessarily cover the same establishments as the preceding tables derived from half-yearly surveys; on the one hand it does not exclude vacancies on farms, in seasonal manufacturing industry, and in domestic service; but on the other hand it includes only those vacancies which have been notified to a district office of the Department of Labour in its capacity as a placement service.
| Period | Auckland | Wellington and Lower Hutt | Other North Island | Christchurch | Dunedin | Other South Island | Total |
|---|---|---|---|---|---|---|---|
*A reduction from and including May 1959, an increase from and including June 1961, and a reduction from and including November 1965 in vacancies notified by Railways Department, resulted from a reassessment of their staffing requirements. | |||||||
| Monthly Average for Calendar Years | |||||||
| 1956 | 1,727 | 5,261 | 2,397 | 1,352 | 914 | 1,335 | 12,986 |
| 1957 | 1,472 | 3,276 | 1,757 | 734 | 652 | 1,035 | 8,926 |
| 1958 | 1,372 | 2,459 | 1,331 | 551 | 604 | 818 | 7,135 |
| 1959* | 992 | 2,068 | 834 | 540 | 348 | 518 | 5,300 |
| 1960 | 1,229 | 2,460 | 1,045 | 965 | 362 | 703 | 6,764 |
| 1961* | 1,592 | 3,997 | 1,214 | 1,067 | 436 | 890 | 9,196 |
| 1962 | 1,016 | 3,415 | 820 | 626 | 334 | 632 | 6,843 |
| 1963 | 950 | 2,783 | 756 | 443 | 254 | 545 | 5,731 |
| 1964 | 1,225 | 2,858 | 1,010 | 625 | 275 | 620 | 6,613 |
| 1965 | 1,596 | 3,237 | 1,249 | 754 | 352 | 748 | 7,936 |
| 1966 | 1,722 | 3,381 | 1,194 | 460 | 312 | 684 | 7,753 |
| 1965— | |||||||
| Monthly Totals | |||||||
| December | 2,427 | 3,377 | 1,322 | 578 | 359 | 921 | 8,984 |
| 1966— | |||||||
| January | 2,221 | 3,454 | 1,320 | 566 | 366 | 960 | 8,887 |
| February | 1,640 | 3,456 | 1,397 | 483 | 364 | 888 | 8,228 |
| March | 1,721 | 3,589 | 1,391 | 469 | 345 | 775 | 8,290 |
| April | 1,573 | 3,549 | 1,338 | 432 | 302 | 744 | 7,938 |
| May | 1,519 | 3,612 | 1,134 | 361 | 318 | 671 | 7,615 |
| June | 1,459 | 3,443 | 1,134 | 348 | 279 | 606 | 7,269 |
| July | 1,435 | 3,231 | 1,107 | 341 | 271 | 632 | 7,017 |
| August | 1,435 | 3,182 | 1,142 | 401 | 275 | 601 | 7,036 |
| September | 1,453 | 3,193 | 1,102 | 445 | 319 | 593 | 7,105 |
| October | 1,422 | 3,349 | 1,160 | 489 | 310 | 608 | 7,338 |
| November | 2,441 | 3,237 | 1,119 | 568 | 321 | 567 | 8,253 |
| December | 2,339 | 3,276 | 989 | 614 | 273 | 564 | 8,055 |
Placements—An industrial analysis of placements by the Department of Labour during the latest five years follows; not all these placements were, however, of disengaged persons.
| Year | Primary Industry | Manufacturing Industry | Building Construction | Power, Water, and Sanitary Services | Transport and Communication | Commerce | Domestic and Personal Services | Administration and Professional | Total |
|---|---|---|---|---|---|---|---|---|---|
| Annual Totals | |||||||||
| 1962 | 4,238 | 3,247 | 2,152 | 175 | 768 | 1,611 | 999 | 1,274 | 14,464 |
| 1963 | 4,799 | 3,098 | 1,995 | 116 | 539 | 1,566 | 921 | 1,037 | 14,071 |
| 1964 | 4,134 | 3,536 | 1,963 | 134 | 590 | 1,623 | 1,031 | 1,144 | 14,155 |
| 1965 | 3,815 | 3,512 | 1,524 | 106 | 499 | 1,607 | 997 | 1,146 | 13,206 |
| 1966 | 3,816 | 3,328 | 1,306 | 128 | 440 | 1,400 | 818 | 900 | 12,136 |
A classification of these placements by district grouping is contained in the next table.
| Year | Auckland | Wellington and Lower Hutt | Other North Island | Christchurch | Dunedin | Other South Island | Total |
|---|---|---|---|---|---|---|---|
| Annual Totals | |||||||
| 1962 | 1,817 | 2,453 | 3,156 | 2,279 | 1,080 | 3,679 | 14,464 |
| 1963 | 1,556 | 1,851 | 3,454 | 2,246 | 959 | 4,005 | 14,071 |
| 1964 | 1,861 | 2,356 | 3,359 | 1,567 | 1,382 | 3,630 | 14,155 |
| 1965 | 1,885 | 1,859 | 2,788 | 1,614 | 1,543 | 3,517 | 13,206 |
| 1966 | 1,691 | 1,443 | 2,986 | 1,330 | 1,151 | 3,535 | 12,136 |
Summary—The following table contains a summary of the numbers of notified vacancies, placements, and disengaged persons as recorded by the Department of Labour for each month from December 1965 to December 1966, together with monthly averages for the calendar years 1956-66 inclusive.
| Date | Vacancies at End of Month | Placements During Month | Disengaged Persons at End of Month | ||||||
|---|---|---|---|---|---|---|---|---|---|
| Males | Females | Total | Males | Females | Total | Males | Females | Total | |
*A reduction from and including May 1959, an increase from and including June 1961, and a reduction from and including November 1965 in vacancies notified by Railways Department, resulted from a reassessment of their staffing requirements. | |||||||||
| Monthly Average For Calendar Years | |||||||||
| 1956 | 8,958 | 4,028 | 12,986 | 866 | 397 | 1,263 | 240 | 19 | 259 |
| 1957 | 5,864 | 3,062 | 8,926 | 941 | 428 | 1,369 | 368 | 26 | 394 |
| 1958 | 4,407 | 2,728 | 7,135 | 890 | 406 | 1,296 | 734 | 52 | 786 |
| 1959 | 3,046* | 2,254 | 5,300 | 1,025 | 389 | 1,414 | 1,096 | 92 | 1,188 |
| 1960 | 4,076 | 2,688 | 6,764 | 793 | 329 | 1,122 | 569 | 64 | 633 |
| 1961 | 5,802* | 3,394 | 9,196 | 634 | 297 | 931 | 335 | 41 | 376 |
| 1962 | 4,285 | 2,558 | 6,843 | 860 | 345 | 1,205 | 934 | 106 | 1,040 |
| 1963 | 3,746 | 1,985 | 5,731 | 803 | 370 | 1,173 | 726 | 123 | 849 |
| 1964 | 4,847 | 1,766 | 6,613 | 788 | 392 | 1,180 | 511 | 139 | 650 |
| 1965 | 6,000 | 1,936 | 7,936 | 722 | 379 | 1,101 | 385 | 128 | 513 |
| 1966 | 5,550 | 2,203 | 7,753 | 674 | 337 | 1,011 | 332 | 131 | 463 |
| 1965— | |||||||||
| Monthly Totals | |||||||||
| December | 6,839 | 2,145 | 8,984 | 395 | 189 | 584 | 240 | 96 | 336 |
| 1966— | |||||||||
| January | 6,734 | 2,153 | 8,887 | 703 | 739 | 1,442 | 270 | 119 | 389 |
| February | 6,129 | 2,099 | 8,228 | 1,098 | 968 | 2,066 | 223 | 140 | 363 |
| March | 6,101 | 2,189 | 8,290 | 729 | 464 | 1,193 | 255 | 140 | 395 |
| April | 5,886 | 2,052 | 7,938 | 534 | 248 | 782 | 256 | 133 | 389 |
| May | 5,540 | 2,075 | 7,615 | 698 | 297 | 995 | 337 | 132 | 469 |
| June | 5,342 | 1,927 | 7,269 | 677 | 179 | 856 | 401 | 127 | 528 |
| July | 5,045 | 1,972 | 7,017 | 659 | 157 | 816 | 461 | 109 | 570 |
| August | 4,953 | 2,083 | 7,036 | 921 | 181 | 1,102 | 409 | 135 | 544 |
| September | 4,935 | 2,170 | 7,105 | 694 | 195 | 889 | 389 | 117 | 506 |
| October | 5,063 | 2,275 | 7,338 | 491 | 193 | 684 | 297 | 116 | 413 |
| November | 5,492 | 2,761 | 8,253 | 570 | 290 | 860 | 306 | 154 | 460 |
| December | 5,380 | 2,675 | 8,055 | 317 | 134 | 451 | 380 | 146 | 526 |
Vocational Guidance—Since 1938 vocational guidance of pupils at secondary schools has been undertaken by the Department of Education which has Vocational Guidance Centres in Auckland, Hamilton, Lower Hutt, Wellington, Christchurch, and Dunedin.
Apprenticeships—Under the Apprentices Act 1948 orders governing apprenticeships are made by the Court of Arbitration, which consists of a Judge, a workers' member, and an employers' member. Orders are made on the recommendations of New Zealand Apprenticeship Committees, which consist of four representatives of employers, four representatives of workers, a person conversant with technical education, and the Commissioner of Apprenticeship, who is ex officio chairman of each committee. The New Zealand committees are in effect policy making committees. There are 32 committees, which normally meet once or twice a year.
Day-to-day administration of the Apprentices Act and the apprenticeship orders is carried on by local apprenticeship committees, of which there are 225. They consist of three representatives of employers, three representatives of workers, a person conversant with technical education, and the District Commissioner of Apprenticeship, who is ex officio chairman of all committees for the district for which he is appointed. District Commissioners delegate chairmanship to other officers of the Department of Labour when necessary.
The apprentice learns by doing tasks under supervision. Provision is made in a number of apprenticeship orders for a specific list of operations and skills to be taught apprentices by their employers. Both employers and apprentices are thus helped to define the scope of training, and apprenticeship committees, when called on to do so, are enabled to judge whether or not training is adequate.
As no employer may engage an apprentice without the prior consent of the appropriate local committee, the facilities for training are known to the committee in each case. When an employer who has not previously had an apprentice applies for permission to engage one, arrangements may be made for an inspection of his workshop by two members of the local committee. On their report the full committee makes the appropriate decision, livery apprentice has a contract of apprenticeship, which is registered by the District Commissioner.
Local committees deal with complaints from apprentices and employers, with applications to transfer apprentices to other employers, and applications to discharge apprentices for misconduct. Their decisions, which are of a semi-judicial nature, are subject to review by way of appeal to the Court of Arbitration.
In the majority of industries there are provisions in apprenticeship orders for the attendance of apprentices at technical classes, both during working hours and in the evening. In the 40-hour week four hours are spent at day classes, with usually an equivalent amount of time at evening classes. In some industries technical training is concentrated into an annual course of three or four weeks' duration. The classes are operated by technical and other secondary schools.
Although technical schools are semi-autonomous bodies, the general policy regarding apprentice education is determined by the Department of Education in co-operation with New Zealand Apprenticeship Committees. That Department itself operates a Technical Correspondence Institute, which provides courses of instruction for those apprentices who live too far from any school to allow them to attend evening classes.
A statutory body, the New Zealand Trades Classification Board, conducts examinations for apprentices (see Section 7 - Education). The examinations are voluntary and, except in the electrical trade and in plumbing, no examination test is required for the practice of a trade. There is very close liaison between New Zealand Apprenticeship Committees and the Board, the Commissioner of Apprenticeship being ex officio a member of the Board. The Commissioner is also ex officio a member of the New Zealand Council for Technical Education (see Section 7).
The numbers of apprenticeship contracts registered during the year, completed during the year, and in force at the end of the year are indicated in the following table.
| Trade | Apprenticeship Contracts | |||||
|---|---|---|---|---|---|---|
| Registered During Year Ended 31 March | Completed During Year Ended 31 March | In Force at 31 March | ||||
| 1965 | 1966 | 1965 | 1966 | 1965 | 1966 | |
| Aircraft | 64 | 86 | 29 | 37 | 252 | 293 |
| Baking | 71 | 64 | 20 | 37 | 188 | 186 |
| Boilermaking | 53 | 61 | 36 | 35 | 195 | 188 |
| Bricklaying | 77 | 81 | 38 | 39 | 233 | 250 |
| Carpentry | 1,630 | 1,571 | 1,076 | 1,216 | 5,719 | 5,755 |
| Clothing | 86 | 73 | 36 | 34 | 242 | 246 |
| Coachbuilding | 434 | 466 | 168 | 188 | 1,553 | 1,706 |
| Dentistry | 7 | 9 | 2 | 3 | 31 | 36 |
| Electrical | 493 | 534 | 244 | 312 | 1,815 | 1,927 |
| Engineering | 622 | 590 | 350 | 355 | 2,041 | 2,151 |
| Footwear repairing and making | 13 | 11 | 10 | 7 | 45 | 40 |
| Footwear manufacturing | 68 | 63 | 44 | 41 | 196 | 184 |
| Furniture | 228 | 205 | 160 | 136 | 840 | 856 |
| Hairdressing | 40 | 50 | 21 | 28 | 171 | 175 |
| Heating and ventilation | - | 29 | - | 7 | - | 54 |
| Horticulture | 41 | 44 | 20 | 11 | 121 | 140 |
| Jewellery | 45 | 44 | 24 | 29 | 162 | 161 |
| Lead burning | - | 1 | 1 | - | 1 | 1 |
| Masonry | 3 | 1 | 2 | - | 8 | 8 |
| Motor trades | 1,265 | 1,395 | 689 | 814 | 4,812 | 5,086 |
| Moulding | 17 | 15 | 10 | 7 | 46 | 50 |
| Painting | 254 | 313 | 119 | 181 | 815 | 843 |
| Photo-engraving | 47 | 47 | 23 | 28 | 147 | 160 |
| Piano repairing and tuning | 5 | 3 | 2 | 1 | 14 | 11 |
| Plastering | 63 | 91 | 55 | 52 | 266 | 276 |
| Plumbing | 281 | 265 | 189 | 152 | 1,163 | 1,192 |
| Printing | 286 | 321 | 196 | 181 | 1,079 | 1,136 |
| Radio | 145 | 103 | 59 | 66 | 429 | 444 |
| Refrigeration engineering | 32 | 31 | 23 | 31 | 135 | 129 |
| Retail meat industry | - | 377 | - | 46 | - | 574 |
| Saddlery, leather, and canvas goods | 17 | 18 | 9 | 5 | 57 | 59 |
| Sheet-metal working | 63 | 69 | 36 | 38 | 234 | 240 |
| Shipbuilding | 43 | 39 | 18 | 20 | 147 | 156 |
| Timber industry | 26 | 26 | 13 | 21 | 62 | 63 |
| Others | 351 | 43 | 40 | 12 | 465 | 158 |
| Totals | 6,870 | 7,139 | 3,762 | 4,170 | 23,684 | 24,934 |
TRADE TRAINING FOR MAORI YOUTHS—Trade training is one approach that is being adopted to broaden employment opportunities for Maori youths. Although Maoris constitute close to 7 1/2 percent of the total population of New Zealand, Maori representation in the skilled trades is well below this figure. In industry, less than 4 percent of the present apprentices are Maoris. In relation to the number of Maoris in the 15-19 years, age group, which is nearly equivalent to the apprenticeship age group, it should be over 8 percent.
Historically, there are many reasons which help to explain the present lack of skilled Maori tradesmen. Until comparatively recently, the Maori was almost entirely a rural dweller, handy neither to industry nor to trade-training establishments, and understandably not fully appreciative of the long-term benefits to be derived from trade training. Again, the somewhat lower standard of Maori education tended to prejudice the chances of Maori youths obtaining apprenticeships in any numbers, while lower incomes restricted the financial assistance which a rural Maori family could give to one of its members who wished to leave home to study a trade.
In 1959 it was clear that special training facilities would be needed if the numbers of skilled Maori workers were to be increased, and after consultation with the appropriate educational and technical authorities, the Government introduced a scheme to train young Maoris in carpentry. This initial training scheme, limited to 10 boys, was not designed to replace the normal apprenticeship system but to fill in the gaps in the education of the boys and help give them the confidence to undertake further training. From this small beginning the scheme has grown to encompass an annual intake of 156 Maori boys in seven trades, with training centres in Auckland, Wellington, and Christchurch.
These training schemes are approved pre-apprenticeship courses, time spent in them being credited towards the normal apprenticeship courses which the boys will complete with employers in the usual way once their special training has finished. These courses are run in conjunction with the technical institutes in Auckland, Petone, and Christchurch and in association with the Departments of Education and Labour and the New Zealand Apprenticeship Committees for the trades involved.
The training syllabus followed by the technical institutions is designed to cover the prescriptions of the New Zealand Trades Certification Board's examinations. Special tuition is also given in some other subjects to assist the Maori boys to adapt themselves to living in large urban communities.
As a general rule, entry to these schemes is restricted to those Maori boys who are under 18 years of age and who come from country areas where apprenticeships are not normally available. Two years' secondary educations is regarded as the minimum although for the electrical wiring, plumbing, and motor mechanics courses better qualifications are required. Boys taken into the schemes, and their parents, enter into a training agreement with the Department of Maori Affairs whereby the boys are required to live at approved hostels, regularly attend evening technical classes, and to sit the appropriate trade examinations.
As relatively few Maori boys apply for such training on their own or their parents' initiative, it is necessary for Maori welfare officers to arouse interest in them in the course off their work in the schools and in the community generally. This highlights the continuing efforts which must be made, both on an individual and community level, to encourage appreciation of the benefits of skilled training.
The trainees receive normal apprentices wages and other allowances in accordance with the appropriate Industry Apprenticeship Orders, as well as a lodging allowance. The initial fares from the boys' homes to the training centres are paid for them, and hostel accommodation is arranged, as is daily transport to and from the training centre. During the May and August vacations the trainees are temporarily employed by private employers. This not only ensures continuous employment but also provides the trainees with experience of normal working conditions.
The trades in which special training is given are carpentry, plumbing, electrical wiring, motor mechanics, painting and decorating, panelbeating, and plastering. Carpentry is a two-year course and is provided in the three cities, 24 boys being taken in for training at each centre each year. The other six trades are one-year courses with annual intakes of 12 boys, except panelbeating where the intake is 24. As well as receiving theoretical and workshop tuition the carpentry trainees split up into groups of six for part of their course and, under the direction of instructors, each group builds three houses during the two-year course.
That these courses are making a significant contribution both to industry and to the Maori community's place in society is evident. By 31 March 1966, 674 Maori youths had been taken into the schemes, of whom 423 had already completed training and had been placed in apprenticeships.
The increase in the number of Maori apprentices in recent years is illustrated by the following table.
| At 31 March | Registered Maori Apprentices | Percentage of Total Registered Apprentices |
|---|---|---|
| 1962 | 566 | 2.8 |
| 1963 | 604 | 2.9 |
| 1964 | 770 | 3.3 |
| 1965 | 852 | 3.6 |
| 1966 | 981 | 3.9 |
If to the figure of 981 Maori apprentices at 31 March 1966 there is added the figure of 210 trainees on the schemes, the Maori representation is increased from 3.6 percent to 4.8 percent of the total apprentices.
UNEMPLOYMENT—Except for occasional returns relating to State unemployment relief which were presented to Parliament from time to time, practically no direct statistical evidence as to the extent of unemployment in New Zealand prior to 1892 is available. Such information is, however, available from the census (since 1896) and from the records of the Department of Labour (since 1892). In addition, statistics of unemployment among trade unionists were collected from trade union secretaries by the Department of Statistics from 1925 to 1930. A table showing figures of unemployment from June 1931 to March 1939 will be found on page 854 of the 1940 Yearbook.
Census Data on Unemployment—The great disadvantage of the census inquiry as an indicator of the trend of unemployment is that it provides data at quinquennial intervals only. Unemployment figures from the 1961 census were 4,674 males and 2,224 females.
The following table gives relevant census data on unemployment from 1896 to 1961. Prior to 1951 Maoris were not included.
| Census | Number of Males Unemployed | Proportion per 1,000 Male Wage and Salary Earners |
|---|---|---|
| 12 April 1896 | 14,759 | 100 |
| 31 March 1901 | 8,467 | 48 |
| 12 April 1906 | 8,189 | 39 |
| 2 April 1911 | 7,152 | 30 |
| 15 October 1916 | 5,920 | 26 |
| 17 April 1921 | 11,061 | 39 |
| 20 April 1926 | 10,694 | 34 |
| 24 March 1936 | 35,774 | 96 |
| 25 September 1945 | 5,823 | 16 |
| 17 April 1951 | 7,902 | 18 |
| 17 April 1956 | 5,558 | 12 |
| 18 April 1961 | 4,674 | 9 |
The 1936 figure includes men on rationed relief work, but excludes men (16,222) partly unemployed but not on relief work. The 1945 figure includes ex-servicemen recently returned from overseas who had not then resumed work. At the time of the 1951 census the waterfront strike was in progress and it was estimated that approximately 15,000 workers in that and other industries were on strike. Evidently many of these were not returned as unemployed; it is likely that a number changed to other industries, while some may not have considered themselves to be unemployed.
Unemployment Benefit—Unemployment benefits under the Social Security Act have been payable since 1 April 1939. The number in force at 31 March 1966 was 133.
Subject to the conditions set out in Section 6A, the unemployment benefit may be claimed as of right as all workers pay social security income tax. Registration at a district office of the Department of Labour is a compulsory prerequisite to eligibility for the benefit. Hence it is considered that the great majority of workers becoming involuntarily unemployed would register for employment in order to validate a claim for the benefit.
Close liaison is maintained between the Social Security Department and the Department of Labour to prevent the payment of benefit where work is available. In addition to the requirement that a benefit applicant must register for work at an employment office, all unemployment beneficiaries must report once weekly at the employment office.
INDUSTRIAL DISTRIBUTION, OCCUPATIONS, AND OCCUPATIONAL STATUS—Statistics on industrial distribution, occupations, and occupational status compiled from the population census taken on 18 April 1961 are given in the following tables. The tables illustrate the extent to which the population directly participated in the economic life of the country, according to industry and occupation, and show the nature of their activities, i.e., employer, wage or salary earner, etc.
Excluded from the tables are members of the Armed Services overseas at census dates, numbering 2,162 in 1956 and 2,559 in 1961. Maoris are included in all tables.
The next table shows the numbers and percentages actively engaged or otherwise.
| Category | 1956 Census | 1961 Census | ||||
|---|---|---|---|---|---|---|
| Males | Females | Total | Males | Females | Total | |
| Numbers | ||||||
| Actively engaged | 622,758 | 194,094 | 816,852 | 670,506 | 224,857 | 895,363 |
| Not actively engaged | 470,453 | 886,757 | 1,357,210 | 542,870 | 976,751 | 1,519,621 |
| Totals | 1,093,211 | 1,080,851 | 2,174,062 | 1,213,376 | 1,201,608 | 2,414,984 |
| Percentages | ||||||
| Actively engaged | 56.97 | 17.96 | 37.57 | 55.26 | 18.71 | 37.08 |
| Not actively engaged | 43.03 | 82.04 | 62.43 | 44.74 | 81.29 | 62.92 |
| Totals | 100.00 | 100.00 | 100.00 | 100.00 | 100.00 | 100.00 |
The percentage of actively engaged males to total male population dropped from 56.97 to 55.26 between 1956 and 1961. This is a reflection of the large increase recorded in the under-15-years age group between 1956 and 1961, as compared with the increase in. the working age group of 15 to 64 years.
This would, in normal circumstances, have meant a similar drop in the proportion percent of actively engaged females, but, owing mainly to the substantial increase in numbers of married women working, the percentage for females has increased from 17.96 to 18.71.
Occupational Status 1961—The following table shows the distribution of the population according to the character of participation or non-participation in industry.
| Occupational Status | 1956 Census | 1961 Census | ||||
|---|---|---|---|---|---|---|
| Males | Females | Total | Males | Females | Total | |
| Employer | 66,864 | 5,983 | 72,847 | 62,231 | 4,691 | 66,922 |
| Own account | 72,239 | 7,856 | 80,095 | 61,862 | 6,045 | 67,907 |
| Wage or salary earner | 476,637 | 176,721 | 653,358 | 540,316 | 210,566 | 750,882 |
| Unemployed | 5,558 | 2,378 | 7,936 | 4,674 | 2,224 | 6,898 |
| Relative assisting, unpaid | 1,208 | 1,038 | 2,246 | 766 | 1,122 | 1,888 |
| Not specified | 252 | 118 | 370 | 657 | 209 | 866 |
| Totals, actively engaged | 622,758 | 194,094 | 816,852 | 670,506 | 224,857 | 895,363 |
| Not actively engaged | 470,453 | 886,757 | 1,357,210 | 542,870 | 976,751 | 1,519,621 |
| Grand totals | 1,093,211 | 1,080,851 | 2,174,062 | 1,213,376 | 1,201,608 | 2,414,984 |
The total number actively engaged increased by 78,511, or 9.61 percent, between 1956 and 1961. In the wage or salary earner group the increase was 97,524 or 14.93 percent.
Female wage or salary earners increased by 33,845, or 19.15 percent; a substantial increase in the number of married females working boosted the increase in this particular group.
Industrial Distribution 1961: Divisions—The industrial distribution of the population by the principal divisions of industry at the 1961 census is now given.
| Division | Numbers | Percentage of Actively Engaged | ||||
|---|---|---|---|---|---|---|
| Males | Females | Total | Males | Females | Total | |
| Agriculture, forestry, hunting, and fishing | 118,952 | 9,982 | 128,934 | 17.74 | 4.44 | 14.40 |
| Mining and quarrying | 7,041 | 123 | 7,164 | 1.05 | 0.05 | 0.80 |
| Manufacturing | 170,275 | 52,752 | 223,027 | 25.39 | 23.46 | 24.91 |
| Construction | 84,482 | 1,784 | 86,266 | 12.60 | 0.79 | 9.64 |
| Electricity, gas, water, and sanitary services | 11,115 | 833 | 11,948 | 1.66 | 0.37 | 1.33 |
| Commerce | 107,320 | 55,717 | 163,037 | 16.01 | 24.78 | 18.21 |
| Transport, storage, and communication | 77,834 | 11,442 | 89,276 | 11.61 | 5.09 | 9.97 |
| Services | 90,936 | 91,193 | 182,129 | 13.56 | 40.56 | 20.34 |
| Activities not adequately described | 2,551 | 1,031 | 3,582 | 0.38 | 0.46 | 0.40 |
| Totals, actively engaged | 670,506 | 224,857 | 895,363 | 100.00 | 100.00 | 100.00 |
| Not actively engaged | 542,870 | 976,751 | 1,519,621 | ... | ... | ... |
| Grand totals | 1,213,376 | 1,201,608 | 2,414,984 | ... | ... | ... |
Industrial participation by major industrial groups is now given for the 1961 census.
| Industrial Division and Major Group | Males | Females | Total |
|---|---|---|---|
| Agriculture, forestry, hunting, and fishing— | |||
| Agriculture and livestock production | 111,909 | 9,732 | 121,641 |
| Forestry and logging | 4,468 | 212 | 4,680 |
| Hunting, trapping, and game propagation | 1,096 | 18 | 1,114 |
| Fishing | 1,479 | 20 | 1,499 |
| Mining and quarrying— | |||
| Coal mining | 4,261 | 69 | 4,330 |
| Metal mining | 169 | 3 | 172 |
| Crude petroleum and natural gases | 164 | 9 | 173 |
| Stone quarrying, clay and sand pits | 2,369 | 34 | 2,403 |
| Non-metallic mining and quarrying, n.e.c. | 78 | 8 | 86 |
| Manufacturing— | |||
| Food industries, except beverage industries | 35,753 | 6,582 | 42,335 |
| Beverage industries | 2,625 | 361 | 2,986 |
| Tobacco | 672 | 714 | 1,386 |
| Textiles | 5,744 | 5,155 | 10,899 |
| Footwear, wearing apparel, and made-up textile goods | 7,902 | 21,309 | 29,211 |
| Wood and cork, except furniture | 14,502 | 500 | 15,002 |
| Furniture and fixtures | 5,190 | 738 | 5,928 |
| Paper and paper products | 4,699 | 1,219 | 5,918 |
| Printing, publishing, and allied industries | 10,017 | 3,467 | 13,484 |
| Leather and leather products, except footwear | 1,205 | 595 | 1,800 |
| Rubber products | 3,199 | 729 | 3,928 |
| Chemicals and chemical products | 5,850 | 2,229 | 8,079 |
| Products of petroleum and coal | 440 | 31 | 471 |
| Non-metallic mineral products, except products of petroleum and coal | 8,436 | 786 | 9,222 |
| Basic metal industries | 2,067 | 123 | 2,190 |
| Metal products, except machinery and transport equipment | 7,931 | 1,032 | 8,963 |
| Machinery, except electrical machinery | 14,248 | 1,195 | 15,443 |
| Electrical machinery apparatus, appliances, and supplies | 5,703 | 2,055 | 7,758 |
| Transport equipment | 30,015 | 1,887 | 31,902 |
| Miscellaneous products | 4,077 | 2,045 | 6,122 |
| Construction— | |||
| Construction | 84,482 | 1,784 | 86,266 |
| Electricity, gas, water, and sanitary services— | |||
| Electricity, gas, and steam | 9,138 | 793 | 9,931 |
| Water and sanitary services | 1,977 | 40 | 2,017 |
| Commerce— | |||
| Wholesale and retail trade | 92,591 | 47,156 | 139,747 |
| Banks, and other financial institutions | 7,571 | 4,911 | 12,482 |
| Insurance | 5,411 | 3,107 | 8,518 |
| Real estate | 1,747 | 543 | 2,290 |
| Transport, storage, and communication— | |||
| Transport | 60,680 | 4,383 | 65,063 |
| Storage and warehousing | 743 | 35 | 778 |
| Communication | 16,411 | 7,024 | 23,435 |
| Services— | |||
| Government services | 26,950 | 7,655 | 34,605 |
| Community and business services | 43,753 | 57,760 | 101,513 |
| Recreation services | 5,132 | 1,863 | 6,995 |
| Personal services | 15,101 | 23,915 | 39,016 |
| Activities not adequately described | 2,551 | 1,031 | 3,582 |
| Totals, actively engaged | 670,506 | 224,857 | 895,363 |
| Not actively engaged | 542,870 | 976,751 | 1,519,621 |
| Grand totals | 1,213,376 | 1,201,608 | 2,414,984 |
Occupations—The occupational classification in major groups is given in the following table.
| Occupational Division and Major Group | Males | Females | Total |
|---|---|---|---|
| Professional, technical, and related workers— | |||
| Architects, engineers, surveyors | 4,975 | 25 | 5,000 |
| Chemists, physicists, geologists, and other physical scientists | 976 | 68 | 1,044 |
| Biologists, veterinarians, agronomists, and related scientists | 1,157 | 280 | 1,437 |
| Physicians, surgeons, dentists | 3,165 | 217 | 3,382 |
| Nurses and midwives | 881 | 14,379 | 15,260 |
| Professional medical workers, n.e.c, and medical technicians | 2,700 | 1,415 | 4,115 |
| Teachers | 12,847 | 14,883 | 27,730 |
| Clergy, and related members of religious orders | 2,595 | 778 | 3,373 |
| Jurists | 2,115 | 33 | 2,148 |
| Artists, writers, and related workers | 2,987 | 1,748 | 4,735 |
| Draughtsmen, and science and engineering technicians, n.e.c. | 4,406 | 1,364 | 5,770 |
| Other professional, technical, and related workers | 8,618 | 1,261 | 9,879 |
| Administrative, executive, and managerial workers— | |||
| Administrative and executive official: Government | 1,461 | 44 | 1,505 |
| Directors, managers, and working proprietors (not including proprietors on own account in wholesale and retail trade) | 45,654 | 4,224 | 49,878 |
| Clerical workers— | |||
| Bookkeepers and cashiers | 1,641 | 3,338 | 4,979 |
| Stenographers and typists | 106 | 21,034 | 21,140 |
| Other clerical workers | 49,041 | 39,406 | 88,447 |
| Sales workers— | |||
| Working proprietors, wholesale and retail trade | 4,632 | 1,727 | 6,359 |
| Insurance and real estate salesmen, salesmen of securities and services, and auctioneers | 3,602 | 129 | 3,731 |
| Commercial travellers and manufacturers agents | 10,905 | 665 | 11,570 |
| Salesmen, shop assistants, and related workers | 25,043 | 26,736 | 51,779 |
| Farmers, fishermen, hunters, loggers, and related workers— | |||
| Farmers and farm managers | 71,323 | 3,271 | 74,594 |
| Farm workers, not elsewhere classified | 42,242 | 6,023 | 48,265 |
| Hunters and related workers | 963 | 5 | 968 |
| Fishermen and related workers | 1,444 | 12 | 1,456 |
| Loggers, and other forestry workers | 4,473 | 18 | 4,491 |
| Miners, quarrymen, and related workers— | |||
| Miners and quarrymen | 3,587 | - | 3,587 |
| Well drillers and related workers | 346 | - | 346 |
| Mineral treaters | 201 | - | 201 |
| Miners, quarrymen, and related workers, n.e.i. | 1,043 | - | 1,043 |
| Workers in transport and communications occupations— | |||
| Deck officers, engineer officers, and pilots (ship) | 1,928 | 6 | 1,934 |
| Deck and engineroom ratings, ship and barge crews, and boatmen | 3,410 | 10 | 3,420 |
| Aircraft pilots, navigators, and flight engineers (not Air Force) | 611 | 7 | 618 |
| Drivers and firemen (railway engines) | 2,123 | - | 2,123 |
| Drivers, road transport | 31,046 | 270 | 31,316 |
| Guards and brakemen—railways | 626 | 2 | 628 |
| Inspectors, supervisors, traffic controllers and dispatchers—transport | 4,623 | 35 | 4,658 |
| Telephone, telegraph, and related communications operators | 2,774 | 4,232 | 7,006 |
| Postmen and messengers | 2,433 | 601 | 3,034 |
| Workers in transport and communications occupations, n.e.c. | 991 | 60 | 1,051 |
| Craftsmen, production process workers, and labourers, n.e.c.— | |||
| Spinners, weavers, knitters, dyers, and related workers | 4,659 | 4,351 | 9,010 |
| Tailors, cutters, furriers, and related workers | 3,958 | 18,650 | 22,608 |
| Leather cutters, lasters and sewers (except gloves and garments), and related workers | 3,149 | 2,526 | 5,675 |
| Furnacemen, rollers, drawers, moulders, and related metal making and treating workers | 2,494 | 50 | 2,544 |
| Precision-instrument makers, watchmakers, jewellers, and related workers | 1,767 | 226 | 1,993 |
| Toolmakers, machinists, plumbers, welders, platers, and related workers | 56,498 | 1,155 | 57,653 |
| Electricians, and related electrical and electronic workers | 21,094 | 1,068 | 22,162 |
| Carpenters, joiners, cabinetmakers, coopers, and related workers | 43,814 | 321 | 44,135 |
| Painters and paperhangers | 10,992 | 89 | 11,081 |
| Bricklayers, plasterers, and construction workers, n.e.c. | 11,814 | 10 | 11,824 |
| Compositors, pressmen, engravers, bookbinders, and related workers | 6,338 | 1,590 | 7,928 |
| Potters, kilnmen, glass and clay formers, and related workers | 1,878 | 280 | 2,158 |
| Millers, bakers, brewmasters, and other food and beverage workers | 24,251 | 2,932 | 27,183 |
| Chemical and related process workers | 3,856 | 393 | 4,249 |
| Tobacco preparers and tobacco product makers | 297 | 514 | 811 |
| Craftsmen and production process workers, n.e.c. | 8,605 | 2,656 | 11,261 |
| Packers, labellers, and related workers | 1,394 | 3,099 | 4,493 |
| Stationary engine, excavating, and lifting equipment operators, and related workers | 10,423 | 5 | 10,428 |
| Waterside workers and related freight handlers | 26,399 | 424 | 26,823 |
| Labourers, n.e.c. | 27,246 | 777 | 28,023 |
| Service, sport, and recreation workers— | |||
| Fire fighters, policemen, guards, and related workers | 4,449 | 70 | 4,519 |
| Housekeepers, cooks, maids, and related workers | 3,206 | 15,818 | 19,024 |
| Waiters, bartenders, and related workers | 3,807 | 5,201 | 9,008 |
| Building caretakers, cleaners, and related workers | 4,280 | 2,353 | 6,633 |
| Barbers, hairdressers, beauticians, and related workers | 1,461 | 2,956 | 4,417 |
| Launderers, drycleaners, and pressers | 1,211 | 2,445 | 3,656 |
| Athletes, sportsmen, and related workers | 1,051 | 117 | 1,168 |
| Photographers and related camera operators | 754 | 295 | 1,049 |
| Embalmers and undertakers | 307 | 12 | 319 |
| Service, sport, and recreation worker, n.e.c. | 2,249 | 4,974 | 7,223 |
| Workers not classifiable by occupation— | |||
| New workers seeking employment | 82 | 89 | 171 |
| Workers reporting occupations unidentifiable or inadequately described | 377 | 136 | 513 |
| Workers not reporting any occupation | 1,316 | 453 | 1,769 |
| Armed forces— | |||
| Armed forces | 9,336 | 516 | 9,852 |
| Totals, actively engaged | 670,506 | 224,857 | 895,363 |
| Totals, not actively engaged | 542,870 | 976,751 | 1,519,621 |
| Grand totals | 1,213,376 | 1,201,608 | 2,414,984 |
EMPLOYMENT ON FARMS—A table giving special detailed statistics for farm workers and farm population at 31 January 1950, covering persons actually residing on holdings of 1 acre and over situated outside borough boundaries, was published on page 979 of the 1954 Yearbook, these having been derived from the collection of farm production statistics undertaken by the Department of Statistics. The information, however, has not been tabulated for subsequent years from this collection and the latest detailed information available is that from the 1961 census of population. This information is given in Section 14A of this Yearbook.
OCCUPATIONS OF MARRIED WOMEN—Information from the 1961 Census on the occupation divisions of married women in the labour force is given by age groups in the following table. In 1951 the 41,932 married women working constituted 25 percent of the female labour force; in 1956 there were 62,033 married women working and they made up 33 percent of the female labour force; in 1961 the total of married women working had risen to 84,556 and this was 38 percent of the female labour force.
| Occupation | Age Group, in Years | |||||||
|---|---|---|---|---|---|---|---|---|
| Under 20 | 20-29 | 30-39 | 40-49 | 50-59 | 60-69 | 70 and over | Total | |
| Teachers, nurses, etc. | 33 | 2,214 | 1,719 | 1,729 | 1,068 | 152 | 10 | 6,925 |
| Directors, managers, etc. | 3 | 177 | 665 | 1,051 | 631 | 162 | 16 | 2,705 |
| Clerks, typists, etc. | 411 | 5,939 | 4,736 | 5,005 | 2,726 | 400 | 16 | 19,233 |
| Shopkeepers and saleswomen, etc. | 166 | 1,936 | 3,636 | 5,577 | 2,833 | 402 | 16 | 14,566 |
| Farmers and farm workers | 39 | 838 | 1,587 | 1,323 | 724 | 169 | 31 | 4,711 |
| Telephone operators, postwomen, drivers etc. | 39 | 391 | 436 | 326 | 116 | 18 | 1 | 1,327 |
| Clothing and other production process workers | 336 | 3,307 | 5,595 | 7,570 | 4,326 | 687 | 26 | 21,847 |
| Housekeepers, waitresses, and other service workers | 131 | 1,762 | 2,978 | 4,360 | 3,061 | 656 | 39 | 12,987 |
| Not classifiable | 7 | 29 | 46 | 56 | 35 | 8 | - | 181 |
| Armed forces | 2 | 32 | 29 | 10 | 1 | - | - | 74 |
| Totals | 1,167 | 16,625 | 21,427 | 27,007 | 15,521 | 2,654 | 155 | 84,556 |
SEASONAL FLUCTUATIONS IN EMPLOYMENT—The adoption of the maintenance of full employment as a desideratum in many countries has prompted research into various employment problems, including that of the fluctuation or periodicity of employment. Information on the annual cycle of employment in New Zealand is available for those industries which are covered by the half-yearly survey. The following table shows the month-to-month variations in male employment in seasonal industries. The seasonal changes in female employment are less marked, such fluctuations as are evident originating mainly in the fruit- and vegetable-preserving industry.
| Month | Meat Processing, etc. | Fruit and Vegetable Preserving | Dairy Factories | Wool and Grain Stores | Total, Seasonal Industries |
|---|---|---|---|---|---|
| 1965 | |||||
| April | 22,094 | 1,256 | 4,431 | 2,426 | 30,207 |
| May | 21,436 | 1,207 | 4,105 | 2,111 | 28,859 |
| June | 18,858 | 1,196 | 3,888 | 1,841 | 25,783 |
| July | 16,366 | 1,224 | 3,963 | 1,717 | 23,270 |
| August | 15,822 | 1,254 | 4,379 | 2,044 | 23,499 |
| September | 15,128 | 1,251 | 4,736 | 2,210 | 23,325 |
| October | 14,714 | 1,276 | 4,900 | 2,536 | 23,426 |
| November | 19,676 | 1,214 | 4,996 | 3,100 | 28,986 |
| December | 26,425 | 1,781 | 5,078 | 3,553 | 36,837 |
| 1966 | |||||
| January | 26,318 | 1,759 | 4,975 | 3,424 | 36,476 |
| February | 24,590 | 1,615 | 4,831 | 3,035 | 34,071 |
| March | 23,973 | 1,589 | 4,676 | 2,720 | 32,958 |
| April | 23,346 | 1,306 | 4,478 | 2,609 | 31,739 |
PUBLIC WORKS—Figures are available which include not only the number of workers in the direct employ of the Ministry of Works and the New Zealand Electricity Department, but also those employed by contractors for public works, and those employed by local authorities on works which are financed wholly or partly by the Ministry of Works, National Roads Board, and Soil Conservation and Rivers Control Council. In the next table figures on this basis are given. Departmental and contractors' workmen on Housing Division work are included.
| Period | Electricity Works | Roads | Irrigation | Soil Conservation and Rivers Control | Buildings | Aerodromes | Railways | Other Works | Total | |
|---|---|---|---|---|---|---|---|---|---|---|
| New Zealand Electricity Department | Ministry of Works | |||||||||
| Average for calendar year— | ||||||||||
| 1956 | 2,845 | 2,798 | 5,582 | 118 | 257 | 5,540 | 471 | 33 | 2,014 | 19,658 |
| 1957 | 2,734 | 3,394 | 5.157 | 186 | 350 | 4,451 | 229 | 118 | 2,639 | 19,258 |
| 1958 | 2,708 | 3,953 | 4,917 | 174 | 363 | 4,025 | 166 | 171 | 2,354 | 18,831 |
| 1959 | 2,808 | 3,644 | 5,025 | 173 | 393 | 4,676 | 156 | 101 | 2,484 | 19,460 |
| 1960 | 2,909 | 3,124 | 5,417 | 140 | 380 | 4,627 | 95 | 154 | 2,675 | 19,521 |
| 1961 | 2,948 | 3,042 | 5,330 | 128 | 365 | 4,173 | 184 | 110 | 2,549 | 18,829 |
| 1962 | 3,197 | 2,658 | 5,085 | 111 | 388 | 3,581 | 230 | 45 | 2,531 | 17,826 |
| 1963 | 3,416 | 2,867 | 5,466 | 122 | 429 | 3,490 | 264 | 39 | 2,641 | 18,734 |
| 1964 | 3,332 | 3,210 | 5,745 | 126 | 417 | 3,737 | 309 | 39 | 2,637 | 19,552 |
| 1965 | 3,115 | 3,557 | 5,718 | 120 | 387 | 3,605 | 251 | 65 | 2,512 | 19,330 |
| 1966 | 3,071 | 4,711 | 6,228 | 107 | 399 | 2,823 | 148 | 55 | 2,558 | 20,100 |
| Month— | ||||||||||
| 1965—December | 3,004 | 3,912 | 6,009 | 93 | 302 | 3,230 | 295 | 70 | 2,428 | 19,343 |
| 1966—March | 3,040 | 4,745 | 6,265 | 132 | 398 | 3,153 | 134 | 27 | 2,435 | 20,329 |
| June | 3,071 | 4,989 | 6,341 | 116 | 436 | 2,673 | 110 | 51 | 2,495 | 20,282 |
| September | 3,094 | 4,776 | 6,329 | 82 | 429 | 2,667 | 148 | 69 | 2,774 | 20,368 |
| December | 3,158 | 4,753 | 5,944 | 102 | 363 | 2,366 | 104 | 74 | 2,631 | 19,495 |
The figures shown in this table and also those in the table following on local authority employment are included in the national employment tables already presented.
LOCAL AUTHORITIES—The following table shows the number of employees of local authorities as at 31 March for the latest five years. Employees of electric power boards and fire boards are included here, but not those of hospital boards. All direct employees are covered, including part-time temporary, or casual employees, and those whose wages are recoverable, but those employed by contractors are excluded.
| As at 31 March | Administrative, Professional, and Clerical | Other | Total |
|---|---|---|---|
| 1962 | 8,532 | 23,906 | 32,438 |
| 1963 | 9,220 | 25,246 | 34,466 |
| 1964 | 9,493 | 25,324 | 34,817 |
| 1965 | 9,818 | 25,693 | 35,511 |
| 1966 | 10,420 | 26,006 | 36,426 |
WORKING LIFE EXPECTANCIES—Precise statistics on the pattern of working life for New Zealand's population first became available with the compiliation by the Department of Statistics in 1957 of Tables of Working Life based on the year 1951. These tables display the degree to which labour force rates of participation, entry, and withdrawal vary with age for both males and females. Also included are expectancies of future working life and retirement life for members of the labour force, assuming that 1951 experience continues. The main applications of these tables are to economic and social studies relating to large groups of people. Individuals frequently do not conform to group patterns and, therefore, applications of the expectancies and other statistics contained in the tables must be made with caution. An abridgement of the detailed tables is presented below. For an explanation of the contents of the Table of Working Life and a detailed analysis of the pattern of working life, male and female, in New Zealand, reference should be made to a Supplement to the February 1957 issue of the Monthly Abstract of Statistics.
| ABRIDGED TABLES OF WORKING LIFE, 1951 | ||||||
|---|---|---|---|---|---|---|
| Exact Age (Years) | Percentage of Population in Labour Force | Number in Labour Force, per 100,000 Live Births | Changes in the Labour Force in the following 5 Years of Age, per 100,000 Live Births | Expectation of Work Life of Person in Labour Force† (Year) | Expectation of Retirement Life of Person in Labour Force‡ (Year) | |
| Total Entries* | Total Withdrawals | |||||
*Entries of females into the labour force below the horizontal line are secondary entries by those who withdrew at younger ages for reasons connected with marriage. †The working life expectancies for females allow for the possibility of a second spell of labour force membership after a period of non-membership due to marriage. ‡Difference between life expectancy and working-life expectancy. | ||||||
| Males | ||||||
| 15 | - | - | 88,331 | 555 | 46.7 | 8.6 |
| 20 | 92.7 | 87,776 | 4,304 | 913 | 42.0 | 8.7 |
| 25 | 97.3 | 91,167 | 382 | 864 | 37.5 | 8.7 |
| 30 | 97.6 | 90,685 | 187 | 1,007 | 32.8 | 8.8 |
| 35 | 97.7 | 89,865 | - | 1,337 | 28.1 | 8.9 |
| 40 | 97.5 | 88,528 | - | 1,806 | 23.5 | 8.9 |
| 45 | 97.1 | 86,722 | - | 3,638 | 18.9 | 9.0 |
| 50 | 95.7 | 83,084 | - | 8,389 | 14.6 | 9.1 |
| 55 | 90.3 | 74,695 | - | 12,304 | 11.0 | 8.7 |
| 60 | 81.6 | 62.391 | - | 26.000 | 7.6 | 8.5 |
| 65 | 53.8 | 36,391 | - | 16.088 | 6.7 | 6.1 |
| 70 | 36.4 | 20,303 | - | 11.770 | 5.0 | 5.0 |
| 75 | 20.5 | 8,533 | - | 5,972 | 3.8 | 3.8 |
| 80 | 9.8 | 2,561 | - | 2,281 | 2.4 | 3.1 |
| 85 | 2.2 | 280 | - | 277 | 1.3 | 2.6 |
| 90 | 0.1 | 3 | - | 3 | 0.7 | 1.9 |
| Females | ||||||
| 15 | - | - | 81,805 | 8,473 | 16.2 | 42.7 |
| 20 | 76.5 | 73,332 | 1,129 | 42,407 | 12.4 | 41.8 |
| 25 | 33.6 | 32,054 | 1,136 | 14,064 | 16.7 | 32.7 |
| 30 | 20.2 | 19,126 | 4,031 | 5,030 | 20.3 | 24.4 |
| 35 | 19.2 | 18,127 | 4,228 | 3,062 | 19.9 | 20.1 |
| 40 | 20.7 | 19,293 | 3,014 | 1,803 | 17.5 | 17.9 |
| 45 | 22.3 | 20,504 | 1,297 | 2,651 | 13.6 | 17.2 |
| 50 | 21.3 | 19,150 | 775 | 4,676 | 9.9 | 16.6 |
| 55 | 17.6 | 15,249 | 351 | 5,449 | 7.2 | 15.2 |
| 60 | 12.3 | 10,151 | - | 6,414 | 4.6 | 13.8 |
| 65 | 4.9 | 3,737 | - | 2,592 | 3.8 | 11.0 |
| 70 | 1.7 | 1,145 | - | 1,014 | 2.5 | 8.9 |
| 75 | 0.2 | 131 | - | 131 | 1.1 | 7.4 |
UNIONS OF WORKERS—Registration under the Industrial Conciliation and Arbitration Act 1954 (originally enacted in 1894) makes a trade union of workers into a body corporate for the purposes of the Act, places the union and its members under the jurisdiction of the Court of Arbitration, lays down certain matters which must be included in the rules of the union, and makes the rules legally binding on the members. It enables the union to sue or be sued, and to hold land and property, and gives it disciplinary power over its members, who may be sued for fees or fines in the Courts. The chief advantage arising from registration under the Industrial Conciliation and Arbitration Act is that it enables the union to compel the employers to negotiate with it in a Conciliation Council and, if no agreement is reached, to secure a decision from the Court of Arbitration in the form of an award laying down minimum wages, house, and working conditions applicable to all employees in the industry. On the other hand, by registration, a union loses the right to strike and renders its members liable to penalties for striking. In order to secure registration under the Industrial Conciliation and Arbitration Act and, therefore, to be able to secure an award for its members, a union must fulfil certain conditions of membership. For registration an industrial union of workers must consist of not less than 15 members or enrol not less than 25 percent of the total number of workers engaged in the industry in the industrial district in which it is registered, but it may not consist of less than five members. Until 1936, when the Act was amended, a union could, however, only cover one of the eight industrial districts into which the country is divided. The registration of a large number of small unions, one for each industrial district, was thus made inevitable.
The legislation in 1936 removed the legal obstacles to the formation of national unions, and enabled any society of workers to register as a New Zealand union covering the whole country, provided it had branches in each of at least four industrial districts. Unions covering two or more districts could also be registered. Under the amended Act, when a New Zealand union is registered, the registrations of the local unions which united to form it are automatically cancelled unless the Minister has directed that any such union shall continue in existence, and no new union in that industry can be registered unless two-thirds of the workers in the district or locality concerned so desire. The 1936 legislation thus opened the way for the first time for the registration of national organisations.
Even before 1900, awards of the Court had contained clauses providing for preference of employment for union members. In 1916, however, the Court of Appeal issued a decision restricting preference clauses. In 1925 the position was clarified when specific power was given to the Court of Arbitration to determine, amongst other matters, "the claim of members of industrial unions of workers to be employed in preference to non-members''. Preference clauses continued to be included in most awards, giving a qualified preference to unionists where a unionist was ready and willing to do the particular work and equally qualified to do it.
In the years subsequent to 1936, when the changes in the law enabled national unions to be formed and introduced compulsory membership of unions, two tendencies were visible. The first was the immediate creation of many new small unions, the number of unions jumping from 410 in 1935 to 499 in 1937, as many small groups of workers for the first time became unionised and secured an award. Later, a tendency for small unions to amalgamate into New Zealand unions or unions covering two or more districts became evident, so that the total number of unions declined at the same time as the number of large unions increased. By 1942 the result of these changes was to leave the number and membership of the small unions little different from what they were in 1928, but substantially to increase the number of large unions, and very greatly to increase their membership.
Compulsory unionism resulted in a great numerical strengthening of the existing unions with consequential increase in their financial strength, and the legislation enabling national unions to be formed helped to consolidate these gains; at the same time it resulted in the unionisation of many small groups of workers who were previously unorganised.
In 1961 the provision in the Act for compulsory union membership was replaced by two alternatives. Membership of a union would continue to be a condition of employment if the representatives of the parties in conciliation agreed to such a clause being included in the industrial agreement or award, or if 50 percent or more of the workers who would be bound by an award desired to be members of the union and party to the award. Alternatively, a qualified preference clause on the lines of the pre-1936 clauses would be inserted in the agreement or award.
The Act provides for a worker to seek a certificate of exemption from any union-membership provision on grounds of conscience.
From earliest days local trades councils had been the mouthpieces of the trade union movement. The great increase in the membership of the trade unions brought about by compulsory unionism and the formation of national unions were factors facilitating the formation of the Federation of Labour in 1937 as an organisation representative of the trade union movement as a whole on a national basis.
The supreme authority of the Federation of Labour is the annual conference of delegates representing affiliated unions. Between conferences the business of the Federation is carried on by a National Executive Committee and a National Council. The Executive consists of the officers and two members elected directly by the conference. The National Council, which meets about once a quarter, consists of members of the National Executive and one representative of each local trades council, and is the governing body of the Federation between meetings of the conference. The local organs of the Federation are the local trades councils, 19 in number, to which all local unions and branches of unions affiliated to the Federation of Labour are entitled to send representatives. The trades councils meet once a month to carry on the local business of the Federation and they maintain close contact with the National Executive by means of exchange of minutes of meetings. Within each district the trades council has local autonomy, but where any matter affects other districts the National Executive or the National Council usually deals with it.
UNIONS OF EMPLOYERS—Under the Industrial Conciliation and Arbitration Act, not less than three persons or a registered company may register as an industrial union of employers. By registering, the employers secure all the rights of a union under the Industrial Conciliation and Arbitration Act and can exercise them, with only minor differences, in the same manner as a union of workers.
Compulsory membership of unions does not apply to employers and in many cases their unions are maintained with a nominal membership.
The employers are, however, much more highly organised in respect of negotiations with labour than the figures of membership and the prevalence of local unions of employers might suggest. The New Zealand Employers' Federation, which is of long standing, is the chief co-ordinating authority for all activities of employers in connection with negotiations under the Industrial Conciliation and Arbitration Act. It is composed of 11 district employers' associations together with a number of other affiliated employers' organisations of national scope. Through the New Zealand Employers' Federation there is close integration of the various employer organisations operating under the Industrial Conciliation and Arbitration Act.
POWERS OF A UNION—The powers of a union are limited to those authorised by statute, and the manner in which such powers may be exercised, where not specifically mentioned in the statute, must be set out in the rules. It cannot use its funds for any purpose foreign to the purposes for which it is established, nor can it commence any project nor use its funds in any manner not contemplated by the Act under which it is registered. Under the Political Disabilities Removal Act 1960, a union may apply its funds in furtherance of political objects if a resolution is passed on a ballot of the members taken in accordance with its rules. A resolution shall be deemed to have been passed in a ballot of the members if a majority of the total valid votes recorded at the ballot is in favour. The Act provides that, where any levy to be applied in the furtherance of political objects becomes lawfully payable, a member shall be exempt from payment of the levy by giving notice of objection in writing.
The Industrial Conciliation and Arbitration Act requires certain provisions to be included in the rules of industrial unions, especially that election of officials are to be made by secret ballot of financial members or by such other democratic method as may be approved by the Registrar of Industrial Unions. The Registrar may refuse any unreasonable or oppressive rule, subject to a right of appeal by the union to the Court of Arbitration. He may also, on application by at least 10 financial members, refer to the Court for inquiry a disputed election of union officials. Secret ballots are required to validate subscriptions in excess of 20 cents weekly and levies on union members. Penalties are prescribed in the case of a strike or lockout, and these are heavier where an affirmative decision on the issue has not been made by a pre-strike or pre-lockout secret ballot of members concerned.
Provision is made under section 79 of the Industrial Conciliation and Arbitration Act 1954 for the furnishing of an annual return showing the number and membership as at 31 December of unions registered under the Act. It is from this return (see parliamentary paper H. 11) that the tables in this section have been compiled.
STATISTICS: Unions of Employers—The numbers and membership of industrial unions of employers registered under the Industrial Conciliation and Arbitration Act as at the end of each of the latest five years are shown in the following table according to industrial groups. In the few cases where current membership figures are not known the latest known figures are included. Some employers belong to two or more unions.
| Industrial Group | 1961 | 1962 | 1963 | 1964 | 1965 | |||||
|---|---|---|---|---|---|---|---|---|---|---|
| Unions | Members | Unions | Members | Unions | Members | Unions | Members | Unions | Members | |
| Provision of— | ||||||||||
| Food and drink | 59 | 4,515 | 60 | 4,442 | 62 | 4,146 | 62 | 4,199 | 62 | 3,782 |
| Clothing, footwear, and textiles | 8 | 3,413 | 9 | 3,304 | 9 | 3,341 | 9 | 3,401 | 8 | 3,370 |
| Building and construction | 50 | 4,151 | 50 | 4,125 | 50 | 4,085 | 52 | 4,107 | 53 | 4,267 |
| Power, heat, and light | 11 | 614 | 11 | 616 | 8 | 246 | 8 | 937 | 8 | 949 |
| Transport by water and air | 13 | 118 | 13 | 115 | 15 | 128 | 15 | 124 | 15 | 132 |
| Transport by land | 10 | 527 | 10 | 524 | 10 | 517 | 10 | 512 | 10 | 511 |
| Accommodation, meals, and personal service | 32 | 2,849 | 31 | 2,815 | 30 | 2,883 | 31 | 3,008 | 31 | 3,164 |
| Working in or on— | ||||||||||
| Wood, wicker, seagrass, etc. | 9 | 515 | 9 | 484 | 9 | 478 | 9 | 489 | 9 | 462 |
| Metal | 12 | 891 | 13 | 934 | 13 | 972 | 13 | 994 | 12 | 1,003 |
| Stone, clay, glass and chemicals | 9 | 800 | 9 | 793 | 10 | 839 | 10 | 831 | 10 | 808 |
| Paper, printing, etc. | 18 | 441 | 16 | 421 | 16 | 418 | 16 | 415 | 15 | 390 |
| Skins, leather, etc. | 6 | 26 | 6 | 26 | 6 | 26 | 6 | 35 | 5 | 29 |
| The land (farming pursuits) | 10 | 3,275 | 9 | 3,216 | 10 | 4,490 | 10 | 4,544 | 9 | 2,572 |
| Miscellaneous | 8 | 493 | 8 | 493 | 7 | 503 | 7 | 496 | 5 | 443 |
| Totals | 255 | 22,628 | 254 | 22,308 | 255 | 23,072 | 258 | 24,092 | 252 | 21,882 |
Unions of Workers—The following table shows membership only of industrial unions of workers as at the end of each year from 1900 to 1966. The outstanding feature is the large increase consequent upon the 1936 amendment to the Industrial Conciliation and Arbitration Act, which made union membership compulsory whenever an award or industrial agreement existed; on the other hand the effect of both world wars, of the economic depression of the 1930s, and of the waterfront strike of 1951 are clearly discernible.
| Year | Number of Members |
|---|---|
| *1950 figure now includes the
membership of five subsequently deregistered unions totalling 8,554 members. | |
| 1900 | 17,989 |
| 1901 | 23,768 |
| 1902 | 23,816 |
| 1903 | 27,640 |
| 1904 | 30,271 |
| 1905 | 29,869 |
| 1906 | 34,978 |
| 1907 | 45,614 |
| 1908 | 49,347 |
| 1909 | 54,519 |
| 1910 | 57,091 |
| 1911 | 55,629 |
| 1912 | 60,622 |
| 1913 | 71,544 |
| 1914 | 73,991 |
| 1915 | 67,661 |
| 1916 | 71,587 |
| 1917 | 72,873 |
| 1918 | 71,447 |
| 1919 | 82,553 |
| 1920 | 96,350 |
| 1921 | 97,719 |
| 1922 | 96,838 |
| 1923 | 94,438 |
| 1924 | 96,822 |
| 1925 | 100,540 |
| 1926 | 99,567 |
| 1927 | 101,071 |
| 1928 | 103,980 |
| 1929 | 102,646 |
| 1930 | 101,526 |
| 1931 | 90,526 |
| 1932 | 79,283 |
| 1933 | 71,888 |
| 1934 | 74,391 |
| 1935 | 80,929 |
| 1936 | 185,527 |
| 1937 | 232,986 |
| 1938 | 249,231 |
| 1939 | 254,690 |
| 1940 | 248,081 |
| 1941 | 01,049 |
| 1942 | 218,398 |
| 1943 | 214,628 |
| 1944 | 223,027 |
| 1945 | 229,103 |
| 1946 | 247,498 |
| 1947 | 260,379 |
| 1948 | 271,100 |
| 1949 | 275,977 |
| 1950 | 275,779* |
| 1951 | 272,957 |
| 1952 | 283,496 |
| 1953 | 290,149 |
| 1954 | 299,254 |
| 1955 | 304,520 |
| 1956 | 308,031 |
| 1957 | 317,137 |
| 1958 | 324,438 |
| 1959 | 327,495 |
| 1960 | 332,362 |
| 1961 | 324,747 |
| 1962 | 332,801 |
| 1963 | 334,128 |
| 1964 | 346,857 |
| 1965 | 353,105 |
| 1966 | 362,760 |
In the following table industrial unions of workers are classified according to membership. Unions for which no membership figures were available have been classified according to the latest known figures.
| Year | Under 100 | 100-199 | 200-299 | 300-499 | 500-999 | 1,000-1,999 | 2,000-2,999 | 3,000-4,999 | 5,000-9,999 | 10,000 and Over | Total |
|---|---|---|---|---|---|---|---|---|---|---|---|
| Number of Unions | |||||||||||
| 1901 | 142 | 30 | 19 | 5 | 4 | 1 | 1 | - | - | - | 202 |
| 1911 | 182 | 53 | 26 | 23 | 14 | 8 | - | - | 1 | - | 307 |
| 1921 | 239 | 70 | 36 | 28 | 28 | 11 | 3 | 2 | 1 | - | 418 |
| 1931 | 239 | 58 | 31 | 30 | 29 | 14 | 3 | - | 1 | - | 405 |
| 1941 | 184 | 70 | 38 | 38 | 32 | 27 | 13 | 10 | 5 | 2 | 419 |
| 1951 | 165 | 69 | 44 | 38 | 39 | 28 | 11 | 11 | 7 | 3 | 415 |
| 1961 | 147 | 58 | 39 | 39 | 46 | 25 | 15 | 11 | 11 | 4 | 395 |
| 1962 | 151 | 54 | 34 | 38 | 47 | 26 | 14 | 11 | 12 | 4 | 391 |
| 1963 | 143 | 53 | 37 | 36 | 45 | 23 | 14 | 12 | 12 | 4 | 379 |
| 1964 | 143 | 52 | 37 | 34 | 45 | 25 | 15 | 13 | 11 | 5 | 380 |
| 1965 | 140 | 51 | 30 | 38 | 44 | 25 | 15 | 14 | 10 | 5 | 372 |
| Membership | |||||||||||
| 1901 | 5,777 | 4,032 | 4,815 | 2,073 | 2,520 | 1,651 | 2,900 | - | - | - | 23,768 |
| 1911 | 7,521 | 7,686 | 6,360 | 8,879 | 9,685 | 9,414 | - | - | 6,084 | - | 55,629 |
| 1921 | 11,222 | 9,708 | 9,182 | 11,066 | 18,527 | 14,580 | 7,433 | 6,506 | 9,495 | - | 97,719 |
| 1931 | 9,969 | 7,966 | 7,578 | 11,244 | 20,602 | 18,566 | 6,744 | - | 7,857 | - | 90,526 |
| 1941 | 7,909 | 9,768 | 9,207 | 15,060 | 22,841 | 35,417 | 31,012 | 41,191 | 28,987 | 29,657 | 231,049 |
| 1951 | 7,875 | 10,225 | 10,394 | 14,671 | 27,274 | 39,658 | 27,364 | 43,218 | 40,278 | 52,000 | 272,957 |
| 1961 | 6,374 | 7,922 | 9,374 | 14,643 | 32,619 | 35,300 | 34,720 | 46,061 | 72,393 | 65,341 | 324,747 |
| 1962 | 6,280 | 7,326 | 8,084 | 14,211 | 33,591 | 37,006 | 33,364 | 44,609 | 75,516 | 72,814 | 332,801 |
| 1963 | 6,092 | 7,132 | 9,098 | 13,946 | 32,291 | 32,119 | 32,924 | 47,906 | 77,188 | 75,432 | 334,128 |
| 1964 | 6,154 | 7,214 | 9,128 | 13,278 | 30,854 | 34,479 | 35,761 | 51,034 | 71,074 | 87,881 | 346,857 |
| 1965 | 5,954 | 7,134 | 7,517 | 14,526 | 31,212 | 34,820 | 36,296 | 58,086 | 69,707 | 87,853 | 353,105 |
| Percentage of Total Membership | |||||||||||
| 1901 | 24.3 | 17.0 | 20.3 | 8.7 | 10.6 | 6.9 | 12.2 | - | - | - | 100.0 |
| 1911 | 13.5 | 13.8 | 11.4 | 16.0 | 17.4 | 16.9 | - | - | 11.0 | - | 100.0 |
| 1921 | 11.5 | 9.9 | 9.4 | 11.3 | 19.0 | 14.9 | 7.6 | 6.7 | 9.7 | - | 100.0 |
| 1931 | 11.1 | 8.8 | 8.4 | 12.4 | 22.8 | 20.5 | 7.4 | - | 8.6 | - | 100.0 |
| 1941 | 3.5 | 4.2 | 4.0 | 6.5 | 9.9 | 15.3 | 13.4 | 17.8 | 12.6 | 12.8 | 100.0 |
| 1951 | 2.9 | 3.7 | 3.8 | 5.4 | 10.0 | 14.5 | 10.0 | 15.8 | 14.8 | 19.1 | 100.0 |
| 1961 | 2.0 | 2.4 | 2.9 | 4.5 | 10.0 | 10.9 | 10.7 | 14.2 | 22.3 | 20.1 | 100.0 |
| 1962 | 1.9 | 2.2 | 2.4 | 4.3 | 10.1 | 11.1 | 10.0 | 13.4 | 22.7 | 21.9 | 100.0 |
| 1963 | 1.8 | 2.1 | 2.7 | 4.2 | 9.7 | 9.6 | 9.9 | 14.3 | 23.1 | 22.6 | 100.0 |
| 1964 | 1.7 | 2.1 | 2.6 | 3.8 | 8.9 | 10.0 | 10.3 | 14.7 | 20.5 | 25.4 | 100.0 |
| 1965 | 1.7 | 2.0 | 2.1 | 4.1 | 8.8 | 9.9 | 10.3 | 16.5 | 19.7 | 24.9 | 100.0 |
There has been a more or less steady growth in the average size of workers' unions, the trend being to a certain extent obscured at times by the cancellation of registration by some large unions. An average membership of 118 in 1901 increased in 1921 to 234, in 1941 to 551, and in 1958 to 801. The average membership of the 372 workers' unions registered in 1965 was 949.
The next table shows both numbers of workers' unions and their membership as at the end of each of the latest five years according to industrial groups. In the few cases where current membership figures are not known, the latest known figures are included.
| Industrial Group | 1961 | 1962 | 1963 | 1964 | 1965 | |||||
|---|---|---|---|---|---|---|---|---|---|---|
| Unions | Members | Unions | Members | Unions | Members | Unions | Members | Unions | Members | |
| Provision of— | ||||||||||
| Food and drink | 68 | 37,694 | 67 | 41,935 | 66 | 39,263 | 66 | 39,386 | 63 | 41,205 |
| Clothing, footwear, and textiles | 17 | 23,493 | 17 | 23,615 | 16 | 23,364 | 17 | 23,738 | 17 | 23,996 |
| Building and construction | 33 | 30,534 | 33 | 30,917 | 29 | 30,229 | 28 | 32,422 | 25 | 32,534 |
| Power, heat, and light | 5 | 669 | 5 | 656 | 3 | 563 | 3 | 594 | 3 | 576 |
| Transport by water and air | 49 | 13,725 | 49 | 13,761 | 48 | 13,796 | 48 | 13,806 | 49 | 14,197 |
| Transport by land | 21 | 35,905 | 21 | 37,380 | 21 | 36,793 | 21 | 36,249 | 21 | 36,991 |
| Accommodation, meals, and personal service | 24 | 29,223 | 24 | 28,130 | 23 | 29,071 | 23 | 29,312 | 23 | 29,451 |
| Working in or on— | ||||||||||
| Wood, wicker, seagrass, etc. | 17 | 15,234 | 17 | 14,374 | 17 | 14,165 | 17 | 14,432 | 17 | 15,362 |
| Metal | 22 | 34,180 | 22 | 41,555 | 22 | 43,957 | 22 | 45,216 | 21 | 47,972 |
| Stone, clay, glass, and chemicals | 22 | 4,186 | 19 | 3,561 | 19 | 3,264 | 19 | 3,888 | 19 | 4,384 |
| Paper, printing, etc. | 3 | 7,280 | 3 | 7,948 | 2 | 6,428 | 2 | 6,650 | 3 | 6,899 |
| Skin, leather, etc. | 8 | 1,406 | 8 | 1,220 | 8 | 1,305 | 8 | 1,464 | 7 | 1,429 |
| Mines and quarries | 14 | 1,553 | 14 | 1,264 | 13 | 1,231 | 13 | 1,175 | 12 | 1,143 |
| The land (farming pursuits) | 4 | 15,465 | 4 | 14,372 | 4 | 15,250 | 4 | 15,808 | 4 | 13,249 |
| Miscellaneous | 88 | 74,200 | 88 | 72,113 | 88 | 75,449 | 89 | 82,717 | 88 | 83,717 |
| Totals | 395 | 324,747 | 391 | 332,801 | 379 | 334,128 | 380 | 346,857 | 372 | 353,105 |
INDUSTRIAL ASSOCIATIONS—Associations of two or more unions in different districts in the same industry can be registered as an industrial association. At 31 December 1965 there were 17 industrial associations of employers and 39 of workers, the former having 138 affiliated unions and the latter 197. The following summary shows the number of industrial associations of employers and workers in each industrial group, with the number of affiliated unions in each case. In most cases the associations cover the entire country.
| Industrial Group | Employers | Workers | ||||||
|---|---|---|---|---|---|---|---|---|
| Associations | Affiliated Unions | Associations | Affiliated Unions | |||||
| 1964 | 1965 | 1964 | 1965 | 1964 | 1965 | 1964 | 1965 | |
| Provision of— | ||||||||
| Food, drink, etc. | 5 | 5 | 39 | 42 | 5 | 5 | 20 | 19 |
| Clothing, footwear, and textiles | - | - | - | - | 3 | 3 | 12 | 12 |
| Building and construction | 3 | 3 | 40 | 41 | 2 | 2 | 18 | 15 |
| Power, heat, and light | - | - | - | - | 1 | 1 | 2 | 2 |
| Transport by water and air | 1 | 1 | 11 | 11 | 5 | 5 | 35 | 33 |
| Transport by land | 1 | 1 | 4 | 4 | 1 | 1 | 12 | 12 |
| Accommodation, meals, and personal service | 2 | 2 | 20 | 20 | 3 | 3 | 17 | 17 |
| Working in or on— | ||||||||
| Wood, wicker, seagrass, etc. | 1 | 1 | 4 | 4 | 2 | 2 | 7 | 7 |
| Metal | - | - | - | - | 3 | 3 | 9 | 9 |
| Stone, clay, glass, chemicals, etc. | 1 | 1 | 3 | 3 | 2 | 2 | 7 | 6 |
| Paper, printing, etc. | 2 | 2 | 11 | 11 | - | - | - | - |
| Skin, leather, etc. | 1 | 1 | 2 | 2 | 1 | 1 | 3 | 3 |
| Mines and quarries | - | - | - | - | 2 | 2 | 5 | 5 |
| The land (farming pursuits) | - | - | - | - | 1 | 1 | 5 | 3 |
| Miscellaneous | - | - | - | - | 8 | 8 | 53 | 54 |
| Totals | 17 | 17 | 134 | 138 | 39 | 39 | 205 | 197 |
PROPORTION OF UNIONISTS—The following table, showing the proportion of workers belonging to unions registered under the Industrial Conciliation and Arbitration Act to the total number of wage earners in the country, is of interest as manifesting the movement in and the extent of unionism during the period under review. The figures for total wage earners are derived from census enumerations and include professional, business, and other classes in which unionism prior to the passing of the amending Act of 1936 did not exist, and agricultural and pastoral occupations where it was practically non-existent. In addition, females are included in both sets of figures, although the proportion of women unionised prior to 1936 was negligible.
| Census Year | Total Wage Earners | End of Year Nearest to Census Date | Numbers of Workers on Rolls of Registered Unions | Percentage of Wage Earners on Rolls of Registered Unions |
|---|---|---|---|---|
| * 1950 figure now includes the membership of five subsequently deregistered unions, totalling 8,554 members. | ||||
| 1901 (March) | 224,346 | 1,900 | 17,989 | 8 |
| 1906 (April) | 269,039 | 1,905 | 29,869 | 11 |
| 1911 (April) | 304,272 | 1,910 | 57,091 | 19 |
| 1916 (October) | 302,161 | 1,916 | 71,587 | 24 |
| 1921 (April) | 370,692 | 1,920 | 96,350 | 26 |
| 1926 (April) | 414,673 | 1,925 | 100,540 | 24 |
| 1936 (March) | 496,563 | 1,935 | 80,929 | 16 |
| 1945 (September) | 473,684 | 1,945 | 229,103 | 48 |
| 1951 (April) | 577,694 | 1,950 | 275,779* | 48 |
| 1956 (April) | 653,358 | 1,955 | 304,520 | 47 |
| 1961 (April) | 750,882 | 1,960 | 332,362 | 44 |
GENERAL—A system of industrial conciliation and arbitration peculiar to New Zealand has evolved from the first legislation on industrial relations passed in 1894. The system is based on: (a) the voluntary registration of industrial unions and industrial associations; (b) the regulation of conditions of employment by industrial agreements made between industrial unions or industrial associations of workers on the one hand and industrial unions or industrial associations of employers or individual employers on the other hand; (c) the reference of disputes to a Council of Conciliation convened by a Conciliation Commissioner; (d) in the event of failure of the parties to reach agreement in the conciliation proceedings the dispute is referred to the Court of Arbitration and after hearing the parties the Court makes an award. Action for breach of an award or industrial agreement may be taken by any of the parties thereto or an inspector of awards in a Magistrate's Court, or by an inspector in the Court of Arbitration. The system owes much of its strength to the success of Judges of the Court of Arbitration in maintaining the dignity of the office with a minimum of formality and in demonstrating a wide and practical grasp of economic and technical problems and human relationships.
INDUSTRIAL CONCILIATION AND ARBITRATION ACT—The Industrial Conciliation and Arbitration Act 1954 is the statute governing most industrial disputes as most unions of workers and employers in the private enterprise field are registered under that Act. The Registrar of Industrial Unions of the Department of Labour is responsible for registration of industrial unions, recording of rules, and other administrative functions. Inspectors of awards (who are the same persons as inspectors of factories) are charged with the duty of seeing that the provisions of awards and agreements are carried out.
The term "dispute'' is used in its widest sense and is intended to refer to the whole field of wage fixation and conditions of employment, as well as to the settlement of strikes and lockouts. New Zealand's approach to this problem is different from that adopted in most other countries in that it has preferred to follow a system of conciliation and compulsory arbitration, rather than to adopt the more normal system of collective bargaining with the unrestricted right to "strike'' or "lockout''. It is, however, incorrect to say that unions in New Zealand must submit to compulsory arbitration. I is entirely in their own hands to decide whether they wish to follow that method or to remain outside the scope of the Act, and to settle their disputes by mutual agreement or by collective bargaining under the procedure laid down in the Labour Disputes Investigation Act 1913.
The principal which has been written into the Act is that if unions elect to register under the Act they forfeit the right to strike and elect to have their differences settled by conciliation and arbitration. Most unions have seen fit to register under the Act and thereby have forfeited their right to strike.
Council of Conciliation—All industrial disputes must be referred to a Council of Conciliation before reference to the Court of Arbitration, The Conciliation Council consists of a conciliation commissioner, who is chairman, and not more than four assessors from each side. In the case of a dispute extending over two or more industrial districts, up to seven assessors from each side may be appointed. The proceedings are quite formal. It is the duty of the council to endeavour to bring about a settlement of the dispute between the parties. (The conciliation commissioner has no vote.)
An industrial union (or association of unions) of workers registered under the Act may cite a union or association of unions of employers, or an employer, or a number of employers, before a Council of Conciliation for the hearing of an industrial dispute before a Commissioner and assessors appointed from each side.
An industrial union (or association of unions) of employers registered under the Act, or an individual employer, or employers, may cite a union of workers in a similar manner. The workers may compel any of their employers to come under the Act, but the employers cannot compel their workers to come under it unless the latter have registered as an industrial union or association thereunder; registration is voluntary.
No industrial dispute shall be referred for settlement to a Council of Conciliation by an industrial union (or association of unions) unless the proposed reference has been approved by resolution by the committee of management of the union or of each of the unions concerned, as the case may be.
If a settlement of a dispute is arrived at by the parties in the course of an inquiry before a Council of Conciliation, the terms of the settlement may be set down as an industrial agreement. Every such agreement must be executed by the assessors representing the parties and by the conciliation commissioner, and when so signed it is binding on all the parties to the dispute. Any party to the dispute, however, may apply to the Court of Arbitration for either total or partial exemption within one month after the agreement has been filed with the Court: the Court is empowered to grant such applications wholly, partly, or conditionally, or to refuse them. Where the employers who are parties to an agreement employ the majority of workers in the industry to which it relates, the Court on the application of any party may make the agreement binding on all employers in the industry, whether parties or not.
In most instances the parties to a complete settlement in conciliation prefer an award, and in such cases the assessors apply in writing to the Court to have the terms of settlement embodied in an award. This may be done by the Court without a hearing.
If settlement cannot be arrived at by the Conciliation Council, the dispute is referred to the Court. The Council may at the same time submit a recommendation for the settlement of the dispute, in which case all the parties are notified of the recommendation. If no party disagrees with the recommendation within one month, the recommendation operates as if it were an industrial agreement.
If no settlement is reached by the Conciliation Council and (a) no recommendation for settlement is made, or (b) a recommendation for settlement is made but any party to the dispute signifies his objection to it, then the dispute is referred to the Court for settlement by the making of an award.
A more common form of industrial agreement, however, is one reached by the parties without pursuing the formal Conciliation Council procedures described above. Such an agreement may be filed with the Clerk of Awards and thereupon becomes binding on the parties and every member of any union or association which is a party.
Making an Award—If a dispute comes before the Court of Arbitration, argument is heard upon the matters in debate, and the Court then makes its award, which becomes binding upon the employers specified in the award and also upon other employers who, when the award comes into force and at any time while it is in force, are engaged in the industry in the locality to which the award applies. In addition, it is binding upon all persons working for such employers. In all cases where an industrial agreement or accepted recommendation or award is filed, it becomes binding on all parties. When an award or industrial agreement has been filed, a strike or lockout becomes unlawful. Unless the parties otherwise agree, rates of wages specified in an award shall have effect from two months after the date first appointed for the hearing by the Conciliation Council, or where two or more districts are affected, four months after this date, or as from the date of the making of the award, whichever is the earlier, or as from such other date as the Court in its discretion thinks fit after taking into consideration all relevant matters.
Disputes Committees—Any award or industrial agreement may include provisions to the effect that any party to a dispute on a matter arising out of the award or agreement but not specifically dealt with therein may require the appointment of a local disputes committee, which will have power to decide the dispute or to refer it to a conciliation commissioner. The latter in his discretion can refer the dispute either to a national disputes committee, which may be appointed where any award relates to two or more industrial districts or parts thereof, or to the Court of Arbitration. Appeals against the decisions of the disputes committees may be made to the Court of Arbitration.
Hospital Board Employees—Where a majority of the workers affected by any industrial dispute under the principal Act are hospital board employees, the Director-General of Health is to be a party to the dispute and is to recommend assessors for the employers in the conciliation proceedings. Other sections provide that an award is not to be made affecting hospital employees covered by regulations unless a majority votes in favour of an award, and for the concurrence of the Minister of Health with industrial agreements in similar circumstances.
Definition of a Strike—A strike means the act of any number of workers who are or have been in the employment of the same or of different employers:
In discontinuing that employment, whether wholly or partially; or
In breaking their contracts of service; or
In refusing or failing after any such discontinuance to resume or return to their employment; or
In refusing or failing after any such discontinuance to resume or return to their employed; or
In reducing their normal output or their normal rate of work—
the act being due to any combination, agreement, common understanding, or concerted action, whether expressed or implied, made or entered into by any workers;
With intent to compel or induce any such employer to agree to terms of employment or comply with any demands made by the said or any other workers; or
With intent to cause loss or inconvenience to any such employer in the conduct of his business; or
With intent, to incite, aid, abet, instigate, or procure any other strike; or
With intent to assist workers in the employment of any other employer to compel or induce that employer to agree to terms of employment or comply with any demands upon him by any workers.
An industrial dispute is a strike if it comes within the definition of a strike which is quoted above.
Definition of a Lockout—A lockout means the act of an employer:
In closing his place of business, or suspending or discontinuing his business in any branch thereof; or
In discontinuing the employment of any workers, whether wholly or partially; or
In breaking his contracts of service; or
In refusing or failing to engage workers for any work for which he usually employs workers—with intent;
To compel or induce any workers to agree to terms of employment or comply with any demands made upon them by the said or any other employer; or
To cause loss or inconvenience to the workers employed by him or to any of them; or
To incite, aid, abet, instigate, or procure any other lockout; or
To assist any other employer to compel or induce any workers to agree to terms of employment or comply with any demands made by him.
Strikes and Lockouts Illegal—A strike is an unlawful act if either:
The union or the workers taking part in it are for the time being bound by an award or industrial agreement under the Industrial Conciliation and Arbitration Act 1954, or by a duly filed agreement under the Labour Disputes Investigation Act 1913, or by any principal order under the Waterfront Industry Act 1953; or
In the case of a dispute relating to conditions of employment between a society of workers to which the Labour Disputes Investigation Act 1913 applies, but who are not bound by any duly filed agreement under the Act, they have failed to give notice of the dispute to the Minister of Labour as required by section 4 of that Act, or if the strike occurs before the expiration of seven days after the publication of the result of a secret ballot of the workers directly concerned, taken in pursuance of the Act.
Further, a strike which would not be unlawful for any of these reasons may be or become unlawful by the operation of regulations to that effect made under the Public Safety Conservation Act 1932, during a state of emergency declared by proclamation of the Governor-General in accordance with the provisions of that Act.
A lockout is an unlawful act:
If the employer or employees party to it are bound for the time being by an award or industrial agreement under the Industrial Conciliation and Arbitration Act 1954, or by a duly filed agreement under the Labour Disputes Investigation Act 1913, or by a principal order under the Waterfront Industry Act 1953; or
In the circumstances set out in sections 13 and 14 of the Labour Disputes Investigation Act 1913.
Under the terms of the Industrial Conciliation and Arbitration Act 1954 (section 191) no strike or lockout may take place until the question has been submitted to a secret ballot of those members of a union (whether a union of workers or employers) who would become parties to the strike or lockout, as the case may be. The secret ballot must be held in the manner laid down by the Act. If a strike or lockout takes place without a secret ballot being held, the Registrar of Industrial Unions may conduct a secret ballot on the question of whether the strike or lockout shall continue. The taking of a secret ballot does not make a strike or lockout lawful, or avoid the penalties imposed in connection with illegal strikes or lockouts.
Penalties—Maximum penalties and fines for being a party to or inciting, instigating, or aiding an unlawful strike or lockout are also provided for—namely, (a) for a worker, $100 or (in the case of certain essential industries), $150 (b) for a union official, $500 or $700; (c) for a union or association or employer, $1,000 or $1,500. The maximum penalty for impeding or interfering with a secret ballot on the question of a strike or lockout is imprisonment for 12 months or a fine of $200, or both.
If any industrial union of workers or employers instigates a strike or lockout without first taking a secret ballot, the penalties are increased. The penalty in such a case is a fine not exceeding $200 for every member of the union taking part in a strike, and for every official of the union a fine of $1,000 unless he proves that he had no means of knowing the imminence of the strike or that he took every step possible to ensure compliance with the provision and to prevent the strike. Corresponding maximum penalties in respect of a lockout are $2,000 for a member of the union and $1,000 for an official.
Section 196 of the Act provides special penalties in certain circumstances for strikes in specified essential industries.
Action to enforce the penalty provisions in relation to strikes and lockouts may be taken by an inspector of awards, or by any industrial association or industrial union which is party to the award or agreement. It may be noted that the penalty provisions of the Act are seldom invoked since it is considered that Court actions of this kind will rarely achieve the desired objectives of the Act in restoring working relationships and promoting industrial harmony.
Under Port Bureau Rules, waterside workers can be placed on penalty (suspension) for unauthorised stoppages of work.
The Minister of Labour is empowered, if he is satisfied that any discontinuance of employment brought about wholly or partly by any industrial union of employers or of workers has caused, or is likely to cause, serious loss or inconvenience, to cancel the registration of the union concerned or to cancel any award or industrial agreement so far as this relates to it.
LABOUR DISPUTES INVESTIGATION ACT—All workers and societies of workers not bound by an award or industrial agreement under the Industrial Conciliation and Arbitration Act are bound by the Labour Disputes Investigation Act 1913.
Under this Act, if a dispute concerning wages or other conditions of employment arises between a society (or societies) of workers, whether registered or not, that is not bound by any award or industrial agreement and its employers, the society must, before it may strike, give to the Minister of Labour formal notice of the dispute, setting forth the names of the parties to the dispute and the claims made by the society. The Minister then refers the dispute to a conciliation commissioner to call a conference, or to a labour disputes committee for investigation and recommendation. Such a committee consists of from one to three members chosen from each side, with an independent chairman. In the event of no settlement being arrived at, a secret ballot is taken by the Registrar of Industrial Unions among the members of the society as to whether, in the case of no recommendation having been made, a strike should eventuate; or, in the case of a recommendation having been made, as to whether the recommendation should be adopted. Seven days' notice must be given to the employers should a strike be decided upon.
Similar provisions apply with reference to the filing of a dispute and to a lockout by the employers.
In the event of an agreement being arrived at, it may be filed with the Clerk of Awards. It is then enforceable in the same manner as an industrial agreement under the Industrial Conciliation and Arbitration Act.
By this Act the principal of settlement of industrial disputes by conciliation and arbitration is extended to workers outside the scope of the Court of Arbitration, so that definite restrictions on the right to strike or to lockout exist over the whole field of industry in New Zealand. The powers under this Act, are not, of course, as far reaching as those under the Industrial Conciliation and Arbitration Act, its main object being that workers or employers should take time for consideration of the points at issue and not precipitate themselves into industrial strife.
As most types of employment are covered by awards or industrial agreements under the Industrial Conciliation and Arbitration Act, only a few agreements are filed each year under the Labour Disputes Investigation Act. There were 34 such agreements in force at 31 March 1966.
INDUSTRIAL RELATIONS ACT 1949—This measure contains a section enabling a conciliation commissioner or a person nominated by the Minister to call a compulsory conference of parties or appoint a committee of inquiry where there is reason to believe that a matter not provided for in the award or industrial agreement governing the industry is causing or is likely to cause industrial unrest.
Further, if in any matters causing or likely to cause partial or total stoppage of work the normal means of reaching a settlement of the dispute have failed to do so, the Minister of Labour may either call a compulsory conference of the parties to the dispute in order to endeavour to effect a settlement, or appoint a committee of inquiry into the matters of the dispute or any particular aspect of it.
STATISTICS OF INDUSTRIAL STOPPAGES—In the tables which follow only those disputes are included which resulted in a strike, penalty, or lockout, or where organised "go slow'' or other passive-resistance methods were clearly manifested. Many disputes are, of course, settled without recourse to such measures; these are not recorded for statistical purposes. To avoid confusion with the term "dispute'' as used in the Industrial Conciliation and Arbitration Act, these statistics have been called "industrial stoppages''. No distinction is drawn between the lawful and unlawful stoppages. A time series on industrial stoppages is included in the Statistical Summary near the end of this Yearbook.
The figures for stoppages include details of stopwork meetings unless, as on the waterfront, provision is made for these in the relevant award or agreement. In all cases unauthorised stopwork meetings are included, also unauthorised delays in resuming work after recognised stopwork meetings. A single stoppage may include or may consist of one stopwork meeting or several stopwork meetings; if several such meetings are included, these may be held at different times or at different places, provided all relate to the same issue. This class of stoppage has assumed considerable importance recently, the number of such cases in the five years 1962-66 being 87 (106 stopwork meetings) involving 22,284 workers, and the loss of 17,331 working days and of $112,784 in wages.
In the table shown later, recording methods of settlement, all such interruptions of labour, including periods of deliberate absence from work by way of protest against an alleged injustice, are classified under the heading "voluntary return to work''. In 1962, these cases comprised 16 out of 96 stoppages; in 1963, 7 out of 60; in 1964, 21 out of 93; in 1965, 27 out of 105; and in 1966, 59 out of 145.
The following table shows figures of incidence rates of stoppages for the last 16 years.
| Year | Number of Wage and Salary Earners* | Workers Involved as Percentage of Wage and Salary Earners | Working Days Lost per 1,000 of Wage and Salary Earners |
|---|---|---|---|
* October estimates. † There was a prolonged waterfront strike lasting from 9 February to 17 July 1951. | |||
| (000) | |||
| 1951 | 583.2 | 6.32 | 1,984.55† |
| 1952 | 592.2 | 2.75 | 47.49 |
| 1953 | 609.4 | 3.64 | 31.66 |
| 1954 | 623.6 | 2.59 | 32.83 |
| 1955 | 639.6 | 3.16 | 81.37 |
| 1956 | 652.9 | 2.08 | 36.56 |
| 1957 | 670.2 | 2.32 | 42.06 |
| 1958 | 693.0 | 1.98 | 27.11 |
| 1959 | 699.4 | 2.68 | 42.39 |
| 1960 | 725.9 | 1.97 | 49.16 |
| 1961 | 753.0 | 2.21 | 50.71 |
| 1962 | 766.7 | 5.21 | 121.50 |
| 1963 | 793.9 | 1.88 | 68.64 |
| 1964 | 821.5 | 4.16 | 80.19 |
| 1965 | 855.5 | 1.78 | 25.50 |
| 1966 | 885.0 | 3.74 | 111.97 |
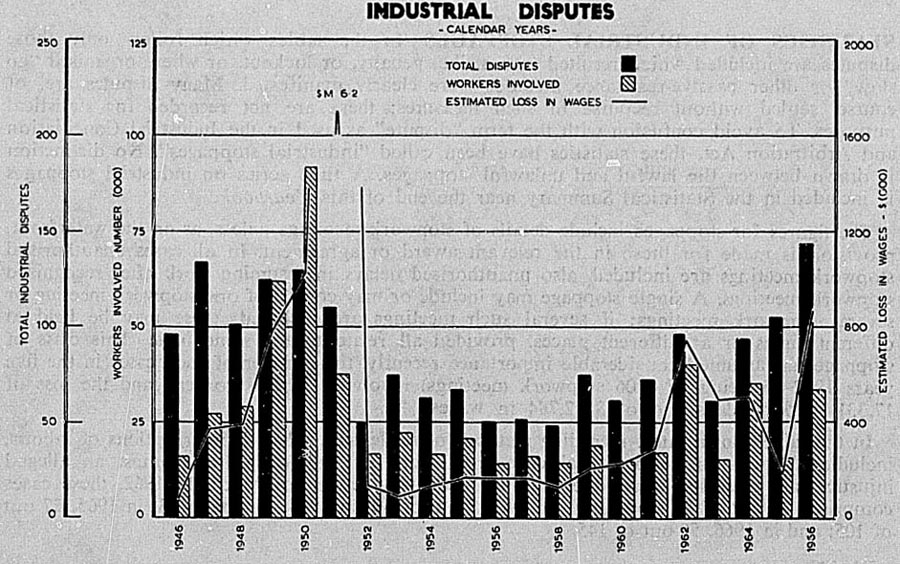
Nature and Duration—The next table shows the nature of the stoppages and the number of workers involved during the last 11 years.
| Year | Nature of Stoppage | Number of Workers Involved | ||||||||
|---|---|---|---|---|---|---|---|---|---|---|
| Direct Strike | Sympathetic Strike | Partial Strike* | Penalty† | Total | Direct Strike | Sympathetic Strike | Partial Strike* | Penalty† | Total | |
* i.e., where no actual cessation of work, but a "go slow'' or other policy of protest adopted. † During 1964 four waterfront stoppages resulted in the imposition of four penalties, two of two days, one of three days, and one of five days under Port Bureau Rules and the loss of some 6,520 working days and $67,924 in wages. In 1966 four waterfront stoppages resulted in the imposition of four penalties, one of one day, two of two days, and one of three days under Port Bureau Rules. These resulted in the loss of some 684 working days and $7,330 in wages. These figures are included in the statistics. ‡ Two lockouts involving 572 workers are included. | ||||||||||
| 1956 | 50 | - | - | - | 50 | 13,579 | - | - | - | 13,579 |
| 1957 | 51 | - | - | - | 51 | 15,545 | - | - | - | 15,545 |
| 1958 | 49 | - | - | - | 49 | 13,709 | - | - | - | 13,709 |
| 1959 | 71 | 2 | - | - | 73 | 16,176 | 2,586 | - | - | 18,762 |
| 1960 | 56 | 4 | - | - | 60 | 13,923 | 382 | - | - | 14,305 |
| 1961 | 66 | - | 5 | - | 71 | 13,112 | - | 3,514 | - | 16,626 |
| 1962 | 90 | 4 | 2 | - | 96 | 34,248 | 2,606 | 3,067 | - | 39,921 |
| 1963 | 58 | 1 | 1 | - | 60 | 11,827 | 3,050 | 34 | - | 14,911 |
| 1964 | 89 | - | - | 4 | 93 | 30,196 | - | - | 4,583 | 34,779 |
| 1965 | 97 | 2 | 4 | - | 105‡ | 13,312 | 726 | 657 | - | 15,267‡ |
| 1966 | 137 | 3 | 1 | 4 | 145 | 31,906 | 725 | 9 | 492 | 33,132 |
The table following illustrates the duration of stoppages during 1966.
| Duration | Number of Stoppages | Number of Firms Affected | Number of Workers Involved | Number of Working Days Lost | Estimated Loss in Wages |
|---|---|---|---|---|---|
* Road transport and electrical industry stoppages affected a large number of firms, the total for which has been excluded as numbers are not available, apart from one firm which was affected by a road transport stoppage in the first quarter. | |||||
| £ | |||||
| 1 day and less | 74 | 62 | 17,473 | 9,864 | 93,238 |
| Over 1 day but not over 2 days | 19 | 16 | 3,392 | 4,795 | 35,816 |
| Over 2 days but not over 3 days | 12 | 10 | 2,658 | 6,825 | 34,620 |
| Over 3 days but less than 1 week | 18 | 26 | 2,853 | 8,331 | 74,190 |
| 1 week but less than 2 weeks | 14 | 24 | 3,773 | 24,787 | 255,578 |
| 2 weeks but less than 4 weeks | 7 | 12 | 2,888 | 41,833 | 357,110 |
| 4 weeks but less than 8 weeks | 1 | 1 | 95 | 2,660 | 27,640 |
| 8 weeks and over | - | - | - | - | - |
| Totals | 145 | 151* | 33,132 | 99,095 | 878,192 |
Geographical Distribution—The following table shows the number of stoppages in each industrial district for the years 1962 to 1966 and also the number of workers involved. In 1966 the Northern District had the largest number of stoppages and also the largest number of workers involved, these workers being mainly employed in the meat freezing, road transport, waterfront, building and construction, and pulp and paper industries.
| Year | Northern | Taranaki | Wellington | Marlborough | Nelson | Westland | Canterbury | Otago and Southland | Total |
|---|---|---|---|---|---|---|---|---|---|
| Number of Stoppages | |||||||||
| 1962 | 35 | 3 | 20 | - | - | 4 | 14 | 20 | 96 |
| 1963 | 29 | 3 | 4 | - | - | 11 | 9 | 4 | 60 |
| 1964 | 27 | 3 | 19 | - | - | 5 | 14 | 25 | 93 |
| 1965 | 37 | 4 | 20 | - | - | 5 | 15 | 24 | 105 |
| 1966 | 59 | 3 | 21 | - | - | 5 | 25 | 32 | 145 |
| Number of Workers Involve | |||||||||
| 1962 | 12,997 | 617 | 7,935 | 309 | 80 | 1,736 | 8,149 | 8,098 | 39,921 |
| 1963 | 4,004 | 753 | 526 | - | - | 2,456 | 2,597 | 4,575 | 14,911 |
| 1964 | 5,424 | 364 | 17,190 | - | - | 1,613 | 3,518 | 6,670 | 34,779 |
| 1965 | 4,994 | 357 | 2,198 | - | - | 1,049 | 1,734 | 4,935 | 15,267 |
| 1966 | 14,961 | 657 | 5,687 | - | - | 823 | 5,485 | 5,510 | 33,132 |
A stoppage extending into more than one industrial district is allocated to that district which includes the greatest number of the workers involved. The actual (or occasionally estimated) numbers of workers in the several districts are, however, correctly distributed.
Industrial Distribution—In the following table industrial stoppages are classified according to the industrial groups in which they took place, this grouping being similar to that used in the compilation of wage and industrial-union statistics.
| Industrial Group | 1962 | 1963 | 1964 | 1965 | 1966 | Totals 1962 to 1966 |
|---|---|---|---|---|---|---|
| Number of Stoppages | ||||||
| Provision of— | ||||||
| Food, drink, etc. | 43 | 19 | 32 | 34 | 28 | 156 |
| Clothing, footwear, and textiles | 1 | 1 | 4 | 5 | 2 | 13 |
| Building and construction | 17 | 13 | 16 | 16 | 24 | 86 |
| Power, heat, and light | - | - | 1 | - | 1 | 2 |
| Transport by water and air | 4 | 4 | 17 | 6 | 26 | 57 |
| Transport by land | 2 | - | 1 | 19 | 34 | 56 |
| Accommodation, meals, and personal service | 1 | - | 4 | - | 2 | 7 |
| Working in or on— | ||||||
| Wood, etc. | 1 | 1 | - | 2 | - | 4 |
| Metal | 10 | 6 | 4 | 8 | 5 | 33 |
| Stone, clay, glass, chemicals, etc. | 12 | 5 | 9 | 7 | 12 | 45 |
| Paper, printing, etc. | - | - | - | 3 | 7 | 10 |
| Skin, leather, etc. | 1 | - | - | - | - | 1 |
| Mines and quarries— | ||||||
| Coal mines | 4 | 11 | 5 | 5 | 4 | 29 |
| Miscellaneous | - | - | - | - | - | - |
| Totals | 96 | 60 | 93 | 105 | 145 | 499 |
| Number of Workers Involved | ||||||
| Provision of— | ||||||
| Food, drink, etc. | 17,002 | 8,061 | 9,582 | 6,986 | 10,475 | 52,106 |
| Clothing, footwear, and textiles | 4 | 62 | 288 | 772 | 92 | 1,218 |
| Building and construction | 2,047 | 442 | 1,359 | 1,191 | 3,728 | 8,767 |
| Power, heat, and light | - | - | 36 | - | 800 | 836 |
| Transport by water and air | 1,925 | 2,684 | 15,165 | 1,003 | 5,594 | 26,371 |
| Transport by land | 15,765 | - | 5,631 | 3,041 | 7,493 | 31,930 |
| Accommodation, meals, and personal service | 40 | - | 249 | - | 21 | 310 |
| Working in or on— | ||||||
| Wood, etc. | 21 | 327 | - | 29 | - | 377 |
| Metal | 1,018 | 377 | 127 | 569 | 356 | 2,447 |
| Stone, clay, glass, chemicals, etc. | 1,065 | 502 | 729 | 162 | 662 | 3,120 |
| Paper, printing, etc. | - | - | - | 465 | 3,103 | 3,568 |
| Skin, leather, etc. | 69 | - | - | - | - | 69 |
| Mines and quarries— | ||||||
| Coal mines | 965 | 2,456 | 1,613 | 1,049 | 808 | 6,891 |
| Miscellaneous | - | - | - | - | - | - |
| Totals | 39,921 | 14,911 | 34,779 | 15,267 | 33,132 | 138,010 |
A more detailed analysis of stoppages occurring during 1966 is given below.
| Industrial Group | Number of Stoppages | Number of Firms Affected | Number of Workers Involved | Number of Working Days Lost | Estimated Loss in Wages | ||
|---|---|---|---|---|---|---|---|
| Directly | Indirectly | Total | |||||
* Road transport and electrical industry stoppages affected a large number of firms, the total for which have been excluded as numbers are not available, apart from the firm which was affected by a road transport stoppage in the first quarter. | |||||||
| $ | |||||||
| Provision of— | |||||||
| Food, drink, etc. | 28 | 28 | 8,027 | 2,448 | 10,475 | 23,545 | 174,200 |
| Clothing, footwear, and textiles | 2 | 2 | 92 | - | 92 | 503 | 2,000 |
| Building and construction | 24 | 24 | 3,728 | - | 3,728 | 11,481 | 130,326 |
| Power, heat, and light | 1 | -* | 800 | - | 800 | 400 | 3,520 |
| Transport by water and air | 26 | 64 | 5,594 | - | 5,594 | 18,834 | 206,748 |
| Transport by land | 34 | 1* | 7,493 | - | 7,493 | 4,098 | 27,318 |
| Accommodation, meals, and personal service | 2 | 2 | 21 | - | 21 | 41 | 178 |
| Working in or on— | |||||||
| Wood, etc. | - | - | - | - | - | - | - |
| Metal | 5 | 6 | 356 | - | 356 | 342 | 3,188 |
| Stone, clay, glass, chemicals etc. | 12 | 12 | 605 | 57 | 662 | 984 | 6,708 |
| Paper, printing, etc. | 7 | 8 | 1,976 | 1,127 | 3,103 | 37,804 | 314,246 |
| Skin, leather, etc. | - | - | - | - | - | - | - |
| Mines and quarries— | |||||||
| Coal mines | 4 | 4 | 808 | - | 808 | 1,063 | 9,760 |
| Miscellaneous | - | - | - | - | - | - | - |
| Totals | 145 | 151* | 29,500 | 3,632 | 33,132 | 99,095 | 878,192 |
Causes—In the next table the causes of stoppages are shown. Under the heading "Wages'' are included stoppages concerning wages, overtime, or rates for piecework.
Stoppages concerning the employment or dismissal of certain classes of persons are included under the heading "Employment''. Stoppages on the subject of employment usually concern the dismissal of a worker on allegedly insufficient grounds.
"Other working conditions'' are of diverse nature, and include such causes as the following: distribution of work in coal mines and on wharves, conveyance to and from work, atmospheric conditions in coal mines, accommodation on ships, numbers of men to be allocated to certain duties, supply of food, and the method of handling cargo.
Under the heading "Sympathy'' are included all stoppages caused by workers striking not on account of a grievance arising out of their own wages or conditions, but in sympathy with the demands of other workers.
| Cause | 1962 | 1963 | 1964 | 1965 | 1966 |
|---|---|---|---|---|---|
| Number of Stoppages | |||||
| Wages | 31 | 20 | 24 | 37 | 48 |
| Hours | - | - | 1 | 3 | - |
| Employment | 30 | 18 | 19 | 20 | 29 |
| Other working conditions | 14 | 9 | 39 | 33 | 31 |
| Sympathy | 5 | 2 | 1 | 2 | 7 |
| Other causes | 16 | 11 | 9 | 10 | 30 |
| Totals | 96 | 60 | 93 | 105 | 145 |
| Number of Workers Involved | |||||
| Wages | 18,477 | 2,501 | 7,841 | 3,516 | 6,213 |
| Hours | - | - | 124 | 320 | - |
| Employment | 6,626 | 3,595 | 6,804 | 1,940 | 6,616 |
| Other working conditions | 4,432 | 2,370 | 14,698 | 7,513 | 11,175 |
| Sympathy | 5,668 | 3,081 | 250 | 597 | 1,092 |
| Other causes | 4,718 | 3,364 | 5,062 | 1,381 | 8,036 |
| Totals | 39,921 | 14,911 | 34,779 | 15,267 | 33,132 |
Methods of Settlement—Following is a table showing the methods of settlement of disputes causing stoppages. Negotiations supposedly under the Industrial Conciliation and Arbitration Act and the Labour Disputes Investigation Act are treated as "Intervention of third party''. "Voluntary return to work'' includes such cases as "Protest'' absence and stopwork meetings.
| Method of Settlement | 1962 | 1963 | 1964 | 1965 | 1966 |
|---|---|---|---|---|---|
| Number of Stoppages | |||||
| Private negotiations between parties | 44 | 36 | 48 | 35 | 52 |
| Intervention of third party | 32 | 17 | 23 | 38 | 32 |
| Voluntary return to work | 16 | 7 | 21 | 27 | 59 |
| Other | 4 | - | 1 | 5 | 2 |
| Totals | 96 | 60 | 93 | 105 | 145 |
| Number of Workers Involved | |||||
| Private negotiations between parties | 9,595 | 6,114 | 7,941 | 3,080 | 9,022 |
| Intervention of third party | 6,457 | 6,904 | 9,094 | 6,064 | 7,275 |
| Voluntary return to work | 20,716 | 1,893 | 17,598 | 5,434 | 16,518 |
| Other | 3,153 | - | 146 | 689 | 317 |
| Totals | 39,921 | 14,911 | 34,779 | 15,267 | 33,132 |
Further information for the year 1966 is given in the next table.
| Method of Settlement | Number of Stoppages | Number of Firms Affected | Number of Workers Involved | Number of Working Days Lost | Estimated Loss in Wages |
|---|---|---|---|---|---|
* Road transport and electrical industry stoppages affected a large number of firms the total for which has been excluded as numbers are not available, apart from one firm which was affected by a road transport stoppage in the first quarter. | |||||
| £ | |||||
| Private negotiations between parties | 52 | 50 | 9,022 | 24,137 | 179,396 |
| Intervention of third party | 32 | 55 | 7,275 | 64,275 | 605,740 |
| Voluntary return to work | 59 | 44 | 16,518 | 10,184 | 89,312 |
| Other | 2 | 2 | 317 | 499 | 3,744 |
| Totals | 145 | 151* | 33,132 | 99,095 | 878,192 |
RESULTS—In compiling the table which follows no stoppage has been included as ending in favour of either employers or workers unless the result has been beyond question. In cases where workers have made more than one demand, succeeding in one or more and failing in one or more, or where they have made one or more demands and in respect of each have been partially successful only, the result has been treated as a compromise. Where strikers have returned to work without any definite decision being arrived at regarding the demands made, or where (as in the case of a sympathetic strike) no definite demand has been made, or where a strike is merely by way of a protest, the result has been recorded as indeterminate.
| Result | 1962 | 1963 | 1964 | 1965 | 1966 |
|---|---|---|---|---|---|
| Number of Stoppages | |||||
| In favour of workers | 9 | 12 | 14 | 22 | 19 |
| In favour of employers | 18 | 8 | 6 | 5 | 13 |
| Compromise | 31 | 20 | 27 | 30 | 27 |
| Indeterminate | 38 | 20 | 46 | 48 | 86 |
| Totals | 96 | 60 | 93 | 105 | 145 |
| Number of Workers Involved | |||||
| In favour of workers | 1,511 | 1,935 | 1,621 | 2,327 | 3,472 |
| In favour of employers | 3,354 | 1,537 | 1,759 | 523 | 2,695 |
| Compromise | 7,935 | 4,840 | 5,502 | 3,563 | 7,503 |
| Indeterminate | 27,121 | 6,599 | 25,897 | 8,854 | 19,462 |
| Totals | 39,921 | 14,911 | 34,779 | 15,267 | 33,132 |
| Number of Working Days Lost In favour of workers | 2,005 | 3,269 | 4,798 | 2,718 | 28,814 |
| In favour of employers | 6,498 | 10,032 | 2,133 3/4 | 1,810 | 3,559 |
| Compromise | 34,794 | 12,972 | 15,715 | 5,992 | 39,133 |
| Indeterminate | 49,860 | 28,217 | 44,187 1/4 | 11,294 | 27,589 |
| Totals | 93,157 | 54,490 | 66,834 | 21,814 | 99,095 |
Of stoppages ending definitely in favour of one party or the other during the five years 1962 to 1966 workers succeeded in 76 instances and employers in 50. In the previous five years (1957 to 1961) workers were successful in 54 instances and employers in 43.
CAUSES AND RESULTS—In the following table the causes and results of stoppages occurring during 1966 are shown in conjunction.
| Result | Cause | ||||||
|---|---|---|---|---|---|---|---|
| Wages | Hours | Employment | Other Working Conditions | Sympathy | Other | Total | |
* Road transport and electrical industry stoppages affected a large number of firms, the total for which has been excluded as numbers are not available, apart from one firm which was affected by a road transport stoppage in the first quarter. | |||||||
| Number of Stoppages | |||||||
| In favour of workers | 5 | - | 8 | 4 | 1 | 1 | 19 |
| In favour of employers | 4 | - | 2 | 7 | - | - | 13 |
| Compromise | 10 | - | 6 | 8 | - | 3 | 27 |
| Indeterminate | 29 | - | 13 | 12 | 6 | 26 | 86 |
| Totals | 48 | - | 29 | 31 | 7 | 30 | 145 |
| Number of Firms Affected | |||||||
| In favour of workers | 6 | - | 8 | 8 | 1 | 1 | 24 |
| In favour of employers | 3 | - | 2 | 7 | - | - | 12 |
| Compromise | 9 | - | 5 | 33 | - | 3 | 50 |
| Indeterminate | 20 | - | 16 | 17 | 6 | 6 | 65 |
| Totals | 38 | - | 31 | 65 | 7 | 10 | 151* |
| Number of Workers Involved | |||||||
| In favour of workers | 295 | - | 2,624 | 242 | 215 | 96 | 3,472 |
| In favour of employers | 940 | - | 231 | 1,524 | - | - | 2,695 |
| Compromise | 1,065 | - | 2,090 | 4,268 | - | 80 | 7,503 |
| Indeterminate | 3,913 | - | 1,671 | 5,141 | 877 | 7,860 | 19,462 |
| Totals | 6,213 | - | 6,616 | 11,175 | 1,092 | 8,036 | 33,132 |
| Number of Days Lost | |||||||
| In favour of workers | 2,600 | - | 24,044 | 388 | 1,398 | 384 | 28,814 |
| In favour of employers | 893 | - | 104 | 2,562 | - | - | 3,559 |
| Compromise | 2,466 | - | 16,717 | 19,735 | - | 215 | 39,133 |
| Indeterminate | 7,209 | - | 2,450 | 7,038 | 3,320 | 7,572 | 27,589 |
| Totals | 13,168 | - | 43,315 | 29,723 | 4,718 | 8,171 | 99,095 |
| Estimated Loss in Wages | |||||||
| $ | $ | $ | $ | $ | $ | $ | |
| In favour of workers | 29,308 | - | 147,894 | 3,632 | 12,900 | 3,890 | 197,624 |
| In favour of employers | 7,352 | - | 918 | 22,006 | - | - | 30,276 |
| Compromise | 22,722 | - | 183,362 | 196,786 | - | 1,476 | 404,346 |
| Indeterminate | 67,982 | - | 24,498 | 34,800 | 32,792 | 85,874 | 245,946 |
| Totals | 127,364 | - | 356,672 | 257,224 | 45,692 | 91,240 | 878,192 |
Table of Contents
GENERAL—Workers' compensation laws have existed in New Zealand for many years, the first Workers' Compensation Act being passed in 1900, and they compare most favourably with those of other countries. In recent years they have been improved to give greater recompense for injury to workers. The present legislation is the Workers' Compensation Act 1956 and regulations made thereunder. All workers are entitled to workers' compensation benefits. Since 1943 it has been compulsory for employers to insure against claims under the Act by their employees. The employer who, through his neglect, is not covered by an insurance company is deemed to be insured by the Workers' Compensation Board. Thus the automatic cover for all workers is preserved, but action may be taken against an employer for failing to insure, and the Workers' Compensation Board can recover from the employer all the compensation paid by the Board to injured workers. A worker who is the wife or husband of his or her employer is not a worker for the purposes of the Act, but voluntary insurance cover by employers may bring such a person within the provisions of the Act.
The worker is entitled to compensation from his employer where he suffers personal injury by accident arising out of and in the course of the employment, and this is so whether or not the employment is for the purposes of any trade or business carried on by the employer and whether or not the employment is of a casual nature. Even if the worker is working under an illegal contract of service at the time of an accident arising out of and in the course of employment, he is entitled to compensation if the illegality consists in evasion of a statutory minimum age provision, or if the Judge, Magistrate, or other person dealing with the matter decides, having regard to all the circumstances, to treat the contract as valid. No compensation is payable in respect of any accident which is attributable to the serious and wilful misconduct of the worker injured, unless the injury results in death or serious or permanent disablement. No compensation is payable in respect of the death of a worker following on, or incapacity resulting from or aggravated by, unreasonable refusal to submit to medical or surgical treatment. Certain accidents are deemed to arise out of and in the course of employment, provided that in each case the accident is of a type that would entitle the worker to compensation had it happened at his work place, namely:
Accidents to apprentices attending compulsory classes at technical schools.
Accidents to workers acting in breach of any Act, regulations, or orders affecting their employment or acting without instructions from the employer (provided that the worker would have been entitled to compensation had there been no breach of Act, etc.).
Accidents to workers travelling to or from work by transport provided by the employer primarily for conveyance of the workers, authorised by him, or arranged with the workers or their union, the employer meeting the whole or part of the cost.
Accidents to workers during meal or rest times, happening on premises occupied by the employer, on premises to which the workers have by virtue of their employment the right of access, or on premises where the workers are entitled to be by authorisation of the employer.
Accidents to workers travelling between their place of employment and premises to which they have by virtue of their employment the right of access.
Accidents to waterside workers awaiting engagement in accordance with the prescribed conditions of employment.
Diseases are deemed to be personal injuries by accident if they are due to the nature of any employment in which the worker was employed during a prescribed period before the date of commencement of the incapacity. In the case of diseases due to exposure to radioactivity the prescribed period is 20 years, and two years in all other cases. If the worker contracts any disease in respect of which he would be entitled to a miner's benefit under the Social Security Act he is not entitled to receive any compensation under the Workers' Compensation Act while receiving such benefit Nor can a benefit be paid for any period during which the worker is receiving compensation, and no lump-sum compensation is to be paid for any incapacity caused by such diseases.
In assessing compensation, no account is taken of any money accruing to the claimant under any insurance policy, nor, in the case of a partial dependant of a deceased worker, of any gain to the estate or the dependant, nor of any money payable by or to a friendly society or other organisation.
The Act generally applies only to accidents happening in New Zealand, but also applies to accidents on New Zealand ships and aircraft and to accidents to seamen or airmen employed in New Zealand ships or aircraft.
RATES OF COMPENSATION—All the maximum rates of compensation, whether for weekly payments or the various allowances, such as dependants' allowances and medical expenses, are fixed by Order in Council. The Act also adopts the method of having the various maximum total payments of compensation for death or incapacity expressed in terms of the current maximum weekly payment, so that any variation in the latter automatically varies the maxima for total payments. Compensation rates at present are as follows:
In case of death:
Where the worker leaves total dependants, a sum equal to the aggregate of the prescribed maximum weekly payments for 274 weeks ($6,507.50); or
Where the worker leaves partial dependants only, a sum reasonable and proportionate to the injury to these dependants, but not exceeding the sum specified in (a).
Compensation received prior to death by the injured person in respect of the accident which causes his death is deducted from the above amounts, to arrive at the amounts payable to dependants, to the extent that such prior compensation exceeds the aggregate of the prescribed maximum weekly payments for 39 weeks. ($926.25).
In the case of injury:
During total incapacity, weekly payments equal to 80 percent of the worker's weekly earnings (maximum $23.75 per week, minimum $5.40).
During partial incapacity, weekly payments equal to 80 percent of the difference between the worker's pre-accident weekly earnings and the weekly amount he is earning or able to earn in suitable employment or business after the accident.
Weekly payments apply during any period of total incapacity, but not for a longer period than six years. The worker's weekly earnings are deemed to be his ordinary weekly earnings (exclusive of overtime) at the time of the accident, increased or reduced during his incapacity according to increases or decreases in ordinary rates of pay, ruling rates of pay, or minimum rates of wages. As an alternative, the worker may elect to have his weekly payments based on his average weekly earnings (exclusive of overtime) over the last 12 months or some shorter period in the employment of the same employer, increased or decreased during incapacity according to increases or decreases in the minimum wage under the Minimum Wage Act 1945. Permanently incapacitated apprentices, trainees, or workers under 21 years of age have their weekly earnings computed on adult or journeymen's rates.
In the case of certain injuries involving permanent disability (e.g., dismemberment or loss of use) compensation is assessed in accordance with a schedule to the Act, representing a percentage (varying according to the nature of the dismemberment) of an amount equal to the aggregate of maximum weekly payments of compensation for six years ($7,433.75). In assessing the compensation payable for such injuries, any compensation, received for any period of temporary incapacity is taken into account in a manner laid down in the Act.
In addition to the ordinary compensation, dependants' allowances are payable under the Workers' Compensation Act 1956. Where the death of the worker results from the injury, an allowance of $100 is payable in respect of each total dependant under 16 years of age, and a proportionate amount in respect of each partial dependant under 16. Where the worker's total incapacity results from the injury, an allowance, of $3 per week is payable in respect of his wife or dependent woman in a position of parent to children under 16 years of age maintained by the worker or paid housekeeper, provided that the combined amount of weekly payments and dependants'; allowances is not to exceed 90 percent of the worker's weekly earnings. A child over 16 and under 18 years of age is treated as being under 16 if still at school or undergoing training without pay.
Various other allowances and expenses are payable in addition to the ordinary compensation. An injured worker is entitled to an allowance of $4 per week for any period during which he requires constant personal attendance and is not being maintained free of charge in a hospital. In the case of death, reasonable expenses are payable for medical and surgical attendance and up to $150 for the funeral. In the case of incapacity, expenses of medical and surgical attendance are payable, namely, in respect of each first attendance other than for inpatient treatment, $2.50, and for subsequent occasions, $1.50, with additional amounts for attendance beyond 30 minutes, and also milage fees where applicable (with certain variations in the case of specialist services, X-ray diagnostic services, and physiotherapeutic services).
Where as a result of the injury to a worker an artificial limb or aid is necessary, the employer must pay the reasonable cost of the artificial limb or aid, and the reasonable cost of its normal repair or renewal. Where, as a result of accident arising out of and in the course of employment, the worker suffers damage to teeth, an artificial limb or aid, clothing, or spectacles he is wearing (in this case the injury suffered must be one for which compensation is payable), the employer must pay for the reasonable cost of repair or replacement. Where the worker needs to be removed to a doctor or hospital after the accident, the employer must pay the costs of removal. Where a worker requires medical treatment in another town or at a place more than 5 miles from his residence, the employer must pay the expenses of transport and meals or lodging up to a maximum of $100.
Weekly payments of compensation may not be discontinued or diminished except in the following cases:
Where the weekly payment is in respect of total incapacity and the worker has actually returned to work.
By formal agreement with the worker.
By leave of the Compensation Court upon payment of a lump sum in lieu of weekly payments.
By leave of the Compensation Court or Magistrate's Court where a doctor certifies that the worker has wholly or partially recovered or that any incapacity is not due in whole or part to the accident. The Court will not grant such leave in the case of partial recovery unless the worker is working in some suitable employment or business, or some suitable employment has been provided by his employer.
By judgment or order of a Court of competent jurisdiction.
After the expiration of the maximum period of six years.
Where the weekly payment is in respect of total incapacity and the worker's doctor has certified he is fit to resume work and the worker has not done so. If in fact the Compensation Court is satisfied that the worker was not fit to resume work, it shall declare that the ending of payments was unlawful. The additional amount to be paid by way of penalty is in the discretion of the Court.
If the employer wrongfully terminates or diminishes weekly compensation payments, he is liable to pay double compensation to the worker.
COMPENSATION COURT—Proceedings under the Act are taken in the Compensation Court. The Court consists of a Judge, and there is provision in the Act for the appointment of a Registrar for each industrial district tinder the Industrial Conciliation and Arbitration Act 1954. Procedure is determined by regulations—the Workers' Compensation Rules. No appeal lies to any other Court from any order made by the Compensation Court, nor may any such order be removed into another Court to be quashed or varied, except upon the ground of want or excess of jurisdiction. All proceedings for the recovery of compensation and the determination of any questions under the Act are, with certain exceptions, taken in the Compensation Court and not otherwise,, Rights of indemnity conferred by the Act are enforceable in the Supreme Court or some other Court of competent jurisdiction, and not (except with the consent of the parties) in the Compensation Court. Where the parties agree or the amount claimed does not exceed $100, proceedings for the recovery of compensation in respect of any injury which has not caused the death of a worker may be taken in the Magistrate's Court. Medical, funeral, and surgical expenses and other allowances of a similar nature may be recovered in the Magistrate's Court equally with the Compensation Court.
Proceedings under the Act for the recovery of compensation are not maintainable unless written notice of the accident has been given to the employer as soon as practicable after its happening. Action for recovery must also be commenced within 12 months after the date of the accident or death, or dale of the last payment of compensation or signing of admission of liability. The Court has power to excuse failure to give notice or to commence action within the limited time if the employer has not been prejudiced, or the failure was due to mistake of fact or law, absence from New Zealand, or other reasonable cause.
INSURANCE—With certain exceptions it is compulsory for all employers to insure against their liability to pay compensation or damages in respect of injuries to workers. The Secretary of Labour has power to grant exemption where the employer has adequate financial resources, or is a Commonwealth shipping company indemnified by a United Kingdom mutual protecting club or is employing workers domiciled outside New Zealand and adequately protected by compensation rights and insurance enforceable in the country of their domicile or in the country where they were engaged. The National Airways Corporation, the Linen Flax Corporation, and education boards and other school authorities are not required to insure their workers. The Secretary of Labour may grant exemption to the trustees of the General Trust Fund established under the New Zealand Rules of Racing. The insurance provisions of the Act do not apply with respect to overseas workers temporarily employed in New Zealand by overseas employers for a period of six months or less.
Contracts are completed by the delivery of wages statements by employers to authorised insurers (insurance companies who have notified the Secretary of Labour that they have made the necessary deposit under the Insurance Companies' Deposits Act 1953). Maximum rates of premiums for the different categories of workers are fixed by the Employers' Liability Insurance Regulations. The employer is required to give prompt notification of details of accidents causing death or personal injury to workers, to his insurer, and to an Inspector of Factories.
WORKERS' COMPENSATION BOARD—The Workers' Compensation Board consists of the General Manager of the State Insurance Office and one other Government representative, two representatives of the Council of Fire and Accident Underwriters' Associations of New Zealand, one employers' representative, and one workers' representative. Its functions include recommending the maximum rates of premiums and rate of commission for insurance agents, administering the Workers' Compensation Account used in carrying out the Board's functions, undertaking and assisting accident prevention, research into causes, incidence, and prevention of accidents, and the care and assistance of injured workers. Penal rates up to 100 percent in excess of the prescribed maximum rates may be imposed by the Board in cases where the risks to workers are unusually great. To finance the activities of the Board, levies are collected from authorised insurers and exempted employers. The Board also acts as the insurer of employers who have neglected to insure their workers with an authorised insurer, so that workers are protected in all cases. The Board may collect from delinquent employers moneys it pays out as insurer.
GENERAL—Statistics of industrial accidents have become increasingly important with the widening mechanisation of industry and the growing labour force. They are basic material for programmes of industrial safety. The national bill for compensation payments is in the region of $6 million annually. This is, however, only the direct cost, and the indirect costs probably put the total bill beyond $20 million. Productivity and the standard of living are affected by industrial accidents. Over the latest five years the calendar days lost through industrial accidents were well over 50 times the working days lost through industrial stoppages. Add to this the loss of some 80 lives each year and the permanent disabling of some nine hundred other workers, then the magnitude of the problem of occupational safety can be more clearly realised.
As the statistics are derived from claims made under the Workers' Compensation Act, they exclude accidents to working proprietors and similar persons not insurable under the Act. This limits the scope of the statistics in the farming industry especially. Coverage does, however, extend to organisations exempt from insurance under the Act.
Claims resulting from the more serious accidents are frequently not settled for some considerable time after the occurrence of the accident, and a period is therefore allowed so that the bulk of such claims may be included in the statistics for the year in which the accidents occurred. From 1953 the closing date has been standardised at mid-August of the following year. Even allowing this period of seven and a half months, it is inevitable that any year's statistics will include a small proportion of long-delayed claims from previous years, but these late claims should be compensatory from year to year.
PRINCIPAL STATISTICS—The following table gives a summary of the principal statistics for the latest five years. The concepts and calculation of frequency and severity rates and of calendar days lost are explained in a succeeding note, and changes in compensation rates are set out in a subsequent table.
| Item | 1961 | 1962 | 1963 | 1964 | 1965 |
|---|---|---|---|---|---|
| Number of accidents resulting in— | |||||
| Fatality | 79 | 83 | 74 | 67 | 90 |
| Permanent total disability | 8 | 3 | 4 | 2 | 9 |
| Permanent partial disability | 974 | 1,004 | 874 | 1,011 | 946 |
| Temporary disability | 53,188 | 53,275 | 54,380 | 57,918 | 55,373 |
| Totals | 54,249 | 54,365 | 55,332 | 58,998 | 56,418 |
| Compensation paid (incl. damages)— | |||||
| Total $(m) | 6.05 | 6.07 | 6.25 | 6.72 | 6.98 |
| Average per accident $ | 112 | 112 | 113 | 114 | 124 |
| Calendar days lost— | |||||
| Temporary disability only (000) | 910.3 | 900.0 | 898.5 | 939.6 | 878.8 |
| Average days per accident | 17 | 17 | 17 | 16 | 16 |
| Total on constant basis (000) | 3,040.8 | 3,068.3 | 2,831.1 | 2,981.0 | 3,075.6 |
| Average days per accident | 56 | 56 | 51 | 51 | 55 |
| Total on actual basis (000) | 3,010.3 | 3,082.5 | 2.908.5 | 2.976.7 | 3,167.5 |
| Average days per accident | 55 | 57 | 53 | 50 | 56 |
| Frequency and severity rates— | |||||
| Frequency rate | 3.83 | 3.78 | 3.65 | 3.75 | 3.46 |
| Injury severity rate | 1,303 | 1,287 | 1,134 | 1,145 | 1,150 |
| Economic severity rate | 1,297 | 1,299 | 1,172 | 1,147 | 1,197 |
FREQUENCY AND SEVERITY RATES—Frequency rates are calculated according to the formula: Accidents per 100,000 man-hours worked.
For severity rates the formula is: Man-hours lost through accidents per 100,000 man-hours worked. In calculating the injury severity rate in the foregoing table a constant allowance of average working-life expectancy (9,263 calendar days) is made for all fatalities, with a percentage of this for each permanent disability according to the percentage of that disability as set out in the First Schedule to the Workers' Compensation Act 1956. To the calendar days lost through fatal and permanent disabling accidents are added the actual days lost through temporary disabilities, adjusted to allow for the different age distribution of workers suffering this kind of accident. From the total the man-hours lost are calculated.
The economic severity rate is calculated similarly, but takes into account the workers' actual ages. Further details will be found in the Report on Industrial Accidents Statistics for 1965.
The average severity of accidents is found by dividing the calendar days lost by the number of accidents. This rate, also called the time charge, is calculated without reference to age.
The numbers of accidents and the injury severity rates (hours lost per 100,000 man-hours worked) for the industrial groups, together with the labour force and frequency rate (accidents per 100.000 man-hours worked) for the groups, are shown in the following diagrams.
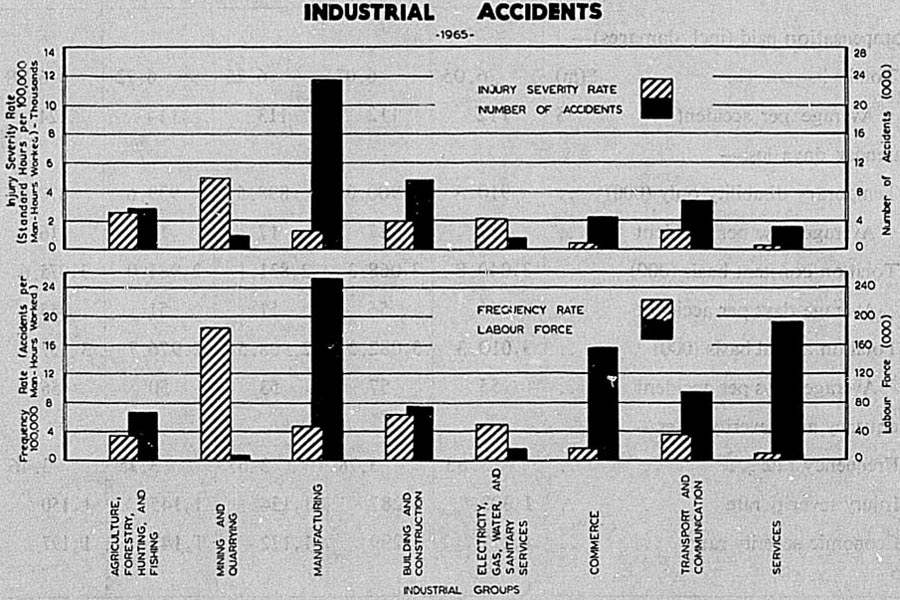
CLASSIFICATION BY INDUSTRY—In the following table industrial accidents during the year 1965 are classified by industrial groups.
| Industrial Group | Total Accidents | Calendar Days Lost | Total
Compensation (Including Damages) | ||
|---|---|---|---|---|---|
| Total | Average | Total | Average | ||
| Agriculture, forestry, hunting, and fishing— | $ | $ | |||
| Agriculture and livestock production | 4,064 | 510,652 | 126 | 695,726 | 171 |
| Forestry and logging | 1,341 | 148,519 | 111 | 260,928 | 195 |
| Hunting, trapping, and game propagation | 126 | 10,306 | 82 | 20,488 | 163 |
| Fishing | 107 | 31,532 | 295 | 43,536 | 407 |
| Mining and quarrying— | |||||
| Coal mining | 1,668 | 45,630 | 27 | 219,702 | 132 |
| Metal mining | 10 | 174 | 17 | 766 | 77 |
| Crude petroleum and natural gas | 17 | 347 | 20 | 1,252 | 74 |
| Stone quarrying, clay and sand pits | 288 | 43,260 | 150 | 37,106 | 129 |
| Non-metallic mining and quarrying | 8 | 93 | 12 | 324 | 41 |
| Manufacturing— | |||||
| Food | 7,432 | 215,054 | 29 | 660,160 | 89 |
| Beverages | 358 | 15,753 | 44 | 45,076 | 126 |
| Tobacco | 60 | 4,163 | 69 | 12,134 | 202 |
| Textiles | 688 | 35,894 | 52 | 85,310 | 124 |
| Footwear, other wearing apparel, and made-up textile goods | 521 | 15,834 | 30 | 43,546 | 84 |
| Wood and cork (excluding furniture) | 2,554 | 175,145 | 69 | 345,076 | 135 |
| Furniture and fixtures | 443 | 50,734 | 115 | 71,032 | 160 |
| Paper and paper products | 814 | 46,392 | 57 | 110,224 | 135 |
| Printing, publishing, and allied industries | 373 | 15,979 | 43 | 38,688 | 104 |
| Leather and leather products (except footwear) | 135 | 7,042 | 52 | 14,532 | 108 |
| Rubber products | 286 | 13,749, | 48 | 57,814 | 202 |
| Chemicals and chemical products | 622 | 55,507 | 89 | 164,888 | 265 |
| Products of petroleum and coal | 40 | 501 | 13 | 2,160 | 54 |
| Non-metallic mineral products | 1,419 | 56,696 | 40 | 134,812 | 95 |
| Basic metal industries | 176 | 8,018 | 46 | 20,698 | 118 |
| Metal products (except machinery and transport equipment) | 1,538 | 87,853 | 57 | 247,932 | 161 |
| Machinery (except electrical machinery) and general engineering | 2,770 | 104,722 | 38 | 316,370 | 114 |
| Electrical machinery, apparatus, appliances, and supplies | 602 | 15,621 | 26 | 61,384 | 102 |
| Transport equipment | 2,290 | 68,612 | 30 | 164,532 | 72 |
| Miscellaneous industries | 493 | 24,306 | 49 | 67,478 | 137 |
| Construction | 9,619 | 488,154 | 51 | 1,103,988 | 115 |
| Electricity, gas, water, and sanitary services— | |||||
| Electricity, gas, and steam | 953 | 99,828 | 105 | 223,170 | 234 |
| Water and sanitary services | 429 | 11,848 | 28 | 41,008 | 96 |
| Commerce— | |||||
| Wholesale and retail trade | 4,123 | 208,693 | 51 | 428,804 | 104 |
| Banks and other financial institutions | 25 | 415 | 17 | 2,062 | 82 |
| Insurance | 12 | 256 | 21 | 1,500 | 125 |
| Real estate | 4 | 85 | 21 | 322 | 81 |
| Transport, storage, and communication— | |||||
| Transport | 5,862 | 383,900 | 65 | 825,820 | 141 |
| Storage and warehousing | 161 | 5,016 | 31 | 13,376 | 83 |
| Communication | 946 | 12,904 | 14 | 69,726 | 74 |
| Services— | |||||
| Government | 329 | 10,071 | 31 | 30,862 | 94 |
| Community and business | 1,262 | 46,215 | 37 | 105,098 | 83 |
| Recreation | 265 | 48,062 | 181 | 51,774 | 195 |
| Personal | 1,183 | 43,934 | 37 | 137,638 | 116 |
| Not adequately described | 2 | 76 | 38 | 260 | 130 |
| Total | 56,418 | 3,167,545 | 56 | 6,979,082 | 124 |
In the next table the accidents in 1965 are classified by the resulting extent of disability.
| Industrial Group | Number of Accidents Resulting in - | Total Number of Accidents | |||
|---|---|---|---|---|---|
| Fatality | Permanent Total Disability | Permanent Partial Disability | Temporary Disability | ||
| Agriculture, forestry, hunting, and fishing— | |||||
| Agriculture and livestock production | 18 | 2 | 88 | 3,956 | 4,064 |
| Forestry and logging | 7 | - | 31 | 1,303 | 1,341 |
| Other | 2 | - | 9 | 222 | 233 |
| Mining and quarrying— | |||||
| Coal mining | - | 1 | 9 | 1,658 | 1,668 |
| Stone quarrying, clay and sand pits | 2 | - | 6 | 280 | 288 |
| Other | - | - | - | 35 | 35 |
| Manufacturing— | |||||
| Food | 1 | - | 92 | 7,339 | 7,432 |
| Beverages | 1 | - | 5 | 352 | 358 |
| Textiles | - | - | 24 | 664 | 688 |
| Footwear, other apparel, and made-up textile goods | - | - | 11 | 510 | 521 |
| Wood and cork | 4 | - | 67 | 2,483 | 2,554 |
| Furniture and fixtures | - | - | 26 | 417 | 443 |
| Paper and paper products | 1 | - | 15 | 798 | 814 |
| Printing, publishing, and allied industries | - | - | 9 | 364 | 373 |
| Rubber products | - | - | 7 | 279 | 286 |
| Chemicals and chemical products | 1 | 2 | 15 | 604 | 622 |
| Non-metallic mineral products | 2 | - | 20 | 1,397 | 1,419 |
| Metal products | 4 | - | 34 | 1,500 | 1,538 |
| Machinery, including general engineering | 1 | - | 51 | 2,718 | 2,770 |
| Electrical machinery, apparatus, appliances, and supplies | - | - | 12 | 590 | 602 |
| Transport equipment | - | - | 24 | 2,266 | 2,290 |
| Other manufacturing | - | - | 33 | 871 | 904 |
| Construction | 11 | 2 | 165 | 9,441 | 9,619 |
| Electricity, gas, water, and sanitary services— | |||||
| Electricity, gas, and steam | 5 | 1 | 11 | 936 | 953 |
| Water and sanitary services | - | - | 4 | 425 | 429 |
| Commerce— | |||||
| Wholesale and retail trade | 5 | - | 64 | 4,054 | 4,123 |
| Other | - | - | - | 41 | 41 |
| Transport, storage, and communication— | |||||
| Transport | 18 | 1 | 68 | 5,775 | 5,862 |
| Storage and warehousing | - | - | 2 | 159 | 161 |
| Communication | - | - | - | 946 | 946 |
| Services— | |||||
| Government | - | - | 4 | 325 | 329 |
| Community and business | 3 | - | 13 | 1,246 | 1,262 |
| Recreation | 3 | - | 5 | 257 | 265 |
| Personal | 1 | - | 22 | 1,160 | 1,183 |
| Not adequately described | - | - | - | 2 | 2 |
| Totals | 90 | 9 | 946 | 55,373 | 56,418 |
CAUSE OF ACCIDENT AND RESULTING DISABILITY—The following table relates cause of accident and degree of resulting disability for the year 1965.
| Cause | Fatality | Permanent Disability* | Temporary Disability | Total | Percentage of Total Accidents |
|---|---|---|---|---|---|
* Including permanent total disability cases. | |||||
| Machinery | 18 | 397 | 7,845 | 8,260 | 14.7 |
| Vehicle | 29 | 40 | 2,133 | 2,202 | 3.9 |
| Electricity, explosion, flames, hot sub-substance | 9 | 21 | 1,618 | 1,648 | 2.9 |
| Poison, corrosive substance | 1 | 4 | 527 | 532 | 0.9 |
| Fall of person | 9 | 143 | 7,852 | 8,004 | 14.2 |
| Stepping on or striking against fixed or stationary object | - | 11 | 2,477 | 2,488 | 4.4 |
| Moving object (not being handled by person injured) | 9 | 44 | 2,213 | 2,266 | 4.0 |
| Fall of earth | 2 | 4 | 255 | 261 | 0.5 |
| Handling of object | 2 | 176 | 18,179 | 18,357 | 32.5 |
| Hand tools | - | 91 | 8,438 | 8,529 | 15.1 |
| Miscellaneous | 11 | 24 | 3,835 | 3,871 | 6.9 |
| Totals | 90 | 955 | 55,373 | 56,418 | 100.0 |
AGE OF WORKERS—The following table gives numbers and percentages according to age groups of the persons injured.
| Age (Completed Years) | 1961 | 1962 | 1963 | 1964 | 1965 | |||||
|---|---|---|---|---|---|---|---|---|---|---|
| Number of Cases | Percent of Total | Number of Cases | Per cent of Total | Number of Cases | Percent of Total | Number of Cases | Percent of Total | Number of Cases | Percent of Total | |
| Under 16 | 457 | 0.8 | 534 | 1.0 | 437 | 0.8 | 523 | 0.9 | 466 | 0.8 |
| 16-20 | 8,303 | 15.3 | 8,417 | 15.5 | 8,573 | 15.5 | 9,674 | 16.4 | 9,846 | 17.5 |
| 21-24 | 6,275 | 11.6 | 6,573 | 12.1 | 6,879 | 12.4 | 7,227 | 12.2 | 6,850 | 12.1 |
| 25-34 | 11,851 | 21.8 | 11,828 | 21.7 | 11.597 | 21.0 | 12.200 | 20.7 | 11.343 | 20.1 |
| 35-44 | 9,778 | 18.0 | 9,716 | 17.9 | 10,136 | 18.3 | 10,423 | 17.7 | 9,838 | 17.4 |
| 45-54 | 7,572 | 14.0 | 7,552 | 13.9 | 7,404 | 13.4 | 7,824 | 13.2 | 7,474 | 13.3 |
| 55-64 | 3,859 | 7.1 | 3,735 | 6.9 | 4,035 | 7.3 | 4,291 | 7.3 | 4,110 | 7.3 |
| 65 and over | 647 | 1.2 | 598 | 1.1 | 654 | 1.2 | 644 | 1.1 | 672 | 1.2 |
| Not stated | 5,507 | 10.2 | 5,412 | 9.9 | 5,617 | 10.1 | 6,192 | 10.5 | 5,819 | 10.3 |
| Totals | 54,249 | 100.0 | 54,365 | 100.0 | 55,332 | 100.0 | 58,998 | 100.0 | 56,418 | 100.0 |
NATURE OF INJURY—A classification of accidents according to injury sustained gives the following results for the latest five years.
| Injury | 1961 | 1962 | 1963 | 1964 | 1965 | Total 1961-65 |
|---|---|---|---|---|---|---|
| Bruises and contusions | 5,903 | 5,833 | 6,143 | 6,499 | 6,293 | 30,671 |
| Burns | 2,368 | 2,356 | 2,337 | 2,561 | 2,516 | 12,138 |
| Concussions | 329 | 306 | 257 | 354 | 321 | 1,567 |
| Lacerations, punctures, and open wounds | 14,954 | 15,666 | 15,975 | 17,385 | 16,822 | 80,802 |
| Ruptures | 468 | 437 | 506 | 538 | 515 | 2,464 |
| Amputations (traumatic) | 139 | 123 | 93 | 146 | 123 | 624 |
| Dislocations | 241 | 218 | 228 | 217 | 229 | 1,133 |
| Fractures | 4,474 | 4,159 | 4,024 | 4,395 | 4,094 | 21,146 |
| Sprains and strains | 17,054 | 16,971 | 17,963 | 19,360 | 18,685 | 90,033 |
| Occupational dermatitis | 589 | 616 | 548 | 562 | 519 | 2,834 |
| Other and ill defined | 7,730 | 7,680 | 7,258 | 6,981 | 6,301 | 35,950 |
| Totals | 54,249 | 54,365 | 55,332 | 58,998 | 56,418 | 279,362 |
| Cases where septic poisoning occurred— | ||||||
| Number | 9,168 | 8,173 | 7,121 | 6,298 | 5,791 | 36,551 |
| Percentage of all accidents | 16.9 | 15.0 | 12.9 | 10.7 | 10.3 | 13.1 |
Of the septic cases shown for 1965 in the preceding table, 35.1 percent occurred in the handling of objects (including pricks and scratches by bones and thorns in slaughtering and packing operations), and 20.6 percent in the use of hand tools.
PART OF BODY INJURED—In the following table industrial accidents are classified according to the different parts of the body injured.
| Part of Body Injured | 1961 | 1962 | 1963 | 1964 | 1965 | Total 1961-65 | |
|---|---|---|---|---|---|---|---|
| Number | Percent | ||||||
| Head | 783 | 841 | 788 | 931 | 887 | 4,230 | 1.5 |
| Eye and orbit | 3,013 | 2,996 | 3,215 | 3,651 | 3,304 | 16,179 | 5.8 |
| Rest of face | 572 | 574 | 560 | 550 | 608 | 2,864 | 1.0 |
| Neck, back, and chest | 9,546 | 9,631 | 9,847 | 10,300 | 10,420 | 49,744 | 17.8 |
| Abdomen and contents | 1,110 | 1,100 | 1,170 | 1,217 | 1,152 | 5,749 | 2.1 |
| Upper limb— | |||||||
| Collarbone and shoulder | 1,371 | 1,423 | 1,431 | 1,636 | 1,549 | 7,410 | 2.7 |
| Arm | 2,488 | 2,295 | 2,182 | 2,546 | 2,463 | 11,974 | 4.3 |
| Hand and wrist | 18,442 | 18,525 | 18,467 | 19,288 | 18,261 | 92,983 | 33.2 |
| Lower limb— | |||||||
| Hip, thigh, and leg | 5,842 | 5,653 | 5,606 | 6,272 | 5,924 | 29,297 | 10.5 |
| Ankle and foot | 7,415 | 7,334 | 7,466 | 7,949 | 7,531 | 37,695 | 13.5 |
| Other, multiple, ill defined, not applicable | 3,667 | 3,993 | 4,600 | 4,658 | 4,319 | 21,237 | 7.6 |
| Total | 54,249 | 54,365 | 55,332 | 58,998 | 56,418 | 279,362 | 100.0 |
DURATION OF INCAPACITY—A summary of the duration of incapacity and the number of cases of fatality, permanent total disability, and permanent partial disability is given below.
| Duration | 1962 | 1963 | 1964 | 1965 | Total 1962-65 | |||||
|---|---|---|---|---|---|---|---|---|---|---|
| Number | Per-cent | Number | Per-cent | Number | Per-cent | Number | Per-cent | Number | Per-cent | |
| 1 or 2 days | 3,707 | 6.8 | 4,167 | 7.5 | 4,842 | 8.2 | 4,722 | 8.4 | 17,438 | 7.8 |
| Over 2 days to 1 week | 17,913 | 33.0 | 18,915 | 32.9 | 20,186 | 34.2 | 19,600 | 34.7 | 76,614 | 33.7 |
| Over 1 week to 2 weeks | 14,987 | 27.6 | 15.305 | 27.7 | 15,743 | 26.7 | 15,427 | 27.3 | 61,462 | 27.3 |
| Over 2 weeks to 4 weeks | 9,505 | 17.5 | 9,605 | 17.4 | 9,699 | 16.4 | 8,856 | 15.7 | 37,665 | 16.7 |
| Over 4 weeks to 6 weeks | 3,213 | 5.9 | 3,121 | 5.6 | 3,294 | 5.6 | 3.022 | 5.4 | 12.650 | 5.6 |
| Over 6 weeks to 3 months | 3,001 | 5.5 | 3,058 | 5.5 | 3,186 | 5.4 | 2,814 | 5.0 | 12.059 | 5.4 |
| Over 3 months | 949 | 1.7 | 929 | 1.7 | 968 | 1.7 | 932 | 1.6 | 3,778 | 1.7 |
| Number of accidents resulting in— | ||||||||||
| Temporary disability | 53,275 | 98.0 | 54,380 | 98.3 | 57,918 | 98.2 | 55,373 | 98.1 | 220,946 | 98.2 |
| Fatality | 83 | 0.2 | 74 | 0.1 | 67 | 0.1 | 90 | 0.2 | 314 | 0.1 |
| Permanent total disability | 3 | - | 4 | - | 2 | - | 9 | - | 18 | - |
| Permanent partial disability | 1,004 | 1.8 | 874 | 1.6 | 1,011 | 1.7 | 946 | 1.7 | 3,835 | 1.7 |
| Totals | 54,365 | 100.0 | 55,332 | 100.0 | 58,998 | 100.0 | 56,418 | 100.0 | 225,113 | 100.0 |
ACCIDENTS PRODUCING DELAYED ACTION—As the following table shows, in about one-third of all accidents there is a time lag between the accident and the time the worker ceases work.
| Complications of Injury | Delayed Action | No Delayed Action | Total 1965 | ||
|---|---|---|---|---|---|
| 1 Week or Less | Over 1 Week and up to 2 Weeks | Over 2 Weeks | |||
| Sepsis | 3,517 | 540 | 321 | 1,261 | 5,639 |
| Surgical amputation | 2 | - | 2 | 148 | 152 |
| Sepsis and surgical amputation | 2 | 2 | 2 | 2 | 8 |
| Loss of function (excluding amputation) | 26 | 9 | 27 | 587 | 649 |
| Sepsis, both organs of a pair | 74 | 13 | 1 | 56 | 144 |
| Loss of function (excluding amputation), both organs of a pair | - | - | - | 14 | 14 |
| No complications, both organs of a pair | 148 | 2 | 4 | 452 | 606 |
| No complications, other | 13,761 | 755 | 950 | 33,740 | 49,206 |
| Totals | 17,530 | 1,321 | 1,307 | 36,260 | 56,418 |
TIME OF OCCURRENCE—The following tabulation of industrial accidents makes annual comparison of time of occurrence for the latest five years.
This table indicates that accidents are most numerous during the middle and later part of the morning; there is another peak in mid-afternoon, but this does not reach the same high point.
| Time of Occurrence to Nearest Hour | Year | |||||
|---|---|---|---|---|---|---|
| 1961 | 1962 | 1963 | 1964 | 1965 | Totals 1961-65 | |
| 8 a.m. | 2,346 | 2,432 | 2,478 | 2,588 | 2,575 | 12,419 |
| 9 a.m. | 5,130 | 5,236 | 5,370 | 5,569 | 5,410 | 26,715 |
| 10 a.m. | 6,569 | 6,602 | 6,690 | 6,872 | 6,730 | 33,463 |
| 11 a.m. | 7,043 | 6,926 | 6,986 | 7,466 | 7,123 | 35,544 |
| 12 noon | 3,877 | 3,673 | 3,919 | 4,165 | 4,156 | 19,790 |
| 1 p.m. | 2,278 | 2,363 | 2,338. | 2,539 | 2,497 | 12,015 |
| 2 p.m. | 5,563 | 5,474 | 5,687 | 5,912 | 5,554 | 28,190 |
| 3 p.m. | 5,894 | 5,605 | 5,749 | 6,064 | 5,779 | 29,091 |
| 4 p.m | 5,135 | 5,031 | 5,250 | 5,554 | 5,288 | 26,258 |
| 5 p.m. | 2,666 | 2,566 | 2,705 | 2,937 | 2,921 | 13,795 |
| Other hours | 4,280 | 4,150 | 4,174 | 4,611 | 4,453 | 21,668 |
| Not stated | 2,505 | 3,305 | 2,988 | 3,642 | 2,843 | 15,283 |
| Not applicable | 963 | 1,002 | 998 | 1,079 | 1,089 | 5,131 |
| Totals | 54,249 | 54,365 | 55,332 | 58,998 | 56,418 | 279,362 |
HOURS ON SHIFT—This table relates cause of accident to the number of hours worked on the day when the accident occurred.
| Number of Hours Already Worked | Cause | |||||||||
|---|---|---|---|---|---|---|---|---|---|---|
| Machinery | Vehicles | Electricity, Flames, etc. | Falls of Persons | Stepping on or Striking Against Objects | Moving Objects | Handling Objects | Hand Tools | Other | Total 1965 | |
| Under 1 | 450 | 204 | 86 | 556 | 136 | 108 | 1,058 | 430 | 189 | 3,217 |
| 1 and under 2 | 884 | 245 | 165 | 828 | 224 | 247 | 2,185 | 955 | 369 | 6,102 |
| 2 and under 3 | 926 | 269 | 195 | 880 | 279 | 247 | 2,285 | 1,035 | 399 | 6,515 |
| 3 and under 4 | 1,032 | 279 | 182 | 912 | 333 | 298 | 2,338 | 1,182 | 408 | 6,964 |
| 4 and under 5 | 737 | 203 | 171 | 691 | 215 | 209 | 1,395 | 806 | 302 | 4,729 |
| 5 and under 6 | 730 | 179 | 148 | 626 | 176 | 239 | 1,498 | 812 | 278 | 4,686 |
| 6 and under 7 | 912 | 203 | 172 | 811 | 274 | 250 | 1,880 | 854 | 338 | 5,694 |
| 7 and under 8 | 798 | 141 | 163 | 796 | 239 | 209 | 1,605 | 781 | 314 | 5,046 |
| 8 or over | 796 | 255 | 166 | 835 | 264 | 185 | 1,381 | 584 | 325 | 4,791 |
| Not stated | 995 | 223 | 200 | 1,068 | 348 | 273 | 2,609 | 1,089 | 778 | 7,583 |
| Not applicable | - | 1 | - | 1 | - | 1 | 123 | 1 | 964 | 1,091 |
| Totals | 8,260 | 2,202 | 1,648 | 8,004 | 2,488 | 2,266 | 18,357 | 8,529 | 4,664 | 56,418 |
The foregoing table shows that the greatest number of accidents occurred during the third and fourth hours worked in the day. Overtime accidents (eight hours or more already worked) represented 8.5 percent of all accidents in 1965.
DAY OF THE WEEK—The following table correlates for 1965 the causes of accidents with the days of the week on which they occurred. This table indicates a peak for accidents on Mondays, and a gradual decrease over the remainder of the week.
| Cause | Sun | Mon | Tues | Wed | Thur | Fri | Sat | Not Stated | Total |
|---|---|---|---|---|---|---|---|---|---|
| Machinery | 140 | 1,595 | 1,658 | 1,541 | 1,606 | 1,215 | 471 | 34 | 8,260 |
| Vehicle | 73 | 457 | 434 | 414 | 391 | 292 | 136 | 5 | 2,202 |
| Electricity, explosion, flames, hot substance | 57 | 260 | 295 | 298 | 326 | 290 | 117 | 5 | 1,648 |
| Poison, corrosive substance | 11 | 95 | 100 | 94 | 96 | 63 | 25 | 48 | 532 |
| Fall of person | 234 | 1,658 | 1,569 | 1,418 | 1,393 | 1,195 | 512 | 25 | 8,004 |
| Stepping on or striking against fixed or stationary object | 56 | 491 | 490 | 447 | 449 | 392 | 152 | 11 | 2,488 |
| Moving object (not being handled by person injured) | 35 | 459 | 473 | 435 | 418 | 338 | 101 | 7 | 2,266 |
| Fall of earth | 2 | 50 | 60 | 52 | 53 | 34 | 9 | 1 | 261 |
| Handling of object | 378 | 3,849 | 3,553 | 3,282 | 3,220 | 2,856 | 947 | 272 | 18,357 |
| Hand tool | 138 | 1,813 | 1,673 | 1,632 | 1,555 | 1,282 | 381 | 55 | 8,529 |
| Miscellaneous | 104 | 570 | 560 | 528 | 476 | 445 | 234 | 954 | 3,871 |
| Totals | 1,228 | 11,297 | 10,865 | 10,141 | 9,983 | 8,402 | 3,085 | 1,417 | 56,418 |
| Percentage of all accidents | 2.2 | 20.0 | 19.2 | 18.0 | 17.7 | 14.9 | 5.5 | 2.5 | 100.0 |
GENERAL—In the preceding section on industrial accidents the statistics include farm employees but not self-employed farmers. At the Census of Population in 1961 there were 74,000 farmers apart from over 48,000 general farm workers.
The high degree of mechanisation on the 72,000 farm holdings of 10 acres or more is responsible in large part for the high output per unit of labour engaged in primary production; but it has been responsible too for an increase in the hazards associated with rural work. Nearly 6,000 threshing machines, 19,000 wool presses, 30,000 internal combustion engines, 140,000 electric motors, 85,000 agricultural tractors, 33,000 milking plants, 32,000 shearing plants, as well as farm trucks, cultivating and harvesting implements, and other farm equipment and installations have taken a high annual toll in accidents and deaths, especially in recent years when there has been rapid growth in the use of heavy machinery both for normal farm activities and for bringing new land into production.
The increasing use of chemicals in agriculture for weed control and as pesticides and therapeutants has added to the hazards to which those engaged in the agricultural industry have been subjected. The Department of Agriculture undertakes educational activities to endeavour to reduce the accident rates.
Tables in this section present information compiled by the National Health Statistics Centre of the Department of Health on farm accidents and deaths sustained by farmers and their employees. The statistics relate to actual farm work, that is, they exclude domestic accidents or accidents in farm homes.
Accidents on Farms—The following table shows the number of patients discharged from, or dying in, public hospitals in 1964 after treatment for injuries sustained in farm accidents (excluding motor vehicle accidents).
| Cause of Accidents | Age of Patients (in Years) | Total Patients | ||||
|---|---|---|---|---|---|---|
| 0-14 | 15-24 | 25-44 | 45-64 | 65 and Over | ||
| Farm machinery | 69 | 100 | 148 | 70 | 6 | 393 |
| Falls | 82 | 33 | 42 | 51 | 13 | 221 |
| Animals | 149 | 125 | 80 | 36 | 11 | 401 |
| Accidental poisoning | 2 | 3 | 3 | 2 | - | 10 |
| Firearms | 1 | 22 | 4 | 3 | - | 30 |
| Fires or explosions | 6 | 10 | 4 | 3 | - | 23 |
| Hot substances, corrosive liquids, or steam | 8 | 7 | 6 | 3 | - | 24 |
| Blow from falling or projected objects | 8 | 11 | 24 | 14 | 3 | 60 |
| Cutting or piercing instruments | 24 | 47 | 58 | 36 | 2 | 167 |
| Other and unspecified farm mishaps | 6 | 16 | 27 | 13 | 1 | 63 |
| Totals, 1964 | 355 | 374 | 396 | 231 | 36 | 1,392 |
| Totals, 1963 | 383 | 354 | 363 | 233 | 8 | 1,381 |
Deaths from Accidents on Farms—Deaths in 1964 from accidents on farms are shown in the following table. Injured persons who died after admission to a public hospital are also included in the preceding table. (Motor vehicle accidents on a farm are included.)
| Cause of Fatal Accident | Age of Deceased (in Years) | Total Deaths | ||||
|---|---|---|---|---|---|---|
| 0-14 | 15-24 | 25-64 | 45-64 | 65 and over | ||
| Tractors | 2 | 10 | 13 | 7 | 1 | 33 |
| Other farm machinery | 1 | 1 | 2 | - | 2 | 6 |
| Fall from ladder | - | - | 1 | - | - | 1 |
| Fall one level to another | - | 1 | - | - | - | 1 |
| Blows from falling or projected objects | - | - | 1 | - | 1 | 2 |
| Electric current | 1 | - | - | - | - | 1 |
| Fires or explosions | 1 | - | - | - | 1 | 3 |
| Firearms | - | - | - | 3 | - | 3 |
| Mechanical suffocation | - | 1 | - | - | 2 | |
| Animals | - | 1 | - | - | 2 | |
| Drowning or submersion | 4 | - | 1 | 1 | - | 6 |
| Other and unspecified | 1 | - | - | 1 | - | 2 |
| Totals, 1964 | 10 | 14 | 18 | 15 | 5 | 62 |
| Totals, 1963 | 16 | 10 | 8 | 11 | 5 | 50 |
The legislation on occupational safety is principally contained in the following statutes (and the regulations made under them):
The Factories Act 1946, sections 41 to 79; the Machinery Act 1950; the Bush Workers Act 1945; the Construction Act 1959; the Shops and Offices Act 1955, First Schedule; the Workers' Compensation Act 1956; the Coal Mines Act 1925; the Mining Act 1926; the Explosives Act 1957; the Dangerous Goods Act 1957; the Boilers, Lifts, and Cranes Act 1950; the Shipping and Seamen Act 1952; the Quarries Act 1944; the Health Act 1956 so far as it relates to occupational health (see Section 5 A).
Government Departments and other organisations concerned with the administration of the Acts, or who have responsibilities for occupational accident prevention, have the scope of their work summarised in the following pages, and legislative requirements are also covered.
Department of Labour—This Department has the largest overall responsibility for the prevention of accidents in industry. The principal statutes it administers are the Factories Act 1946, of which a large section is concerned with safety, health; and welfare in factories, the Construction Act 1959, which completely covers safety, health, and welfare of workmen on works of building and engineering construction, and the Machinery Act 1950, which is concerned with the inspection of ail machinery (with some exceptions covered by other legislation) in work places and the safety of persons working with such machinery. The Department also administers regulations under these Acts, and other statutes dealing with specific spheres of occupational safety, health, and welfare—the Bush Workers Act 1945 and the Shops and Offices Act 1955. It has also administrative responsibility for the Workers' Compensation Act 1956. In addition, the Department supervises nearly 700 awards and industrial agreements, many of which include specific safety, health, and welfare provisions relating to particular occupations and processes.
The administration of this safety legislation is based primarily on regular inspection of work places and requisitioning for improvements, together with investigation of reported breaches of legislation by employers and workers and investigation of a large number of accidents including serious and fatal accidents in industries coming within the scope of the legislation. Special attention is given to dangerous machinery. The Department employs some 130 Inspectors of Factories (including six who specialise in bush undertakings), together with some 30 Safety Inspectors appointed under the Construction Act 1959, all of whom are qualified by special examination. Their work is substantially preventive.
The Department of Labour also engages in a large amount of occupational safety education. It collaborates with the Department of Education and with teachers training colleges and technical schools in the instruction of technical teachers in occupational safety and in the safety training of apprentices and senior school pupils. Further, it issues monthly occupational safety posters to industry and publishes a range of safety booklets, pamphlets, warning notices, and other printed publicity. Its library of occupational safety films, which is widely used by industry, Government Departments, trade unions, industrial organisations, etc., is believed to be the largest specialised film library of its kind in the world. The Department produces industrial safety displays and exhibits, and has its own specially fitted exhibition van by means of which the displays are taken on tour regularly through selected areas of the country and exhibits used in the education and instruction of apprentices, school children, workers, employers, and the general public. The Department also publishes the Labour and Employment Gazette, a quarterly industrial periodical which includes a substantial amount of material relating to occupational safety.
In Wellington the Department has a Safety Centre which it opened in 1960, consisting of a lecture room and a large display and demonstration area. The centre is used for safety courses for inspectors, teachers, trade and industry groups, post-graduate nurses doing work in the field of occupational health, and so on.
The Department co-operates with all other bodies working in this and related fields and seeks specialist advice from time to time from such other Departments as Health, Marine, Forestry, Mines, Railways, Works, Electricity, Agriculture, and Scientific and Industrial Research, and collaborates with them in matters of mutual concern.
A joint Committee on Occupational Health and Safety Education of the Departments of Labour and Health ensures that the educational work of these Departments in this field is co-ordinated and wherever responsibility is shared that it is undertaken jointly. The National Safety Association of New Zealand (Inc.) and the Workers' Compensation Board are also associated with this committee for the purpose of mutual sharing of information.
Department of Health—This Department has general responsibility under the Health Act 1956 for occupational health as one sphere of public health, and, in addition, the Factories Act 1946 gives to Medical Officers of Health and Inspectors of Health the same powers and responsibilities as Inspectors of Factories with regard to the health and welfare provisions of the Act.
Marine Department—This Department has overall responsibility for the safety of persons working on the waterfront, for physical conditions on ships affecting the safety of ships' crews, and for the Boilers, Lifts, and Cranes Act 1950.
Safety of Ships—A substantial portion of the Shipping and Seamen Act 1952 is concerned with the safety of ships and those who sail in them. This Act contains the necessary authority for implementing the provisions of the International Convention for the Safety of Life at Sea 1960 and the International Load Line Convention 1930, to both of which New Zealand is a signatory. Both conventions deal principally with ships engaged on international voyages, but the Shipping and Seamen Act 1952 also contains provisions concerning the safety of all other ships plying in and about New Zealand coastal waters.
With the exception of fishing boats not exceeding 40 ft register length, pleasure yachts not exceeding 50 tons register, missionary ships, and certain small vessels engaged in carrying agricultural or pastoral produce, the bull, machinery, and equipment of every New Zealand ship are required to be surveyed once in every 12 months by a Surveyor of Ships of the Marine Department. A certificate of survey sets out the limits in which the vessel may ply, the number of passengers and/or crew she may carry, and the lifesaving appliances to be carried.
Port Safety—All cargo gear used in working cargo must comply with the requirements of the General Harbour (Safe Working Loads) Regulations. Cargo gear is tested and inspected by officers of the Marine Department before being put into use, and is afterwards inspected annually by officers of the Department.
Boilers, Lifts, and Cranes—The Boilers, Lifts, and Cranes Act 1950 is designed to promote the safety of life and limb in the operation of steam boilers, digesters, other steam-pressure vessels, and air receivers; hydraulic, electric, and other lifts; all types of power-driven cranes.
All boilers and power cranes are inspected and certificated once per year and lifts twice per year. In the calendar year 1965 there were 26,497 inspections of boilers, 4,698 inspections of lifts, and 3,164 inspections of cranes.
Mines Department—This Department is responsible for the safety of persons working in mines (both underground and opencast) and in quarries.
The Mining Act 1926 requires that certificates must be held by mine managers of any mine where there are more than 12 men employed above ground, or more than six underground. Provision is made for proper ventilation in mines, the air temperature must not exceed 80° F in any working place, special care is required to be taken in handling explosives, dangerous places must be properly timbered, and special regulations are made as to hauling machinery, etc.
The Coal Mines Act 1925 deals with the control of coal dust, the use of safety lamps, first-aid endorsement on certificates of competency, the prohibition of work in places where the presence of gas is suspected, and the inspection of the mine before the commencement of work, etc.
The Quarries Act 1944 contains provisions as to inspectors, and the appointment, qualifications, and duties of quarry managers. Adequate rules are provided for the safety of workers and the prevention of accidents. The definition of a quarry covers hydro-electric works construction and dams for public water supply.
New Zealand Electricity Department—In addition to its major role of supplying bulk power, the New Zealand Electricity Department, amongst other things, administers the Electricity Act 1945, the Electricity Supply Regulations, the Electrical Wiring Regulations, the Electricians Act 1952, the Electric Linemen Act 1959, and the Gas Industry Act 1958.
The Electrical Wiring Regulations set out minimum requirements for electrical installations, apparatus, and appliances used on consumers' premises. It is the responsibility of Electrical Supply Authorities to inspect such installations to see that they comply with the Wiring Regulations, which are designed to promote safety to life and property. The "Handbook to the Electrical Wiring Regulations 1961'' incorporates explanatory notes and diagrams.
Department of Civil Aviation—The Department is responsible for the safety of aircraft and crews engaged in private and commercial carriage of the public and commercial carriage of goods, including agricultural aviation. The Department lays down standards of aircraft construction and maintenance by means of Civil Airworthiness Requirements and by regulation controls the standards of crew competence and physical fitness.
Department of Internal Affairs—The Department of Internal Affairs, through its Explosives Branch, administers legislation which has as its purpose the protection of life and property from the hazards associated with the handling, storage, transport, and use of explosives, dangerous goods, and cinematograph film.
Explosives—The empowering legislation is the Explosives Act 1957. The regulations in force are the Explosives Regulations 1959, and the Explosives Authorisation Order 1959 lists the explosives which may be imported into or manufactured in New Zealand. The explosives legislation is concerned solely with explosives proper, such as blasting powder, gelignite, and detonators which are used in blasting operations, explosive compositions used in ammunition, signals, or fireworks, and also ammunition signals, and fireworks in then-final manufactured form.
Dangerous Goods—The relevant legislation is the Dangerous Goods Act 1957 and the Dangerous Goods Regulations 1958. Substances controlled under the heading of dangerous goods embrace a wide range of inflammable materials, such as petrol, kerosene, fuel oil, calcium carbide, white phosphorus, ammonium nitrate, the chlorates of sodium, potassium, and calcium, compressed gases, and liquefied petroleum gas.
Cinematograph Films—The Cinematograph Films Act 1961 and its associated regulations include provisions for the licensing of theatres and other buildings in which cinematograph film is projected and of cinematograph-film projectionists.
State Services Commission—Progress towards safety at work can come only from deliberate, informed, and organised effort in every work place. It is a recognised fact that most industrial accidents result from unsafe conditions, unsafe human acts, or from a combination of both. Consequently, occupational accidents, with their resultant loss of productive hours, suffering, and incapacity, will be kept to a minimum only if (a) safe working conditions are provided; and (b) safe working methods are adopted.
To this end the State Services Commission has ensured that positive measures are adopted towards the prevention of accidents at work. It realises that safety at work is important to morale and efficiency. It accepts the fact that leadership in the organisation of safety measures must come from top management. It endeavours to have every worker assured that there is a definite policy for safety based on the best available knowledge and methods, and that organisation and resources are in existence to ensure the implementation of that policy.
Safety work must be, and is, in the hands of experienced people. The Commission itself watches statistics and trends and directs special attention to causes and localities with a high incidence of accidents. It encourages Departments to campaign for safety, and offers active assistance where needed. Also, on behalf of its associated Departments, the Commission is a member of the National Safety Association of New Zealand.
Ministry of Works—On each major construction project the Ministry of Works appoints a senior technical officer to act in the capacity of Safety Officer. He is invariably an officer with considerable practical knowledge and experience of departmental construction works. It his duty to see that every section of the work is safeguarded to the maximum extent.
Safety requirements prescribed in various Goverment Acts and regulations play a major part in safety promotion on construction works. The Safety Officer is required to have a sound working knowledge of these requirements. In addition, he is sent to training courses conducted periodically by the National Safety Association of New Zealand. From this training and with the help of Divisional Technical Staff (Mechanical, Civil Engineering, etc.) to whom he can look for specialised knowledge and assistance, the Safety Officer is well qualified to police the various sections of the works and ensure that the various safety regulations are complied with.
In the main it is the Department's foremen and overseers who can play the most important part in accident prevention on the job. These supervisors are in direct control of the day-to-day work, and by instructing their workers in the use of correct, efficient, and safe working methods, can prevent accidents. It is therefore an important part of the Safety Officer's job to make supervising staff safety conscious. To do this, staff talks on safety are given, circulars, booklets, and extracts from safety regulations are distributed, posters are displayed on the works site, and film showings are made at regular intervals.
Workers' Compensation Board—This Board is a statutory body set up under the provisions of the Workers' Compensation Act. One of its responsibilities is a general requirement to "prevent accidents to workers by such means as the Board thinks fit, and co-operate with any Government Department and other bodies and persons for that purpose''. It is also required to assist in providing facilities for the treatment and rehabilitation of injured persons. It has interpreted these requirements by sponsoring the formation of the National Safety Association of New Zealand (Inc.), and by making grants to the Department of Labour for safety education, the Department of Health for the construction of Industrial Health Centres at Penrose and Mt. Wellington (Auckland), at Petone, and at Woolston and Hornby (Christchurch) and for a Mobile Industrial Health Clinic at Dunedin. It has also made a grant to the Auckland Hospital Board towards the cost of a rehabilitation centre for disabled civilians at Otara (Auckland). The Board also sponsors a scheme for first-aid instruction in remote areas by the Order of St. John.
National Safety Association of New Zealand (Inc.)—This organisation was sponsored and is largely financed by the Workers' Compensation Board. It comprises member firms interested in promoting occupational safety, and is controlled by an elected executive functioning through specialist committees, five branch committees, and a small headquarters staff, together with a number of field officers. It seeks to stimulate firms and organisations in taking all possible measures to reduce accidents in their own establishments, and especially in establishing their own internal safety organisations, full-time or part-time safety officers, and where possible joint management-worker safety committees. The Association also issues safety education material, undertakes general safety instruction and supervisor training within firms through its field staff, and organises periodical courses for farm safety officers and industrial safety officers. Its field of interest is substantially limited to occupational safety.
GENERAL—New Zealand territory overseas falls into the following categories: self-governing territory (Cook Islands); territory which is mainly self-governing (Niue Island); non-self-governing territory (Tokelau Islands); administered territory (Ross Dependency).
Self-governing Territory—The 15 Cook Islands achieved a status of self-government in free association with New Zealand on 4 August 1965. The Cook Islands were proclaimed a British Protectorate in 1888, and on 11 June 1901, they were annexed and proclaimed part of New Zealand under the Colonial Boundaries Act 1895. Prior to the advent of self-government, the group had been a non-self-governing territory administered under the Cook Islands Act 1915 and the Island Territories Act 1943.
Territory which is Mainly Self-governing—The island of Niue, which was also brought within the boundaries of New Zealand in 1901, has reached a stage of internal self-government. The Resident Commissioner, however, is still the head of the executive government of Niue. Any future constitutional development on Niue would still be subject to negotiations with the New Zealand Government, and the New Zealand Parliament can still legislate for Niue.
Non-self-governing Territory—The Tokelau Islands became a legal part of New Zealand in 1949. The group had formerly been part of the Gilbert and Ellice Islands Colony, although New Zealand had administered it on behalf of the United Kingdom since 1925.
Reports on the progress made in both Niue and the Tokelau Islands are forwarded annually to the United Nations.
Administered Territory—New Zealand administers the Ross Dependency on behalf of the United Kingdom Government. The Ross Dependency has been inhabited for some years by parties of persons maintaining the permanent scientific bases.
Nauru Island is administered by Australia under a trusteeship arrangement held jointly by the British, New Zealand, and Australian Governments.
The term “New Zealand territory overseas” does not include Stewart Island or the Chatham Islands, which form part of New Zealand. The following minor islands, which are referred to on page 1 of this Yearbook, are also excluded: Three Kings Islands, Auckland Islands, Campbell Island, Antipodes Islands, Bounty Islands, Snares Islands, and Solander Island. Apart from Campbell Island, none of these islands is regularly inhabitated, but a scientific staff of 11 men is stationed on Campbell Island maintaining meteorological records, conducting ionospheric research, and manning a radio station. The Kermadec Islands are also excluded for, although they are in the same category as the Cook Islands in that they originally ranked as annexed islands, all New Zealand laws extend to them and there is no separate administration. A meteorological station and an aeradio station have been established on Raoul Island and have an official staff of 10 men. This is the only island of the Kermadec Group that is inhabited.
In 1919 New Zealand was given a mandate over Western Samoa; this became a trusteeship in 1946 under the Trusteeship Council of the United Nations, and was terminated on 1 January 1962 with the granting of independence to Western Samoa. The emergence of Western Samoa as the first fully-independent Polynesian State has not severed the close ties of friendship existing between New Zealand and Western Samoa. The New Zealand Government, in appreciation of the difficulties being faced by a new State, endeavours to give all possible aid and assistance when requested to do so. A programme of assistance to education is the most important assistance scheme being continued by New Zealand.
The Minister of Island Territories is charged with the administration of Niue and the Tokelau Islands and in terms of the Cook Islands Constitution Amendment Act 1965 he has also been designated as the Minister charged with handling Cook Islands affairs in so far as they affect New Zealand. The Department of Island Territories is the executive agency for the administration of Niue and the Tokelau Islands and the channel of communication between the New Zealand and the Cook Islands Governments. The Department controls the operations of the N.Z.G.m.v. Moana Roa and the purchase and shipping of equipment, stores, etc., to island administrations. In addition, the Department takes an interest in the welfare of islanders in New Zealand, and is associated with the South Pacific Commission and the South Pacific Health Service. The former is an advisory and consultative body set up by the Governments of Australia, France, New Zealand, Britain, and the United States of America, all of which are responsible for the administration of non-self-governing territories in the Pacific. The functions of the Commission are to recommend to the member Governments means for promoting the social, economic, and medical welfare of the peoples in the region, and to this end several projects have been organised. The South Pacific Health Service advises member Governments on health matters, collects and distributes epidemiological information, assists in the maintenance of professional staffs, and encourages medical research and the training of indigenous people as assistant medical practitioners and nurses.
The Department also administers a training scheme under which selected students and trainees from the Cook, Niue and Tokelau Islands receive secondary and higher education and vocational training in New Zealand. The Department of Education's Officer for Islands Education advises the Department on educational policy matters, assists with the appointment of New Zealand teachers on secondment, the publication of school journals and textbooks in the vernacular of the different groups, and the supply of modern teaching equipment.
By arrangement between the Governments of Western Samoa, Fiji, and New Zealand, young Samoans, Cook Islanders, Niueans, and Tokelau Islanders receive training at the Fiji School of Medicine in Suva to equip them for duty in their own territories as medical officers, assistant dental officers, pharmacy and laboratory assistants, and assistant health inspectors.
COOK ISLANDS: Descriptive—There are 15 islands in the Cook Group, scattered over an area of some 850,000 square miles of ocean, and extending from Penrhyn, situated 9° south of the Equartor, to Mangaia, which is just north of the Tropic of Capricorn. The Cook Islands are bounded on the east and west by the 156th and 167th meridians of west longitude respectively, and on the north and south by the 8th and 23rd parallels of south latitude. The total land area of the 15 islands is approximately 93 square miles, while Niue has an area slightly in excess of that figure.
Of the islands of the Southern Group, Rarotonga, Aitutaki, Atiu, Mitiaro, Mauke and Mangaia are elevated and fertile, while Manuae and Takutea and the islands of the Northern Group, comprising Penrhyn, Manihiki, Rakahanga, Pukapuka, Palmerston, Nassau, and Suwarrow, are sea-level coral atolls, As a consequence the southern islands support the greater population. With one exception, Penrhyn, none of the islands possesses a good harbour.
The whole of the Cook Islands lie within the hurricane zone, and a number of destructive storms have been experienced. The Cook Islands are covered by a meteorological service with headquarters in Fiji, and advance warning of the intensity and path of tropical storms is available and enables precautions to be taken to protect life and property. From December to March the climate is warm and humid, and there is always the possibility of serious storms. In the remaining months of the year the climate of the Southern Group is mild and equable. The mean annual temperature in Rarotonga taken over the last 40 years was 74.5° F, and the average yearly rainfall over the same period was 84 in.
Administration: Executive Government—The Executive Government of the Cook Islands is vested in the Crown in the right of the Government of New Zealand. The Cook Islands Constitution Amendment Act 1965 provides for the appointment by the Governor-General of a High Commissioner of the Cook Islands as the representative of Her Majesty the Queen in the Cook Islands, and also as the representative of the Government of New Zealand in the Cook Islands.
The general direction and control of Executive Government lies with a Cabinet of Ministers comprising the Premier of the Cook Islands and no fewer than three nor more than five other Ministers. The Premier is appointed by the High Commissioner as the member of the Assembly commanding the confidence of the majority of the members of the Assembly, and the other Ministers are appointed by the High Commissioner on the advice of the Premier. An Executive Council of the Cook Islands, consisting of the High Commissioner of the Cook Islands and the members of Cabinet, may be summoned by the High Commissioner or the Premier to consider any Cabinet decision, and has power to ask Cabinet to reconsider its decisions. If Cabinet, after reconsideration, reaffirms its original decision, this decision is forthwith put into operation.
The principal administrative officer of the Government of the Cook Islands is the Secretary of the Premier's Department, who is appointed by the High Commissioner acting on the advice of Cabinet. The Cook Islands Public Service is controlled by the Secretary of the Premier's Department and is organised in the following departments: Agriculture, Education, Health, Justice, Police, Post Office, Electric Power, Public Works, Radio, Social Development, Co-operatives, Survey, Treasury, and Customs. In most cases the heads of these departments are expatriate officers. In the outer islands, Resident Agents, subject to the control of the Secretary of the Premier's Department, are responsible for all aspects of administration.
The House of Arikis—The House of Arikis of the Cook Islands consists of up to 15 arikis representing all islands in the Group, and is required to meet at least once every 12 months. The House considers any matters relative to the welfare of the people of the Cook Islands which may be submitted to it for consideration by the Legislative Assembly and has such other functions as may be prescribed by law.
Islands Councils—Island councils exist in each of the main islands of the Cook Islands. The Rarotonga Island Council was established by the Rarotonga Island Council Ordinance 1958 and reconstituted by the Rarotonga Island Council Amendment Act 1965. The powers and authority formerly vested in the Resident Commissioner are now carried out by the Cook Islands Minister of Justice.
The councils of the islands of Aitutaki, Atiu, Mangaia, Manihiki, Mauke, Mitiaro, Penrhyn, Pukapuka, and Rakahanga, were established by the Island Councils (other than Rarotonga) Ordinance 1960. Changes in the constitution of these island councils following the attainment of self-government have not yet been considered in detail.
The councils meet regularly and are empowered to make bylaws for the imposition of tolls, rates, taxes, and other charges (except Customs duties) and to carry out various works and services on each island.
Legislative Government—The Legislative Assembly of the Cook Islands, as constituted by the Cook Islands Constitution Amendment Act 1965, consist of 22 members, all elected by secret ballot under a system of universal suffrage by the electors of the following islands: Three members from Aitutaki and Manuae; two members each from Atiu and Mangaia; one member each from Manihiki, Mauke, Mitiaro, Penryhn, and Rakahanga; one member from Pukapuka and Nassau; nine members from Rarotonga and Palmerston.
Elections are normally held at three-yearly intervals and the last general elections were held on 20 April 1965. There is a common roll for both Maoris and non-Maoris. The Speaker of the Legislative Assembly is elected by members from persons within or without the Assembly.
The Legislative Assembly may make laws (known as Acts) for the peace, order, and good government of the Cook Islands. (These powers extend to the making of laws having extraterritorial operation.) The responsibilities of the Crown in right of New Zealand for the external affairs and defence of the Cook Islands are discharged after consultation by the Prime Minister of New Zealand with the Premier of the Cook Islands.
The Constitution of the Cook Islands is the supreme law of the Cook Islands and the Legislative Assembly alone has power to amend or repeal it. Such repeal or amendment, however, can only be made by a two-thirds affirmative vote of the Assembly followed by an interval of not less than 90 days.
By virtue of the British Nationality and New Zealand Citizenship Act 1948, Cook Islanders remain British subjects and New Zealand citizens.
Population and Vital Statistics—The Cook Island Maori is a Polynesian and is closely related to the New Zealand Maori. There is a strong resemblance between the two peoples in tradition, language, and custom. Many of the tribes in both places are able to trace their descent back to a common ancestor.
A census of the Cook Islands taken on 1 September 1966 recorded a total population of 19,251, an increase of 873 or 4.75 percent as compared with the Census of 25 September 1961. Details of population of the islands of the group as at 1 September 1966 are set out in the following table.
| Island | Males | Females | Total |
|---|---|---|---|
| Rarotonga | 4,990 | 4,905 | 9,895 |
| Aitutaki | 1,296 | 1,321 | 2,617 |
| Mangaia | 982 | 1,019 | 2,001 |
| Atiu | 702 | 626 | 1,328 |
| Mauke | 333 | 337 | 670 |
| Matiaro | 144 | 149 | 293 |
| Manuae | 15 | – | 15 |
| Palmerston | 37 | 48 | 85 |
| Pukapuka | 356 | 328 | 684 |
| Nassau | 98 | 69 | 167 |
| Manihiki | 313 | 271 | 584 |
| Rakahanga | 161 | 160 | 321 |
| Penrhyn | 314 | 277 | 591 |
| Suwarrow | – | – | – |
| Totals | 9,741 | 9,510 | 19,251 |
During the year ended 31 December 1965 births numbered 857 and deaths 147. The number of deaths of children under one year of age was 34.
Health—All Cook Islanders receive free medical and surgical treatment. They also receive free dental treatment.
Although lying within the tropics, the Cook Islands are singularly free from the common diseases prevalent in other tropical islands. Malaria is unknown, but filariasis is endemic, and this and tuberculosis provide the main health problems of the group. The objective of the health services—to improve the health of the community—is being pursued by a system of village sanitary inspection and group medical examination, combined with modern treatment of disease in dispensary, clinic, and hospital.
The staff of the Health Department numbered 157 at 31 March 1966.
A general hospital (72 beds) equipped with dispensary, X-ray, and laboratory facilities, and a tuberculosis sanatorium (70 beds) are maintained in Rarotonga. In the outer islands, dispensaries with accommodation for a few patients are operated by assistant medical practitioners. Cottage hospitals have been built at Aitutaki, Atiu, Penrhyn, Manihiki, Pukapuka, and Mangaia.
Education—Primary education in the Cook Islands is provided by the Government, the Roman Catholic Mission, and the Seventh Day Adventist Mission, post-primary education being provided by the Government for children selected from throughout the Group.
Education is free and compulsory between the ages of six and 16 years. At 31 March 1966 the total number of pupils on the rolls was 5,666, comprising 5,288 pupils at Government schools and 378 at denominational schools. Under the New Zealand Government's Training Scheme 30 scholars proceeded to New Zealand early in 1966.
Labour and Employment—There is a wide variation in types of employment in the different islands. On the atolls in the Northern Group the people subsist largely on coconuts and fish, and there is little opportunity for them to engage in other pursuits which would provide exports and a consequent higher living standard. In the islands of Manihiki and Penrhyn pearl diving is carried out under regulations which restrict this employment to Polynesians, and otherwise govern the industry. A strict control of this industry is enforced to ensure that the beds are not depleted. It is in the fertile islands of the Southern Group that most of the population is concentrated, and labour is required for the growing, harvesting, packing, and shipment of fruit and copra, the staple production on which living standards depend. As most of the land in these islands is held by family groups under customary tide, the bulk of the people are engaged in work on their own plantations. There is, however, opportunity for wage earners in Government departments, in plantation work, and in the handling of fruit for export.
In Rarotonga secondary industries have been established in the form of two clothing factories and a fruit juicing and canning factory. Products from these industries are exported to the New Zealand market. The manufacture of handicraft is on a domestic basis.
A number of Cook Island Maoris go to New Zealand to seek employment or to learn trades.
Agriculture—The principal export crops of the Cooks Islands are citrus fruit, copra, pineapples, and tomatoes. The following are the estimated areas planted in the principal crops: coconuts, 28,250 acres; citrus fruits, 1,190 acres; taro 478 acres; bananas, 2,000 acres; tomatoes, 1,050 acres; pineapples, 750 acres; manioc, 352 acres; kumeras, 215 acres; yams, 50 acres; coffee, 220 acres.
Transport and Communications—The New Zealand Government vessel, Moana Roa, maintains a service between New Zealand and the Cook Group at approximately monthly intervals visiting Rarotonga and those of the outer islands which are offering cargo. Occasional calls at Rarotonga are also made by trans-Pacific cargo vessels. The Matson Line vessels regularly visit Rarotonga en route from the Pacific coast of America and uplift passengers and mail.
Radio communication has largely removed the former isolation of the islands, there being now no permanently inhabited island without a radio station. The chief station is Rarotonga Radio, which maintains direct communication with the substations and with Wellington, Apia, and Suva. Postal and telegraph services are available in all the islands. There is a telephone service in Rarotonga and a limited service operates on Aitutaki.
Trade—A summary of exports by country of destination and imports by country of origin for the last five years is contained in the next table.
| Country | 1961 | 1962 | 1963 | 1964 | 1965 |
|---|---|---|---|---|---|
| Imports $(000) | |||||
| New Zealand | 1,345 | 1,334 | 1,768 | 2,171 | 2,122 |
| Australia | 107 | 71 | 69 | 84 | 189 |
| United Kingdom | 209 | 103 | 204 | 130 | 133 |
| Canada | 45 | 27 | 45 | 12 | 50 |
| United States of America | 57 | 71 | 95 | 93 | 97 |
| Japan and Hong Kong | 54 | 197 | 203 | 103 | 318 |
| Other | 225 | 71 | 68 | 183 | 158 |
| Totals | 2,043 | 1,875 | 2,452 | 2,777 | 3,067 |
| Exports $(000) | |||||
| New Zealand | 1,122 | 1,351 | 1,649 | 1,842 | 1,837 |
| Australia | 26 | 12 | 3 | 10 | 9 |
| United States of America | 1 | 1 | 1 | 2 | 3 |
| United Kingdom | 1 | – | 1 | 1 | – |
| Other | 47 | 58 | 15 | 12 | 19 |
| Totals | 1,196 | 1,421 | 1,670 | 1,867 | 1,868 |
There is free trade between the Cook Islands and New Zealand. The New Zealand Customs Tariff applies in the Cook Islands as modified by the Cook Islands Customs Duty Order 1962. The New Zealand Government makes an allocation of overseas exchange annually to the Cook Islands Government and by agreement, the Cook Islands Government in the use of this exchange follows, where appropriate, the import policies applying in New Zealand. Import licences are required for goods imported from countries other than New Zealand.
Details of the quantities and values of the principal commodities exported are shown below.
| Commodity | 1964 | 1965 | ||
|---|---|---|---|---|
| Quantity | Value | Quantity | Value | |
| cases | $(000) | cases | $(000) | |
| Citrus fruits | 101,964 | 308 | 52,740 | 124 |
| Bananas | 7,419 | 19 | 6,031 | 15 |
| Pineapples | 4,058 | 8 | 8,834 | 18 |
| boxes | boxes | |||
| Tomatoes | 61,387 | 107 | 101,886 | 176 |
| tons | tons | |||
| Copra | 1,312 | 150 | 875 | 253 |
| Mother-of-pearl shell | 63 | 52 | 20 | 30 |
| Handicrafts, grassware, etc. | ... | 22 | ... | 34 |
| Manufactured goods | ... | 141 | ... | 479 |
| Jewellery | ... | 2 | .... | 4 |
| gallons | gallons | |||
| Fruit juice | 639,667 | 787 | 685,029 | 793 |
Foodstuffs continue to be the largest class of import; major imports are set out in the following table.
| Commodity | Value | Percentage of Total Imports | ||
|---|---|---|---|---|
| 1964 | 1965 | 1964 | 1965 | |
| $ | $ | percent | percent | |
| Foodstuffs | 705,016 | 716,518 | 26.88 | 23.37 |
| Drapery and piece goods | 417,250 | 399,802 | 15.91 | 13.03 |
| Oils and petrol, etc. | 114,818 | 92,900 | 4.38 | 3.03 |
| Tobacco and cigarettes | 40,642 | 50,708 | 1.78 | 1.68 |
| Vehicles and parts | 131,438 | 141,034 | 5.01 | 4.59 |
| Timber and cement | 139,954 | 138,434 | 5.34 | 4.51 |
Public Finance—New Zealand currency is in use in the Group. The principal sources of revenue within the Group in 1965 were import duties $292,496, export duties $10,416, stamp sales $25,462, and income tax $86,102.
The New Zealand Government has continued to make subsidies and grants available for capital development in health, education, and other social services. Subsidies are fixed three-yearly in advance.
A comparative statement of receipts and expenditure for the last five years is now given.
| Year | Subsidies from New Zealand | Receipts from Cook Islands | Expenditure |
|---|---|---|---|
| $(000) | $(000) | $(000) | |
| 1960–61 | 1,150 | 1,020 | 2,236 |
| 1961–62 | 1,256 | 1,042 | 2,188 |
| 1962–63 | 1,474 | 1,060 | 2,184 |
| 1963–64 | 1,550 | 1,326 | 2,506 |
| 1964–65 | 1,618 | 1,614 | 3,260 |
The principal items of expenditure in 1965–66 were $668,368 on education, $416,594 on health services, and $296,798 on public works.
NIUE: Descriptive—Niue Island, discovered by Captain Cook in 1774, became part of New Zealand in 1901, when the boundaries of New Zealand were extended to include the Cook Islands. The island is situated in latitude 19° 02' south and longitude 169° 52' west, somewhat west of the centre of the irregular triangle formed by Samoa, Tonga, and the southern Cook Islands, and is 600 miles distant from the latter. The island, which has an area of 64,028 acres, is an elevated coral outcrop with a coral reef fringing a precipitous and broken coastline. The central saucer-shaped plateau, rising to a height of 220 ft, is encircled by a narrow terrace about 90 ft. above sea level. The soil, though fertile, is not plentiful, and this feature, combined with the rocky and broken nature of the country, makes cultivation difficult. The climate is mild and equable, but the island is in the hurricane belt. The mean annual temperature is 76.6° F, and the average annual rainfall is 79.4 in.
Administration—The Niue Act 1966 provides for the appointment of a Resident Commissioner charged with the administration of the Executive Government of Niue. Under statutory authority the Resident Commissioner may delegate any of his powers to the Executive Committee of the Niue Island Assembly, over which he presides. The Assembly meets regularly and consists of 14 members elected by universal suffrage and representing all villages on the island. The Executive Committee has four members, one of whom acts as Leader of Government Business. The Executive Committee does in fact exercise powers delegated to it by the Resident Commissioner over a wide range of Government activities.
Laws are made by Act of the New Zealand Parliament, or regulations issued thereunder, or by ordinances passed by the Assembly.
Population and Vital Statistics—The Niuean is of Polynesian stock and the language a Polynesian dialect peculiar to the island, but closely related to that of Tonga, Samoa, and Cook Islands.
The population at the census at 28 September 1966 was 5,199 comprising 2,535 males and 2,664 females.
The inhabitants are distributed amongst 12 villages, of which Alofi is the largest. Niueans are British subjects and New Zealand citizens. A number of Niueans migrate to New Zealand each year.
For the calendar year 1965 births totalled 195 and deaths 46. There were 2 deaths of children under one year of age, the infant mortality rate per 1,000 live births being 15.3.
Health—Niue, although situated in the tropics, is largely free from diseases prevalent in tropical countries. The Niuean standard of general hygiene is very good by Pacific standards.
All medical and dental treatment, including hospital services, is provided free of charge, the money for this expenditure being provided out of subsidies from the New Zealand Government. There is a Government hospital. Attached to the hospital is an outpatients department, X-ray unit, laboratory, and dispensary. The staff at April 1966 numbered 56.
The amounts expended on public health during the past five years were as follows.
| Item | 1961–62 | 1962–63 | 1963–64 | 1964–65 | 1965–66 |
|---|---|---|---|---|---|
| Amount expended | $125,600 | $108,956 | $110,848 | $110,848 | $108,688 |
| Population | 4,864 | 4,885 | 5,044 | 5,145 | 5,157 |
| Amount per head of population | $26.8 | $22.3 | $22.0 | $20.6 | $20.2 |
Education—The seven primary schools, the high school, and side school are all under the control of the Government.
The total number of children attending school in Niue at 31 March 1966 was 1,604 and scholarship pupils attending; school or receiving training in New Zealand numbered 52. Education is free and compulsory for those aged from six to 14 years.
Labour and Employment—The only substantial employer of labour is the Government, which employs Niueans in the Education, Police, Public Works, Health, Agriculture, and other Departments, and in the loading or discharge of vessels. A large number of unskilled labourers are employed on public works. There is no unemployment problem.
Agriculture—The principal agricultural exports are copra, bananas, and kumeras. All the copra exported is grown by the Niueans.
The extremely rocky nature of the ground makes all agriculture difficult, as practically the whole of the arable land is confined to small pockets of soil among the coral rocks. Of the total area of some 65,000 acres, approximately 48,000 acres are more or less continuously cultivated, while some 8,000 acres are in forest. The remaining 9,000 acres are either in coastal forest and scrub, light forest, or heavy forest. The Agriculture Department has a programme for soil study and plant improvement, rehabilitation of coconut areas and rearing of cattle for local consumption.
As the Niuean depends for his livelihood upon his family lands, alienation is prohibited, so that there are no landowners apart from the Niueans and the Government.
Transport and Communication—There are no internal transport services. The transport of goods and produce to and from the port of Alofi is carried out by Government and privately-owned motor vehicles. There are some 76 miles of all-weather roads on the island.
At Alofi there is an open roadstead only, and cargo is handled by lighters.
Full postal services are provided at Alofi, where there is a Post Office Savings Bank. A single-line telephone system connects all villages on the island, and a radio station is maintained by the Government for overseas communication.
Trade—During 1965 inward cargo totalled 3,950 tons, while outward cargo totalled 1,716 tons. As usual the bulk of the trade was with New Zealand.
The values of exports and imports for the latest five years available are given below.
| Year | Exports | Imports | Total Trade |
|---|---|---|---|
| $(000) | $(000) | $(000) | |
| 1961 | 70 | 478 | 548 |
| 1962 | 61 | 367 | 428 |
| 1963 | 102 | 326 | 428 |
| 1964 | 155 | 456 | 611 |
| 1965 | 130 | 502 | 632 |
Exports of principal commodities over the latest five years were as follows (there were no copra exports in 1961 because of the effects of hurricanes).
| Item | 1961 | 1962 | 1963 | 1964 | 1965 | |||||
|---|---|---|---|---|---|---|---|---|---|---|
| Quantity | Value | Quantity | Value | Quantity | Value | Quantity | Value | Quantity | Value | |
| $ | $ | $ | $ | $ | ||||||
| Copra (tons) | – | – | 130 | 12,064 | 353 | 37,304 | 577 | 66,176 | 347 | 47,136 |
| Bananas (cases) | 5,371 | 11,950 | 3,122 | 6,932 | 3,813 | 8,458 | 6,356 | 14,440 | 4,907 | 12,750 |
| Kumeras (bags) | 14,176 | 28,488 | 3,947 | 10,768 | 4,700 | 20,020 | 8,145 | 33,580 | 3,141 | 13,360 |
| Plaited ware | ... | 6,208 | ... | 3,780 | ... | 3,796 | ... | 10,426 | ... | 14,834 |
| Principal exports | ... | 46,646 | ... | 33,442 | ... | 69,578 | ... | 124,622 | ... | 88,080 |
The New Zealand Customs Tariff as modified by the Cook Islands Customs Duty Order 1962 is in force, and there is free trade between the island and New Zealand.
Public Finance—Revenue on the island is raised principally from import and export duties, the sale of stamps and High Court fines. Local income tax is levied in accordance with the Income Tax Ordinance of 1961 and an “aid to revenue” tax of 5c in $2 is imposed on wage earners if their income is not otherwise subject to income tax.
Deficits are met by a subsidy from New Zealand. A comparative statement of receipts and expenditure during the latest five financial years is given in the following table.
| Year | Receipts | Expenditure | Subsidy |
|---|---|---|---|
| $(000) | $(000) | $(000) | |
| 1961–62 | 456 | 1,012 | 558 |
| 1962–63 | 362 | 844 | 544 |
| 1963–64 | 388 | 764 | 572 |
| 1964–65 | 470 | 1,048 | 602 |
| 1965–66 | 582 | 1,235 | 695 |
TOKELAU ISLANDS: Descriptive—Situated some 300 miles to the north of Western Samoa, between 8° and 10° south latitude and between 171° and 173° west longitude, are the three atoll islands of Atafu, Nukunonu, and Fakaofo, of the Tokelau Group. A fourth island, Olosega, belonging to the United States of America and lying 100 miles to the south of Fakaofo, completes the group.
Each atoll is composed of a number of coral islets surrounding a central lagoon. These islets vary in size from 100 yards in length, while none is wider than 400 yards nor, with but few exceptions, higher than 10 ft above sea level. The land area of each atoll is approximately as follows: Fakaofo, 650 acres; Atafu, 500 acres; Nukunonu, 1,350 acres. The atolls do not lie in close proximity, there being 40 miles of open sea between Fakaofo and Nukunonu and 57 miles between Nukunonu and Atafu.
Owing to the absence of humus in the soil, the vegetation is practically restricted to coconut palms, although one islet of each atoll is reserved for growing the tauanave, a short stubby tree, which yields to the Tokelau Islanders their only timber for the construction of canoes and utensils.
Administration—The Tokelau Islands were included under the protection of Great Britain in 1877. In 1916 the islands, at the request of the inhabitants, were formally annexed to Great Britain by an Order in Council, which also extended the boundaries of the Gilbert and Ellice Islands Colony to include the Tokelau Group (then known as the Union Islands) and their dependencies. The group was governed by the High Commissioner for the Western Pacific and administered by the District Officer at Funafuti, in the Ellice Group. In 1925 the New Zealand Government, at the request of the British Government, agreed to administer the islands. By Order in Council the group was separated from the Gilbert and Ellice Islands Colony, and by a further Order in Council in the same year the Governor-General of New Zealand was empowered to make laws for its peace, order, and good government.
By the Tokelau Islands Act 1948 the Tokelau Group was included within the territorial boundaries of New Zealand; legislative powers are now invested in the Governor-General in Council. The inhabitants of the Tokelau Islands are British subjects and New Zealand citizens.
The High Commissioner for New Zealand in Western Samoa is Administrator of the Tokelaus and in this capacity is responsible to the Minister of Island Territories.
The general isolation of the Tokelau Islands and the limited nature of the economy have combined to produce an extremely simple pattern of living and a stable society in which there is freedom from social problems. The absence of such complicating factors as divergent economic interests, cultural differences, or racial conflict is conducive towards the maintenance of the present peaceful mode of life and outlook. Village affairs are managed by the Council of Elders, or “fono”, comprising representatives of the families, and this body also exerts influence over the “aumaga” or village labour force. In this way the traditional form of patriarchal authority has been preserved and regulates Tokelau society, performing a service alongside, and also in addition to, the public duties of government which are carried out by local officials such as Faipule and the Pulenu'u.
Population—The people are closely allied to the Samoans. On 24 September 1966 a census showed a total population of 1,900.
| Island | Males | Females | Total |
|---|---|---|---|
| Atafu | 291 | 325 | 616 |
| Fakaofo | 336 | 397 | 733 |
| Nukunonu | 265 | 286 | 551 |
| Totals | 892 | 1,008 | 1,900 |
Health—Health services in the Tokelau Islands are organised and supervised from Apia. The incidence of disease in the islands is comparatively slight.
Samoan medical practitioners are stationed in the group. Other medical staff consists of staff nurses, nurses, and dressers, who obtain their training at Apia hospital in Western Samoa. In addition, each atoll has an active women's committee, and to these committees much credit is due for their work in village health and sanitation.
Education—There are now 18 trained Tokelau teachers in the group. All the necessary school equipment, stationery, and textbooks are supplied by the New Zealand Government; the schools also receive copies of the Samoan Teachers Monthly Guide and of Samoan and New Zealand School Journals. In addition, they are equipped with filmstrip projectors and also with radio sets so that the daily educational broadcasts of the Western Samoan Education Department may be utilised. The mission school on Nukunonu is equipped by the New Zealand Government in a similar fashion to the schools of the outer islands.
Tokelau pupils are included in the training scheme for education in New Zealand, and selected students also receive schooling and training in Western Samoa and Fiji.
Communications—Trading visits are made at fairly regular intervals by a chartered vessel. Radiotelegraph receivers and transmitters are operated on each atoll. In addition, radio receiving sets are installed in all villages and enable the people to listen to broadcasts from the Apia broadcasting station.
Trade and Finance—The quantity of copra shipped for the year ended 31 March 1966 amounted to 270 tons. Apart from copra the only exports are handicrafts.
Revenue is derived principally from export duty on copra, Customs duty of 12 1/2 percent ad valorem on all goods entering the islands, trading profits, and the sale of postage stamps. Expenditure for the year 1965 was $75,836.
Under the Tokelau Islands Copra Regulations 1952 a Copra Stabilisation Fund was established by a levy on purchases of copra for export, and is used to supplement the prices received by the producers, or by the purchasers on resale after export, as may be necessary from time to time. At 31 March 1966 there was $18,704 in the fund.
ROSS DEPENDENCY: Descriptive—The Ross Dependency comprises the sector of the Antarctic continent between 160° east and 150° west longitude, together with the islands lying between those degrees of longitude and south of latitude 60° south.
Within these boundaries there are an estimated 160,000–175,000 square miles of land and 130,000 square miles of permanent ice shelf. The land is virtually entirely covered by ice, but has bases inhabited by scientific personnel.
Administration—By Order in Council of 30 July 1923 under the British Settlements Act 1887 (Imp.) the territories of the Ross Dependency were brought within the jurisdiction of the New Zealand Government. From time to time laws for the Dependency have been made by regulations promulgated by the Governor-General of New Zealand.
Administrative powers are vested in the Governor-General of New Zealand, and administrative officers (commonly referred to as Administrators) have been appointed from time to time since 1923. In 1956 a Deputy Administrator was also appointed, and other officers were given the powers of Stipendiary Magistrate, coroner, and postmaster.
In November 1963 the Governor-General of New Zealand visited the Dependency and resided for several days at Scott Base. Through the courtesy of the United States Navy, he was able to visit the South Pole and Byrd Station and to see New Zealand teams in the field.
The New Zealand Geographic Board, which is the place-names authority for the Ross Dependency, published in 1958 a provisional Gazetteer of the Ross Dependency. A supplement to the provisional Gazetteer was published in 1960, and second and third supplements in 1963.
The New Zealand Government decided that the New Zealand bases in the Ross Dependency would continue to be operated after the conclusion of the International Geophysical Year. In March 1958 the Government appointed the Ross Dependency Research Committee to co-ordinate and supervise all New Zealand activity in the Ross Dependency, with particular reference to the scientific and technical programme, and to co-operate with other countries operating in Antarctica.
The implementation of the approved programme is the responsibility of the Department of Scientific and Industrial Research which has an Antarctic Division.
Responsibility for co-ordinating the scientific details of the approved programme, the procurement of scientific equipment and spares, and the working up of scientific data has been delegated as follows: Meteorology, Director, New Zealand Meteorological Service; Survey and Maps, Surveyor-General, Department of Lands and Survey; Geology and Glaciology, Director, Geological Survey; Special Upper Atmosphere Investigations and Aurora, Director, Dominion Physical Laboratory; Seismology, Geomagnetism, Ionosphere, Director, Geophysics Division; Oceanography, Director, Oceanographic Institute; Biology, Director, Dominion Museum.
New Zealand's international relations on Antarctic affairs are conducted at the political level by the Department of External Affairs. Whilst scientific contact with other countries and institutions engaged in Antarctic research is maintained at all levels, the primary channel is the Ross Dependency Research Committee.
Exploration—Various expeditions have operated within the area of the Dependency since the coastline was explored by Sir James Ross in 1841.
In December 1956 a New Zealand expedition under the leadership of Sir Edmund Hillary sailed for McMurdo Sound in HMNZS Endeavour. In January 1957 Scott Base was established near Cape Armitage on Ross Island. The purpose of the expedition was twofold: to take part in the crossing of the continent from the Weddell Sea to Scott Base by the Commonwealth Trans-Antarctic Expedition, and to participate in the Antarctic programme of the International Geophysical Year. During the early months of 1957 the expedition was successful in finding a route and setting up depots across the Ross Ice Shelf and up the Skelton Glacier to the Polar Plateau.
In the summer of 1957–58 the expedition explored a route farther south and established depots for the use of the crossing party of the Commonwealth Trans-Antarctic Expedition. Sir Edmund Hillary and four other New Zealanders reached the South Pole on 3 January 1958. The crossing of the continent was successfully achieved on 20 March 1958 when Sir Vivian Fuchs's party reached Scott Base. Further reference to the activities was made in Appendix (d) of the 1958 Yearbook.
Scientific Programme—For the purposes of the International Geophysical Year a joint New Zealand-United States scientific station, known as Hallett Station, was established at Cape Hallett in January 1957. Throughout the International Geophysical Year New Zealand maintained at Scott Base and Hallett Station a scientific programme in close accord with the aims and objects of the IGY. (References to these activities are contained in Appendix (d) of the 1958 Yearbook.)
Since 1957, at Scott Base, regular observations have been undertaken in seismology, geomagnetism, ionosphere, meteorology, aurora, and glaciology.
Field Survey Work—Field parties generally using dog teams and sledges, have since 1957–58 completed a geological and topographical survey of the whole of the exposed land area in the Dependency.
The Lands and Survey Department has issued a series of 25 maps based on survey work carried out by New Zealand field teams in the Antarctic during the past few years. More are in course of preparation.
Whaling—Regulations dated 24 October 1929 prohibit whaling in the territorial waters of the Ross Dependency without a licence. New Zealand is a member of the International Whaling Commission, the purpose of which is to enforce conservation of whale stocks.
NAURU—Nauru island is about half a degree below the equator and lies 166° 55' east of Greenwich. It is an elevated island about 3 1/2 miles long and 2 1/2 miles wide, with a circumference of 12 miles, and an area of 5,263 acres. With the exception of a narrow coastal belt favourable for the growth of coconuts, and of a brackish lagoon, the island consists or phosphate deposits overlying a bed of coralliferous limestone. There are about 1.3 million tons of phosphate rock exported annually.
Nauru was brought under the International Trusteeship system by a trusteeship agreement which was approved by the General Assembly of the United Nations on 1 November 1947. The Governments of Australia, New Zealand, and Britain were designated as the joint Administering Authority, and it was agreed that the Australian Government should continue to administer the island on their behalf. Plans are being discussed for the resettlement of the 2,500 Nauruans as a community in or near Australia.
WIDE RANGE OF ATTRACTIONS—New Zealand has often been described as “the world's most exciting travel package”. With features such as the amazing thermal areas, magnificent lakes and fiords, glaciers, alpine regions, and unrivalled hunting, fishing, and other sporting opportunities, New Zealand combines in a comparatively small area a host of attractions—each one could make a country famous. In addition to these natural attractions, the dignity and charm of the Maori race offers a culture for study which is unique to New Zealand.
While some of the older countries and regions have huge, long-established tourist industries, the Pacific area has only recently come significantly into the expanding field of international tourism. New Zealand has been brought more easily into the compass of international tourism by improvements in transport services. Further development of tourism by Pacific countries cannot fail to make New Zealand more conveniently accessible to travellers and sportsmen. Of the 77 million tourist arrivals in 1961, Europe claimed 55 million, North America 15 million, and the Eastern Pacific countries, together with Australia and New Zealand, less than a million. (Source: International Union of Official Travel Organisations.)
By air, New Zealand is but a few hours from Australia, a day from the United States, and two days from the United Kingdom, Europe, or South Africa, so that it is within easy reach of most prospective visitors. With two international jet airports now in operation a significant increase in overseas visitors is expected. By sea there are direct services from Britain and North America and services from several European countries via Australia.
The tourist industry in New Zealand is rapidly expanding. A boom in hotel building is providing more accommodation at point of entry and major tourist resorts. New scenic routes are being developed and facilities improved and extended in major resort areas.
Visitor Arrivals and Receipts from Travel—There were 153,281 visitors to New Zealand in the year ended 31 March 1966 and it is estimated that they spent $23.2 million; this excludes receipts from fares and expenditure by crews of visiting ships. Crew numbers, which are excluded from the visitor total, have risen from 106,907 in the March year 1956 to 120,127 in the year ended 31 March 1966.
| Year Ended 31 March | Long-stay Visitor Arrivals | Short-stay Visitor Arrivals* | Total Visitor Arrivals | Reserve Bank Travel Receipts | Estimated Visitor-Expenditure |
|---|---|---|---|---|---|
| *Through passengers and tourists on cruise ships. | |||||
| $(000) | $(000) | ||||
| 1956 | 23,679 | 8,264 | 31,943 | 4,792 | 5,976 |
| 1957 | 27,979 | 20,718 | 48,697 | 6,210 | 7,354 |
| 1958 | 29,772 | 31,468 | 61,240 | 6,942 | 8,082 |
| 1959 | 31,173 | 26,045 | 57,218 | 6,020 | 8,280 |
| 1960 | 36,557 | 35,637 | 72,194 | 6,528 | 9,846 |
| 1961 | 40,924 | 36,386 | 77,310 | 7,518 | 10,926 |
| 1962 | 51,688 | 38,587 | 90,275 | 8,288 | 13,602 |
| 1963 | 58,885 | 38,732 | 97,617 | 8,670 | 15,354 |
| 1964 | 69,704 | 39,714 | 109,418 | 11,226 | 17,920 |
| 1965 | 82,035 | 40,353 | 122,288 | 12,538 | 20,896 |
| 1966 | 98,016 | 55,265 | 153,281 | 13,448 | 23,222 |
Receipts from travel in overseas exchange transactions for the year ended March 1966 were $13,548,000, and represented an increase of $910,000, or 7.3 percent, on the previous year.
| Country or Area | Year Ended 31 March | Increase | ||
|---|---|---|---|---|
| 1965 | 1966 | Amount | Percentage | |
| $(000) | $(000) | $(000) | percent | |
| Canada | 170 | 188 | 18 | 10.6 |
| United States | 2,630 | 3,134 | 504 | 19.2 |
| Other non-sterling | 130 | 180 | 50 | 38.5 |
| Britain | 3,156 | 3,378 | 222 | 7.0 |
| Australia | 6,138 | 6,236 | 98 | 1.6 |
| Other sterling | 314 | 332 | 18 | 5.7 |
| Totals | 12,538 | 13,448 | 910 | 7.3 |
Travel receipts exclude fares, migrants' transfers, and personal remittances.
(Tourist expenditure throughout the world has been estimated at upwards of $4,000 million. In a number of countries the tourist industry is among the largest industries in the country.)
Countries of Origin—The countries or areas of origin of all long-stay visitors to New Zealand during years ended 31 March are given in the following table. Changes are also shown.
| Country or Area | Year Ended 31 March | Increase | ||
|---|---|---|---|---|
| 1965 | 1966 | Number | Percentage | |
| percent | ||||
| Australia | 40,368 | 48,352 | 7,984 | 19.8 |
| Britain | 7,744 | 9,444 | 1,700 | 22.0 |
| Canada | 2,030 | 2,819 | 789 | 38.9 |
| United States | 15,958 | 17,201 | 1,243 | 7.8 |
| Other countries | 15,935 | 20,200 | 4,265 | 26.8 |
| Totals | 82,035 | 98,016 | 15,981 | 19.5 |
The long-stay visitors totals above include tourists and transient visitors, but exclude short-stay visitors, crews, and immigrants.
Traditionally, Australia has always been the major source of tourists but other areas are now gaining in relative importance, notably the United States, as can be seen in the following table giving percentage distribution of long-stay visitors according to country of origin.
| March Year | Australia | United Kingdom | Canada | United States | Others | Total |
|---|---|---|---|---|---|---|
| 1950 | 61 | 14 | 2 | 6 | 17 | 100 |
| 1955 | 59 | 13 | 2 | 8 | 18 | 100 |
| 1960 | 48 | 11 | 3 | 18 | 20 | 100 |
| 1964 | 47 | 9 | 3 | 21 | 20 | 100 |
| 1965 | 49 | 9 | 3 | 20 | 19 | 100 |
| 1966 | 49 | 10 | 3 | 17 | 21 | 100 |
Points of Arrival in New Zealand—The points of arrival for long-stay and short-stay visitors to New Zealand are given below for years ended 31 March.
| Point of Arrival | Long-stay Visitors | Short-stay Visitors | Total Visitors | |||
|---|---|---|---|---|---|---|
| 1964–65 | 1965–66 | 1964–65 | 1965–66 | 1964–65 | 1965–66 | |
| Auckland: Air | 41,650 | 52,188 | 858 | 2,381 | 42,508 | 54,569 |
| Sea | 7,172 | 9,338 | 28,955 | 41,980 | 36,127 | 51,538 |
| Totals | 48,822 | 61,526 | 29,813 | 44,361 | 78,635 | 105,887 |
| Wellington: Air | 13,025 | 14,536 | – | – | 13,025 | 14,536 |
| Sea | 3,103 | 3,642 | 9,873 | 9,860 | 12,976 | 13,502 |
| Totals | 16,128 | 18,178 | 9,873 | 9,860 | 26,001 | 28,038 |
| Christchurch: Air | 16,645 | 17,775 | – | – | 16,645 | 17,775 |
| Lyttelton: Sea | 243 | 103 | 33 | – | 276 | 103 |
| Dunedin: Sea | 6 | 1 | – | – | 6 | 1 |
| Other | 191 | 433 | 543 | 1,044 | 725 | 1,477 |
| Grand totals | 82,035 | 98,016 | 40,253 | 55,265 | 122,288 | 153,281 |
Auckland is the main point of arrival and receives over 69 percent of all visitors, including through passengers. This influx causes a high demand for hotel accommodation in Auckland. An analysis of the distribution pattern shows that the majority of the visitors arrive in the period from October to February. With the opening of Auckland International Airport, an even greater use is being made of Auckland as a point of entry for overseas tourists, and more hotels are being built.
Arrivals and Departures by Sea and Air—There is a continuing trend towards a greater use of air travel by migrants, including tourists. This is illustrated in the following diagram.
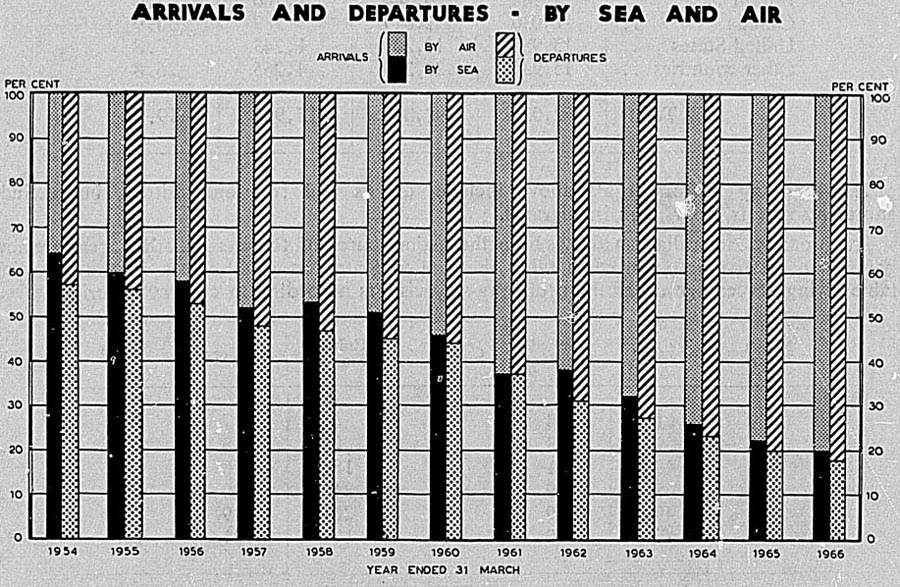
Seasonal Flow of Visitor Arrivals—Arrivals are highest in December, January, and February. These arrivals, taken in conjunction with the demand arising from the New Zealand summer holiday period, impose a strain on available hotel accommodation at the major tourist resorts. This is being alleviated to some extent by the more rapid rate of construction of hotels and motels.
| SEASONALITY PATTERN OF ARRIVAL OF VISITORS YEAR ENDED 31 MARCH 1966. | ||||||
|---|---|---|---|---|---|---|
| Month of Arrival | Long-stay Visitors | Percentage of Total | Short-stay Visitors | Percentage of Total | Total Visitors | Percentage of Total |
| April | 5,430 | 5.5 | 3,028 | 5.5 | 8,458 | 5.5 |
| May | 4,992 | 5.1 | 3,421 | 6.2 | 8,413 | 5.5 |
| June | 3,478 | 3.5 | 4,800 | 8.7 | 8,278 | 5.4 |
| July | 3,955 | 4.0 | 785 | 1.4 | 4,740 | 3.1 |
| August | 5,725 | 5.8 | 3,137 | 5.7 | 8,802 | 5.8 |
| September | 7,109 | 7.3 | 4,656 | 8.4 | 11,765 | 7.7 |
| October | 9,266 | 9.5 | 6,578 | 11.9 | 15,844 | 10.3 |
| November | 9,789 | 10.0 | 4,376 | 7.9 | 14,165 | 9.2 |
| December | 14,859 | 15.3 | 5,251 | 9.5 | 20,110 | 13.1 |
| January | 12,187 | 12.4 | 6,759 | 12.2 | 18,946 | 12.4 |
| February | 11,207 | 11.4 | 5,448 | 9.9 | 16,655 | 10.9 |
| March | 10,019 | 10.2 | 7,026 | 12.7 | 17,045 | 11.1 |
| Totals | 98,016 | 100.0 | 55.265 | 100.0 | 153,281 | 100.0 |
Hotel Accommodation in New Zealand—Throughout New Zealand there are over 9,000 beds of tourist-class standard in hotels and motor hotels which are licensed to sell liquor. Leading hotels in the main centres and Tourist Hotel Corporation hotels in the major resort areas all provide first-class accommodation.
Few New Zealand hotels have more than 100 rooms. In the main centres some have a private bathroom or shower and toilet with every bedroom. Smaller hotels which have been built recently in secondary areas close to tourist resorts also have these facilities. Most of the other hotels have a proportion of bedrooms with private bath and toilet.
New Zealand hotel tariffs are as follows although these are subject to alterations. In Tourist Hotel Corporation hotels daily tariffs (all meals included) range from about $13 (about $US18.20) for rooms with bath, and from about $9 (about $US12.60) for rooms without bath. In other hotels daily tariffs (all meals included) range from about $9 (about $US12.60) for rooms with bath, and from about $6 (about $US8.40 for rooms without bath.
In addition to hotels with liquor licences there are a number of motels and private hotels throughout the country which offer accommodation of a good standard at a reasonable price.
As in other parts of the world, reservations, especially at the main scenic areas, are often difficult to obtain if early application is not made. Therefore it is advisable to arrange for reservations well ahead of the proposed visit to avoid possible disappointment.
There are now 13 Tourist Hotel Corporation hotels, recent additions being Wanaka and Franz Josef in the South Island and Waitangi in the North Island. Wanaka, overlooking Lake Wanaka, has 37 rooms, all with private bath and screened balcony. Franz Josef Glacier Hotel is on the West Coast of the South Island and has 39 rooms, all with a private bath. Both Wanaka and Franz Josef accommodate travellers on the Haast Pass road linking eastern and western sides of the Southern Alps. Waitangi is situated in the Bay of Islands, a world famous big-game fishing area and has 39 rooms, all with private bath.
Tourist Hotel Corporation hotels are situated at the following places:
| North Island | South Island |
| Waitangi | Lake Pukaki Inn |
| Waitomo | Hermitage, Mount Cook |
| Wairakei | Wanaka |
| Lake House, Waikaremoana | Franz Josef |
| Tokaanu | Eichardt's, Queenstown |
| Chateau Tongariro, National Park | Te Anau Milford |
Assistance to the Hotel Industry—The New Zealand Government has made available loan and guarantee finance to encourage the building of new hotels and motor hotels and the extension of existing hotels to provide accommodation of a high standard to meet the demand from overseas tourists on the main tourist routes and at the four main centres of Auckland, Wellington, Christchurch, and Dunedin.
Under this scheme five new hotels have been built and seven more are planned or under construction, costing over $19 million and providing 1,260 first-class beds. Included in these are two Auckland hotels, the South Pacific, a 14–storey, 196–room hotel, and the Intercontinental, which will accommodate 594 guests. All these projects have involved Government loans amounting to $3.4 million and guarantees of $7.1 million.
Resort Development—A major development in New Zealand was the opening of the Haast Pass road in November 1965. It links the Southern Lakes region on the eastern side of the Alps with the West Coast and opens up one of the greatest scenic round-trip drives in the world.
In Rotorua a Maori Arts and Crafts Institute was established to preserve and foster traditional Maori culture. The institute has assumed control of the Whakarewarewa Reserve and plans to display Maori arts and crafts in traditional settings as well as presenting traditional songs and dances.
At Queenstown the Government and private enterprise have co-operated in the development of winter sports facilities. An open-air artificial ice-skating rink is being constructed in Queenstown. At Coronet Peak the access road has been improved, a new restaurant completed, and a chairlift has been in operation since 1964.
At Pakatoa Island in the Hauraki Gulf a tourist and holiday resort has been developed. Only 12 minutes from Auckland by amphibian aircraft and 45 minutes by hydrofoil, the island has accommodation in a chalet village.
Weather—New Zealand lies wholly within the South Temperate Zone. The weather is sunny and rather changeable, but is neither excessively hot in summer nor uncomfortably cold in winter. A large portion of the country is favoured with at least 2,000 hours of sunshine a year.
Seasons—The seasons in New Zealand are the opposite of those in the Northern Hemisphere:
| Summer: December, January, February |
| Autumn: March, April, May |
| Winter: June, July, August |
| Spring: September, October, November |
Transport—All main cities, secondary centres, and tourist resorts are linked by road or rail services running to regular and frequent schedules and there are extensive internal air services. Fast diesel railcars have been introduced on most main routes. Dining or buffet facilities are not provided on the trains, but refreshments are obtainable from cafeterias at many train stops. Modern motor coaches run on long-distance road services, and luxury limousines are available for personally conducted tours.
The New Zealand National Airways Corporation operates an efficient internal air service which connects the leading cities and secondary centres and also some of the tourist resorts. Meals and refreshments are not usually served in the air because of the relatively short journeys, but there are cafeterias at the air centres. Vickers Viscount and Fokker Friendship aircraft operate between the main cities. The Mount Cook and Southern Lakes Tourist Company and the West Coast Airways operate additional services. There are also several privately owned scenic and charter air services.
The North and South Islands are linked by a 174–nautical-mile steamer express service which operates nightly, except Sundays, between Wellington and Lyttelton, the port for Christchurch. Two rail-road ferries operate daily between Wellington and Picton.
Shopping—New Zealand shops are well stocked, both with imported lines and locally manufactured goods. Relatively, clothing costs are slightly higher than in the United Kingdom and most foodstuffs are somewhat cheaper.
Souvenirs—Distinctive jewellery is made from New Zealand greenstone and from the beautifully irridescent paua shell. Small pieces set in silver make very attractive souvenirs. The carved greenstone tiki, a unique Maori charm, is another favourite souvenir. New Zealand has many attractive woods and a variety of small carvings and other souvenirs are made by the Maori people who are gifted carvers.
New Zealand woollen goods, especially travelling rugs, are of excellent quality and an attractive range of knitwear such as sweaters, scarves, and jerseys is available.
Sporting Attractions: Angling—Lake Taupo is the most popular North Island fishing resort. Along the lakeshore numerous hotels, fishing lodges, and camping sites are available to visitors and, with no closed season, they are in demand all through the year. Rainbow trout predominate and average between 5 and 10 lb. Rotorua, with half a dozen good lakes for trolling with spinners or fly-fishing from row boats anchored offshore, is also popular. South Island angling is more varied than the North and has the added attraction of epic alpine scenery. Brown trout predominate, averaging from 8 to 10 lb. Quinnat salmon also abound in the snow-fed rivers of Canterbury. In the Waiau River system, particularly at the outlets of Lakes Te Anau and Manapouri, Atlantic salmon are found sometimes weighing between 35 and 40 lb.
Big-game Fishing—The warm waters off the eastern shores of North Auckland in the Bay of Plenty are New Zealand's deep-sea fishing grounds. The main bases are at Otehei Bay and Russell. Other centres are Whangaroa, Whangarei, Whitianga, and Tauranga. Swordfish (black and striped marlin and broadbill) are prize catches, while hammerhead, mako, thresher, and tiger sharks and kingfish are all found in New Zealand waters. The best catches are made from January to March or April.
Ski-ing—New Zealand has good ski-ing grounds in both islands. Mt. Ruapehu, midway between Auckland and Wellington, is the most popular ski centre in the North Island: A ski centre, 4 1/2 miles by road from the top-grade hotel, Chateau Tongariro, provides facilities for skiers and is close to the start of the chairlift system which comprises three chairlifts, a T-bar, a Poma lift, and two rope tows. Equipment is available for hire and instruction is available from professional continental instructors. Mount Egmont is the North Island's only other principal ski-ing area.
Coronet Peak, situated 7 miles from Queenstown in the South Island, provides the best powder snow conditions in New Zealand. Facilities include a chairlift to the summit and four ski tows. Equipment can be hired and instruction is available from overseas professionals. Mount Cook is the centre of an area containing 27 peaks over 10,000 ft. From the Hermitage, one of New Zealand's finest hotels, ski-equipped planes make regular flights with skiers and sightseers; the Tasman Glacier flight is world famous and the whole area is renowned for its mountaineering.
In the North Island the main season generally starts in mid-July and terminates at the end of October. In the South Island the main season is from early July to the end of September.
Hunting—New Zealand deer, thar, chamois, goat, and wild pig all provide good hunting but mainly in rugged country demanding good physical fitness.
Other Sports—There are also good facilities for golf, croquet, bowls, and tennis. Horse racing and rugby football are New Zealand's major spectator sports.
Scenery and Recreation—The 1960 and 1962 issues of the Yearbookcontained pictorial supplements entitled “Scenic New Zealand” and “New Zealand's National Parks”. In the 1965 issue of the Yearbook the photographs were devoted to the wide opportunities of outdoor recreation in New Zealand. The attractions of the national parks are described in Section 10A.
Mineral Waters and Spas—New Zealand is unique for the number, variety, and extent of her hydro-thermal phenomena. The main thermal belt runs north-east from the three volcanic peaks in the centre of the North Island to White Island, an active volcano some 40 miles off the coast, but there are hundreds, probably thousands, of hot mineral springs and thermal muds throughout the country. Some even appear high in the Southern Alps of the South Island.
Many mineral springs have a therapeutic use and mineral baths are maintained by private interests in many places. The Tourist Department controls baths at Rotorua, Morere, and Te Aroha. The Health Department maintains the Queen Mary Hospital at Rotorua for the treatment of functional nervous disorders, and the Queen Elizabeth Hospital at Rotorua for the treatment of all forms of arthritis and other locomotor complaints. There is also a cerebral palsy unit at the Queen Elizabeth Hospital. Specialist consultation and treatment with full orthopaedic, surgical, medical, and nursing services and the latest facilities for physiotherapy, occupational therapy, medical social work, splint making, and surgical bootmaking are available at the Queen Elizabeth Hospital. As there is a waiting list for both admission and outpatient consultations or treatment it is advisable to apply for appointments well in advance of arrival in Rotorua. Patients should also supply, if possible, a letter of introduction from their own doctor so that continuity of treatment can be maintained. No charge for hospital medical service is made to New Zealanders or to citizens of countries such as Britain which have complete reciprocal social security arrangements with New Zealand. For others there are modest charges payable to the Department of Health.
Rotorua, with its great variety and abundance of hot sulphur springs is the most famous of New Zealand spas. The Ward Baths, in the Government Gardens, are adjacent to several leading hotels and are popular with guests and city residents alike. The Ward Baths consist of the private Rachel Baths of alkaline siliceous sulphur water, the hot Rachel swimming pool, the Priest pool of acid siliceous sulphur water, and the Radium pool of acid siliceous sulphur water with carbon dioxide bubbles. All are used for the relief of stiff or aching muscles and joints. The Priest and Radium pools also produce a pleasant stimulating effect through the skin. The Blue Baths are public baths also in the Government Gardens with two swimming pools—one for adults and one for children, and are very popular with the fit and well.
Certain other springs in other parts of the country such as the mercurial waters of Ngawha, the alkaline soda waters of Te Aroha, and iodine waters of Morere are unusual in their mineral content.
Tourist and Publicity Department—Under the Tourist and Publicity Act 1963 the principal functions of the Department are to encourage and develop the New Zealand tourist industry and tourist traffic, to, within, and beyond New Zealand; to operate publicity, information, and public relations services; and to maintain a travel service. The Publicity Division has an information and press section, which, among other things, supplies New Zealand publicity of all kinds for use within New Zealand and overseas, while the overseas information section distributes material overseas to create a background knowledge of New Zealand and its people and way of life. The National Publicity Studios combine photographic, artistic, design, display, modelling, workshop, and other services necessary for a wide range of publications, exhibitions, displays, and posters. The National Film Unit produces news and feature films covering all aspects of New Zealand; many of its films are made for tourist publicity purposes and these are widely distributed overseas.
Travel Service—Tourist bureaux are now sited in Auckland, Te Aroha, Rotorua, Wellington, Christchurch, Dunedin, and Invercargill. There are also a further 23 agencies in other parts of New Zealand. Overseas offices are situated in Sydney, Melbourne, Brisbane, London, San Francisco, Los Angeles and New York. The Department is also represented by agents in South Africa and Hawaii. The Department operates a comprehensive travel service and makes accommodation reservations. Officers of the Department meet overseas vessels and aircraft to help tourists clear their luggage through Customs and to aid them with their travel plans. Both individual and conducted group tours are available. Hired cars with experienced courier drivers and “drive yourself” tours can also be provided.
Other Tourist Organisations—The New Zealand Travel and Holidays Association, an organisation representing private travel interests in New Zealand, is also concerned with the development of the tourist industry.
New Zealand is a member of the International Union of Official Travel Organisations, an association whose principal aims are to ease travel difficulties and obstacles and promote travel research, and also is a foundation member of the Pacific Area Travel Association which was formed in 1952 as a tourist promotional body for the Pacific Area.
MAORI WELFARE—The legislative basis of the Maori welfare programme is the Maori Welfare Act 1962 and the aim is the social and economic advancement and the promotion and maintenance of the health and general well-being of the Maori community and the facilitation of full integration of the Maori race into the social and economic life of the country. An important feature of the programme is that it does not seek to impose standards from without; rather, it calls upon the Maori people to exercise control and direction of their own communities in the essentials of good citizenship and civic responsibility.
The Maori welfare organisations consist of two statutory groups and various voluntary groups. The statutory groups are:
Maori associations comprising the New Zealand Maori Council, the District Maori Councils, Maori Executive Committees, and Maori Committees. All are democratically elected and work independently of the Department.
The Department of Maori Affairs which works closely with all Maori groups as it realises that its main objectives cannot be achieved without full acceptance and participation by the people themselves.
The main organisation in the non-statutory group is the Maori Women's Welfare League. It was formed in 1951 and has branches throughout the country. Its membership approximates 3,000. Special tribal groups, social, sports, and cultural clubs, church groups, women's and other organisations are some of the many other groups which have their own spheres of action promoting and furthering the physical, social, spiritual, and moral well-being of the people.
The primary function of the New Zealand Maori Council is to encourage Maoris as individuals and in groups to take the initiative in matters affecting their own welfare and that of their kinsfolk, to be a forum of discussion in which they can crystallise their ideas and gain the co-operation of others in actively pursuing mutually agreed objectives and eventually achieving progressive improvement in the various spheres of welfare. By its own request it is charged with the duty of maintaining and promoting harmony between Maori and non-Maori.
The Department of Maori Affairs, through the activities of its Welfare Division in particular, collaborates with and gives Maori associations and other groups such assistance and advice as may be necessary or helpful so that the members themselves may find and apply their own solutions to their problems and develop and achieve the utmost satisfaction from their own culture. The Department also collaborates with appropriate social welfare agencies, State and voluntary, in helping individuals and families who are experiencing difficulties in adapting themselves to their social and economic environment, accepting the full responsibility where a need is not being met. The Department actively encourages these State and voluntary organisations to understand and to communicate successfully with the Maori so that they can work more effectively with him.
The primary function of the Maori Women's Welfare League is to educate the mothers of the race to an appreciation of the higher standards of attainment on the home front. It also interests itself actively in education particularly pre-school.
Maori wardens carry out special functions. They are appointed by the Minister at the initiative of Maori Committees to whom they are responsible. Their function is to assist in the maintenance of order and in stamping out mischief before it becomes crime. Wardens do not usurp the duties of the police but are an influence among the people in maintaining law and order.
The Act provides for subsidies to be paid on moneys raised by the Maori people through their associations for the promotion of welfare. The subsidy granted in the financial year ended 31 March 1966 amounted to $38,340.
PUBLIC TRUST OFFICE—In the early years of settlement in New Zealand those who wished to make provision for the administration of their estates on their death often experienced difficulty in selecting a suitable person competent and willing to act as trustee. That difficulty was natural in a new country where the colonists were fully occupied with their own affairs, and were unable to give to the property or business of another the close attention that was demanded.
In these circumstances the Public Trust Office was established in 1872 (it is now constituted under the Public Trust Office Act 1957) under the administration of the Public Trustee, a corporation sole with perpetual succession and a seal of office. The main purpose of the original Act was to provide a means of overcoming the difficulties that have been mentioned and to make available to the public a trustworthy administrator of the estates of deceased persons at a reasonable cost, the integrity of the Public Trustee and his officers being guaranteed by the State. That continues to be the chief function of the Office, but since its establishment the range of service has been very considerably extended. The Public Trustee now acts in many capacities, e.g., as administrator in intestate estates; executor and trustee under wills; trustee under marriage and other settlements; trustee of benefit or relief funds; agent or attorney for absentees or persons desiring to be relieved of business worries; sinking fund commissioner for local authorities; administrator of unclaimed lands and property; statutory administrator of the estates of mental patients (other than Maoris); manager (when so appointed by the Court) of the estates of aged and infirm persons unable to attend to their own affairs; and trustee of compensation moneys payable in respect of the death of a worker. The wills of persons desiring the Public Trustee to act as their executor are prepared and held in safe custody by him, free of charge.
In lieu of obtaining probate or other grant of administration, the Public Trustee may file in an office of the Supreme Court an election by him to administer an estate (testate or intestate) if the gross value of the property in New Zealand is estimated not to exceed $2,000. If after the filing of the election the value of the property is found to exceed $3,000, the Public Trustee must obtain a grant of probate or administration in the ordinary way.
During the year ended 31 March 1966, 4,682 estates valued at $39,820,472 were accepted for administration. The administration of 5,077 estates was completed. Estates and funds under administration at 31 March 1966 numbered 18,527 and were valued at $184,489,824.
Capital moneys becoming available for investment either form part of the Common Fund of the Office or, at the option of the testator or settlor, are invested in such securities as he may specify. Interest is allowed on moneys in the Common Fund at the rate fixed from time to time by the Governor-General in Council and is free of all commission and other charges. Both capital and interest are guaranteed by the State, thus affording the complete security that it is the object of the Office to provide. On the other hand, moneys directed to be invested in specified securities do not carry the State guarantee and, subject to the Public Trustee's ordinary liability as a trustee any loss resulting from their investment falls upon the estate concerned. Commission is charged on the collection of the interest. Recognising that the safety of the moneys is thereby assured, the great majority of testators and settlors desire their funds to be placed in the Common Fund.
Charges and commission rates are contained in the Public Trust Office Regulations 1958.
New investments completed during the year ended 31 March 1966 totalled $9,198,800, the favourable terms offered by the Office again proving popular with borrowers. The investments held by the Office at 31 March 1966 totalled $54,845,976. These figures relate exclusively to Common Fund investments, and do not include other special investments made on behalf of estates or investments which constituted assets of estate when the latter came under the Public Trustee's administration and which are still held as assets of those estates.
During the year ended 31 March 1966, 11,730 wills appointing the Public Trustee executor were deposited with him for safe custody. The total number of such wills held on deposit at 31 March 1966 was 214,997. In addition to preparing the will of the testator in the first instance, the Public Trustee prepares any subsequent will or codicil that may be desired. During the year ended 31 March 1966 effect was given in 8,939 cases to changes desired by testators.
PATENTS, DESIGNS, AND TRADE MARKS—The legislation concerned is the Patents Act 1953, the Trade Marks Act 1953, and the Designs Act 1953. The total number of applications for the grant of letters patent and for the registration of designs and trade marks during the financial year 1965–66, was 6,381, which was 191 less than in the previous year.
The following table shows the number of applications for patents and for the registration of trade marks and designs in each of the last 11 March years.
| Year | Patents | Trade Marks | Designs |
|---|---|---|---|
| 1955–56 | 2,298 | 1,631 | 261 |
| 1956–57 | 2,324 | 1,858 | 250 |
| 1957–58 | 2,398 | 1,956 | 261 |
| 1958–59 | 2,356 | 1,896 | 246 |
| 1959–60 | 2,784 | 2,258 | 280 |
| 1960–61 | 2,833 | 2,496 | 343 |
| 1961–62 | 2,848 | 2,229 | 357 |
| 1962–63 | 2,820 | 2,304 | 308 |
| 1963–64 | 3,192 | 2,571 | 366 |
| 1964–65 | 3,447 | 2,690 | 435 |
| 1965–66 | 3,450 | 2,591 | 340 |
Patents—The applications received during 1965–66 were broadly classified as follows: chemistry, 963; mechanical engineering, 892; electrical engineering, 552; building construction, 323; primary industries, 247; home science and miscellaneous, 473.
Applications originating in New Zealand totalled 788, Great Britain 738, the United States of America 819, Australia 265, with the remainder 840, distributed among 32 other countries.
Trade Marks—In applications for trade marks in 1965–66 Class 5 (pharmaceutical, veterinary, and sanitary substances) again predominated with 379 applications, and it was followed by Class 3 (soaps, detergents, cosmetics, etc.) 277; Class 25 (clothing) 236; Class 1 (chemicals, etc.) 154; Class 9 (radio, scientific equipment, etc.) 142; Class 16 (stationery, office requisites, etc.) 125.
The countries from which the applications originated were: New Zealand, 868; United States of America, 581; Great Britain, 466; Australia, 158; with the remaining 518 distributed between 22 other countries.
Renewal of registration of 2,203 trade marks was effected during the year.
Designs—The total number of applications since the inception of design registration in New Zealand is 10,592.
COPYRIGHT—Under the Copyright Act 1962, copyright comes into existence automatically upon the completion of any original literary, dramatic, musical, and artistic work (including photographs). No registration is necessary (or even possible), nor is any other formality required for securing copyright protection.
Copyright also subsists in New Zealand in sound recordings, cinematograph films, broadcasts, and published editions (typography) of literary, dramatic, and musical works.
Copyright in literary, dramatic, musical, and artistic works (except photographs) continues until 50 years after the author's death, if the works are published in the author's lifetime, and until 50 years after publication or 75 years after death (whichever is shorter) if they are unpublished at the death of the author. Copyright in photographs, sound recordings, cinematograph films, and broadcasts continues until 50 years after the making, and in editions until 25 years after publication.
Copyright in New Zealand in literary, dramatic, musical, and artistic works and in cinema tograph films extends to all countries which are parties to the International Convention for the Protection of Literary and Artistic Works (Berne Copyright Union) and to all countries which are parties to the Universal Copyright Convention. In some cases sound recordings, broadcasts, and published editions are also protected overseas. New Zealand is a party to both Conventions. Most of the important countries of the world (except at present Russia and China, but all English-speaking countries) have acceded to the one or the other or to both Conventions.
In New Zealand certain disputes relating to performing rights of copyright works, sound recordings, or films may be determined by the Copyright Tribunal.
BANKRUPTCY—The law relating to bankruptcy in New Zealand is contained in the main in the Bankruptcy Act 1908 and its amendments. Jurisdiction in bankruptcy matters is vested in the Supreme Court. The Governor-General, however, may by Proclamation confer similar jurisdiction on a Magistrate's Court in cases where the liabilities do not exceed $600.
All proceedings in bankruptcy are commenced by a petition filed in the Court. A petition may be filed either by the debtor or by a creditor, a fee of $12 being payable. The filing of a debtor's petition is equivalent to an order of the Court adjudging the debtor a bankrupt, no order being required in this case. Not less than $60 in the aggregate must be owing by the debtor to the creditor or creditors filing a petition.
The value of furniture and household effects, including wearing apparel of himself and family, which a bankrupt may select and retain as his own property is $200.
The Official Assignee is empowered to sell the bankrupt's property, to claim debts due to the bankrupt estate, to carry on the business of the bankrupt so far as is necessary or expedient for its beneficial winding up, or to divide the property among the creditors. The bankrupt may be appointed by the Official Assignee to manage his estate or carry on his business on behalf of the creditors.
Creditors may accept a composition in satisfaction of the debts due to them. In such a case, after approval of the Court, a deed of composition is executed and filed, and the bankruptcy annulled.
On application being made by the bankrupt, the Court is empowered to grant him an order of discharge, either absolute, suspended, or conditional. The application may be Opposed either by the Official Assignee or by any creditor who has proved his claim. A public examination of the bankrupt may be demanded by the Assignee on a resolution by creditors.
Another form of financial failure is covered by private assignments, of which there were 12 in 1963, 21 in 1964, eight in 1965, and 15 in 1966. Private assignments are not included in official bankruptcy statistics.
Transactions in Bankruptcy—The number of transactions in bankruptcy during the last five years is now given. A long-term record of the more important features will be found in the Statistical Summary given later in this volume.
| Year | Number of Bankruptcies | Petitions by Debtors | Adjudications on Petitions by Creditors | Orders of Discharge or Annulment Granted | Orders for Liquidation of Companies by Assignee |
|---|---|---|---|---|---|
| 1962 | 559 | 478 | 81 | 130 | 32 |
| 1963 | 458 | 469 | 79 | 158 | 18 |
| 1964 | 483 | 428 | 55 | 156 | 24 |
| 1965 | 483 | 425x | 58x | 150 | 24 |
| 1966 | 483 | 415 | 68 | 149 | 24 |
In the case of a partnership, each partner is counted in the total of transactions and also the partnership. The general bankruptcy statistics do not cover private assignments and compositions, but relate only to cases dealt with by Official Assignees.
The annual average was 271 for the five years 1952–56, compared with an average of 511 for the years 1962–66. Regard should be paid to the fact that the number of business units is also increasing.
Assets and Liabilities—Debtors are required to file a statement of the extent of their liabilities and assets, but there is usually a marked difference between these statements and the amounts actually realised by the Official Assignee or the debts subsequently proved by creditors.
It should be understood that in the following table the figures in each column refer to all transactions under the respective heads during the year, the amounts realised by Assignees and paid in dividends and preferential claims relating partly to the current year's bankruptcies (many of which, however, are not disposed of during the year) and partly to cases commenced in previous years. Time-lag variations of this nature account for the amounts paid during 1959 exceeding the figures for amounts realised. Company liquidations are included in the totals.
| Year | Number of Bankruptcies | Amounts Realised by Official Assignees | Amounts of Debts Proved | Amounts Paid in Dividends, Preferential and Secured Claims | Amounts Paid in Government Commission |
|---|---|---|---|---|---|
*1, †2, ‡4, §3 deceased persons' estates under Part IV of the Administration Act 1952 included. | |||||
| $(thousand) | |||||
| 1956 | 390 | 261 | 1,096 | 157 | 14 |
| 1957 | 437† | 361 | 1,564 | 201 | 16 |
| 1958 | 495‡ | 370 | 1,638 | 262 | 26 |
| 1959 | 618† | 390 | 1,510 | 402 | 25 |
| 1960 | 495 | 331 | 1,338 | 280 | 26 |
| 1961 | 425† | 304 | 1,416 | 251 | 23 |
| 1962 | 591* | 446 | 2,139 | 328 | 29 |
| 1963 | 566§ | 441 | 1,660 | 383 | 34 |
| 1964 | 507* | 325 | 1,785 | 301 | 27 |
| 1965 | 507* | 336 | 2,338 | 312 | 27 |
| 1966 | 507 | 378 | 2,034 | 306 | 25 |
The table following shows for each of the last 11 years the average amount of debts proved per estate, and also the proportion of dividends, preferential claims, and secured claims, to debts.
| Year | Average Debts Proved per Estate | Proportion of Dividends, etc., to Debts |
|---|---|---|
| $ | percent | |
| 1956 | 2,808 | 14.3 |
| 1957 | 3,580 | 12.9 |
| 1958 | 3,310 | 16.0 |
| 1959 | 2,444 | 26.6 |
| 1960 | 2,702 | 20.9 |
| 1961 | 3,332 | 17.7 |
| 1962 | 3,618 | 15.3 |
| 1963 | 2,934 | 23.1 |
| 1964 | 3,520 | 16.8 |
| 1965 | 4,610 | 13.3 |
| 1966 | 4,010 | 15.1 |
Apart from dividend, preferential and secured claims, and Government commission, payments made from assets realised include cost of actions, solicitors' fees, and expenses incurred in managing estates for the benefit of creditors.
Amount of Liabilities—The following table shows for each of the last five years a classification of bankruptcies according to the amount of stated liabilities. With all partnerships the liabilities for each partner are included, but not the partnership.
| Liabilities | 1962 | 1963 | 1964 | 1965 | 1966 |
|---|---|---|---|---|---|
| *Excludes partnerships, 1962, 9; 1963, 2; 1965, 1; and 1966, 4. | |||||
| Under $500 | 111 | 91 | 108 | 77 | 87 |
| $500– $999 | 88 | 140 | 123 | 109 | 111 |
| $1,000–$1,999 | 104 | 122 | 103 | 111 | 99 |
| $2,000–$3,999 | 131 | 105 | 80 | 97 | 84 |
| $4,000–$9,999 | 103 | 70 | 59 | 74 | 83 |
| $10,000 and over | 45 | 36 | 34 | 38 | 39 |
| Totals | 582* | 564* | 507 | 506* | 503* |
Most failures are for comparatively small amounts. Of a total of 2,662 bankruptcies during the five years surveyed, 18 percent were for liabilities of less than $500, 39 percent under $1,000, and 60 percent for liabilities under $2,000.
Industry Groups of Bankrupts—The following table shows in broad groups the industries of those persons adjudged bankrupt in the last five years. The revised classification is based on the international standard industrial code. Companies are here excluded.
| Industry Group | 1962 | 1963 | 1964 | 1965 | 1966 |
|---|---|---|---|---|---|
| *Excludes partnerships as follows: 1962, 9; 1963, 2; 1965, 1; and 1966, 4. | |||||
| Agriculture and livestock production | 47 | 45 | 42 | 30 | 42 |
| Forestry, hunting, and fishing | 9 | 7 | 10 | 15 | 8 |
| Mining and quarrying | – | 3 | 3 | – | 4 |
| Manufacturing— | |||||
| Food and beverages | 9 | 10 | 8 | 12 | 12 |
| Footwear and textiles | 6 | 3 | 8 | 5 | 9 |
| Wood, furniture, and fixtures | 12 | 9 | 7 | 6 | 10 |
| Printing and publishing | 2 | 1 | 1 | – | 2 |
| Machinery (not electrical) | 21 | 16 | 13 | 8 | 6 |
| Transport equipment | 4 | 6 | 4 | 18 | 13 |
| Other | 17 | 17 | 23 | 21 | 32 |
| Construction | 114 | 89 | 80 | 74 | 56 |
| Wholesale and retail trade | 68 | 93 | 55 | 71 | 74 |
| Other commerce | 1 | 1 | 3 | 3 | 6 |
| Transport, storage, and communication | 70 | 76 | 67 | 73 | 58 |
| Personal and community services | 80 | 72 | 64 | 55 | 69 |
| Activities not adequately described— | |||||
| Contractor | 10 | 10 | 15 | 6 | 7 |
| Labourer | 68 | 62 | 57 | 67 | 59 |
| Other | 12 | 26 | 23 | 18 | 12 |
| Totals | 550* | 546* | 483 | 482* | 479* |
The types of activity in which bankrupts were engaged at the time of failure frequently bear little relationship to the fact of insolvency. Personal extravagance or business incompetence are probably much more important factors in the majority of cases.
The occupational status of individual bankrupts during each of the calendar years 1956–66 is given in the following table. With all partnerships the occupation of each partner is included, but not the partnership. Under the heading “Working for Salary or Wages” are included small numbers returning no occupational status.
| Year | Occupational Status | |||
|---|---|---|---|---|
| Working for Salary or Wages | Employer of Labour | Working on Own Account But Not Employing Labour | Total* | |
| *Excludes partnerships as follows: 1956, 2; 1957, 3; 1958, 3; 1959, 5; 1960, 1; 1961, 3; 1962, 9; 1963, 2; 1965, 1; and 1966, 4. | ||||
| 1956 | 188 | 49 | 132 | 369 |
| 1957 | 211 | 71 | 136 | 418 |
| 1958 | 213 | 80 | 183 | 476 |
| 1959 | 288 | 99 | 202 | 589 |
| 1960 | 246 | 109 | 117 | 472 |
| 1961 | 194 | 86 | 117 | 397 |
| 1962 | 247 | 134 | 169 | 550 |
| 1963 | 279 | 104 | 163 | 546 |
| 1964 | 275 | 69 | 139 | 483 |
| 1965 | 268 | 91 | 123 | 482 |
| 1966 | 273 | 92 | 114 | 479 |
INTERNATIONAL INDICATORS OF STANDARDS OF LIVING—Measurements of standards or levels of living between countries constitute a complex problem for which there is no completely adequate or satisfactory solution in the way of an index that can be applied internationally. By most accepted criteria it is recognised that the countries with the highest standards of living include the United States of America, Canada, Sweden, Switzerland, New Zealand, and Australia in approximately that order. Some comparative indicators are set out in the following table. In other sections of the Yearbook there are international comparisons on food consumption, life expectancy, infant mortality, and newspaper circulation.
| INTERNATIONAL COMPARISONS RELATED TO STANDARDS OF LIVING | ||||||
|---|---|---|---|---|---|---|
| Item | New Zealand | United States of America | Canada | Australia | United Kingdom | Sweden |
*At September 1965. †England and Wales. | ||||||
| Number per 1,000 of population (1964)— | ||||||
| Private passenger cars | 253 | 373 | 261 | 243 | 156 | 217 |
| Television sets | 146* | 349 | 257 | 161 | 243 | 256 |
| Telephones (public and private) | 365 | 459 | 361 | 240 | 183 | 440 |
| Annual consumption of energy per head, 1964 (In terms of coal, kg) | 2,159 | 8,772 | 7,137 | 4,454 | 5,079 | 4,320 |
| Annual electricity consumption per head, 1964 (kWh) | 3,598 | 5,341 | 6,408 | 2,806 | 3,216 | 5,338 |
| Enrolment of persons aged 5–19 years for primary and secondary education (1964) percent | 80 | 81 | 80 | 77 | 75 | 71 |
| Enrolment in higher education per 100,000 of population (1961) | 1,224 | 2,028 | 879 | 1,027 | 358 | 534 |
| Persons per hospital bed (1957–59) | 90 | 110 | 90 | 90 | 110* | 80 |
| Persons per doctor (1962–64) | 670 | 690 | 890 | 730 | 840 | 960 |
| Housing (1960–61)—Percentage of dwellings with— | ||||||
| Piped water | 99.5 | 94.0 | 89.1 | .. | 98.7† | 91.4 |
| Baths | 97.1 | 88.1 | 80.3 | .. | 78.7† | 60.9 |
STANDARDS COUNCIL—By the Standards Act 1965 the Standards Council was established as an independent body of 43 members from 1 April 1966. The functions of the Council are to promote standardisation in industry and commerce and to promulgate standards with the object of improving the quality of goods produced, promoting industrial efficiency and development, and promoting public and industrial welfare, health, and safety. The Council largely continues the functions previously performed under earlier legislation in 1941. It functions through the Standards Association which has taken the place of the former Standards Institute. The Standards Association is paying increasing attention to international standardisation and to consumer goods.
LOTTERIES—Under the Gaming Act 1908 the Minister of Internal Affairs may grant permission (subject to such conditions as he thinks fit) for raffles of property. The Police may issue raffle licences where an individual prize does not exceed $20 in value, and where the total value of the prizes does not exceed $50; and authorised members of the Police may from time to time approve of organisations conducting raffles, provided the value of the prizes in any raffle does not exceed $10. By the Stamp Duties Act 1954, any licence granted for the raffling of any real or personal property in excess of $1,000 value is subject to a lottery duty of 10 percent of the value of the tickets sold in the lottery. Information as to receipts from this source will be found in Section 26B—Taxation.
The Gaming Act also permits sweepstakes and art unions (as defined) under certain specified conditions.
The Gaming Amendment Act 1962 makes provision for the conduct of national lotteries under the control of the Minister of Internal Affairs. The “Golden Kiwi” and the “Mammoth” national lotteries have been established. In both cases the number of tickets in a lottery is limited to 250,000. “Golden Kiwi” tickets cost 50 cents each and the prize list totals $66,000; “Mammoth” tickets cost $2 each and the value of the prize list is $270,000. Profits from these lotteries are available for distribution for charitable, research, or cultural purposes, or for other purposes that will be beneficial to the community.
During the year ended 31 March 1966, 8,830 licences covering small raffles with prizes ranging from $50 to $1,000 in cash or goods were issued to local or national organisations. Raffles in which the prizes are less than $50 in total, and with no one prize exceeding $20, are licensed and supervised by the Police. In addition, 47 “Golden Kiwi” and 6 “Mammoth” lotteries were conducted. The aggregate results of the regular lotteries for the eight latest years are shown in the following table.
| Item | 1958–59 | 1959–60 | 1960–61 | 1961–62 | 1962–63 | 1963–64 | 1964–65 | 1965–66 | |
|---|---|---|---|---|---|---|---|---|---|
| Number of lotteries | 17 | 17 | 17 | 29 | 74 | 54 | 55 | 53 | |
| Gross sales | $(000) | 1,213 | 1,188 | 1,195 | 2,950 | 9,250 | 6,750 | 8,000 | 8,875 |
| Commission on sales | $(000) | 182 | 178 | 189 | 336 | 925 | 675 | 744 | 776 |
| Expenses | $(000) | 120 | 120 | 119 | 164 | 318 | 238 | 273 | 258 |
| Prizes | $(000) | 340 | 340 | 340 | 1,260 | 4,444 | 3,510 | 4,242 | 4,722 |
| Net proceeds | $(000) | 571 | 550 | 556 | 1,190 | 3,563 | 2,327 | 2,741 | 3,119 |
| Lottery duty | $(000) | 121 | 119 | 119 | 295 | 925 | 675 | 800 | 887 |
| Net profit | $(000) | 450 | 431 | 437 | 895 | 2,638 | 1,652 | 1,941 | 2,232 |
Under the Gaming Amendment Act 1962 a Board of Control has the responsibility of apportioning profits of lotteries to various Distribution Committees which consider applications for assistance from lottery funds and make allocations. Grants made during 1965–66 were as follows: $260,090 for the welfare of aged persons: $411,606 to charitable and philanthropic organisations including various mayoral and other relief or distress funds; $847,558 to youth organisations, sporting bodies, national water safety,' and to various bodies providing community facilities; $262,058 for medical research; $248,448 for scientific research; Queen Elizabeth Arts Council $400,000; and miscellaneous grants, $93,626.
LIQUOR LICENSING—The principal source of the liquor law of New Zealand is the Sale of Liquor Act 1962. The principles on which the liquor law of New Zealand rests are that no liquor may be sold without a licence, that new licences are not to be authorised unless they are shown to be necessary or desirable in the locality, and that there should be close regulation of the conduct of the trade and of the provision and standard of accommodation, amenities, and services.
There is a Licensing Control Commission whose principal functions are to ascertain the requirements of the public as to the provision of accommodation, services, and other facilities on licensed premises; to determine what new hotel, tavern and tourist house premises licences, restaurant licences and wholesale licences are needed and to authorise their issue; to review provisional hotel licences and determine whether the licence to be issued in their place should be a hotel or tavern premises licence; to prescribe and enforce standards of accommodation, amenities, and services; to grant club charters; and to hear appeals from licensing committees. There is a right of appeal to the Commission from every decision of a licensing committee except on a matter of law or character in which case the appeal is to the Supreme Court. Many of the Commission's decisions are themselves subject to appeal to the Supreme Court, and an appeal may be brought in any case on a point of law. Licences either in force or authorised at 31 March 1966 comprised 1,076 hotel or provisional hotel premises licences, 29 tourist-house premises licences, 38 restaurant licences, and 168 wholesale licences.
There were 48 permanent club charters and 146 renewable club charters in force on 31 March 1966. All the permanent charters and some of the renewable charters permit the sale of liquor to members for consumption off as well as on the premises.
New Licences—The Licensing Control Commission decides after a public inquiry whether the issue of a hotel tourist-house, or tavern premises licence, or a wholesale or wine reseller's licence is desirable in a particular locality. In the case of a hotel, tourist-house, or tavern premises licence the Commission prescribes the minimum standards of accommodation, services, and other facilities that must be provided. It may direct that any bar-room of a hotel or tavern shall contain facilities for sit-down drinking. There is provision for a poll of residents on the question whether a hotel or tavern premises licence is not desired in the locality, and if the majority of votes recorded at the poll is against the licence the Commission may not authorise one unless special circumstances exist.
Subject to the result of any such poll the Commission (or in the case of a wholesale or wine reseller's licence, the Licensing Committee) then calls for applications for the licence. On each application the Commission fixes a fair price which the applicant, if successful, must pay. The decision of the Commission or the committee as to which applicant should receive the licence in effect fixes the exact site of the proposed premises. In the case of a hotel or a tavern any adult residing within a quarter of a mile may object to the Town and Country Planning Appeal Board on the grounds that the site is in the immediate vicinity of a church, school or hospital, or that the objector will be adversely affected by the establishment of a hotel or tavern on the site. In considering an objection on the ground of adverse affection, the Board has regard to the provisions of any district planning scheme (or if there is no such scheme, planning principles), to the distance between the site and the nearest substantial number of houses, to the provision made for off-street parking, and to other relevant circumstances.
Hours of Sale—In 1917 the Sale of Liquor Restriction Act provided for the closing of licensed premises for the sale of liquor, on weekdays between the hours of 6 p.m. in the evening and 9 a.m. on the following morning, and all day on Sundays, Christmas Day, and Good Friday, except that wholesalers and brewers (also winemakers and wine resellers) might sell liquor between 7 a.m. and 9 a.m. on weekday mornings. This legislation was originally intended as a temporary wartime measure, but was made permanent in 1918.
In 1949 a referendum was held pursuant to the provisions of the Licensing Amendment Act 1948 on the question of hours for the sale of liquor in hotel bar-rooms. The proposal for the retention of the existing hours was carried by a large majority, the vote in favour of the existing hours being 473,678 and the vote for the alternative proposal of a total of nine hours between 10 a.m. and 10 p.m. being 153, 854.
Legislation in 1960 authorised hotels to serve liquor to guests and lodgers partaking of a meal for consumption with the meal up to 11.30 p.m. on any day and between 12 noon and 2.30 p.m. on Sunday, Christmas Day, and Good Friday. By the same Act the hours during which licensed restaurants may sell and serve liquor to diners were fixed as 12 noon to 2.30 p.m. and 6 p.m. to 11.30 p.m. on any day. The Sale of Liquor Act 1962 authorises the Commission to grant permits to a hotel for the sale of liquor in a lounge or lounge bar to diners during hours fixed by the Commission, but not later than 11.30 p.m.
Licensing Trusts—The system of trust control in New Zealand is an alternative to the traditional means of controlling the sale of liquor through privately held licences supervised by licensing committees and since 1949 by the Licensing Control Commission. The system of licensing committees and the Licensing Control Commission gives the public an indirect control over the conditions under which liquor is sold. In the case of trusts public control is direct since the whole of the liquor trade in a trust district is conducted by the trust, which is elected by the residents and is responsible to them.
The first licensing trust in New Zealand was set up in 1944 following the carrying of restoration in the former Invercargill no-licence district. There are now eight district trusts—Ashburton, Clutha, Geraldine, Invercargill, Masterton, Mataura, Oamaru, and Porirua. In addition, three local trusts at Hornby and Cheviot in Canterbury and Mt Wellington in the Auckland suburbs are operating hotels.
The only remaining no-licence districts are parts of the Wellington and Auckland Metropolitan areas, namely, Auckland Suburbs, Eden, Grey Lynn, Roskill, Wellington East, Wellington South, and Wellington West. Because of the circumstances of these areas and their relation to the metropolitan areas as a whole, legislation was enacted in 1963 providing a special procedure if any of them should carry restoration and introducing a new form of trust control known as suburban trusts.
On the carrying of restoration in any remaining no-licence district the Licensing Control Commission will review the area and decide what hotel, tourist-house and tavern premises licences and what wholesale licences are necessary or desirable in the district or any locality or place therein. If the Commission is of the opinion mat it should authorise the issue of any licence a further poll is taken on the question whether all licences to be so authorised should be offered to suburban trusts.
Should the trust proposal be carried, any local authority in the district may apply (or if no such application is made within the prescribed time 100 or more residents may apply) for the licence or licences to be issued to a suburban trust and the application must be granted if it conforms to the standards defined by the Commission. A suburban trust would then be established in accordance with the regulations to operate the licence or licences. If the trust proposal were not carried the ordinary procedure under the Sale of Liquor Act would be followed.
GENERAL ELECTION RESULTS—A general election of parliamentary representatives was held on 26 November 1966, voting in New Zealand for both European and Maori electorates taking place on that day.
The strength of the political party representation among members of Parliament after the 1966 election was National 44, Labour 35, Social Credit 1. The relative strengths after the six preceding general elections were as follows: November 1949, National 46, Labour 34; September 1951, National 50, Labour 30; November 1954, National 45, Labour 35; November 1957, Labour 41, National 39; November 1960, National 46, Labour 34; and November 1963, National 45, Labour 35.
The total number of electors on the roll for the election was 1,399,720 comprising European, 1,347,123 and Maori, 52,597. The number of votes recorded, including informal, was 1,212,127 (European 1,173,819; Maori 38,308), this figure including 9,880 special votes cast by persons who were not on the roll.
The following table shows for the last three general elections the number of votes recorded by the main political parties, along with the percentages that the various party votes represent of the total valid votes.
| — | Votes Recorded | Percentage of Total Valid Votes | ||||
|---|---|---|---|---|---|---|
| 1960 | 1963 | 1966 | 1960 | 1963 | 1966 | |
| National | 557,046 | 563,875 | 525,945 | 47.59 | 47.07 | 43.64 |
| Labour | 508,179 | 524,066 | 499,392 | 43.42 | 43.74 | 41.44 |
| Social Credit | 100,905 | 95,176 | 174,515 | 8.62 | 7.94 | 14.48 |
| Liberal | – | 10,339 | 5,243 | – | 0.87 | 0.44 |
| Communist | 2,423 | 3,167 | 0.21 | 0.26 | ||
| Other | 1,950 | 1,422 | 0.16 | 0.12 | ||
| Total valid votes | 1,170,503 | 1,198,045 | 1,205,095 | 100.00 | 100.00 | 100.00 |
| Informal votes | 6,460 | 7,277 | 7,032 | ... | ... | ... |
| Total votes recorded | 1,176,963 | 1,205,322 | 1,212,127 | ... | ... | ... |
A statement of voting in individual electorates (both European and Maori) at the general election in 1966 is now given.
NOTE—Abbreviations used: CD, Christian Democrat; C, Communist; D, Democrat; DUI, Democracy's United Independent; FMP, NZ Family Man's Party; I, Independent; ID, Independent Democrat; KPP, NZ Keynesian Progress Party; L, Labour; Loy, Loyalist Party; N, National; SC, Social Credit.
| Electoral District Names of Candidates, and Party Affiliations | Number of Votes Recorded | Number of Electors on Roll |
|---|---|---|
*Held 15 April 1967 following death of Hon. H. R. Lake. †Held 15 April 1967 following death of Hon. M. Moohan. ‡Held 11 March 1967 following death of Hon. Sir Eruera Tirikatene. §Held 12 August 1967 following death of Mr P. T. Watene. | ||
| Ashburton— | ||
| Barwood (S.C.) | 2,054 | |
| Srhoy (L) | 6,479 | |
| Talbot (N) | 7,462 | |
| Totals | 15,995 | 17,977 |
| Auckland Central— | ||
| Burke (S.C.) | 1,043 | |
| Douglas (L) | 6,103 | |
| Quinn (N) | 3,541 | |
| Totals | 10,687 | 13,958 |
| Avon— | ||
| Barrow (SC) | 2,515 | |
| Dawson (N) | 3,837 | |
| Mathison (L) | 9,069 | |
| Totals | 15,421 | 18,671 |
| Awarua— | ||
| Booker (L) | 3,811 | |
| Grieve (N) | 7,033 | |
| McNaughton (SC) | 3,290 | |
| Totals | 14,134 | 16,913 |
| Bay of Plenty— | ||
| Allen (N) | 7,118 | |
| Fischer (L) | 3,522 | |
| Knox (Mrs) (SC) | 2,749 | |
| Totals | 13,389 | 15,414 |
| Buller— | ||
| Dobier (SC) | 2,286 | |
| King (N) | 4,688 | |
| Rowling (L) | 6,510 | |
| Totals | 13,484 | 15,210 |
| Christchurch Central— | ||
| Francis (N) | 5,362 | |
| Locke (C) | 138 | |
| MacFarlane (L) | 6,771 | |
| Thomson (SC) | 1,455 | |
| Totals | 13,726 | 17,115 |
| Clutha— | ||
| Gordon (N) | 7,596 | |
| McKay (L) | 4,284 | |
| McMullan (SC) | 2,490 | |
| Totals | 14,370 | 16,344 |
| Dunedin Central— | ||
| Aberdeen (SC) | 1,687 | |
| Farry (N) | 6,312 | |
| MacDonell (L) | 7,557 | |
| Totals | 15,556 | 17,855 |
| Dunedin North— | ||
| Fagg (SC) | 2,052 | |
| Gerard (N) | 5,246 | |
| McMillan (Mrs) (L) | 8,079 | |
| Totals | 15,377 | 17,745 |
| Eden— | ||
| Rae (N) | 7,502 | |
| Stewart (L) | 4,954 | |
| Tanfield (SC) | 1,288 | |
| Totals | 13,744 | 16,606 |
| Egmont— | ||
| Finer (I) | 1,005 | |
| Johnston (SC) | 3,017 | |
| Vallely (L) | 2,560 | |
| Young (N) | 6,279 | |
| Totals | 12,861 | 14,839 |
| Fendalton— | ||
| Barclay (L) | 6,579 | |
| Forster (SC) | 1,803 | |
| Lake (N) | 8,850 | |
| Totals | 17,232 | 19,992 |
| Franklin— | ||
| Allen (N) | 7,343 | |
| Muir (ID) | 1,419 | |
| Waishing (L) | 2,260 | |
| Wheeler (SC) | 1,907 | |
| Totals | 12,929 | 14,830 |
| Gisborne— | ||
| MacDonald (L) | 6,063 | |
| Phin (SC) | 2,077 | |
| Tombleson (Mrs) (N) | 7,495 | |
| Totals | 15,635 | 17,427 |
| Grey Lynn— | ||
| MacDonald (L) | 8,329 | |
| McAra (C) | 152 | |
| Nash (N) | 3,930 | |
| Ross (SC) | 1,523 | |
| Totals | 13,934 | 16,763 |
| Hamilton— | ||
| Adams-Schneider (N) | 7,368 | |
| Bethune (SC) | 2,629 | |
| Reese (L) | 5,143 | |
| Totals | 15,140 | 17,607 |
| Hastings— | ||
| Davies (L) | 6,497 | |
| MacIntyre (N) | 8,626 | |
| Whitcombe (SC) | 1,695 | |
| Totals | 16,818 | 18,839 |
| Hauraki— | ||
| Kinsella (N) | 6,561 | |
| Mackey (SC) | 3,316 | |
| Uttinger (L) | 4,225 | |
| Totals | 14,102 | 16,247 |
| Hawke's Bay— | ||
| Bullock (SC) | 2,255 | |
| Evans (L) | 3,418 | |
| Harrison (N) | 7,333 | |
| Totals | 13,006 | 15,457 |
| Heretaunga— | ||
| Bailey (L) | 8,572 | |
| Burgess (DUI) | 138 | |
| Ritzema (SC) | 2,111 | |
| Ross (N) | 5,925 | |
| Totals | 16,746 | 18,874 |
| Hobson— | ||
| Cracknell (SC) | 6,791 | |
| Sloane (N) | 6,301 | |
| Srhoj (L) | 1,040 | |
| Totals | 14,132 | 15,591 |
| Hutt— | ||
| Dalglish (Mrs) (SC) | 1,431 | |
| Kennedy-Good (N) | 5,912 | |
| Nash (L) | 7,861 | |
| Totals | 15,204 | 17,423 |
| Invercargill— | ||
| Hanan (N) | 7,626 | |
| Steele (SC) | 2,611 | |
| Valentine (L) | 5,230 | |
| Totals | 15,467 | 17,959 |
| Island Bay— | ||
| Cameron (DUI) | 174 | |
| Goldsmith (N) | 4,461 | |
| Marshall (SC) | 1,487 | |
| Nordmeyer (L) | 7,267 | |
| Smith (C) | 139 | |
| Totals | 13,528 | 16,930 |
| Karori— | ||
| Blizard (L) | 5,691 | |
| Dickson (SC) | 1,798 | |
| Marshall (N) | 10,961 | |
| Totals | 18,450 | 21,083 |
| Lyttelton— | ||
| de Latour (N) | 6,924 | |
| Kirk (L) | 9,045 | |
| Munnings (SC) | 1,424 | |
| Totals | 17,393 | 19,737 |
| Manawatu— | ||
| Gandar (N) | 7,079 | |
| Hemmingsen (L) | 4,781 | |
| O'Brien (SC) | 2,930 | |
| Totals | 14,790 | 16,961 |
| Manukau— | ||
| Jordan (SC) | 1,609 | |
| Mill (I) | 121 | |
| Moyle (L) | 8,796 | |
| Peers (N) | 6,068 | |
| Smith (C) | 86 | |
| Totals | 16,680 | 19,165 |
| Manurewa— | ||
| Amos (L) | 9,725 | |
| Hieatt (C) | 147 | |
| Higham (SC) | 2,346 | |
| Kimpton (N) | 7,336 | |
| Totals | 19,554 | 23,236 |
| Marlborough— | ||
| Kerr (SC) | 1,943 | |
| Shand (N) | 7,216 | |
| Wall (L) | 6,484 | |
| Totals | 15,643 | 17,333 |
| Marsden— | ||
| Graham (Loy) | 101 | |
| Lewis (L) | 4,830 | |
| McKay (N) | 8,907 | |
| Rawson (SC) | 3,686 | |
| Totals | 17,524 | 20,177 |
| Miramar— | ||
| Fox (L) | 7,621 | |
| Morgan (SC) | 1,259 | |
| Young (N) | 7,767 | |
| Totals | 16,647 | 19,025 |
| Mount Albert— | ||
| Freer (L) | 7,359 | |
| Hibbert (N) | 4,705 | |
| Weal (SC) | 2,270 | |
| Totals | 14,334 | 16,772 |
| Napier— | ||
| Christie (L) | 8,088 | |
| Hollands (SC) | 1,850 | |
| Kidson (N) | 7,695 | |
| Totals | 17,633 | 19,708 |
| Nelson— | ||
| Nicholls (SC) | 3,250 | |
| Slack (N) | 5,732 | |
| Whitehead (L) | 7,777 | |
| Totals | 16,759 | 19,106 |
| New Lynn— | ||
| Foulds (C) | 152 | |
| Hunt (L) | 8,598 | |
| Lynch (N) | 4,871 | |
| Monteith (SC) | 2,372 | |
| Totals | 15,993 | 18,446 |
| New Plymouth— | ||
| Barclay (L) | 8,073 | |
| Clark (N) | 7,995 | |
| Mullins (SC) | 1,129 | |
| Totals | 17,197 | 18,793 |
| North Shore— | ||
| Bassett (L) | 7,132 | |
| Gair (N) | 13,240 | |
| Hill (SC) | 1,418 | |
| Totals | 16,790 | 19,245 |
| Onehunga— | ||
| Double (N) | 4,096 | |
| Robinson (SC) | 1,828 | |
| Watt (L) | 8,361 | |
| Totals | 14,285 | 17,281 |
| Otago Central— | ||
| George (N) | 7,060 | |
| Griffiths (L) | 4,755 | |
| Jones (SC) | 2,571 | |
| Totals | 14,386 | 16,355 |
| Otaki— | ||
| Herbert (L) | 5,618 | |
| McCready (N) | 9,193 | |
| Nixon (SC) | 3,587 | |
| Totals | 18,398 | 20,803 |
| Pahiatua— | ||
| Cheer (I) | 198 | |
| Holyoake (N) | 7,914 | |
| Morrow (SC) | 2,207 | |
| O'Brien (L) | 2,623 | |
| Totals | 12,942 | 14,844 |
| Pakuranga— | ||
| Moosman (FMP) | 71 | |
| Thompson (N) | 7,121 | |
| Tizard (L) | 9,380 | |
| Wreaks (SC) | 1,588 | |
| Totals | 18,160 | 21,054 |
| Palmerston North— | ||
| Brown (N) | 7,865 | |
| Thew (SC) | 1,620 | |
| Walding (L) | 7,606 | |
| Totals | 17,091 | 19,042 |
| Petone— | ||
| Millar (N) | 5,694 | |
| Moohan (L) | 8,301 | |
| Whitmill (SC) | 1,929 | |
| Totals | 15,924 | 18,819 |
| Piako— | ||
| Barrowclough (SC) | 3,090 | |
| Luxton (N) | 6,974 | |
| Smith (L) | 2,340 | |
| Totals | 12,404 | 14,745 |
| Porirua— | ||
| Blackwell (SC) | 1,335 | |
| Manson (C) | 161 | |
| May (L) | 7,807 | |
| Stevenson (N) | 5,879 | |
| Totals | 15,182 | 17,488 |
| Raglan— | ||
| Carter (N) | 7,288 | |
| Crook (C) | 94 | |
| Little (L) | 5,629 | |
| Murphy (SC) | 2,571 | |
| Totals | 15,582 | 17,884 |
| Rangiora— | ||
| Bere (SC) | 1,598 | |
| Pickering (N) | 7,338 | |
| Tirikatene (L) | 6,381 | |
| Totals | 15,317 | 17,335 |
| Rangitikei— | ||
| Shelton (N) | 7,375 | |
| Smith (SC) | 2,396 | |
| Wiseman (L) | 3,370 | |
| Totals | 13,141 | 15,131 |
| Remuera— | ||
| Clark (Mrs) (SC) | 1,651 | |
| Highet (N) | 10,127 | |
| Nairn (L) | 3,467 | |
| Totals | 15,245 | 18,099 |
| Riccarton— | ||
| Connelly (L) | 8,834 | |
| Cullen (SC) | 1,989 | |
| Wilson (N) | 6,109 | |
| Totals | 16,932 | 19,376 |
| Rodney— | ||
| McConachy (SC) | 4,433 | |
| Pickett (L) | 3,276 | |
| Scott (N) | 7,155 | |
| Totals | 14,864 | 16,805 |
| Roskill— | ||
| Cook (N) | 5,802 | |
| Faulkner (L) | 9,624 | |
| Howie (SC) | 2,218 | |
| Totals | 17,644 | 20,748 |
| Rotorua— | ||
| Knipe (L) | 5,152 | |
| Lamason (Mrs) (SC) | 2,465 | |
| Lapwood (N) | 7,450 | |
| Totals | 15,067 | 17,557 |
| St. Albans— | ||
| Adcock (L) | 5,880 | |
| McNeil (SC) | 1,344 | |
| Sadler (KPP) | 88 | |
| Walker (N) | 8,455 | |
| Totals | 15,767 | 18,356 |
| St. Kilda— | ||
| Chapman (SC) | 1,938 | |
| Fraser (L) | 8,691 | |
| Hall (N) | 5,882 | |
| Totals | 16,511 | 18,515 |
| Selwyn— | ||
| Campbell (L) | 4,777 | |
| McConnell (SC) | 1,903 | |
| McLachlan (N) | 7,374 | |
| Totals | 14,054 | 16,349 |
| Stratford— | ||
| Butler (L) | 3,131 | |
| Marks (SC) | 2,825 | |
| Thomson (N) | 7,246 | |
| Totals | 13,202 | 14,987 |
| Sydenham— | ||
| Armstrong (I) | 303 | |
| Garrett (N) | 4,124 | |
| Howard (Miss) (L) | 8,071 | |
| Pounsford (SC) | 2,631 | |
| Totals | 15,129 | 18,231 |
| Tamaki— | ||
| Branch (SC) | 1,032 | |
| Muldoon (N) | 9,248 | |
| Ryan (L) | 6,421 | |
| Totals | 16,701 | 18,896 |
| Taupo— | ||
| Dunn (SC) | 1,719 | |
| Gustafson (L) | 6,350 | |
| Stevenson (Mrs) (N) | 6,608 | |
| Totals | 14,677 | 16,552 |
| Tauranga— | ||
| Johnson (SC) | 3,170 | |
| Smuts-Kennedy (Mrs) (L) | 5,741 | |
| Walsh (N) | 8,040 | |
| Totals | 16,951 | 19,581 |
| Timaru— | ||
| Arthur (L) | 8,929 | |
| Brown (N) | 5,821 | |
| Hayes (SC) | 1,464 | |
| Totals | 16,214 | 18,190 |
| Waimarino— | ||
| Cameron (L) | 3,925 | |
| Jack (N) | 6,416 | |
| Lyford (SC) | 2,442 | |
| Totals | 12,783 | 14,850 |
| Waipa— | ||
| Munro (N) | 6,682 | |
| Shewan (L) | 3,601 | |
| Young (SC) | 3,027 | |
| Totals | 13,310 | 15,515 |
| Wairarapa— | ||
| Donald (N) | 7,080 | |
| Marks (SC) | 1,745 | |
| Williams (L) | 6,547 | |
| Totals | 15,372 | 16,808 |
| Waitakere— | ||
| Finlay (L) | 9,256 | |
| Robertson (SC) | 2,968 | |
| Wilkinson (N) | 5,443 | |
| Totals | 17,667 | 20,310 |
| Waitaki— | ||
| Dick (N) | 7,574 | |
| Milmine (SC) | 2,489 | |
| Rodger (L) | 5,565 | |
| Totals | 15,628 | 17,206 |
| Waitemata— | ||
| King (L) | 11,624 | |
| Power (N) | 7,792 | |
| Richards (SC) | 2,476 | |
| Totals | 21,892 | 25,249 |
| Waitomo— | ||
| Barber (SC) | 2,689 | |
| Ingram (L) | 2,725 | |
| Seath (N) | 7,167 | |
| Totals | 12,581 | 14,929 |
| Wallace— | ||
| Begg (L) | 3,876 | |
| Talboys (N) | 7,841 | |
| Williams (SC) | 2,870 | |
| Totals | 14,587 | 17,105 |
| Wanganui— | ||
| Dempsey (SC) | 3,206 | |
| Grace (N) | 5,591 | |
| Spooner (L) | 6,499 | |
| Turney (CD) | 233 | |
| Totals | 15,529 | 17,134 |
| Wellington Central— | ||
| Healy (SC) | 799 | |
| Hughes (D) | 185 | |
| O'Regan (L) | 6,214 | |
| Riddiford (N) | 7,927 | |
| Totals | 15,125 | 18,570 |
| Westland— | ||
| Blanchfield (L) | 7,621 | |
| Ferguson (N) | 3,580 | |
| Fraser (SC) | 2,104 | |
| Mitchell (C) | 138 | |
| Totals | 13,44,3 | 15,051 |
| MAORI ELECTORATES | ||
| Eastern Maori— | ||
| Paul (SC) | 1,158 | |
| Reedy (N) | 3,416 | |
| Watene (L) | 6,537 | |
| Totals | 11,111 | 14,190 |
| Northern Maori— | ||
| Rata (L) | 5,926 | |
| Wairua (SC) | 1,212 | |
| Wilcox (N) | 1,629 | |
| Totals | 8,767 | 12,074 |
| Southern Maori— | ||
| MacDonald (SC) | 457 | |
| Pere (N) | 1,642 | |
| Tirikatene (L) | 5,474 | |
| Totals | 7,573 | 11,845 |
| Western Maori— | ||
| Ratana (Mrs) (L) | 7 304 | |
| Sadler (SC) | 925 | |
| Te Heuheu (N) | 1,724 | |
| Totals | 9,953 | 14,488 |
| BY-ELECTION | ||
| Fendalton*— | ||
| Barclay (L) | 6,738 | |
| Forster (SC) | 1,451 | |
| Holland (N) | 7,024 | |
| Totals | 15,213 | 19,992 |
| Petone†— | ||
| Colman (L) | 7,086 | |
| Martin (N) | 4,003 | |
| Whitmill (SC) | 1,888 | |
| Totals | 12,977 | 18,819 |
| Southern Maori‡— | ||
| MacDonald | 347 | |
| Pere (N) | 1,371 | |
| Tirikatene-Sullivan (Mrs) (L) | 4,968 | |
| Totals | 6,686 | 11,845 |
| Eastern Maori§— | ||
| Bennett (IM) | 671 | |
| Huata (IL) | 246 | |
| Paul (SC) | 1,219 | |
| Reedy (N) | 2,416 | |
| Reweti (L) | 4,460 | |
| Totals | 9,012 | 14,190 |
NATIONAL LICENSING POLL—The licensing poll of 26 November 1966, held in conjunction with the parliamentary elections, was the thirteenth at which the three issues—national continuance, State purchase and control, and national prohibition (without compensation)—were submitted to the electors. Official figures of the 1966 poll, together with those of five preceding polls, were as follows.
| — | 1949 | 1954 | 1957 | 1960 | 1963 | 1966 |
|---|---|---|---|---|---|---|
| For national continuance | 660,573 | 672,754 | 723,059 | 765,952 | 791,767 | 817,760 |
| For State purchase and control | 135,982 | 164,380 | 160,483 | 138,644 | 157,581 | 176,946 |
| For national prohibition | 268,567 | 250,460 | 260,132 | 255,157 | 235,959 | 198,859 |
The percentage of votes recorded for State purchase and control was 12.8 of the total votes in 1949, 15.1 in 1954, 14.0 in 1957, 12.0 in 1960, 13.3 in 1963, and 14.8 in 1966. National continuance reached 63.4 percent in 1935, since when it fell gradually to 54.0 percent in 1946, recovered substantially at the expense largely of the State purchase and control vote to 62.0 percent in 1949, was steady at 61.9 percent in 1954, rose to 63.2 percent in 1957 and to 66.0 in 1960, 66.8 in 1963, 68.5 in 1966. Votes cast in favour of national prohibition amounted to 47.3 percent in 1925, but fell heavily at each of the next two polls, reaching 29.6 percent in 1935. There was little variation in this percentage in 1938 and 1943, but further falls to 25.2 percent, 23.0, 22.8, 22.0, 19.9 and 16.7 percent were recorded in 1949, 1954, 1957, 1960, 1963, and 1966 respectively.
| Electoral District | For National Continuance | For State Purchase and Control | For National Prohibition |
|---|---|---|---|
| Ashburton | 10,893 | 2,142 | 2,878 |
| Auckland Central | 6,811 | 2,138 | 1,537 |
| Avon | 10,641 | 2,363 | 2,251 |
| Awarua | 9,900 | 1,205 | 2,914 |
| Bay of Plenty | 9,114 | 1,829 | 2,268 |
| Buller | 9,801 | 1,414 | 2,147 |
| Christchurch Central | 9,496 | 1,939 | 2,136 |
| Clutha | 9,615 | 1,726 | 2,910 |
| Dunedin Central | 10,579 | 2,334 | 2,509 |
| Dunedin North | 9,864 | 2,696 | 2,719 |
| Eden | 8,341 | 2,139 | 3,067 |
| Egmont | 9,655 | 1,046 | 2,076 |
| Fendalton | 12,339 | 2,230 | 2,598 |
| Franklin | 8,663 | 1,622 | 2,404 |
| Gisborne | 11,264 | 1,894 | 2,345 |
| Grey Lynn | 8,609 | 2,535 | 2,585 |
| Hamilton | 9,874 | 2,174 | 2,960 |
| Hastings | 11,860 | 2,182 | 2,625 |
| Hauraki | 9,640 | 1,718 | 2,597 |
| Hawke's Bay | 9,837 | 1,424 | 1,676 |
| Heretaunga | 11,623 | 3,108 | 1,825 |
| Hobson | 9,354 | 1,864 | 2,736 |
| Hutt | 9,882 | 3,012 | 2,151 |
| Invercargill | 10,450 | 1,446 | 3,416 |
| Island Bay | 8,804 | 2,395 | 2,138 |
| Karori | 12,890 | 2,881 | 2,591 |
| Lyttelton | 11,746 | 2,800 | 2,670 |
| Manawatu | 10,458 | 1,671 | 2,558 |
| Manukau | 10,489 | 3,293 | 2,775 |
| Manurewa | 12,858 | 3,312 | 3,110 |
| Marlborough | 11,565 | 1,661 | 2,263 |
| Marsden | 11,494 | 2,813 | 3,117 |
| Miramar | 11,204 | 2,550 | 2,720 |
| Mount Albert | 8,305 | 2,647 | 3,213 |
| Napier | 12,423 | 2,426 | 2,612 |
| Nelson | 11,113 | 2,051 | 3,476 |
| New Lynn | 9,992 | 2,906 | 2,912 |
| New Plymouth | 11,938 | 1,979 | 3,133 |
| North Shore | 11,229 | 2,959 | 2,456 |
| Onehunga | 8,718 | 2,909 | 2,475 |
| Otago Central | 10,059 | 2,084 | 2,157 |
| Otaki | 12,588 | 2,725 | 2,939 |
| Pahiatua | 9,779 | 1,209 | 1,956 |
| Pakuranga | 11,987 | 3,502 | 2,513 |
| Palmerston North | 11,868 | 2,191 | 2,892 |
| Petone | 10,428 | 3,335 | 1,969 |
| Piako | 8,834 | 1,237 | 2,228 |
| Porirua | 10,081 | 2,956 | 2,014 |
| Raglan | 10,675 | 2,335 | 2,454 |
| Rangiora | 10,914 | 1,679 | 2,612 |
| Rangitikei | 9,771 | 1,117 | 2,150 |
| Remuera | 10,845 | 1,944 | 2,347 |
| Riccarton | 11,980 | 2,329 | 2,491 |
| Rodney | 10,016 | 2,033 | 2,694 |
| Roskill | 10,911 | 3,217 | 3,370 |
| Rotorua | 10,677 | 2,231 | 2,018 |
| St. Albans | 10,653 | 2,089 | 2,879 |
| St. Kilda | 10,981 | 2,627 | 2,793 |
| Selwyn | 10,055 | 1,667 | 2,208 |
| Stratford | 10,070 | 1,027 | 2,005 |
| Sydenham | 9,949 | 2,456 | 2,620 |
| Tamaki | 11,497 | 2,628 | 2,577 |
| Taupo | 10,383 | 2,359 | 1,749 |
| Tauranga | 11,417 | 2,386 | 2,985 |
| Timaru | 10,614 | 2,819 | 2,668 |
| Waimarino | 9,733 | 1,352 | 1,588 |
| Waipa | 8,978 | 1,704 | 2,543 |
| Wairarapa | 10,828 | 1,926 | 2,471 |
| Waitakere | 11,471 | 3,164 | 2,876 |
| Waitaki | 10,545 | 1,994 | 2,942 |
| Waitemata | 14,886 | 3,980 | 2,856 |
| Waitomo | 9,327 | 1,330 | 1,804 |
| Wallace | 10,325 | 1,243 | 2,963 |
| Wanganui | 10,925 | 1,979 | 2,493 |
| Wellington Central | 10,833 | 2,329 | 1,700 |
| Westland | 10,481 | 1,376 | 1,495 |
| Eastern Maori | 5,890 | 2,395 | 2,561 |
| Northern Maori | 4,260 | 2,185 | 1,880 |
| Southern Maori | 4,206 | 1,789 | 1,519 |
| Western Maori | 4,709 | 2,585 | 2,331 |
| Totals | 817,760 | 176,946 | 198,859 |
| Licensing District | For Local Restoration | For Local No-licence | Number of Valid Votes |
|---|---|---|---|
| Auckland Suburbs | 23,307 | 19,130 | 42,437 |
| Eden | 4,286 | 5,589 | 9,875 |
| Grey Lynn | 5,222 | 5,774 | 10,996 |
| Roskill | 11,383 | 14,854 | 26,237 |
| Wellington East | 7,012 | 6,664 | 13,676 |
| Wellington South | 4,502 | 3,381 | 7,883 |
| Wellington West | 6,883 | 6,965 | 13,848 |
| Totals | 62,595 | 62,357 | 124,952 |
TIME-SERVICE ARRANGEMENTS—One uniform time is kept throughout New Zealand. The New Zealand Gazette of 31 October 1868 contained a Government announcement to the effect that the time corresponding to longitude 172° 30' east of Greenwich (exactly 11 1/2 hours in advance of Greenwich time) was to be adopted as the New Zealand Mean Time throughout the colony.
This New Zealand Mean Time 11 h 30 min, in advance of Greenwich Mean Time (G.M.T.), was observed continuously up to 1927, when on 6 November clocks were advanced 1 hour until 4 March 1928. Summer Time, with clocks advanced only 30 minutes (to 12 h ahead of G.M.T.), became standard practice in the summer months under the Summer Time Act 1929.
The Daylight Saving Emergency Regulations of 1941 provided for the continuance of Summer Time throughout that year, and its continued observance during subsequent war years was provided for by regulations made annually.
By the Standard Time Act of 1945 the time of the meridian 180° east of Greenwich (12 h in advance of G.M.T.) was adopted as the Standard Time for New Zealand. Thus, what was formerly known as “Summer Time” became “New Zealand Standard Time” as from 1 January 1946. The times stated in this article are New Zealand Standard Time, unless otherwise stated.
The time throughout New Zealand is controlled by the New Zealand Time Service, Department of Scientific and Industrial Research, Wellington. The Observatory signal clock is kept as correct as possible by means of astronomical observations and by comparison with radio time signals from observatories in other parts of the world.
The Observatory provides the following time service:
RADIO TIME SIGNALS TRANSMITTED THROUGH STATION ZLW ON A WAVE-LENGTH OF 500 Kc/s (600 METRES) I.C.W.
These signals are transmitted between 10 h 54 min and 11 h 00 min a.m. daily, and are in accordance with the English system. All times are given in New Zealand Standard lime. The procedure is as follows:
At 22 h 54 min 00 sec the “Attention” call (—.—.—).
From 22 h 54 min 10 sec to 22 h 54 min 40 sec the letters ZMO (— —..— — — — —), repeated every 10 seconds.
From 22 h 55 min 00 sec to 23 h 00min 00 sec a dot each second, lengthened to a dash on the sixtieth second of each minute.
Each dot consists of 150 cycles of 1,000 c/s audio tone and the dash on the sixtieth second of each minute is lengthened to 300 c/cles.
Origin of Signal—The time signals are derived from the quartz crystal clock of the New Zealand Time Service.
Error—Normally less than five hundredths of a second.
Corrections to the time signals can be obtained on application to the Officer in Charge, New Zealand Time Service.
RADIO TIME SIGNALS TRANSMITTED BY THE NEW ZEALAND BROAD-CASTING CORPORATION
Time Signals from the Observatory are transmitted at New Zealand Standard Time as follows:
National programme daily— 1YA (760 kc); 1YW (1,140 kc); 1YX (830 kc); 1YZ (860 kc); 2YA (570 kc); 2YW (1,180 kc); 2YZ (630 kc); 3YA (690 kc); 3YW (1,460 kc); 3YZ (920 kc); 4YA (780 kc); 4YX (640 kc); 4YZ (720 kc): 6.00 a.m., 7.00 a.m., 8.00 a.m., 9.00 a.m., 10.58 a.m., 10.59 a.m., 11.00 a.m., 12.30 p.m., 4.00 p.m., 6.00 p.m., 6.30 p.m., 7.00 p.m., 9.00 p.m., 10.00 p.m., 11.00 p.m.
All-night national programme daily except Mondays—(1YA, 2YA, 3YA, 4YA, 4YX) 1.00 a.m., 3.00 a.m., 4.00 a.m., 5.00 a.m.
Each time signal consists of six dots, at one second intervals, the beginning of the last dot being the exact minute. Each dot consists of 150 cycles of 1,000 c/s audio tone except that which denotes the exact hour is lengthened to 300 cycles. The error is normally less than five hundredths of a second.
PUBLIC HOLIDAYS—These are listed below.
| — | 1967 | 1968 |
|---|---|---|
| *Date of Queen's Birthday, 21 April 1926. | ||
| New Year's Day | 1 January | 1 January |
| Good Friday | 24 March | 12 April |
| Easter Monday | 27 March | 15 April |
| Anzac Day | 25 April | 25 April |
| Queen's Birthday* (observance) | 5 June | 3 June |
| Labour Day | 23 October | 28 October |
| Christmas Day | 25 December | 25 December |
| Boxing Day | 26 December | 26 December |
In addition to the above, there is in each provincial district a holiday for the provincial anniversary. The actual anniversary days are as follows: Northland, 6 February (Waitangi Day); Auckland, 29 January; Taranaki, 31 March; Hawke's Bay, 1 November; Wellington, 22 January; Marlborough, 1 November; Nelson, 1 February; Canterbury, 16 December; Westland, 1 December; Otago and Southland, 23 March.
When Anniversary Day falls on Friday or later, the holiday is observed on the next Monday; if earlier, it is observed on the preceding Monday. In some cases the holiday is taken on the local show day or some other day.
NATIONAL SONG—New Zealand's National Song is God Defend New Zealand, the words being written by Thomas Bracken and the music composed by John J. Woods.
The verses are now given.
God of nations at Thy feet In the bonds of love we meet, Hear our voices, we entreat, God defend our Free Land Guard Pacific's triple star From the shafts of strife and war, Make her praises heard afar, God defend New Zealand.
Men of ev'ry creed and race Gather here before Thy face, Asking Thee to bless this place, God defend our Free Land. From dissension, envy, hate, And corruption guard our State, Make our country good and great, God defend New Zealand.
Peace, not war, shall be our boast, But, should foes assail our coast, Make us then a mighty host, God defend our Free Land. Lord of battles in Thy might, Put our enemies to flight, Let our cause be just and right, God defend New Zealand.
Let our love for Thee increase, May Thy blessings never cease, Give us plenty, give us peace, God defend our Free Land. From dishonour and from shame Guard our country's spotless name, Crown her with immortal fame, God defend New Zealand.
May our mountains ever be Freedom's ramparts on the sea, Make us faithful unto Thee, God defend our Free Land. Guide her in the nation's van, Preaching love and truth to man, Working out Thy glorious plan, God defend New Zealand.
Table of Contents
GOVERNOR-GENERAL OF NEW ZEALAND
His Excellency Brigadier Sir Bernard Edward Fergusson. G.C.M.G., G.C.V.O., D.S.O., O.B.F..
Official Secretary—D. C. Williams, Esq.
(His Excellency assumed office on 9 November 1962)
GOVERNOR-GENERAL (DESIGNATE)
Sir Arthur E. Porritt, BART., K.C.M.G., K.C.V.O., K.ST.J., O.B.E.
PREVIOUS VICE-REGAL REPRESENTATIVES
Governors since 1840 and Governors-General since 1924 are listed below.
| Vice-Regal Representative | Assumed Office | Retired |
|---|---|---|
| THE DEPENDENCY PERIOD | ||
| Lieutenant-Governor | ||
| Captain William Hobson, R.N. | 30 Jan 1840 | 3 May 1841 |
| THE CROWN COLONY | ||
| Governor | ||
| Captain William Hobson, R.N. | 3 May 1841 | 10 Sep 1842 |
| Captain Robert FitzRoy, R.N. | 26 Dec 1843 | 17 Nov 1845 |
| Captain George Grey | 18 Nov 1845 | 31 Dec 1847 |
| Governor in Chief | ||
| Sir George Grey, K.C.B. | 1 Jan 1848 | 7 Mar 1853 |
| THE SELF-GOVERNING COLONY | ||
| Governor of New Zealand | ||
| Sir George Grey, K.C.B. | 7 Mar 1853 | 31 Dec 1853 |
| Colonel Thomas Gore Browne, C.B. | 6 Sep 1855 | 2 Oct 1861 |
| Sir George Grey, K.C.B. | 4 Dec 1861 | 5 Feb 1868 |
| Sir George Ferguson Bowen, G.C.M.G. | 5 Feb 1868 | 19 Mar 1873 |
| The Right Hon. Sir James Fergusson, BART., G.C.S.I., K.C.M.G., C.I.E. | 14 Jun 1873 | 3 Dec 1874 |
| The Right Hon. the Marquess of Normanby, G.C.B., G.C.M.G., P.C. | 9 Jan 1875 | 21 Feb 1879 |
| Sir Hercules George Robert Robinson, G.C.M.G. | 17 Apr 1879 | 8 Sep 1880 |
| The Hon. Sir Arthur Hamilton Gordon, G.C. M.G. | 29 Nov 1880 | 23 Jun 1882 |
| Lieutenant-General Sir William Francis Drummond Jervois, G.C.M.G., C.B. | 20 Jan 1883 | 22 Mar 1889 |
| The Right Hon. Earl of Onslow, G.C.M.G. | 2 May 1889 | 24 Feb 1892 |
| The Right Hon. Earl of Glasgow, G.C.M.G. | 7 Jun 1892 | 6 Feb 1897 |
| The Right Hon. Earl of Ranfurly, G.C.M.G. | 10 Aug 1897 | 19 Jun 1904 |
| The Right Hon. Baron Plunket, K.C.M.G., K.C.V.O. | 20 Jun 1904 | 8 Jun 1910 |
| The Right Hon. Baron Islington, G.C.M.G., G.B.E., D.S.O. | 22 Jun 1910 | 2 Dec 1912 |
| The Right Hon. the Earl of Liverpool, G.C.B., G.C.M.G., G.B.E., M.V.O., P.C. | 19 Dec 1912 | 27 Jun 1917 |
| Governor-General of New Zealand | ||
| The Right Hon. the Earl of Liverpool, G.C.B., G.C.M.G., G.B.E., M.V.O., P.C. | 28 Jun 1917 | 7 Jul 1920 |
| The Right Hon. Earl Jellicoe, G.C.B., O.M., G.C.V.O. | 27 Sep 1920 | 26 Nov 1924 |
| General Sir Charles Fergusson, BART., G.C.B., G.C.M.G., D.S.O., M.V.O. | 13 Dec 1924 | 8 Feb 1930 |
| The Right Hon. Viscount Bledisloe, G.C.M.G., K.B.E., P.C. | 19 Mar 1930 | 15 Mar 1935 |
| The Right Hon. Viscount Galway, G.C.M.G., D.S.O., O.B.E., P.C. | 12 Apr 1935 | 3 Feb 1941 |
| Marshal of the Royal Air Force the Right Hon. Baron Newall, G.C.B., O.M., G.C.M.G., C.B.E., A.M. | 22 Feb 1941 | 19 Apr 1946 |
| Lieutenant-General the Right Hon. Baron Freyberg, V.C., G.C.M.G., K.C.B., K.B.E., D.S.O. | 17 Jun 1946 | 15 Aug 1952 |
| Lieutenant-General the Right Hon. Baron Norrie, G.C.M.G., G.C.V.O., C.B., D.S.O., M.C. | 2 Dec 1952 | 25 Jul 1957 |
| The Right Hon. Viscount Cobham, G.C.M.G., T.D. | 5 Sep 1957 | 13 Sep 1962 |
| SUCCESSIVE MINISTRIES AND PRIME MINISTERS | |||
|---|---|---|---|
| SINCE THE ESTABLISHMENT OF RESPONSIBLE GOVERNMENT IN NEW ZEALAND IN 1856 | |||
| Name of Ministry | Name of Prime Minister | Assumed Office | Retired |
| 1. Bell-Sewell | Henry Sewell | 7 May 1856 | 20 May 1856 |
| 2. Fox | William Fox | 20 May 1856 | 2 Jun 1856 |
| 3. Stafford | Edward William Stafford | 2 Jun 1856 | 12 Jul 1861 |
| 4. Fox | William Fox | 12 Jul 1861 | 6 Aug 1862 |
| 5. Domett | Alfred Domett | 6 Aug 1862 | 30 Oct 1863 |
| 6. Whitaker-Fox | Frederick Whitaker | 30 Oct 1863 | 24 Nov 1864 |
| 7. Weld | Frederick Aloysius Weld | 24 Nov 1864 | 16 Oct 1865 |
| 8. Stafford | Edward William Stafford | 16 Oct 1865 | 28 Jun 1869 |
| 9. Fox | William Fox | 28 Jun 1869 | 10 Sep 1872 |
| 10. Stafford | Edward William Stafford | 10 Sep 1872 | 11 Oct 1872 |
| 11. Waterhouse | George Marsden Waterhouse | 11 Oct 1872 | 3 Mar 1873 |
| 12. Fox | William Fox | 3 Mar 1873 | 8 Apr 1873 |
| 13. Vogel | Julius Vogel, C.M.G. | 8 Apr 1873 | 6 Jul 1875 |
| 14. Pollen | Daniel Pollen, M.L.C. | 6 Jul 1875 | 15 Feb 1876 |
| 15. Vogel | Sir Julius Vogel, K.C.M.G. | 15 Feb 1876 | 1 Sep 1876 |
| 16. Atkinson | Harry Albert, Atkinson | 1 Sep 1876 | 13 Sep 1876 |
| 17. Atkinson (reconstituted) | Harry Albert Atkinson | 13 Sep 1876 | 13 Oct 1877 |
| 18. Grey | Sir George Grey, K.C.B. | 15 Oct 1877 | 8 Oct 1879 |
| 19. Hall | John Hall | 8 Oct 1879 | 21 Apr 1882 |
| 20. Whitaker | Frederick Whitaker, M.L.C. | 21 Apr 1882 | 25 Sep 1883 |
| 21. Atkinson | Harry Albert Atkinson | 25 Sep 1883 | 16 Aug 1884 |
| 22. Stout-Vogel | Robert Stout | 16 Aug 1884 | 28 Aug 1884 |
| 23. Atkinson | Harry Albert Atkinson | 28 Aug 1884 | 3 Sep 1884 |
| 24. Stout-Vogel | Sir Robert Stout, K.C.M.G. | 3 Sep 1884 | 8 Oct 1887 |
| 25. Atkinson | Sir Harry Albert Atkinson, K.C.M.G. | 8 Oct 1887 | 24 Jan 1891 |
| 26. Ballance | John Ballance | 24 Jan 1891 | 1 May 1893 |
| 27. Seddon | Right Hon. Richard John Seddon | 1 May 1893 | 21 Jun 1906 |
| 28. Hall-Jones | William Hall-Jones | 21 Jun 1906 | 6 Aug 1906 |
| 29. Ward | Right Hon. Sir Joseph George Ward, BART., K.C.M.G. | 6 Aug 1906 | 28 Mar 1912 |
| 30. Mackenzie | Thomas Mackenzie | 28 Mar 1912. | 10 Jul 1912 |
| 31. Massey | Right Hon. William Ferguson Massey | 10 Jul 1912 | 12 Aug 1915 |
| 32. National | Right Hon. William Ferguson Massey | 12 Aug 1915 | 25 Aug 1919 |
| 33. Massey | Right Hon. William Ferguson Massey | 25 Aug 1919 | 14 May 1925 |
| 34. Bell | Hon. Sir Francis Henry Dillon Bell, G.C.M.G., K.C. | 14 May 1925 | 30 May 1925 |
| 35. Coates | Right Hon. Joseph Gordon Coates, M.C. | 30 May 1925 | 10 Dec 1928 |
| 36. Ward | Right Hon. Sir Joseph George Ward, BART., G.C.M.G. | 10 Dec 1928 | 28 May 1930 |
| 37. Forbes | Right Hon. George William Forbes | 28 May 1930 | 22 Sep 1931 |
| 38. Coalition | Right Hon. George William Forbes | 22 Sep 1931 | 6 Dec 1935 |
| 39. Savage | Right Hon. Michael Joseph Savage | 6 Dec 1935 | 1 Apr 1940 |
| 40. Fraser | Hon. Peter Fraser | 1 Apr 1940 | 30 Apr 1940 |
| 41. Fraser | Right Hon. Peter Fraser, C.H. | 30 Apr 1940 | 13 Dec 1949 |
| 42. Holland | Right Hon. Sir Sidney George Holland, G.C.B., C.H. | 13 Dec 1949 | 26 Sep 1957 |
| 43. Holyoake | Right Hon. Keith Jacka Holyoake | 26 Sep 1957 | 12 Dec 1957 |
| 44. Nash | Right Hon. Walter Nash, C.H. | 12 Dec 1957 | 12 Dec 1960 |
| 45. Holyoake | Right Hon. Keith Jacka Holyoake, C.H. | 12 Dec 1960 | |
Right Hon. K. J. HOLYOAKE, C.H., Prime Minister, Minister of External Affairs, Minister of State Services, Minister in Charge of the Legislative Department, Minister in Charge of the Audit Department.
Right Hon. J. R. MARSHALL, Deputy Prime Minister, Minister of Industries and Commerce, Minister of Overseas Trade.
Hon. J. R. HANAN, Attorney-General, Minister of Justice, Minister of Maori Affairs, Minister of Island Territories.
Hon. T. P. SHAND, Minister of Labour, Minister of Immigration, Minister of Mines, Minister of Electricity.
Hon. N. L. SHELTON, Minister of Customs, Associate Minister of Industries and Commerce.
Hon. B. E. TALBOYS, Minister of Agriculture, Minister of Science.
Hon. J. RAE, Minister of Housing, Minister in Charge of the State Advances Corporation, Minister in Charge of the Public Trust Office, Minister in Charge of the Government Life Insurance Office, Minister in Charge of the State Insurance Office, Minister in Charge of the Earthquake and War Damage Commission.
Hon. A. E. KINSELLA, Minister of Education.
Hon. D. N. McKAY, Minister of Health, Minister of Social Security, Minister in Charge of the Child Welfare Division, Minister for the Welfare of Women and Children.
Hon. D. C. SEATH, Minister of Internal Affairs, Minister for Local Government, Minister of Civil Defence.
Hon. P. B. ALLEN, Minister of Works, Minister in Charge of Police.
Hon. W. J. SCOTT, Postmaster-General, Minister of Marine, Minister in Charge of the Government Printing Office.
Hon. J. B. GORDON, Minister of Transport, Minister of Railways, Minister of Civil Aviation.
Hon. D. MacINTYRE, D.S.O., O.B.E., E.D., Minister of Lands, Minister of Forests, Minister in Charge of the Valuation Department.
Hon. D. S. THOMSON, M.C., ED., Minister of Defence, Minister of Tourism, Minister Assistant to the Prime Minister, Minister in Charge of Publicity, Minister in Charge of War Pensions, Minister in Charge of Rehabilitation.
Hon. L. R. ADAMS-SCHNEIDER, Minister of Broadcasting, Minister Assistant to Minister of Customs.
Hon. R. D. MULDOON, Minister of Finance, Minister in Charge of the Department of Statistics, Minister in Charge of Friendly Societies.
Parliamentary Under-Secretary—
D. J. CARTER, Parliamentary Under-Secretary to the Minister of Agriculture.
Clerk of the Executive Council, P. J. Brooks, B.A., D.P.A., Admin. Prof.
Prime Minister—Rt. Hon. K. J. Holyoake, C.H.
Leader of the Opposition—N. E. Kirk.
Speaker—Hon. R. E. Jack. Chairman of Committees—J. H. George.
Clerk of the House—H. N. Dollimore, LL.B.
| Name | Electoral District |
|---|---|
* Government Member. †Elected 15 April 1967 following the death of Hon M. Moohan. ‡Elected 11 March 1967 following the death of Hon Sir Eruera Tirikatene, K.C.M.G. §Elected 15 April 1967 following the death of Hon H. R. Lake. ¶Elected 12 August 1967 following the death of Mr P. T. Watene. | |
| For European Electorates | |
| Adams-Schneider, Hon. L. R.* | Hamilton |
| Allen, A. E.* | Franklin |
| Allen, Hon. P. B.* | Bay of Plenty |
| Amos, P. A. | Manurewa |
| Arthur, Sir Basil, Bt. | Timaru |
| Bailey, R. L. | Heretaunga |
| Barclay, R. M. | New Plymouth |
| Blanchfield. P. | Westland |
| Brown, W. H.* | Palmerston North |
| Carter, D. J.* | Raglan |
| Christie, G. | Napier |
| Colman, F. MacD.† | Petone |
| Connelly, M. A. | Riccarton |
| Cracknell, V. F. | Hobson |
| Dick, A. D.* | Waitaki |
| Donald, H. V.,* D.S.O., M.C. | Wairarapa |
| Douglas, N. V. | Auckland Central |
| Faulkner, A. J. | Roskill |
| Finlay, Dr A. M. | Waitakere |
| Fraser, W. A. | St. Kilda |
| Freer, W. W. | Mount Albert |
| Gair, G. F.* | North Shore |
| Gandar, L. W.* | Manawatu |
| George, J. H.* | Otago Central |
| Gordon, Hon. J. B.* | Clutha |
| Grieve, G. G.* | Awarua |
| Hanan, Hon. J. R.* | Invercargill |
| Harrison, J. R.* | Hawke's Bay |
| Highet, D. A.* | Remuera |
| Holland, E. S. F.§ | Fendalton |
| Holyoake, Right Hon. K. J., C.H.* | Pahiatua |
| Howard, Hon. Miss M. B. | Sydenham |
| Hunt, J. L. | New Lynn |
| Jack, Hon. R. E.* | Waimarino |
| King, N. J. | Waitemata |
| Kinsella, Hon. A. E.* | Hauraki |
| Kirk, N. E. | Lyttelton |
| Lapwood, H. R.* | Rotorua |
| Luxton, J. F.* | Piako |
| McCready, A.* | Otaki |
| Macdonald, R. | Grey Lynn. |
| MacDonell, B. P. | Dunedin Central |
| Macfarlane, Hon. R. M., C.M.G. | Christchurch Central |
| MacIntyre, Hon. D., D.S.O., O.B.E., E.D.* | Hastings |
| McKay, Hon. D. N.* | Marsden |
| McLachlan, C. C. A.* | Selwyn |
| McMillan, Mrs E. E. | North Dunedin |
| Marshall, Rt. Hon. J. R.* | Karori |
| Mathison. Hon. J. | Avon |
| May, H. L. J. | Porirua |
| Moyle, C. J. | Manukau |
| Muldoon, Hon. R. D.* | Tamaki |
| Munro, Sir Leslie, K.C.M.G., K.C.V.O.* | Waipa |
| Nash, Right Hon. Sir Walter, G.C.M.G., C.H. | Hutt |
| Nordmeyer, Hon. A. H. | Island Bay |
| Pickering, H. E. L.* | Rangiora |
| Rae, Hon, J.* | Eden |
| Riddiford, D. J., M.C.* | Wellington Central |
| Rowling, W. E. | Buller |
| Scott, Hon. W. J.* | Rodney |
| Seath, Hon. D. C.* | Waitomo |
| Shand, Hon. T. P.* | Marlborough |
| Shelton, Hon. N. L.* | Rangitikei |
| Spooner, G. A. | Wanganui |
| Stevenson, Mrs R. M.* | Taupo |
| Talbot, R. L. G.* | Ashburton |
| Talboys, Hon. B. E.* | Wallace |
| Thomson, Hon. D. S., M.C., E.D.* | Stratford |
| Tizard, R. J. | Pakuranga |
| Tombleson, Mrs E. I.* | Gisborne |
| Walker, H.J.* | St. Albans |
| Walsh, G. A.* | Tauranga |
| Watt, Hon. H. | Onehunga |
| Whitehead, S. A. | Nelson |
| Young, V. S.* | Egmont |
| Young, W. L.* | Miramar |
| For Maori Electorates | |
| Rata, M. | Northern Maori |
| Ratana, Mrs I. M. | Western Maori |
| Tirikatene-Sullivan, Mrs T. W.M.‡ | Southern Maori |
| Reweti, P. B.¶ | Eastern Maori |
| Parliament | Date of Opening of Session | Date of Ending of Session |
|---|---|---|
| Thirty-first | 22 March 1955 | 28 October 1955 |
| 4 April 1956 | 26 October 1956 | |
| 11 June 1957 | 25 October 1957 | |
| Thirty second | 21 January 1958 | 31 January 1958 |
| 10 June 1958 | 3 October 1958 | |
| 24 June 1959 | 23 October 1959 | |
| 22 June 1960 | 28 October 1960 | |
| 20 June 1961 | 1 December 1961 | |
| Thirty-third | 7 June 1962 12 | February 1963 |
| 14 December 1962 | 12 February 1963 | |
| 20 June 1963 | 25 October 1963 | |
| Thirty-fourth | 10 June 1964 | 4 December 1964 |
| 27 May 1965 | 30 October 1965 | |
| 26 May 1966 | 21 October 1966 | |
| Thirty-fifth | 26 April 1967 |
LIST OF LEGISLATION, 1966—During the may parliamentary session of 1966, which commenced on 26 May, and which ended on 21 October the General Assembly passed 109 public Acts, 29 local Acts, and 2 private Acts. The following is a list of public, local, and private Acts passed during the session.
Airport Authorities
Alcoholism and Drug Addiction
Appropriation
Anzac Day
Arms Amendment
Auckland Grammar School Amendment
Boilers. Lifts, and Cranes Amendment
Chiropractors Amendment
Clerks of Work Amendment
Companies Amendment
Construction Amendment
Consumer Council
Cook Islands Amendment
Counties Amendment
Crimes Amendment
Criminal Injuries Compensation Amendment
Criminal Justice Amendment
Customs
Customs Acts Amendment
Declaratory Judgments Amendment
Dental Amendment
Education Amendment
Electricians Amendment
Electricity Amendment
Electric Linemen Amendment
Engineers Registration Amendment
Estate and Gift Duties Amendment
Evidence Amendment
Factories Amendment
Finance
Fire Services Amendment
Forestry Encouragement Amendment
Geothermal Energy Amendment
Gisborne High School Amendment
Harbours Amendment
Hospitals Amendment
Immigration Amendment
Imprest Supply
Imprest Supply (No. 3).
Industrial Conciliation and Arbitration Amendment
Industrial Design
Inland Revenue Department Amendment
International Finance Agreements Amendment
Inventions Development
Judicature Amendment
Juries Amendment
Land and Income Tax (Annual)
Land and Income Tax Amendment
Land Transfer Amendment
Land Valuation Court Amendment
Life Insurance Amendment
Lincoln College Amendment
Local Elections and Polls
Local Legislation
Magistrates' Courts Amendment
Maori Purposes
Marriage Amendment
Massey University Amendment
Matrimonial Proceedings Amendment
Matrimonial Property Amendment
Meat Amendment
Meat Export Control Amendment
Medical and Dental Auxiliaries
Motor Spirits Distribution Amendment
Motor-Vehicle Dealers Amendment
Municipal Corporations Amendment
Municipal Insurance Amendment
National Provident Fund Amendment
New Plymouth High School Amendment
Niue
Opticians Amendment
Perpetuities Amendment
Post Office Amendment
Primary Products Marketing Regulations Confirmation
Public Revenues Amendment
Public Trust Office Amendment
Regulations Amendment
Republic of Malawi
Republic of Singapore
Republic of Tanzania
Reserves and Domains Amendment
Reserves and Other Lands Disposal
Scientific and Industrial Research Amendment
Shipping and Seamen Amendment
Social Security Amendment
Stamp Duties Amendment
State Services Amendment
Stock Foods Amendment
Stock Remedies Amendment
Submarine Cables and Pipelines Protection
Superannuation Amendment
Surveyors
Taranaki Scholarships Trust Board Amendment
Technicians Certification Amendment
Thomas Cawthron Trust Amendment
Town and Country Planning Amendment
Trades Certification
Transport Amendment
Trustee Savings Banks Amendment
Universities Amendment
University of Auckland Amendment
University of Canterbury Amendment
University of Otago Amendment
University of Waikato Amendment
Victoria University of Wellington Amendment
War Pensions Amendment
Whangarei High School Amendment
Wildlife Amendment
Wool Industry Amendment
Workers' Compensation Amendment
Auckland Harbour Board Loan and Empowering
Auckland Regional Authority Amendment
Christchurch District Drainage Amendment
Christchurch Tramway District Amendment
Dunedin District Drainage and Sewerage Amendment
Gisborne Harbour Board Empowering
Hawke's Bay Catchment Board Rating
Levin Borough Empowering
Mangawai Lands Empowering
Manukau City Empowering (Sewerage Rate)
Masterton Trust Lands
Napier Foreshore Extension
Napier Harbour Board and Napier City (Inner Harbour) Subdivision
Napier Harbour Board and Napier City Enabling Amendment
Nelson City Empowering
Nelson Harbour Board Empowering
New Plymouth City Electricity and Gas Empowering
Northland Harbour Board Vesting and Empowering
North Shore Drainage Amendment
Otago Harbour Board Empowering
Palmerston North Reserves Empowering
South Auckland Local Authorities Empowering
Taranaki Country Reserves
Taranaki Harbours Board Empowering
Tauranga Harbour Board Loan and Empowering
Timaru Harbour Board Loan and Empowering
Tokoroa Town Empowering
Waitemata County Council Empowering
Wallace County Empowering (Community Centres)
Church of England Empowering Amendment
Royal Antediluvian Order of Buffaloes Trust
PUBLIC GENERAL ACTS OF NEW ZEALAND—The following list shows the Departments responsible for the administration of the Public Acts of general application in New Zealand which were in force at January 1966 or which had then been passed to come into force at a later date.
The list does not include references to Acts that are spent or expired or to amending Acts, Appropriation Acts, Finance Acts, or other Acts containing miscellaneous provisions, such as Statutes Amendment Acts, Local Legislation Acts, Reserves and Other Lands Disposal Acts, and Maori Purposes Acts.
| Act | Department |
|---|---|
| Accident Insurance Companies Act 1908 | Treasury |
| Acts Interpretation Act 1924 | Justice |
| Administration Act 1952 | Justice |
| Adoption Act 1955 | Justice |
| Adult Education Act 1963 | Education |
| Aged and Infirm Persons Protection Act 1912 | Justice |
| Agricultural and Pastoral Societies Act 1908 | Agriculture |
| Agricultural Chemicals Act 1959 | Agriculture |
| Agricultural Workers Act 1962 | Agriculture |
| Agriculture (Emergency Powers) Act 1934 | Agriculture |
| Agriculture (Emergency Regulations Confirmation) Acts | Agriculture |
| Air Services Licensing Act 1951 | Civil Aviation |
| Airport Authorities Act 1966 | Civil Aviation |
| Alcoholics Act 1966 | Justice |
| Aliens Act 1948 | Justice |
| Animals Protection Act 1960 | Agriculture |
| Annual Holidays Act 1944 | Labour |
| Antarctica Act 1960 | External Affairs |
| Anzac Day Act 1966 | Internal Affairs |
| Apiaries Act 1927 | Agriculture |
| Apple and Pear Marketing Act 1948 | Agriculture |
| Apprentices Act 1948 | Labour |
| Arbitration Act 1908 | Justice |
| Arbitration Clauses (Protocol) and the Arbitration (Foreign Awards) Act 1933 | Justice |
| Architects Act 1963 | Internal Affairs |
| Archives Act 1957 | Internal Affairs |
| Armed Forces Canteens Act 1948 | Defence |
| Arms Act 1958 | Police |
| Atomic Energy Act 1945 | Mines |
| Auckland Harbour Bridge Act 1950 | Works |
| Auctioneers Act 1928 | Justice |
| Bank of New Zealand Act 1945 | Treasury |
| Banking Act 1903 | Treasury |
| Bankruptcy Act 1908 | Justice |
| Bauxite Act 1959 | Mines |
| Bills of Exchange Act 1908 | Treasury |
| Births and Deaths Registration Act 1951 | Justice |
| Boilers, Lifts, and Cranes Act 1950 | Marine |
| British Nationality and New Zealand Citizenship Act 1948 | Internal Affairs |
| Broadcasting Corporation Act 1961 | Broadcasting |
| Building Societies Act 1965 | Justice |
| Burial and Cremation Act 1964 | Health |
| Bush Workers Act 1945 | Labour |
| Bylaws Act 1910 | Internal Affairs |
| Card Tournaments Regulation Act 1933 | Internal Affairs |
| Carriage by Air Act 1962 | Civil Aviation |
| Carriers Act 1948 | Justice |
| Charitable Trusts Act 1957 | Justice |
| Charted Associations (Protection of Names and Uniforms) Act 1930 | Internal Affairs |
| Chatham Islands County Council Empowering Act 1936 | Internal Affairs |
| Chattels Transfer Act 1924 | Justice |
| Cheques Act 1960 | Treasury |
| Child Welfare Act 1925 | Education |
| Chiropractors Act 1960 | Justice |
| Christchurch-Lyttelton Road Tunnel Act 1956 | Works |
| Cinematograph Films Act 1961 | Internal Affairs |
| Civil Aviation Act 1964 | Civil Aviation |
| Civil Defence Act 1962 | Internal Affairs |
| Civil List Act 1950 | Prime Minister |
| Clerks of Works Act 1944 | Labour |
| Coal Mines Act 1925 | Mines |
| Commercial Trusts Act 1910 | Justice |
| Commissions of Inquiry Act 1908 | Internal Affairs |
| Commonwealth Fabric Corporation Act 1962 | Treasury |
| Companies Act 1955 | Justice |
| Companies (Bondholders Incorporation) Act 1934–35 | Justice |
| Companies Special Investigations Act 1958 | Justice |
| Construction Act 1959 | Labour |
| Consumer Council Act 1966 | Industries and Commerce |
| Continental Shelf Act 1964 | Marine |
| Contracts Enforcement Act 1956 | Justice |
| Contributory Negligence Act 1947 | Justice |
| Control of Prices Act 1947 | Industries and Commerce |
| Cook Islands Act 1915 | Island Territories |
| Cook Islands Constitution Act 1964 | Island Territories |
| Co-operative Companies Act 1956 | Justice |
| Co-operative Dairy Companies Act 1949 | Justice |
| Co-operative Freezing Companies Act 1960 | Justice |
| Copyright Act 1962 | Justice |
| Coroners Act 1951 | Justice |
| Counties Act 1956 | Internal Affairs |
| Counties Insurance Empowering Act 1941 | Internal Affairs |
| Courts Martial Appeals Act 1953 | Defence |
| Crimes Act 1961 | Justice |
| Criminal Injuries Compensation Act 1963 | Justice |
| Criminal Justice Act 1954 | Justice |
| Crowns Grants Act 1908 | Lands and Survey |
| Crown Proceedings Act 1950 | Justice |
| Customs Act 1966 | Customs |
| Customs Law Act 1908 | Customs |
| Dairy Industry Act 1952 | Agriculture |
| Dairy Board Act 1961 | Agriculture |
| Dangerous Goods Act 1957 | Internal Affairs |
| Deaths by Accidents Compensation Act 1952 | Justice |
| Decimal Currency Act 1964 | Treasury |
| Declaratory Judgments Act 1908 | Justice |
| Deeds Registration Act 1908 | Justice |
| Defamation Act 1954 | Justice |
| Demise of the Crown Act 1908 | Internal Affairs |
| Dental Act 1963 | Health |
| Department of Agriculture Act 1953 | Agriculture |
| Deputy Governor's Powers Act 1912 | Internal Affairs |
| Designs Act 1953 | Justice |
| Destitute Persons Act 1910 | Justice |
| Development Finance Corporation Act 1964 | Treasury |
| Dietitians Act 1950 | Health |
| Diplomatic Immunities and Privileges Act 1957 | External Affairs |
| Disabled Persons Employment Promotion Act 1960 | Labour |
| Disabled Soldiers' Civil Re-establishment Act 1930 | Social Security |
| Distillation Act 1908 | Customs |
| Distress and Replevin Act 1908 | Justice |
| Districts Courts Abolition Act 1925 | Justice |
| District Railways Act 1908 | Works |
| Dogs Registration Act 1955 | Internal Affairs |
| Domestic Proceedings Act 1939 | Justice |
| Earthquake and War Damage Act 1944 | State Insurance Office |
| Economic Stabilisation Act 1948 | Industries and Commerce |
| Education Act 1964 | Education |
| Education Lands Act 1949 | Education |
| Electoral Act 1956 | Justice |
| Electric Linemen Act 1959 | Electricity |
| Electric Power Boards Act 1925 | Electricity |
| Electrical Supply Authorities Association Act 1930 | Electricity |
| Electricians Act 1952 | Electricity |
| Electricity Act 1945 | Electricity |
| Emergency Forces Rehabilitation Act 1953 | Social Security |
| Enemy Property Act 1951 | Public Trust |
| Engineering Association Act 1961 | Works |
| Engineers Registration Act 1924 | Works |
| English Laws Act 1908 | Justice |
| Estate and Gift Duties Act 1955 | Inland Revenue |
| Evidence Act 1908 | Justice |
| Exhibitions Act 1910 | Industries and Commerce |
| Explosives Act 1957 | Internal Affairs |
| Export Guarantee Act 1964 | Treasury |
| External Affairs Act 1943 | External Affairs |
| Extradition Act 1965 | Justice |
| Factories Act 1946 | Labour |
| Family Benefits (Home Ownership) Act 1964 | Social Security |
| Family Benefits (Reciprocity with Great Britain) Act 1948 | Social Security |
| Family Benefits (Reciprocity with Northern Ireland) Act 1948 | Social Security |
| Family Protection Act 1955 | Justice |
| Federation of Malaya Act 1957 | External Affairs |
| Fees and Travelling Allowances Act 1951 | Treasury |
| Fencing Act 1908 | Justice |
| Fertilisers Act 1960 | Agriculture |
| Fire Services Act 1949 | Internal Affairs |
| Fishing Industry Board Act 1963 | Marine |
| Fisheries Act 1908 | Marine |
| Food and Drugs Act 1947 | Health |
| Forest and Rural Fires Act 1955 | Forest Service |
| Forestry Encouragement Act 1962 | Forest Service |
| Forests Act 1949 | Forest Service |
| Friendly Societies Act 1909 | Treasury |
| Frustrated Contracts Act 1944 | Justice |
| Gaming Act 1908 | Internal Affairs |
| Gas Industry Act 1958 | Electricity |
| Gas Supply Act 1908 | Electricity |
| General Agreement on Tariffs and Trade Act 1948 | Customs |
| Geneva Conventions Act 1958 | External Affairs |
| Geothermal Energy Act 1953 | Works |
| Government Life Insurance Act 1953 | Government Life Insurance Office |
| Government Railways Act 1949 | Railways |
| Government Service Equal Pay Act 1960 | State Services Commission |
| Government Service Tribunal Act 1965 | State Services Commission |
| Harbours Act 1950 | Marine |
| Health Act 1956 | Health |
| Hire Purchase Agreements Act 1939 | Justice |
| Historic Articles Act 1962 | Internal Affairs |
| Historic Places Act 1954 | Internal Affairs |
| Hospitals Act 1957 | Health |
| Housing Act 1955 | State Advances |
| Housing Improvement Act 1964 | Works |
| Human Tissues Act 1964 | Health |
| Hunter Gift for the Settlement of Discharged Soldiers Act 1921 | Lands and Survey |
| Hydatids Act 1959 | Agriculture |
| Immigration Act 1964 | Labour |
| Impounding Act 1955 | Internal Affairs |
| Imprisonment for Debt Limitation Act 1908 | Justice |
| Inalienable Life Annuities Act 1910 | Public Trust |
| Income Tax Assessment Act 1957 | Inland Revenue |
| Incorporated Societies Act 1908 | Justice |
| Indecent Publications Act 1963 | Justice |
| Industrial and Provident Societies Act 1908 | Justice |
| Industrial Conciliation and Arbitration Act 1954 | Labour |
| Industrial Design Act 1966 | Industries and Commerce |
| Industrial Relations Act 1949 | Labour |
| Industrial Societies Act 1908 | Justice |
| Industries and Commerce Act 1956 | Industries and Commerce |
| Infants Act 1908 | Justice |
| Inferior Courts Procedure Act 1909 | Justice |
| Inland Revenue Department Act 1952 | Inland Revenue |
| Innkeepers Act 1962 | Justice |
| Insurance Companies' Deposits Act 1953 | Public Trust |
| International Air Services Licensing Act 1947 | Civil Aviation |
| International Finance Agreements Act 1961 | Treasury |
| Introduction of Plants Act 1927 | Agriculture |
| Inventions Development Act 1966 | Industries and Commerce |
| Invercargill Licensing Trust Act 1950 | Justice |
| Iron and Steel Industry Act 1959 | Mines |
| Island Territories Act 1943 | Island Territories |
| Joint Family Homes Act 1964 | Justice |
| Judicature Act 1908 | Justice |
| Juries Act 1908 | Justice |
| Kawerau and Murupara Township Act 1953 | Internal Affairs |
| Kawerau Borough Act 1958 | Internal Affairs |
| Kermadec Islands Act 1887 | Island Territories |
| King George the Fifth Memorial Children's Health Camps Act 1953 | Health |
| Kitchener Memorial Scholarship Trust Act 1941 | Education |
| Labour Department Act 1954 | Labour |
| Labour Disputes Investigation Act 1913 | Labour |
| Lake Coleridge Water Power Act 1915 | Works |
| Land Act 1948 | Lands and Survey |
| Land and Income Tax Act 1954 | Inland Revenue |
| Land Drainage Act 1908 | Internal Affairs |
| Land Settlement Promotion Act 1952 | Lands and Survey |
| Land Transfer Act 1952 | Justice |
| Land Transfer (Hawke's Bay) Act 1931 | Justice |
| Land Valuation Court Act 1948 | Justice |
| Law Practitioners Act 1955 | Justice |
| Law Reform Act 1936 | Justice |
| Law Reform Act 1944 | Justice |
| Law Reform (Testamentary Promises) Act 1949 | Justice |
| Legal Aid Act 1939 | Justice |
| Legislative Council Abolition Act 1950 | Legislative |
| Legislature Act 1908 | Legislative |
| Legitimation Act 1939 | Justice |
| Libraries and Mechanics' Institutes Act 1908 | Internal Affairs |
| Licensing Act 1908 | Justice |
| Licensing Trusts Act 1949 | Justice |
| Life Insurance Act 1908 | Treasury |
| Limitation Act 1950 | Justice |
| Lincoln College Act 1961 | Education |
| Linen Flax Corporation Act 1945 | Industries and Commerce |
| Local Authorities (Employment Protection) Act 1963 | Internal Affairs |
| Local Authorities Loans Act 1956 | Treasury |
| Local Authorities (Members' Contracts) Act 1954 | Internal Affairs |
| Local Elections and Polls Act 1966 | Internal Affairs |
| Local Government Commission Act 1961 | Internal Affairs |
| Local Railways Acts 1914 | Works |
| Machinery Act 1950 | Labour |
| Magistrates' Courts Act 1947 | Justice |
| Maintenance Orders (Facilities for Enforcement) Act 1921 | Justice |
| Malaysia Act 1963 | External Affairs |
| Manapouri - Te Anau Development Act 1963 | Works |
| Maori Affairs Act 1953 | Maori Affairs |
| Maori Education Foundation Act 1961 | Maori Affairs |
| Maori Housing Act 1935 | Maori Affairs |
| Maori Purposes Funds Act 1934–35 | Maori Affairs |
| Maori Reserved Land Act 1956 | Maori Affairs |
| Maori Soldiers Trust Act 1957 | Maori Affairs |
| Maori Trust Boards Act 1955 | Maori Affairs |
| Maori Trustee Act 1953 | Maori Affairs |
| Maori Vested Lands Administration Act 1954 | Maori Affairs |
| Maori Welfare Act 1962 | Maori Affairs |
| Margarine Act 1908 | Agriculture |
| Marginal Lands Act 1950 | Lands and Survey |
| Marine Insurance Act 1908 | Justice |
| Marketing Act 1936 | Agriculture |
| Marriage Act 1955 | Justice |
| Married Women's Property Act 1952 | Justice |
| Massey University Act 1963 | Education |
| Master and Apprentice Act 1908 | Labour |
| Masterton Licensing Trust Act 1947 | Justice |
| Matrimonial Proceedings Act 1963 | Justice |
| Matrimonial Property Act 1963 | Justice |
| Meat Act 1964 | Agriculture |
| Meat Export Control Act 1921–22 | Agriculture |
| Meat Export Prices Act 1955 | Agriculture |
| Medical Advertisements Act 1942 | Health |
| Medical and Dental Auxiliaries Act 1966 | Health |
| Medical Practioners Act 1950 | Health |
| Medical Research Council Act 1950 | Health |
| Mental Health Act 1911 | Health |
| Mercantile Law Act 1908 | Justice |
| Merchandise Marks Act 1954 | Industries and Commerce |
| Military Decorations and Distinctive Badges Act 1918 | Defence |
| Military Manoeuvres Act 1915 | Defence |
| Milk Act 1944 | Agriculture |
| Minimum Wages Act 1945 | Labour |
| Mining Act 1926 | Mines |
| Mining Tenures Registration Act 1962 | Justice |
| Ministry of Works Act 1943 | Works |
| Monetary and Economic Council Act 1961 | Treasury |
| Moneylenders Act 1908 | Justice |
| Monopoly Prevention Act 1908 | Industries and Commerce |
| Mortgages and Lessees Rehabilitation Act 1936 | Treasury |
| Motor Spirits Distribution Act 1953 | Industries and Commerce |
| Motor Spirits Duty Act 1961 | Customs |
| Motor-Vehicle Dealers Act 1958 | Justice |
| Municipal Association Act 1939 | Internal Affairs |
| Municipal Corporations Act 1954 | Internal Affairs |
| Municipal Insurance Act 1960 | Internal Affairs |
| Music Teachers Registration Act 1928 | Education |
| Mutual Insurance Act 1955 | Public Trust |
| Narcotics Act 1965 | Health |
| Nassella Tussock Act 1946 | Agriculture |
| National Art Gallery and Dominion Museum Act 1930 | Internal Affairs |
| National Expenditure Adjustment Act 1932 | Treasury |
| National Library Act 1965 | Education |
| National Military Service Act 1961 | Defence |
| National Parks Act 1952 | Lands and Survey |
| National Provident Fund Act 1950 | Treasury |
| National Research Advisory Council Act 1963 | State Services Commission |
| National Roads Act 1953 | Works |
| National Savings Act 1940 | Treasury |
| Native Plants Protection Act 1934 | Lands and Survey |
| Nature Conservation Council Act 1962 | Lands and Survey |
| Naval and Victualling Stores Act 1908 | Defence |
| Navy Act 1954 | Defence |
| New Zealand Army Act 1950 | Defence |
| New Zealand - Australia Free Trade Agreement Act 1965 | Industries and Commerce |
| New Zealand Bank Act 1861 | Treasury |
| New Zealand Boundaries Act 1863 (U.K.) | Internal Affairs |
| New Zealand Constitution Act 1852 (U.K.) | Internal Affairs |
| New Zealand Constitution (Amendment) Act 1947 (U.K.) | Internal Affairs |
| New Zealand Constitution Amendment | |
| (Request and Consent) Act 1947 | Internal Affairs |
| New Zealand Council for Educational Research Act 1945 | Education |
| New Zealand Council of Law Reporting Act 1938 | Justice |
| New Zealand Counties Association Act 1949 | Internal Affairs |
| New Zealand Debt Conversion Act 1932–33 | Treasury |
| New Zealand Foundation for the Blind Act 1963 | Education |
| New Zealand Geographic Board Act 1946 | Lands and Survey |
| New Zealand Government Property Corporation Act 1953 | Treasury |
| New Zealand Library Association Act 1939 | Education |
| New Zealand Loans Act 1953 | Treasury |
| New Zealand National Airways Act 1945 | Civil Aviation |
| New Zealand Society of Accountants Act 1958 | Treasury |
| News Media Ownership Act 1965 | Justice |
| Newspapers and Printers Act 1955 | Justice |
| Ngarimu V.C. and 28th (Maori) Battalion Memorial Scholarship Fund Act 1945 | Education |
| Niue Act 1966 | Island Territories |
| Noxious Animals Act 1956 | Forest Service |
| Noxious Weeds Act 1950 | Agriculture |
| Nurses and Midwives Act 1945 | Health |
| Oaths and Declarations Act 1957 | Justice |
| Occupational Therapy Act 1949 | Health |
| Occupiers Liability Act 1962 | Justice |
| Offenders Legal Aid Act 1954 | Justice |
| Official Appointments and Documents Act 1919 | Internal Affairs |
| Official Secrets Act 1951 | Justice |
| Oil in Navigable Waters Act 1965 | Marine |
| Opticians 1928 | Health |
| Orchards and Garden Diseases Act 1928 | Agriculture |
| Orchard Levy Act 1953 | Agriculture |
| Overseas Representatives Act 1942 | External Affairs |
| Parliamentary Commissioner (Ombudsman) Act 1962 | Legislative |
| Partnership Act 1908 | Justice |
| Passport Act 1946 | Internal Affairs |
| Patents Act 1953 | Justice |
| Patriotic and Canteen Funds Act 1947 | Internal Affairs |
| Pawnbrokers Act 1908 | Justice |
| Payment of Jurors Act 1919 | Justice |
| Penal Institutions Act 1954 | Justice |
| Perpetuities Act 1964 | Justice |
| Petroleum Act 1937 | Mines |
| Pharmacy Act 1939 | Health |
| Phosphorus Matches Act 1910 | Labour |
| Physical Welfare and Recreation Act 1937 | Internal Affairs |
| Physiotherapy Act 1949 | Health |
| Plumbers and Gasfillers Registration Act 1964 | Health |
| Poisons Act 1960 | Health |
| Police Act 1958 | Police |
| Police Offences Act 1927 | Justice |
| Political Disabilities Removal Act 1960 | Labour |
| Post Office Act 1959 | Post Office |
| Potato Growing Industry Act 1950 | Agriculture |
| Poultry Act 1924 | Agriculture |
| Poultry Runs Registration Act 1933 | Agriculture |
| Primary Products Marketing Act 1953 | Agriculture |
| Primary Products Marketing Act: Regulations Confirmations Acts 1957 | Agriculture |
| Private Savings Banks Act 1964 | Treasury |
| Property Law Act 1952 | Justice |
| Protection of British Shipping Act 1936 | Marine |
| Public Authorities (Party Wall) Empowering Act 1919 | Works |
| Public Bodies' Contracts Act 1959 | Internal Affairs |
| Public Bodies' Leases Act 1908 | Internal Affairs |
| Public Bodies' Meetings Act 1961 | Internal Affairs |
| Public Contracts Act 1908 | Labour |
| Public Holidays Act 1955 | Labour |
| Public Revenues Act 1953 | Treasury |
| Public Safety Conservation Act 1932 | Justice |
| Public Trust Office Act 1957 | Public Trust |
| Public Works Act 1928 | Works (Electricity Part XIII) |
| Quarries Act 1944 | Mines |
| Queen Elizabeth The Second Arts Council of New Zealand Act 1963 | Internal Affairs |
| Queen Elizabeth The Second Post-graduate Fellowship of New Zealand Act 1963 | Education |
| Rabbits Act 1955 | Agriculture |
| Race Meetings Act 1909 | Internal Affairs |
| Radiation Protection Act 1965 | Health |
| Rangitaiki Land Drainage Act 1956 | Internal Affairs |
| Rating Act 1925 | Internal Affairs |
| Real Estate Agents Act 1963 | Justice |
| Reciprocal Enforcement of Judgments Act 1934 | Justice |
| Regulations Act 1936 | Justice |
| Rehabilitation Act 1941 | Social Security |
| Republic of Cyprus Act 1961 | External Affairs |
| Republic of Ghana Act 1960 | External Affairs |
| Republic of India Act 1956 | External Affairs |
| Republic of Ireland Act 1950 | External Affairs |
| Republic of Kenya Act 1965 | External Affairs |
| Republic of Malawi Act 1966 | External Affairs |
| Republic of Nigeria Act 1963 | External Affairs |
| Republic of Pakistan Act 1956 | External Affairs |
| Republic of Singapore Act 1966 | External Affairs |
| Republic of Tanzania Act 1966 | External Affairs |
| Republic of Zambia Act 1965 | External Affairs |
| Reserve Bank of New Zealand Act 1964 | Treasury |
| Reserves and Domains Act 1953 | Lands and Survey |
| Rest Homes Act 1929 | Justice |
| River Boards Act 1908 | Internal Affairs |
| Rotorua Maori Arts and Crafts Institute Act 1963 | Tourist and Publicity |
| Royal New Zealand Air Force Act 1950 | Defence |
| Royal New Zealand Institute of Horticulture Act 1953 | Agriculture |
| Royal Powers Act 1953 | External Affairs |
| Royal Society of New Zealand Act 1965 | Scientific and Industrial Research |
| Royal Titles Act 1953 | External Affairs |
| Rural Housing Act 1939 | State Advances |
| Rural Intermediate Credit Act 1927 | State Advances |
| Sale of Goods Act 1908 | Justice |
| Sale of Liquor Act 1962 | Justice |
| Sale of Wool Act 1937 | Agriculture |
| Sales Tax Act 1932–33 | Customs |
| Sand Drift Act 1908 | Lands and Survey |
| Scientific and Industrial Research Act 1952 | Scientific and Industrial Research |
| Sea Carriage of Goods Act 1940 | Industries and Commerce |
| Secondhand Dealers Act 1963 | Justice |
| Secret Commissions Act 1910 | Justice |
| Seeds Importation Act 1927 | Agriculture |
| Servants' Registry Offices Act 1908 | Labour |
| Sharebrokers Act 1908 | Justice |
| Sharemilking Agreements Act 1937 | Labour |
| Shearers Act 1962 | Labour |
| Shipping and Seamen Act 1952 | Marine |
| Shops and Offices Act 1955 | Labour |
| Shorthand Reporters Act 1908 | Justice |
| Simultaneous Deaths Act 1958 | Justice |
| Social Security Act 1964 | Social Security |
| Social Security (Reciprocity with Australia) Act 1948 | Social Security |
| Social Security (Reciprocity with She United Kingdom) Act 1956 | Social Security |
| Soil Conservation and Rivers Control Act 1941 | Works |
| Sovereign's Birthday Observance Act 1952 | Internal Affairs |
| Stamp Duties Act 1954 | Inland Revenue |
| Standards Act 1965 | Industries and Commerce |
| Standard Time Act 1945 | Internal Affairs |
| State Advances Corporation Act 1965 | State Advances |
| State Insurance Act 1963 | State Insurance Office |
| State Services Act 1962 | State Services Commission |
| State Supply of Electrical Energy Act 1917 | Electricity |
| Statistics Act 1955 | Statistics |
| Statute of Westminster Adoption Act 1947 | External Affairs |
| Statutes Drafting and Compilation Act 1920 | Law Drafting Office |
| Statutory Land Charges Registration Act 1928 | Justice |
| Stock Act 1908 | Agriculture |
| Stock Foods Act 1946 | Agriculture |
| Stock Remedies Act 1934 | Agriculture |
| Submarine Cables and Pipelines Protection Act 1966 | External Affairs |
| Summary Proceedings Act 1957 | Justice |
| Superannuation Act 1956 | Treasury |
| Surveyors Act 1966 | Lands and Survey |
| Swamp Drainage Act 1915 | Lands and Survey |
| Taranaki Harbours Act 1965 | Marine |
| Taranaki Scholarships Trust Board Act 1957 | Education |
| Tariff and Development Board Act 1961 | Industries and Commerce |
| Taupo County Act 1962 | Internal Affairs |
| Technicians Certification Act 1958 | Education |
| Tenancy Act 1955 | Labour |
| Termites Act 1940 | State Advances |
| Territorial Sea and Fishing Zone Act 1965 | External Affairs |
| Timber Floating Act 1954 | Forest Services |
| Tobacco-growing Industry Act 1935 | Industries and Commerce |
| Tokelau Islands Act 1948 | Island Territories |
| Tourist and Publicity Department Act 1963 | Tourist and Publicity |
| Tourist Hotel Corporation Act 1955 | Tourist and Publicity |
| Town and Country Planning Act 1953 | Works |
| Trade Agreement (New Zealand and Australia) Ratification Act 1933 | Customs |
| Trade Agreement (New Zealand and Canada) Ratification Act 1932 | Customs |
| Trademarks Act 1953 | Justice |
| Trade Practices Act 1958 | Industries and Commerce |
| Trade Unions Act 1908 | Treasury |
| Trades Certification Act 1966 | Education |
| Trading Coupons Act 1931 | Industries and Commerce |
| Tramways Act 1908 | Works |
| Transport Act 1962 | Transport |
| Treaties of Peace (Italy, Roumania, Bulgaria, Hungary, and Finland) Act 1947 | External Affairs |
| Treaty of Peace (Japan) Act 1951 | External Affairs |
| Trustee Act 1956 | Justice |
| Trustee Companies Act 1960 | Justice |
| Trustee Companies Protection Act 1934–35 | Justice |
| Trustee Savings Banks Act 1948 | Treasury |
| Tuberculosis Act 1948 | Health |
| Turangi Township Act 1964 | Works |
| Uganda Act 1964 | External Affairs |
| Unclaimed Moneys Act 1908 | Treasury |
| Underground Water Act 1953 | Works |
| Undesirable Immigrants Exclusion Act 1919 | Labour |
| United Nations Act 1946 | External Affairs |
| United Nations (Police) Act 1964 | Police |
| United Nations Relief and Rehabilitation Administration Act 1944 | External Affairs |
| Unit Trusts Act 1960 | Justice |
| Universities Act 1961 | Education |
| University of Auckland Act 1961 | Education |
| University of Canterbury Act 1961 | Education |
| University of Otago Ordnance 1869 and University of Otago Amendment Act 1961 | Education |
| University of Waikato Act 1963 | Education |
| Urban Farm Land Rating Act 1932 | Internal Affairs |
| Valuation Equalisation Act 1957 | Internal Affairs |
| Valuation of Land Act 1951 | Valuation |
| Valuers Act 1948 | Valuation |
| Vegetables Levy Act 1957 | Agriculture |
| Veterinary Services Act 1946 | Agriculture |
| Veterinary Surgeons Act 1956 | Agriculture |
| Victoria University of Wellington Act 1961 | Education |
| Visiting Forces Act 1939 | External Affairs |
| Wages Protection Act 1964 | Labour |
| Wages Protection and Contractors' Liens Act 1939 | Labour |
| Waihou and Ohinemuri Rivers Improvement Act 1910 | Works |
| Waikato Valley Authority Act 1956 | Works |
| Waitangi Day Act 1960 | Labour |
| Waitangi Endowment Act 1932–33 | Forest Service |
| Waitangi National Trust Board Act 1932 | Lands and Survey |
| War Disabilities Removal Act 192** | Justice |
| War Expenses Act 1939 | Treasury |
| War Funds Act 1915 | Internal Affairs |
| War Pensions Act 1954 | Social Security |
| Waterfront Industry Act 1953 | Labour |
| Waters Pollution Act 1953 | Marine |
| Weights and Measures Act 192 | Labour |
| Western Samoa Act 1961 | External Affairs |
| Westport Harbour Act 1920 | Marine |
| Whaling Industry Act 1935 | Marine |
| Wheat Board Act 1965 | Industries and Commerce |
| Wildlife Act 1953 | Internal Affairs |
| Wills Act 1837 (U.K.) | Justice |
| Winston Churchill Memorial Trust Act 1965 | Internal Affairs |
| Wool Commission Act 1951 | Agriculture |
| Wool Industry Act 1944 | Agriculture |
| Wool Labelling Act 1949 | Industries and Commerce |
| Wool Proceeds Retention Act 1950 | Agriculture |
| Wool Testing Authority Act 1964 | Agriculture |
| Workers' Compensation Act 1956 | Labour |
ADMINISTRATIVE TRIBUNALS—Administrative tribunals have gradually developed over a period of more than 50 years. As a rule they are set up by Act of Parliament or under powers conferred by statute. Their growth is related to the continuing expansion of governmental activity and responsibility for the general well-being of the community. This development is common to many countries. A list of administrative tribunals in New Zealand is now presented. The list does not include tribunals which regulate entry into or expulsion from or regulation within a profession or occupation. (Source: The Citizen and Power: Administrative Tribunals—a survey by the Department of Justice.)
| Name of Tribunal and Act Under Which Set Up | Function of Tribunal |
|---|---|
| Transport— | |
| Air Services Licensing Authority | (a) To issue air service licences, to amend and revoke the terms and conditions of such licences and to transfer such licences. |
| Air Services Licensing Act 1951 (s.3) | (b) To hold public inquiries dealing with general conditions applicable to air service licences. |
| Air Services Licensing Appeal Authority | To determine appeals from decisions of Air Services Licensing Authority. |
| Air Services Licensing Act 1951 (s. 33) | |
| District Transport Licensing Authority | To issue, transfer, amend, suspend, revoke, and renew goods, passenger, taxi, and rental service licences. |
| Transport Act 1962 (s. 93) | |
| Harbour Ferry Service Licensing Authority | To issue, transfer, amend, suspend, revoke, and renew harbour ferry service licences. |
| Transport Act 1962 (s. 96) | |
| Transport Licensing Appeal Authority | To determine appeals from decisions of a licensing authority. |
| Transport Act 1962 (s. 156) | |
| Transport Charges Appeal Authority | To determine appeals from decision of a public body or Commissioner of Transport in relation to transport charges or from decision of Minister of Railways prescribing charges in respect of road passenger service under Part III of Government Railways Act 1949. It may also issue directions to any appropriate body to prescribe or review charges. |
| Transport Act 1962 (s.157) | |
| Businesses or Trades— | |
| Cinematography Films Licensing Authority | To determine applications for licences to show films and to impose standards for picture theatres. |
| Cinematograph Films Act 1961 (s. 4) | |
| Cinematograph Films Licensing and Registration Appeal Authority | To determine Appeals from decisions of— |
| Cinematograph Films Act 1961 (s.81) | (a) The licensing authority. |
| (b) The Registrar in respect of registration of any film. | |
| (c) The Cinematograph Films Projectionists Licensing Board. | |
| Conscientious Objection Committee | To determine applications for exemptions from membership of industrial unions of workers on grounds of conscience. |
| Industrial Conciliation and Arbitration Act 1954 (s. 175) | |
| Licensing Committees | To issue certain licences and permits under the Sale of Liquor Act. The Licensing Control Commission may also delegate certain powers to committees. |
| Sale of Liquor Act 1962 (s. 32) | |
| Licensing Control Commission | (a) To authorise the issue of new licences. |
| Sale of Liquor Act 1962 (s. 4) | (b) To determine fair price for new licences and on removal of licences. |
| (c) To prescribe standards of accommodation and facilities on licensed premises and to conduct inquiries into requirements. | |
| (d) To grant and renew club charters. | |
| (e) To hear appeals from licensing committees. | |
| (f) To control the licensing fund. | |
| (g) To conduct inquiries at the request of the Minister of Justice. | |
| Local Apprenticeship Committees | To approve entry into apprenticeships and deal generally with conditions of apprentices. |
| Apprentices Act 1948 (s. 7) | |
| Motor Spirits Licensing Authority | (a) To determine applications for granting, transfer, revocation, and amendment of licences to sell motor spirits. |
| Motor Spirits Distribution Act 1959 (s. 9) | (b) To hold inquiries as to whether licensee is conforming with terms of licence. |
| Motor Spirits Licensing Appeal Authority | To sit as judicial authority for determination of appeals from decisions of Motor Spirits Licensing Authority. |
| Motor Spirits Distribution Act 1959 (s. 26) | |
| Pharmacy Authority | To consider applications for opening a pharmacy by certain companies, by non-chemists, and by chemists owning another pharmacy. |
| Pharmacy Amendment Act 1954 (s. 6) | |
| Shops and Offices Exemptions Tribunal | To determine applications for exemption from provisions of Act or award obliging shops to be closed during certain hours. |
| Shops and Offices Amendment Act 1953 (s. 3) | |
| Local Bodies— | |
| Local Government Commission | To review the functions and districts of local authorities and to prepare schemes for the re-organisation of their functions and districts. |
| Local Government Commission Act 1961 (s. 3) | |
| Local Government Appeal Authority | To sit as judicial authority to determine appeals from decisions of Local Government Commission. |
| Local Government Commission Act 1961 (s. 27) | |
| Local Authorities Loans Board | To consider applications by local authorities for permission to borrow money. |
| Local Authorities Loans Act 1956 (Part I) (s. 4) | |
| Inquiry Conducted by Audit Officer | To settle dispute or obtain evidence to assist towards settlement where local authorities fail to agree about financial adjustments on change of boundaries. |
| Electric Power Boards Act 1925 (s. 7) | |
| Land Drainage Act 1908 (s. 87) | |
| Soil Conservation and Rivers Control Act 1941 (s. 28) | |
| And Others | |
| Land and Property— | |
| Copyright Tribunal | To determine disputes in relation to the performing rights in copyright material. |
| Copyright Act 1962 (s. 30) | |
| Local Authority or Minister of Agriculture or appointee | To determine appeals against notification to clear land given by inspector under s. 5 of Noxious Weeds Act. |
| Noxious Weeds Act 1950 (s. 5) | |
| Town and Country Planning Appeal Board | To determine appeals on— |
| Town and Country Planning Act 1953 (s. 39) | (a) Town planning matters under Town and Country Planning Act. |
| (b) Certain decisions of local authorities under Municipal Corporations Act. | |
| (c) Decisions relating to land subdivision in counties. | |
| Social Security Benefits— | |
| Crimes Compensation Tribunal | To determine applications for compensation by victims of crimes of violence. |
| Criminal Injuries Compensation Act 1963 (s. 4) | |
| Invalids Benefit Appeal Board | To determine appeals from decisions of the Commission where benefit is declined on medical grounds. |
| Social Security Act 1964 (s. 45) | |
| Miners Benefits Appeal Board | To determine appeals from decisions of the Commission where benefit is declined on medical grounds. |
| Social Security Act 1964 (s. 51) | |
| War Pensions Appeal Board | To determine appeals from decisions of War Pensions Board. |
| War Pensions Act 1954 (s. 8) | |
| Censorship— | |
| Cinematograph Films Censorship Board of Appeal | To determine appeals from decisions of Censor relating to cinematograph films. |
| Cinematograph Films Act 1961 (s. 91) | |
| Indecent Publications Tribunal | To determine applications on questions relating to the indecency of any book, document or record. |
| Indecent Publications Act 1963 (s. 3) | |
| Income Tax, Prices, etc.— | |
| Board of Review | To sit as judicial authority for hearing and determining objections to assessments of tax or duty or decisions or determinations of Commissioner of Inland Revenue. |
| Inland Revenue Department Amendment Act 1960 (s. 3) | |
| Controller and Auditor-General | To recover loss through default, neglect, etc., of any servant of the Crown or any local authority. |
| Public Revenues Act 1953 (s. 26) | |
| Co-operative Dairy Companies Income Tax Appeal Authority | To determine appeals from decisions of Commissioner of Inland Revenue on status of company. |
| Land and Income Tax Act 1954 (s. 146) | |
| Co-operative Dairy Companies Tribunal | To determine dispute between the company and shareholders as to fair value of shares surrendered. |
| Co-operative Dairy Companies Act 1943 (s. 17) | |
| Earthquake and War Damage Commission | To determine applications for compensation for damage of property due to disasters or war. |
| Earthquake and War Damage Act 1944 (s. 4 (1) | |
| Price Tribunal | (a) To fix prices for goods and services. |
| Control of Prices Act 1947 (s. 3) | (b) To investigate complaints relating to prices of goods and services. |
| (c) To maintain a survey of prices of goods and services and to institute proceedings for offences relating to prices. | |
| Snow Loss Reserve Committee | To determine amount of refund of deposit to taxpayer who suffers snow loss. |
| Land and Income Tax Act 1954 (s. 136) | |
| Trade Practices Appeal Authority | To sit as judicial authority for the determination of appeals from orders of the Trade Practices and Prices Commission. |
| Trade Practices Act 1958 (s. 24) | |
| Trade Practices and Prices Commission | (a) To enquire into trade practices and make orders directing the discontinuance or modification of any trade practice contrary to the public interest. |
| Trade Practices Act 1958 (s. 3) | |
| (b) To recommend to the Minister on Industries and Commerce the imposition of price control in any case. | |
| Salaries and Conditions of Public Servants— | |
| Appeal Board | To determine appeals by primary teachers against the assessment on their personal report, by post-primary teachers against their classification. |
| Education (Assessment, Classification, and Appointment) Regulations 1957 (Part VII) Reg. 48 | |
| Government Railways Appeal Board | To determine appeals relating to appointments, grading, dismissals, etc., of railway employees. |
| Government Railways Act 1943 (s. 91) | |
| Government Railways Industrial Tribunal | To make wage orders in respect of railway employees. |
| Government Railways Act 1943 (s. 100) | |
| Government Service Tribunal | To fix salaries, wages, and related conditions of public service employees up to prescribed level. |
| Government Service Tribunal Act 1948 (s. 3) | |
| Permanent Head or State Services Commission Acting as Disciplinary Tribunal | To hear charges of misconduct against public servants. |
| State Services Act 1962 (ss. 57 and 58) | |
| Police Appeal Board | (a) To determine appeals against recommendations of the Police Promotion Board. |
| Police Act 1958 (s. 46) | (b) To determine appeals under s. 34 of the Police Act against a finding that any member of the police has been guilty of misconduct. |
| (c) To determine appeals under s. 36 against a decision to dismiss any member. | |
| Police Misconduct Tribunals | To hear charges of misconduct against members of the police. |
| Police Act 1958 (s. 33) | |
| Post Office Appeal Board | To hear appeals relating to appointments re-grading, dismissals of Post Office employees. |
| Post Office Act 1959 (s. 193) | |
| Primary Teachers Appointment Appeal Board | To determine appeals by teachers against non-appointment to positions. |
| Education Act 1964 (s. 144) | |
| (a) Public Service Appeal Board | To hear appeals against Commission's decisions on promotion, regrading, etc. |
| State Services Act 1962 (s. 61) | |
| (b) Special Board of Appeal | |
| State Services Act 1962 (s. 62) | |
| Teachers Court of Appeal | To determine appeals by teachers against their suspension, dismissal, or transfer. |
| Education Act 1964 (s. 174) | |
| Miscellaneous— | |
| Waterfront Industry Tribunal | (a) To make orders as to pay and conditions of work for waterside workers. |
| Waterfront Industry Act 1953 (s. 4) | (b) To determine appeals from certain decisions of Port Conciliation Committees, the Waterfront Industry Commission and the National Amenities Committee. |
| (c) To control and direct the activities of Port Conciliation Committees. | |
| Coal Mines Council | (a) To settle industrial disputes between owners and workers. |
| Coal Mines Act 1925 (s. 166b) | (b) To make inquiries and report to Minister of Mines on matters affecting the coal mining industry. |
| Commissioner of Patents | To determine disputes in relation to the grant of patents, designs or registration of trade marks. |
| Patents Act 1953 | |
| Court of Inquiry into Competency to hold Certificate under the Coal Mines Act | To make inquiries into competency to hold any certificate and cancel or suspend such certificates. |
| Coal Mines Act 1925 (s. 57) | |
| Medical Advertisements Board | To consider applications for order prohibiting untruthful medical advertisements. |
| Medical Advertisements Act 1942 (s. 3) | |
| Inquiries— | |
| Commission of Inquiry | To investigate the circumstances of major fires. |
| Fire Services Act 1949 (s. 82) | |
| Committee of Board of Health | To hear appeal by licensee or manager of private hospital or any medical practitioner in respect of decisions of Director-General in relation to a private hospital. |
| Hospitals Act 1957 (s. 143) | |
| Committee of Inquiry (Milk Board) | To conduct an inquiry into organisation of town or milk industry. |
| Milk Amendment Act 1951 (s. 19) | |
| Committee of Milk Council sitting as Appeal Authority against Alteration of Scheme of Milk Delivery | To determine appeals against amendment, revocation of scheme of milk delivery. |
| Milk Delivery Regulations 1949 (Reg. 12) | |
| Court of Inquiry into Aircraft Accidents | To conduct a public inquiry for the purpose of establishing the circumstances surrounding an aircraft accident. |
| Civil Aviation (Investigation of Accidents) Regulations 1953 (Reg. 13) | |
| Court of Investigation | To conduct an investigation into shipping casualties. |
| Shipping and Seamen Act 1952 (s. 325) | |
| Minister of Works or his Appointee or Local Authority | To hear objections to the compulsory acquisition of land by Crown or local authority. |
| Public Works Act 1928 (s. 22) | |
| Tariff and Development Board | At the request of certain Ministers to inquire into and make recommendations in respect of rates of duty, import licences, and any other matter relating to the protection and development of industry and overseas trade. |
| Tariff and Development Board Act 1961 (s. 3) | |
| Underground Water Commission | To inquire into proposals of a local authority to declare an underground water area. |
| Underground Water Act 1953 (s. 4) |
Judges of the Court of Appeal and Supreme Court—
Chief Justice: Right Hon. Sir Richard Wild, K.C.M.G.
Court of Appeal: Right Hon. Sir Alfred North, President; Hon. Sir Alexander Turner; Hon. Sir Thaddeus McCarthy.
Supreme Court, Puisne Judges: Hon. Sir George McGregor; Hon. T. E. Henry; Hon. T. A. Gresson; Hon. A. L. Haslam; Hon. R. Hardie Boys; Hon. I. H. Macarthur; Hon. C. P. Richmond; Hon. A. O. Woodhouse; Hon. A. C. Perry; Hon. J. N. Wilson; Hon. A. L. Tompkins; Hon. L. F. Moller; Hon. G. D. Speight.
Judge of the Court of Arbitration—A. P. Blair.
Judge of Compensation Court—A. P. Blair.
Judge of Land Valuation Court—K. G. Archer.
| LIST OF DEPARTMENTS OF THE NEW ZEALAND GOVERNMENT, WITH TITLES AND HOLDERS OF CHIEF ADMINISTRATIVE POSITIONS | ||
|---|---|---|
| Department | Chief Administrative Positions | |
| Title | Name | |
| Agriculture | Director-General | D. N. R. Webb. |
| Audit | Controller and Auditor-General | B. D. A. Greig, M. COM. |
| Civil Aviation | Secretary | B. R. Rae, M.B.E., B.COM. |
| Crown Law | Solicitor-General | J. C. White, LL.M. |
| Customs | Comptroller | V.W.Thomas, ACCTS. PROF., C.A.I. |
| Defence, Ministry of | Secretary | W. Hutchings. |
| Chief of Defence Staff | Lieut.-General Sir Leonard Thornton, K.C.B. | |
| Chief of Air Staff | Air Vice-Marshal C. A. Turner, C.B.E. | |
| Chief of General Staff | Major-General R. B. Dawson, C.B.E., D.S.O. | |
| Chief of Naval Staff | Rear-Admiral J. O'C. Ross, C.B., C.B.E. | |
| Education | Director-General | K. J. Sheen, M.A., PH.D.(LOND.) |
| External Affairs | Secretary | G. R. Laking, LL.B. |
| Government Life Insurance | Commissioner | A. C. Paine, D.L.I. |
| Government Printing Office | Government Printer | R. E. Owen. |
| Health | Director-General | D. P. Kennedy, M.B., CH.B., D.P.H. |
| Industries and Commerce | Secretary | M. J. Moriarty, ACCTS.PROF., D.P.A. |
| Inland Revenue | Commissioner | D. A. Stevens, ACCTS. PROF. |
| Internal Affairs | Secretary and Clerk of Writs | P. J. O'Dea, ACCTS. PROF, D.P.A. |
| Dominion Museum | Director | R. K. Dell, D.SC., B.A. |
| National Art Gallery | Director | S. B. Maclennan, A.R.C.A. |
| Island Territories | Secretary | J. M. McEwen, LL.B. |
| Justice | Secretary for Justice | J. L. Robson, LL.M., PH.D. |
| Labour | Secretary of Labour | N. S. Woods, M.A., DIP.ED., DIP.SOC.SCI. |
| Lands and Survey | Director-General | R. J. MacLachlan, B.A., B.COM., DIP.U.V.(AUCK.). |
| Law Drafting | Counsel and Compiler of Statutes | D. A. S. Ward, B.A., LL.B. |
| Legislative | Clerk of House of Representatives | H. N. Dollimore, LL.B. |
| Maori Affairs | Secretary, and Maori Trustee | J. M. McEwen, LL.B. |
| Marine | Secretary | R. N. Kerr, M.E.C.A., A.M.I. (MECH.) E. |
| Mines | Under-Secretary | I. D. Dick, M. SC. |
| New Zealand Electricity | General Manager | E. B. MacKenzie, B.E., M.I.E.E., A.M.I.(MECH.)E. |
| New Zealand Forest Service | Director-General | A. L. Poole. M.SC., B.FOR.SC. |
| Police | Commissioner | C. L. Urquhart, B.E.M., Q.P.M. |
| Post Office | Director-General | G. Searle, M.SC., M.I.E.E., M.N.Z.I.E. |
| Prime Minister's | Permanent Head | G. R. Laking, LL.B. |
| Principal Private Secretary | P. A. Barnes, ACCTS.PROF. | |
| Public Trust | Public Trustee | A. E. Kennard, LL.M. |
| Railways | General Manager | I. Thomas, LL.B., A.M.INST.T. |
| Scientific and Industrial Research | Director-General | W. M. Hamilton, D.SC., M.AGRIC.SC., N.D.H.(N.Z.) |
| Social Security | Director, Chairman, Social Security Commission, and Secretary for War Pensions | G. J. Brocklehurst, B.COM., A.R.A.N.Z. |
| State Advances Corporation of | Managing Director | W. Hay, LL.M. |
| New Zealand | General Manager | C. J. Ashton, ACCTS.PROF. |
| State Insurance | General Manager | N. R. Ainsworth, ACCTS.PROF. |
| State Services Commission | Chairman of Commission | A. G. Rodda, A.R.A.N.Z., D.P.A. |
| Members | I. G. Lythgoc, M.COM. | |
| R. G. Norman, B.E., M. SC. | ||
| Statistics | Government Statistician | J. V. T. Baker, M.A., M.COM., F.R.A.N.Z., D.P.A. |
| Tourist and Publicity | General Manager | R. S. Odell, B.A. |
| Transport | Commissioner | R. J. Polaschek, B.A., M.COM., A.R.A.N.Z., D.P.A. |
| Treasury | Secretary | N. R. Davis, B.COM., ACCTS.PROF. |
| Valuation | Valuer-General | J. B. Brown, DIP.AG.(LIN.). |
| Works, Ministry of | Commissioner of Works | P. L. Laing, B.E., M.I.C.E. |
| Government Architect | F. G. F. Sheppard, F.N.Z.I.A., A.R.I.B.A. | |
| Housing Division | Director | J. V. Jebson, F.N.Z.I.A. |
The State Services comprise, in the widest sense, all servants of the Crown other than those holding political or judicial office. They include the 36 Departments of the Public Service, and the Post Office, Railways Department, Legislative Department, Law Drafting Office, and other State organisations such as Government Corporations and Agencies, the Police, the armed forces, and the teaching and health services. In the following table the staff numbers of the State Services are set out as at 31 March 1949 and 1964.
| Organisation | Staff Numbers at 31 March | |
|---|---|---|
| 1949 | 1964 | |
| Public Service Departments | 50,290 | 64,330 |
| Railways Department | 26,484 | 24,168 |
| Post Office | 17,690 | 27,765 |
| Education board and teaching staff | 13,321 | 24,699 |
| Hospital board staff | 14,895 | 26,952 |
| Armed forces | 7,902 | 12,950 |
| N.Z. Broadcasting Corporation | 885 | 2,144 |
| Police | 1,541 | 2,611 |
| National Airways Corporation | 1,112 | 2,193 |
| Air New Zealand | 384 | 1,071 |
| Tourist Hotel Corporation (formed in 1956) | — | 477 |
| Linen Flax Corporation | 280 | 31 |
| Legislative Department | 150 | 151 |
| Totals | 134,934 | 189,542 |
The staff of these State organisations constituted 7.2 percent of the total population in 1949 and 7.3 percent in 1964; as a proportion of the total labour force they constituted 18.8 percent in 1949 and 19.8 percent in 1964. In New Zealand with its long tradition of Government activity in many spheres the work of the State Services covers a broad field and expansion has taken place as successive Governments have responded to social and economic needs and demands of the welfare state.
The relative cost of government has, however, remained remarkably stable over the past 25 years, being approximately 10 percent of gross national product, as shown in the following table.
| Year | Governments Current Expenditure on Goods and Services* | Gross National Product | Percentage |
|---|---|---|---|
| *This figure is net of departmental receipts other than taxation. It also excludes the operating expenses of trading Departments, expenditures of a capital nature, and transfer payments to either persons or local authorities such as social security benefits, pensions, subsidies, and interest on the public debt paid in New Zealand. | |||
| $(million) | $(million) | ||
| 1938–39 | 46.4 | 463.8 | 10.0 |
| 1948–49 | 100.0 | 978.4 | 10.2 |
| 1953–54 | 188.0 | 1,680.6 | 10.6 |
| 1958–59 | 236.2 | 2,270.6 | 10.4 |
| 1959–60 | 251.0 | 2,434.2 | 10.3 |
| 1960–61 | 266.6 | 2,621.6 | 10.2 |
| 1961–62 | 280.4 | 2,721.0 | 10.3 |
| 1962–63 | 302.2 | 2,924.6 | 10.3 |
| 1963–64 | 320.2 | 3,209.6 | 10.0 |
| 1964–65 | 346.8 | 3,512.6 | 9.9 |
STATE SERVICES COMMISSION—Arising out of the report of the Royal Commission on State Services, the State Services Act 1962 provides for a State Services Commission of up to four men appointed by the Governor-General in Council on the recommendation of the Prime Minister.
When directed by the Minister charged with the administration of the Act, at the request of the Minister responsible for another part of the State Services, e.g., the Post Office or the Railways Department, the Commission must associate itself with the head of that particular part of the service in an investigation of its organisation, methods, or procedures. The Commission must also, when requested by the head of or the Minister in Charge of any part of the State Services, provide management consultation services, including advice as to efficient work and control methods and techniques, data processing equipment and problems of organisation, and also furnish advice on and assist with training of staff.
In respect of Departments of the Public Service, the Commission is responsible for—
Reviewing the machinery of Government, including the allocation of functions to and between Departments, the desirability of or need for the creation of new Departments and the amalgamation or abolition of existing Departments, the co-ordination of the activities of Departments, and the extent and nature of controls exercised by any one Department over the operations of another Department:
Reviewing the efficiency and economy of each Department:
The provision of suitable office accommodation and the prescription and supervision of physical working conditions of all employees in the Public Service:
Approving and reviewing establishments of staff:
Acting as the central personnel authority for the Public Service:
Prescribing basic training programmes, furnishing advice on and assisting with the training of staff, and making recommendations to the Minister on the facilities necessary for the proper training of staff:
Providing management consultation services, including advice as to efficient work and control methods and techniques, data processing equipment, and problems of organisation.
It has complete independence in dealing with individual employees of the Public Service, but is made responsible to a Minister in all other matters.
THE PUBLIC SERVICE: Recruitment—The recruitment of public servants is conducted by the State Services Commission through its district representatives, its own officers, and by Departments in collaboration with the Commission. Details of career openings in the Service are regularly supplied to schools; career leaflets are published by some Departments. In some occupations it is necessary to recruit professional and technical staff from overseas.
All recruits are appointed on probation normally for two years.
Promotion—Promotion in the Public Service is based on merit. Although the Service has clearly defined salary scales and avenues of promotion, it also provides quick promotion with special salary increases to officers of outstanding merit. All vacancies above basic level are widely advertised so that all persons in the Service, and sometimes persons outside the Service, may apply for higher positions. Appointments are made on the basis of merit which is determined by comparing applicants on the basis of work experience and competence; personal qualities, characteristics and attributes relevant to the position to be filled; and relevant educational or other qualifications.
Appeals—Public servants have certain rights of appeal to the Public Service Appeal Board concerning (a) promotions approved by the Commission, (b) decisions by the Commission contrary to the recommendations of classification and grading committees, (c) decisions by the Commission concerning disciplinary charges made against officers, and (d) transfer from any place within, to any place outside New Zealand. An officer may also apply to the Chairman of the Appeal Board for leave to appeal against transfer within New Zealand on grounds of extraordinary personal hardship. The Board's decisions are final.
Classification and Grading—The Commission is in the process of prescribing occupational classes according to the nature of the duties required to be performed, and each occupational class is graded according to relative levels of responsibility and skills required.
The Commission is responsible for conducting a continuous review of the classification and grading of the Public Service, but an officer has the right to apply to the Commission for a review of the grading of his position if he has not had the grading of the position he has occupied reviewed by a classification and grading committee within the previous five years.
Classification and grading committees, after receiving evidence, make recommendations to the State Services Commission. If the Commission decides contrary to a committee's recommendation the applicant may appeal to the Public Service Appeal Board.
Remuneration—Salary rates are related to the levels of remuneration of persons doing comparable work in employment outside the Public Service, and adequate margins are maintained for skill and responsibility.
Efficiency and Economy—Successful administration depends in part on the use of up-to-date management techniques. In fulfilling its responsibility for reviewing efficiency and economy in the Public Service, the Commission, in collaboration with Departments, makes full use of inspection of work and analysis of systems, standards and controls; new training methods and materials; modern technical processes and equipment; clearly defined systems of delegation of authority and of discipline.
Complementary to the continuing search for improved organisation and methods is a formal suggestions scheme designed to stimulate suggestions for better methods from all ranks of public servants. This scheme produces a steady flow of suggestions many of which are adopted in full or in part.
Staff Training and Education—A comprehensive Service training and education policy is pursued by the Commission's Staff Training Branch. The Branch organises central courses, instructs departmental training officers in training techniques, publishes training material, assists Departments to develop training to meet specific needs, and acts as a general clearing house for the exchange of information on training methods. It also administers the various bursary schemes operated by the Commission.
Office Accommodation and Physical Working Conditions—The Commission is charged with ensuring that adequate and suitable office accommodation is obtained to meet the requirements of the Public Service, and also sets the standards to be maintained in the physical working conditions of all public servants.
Statistics: Staff—The detailed distribution of staff among Departments in the Public Service is shown in the Commission's annual report to Parliament (Parliamentary paper H. 14). At 31 March 1967 there were 46,670 permanent officers and 2,548 temporary staff (excluding casuals) employed; a year earlier the comparable figures were 45,470 and 2,185 respectively.
Under the Parliamentary Commissioner (Ombudsman) Act 1962 there has been appointed a Commissioner whose principal function is to inquire into complaints from members of the public relating to administrative decisions of Government Departments and related organisations. The Commissioner is appointed by the Governor-General on the recommendation of the House of Representatives. Complaints to the Commissioner must be made in writing and be accompanied by a fee of $2. Investigations are conducted in private, but the Commissioner can decide not to investigate complaints where, for instance, the subject-matter is trivial or the complainant has not a sufficient personal interest in the subject-matter of the complaint.
The Ombudsman is empowered to report his opinion, after such an investigation, to the Department and to the Minister concerned, and if no action is taken the may report to Parliament.
The first Ombudsman was appointed on 1 October 1962, and makes an annual report to Parliament in parliamentary paper A. 6. Nearly all complaints held to be justified are rectified by the Department or organisation concerned. No complaint of actual malpractice has been found justified.
An analysis of the complaints made to the Ombudsman and the resultant action is given in the following table.
| Action on Complaint | 1 Oct 1962–31 Mar 1964 | 1 April 1964–31 Mar 1965 | 1 April 1965–31 Mar 1966 | Total |
|---|---|---|---|---|
| *There were 86 cases still under investigation at 31 March 1966. | ||||
| Outside jurisdiction | 409 | 263 | 243 | 915 |
| Declined | 19 | 12 | 14 | 45 |
| Discontinued | 39 | 55 | 66 | 160 |
| Withdrawn | 48 | 56 | 78 | 182 |
| Investigated and considered justified | 107 | 55 | 45 | 207 |
| Investigated and considered not justified | 398 | 308 | 227 | 933 |
| Totals | 1,020 | 749 | 673 | 2,442* |
Since the preceding issue of the Yearbook the following honours have been conferred by Her Majesty the Queen for services rendered in connection with New Zealand:
Knight Commander of the Most Excellent Order of the British Empire (K.B.E.)—
Mr Clifford Ulric Plimmer.
Knight Bachelor—
The Honourable Mr Justice George Innes McGregor; Mr Harvey Turner, C.B.E.
Companion of the Most Distinguished Order of Saint Michael and Saint George (C.M.G.)—
The Honourable H. G. R. Mason, Q.C.; The Right Reverend A. K. Warren, M.C.
Commander of the Most Excellent Order of the British Empire (C.B.E.)—
Mr E. R. Garden; Dr W. E. Henley, M.B.E.; Mr E. W. McCallum; Commissioner C. L. Spencer, C.V.O.
Officer of the Most Excellent Order of the British Empire (O.B.E.)—
Mr E. P. Aderman; Mr T. H. C. Caughey; Mr J. H. Hall; Mr W. G. Macartney; Miss E. B. Orbell; Dr M. N. Paewai; Mrs B. Sidey; Mr H. P. Smith; Mr J. A. Steele; Mr P. Tait.
Companion of the Imperial Service Order (I.S.O.)—
Mr J. C. C. Edwards.
Member of the Most Excellent Order of the British Empire (M.B.E.)—
Mr D. C. Butler; Mr C. S. Davies; Mr J. Dempsey; Mrs B. R. Eyre; Mr A. C. L. Fooks: Mr H. O. Hills; Miss E. M. C. Little; Mr R. V. McLachlan; Mr G. Melville; Mrs G. Nelson; Mrs D. M. Parfitt; Mrs K. Reeve-Smith; Mrs M. C. Wachner; Mr T. A. Wilson; Mr C. Woods; Mr A. Tepuretu.
British Empire Medal, for Gallantry (B.E.M.)—
Mr E. C. Marchant; Mr W. Weir.
British Empire Medal (B.E.M.)—
Constable G. P. Ogilvie.
Queen's Police Medal for Distinguished Service (Q.P.M.)—
Detective Sergeant G. Hogan; Detective Senior Sergeant A. Reid; Assistant Commissioner G. C. Urquhart, B.E.M.
Queen's Fire Service Medal, for Distinguished Service—
Chief Fire Officer W. G. Grey; Chief Fire Officer C. A. Nightingale. MILITARY DIVISION
Companion of the Most Honourable Order of the Bath (C.B.)—
Rear Admiral J. O'C. Ross, C.B.E.
Commander of the Most Excellent Order of the British Empire (C.B.E.)—
Air Commodore P. P. O'Brien, O.B.E.
Officer of the Most Excellent Order of the British Empire (O.B.E.)—
Surgeon Commander H. G. Smith, V.R.D.; Lieutenant Colonel J. W. Ardagh; Wing Commander R. C. Jones.
Member of the Most Excellent Order of the British Empire (M.B.E.)—
Lieutenant Commander (Special) A. K. Griffith; Lieutenant Colonel F. B. Bath; Captain J. D. Ireland; Warrant Officer First Class C. W. Crotty; Lieutenant Colonel J. Brooke; Flying Officer D. A. Gable; Warrant Officer V. J. Cosgrave.
Air Force Cross (A.F.C.) —Flight Lieutenant J. A. Hall.
British Empire Medal (B.E.M.)—
Petty Officer B. N. Reed; Chief Visual Instructor L. D. Glassey; Master at Arms, G. M. Cooke; Able Seaman R. F. Anderson; Staff Sergeant G. F. W. Lewis; Staff Sergeant L. Mullane; Flight Sergeant W. McArthur; Sergeant K. S. Piper; Sergeant E. B. Wood.
Queen's Commendation for Valuable Services in the Air—
Flight Lieutenant T. S. Lambert.
CIVIL DIVISION
Knight Commander of the Most Excellent Order of the British Empire (K.B.E.)—
Mr Edward Denis Blundell, O.B.E.
Knight Bachelor—
Mr George Manning, C.M.G.
Knight Commander of the Royal Victorian Order (K.C.V.O.)*—
Mr John V. Meech, C.V.O.
Companion of the Most Distinguished Order of Saint Michael and Saint George (C.M.G.)—
Dr A. W. Liley; Mr D. A. S. Ward.
Commands of the Most Excellent Order of the British Empire (C.B.E.)—
Mr J. T. Andrews; Mr J. S. Meadowcroft; Mr A. M. Satterthwaite; Mr L. G. H. Sinclair, S.M.
Officer of the Most Excellent Order of the British Empire (O.B.E.)—
Mrs H. K. Birks; Captain A. R. Champion; Mr L. L. C. Field; Professor A. H. Flay; Mr D. Forsyth; Mr A. G. Honnor; Mr A. L. Hunt; Mr F. C. Johnstone; Mr H. K. Ngata; Mr J. A. Redwood; The Reverend Dr W. M. Ryburn.
Companion of the Imperial Service Order (I.S.O.)—
Dr G. O. L. Dempster.
Member of the Most Excellent Order of the British Empire (M.B.E.)—
Mr J. H. Beatrie; Dr E. C. Bydder; Mrs J. D. Dalgleish; Mrs G. Farrell; Mr F. C. Jurgens; Miss I. M. C. Lassen: Mr W. D. Lattimore; Mr L. D. Lees: Miss F. M. M Low; Mrs S. A. Martin; Mr E. J. Naylor; Dr A. North; Mrs E. E. Pickering; Mr L. B. Quartermain; Mr H. A. Toneycliffe; Mrs R. E. Townshend; Mrs E. M. Uttley; Miss A. M. Walton Mr E. W. Wise.
British Empire Medal for Gallantry (B.E.M.)—
Detective Sergeant P. J. O'Donovan.
British Empire Medal (B.E.M.)—
Mr D. Barrett; Mr W. R. Burke; Mr J. Davies; Mrs H. Davy; Mr A. P. Farmer; Miss J. H. Hastings; Mr H. J. Kerr; Mr J. Nicholas; Mr Te H. M. Ormsby; Mr A. W. Robertson; Detective Sergeant B. J. Stewart
Queen's Police Medal for Distinguished Service (Q.P.M.)—
Chief Superintendent F. O. Scott.
*On United Kingdom Honours List.
Knight Commander of the Most Honourable Order of the Bath (K.C.B.)—
Lieutenant-General Leonard Whitmore Thornton, C.B., C.B.E.
Commander of the Most Excellent Order of the British Empire (C.B.E.)—
Brigadier B. R. Bullot.
Officer of the Most Excellent Order of the British Empire (O.B.E.)—
Commander N. D. Anderson; Colonel T. F. Hegglun, E. D.; Wing Commander D. E. Jamieson.
Member of the Most Excellent Order of the British Empire (M.B.E.)—
Lieutenant N. L. Merrick; Major D. J. Dunn; Captain (Temporary Major) M. D. Stanley; Captain L. D. Grant; Flight Lieutenant M. D. Burns; Warrant Officer R. E. Spencer; Warrant Officer C. L. Anderson.
Air Force Cross (A.F.C.)—
Squadron Leader G. Wallingford; Flight Lieutenant B. K. Bassett.
British Empire Medal (B.E.M.)—
Master at Arms (Coxswain) T. Denny; Stores Chief Petty Officer R. H. Smith; Mechanician First Class R. V. Stevens; Chief Engineroom Artificer R. E. Lincoln; Warrant Officer Second Class J. D. Desmond; Staff Sergeant H. Cherrington; Sergeant J. M. Benyon; Flight Sergeant A. D. McNicol; Flight Sergeant C. W. Mayes; Flight Sergeant A. C. Webster.
Queen's Commendation for Valuable Service in the Air—
Squadron Leader A. E. Thomson.
British Empire Medal (B.E.M.)—
Mr A. Auld; Mr W. Boardman; Mr G. W. Ewen; Mr R. J. Gibb; Mr R. F. Thomas (for brave conduct after the fatal explosion in the Strongman coal mine, 19 January 1967).
Member of the Most Excellent Order of the British Empire (M.B.E.)—
Warrant Officer M. C. Nabbs.
Military Cross (M.C.)—
Captain B. A. Murphy.
Distinguished Service Cross (D.S.C.)—
Lieutenant-Commander P. N. Wright.
Distinguished Service Medal (D.S.M.)—
Able Seaman C. K. Taylor.
British Empire Medal (B.E.M.)—
Staff-Sergeant G. B. Black.
Mention in Despatches (M.I.D.)—
Lieutenant-Colonel B. M. Poananga; Sergeant G. C. Faulkner; Lance-Bombardier D. T. A. Morrow; Sergeant K. M Schimanski.
Embassies
Belgium—51 Rue de la Loi, Brussels 4.
European Economic Community—51 Rue de la Loi, Brussels 4.
France—9 Rue Leonard de Vinci, Paris.
Germany, West—532 Bad Godesberg, Zanderstrasse 31, Bonn.
Ireland—New Zealand House, Haymarket, London.
Italy—Via Zara 28, Rome.
Japan—26 Sanbancho, Chiyoda-ku, Tokyo.
Korea—26 Sanbancho, Chiyoda-ku, Tokyo, Japan.
Laos—96 Sathorn Road, Bangkok, Thailand.
Nepal—39 Golf Links Road, New Delhi 3, India.
Netherlands—53 Anna Paulownastraat, S.2, The Hague.
Thailand—96 Sathorn Road, Bangkok.
United States of America—19 Observatory Circle, N.W., Washington, D.C., 20008.
Vietnam—45 Phung Khac Khoan, Saigon.
High Commissions
Australia—M.L.C. Building, London Circuit, Canberra, A.C.T.
Britain—New Zealand House, Haymarket, London, S.W.I.
Canada—Commonwealth Building, 77 Metcalfe Street, Ottawa.
Ceylon—39 Golf Links Road, New Delhi 3, India.
India—39 Golf Links Road, New Delhi 3.
Malaysia—Police Co-operative Building, Suleiman Road, Kuala Lumpur.
Singapore—13 Nassim Road, Singapore 10.
Western Samoa—Apia.
Other Missions
Australia—Consular Office, United Insurance Building, corner George and Hunter Streets, Sydney.
Greece—Consulate-General, Leoforos Vasilissis Sophias 63, Athens 140.
Indonesia—Legation, 60 Djalan Prof. Moh. Yamin S.H. Menteng, Djakarta.
Hong Kong—New Zealand Commission, 1124 Prince's Building, Chater Road.
Philippines—Minister, 1124 Prince's Building, Chater Road, Hong Kong.
South-East Asia Treaty Organisation—Council Representative, 96 Sathorn Road, Bangkok.
Switzerland—Consulate-General, 58 Rue de Moillebeau, CH/1211, Geneva 19.
United Nations—New Zealand Mission, 733 Third Avenue, New York, N.Y., 10017.
New Zealand Mission, 58 Rue de Moillebeau, CH/1211, Geneva 19.
United States of America—Consulate-General, 630 Fifth Avenue, New York, N.Y., 10020.
Consulate-General, 153 Kearny Street, San Francisco.
Consulate-General, 510 West Sixth Street, Los Angeles.
Argentina—Government Life Insurance Building, Wellington.
Australia—Australian High Commission, I.C.I. House, Molesworth Street, Wellington.
Austria—Hon. Consul-General, S.M. Motors Building, Taranaki Street, Wellington.
Belgium—Embassy of Belgium, Dominion Farmers Institute, Featherston Street, Wellington.
Hon, Consul, Care of John Burns and Co. Ltd., Auckland.
Hon. Consul, 87 Worcester Street, Christchurch.
Hon. Consul (vacant), Dunedin.
Britain—British High Commission, Government Life Insurance Building, Wellington.
Information Office, Shell House, Albert Street, Auckland.
Canada—Canadian High Commission, I.C.I. House, Molesworth Street, Wellington.
Chile—Hon. Consul, Bates Building, 10 Customs Street East, Auckland.
China—Embassy of Republic of China, D.I.C. Building, Lambton Quay, Wellington.
Czechoslovakia—Legation of Czechoslovakia, 12 Anne Street, Wellington.
Denmark—Royal Danish Embassy, Government Life Insurance Building, Wellington.
Hon. Consul, 101–103 Queen's Arcade, Customs Street, Auckland.
Hon. Consul, 100 Comnor Terrace, Woolston, Christchurch.
Finland—Hon. Consul, 118 Oriental Parade, Wellington.
France—Embassy of France, Government Life Insurance Building, Wellington.
Germany, West—Embassy of the Federal Republic of Germany, 3 Claremont Grove, Wellington.
Hon. Consul, 203 Queen Street, Auckland.
Greece—Hon. Consul-General, 270 Wakefield Street, Wellington.
India—High Commission of India, 49 Willis Street, Wellington.
Italy—Embassy of Italy, 24 Grant Road, Wellington.
Japan—Embassy of Japan, 298 Oriental Parade, Wellington.
Hon. Consul, Northern Steamship Co., Auckland.
Hon. Consul, J. Pallot and Co. Ltd., Christchurch.
Netherlands—Royal Netherlands Legation, Shell House, Wellington.
Hon. Consul, 83 Customs Street East, Auckland.
Hon. Consul, 178 Cashel Street, Christchurch.
Hon. Consul, National Mortgage and Agency Co., Dunedin.
Norway—Hon. Consul, Colonial Mutual Life Building, Customhouse Quay, Wellington.
Panama—Hon. Consul, N.I.M.U. Building, O'Connell Street, Auckland.
Peru—Hon. Consul, 410 Dilworth Buildings, Customs Street, Auckland.
Philippines—Hon. Consul, A.M.P. Building, Auckland.
Portugal—Hon. Consul, L. D. Nathan, Auckland.
Hon. Consul, 39 Johnston Street, Wellington.
South Africa—Consul-General, 36 Wadestown Road, Wellington.
Sweden—Royal Swedish Embassy, 105 Customhouse Quay, Wellington.
Hon. Consul, Coiner of Beach Road and Anzac Avenue, Auckland.
Switzerland—Embassy of Switzerland, D.I.C. Building, Lambton Quay, Wellington.
Thailand—Royal Thai Embassy, 9 Fitzherbert Terrace, Wellington.
Turkey—Hon. Consul, Globe Chambers, 11 Swanson Street, Auckland.
U.S.S.R.—Legation of Union of Soviet Socialist Republics, 57 Messines Road, Wellington.
U.S.A.—Embassy of the United States of America, Government Life Insurance Building, Wellington.
Consul, A.M.P. Building, Queen Street East, Auckland.
Venezuela—Hon. Consul, 29 Princes Street, Auckland C. 1.
Yugoslavia—Consul-General, 49 Hobson Street, Wellington.
Countries with diplomatic representation in Australia with responsibility for New Zealand are: Brazil (Canberra), Ceylon (Canberra), Chile (Sydney), Indonesia (Canberra), Ireland (Canberra), Israel (Canberra), Korea (Sydney, Lebanon (Sydney), Malaysia (Canberra), Norway (Sydney), Pakistan (Canberra), Philippines (Canberra), Vietnam (Canberra).
There are official trade commissioners at the diplomatic missions in Canberra, Sydney, London, Athens, New Delhi, Hong Kong, Tokyo, Kuala Lumpur, Djakarta, Singapore, New York, San Francisco, and Los Angeles at the addresses given on a preceding page.
Addresses of additional official trade commissioners and other representatives are as follows:
Australia—330 Collins Street, Melbourne.
M.L.C. Building, Adelaide Street, Brisbane.
Canada—635 Dorchester Boulevard West, Montreal 2, Quebec.
409 Granville Street, Vancouver 2, B.C.
Fiji—Trade Correspondent, Air New Zealand Ltd., Suva.
Trade Correspondent, Air New Zealand Ltd., Nandi Airport.
France—Apartment 2, 185 Avenue Victor Hugo, Paris 16.
Jamaica—Resident in Trinidad.
Pacific—Department of Industries and Commerce, Bledisloe State Building, Auckland.
Tahiti—Trade Correspondent, Air New Zealand Ltd., Papeete.
Trinidad and Tobago—90 Independence Square, Port of Spain.
U.S.A.—Association's Building, 1145 19th Street, N.W., Washington D.C., 20036.
Trade Correspondent, 2354 Kalakaua Avenue, Waikiki, Honolulu, Hawaii.
Fuller information and also details of official overseas trade representation in New Zealand are set out in the booklet Overseas Representatives in New Zealand and New Zealand Representatives Overseas published by the Department of External Affairs, Wellington.
| TOTAL POPULATION AND EXTERNAL MIGRATION | ||||||
|---|---|---|---|---|---|---|
| Year | Population‡ | Mean Population‡ | Year Ended 31 March | |||
| At 31 December | At 31 March | Year Ended 31 December | Year Ended 31 March | Overseas Passenger Arrivals* | Overseas Passenger Departures* | |
*Excluding through passengers and tourists on cruising liners. ‡Does not include armed forces personnel overseas. †Provisional. | ||||||
| 1916 | 1,150,339 | 1,150,250 | 1,149,225 | 1,150,318 | 25,407 | 22,808 |
| 1917 | 1,147,448 | 1,150,938 | 1,148,893 | 1,149,225 | 20,470 | 20,047 |
| 1918 | 1,158,149 | 1,154,559 | 1,152,798 | 1,152,748 | 13,718 | 12,214 |
| 1919 | 1,227,181 | 1,178,406 | 1,912,665 | 1,166,482 | 11,978 | 11,473 |
| 1920 | 1,257,611 | 1,236,915 | 1,242,396 | 1,207,660 | 26,900 | 23,990 |
| 1921 | 1,292,892 | 1,267,498 | 1,274,917 | 1,252,206 | 46,090 | 31,908 |
| 1922 | 1,318,884 | 1,301,251 | 1,305,126 | 1,283,546 | 41,128 | 30,396 |
| 1923 | 1,343,021 | 1,325,301 | 1,328,193 | 1,311,382 | 34,108 | 28,581 |
| 1924 | 1,370,403 | 1,347,853 | 1,352,618 | 1,334,029 | 36,254 | 30,487 |
| 1925 | 1,401,230 | 1,379,487 | 1,384,428 | 1,359,995 | 42,211 | 29,913 |
| 1926 | 1,429,669 | 1,409,812 | 1,413,743 | 1,392,073 | 42,449 | 30,714 |
| 1927 | 1,450,356 | 1,438,132 | 1,439,004 | 1,420,838 | 45,682 | 34,018 |
| 1928 | 1,467,370 | 1,453,821 | 1,456,075 | 1,443,551 | 35,837 | 37,072 |
| 1929 | 1,486,134 | 1,471,110 | 1,473,419 | 1,460,363 | 34,799 | 34,088 |
| 1930 | 1,506,809 | 1,489,203 | 1,493,019 | 1,478,027 | 33,839 | 31,454 |
| 1931 | 1,522,762 | 1,511,700 | 1,514,215 | 1,498,416 | 30,741 | 25,632 |
| 1932 | 1,534,739 | 1,525,545 | 1,527,062 | 1,517,940 | 17,891 | 21,063 |
| 1933 | 1,547,124 | 1,538,028 | 1,539,590 | 1,530,119 | 18,713 | 21,308 |
| 1934 | 1,558,373 | 1,550,125 | 1,551,523 | 1,542,651 | 19,687 | 22,022 |
| 1935 | 1,569,689 | 1,560,992 | 1,562,233 | 1,554,297 | 24,901 | 28,051 |
| 1936 | 1,584,617 | 1,573,927 | 1,575,231 | 1,565,263 | 26,936 | 28,050 |
| 1937 | 1,601,758 | 1,587,211 | 1,589,972 | 1,578,757 | 31,670 | 32,023 |
| 1938 | 1,618,313 | 1,604,479 | 1,606,763 | 1,594,275 | 38,738 | 36,352 |
| 1939 | 1,641,639 | 1,624,714 | 1,628,512 | 1,611,362 | 42,648 | 37,685 |
| 1940 | 1,633,645 | 1,640,901 | 1,637,305 | 1,633,447 | 31,432 | 25,404 |
| 1941 | 1,631,276 | 1,636,230 | 1,630,948 | 1,635,715 | 13,814 | 13,100 |
| 1942 | 1,636,403 | 1,634,338 | 1,639,572 | 1,630,419 | 7,102 | 6,893 |
| 1943 | 1,642,041 | 1,634,094 | 1,635,635 | 1,640,191 | 3,133 | 2,592 |
| 1944 | 1,676,286 | 1,643,900 | 1,655,795 | 1,637,570 | 3,747 | 3,640 |
| 1945 | 1,727,817 | 1,679,972 | 1,694,641 | 1,664,585 | 7,207 | 6,189 |
| 1946 | 1,781,214 | 1,756,756 | 1,759,526 | 1,710,680 | 13,309 | 10,966 |
| 1947 | 1,817,453 | 1,789,476 | 1,798,262 | 1,770,291 | 25,358 | 22,320 |
| 1948 | 1,853,806 | 1,828,025 | 1,834,655 | 1,807,611 | 33,144 | 27,388 |
| 1949 | 1,892,042 | 1,864,560 | 1,871,748 | 1,843,767 | 35,946 | 31,765 |
| 1950 | 1,927,629 | 1,902,883 | 1,909,092 | 1,881,317 | 50,880 | 43,000 |
| 1951 | 1,970,522 | 1,938,032 | 1,947,529 | 1,917,934 | 54,644 | 47,122 |
| 1952 | 2,024,556 | 1,984,730 | 1,996,149 | 1,958,729 | 62,498 | 46,834 |
| 1953 | 2,074,781 | 2,037,553 | 2,048,826 | 2,009,506 | 66,240 | 44,208 |
| 1954 | 2,118,434 | 2,087,740 | 2,094,910 | 2,061,376 | 61,845 | 46,404 |
| 1955 | 2,164,734 | 2,130,927 | 2,138,946 | 2,105,767 | 61,610 | 54,580 |
| 1956 | 2,209,132 | 2,175,373 | 2,182,833 | 2,150,290 | 66,472 | 58,380 |
| 1957 | 2,262,814 | 2,221,169 | 2,232,591 | 2,194,108 | 76,005 | 64,563 |
| 1958 | 2,315,900 | 2,275,515 | 2,285,852 | 2,246,093 | 79,666 | 64,258 |
| 1959 | 2,359,746 | 2,326,129 | 2,334,617 | 2,298,814 | 83,648 | 73,656 |
| 1960 | 2,403,567 | 2,370,166 | 2,377,010 | 2,345,602 | 89,377 | 86,164 |
| 1961 | 2,461,243 | 2,414,296 | 2,426,654 | 2,388,004 | 106,238 | 104,618 |
| 1962 | 2,515,835 | 2,474,588 | 2,484,873 | 2,441,400 | 132,656 | 113,824 |
| 1963 | 2,566,915 | 2,527,868 | 2,536,912 | 2,498,357 | 143,872 | 130,233 |
| 1964 | 2,616,970 | 2,582,407 | 2,589,150 | 2,550,114 | 164,646 | 149,162 |
| 1965 | 2,663,843 | 2,628,900 | 2,635,352 | 2,601,219 | 190,291 | 178,300 |
| 1966 | 2,712,250 | 2,676,809 | 2,682,968 | 2,647,199 | 219,939 | 207,918 |
| 1967 | 2,727,148 | 2,695,310 | 250,406 | 235,971 | ||
| VITAL STATISTICS | ||||||||
|---|---|---|---|---|---|---|---|---|
| Year | Numbers | Rates per 1,000 of Mean Population | Deaths Under 1 Year per 1,000 Live Births | Marriages | ||||
| Live Births | Deaths | Deaths Under 1 Year | Live Births | Deaths | Number | Rate per 1,000 of Mean Population | ||
| 1921 | 29,623 | 11,474 | .. | 23.24 | 9.00 | .. | 10,883 | 8.54 |
| 1922 | 30,448 | 11,874 | .. | 23.33 | 9.03 | .. | 9,834 | 7.53 |
| 1923 | 29,148 | 12,239 | .. | 21.95 | 9.21 | .. | 10,352 | 7.79 |
| 1924 | 29,260 | 11,540 | .. | 21.63 | 8.53 | .. | 10,502 | 7.76 |
| 1925 | 29,869 | 11,844 | 1,309 | 21.57 | 8.56 | 43.82 | 10,817 | 7.81 |
| 1926 | 30,009 | 12,517 | 1,312 | 21.23 | 8.85 | 43.72 | 10,994 | 7.78 |
| 1927 | 29,376 | 12,600 | 1,316 | 20.41 | 8.76 | 44.80 | 10,796 | 7.50 |
| 1928 | 29,045 | 12,860 | 1,166 | 19.95 | 8.83 | 40.14 | 10,919 | 7.50 |
| 1929 | 28,963 | 13,220 | 1,086 | 19.66 | 8.97 | 37.50 | 11,403 | 7.74 |
| 1930 | 28,923 | 13,145 | 1,112 | 19.37 | 8.80 | 38.45 | 11,494 | 7.70 |
| 1931 | 28,934 | 13,062 | 1,077 | 19.11 | 8.63 | 37.22 | 10,254 | 6.77 |
| 1932 | 27,629 | 12,875 | 1,039 | 18.09 | 8.43 | 37.61 | 10,492 | 6.87 |
| 1933 | 27,282 | 12,862 | 1,043 | 17.72 | 8.35 | 38.23 | 11,067 | 7.19 |
| 1934 | 27,303 | 13,810 | 1,060 | 17.60 | 8.90 | 38.82 | 11,788 | 7.60 |
| 1935 | 27,216 | 13,664 | 1,128 | 17.42 | 8.74 | 41.45 | 12,744 | 8.16 |
| 1936 | 28,467 | 14,658 | 1,168 | 18.07 | 9.31 | 41.03 | 14,448 | 9.17 |
| 1937 | 29,985 | 15,215 | 1,178 | 18.86 | 9.57 | 39.29 | 14,973 | 9.42 |
| 1938 | 30,942 | 16,874 | 1,537 | 19.26 | 10.50 | 49.67 | 15,959 | 9.93 |
| 1939 | 32,949 | 15,933 | 1,371 | 20.23 | 9.78 | 41.61 | 17,791 | 10.92 |
| 1940 | 37,036 | 15,875 | 1,362 | 22.62 | 9.70 | 36.78 | 18,084 | 11.04 |
| 1941 | 39,234 | 17,047 | 1,562 | 24.06 | 10.45 | 39.81 | 13,830 | 8.48 |
| 1942 | 37,904 | 18,117 | 1,388 | 23.12 | 11.05 | 36.62 | 12,775 | 7.79 |
| 1943 | 34,751 | 17,122 | 1,350 | 21.25 | 10.47 | 38.47 | 12,021 | 7.35 |
| 1944 | 38,107 | 17,049 | 1,473 | 23.01 | 10.30 | 38.65 | 13,646 | 8.24 |
| 1945 | 41,651 | 17,686 | 1,449 | 24.58 | 10.44 | 34.77 | 16,693 | 9.85 |
| 1946 | 47,647 | 17,720 | 1,524 | 27.08 | 10.07 | 31.99 | 21,096 | 11.99 |
| 1947 | 49,804 | 17,442 | 1,487 | 27.70 | 9.70 | 29.86 | 19,047 | 10.59 |
| 1948 | 49,149 | 17,285 | 1,350 | 26.79 | 9.42 | 27.47 | 17,750 | 9.67 |
| 1949 | 48,905 | 17,578 | 1,468 | 26.13 | 9.39 | 30.02 | 17,354 | 9.27 |
| 1950 | 49,414 | 18,084 | 1,364 | 25.88 | 9.47 | 27.60 | 17,099 | 8.96 |
| 1951 | 49,889 | 18,836 | 1,374 | 25,62 | 9.67 | 27,54 | 16,915 | 8.69 |
| 1952 | 51,928 | 18,896 | 1,475 | 26.01 | 9.47 | 28.40 | 17,061 | 8.55 |
| 1953 | 51,943 | 18,354 | 1,335 | 25.35 | 8.96 | 25.70 | 17,224 | 8.41 |
| 1954 | 54,131 | 18,876 | 1,302 | 25.84 | 9.01 | 24.05 | 17,557 | 8.38 |
| 1955 | 55,676 | 19,225 | 1,365 | 26.03 | 8.99 | 24.52 | 17,795 | 8.32 |
| 1956 | 56,593 | 19,696 | 1,313 | 25.93 | 9.02 | 23.20 | 17,531 | 8.03 |
| 1957 | 58,484 | 20.862 | 1,420 | 26.20 | 9.34 | 24.28 | 17,614 | 7.89 |
| 1958 | 60,635 | 20,301 | 1,416 | 26.53 | 8.88 | 23.35 | 18,305 | 8.01 |
| 1959 | 61,869 | 21,128 | 1,477 | 26.50 | 9.05 | 23.87 | 18,315 | 7.84 |
| 1960 | 62,850 | 20,892 | 1,420 | 26.44 | 8.79 | 22.59 | 18,909 | 7.96 |
| 1961 | 65,476 | 21,782 | 1,490 | 26.97 | 8.97 | 22.76 | 19,426 | 8.00 |
| 1962 | 65,127 | 22,081 | 1,331 | 26.17 | 8.87 | 20.33 | 19,572 | 7.86 |
| 1963 | 64,675 | 22,416 | 1,269 | 25.43 | 8.81 | 19.62 | 19,856 | 7.81 |
| 1964 | 62,459 | 22,861 | 1,193 | 24.04 | 8.80 | 19.10 | 20,720 | 7.97 |
| 1965 | 60,178 | 22,976 | 1,174 | 22.73 | 8.68 | 19.51 | 21,702 | 8.20 |
| 1966 | 60,188 | 23,778 | 1,064 | 22.42 | 8.86 | 17.68 | 22,949 | 8.55 |
| EDUCATION | |||||||
|---|---|---|---|---|---|---|---|
| Roll Numbers at Educational Institutions | |||||||
| At 1 July* | Primary† | Secondary† | Higher | ||||
| State Schools | Registered Private Schools | State Schools | Registered Private Schools | Technical Institutes (Full-time Students) | Teachers' Colleges | University Institutions (Including Extramural and Part-time Students) | |
*Figures earlier than 1928 are for December. †Excludes Correspondence School pupils. | |||||||
| 1916 | 191,482 | 23,635 | 11,272 | 1,004 | .. | 442 | 1,985 |
| 1917 | 193,927 | 25,685 | 12,117 | 1,206 | .. | 451 | 1,977 |
| 1918 | 198,409 | 26,371 | 13,414 | 1,366 | .. | 500 | 2,226 |
| 1919 | 199,784 | 20,977 | 14,153 | 1,497 | .. | 582 | 3,060 |
| 1920 | 203,698 | 22,193 | 14,119 | 1,439 | .. | 680 | 3,822 |
| 1921 | 211,777 | 23,924 | 15,555 | 1,634 | .. | 904 | 4,123 |
| 1922 | 217,242 | 24,861 | 17,544 | 1,998 | .. | 1,151 | 3,958 |
| 1923 | 218,646 | 26,010 | 19,491 | 2,134 | .. | 1,202 | 4,202 |
| 1924 | 220,078 | 26,302 | 20,279 | 2,473 | .. | 1,274 | 4,236 |
| 1925 | 221,449 | 25,933 | 20,782 | 2,511 | .. | 1,271 | 4,442 |
| 1926 | 225,608 | 26,778 | 22,650 | 2,794 | .. | 1,198 | 4,653 |
| 1927 | 227,777 | 27,358 | 23,474 | 2,932 | .. | 1,200 | 4,878 |
| 1928 | 221,169 | 26,394 | 27,084 | 3,506 | .. | 1,115 | 4,802 |
| 1929 | 220,347 | 26,556 | 28,513 | 3,877 | .. | 1,188 | 4,623 |
| 1930 | 219,274 | 26,617 | 29,284 | 4,513 | .. | 1,155 | 4,801 |
| 1931 | 220,976 | 26,448 | 31,053 | 4,602 | .. | 1,165 | 5,111 |
| 1932 | 217,236 | 26,390 | 30,944 | 4,512 | .. | 990 | 5,171 |
| 1933 | 203,589 | 26,097 | 30,473 | 4,315 | .. | 443 | 5,085 |
| 1934 | 201,870 | 26,584 | 30,915 | 4,430 | .. | .. | 5,059 |
| 1935 | 200,135 | 26,923 | 31,611 | 4,743 | .. | 429 | 5,101 |
| 1936 | 213,497 | 27,540 | 31,894 | 5,108 | .. | 1,185 | 5,218 |
| 1937 | 212,076 | 27,507 | 32,115 | 5,595 | .. | 1,346 | 5,238 |
| 1938 | 209,961 | 28,271 | 34,345 | 6,059 | .. | 1,522 | 5,707 |
| 1939 | 208,641 | 27,972 | 35,692 | 6,266 | .. | 1,588 | 5,979 |
| 1940 | 208,433 | 27,868 | 35,273 | 6,379 | .. | 1,457 | 5,528 |
| 1941 | 208,595 | 27,836 | 33,253 | 6,451 | .. | 1,503 | 5,065 |
| 1942 | 208,721 | 26,983 | 32,391 | 6,483 | .. | 1,463 | 4,373 |
| 1943 | 206,884 | 28,521 | 34,893 | 7,184 | .. | 1,775 | 5,953 |
| 1944 | 207,292 | 29,223 | 40,723 | 8,121 | .. | 1,678 | 7,267 |
| 1945 | 211,742 | 29,583 | 44,279 | 8,933 | .. | 1,431 | 8,425 |
| 1946 | 218,129 | 30,581 | 44,985 | 9,424 | .. | 1,575 | 11,361 |
| 1947 | 229,804 | 31,929 | 45,249 | 9,968 | .. | 1,634 | 11,874 |
| 1948 | 235,243 | 32,818 | 45,109 | 9,793 | .. | 1,875 | 11,964 |
| 1949 | 244,377 | 33,941 | 46,512 | 10,243 | .. | 2,321 | 11,598 |
| 1950 | 254,664 | 35,775 | 48,232 | 10,511 | .. | 2,684 | 11,515 |
| 1951 | 265,230 | 37,109 | 50,682 | 11,045 | .. | 2,704 | 10,956 |
| 1952 | 282,699 | 39,342 | 54,124 | 11,622 | .. | 2,710 | 10,691 |
| 1953 | 298,481 | 41,277 | 59,558 | 12,476 | .. | 2,769 | 10,831 |
| 1954 | 311,541 | 42,797 | 66,344 | 13,627 | .. | 2,834 | 10,803 |
| 1955 | 320,580 | 44,086 | 72,117 | 14,970 | .. | 2,847 | 10,851 |
| 1956 | 332,049 | 46,261 | 75,354 | 15,832 | .. | 2,963 | 11,077 |
| 1957 | 344,959 | 47,953 | 78,843 | 16,265 | .. | 3,218 | 11,761 |
| 1958 | 356,224 | 48,418 | 82,699 | 16,984 | .. | 3,602 | 12,881 |
| 1959 | 365,761 | 51,549 | 89,508 | 17,663 | .. | 3,753 | 14,388 |
| 1960 | 371,825 | 52,887 | 99,365 | 19,293 | 71 | 3,838 | 15,809 |
| 1961 | 376,475 | 54,079 | 109,632 | 20,752 | 221 | 3,814 | 16,820 |
| 1962 | 384,313 | 55,293 | 118,523 | 22,290 | 441 | 4,223 | 17,214 |
| 1963 | 392,595 | 56,341 | 124,978 | 23,603 | 532 | 4,536 | 18,303 |
| 1964 | 404,257 | 57,154 | 128,709 | 24,439 | 620 | 4,691 | 19,640 |
| 1965 | 415,582 | 57,244 | 132,094 | 25,073 | 857 | 4,790 | 22,145 |
| 1966 | 429,916 | 56,050 | 136,104 | 25,585 | 1,163 | 5,022 | 24,302 |
NOTE—In addition, in 1966, 165 students attended Massey University of Manawatu, 26 attended Otago University, and 153 attended Lincoln College for courses of less than one year's duration, 80,688 students were enrolled for part-time day and evening classes, including 13.247 with the N.Z. Technical Correspondence Institute; 939 pupils received tuition from the Primary Correspondence School and 449 pupils received tuition from the Secondary Correspondence School.
| JUSTICE | ||||||||
|---|---|---|---|---|---|---|---|---|
| Year | Summary Convictions in Magistrates' Courts* | Total Convictions or Sentences in Superior Courts | Total Distinct Persons Sentenced in Superior Courts | Prisoners in Gaol at End of Year (Undergoing Sentence) | ||||
| Number | Rate per 1,000 of Mean Population | Number | Rate per 1,000 of Mean Population | Number | Rate per 1,000 of Mean Population | Number | Rate per 1,000 of Population | |
*Excluding Children's Court cases from year 1914 onwards. †Change in legislation has resulted in more cases being dealt with in Magistrates' Courts. | ||||||||
| 1915 | 38,446 | 33.45 | 509 | 0.44 | 441 | 0.38 | 941 | 0.82 |
| 1916 | 34,324 | 29.87 | 448 | 0.39 | 401 | 0.35 | 834 | 0.73 |
| 1917 | 33,302 | 28.99 | 623 | 0.54 | 377 | 0.33 | 954 | 0.83 |
| 1918 | 28,421 | 24.65 | 632 | 0.55 | 355 | 0.31 | 1,005 | 0.87 |
| 1919 | 31,766 | 26.63 | 808 | 0.68 | 461 | 0.39 | 852 | 0.69 |
| 1920 | 34,740 | 27.96 | 1,011 | 0.81 | 459 | 0.37 | 996 | 0.79 |
| 1921 | 36,492 | 28.58 | 1,475 | 1.16 | 616 | 0.48 | 1,044 | 0.81 |
| 1922 | 33,995 | 26.05 | 1,417 | 1.09 | 601 | 0.46 | 1,052 | 0.83 |
| 1923 | 36,701 | 29.14 | 1,663 | 1.25 | 625 | 0.47 | 1,141 | 0.85 |
| 1924 | 38,982 | 28.82 | 1,388 | 1.03 | 555 | 0.41 | 1,197 | 0.87 |
| 1925 | 43,407 | 31.35 | 1,465 | 1.06 | 511 | 0.37 | 1,284 | 0.92 |
| 1926 | 44,887 | 31.75 | 1,562 | 1.10 | 569 | 0.40 | 1,388 | 0.97 |
| 1927 | 44,540 | 30.95 | 1,739 | 1.21 | 569 | 0.40 | 1,483 | 1.02 |
| 1928 | 43,419 | 29.82 | 1,368 | 0.94 | 478 | 0.33 | 1,435 | 0.98 |
| 1929 | 44,311 | 30.07 | 1,345 | 0.91 | 473 | 0.32 | 1,342 | 0.90 |
| 1930 | 45,544 | 30.50 | 1,524 | 1.02 | 538 | 0.36 | .1,523 | 1.01 |
| 1931 | 40,374 | 26.66 | 1,624 | 1.07 | 600 | 0.40 | 1,614 | 1.06 |
| 1932 | 40,591 | 26.58 | 1,710 | 1.12 | 636 | 0.42 | 1,522 | 0.99 |
| 1933 | 36,043 | 23.41 | 1,513 | 0.98 | 531 | 0.34 | 1,410 | 0.91 |
| 1934 | 35,752 | 23.04 | 1,213 | 0.78 | 490 | 0.32 | 1,199 | 0.77 |
| 1935 | 36,230 | 23.19 | 1,148 | 0.73 | 472 | 0.30 | 1,112 | 0.71 |
| 1936 | 39,517 | 25.09 | 1,178 | 0.75 | 462 | 0.29 | 915 | 0.58 |
| 1937 | 42,726 | 26.87 | 1,318 | 0.83 | 507 | 0.32 | 790 | 0.49 |
| 1938 | 49,651 | 30.90 | 1,322 | 0.82 | 488 | 0.30 | 777 | 0.48 |
| 1939 | 52,288 | 32.11 | 1,489 | 0.91 | 571 | 0.35 | 895 | 0.55 |
| 1940 | 46,110 | 28.16 | 1,394 | 0.85 | 547 | 0.33 | 863 | 0.53 |
| 1941 | 39,636 | 24.30 | .1,496 | 0.92 | 542 | 0.33 | 988 | 0.61 |
| 1942 | .. | .. | 1,460 | 0.89 | 457 | 0.28 | 1,304 | 0.63 |
| 1943 | .. | .. | 1,378 | 0.84 | 494 | 0.30 | 1,024 | 0.62 |
| 1944 | .. | .. | 1,441 | 0.87 | 560 | 0.34 | 945 | 0.56 |
| 1945 | .. | .. | 1,885 | 1.11 | 619 | 0.37 | 998 | 0.58 |
| 1946 | .. | .. | 1,713 | 0.97 | 655 | 0.37 | 992 | 0.56 |
| 1947 | 40,990 | 22.79 | 1,948 | 1.08 | 740 | 0.41 | 1,088 | 0.60 |
| 1948 | 44,119 | 24.05 | 2,323 | 1.27 | 717 | 0.39 | 986 | 0.53 |
| 1949 | 50,000 | 26.71 | 1,718 | 0.92 | 676 | 0.36 | 941 | 0.50 |
| 1950 | 51,606 | 27.03 | 1,583 | 0.83 | 642 | 0.34 | 1,043 | 0.54 |
| 1951 | 56,128 | 28.82 | 1,574 | 0.81 | 644 | 0.33 | 1,040 | 0.53 |
| 1952 | 73,960 | 37.05 | 1,706 | 0.85 | 704 | 0.35 | 1,083 | 0.54 |
| 1953 | 82,143 | 40.09 | 361† | 0.18 | 179† | 0.09 | 1,088 | 0.52 |
| 1954 | 80,210 | 38.29 | 326† | 0.16 | 148† | 0.07 | 1,196 | 0.57 |
| 1955 | 77,806 | 36.38 | 377† | 0.18 | 147† | 0.07 | 1,118 | 0.52 |
| 1956 | 87,394 | 40.40 | 601† | 0.28 | 204† | 0.09 | 1,362 | 0.62 |
| 1957 | 98,647 | 44.18 | 567† | 0.25 | 199† | 0.09 | 1,474 | 0.66 |
| 1958 | 108,791 | 47.59 | 558† | 0.24 | 206† | 0.09 | 1,642 | 0.72 |
| 1959 | 101,655 | 43.54 | 595† | 0.25 | 212† | 0.09 | 1,714 | 0.73 |
| 1960 | 112,889 | 47.49 | 749† | 0.32 | 286† | 0.12 | 1,777 | 0.75 |
| 1961 | 122,544 | 50.48 | 532† | 0.22 | 294† | 0.12 | 1,818 | 0.75 |
| 1962 | 137,395 | 55.22 | 667† | 0.29 | 265† | 0.12 | 1,707 | 0.69 |
| 1963 | 143,013 | 56.23 | 775† | 0.30 | 309† | 0.12 | 1,765 | 0.69 |
| 1964 | 166,490 | 64.10 | 669† | 0.26 | 242† | 0.09 | 1,757 | 0.67 |
| 1965 | 183,855 | 63.18 | 584† | 0.22 | 304† | 0.12 | 1,702 | 0.66 |
| POSTAL | ||||||
|---|---|---|---|---|---|---|
| Year Ended 31 March* | Letters, Cards, etc., Posted | Total Mail Matter (Including Parcels) Posted | Money Orders Issued | Postal Notes Issued† | ||
| Number | Amount | Number | Amount | |||
*Calendar year until 1945. †Year ended 31 March following from 1922. ‡Increase largely accounted for by withdrawals from savings-bank accounts for payment at sub-post-offices being paid by savings-bank money orders as from 31 March 1946. | ||||||
| million | million | (000) | $(000) | (000) | $(000) | |
| 1915 | 121.3 | 178.3 | 665 | 6,944 | 2,370 | 1,426 |
| 1916 | 121.1 | 173.5 | 669 | 7,214 | 2,286 | 1,372 |
| 1917 | 122.9 | 172.5 | 643 | 6,954 | 2,187 | 1,258 |
| 1918 | 121.3 | 166.9 | 639 | 7,298 | 2.091 | 1,222 |
| 1919 | 123.6 | 170.2 | 690 | 5,208 | 2,198 | 1,292 |
| 1920 | 129.9 | 180.4 | 700 | 10,554 | 2,280 | 1,382 |
| 1921 | 126.9 | 179.5 | 669 | 9,702 | 2,378 | 1,446 |
| 1922 | 120.0 | 178.1 | 660 | 8,558 | 2,435 | 1,460 |
| 1923 | 126.0 | 191.6 | 635 | 8,780 | 2,653 | 1,572 |
| 1924 | 136.2 | 213.5 | 732 | 9,386 | 2,846 | 1,682 |
| 1925 | 197.3 | 235.8 | 767 | 9,954 | 3,041 | 1,804 |
| 1926 | 149.3 | 243.2 | 793 | 10,066 | 3,330 | 1,930 |
| 1927 | 148.2 | 248.3 | 804 | 9,990 | 3,614 | 2,030 |
| 1928 | 149.3 | 258.9 | 808 | 9,956 | 3,576 | 2,116 |
| 1929 | 154.6 | 266.0 | 835 | 10,376 | 3,817 | 2,246 |
| 1930 | 156.6 | 271.0 | 834 | 10,140 | 3,907 | 2,258 |
| 1931 | 131.9 | 232.7 | 714 | 7,986 | 2,885 | 1,904 |
| 1932 | 123.2 | 218.3 | 649 | 6,672 | 2,687 | 1,916 |
| 1933 | 131.0 | 230.6 | 636 | 6,226 | 2,883 | 2,124 |
| 1934 | 137.5 | 243.4 | 655 | 6,420 | 3,326 | 2,282 |
| 1935 | 144.3 | 263.1 | 673 | 6,748 | 3,827 | 2,588 |
| 1936 | 146.0 | 267.0 | 734 | 7,590 | 3,833 | 2,756 |
| 1937 | 151.0 | 273.8 | 784 | 8,626 | 3,747 | 2,910 |
| 1938 | 158.2 | 304.3 | 848 | 9,604 | 3,835 | 2,970 |
| 1939 | 156.3 | 295.7 | 911 | 10,188 | 3,375 | 2,646 |
| 1940 | 148.3 | 266.0 | 813 | 8,870 | 2,559 | 2,042 |
| 1941 | 143.0 | 261.9 | 752 | 8,604 | 2,408 | 1,962 |
| 1942 | .. | .. | 817 | 9,922 | 2,242 | 1,868 |
| 1943 | .. | .. | 787 | 11,002 | 2,216 | 1,890 |
| 1944 | .. | .. | 762 | 11,978 | 2,223 | 1,904 |
| 1945 | 140.4 | 236.8 | 770 | 14,404 | 2,266 | 1,966 |
| 1947 | 160.7* | 294.3* | 903 | 21,248‡ | 2,354 | 2,056 |
| 1948 | 159.8 | 301.1 | 917 | 21,608 | 2,465 | 2,144 |
| 1949 | 162.1 | 319.2 | 943 | 21,686 | 2,484 | 2,212 |
| 1950 | 169.8 | 343.0 | 952 | 21,712 | 2,461 | 2,240 |
| 1951 | 178.9 | 358.2 | 977 | 23,276 | 2,372 | 2,168 |
| 1952 | 174.6 | 346.7 | 1,027 | 25,362 | 2,350 | 2,232 |
| 1953 | 176.9 | 357.6 | 1,091 | 28,748 | 2,297 | 2,202 |
| 1954 | 173.5 | 359.3 | 1,136 | 29,334 | 2,230 | 2,160 |
| 1955 | 180.1 | 386.4 | 1,236 | 41,174 | 2,278 | 2,202 |
| 1956 | 187.5 | 408.1 | 1,337 | 50,922 | 2,334 | 2,172 |
| 1957 | 192.0 | 412.4 | 1,383 | 52,600 | 2,230 | 2,144 |
| 1958 | 202.3 | 438.6 | 1,339 | 49,814 | 2,176 | 2,272 |
| 1959 | 204.6 | 446.4 | 1,353 | 50,078 | 2,240 | 2,460 |
| 1960 | 210.3 | 464.3 | 1,404 | 48,088 | 2,369 | 2,674 |
| 1961 | 224.1 | 494.8 | 1,485 | 49,030 | 2,614 | 2,894 |
| 1962 | 229.1 | 507.2 | 1,600 | 53,014 | 2,777 | 3,042 |
| 1963 | 239.9 | 526.0 | 1,677 | 53,502 | 2,584 | 3,030 |
| 1964 | 257.8 | 533.9 | 1,797 | 54,468 | 2,634 | 3,196 |
| 1965 | 263.1 | 551.4 | 1,967 | 58,272 | 2,597 | 3,408 |
| 1966 | 273.6 | 573.4 | 2,128 | 61,320 | 2,579 | 3,498 |
| GOVERNMENT RAILWAYS | ||||||
|---|---|---|---|---|---|---|
| Year Ended 31 March | Miles Open for Traffic | Revenue Train-miles | Rail Passenger Journeys | Goods and Livestock* | Revenue† | Expenditure† |
*Equivalent tonnage of livestock. †From 1925–26 figures relate to railway operation only. | ||||||
| (000) | (000) | tons (000) | $(000) | $(000) | ||
| 1916 | 2,960 | 9,357 | 24,601 | 6,371 | 9,096 | 5,822 |
| 1917 | 2,960 | 9,146 | 24,783 | 6,239 | 9,602 | 5,854 |
| 1918 | 2,983 | 7,469 | 21,438 | 5,743 | 9,376 | 6,086 |
| 1919 | 2,983 | 7,478 | 22,030 | 5,612 | 9,978 | 6,618 |
| 1920 | 2,996 | 7,409 | 24,582 | 6,000 | 11,504 | 8,210 |
| 1921 | 3,009 | 9,303 | 28,822 | 6,487 | 13,818 | 11,274 |
| 1922 | 3,021 | 8,717 | 28,122 | 6,321 | 13,288 | 12,476 |
| 1923 | 3,028 | 8,347 | 28,221 | 6,619 | 13,456 | 11,004 |
| 1924 | 3,053 | 9,025 | 28,436 | 6,918 | 13,968 | 10,808 |
| 1925 | 3,085 | 9,084 | 26,107 | 7,025 | 14,226 | 11,090 |
| 1926 | 3,138 | 10,319 | 27,653 | 7,247 | 15,178 | 12,330 |
| 1927 | 3,164 | 10,724 | 26,002 | 7,300 | 14,846 | 12,316 |
| 1928 | 3,180 | 10,839 | 25,380 | 7,358 | 14,688 | 12,604 |
| 1929 | 3,287 | 11,113 | 25,575 | 7,613 | 15,050 | 12,750 |
| 1930 | 3,287 | 12,022 | 25,414 | 7,789 | 14,948 | 13,696 |
| 1931 | 3,322 | 11,282 | 22,814 | 6,958 | 13,562 | 12,812 |
| 1932 | 3,315 | 10,169 | 19,151 | 5,825 | 11,578 | 10,604 |
| 1933 | 3,315 | 9,829 | 18,367 | 5,491 | 10,678 | 9,668 |
| 1934 | 3,320 | 10,163 | 19,047 | 5,642 | 11,258 | 9,754 |
| 1935 | 3,320 | 10,626 | 19,654 | 6,024 | 11,816 | 10,278 |
| 1936 | 3,320 | 11,050 | 20,358 | 6,189 | 12,488 | 11,046 |
| 1937 | 3,320 | 11,868 | 21,235 | 6,813 | 13,808 | 12,676 |
| 1938 | 3,323 | 12,778 | 22,441 | 7,516 | 15,184 | 14,584 |
| 1939 | 3,319 | 13,073 | 23,266 | 7,539 | 16,010 | 15,328 |
| 1940 | 3,390 | 13,367 | 24,454 | 7,674 | 17,524 | 15,886 |
| 1941 | 3,390 | 13,560 | 26,277 | 8,426 | 19,388 | 16,814 |
| 1942 | 3,390 | 13,979 | 28,611 | 8,474 | 20,768 | 17,806 |
| 1943 | 3,460 | 15,140 | 36,133 | 8,887 | 24,830 | 20,040 |
| 1944 | 3,504 | 15,329 | 38,611 | 9,027 | 26,930 | 22,732 |
| 1945 | 3,504 | 12,803 | 32,995 | 8,954 | 24,896 | 23,394 |
| 1946 | 3,528 | 13,455 | 32,418 | 9,210 | 26,210 | 25,100 |
| 1947 | 3,528 | 13,169 | 28,869 | 9,329 | 25,648 | 27,290 |
| 1948 | 3,526 | 13,712 | 25,887 | 9,524 | 27,928 | 30,180 |
| 1949 | 3,526 | 13,895 | 26,168 | 9,666 | 30,678 | 33,576 |
| 1950 | 3,526 | 14,421 | 25,895 | 9,948 | 32,124 | 34,722 |
| 1951 | 3,531 | 14,153 | 24,824 | 9,616 | 37,000 | 37,450 |
| 1952 | 3,539 | 12,371 | 21,292 | 9,829 | 40,194 | 43,030 |
| 1953 | 3,535 | 13,409 | 21,455 | 10,026 | 25,178 | 45,510 |
| 1954 | 3,504 | 13,719 | 23,272 | 9,635 | 47,364 | 47,242 |
| 1955 | 3,489 | 14,420 | 24,735 | 10,336 | 54,018 | 51,084 |
| 1956 | 3,422 | 14,884 | 25,075 | 10,678 | 55,742 | 53,550 |
| 1957 | 3,418 | 15,102 | 25,377 | 10,325 | 57,014 | 57,388 |
| 1958 | 3,466 | 14,825 | 24,817 | 10,332 | 60,020 | 62,128 |
| 1959 | 3,420 | 14,605 | 25,437 | 10,367 | 59,646 | 61,010 |
| 1960 | 3,336 | 14,480 | 26,134 | 10,543 | 60,542 | 61,516 |
| 1961 | 3,333 | 14,773 | 26,233 | 10,830 | 62,858 | 62,978 |
| 1962 | 3,332 | 14,948 | 26,324 | 10,822 | 63,390 | 63,632 |
| 1963 | 3,263 | 14,575 | 25,665 | 10,044 | 62,752 | 66,874 |
| 1964 | 3,265 | 14,918 | 25,734 | 11,090 | 67,648 | 67,946 |
| 1965 | 3,254 | 15,316 | 25,137 | 11,972 | 72,786 | 71,932 |
| 1966 | 3,251 | 15,428 | 23,889 | 11,888 | 74,753 | 73,228 |
| AGRICULTURE | |||||||
|---|---|---|---|---|---|---|---|
| Season | Wheat for Threshing | Yield of | |||||
| Area | Yield | Yield per Acre | Oats | Barley | Peas | Potatoes | |
| *Includes yield of beans. | |||||||
| acres | bushels (000) | bushels | bushels (000) | tons (000) | |||
| 1915–16 | 329,207 | 7,108 | 21.59 | 7,653 | 820 | 163* | 129 |
| 1916–17 | 218,942 | 5,083 | 23.22 | 5,371 | 759 | 243* | 134 |
| 1917–18 | 280,978 | 6,808 | 24.23 | 4,943 | 569 | 313* | 101 |
| 1918–19 | 208,030 | 6,568 | 31.57 | 6,885 | 711 | 506* | 105 |
| 1919–20 | 139,611 | 4,560 | 32.66 | 6,968 | 816 | 369* | 145 |
| 1920–21 | 219,985 | 6,872 | 31.24 | 5,225 | 1,587 | 355* | 127 |
| 1921–22 | 352,918 | 10,565 | 29.94 | 6,753 | 1,151 | 339* | 112 |
| 1922–23 | 275,775 | 8,395 | 30.44 | 5,688 | 598 | 697* | 114 |
| 1923–24 | 173,864 | 4,175 | 24.01 | 1,965 | 597 | 363* | 106 |
| 1924–25 | 166,964 | 5,448 | 32.62 | 5,707 | 798 | 411* | 122 |
| 1925–26 | 151,673 | 4,617 | 30.44 | 4,116 | 947 | 288* | 144 |
| 1926–27 | 220,083 | 7,952 | 36.13 | 4,998 | 1,243 | 455* | 117 |
| 1927–28 | 260,987 | 9,541 | 36.56 | 3,853 | 862 | 802* | 121 |
| 1928–29 | 255,312 | 8,833 | 34.60 | 3,065 | 781 | 528 | 124 |
| 1929–30 | 235,942 | 7,240 | 30.68 | 3,002 | 755 | 294 | 130 |
| 1930–31 | 249,014 | 7,579 | 30.44 | 3,377 | 838 | 241 | 152 |
| 1931–32 | 268,756 | 6,583 | 24.49 | 2,818 | 537 | 309 | 117 |
| 1932–33 | 302,531 | 11,055 | 36.54 | 5,132 | 561 | 585 | 129 |
| 1933–34 | 286,271 | 9,036 | 31.56 | 3,243 | 731 | 698 | 131 |
| 1934–35 | 225,389 | 5,933 | 26.32 | 1,980 | 485 | 437 | 109 |
| 1935–36 | 248,639 | 8,859 | 35.63 | 3,303 | 745 | 563 | 121 |
| 1936–37 | 221,790 | 7,169 | 32.32 | 3,525 | 747 | 481 | 126 |
| 1937–38 | 185,949 | 6,043 | 32.50 | 2,641 | 1,086 | 372 | 147 |
| 1938–39 | 189,281 | 5,564 | 29.40 | 2,605 | 1,077 | 387 | 88 |
| 1939–40 | 257,532 | 8,010 | 31,10 | 2,081 | 916 | 563 | 141 |
| 1940–41 | 243,197 | 8,306 | 31.15 | 3,115 | 1,066 | 742 | 94 |
| 1941–42 | 258,002 | 8,671 | 33.61 | 3,445 | 1,297 | 852 | 90 |
| 1942–43 | 286,998 | 9,819 | 34.21 | 2,809 | 1,058 | 889 | 139 |
| 1943–44 | 233,786 | 7,208 | 30.83 | 1,834 | 833 | 889 | 162 |
| 1944–45 | 183,886 | 6,992 | 38.02 | 4,209 | 1,385 | 1,038 | 126 |
| 1945–46 | 161,049 | 5,439 | 33.77 | 2,797 | 1,872 | 817 | 140 |
| 1946–47 | 141,407 | 5,368 | 37.96 | 2,686 | 2,027 | 1,231 | 116 |
| 1947–48 | 123,751 | 4,539 | 36.68 | 2,854 | 2,088 | 1,129 | 155 |
| 1948–49 | 146,707 | 5,958 | 40.61 | 3,719 | 2,256 | 1,195 | 110 |
| 1949–50 | 125,159 | 4,900 | 39.15 | 2,620 | 2,434 | 1,243 | 135 |
| 1950–51 | 144,763 | 6,272 | 43.33 | 1,828 | 1,902 | 626 | 120 |
| 1951–52 | 89,955 | 3,890 | 43.25 | 2,470 | 2,182 | 730 | 70 |
| 1952–53 | 127,225 | 4,525 | 35.57 | 2,385 | 2,140 | 614 | 95 |
| 1953–54 | 113,813 | 4,783 | 42.03 | 945 | 3,335 | 954 | 156 |
| 1954–55 | 103,989 | 4,113 | 39.56 | 1,602 | 1,992 | 885 | 144 |
| 1955–56 | 68,479 | 2,658 | 38.82 | 1,947 | 2,032 | 635 | 101 |
| 1956–57 | 65,743 | 2,950 | 44.88 | 2,888 | 2,855 | 846 | 145 |
| 1957–58 | 83,936 | 3,727 | 44.40 | 1,460 | 3,552 | 1,047 | 157 |
| 1958–59 | 132,913 | 6,039 | 45.43 | 1,576 | 2,661 | 830 | 150 |
| 1959–60 | 163,158 | 8,700 | 53.32 | 1,825 | 3,137 | 924 | 157 |
| 1960–61 | 186,788 | 9,309 | 49.84 | 2,349 | 3,416 | 931 | 190 |
| 1961–62 | 186,288 | 7,835 | 42.06 | 1,886 | 3,561 | 763 | 191 |
| 1962–63 | 225,748 | 9,156 | 40.56 | 1,029 | 4,202 | 1,001 | 181 |
| 1963–64 | 203,960 | 10,068 | 49.36 | 1,584 | 5,776 | 1,102 | 201 |
| 1964–65 | 183,969 | 9,198 | 49.99 | 2,494 | 4,670 | 878 | 243 |
| 1965–66 | 199,525 | 10,721 | 53.73 | 2,399 | 5,030 | 1,058 | 231 |
| LIVESTOCK | ||||||
|---|---|---|---|---|---|---|
| Year | Beef Cattle | Dairy Cows in Milk | Total Dairy Cattle | Total Cattle | Sheep | Pigs |
*Figure for 1916 is for all dairy cows. †Coverage to 1959 relates to holdings of 1 acre and over; thereafter to 10 acres and over. ‡Estimated. | ||||||
| (000) | (000) | (000) | (000) | (000) | (000) | |
| 1916 | .. | 750* | .. | 2,417 | 24,788 | 298 |
| 1917 | .. | 684 | .. | 2,575 | 25,270 | 284 |
| 1918 | .. | 711 | .. | 2,869 | 26,538 | 259 |
| 1919 | .. | 732 | .. | 3,035 | 25,829 | 235 |
| 1920 | .. | 783 | .. | 3,102 | 23,920 | 267 |
| 1921 | .. | 890 | .. | 3,139 | 23,285 | 350 |
| 1922 | .. | 1,015 | .. | 3,323 | 22,222 | 384 |
| 1923 | .. | 1,125 | .. | 3,481 | 23,081 | 401 |
| 1924 | 1,185 | .. | 3,563 | 23,776 | 407 | |
| 1925 | .. | 1,196 | .. | 3,504 | 24,548 | 440 |
| 1926 | .. | 1,181 | .. | 3,452 | 24,905 | 473 |
| 1927 | .. | 1,182 | .. | 3,258 | 25,649 | 520 |
| 1928 | .. | 1,243 | .. | 3,274 | 27,134 | 587 |
| 1929 | .. | 1,291 | .. | 3,446 | 29,051 | 557 |
| 1930 | .. | 1,390 | .. | 3,770 | 30,841 | 488 |
| 1931 | .. | 1,479 | .. | 4,044 | 29,793 | 469 |
| 1932 | .. | 1,562 | .. | 4,072 | 28,692 | 506 |
| 1933 | .. | 1,703 | .. | 4,155 | 27,756 | 584 |
| 1934 | .. | 1,796 | .. | 4,264 | 28,649 | 653 |
| 1935 | .. | 1,807 | .. | 4,257 | 29,077 | 755 |
| 1936 | .. | 1,803 | .. | 4,217 | 30,114 | 801 |
| 1937 | .. | 1,785 | .. | 4,352 | 31,306 | 795 |
| 1938 | .. | 1,743 | .. | 4,469 | 32,379 | 749 |
| 1939 | .. | 1,724 | .. | 4,528 | 31,879 | 676 |
| 1940 | .. | 1,719 | .. | 4,496 | 31,063 | 706 |
| 1941 | .. | 1,759 | .. | 4,539 | 31,752 | 769 |
| 1942 | .. | 1,757 | .. | 4,642 | .. | 689 |
| 1943 | .. | 1,715 | .. | 4,448 | .. | 605 |
| 1944 | .. | 1,648 | .. | 4,439 | 33,200 | 573 |
| 1945 | .. | 1,697 | .. | 4,591 | 33,975 | 594 |
| 1946 | 2,066 | 1,662 | 2,600 | 4,667 | .. | 549 |
| 1947 | 2,048 | 1,658 | 2,586 | 4,634 | 32,682 | 546 |
| 1948 | 2,078 | 1,714 | 2,638 | 4,716 | 32,483 | 548 |
| 1949 | 2,041 | 1,747 | 2,681 | 4,723 | 32,845 | 545 |
| 1950 | 2,088 | 1,850 | 2,867 | 4,955 | 33,857 | 555 |
| 1951 | 2,149 | 1,898 | 2,911 | 5,060 | 34,786 | 564 |
| 1952 | 2,282 | 1,906 | 2,883 | 5,165 | 35,384 | 566 |
| 1953 | 2,478 | 1,962 | 2,968 | 5,446 | 36,193 | 628 |
| 1954 | 2,634 | 1,999 | 3,110 | 5,745 | 38,011 | 649 |
| 1955 | 2,808 | 1,995 | 3,079 | 5,887 | 39,117 | 681 |
| 1956 | .. | .. | .. | .. | 40,255 | .. |
| 1957 | 2,861 | 1,998 | 2,948 | 5,809 | 42,382 | 602 |
| 1958 | 2,915 | 1,967 | 2,970 | 5,886 | 46,026 | 628 |
| 1959 | 2,970 | 1,931 | 3,004 | 5,973 | 46,876 | 692 |
| 1960† | 3,019 | 1,887 | 2,973 | 5,992 | 47,134 | 660 |
| 1961 | 3,334 | 1,929 | 3,111 | 6,446 | 48,462 | 655 |
| 1962 | 3,462 | 1,968 | 3,136 | 6,598 | 48,988 | 686 |
| 1963 | 3,558 | 1,997 | 3,133 | 6,691 | 50,190 | 766 |
| 1964 | 3,568 | 2,011 | 3,128 | 6,696 | 51,292 | 771 |
| 1965 | 3,628 | 2,032 | 3,174 | 6,801 | 53,748 | 716 |
| 1966 | 3,856 | 2,088 | 3,362 | 7,218 | 57,343 | 667 |
| 1967‡ | 4,236 | 2,141 | 3,531 | 7,767 | 612 | |
| TRADE | ||||||
|---|---|---|---|---|---|---|
| Year | Excluding Gold and Specie* | Gold and Specie† | ||||
| Exports | Imports (c.d.v) | Exports | Imports | |||
| Total | Per Head of Mean Population | Total | Per Head of Mean Population | |||
*Figures are in terms of New Zealand currency. †Specie exports and imports represent face value. ‡Provisional. NOTE: Gold is excluded from 1962 onwards. | ||||||
| $(m) | $ | $(m) | $ | $(m) | $(m) | |
| 1915 | 59.5 | 51.75 | 37.6 | 32.68 | 4.0 | 2.1 |
| 1916 | 64.2 | 55.83 | 45.5 | 39.62 | 2.4 | 2.6 |
| 1917 | 61.2 | 53.29 | 37.7 | 32.82 | 1.9 | 0.4 |
| 1918 | 56.9 | 49.33 | 43.9 | 38.06 | 0.2 | 0.2 |
| 1919 | 105.1 | 88.16 | 55.1 | 46.20 | 2.8 | 0.7 |
| 1920 | 91.0 | 73.28 | 111.9 | 90.07 | 1.8 | 0.1 |
| 1921 | 88.4 | 69.37 | 77.7 | 60.96 | 1.2 | 0.4 |
| 1922 | 88.4 | 64.65 | 63.3 | 48.51 | 1.1 | 0.4 |
| 1923 | 90.5 | 68.12 | 78.8 | 59.36 | 1.5 | – |
| 1924 | 103.9 | 76.82 | 88.2 | 65.22 | 1.3 | – |
| 1925 | 109.5 | 79,12 | 95.3 | 68.84 | 1.0 | 0.1 |
| 1926 | 89.5 | 63.31 | 90.6 | 64.06 | 1.0 | 0.2 |
| 1927 | 95.9 | 66.66 | 81.4 | 56.58 | 1.1 | - - |
| 1928 | 110.2 | 75.66 | 81.5 | 55.99 | 2.2 | 0.1 |
| 1929 | 108.9 | 73.91 | 88.6 | 60.12 | 2.3 | 0.1 |
| 1930 | 88.8 | 59.47 | 80.6 | 53.99 | 1.1 | 0.7 |
| 1931 | 68.7 | 45.40 | 48.2 | 31.82 | 1.6 | 0.1 |
| 1932 | 68.9 | 45.10 | 44.8 | 29.34 | 5.1 | 0.1 |
| 1933 | 79.3 | 51.52 | 46.5 | 30.21 | 3.3 | 0.9 |
| 1934 | 92.0 | 59.28 | 57.0 | 36.72 | 7.3 | 2.5 |
| 1935 | 90.2 | 57.72 | 66.0 | 42.26 | 3.4 | 0.8 |
| 1936 | 110.7 | 70.28 | 80.5 | 71.08 | 2.9 | 0.1 |
| 1937 | 130.5 | 82.11 | 102.1 | 64.22 | 2.9 | 0.6 |
| 1938 | 114.2 | 71.04 | 100.8 | 62.71 | 2.7 | 0.1 |
| 1939 | 112.8 | 69.29 | 89.8 | 55.12 | 3.3 | 0.1 |
| 1940 | 143.6 | 87.70 | 89.1 | 54.41 | 3.9 | 0.1 |
| 1941 | 131.3 | 80.50 | 89.4 | 54.81 | 3.7 | 0.4 |
| 1942 | 159.1 | 97.05 | 97.9 | 59.72 | 3.5 | 0.3 |
| 1943 | 140.6 | 85.98 | 173.2 | 105.87 | 3.1 | 0.9 |
| 1944 | 152.7 | 92.24 | 157.1 | 94.87 | 2.8 | 0.3 |
| 1945 | 160.7 | 94.85 | 100.1 | 59.09 | 2.5 | 0.4 |
| 1946 | 200.2 | 113.80 | 130.1 | 73.95 | 2.4 | 0.9 |
| 1947 | 256.8 | 142.78 | 233.9 | 130.06 | 2.1 | 0.3 |
| 1948 | 294.4 | 160.48 | 233.7 | 127.37 | 1.3 | 1.3 |
| 1949 | 293.3 | 156.72 | 218.2 | 116.59 | 2.4 | 2.1 |
| 1950 | 364.9 | 191.12 | 287.1 | 150.41 | 3.7 | 0.4 |
| 1951 | 494.6 | 253.95 | 375.5 | 192.80 | 2.2 | 0.5 |
| 1952 | 479.5 | 240.22 | 458.9 | 229.88 | 1.7 | 0.2 |
| 1953 | 470.7 | 229.74 | 327.2 | 159.70 | 1.0 | 0.2 |
| 1954 | 488.0 | 232.92 | 426.3 | 203.48 | 1.0 | 0.1 |
| 1955 | 518.1 | 242.20 | 501.3 | 234.37 | 0.6 | 0.1 |
| 1956 | 554.5 | 254.02 | 469.5 | 215.51 | 0.5 | 0.1 |
| 1957 | 552.5 | 247.48 | 523.4 | 234.42 | 0.7 | 0.2 |
| 1958 | 499.9 | 218.68 | 505.5 | 221.14 | 0.8 | 0.3 |
| 1959 | 586.6 | 251.26 | 410.1 | 175.61 | 0.8 | 0.2 |
| 1960 | 604.6 | 254.35 | 506.2 | 212.94 | 0.7 | 0.4 |
| 1961 | 567.4 | 233.76 | 576.4 | 237.48 | 0.6 | 0.6 |
| Jan-Jun 1962 | 332.6 | 134.32 | 237.4 | 95.88 | 0.2 | 0.1 |
| Year ended June | ||||||
| 1963 | 627.5 | 249.42 | 523.7 | 208.16 | 0.5 | 0.4 |
| 1964 | 737.3 | 286.72 | 637.4 | 247.88 | 0.2 | 0.2 |
| 1965x | 742.2 | 282.95 | 662.7 | 252.64 | 0.2 | 0.4 |
| 1966‡ | 761.3 | 285.44 | 729.6 | 273.56 | 0.1 | 0.6 |
| Year | Exports of New Zealand Produce | |||||
|---|---|---|---|---|---|---|
| Wool | Frozen Meat* | Tallow | ||||
| Quantity | Value | Quantity | Value | Quantity | Value | |
*Includes exports of chilled beef and sausages. †Provisional. | ||||||
| Ib(m) | $(m) | tons | $(m) | tons | $(m) | |
| 1915 | 197 | 20.8 | 197,563 | 15.6 | 26,763 | 1.6 |
| 1916 | 186 | 24.8 | 166,302 | 14.5 | 22,472 | 1.6 |
| 1917 | 178 | 24.4 | 122,347 | 12.0 | 12,599 | 1.1 |
| 1918 | 109 | 15.1 | 101,845 | 9.8 | 16,421 | 1.7 |
| 1919 | 274 | 39.1 | 191,134 | 19.3 | 46,874 | 5.4 |
| 1920 | 162 | 23.7 | 231,464 | 23.3 | 27,041 | 3.5 |
| 1921 | 159 | 10.4 | 216,138 | 22.3 | 27,712 | 1.7 |
| 1922 | 322 | 23.3 | 175,900 | 16.8 | 26,495 | 1.5 |
| 1923 | 218 | 21.8 | 152,196 | 18.0 | 25,243 | 1.6 |
| 1924 | 206 | 30.5 | 160,679 | 19.0 | 23,988 | 1.6 |
| 1925 | 206 | 35.5 | 170,710 | 22.3 | 25,038 | 1.8 |
| 1926 | 213 | 23.7 | 151,718 | 17.3 | 21,128 | 1.5 |
| 1927 | 221 | 25.9 | 168,248 | 18.2 | 23,875 | 1.4 |
| 1928 | 227 | 33.4 | 189,691 | 20.6 | 25,748 | 1.6 |
| 1929 | 235 | 30.7 | 166,810 | 19.8 | 20,832 | 1.4 |
| 1930 | 197 | 15.3 | 201,832 | 21.4 | 24,628 | 1.4 |
| 1931 | 212 | 11.0 | 206,940 | 17.8 | 23,264 | 0.8 |
| 1932 | 238 | 11.5 | 232,274 | 16.9 | 25,377 | 0.9 |
| 1933 | 286 | 14.8 | 260,156 | 19.7 | 28,020 | 1.0 |
| 1934 | 256 | 25.0 | 248,472 | 23.8 | 27,662 | 1.0 |
| 1935 | 223 | 14.2 | 260,326 | 25.5 | 25,277 | 1.3 |
| 1936 | 314 | 26.6 | 255,990 | 24.5 | 26,095 | 1.3 |
| 1937 | 282 | 38.1 | 270,546 | 29.4 | 25,940 | 1.3 |
| 1938 | 271 | 24.4 | 268,665 | 30.2 | 29,613 | 1.1 |
| 1939 | 277 | 23.3 | 295,313 | 30.8 | 29,137 | 0.9 |
| 1940 | 300 | 33.8 | 348,831 | 39.4 | 34,138 | 1.4 |
| 1941 | 216 | 25.2 | 264,242 | 33.2 | 39,328 | 1.6 |
| 1942 | 308 | 36.7 | 287,069 | 35.6 | 51,779 | 2.3 |
| 1943 | 207 | 27.0 | 220,633 | 27.6 | 43,955 | 2.1 |
| 1944 | 189 | 25.4 | 207,803 | 25.0 | 26,624 | 1.2 |
| 1945 | 166 | 25.4 | 282,692 | 35.2 | 30,726 | 1.8 |
| 1946 | 365 | 53.2 | 337,669 | 46.5 | 24,756 | 2.1 |
| 1947 | 375 | 63.9 | 347,781 | 58.7 | 25,725 | 4.7 |
| 1948 | 421 | 89.0 | 343,496 | 57.2 | 20,063 | 4.3 |
| 1949 | 430 | 93.1 | 344,103 | 54.4 | 25,432 | 5.2 |
| 1950 | 394 | 149.3 | 338,084 | 57.2 | 29,596 | 4.3 |
| 1951 | 317 | 256.4 | 274,801 | 50.7 | 29,848 | 5.1 |
| 1952 | 438 | 164.0 | 385,561 | 78.8 | 48,951 | 9.4 |
| 1953 | 392 | 169.2 | 326,688 | 78.8 | 40,153 | 3.9 |
| 1954 | 393 | 176.9 | 370,792 | 100.5 | 39,112 | 5.1 |
| 1955 | 418 | 187.9 | 378,178 | 121.2 | 43,434 | 5.7 |
| 1956 | 428 | 183.1 | 414,152 | 127.7 | 39,618 | 5.3 |
| 1957 | 432 | 212.1 | 388,446 | 128.1 | 46,207 | 6.1 |
| 1958 | 457 | 160.1 | 405,401 | 146.9 | 51,260 | 6.8 |
| 1959 | 529 | 179.5 | 434,739 | 142.4 | 53,559 | 6.6 |
| 1960 | 522 | 205.0 | 467,145 | 152.3 | 59,468 | 5.9 |
| 1961 | 555 | 200.7 | 460,685 | 144.2 | 57,723 | 6.3 |
| Jan–Jun | ||||||
| 1962 | 359 | 127.5 | 277,749 | 80.6 | 36,056 | 3.1 |
| 1962–63 | 577 | 214.4 | 508,488 | 169.7 | 59,008 | 4.8 |
| 1963–64 | 565 | 271.4 | 514,762 | 180.2 | 75,625 | 7.2 |
| 1964–65x | 531 | 208.6 | 511,758 | 208.6 | 57,052 | 7.0 |
| 1965–66† | 611 | 231.3 | 490,889 | 191.6 | 48,612 | 6.5 |
| Year | Exports of New Zealand Produce | |||||
|---|---|---|---|---|---|---|
| Butter | Cheese | Pulp and Newsprint | ||||
| Quantity | Value | Quantity | Value | Quantity | Value | |
*Provisional. | ||||||
| tons | $(m) | tons | $(m) | tons(000) | $(m) | |
| 1915 | 21,007 | 5.4 | 40,863 | 5.5 | – | – |
| 1916 | 17,932 | 5.3 | 47,471 | 7.0 | – | – |
| 1917 | 12,720 | 4.1 | 44,287 | 7.9 | – | – |
| 1918 | 21,551 | 6.8 | 44,172 | 8.2 | – | – |
| 1919 | 17,291 | 6.2 | 78,616 | 15.6 | – | – |
| 1920 | 15,600 | 6.0 | 61,103 | 12.3 | – | – |
| 1921 | 44,924 | 22.3 | 68,439 | 16.4 | – | – |
| 1922 | 56,010 | 18.1 | 58,060 | 9.4 | – | – |
| 1923 | 62,507 | 21.4 | 72,073 | 13.7 | – | – |
| 1924 | 63,473 | 23.3 | 79,724 | 14.0 | – | – |
| 1925 | 62,266 | 20.5 | 68,838 | 11.6 | – | – |
| 1926 | 58,402 | 17.4 | 73,077 | 11.9 | – | – |
| 1927 | 72,777 | 21.8 | 74,640 | 11.2 | – | – |
| 1928 | 72,479 | 22.6 | 78,364 | 13.4 | – | – |
| 1929 | 82,690 | 26.5 | 88,955 | 14.0 | – | – |
| 1930 | 94,212 | 23.7 | 90,649 | 12.9 | – | – |
| 1931 | 99,428 | 21.3 | 81,817 | 8.9 | – | – |
| 1932 | 109,277 | 21.3 | 89,522 | 9.9 | – | – |
| 1933 | 131,762 | 23.3 | 99,147 | 9.5 | – | – |
| 1934 | 130,726 | 20.1 | 99.225 | 9.4 | – | – |
| 1935 | 139,465 | 27.2 | 86,378 | 8.8 | – | – |
| 1936 | 139,807 | 30.6 | 82,910 | 10.2 | – | – |
| 1937 | 148,804 | 34.0 | 82,358 | 10.7 | – | – |
| 1938 | 130,727 | 30.0 | 80,526 | 11.9 | – | – |
| 1939 | 122,165 | 32.2 | 83,863 | 11.7 | – | – |
| 1940 | 131,135 | 36.5 | 101,675 | 16.5 | – | – |
| 1941 | 113,157 | 31.6 | 118,312 | 19.7 | – | – |
| 1942 | 117,231 | 33.9 | 134,381 | 23.7 | – | – |
| 1943 | 99,259 | 29.4 | 100,497 | 18.3 | – | – |
| 1944 | 115,340 | 37.1 | 77,703 | 14.9 | – | – |
| 1945 | 103,477 | 38.6 | 87,426 | 19.0 | – | – |
| 1946 | 101,794 | 39.7 | 75,746 | 16.9 | – | – |
| 1947 | 127,708 | 57.7 | 87,044 | 23.2 | – | – |
| 1948 | 135,634 | 67.5 | 75,623 | 22.4 | – | – |
| 1949 | 147,670 | 70.9 | 93,938 | 25.3 | – | – |
| 1950 | 138,267 | 71.7 | 99,890 | 29.1 | – | – |
| 1951 | 147,964 | 83.0 | 106,619 | 33.3 | – | – |
| 1952 | 184,028 | 112.3 | 91,255 | 31.1 | – | – |
| 1953 | 159,106 | 102.9 | 101,360 | 36.7 | 4 | 0.4 |
| 1954 | 132,481 | 89.6 | 90,396 | 32.8 | 20 | 1.6 |
| 1955 | 150,965 | 102.0 | 85,042 | 27.4 | 31 | 2.3 |
| 1956 | 167,449 | 106.3 | 88,877 | 44.5 | 73 | 7.1 |
| 1957 | 145,075 | 76.9 | 88,476 | 35.8 | 101 | 9.6 |
| 1958 | 175,392 | 77.7 | 89,428 | 24.8 | 111 | 10.7 |
| 1959 | 192,978 | 111.6 | 83,452 | 44.2 | 121 | 11.3 |
| 1960 | 157,051 | 100.3 | 79,413 | 37.1 | 119 | 11.8 |
| 1961 | 165,040 | 78.8 | 87,607 | 39.8 | 110 | 10.4 |
| 1962 | ||||||
| Jan-Jun | 84,718 | 41.5 | 52,153 | 21.3 | 54 | 5.0 |
| 1962–63 | 164,585 | 90.9 | 92,209 | 37.0 | 141 | 13.5 |
| 1963–64 | 181,955 | 109.6 | 87,594 | 35.1 | 173 | 17.0 |
| 1964–65x | 189,144 | 119.6 | 93,249 | 40.7 | 167 | 16.7 |
| 1965–66* | 189,351 | 109.0 | 95,028 | 41.1 | 187 | 17.9 |
| Year | Exports of New Zealand Produce | |||||
|---|---|---|---|---|---|---|
| Apples and Pears | Grass and Clover Seeds | Milk and Cream (Dried and Condensed etc.) | ||||
| Quantity | Value | Quantity | Value | Quantity | Value | |
*Provisional. †Whole fruit only. | ||||||
| Ib(000) | $(m) | cwt | $(000) | tons | $(000) | |
| 1915 | 2,459 | 0.04 | 13,980 | 0.1 | 525 | – |
| 1916 | 364 | 0.02 | 9,841 | 0.1 | 439 | – |
| 1917 | 7 | – | 16,484 | 0.1 | 1,832 | 0.3 |
| 1918 | 12 | – | 15,995 | 0.1 | 3,153 | 0.7 |
| 1919 | 13 | – | 49,906 | 0.5 | 4,685 | 1.2 |
| 1920 | 1,405 | – | 23,821 | 0.3 | 6,228 | 1.6 |
| 1921 | 2,042 | 0.05 | 37,319 | 0.3 | 8,302 | 2.2 |
| 1922 | 4,741 | 0.1 | 70,120 | 0.6 | 5,099 | 1.1 |
| 1923 | 5,954 | 0.1 | 47,031 | 0.4 | 7,242 | 1.0 |
| 1924 | 9,784 | 0.2 | 36,331 | 0.3 | 6,018 | 1.0 |
| 1925 | 8,787 | 0.1 | 45,368 | 0.3 | 6,135 | 0.9 |
| 1926 | 29,350 | 0.7 | 57,726 | 0.4 | 5,056 | 0.7 |
| 1927 | 21,841 | 0.5 | 90.362 | 0.5 | 5,545 | 0.7 |
| 1928 | 40,618 | 1.0 | 50,238 | 0.3 | 7,687 | 0.8 |
| 1929 | 40,343 | 1.2 | 57,869 | 0.4 | 6,132 | 0.7 |
| 1930 | 53,091 | 1.3 | 36,560 | 0.3 | 6,786 | 0.7 |
| 1931 | 53,607 | 1.3 | 40,953 | 0.3 | 5,735 | 0.5 |
| 1932 | 63,222 | 1.6 | 34,337 | 0.2 | 7,158 | 0.5 |
| 1933 | 57,537 | 1.4 | 80,308 | 0.3 | 7,875 | 0.6 |
| 1934 | 62,679 | 1.6 | 48.751 | 0.3 | 9,626 | 0.8 |
| 1935 | 41,578 | 1.0 | 71,649 | 0.4 | 9,278 | 0.7 |
| 1936 | 49,337 | 1.2 | 79,982 | 0.5 | 10,599 | 0.8 |
| 1937 | 37,720 | 0.9 | 58,107 | 0.4 | 11,033 | 0.7 |
| 1938 | 61,847 | 1.5 | 45,484 | 0.5 | 9.168 | 0.6 |
| 1939 | 4.1,906 | 1.1 | 45.829 | 0.6 | 10,958 | 0.8 |
| 1940 | 23,709 | 0.5 | 45,742 | 0.7 | 10,464 | 0.8 |
| 1941 | 425 | – | 88,191 | 1.1 | 13,233 | 1.4 |
| 1942 | 327 | – | 82,499 | 1.2 | 12,315 | 1.4 |
| 1943 | 185 | – | 90,720 | 1.3 | 10,353 | 1.2 |
| 1944 | 20 | – | 158,475 | 2.9 | 8,228 | 1.1 |
| 1945 | 159 | – | 166,553 | 3.6 | 15,105 | 2.0 |
| 1946 | 12,159 | 0.3 | 150,598 | 3.9 | 16,995 | 2.4 |
| 1947 | 239 | – | 147,011 | 3.3 | 19,981 | 3.3 |
| 1948 | 40,204 | 1.7 | 174,843 | 3.4 | 26,540 | 4.4 |
| 1949 | 21,364 | 0.8 | 161,993 | 3.0 | 34,390 | 5.7 |
| 1950 | 28,603 | 1.4 | 164,114 | 4.2 | 40,632 | 6.6 |
| 1951 | 27,944 | 1.4 | 88,428 | 2.5 | 46,713 | 7.9 |
| 1952 | 55,269 | 4.1 | 163,452 | 4.2 | 62,732 | 13.1 |
| 1953 | 46,122 | 3.4 | 179,267 | 3.7 | 62,990 | 12.6 |
| 1954 | 49,693 | 3.1 | 3.84,253 | 5.6 | 45,223 | 8.2 |
| 1955 | 41,639 | 2.6 | 79,398 | 2.7 | 50,925 | 7.2 |
| 1956 | 64,486 | 4.1 | 146,403 | 3.2 | 52,080 | 8.8 |
| 1957 | 57,389 | 3.6 | 162,552 | 2.4 | 67.711 | 11.5 |
| 1958 | 73,137 | 4.6 | 143,230 | 3.0 | 89,428 | 7.6 |
| 1959 | 76,754 | 4.8 | 91,221 | 2.0 | 70,379 | 11.5 |
| 1960 | 76,806 | 4.8 | 128,458 | 3.4 | 60,319 | 11.1 |
| 1961 | 81,840 | 4.8 | 132,921 | 2.6 | 50,457 | 8.4 |
| Jan-Jun | ||||||
| 1962 | 89,851 | 5.6 | 60,061 | 1.2 | 30,241 | 4.4 |
| 1962–63 | 74,482 | 4.7 | 163,526 | 3.6 | 63,350 | 9.5 |
| 1963–64 | 84,987x | 5.3 | 182,244 | 3.5 | 72,603 | 11.0 |
| 1964–65x | 97,149 | 6.1 | 91,216 | 2.0 | 86,659 | 18.9 |
| 1965–66* | 110,511 | 6.9 | 202,654 | 3.2 | 97,022 | 21.3 |
| Year | Exports of New Zealand Produce | |||||
|---|---|---|---|---|---|---|
| Cattle Hides and Calf Skins | Sheep Skins | |||||
| Cattle Hides | Calf Skins | Aggregate Value | With Wool | Without Wool | Aggregate Value | |
| *Provisional. | ||||||
| (thousands) | $(m) | (thousands) | $(m) | |||
| 1915 | 270 | 234 | 1.1 | 499 | 8,595 | 1.7 |
| 1916 | 297 | 206 | 1.3 | 398 | 7,938 | 1.8 |
| 1917 | 177 | 51 | 0.9 | 3 | 6,525 | 2.6 |
| 1918 | 207 | 106 | 1.1 | – | 8,742 | 3.6 |
| 1919 | 319 | 107 | 1.9 | – | 8,502 | 3.4 |
| 1920 | 285 | 251 | 2.3 | – | 9,222 | 6.1 |
| 1921 | 329 | 441 | 1.1 | 86 | 8,351 | 1.9 |
| 1922 | 240 | 465 | 1.0 | 645 | 9,500 | 2.0 |
| 1923 | 340 | 609 | 1.5 | 706 | 7,541 | 2.2 |
| 1924 | 470 | 707 | 1.7 | 689 | 8,136 | 3.0 |
| 1925 | 496 | 702 | 1.9 | 471 | 8,224 | 4.0 |
| 1926 | 449 | 751 | 1.5 | 707 | 8,525 | 3.1 |
| 1927 | 398 | 774 | 1.8 | 973 | 8,946 | 3.1 |
| 1928 | 432 | 770 | 2.5 | 1,365 | 8,817 | 3.8 |
| 1929 | 291 | 668 | 1.4 | 1,072 | 8,560 | 3.6 |
| 1930 | 291 | 657 | 1.0 | 1,542 | 9,478 | 3.0 |
| 1931 | 309 | 653 | 0.7 | 1,666 | 10,420 | 1.6 |
| 1932 | 304 | 846 | 0.6 | 1,641 | 11,999 | 1.4 |
| 1933 | 401 | 891 | 1.1 | 3,380 | 11,814 | 2.8 |
| 1934 | 476 | 1,110 | 1.3 | 2,950 | 9,244 | 2.5 |
| 1935 | 522 | 1,266 | 1.4 | 2,405 | 11,765 | 2.6 |
| 1936 | 431 | 1,178 | 1.5 | 1,780 | 10,847 | 3.4 |
| 1937 | 506 | 1,163 | 2.1 | 1,744 | 10,759 | 4.5 |
| 1938 | 516 | 1,247 | 1.5 | 1,824 | 12,354 | 2.7 |
| 1939 | 528 | 1,103 | 1.6 | 1,933 | 13,224 | 2.9 |
| 1940 | 520 | 1,032 | 1.7 | 1,799 | 11,340 | 3.9 |
| 1941 | 385 | 1,016 | 2.0 | 770 | 17,744 | 4.0 |
| 1942 | 357 | 931 | 2.1 | 1,013 | 14,590 | 5.6 |
| 1943 | 418 | 944 | 2.3 | 777 | 14,000 | 4.5 |
| 1944 | 305 | 888 | 1.8 | 815 | 14,425 | 4.8 |
| 1945 | 329 | 795 | 2.1 | 905 | 14,324 | 4.8 |
| 1946 | 392 | 660 | 3.0 | 784 | 14,694 | 5.0 |
| 1947 | 473 | 757 | 5.8 | 1,416 | 15,624 | 12.0 |
| 1948 | 476 | 666 | 5.8 | 869 | 16,289 | 11.3 |
| 1949 | 328 | 1,122 | 4,7 | 795 | 16,620 | 7.7 |
| 1950 | 363 | 870 | 5.2 | 670 | 16,791 | 13.5 |
| 1951 | 336 | 977 | 6.0 | 719 | 13,986 | 18.1 |
| 1952 | 533 | 1,578 | 6.5 | 1,100 | 18,992 | 12.8 |
| 1953 | 400 | 961 | 4.8 | 1,254 | 17,032 | 15.9 |
| 1954 | 503 | 1,129 | 5.2 | 1,068 | 17,831 | 15.3 |
| 1955 | 654 | 1,304 | 5.6 | 1,064 | 19,249 | 12.2 |
| 1956 | 837 | 1,117 | 5.9 | 1,088 | 19,271 | 14.6 |
| 1957 | 906 | 1,280 | 6.5 | 1,066 | 18,745 | 13.3 |
| 1958 | 904 | 1,015 | 5.8 | 915 | 19,679 | 10.2 |
| 1959 | 880 | 963 | 8.9 | 1,250 | 24,618 | 16.9 |
| 1960 | 813 | 1,029 | 6.8 | 1,238 | 25,991 | 19.1 |
| 1961 | 797 | 785 | 5.8 | 1,240 | 26,069 | 18.0 |
| Jan-Jun | ||||||
| 1962 | 438 | 289 | 2.8 | 578 | 19,470 | 12.2 |
| 1962–63 | 1,141 | 1,030 | 7.0 | 1,350 | 27,453 | 16.9 |
| 1963–64 | 1,014 | 1,173 | 5.5 | 1,421 | 29,945 | 23.7 |
| 1964–65x | 1,059 | 1.091 | 6.5 | 1,267 | 27,296 | 24.5 |
| 1965–66* | 954 | 958 | 7.8 | 1,292 | 26,226 | 31.2 |
| PRODUCTION | ||||||||
|---|---|---|---|---|---|---|---|---|
| Season | Wool Production | Butterfat Production | Timber Production | Meat Production | ||||
| Total Production (Greasy Basis) | Average Price per Pound (Greasy Wool) | Total Value | Total Production | Yield per Cow in Milk | Average Payout per Pound† | |||
*Provisional. †Butterfat for butter and cheese making. Excludes payment for butterfat in milk and cream consumed as such. | ||||||||
| lb(m) | c | $(m) | lb(m) | lb | c | bd.ft.(m) | ton(000) | |
| 1918–19 | 241 | 12.50 | 30.2 | 124 | 170 | .. | .. | .. |
| 1919–20 | 229 | 12.50 | 28.6 | 136 | 174 | 17.50 | 301 | .. |
| 1920–21 | 217 | 5.83 | 12.6 | 155 | 174 | 23.33 | 308 | .. |
| 1921–22 | 210 | 6.67 | 14.0 | 199 | 196 | 12.08 | 315 | .. |
| 1922–23 | 209 | 9.04 | 18.8 | 226 | 201 | 14.17 | 304 | .. |
| 1923–24 | 216 | 13.15 | 28.4 | 229 | 193 | 12.92 | 317 | .. |
| 1924–25 | 223 | 16.84 | 37.6 | 241 | 202 | 14.17 | 344 | .. |
| 1925–26 | 228 | 9.94 | 22.6 | 234 | 198 | 15.00 | 353 | .. |
| 1926–27 | 241 | 10.58 | 25.6 | 259 | 219 | 12.92 | 306 | .. |
| 1927–28 | 253 | 13.89 | 35.2 | 264 | 213 | 15.00 | 270 | .. |
| 1928–29 | 263 | 12.40 | 32.6 | 289 | 224 | 15.42 | 270 | .. |
| 1929–30 | 262 | 7.12 | 18.6 | 314 | 226 | 13.33 | 282 | .. |
| 1930–31 | 259 | 4.72 | 12.2 | 322 | 215 | 9.58 | 229 | .. |
| 1931–32 | 270 | 4.38 | 11.8 | 340 | 215 | 9.17 | 154 | .. |
| 1932–33 | 277 | 4.29 | 11.8 | 397 | 230 | 7.50 | 166 | .. |
| 1933–34 | 290 | 9.22 | 26.8 | 427 | 235 | 7.50 | 198 | .. |
| 1934–35 | 265 | 5.45 | 14.4 | 410 | 224 | 7.92 | 244 | .. |
| 1935–36 | 304 | 7.61 | 23.2 | 437 | 240 | 10.42 | 293 | .. |
| 1936–37 | 303 | 13.09 | 39.6 | 458 | 254 | 11.42 | 306 | .. |
| 1937–38 | 297 | 8.37 | 24.8 | 435 | 247 | 12.67 | 323 | .. |
| 1938–39 | 328 | 7.64 | 25.0 | 400 | 229 | 13.75 | 317 | .. |
| 1939–40 | 310 | 10.71 | 31.6 | 431 | 247 | 13.92 | 336 | .. |
| 1940–41 | 331 | 10.72 | 33.8 | 466 | 262 | 13.92 | 342 | .. |
| 1941–42 | 345 | 10.73 | 35.2 | 437 | 246 | 14.00 | 324 | .. |
| 1942–43 | 340 | 12.15 | 39.4 | 407 | 234 | 14.25 | 342 | .. |
| 1943–44 | 330 | 12.17 | 38.4 | 387 | 232 | 15.17 | 351 | .. |
| 1944–45 | 372 | 12.17 | 43.2 | 432 | 254 | 16.92 | 340 | .. |
| 1945–46 | 365 | 12.09 | 42.4 | 373 | 221 | 17.67 | 345 | 541 |
| 1946–47 | 367 | 14.86 | 55.0 | 408 | 243 | 19.75 | 354 | 560 |
| 1947–48 | 362 | 20.92 | 75.8 | 41.8 | 241 | 22.17 | 431 | 549 |
| 1948–49 | 367 | 21.51 | 79.0 | 457 | 259 | 23.17 | 470 | 556 |
| 1949–50 | 390 | 31.65 | 123.4 | 470 | 251 | 24.33 | 478 | 577 |
| 1950–51 | 390 | 73.20 | 285.4 | 494 | 258 | 25.83 | 528 | 530 |
| 1951–52 | 407 | 33.49 | 136.4 | 501 | 262 | 28.83 | 575 | 602 |
| 1952–53 | 418 | 38.49 | 160.8 | 535 | 273 | 31.00 | 575 | 578 |
| 1953–54 | 426 | 41.87 | 178.4 | 497 | 251 | 32.42 | 574 | 589 |
| 1954–55 | 455 | 41.39 | 188.4 | 507 | 256 | 31.83 | 616 | 637 |
| 1955–56 | 462 | 38.49 | 177.8 | 530 | 269 | 31.67 | 626 | 682 |
| 1956–57 | 491 | 45.63 | 224.0 | 524 | 266 | 31.75 | 597 | 670 |
| 1957–58 | 496 | 34.30 | 170.2 | 558 | 285 | 30.75 | 597 | 688 |
| 1958–59 | 540 | 30.06 | 162.4 | 557 | 293 | 27.33 | 637 | 731 |
| 1959–60 | 577 | 37.21 | 214.6 | 547 | 288 | 31.50 | 694 | 773 |
| 1960–61 | 588 | 33.62 | 197.6 | 557 | 287 | 27.92 | 714 | 758 |
| 1961–62 | 587 | 32.65 | 191.6 | 555 | 280 | 27.58 | 693 | 821 |
| 1962–63 | 620 | 35.70 | 221.4 | 567* | 282* | 27.42 | 643 | 828 |
| 1963–64 | 617 | 45.89 | 283.0 | 590* | 292* | 29.16 | 666 | 852 |
| 1964–65 | 623 | 35.12 | 218.8 | 623* | 305* | 30.67 | 736 | 823 |
| 1965–66 | 695 | 34.69 | 241.0 | 646* | 308* | 30.00* | 757 | 830 |
| FACTORY PRODUCTION | |||||||||
|---|---|---|---|---|---|---|---|---|---|
| Year | Establishments | Persons* Engaged | Salaries* and Wages Paid | Cost of Materials | Other Expenses of Production | Value of Production | Added Value | Net Output (Net Value Added) | Value of Land and Buildings, Plant and Machinery |
*For the year 1915–16 and earlier years, figures refer to productive employees only. †Estimates based on results of sample survey carried out during that year. | |||||||||
| No | No | $(million) | |||||||
| 1880–81 | 1,430 | 13,922 | .. | .. | .. | .. | .. | .. | 5.4 |
| 1885–86 | 1,833 | 19,653 | .. | .. | .. | 12.9 | .. | .. | 8.1 |
| 1890–91 | 2,152 | 23,761 | 3.3 | .. | .. | 17.1 | .. | .. | 8.7 |
| 1895–96 | 2,361 | 25,397 | 3.5 | 7.1 | .. | 18.5 | 11.4 | .. | 9.6 |
| 1900–01 | 3,059 | 38,651 | 5.6 | 15.4 | .. | 33.0 | 17.5 | .. | 13.1 |
| 1905–06 | 3,381 | 45,198 | 7.2 | 26.6 | .. | 43.2 | 16.6 | .. | 19.1 |
| 1910–11 | 3,421 | 42,142 | 8.7 | 37.5 | .. | 57.1 | 19.7 | .. | 24.0 |
| 1915–16 | 3,657 | 44,673 | 10.6 | 59.7 | .. | 83.8 | 24.1 | .. | 31.6 |
| 1920–21 | 3,894 | 62,972 | 23.5 | 106.0 | .. | 151.0 | 45.0 | .. | 51.4 |
| 1925–26 | 4,643 | 70,212 | 28.3 | 102.6 | 14.5 | 157.0 | 54.3 | .. | 64.8 |
| 1930–31 | 5,047 | 70,625 | 27.8 | 90.6 | 16.9 | 143.4 | 52.8 | 37.0 | 69.0 |
| 1931–32 | 4,823 | 62,335 | 22.4 | 77.7 | 15.3 | 121.5 | 43.8 | 29.5 | 65.8 |
| 1932–33 | 4,847 | 62,583 | 21.3 | 77.9 | 15.0 | 120.3 | 42.4 | 28.4 | 65.9 |
| 1933–34 | 4,883 | 65,961 | 21.5 | 87.0 | 15.1 | 131.8 | 44.8 | 30.7 | 63.9 |
| 1934–35 | 5,126 | 72,095 | 23.4 | 97.7 | 16.3 | 146.6 | 49.0 | 33.7 | 64.8 |
| 1935–36 | 5,391 | 78,701 | 26.2 | 113.7 | 17.3 | 167.5 | 53.8 | 37.5 | 66.4 |
| 1936–37 | 5,584 | 87,822 | 32.6 | 135.0 | 19.6 | 198.8 | 63.8 | 45.3 | 68.8 |
| 1937–38 | 5,780 | 93,534 | 37.4 | 143.5 | 19.6 | 213.0 | 69.5 | 51.0 | 72.6 |
| 1938–39 | 6,002 | 93,638 | 39.9 | 142.3 | 18.6 | 213.2 | 70.9 | 53.4 | 77.2 |
| 1939–40 | 6,198 | 99,349 | 43.8 | 160.4 | 20.7 | 240.6 | 80.2 | 60.8 | 82.0 |
| 1940–41 | 6,252 | 104,784 | 48.6 | 186.0 | 22.4 | 274.8 | 88.8 | 67.7 | 84.3 |
| 1941–42 | 6,225 | 108,275 | 53.6 | 193.0 | 24.1 | 291.2 | 98.3 | 75.6 | 87.5 |
| 1942–43 | 5,985 | 106,179 | 58.9 | 203.8 | 25.1 | 311.6 | 107.8 | 84.0 | 89.3 |
| 1943–44 | 6,062 | 109,221 | 62.8 | 214.1 | 27.3 | 329.7 | 115.6 | 89.8 | 92.0 |
| 1944–45 | 6,340 | 113,534 | 68.4 | 233.0 | 29.1 | 357.2 | 124.2 | 96.6 | 97.5 |
| 1945–46 | 6,847 | 118,886 | 75.8 | 234.1 | 30.6 | 367.1 | 132.9 | 103.9 | 103.6 |
| 1946–47 | 7,498 | 124,925 | 83.0 | 262.7 | 34.6 | 411.3 | 148.6 | 115.8 | 111.6 |
| 1947–48 | 7,822 | 130,504 | 95.9 | 349.7 | 40.2 | 518.4 | 168.7 | 130.5 | 126.6 |
| 1948–49† | 7,852 | 132,427 | 102.8 | 390.1 | 43.9 | 572.8 | 182.7 | 141.1 | 147.2 |
| 1949–50 | 7,815 | 133,245 | 112.5 | 430.0 | 48.3 | 634.7 | 204.7 | 158.8 | 156.0 |
| 1950–51 | 8,113 | 138,435 | 130.0 | 533.8 | 57.7 | 760.4 | 226.6 | 171.6 | 175.2 |
| 1951–52 | 8,546 | 144,352 | 150.1 | 581.5 | 64.0 | 862.0 | 280.5 | 219.7 | 195.0 |
| 1952–53 | 8,511 | 143,164 | 157.0 | 637.9 | 70.5 | 927.9 | 290.1 | 222.9 | 218.2 |
| 1953–54 | 8,377 | 146,488 | 173.2 | 665.7 | 80.5 | 990.4 | 324.8 | 247.8 | 244.5 |
| 1954–55 | 8,366 | 153,575 | 196.8 | 730.6 | 95.7 | 1,101.2 | 370.6 | 278.6 | 276.5 |
| 1955–56 | 8,515 | 158,238 | 215.9 | 769.6 | 113.1 | 1,171.9 | 402.3 | 294.4 | 337.1 |
| 1956–57 | 8,488 | 156,752 | 221.9 | 790.0 | 119.8 | 1,204.1 | 414.1 | 300.4 | 360.2 |
| 1957–58 | 8,529 | 162,985 | 240.0 | 835.8 | 132.1 | 1,289.9 | 454.0 | 328.3 | 378.6 |
| 1958–59 | 8,565 | 168,742 | 256.6 | 837.3 | 140.6 | 1,318.9 | 481.6 | 347.7 | 411.8 |
| 1959–60 | 8,550 | 171,973 | 272.4 | 878.2 | 145.7 | 1,411.2 | 533.1 | 394.0 | 448.5 |
| 1960–61 | 8,745 | 181,346 | 301.2 | 939.4 | 158.0 | 1,513.6 | 574.2 | 423.4 | 498.6 |
| 1961–62 | 8,981 | 187,579 | 323.1 | 977.0 | 173.6 | 1,613.1 | 636.0 | 471.0 | 561.1 |
| 1962–63 | 9,034 | 191,515 | 339.9 | 1,005.8 | 190.3 | 1,681.2 | 675.5 | 495.9 | 634.7 |
| 1963–64 | 9,365 | 199,265 | 368.6 | 1,160.7 | 206.4 | 1,924.1 | 763.4 | 568.4 | 673.9 |
| 1964–65 | 9,753 | 211,050 | 412.0 | 1,335.4 | 232.0 | 2,176.6 | 841.2 | 621.8 | 747.3 |
| REVENUE AND EXPENDITURE OF CENTRAL GOVERNMENT | ||||||
|---|---|---|---|---|---|---|
| Year Ended 31 March | Receipts | Payments | Deficit | Surplus | ||
| From Taxation | From Other Sources | Total | ||||
| *Excludes duty on motor spirits refunded under the Transport Amendment Act $1.9 million in 1958–59, $4.7 million in 1959–60, $2.0 million in 1960–61, $0.8 million in 1961–62, $0.8 million in 1962–63, $0.8 million in 1963–64. | ||||||
| $(million) | ||||||
| CONSOLIDATED FUND | ||||||
| 1917 | 21.1 | 15.6 | 36.7 | 28.1 | ... | 8.6 |
| 1918 | 24.7 | 15.7 | 40.4 | 30.2 | ... | 10.2 |
| 1919 | 27.6 | 17.1 | 44.7 | 37.3 | ... | 7.4 |
| 1920 | 32.5 | 19.7 | 52.2 | 47.6 | ... | 4.6 |
| 1921 | 44.4 | 24.2 | 68.5 | 56.3 | ... | 12.3 |
| 1922 | 32.7 | 23.5 | 56.3 | 56.9 | 0.7 | ... |
| 1923 | 31.2 | 24.0 | 55.2 | 52.5 | ... | 2.6 |
| 1924 | 32.8 | 23.1 | 59.9 | 52.3 | ... | 3.6 |
| 1925 | 33.1 | 24.2 | 57.3 | 54.8 | ... | 2.5 |
| 1926 | 34.0 | 15.5 | 49.5 | 47.1 | ... | 2.3 |
| 1927 | 33.8 | 16.1 | 49.9 | 48.7 | ... | 1.2 |
| 1928 | 33.7 | 16.6 | 50.2 | 49.9 | ... | 0.4 |
| 1929 | 35.7 | 11.5 | 47.2 | 48.4 | 1.2 | ... |
| 1930 | 39.0 | 11.7 | 50.7 | 50.4 | ... | 0.3 |
| 1931 | 37.2 | 8.9 | 46.1 | 49.4 | 3.3 | ... |
| 1932 | 32.4 | 13.1 | 45.4 | 49.7 | 4.3 | ... |
| 1933 | 31.2 | 13.9 | 45.1 | 45.1 | ... | – |
| 1934 | 34.1 | 12.9 | 47,0 | 48.4 | 1.4 | ... |
| 1935 | 40.4 | 11.9 | 52.3 | 49.0 | ... | 3.3 |
| 1936 | 43.1 | 9.2 | 52.3 | 51.8 | ... | 0.6 |
| 1937 | 53.9 | 8.4 | 62.3 | 61.4 | ... | 0.9 |
| 1938 | 63.3 | 26.3 | 89.6 | 88.0 | ... | 1.6 |
| 1939 | 64.6 | 22.8 | 87.4 | 85.8 | ... | 1.6 |
| 1940 | 65.6 | 28.2 | 93.8 | 93.2 | ... | 0.6 |
| 1941 | 68.7 | 32.2 | 102.9 | 98.5 | ... | 3.5 |
| 1942 | 70.3 | 38.7 | 109.1 | 105.8 | ... | 3.3 |
| 1943 | 72.4 | 37.8 | 110.2 | 101.8 | ... | 8.3 |
| 1944 | 84.0 | 31.1 | 115.1 | 110.7 | ... | 4.5 |
| 1945 | 91.4 | 28.5 | 119.9 | 117.4 | ... | 2.4 |
| 1946 | 96.7 | 31.1 | 127.8 | 125.3 | ... | 2.5 |
| 1947 | 181.4 | 35.2 | 216.6 | 207.4 | ... | 9.2 |
| 1948 | 192.2 | 42.0 | 234.2 | 230.7 | ... | 3.6 |
| 1949 | 202.1 | 41.0 | 243.0 | 237.8 | ... | 5.3 |
| 1950 | 207.7 | 42.3 | 250.0 | 241.4 | ... | 8.6 |
| 1951 | 244.4 | 43.2 | 287.5 | 271.0 | ... | 16.5 |
| 1952 | 313.9 | 47.7 | 361.6 | 336.3 | ... | 25.3 |
| 1953 | 308.5 | 47.1 | 355.6 | 349.0 | ... | 6.6 |
| 1954 | 312.4 | 52.2 | 364.6 | 361.0 | ... | 3.6 |
| 1955 | 325.0 | 57.4 | 382.4 | 368.8 | ... | 13.7 |
| 1956 | 334.9 | 60.0 | 394.9 | 386.6 | ... | 8.3 |
| 1957 | 345.6 | 67.0 | 412.6 | 405.9 | ... | 6.7 |
| 1958 | 317.9 | 69.3 | 387.2 | 387.5 | 0.3 | ... |
| 1959 | 409.7 | 71.1 | 480.8* | 480.0* | ... | 0.8 |
| 1960 | 552.9 | 76.8 | 629.7* | 628.4* | ... | 1.3 |
| 1961 | 474.8 | 94.0 | 568.7* | 567.9* | ... | 0.8 |
| 1962 | 508.3 | 93.0 | 601.3* | 600.6* | ... | 0.6 |
| 1963 | 471.5 | 101.8 | 573.3* | 581.2* | 7.9 | ... |
| 1964 | 512.6 | 120.6 | 633.2* | 635.9* | 2.7 | ... |
| CONSOLIDATED REVENUE ACCOUNT | ||||||
| 1965 | 783.2 | 120.5 | 903.7 | 894.5 | ... | 9.2 |
| 1966 | 852.2 | 122.2 | 974.5 | 970.9 | ... | 3.5 |
| 1967 | 918.8 | 132.5 | 1,051.3 | 1,050.6 | ... | 0.7 |
NOTE—The figures shown in the above table are not on a comparable basis over the whole period.
| INDEBTEDNESS OF CENTRAL GOVERNMENT—AMOUNT OF DEBENTURES AND STOCK IN CIRCULATION | ||||||
|---|---|---|---|---|---|---|
| (Nominal Amounts) | ||||||
| As at 31 March | Domiciled in | Total | Per Head of Population | |||
| United States of America | London | Australia | New Zealand | |||
| *Includes $1.9 million in 1964, $17.5 million in 1965, $29.9 million in 1966, and $44.9 million in 1967 held by International Bank for Reconstruction and Development. | ||||||
| N.Z.$(million) | $ c | |||||
| 1917 | – | 167.8 | 6.8 | 85.1 | 259.7 | 225.60 |
| 1918 | – | 177.4 | 6.8 | 117.5 | 301.7 | 261.30 |
| 1919 | – | 191.4 | 6.8 | 154.0 | 352.2 | 298.80 |
| 1920 | – | 191.4 | 6.8 | 204.2 | 402.3 | 325.30 |
| 1921 | – | 199.4 | 3.3 | 210.0 | 412.6 | 325.60 |
| 1922 | – | 211.8 | 4.6 | 221.7 | 438.1 | 336.70 |
| 1923 | – | 221.3 | 4.3 | 212.3 | 437.9 | 330.40 |
| 1924 | – | 229.7 | 4.2 | 209.3 | 443.2 | 328.80 |
| 1925 | – | 241.6 | 5.9 | 208.1 | 455.6 | 330.30 |
| 1926 | – | 256.1 | 7.3 | 214.3 | 477.7 | 338.80 |
| 1927 | – | 265.0 | 8.1 | 218.6 | 491.7 | 841.90 |
| 1928 | – | 279.5 | 8.3 | 214.9 | 502.8 | 343.80 |
| 1929 | – | 298.7 | 8.3 | 221.4 | 528.4 | 359.20 |
| 1930 | – | 293.2 | 8.6 | 233.1 | 534.8 | 359.10 |
| 1931 | – | 309.1 | 8.4 | 234.7 | 552.1 | 365.20 |
| 1932 | – | 268.9 | 7.8 | 236.8 | 511.5 | 335.30 |
| 1933 | – | 270.4 | 5.7 | 236.7 | 512.9 | 333.50 |
| 1934 | – | 269.4 | 5.8 | 278.0 | 553.2 | 356.90 |
| 1935 | – | 269.6 | 4.4 | 234.9 | 508.8 | 325.90 |
| 1936 | – | 265.0 | 3.2 | 244.5 | 512.7 | 325.80 |
| 1937 | – | 261.1 | 1.8 | 260.1 | 523.0 | 329.30 |
| 1938 | – | 261.5 | 1.8 | 264.9 | 528.0 | 329.10 |
| 1939 | – | 261.3 | 1.8 | 292.5 | 555.6 | 341.90 |
| 1940 | – | 263.3 | 1.8 | 328.3 | 593.4 | 361.70 |
| 1941 | – | 264.4 | 1.8 | 380.4 | 646.5 | 395.10 |
| 1942 | – | 255.1 | 1.7 | 461.6 | 718.4 | 439.60 |
| 1943 | – | 264.2 | 1.7 | 609.4 | 875.3 | 535.60 |
| 1944 | – | 265.9 | 1.7 | 733.5 | 1,001.1 | 608.90 |
| 1945 | – | 266.2 | 1.7 | 806.5 | 1,074.5 | 639.60 |
| 1946 | – | 189.1 | 1.7 | 945.5 | 1,136.3 | 646.80 |
| 1947 | – | 189.1 | 1.7 | 966.0 | 1,156.8 | 646.40 |
| 1948 | – | 166.4 | 1.6 | 988.2 | 1,156.2 | 632.50 |
| 1949 | – | 159.9 | 1.3 | 1,068.8 | 1,230.0 | 659.70 |
| 1950 | – | 156.3 | 1.3 | 1,130.2 | 1,287.8 | 676.70 |
| 1951 | – | 155.6 | – | 1,178.8 | 1,334.5 | 688.60 |
| 1952 | – | 155.6 | – | 1,151.8 | 1,307.3 | 658.70 |
| 1953 | – | 155.6 | – | 1,179.8 | 1,335.4 | 655.40 |
| 1954 | – | 175.6 | – | 1,233.2 | 1,408.7 | 674.80 |
| 1955 | – | 195.6 | – | 1,261.6 | 1,457.2 | 683.80 |
| 1956 | – | 191.6 | – | 1,278.8 | 1,470.4 | 675.90 |
| 1957 | 8.9 | 200.9 | – | 1,304.5 | 1,514.2 | 681.70 |
| 1958 | 7.9 | 199.2 | – | 1,357.1 | 1,564.2 | 687.40 |
| 1959 | 47.1 | 236.6 | – | 1,349.0 | 1,633.1 | 702.10 |
| 1960 | 37.9 | 235.5 | – | 1,415.6 | 1,689.0 | 712.60 |
| 1961 | 37.0 | 216.3 | – | 1,483.0 | 1,736.3 | 719.20 |
| 1962 | 25.1 | 254.0 | – | 1,528.6 | 1,807.7 | 729.80 |
| 1963 | 41.5 | 272.5 | – | 1,620.4 | 1,934.3 | 763.50 |
| 1964 | 41.8 | 279.9 | – | 1,700.0 | 2,021.7 | 780.20 |
| 1965 | 54.3* | 276.5 | – | 1,908.8 | 2,139.6 | 810.00 |
| 1966 | 88.3* | 244.8 | – | 1,922.8 | 2,256.0 | 842.80 |
| 1967 | 107.3* | 283.4 | – | 2,021.3 | 2,412.0 | 884.40 |
| LOCAL AUTHORITIES | ||||||
|---|---|---|---|---|---|---|
| Year Ended 31 March | Receipts | Payments | Total Gross Indebtedness† | |||
| Revenue | Other Receipts‡ | Total | ||||
| From Rates | From Other Sources‡ | |||||
*Exclusive of hospital boards. †Debt shown at its nominal amount, that portion domiciled overseas not being converted to its New Zealand currency equivalent. In terms of New Zealand currency, gross debt at 31 March 1966 amounted to $(N.Z.)461.3 million. ‡Revised series from and including year ended 31 March 1925. | ||||||
| $(million) | ||||||
| 1916 | 4.7 | 6.0 | 4.9 | 15.6 | 13.8 | 52.1 |
| 1917 | 5.1 | 6.5 | 2.8 | 14.4 | 13.5 | 53.6 |
| 1918 | 5.4 | 6.6 | 2.5 | 14.4 | 14.2 | 55.3 |
| 1919 | 5.9 | 7.0 | 1.9 | 14.7 | 14.6 | 56.2 |
| 1920 | 6.3 | 9.0 | 6.7 | 21.9 | 21.8 | 60.4 |
| 1921 | 7.1 | 10.7 | 6.9 | 24.6 | 25.5 | 64.2 |
| 1922 | 7.6 | 12.2 | 11.0 | 30.7 | 30.2 | 73.5 |
| 1923 | 8.6 | 12.5 | 14.8 | 35.8 | 31.4 | 86.4 |
| 1924 | 8.9 | 13.4 | 11.4 | 33.7 | 33.0 | 93.1 |
| 1925 | 9.3 | 14.4 | 15.9 | 39.6 | 38.8 | 106.7 |
| 1926 | 10.1 | 16.0 | 15.7 | 41.8 | 41.8 | 118.8 |
| 1927 | 10.6 | 17.2 | 14.0 | 41.9 | 43.5 | 128.0 |
| 1928 | 11.2 | 19.0 | 12.0 | 42.1 | 44.9 | 132.8 |
| 1929 | 11.7 | 18.4 | 12.9 | 42.9 | 42.6 | 138.6 |
| 1930 | 12.0 | 20.7 | 11.9 | 44.5 | 44.1 | 142.4 |
| 1931 | 11.3 | 20.4 | 9.7 | 41.4 | 44.4 | 145.4 |
| 1932 | 11.0 | 18.1 | 10.0 | 39.1 | 40.2 | 144.8 |
| 1933 | 10.5 | 17.0 | 9.8 | 37.2 | 37.8 | 145.0 |
| 1934 | 11.0 | 16.5 | 8.5 | 36.1 | 35.5 | 124.0 |
| 1935 | 11.0 | 17.2 | 9.0 | 37.2 | 37.4 | 142.5 |
| 1936 | 11.2 | 18.0 | 9.9 | 39.0 | 38.7 | 140.8 |
| 1937 | 12.0 | 19.1 | 9.4 | 40.5 | 40.4 | 137.1 |
| 1938 | 13.1 | 21.1 | 9.7 | 43.9 | 44.1 | 136.1 |
| 1939 | 14.0 | 22.6 | 13.5 | 50.0 | 50.2 | 136.4 |
| 1940 | 14.6 | 24.4 | 14.5 | 53.5 | 51.4 | 139.0 |
| 1941 | 14.7 | 25.4 | 10.2 | 50.3 | 49.5 | 136.0 |
| 1942 | 14.9 | 26.0 | 7.2 | 48.0 | 48.1 | 153.2 |
| 1943 | 15.5 | 27.4 | 6.1 | 49.0 | 46.5 | 130.3 |
| 1944 | 15.6 | 29.6 | 4.9 | 50.0 | 47.6 | 126.5 |
| 1945 | 15.8 | 30.1 | 5.0 | 50.9 | 50.4 | 122.5 |
| 1946 | 17.3 | 30.8 | 6.4 | 54.4 | 54.7 | 120.0 |
| 1947 | 19.1 | 33.0 | 8.5 | 60.6 | 61.0 | 115.6 |
| 1948 | 19.6 | 34.4 | 10.0 | 64.0 | 64.9 | 114.2 |
| 1949 | 21.6 | 38.2 | 12.3 | 72.0 | 71.6 | 113.2 |
| 1950 | 23.3 | 40.7 | 16.2 | 80.2 | 79.3 | 112.6 |
| 1951 | 25.2 | 43.4 | 16.7 | 85.3 | 86.5 | 112.2 |
| 1952 | 29.0 | 49.1 | 21.3 | 98.4 | 97.7 | 115.7 |
| 1953 | 30.8 | 55.2 | 31.5 | 117.4 | 116.7 | 128.9 |
| 1954 | 32.8 | 64.6 | 41.0 | 138.5 | 136.4 | 146.9 |
| 1955 | 36.5 | 70.6 | 42.1 | 149.2 | 148.0 | 158.6 |
| 1956 | 37.8 | 76.8 | 50.9 | 165.4 | 167.1 | 176.0 |
| 1957 | 41.3 | 79.1 | 60.7 | 181.2 | 181.5 | 198.2 |
| 1958 | 45.4 | 84.7 | 71.1 | 201.2 | 196.6 | 229.4 |
| 1959 | 48.8 | 97.8 | 69.6 | 216.2 | 213.2 | 255.9 |
| 1960 | 51.5 | 101.7 | 83.6 | 231.8 | 231.2 | 287.1 |
| 1961 | 55.0 | 108.7 | 88.1 | 251.8 | 245.0 | 31.88 |
| 1962 | 58.0 | 118.9 | 78.7 | 255.6 | 267.5 | 337.6 |
| 1963 | 62.4 | 125.5 | 96.2 | 284.1 | 286.5 | 370.2 |
| 1964 | 68.3 | 153.2 | 120.0 | 351.5 | 329.6 | 401.8 |
| 1965 | 77.2 | 164.0 | 122.7 | 363.8 | 361.1 | 436.2 |
| 1966 | 80.5 | 176.4 | 119.2 | 376.0 | 387.5 | 461.4 |
| LOCAL AUTHORITIES*—LOAN INDEBTEDNESS† | ||||||
|---|---|---|---|---|---|---|
| (Exclusive of Inscribed Debt) | ||||||
| As at 31 March | Counties | Cities and Boroughs | Harbour Boards | Electric Power Districts | Other | Total |
*Exclusive of hospital boards. †Debt shown at its nominal amount, that portion domiciled overseas not being converted to its New Zealand currency equivalent. | ||||||
| $(million) | ||||||
| 1916 | 2.3 | 24.7 | 14.3 | ... | 5.3 | 46.6 |
| 1917 | 2.5 | 25.8 | 14.5 | ... | 5.3 | 48.2 |
| 1918 | 3.0 | 26.9 | 14.7 | ... | 5.4 | 50.0 |
| 1919 | 3.3 | 27.4 | 14.8 | ... | 5.5 | 51.0 |
| 1920 | 4.1 | 30.6 | 15.0 | ... | 5.8 | 55.4 |
| 1921 | 5.1 | 32.1 | 15.3 | 0.3 | 6.6 | 59.4 |
| 1922 | 6.0 | 36.1 | 16.5 | 3.0 | 7.1 | 68.7 |
| 1923 | 7.6 | 43.2 | 17.2 | 6.1 | 7.6 | 81.7 |
| 1924 | 8.0 | 44.2 | 18.3 | 9.5 | 8.5 | 88.4 |
| 1925 | 9.2 | 51.8 | 19.5 | 13.0 | 8.6 | 102.2 |
| 1926 | 10.8 | 56.1 | 20.0 | 17.5 | 10.1 | 114.4 |
| 1927 | 12.0 | 60.1 | 20.5 | 20.2 | 10.8 | 123.6 |
| 1928 | 12.4 | 63.2 | 21.0 | 20.4 | 11.6 | 128.5 |
| 1929 | 12.7 | 64.5 | 21.5 | 24.0 | 11.7 | 134.4 |
| 1930 | 13.1 | 63.0 | 20.9 | 25.3 | 16.1 | 138.4 |
| 1931 | 13.3 | 64.3 | 21.0 | 26.0 | 16.9 | 141.4 |
| 1932 | 13.4 | 63.4 | 21.1 | 26.2 | 16.9 | 141.0 |
| 1933 | 13.2 | 63.6 | 21.2 | 26.1 | 17.1 | 141.2 |
| 1934 | 13.1 | 62.7 | 21.0 | 26.4 | 17.0 | 140.3 |
| 1935 | 12.8 | 62.0 | 21.1 | 26.8 | 16.4 | 139.0 |
| 1936 | 12.5 | 61.5 | 20.4 | 27.0 | 16.1 | 137.5 |
| 1937 | 12.3 | 61.0 | 20.3 | 24.1 | 16.3 | 134.0 |
| 1938 | 12.2 | 61.1 | 19.7 | 23.8 | 16.2 | 133.0 |
| 1939 | 12.2 | 61.2 | 19.5 | 24.9 | 15.5 | 133.4 |
| 1940 | 12.4 | 61.5 | 19.9 | 26.2 | 16.0 | 136.0 |
| 1941 | 12.3 | 60.0 | 19.9 | 26.2 | 14.7 | 133.1 |
| 1942 | 12.2 | 59.3 | 19.6 | 25.0 | 14.6 | 130.7 |
| 1943 | 11.7 | 57.7 | 19.6 | 24.7 | 14.2 | 128.0 |
| 1944 | 11.3 | 56.4 | 19.4 | 23.6 | 13.9 | 124.6 |
| 1945 | 10.8 | 55.1 | 19.0 | 23.1 | 12.9 | 120.8 |
| 1946 | 10.4 | 54.5 | 18.7 | 22.4 | 12.7 | 118.7 |
| 1947 | 9.9 | 53.4 | 16.8 | 21.7 | 12.5 | 114.3 |
| 1948 | 9.5 | 53.0 | 16.5 | 22.2 | 12.1 | 113.2 |
| 1949 | 9.3 | 51.9 | 16.1 | 23.2 | 12.0 | 112.4 |
| 1950 | 8.9 | 52.2 | 15.6 | 24.0 | 11.4 | 112.1 |
| 1951 | 8.6 | 52.5 | 14.8 | 24.9 | 11.2 | 112.0 |
| 1952 | 8.6 | 54.3 | 15.0 | 26.0 | 11.8 | 115.7 |
| 1953 | 8.6 | 59.5 | 17.8 | 28.8 | 14.1 | 128.8 |
| 1954 | 8.6 | 68.0 | 20.7 | 31.9 | 17.6 | 146.9 |
| 1955 | 9.2 | 73.4 | 21.6 | 34.4 | 20.0 | 158.6 |
| 1956 | 10.2 | 80.2 | 23.2 | 37.7 | 24.6 | 176.0 |
| 1957 | 11.9 | 89.4 | 26.1 | 39.6 | 31.3 | 198.2 |
| 1958 | 13.5 | 102.8 | 31.4 | 42.6 | 39.0 | 229.4 |
| 1959 | 14.8 | 111.5 | 35.1 | 45.9 | 48.6 | 256.0 |
| 1960 | 17.4 | 124.1 | 40.1 | 47.8 | 57.7 | 287.1 |
| 1961 | 19.8 | 132.6 | 46.0 | 49.3 | 71.2 | 318.8 |
| 1962 | 22.3 | 141.4 | 48.0 | 51.4 | 74.4 | 337.6 |
| 1963 | 24.0 | 156.6 | 56.1 | 54.1 | 79.5 | 370.2 |
| 1964 | 28.4 | 172.4 | 65.4 | 53.7 | 81.8 | 401.8 |
| 1965 | 31.8 | 187.2 | 72.1 | 58.1 | 87.0 | 436.2 |
| 1966 | 31.5 | 202.5 | 79.8 | 60.0 | 87.6 | 461.4 |
| BANKING AND CURRENCY | ||||||||
|---|---|---|---|---|---|---|---|---|
| Year | Assets of Trading Banks | Liabilities of Trading Banks | Notes in Hands of Public† | Net Overseas Assets of Banking System|| | ||||
| Advances and Discounts*† | Notes and Coin and Balances at Reserve Bank‡ | Securities‡ | Total Selected Assets§ | Deposits† | Total Selected Liabilities§ | |||
*Includes term loans and export finance from 1964 on. †Average of weekly figures. ‡Average of monthly figures. §As at last balance day in December, assets exclude shareholders' funds, while both assets and liabilities exclude inter-branch accounts within New Zealand, contingencies, and certain transit items. ||Includes holdings of Reserve Bank. | ||||||||
| $(million) | ||||||||
| 1935 | 89.4 | 19.4 | 10.2 | 166.0 | 123.0 | 132.0 | 12.8 | 84.0 |
| 1936 | 91.8 | 25.0 | 11.0 | 167.8 | 130.4 | 131.8 | 15.0 | 78.2 |
| 1937 | 98.4 | 28.2 | 15.8 | 171.6 | 133.6 | 135.6 | 17.8 | 63.4 |
| 1938 | 111.4 | 23.0 | 15.8 | 170.2 | 130.0 | 133.6 | 20.0 | 42.0 |
| 1939 | 109.4 | 31.6 | 23.0 | 192.2 | 134.6 | 152.0 | 24.0 | 20.6 |
| 1940 | 96.0 | 40.4 | 33.6 | 203.0 | 154.8 | 164.0 | 29.6 | 47.2 |
| 1941 | 99.4 | 35.4 | 42.0 | 210.6 | 161.4 | 168.2 | 34.8 | 60.2 |
| 1942 | 90.8 | 47.6 | 56.2 | 237.8 | 181.8 | 201.6 | 43.0 | 77.0 |
| 1943 | 86.6 | 65.8 | 75.4 | 265.4 | 212.6 | 229.2 | 55.2 | 84.4 |
| 1944 | 93.6 | 78.8 | 77.2 | 281.8 | 235.2 | 244.4 | 64.2 | 99.6 |
| 1945 | 103.6 | 104.8 | 63.6 | 329.0 | 260.2 | 285.2 | 70.0 | 160.8 |
| 1946 | 116.6 | 135.6 | 57.0 | 358.0 | 299.6 | 321.0 | 76.4 | 201.4 |
| 1947 | 153.0 | 132.0 | 46.0 | 384.0 | 328.4 | 355.2 | 80.2 | 205.2 |
| 1948 | 196.4 | 137.6 | 37.8 | 387.0 | 351.0 | 381.6 | 81.6 | 168.2 |
| 1949 | 166.8 | 172.2 | 29.4 | 416.6 | 372.2 | 417.8 | 85.0 | 141.2 |
| 1950 | 189.4 | 173.4 | 26.8 | 450.6 | 404.4 | 468.0 | 90.4 | 150.2 |
| 1951 | 265.8 | 166.6 | 26.4 | 540.6 | 501.4 | 550.6 | 98.0 | 208.0 |
| 1952 | 339.6 | 127.4 | 26.0 | 536.4 | 506.0 | 510.2 | 102.0 | 145.2 |
| 1953 | 273.6 | 210.6 | 28.0 | 582.6 | 530.6 | 563.2 | 106.8 | 207.2 |
| 1954 | 314.0 | 183.8 | 50.4 | 603.2 | 563.6 | 611.6 | 115.4 | 236.0 |
| 1955 | 365.8 | 137.0 | 50.4 | 600.6 | 559.8 | 599.0 | 119.0 | 176.6 |
| 1956 | 341.2 | 144.8 | 57.6 | 575.4 | 537.4 | 568.8 | 120.0 | 171.8 |
| 1957 | 329.8 | 155.8 | 57.4 | 599,2 | 557.8 | 592.2 | 122.4 | 173.0 |
| 1958 | 350.8 | 152.0 | 57.0 | 577.0 | 558.0 | 560.2 | 124.2 | 104.2 |
| 1959 | 340.2 | 161.0 | 57.0 | 632.6 | 566.8 | 629.8 | 125.4 | 179.8 |
| 1960 | 355.4 | 212.6 | 46.8 | 700.6 | 647.8 | 720.6 | 131.2 | 195.0 |
| 1961 | 435.0 | 170.6 | 46.6 | 648.2 | 652.0 | 705.4 | 135.0 | 107.4 |
| 1962 | 401.0 | 192.4 | 46.4 | 687.2 | 646.6 | 701.2 | 133.2 | 128.4 |
| 1963 | 403.8 | 187.0 | 46.2 | 722.6 | 676.5 | 723.8 | 133.0 | 159.2 |
| 1964 | 439.9 | 188.0 | 46.2 | 804.8 | 724.8 | 782.2 | 129.6 | 167.4 |
| 1965 | 498.2 | 145.2 | 53.3 | 812.0 | 729.9 | 796.0 | 128.0 | 140.6 |
| 1966 | 513.4 | 114.6 | 64.7 | 826.6 | 731.8 | 817.9 | 125.4 | 117.4 |
| POST OFFICE SAVINGS BANK | ||||||
|---|---|---|---|---|---|---|
| Year | Number of Depositors at End of Year | Total Amount of Deposits During Year | Interest Credited to Depositors | Total Amount of Withdrawals During Year* | Excess of Deposits plus Interest over Withdrawals | Total Amount to Credit of Depositors at End of Year |
*From January 1958 includes interest paid out on investment accounts. †Fifteen months, 1 January 1920 to 31 March 1921. ‡Excess of withdrawals over deposits. §From 1940–41 the year of opening includes national saving accounts. ||Does not include $22.9 million from war gratuity accounts shown in italics in next line. ¶Excludes 15,439 amounts credited with $0.6 million transferred to Apia, Western Samoa. | ||||||
| Number | $(million) | |||||
| 1916 | 538,072 | 31.2 | 1.6 | 25.9 | 6.9 | 51.2 |
| 1917 | 566,351 | 34.2 | 1.9 | 28.9 | 7.2 | 58.4 |
| 1918 | 590,205 | 36.2 | 2.1 | 29.9 | 8.4 | 66.8 |
| 1919 | 630,783 | 59.5 | 2.4 | 51.9 | 9.9 | 76.8 |
| 1920–21† | 664,819 | 88.6 | 3.6 | 82.3 | 9.8 | 86.7 |
| 1921–22 | 678,930 | 58.3 | 3.2 | 60.5 | 1.0 | 87.7 |
| 1922–23 | 690,790 | 53.4 | 3.2 | 55.5 | 1.0 | 88.7 |
| 1923–24 | 710,157 | 59.2 | 3.3 | 59.0 | 3.5 | 92.2 |
| 1924–25 | 735,148 | 59.2 | 3.4 | 60.8 | 1.7 | 93.9 |
| 1925–26 | 758,155 | 63.7 | 3.5 | 65.2 | 1.9 | 95.8 |
| 1926–27 | 783,827 | 58.9 | 3.5 | 60.3 | 2.1 | 98.0 |
| 1927–28 | 804,725 | 55.2 | 3.5 | 61.2 | -2.4‡ | 95.5 |
| 1928–29 | 828,296 | 54.5 | 3.5 | 56.2 | 1.8 | 97.3 |
| 1929–30 | 852,757 | 57.1 | 3.6 | 59.2 | 1.6 | 98.9 |
| 1930–31 | 878,043 | 49,1 | 3.5 | 56.1 | -3.5‡ | 95.3 |
| 1931–32 | 877,090 | 38.9 | 3.2 | 50.9 | -8.8‡ | 86.5 |
| 1932–33 | 797,097 | 33.9 | 2.9 | 39.3 | -2.4‡ | 84.1 |
| 1933–34 | 798,262 | 38.9 | 2.5 | 35.6 | 5.7 | 89.7 |
| 1934–35 | 817,617 | 48.4 | 2.6 | 41.9 | 9.1 | 98.8 |
| 1935–36 | 840,671 | 51.2 | 2.8 | 47.1 | 7.0 | 105.8 |
| 1936–37 | 880,857 | 61.3 | 3.0 | 54.1 | 10.3 | 116.1 |
| 1937–38 | 920,805 | 66.1 | 3.3 | 59.3 | 10.2 | 126.3 |
| 1938–39 | 946,822 | 60.9 | 3.5 | 69.2 | -4.9‡ | 121.4 |
| 1939–40 | 960,565 | 50.3 | 3.2 | 58.9 | -5.4‡ | 116.0 |
| 1940–41 | 1,142,792 | 58.5 | 3.3 | 50.6 | 11.2 | 127.2§ |
| 1941–42 | 1,298,483 | 68.4 | 3.7 | 50.8 | 21.3 | 148.5 |
| 1942–43 | 1,399,896 | 80.3 | 3.8 | 53.8 | 30.3 | 178.8 |
| 1943–44 | 1,494,136 | 107.9 | 4.4 | 71.2 | 41.0 | 219.8 |
| 1944–45 | 1,570,586 | 121.3 | 5.5 | 84.6 | 42.2 | 262.1 |
| 1945–46 | 1,605,981 | 148.6 | 6.5 | 114.0 | 41.0 | 303.1 |
| 1946–47 | 1,634,548 | 155.1 | 7.5 | 129.3 | 33.3 | 336.4 |
| 1947–48 | 1,652,765 | 157.7 | 8.2 | 143.5 | 22.4 | 358.8 |
| 1948–49 | 1,679,692 | 153.6 | 8.7 | 142.0 | 20.3 | 379.1|| |
| 1949–50 | ... | 22.9 | – | 7.6 | 15.3 | 425.1 |
| 1,730,072 | 175.0 | 9.7 | 154.0 | 30.7 | ||
| 1950–51 | 1,760,541 | 189.3 | 10.2 | 179.6 | 19.9 | 445.0 |
| 1951–52 | 1,800,709 | 215.6 | 10.8 | 198.9 | 27.5 | 472.5 |
| 1952–53 | 1,835,552 | 216.9 | 11.4 | 207.6 | 20.7 | 493.3 |
| 1953–54 | 1,868,788 | 237.2 | 12.1 | 2.14.9 | 34.4 | 527.7 |
| 1954–55 | 1,900,649 | 255.7 | 12.8 | 243.6 | 24.9 | 552.6 |
| 1955–56 | 1,927,422 | 255.2 | 13.3 | 256.4 | 12.1 | 564.7 |
| 1956–57 | 1,971,731 | 279.1 | 16.3 | 265.8 | 29.4 | 594.1 |
| 1957–58 | 2,013,664 | 311.7 | 17.9 | 291.2 | 38.5 | 632.6 |
| 1958–59 | 2,052,626 | 294.2 | 18.5 | 307.4 | 5.3 | 637.9 |
| 1959–60 | 2,084,837 | 326.3 | 18.9 | 311.0 | 34.1 | 672.0 |
| 1960–61 | 2,116,675 | 374.6 | 20.1 | 350.1 | 44.6 | 716.6 |
| 1961–62 | 2,143,586 | 383.4 | 21.0 | 383.7 | 20.7 | 736.7¶ |
| 1962–63 | 2,190,757 | 409.1 | 22.0 | 397.2 | 33.9 | 770.6 |
| 1963–64 | 2,245,339 | 471.6 | 23.6 | 442.9 | 52.3 | 822.8 |
| 1964–65 | 2,275,813 | 505.5 | 25.0 | 500.6 | 29.9 | 852.7 |
| 1965–66 | 2,312,392 | 506.6 | 25.7 | 520.6 | 11.7 | 864.4 |
| 1966–67 | 2,330,687 | 524.3 | 25.9 | 540.8 | 9.4 | 873.8 |
| MORTGAGES AND LAND TRANSFERS | |||||
|---|---|---|---|---|---|
| Year Ended 31 March | Mortgages | Average Rate of Interest On New Mortgages | Land Transfers | ||
| Registered | Discharged | Number | Consideration | ||
| $(m) | $(m) | Per Cent | $(m) | ||
| 1917 | 42.1 | 26.0 | 5.80 | 22,187 | 68.6 |
| 1918 | 36.3 | 23.2 | 5.84 | 19,949 | 36.2 |
| 1919 | 38.0 | 22.1 | 5.84 | 22,496 | 50.4 |
| 1920 | 96.9 | 46.2 | 5.75 | 45,128 | 124.9 |
| 1921 | 133.9 | 58.9 | 5.89 | 55,746 | 163.6 |
| 1922 | 69.5 | 26.5 | 6.42 | 33,784 | 70.9 |
| 1923 | 52.1 | 29.2 | 6.57 | 31,021 | 60.0 |
| 1924 | 75.7 | 44.5 | 6.38 | 33,293 | 67.7 |
| 1925 | 82.2 | 59.5 | 6.30 | 34,289 | 67.3 |
| 1926 | 94.2 | 67.9 | 6.22 | 36,038 | 70.4 |
| 1927 | 80.0 | 58.5 | 6.47 | 34,106 | 64.7 |
| 1928 | 66.4 | 48.0 | 6.46 | 31,141 | 60.3 |
| 1929 | 67.1 | 50.5 | 6.46 | 30,760 | 62.3 |
| 1930 | 77.7 | 56.7 | 6.35 | 32,112 | 61.7 |
| 1931 | 60.4 | 40.1 | 6.25 | 25,626 | 44.1 |
| 1932 | 26.8 | 20.1 | 6.28 | 16,943 | 26.4 |
| 1933 | 18.3 | 16.3 | 5.88 | 15,381 | 22.0 |
| 1934 | 15.6 | 18.2 | 5.56 | 15,760 | 19.1 |
| 1935 | 23.7 | 27.5 | 5.06 | 18,628 | 24.4 |
| 1936 | 32.5 | 35.1 | 4.73 | 23,044 | 31.2 |
| 1937 | 39.4 | 39.6 | 4.60 | 25,178 | 37.7 |
| 1938 | 38.0 | 38.7 | 4.65 | 26,269 | 46.7 |
| 1939 | 40.1 | 33.2 | 4.58 | 28,965 | 47.3 |
| 1940 | 35.2 | 28,2 | 4.69 | 28,057 | 44.2 |
| 1941 | 32.5 | 31.9 | 4.69 | 28,828 | 51.5 |
| 1942 | 29.1 | 30.2 | 4.73 | 28,207 | 46.5 |
| 1943 | 24.3 | 33.4 | 4.72 | 27,657 | 48.3 |
| 1944 | 31.2 | 40.1 | 4.63 | 33,701 | 76.3 |
| 1945 | 36.2 | 42.0 | 4.51 | 33,284 | 64.9 |
| 1946 | 45.0 | 46.6 | 4.10 | 38,060 | 76.7 |
| 1947 | 62.2 | 51.9 | 3.85 | 42,994 | 89.9 |
| 1948 | 64.1 | 50.8 | 3.90 | 48,801 | 80.9 |
| 1949 | 70.6 | 46.8 | 3.98 | 36,564 | 76.8 |
| 1950 | 72.0 | 46.2 | 3.99 | 39,058 | 81.3 |
| 1951 | 91.6 | 64.5 | 4.09 | 57,938 | 158.7 |
| 1952 | 135.9 | 74.5 | 4.15 | 56,609 | 218.3 |
| 1953 | 147.4 | 62.8 | 4.29 | 48,378 | 201.4 |
| 1954 | 140.8 | 72.0 | 4.49 | 52,615 | 228.8 |
| 1955 | 169.2 | 82.3 | 4.69 | 56,571 | 273.4 |
| 1956 | 192.5 | 70.7 | 4.76 | 49,100 | 241.9 |
| 1957 | 182.4 | 75.4 | 5.09 | 45,334 | 229.4 |
| 1958 | 199.1 | 92.2 | 5.24 | 50,573 | 279.4 |
| 1959 | 217.1 | 88.8 | 5.15 | 49,153 | 255.2 |
| 1960 | 239.0 | 102.3 | 5.01 | 52,855 | 285.4 |
| 1961 | 300.8 | 136.6 | 5.01 | 61,412 | 375.6 |
| 1962 | 331.5 | 133.8 | 5.27 | 57,813 | 360.1 |
| 1963 | 295.1 | 135.6 | 5.51 | 53,566 | 336.3 |
| 1964 | 339.8 | 168.8 | 5.70 | 59,836 | 419.9 |
| 1965 | 420.0 | 206.8 | 5.78 | 69,548 | 536.2 |
| 1966 | 487.7 | 230.0 | 6.07 | 71,508 | 592.6 |
| 1967 | 493.4 | 293.3 | 6.31 | 68,639 | 589.2 |
| BANKRUPTCIES AND NEW COMPANY REGISTRATIONS | |||||
|---|---|---|---|---|---|
| Year | Bankruptcies | New Company Registrations* | |||
| Number of Bankruptcies | Amount Realised by Official Assignee | Amount of Debts Proved | Number of New Registrations | Amount of Nominal Capital | |
*Public, private, and overseas. †The extraordinarily high figure for 1934 is due to the inclusion of all overseas companies (numbering 187 with an aggregate nominal capital of $386.0 million) which had previous to 1934 established places of business in New Zealand and which were reregistered in 1934 under Part XII of the Companies Act 1933. ‡Since 1954 company liquidations are included in the total. | |||||
| $(m.) | $(m.) | $(m.) | |||
| 1915 | 294 | 126.6 | 307.9 | .. | .. |
| 1916 | 304 | 112.8 | 345.5 | 258 | 8.1 |
| 1917 | 265 | 127.3 | 356.5 | 261 | 10.7 |
| 1918 | 164 | 135.5 | 177.2 | 200 | 6.1 |
| 1919 | 141 | 109.3 | 119.5 | 328 | 11.9 |
| 1920 | 145 | 95.8 | 155.5 | 501 | 19.1 |
| 1921 | 336 | 156.5 | 1,117.0 | 337 | 7.0 |
| 1922 | 690 | 252.3 | 1,668.7 | 417 | 26.3 |
| 1923 | 674 | 249.3 | 1,337.8 | 502 | 26.0 |
| 1924 | 670 | 237.3 | 1,408.0 | 565 | 42.7 |
| 1925 | 653 | 197.3 | 942.1 | 621 | 29.5 |
| 1926 | 752 | 205.8 | 1,171.4 | 655 | 21.5 |
| 1927 | 867 | 217.7 | 1,359.0 | 698 | 17.4 |
| 1928 | 806 | 233.2 | 1,534.6 | 736 | 22.0 |
| 1929 | 687 | 182.4 | 1,004.2 | 903 | 24.9 |
| 1930 | 780 | 166.6 | 1,654.7 | 893 | 13.4 |
| 1931 | 848 | 217.6 | 2,084.4 | 795 | 16.6 |
| 1932 | 661 | 151.3 | 1,249.8 | 812 | 13.7 |
| 1933 | 450 | 123.4 | 979.8 | 830 | 14.6 |
| 1934 | 326 | 89.1 | 517.8 | 933 | 401.5† |
| 1935 | 257 | 82.1 | 451.0 | 810 | 48.5 |
| 1936 | 260 | 66.0 | 339.7 | 942 | 19.9 |
| 1937 | 222 | 111.9 | 343.4 | 888 | 12.2 |
| 1938 | 267 | 129.0 | 460.9 | 824 | 13.2 |
| 1939 | 267 | 88.3 | 451.0 | 681 | 17.8 |
| 1940 | 213 | 84.8 | 250.6 | 391 | 7.6 |
| 1941 | 165 | 70.9 | 142.0 | 288 | 22.5 |
| 1942 | 82 | 59.5 | 64.5 | 198 | 1.9 |
| 1943 | 45 | 37.8 | 40.1 | 270 | 3.1 |
| 1944 | 51 | 26.9 | 102.1 | 464 | 3.0 |
| 1945 | 45 | 37.1 | 236.4 | 741 | 6.8 |
| 1946 | 52 | 41.9 | 97.0 | 1,435 | 22.1 |
| 1947 | 74 | 31.1 | 89.5 | 1,813 | 19.2 |
| 1948 | 148 | 100.6 | 286.6 | 1,751 | 17.4 |
| 1949 | 179 | 76.8 | 406.3 | 2,157 | 16.0 |
| 1950 | 142 | 98.5 | 251.8 | 2,074 | 20.4 |
| 1951 | 145 | 96.5 | 273.6 | 2,020 | 25.6 |
| 1952 | 168 | 112.5 | 502.3 | 1,744 | 66.8 |
| 1953 | 215 | 144.3 | 762.0 | 2,041 | 86.1 |
| 1954‡ | 277 | 165.1 | 826.9 | 2,685 | 55.5 |
| 1955 | 304 | 224.8 | 764.6 | 2,695 | 36.7 |
| 1956 | 390 | 261.1 | 1,095.5 | 3,255 | 41.2 |
| 1957 | 437 | 360.7 | 1,564.5 | 3,502 | 161.1 |
| 1958 | 495 | 369.6 | 1,638.3 | 3,034 | 61.5 |
| 1959 | 618 | 389.8 | 1,510.4 | 2,737 | 94.2 |
| 1960 | 495 | 331.2 | 1,337.8 | 3,767 | 74.0 |
| 1961 | 425 | 303.6 | 1,415.8 | 3,567 | 71.7 |
| 1962 | 591 | 446.1 | 2,138.4 | 3,351 | 45.1 |
| 1963 | 566 | 441.1 | 1,660.3 | 4,165 | 74.1 |
| 1964 | 507 | 325.5 | 1,784.9 | 5,054 | 90.0 |
| 1965 | 507 | 335.6 | 2,337.5 | 5,563 | 85.8 |
| 1966 | 507 | 378.5 | 2,033.5 | 5,609 | 187.3 |
| INSURANCE | ||||||
|---|---|---|---|---|---|---|
| Year | Life (Ordinary and Industrial) | Accident | Fire | |||
| Policies in Force† | Sum Assured† | Net Revenue* | Net Expenditure* | Net Revenue* | Net Expenditure* | |
*Excluding unexpired risks reserves. †Excludes annuities. | ||||||
| (000) | $(million) | $(thousand) | ||||
| 1915–16 | 260 | 88 | 690 | 584 | .. | .. |
| 1916–17 | 274 | 90 | 710 | 604 | .. | .. |
| 1917–18 | 283 | 92 | 712 | 642 | .. | .. |
| 1918–19 | 299 | 98 | 728 | 654 | 1,948 | 1,496 |
| 1919–20 | 318 | 108 | 912 | 798 | 2,202 | 1,540 |
| 1920–21 | 339 | 118 | 1,082 | 910 | 2,564 | 1,772 |
| 1921–22 | 357 | 126 | 1,430 | 1,238 | 2,808 | 2,318 |
| 1922–23 | 370 | 131 | 1,436 | 1,304 | 2,858 | 2,338 |
| 1923–24 | 389 | 141 | 1,534 | 1,415 | 2,870 | 2,414 |
| 1924–25 | 412 | 152 | 1,738 | 1,583 | 2,892 | 2,558 |
| 1925–26 | 433 | 163 | 2,316 | 1,960 | 3,034 | 2,447 |
| 1926–27 | 455 | 174 | 2,661 | 2,290 | 2,981 | 2,705 |
| 1927–28 | 480 | 184 | 2,682 | 2,447 | 2,994 | 2,891 |
| 1928–29 | 503 | 196 | 2,846 | 2,598 | 3,002 | 3,067 |
| 1929–30 | 532 | 211 | 3,325 | 2,898 | 3,033 | 2,665 |
| 1930–31 | 553 | 224 | 3,491 | 3,098 | 3,106 | 2,613 |
| 1931–32 | 546 | 225 | 3,053 | 2,913 | 3,107 | 2,903 |
| 1932–33 | 543 | 224 | 2,638 | 2,363 | 2,986 | 2,332 |
| 1933–34 | 558 | 226 | 2,532 | 2,225 | 2,857 | 2,158 |
| 1934–35 | 589 | 233 | 2,785 | 2,402 | 2,745 | 2,099 |
| 1935–36 | 628 | 248 | 3,026 | 2,808 | 2,751 | 2,038 |
| 1936–37 | 686 | 272 | 3,528 | 3,401 | 2,710 | 1,975 |
| 1937–38 | 751 | 302 | 4,447 | 4,270 | 2,590 | 1,867 |
| 1938–39 | 801 | 322 | 5,212 | 4,673 | 2,660 | 2,021 |
| 19.39–40 | 836 | 341 | 5,639 | 4,785 | 2,785 | 2,117 |
| 1940–41 | 865 | 355 | 5,282 | 4,610 | 2,884 | 2,245 |
| 1941–42 | 900 | 374 | 5,210 | 4,456 | 3,014 | 2,334 |
| 1942–43 | 922 | 388 | 4,782 | 4,130 | 3,124 | 2,674 |
| 1943–44 | 954 | 408 | 5,360 | 4,584 | 3,358 | 2,648 |
| 1944–45 | 992 | 438 | 5,436 | 4,864 | 3,142 | 2,572 |
| 1945–46 | 1,036 | 477 | 5,922 | 5,304 | 3,280 | 2,706 |
| 1946–47 | 1,096 | 532 | 6,758 | 5,684 | 3,656 | 3,088 |
| 1947–48 | 1,151 | 593 | 8,074 | 6,922 | 4,086 | 3,348 |
| 1948–49 | 1,192 | 650 | 8,942 | 7,970 | 4,644 | 3,424 |
| 1949–50 | 1,226 | 707 | 10,110 | 8,990 | 5,108 | 3,844 |
| 1950–51 | 1,263 | 774 | 11,974 | 10,422 | 5,498 | 4,476 |
| 1951–52 | 1,304 | 866 | 13,661 | 12,121 | 6,106 | 4,857 |
| 1952–53 | 1,345 | 958 | 16,373 | 14,405 | 6,818 | 5,585 |
| 1953–54 | 1,381 | 1,058 | 18,367 | 16,063 | 7,510 | 6,168 |
| 1954–55 | 1,427 | 1,184 | 20,444 | 18,113 | 8,252 | 6,495 |
| 1955–56 | 1,463 | 1,324 | 22,755 | 20,774 | 8,449 | 7,110 |
| 1956–57 | 1,494 | 1,464 | 25,631 | 23,692 | 8,793 | 7,307 |
| 1957–58 | 1,528 | 1,623 | 28,337 | 26,449 | 9,296 | 8,057 |
| 1958–59 | 1,561 | 1,804 | 30,741 | 28,694 | 10,024 | 8,414 |
| 1959–60 | 1,598 | 2,026 | 33,362 | 30,526 | 11,148 | 8,849 |
| 1960–61 | 1,695 | 2,278 | 37,526 | 33,292 | 12,062 | 9,738 |
| 1961–62 | 1,723 | 2,548 | 40,909 | 36,148 | 13,366 | 10,690 |
| 1962–63 | 1,751 | 2,843 | 44,255 | 39,559 | 14,783 | 12,026 |
| 1963–64 | 1,793 | 3,195 | 49,034 | 43,714 | 16,385 | 13,643 |
| 1964–65 | 1,846 | 3,609 | 54,198 | 48,656 | 17,608 | 14,624 |
| 1965–66 | 1,911 | 4,070 | 62,963 | 55,638 | 19,645 | 15,729 |
| INDUSTRIAL STOPPAGES | ||||||||
|---|---|---|---|---|---|---|---|---|
| Year | Total Industrial Stoppages* | Firms Affected | Total Duration (Days) | Average Duration (Days) | Workers Involved† | Working Days Lost† | Average Days Lost per Worker Involved† | Estimated Loss in Wages† |
*The number of lockouts included in total industrial stoppages were: 1925, 2; 1928, 2; 1929, 1; 1931, 1; 1940, 1; 1944, 1; and 1965, 2. †Includes workers indirectly involved. ‡In each of the years 1964 and 1966 4 stoppages resulted in an additional 4 penalty (suspension) stoppages provided for under Port Bureau Rules. §Road transport and electrical industry stoppages affected a large number of firms, the total for which has been excluded as numbers are not available, apart from one firm which was affected by a road transport stoppage in the first quarter. | ||||||||
| $ | ||||||||
| 1921 | 77 | 112 | 769 | 9.99 | 10,433 | 119,208 | 11.43 | 180,954 |
| 1922 | 58 | 67 | 851 | 14.68 | 6,414 | 93,456 | 14.57 | 121,564 |
| 1923 | 49 | 79 | 603 | 12.31 | 7,162 | 201,812 | 28.18 | 228,148 |
| 1924 | 34 | 58 | 134 | 3.94 | 14,815 | 89,105 | 6.01 | 125,464 |
| 1925 | 83 | 93 | 598 | 7.20 | 9,905 | 74,552 | 7.53 | 98,298 |
| 1926 | 59 | 67 | 314 | 5.32 | 6,264 | 47,811 | 7.63 | 64,710 |
| 1927 | 38 | 40 | 83 | 2.18 | 4,476 | 12,485 | 2.79 | 23,638 |
| 1928 | 39 | 56 | 253 | 6.49 | 9,258 | 21,997 | 2.38 | 44,608 |
| 1929 | 47 | 60 | 342 | 7.28 | 7,151 | 25,889 | 3.62 | 53,880 |
| 1930 | 38 | 44 | 392 | 10.32 | 5,467 | 31,669 | 5.79 | 74,598 |
| 1931 | 24 | 37 | 262 | 10.92 | 6,356 | 48,486 | 7.63 | 89,088 |
| 1932 | 23 | 67 | 313 | 13.61 | 9,355 | 108,605 | 11.61 | 211,430 |
| 1933 | 15 | 43 | 205 | 13.67 | 3,558 | 65,099 | 18.30 | 118,668 |
| 1934 | 24 | 37 | 120 | 5.00 | 3,773 | 10,393 | 2.75 | 14,242 |
| 1935 | 12 | 65 | 88 | 7.33 | 2,323 | 18,563 | 7.99 | 30,532 |
| 1936 | 43 | 128 | 221 | 5.14 | 7,354 | 16,980 | 2.31 | 25,772 |
| 1937 | 52 | 72 | 320 | 6.15 | 11,411 | 29,916 | 2.62 | 64,258 |
| 1938 | 72 | 103 | 287 | 3.99 | 11,388 | 35,456 | 3.11 | 84,208 |
| 1939 | 66 | 636 | 416 | 6.30 | 15,682 | 53,801 | 3.43 | 120,788 |
| 1940 | 57 | 99 | 435 | 7.63 | 10,475 | 28,097 | 2.68 | 56,124 |
| 1941 | 89 | 97 | 233 | 2.62 | 15,261 | 26,237 | 1.72 | 69,104 |
| 1942 | 65 | 78 | 143 | 2.20 | 14,345 | 51,189 | 3.57 | 126,358 |
| 1943 | 69 | 114 | 122 | 1.77 | 10,915 | 14,687 | 1.35 | 40,358 |
| 1944 | 149 | 269 | 281 | 1.89 | 29,766 | 52,602 | 1.77 | 148,024 |
| 1945 | 154 | 1,255 | 379 | 2.46 | 39,418 | 66,629 | 1.69 | 185,092 |
| 1946 | 96 | 122 | 259 | 2.70 | 15,696 | 30,393 | 1.94 | 80,224 |
| 1947 | 134 | 234 | 834 | 6.22 | 26,970 | 102,725 | 3.81 | 375,338 |
| 1948 | 101 | 885 | 608 | 6.02 | 28,494 | 93,464 | 3.28 | 391,970 |
| 1949 | 123 | 1,315 | 672 | 5.46 | 61,536 | 218,172 | 3.55 | 781,546 |
| 1950 | 129 | 1,189 | 567 | 4.40 | 91,492 | 271,475 | 2.97 | 1,028,472 |
| 1951 | 109 | 354 | 3,464 | 31.78 | 36,878 | 1,157,390 | 31.38 | 6,222,614 |
| 1952 | 50 | 177 | 108 | 2.16 | 16,297 | 28,123 | 1.73 | 138,742 |
| 1953 | 73 | 880 | 145 | 1.99 | 22,175 | 19,291 | 0.87 | 96,866 |
| 1954 | 61 | 447 | 136 | 2.23 | 16,153 | 20,474 | 1.27 | 132,732 |
| 1955 | 65 | 114 | 211 | 3.25 | 20,224 | 52,043 | 2.57 | 370,574 |
| 1956 | 50 | 426 | 390 | 7.80 | 13,579 | 23,870 | 1.76 | 168,412 |
| 1957 | 51 | 88 | 165 | 3.24 | 15,545 | 28,186 | 1.81 | 166,046 |
| 1958 | 49 | 83 | 152 | 3.10 | 13,709 | 18,788 | 1.37 | 128,464 |
| 1959 | 73 | 119 | 229 | 3.14 | 18,762 | 29,651 | 1.58 | 214,922 |
| 1960 | 60 | 80 | 344 | 5.73 | 14,305 | 35,683 | 2.49 | 232,824 |
| 1961 | 71 | 89 | 353 | 4.96 | 16,626 | 38,185 | 2.30 | 298,670 |
| 1962 | 96 | 129 | 498 | 5.18 | 39,921 | 93,157 | 2.33 | 749,484 |
| 1963 | 60 | 91 | 366 | 6.09 | 14,911 | 54,490 | 3.65 | 496,226 |
| 1964‡ | 93 | 230 | 333 | 3.58 | 34,779 | 66,834 | 1.92 | 513,072 |
| 1965 | 105 | 218 | 287 | 2.73 | 15,267 | 21,814 | 1.43 | 184,040 |
| 1966‡ | 145 | 151§ | 462 | 3.19 | 33,132 | 99,095 | 2.99 | 878,192 |
1642 European discovery of New Zealand by Tasman.
1769 Captain Cook's first visit to New Zealand.
1791 Discovery of Snares and Chatham Islands.
1792 First sealing gang left on New Zealand coast.
1814 Arrival of Rev. Samuel Marsden, and introduction of Christianity. Horses, cattle, sheep, and poultry first brought to New Zealand.
1820 Hongi's visit to England. First vessel entered Auckland Harbour.
1823–28 Jurisdiction of Courts of Justice in New South Wales extended to British subjects in New Zealand.
1825 First attempt at colonisation, by an expedition under Captain Herd.
1827 Hongi's forces destroyed mission station at Whangaroa.
1831 Tory Channel whaling station established. Application of 13 chiefs for the protection of King William IV.
1833 Mr James Busby appointed British Resident at Bay of Islands.
1834 Waimate Pa, near Opunake, shelled and captured by British - first occasion on which HM troops employed in New Zealand.
1835 Declaration of independence of the whole of New Zealand as one nation, with title of "United Tribes of New Zealand''. Ngati-Awa tribes migrated to and conquered Chatham Islands.
1838 Pelorus Sound discovered.
1839 Governor of New South Wales authorised to include within the limits of that colony any territory that might be acquired in sovereignty by Her Majesty in New Zealand. Preliminary expedition of New Zealand Company under Colonel Wakefield arrived at Port Nicholson.
1840 Arrival of New Zealand Company's settlers at Port Nicholson. Treaty of Waitangi signed. British sovereignty proclaimed. Captain Hobson appointed Lieutenant-Governor, with residence at Auckland. Settlements formed at Petre (Wanganui) and Akaroa.
1841 Issue of charter of incorporation of New Zealand Company. New Zealand proclaimed independent of New South Wales. Arrival of New Plymouth settlers.
1842 Settlement founded at Nelson.
1843 Affray with Maoris at the Wairau.
1844 Royal flagstaff at Kororareka cut down by Heke.
1845 Destruction of Kororareka by Heke.
1846 Arrival of first steam vessel (HMS Driver) in New Zealand waters. Capture of pa at Ruapekapeka and termination of Heke's war. Maori hostilities near Wellington. Te Rauparaha captured and detained as a prisoner. New Zealand divided into two provinces, New Munster and New Ulster, and representative institutions conferred.
1847 Attack by Maoris on Wanganui.
1848 Suspension of that part of New Zealand Government Act which had conferred representative institutions. Otago founded.
1850 Surrender of New Zealand Company's charter, all its interests reverting to the Imperial Government. Canterbury founded.
1852 Discovery of gold at Coromandel. Constitution Act passed, granting representative institutions to New Zealand, and dividing country into six provinces.
1854 Opening at Auckland of first session of the General Assembly.
1855 First members elected to the House of Representatives under system of responsible Government. Very severe earthquake on both sides of Cook Strait.
1856 Appointment of first Ministry under system of responsible Government.
1857 Goldfield opened at Collingwood.
1858 New Provinces Act passed. Hawke's Bay Province constituted.
1859 Establishment of Marlborough Province.
1860 Hostilities in Waitara district
1861 Truce arranged with Waitara Maoris. Bank of New Zealand incorporated. Southland Province established. Gold discovered at Gabriel's Gully, Otago.
1862 Coromandel proclaimed a goldfield. Wreck of s.s. White Swan, with loss of many public records. First electric-telegraph line opened - Christchurch to Lyttelton.
1863 Wreck of HMS Orpheus on Manukau bar, with loss of 181 lives. Control of Maori affairs transferred to Colonial Government. Commencement of Waikato War. Defeat of Maoris at Rangiriri, and occupation of Ngaruawahia. First railway in New Zealand, portion of Christchurch-Lyttelton line, opened.
1864 Severe fighting in Waikato and elsewhere, including battles of Rangiaohia, Orakau, Gate Pa, and Te Ranga. First major discovery of gold on West Coast of South Island.
1865 Seat of Government transferred to Wellington. Further fighting, followed by proclamation of peace. Activities of Hauhau fanatics, including murders of Europeans. Rebel Maoris defeated at Wairoa.
1866 Cook Strait submarine telegraph cable laid.
1867 Opening of Thames Goldfield. Lyttelton Tunnel completed. Admission of four Maori members to House of Representatives as direct representatives of Maori people.
1868 Maori prisoners, under leadership of Te Kooti, seized schooner Rifleman and escaped from Chatham Islands to mainland where they massacred Europeans. Considerable fighting with these and other rebel Maoris.
1869 Continuation of fighting with rebels and of pursuit of Te Kooti. Visit of H.R.H. the Duke of Edinburgh. Government Life Insurance Office established.
1870 Further fighting with Te Kooti. Last of Imperial troops left New Zealand. Commencement of San Francisco mail service. Possession taken of Bounty Island. Inauguration of Vogel public works policy. Act passed to establish the New Zealand University. Southland Province reunited with Otago.
1871 Commencement of railway construction under public works policy.
1872 Resumption of friendly relations with Waitara Maoris. Appointment of Maori chiefs (two) to Legislative Council. Public Trust Office created.
1873 Establishment of New Zealand Shipping Co.
1874 In pursuance of immigration and public works policy 31,774 assisted immigrants arrived. Westland Province established.
1875 Resumption of amicable relations with Maori King. Establishment of Union Steam Ship Company. Abolition of Provinces Act passed.
1876 New Zealand connected by cable with Australia. Abolition of Provinces Act came into operation, provincial institutions being abolished and the country divided into counties and boroughs.
1877 Education Act passed, providing for free compulsory education.
1878 Completion of the Christchurch-Invercargill railway.
1879 Triennial Parliaments Act passed. Adult male suffrage introduced. Kaitangata coal mine explosion, whereby 34 lives lost.
1881 Wreck of s.s. Tararua, with loss of 130 lives.
1882 First shipment of frozen meat from New Zealand.
1883 Direct steamer communication inaugurated between New Zealand and England.
1885 New Zealand Industrial Exhibition at Wellington.
1886 Tarawera eruption, involving loss of 101 lives and destruction of Pink and White Terraces.
1887 Annexation of Kermadec Islands. Members of House of Representatives reduced to 74, including four Maoris.
1888 British protectorate over Cook Islands proclaimed.
1889 South Seas Exhibition at Dunedin.
1890 Great maritime strike. First election of House of Representatives under one-man-one-vote principle.
1891 Inauguration of Liberal régime under Hon. John Ballance, succeeded on his death in 1893 by Mr Seddon. This and following years marked by passage of industrial and social legislation.
1892 Introduction of lease-in-perpetuity system of land tenure.
1893 Franchise extended to women. Special licensing poll introduced.
1894 Industrial Conciliation and Arbitration Act passed. Government Advances to Settlers Act passed. Wreck of s.s. Wairarapa, with loss of 135 lives.
1896 Brunner Mine explosion, causing 67 deaths. Abolition of non-residential or property qualification to vote. Government Valuation of Land Act passed.
1898 Old-age Pensions Act passed.
1899 Labour Day instituted. New Zealand contingent (the first of 10) sent to South Africa.
1900 Number of European representatives in Lower House increased to 76.
1901 T.R.H. the Duke and Duchess of York visited New Zealand. Penny postage adopted by New Zealand. Cook and other Pacific islands annexed.
1902 Pacific cable opened. Wreck of s.s. Elingamite, with loss of 43 lives. Conference of colonial Premiers in London.
1903 Empire Day proclaimed. State Fire Insurance Act passed.
1905 Workers' Dwellings Act passed. Title of New Zealand's representative in London altered to "High Commissioner''.
1906 Death of Right Hon. R. J. Seddon, Premier since 1893. Advances to Workers Act passed. New Zealand International Exhibition at Christchurch.
1907 New Zealand constituted a Dominion. Lease-in-perpetuity system of land tenure abolished. Parliament Buildings destroyed by fire.
1908 Through railway communication established between Wellington and Auckland. Wellington-Manawatu railway purchased by Government. Second Ballot Act passed.
1909 S.s. Penguin wrecked in Cook Strait, with loss of 75 lives. Battle cruiser presented by New Zealand to Imperial Government. System of compulsory military training introduced.
1910 Field-Marshal Lord Kitchener reported and advised on New Zealand defences. Public Debt Extinction Act and National Provident Fund Act passed.
1911 Wireless telegraphy installed in New Zealand. Widows' Pensions Act passed. First poll on national prohibition taken.
1912 Foundation stone of new Parliament Buildings laid. Public Service placed under Commissioner control.
1913 Extensive strikes. Second Ballot Act repealed.
1914 Western Samoa occupied by New Zealand Advance Expeditionary Force. Main Expeditionary Force left for Egypt. Huntly coal mine disaster, with loss of 43 lives.
1915 New Zealand Expeditionary Force engaged in operations on Gallipoli Peninsula. National Cabinet formed. National register of men compiled. Pensions for miners introduced.
1916 New Zealand Division transferred to Western Front, Mounted Brigade being retained in Egypt. Compulsory enrolment of men for war service introduced. Lake Coleridge electric-supply scheme opened.
1918 S.s. Wimmera sunk by enemy mine off New Zealand coast, with loss of 26 lives. Otira Tunnel pierced. End of First World War. Great influenza epidemic, causing nearly 7,000 deaths.
1919 Women made eligible for seats in Parliament. New Zealand represented at Peace Conference by Right Hon. W. F. Massey, Prime Minister.
1920 Visit of H.R.H. the Prince of Wales. Railway strike. First aeroplane flight over Cook Strait. League of Nations gave New Zealand mandate to administer Western Samoa. Anzac Day constituted.
1921 Samoa Act passed, making provision for government in terms of mandate. New Zealand represented at Disarmament Conference, Washington.
1922 Meat-export trade placed under control of a board.
1923 Opening of Otira Tunnel. Ross Dependency proclaimed, and placed under jurisdiction of Governor-General. Dairy Produce Export Control Act passed.
1924 Railway strike. Direct two-way radio communication effected with England. Motor Vehicles Act provided for registration and annual licensing of motor vehicles. Land Transfer (Compulsory Registration of Titles) Act passed. Pensions for blind persons introduced. S.s. Ripple foundered off Cape Palliser with loss of 16 lives.
1925 New Zealand and South Seas International Exhibition at Dunedin. Administration of Tokelau (Union) Islands transferred to New Zealand.
1926 Family Allowances Act passed.
1927 Visit of T.R.H. the Duke and Duchess of York. Summer Time Act passed.
1928 Kingsford Smith and party made first successful flight across Tasman Sea.
1929 Severe earthquake in Murchison-Karamea district caused 17 deaths. Daylight saving (half hour) permanently adopted for summer months.
1930 Legislation providing for relief of unemployment first passed.
1931 Worst earthquake in history of New Zealand occurred in Hawke's Bay, resulting in the loss of 255 lives. General reduction of 10 percent in wages and salaries. Parliament approved draft Statute of Westminster. Mortgagors' relief legislation passed.
1932 Industrial Conciliation and Arbitration Amendment Act made important changes in industrial legislation. National Expenditure Adjustment Act made reductions in old-age and other pensions, in salaries of State employees, and in rentals, interest rates, and other fixed charges. The historic Waitangi Estate presented to the nation by Their Excellencies Lord and Lady Bledisloe. New Zealand represented at Ottawa Conference.
1933 Exchange raised at instance of Government to £125 N.Z. for £100 London (telegraphic transfers). Sales tax instituted. Conversion of internal public debt with reduction in interest rates, and provision made for local authorities interest reduction and loans conversion. Successful experimental shipments of chilled beef to England. Issue of New Zealand silver coinage.
1934 First official trans-Tasman air mail. Reserve Bank incorporated and commenced business. H.R.H. the Duke of Gloucester arrived on an official visit. First licensed air transport service commenced operations.
1935 Bank notes of trading banks ceased to be legal tender. Rural Mortgagors Final Adjustment Act passed, and Court of Review established. National Government defeated at general election, and Labour Government assumed office for first of four successive terms.
1936 Inauguration of inter-Island trunk air services. Reserve Bank nationalised. System of guaranteed prices for butter and cheese introduced. Forty-hour week became operative. Powers of Court of Arbitration restored. Railcar services inaugurated. New Zealand elected to seat on League of Nations Council.
1937 New Zealand represented at Imperial Conference by Right Hon. M. J. Savage, Hon. W. Nash, and Mr W. J. Jordan. Death of Lord Rutherford of Nelson.
1938 Mr W. J. Jordan, New Zealand's representative on League of Nations, elected President of the League Assembly. Social Security Act passed. Introduction of import selection and control.
1939 Declaration of war with Germany. Recruitment for 2nd New Zealand Expeditionary Force. Arrangements for purchase of primary products by Imperial Government. New Zealand Centennial Exhibition opened at Wellington. Naval engagement off River Plate in which HMS Achilles, largely manned by New Zealand ratings, took part.
1940 Centennial celebrations. Departure of First Echelon of 2nd New Zealand Expeditionary Force. Death of the Prime Minister, the Right Hon. M. J. Savage; succeeded in office by Hon. P. Fraser. Declaration of war with Italy. RMS Niagara sunk off New Zealand coast by enemy mine. Ballots for military service. National savings scheme inaugurated.
1941 Daylight saving period extended to cover whole year. First enrolment of married men for military service. Declaration of war with Japan. Territorial Forces mobilised.
1942 Complete mobilisation of Military Forces ordered. Introduction of control of industrial manpower. Compulsory enrolment of all male British subjects between ages of 18 and 65 inclusive, in Emergency Reserve Corps. Lend-lease reciprocal aid extended to include Australia and New Zealand. Gold to value of $4.8 million salvaged from RMS Niagara. Rationing introduced. Mobilisation of women for essential work.
1943 Death of Right Hon. J. G. Coates, M.c., member of War Cabinet and former Prime Minister. North African campaign brought to a successful conclusion. Railway accident near Hyde - 21 persons killed. 2nd NZEF (3rd Division) took part in action against Japanese in the Pacific Area.
1944 Australia - New Zealand Agreement 1944, providing for collaboration on matters of mutual interest. Mutual-aid Agreement between Canadian and New Zealand Governments signed.
1945 War in Europe ended (8 May). Manpower controls in regard to women and young persons relaxed. Wartime press censorship abolished. War Cabinet dissolved. War in Pacific ended. Japan formally surrenders (15 August). Electoral Amendment Act providing for abolition of the "country quota'' passed. South Island Main Trunk Railway opened, through rail connection from Picton to Bluff established.
1946 First women members of Legislative Council (two) appointed. Restrictions on consumption of electric power imposed in North Island. Remaining manpower controls lifted in June. Family benefit of $1 per week made universal as from 1 April. Lieutenant-General Sir Bernard Freyberg, v.c., assumed office as Governor-General (17 June). Railways Department inaugurated inter-island air freight service.
1947 $25 million presented to United Kingdom Government by New Zealand. Local Government Commission appointed. First woman Cabinet Minister in New Zealand appointed. Marketing of dairy produce and fixation of basic price taken over by Dairy Commission. Statute of Westminster adopted by New Zealand Parliament.
1948 Licensing Control Commission appointed. Mt. Ngauruhoe erupts after 22 years' quiescence. Adjustment of exchange rate to parity with sterling as from 20 August.
1949 Polls on the establishment of off-course betting and on an alteration in hotel hours held in March. Referendum on question of compulsory military training answered in the affirmative. Labour Government defeated and National Government assumed office on 13 December for first of three successive terms.
1950 British Empire Games held at Auckland. Control of land sales, except of farm land, lifted. Control of sterling funds and securities relaxed. Abolition of petrol and butter rationing. Two New Zealand frigates departed for Korean waters. Legislative Council Abolition Act passed. Kayforce sailed from Wellington for Korea on 10 December. Death of Right Hon. Peter Fraser, Prime Minister, 1940–49.
1951 Prolonged waterfront strike resulted in Proclamation of State of Emergency, and issue of regulations under the Public Safety Conservation Act. Servicemen kept essential cargoes moving. Waterfront unions deregistered, followed by deregistration of certain other unions – e.g., freezing workers - seamen and miners also involved. Establishment of Civil Emergency Reserve. Off-course betting operations commenced by Totalisator Agency Board. United States of America, Australia, and New Zealand signed Pacific Security Treaty.
1952 Royal Commission on Railways. Proclamation of the accession of Queen Elizabeth II read by the Governor-General at Parliament Buildings on 11 February. New Zealand team at Olympic Games at Helsinki gained one gold and two bronze medals. Report of Royal Commission on the Waterfront Industry released.
1953 Power restrictions suspended in North Island, first time for 12 years. Coronation Day for Her Majesty Queen Elizabeth the Second marked in New Zealand by nation-wide civic programmes. Mt. Everest conquered on 29 May by British expedition, the summit being reached by the New Zealander Edmund Hillary and the Sherpa Tensing. Armistice agreement signed in Korea. The London-Christchurch air race won by RAF Canberra No. 3 in record time of 23 hours 51 minutes. New Zealand's worst railway disaster occurred at Tangiwai on Christmas Eve, with a death roll of 154 persons. Arrival of Her Majesty Queen Elizabeth the Second and His Royal Highness the Duke of Edinburgh, on 23 December, the first occasion on which a reigning monarch had visited these shores. Her Majesty broadcast to the Common-wealth and Empire from Auckland on 25 December. The first Proclamation issued by a reigning Sovereign in New Zealand summoned Parliament for its opening by the Queen on 12 January 1954.
1954 Continuation of Royal Tour, including meetings of the Privy Council and Executive Council and opening of a special session of Parliament. New Zealand took seat on United Nations Security Council. New Zealand won seven gold, seven silver, and five bronze medals at Empire Games in Vancouver. The Executive Council and Cabinet held meetings at Auckland on 25 May to mark the centenary of parliamentary government in New Zealand. New Zealand signed the South-East Asia Treaty at Manila.
1955 New Zealand made contribution to defence of South-East Asia by sending squadron of fighter bombers and part transport squadron to Malaya and, later in the year, an Army Special Air Service Squadron. Pulp and paper mill at Kawerau begins operation. Rimutaka tunnel opened for traffic in November.
1956 Report of Royal Commission on Monetary, Banking, and Credit Systems released. Roxburgh and Whakamaru power stations in operation. Guaranteed price scheme for potatoes announced. Petition for increased State aid to private schools rejected. Building controls abolished. Team sent to Olympic Games at Melbourne wins two gold medals. Colombo Plan Conference held in Wellington. Duke of Edinburgh visited New Zealand.
1957 New Zealand Antarctic Expedition established Scott Base at Pram Point, McMurdo Sound. New Zealand shared fully in programme for International Geophysical Year, including Antarctic section. Dairy produce given unrestricted, duty-free right of entry to Britain till 1967. Plan announced to almost double generating capacity of New Zealand's power systems by 1970 at cost of $470 million, including the laying of a cable across Cook Strait. Restraints on credit continued. Lord Cobham succeeded Lord Norrie as Governor-General on 5 September. Separate Court of Appeal constituted. Sir Leslie Munro elected President of United Nations General Assembly. National Government defeated and Labour Government assumed office on 12 December. Battalion sailed for service in Malaya.
1958 Import selection and exchange allocation brought into force to conserve overseas exchange. Sir Edmund Hillary and companions reached South Pole overland from Scott Base. Royal Tour of Her Majesty the Queen Mother. PAYE taxation on incomes introduced. Electric power restrictions in North Island. Increase in family and age benefits. Army reorganised as an operational regular brigade group. New Zealand won four gold, six silver, and nine bronze medals at Empire Games in Cardiff. Power generated from geothermal steam at Wairakei and from coal station at Mercer. Report made by Royal Commission on Local Authority Finance. Revised trade pact provided for variation of margins of preference on United Kingdom imports.
1959 Mr C. M. Bennett, a distinguished Maori, appointed High Commissioner in Malaya. National Consumer Council appointed and four regional consumer committees established. Institute of Nuclear Sciences established. Commission of inquiry into meat industry. Scheme provided for capitalisation of family benefit for housing purposes. Auckland Harbour Bridge opened (May). Reconstructed Wellington Airport opened for traffic (July). S.s. Holmglen foundered off Timaru with loss of 15 lives. Twelve nations, including New Zealand, signed treaty to preserve Antarctica for peaceful scientific research for all time.
1960 Government signed agreement for company to use power from Te Anau - Manapouri Lakes system for large aluminium smelting industry. Report issued by Committee on New Zealand Universities chaired by Sir David Hughes Parry. Regular television programmes began in Auckland. Commission on Education appointed with Sir George Currie as chairman. Institute of Economic Research established. Meat export development company formed. Industrial Development Conference held in Wellington. New Zealand athletes won two gold medals in one day at Olympic Games in Rome, also one bronze medal. Government Service Equal Pay Act passed. Conference of British Commonwealth Statisticians held in Wellington. Labour Government defeated and National Government assumed office on 13 December.
1961 Review of Maori Affairs (Hunn Report) published. Trade agreement with Malaya signed. United Nations seminar on Human Rights held in Wellington. Right of unrestricted and duty free access to United Kingdom market for meat and dairy produce emphasised in discussions on possible entry of United Kingdom into European Economic Community; assurance given that special arrangement will be sought to protect vital interests of New Zealand. Minister to European Economic Community appointed. Expansion of overseas trade posts and wide extension of market surveys. Tasman Empire Airways became wholly owned by New Zealand (later renamed Air New Zealand). Monetary and Economic Council appointed. New Zealand joined International Monetary Fund, International Bank for Reconstruction and Development, and International Finance Corporation. New Customs tariff introduced. Tenders accepted for Cook Strait electric power cable. Death of Right Hon. Sir Sidney Holland, Prime Minister, 1949–57. Television broadcasts extended to Wellington and Christchurch.
1962 Western Samoa became first independent Polynesian State. Trade promotion council established to advise Government on all matters affecting overseas trade. Television extended to Dunedin. New Zealand Broadcasting Service became a corporation. Cook Strait rail-ferry service commenced with Aramoana. Visit of King Bhumibol and Queen Sirikit of Thailand. Protracted discussions, including Commonwealth Prime Ministers' Conference, on possible trade repercussions of Britain's proposal to join European Economic Community. Report presented by Royal Commission on State Services chaired by Mr Justice McCarthy. Building programme for universities 1963–68 at cost of $52 million approved in principle. United Nations and ECAFE seminar on basic statistics for economic and social development held in Wellington. Brigadier Sir Bernard Fergusson succeeded Lord Cobham as Governor-General. New Zealand won 10 gold, 12 silver, and 10 bronze medals at Commonwealth Games at Perth and was third most successful country behind Australia and England. New Tasman cable link completed as part of Commonwealth Pacific cable.
1963 Breakdown of Britain's bid to enter European Economic Community; New Zealand held an Export Development Conference in Wellington and sent trade missions to several countries, including Australia, the United States of America, Canada, Japan, Korea, Hong Kong. Visit of Her Majesty Queen Elizabeth II and His Royal Highness the Duke of Edinburgh. The Queen opened New Zealand House in London. Approval was given by Government for expenditure of £22 million on defence re-equipment, for a seven-year $15 million radio and TV expansion programme, for development of a $28 million New Zealand iron and steel industry. The World Bank loaned $5.6 million for port development. A ten-shilling unit was decided upon for the introduction of decimal coinage in July 1967. Work was begun on the $18.8 million Manapouri tail-race tunnel as part of an electric-power project. Death of Lord Freyberg, New Zealand wartime leader and former Governor-General. Crash of a National Airways Corporation DC3 aircraft in the Kaimai Ranges killed 23 persons, and 15 lives lost in accident to a bus returning from Waitangi Royal celebrations. Controversy over proposed French nuclear tests in Pacific.
1964 Access road tunnel of six miles commenced for underground powerhouse at Lake Manapouri. Loan of $23.2 million negotiated with World Bank to meet overseas costs of inter-island power transmission. Three Cook Strait cables, each of 25 miles, laid as part of inter-island transmission project. Start made on Tongariro hydro-electric power scheme at estimated cost of $140 million. Use of natural gas at Kapuni investigated. Oil refinery opened at Whangarei. Report of port streamlining committee to speed up turn round of ships; Exports and Shipping Council established. New agreement on beef exports to United States. Agricultural Development Conference held. First school of veterinary science opened at Massey University, Grants of $64.6 million to universities approved for five years from 1965. Big increase in tourist receipts to $18.0 million for year. New Zealand team won three gold and two bronze medals at Olympic Games in Tokyo. Reports made by overseas consultants on steps to meet traffic problems of central areas of main cities. Private savings banks opened by trading banks.
1965 United Nations Economic Commission for Asia and the Far East held its 21st session in Wellington attended by some 300 delegates and observers from 37 countries. Centenary of parliamentary goverment in New Zealand. Eleventh Conference of Commonwealth Parliamentary Association held in Wellington. First visit to New Zealand of an Archbishop of Canterbury. Inter-island electric power transmission project completed. Increased expenditure planned for higher education, technical institutes, and teachers' colleges. First tender let for construction work on New Zealand's longest traffic tunnel (5 m. 43 ch.) for Kaimai railway deviation. Contract let for oil-fired thermal power station at Marsden Point, Whangarei. Artillery unit committed to combat service in Vietnam. Limited free trade agreement negotiated with Australia. Cook Islands became self-governing. Auckland International Airport came into use. Jet airliners (three DC8's) obtained by Air New Zealand. Haast Pass highway opened to link South Westland and Otago. Millionth telephone installed. $44.6 million drawn from International Monetary Fund. New Zealand elected to United Nations Security Council.
1966 Labour force reached 1,000,000. Licensed television sets reach 500,000 with 60 percent of houses equipped. Value of goods produced in New Zealand factories exceeds $2 thousand million. Tender for $12 million let for widening Auckland Harbour Bridge. Further port modernisation plans announced by harbour boards. Collier Kaitawa sank off Cape Reinga with loss of 29 lives. Embassies established in Rome and Bonn. Royal Tour by Her Majesty the Queen Mother. Visits by the President of the United States, Mr Lyndon B. Johnson, and the Vice-President, Mr Hubert Humphrey. Vogel Building of 17 storeys completed and occupied by Ministry of Works in Wellington. An Encyclopaedia of New Zealand published. New Zealand won eight gold, five silver, and 13 bronze medals at Commonwealth Games in Jamaica. Social Credit party gains first seat in Parliament. Contract let for main steel mill building at Glenbrook, South Auckland. Revival of United Kingdom interest in joining European Economic Community.
| Subject | Year | Page |
|---|---|---|
| Building stones | 1,892 | 194 |
| Varieties of soil | 1,892 | 193 |
| Patents, designs, and trade marks | 1,893 | 350 |
| Acclimatisation | 1,894 | 430 |
| Co-operative system of constructing public works | 1,894 | 234 |
| Frozen meat trade, the | 1,894 | 311 |
| Labour in New Zealand | 1,894 | 362 |
| Railways in New Zealand: Their history and progress | 1,894 | 377 |
| Sheep farming | 1,894 | 302 |
| Southern Alps, the | 1,894 | 474 |
| State farms | 1,894 | 243 |
| West Coast Sounds, the | 1,894 | 482 |
| Cheviot Estate, the | 1,895 | 264 |
| Shipping companies | 1,895 | 389 |
| Wellington-Manawatu railway, the | 1,895 | 381 |
| Laws of England and New Zealand, difference between | 1,896 | 281 |
| Waihi Gold Mining Co. | 1,897 | 432 |
| Wattle growing in the Auckland Provincial District | 1,897 | 430 |
| Mount Cook: Its glaciers, and the Hermitage | 1,898 | 552 |
| Scenic wonderland, a | 1,898 | 565 |
| Christchurch to West Coast, journey from | 1,899 | 548 |
| Forest trees and the timber industry | 1,899 | 470 |
| Gold dredging industry, the | 1,899 | 509 |
| Moa, heir of the | 1,899 | 517 |
| Mount Cook district, the | 1,899 | 554 |
| Tokaanu to Raetihi | 1,899 | 539 |
| Tuhoeland | 1,899 | 546 |
| Waikato district and through to Wanganui | 1,899 | 520 |
| Waiouru to Mangaonoho | 1,899 | 543 |
| Chatham Islands, the | 1,900 | 531 |
| Coal deposits of New Zealand, the | 1,900 | 479 |
| Hemp industry, the | 1,900 | 477 |
| Kauri gum | 1,900 | 489 |
| Maori mythology | 1,900 | 536 |
| Mount Sefton, ascent of and a night on Mount Cook | 1,900 | 519 |
| New Zealand contingents for South Africa | 1,900 | 449 |
| Pumice-stone deposits of New Zealand | 1,900 | 486 |
| Wanganui River, up the, to Tokaanu | 1,900 | 509 |
| Maori religion | 1,901 | 530 |
| Marlborough Sounds, and Otago lakes, the | 1,901 | 517 |
| Sydney pageant, the | 1,901 | 527 |
| Cook Islands, the laws of | 1,902 | 573 |
| Maori, neolithic, the | 1,902 | 578 |
| Maori sociology | 1,903 | 641 |
| Timber trees of the world | 1,903 | 605 |
| Exotic trees in Canterbury | 1,904 | 569 |
| Hanmer thermal springs | 1,905 | 631 |
| Maori, colour sense of the | 1,905 | 637 |
| Thermal springs district | 1,905 | 614 |
| Maori marriage customs | 1,906 | 638 |
| Tree planting | 1,906 | 611 |
| White Island, a day on | 1,906 | 637 |
| Subject | Year | Page |
| Maori, ancient: His amusements, games, etc. | 1,907 | 707 |
| New Zealand international exhibition | 1,907 | 701 |
| Maori, ancient: His clothing, etc. | 1,908 | 734 |
| Agriculture in New Zealand | 1,912 | 809 |
| HMS New Zealand and Government training ship Amokura | 1,913 | 932 |
| Mineral waters of New Zealand | 1,913 | 896 |
| External trade of New Zealand, the | 1,915 | 858 |
| Maori, topographical nomenclature of the | 1,919 | 936 |
| Wages and working hours in New Zealand | 1,919 | 860 |
| Education system of New Zealand, the | 1,925 | 816 |
| Effect of nativity order on infant mortality | 1,925 | 835 |
| Local government in New Zealand | 1,925 | 845 |
| Terman intelligence tests in New Zealand schools | 1,925 | 823 |
| Wellington municipal milk supply | 1,925 | 777 |
| Cancer in New Zealand: A statistical study | 1,926 | 889 |
| Totalisator, the | 1,926 | 838 |
| Britomart, mission of, at Akaroa, in August 1840 | 1,927 | 1,012 |
| Mortality rates, New Zealand | 1,927 | 995 |
| Livestock production: A review based on standard values and units | 1,929 | 990 |
| Dairy farm survey | 1,938 | 429 |
| Ross Dependency | 1,938 | 900 |
| Plants and fauna | 1,940 | 28 |
| Libraries | 1,940 | 928 |
| Mineral waters and spas | 1,940 | 935 |
| Tourist attractions | 1,940 | 932 |
| Alexander Turnbull Library | 1,946 | 914 |
| National Film Unit | 1,946 | 724 |
| Retail prices in New Zealand, with special reference to the Consumers' Price Index | 1947–49 | 998 |
| Economic policy and national income | 1,950 | 1,033 |
| Department of Scientific and Industrial Research | 1951–52 | 1,066 |
| Standardisation | 1951–52 | 1,076 |
| Sources of statistical information | 1,953 | 1,016 |
| Royal Tour of New Zealand, 23 December 1953 to 31 January 1954 | 1,954 | 1,121 |
| New Zealand: Its tourist industry, tourist and sporting attractions, and travel information | 1,955 | 1,143 |
| Royal Commission on Monetary, Banking, and Credit System: Summary of report | 1,956 | 1,201 |
| Consumers' Price Index—1955 Revision | 1,957 | 1,214 |
| New Zealand Activities in the Antarctic | 1,958 | 1,247 |
| New Zealand's International Activities | 1,959 | 1,221 |
| Grassland Research in New Zealand | 1,960 | 1,243 |
| University Education for Science and Technology | 1,961 | 1,186 |
| New Zealand and the European Economic Community | 1,962 | 1,150 |
| Visit of Her Majesty Queen Elizabeth II and His Royal Highness the Duke of Edinburgh, 6 to 18 February 1963 | 1,963 | 1,167 |
| The Development of New Zealand's Railway System 1863–1963 | 1,963 | 1,175 |
| The Arts in New Zealand, including the visual arts, literature, music and opera, and drama and ballet | 1,964 | 1,145 |
| The Maori People as shown by the Population Census 1961 | 1,965 | 1,160 |
| Industrial Relations—The next Ten Years and Beyond | 1,966 | 1,131 |
| Population Growth and Economic Development in New Zealand | 1,966 | 1,136 |
Table of Contents
PATRONAGE has always been part of the history of the arts. Today, if the arts are to flourish in the face of strong competition from mass media entertainment, private patronage must be supplemented by State assistance. In New Zealand, as in other countries, the State is taking an increasing part in providing financial help to culture.
The Department of Education, the Council of Adult Education, the Community Arts Service, and the New Zealand Broadcasting Corporation have for many years past given valuable assistance to the arts in the course of their everyday functions. The principal channel for direct financial assistance by the State has been through the Department of Internal Affairs.
The Government displayed a notable interest in historical literature at the time of the centennial celebrations in 1940. A series of centennial surveys, covering various aspects of the country's history, and other works, such as the Dictionary of New Zealand Biography and Making New Zealand, were commissioned and published by the Department of Internal Affairs, forming a landmark in New Zealand historical publishing.
In 1946 State aid for literature was established on a permanent footing through the New Zealand Literary Fund, financed from the vote of the Department of Internal Affairs.
Assistance for the arts other than literature began in 1947, art union profits being used instead of tax moneys. A small portion of these profits was allocated to a Cultural Fund from which assistance was given on the recommendation of the Department of Internal Affairs with the approval of its Minister and the Prime Minister. The fund was used to help talented young people in the arts to further their studies abroad. Bursaries were awarded to pay for expenses of travel and study or to supplement scholarships. A few small grants were made to national organisations representing one or other of the arts.
Over the years, as more money was allocated to the Cultural Fund, the scheme of assistance administered by the Department was broadened. Recipients of bursaries were selected on the recommendation of committees of people with professional qualifications in the arts. Grants to national administrative organisations were also continued and others were made to emerging groups showing promise of becoming professional companies, viz., the New Zealand Opera Company, the New Zealand Ballet Company, and the New Zealand Players Company. In the visual arts, grants were made to meet the transport costs throughout New Zealand of exhibitions from overseas, while exhibitions of New Zealand art were sent abroad. Exhibitions of New Zealand books both in New Zealand and abroad were supported, and the publishing of a few books outside the scope of the New Zealand Literary Fund was financed.
Arts Advisory Council—The next important step, taken in 1960, was the establishment of the Arts Advisory Council. A main aim of the Council was the encouragement of professional standards, and accordingly substantial recurring grants were made to the New Zealand Opera Company and the New Zealand Ballet Trust. Assistance was given to the New Zealand Federation of Chamber Music Societies, the New Zealand Drama Council, the British Drama League, the Christchurch Civic Orchestra Foundation, the New Zealand Film Institute, the Association of New Zealand Art Societies, and a number of regional activities. Its training awards were tenable either overseas or locally, travel grants to and from New Zealand were awarded, and overseas artists were encouraged to give master classes. The Council directly commissioned works from artists, allocated money for the purchase of contemporary works of art, including pottery and paintings. It subsidised the transport expenses of important exhibitions in the visual arts.
Queen Elizabeth the Second Arts Council—In October 1963 legislation establishing the Queen Elizabeth the Second Arts Council of New Zealand was passed. By a Proclamation under the Act it came into force on 1 April 1964. The Arts Council was charged to encourage, foster, and promote the practice and appreciation of the arts in New Zealand, to make accessible to the public of New Zealand all forms of artistic and cultural work, to improve the standard of execution of the arts, and to foster and maintain public interest in the arts and culture of New Zealand.
The Council set up four main committees, each dealing with one of the main branches of the arts—music, visual arts, ballet, and drama. On each of these committees one or more members of the Council sit, the rest of the committee being composed of people experienced in the relevant art form.
The Council's policy is largely governed by the funds available to it and its basic problem has been to determine the priorities among the many hundred of claimants for its assistance. Naturally, the principal objective of the Council is the encouragement of activities that are professional in character and standard, and to this end it regards its major responsibility as being to maintain at the highest level of performance the New Zealand Opera Company, the New Zealand Ballet, the regional orchestra projects in Auckland, Wellington, Christchurch, and Dunedin, and the professional theatre.
The Council is aware of the importance of the creative artist to the community and its aim is to devise and shape policies that provide the necessary stimulus to composers, playwrights, choreographers, and artists to produce the best of which they are capable.
There is no doubt that New Zealand as a whole provides considerable support for the arts, but the tendency exists for its resources, both financial and artistic, to be diffused so that the quality of performance and presentation that comes from concentrating talents and finance is lost.
No organisation can raise standards and spread its activities at the same time. To reconcile the highest standard of performance with the needs of scattered communities throughout New Zealand will be one of the major problems the Council will have to solve in the coming years.
The Council operates on an annual budget and for the year ended 31 December 1966 received grants of $60,000 from the Government and $400,000 from the Golden Kiwi Board of Control.
Before any permanent art galleries were established in New Zealand, groups of interested people in a number of centres formed themselves into the first art societies. The history of the art societies and art galleries is closely linked, and in a number of cases, particularly in the smaller centres, facilities and services are still shared. Generally, however, the institutions have developed their separate functions and they occupy separate premises. The Association of New Zealand Art Societies was founded in 1930 to help the societies to co-ordinate their activities and to co-operate on matters of common interest. There are now 38 member institutions, and the association is thus the most representative in this country in matters generally pertaining to the amateur visual arts. Art gallery interests are fostered by the Art Galleries and Museums Association of New Zealand, all the main galleries being members.
Auckland City Art Gallery—Opened in 1887, the Auckland City Art Gallery was the first in New Zealand. At that time the collection was formed of the old master paintings and other works given by Sir George Grey, a former Governor of New Zealand, a few works by local artists, together with gifts from J. McCosh Clark, Albin Martin, the Auckland Society of Arts, and others. Among the many gifts of pictures and money by citizens, mention must be made of the J. T. Mackelvie bequest of a large collection of pictures and objects d'art with an endowment of $44,000 for its development. The gallery is financed by the city council.
National Art Gallery—Officially opened in 1936, the National Art Gallery occupies the first floor of the National Art Gallery and Dominion Museum, the ground floor housing the museum collections. The two institutions are administered by a board of trustees, with separate management committees for the gallery and museum, these having been constituted under the National Art Gallery and Dominion Museum Act 1930. In 1936, the New Zealand Academy of Fine Arts, Wellington, sold its gallery in Whitmore Street (this having been in effect a Wellington City Art Gallery) and devoted proceeds of the sale, its art collection, and building fund to the National Art Gallery. In return for this, the academy was granted accommodation in perpetuity within the gallery, but it remains a distinct and separate body.
Finance for the National Art Gallery is provided by annual grants from the Government, the Wellington City Council, the Wellington Harbour Board, the Lower Hutt City Council, and from other adjacent local bodies. Works of art are purchased by the Sir Harold Beauchamp and T. Lindsay Buick bequests, through grants from the Government and Wellington City Council, and from time to time, from the T. G. Macarthy Trust.
The main collection is confined to contemporary paintings, drawings, and sculpture by British and foreign, and New Zealand and Australian artists. Gift collections include the Archdeacon Smythe (eighteenth- and ninteenth-century British water-colours and drawings) and the Nicholas Chevalier, William Swainson, and J. C. Richmond collections (early New Zealand). The gallery is particularly rich in graphic art thanks to the gift collections from Bishop Monrad (mainly early Dutch and Flemish), Sir John Ilott (etchings and engravings by old and modern masters), and Rex Nan Kivell (contemporary British).
Robert McDougall Art Gallery—The Robert McDougall Art Gallery, Christchurch, was named after the donor and was opened in 1932. It is administered and wholly financed by the Christchurch City Council, who appoint the Art Gallery Committee.
The main collections include European art of the late nineteenth and twentieth centuries, New Zealand oil paintings, water-colours, and graphic art (early and contemporary), and a special Canterbury section. There is also a collection of miniatures. The Canterbury Art Society presented its collection of 118 paintings and other works of art to the McDougall Gallery when it was officially opened.
Dunedin Public Art Gallery—The permanent collection of the Dunedin Public Art Gallery originated in purchases from the New Zealand and South Seas Exhibition 1889. Two sections of the exhibition building were purchased by the Art Gallery Society to house these works. These erections of corrugated iron and timber served till 1905 when Lady McLean instigated the building of a permanent gallery which has now become the Early Settlers' Museum. A second New Zealand and South Seas Exhibition, 1925–26, featured an important overseas art exhibition for which an attractive and well-designed gallery was built in Logan Park. This building was purchased by Sir Percy and Lady Sargood and presented to the city as a memorial to their son, killed in the First World War. This is the present Dunedin Public Art Gallery.
The overseas collection includes a fine Romney and other notable works from the eighteenth century to the present day. Archdeacon Smythe's main gift of eighteenth- and nineteenth-century British water-colours and drawings went to the Dunedin Gallery. Van der Velden's Otira Gorge is particularly notable in the New Zealand section which comprises about one-third of the whole collection.
A board of trustees administers the gallery for the city and income derives from city council grants, membership subscriptions, gifts, bequests, and interest on investments.
Other Art Galleries—The collections in the following municipal galleries are generally a combination of European and New Zealand paintings, sculpture, and graphic art of the nineteenth and twentieth centuries.
The Sarjeant Art Gallery, Wanganui, beautifully sited in Queen's Park and opened in 1919, is named for the donor, Henry Sarjeant. It is maintained by the Wanganui City Council and administered by a subcommittee of the council.
The Hawke's Bay Art Gallery and Museum, Napier, owes its being to the initiative of the local art society. The art gallery was opened in 1936, the centre block added in 1938, the museum wing with the Children's Museum in 1954, and the Holt Gallery in 1959.
The Gisborne Art Society, originally a branch of the Hawke's Bay and East Coast Society became independent in 1953, and acquired a spacious old homestead, Kelvin Rise, for use as an art gallery and museum.
The Hamilton Art Gallery is under the control of the Waikato Society of Arts. The building was presented in 1941 by Mrs Allen Bell and opened as a public art gallery in 1947.
The Art Gallery, Palmerston North, is owned and maintained by the city council but is administered by the Manawatu Society of Arts. It was erected in 1959 with public subscriptions, contributions from the art society, and a subsidy from the city council.
The Bishop Suter Art Gallery, Nelson, was founded in 1898 as a memorial to Andrew Burn Suter, Bishop of Nelson. It is administered by a self-perpetuating trust board.
The Southland Centennial Museum provides a small art gallery in Invercargill, controlled by the Museum Trust Board, comprising representatives of contributing local authorities and other interested bodies.
The Invercargill Public Art Gallery, opened in 1951, is situated in a fine house given to the city by the late Sir Robert and Lady Anderson. The gallery is financed by annual grants from the Invercargill City Council, Southland Savings Bank, and subscriptions and donations, and is administered for the city council by the local art society.
In 1956, J. W. Grant gave to the citizens of Timaru the property in Wai-iti Road which is now known as the Aigantighe Art Gallery.
The Waihi Arts Centre and Museum represents an enterprising venture in establishing a gallery that will be sufficiently lively to attract visitors from other larger centres.
Important collections of early New Zealand paintings are held by the Alexander Turnbull Library, Wellington; the Hocken Library; the Auckland City Public Library; and the Canterbury Public Library, Christchurch.
Exhibitions—Most art galleries owe their inception to the initiative of groups of citizens, very often the local art society; their premises to private benefactors; and their maintenance and running costs to the Government (in the case of the National Gallery), to local authorities, and, to a lesser extent, to members' subscriptions. Staffing generally is meagre, and the combined purchasing resources of all the galleries scarcely reaches five figures.
To compensate for this inadequacy, temporary loan exhibitions from overseas have always been an important feature of art gallery activities. In the early part of the century these were provided by the Baillie and Murray Fuller exhibitions, and collections brought out in connection with industrial exhibitions organised from time to time in the main centres. In 1932 the Empire Art Loan Exhibitions Society was founded in London by Sir Percy Sargood "to arrange from public or private sources, exhibitions of representative works of fine art and craft work for loan to galleries and art societies within the British Commonwealth of Nations, the Colonies and Dependencies of Great Britain''. Under this scheme many important exhibitions have been brought to New Zealand and Australia, the two countries acting as a separate zone for reasons of economy. Grants from the Department of Internal Affairs defrayed transport costs within New Zealand.
In 1939 the National Gallery was entrusted with the task of assembling the Centennial Exhibition of International and New Zealand Art. The international section included sculpture by Henry Moore, Eric Gill, Charles Wheeler, paintings by Marquet, Vlaminck, Utrillo, Dufy, John, Peploe, Paul and John Nash, Frances Hodgkins, and Stanley Spencer among the total of 562 items. After the Second World War, the British Council provided numerous important exhibitions and others were secured through the good offices of diplomatic representatives in Wellington. Since 1956 Eric Westbrook and Peter Tomory, both with previous exhibition experience with the Arts Council of Great Britain, and Gilbert Docking, formerly Director of the Newcastle Art Gallery, New South Wales, have ensured an abundant programme through the Auckland Gallery. From 1960 to 1964 grants from the Department of Internal Affairs, on the recommendation of the Arts Advisory Council, eased the financial strain, particularly in the case of the smaller participating galleries, and since 1 April 1964 the Queen Elizabeth the Second Arts Council of New Zealand has continued these grants, initiated further travelling exhibitions, commissioned works of art, and subsidised the purchase of items for gallery collections.
Auckland War Memorial Museum—After the First World War, Auckland citizens sub-scribed over $400,000 to erect a War Memorial Museum on Observatory Hill in the Auckland Domain. Twenty-four local authorities in the Auckland metropolitan area agreed to support the museum by annual contributions, and the council of the institute was widened to include representatives of the local authorities. In 1960 an extension to the museum, costing $900,000, was opened as a Second World War Memorial. Citizens of the Auckland provincial district subscribed over half this sum and the balance was met with a Government subsidy.
Dominion Museum—The Dominion Museum was founded by the Government in 1865, as the Colonial Museum, in a building built for the purpose in Museum Street, Wellington. The first curator was Dr (afterwards Sir) James Hector, Director of the Geological Survey. In 1907, on the colony being declared a Dominion, the Colonial Museum became the Dominion Museum. As the collections had outgrown the building, plans were made in 1912 for a new building on the same site, but nothing was done until after the First World War. A board of trustees was then set up to control the Dominion Museum and National Art Gallery and in 1936 both institutions took up joint occupancy of a new building on an elevated site in Buckle Street, Wellington.
Canterbury Museum—The Canterbury Museum was opened to the public in 1866, when the Provincial Geologist, Julius von Haast, arranged his collections in the Provincial Council Building. Haast was familiar with the cultural movements that had already stirred European countries to action and, with the support of a small band of pioneer citizens, he worked to found a permanent museum. A building was finally erected on the present site and opened in 1870. Additions were made in 1872, 1876, 1882, and 1958, the last being a Centennial Memorial Wing costing $300,000 which almost doubled the exhibition floor space and included a lecture theatre seating 250. With the end of provincial government, in 1876, the control of the museum passed to the University of Canterbury, with a substantial endowment of high-country land. The income from this source declined, and from 1947 the administration and maintenance of the museum has been undertaken by a trust board supported by the local authorities of Canterbury.
Otago Museum—The founding of the Otago Museum followed the successful New Zealand Exhibition, held in Dunedin in 1865. Dr (later Sir James) Hector's collections of geological and other specimens were held to be of such permanent value and interest that in 1868 the Hector collection was opened to the public as the Otago Museum in a gallery of the new post office. In 1874 the Provincial Government decided that the museum should be housed in a permanent building and voted $25,000 for the first portion of the present structure. Following the abolition of provincial government, control of the museum was transferred to the Otago University in 1877, with pastoral lands to provide an income. This amounted to about $1,540 annually and soon proved inadequate. Additions to the buildings were made in 1890 (the annexe), 1910 (the Hocken Wing), 1929 (the Willi Fels Wing), and 1963 (the Centennial Memorial Wing). This latest addition, costing $350,000, added 30,000 sq. ft to the display halls, storerooms, and staff quarters, including two auditoria seating 400 and 150 respectively. The Otago University could not provide increased funds for the growth of the museum, and in 1955 control was transferred to a trust board representing the contributing local authorities of Otago.
Other Museums—Natural history and ethnological collections of national value are maintained at the four metropolitan museums, together with reference libraries. At Auckland a Museum of Transport and Technology was formed in 1964 on a site at Western Springs, and it is attracting the support of industry and specialist societies. At Christchurch a similar Museum of Science and Industry opened in 1965 on a site at Hornby. Historical material of local interest has been collected and displayed at the Waitangi Treaty House; Pompallier House; the Russell Museum; the Waimate North Mission House; the Waipu Pioneers' Memorial Museum; the Dargaville and Whangarei Museums; the Matakohe and Port Albert Museums; the Melanesian Mission Museum at Auckland; the Coromandel, Thames, and Waihi Mining Museum; the Gavin Gifford Memorial Museum, Te Awamutu; the Elms Mission House, Tauranga; the Hawke's Bay Art Gallery and Museum; the Norsewood Pioneer Museum; Richmond Cottage, New Plymouth; the Smith Memorial Museum, Picton; the Riverlands Cob Cottage; Nelson Museum; the Langlois-Eteveneaux House, Akaroa; Canterbury Museum; the South Canterbury Historical Society, Timaru; the West Coast Historical Museum, Hokitika; the North Otago Pioneer Gallery, Oamaru; the Otago Early Settlers' Association, Dunedin; the Alexandra Historical Museum; the Lakes District Centennial Museum, Arrowtown; Southland Museum, Invercargill; and the Stewart Island Museum (whaling).
Educational activities at the four metropolitan museums were stimulated by the generous gift of $20,000 from the Carnegie Corporation, and in 1938 education officers were appointed to teach museum—half their salary being paid from the grant and half by the Department of Education. From 1941 the museum education service was accepted as part of the education system of New Zealand.
In 1947 the Art Galleries and Museums Association of New Zealand (Inc.) was formed to raise the standard of service, exchange information, and improve the qualifications of staff. Forty-five art galleries and museums, and 100 members of trust boards and staffs belong to the association, which has instituted a system of fellowships and travel and training grants, and holds meetings and issues newsletters to further its objects.
In the literary field, the following awards are available:
New Zealand Literary Fund—This fund is financed by a yearly appropriation on the vote of the Department of Internal Affairs. Assistance from the fund is granted by the Minister of Internal Affairs, who is advised by the Literary Fund Advisory Committee. The approved categories of assistance are: (1) Grants towards the publishing costs (or by other appropriate means) to enable the publication of writing of literary merit in such fields as contemporary creative literature, historical writing, reprints of New Zealand classics, and Maori literature; (2) Grants to New Zealand authors undertaking creative work on approved projects; (3) Grants towards the cost of publication (or other appropriate means) of critical books and studies, to encourage the reading and study of New Zealand literature; (4) Such other assistance as the committee, with better knowledge gained by its experience, may deem desirable.
Scholarship in Letters—The scholarship is available annually for award to a New Zealand writer by the Queen Elizabeth the Second Arts Council on the recommendation of the Literary Fund Advisory Committee. It is of the value of $2,000. The scholarship is intended to enable the recipient to give all or most of his time to the project or projects nominated by him, either in New Zealand or abroad, during the year of tenure. Applications for tenure during the following calendar year are made by 30 September to the Secretary, New Zealand Literary Fund Advisory Committee, Department of Internal Affairs, Private Bag, Wellington.
Robert Burns Fellowship in Literature—This fellowship in literature is tenable for one year, with provision for extension, at the University of Otago, a condition being that the fellow shall be resident for the academic year. The fellowship is open to New Zealand writers, preferably under 40 years. The fellow receives the equivalent of a lecturer's salary. Applications are made to the Registrar, University of Otago, Dunedin.
Award for Achievement—The Award for Achievement, of $200, is available annually for award to a New Zealand writer by the Queen Elizabeth the Second Arts Council on the recommendation of the Literary Fund Advisory Committee. (Applications are not called for.)
Esther Glen Award—This award of the New Zealand Library Association is available annually for award to the author of the most distinguished children's book written by a New Zealander and published in New Zealand during the year. The award of a medal. (Applications are not called for.)
Hubert Church Prose Award—This award of PEN (New Zealand Centre) is available annually for the best prose writing by a New Zealand author during the year in question. The amount is $200. (Applications are not called for.)
Jessie Mackay Poetry Award—This award of PEN (New Zealand Centre) is available annually for the best poetry written by a New Zealand author during the year in question. The amount is $100. (Applications are not called for.)
Katherine Mansfield Memorial Award—This award of the New Zealand Women Writers' Society (Inc.) is financed from funds provided by the Bank of New Zealand. It is open to New Zealanders (both men and women) by birth or residence. In 1965 the award was made for a short story, the prize being $210. The next competition will be in 1967.
Frances Hodgkins Fellowship—Open to painters and sculptors, at the University of Otago. It is tenable for one year and the fellow receives the equivalent of a lecturer's salary.
This Act, which came into force on 1 April 1963, has for its main purpose the control of the export from New Zealand of Maori artifacts of early type, important books and papers more than 90 years old of which there is no copy in the main types of library, and biological, botanical, and mineralogical type specimens. Permission of the Minister of Internal Affairs for the export of historic articles must be secured, and the Minister may withhold permission if he is satisfied that removal would be detrimental to historical or scientific study or research in New Zealand, or contrary to the public interest.
Though a Controller of Dominion Archives was appointed in 1926, in the person of the Librarian of the General Assembly Library, it was not until the Archives Act 1957 was passed that the protection of New Zealand's public records was put on a firm statutory basis.
The Archives Act established a National Archives to provide for the custody and preservation of the public archives of New Zealand. The Chief Archivist, appointed under the Act, has certain statutory powers. No archives, as defined in the Act, can be destroyed without his approval and he has powers of inspection and direction in respect of the keeping of public records. All Government records of permanent value are deposited with National Archives, and considerable original research is done in the National Archives by scholars, students, officials, and the public.
National Archives has a records centre in Lower Hutt and one in Auckland. These provide storage for semi-current government records as well as public archives. The total staff, including that of records centres, is 15. An officer of the National Archives also collaborates with the State Services Commission on assignments on the management of current records. Some public archives of regional interest are deposited with certain non-government repositories approved by the Minister of Internal Affairs, such as the Hocken Library in Dunedin, the Canterbury Museum in Christchurch, the Hawke's Bay and East Coast Art Society Gallery and Museum in Napier, the Auckland Institute and Museum, the New Plymouth Public Library, and the Marlborough Historical Society Museum in Blenheim.
Under the Historic Places Act 1954 a New Zealand Historic Places Trust was created for the purpose of preserving and marking historic places and objects, together with those of archaeological, scientific, educational, architectural, literary, or any other special interest. The Trust is composed of 14 members, the majority of whom are appointed on the nomination of some learned or professional body. A branch organisation operates through either regional committees, of which there are 12, or representatives, of whom there are five. This multiplicity of obligations, measured against its means, makes some sort of selection advisable, and much of the early emphasis of Trust work was concerned with the erection of bronze plaques and notice boards to commemorate significant sites or buildings. Inscriptions had to be painstakingly studied and carefully prepared. But the Trust is slowly giving more attention to preservation which, in the case of buildings, often means first-aid repairs and, less frequently, restoration or, in the case of sites, the reserves machinery operated by the Lands and Survey Department and other departments. Repairs are usually financed through a grant-in-aid to the owner or occupant. The title to the property is not affected because the Trust considers that continued use is essential for preservation. In fact the Trust has taken title to only two properties, namely, the Waimate North Mission House, the object of a comprehensive programme of restoration, and an armed constabulary and militia redoubt site at Pirongia gifted to the Trust. The Trust is also aware of the accelerating loss of our prehistoric heritage. Roading, hydro-electric development, closer settlement and other undertakings all on an increasing scale, have meant the loss or destruction of many of our archaeological remains. The Trust has assisted those groups or institutions anxious about the need for some form of salvage archaeology. But this need has now reached such a scale that a more systematic and continuing answer is required. The Trust would like to have archaeologists permanently employed on this work, well in advance of the bulldozers, and surveying or rescuing those field monuments under threat. It has already begun such a programme for the area affected by the Tongariro power development scheme. The Trust also publishes booklets and leaflets, usually about buildings and sites in which it has been actively interested. It also has a growing photographic collection and through its regional committees has begun to record and classify the historic and architecturally significant buildings and the more important sites throughout the country.
Table of Contents
Compiled in the Alexander Turnbull Library, Wellington
THE following list of books and serials has been compiled to give New Zealand and overseas readers a selective approach to the country's literature and sources of information. Entries are arranged alphabetically under appropriate subject headings which are in approximate order of the Dewey Classification. Emphasis has been placed on works which are known to be in print, but standard works which are out of print have been included where necessary. Selection has covered books published in New Zealand as well as books published overseas about New Zealand or written by resident New Zealanders. Works which are clearly university or school texts have been omitted unless they represent the most concise and authoritative treatment of a subject. Works of less than 75 pages have been indicated by an asterisk.
The standard current bibliography of New Zealand books and pamphlets as from 1967 is the New Zealand National Bibliography issued by the Alexander Turnbull Library for the National Library of New Zealand. This replaces Copyright Publications formerly issued by the General Assembly Library and the Current National Bibliography formerly issued by the National Library Centre. Prices of New Zealand imprints have been converted to decimal currency on the basis of prices shown in the Associated Booksellers New Zealand books in print, in publishers' catalogues and from other sources, but prices of overseas publications are given at the overseas rate.
Having regard to the importance of serial publications as records of current research, opinion, and original work, a number of journals, annuals, and bulletins have been cited where appropriate. In sections where they occur the serials follow the monographs in a separate sequence, and, where not otherwise noted, prices are for a year's subscription.
Copyright Periodicals currently received—The 1967 issue, issued by the General Assembly Library is the standard approach to the full range of published material in this field.
| INDEX TO SUBJECTS | |
|---|---|
| PAGE | |
| Agriculture | 1,105 |
| Antarctica | 1,117 |
| Architecture | 1,108 |
| Arts, general | 1,108 |
| Banking | 1,096 |
| Bibliography, general | 1,094 |
| Biography | 1,116 |
| Biology, general | 1,103 |
| Business management | 1,107 |
| Defence | 1,100 |
| Dentistry | 1,104 |
| Descriptive works | 1,113 |
| Directories | 1,095 |
| Drama and theatre | 1,112 |
| Economics | 1,096 |
| Education | 1,099 |
| Encyclopaedias | 1,095 |
| Essays | 1,112 |
| Fauna | 1,103 |
| Fiction | 1,110 |
| Flora | 1,104 |
| Forestry | 1,105 |
| Gazetteers | 1,112 |
| Geography (descriptive works) | 1,113 |
| Geology | 1,102 |
| Government | 1,098 |
| Historical works | 1,114 |
| Home economics | 1,107 |
| Humour | 1,112 |
| Industry | 1,105 |
| Landscape | 1,108 |
| Language | 1,107 |
| Law | 1,097 |
| Libraries | 1,094 |
| Literature, general | 1,109 |
| Maori language | 1,107 |
| Maori people, past and present | 1,101 |
| Medicine | 1,104 |
| Mental health | 1,095 |
| Miscellaneous | 1,112 |
| Music | 1,108 |
| Painting | 1,108 |
| Pacific islands | 1,117 |
| Plays | 1,112 |
| Poetry | 1,109 |
| Power | 1,105 |
| Psychology | 1,095 |
| Public administration | 1,098 |
| Religion | 1,095 |
| Science, general | 1,102 |
| Social science | 1,095 |
| Sport | 1,108 |
| Statistics | 1,095 |
| Technology | 1,105 |
| Transport and communications | 1,100 |
| World wars | 1,115 |
| ABBREVIATIONS | |
|---|---|
| a. | Annually |
| Ak. | Auckland |
| Assn | Association |
| Ch | Christchurch |
| Dept. | Department |
| D.S.I.R. | Department of Scientific and Industrial Research |
| Dn | Dunedin |
| Ed. | Edition; Editor |
| Govt. Print. | Government Printer |
| irr. | Irregular |
| Lond. | London |
| m. | Monthly |
| Mimeo. | Mimeographed |
| n.p. | No price |
| N.Y. | New York |
| o.p. | Out of print |
| O.U.P. | Oxford University Press |
| Pr | Press |
| q. | Quarterly |
| vol. | Volume |
| Wn | Wellington |
ALEXANDER TURNBULL LIBRARY, English Printed Books to 1700 in the Alexander Turnbull Library. Wn, Alexander Turnbull Library, 1963, 50c.
FAIR, A. P. R. Guide to Book Values, New Zealand – Australia – Pacific – Antarctic. Book Auction Records, 1956–61. Wn, the Author, 1961. $2.00.
HARRIS, J. W. Guide to New Zealand Reference Material. 2d Ed. Wn, N.Z. Library Assn, 1950. Supplements, 1951, 1957. 75c.
HOCKEN, T. M. A. Bibliography of the Literature Relating to New Zealand. Wn, Govt. Print., 1909. o.p.
*NATIONAL LIBRARY SERVICE. School Library Service. Books to Enjoy: Forms I and II. 2d Ed. Wn, National Library Service, 1964.
PARK, I. M. New Zealand Periodicals of Literary Interest. Wn, Library School, National Library Service, 1962. gratis.
UNION CATALOGUE OF NEW ZEALAND NEWSPAPERS PRESERVED IN PUBLIC LIBRARIES, NEWSPAPER OFFICES, AND LOCAL AUTHORITY OFFICES. 2d Ed. Wn, General Assembly Library, 1961. J. S. Gully, comp. $1.00.
UNION LIST OF SERIALS IN NEW ZEALAND LIBRARIES. 2d Ed. Wn, National Library Service, 1964. $7.00
UNION LIST OF THESES OF THE UNIVERSITY OF NEW ZEALAND, 1910–54. D. L. Jenkins, comp. Wn, New Zealand Library Assn, 1956. Mimeo. $2.00.
—— Supplement 1955–1962, with some additions and corrections … Wn, New Zealand Library Association, 1963. $1.20.
*WILSON, J. O. A Finding List of British Parliamentary Papers Relating to New Zealand, 1817–1900. Wn, General Assembly Library, 1960. 75c.
INDEX TO NEW ZEALAND PERIODICALS. Wn, National Library, 1947–a. $3.75.
N.Z. GENERAL ASSEMBLY LIBRARY. Copyright Newspapers Currently Received. Biennial. 15c.
N.Z. GENERAL ASSEMBLY LIBRARY. Copyright Periodicals Currently Received. Biennial. 50c.
N.Z. National Library. New Zealand National Bibliography 1967–$5.00.
MC ELDOWNEY, W. J. The New Zealand Library Association 1910–60 and its Part in New Zealand Library Development. Wn, N.Z. Library Assn, 1962. $1.20.
NATIONAL LIBRARY SERVICE. School Library Service. Planning the School Library. New Ed. Wn, 1962. gratis.
N.Z. LIBRARY ASSOCIATION. Special Libraries and Collection; a New Zealand Directory. Wn, N.Z. Library Assn, 1959. 50c.
OSBORN, A. D. New Zealand Library Resources: Report of a Survey … Wn, N.Z. Library Assn. 1960. 75c.
TAYLOR, C. R. H. A Pacific Bibliography. 2d Ed. Oxford, Clarendon Press, 1965. $8.00.
TAYLOR, D. M. The Oldest Manuscripts in New Zealand. Wn, N.Z. Council for Educational Research, 1955. $2.20.
WHO'S WHO IN NEW ZEALAND LIBRARIES, 1962. A. L. Olsson, ed. Wn, N.Z. Library Assn, 1962. 50c.
NEW ZEALAND LIBRARIES. NZ. Library Association, 10 Park St., Wellington. m. $2.00 to non-members.
AN ENCYCLOPAEDIA OF NEW ZEALAND. Edited by A. H. McLintock. Wn, Govt. Print., 1966. $15.00.
THE NEW ZEALAND BUSINESS WHO'S WHO, 1964 Ed. Wn, L. T. Watkins, 1964. $11.75.
NEW ZEALAND MANUFACTURERS' FEDERATION. Official Directory of Members. Ak, Breckell & Nicholls, 1965.
NEW ZEALAND WRITERS' AND PUBLISHERS' YEAR BOOK, 1965. Ak. Len Bolton, 1965. $1.25. OXFORD NEW ZEALAND ENCYCLOPAEDIA. Lond., O.U.P., 1965. $6.00.
UNIVERSAL BUSINESS DIRECTORIES LTD. Universal Business Directories. 9 vol. $25.20.
WISE'S NEW ZEALAND POST OFFICE DIRECTORY. 4 vols. Auckland city, 1962–63; Auckland Province, 1961–62; Wellington city and environs, 1963; Wellington, Hawke's Bay and Taranaki Provinces, 1959–60; Christchurch city and suburbs, 1962; Canterbury, Nelson, Marlborough, and Westland, 1960–61; Otago and Southland.. 1963.
LAWRENCE, P. J., ed. Mental Health and the Community. Ch, Canterbury Mental Health Council 1963. $3.50.
ROGERS, C. A. Measuring Intelligence in New Zealand. Ak, Auckland University, 1956. $1.75.
STALLWORTHY, K. R. The Facts of Mental Health and Illness. 3d Ed. Ch, N. M. Peryer, 1961. $2.40.
VICTORIA UNIVERSITY OF WELLINGTON. Dept. of Psychology. Publications in Psychology. The Department, Box 196, Wn. irr. Not for sale.
ELDER, J. R. History of the Presbyterian Church of New Zealand, 1840–1940. Ch, Presbyterian Bookroom, 1940, o.p.
MORAN, P. F. History of the Catholic Church in Australasia. Sydney, F. Coffee, 1895. 2 vol. o.p.
MORLEY, W. The History of Methodism in New Zealand. Wn, McKee, 1900. o.p.
PURCHAS, H. T. A History of the English Church in New Zealand. Ch, Simpson & Williams, 1914. o.p.
See also MAORI PEOPLE, PAST AND PRESENT.
BROWN, B. M. The Rise of New Zealand Labour; a History of the New Zealand Labour Party from 1916 to 1940. Wn, Price Milburn, 1962. $2.25.
FONG, N. B. The Chinese in New Zealand. Hong Kong, Hong Kong University Press; Lond. O.U.P, 1959, $4.10.
GORDON, B. K. New Zealand Becomes a Pacific Power. Chicago, University of Chicago Press, 1960. $6.30.
GREEN, W. A. E., and others. Social Services in New Zealand. Wn, N.Z. Institute of Public Administration, 1955 n.p.
LARKIN, T. C. New Zealand's External Relations. Wn, N.Z. Institute of Public Administration, London, O.U.P., 1962. $1.80.
LOCHORE, R. A. From Europe to New Zealand: An Account of Our Continental European Settlers. Wn, Reed, 1951. $1.05.
MAZENGARB, O. C. The Story of Heritage … Wn, Reed, 1962. 85c.
NEALE, E. P. Guide to New Zealand Official Statistics. 3d Ed. Ch, Whitcombe & Tombs, 1955. $1.60.
*N.Z. BOARD OF HEALTH. Committee on Services for the Deaf. Services for the Deaf in New Zealand (A Report of a Study Group on Occupational Deafness). Wn, Govt. Print., 1962. gratis.
N.Z. DEPT. OF JUSTICE. Crime and the Community: A Survey of Penal Policy in New Zealand. Wn, Govt. Print., 1964. $2.00.
N.Z. DEPT. OF STATISTICS. Catalogue of New Zealand Statistics. Wn, Govt. Print., 1966. $1.00.
*N.Z. DEPT. OF STATISTICS. Statistical Publications, 1840–1960. Wn, Govt. Print., 1961. 95c.
N.Z. LICENSING CONTROL COMMISSION. Report, etc. Wn, Govt. Print., 1957. 50c.
N.Z. SOCIAL SECURITY DEPARTMENT. The Growth and Development of Social Security in New Zealand. Wn, Govt. Print., 1950. o.p.
*NEW ZEALAND COUNCIL FOR EDUCATIONAL RESEARCH. A Directory of Philanthropic Trusts. Wn, N.Z.C.E.R., 1964. 75c.
PERRY, C. S. The Indecent Publication; a social experiment. Ch, Whitcombe & Tombs, 1965. $2.75.
SCOTT, K. J., ed. Welfare in New Zealand. Wn, N.Z. Institute of Public Administration; Lond. O.U.P., 1955. $1.50.
SHARPE, D. R. Youth Leadership and the Growth of Personality. Wn, Reed, 1966. 85c.
SIMPSON, H. M. The Women of New Zealand. Ak, Paul's Book Arcade, Lond., G. Allen & Unwin, 1962. $2.10.
SUMNER, E. F. W. Superannuation Explained. Wn, Sweet & Maxwell (N.Z.), 1965. $4.50.
*THOMPSON, R. H. T. Race and Sport. Lond., O.U.P., 1964. $1.02.
—— Race Relations in New Zealand: A Review of the Literature. Ch, National Council of Churches, 1964. 75c.
WOOD, F. L. W. New Zealand in the World. Wn, Dept. of Internal Affairs, 1940. o.p.
EXTERNAL AFFAIRS REVIEW. Wn, Dept. of External Affairs. m.
N.Z. DEPARTMENT OF STATISTICS. Farm Production. Wn, Govt. Print., a. 95c.
—— Prices, Wages, and Labour. Wn, Govt. Print., a. 95c.
—— Industrial Production. Wn, Govt. Print., a. $3.00.
—— Population, Migration, and Building. Wn, Govt. Print., a. 75c.
—— Vital Statistics. Wn, Govt. Print., a. 65c.
NEW ZEALAND JOURNAL OF PUBLIC ADMINISTRATION. Wn, N.Z. Institute of Public Administration. Semi-a. 80c.
POLITICAL SCIENCE. Wn, Victoria University of Wellington. Semi-a. 40c.
AUSTRALIA AND NEW ZEALAND BANK LTD. Investment and Industry in New Zealand. Wn, 1964. gratis.
BLYTH, C. A. ed. The Future of Manufacturing in New Zealand. Wn, N.Z. Institute of Public Administration; London, O.U.P., 1964. $2.50.
BRIGHT, T. N. Banking Law and Practice in New Zealand. Wn, Sweet and Maxwell, 1962. $7.00.
BUTLIN, S. J. Australia and New Zealand Bank. Lond., Longmans, 1961. $4.05.
CATT, A. J. L. Investment Decision Making in New Zealand. Wn, N.Z. Institute of Economic Research, 1964. 50c.
CHAPPELL, N. M. New Zealand Banker's Hundred: A History of the Bank of New Zealand, 1861–1961. Wn, The Bank, 1961. Not for sale.
CORNWALL, J. P. M. ed. Planning and Forecasting in New Zealand. Wn, N.Z. Institute of Public Administration; London, O.U.P., 1965. $2.00.
ELKAN, P. G. New Zealand's Butter and Cheese in the European Economic Community. Wn, N.Z. Institute of Economic Research, 1962. gratis.
LLOYD, P. J. The Economic Development of the Tourist Industry in New Zealand. Wn, N.Z. Institute of Economic Research, 1964. gratis.
MARRIS, E. C. New Zealand Investment Guide. Rev. Ed. Wn, N.Z. Financial Times, 1964. $2.00.
MILLER, J. G. A Survey of Farm Credit in New Zealand. Wn, Dept. of Agriculture, 1965. gratis.
MORIARTY, M. J., ed. New Zealand Farm Production and Marketing. Wn, New Zealand Institute of Public Administration; Lond., O.U.P., 1963. $1.80.
N.Z. INSTITUTE OF VALUERS. Principles and Practice of Urban Valuation in New Zealand. 2d Ed. Wn, 1959. $4.20.
*N.Z. MONETARY AND ECONOMIC COUNCIL. The New Zealand Financial System. Wn, Govt. Print., 1966. $1.50.
N.Z. ROYAL COMMISSION ON MONETARY, BANKING, AND CREDIT SYSTEMS. Report. Wn, Govt. Print., 1956. $1.60.
RESERVE BANK OF NEW ZEALAND. Money and Banking in New Zealand. Wn, 1963. 75c.
RESERVE BANK OF NEW ZEALAND. Overseas Trade and Finance, with Particular Reference to New Zealand. Wn, 1966. $1.50.
RIDLER, D. Far East Markets for New Zealand's Meat and Milk. Wn, N.Z. Institute of Economic Research, 1962. 50c.
SIMKIN, C. G. F. The Instability of a Dependent Economy: Economic Fluctuations in New Zealand, 1840–1914. Lond., O.U.P., 1951. o.p.
SINCLAIR, K., and MANDLE, W. F. Open Account: A History of the Bank of New South Wales in New Zealand, 1861–1961. Wn, Whitcombe & Tombs, 1961. –2.75.
CANTERBURY CHAMBER OF COMMERCE. Economic Bulletin. Ch, The Chamber. m. $1.50.
MONTHLY ABSTRACT OF STATISTICS. Wn, Govt. Print. m. 50c. Annual Subscription. $5.00.
RESERVE BANK OF NEW ZEALAND. Bulletin. Wn, The Bank. m. $1.20.
ADAMS, E. C. The Law of Estate and Gift Duties in New Zealand 3d Ed. Wn, Butterworth, 1956. With supp. 1960. $10.00.
ADAMS, E. C. The Law of Stamp Duties in New Zealand. 3d Ed. Wn, Butterworth, 1966. $7.25.
ADAMS, Sir F. B., ed. Criminal Law and Practice in New Zealand. Wn, Sweet & Maxwell (N.Z.), 1964. $14.70.
ANDERSON, H. E., and DALGLISH, D. J. The Law Relating to Companies in New Zealand. 2d Ed. Wn, Brooker & Friend, 1957. o.p.
BARTON, G. P. ed. Judicature Act, including Code of Civil Procedure and Court of Appeal rules. Wn, Sweet & Maxwell (N.Z.), 1965. $5.00.
BARTON, J. S. The New Zealand Company Secretary. 8th Ed. by W. G. Rodger. Wn, Butterworth, 1960. $5.40.
BIRKS, W. R. The Legal Relationship of Parent and Child. Wn, Legal Publications, 1952. $6.00.
BUTTERWORTH'S CASES ANNOTATIONS OF THE NEW ZEALAND STATUTES REPRINT, 1908–57, by H. J. Wily. Wn, Butterworth, 1960–61. 2 vol. $26.00.
CAMPBELL, I. B., and NEAZOR, D. P. Workers' Compensation Law in New Zealand. 2d Ed. Wn, Sweet & Maxwell (N.Z.), 1964. $8.50.
CAMPBELL, I. D. The Law of Adoption in New Zealand. 2d Ed. Wn, Butterworth, 1957. $6.20.
CASEY, M. E. Hire Purchase Law in New Zealand. Wn, Sweet & Maxwell, 1960. $2.50.
CHALMERS, C. C The Road Traffic Laws of New Zealand. 4th Ed. by R. T. Dixon. Wn, Butterworth, 1964. $11.20.
CROSS, A. R. N. Evidence. New Zealand edition by D. L. Mathieson. Wn, Butterworth, 1963. $10.50.
CUNNINGHAM, H. A. Taxation Laws of New Zealand. 5th Ed. Wn, Butterworth, 1963. $13.75.
CURRIE, A. E. Crown and Subject. Wn, Legal Publications, 1953. $5.50.
DAVIS, A. G. Law of Torts in New Zealand. 2d Ed. Wn, Butterworth, 1959. $7.20.
DOBBIE, A. E. Probate and Administration Practice in New Zealand. Wn, Butterworth, 1951. $7.70.
DUGDALE, D. F. New Zealand Hire Purchase Law. 2d Ed., Wn, Butterworth, 1965. $3.25.
GARROW, J. M. E. Garrow and Spence's Criminal Law. 4th Ed. Wn, Butterworth, 1962. $11.50.
—— Garrow's Law of Real Property. 5th Ed. Wn, Butterworth, 1961. $12.75.
—— Garrow and Gray's Law of Personal Property in New Zealand. 4th Ed. Wn, Butterworth, 1959. $7.70.
GARROW, J. M. E., and HENDERSON, E. W. Garrow and Henderson's Law of Trusts and Trustees .. 3rd Ed. Wn, Butterworth, 1966. $8.75.
GARROW, J. M. E., and WILLIS, J. D. Garrow and Willis's Law of Wills and Adminstration and Succession on Intestacy. 3d Ed. Wn, Butterworth, 1960, with supp. 1963. $14.00.
—— Garrow and Willis's Principles of the Law of Evidence in New Zealand. 5th Ed. Wn, Butterworth, 1966. $6.25.
GOODALL, S. I. Goodall's Law and Practice Relating to Conveyancing in New Zealand. 2d Ed. Wn, Butterworth, 1951. o.p.
GRIEVE, G. F. Industrial Conciliation and Arbitration: A Handbook to the New Act. Wn, Financial Publications, 1956. o.p.
INGLIS, B. D. Family Law. Wn, Sweet & Maxwell, 1960. $13.00.
KELLY, E. M. Summary of the Law Relating to Land Surveying in New Zealand. 3d Ed. Wn, N.Z. Institute of Surveyors, 1958. $4.50.
A LEGAL BIBLIOGRAPHY OF THE BRITISH COMMONWEALTH OF NATIONS. Lond., Sweet & Maxwell, 1955–(Vol. 6, Australia, New Zealand, and their Dependencies … 2d Ed., 1958. $3.00.
LUXFORD, J. H. Commercial Law of New Zealand. 2d Ed. Wn, Butterworth, 1961–(Looseleaf 4 vol. $52.50.
LUXFORD, J. H. Liquor Laws of New Zealand. 3d Ed. Wn, Butterworth, 1964. $13.25.
—— Police Law in New Zealand. 2d Ed. Wn, Butterworth, 1950. $7.75.
—— Real Estate Agency in New Zealand. 4th Ed. Wn, Butterworth, 1964. $6.25.
MACDONALD, J. W. Macdonald's Law Relating to Workers' Compensation in New Zealand. 3d Ed. Wn, Butterworth. 1958, with supp. 1962. $16.50.
MC VEAGH, J. P. Land Valuation Law. 3d Ed. Wn, Butterworth, 1962 (i.e., 1963). $5.95.
MARSHALL, J. R. and PAGE, E. F. The Law of Water-Courses and a Handbook for Catchment Boards. Wn, Legal Publications, 1957. $4.20.
MAZENGARB, A. T. Mazengarb's Industrial Laws of New Zealand. 3d Ed. Wn, Butterworth, 1956. $11.50.
MAZENGARB, O. C. The Law and Practice Relating to Actions for Negligence on the Highway. 4th Ed. Sydney, Butterworth, 1962. $11.00.
MORISON, C. B. Morison's Company Law in New Zealand. 3d Ed. by F. C. Spratt … Wn, Butterworth, 1958. 2 vol. $14.70.
N.Z. COPYRIGHT COMMITTEE. Report. Wn, Govt. Print., 1959. 60c.
N.Z. LAWS, STATUTES, etc. Reprint of the Statutes of New Zealand, 1908–57. Wn, Govt. Print., 1958–61. 16 vol. $120.00.
THE NEW ZEALAND ENCYCLOPAEDIA OF FORMS AND PRECEDENTS OTHER THAN COURT FORMS. Editor: E. C Adams, Wn, Butterworth, 1963– $11.00 each.
NORTHEY, J. F. Commercial Law in New Zealand. Wn, Butterworth, 1961. $5.20.
—— Introduction to Company Law in New Zealand. 5th Ed. Wn, Butterworth, 1964. $4.50.
PAUL, T. F. Land and Income Tax in New Zealand. Wn, Butterworth, 1963. $4.90.
ROBINSON, K. The Law of Town and Country Planning. Wn, Butterworth, 1966. $6.00.
ROBSON, J. L. ed. New Zealand: The Development of its Laws and Constitution. Lond., Stevens & Sons, 1954. $6.75.
SIM, Sir W. A. The Practice of the Supreme Court and Court of Appeal of New Zealand. 9th Ed., by Sir W. I. Sim. Wn, Butterworth, 1955. $14.00.
SIM, Sir W. J. Sim's Divorce Law and Practice in New Zealand. 7th Ed. Wn, Butterworth, 1964. $5.50.
SMITH, N. W. Maori Land Corporations. Wn, Reed, 1962. $1.05.
—— Maori Land Law. Wn, Reed, 1960. $4.20.
STAPLES, C. A. Land Tax in New Zealand. 5th Ed. Wn, Sweet & Maxwell, 1963. $1.05.
STEPHENS, M. O. Traffic and Transport Law in New Zealand. Wn, Sweet & Maxwell (N.Z.), 1964. $8.50.
TONKIN, A. S. The Law and Procedure Relating to Company Meetings and Winding-up in New Zealand. 2d Ed. Wn, Butterworth, 1958. $3.15.
TONKIN, A. S., AND THOMPSON, M. I. The Law and Taxation of Private Companies. 2d Ed. Wn, Butterworth, 1962 (i.e., 1963). $4.15.
WARD, D. A. S., and WILD, H. R. C. Mercantile Law in New Zealand. 4th Ed. (rev.) Ch, Whitcombe & Tombs, 1963. $1.75.
WILY, H. J. Wily's Magistrates' Courts Practice … 5th Ed. Wn, Butterworth, 1961. $13.00.
—— Wily's Tenancy Legislation. 5th Ed. Wn, Butterworth, 1962. $4.40.
—— ed. The Abridgement of New Zealand Case Law. Wn, Butterworth, 1963–. 16 vol. $13.00.
WILY, H. J. AND STALLWORTHY, K. R. Mental Abnormality and the Law. Ch, N. M. Peryer, 1962. $6.30.
WOODS, N. S. Industrial Conciliation and Arbitration in New Zealand. Wn, Govt. Print., 1963. $2.10.
NEW ZEALAND LAW JOURNAL. Butterworth, Wn. Fortnightly. $10.25.
NEW ZEALAND LAW REGISTER. Wn, N.Z. Law Publishing Co., 1950– a. $1.05.
NEW ZEALAND LAW REPORTS. Butterworth, Wn. m. $20.00.
AMMUNDSEN, G. A. comp. Local Body Administration in New Zealand. Wanganui, N.Z. Institute of Local Body Administrative Officers, 1960. $3.00.
ANGUS, N. C. ed. The Expert and Administration in New Zealand. Wn, N.Z. Institute of Public Administration; Lond., O.U.P., 1959. $1.50.
BISHOP, C. L. Local Authority Finance, Accounts and Administration. 2d Ed. Wn, Butterworth, 1959. $12.50. Supplement 1966. $4.00.
BROWN, J. B. Rural Land Administration in New Zealand. Wn, N.Z. Institute of Public Administration. Lond., O.U.P., 1966. $2.00.
CHAPMAN, R. M. Ends and Means in New Zealand Politics. Ak, University of Auckland, 1961. 50c.
CHAPMAN, R. M., JACKSON, W. K. AND MITCHELL, A. V. New Zealand Politics in Action; the 1960 General Election. London, O.U.P., 1962. $3.50.
*DOLLIMORE, H. N. The Parliament of New Zealand and Parliament House. 2d Ed. Wn, Govt. Print., 1964. 20c.
GLUE, W. A. History of the Government Printing Office. Wn, Govt. Print., 1966. $2.00.
JOLLIFFE, W. Jolliffe's Local Government in Boroughs and Counties. 8th Ed., Ed. by J. P. McVeagh. Wn, Ferguson and Osborn, 1964–. 2 vol. Vol. 1. $16.00.
LAMB, R. C. Early Christchurch; The Beginnings of Municipal Government 1862–1868. Ch, Canterbury Public Library, 1963. $1.25.
MILNE, R. S. ed. Bureaucracy in New Zealand. Wn, N.Z. Institute of Public Administration; Lond. O.U.P., 1957. $1.50.
—— Political Parties in New Zealand. Oxford, Clarendon Press, 1966. $6.50.
MITCHELL, A. V. Waitaki Votes; a Study of a New Zealand By-election, 1962. Dn, University of Otago Press, 1962. $1.00.
NEW ZEALAND PARLIAMENTARY RECORD, 1840–1949, ed. by G. H. Scholefield. Wn, Govt. Print, 1950. $3.50.
*N.Z. COMMITTEE ON LOCAL AUTHORITY FINANCE, 1963. Report. Wn, Govt. Print., 1964. 25c.
*N.Z. DEPT. OF JUSTICE. The Citizen and Power; Administrative Tribunals. Wn, Govt. Print., 1965. Not for sale.
N.Z. PARLIAMENT. House of Representatives. Speakers' Rulings, 1867 to 1963 inclusive. Wn, Govt. Print., 1964. (Not for sale.)
N.Z. ROYAL COMMISSION ON LOCAL AUTHORITY FINANCE. Report … Wn, Govt. Print., 1958. $1.00.
N.Z. ROYAL COMMISSION TO INQUIRE INTO AND REPORT UPON STATE SERVICES IN NEW ZEALAND. The State Services in New Zealand; Report of the Royal Commission of Inquiry. Wn, Govt. Print., 1962. $1.50.
ORR, G. S. Report on Administrative Justice in New Zealand. Wn, Govt. Print., 1964. $2.00.
POLASCHEK, R. J. Government Administration in New Zealand. Wn, NZ. Institute of Public Administration; Lond., O.U.P., 1958. $3.00.
—— ed. Local Government in New Zealand. Wn, N.Z. Institute of Public Administration; Lond., O.U.P., 1956. o.p.
ROBERTS, J. L. ed. Decentralisation in New Zealand Government Administration. Wn, N.Z. Institute of Public Administration; Lond., O.U.P., 1961 (i.e. 1962). $1.50.
SCOTT, K. J. The New Zealand Constitution. Oxford, Clarendon Press, 1962. $2.50.
WEBB, L. C. Government in New Zealand. Wn, Dept. of Internal Affairs, 1940. o.p.
LOCAL AUTHORITIES HANDBOOK OF NEW ZEALAND. Govt. Print., Wn. a. $1.50.
NEW ZEALAND JOURNAL OF PUBLIC ADMINISTRATION. N.Z. Institute of Public Administration, Wn. Semi-a. 80c.
ASHBRIDGE, G. R. Teachers' Legal and Service Handbook. 6th Ed. Wn, N.Z. Educational Institute, 1959. 75c.
ASHTON-WARNER, S. Teacher. New York, Simon & Schuster; Lond., Seeker & Warburg, 1963. $2.80.
BEAGLEHOLE, J. C. Victoria University College: an Essay Towards a History. Wn, N.Z. University Press, 1949. $1.50.
BEEBY, C. E. The Intermediate Schools of New Zealand. Wn, N.Z. Council for Educational Research, 1938. o.p.
EWING, J. L. Origins of the New Zealand Primary School Curriculum, 1840–1878. Wn, N.Z. Council for Educational Research, 1960. $2.75.
N.Z. COMMISSION ON EDUCATION IN NEW ZEALAND. Report of the Commission on Education in New Zealand. Wn, Govt. Print., 1962. $2.75.
N.Z. COMMITTEE ON NEW ZEALAND UNIVERSITIES. Report … Wn, Govt. Print., 1960. 45c.
N.Z. CONSULTATIVE COMMITTEE ON ADULT EDUCATION. Report Further Education for Adults. Wn, Council for Adult Education, 1947. o.p.
N.Z. CONSULTATIVE COMMITTEE ON AGRICULTURAL EDUCATION. Report Wn, Govt. Print., 1958. n.p.
N.Z. CONSULTATIVE COMMITTEE ON THE POST-PRIMARY SCHOOL CURRICULUM. Report … Wn, Dept. of Education 1959. 25c.
N.Z. DEPARTMENT OF EDUCATION. Physical Education Branch, Physical Education for Boys; a Guide book for Teachers in Secondary Schools. Wn, 1966. Not for sale.
PARKYN, G. W., ed. The Administration of Education in New Zealand. Wn, N.Z. Institute of Public Administration, 1954. o.p.
—— Children of High Intelligence: A New Zealand Study. Wn, N.Z. Council for Educational Research, 1948.
—— The Consolidation of Rural Schools. Wn, N.Z. Council for Educational Research, 1952. $1.85.
—— Success and Failure at the University. Wn, N.Z. Council for Educational Research, 1959. 2 vol. Vol. 1. $4.20.
RICHARDSON, E. S. In this Early World. Wn, N.Z. Council for Educational Research, 1964. $3.50.
ROTH, H. O. A Bibliography of New Zealand Education. Wn, N.Z. Council for Educational Research, 1964. $2.25.
SEARLE, E. J. The Teaching of Science in Post-Primary Schools. Wn, N.Z. Council for Educational Research, 1958. $3.00.
SUTTON-SMITH, B. The Games of New Zealand Children. Berkeley, Calif., University of California Press, 1959. $US4.00.
THOM, A. H. The District High Schools of New Zealand. Wn, N.Z. Council for Educational Research, 1950. $1.00.
TURNER, H. W. Halls of Residence. Wn, N.Z. Council for Educational Research, 1953. $1.85.
WATSON, J. E. Intermediate Schooling in New Zealand. Wn, N.Z. Council for Educational Research, 1964. $2.75.
*WELLS, P. C. R. The New Zealand School Publications Branch. Paris, UNESCO, 1957. 35c.
EDUCATION. Wn, School Publications Branch, Dept. of Education, P.O. Box 2836.10 p. a. $1.00.
N.Z. UNIVERSITY GRANTS COMMITTEE. Handbook. Wn. a. n.p. (The separate universities of New Zealand issue their own calendars.)
NEW ZEALAND UNIVERSITY JOURNAL. Association of University Teachers of N.Z., care of Victoria University of Wellington, P.O. Box 196, Wellington, a. 55c.
COLLINS, R. J. G., and FATHERS, H. T. M. Ed. The Postage Stamps of New Zealand. Wn, Royal Philatelic Society of N.Z., 1938–64. 4 vol. Vols. 1–3 o.p. Vol. 4. $12.60.
EADDY, P. A. 'Neath Swaying Spars: the Story of the Trading Scows of New Zealand. Ch, Whitcombe & Tombs, 1955. 50c.
HARVIE, E. F. Venture the Far Horizon. The Pioneer Long-distance Flights in New Zealand. Ch, Whitcombe & Tombs, 1966. $2.50.
MACKAY, I. K. Broadcasting in New Zealand. Wn, Reed, 1953. o.p.
N.Z. ROADING INVESTIGATION COMMITTEE. Report … Wn, Govt. Print., 1953. 45c.
N.Z. TRANSPORT DEPT. Economics Branch. Transport in New Zealand. Wn, 1963. gratis.
PALMER, A. N., and STEWART, W. W. Cavalcade of New Zealand Locomotives. Rev. and enl. ed. Wn, Reed; 1965. $3.85.
PRODUCER BOARDS' SHIPPING UTILISATION COMMITTEE. New Zealand Overseas Trade: Report on Shipping, Ports, Transport, and Other Services. Wn, 1964. $1.50.
ROBINSON, H. A History of the Post Office in New Zealand. Wn, Govt. Print., 1964. $3.50.
WILKINSON, J. D. Early New Zealand Steamers. Wn, the Author, 1966. $4.50.
DORNBUSCH, C. E., comp. The New Zealand Army; a Bibliography. Cornwallville, N.Y., Hope Farm Press, 1961. $U.S.4.00.
*N.Z. NAVY DEPARTMENT. History and Development of the Royal New Zealand Navy. Wn, Govt. Print., 1960.
See also World War.
ALPERS, A. F. G. Maori Myths and Tribal Legends. London, J. Murray, Hamilton, Paul. 1964. $2.50.
ARMSTRONG, A. G., and NGATA, R. Maori Action Songs. Wn, Reed, 1960. $1.25.
ARMSTRONG, A. G. Maori Games and Hakas. Wn, Reed, 1964. $2.25.
BARROW, T. T. The Decorative Arts of the New Zealand Maori. Wn, Reed, 1964. $2.25.
*—— Traditional and Modern Music of the Maori. Wn and Sydney, Seven Seas Publishing Pty. Ltd., 1965. $1.85.
BEST, E. The Maori As He Was. Wn, Govt. Print., 1952. $2.00.
BIGGS, B. G. Maori Marriage; an Essay in Reconstruction. Wn, Polynesian Society, 1960. $2.10.
BUCK, Sir P. The Coming of the Maori. Wn, Whitcombe & Tombs, 1949. $3.50.
—— Vikings of the Sunrise. Ch, Whitcombe & Tombs, 1954. $3.50.
DUFF, R. D. The Moa-hunter Period of Maori Culture. 2d Ed. Wn, Govt. Print., 1956. $5.50.
FIRTH, R. W. Economics of the New Zealand Maori. 2d Ed. Wn, Govt. Print., 1959–55.00.
GOLSON, J., ed. Polynesian Navigation; a Symposium on Andrew Sharp's Theory of Accidental Voyages. Rev. ed. Wn, Polynesian Society, 1963. $1.50.
GREY, Sir G. Polynesian Mythology and Ancient Traditional History of the Maori. Ch. Whitcombe & Tombs, 1956. $1.75.
HARR$EA, J. N. Maori and Pakeha; a Study of Mixed Marriages in New Zealand. Wn, Reed, 1966. $3.05.
HILL, Mrs J. A., and HILL, B. Hey Boy. Photographs and Text. Ch, Whitcombe & Tombs, 1963. $2.25.
HOHEPA, P. W. A Maori Community in Northland. Ak, Anthropology Department, Auckland University, 1964. $1.20.
JEFFERSON, C. Dendroglyphs of the Chatham Islands; Moriori Designs on Karaka Trees. Wn, Polynesian Society, 1956. $2.40.
KEENE, F. M. O Te Raki; Maori Legends of the North. Hamilton. Paul's Book Arcade. 1963. $2.10.
MEAD, S. M. The Art of Maori Carving. Wn, Reed, 1961. $1.60.
METGE, A. J. A New Maori Migration: Rural and Urban Relations in Northern New Zealand. London, Athlone Press; Melbourne, University of Melbourne Press, 1964. $4.50.
*N.Z. DEPT. OF MAORI AFFAIRS. Integration of Maori and Pakeha. Wn, Govt. Print., 1962. gratis.
N.Z. DEPARTMENT OF MAORI AFFAIRS. The Maori Today. 3rd Ed. 1964. 55c.
PHILLIPPS, W. J. Maori Houses and Food Stores. Wn, Dominion Museum, 1952. $1.80.
—— Carved Maori Houses of Western and Northern Areas of New Zealand. Wn, Govt. Print., 1955. $5.00.
—— Maori Life and Custom. Wn, Reed, 1966. $3.75.
—— Maori Carving Illustrated. 3d Ed. Wn, Reed, 1961. 60c.
POCOCK, J. G. A. ed. The Maori and New Zealand Politics; talks from a N.Z.B.C. series with additional essays. Hamilton, Blackwood & Janet Paul, 1965. $1.80.
REED, A. W. Myths and Legends of Maoriland. 7th Ed. Wn, Reed, 1961. $1.85.
—— Treasury of Maori Folklore. Wn, Reed, 1963. $4.50.
RITCHIE, J. E. The Making of a Maori; a Case Study of a Changing Community. Wn, Reed, 1963. $2.15.
SCHWIMMER E. G. The World of the Maori. Wn, Reed, 1966. $2.10.
SHARP, C. A. Ancient Voyagers in Polynesia. Hamilton, Paul's Books Arcade, 1963. $2.10.
VAYDA, A. P. Maori Warfare. Wn, Polynesian Society, 1960. $2.10.
*YOUNG MAORI LEADERS CONFERENCE, AUCKLAND, 1959. Report … Council of Adult Education, University of Auckland. Mimeo. n.p. (and reports of other similar conferences throughout N.Z.).
(See also Historical Works, Maori Tribal, and Language, Maori and English.)
TE AO HOU. Department of Maori Affairs, Wn. q. 75c.
POLYNESIAN SOCIETY. Journal, The Society, Wn. m. $3.00.
CALLAGHAN. F. R., ed. Science in New Zealand. Wn, Reed, 1957. o.p.
MCBRIDE, C. P. Scientific Research in New Zealand: Expenditure and Manpower 1926–1966. Wn, Dept. of Scientific and Industrial Research, 1966.
DIRECTORY OF NEW ZEALAND SCIENCE, 4th Ed., 1962. H. Jansen, ed. Wn, N.Z. Association of Scientists, 1962. $4.50.
N.Z. D.S.I.R. INFORMATION BUREAU. D.S.I.R. Handbook. 6th Ed. Wn, 1966. n.p
AUCKLAND INSTITUTE AND MUSEUM. Records. The Museum, Ak. irr. Price varies.
CANTERBURY MUSEUM. CHRISTCHURCH. Records. The Museum, Ch. irr. Price varies.
N.Z. DEPARTMENT OF SCIENTIFIC AND INDUSTRIAL RESEARCH. Bulletins. D.S.I.R., Wn. irr. Price varies.
—— Information Series. D.S.I.R., Wn. irr. Price varies.
N.Z. DOMINION MUSEUM, WELLINGTON. Dominion Museum Records, The Museum, Wn. irr. Price varies.
NEW ZEALAND JOURNAL OF SCIENCE. D.S.I.R., Wn, q. $3.00.
ALLAN, R. S., and COLLINS, B. W. Bibliography of New Zealand Geology Since 1908. Ch, N.Z. Geological Survey. 1952. o.p.
BANWELL, C. J., and others. Physics of the New Zealand Thermal Area. Wn, D.S.I.R., 1957. $1.50.
COTTON, Sir C. A. Geomorphology. 7th rev. Ed. Ch, Whitcombe & Tombs, 1958. $3.25.
—— Landscape as Developed by the Processes of Normal Erosion. 2d Ed. Ch, Whitcombe & Tombs, 1948. $4.75.
—— New Zealand Geomorphology: Reprints of Selected Papers, 1912–25. Wn, N.Z. University Press, 1955. $4.20.
—— Volcanoes as Landscape Forms. 2d Ed. Ch, Whitcombe & Tombs, 1952. o.p.
COWIE, C. A. Floods in New Zealand, 1920–53. Wn, Soil Conservation and Rivers Control Council, 1957. o.p.
EIBY, G. A. Earthquakes. Lond., Muller, 1957. (U.S. Ed., About Earthquakes. N.Y., Harper, 1957.) $2.10.
GARNER, D. M. Hydrology of New Zealand Coastal Waters, 1955. Wn, D.S.I.R., 1961 $1.25.
*GARNER, D. M. and RIDGWAY, N. M. Hydrology of New Zealand Offshore Waters. Wn, Govt. Print., 1965. $1.50.
GARNIER, B. J. The Climate of New Zealand. Lond., E. Arnold, 1958. $7.00.
GRINDLEY, G. W., HARRINGTON, H. J. and WOOD, B. L. The Geological Map of New Zealand, 1:2,000,000. Wn, D.S.I.R., 1959. $2.75.
OTAGO UNIVERSITY. School of Mines and Metallurgy. Proceedings of a Mining and Quarrying Conference. Dn, The School, 1956. 3 vol.
—— Proceedings of a Mineral Conference. Dn, The School, 1959.
*RICHARDS, J. H. Waitomo Caves. 7th Ed. Wn, Reed, 1964. 50c.
SALMON, J. H. M. A History of Goldmining in New Zealand. Wn, Govt. Print., 1963. $3.75.
SEARLE, E. J. City of Volcanoes: A Geology of Auckland. Hamilton, Paul, 1964. £2.15.
SUGGATE, R. P. New Zealand Coals. Wn, D.S.I.R., 1959. $1.25.
THOMPSON, B. N. ed. New Zealand Volcanology: Central Volcanic Region. Wn, D.S.I.R., 1965. $2.00.
—— New Zealand Volcanology: Northland, Coromandel, Auckland. Wn, D.S.I.R.. 1965. $1.00.
—— New Zealand Volcanology: South Island. Wn, D.S.I.R., 1965. $1.00.
WELLMAN, H. W. Structural Outline of New Zealand. Wn, D.S.I.R., 1956. 65c.
WILLIAMS, G. J. Economic Geology of New Zealand. Melbourne, Australian Institute of Mining and Metallurgy, 1965. $8.40.
N.Z. GEOLOGICAL SURVEY. Geological Bulletins. The Survey, P.O. Box 368, Lower Hutt. irr. Price varies.
—— Geological Memoirs. The Survey, Lower Hutt. irr. Price varies.
—— Palaeontological Bulletins. The Survey, Lower Hutt. irr. Price varies.
NEW ZEALAND JOURNAL OF GEOLOGY AND GEOPHYSICS. D.S.I.R., Wn, q. £3.
ROYAL SOCIETY OF NEW ZEALAND. Transactions: Geology. The Society, c/o P.O. Box 196, Wellington. irr.
POOLE, A. L., comp. Preliminary Reports of the New Zealand - American Fiordland Expedition. Wn, Govt. Print., 1951. 75c.
*RINEY, T. A., and others. Lake Monk Expedition; an Ecological Study in Southern Fiordland. Wn, D.S.I.R., 1959. 85c.
NEW ZEALAND ECOLOGICAL SOCIETY. Proceedings. The Society, Box 202, Wellington, a. 75c.
TUATARA. Journal of the Biological Society, Victoria University of Wellington, Box 196, Wellington. irr. 40c. per issue.
ALPERS, A. F. G. Dolphins. 2d Ed. Hamilton, Paul's Book Arcade; Lond., John Murray, 1963. $2.50.
BAILEY, A. M., and SORENSEN, J … Subantarctic Campbell Island. Denver, Museum of Natural History, 1962. $7.25.
BANDSMA, A. T., and BRANDT, R. T. Camera Studies of the Small World. Ch, Whitcombe and Tombs, 1961. $1.35.
BENNETT, E. W. The Marine Fauna of New Zealand: Crustacea Brachyura. Wn, Govt. Print., 1964. $2.00.
*DELL, R. K. Native Crabs. Wn, Reed, 1963. 75c.
FALLA, R. A., and others. A Field Guide to the Birds of New Zealand and Outlying Islands. Lond., Ak, Collins, 1966. $4.50.
FREED, D. W. Bibliography of New Zealand Marine Zoology, 1769–1899. Wn, D.S.I.R., 1963. $1.25.
GRAHAM, D. H. A Treasury of New Zealand Fishes. 2d Ed. Wn, Reed, 1956. o.p.
HOWARD, W. E. Control of Introduced Mammals in New Zealand. Wn, D.S.I.R., 1965. $1.75.
HUDSON, G. V. The Butterflies and Moths of New Zealand … Wn, Ferguson & Osborn, 1928. o.p. (Supplement 1939. o.p.)
——New Zealand Beetles and Their Larvae. Wn, Ferguson & Osborn, 1934. o.p.
LEE, K. E. The Earthworm Fauna of New Zealand. Wn, D.S.I.R., 1959. $6.00.
McCANN, Y. M. C. The Lizards of New Zealand. Wn, Dominion Museum, 1955. $2.00.
MARPLES, B. J. An Introduction to Freshwater Life in New Zealand. Ch, Whitcombe & Tombs. 1962. $2.00.
MILLER, D. Bibliography of New Zealand Entomology, 1775–1952 (With Annotations). Wn, D.S.I.R., 1956. $2.00.
MONCRIEFF, Mrs P. New Zealand Birds and How to Identify Them. 5th Ed. Ch, Whitcombe & Tombs, 1961. $1.05.
MOON, G. J. H. Focus on New Zealand Birds. 2d Rev. Ed. Wn, Reed, 1960. o.p.
OLIVER, W. R. B. New Zealand Birds. 2d Ed, Rev. and Enl. Wn, Reed, 1955. o.p.
ORNITHOLOGICAL SOCIETY OF NEW ZEALAND. Checklist of New Zealand. Wn, Reed for the Society, 1953. o.p.
PARROTT, A. W. Big Game Fishes and Sharks of New Zealand. Lond., Hodder, 1958. $2.50.
—— The Queer and the Rare Fishes of New Zealand. Lond., Hodder, 1958. $2.50.
—— Sea Angler's Fishes of New Zealand. Lond., Hodder. 1957. $1.80.
PENDERGRAST, J. G. and COWLEY, D. R. An Introduction to New Zealand Freshwater Insects. Ak, London, Collins, 1966. $1.50.
POWELL, A. W. B. Native Animals of New Zealand. Auckland Institute & Museum, 1951. 75c.
—— Shells of New Zealand, an Illustrated Handbook. 4th Ed. Ch, Whitcombe & Tombs, 1964 $1.85.
*PRACY, L. T. Introduction and Liberation of the Opossum (Trichosurus Vulpecula) into New Zealand. Wn, N.Z. Forest Service, 1962. gratis.
RICHDALE, L. E. A Population Study of Penguins. Oxford, Clarendon Press, 1957. $5.60.
ROYAL FOREST AND BIRD PROTECTION SOCIETY OF NEW ZEALAND. New Zealand Sea and Shore Birds: 24 col. illus. with Descriptive Letterpress. 2d Ed. Wn, The Society, 1953. $1.75.
—— New Zealand Birds: 24 col. illus. of Forest-inhabitating Birds with Descriptive Letter press. 3d Ed. Wn, The Society, 4959. $2.10.
SHARELL, R. The Tuatara, Lizards, and Frogs of New Zealand. London, Collins, 1966. $3.50.
SOPER, M. F. New Zealand Bird Portraits. Ch, Whitcombe & Tombs, 1963. $2.85.
STOKELL, G. Fresh Water Fishes of New Zealand. Ch, Simpson & Williams, 1955. $2.00.
WILSON, R. A. Bird Islands of New Zealand. Ch, Whitcombe & Tombs, 1959. $2.75.
WODZICKI, K. A. Introduced Mammals of New Zealand; an Ecological and Economic Survey. Wn, D.S.I.R., 1950. $1.25.
NOTORNIS, New Zealand Ornithological Society, c/o R. B. Sibson, King's College, Ak. q. $2.00.
ROYAL SOCIETY OF NEW ZEALAND. Transactions: Zoology. The Society, Wn. irr.
*ADAMS, J. N. M. Mountain Flowers of New Zealand. Wn, Reed, 1965, $1.35.
ALLAN, H. H. Flora of New Zealand. Wn, Govt. Print., 1961 - 3 vols. Vol. 1. 1961. $10.50.
—— A Handbook of the Naturalised Flora of New Zealand. Wn, Govt. Print., 1940. o.p.
*BROOKER, S. G. and COOPER, R. C. New Zealand Medicinal Plants. Ak, Auckland Museum, 1961. $1.00.
CHAMBERLAIN, E. E. Plant Virus Diseases in New Zealand. Wn, D.S.I.R., 1954. $2.00.
COCKAYNE, L., and TURNER, E. P. The Trees of New Zealand. 4th Ed. Wn, Govt. Print., 1958. $2.50.
COCKAYNE, L. The Vegetation of New Zealand. 3d Ed. (Reprint). Weinheim, H. R. Engelmann (J. Cramer) 1958. DM 84.—
CONNOR, H. E. The Poisonous Plants in New Zealand. Wn, Dept. of Agriculture, 1960.
DAVIES, W. C New Zealand Native Plant Studies. 2d Ed. Wn. Reed, 1961. $4.75.
DOBBIE, H. B. New Zealand Ferns. 6th Ed. Ch, Whitcombe & Tombs, 1963. o.p.
DRUCE, A. P. Botanical Survey of an Experimental Catchment, Taita, New Zealand. Wn, D.S.I.R., 1957. $1.50.
GUTHRIE-SMITH, W. H. Tutira; the Story of a New Zealand Sheep Station, 3d Ed. Edinburgh, William Blackwood, 1953. o.p.
HINDS, H. V., and REID, J. S. Forest Trees and Timbers of New Zealand. Wn, Govt. Print., 1957. 75c.
LAING, R. M., and BLACKWELL, E. W. Plants of New Zealand. 7th Ed. Ch, Whitcombe & Tombs, 1964. $2.85.
MARTIN, W. The Flora of New Zealand. 4th Rev. Ch, Whitcombe & Tombs, 1961. $1.68.
MOORE, L. B. The Economic Importance of Seaweeds. Wn, D.S.I.R., 1966. 50c.
MOORE, L. B. and ADAMS, N. M. Plants of the New Zealand Coast. Hamilton, Paul, 1963. $1.50.
NATUSCH, S. E. Native Plants; an Introduction to the Plant Life of New Zealand. Ch, Pegasus Press, 1956. 45c.
PHILIPSON, W. R., and HEARN, D. Rock Garden Plants of the Southern Alps. Ch, Caxton Press, 1962. $4.75.
POOLE, A. L., and ADAMS, N. M. Trees and Shrubs of New Zealand. Wn, Govt. Print., 1963. $2.50.
RICHARDS, E. C. The Chatham Islands, their Plants, Birds and People. Ch, Simpson & Williams, 1952. $2.00.
SAINSBURY, G. O. K. Handbook of New Zealand Mosses. Wn, Royal Society of New Zealand, 1955. $2.55.
STEVENSON, G. A Book of Ferns. 2d Rev. Ed. Hamilton, Paul's Book Arcade, 1959. $1.35.
WALL, A., and ALLAN, H. H. The Botanical Names of the Flora of New Zealand; their Origin History and Meaning. Ch, Whitcombe & Tombs, 2d Ed, 1950. 6.
ROYAL SOCIETY OF NEW ZEALAND. Transactions: Botany. The Society, Wn. irr.
NEW ZEALAND JOURNAL OF BOTANY. Wn, D.S.I.R., q.
HERCUS, Sir C. E. and BELL, Sir G. The Otago Medical School Under the First Three Deans. Edinburgh, Livingstone, 1964.
HEWAT, R. E. T., and EASTCOTT, D. F. Dental Caries in New Zealand. Ch, Medical Research Council of N.Z., 1956. o.p.
MACLEAN, F. S. Challenge for Health: A History of Public Health in New Zealand. Wn, Govt. Print., 1964. $3.50.
—— Hydatid Disease in New Zealand. Wn, National Hydatids Council, 1964. gratis.
N.Z. COMMITTEE OF INQUIRY ON THE FLUORIDATION OF PUBLIC WATER SUPPLIES. Report. Wn, Govt. Print., 1957. 80c.
N.Z. CONSULTATIVE COMMITTEE ON HOSPITAL REFORM. Report. Wn, Govt. Print., 1953. o.p.
N.Z. CONSULTATIVE COMMITTEE ON INFANT AND PRE-SCHOOL HEALTH SERVICES. Report. Wn, Govt. Print., 1960. n.p.
*N.Z. DEFT, OF HEALTH. A Summary of the Functions and Responsibilities of the Department of Health. Wn, Govt. Print., 1961.
RATTRAY, J. Great Days in New Zealand Nursing. Wn, Reed, 1961. $1.85.
*ROSE, R. J. Maori-European Standards of Health. Wn, Dept. of Health, Medical Statistics Branch, 1960. n.p.
SAUNDERS, J. L. The New Zealand School Dental Service. Wn, Govt. Print., 1964. (Not for sale.)
NEW ZEALAND DENTAL JOURNAL. N.Z. Dental Association, Lister Building, Auckland, q. $2.50.
NEW ZEALAND MEDICAL JOURNAL. British Medical Association, Wn. m. $6.00.
BLYTH, C. A. The future of manufacturing in New Zealand. Wn, N.Z. Institute of Public Administration, Lond., O.U.P., 1964. $2.50.
BRAITHWAITE, R. A. M. ed. New Zealand Drainage and River Board Review, 1953. Hamilton, N.Z. Land Drainage & River Boards Association, 1954. o.p.
FARRELL, B. H. Power in New Zealand; a Geography of Energy Resources. Wn, Reed, 1962. $4.25.
FURKERT, F. W. Early New Zealand Engineers. Wn, Reed, 1953. o.p.
GRANGE, L. I. Geothermal Steam for Power in New Zealand. Wn, D.S.I.R., 1955. $1.50.
HEINZ, W. F. Prospecting for Gold. 2d Rev. Ed. Ch, Pegasus Press, 1964. 75c.
HUTTON, L. B., and STACE, F. N. eds. The Engineering History of Electric Supply in New Zealand. Wn, Electric Supply Authority Engineers' Institute of N.Z., 1958– vol. 1. $3.00.
INDUSTRIAL DEVELOPMENT CONFERENCE, WELLINGTON, 1960. Background Papers. Wn, Govt. Print., 1960.
—— Report. Wn, Govt. Print., 1960.
*LUKE, I. J. Iron Ore Resources of New Zealand. Wn, D.S.I.R., 1955. 20c.
N.Z. COMBINED COMMITTEE ON THE NEW ZEALAND ELECTRIC POWER SUPPLY. Report. Wn, Govt. Print., 1957. n.p.
N.Z. COMMISSION OF INQUIRY INTO THE DISTRIBUTION OF ELECTRICITY. Report. Wn, Govt. Print., 1959. 45c.
N.Z. ELECTRICITY DEPARTMENT. Power From the Earth: The Story of the Wairakei Geothermal Project. Wn, Govt. Print., 1964. 45c.
O'LEARY, J. T., and SHAFFER, R. H. Scientific and Engineering Manpower in New Zealand Industry. Wn, D.S.I.R., 1958. 75c.
SPEER, N. M. The Electrical. Supply Industry in New Zealand, its Progress and Achievement. Wn, Electrical Supply Authorities Association of New Zealand, 1962. $6.30.
WARD, R. G., and WARD, M. W. eds. New Zealand's Industrial Potential. Ak, N.Z. Geographical Society, Auckland Branch, 1960. o.p.
ELECTRIC SUPPLY AUTHORITIES' ENGINEERS' INSTITUTE OF NEW ZEALAND. Transactions … Annual Conference. The Institute, Wn. a. $4.20.
NEW ZEALAND ELECTRICAL JOURNAL. Technical Publications Ltd., Wn. m. $2.00; $2.50 overseas.
NEW ZEALAND ENGINEERING. Technical Publications Ltd., Wn. m. $4.00; $5.00 overseas.
NEW ZEALAND PATENT OFFICE JOURNAL. Patent Office, Wn. m. $10.50.
THOMSON, HELEN M. S. Fibres and Fabrics of Today. Ch, Whitcombe and Tombs, 1966. $1.60.
ALLEY, G. T. and HALL, D. O. W. The Farmer in New Zealand. Wn, Dept. of Internal Affairs, 1941. o.p.
BEAUCHAMP, R. R. A Handbook for Farm Foresters. Wn, H. H. Tombs, 1964. $1.00.
BLAIR, I. D. Life and Work at Canterbury Agricultural College; the First Seventy-five Years … Ch, Caxton Press, 1956. $4.20.
BOWEN, W. G. Wool Away: The Art and Technique of Shearing. Ch, Whitcombe & Tombs. 3rd Ed. 1963. $1.75.
CONNELL, R. P., and HADFIELD, J. W. Agriculture. 7th Ed. Ch, Whitcombe & Tombs, 1961. $2.10.
COOP, I. E. The Principles and Practice of Animal Nutrition. 2d Rev. Ed. Wn, Govt. Print., 1961. $1.75.
CRITCHELL, J. T. and RAYMOND, J. A History of the Frozen Trade. Lond., Constable, 1912. o.p.
DRUMMOND, H. M. and LEATHAM, E. H. Bibliography of New Zealand Tussock Grasslands. Wn, D.S.I.R., 1959. 40c.
DU FAUR, R. T. Sheep Farming for Profit. Wn, Reed, 1966. $3.25.
DUFF, O. A Shepherd's Calendar. Hamilton, Paul's Book Arcade, 1961 (i.e. 1962). $2.00.
ENTRICAN, A. R., and others. The Physical and Mechanical Properties of the Principal Indigenous Woods of New Zealand. Wn, Govt. Print., 1951. o.p.
EVANS, B. L. A History of Farm Implements and Implement Firms in New Zealand. Feilding, 1956, o.p.
GILMOUR, J. W. The Pathology of Forest Trees in New Zealand. Wn, N.Z. Forest Service, 1966. gratis.
HADFIELD, J. W. Arable Farm Crops of New Zealand. Wn, D.S.I.R., 1952. $2.85.
HARRISON, R. E. Handbook of Bulbs and Perennials for the Southern Hemisphere. 2d Ed. (rev.) Palmerston North, R. E. Harrison & Co., 1963. $4.25
—— Handbook of Trees and Shrubs for the Southern Hemisphere. 3d Ed. (rev.) Wn, Reed, 1963. $4.50.
HILGENDORF, F. W. Pasture Plants and Pastures of New Zealand. 7th Ed. Ch, Whitcombe & Tombs, 1957. 55c.
—— Weeds of New Zealand and How to Eradicate Them. 6th Ed. Ch, Whitcombe & Tombs, 1961. $1.25.
*HOWARD, W. E. The Rabbit Problem in New Zealand. Wn, D.S.I.R., 1958. 40c.
LEVY, Sir E. B. Grasslands of New Zealand 2d Ed. Wn, Govt. Print., 1955. o.p.
McDOWALL, F. H. The Buttermaker's Manual. Wn, N.Z. University Press, 1953. 2 vols. $16.00.
McMEEKAN, C. P. Grass to Milk. 3d Ed. Wn, N.Z. Dairy Exporter, 1964. $3.00.
—— Principles of Animal Production. 3d Ed. Ch, Whitcombe & Tombs, 1959. $2.75.
N.Z. DEPT, OF AGRICULTURE. Papers Presented at a Conference on the Theme, the Farm as a Business. Dn, 1962. $1.00.
N.Z. DEFT, OF AGRICULTURE Primary Production in New Zealand. Wn, 1963. 25c.
N.Z. DEPT. OF LANDS AND SURVEY. The Land Utilisation Survey of Gisborne - East Coast Region. Wn, 1964. $2.00.
N.Z. FOREST SERVICE. Westland's Wealth. Wn, 1959. $2.00.
N.Z. FOREST SERVICE. The National Forest Survey of New Zealand. Vol. 1. The Indigenous Forest Resources of New Zealand, by S. E. Masters and others. Wn, Govt. Print., 1957. $1.75.
N.Z. SOIL BUREAU, and N.Z. DEPT. OF AGRICULTURE. Extension Division. General Survey of the Soils of North Island, New Zealand. Wn, D.S.I.R., 1954. $4.72.
NEW ZEALAND AGRICULTURAL AVIATION SYMPOSIUM. Proceedings, 1st, Wanganui, 1959. Wn, Civil Aviation Administration, 1960. $1.25.
NEW ZEALAND VETERINARY ASSOCIATION TECHNICAL COMMITTEE. Diseases of Domestic Animals in New Zealand. 2d Ed (rev.) Wn, Editorial Services, 1962, $4.50.
PHILPOTT, H. G. A History of the New Zealand Dairy Industry, 1840–1935. Wn, Govt. Print., 1937. o.p.
PLANT PROTECTION IN NEW ZEALAND, by J. D. Atkinson and Oothers. Wn, Govt. Print., 1956. $5.60.
REED, A. H. The New Story of the Kauri. Wn, Reed, 1965. $6.30.
*REID, J. S. New Zealand Building Timbers (how, where and when to use them), 3d Ed. Wn, Govt. Print., 1961. 50c.
SAXBY, S. H. Pasture Production in New Zealand. 3d Ed. Wn, N.Z. Dept. of Agriculture, 1956. 25c.
SHARPE, R. J. D. Fiordland Muster. London, Hodder and Stoughton, 1966. $2.30.
STEVENS, P. G. W. Sheep. Ch, Whitcombe & Tombs, 1958–61. 2 vols. $3.10.
SUTHERLAND, W. T. G. The Sixty Million Muster. Wn, Reed, 1966. $3.75.
WESTON, G. C. Exotic Forest Trees in New Zealand. Wn, N.Z. Forest Service, 1957. $1.75.
WILD, L. J. Soils and Manures in New Zealand. 6th Ed. Ch, Whitcombe & Tombs, 1960. $1.05.
WILSON, R. A. Fifty Years Farming on Sand Country, Palmerston North, Keeling & Mundy, 1959. n.p.
WINTER, T. S. Beekeeping in New Zealand. Wn, Dept. of Agriculture, 1961. 50c.
CANTERBURY CHAMBER OF COMMERCE. AGRICULTURAL BULLETIN. Ch, The Chamber, m.
DAIRYFARMING ANNUAL. Massey University, P.B. Palmerston North, a. $1.00.
N.Z. SOIL BUREAU. Bulletins. Wn, D.S.I.R. irr. Price varies.
NEW ZEALAND GRASSLAND ASSOCIATION. Conference Proceedings. The Association, Wn. a. $1.50.
NEW ZEALAND JOURNAL OF AGRICULTURE. Dept. of Agriculture, Wellington. m. $1.00.
NEW ZEALAND JOURNAL OF FORESTRY. N.Z. Institute of Foresters, Rotorua. a. $1.00.
NEW ZEALAND PLANTS AND GARDENS. Royal N.Z. Institute of Horticulture, P.O. Box 1368, Wellington. q. 25c per copy.
NEW ZEALAND SOCIETY OF ANIMAL PRODUCTION. Proceedings. The Society, Hamilton. a. $1.50.
NEW ZEALAND VETERINARY JOURNAL. Editorial Services Ltd., P.O. Box 2721, Wn. bi-m. $2.50.
NEW ZEALAND WEED CONTROL CONFERENCE. Proceedings. The Conference, Wn. a. $1.50.
SHEEPFARMING ANNUAL. Massey University, Palmerston North. a. £1.25.
CARPENTER, E. E., and KING, J. M. Kitchen Planning. Dn, Home Science Extension, Department of Adult Education, University of Otago, 1962. 50c.
*MESSENGER, E. M. The Wine and Food Book; New Zealand Recipes and Menus. Wn, Price Milburn, 1961. 60c.
MOORE, E. E. Food and Health. Wn, Dept. of Agriculture, 1951. 15c.
*N.Z. DEPT. OF INDUSTRIES AND COMMERCE. Wine in New Zealand. Wn, Govt. Print., 1963. 20c.
NEW ZEALAND DEPT. OF AGRICULTURE. Second Journal of Agriculture Cookery Book. Wn, Reed, 1959. 68c.
*OTAGO UNIVERSITY ASSOCIATION OF HOME SCIENCE ALUMNAE. New Zealand Dishes and Menus. Wn, Price Milburn, 1960. 50c.
*OTAGO UNIVERSITY. DEPT. OF ADULT EDUCATION. Home Science Extension. New Zealand Fish. Dn, 1962. 20c.
ROYAL NEW ZEALAND SOCIETY FOR THE HEALTH OF WOMEN AND CHILDREN. Modern Mothercraft; a Guide to Parents, by Helen Deem and Nora P. Fitzgibbon. 2d Rev. Ed. Dn, 1953. 65c.
BARTON, J. S. The New Zealand Company Secretary. 8th Ed., by W. G. Rodger. Wn, Butter-worth, 1960. $5.40.
COWAN, T. K. Financial Accounting in New Zealand. Wn, Sweet & Maxwell, 1960. $6.50.
IRVINO, J. C. A Century's Challenge: Wright Stephenson & Co. Ltd., 1861–1961. Wn, Wright Stephenson & Co. Ltd., 1961. n.p.
NEW ZEALAND SOCIETY OF CUSTOMS AGENTS. Customs Agents' Handbook. Wn, V.A. Dunlop, 1956. $2.10.
RODGER, W. G. and GILKISON, W. S. Auditing; the Principles and Practices of Auditing under New Zealand Conditions, 3d Ed. Wn, Sweet & Maxwell, 1962. $8.40.
BIGGS, B. G. English – Maori Finder List. Ak, The Author, 1961. 75c.
—— and others, ed. Selected Readings in Maori. Rev. Ed. Ak, Anthropology Dept., University of Auckland, 1963. 60c.
HARAWIRA, K. T. Teach Yourself Maori. 3d Ed. Wn, Reed, 1963. $1.25.
WALL, A. The Mother Tongue in New Zealand. Wn, Reed, 1936. o.p.
—— New Zealand English; a Guide to the Correct Pronunciation of English, with Special Reference to New Zealand Conditions and Problems. 3d Ed. Enl. Ch, Whitcombe & Tombs, 1959. $1.00.
WILLIAMS, H. W. A Bibliography of Printed Maori to 1900. Wn, Dominion Museum, 1924. o.p.
WILLIAMS W. A Dictionary of the Maori Language. 6th Ed., by H. W. Williams, Rev. and Augmented Under the Auspices of the Polynesian Society. Wn, Gvt. Print., 1957. $3.50.
WILLIAMS, W. L. First Lessons in Maori. 13th Ed. Wn, Whitcombe & Tombs, 1964. 85c.
TE REO. Linguistic Society of New Zealand, c/o Dept. of Romance Languages, University of Auckland, Ak. a. $1.00.
*AUCKLAND ART GALLERY. Early Watercolours of New Zealand. Ak, 1963. 60c.
*AUCKLAND ART GALLERY. P. van der Velden, Paintings, 1870–1912. Ak, 1959. o.p. and Similar Catalogues on Other N.Z. Artists.
*BRASCH, C. O. Present Company; Reflections on the Arts. Ak, Blackwood & Janet Paul, 1966. 75c.
*HOWE, C. W. P., comp. Schola Cantorum, Wellington, New Zealand, 1936–50. Wn, Wright & Carman, 1951. o.p.
JENSEN, O. The N.Z.B.C. Symphony Orchestra. Wn, Reed, 1966. $4.00.
*McCAHON, C. A. Colonial View; Paintings of Early New Zealand. Ak, Auckland City Art Gallery, 1958. 30c.
*McCORMICK, E. H. Eric Lee-Johnson. Ak, Paul's Book Arcade, 1956. o.p.
—— The Inland Eye; a Sketch in Visual Autobiography. Ak, Auckland Gallery Associates, 1959. 30c.
*MARSH, NGAIO. Perspectives; the New Zealander and the Visual Arts. Ak, Auckland Gallery Associates, 1960. 25c.
*NAN KIVELL, R. de C. The Rex Nan Kivell Collection of Early New Zealand Pictures. Wn, Dept. of Internal Affairs, 1953. n.p.
SIMPSON, E. C. A Survey of the Arts in New Zealand. Wn, Wellington Chamber Music Society.
*TAYLOR, E. M. Engravings on Wood. Wn, Mermaid Press, 1957 $4.20.
*WOOLLASTON, M. T. The Far-away Hills; a Meditation on the New Zealand Landscape … Ak. Auckland Gallery Associates, 1962. 50c.
—— ERUA, Ak, Blackwood & Janet Paul, 1966. $3.30.
PASCOE, J. D. ed. National Parks of New Zealand. Wn, Govt. Print., 1965. $2.50.
SALMON, J. T. Heritage Destroyed; the Crisis in Scenery Preservation in New Zealand. Wn, Reed, 1960. 85c.
ALINGTON, M. H. Frederick Thatcher and St. Paul's, an Ecclesiological Study. Wn, Govt. Print., 1965. 45c.
FIRTH, C. H. State Housing in New Zealand. Wn, Ministry of Works, 1949, n.p.
ROSENFELD, M. Practical Flat and House plans (with specifications). 9th ed. Ak, New Zealand House Design Publications, 1965. $1.75.
*TAYLOR, C. R. H. The Gothic Beauties and History of the Canterbury Provincial Buildings. 4th Ed. Ch. Canterbury Provincial Buildings Board, 1963. 20c.
*WARREN, D. E. Some Canterbury Churches. Ch, Pegasus Press, 1957. 55c.
BRIDGE, L. D. Mountain Search and Rescue in New Zealand. Wn, Federated Mountain Clubs of N.Z., 1960. $1.55.
BRITTENDEN, R. T. Great Days in New Zealand Cricket. Wn, Reed, 1958. $1.85.
CRUMP, B. J. A Good Keen Man. Wn, Reed, 1960. $1.60 (Sketches based on the experiences of a deer culler.)
DOOGUE, R. B., and MORELAND, J. M. New Zealand Sea Anglers' Guide. Wn, Reed. 3d Ed. 1964. $2.25.
GRAHAM, J. C. Ruapehu; Tribute to a Mountain. The Golden Jubilee Book of the Ruapehu Ski Club. Wn, Reed, 1963. $2.25.
HARRIS, N. H. Lap of Honour; the Great Moments of New Zealand Athletics. Wn, Reed, 1963. $1.85.
HEWITT, L. R., and DAVIDSON, M. The Mountains of New Zealand. Wn, Reed, 1954. o.p.
HILLARY, Sir E. P. High Adventure. Lond., Hodder & Stoughton, 1955. $1.60.
HINTZ, O. S. Trout at Taupo, Lond., M. Reinhardt. New Ed. 1964. $3.00.
HOUSTON, J. Association Football in New Zealand. Wn, Reed, 1952. 60c.
JARDEN, R. A. Rugby on Attack. Ch, Whitcombe & Tombs, 1961. $1.25.
LITTLE, K. M. Polo in New Zealand. Wn, Whitcombe & Tombs, 1956. $3.00.
LYDIARD, A. L., and GILMOUR, G. Run to the Top. Wn, Reed, 1962. $1.85.
MACKINNON, J. A. ed. New Zealand Sports Almanac. Ak, Beach Road Printers, 1964. $1.50.
*MIERS, K. H. Shooters' Guide to New Zealand Waterbirds. Wn, Dept. of Internal Affairs, 1960. 15c.
MULGREW, P. D. No Place for Men. Wn, Reed, 1964. $2.25.
N.Z. DEPT. OF EDUCATION. Physical Education Branch. (Sports Series) 1954–(Guide Books for Teachers and Coaches on Various Sports, e.g., rugby football, athletics, hockey) 25c ea.
NOLAN, M. A. Bush Lore. Ch, Whitcombe & Tombs, 1961. $1.35.
O'BRIEN, B. F. Kiwis with Gloves on; a History and Record-book of New Zealand Boxing. Wn, Reed, 1960. $2.50.
PASCOE, J. D. Great Days in New Zealand Mountaineering. Wn, Reed, 1958. o.p.
—— Land Uplifted High. Ch, Whitcombe & Tombs, 1962. $1.80.
PAUL, G. R. Cruising in New Zealand Waters. Rev. Ed. Ch, Pegasus Press, 1963. 95c.
SMITH, M. W. Game as You Like (Biographies of Sportsmen) Ch, Whitcombe & Tombs, 1965. $2.40.
SWAN. A. C. History of New Zealand Rugby Football. Vol. 2: 1946–57. Wn, N.Z. Rugby Football Union, 1958. $3.25.
—— History of New Zealand Rugby Football 1870–1945. Wn, N.Z. Rugby Football Union by Reed, 1958. o.p.
—— The Log o'Wood; a Complete History of the Ranfurly Shield. Ch, Whitcombe & Tombs, 1960. $1.15.
TOTALISATOR AGENCY BOARD. History and Operation of Off-course Betting in New Zealand. Wn, 1958. n.p.
CRICKET ALMANAC OF NEW ZEALAND. A. H. Carman, Wn. a. $1.05.
RUGBY ALMANAC OF NEW ZEALAND. A. H. Carman, Wn. a. 75c.
JOHNSON, O. A. A. R. D. Fairburn, 1904–57; a Bibliography of his Published Work. Ak, University of Auckland, 1958. $1.50.
LANDFALL. Landfall Country; Work from Landfall, 1947–61, Chosen by Charles Brasch. Ch, Caxton Press, 1962. $4.50.
McCORMICK, E. H. New Zealand Literature; a Survey. Lond., O.U.P., 1959. $2.25.
MULGAN, A. E. Great Days in New Zealand Writing. Wn, Reed, 1962. $1.85.
REID, J. C. ed. A Book of New Zealand. Ak, Collins, 1964. $1.60.
SMITHYMAN, W. K. A Way of Saying; a Study of New Zealand Poetry. Ak, Collins, 1965. $2.25.
STEVENS, J. The New Zealand Novel, 1860–1960. 2d ed. Wn, Reed, 1966. $1.25.
TURNER, G. W. The English Language in Australia and New Zealand. London, Longmans, 1966. $3.75.
LANDFALL. Caxton Press, 119 Victoria St., Ch. q. $2.00 p.a.
*ADCOCK, K. F. The Eye of the Hurricane. Wn, Reed, 1964. $1.25.
*BAXTER, J, K. A Selection of Poetry. Wn, Poetry Magazine, 1964.
—— Howrah Bridge and Other Poems. Lond., O.U.P., 1961. $1.05.
*—— In Fires of no Return; Poems. Lond., O.U.P., 1958. $1.25.
—— Pig Island letters. Lond., Oxford University Press, 1966. $1.80.
*BLAND, P. G. My Side of the Story; Poems 1960–1964. Ak, Mate Books, 1964. $1.50.
*BRASCH, C. O. Ambulando; Poems. Ch, Caxton Press, 1964. $1.50.
*—— C. O. Disputed Ground; Poems 1939–45. Ch, Caxton Press, 1948. 60c.
*CAMPBELL, A. Mine Eyes Dazzle; Poems 1947–49. 2d Ed. Ch, Pegasus Press, 1956. 95c.
*—— Sanctuary of Spirits; Poems. Wn, Wai-te-ata Press, 1963. 40c.
*CHALLIS, C. G. Building; Poems. Ch, Caxton Press, 1963. $1.50.
CHAPMAN, R. McD., and BENNETT, J., comps. Anthology of New Zealand Verse. Lond., O.U.P., 1956. $2.10.
CURNOW, T. A. M. The Penguin Book of New Zealand Verse. Harmondsworth, Eng., Penguin Books. 1966. 50c.
*—— Poems 1949–57. Wn, Mermaid Press, 1957. $1.45.
—— A Small Room with Large Windows; Selected Poems. Lond., O.U.P., 1962. $1.25.
*DALLAS, R. The Turning Wheel. Ch, Caxton Press, 1961. $1.50.
*DOYLE, C. D. Distances; Poems. Ak, Paul's Book Arcade, 1963. 85c.
*—— Messages for Herod. Ak, Collins, 1965. $1.25.
—— ed. Recent Poetry in New Zealand. Ak, Collins, 1965. $1.80.
*—— A Splinter of Glass; Poems 1951–55. Ch, Pegasus Press, 1956. $1.25.
*DUGGAN, E. M. More Poems. Lond., Allen & Unwin, 1951. $1.25.
FAIRBURN, A. R. D. Collected Poems. Ch, Pegasus Press, 1966. $2.25; paper $1.50.
—— The Disadvantages of Being Dead. Wn, Mermaid Press, 1958. $1.05.
GILBERT, Ruth. The Luthier Poems. Wn, Reed, 1966. $1.25.
GLOVER, D. J. M. Enter Without Knocking. Ch, Pegasus Press. 1964. $1.75.
—— Since Then. Wn, Mermaid Press, 1957. $1.05.
*—— Sings Harry and Other Poems. Ch, Caxton Press. 2d Ed. 1957. $1.25.
HART-SMITH, W. The Talking Clothes, poems. Sydney, Angus and Robertson, 1966. $A1.95.
*HENDERSON, P., pseud. The Halting Place. Ch, Caxton Press, 1963. $1.50.
*—— Unwilling Pilgrim; Poems. Ch, Caxton Press, 1955. $1.25.
*HERVEY, J. R. She was My Spring. Ch, Caxton Press, 1954. $1.50.
*HOOPER, P. A Map of Morning and Other Poems. Ch, Pegasus, 1964. $1.25.
JOHNSON, L. A. Bread and a Pension; Selected Poems. Ch, Pegasus Press, 1964. $1.75.
*JOSEPH, M. K. The Living Countries. Hamilton, Paul's Book Arcade, 1959. $1.05.
MASON, R. A. K. Collected Poems; with an Introduction by Allen Curnow. Ch, Pegasus Press, 1962. $1.75.
*MITCALFE, B. Thirty Poems. Wn, Price Milburn, 1960. 95c.
*MULGAN, A. E. Golden Wedding and Other Poems. Ch, Caxton Press, 1964. $1.25.
MURDOCH, W., and MULGAN, A., comps. A Book of Australian and New Zealand Verse. Lond., O.U.P., 1950. 90c.
NGATA, Sir A. T., ed. (Nga Moteatea) The Songs. Wn, Polynesian Society, 1959–. (Part 1, $3.25; Part 2, $4.20).
*OLIVER, W. H. Fire Without Phoenix; Poems 1946–54. Ch, Caxton Press, 1957. $1.25.
*RAWLINSON, G. J. Of Clouds and Pebbles; Poems. Hamilton, Paul's Book Arcade, 1963. $1.05.
*SCHRODER, J. H. E. The Street and Other Verses. Ch, Pegasus Press, 1962. $1.25.
*SINCLAIR, K. Strangers or Beasts; Poems. Ch, Caxton Press, 1954. 75c.
*—— A Time to Embrace. Hamilton, Paul's Book Arcade, 1963. $1.05.
*SMITHYMAN, W. K. The Blind Mountain and Other Poems. Ch, Caxton Press, 1950. 85c.
—— Inheritance; Poems. Hamilton. Paul's Book Arcade, 1962. $1.25.
*STEAD, C. K. Whether the Will is Free; Poems 1954–62. Hamilton, Paul's Book Arcade, 1964. $1.25.
*TUWHARE, H. No Ordinary Sun; Poems. Hamilton, Blackwood and Janet Paul, 1964. $1.05.
WILKINSON, I. G. Houses by the Sea and the Later Poems of Robin Hyde (pseud.), Ch, Caxton Press, 1952. $1.35.
*WILSON, P. S. Staying at Ballisodare. Lond., Scorpion Press, 1960. 85c.
WOODHOUSE, A. R., comp. New Zealand Farm and Station Verse 1850–1950. Ch, Whitcombe & Tombs, 1950. o.p.
NEW ZEALAND POETRY YEARBOOK. Whitcombe & Tombs, Wn. a. $1.05.
HOLCROFT, M. H. Islands of Innocence; The Childhood Theme in New Zealand Fiction. Wn, Reed, 1964, 55c.
N.Z. NATIONAL LIBRARY SERVICE. School Library Service. Fiction for Post-primary Schools; an Annotated List. 2d Ed. Rev. and Enl. Wn, 1960. Photoprinted.
ADSETT, D. R. A Magpie Sings. Wn, Price Milburn, 1963. $1.60.
ASHTON-WARNER, S. Bell Call. New York, Simon and Schuster, 1964.
—— Greenstone. New York, Simon and Schuster, 1966. $US5.00.
—— Incense to Idols. Lond., Seeker & Warburg, 1960. $1.80.
—— Spinster. Lond., Seeker & Warburg, 1958. $1.80.
BALLANTYNE, D. The Cunninghams. Lond., Robert Hale; Ch, Whitcombe & Tombs, 1963. $1.50.
—— The Last Pioneer. Lond., Robert Hale; Ch, Whitcombe & Tombs, 1963. $1.25.
BOOTH, P. J. Long Night Among the Stars. Lond., Collins, 1961. $1.60.
BILLING, G. J. Forbush and the Penguins. Wn, Reed, 1965. $1.60.
BRATHWAITE, E. Fear in the Night. Ch, Caxton Press, 1959. $1.50.
—— The Flying Fish. Lond., Ak. Collins, 1964. $2.20.
COURAGE, J. The Visit to Penmorten. Lond., Cape, 1961. $1.60.
—— The Young Have Secrets. Lond., Cape, 1954. $1.25.
CROSS, I. R. After Anzac Day. Lond., A. Deutsch, 1961. $1.50.
—— The Backward Sex. Lond., A. Deutsch, 1960. $1.25.
—— The God Boy. Lond., A Deutsch, 1958. $1.25.
DAVIN, D. M. New Zealand Short Stories. Lond., O.U.P., 1953. 50c.
—— No Remittance. Lond., M. Joseph, 1959. $1.50.
DUCKWORTH, M. R. A Barbarous Tongue. Lond., Hutchinson, 1963. $1.60.
—— A Gap in the Spectrum. Lond., New Authors, 1959. $1.35.
—— The Matchbox House. Lond., Hutchinson, 1960, $1.60.
DUGGAN, M. N. Summer in the Gravel Pit; Stories. Hamilton, Blackwood & Janet Paul; Lond., Gollancz, 1965. $2.10.
FRAME, J. The Adaptable Man. Ch, Pegasus Press, 1965. $2.10.
—— The Edge of the Alphabet. Ch, Pegasus Press, 1962. $1.75.
—— Faces in the Water. Ch, Pegasus Press, 1961. $1.75.
—— The Lagoon, and Other Stories. 2d Ed. Ch, Caxton Press, 1961. $1.25.
—— Owls Do Cry. Ch, Pegasus Press, 1957. $1.50.
—— The Reservoir; Stories and Sketches. New York. G. Braziller, 1963.
—— Teacher. Lond. Seeker & Warburg, 1963. $2.80.
—— Scented Gardens for the Blind. Ch, Pegasus Press, 1963. $1.75.
—— Snowman, Snowman; Fables and Fantasies. New York, G. Braziller, 1963.
FRANCE, H. R. Ice Cold River. Lond., Constable; Hamilton, Paul's Book Arcade, 1961. $1.75.
—— The Race. Hamilton, Paul's Book Arcade, 1960. $1.50.
GEE, M. G. The Big Season. Lond., Hutchinson, 1962. $1.60.
—— A Special Flower. Lond., Hutchinson, 1965. $2.20.
GILBERT, G. R. Love in a Lighthouse. Ch, Pegasus Press, 1956. $1.25.
HILLIARD, N. H. Maori Girl. Lond., Heinemann, 1960. $1.60.
—— A Piece of Land; Stories and Sketches. Lond., Robert Hale; Ch, Whitcombe & Tombs, 1963. $1.25.
—— Power of Joy. Lond., M. Joseph, 1965. $2.10.
JOSEPH, M. K. A Pound of Saffron. Lond., V. Gollancz; Hamilton, Paul's Book Arcade, 1962. $1.80.
LEE, J. A. Children of the Poor. London, Mayfair Books. 40c (paper)
—— Shiner Slattery. Ak, Collins, 1964. $1.80.
—— Shining With the Shiner. Lond., Mayfair Books, 1963. 52c.
MC DONALD, G. B. Srinson's Bush. Ch, Whitcombe & Tombs, 1954. 65c.
MC LEOD, D. The Tall Tussock: Stories of the High Country. Ch, Whitcombe & Tombs, 1959. $1.35.
MANDER, J. The Story of a New Zealand River. Lond., R. Hale; Ch, Whitcombe & Tombs, 1960. $1.65.
MANSFIELD, K. Selected Stories, Chosen and Introduced by D. M. Davin. Lond., O.U.P., 1953. 50c.
MIDDLETON, O. E. G. A Walk on the Beach. London, Joseph, 1964. $2.10.
MITCALFE, B. Salvation Jones. Ak, Mate Books (Ak) 1962. 75c.
MUIR, Word for Word. Ch, Pegasus Press, 1960. $1.80.
MULGAN, A. E. Spur of Morning. Ch, Whitcombe & Tombs, 1960. $1.25.
MULGAN, J. A. E. Man Alone. Hamilton, Paul's Book Arcade, 1960. $1.35.
PARK, R. R. L. One-a-Pecker, Two-a-Pecker. Sydney, Angus & Robertson, 1957. $1.75.
PEARSON, W. H. Coal Flat. Ak, Paul's Book Arcade, 1963. $2.10.
SARGESON, F. Collected Stories. Hamilton, Blackwood & Janet Paul, 1964. $1.60.
—— I for One. Ch, Caxton Press, 1954. 60c.
—— Memoirs of a Peon. Lond., MacGibbon & Kee, 1965. $3.10.
SATCHELL, W. The Greenstone Door. Lond., Whitcombe & Tombs, 1950. $1.50.
SHADBOLT, M. F. R. Among the Cinders. Ch, Whitcombe & Tombs, 1965. $2.25.
—— The New Zealanders; a Sequence of Stories. Ch, Whitcombe & Tombs, 1959. $1.80.
—— Summer Fires and Winter Country. Lond., Eyre & Spottiswoode; Ch, Whitcombe & Tombs, 1963. $2.10.
SLATTER, G. C. A Gun in my Hand. Ch, Pegasus Press, 1959. $1.50.
STEAD, C. K. New Zealand Sport Stories. 2d series. London. O.U.P., 1966. $1.45.
WALLIS, R. F. Point of Origin. Boston, Houghton Miflin; Lond., Bodley Head, 1963. $1.70.
WILKINSON, I. G. Check to your King … by Robin Hyde (pseud.) Wn, Reed, 1960. $1.50.
WILSON, G. E. M. Brave Company. Hamilton, Paul's Book Arcade, 1963. $1.50.
WILSON, P. J. Some Are Lucky. Wn, D. Glover, 1960. $2.00.
CAMPBELL, A. The Happy Summer. Ch, Whitcombe & Tombs, 1961. $1.40.
*DUGGAN, M. N. Falter Tom and the Water Boy. Hamilton, Paul's Book Arcade, 1958. $1.05.
FINLAYSON, R. D. The Springing Fern. Ch, Whitcombe & Tombs, 1965. $1.75.
LOCKE, E. V. The Runaway Settlers. Lond., Cape; Hamilton, Blackwood & Janet Paul, 1965. $1.60.
MITCALFE, B. The Long Holiday. Ch, Whitcombe & Tombs, 1964. $1.30.
*MORICE, S. The Book of Wiremu. Hamilton, Paul's Book Arcade, 1958. 75c.
SUTTON-SMITH, B. Smitty Does a Bunk. Wn, Price Milburn, 1961. $1.25.
TINDALE, N. B., and LINDSAY, H. A. Rangatira (the High Born). Wn, Reed, 1959. $1.25.
WEST, J. T. The Golden Country. Lond., Dent; Hamilton, Blackwood & Janet Paul, 1965. $1.50.
—— The Year of the shining Cuckoo. Hamilton, Paul's Book Arcade, 1961. $1.25.
*WESTRA, A. Washday at the Pa. Ch, Caxton Press, 1964.
WILSON, P. J. The Outcasts. Lond., R. Hale; Ch, Whitcombe & Tombs, 1965. $1.60.
HOLCROFT, M. H. Discovered Isles; a Trilogy: The Deepening Stream, The Waiting Hills, Encircling Seas. Ch, Caxton Press, 1950. $2.25.
—— The Eye of the Lizard, a Selection of Editorials from the New Zealand Listener, 1949–59. Wn, Reed, 1960. $1.55.
NEW ZEALAND DRAMA COUNCIL. List of Recommended Plays. Wn, 1955. 15c.
REID (JOAN AND RUSSELL) LTD., WELLINGTON. Prompt Book, 2d Ed.; a New Zealand Theatre Guide. .. Wn, 1959. $1.05.
*BAXTER, J. K. Two Plays: The Wide Open Cage and Jack Winter's Dream. Hastings, Capricorn Press, 1959. 75c.
CURNOW, T. A. M. The Axe; a Verse Tragedy. Ch, Caxton Press, 1949 (i.e. 1950) o.p.
JONES, S. The Tree. Ch, Whitcombe & Tombs, 1960. 50c.
MASON, B. E. G. The Pohutukawa Tree; a Play in Three Acts. Wn, Price Milburn, 1960. 75c.
SARGESON, F. Wrestling with an Angel; two plays, A Time for Sowing and The Cradle and the Egg. Ch, Caxton Press, 1964. $1.75.
ANTHONY, F. S. and JACKSON, F. The Complete Me and Gus. Wn, Reed, 1963. $1.10.
CRUMP, B. J. Hang on a Minute Mate. Wn, Reed, 1961. $1.60.
GRIEVE, H. Sketches from Maoriland. Lond., R. Hale; Ch, Whitcombe & Tombs, 1961. $1.25.
REID, J. C. The Kiwi Laughs; an Anthology of New Zealand Prose Humour. Wn, Reed, 1960. $1.60.
GLOVER, D. J. M. Denis Glover's Bedside Book. Dn, Reed, 1963. $1.60.
MASON, B. E. G. The End of the Golden Weather; a Voyage into a New Zealand Childhood. Wn, Price Milburn, 1962. $1.25.
ANDERSEN, J. C. Maori Place Names. Wn, Polynesian Society, 1942. o.p.
DOLLIMORE, E. S. The New Zealand Guide. 3d Ed. Dn, H. Wise, 1962. $4.50.
REED, A. W. A Dictionary of Maori Place Names. Wn, Reed, 1961. $1.25.
AUSUBEL, D. P. The Fern and the Tiki; an American View of New Zealand. Sydney, Angus & Robertson, 1960. $2.25.
BIGWOOD, K. V. New Zealand in Colour. Wn, Reed, 1961–62. 2 vol. $2.50.
BRAKE, B. New Zealand; Gift of the Sea. Ch, Whitcombe & Tombs, 1963. $3.50.
CONSTABLE, L. D. Home Territory. Ch, Pegasus Press, 1953. 95c.
CUMBERLAND, K. B. This is New Zealand; a Pictorial Description. 5th Ed. Ch, Whitcombe & Tombs, 1960. 82c.
CUMBERLAND, K. B., and Fox, J. W. New Zealand; a Regional Geography. Ch, Whitcombe & Tombs, 1958. $1.85.
DUFF, O. New Zealand Now. 2d Ed. Hamilton, Paul's Book Arcade, London, Allen & Unwin, 1956. $1.25.
*—— Ourselves Today. Ch, Pegasus Press, 1959.
HALL, D. O. W. Portrait of New Zealand. 3d Ed. Wn, Reed, 1961.
HARDWICK, J. M. D. Seeing New Zealand; an Illustrated Travel Guide. 4th Ed. Wn, Reed, 1959. $1.85.
HOLCROFT, M. H. New Zealand. Wn, Reed, 1963. $10.50.
MC INTYRE, P. Peter McIntyre's New Zealand. Wn, Reed, 1964. $12.60.
MC LINTOCK, A. H., ed. A Descriptive Atlas of New Zealand. Wn, Govt. Print., 1959. $4.00.
SINCLAIR, K. Distance Looks our Way; the Effects of Remoteness on New Zealand. Hamilton, Paul's Book Arcade for the University of Auckland, 1961. $1.25.
STONE, D. Verdict on New Zealand. Wn, Reed, 1959. $1.85.
SUTHERLAND, W. T. G. The Silver Fern; a Journey in Search of New Zealand. Wn, Reed, 1959. $1.60.
WHITE, L. L. White's Pictorial Reference of New Zealand. 2d Ed. Ak, White's Aviation, 1960. $12.60.
WOOD, F. L. W. This New Zealand. 3d Ed. Hamilton, Paul's Book Arcade, 1958. $2.50.
NEW ZEALAND GEOGRAPHER. New Zealand Geographical Society, University of Canterbury, Ch, semi-a. $3.00.
BARKER, M. A., Lady. Station Life in New Zealand. Ch, Whitcombe & Tombs, 1950. o.p.
BEST, A. D. W. The Journal of Ensign Best, 1837–1843. Ed. by Nancy M. Taylor. Wn, Govt. Print., 1966. $3.50.
BUTLER, S. A First Year in Canterbury Settlement. Edited by A. C. Brassington and P. B. Maling. Hamilton, Blackwood & Janet Paul, 1964. $1.85.
COOK, J. The Journals of Captain James Cook on his Voyages of Discovery. Edited … by J. C. Beaglehole … Cambridge, Hakluyt Society, 1955—.
CRUISE, R. A. Journal of a Ten Months' Residence in New Zealand (1820). New Ed. Ch, Pegasus Press, 1957. $4.20.
DRUMMOND, Mrs A. E. H. Married and Gone to New Zealand; Being Extracts from the Writings of Women Pioneers. Lond., O.U.P.; Hamilton, Paul's Book Arcade, 1960. $1.85.
EARLE, A Narrative of a Residence in New Zealand. Ed. by E. H. McCormick. Oxford, Clarendon Press, 1966. $7.15.
MANING, F. E. Old New Zealand; a Tale of the Good Old Times. Ch, Whitcombe & Tombs, 1952. $1.50.
MARKHAM, E. New Zealand or Recollections of It. Edited with an introduction by E. H. McCormick. Wn, Govt. Print., 1963. $3.00.
TAYLOR, Mrs N. M. Early Travellers in New Zealand. Oxford, Clarendon Press, 1959. $6.30.
WAKEFIELD, E. J. Adventure in New Zealand. An Abridgement. Ch, Whitcombe & Tombs, 1955. $1.75.
The following are representative of the many titles in this category:
BROWNE, V. C. The Coast. Ch, Whitcombe & Tombs, 1962 (i.e. 1963) $2.50.
HAMILTON, W. M. Little Barrier Island (Hauturu). 2d Ed. Wn, D.S.I.R., 1961. $3.00.
KEAM, R. F. Volcanic Wonderland; the Scenery and Spectacle of the New Zealand Thermal Region. 2d Ed. Ak, The Author, 1961. 60c.
LISTER, R. G. ed. Central Otago. Dn, New Zealand Geographical Society, 1965. $3.50.
MOIR'S Guide Book to the Tramping Tracks and Routes of the Great Southern Lakes and Fiords of Otago and Southland. 3d Ed. Ch, Whitcombe & Tombs, 1956–61. $1.25.
N.Z. MINISTRY OF WORKS. Town and Country Planning Branch. National Resources Survey. Part I. West Coast Region. Wn, Govt. Print., 1959. $3.50.
N.Z. MINISTRY OF WORKS. Town and Country Planning Branch. National Resources Survey. Part II, Bay of Plenty Region. Wn, Govt. Print., 1962. $6.50.
N.Z. MINISTRY OF WORKS. Town and Country Planning Branch. National Resources Survey. Part III. Northland Region. Wn, Govt Print., 1964. $4.50.
N.Z. MINISTRY OF WORKS. Town and Country Planning Branch. National Resources Survey. Part IV. Nelson Region. Wn, Govt. Print., 1965. $4.50.
*PACKARD, W P. Mount Cook National Park Handbook. Ch, Mount Cook National Park Board, 1959. (Corresponding Handbooks for other Parks in process of publication.) 40c.
PASCOE, J. D. The Mountains, the Bush and the Sea; a Photographic Report. Ch, Whitcombe & Tombs, 1950. $1.25.
REED, A. H. The Four Corners of New Zealand. Wn, Reed, 1954. $2.50.
SAUNDERS, B. G. R. ed. Introducing the Manawatu. 2d Ed. Palmerston North, Department of Geography, Massey University of Manawatu, 1964. $2.00.
BEAGLEHOLE, J. C. The Discovery of New Zealand. 2d Ed. Lond., O.U.P., 1961. $2.10.
BURDON, R M. The New Dominion; a Social and Political History of New Zealand 1918–39. Wn, Reed; Lond., Allen & Unwin, 1965. $5.00.
CHAPMAN, R. M., and SINCLAIR, K., ed. Studies of a Small Democracy; Essays in Honour of Willis Airey. Hamilton, Paul's Book Arcade for the University of Auckland, 1963. $2.75.
CONDLIFFE, J. B. New Zealand in the Making. 2d Ed. Lond., Allen & Unwin, 1959. $3.00.
—— The Welfare State in New Zealand. Lond., Allen & Unwin, 1959. $3.50.
COWAN, J. The New Zealand Wars. Wn, Govt. Print., 1955–56. $9.00.
GORST, Sir J. E. The Maori King. Edited by Keith Sinclair. Lond., O.U.P.; Hamilton, Paul's Book Arcade, 1959. $2.50.
HALL, D. O. W. The New Zealanders in South Africa, 1899–1902. Wn, War History Branch, Dept. of Internal Affairs, 1949. $1.05.
HOLT, E. C. The Strangest War; the Story of the Maori Wars 1860–1872. Lond., Putnam, 1962. $3.00.
MC CLYMONT, W. G. The Exploration of New Zealand. Lond., O.U.P., 1959. $2.10.
MC CORMICK, E. H. Tasman and New Zealand; a bibliographical study. Wn, Govt. Print., 1959. 75c.
MC LINTOCK, A. H. Crown Colony Government in New Zealand. Wn, Govt. Print., 1958. $3.50.
MILLER, J. O. Early Victorian New Pealand … 1839–52. Lond., O.U.P., 1958. $3.70.
MORRELL, W. P. The Great Powers in the Pacific. London, published for the Historical Association by Routledge and Kegan Paul, 1963. 35c.
—— The Provincial System in New Zealand, 1852–76. 2d Rev. Ed. Ch, Whitcombe & Tombs, 1964. $4.50.
N.Z. DEPT. OF INTERNAL AFFAIRS. Centennial Branch. Making New Zealand; Pictorial Surveys of a Century. Wn, 1939–40. 2 vols. o.p.
N.Z. NATIONAL ARCHIVES. Preliminary Inventory. No. 1–9, 1953–58. Wn, Dept. of Internal Affairs.
N.Z. NATIONAL HISTORIC PLACES TRUST. (Leaflets on various historic sites. gratis.) (Booklets. See under Individual Authors, e.g., Standish, M. W., Wilson, G. H. O.)
OLIVER, W. H. The Story of New Zealand. 2d Ed. Lond., Faber, 1963. $2.50.
PASCOE, J. D. Great Days in New Zealand Exploration; the Bush and the Rain. Wn, Reed, 1959. $1.85.
Ross, A. New Zealand Aspirations in the Pacific in the Nineteenth Century. Oxford, Clarendon Press, 1964. $5.60.
SCHOLEFIELD, G. H., ed. The Richmond-Atkinson Papers. Wn, Govt. Print., 1960. $21.00.
SCOTT, R. G. Inheritors of a Dream; a Pictorial History of New Zealand. Ak, Ronald Riddell, 1962. $4.50.
SINCLAIR, K. A History of New Zealand. Penguin Books, 1959. 4s. 9d.; Lond, O.U.P., 1961. $2.50.
—— The Origins of the Maori Wars. Wn, New Zealand University Press, 1957. $3.00.
SUTCH, W. B. The Quest for Security in New Zealand, 1840 to 1966. Wn, Oxford U. P., 1966. $2.75.
*WILSON, G. H. O. War in the Tussock; Te Kooti and the Battle at Te Porere. Wn, Govt. Print, 1961. 50c.
WRIGHT, H. M. New Zealand, 1769–1840; Early Years of Western Contact, Cambridge, Mass, Harvard University Press, 1959. $3.80.
HISTORICAL NEWS. Whitcombe and Tombs in Association with the History Dept., Canterbury University, Christchurch. 2 p.a. 30c.
HISTORICAL REVIEW. Whakatane and District Historical Society, Whakatane. q. $2.10 (and publications of other Local Historical Societies).
POLITICAL SCIENCE. See full entry under Political Science. Includes Historical Articles.
GRACE, J. H. Tuwharetoa; the History of the Maori People of the Taupo District. Wn, Reed, 1959.
HOUSTON, J. Maori Life in Old Taranaki. Wn, Reed, 1965. $3.50.
KELLY, L. G. Tainui; the Story of Hoturoa and his Descendants. Wn, Polynesian Society, 1949. $3.00.
TAYLOR, W. A. Lore and History of the South Island Maori. Ch, Bascands, 1952. o.p.
The following are representative of the many titles in this category:
ADKIN, G. L. The Great Harbour of Tara; Traditional Maori Place-names and Sites of Wellington Harbour and Environs. Ch, Whitcombe & Tombs 1959. $2.85.
ALLAN, R. M. Nelson; a History of Early Settlement. Wn, Reed, 1965. $4.50.
*BURNETT, R. I. M. The Paremata Barracks. Wn, Govt. Print, 1963. 50c.
CARKEER, W. The Kapiti Coast, Maori History and Place Names. Wn, Reed, 1966. $2.85.
GILLESPIE, O. A. South Canterbury; a Record of Settlement. Timaru, South Canterbury Centennial History Committee, 1958. $6.50.
HAWKINS, D. W. Beyond the Waimakariri. Ch, Whitcombe & Tombs, 1957. $2.50.
HIGHT, Sir J. A History of Canterbury. Ch, Canterbury Centennial Association, 1957– vol. 1, 1957 by C. R. Straubel and others. $2.25.
MC LINTOCK, A. H. The History of Otago. Dn, Otago Centennial Historical Publications, 1949. o.p.
MAY, P. R. The West Coast Gold Rushes. Ch, Pegasus Press, 1962. $3.75.
MILLER, F. W. G. Golden Days of Lake County. 2d Ed. Ch, Whitcombe & Tombs, 1961. $2.75.
NEWPORT, J. N. W. Footprints; the Story of the Settlement and Development of Nelson Back Country Districts. Ch, Whitcombe & Tombs, 1962. $4.20.
NORRIS, H. C. M. Settlers in Depression; a History of Hamilton, New Zealand, 1875–1894. Hamilton, Paul's Book Arcade, 1964. $2.50.
PETERSEN, G. C. Forest Homes; the Story of the Scandinavian Settlements in the Forty Mile Bush, New Zealand. Wn, Reed, 1956. o.p.
PYKE, V. History of the Early Gold Discoveries in Otago. Dn, Otago Daily Times and Witness Newspapers Co, 1962. $1.75.
SCOTTER, W. H. A History of Canterbury, Vol. III: 1876–1950. Ch, Canterbury Centennial Historical and Literary Committee, 1965. $4.20.
SHERRARD, J. M. Kaikoura, a History of the District Kaikoura, Kaikoura County Council. $3,00.
*STANDISH, M. W. The Waimate Mission Station. Wn, Govt. Print, 1962. 50c.
AITKEN, A. C. Gallipoli to the Somme; Recollections of a New Zealand Infantryman. Lond, O.U.P. 1963. $3.00.
Official History of New Zealand's Effort in the Great War. Ak, Whitcombe & Tombs, under Authority of N.Z. Govt. 4 vols. 1919–23. o.p.
The following represent a selection of general volumes of the New Zealand Official History.
Unit Histories have been listed in earlier volumes of the Yearbook.
ANSON, T. V. The New Zealand Dental Services. Wn, War History Branch, 1960. $2.50.
BAKER, J. V. T. The New Zealand People at War; War Economy. Wn, War History Branch, 1965. $2.50.
DAVIN, D. M. Crete. Wn, War History Branch, 1953. o.p.
GILLESPIE, O. A. The Pacific. Wn, War History Branch, 1952. o.p.
MC CLYMONT, W. G. To Greece. Wn, War History Branch, 1959. $2.50.
MASON, W. W. Prisoners of War. Wn, War History Branch, 1954. $2.50.
MURPHY, W. E. The Relief of Tobruk. Wn, War History Branch, 1961. $2.50.
N.Z. DEPT. OF INTERNAL AFFAIRS. War History Branch. Documents Relating to New Zealand's Participation in the Second World War, 1939–45. 3 vols. Wn, 1949–63. $2.10 each.
PHILLIPS, N. C. Italy. Wn, War History Branch, 1957–Vol. 1 Sangro to Cassino, 1957. $2.50.
ROSS, J. M. S. Royal New Zealand Air Force. Wn, War History Branch, 1955. $2.50.
SCOULLAR, J. L. Battle for Egypt; the Summer of 1942. Wn, War History Branch, 1955. $2.50.
STEVENS, W. G. Bardia to Enfidaville. Wn, War History Branch, Dept. of Internal Affairs, 1962. $2.50.
—— Problems of 2 NZEF, Wn, War History Branch, 1958. $2.50.
STOUT, T. D. M. War Surgery and Medicine. Wn, War History Branch, 1954. $5.00.
—— Medical Services in New Zealand and the Pacific … Wn, War History Branch, 1958. $2.50.
—— New Zealand Medical Services in Middle East and Italy. Wn, War History Branch, 1956. $2.50.
THOMPSON, H. L. New Zealanders with the Royal Air Force. Wn, War History Branch, 1953–3 vols. $2.50 each.
WATERS, S. D. The Royal New Zealand Navy. Wn, War History Branch, 1956. $2.50.
WOOD, F. L. W. The New Zealand People at War; Political and External Affairs. Wn, War History Branch, 1958. $2.50.
ALPERS, A. F. G. Katherine Mansfield; a Bibliography. New York, Knopf; Lond., Cape, 1954. $2.10.
ALPERS, O. T. J. Cheerful Yesterdays. Hamilton, Paul's Book Arcade, 1951. $1.65.
ANDERSON, A. M. A River Rules My Life. Wn, Reed, 1963. $2.25.
ARNOLD, T. New Zealand Letters of Thomas Arnold the Younger. Ed. by James Bertram. Ak, University of Auckland, 1966. $7.80.
BURDON, R. M. The Life and Times of Sir Julius Vogel. Ch, Caxton Press, 1948. $1.75.
—— King Dick; a Biography of Richard John Seddon. Ch, Whitcombe & Tombs, 1955. $1.75.
CRAIG, E. W. G. Man of the Mist; a Biography of Elsdon Best. Wn, Reed, 1964. $3.25.
GLOVER, D. J. M. Hot Water Sailor … Wn, Reed, 1962. $1.60.
GORDON, Mrs D. C. Doctor Down Under. Ch, Whitcombe & Tombs; Lond., Faber, 1957. $1.05.
GORDON, M. C. The Golden Age of Josiah Clifton Firth. Ch, Pegasus Press, 1963 $3.95.
HENDERSON, J. M. Ratana; the Origins and the Story of the Movement. Wn, Polynesian Society, 1963. $2.25.
HOLCROFT, M. H. Dance of the Seasons; an Autobiographical Essay. Ch, Whitcombe & Tombs, 1952. 75c.
JONES, J. J. The Cradle of Erewhon; Samuel Butler in New Zealand … Austin, University of Texas Press, 1959. $3.70.
LEE, J. A. Simple on a Soap-box. Ak, Collins, 1963. £2.25.
LENNARD, C. G. Sir William Martin; the Life of the First Chief Justice of New Zealand. Ch, Whitcombe & Tombs, 1961. $2.25.
*MCCORMICK, E. H. The Fascinating Folly; Dr Hocken and his Fellow Collectors. Dn, University of Otago Press, 1961. 75c.
MC INTYRE, P. The Painted Years. Wn, Reed, 1962. $3.60.
MALING, P. B. Samuel Butler at Mesopotamia, together with Butler's "Forest Creek'' Manuscript. Wn, Govt. Print., and National Historic Places Trust. 1960. 50c.
MANSON, C. M., and Mrs C. Doctor Agnes Bennett. Ch, Whitcombe & Tombs; Lond., Michael Joseph, 1960. $1.80.
MULGAN, A. E. The Making of a New Zealander. Wn, Reed, 1958. $1.85.
N.Z. DEPT. OF INTERNAL AFFAIRS. The New Zealand Honours List. 5th Ed. Wn, Govt. Print., 1964.
O'FARRELL, P. J. Harry Holland, Militant Socialist. Canberra, Australian National University. 1964. $4.95.
RUTHERFORD, J. Sir George Grey, K.C.B., 1812–98; a Study in Colonial Government. Lond., Cassell, 1961. $9.80.
SCHOLEFIELD, G. H. ed. A Dictionary of New Zealand Biography. Wn, Dept. of Internal Affairs, 1940. 2 vols. o.p.
SCOTT, MARY E. Days That Have Run; an Autobiography. Hamilton, Blackwood & Janet Paul, 1966. $2.10.
SINCLAIR, K. William Pember Reeves; New Zealand Fabion. Oxford, Clarendon Press, 1965. $5.70.
STEVENS, W. G. Freyberg, V.C., The Man, 1939–1945. Wn, Reed, 1965. $1.85.
SUTCLIFFE, B. Between Overs; memoirs of a Cricketing Kiwi. Lond., W. H. Allen; Ch, Whitcombe & Tombs, 1963. $1.80.
SUTHERLAND, W. T. G. Green Kiwi. Wn, Reed, 1960. $1.60.
TORLESSE, C. O. The Torlesse Papers. Journal concerning the Foundation of the Canterbury Settlement … Edited by P. B. Maling. Ch, Pegasus Press, 1958. $4.50.
VON ZEDLITZ, G. W. The Search for a Country; the Autobiography of G. W. von Zedlitz. Hamilton, Paul's Book Arcade, 1963. $1.85.
WHO'S WHO IN NEW ZEALAND. 8th Ed. Edited by G. C. Petersen. Wn, Reed, 1964. $5.25.
WILLIAMS, H. The Early Journals of Henry Williams, … Church Missionary Society, 1826–40. Ed. by L. M. Rogers. Ch, Pegasus Press, 1961. $7.50.
WILSON, Mrs H. My First Eighty Years. Hamilton, Paul's Book Arcade, 1959. $1.60.
WILSON, P. J. The Maorilander; a Study of William Satchell. Ch, Whitcombe & Tombs, 1961. $1.20.
WOODHOUSE, Mrs A. E. Guthrie-Smith of Tutira. Ch, Whitcombe & Tombs, 1959. $2.75.
BEAGLEHOLE, E. Social Change in the South Pacific; Rarotonga and Aitutaki. Lond., Allen & Unwin, 1957. $3.50.
CUMBERLAND, K. B. South-west Pacific. A Geography. 3d Ed. Ch, Whitcombe & Tombs, 1958. $1.85.
N.Z. TOURIST AND PUBLICITY DEPT. Publicity Division. New Zealand's Tropical Provinces. Wn, Govt. Print., 1960. gratis.
SAVAGE, S. A Dictionary of the Maori Language of Rarotonga. Wn, Dept. of Island Territories, 1952. $3.50.
HATHERTON, T. ed. Antarctica. Wn, Reed, 1965. $10.50.
—— New Zealand IGY Antarctic Expeditions, Scott Base and Hallett Station. Wn, D.S.I.R. 1961. $1.50.
HELM, A. S., and MILLER, J. H. Antarctica; the Story of the New Zealand Party of the Trans-Antarctic Expedition. Wn, Govt. Print., 1964. $3.75.
HELM, A. S. Provisional Gazetteer of the Ross Dependency, Wn, Govt. Print., 1958. $2.25.
HILLARY, Sir E. P. No Latitude for Error. Lond., Hodder, 1961. $2.10.
SIMPSON, F. A., ed. The Antarctic Today; a Mid-century Survey by the Antarctic Society. Wn, Reed and the Society, 1952. o.p.
ANTARCTIC. N. Z. Antarctic Society, Wn. q. $1.50.
(Contributed by C. P. McBride, National Research Advisory Council)
General—Economic growth and higher living standards depend on increased productivity and full development of national resources. In an age of technological advancement progress depends in a large part on the application of the results of scientific research. In past years production, in particular that in agriculture, has been promoted by scientific research.
More than three-quarters of the scientific research in New Zealand is financed from Government sources. The Government supports science as a cultural, educational, and intellectual activity through the schools, universities, museums, and other ways; but itself engages in scientific research for its social and economic values. Industry supports research which may be of short or long-term benefit to its business and together with private individuals, supports research for philanthropic reasons.
Historical—Many of the early expeditions to the South Pacific included naturalists interested in studying the plant and animal life of the area. The unexplored fields for study attracted famous botanists, geologists, and zoologists. Amongst those who visited New Zealand were Solander, Darwin, Hooker, Dieffenbach, Dana, and von Hochstetter.
However, 1861 might be considered the beginning of organised science in New Zealand. In that year Julius von Haast was appointed provincial geologist to Canterbury, James Hector provinicial geologist to Otago, and the Auditor-General Charles King was appointed Director of Meteorological Observatories.
On 17 March 1865 the Central Government offered Hector the position of Director of a Geological Survey of New Zealand. Hector accepted this position. To this he had added responsibilities for the Colonial Laboratory (where William Skey was Government Analyst from 1865 to 1900), Meteorological Observatories (1868), Colonial Museum (1865), New Zealand Institute (1867), and the University of New Zealand (1871).
For the remainder of the nineteenth century these institutions remained the major scientific organisations in the country.
In 1900 instrumental recording of earthquakes was commenced by the Director of Education, George Hogben, in his home in Wellington. This work was transferred in 1915 to the Hector Observatory. In 1903 the Magnetic Observatory was established by the Department of Lands in Christchurch and in 1905 the Wallaceville Veterinary Laboratory was established by the Department of Agriculture.
The only major endowed research organisation in New Zealand, the Cawthron Institute, was established in 1920. The Institute was founded in Nelson as a result of a bequest of about $500,000 under the will of Thomas Cawthron. As the value of the investment of the bequest has declined the Institute has received increasing grants from the Government through the Department of Scientific and Industrial Research. This grant now amounts to about half the annual income of the Institute.
In 1926 the Government invited Sir Frank Heath, Secretary of the United Kingdom Department of Scientific and Industrial Research to report on the organisation of science in New Zealand. As a result the New Zealand Department of Scientific and Industrial Research was established on 1 September 1926.
The following units were transferred to the new department: Dominion Laboratory and Dominion (Hector) Observatory (from the Department of Internal Affairs), Meteorological Service (from the Marine Department), New Zealand Geological Survey (from the Mines Department), and the Stone Testing and Geological Advisory Service (from the Public Works Department).
The following units remained with their departments: Dominion Museum (Department of Internal Affairs), Magnetic Observatory (Department of Lands and Survey), Apia Observatory (Department of External Affairs), Biological Laboratory, Chemical Laboratory, and Wallaceville Veterinary Laboratory (Department of Agriculture). The Magnetic Observatory (1931) and the Apia Observatory (1928) were subsequently transferred to the Department of Scientific and Industrial Research. The Biological Laboratory of the Department of Agriculture formed the basis of the joint Department of Agriculture -Department of Scientific and Industrial Research, Plant Research Station, established in 1929. This station became the Plant Research Bureau of the Department of Scientific and Industrial Research in 1936 and has subsequently been divided into the various agriculture and biology divisions of that department.
Since the Second World War a number of departments have established their own research units to serve their particular needs. In addition there has been a general increase in research in industry and for industry through the establishment of a number of joint industry - government incorporated research associations. The universities have also during this period taken a much greater part in research.
Science in National Development—There is no doubt about the value of research in national development. The most outstanding examples are to be found in agricultural research. Until the late thirties, livestock would not flourish in the Rotorua - Taupo area because of bush sickness, but through the discovery of cobalt deficiency that same land in 1963 was able to support 146,000 beef cattle, 77,000 dairy cattle, and 1,000,000 sheep. The export value of livestock products from this area is approximately $10,000,000 per year.
The artificial breeding of dairy cows was made possible by research in the past 25 years. Surveys by the Herd Improvement Department if the New Zealand Dairy Board show that in 1963–64 there were 352,000 artificially bred cows in milk in New Zealand and that the average production of these cows was 20 lb of butterfat higher than that of the rest of the national herd. The Board estimates that this additional production was worth $2,112,000 in overseas earnings in 1963–64 and it was expected to rise to $4,186,000 in 1966–67.
Yields from other research projects are not so easy to evaluate but there is no doubt that they are considerable.
Living standards have been maintained and improved as a result of research endeavour. For example, the following major post-war developments in New Zealand have required extensive research and development: the harnessing of geothermal energy; the development of timber preservation techniques; the widespread use of artificial breeding techniques in the dairy industry; the breeding of new varieties of wheat, other crops, and pastures; the search for oil and natural gas; the control of insect pests such as grass grub in pastures and sirex in exotic forests; the widespread use of elements such as sulphur, cobalt, selenium, molybdenum, and copper, to increase farm production; the control of animal disease by use of vaccines and antibiotics; the detailed testing work to establish the use of radiata pine for a diversity of applications; the development of aerial topdressing both for agriculture and forestry; research into the design of buildings and structures so that they will be able to withstand earthquake shock; the control of pesticidal residuals in our export products such as meat.
In addition, many major undertakings of national significance require extensive scientific investigations before they can be commenced with confidence. Hydro-electric dam sites are chosen only after careful geological and geophysical examination of possible locations; special coal surveys had to be made for the planning of the Meremere steam power station; iron ore reserves had to be carefully evaluated before the establishment of an iron and steel industry could be profitably envisaged; and so on.
Along with these more spectacular and demonstrable examples, scientific methods and resources are an essential part of a number of activities concerned with public safety, law and order, health, foreign affairs, and a number of administrative and regulatory activities. Scientists are asked to assist in the investigation of aircraft accidents; to determine the purity of foods and drugs; to help the police in crime detection; to carry out tests for the Consumer Institute and the Government Stores Board; and to visit other countries to assist them in their development programmes either at the request of the other governments or of international bodies such as the United Nations Organisation and its specialised agencies.
If New Zealand is to accelerate its growth the demands on research and scientific services will undoubtedly increase. In all societies, and ours is no exception, the natural resources most easily exploited are the first to be used, but, as these are fully used or become depleted, those less easily developed have to be brought into use if our living standards are to be improved or even maintained. In New Zealand, for example, our first major electricity schemes were hydro-electric; now we are dealing with the more difficult problem of using geothermal power. Until 1940 we used only indigenous heartwood timbers for building purposes; in the last 20 years we have had to devote considerable research and development effort to see how best to replace dwindling supplies of indigenous timbers by locally grown exotic softwoods.
Present Organisation—About 80 percent of the money spent on scientific research in New Zealand comes directly from government sources.
The expenditure by the various organisation groups is approximately:
| Government departments | 72 percent |
| Universities | 9 percent |
| Industry | 8 percent |
| Research associations | 6 1/2 percent |
| Other organisations | 4 1/2 percent |
Therefore the pattern of organisation in government for research plays a large part in the national research pattern.
The National Research Advisory Council was established on 1 April 1964 to advise the Minister of Science on—
The promotion and development of scientific research in New Zealand:
The planning and co-ordination of scientific research and services in New Zealand, including—
The determination of priorities among research activities of government departments, having regard to research done by other organisations:
The provision of scholarships and fellowships and the promotion of the training of research workers:
The association of government with industry in the promotion of fundamental and applied research, including the promotion of research associations:
The collection and dissemination of scientific information including the publication of reports and journals:
The promotion of co-operation with the governments of or organisations in other countries, or with international organisations, in scientific matters:
Any other matters that are appropriate for the carrying out of any other above-mentioned functions, or that are referred to it by the Minister.
The Council has nine members, six (including the Chairman) appointed by the Governor-General together with the Director-General of Agriculture, Director-General of the Department of Scientific and Industrial Research, and Secretary to the Treasury. The Council is responsible to the Minister of Science who discusses reports or proposals with other Cabinet Ministers whose departments may be affected. The Council replaced the Council of Scientific and Industrial Research established in 1926.
The Medical Research Council was established in 1950 and was reconstituted in 1966. The functions of the Council are:
To initiate, foster, and support medical research:
To furnish information, advice, and assistance to persons and organisations concerned with medical research:
To collect and disseminate scientific information, including the publication of reports.
The Council has 13 members; five are ex-officio; three are appointed on the recommendation of professional bodies; and five are appointed as individuals. The Council appoints its own Chairman.
At present, government scientific activities are distributed amongst nine government departments—the Department of Scientific and Industrial Research, the Department of Agriculture, the New Zealand Forest Service, the Marine Department, the Department of Internal Affairs, the Department of Civil Aviation, the Department of Health, the Ministry of Works, and the Ministry of Defence (Navy).
Over 80 percent of the funds provided for science by the Government are administered by three departments—Department of Scientific and Industrial Research, the Department of Agriculture, and the New Zealand Forest Service. A brief outline of the work of these and other departments is now given.
Department of Scientific and Industrial Research—
Agriculture and Biology—crops, pastures, soil, and basic sciences related to these.
Earth Sciences.
Atmospheric Sciences.
Research and services for government departments and for industry.
Department of Agriculture—
Domestic animals, soil fertility and testing, irrigation, horticulture, animal and plant diagnostic services.
New Zealand Forest Service—
Forestry, forest products, noxious animals in forests.
Department of Health—
X-rays and radioactivity and other services related to public health.
Department of Internal Affairs—
Wildlife.
Marine Department—
Marine and freshwater fisheries.
Ministry of Defence—
Underwater and naval research.
Ministry of Works—
Concrete. Hydrology and roads.
In the universities much of the research is done as time permits within teaching commitments. However, in recent years with the growth of doctorate schools and increases in government grants for research there has been a general increase in research at the universities.
In industry, scientific effort has generally been devoted to development and service but in recent years some large organisations have been undertaking substantial applied research.
Prior to the Second World War the various research associations functioned as units of the Department of Scientific and Industrial Research. Following the war most of the units for which industry contributed about half of the running costs were incorporated and no longer functioned within the Department. The incorporated research associations and their establishment dates are as follows.
| Dairy Research Institute | 1,928 |
| Leather and Shoe Research Association | 1,928 |
| Wool Industries Research Institute | 1,937 |
| Pottery and Ceramic Research Association | 1,945 |
| Research Institute of Launderers, Drycleaners and Dyers | 1,947 |
| Fertiliser Manufacturers' Research Association | 1,947 |
| Meat Industry Research Institute | 1,955 |
| Wool Research Organisation | 1,961 |
| Coal Research Association | 1,966 |
The remaining units of the Department to which industry contributes about half the running costs are:
Hop Research Station (Crop Research Division).
Tobacco Research Station (Crop Research Division).
Wheat Research Institute.
The research associations range over the whole of science from those who concentrate on day-to-day service to industrial members to those who concentrate on long-term research for their industry.
Among the other organisations undertaking research, are the various units funded by the Medical Research Council (these are mainly in Dunedin associated with the University of Otago), local medical research foundations and the Cancer Society. There are also the Cawthron Institute at Nelson, the various museums and a number of amateur or near amateur groups, particularly in astronomy.
Research Effort—It is virtually impossible to draw up a precise statement of national expenditure on science. Difficulties arise in the classification of work as science or non-science and it is also difficult to obtain accurate expenditure figures for many organisations. Because such figures therefore depend on the assumptions, often not stated, of the compiler, international comparisons are generally meaningless.
Some New Zealand figures have been published by the National Research Advisory Council and the following tables are based on these figures.
| EXPENDITURE ON SCIENCE | ||||||
|---|---|---|---|---|---|---|
| Department or Agency | Gross Expenditure on Science | Grants | ||||
| 1964–65 | 1965–66 | 1966–67 | 1964–65 | 1965–66 | 1966–67 | |
| $(000) | ||||||
| Scientific and Industrial Research | 6,012 | 7,076 | 7,520 | 733 | 927 | 984 |
| Agriculture | 2,427 | 2,686 | 3,236 | 120 | 86 | 124 |
| Civil Aviation (Meteorological Service) | 293 | 340 | 381 | – | – | – |
| Forest Service | 656 | 659 | 698 | 5 | 5 | 6 |
| Health | 483 | 569 | 602 | 277 | 324 | 338 |
| Seven other departments | 1,074 | 1,297 | 1,498 | 277 | 395 | 458 |
| Totals | 10,945 | 12,627 | 13,935 | 1,412 | 1,737 | 1,910 |
| Buildings (government) | 916 | 1,102 | 1,180 | ... | ... | ... |
| Totals, government | 11,861 | 13,729 | 15,115 | 1,412 | 1,737 | 1,910 |
| Universities | ... | ... | ... | ... | ... | ... |
| Research associations | ... | ... | ... | ... | ... | ... |
| Industry | ... | ... | ... | ... | ... | ... |
| Other organisations | ... | ... | ... | ... | ... | ... |
| Grand totals | ... | ... | ... | ... | ... | ... |
| Department or Agency | Net Expenditure on Science | Percentage of Total Net Government Expenditure on Science (Excluding Buildings) | ||||
|---|---|---|---|---|---|---|
| 1964–65 | 1965–66 | 1966–67 | 1964–65 | 1965–66 | 1966–67 | |
| $(000) | Percent | |||||
| Scientific and Industrial Research | 5,279 | 6,149 | 6,536 | 55.4 | 56.4 | 54.4 |
| Agriculture | 2,307 | 2,600 | 3,112 | 24.2 | 24.0 | 25.8 |
| Civil Aviation (Meteorological Service) | 293 | 340 | 381 | 3.1 | 3.1 | 3.2 |
| Forest Service | 651 | 654 | 692 | 6.8 | 6.0 | 5.8 |
| Health | 206 | 245 | 264 | 2.2 | 2.2 | 2.2 |
| Seven other departments | 797 | 902 | 1,040 | 8.3 | 8.3 | 3.6 |
| Totals | 9,533 | 10,890 | 12,025 | 100.0 | 100.0 | 100.0 |
| Buildings (government) | 916 | 1,102 | 1,180 | ... | ... | ... |
| Totals, government | 10,449 | 11,992 | 13,205 | ... | ... | ... |
| Universities | 1,480 | 1,600 | 1,780 | ... | ... | ... |
| Research associations | 900 | 1,134 | 1,440 | ... | ... | ... |
| Industry | 1,365 | 1,571 | 1,670 | ... | ... | ... |
| Other organisations | 762 | 790 | 846 | ... | ... | ... |
| Grand totals | 14,956 | 17,087 | 18,941 | ... | ... | ... |
| APPROXIMATE EXPENDITURE BY EACH INDUSTRY GROUP | ||||||
|---|---|---|---|---|---|---|
| (Excluding Buildings) | ||||||
| Type of Scientific Work | Estimated Expenditure (Excluding Buildings) | Percentage of Total | ||||
| 1964–65 | 1965–66 | 1966–67 | 1964–65 | 1965–66 | 1966–67 | |
| $(000) | Percent | |||||
| Agricultural production and processing | 5,708 | 6,472 | 7,484 | 40.7 | 40.5 | 42.1 |
| Forestry and forest products | 969 | 1,016 | 1,218 | 6.9 | 6.4 | 6.9 |
| Building research | 540 | 660 | 740 | 3.8 | 4.1 | 4.2 |
| Oceanography, limnology and fisheries | 792 | 840 | 982 | 5.6 | 5.3 | 5.5 |
| Geology and geophysics, including Antarctica and upper atmosphere | 1,020 | 1,084 | 1,172 | 7.3 | 6.8 | 6.6 |
| Scientific services (n.e.i.), including meteorology | 1,630 | 1,960 | 2,005 | 11.6 | 12.2 | 11.3 |
| Secondary industry | 2,093 | 2,573 | 2,680 | 14.9 | 16.1 | 15.1 |
| Medical research | 1,288 | 1,380 | 1,480 | 9.2 | 8.6 | 8.3 |
| Totals | 14,040 | 15,985 | 17,761 | 100.0 | 100.0 | 100.0 |
| GOVERNMENT RESEARCH EFFORT, 1926–1966 | |||||
|---|---|---|---|---|---|
| Year Ended 31 March | Gross Expenditure on Science | Percentage of Total Government Expenditure | Percentage of Gross National Product | Permanent Staff Employed | |
| Professional | Technical | ||||
*Second World War—satisfactory figures not available. †Estimated. | |||||
| $(000) | Percent | Percent | |||
| 1926 | 92 | 0.20 | 37 | – | |
| 1931 | 100 | 0.36 | 50 | – | |
| 1936 | 184 | 0.35 | 0.06 | 68 | 2 |
| 1941* | |||||
| 1946 | 1,062 | 0.85 | 0.13 | 227 | 60 |
| 1951 | 3,150 | 1.16 | 0.23 | 550 | 574 |
| 1956 | 4,652 | 1.20 | 0.24 | 573 | 550 |
| 1961 | 7,864 | 1.38 | 0.30 | 668 | 756 |
| 1966 | 13,728 | 1.82 | 0.36 | 820† | 1,010† |
The National Research Advisory Council realising that trained manpower can be a problem in any expansion of research activities is conducting a number of inquiries into the availability of trained professional and technical staff.
Assessment of Priorities—Government-financed research is an investment by the taxpayer from which he expects to receive worth-while dividends. The dividends can come in the form of measurable economic returns or in such desirable intangibles as better health, increased leisure, or higher standards of public safety.
We can think of government-financed research as having two major functions; first, the solution of problems affecting or likely to affect a specific industry or group of industries such as agriculture, and, secondly, the study of our natural resources and environment such as soils, minerals, water, climate, and so on. The second group is not directed to any specific objective; its major value and use being the provision of background information for the first.
The assessment of priorities is not easy, and the best one can do is to provide answers by rule of the thumb.
The National Research Advisory Council has stated that the amount of the research investment for an industry should be conditioned by:
The annual value of production of the industry. This criterion, however, has to be used in light of the probability of expansion of the industry should certain problems be solved by research, or, conversely, whether the industry is likely to contract or even disappear unless research is maintained:
The national importance of the industry. The national importance of an industry can be judged by—
Value of production:
Value of overseas earnings:
Value of import savings and the extent to which it utilises our own natural resources:
Defence or strategic needs:
The extent to which it might assist certain types of regional problems as, for example, that of the West Coast:
The number and significance of the problems affecting the industry. Some, but not all problems can be solved by reference to overseas research. Such research can be used when available, but some problems are unique to this country or not so important to other countries that they would devote the effort necessary to obtain a practical solution:
An assessment of the chances of a solution being found to the selected problems, taking into account—
The amount of existing scientific information necessary for a solution and the purely scientific difficulty of obtaining any necessary additional information:
The calibre of the staff available in the specific field of research or development, together with the possibility of recruiting or training the staff required if the problems are long-term ones:
The availability of suitable facilities (buildings, equipment, etc.) or of the resources to obtain them:
The application of the research results bearing in mind, amongst other things—
The problem of implementing the results because of either difficulties of liaison and information services or the amount of investment in new equipment or methods to ensure the profitable use of the results:
The time lag in the application of research results. One may be satisfied with small gains if there is rapid application; but the longer the delay in application, the greater the return must be if the research investment is to be worth while.
Basic Research—The achievement of the economic ends implied by these criteria will require a considerable amount of basic research, the economic relevance of which might not be at once readily obvious. For example, the study of fossils is sometimes regarded as a scientific hobby devoid of hard economic significance; but without such a study the task of oil prospecting would be even more difficult than at present, because the existence of certain types of fossils has proved to be an important indicator of oil-yielding geological strata.
Furthermore, there is little use in assessing priorities unless there is sufficient basic scientific information available to give an increased scientific effort a chance of achieving the economic or social aims for which it was undertaken and unless the research programme is administered in such a way as to offer our best scientists a congenial career. The motives which lead people to support research are not necessarily those which lead men and women to make research their life work.
New Zealand scientists do, of course, make the maximum use of basic research results obtained in other countries. But this in itself should not satisfy us, for if science is to develop and New Zealand is to continue to take advantage of overseas developments, it is only right that we in our turn should put something back into the pool.
Expansion of Research—The National Research Advisory Council in its 1965 and 1966 Annual Reports recommended an increased research effort in areas of economic importance. In the first report the recommendations were mainly concerned with agriculture, forestry, and mineral resources, with a continued expansion over a period of years. The second report considered a number of other fields including transport, building and manufacturing industry. This recommended programme was also spread over a number of years. The estimated annual cost of the recommended increase was $803,000 for each year of the programme proposed in the first report and $320,000 for each year of the programme proposed in the second report. The government implemented the first year's programme as recommended in the first annual report, but because of economic conditions deferred a decision on the other recommendations.
In 1966 following a report by Sir Harold Himsworth, the Medical Research Council asked for a considerably increased grant from government for the 1967–69 triennium. The government accepted the recommendation of the Council and the total grant for the period will be about $1,743,000, an increase of some $822,000 over the total for the previous triennium.
Bibliography—Further information on New Zealand scientific research may be obtained from:
New Zealand Department of Scientific and Industrial Research: Annual Reports, Parliamentary Paper, H.34.
New Zealand Medical Research Council: Annual Reports, Parliamentary Paper, H.31B.
New Zealand National Research Advisory Council: Annual Reports, Parliamentary Paper, H.41.
New Zealand Department of Scientific and Industrial Research, Information Service: D.S.I.R. Handbook, Wn, 1966.
New Zealand National Research Advisory Council; Some Aspects of Technical Manpower in New Zealand, N.R.A.C. Publication 2, Department of Scientific and Industrial Research, Wn, 1967.
Callaghan F. R. ed.: Science in New Zealand, Wn, Reed 1957.
Jansen, H. ed.: Directory of New Zealand Science, 4th Ed., 1962, Wn., New Zealand Association of Scientists.
McBride, C. P.: Scientific Research in New Zealand, Expenditure and Manpower 1953–62. Wn. Department of Scientific and Industrial Research, 1964.
McBride, C. P. and de Joux, Christine: Scientific Research in New Zealand, Government Expenditure and Manpower, 1926–66. National Research Advisory Council Publication 1, Department of Scientific and Industrial Research, Wn., 1966.
This page shows the designs and specifications of the coin series introduced on 10 July 1967, when New Zealand changed to a dollar – cent ($ c) system, based upon a major unit of one dollar (equivalent in value to 10 shillings of the previous currency) and made up of 100 cents. The currency replaced was based upon the pounds, shillings, and pence (£ s. d.) system (two halfpence to one penny; 12 pence to one shilling; and 20 shillings to one pound).
New Zealand first issued its own silver coins in 1933, after using British coins for many years. New Zealand bronze coins were first issued in 1940. The new decimal coins were struck at the Royal Mint, London, which has minted all New Zealand's coins.
A commemorative dollar was issued in 1967 only. It was designed by William Gardner, of London, and bears the New Zealand Shield of Arms, surrounded by fern fronds and surmounted by a Royal Crown.
Decimal coins are issued under the authority of section 10 of the Decimal Currency Act 1964.
 | FIFTY CENTS—Captain Cook's bark Endeavour sailing South, with a representation of Mt. Egmont in the distance. (Cupro-nickel; diameter, 1.250 in.; weight, 210 grains; partly milled and partly plain edge.) |
 | TWENTY CENTS—A kiwi facing right, with a fern bush in the background. (Cupro-nickel; diameter, 1.125 in.; weight, 174.54 grains; milled edge.) |
 | TEN CENTS—A Maori carved head or koruru, with Maori rafter patterns. (Cupro-nickel; diameter, 0.930 in.; weight, 87.27 grains; milled edge.) |
 | FIVE CENTS—A tuatara curled on a coastal rock. (Cupro-nickel; diameter, 0.765 in.; weight, 43.63 grains; milled edge.) |
 | TWO CENTS—Two golden kowhai flowers and leaves. (Bronze; diameter, 0.830 in.; weight, 64.00 grains; plain edge.) |
 | ONE CENT—A stylised fern leaf. (Bronze; diameter, 0.690 in.; weight, 32.00 grains; plain edge.) |
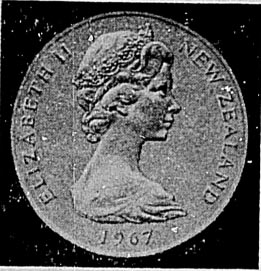 | NEW EFFIGY—The new effigy of Her Majesty being used on the obverse of the new coin series shows the Queen in profile wearing a diamond tiara of festoons, scrolls, and collet-spikes given as a wedding present by Queen Mary. Only the words "Elizabeth II'' and "New Zealand'' are shown on the obverse with the effigy and the date – this latter being a change from New Zealand practice, to give prominence to the numerical value on the reverse. |
Composition of Coins—Bronze: 97 percent copper, 2.5 percent zinc, 0.5 percent tin. Cupronickel: 75 percent copper, 25 percent nickel.
Reverses designed by James Berry of Wellington, New Zealand.
Obverse designed by Arnold Machin, London, England.
Table of Contents
Later statistical information has become available during the course of printing the Yearbook. Some of these statistics are entered in the Statistical Summary (pages 1051 to 1075). Other information is given in the following pages with references to appropriate sections of the Yearbook. Readers are referred to the Monthly Abstract of Statistics for the most recent information on many statistical series.
Population Estimates (p. 60)—The following population figures exclude members of New Zealand armed forces who were overseas.
| Year | Total Population at End of Year | Increase During Year | Mean Population for Year | |||
|---|---|---|---|---|---|---|
| Males | Females | Total | Numerical | Percent | ||
| Years Ended 31 March | ||||||
| 1962 | 1,244,389 | 1,230,199 | 2,474,588 | 60,292 | 2.5 | 2,441,400 |
| 1963 | 1,269,701 | 1,258,167 | 2,527,868 | 53,280 | 2.2 | 2,498,357 |
| 1964 | 1,296,773 | 1,285,634 | 2,582,407 | 54,539 | 2.2 | 2,550,114 |
| 1965 | 1,318,573 | 1,310,327 | 2,628,900 | 46,493 | 1.8 | 2,601,219 |
| 1966 | 1,343,803 | 1,333,006 | 2,676,809 | 47,909 | 1.8 | 2,647,199 |
| 1967 | 1,368,767 | 1,358,381 | 2,727,148 | 50,339 | 1.9 | 2,695,310 |
| Years Ended 31 December | ||||||
| 1961 | 1,237,908 | 1,223,335 | 2,461,243 | 57,676 | 2.4 | 2,426,654 |
| 1962 | 1,264,085 | 1,251,750 | 2,515,835 | 54,592 | 2.2 | 2,484,873 |
| 1963 | 1,288,350 | 1,278,565 | 2,566,915 | 51,080 | 2.0 | 2,536,912 |
| 1964 | 1,312,996 | 1,303,974 | 2,616,970 | 50,055 | 2.0 | 2,589,150 |
| 1965 | 1,336,731 | 1,327,112 | 2,663,843 | 46,873 | 1.8 | 2,635,352 |
| 1966 | 1,360,966 | 1,351,284 | 2,712,250 | 48,407 | 1.8 | 2,682,968 |
The figures given in the preceding table are for total population inclusive of Maoris. The following table shows the Maori population.
| Year | Maori Population at End of Year | Increase During Year | Mean Population for Year | |||
|---|---|---|---|---|---|---|
| Males | Females | Total | Numerical | Percent | ||
| Years Ended 31 March | ||||||
| 1961 | 83,444 | 80,735 | 164,179 | 5,824 | 3.7 | 161,226 |
| 1962 | 88,231 | 85,355 | 173,586 | 9,407 | 5.7 | 169,833 |
| 1963 | 91,769 | 88,866 | 180,635 | 7,049 | 4.1 | 177,029 |
| 1964 | 92,258 | 92,356 | 187,614 | 6,979 | 3.9 | 184,065 |
| 1965 | 98,779 | 95,822 | 194,601 | 6,987 | 3.7 | 191,045 |
| 1966 | 102,187 | 99,149 | 201,336 | 6,735 | 3.5 | 197,905 |
| 1967 | 105,434 | 102,318 | 207,752 | 6,416 | 3.2 | 204,409 |
| Years Ended 31 December | ||||||
| 1961 | 87,357 | 84,487 | 171,844 | 9,169 | 5.6 | 167,511 |
| 1962 | 90,784 | 87,831 | 178,615 | 6,771 | 3.9 | 175,302 |
| 1963 | 94,371 | 91,431 | 185,802 | 7,187 | 4.0 | 182,294 |
| 1964 | 97,901 | 94,904 | 192,805 | 7,003 | 3.8 | 189,296 |
| 1965 | 101,326 | 98,248 | 199,574 | 6,769 | 3.5 | 196,217 |
| 1966 | 104,631 | 101,422 | 206,053 | 6,479 | 3.2 | 202,798 |
The above figures do not include the population of the Cook Islands, 19,521 (at 1 September 1966); Niue Island, 5,191 (at 31 December 1966); and Tokelau Islands, 1,900 (at 24 September 1966).
Migration (pp. 72–74)—Total arrivals and departures are classified in the following table.
| Category | Year Ended 31 March | |
|---|---|---|
| 1966 | 1967 | |
| Arrivals | ||
| Immigrants intending permanent residence | 35,299 | 38,999 |
| New Zealand residents returning | 86,624 | 98,564 |
| Temporary visitors | 98,016 | 112,843 |
| Totals | 219,939 | 250,406 |
| Crews | 120,127 | 131,420 |
| Through passengers and tourists on cruising liners | 55,265 | 72,561 |
| Grand totals, all arrivals | 395,331 | 454,337 |
| Departures | ||
| New Zealand residents departing— | ||
| Permanently | 18,589 | 21,128 |
| Temporarily | 88,145 | 99,890 |
| Temporary visitors departing | 101,184 | 114,953 |
| Totals | 207,918 | 235,971 |
| Crews | 119,198 | 131,851 |
| Through passengers and tourists on cruising liners | 55,265 | 72,561 |
| Grand totals, all departures | 382,381 | 440,383 |
There were 4,097 assisted immigrants included in the 38,999 arrivals in 1966–67; the 1965–66 figure was 4,047.
Railway Transport (pp. 313–324)—Summarised statistics of railway transport for the year ended 31 March 1967 are compared with previous years.
| Item | Unit | Year Ended 31 March | ||
|---|---|---|---|---|
| 1965 | 1966 | 1967 | ||
| *Including road motor, rail-road ferry, and other subsidiary services. | ||||
| Passenger journeys— | ||||
| Railways | (000) | 25,137 | 23,889 | 23,723 |
| Railway road motor services | (000) | 22,955 | 22,297 | 22,398 |
| Livestock tonnage | tons (000) | 484 | 374 | 329 |
| Goods tonnage | tons (000) | 11,488 | 11,513 | 11,205 |
| Revenue— | ||||
| Railway operation | $(000) | 72,786 | 74,752 | 75,028 |
| Total* | $(000) | 85,318 | 87,552 | 88,756 |
| Expenditure— | ||||
| Railway operation | $(000) | 71,932 | 73,228 | 75,151 |
| Total* | $(000) | 82,948 | 84,184 | 87,878 |
Road Transport (p. 331)—Statistics of motor vehicles licensed at 31 March 1967 are compared with those for 31 March 1966.
| Class | As at 31 March | |
|---|---|---|
| 1966 | 1967 | |
| Cars | 734,112 | 790,997 |
| Trucks | 163,399 | 163,042 |
| Contract vehicles | 1,659 | 1,403 |
| Omnibuses and service cars | 3,236 | 3,210 |
| Vehicles exempted from payment of licence fees | 87,508 | 76,958 |
| Motor cycles | 31,835 | 31,438 |
| Power cycles | 17,971 | 18,291 |
| Totals | 1,039,720 | 1,085,339 |
| Trailers | 180,616 | 189,735 |
| Grand totals | 1,220,336 | 1,275,074 |
Registrations of new vehicles and those vehicles previously registered only in another country during the year ended 31 March 1967. Cars, 62,982; motor cycles (including power cycles), 4,827; commercial vehicles, 17,791; trailers, 24,942; total, 110,542.
Wool (p. 576)—Weight, sale value, and average value per pound of greasy wool sold at auction in New Zealand in the last two seasons are shown below.
| Season | Weight of Greasy Wool Sold | Sale Value | Value per Pound | Average Minimum Floor Price per Found of Greasy Wool | Index Numbers* Base: 1963–64 (=1000) |
|---|---|---|---|---|---|
| *Based on price on floor, clean. | |||||
| lb (000) | $(m) | c | c | ||
| 1964–65 | 443,169 | 155.6 | 35.12 | 29.17 | 780 |
| 1965–66 | 509,161 | 176.6 | 34.69 | 29.17 | 775 |
| 1966–67 | 533,789 | 156.9 | 29.39 | 30.00 | 683 |
The floor price was set at 25c per pound for the 1967–68 season.
Retail Trade—Values of quartely sales or turnover for all retail stores, corrected for seasonal fluctuations and for price and population changes, are shown in the following table for the latest quarters.
| QUARTERLY SALES OR TURNOVER—ALL STORE TYPES | ||||||||
|---|---|---|---|---|---|---|---|---|
| Quarter Ended | In Current $s | In Constant 1957–58 $s | In Current $s | In Constant 1957–58 $s | ||||
| As Recorded | Seasonally Corrected | Before Seasonal Correction | Seasonally Corrected | As Recorded | Seasonally Corrected | Before Seasonal Correction | Seasonally Corrected | |
| total turnover $(m) | total turnover $(m) | turnover per head of population $ | turnover per head of population $ | |||||
| 1966–Dec | 430.2 | 389.6 | 361.8 | 327.6 | 159.2 | 144.2 | 134.0 | 121.4 |
| 1967–Mar | 370.3 | 391.8 | 304.2 | 321.8 | 136.6 | 144.4 | 112.2 | 118.6 |
| June | 383.0 | 390.9 | 308.0 | 314.3 | 140.5 | 143.4 | 113.0 | 115.3 |
Hire Purchase Trade—The following statistics show trade for the latest quarter (compared with previous quarters) by surveyed businesses covering about 58 percent of total hire purchase business.
| GOODS SOLD ON HIRE PURCHASE | ||||||
|---|---|---|---|---|---|---|
| Quarter Ended | Value of Goods Sold on Hire Purchase | Total Amount Owing Under H.P. Agreements* | ||||
| Motor Vehicles | Plant and Machinery | Television Sets | Other Household and Personal Goods | Total | ||
| *As at end of quarter. | ||||||
| $(000) | $(m) | |||||
| 1966— | ||||||
| December | 16,476 | 5,552 | 728 | 8,092 | 30,848 | 64.3 |
| 1967— | ||||||
| March | 13,726 | 3,686 | 646 | 5,048 | 23,106 | 61.0 |
Summary of Stocks—The following table gives a summary of stocks held by manufacturers, wholesale traders, and retail traders.
| Stocks | As at 31 March | ||
|---|---|---|---|
| 1965 | 1966 | 1967 | |
| $(million) | |||
| Manufacturers— | |||
| Materials | 202.7 | 232.9 | 249.5 |
| Finished goods | 87.5 | 94.6 | 109.3 |
| Wholesale | 190.3 | 226.4 | 235.1 |
| Retail | 240.1 | 260.4 | 272.7 |
| Totals | 720.6 | 814.3 | 866.6 |
Statistics of external trade in the June year 1967, are given below.
Total Commodity Trade—Following are statistics of exports and imports.
| Year Ended June | Exports | Imports (c.d.v.)* | Excess of Exports Over Imports | |
|---|---|---|---|---|
| New Zealand Produce | Total Exports | |||
| *The corresponding c.i.f. values were $724.5 million in 1964–65, $793.2 million in 1965–66, and $783.2 million in 1966–67. | ||||
| $(million) | ||||
| 1965 | 733.7 | 742.2 | 662.7 | 79.5 |
| 1966 | 756.8 | 767.3 | 729.6 | 37.6 |
| 1967† | 716.0 | 725.5 | 721.5 | 4.0 |
Exports—An indication of the movement in the value of exports in the main groups of commodities is afforded by the following table.
| VALUE OF EXPORTS | ||||
|---|---|---|---|---|
| Year ended June | Dairy Products | Meat and Meat Preparations | Wool | Hides, Skins, and Pelts |
| $(million) | ||||
| 1965 | 180.9 | 212.5 | 208.6 | 31.7 |
| 1966 | 175.4 | 196.7 | 231.9 | 40.0 |
| 1967 | 186.5 | 204.7 | 173.9 | 33.4 |
Imports—The table following classifies imports by broad divisions.
| IMPORTS VALUED AT CURRENT DOMESTIC VALUE IN COUNTRY OF EXPORT | ||||||||
|---|---|---|---|---|---|---|---|---|
| Year Ended June | Food and Live Animals | Crude Materials, Inedible, Except Fuels | Mineral Fuels, Lubricants, etc. | Chemicals | Manufactured Goods | Machinery and Transport Equipment | Miscellaneous Manufactured Articles | Total* |
| *Including sections not listed. | ||||||||
| $(million) | ||||||||
| 1965 | 35.5 | 30.9 | 45.4 | 65.3 | 195.2 | 224.3 | 42.3 | 649.5 |
| 1966 | 37.1 | 35.0 | 40.1 | 80.2 | 216.3 | 263.5 | 46.8 | 729.6 |
| 1967 | 31.4 | 37.2 | 44.7 | 77.3 | 210.8 | 260.3 | 46.4 | 721.5 |
Retail Prices (pp. 683–696)—Details of the consumers' price index for later quarters are set out in the following table.
| CONSUMERS' PRICE INDEX | |||
|---|---|---|---|
| Base: Weighted average 25 centres, 1965 (=1000) | |||
| Group or Subgroup | Calendar Year 1965 | Quarter Ended 31 March 1967 | Quarter Ended 30 June 1967 |
| Food— | |||
| Fruits and vegetables | 1,000 | 1,108 | 1,130 |
| Meat and fish | 1,000 | 1,079 | 1,076 |
| Other foods | 1,000 | 1,052 | 1,099 |
| All foods | 1,000 | 1,071 | 1,098 |
| Housing— | |||
| Rent | 1,000 | 1,074 | 1,113 |
| Home ownership | 1,000 | 1,098 | 1,113 |
| All housing | 1,000 | 1,091 | 1,113 |
| Household operations— | |||
| Fuel and light | 1,000 | 1,043 | 1,066 |
| Home furnishing | 1,000 | 1,015 | 1,022 |
| Domestic supplies and services | 1,000 | 1,033 | 1,156 |
| All household operation | 1,000 | 1,027 | 1,067 |
| Apparel— | |||
| Clothing | 1,000 | 1,030 | 1,040 |
| Footwear | 1,000 | 1,061 | 1,065 |
| All apparel | 1,000 | 1,035 | 1,044 |
| Transportation— | |||
| Public transport | 1,000 | 1,065 | 1,078 |
| Private transport | 1,000 | 1,064 | 1,109 |
| All transportation | 1,000 | 1,064 | 1,101 |
| Miscellaneous— | |||
| Tobacco and alcohol | 1,000 | 1,023 | 1,105 |
| Other supplies | 1,000 | 1,081 | 1,087 |
| Other services | 1,000 | 1,092 | 1,120 |
| All miscellaneous | 1,000 | 1,060 | 1,103 |
| All groups | 1,000 | 1,062 | 1,091 |
Receipts of Consolidated Revenue Account and National Roads Fund—This table shows direct and indirect taxation.
(Source: Parliamentary paper B. 6, 1967)
| Item | Years Ended 31 March | |
|---|---|---|
| 1966 | 1967 | |
| $(thousand) | ||
| Direct taxation— | ||
| Income and social security taxes | 605,951 | 664,413 |
| Estate and gift duty | 23,031 | 23,064 |
| Land tax | 3,171 | 3,506 |
| Total—Direct taxation | 632,153 | 690,983 |
| Indirect taxation— | ||
| Customs duty | 88,875 | 92,012 |
| Beer duty | 32,828 | 34,735 |
| Sales tax | 76,633 | 78,926 |
| Racing duty | 11,510 | 12,029 |
| Other stamp duties | 9,844 | 9,577 |
| Highways taxation | 65,804 | 70,071 |
| Other taxation | 374 | 378 |
| Total—Indirect taxation | 285,868 | 297,728 |
| Total—Taxation receipts | 918,022 | 988,710 |
| Interest— | ||
| On capital liability— | ||
| Electric supply | 21,695 | 24,057 |
| Post Office | 9,275 | 10,823 |
| Other | 24,112 | 27,762 |
| On other public moneys | 4,260 | 3,679 |
| Total—Interest | 59,342 | 66,321 |
| Profits from trading undertakings | 11,626 | 12,312 |
| Departmental receipts | 51,990 | 54,710 |
| Total—Other | 122,958 | 133,342 |
| Total—Receipts | 1,040,980 | 1,122,052 |
Consolidated Revenue Account Expenditure—The following table shows expenditure from the Consolidated Revenue Account.
| Item | Years Ended 31 March | |
|---|---|---|
| 1966 | 1967 | |
| Permanent appropriations— | $(thousand) | |
| Under special Acts of Legislature— | ||
| Civil List | 592 | 586 |
| Debt services— | ||
| Interest | 94,506 | 105,958 |
| Transfer to Loans Redemption Account | 36,036 | 37,606 |
| Administration and management | 984 | 994 |
| Total—Debt services | 131,526 | 144,558 |
| Special Acts— | ||
| Government Superannuation Fund | 15,130 | 17,232 |
| Miscellaneous | 2,756 | 2,508 |
| Total—Special Acts | 17,886 | 19,740 |
| Total—Permanent appropriations | 150,004 | 164,885 |
| Annual appropriations— | ||
| Vote— | ||
| Legislative | 794 | 762 |
| Prime Minister's Office | 48 | 50 |
| External Affairs | 9,568 | 9,866 |
| Finance— | ||
| Audit | 624 | 659 |
| Customs | 2,108 | 2,280 |
| Inland Revenue | 5,606 | 5,923 |
| Stabilisation | 37,166 | 35,810 |
| Treasury | 4,620 | 3,004 |
| Total—Finance | 50,124 | 47,676 |
| General Administration— | ||
| Broadcasting | 10 | 18 |
| Government Printing Office | 5,786 | 6,873 |
| Internal Affairs | 5,998 | 6,507 |
| Island Territories | 3,412 | 3,747 |
| Labour | 4,678 | 4,900 |
| Maori Affairs | 2,950 | 3,089 |
| Marine | 2,994 | 3,335 |
| State Advances Corporation | 40 | 30 |
| State Services Commission | 632 | 687 |
| Statistics | 1,022 | 1,645 |
| Valuation | 1,288 | 1,398 |
| Total—General Administration | 28,810 | 32,230 |
| Law and Order— | ||
| Crown Law | 146 | 136 |
| Justice | 7,816 | 9,181 |
| Police | 9,690 | 11,078 |
| Total—Law and Order | 17,652 | 20,394 |
| Defence | 81,194 | 88,589 |
| Maintenance— | ||
| Public Works and Services | 35,666 | 36,793 |
| Roads, etc. | 2,046 | 1,938 |
| Total—Maintenance | 37,712 | 38,731 |
| Development of Primary and | ||
| Secondary Industries— | ||
| Agriculture | 17,830 | 20,284 |
| Civil Aviation and Meteorological Services | 9,290 | 9,062 |
| Forest Service | 5,620 | 6,276 |
| Industries and Commerce | 2,252 | 2,557 |
| Lands and Survey | 4,630 | 5,052 |
| Mines | 1,012 | 1,238 |
| Scientific and Industrial Research | 7,110 | 7,516 |
| Tourist and Publicity | 4,250 | 4,663 |
| Transport | 2,916 | 3,311 |
| Total—Development of Primary and Secondary Industries | 54,910 | 59,961 |
| Social Services— | ||
| Social Security Monetary Benefits— | ||
| Age | 51,456 | 55,102 |
| Invalids | 4,786 | 5,071 |
| Widows | 10,480 | 11,316 |
| Sickness | 4,076 | 4,559 |
| Family | 70,164 | 66,816 |
| Miners | 136 | 131 |
| Orphans | 116 | 122 |
| Unemployment | 142 | 141 |
| Universal superannuation | 62,578 | 70,193 |
| Education | 132,772 | 146,359 |
| Family benefit capitalisation | 8,596 | 7,576 |
| Health | 11,544 | 12,205 |
| Health benefits | 35,372 | 37,470 |
| Hospitals | 103,818 | 115,010 |
| Social security expenses and emergency benefits | 7,626 | 8,460 |
| War and other pensions | 30,454 | 30,919 |
| Total—Social services | 534,120 | 571,450 |
| Total Annual Appropriations | 814,932 | 869,708 |
| Unauthorised expenditure— | ||
| Services not provided for | 4 | 16 |
| Transfer to Loans Redemption Account | 2,000 | 16,000 |
| Transfer to National Development Loans Account | 4,000 | – |
| Total expenditure | 970,940 | 1,050,609 |
National Roads Fund Expenditure—
| Item | Years Ended 31 March | |
|---|---|---|
| 1966 | 1967 | |
| $(thousand) | ||
| Highways maintenance | 9,326 | 9,533 |
| Highways construction | 29,182 | 26,673 |
| Subsidies to local authorities | 26,887 | 28,426 |
| Administration and general | 4,488 | 5,922 |
| Unauthorised | 5 | 3 |
| Total expenditure | 69,888 | 70,557 |
Summary of Budget Proposals—The Financial Statement was presented on 22 June 1967. Principal changes from the existing situation are as follows.
The rebate of 10 percent of ordinary income tax will be continued for a further year.
Building programming will be abolished except for projects in the metropolitan areas of Auckland and Wellington.
The limits on loans from the State Advances Corporation for new houses will be increased from $5,000 to $5,300 for persons with up to two children rising by steps to $5,600 for persons with five or more children.
A series of Special Development Bonds will be issued for a six-year term; no interest will be payable, but the purchase price of the bonds will be allowed as a deduction from income in the year of purchase for tax purposes.
Overseas Exchange Transactions (p. 851)—The following statement gives statistics of overseas exchange transactions for the years ended 31 March 1966 and 1967.
| (Source: Reserve Bank) | ||
|---|---|---|
| Item | Years Ended 31 March | |
| 1966 | 1967 | |
| RECEIPTS— | ||
| Exports— | $(million) | |
| Butter | 107.8 | 117.6 |
| Cheese | 45.2 | 55.0 |
| Meat | 214 8 | 207 8 |
| Wool | 230.8 | 216.6 |
| Other | 175.6 | 199.0 |
| Total exports | 774.2 | 795.8 |
| Other current receipts | 84.4 | 92,2 |
| Total current receipts | 858.4 | 888.0 |
| Capital receipts— | ||
| (a) Government— | ||
| IMF drawing | 50 4 | – |
| Sales of investments | 50.8 | 57.0 |
| Borrowing | 55 8 | 79 6 |
| Loans to Reserve Bank | – | 45.6 |
| (b) Private | 22.6 | 24.0 |
| Total capital receipts | 179.6 | 206.2 |
| Total receipts | 1,038.0 | 1,094.2 |
| PAYMENTS— | ||
| Imports— | ||
| (a) Government | 72.6 | 74.2 |
| (b) Private | 669.8 | 648.2 |
| Total imports | 742.4 | 722.4 |
| Other current payments— | ||
| (a) Government | 45.6 | 56.0 |
| (b) Private | 188.0 | 216.2 |
| Total current payments | 976.0 | 994.6 |
| Capital payments— | ||
| (a) Government— | ||
| Investment | 46.2 | 51.8 |
| Debt repayment | 38.0 | 17.4 |
| (b) Private | 25.0 | 25.2 |
| Total capital payments | 109.2 | 94.4 |
| Total payments | 1,085.2 | 1,089.0 |
| Balance on trade transactions | +31.8 | +73.4 |
| Invisible balance | –149.2 | –180.0 |
| Balance on current account | −117.6 | −106.6 |
| Balance on capital account | +70.4 | +111.8 |
| Overall balance | −47.2 | +5.2 |
A survey of capital expenditure on farms during the year ended 31 March 1966 has been made and details according to farm type are given in the following table.
| Farm Type | Capital Expenditure | |||||
|---|---|---|---|---|---|---|
| Number of Holdings | Building Construction | Motor Vehicles and Trailers | Tractors and Farm Machinery | Improvements and Development | Total Expenditure | |
| *With first named type predominant. | ||||||
| $(000) | ||||||
| Principally dairy farming | 21,238 | 13,734 | 4,775 | 6,478 | 9,666 | 34,652 |
| Principally sheep farming | 19,130 | 12,525 | 4,629 | 7,017 | 19,457 | 43,628 |
| Principally beef farming | 1,270 | 450 | 178 | 188 | 611 | 1,427 |
| Dairy and sheep* | 1,446 | 978 | 347 | 479 | 1,000 | 2,804 |
| Dairy and beef* | 265 | 129 | 94 | 97 | 136 | 456 |
| Sheep and dairy* | 1,161 | 642 | 281 | 394 | 774 | 2,091 |
| Sheep and beef* | 7,003 | 7,045 | 2,359 | 2,630 | 15,990 | 28,024 |
| Beef and dairy* | 109 | 49 | 14 | 54 | 57 | 174 |
| Beef and sheep* | 736 | 582 | 158 | 202 | 1,156 | 2,098 |
| Mixed livestock | 255 | 188 | 54 | 100 | 280 | 622 |
| Sheep and cropping | 4,751 | 3,431 | 1,289 | 4,027 | 4,205 | 12,951 |
| Principally cropping | 1,277 | 599 | 236 | 700 | 468 | 2,003 |
| General mixed farming | 210 | 239 | 88 | 222 | 242 | 791 |
| Market farms and gardens | 505 | 240 | 133 | 228 | 108 | 709 |
| Other | 4,505 | 2,131 | 471 | 659 | 1,033 | 4,295 |
| Totals | 63,861 | 42,962 | 15,107 | 23,475 | 55,183 | 136,726 |
Radio Licences (p. 369)—The number of radio licences in force on 31 March 1967 was 659,249 compared with 644,123 at 31. March 1966.
Television Licences (p. 368)—At 31 May 1967 there were 539,792 television receiving licences in force, compared with 451,731 at 31 May 1966.
Horse Racing (pp. 772–773)—The number of racing days in the calendar year 1966 was 378. Totalisator turnover totalled $131,136,000 in 1966 ($126,042,000 in 1965) while Government taxation totalled $11,922,000 in 1966 ($11,544,000 in 1965).
Land Transfers (pp. 275–279)—The average amount per transaction (town and suburban properties) in 1966–67 was $6,600 as compared with $6,046 in 1964–65 and $6,398 in 1965–66.
| Item | Years Ended 31 March | ||
|---|---|---|---|
| 1965 | 1966 | 1967 | |
| Urban properties— | |||
| Number | 59,983 | 61,581 | 59,151 |
| Consideration $(000) | 362,671 | 393,964 | 393,968 |
| Rural properties— | |||
| Freehold— | |||
| Number | 8,642 | 9,281 | 8,914 |
| Area acres (000) | 1,589 | 1,560 | 1,592 |
| Consideration $(000) | 156,560 | 185,253 | 184,007 |
| Total freehold and leasehold— | |||
| Number | 9,565 | 9,927 | 9,488 |
| Consideration $(000) | 173,502 | 198,632 | 195,244 |
| All properties: Total consideration $(000) | 536,173 | 592,596 | 589,211 |
Mortgages (pp. 857–864)—Particulars of gross totals of mortgages registered and discharged during the last three financial years are shown below.
| Year Ended 31 March | Registered* | Discharged* | ||
|---|---|---|---|---|
| Number | Amount | Number | Amount | |
| *Inclusive of duplicate registrations and discharges. | ||||
| $(000) | $(000) | |||
| 1965 | 71,531 | 420,001 | 56,262 | 206,805 |
| 1966 | 76,971 | 487,950 | 59,479 | 230,060 |
| 1967 | 75,303 | 493,438 | 55,958 | 239,315 |
[Obtainable from the Government Printer, Mulgrave Street (Private Bag), Wellington; corner of Rutland and Lorne Streets (P.O. Box 5344) Auckland; 130 Oxford Terrace (P.O. Box 1721), Christchurch; corner of Water and Bond Streets (P.O. Box 1104), Dunedin; and Alma Street (P.O. Box 857), Hamilton.]
| Title | Latest No. | Date of Issue | Price per Copy (Post Free) |
|---|---|---|---|
| *$5.00 a year post free. | |||
| $ | |||
| Annual Report of the Government Statistician (H. 39) | 1,967 | June 1967 | 0.10 |
| New Zealand Official Yearbook | 1,967 | November 1967 | 2.00 |
| Pocket Digest of New Zealand Statistics | 1,967 | June 1967 | 0.50 |
| Catalogue of New Zealand Statistics | .. | August 1966 | 1.00 |
| Statistical Publications, 1840–1960 | .. | April 1961 | 0.95 |
| Annual Statistical Reports: | |||
| Balance of Payments | 1965–66 | January 1967 | 0.45 |
| Farm Production | 1964–65 | February 1967 | 0.95 |
| Incomes and Income Tax, 1960–61 and 1961–62 | 1960–62 | March 1966 | 1.15 |
| Industrial Accidents | 1,965 | May 1967 | 0.65 |
| Industrial Production | 1964–65 | March 1967 | 3.00 |
| Insurance | 1965–66 | April 1967 | 0.45 |
| Justice | 1,965 | May 1967 | 0.95 |
| Local Authority Statistics | 1965–66 | July 1967 | 1.45 |
| National Income and Expenditure | 1965–66 | December 1966 | 0.45 |
| Special Supplement: The Accounts of the Government Sector | 1965–66 | April 1967 | 0.55 |
| Population, Migration, and Building | 1965–66 | November 1966 | 0.75 |
| Prices, Wages, and Labour | 1,965 | October 1966 | 0.95 |
| Transport | 1,966 | August 1967 | 0.75 |
| Vital Statistics | 1,965 | November 1966 | 0.65 |
| Trade Publications: | |||
| Exports | 1965–65 | December 1966 | 3.00 |
| External Trade, Country Analyses | Jul 66–Mar 67 | August 1967 | 0.50 |
| External Trade, Report on, and Analysis of | 1964–65 | May 1967 | 1.95 |
| Imports (pt. A) Commodity by Country | 1964–65 | March 1967 | 3.00 |
| Imports (pt. B) Country by Commodity | 1964–65 | March 1967 | 3.00 |
| Inter-Industry Study of the New Zealand Economy: | |||
| Part 1. Transactions between 110 Productive | |||
| Industries at Producers' Prices | 1959–60 | September 1966 | 0.45 |
| Part 2. Derived Tables from Transactions of 110 Industries | 1959–60 | December 1966 | 0.45 |
| Part 3. Transactions Between 44 Productive Industries and Derived Tables | 1959–60 | March 1967 | 0.45 |
| Agricultural and Pastoral Statistics of New Zealand, 1861–1954 | .. | July 1956 | 0.20 |
| Census of Building and Construction | 1963–64 | August 1966 | 0.45 |
| Census of Distribution | 1,963 | February 1965 | 0.85 |
| Census of Libraries | 1,964 | July 1965 | 0.65 |
| Census of Agriculture | 1959–60 | February 1964 | 0.65 |
| $ | |||
| Population Census: | |||
| Vol. 1. Increase and Location of Population | 1,961 | February 1963 | 1.35 |
| Vol. 2. Ages and Marital Status | 1,961 | February 1964 | 1.25 |
| Vol. 3. Religious Professions | 1,961 | April 1964 | 0.45 |
| Vol. 4. Industries and Occupations | 1,961 | July 1965 | 1.55 |
| Vol. 5. Incomes | 1,961 | February 1965 | 0.65 |
| Vol. 6. Birthplaces and Duration of Residence of Overseas-born | 1,961 | August 1964 | 0.45 |
| Vol. 7. Race | 1,961 | March 1964 | 0.55 |
| Vol. 8. Maori Population and Dwellings | 1,961 | May 1965 | 1.15 |
| Vol. 9. Dwellings and Households | 1,961 | December 1964 | 1.55 |
| Vol. 10. General Report (Including Details of War Service, Dependent Children, and Usual Place of Residence) | 1,961 | December 1965 | 1.55 |
| Appendix A. Census of Poultry | 1,916 | June 1963 | 0.45 |
| Appendix B. New Zealand Life Tables, 1960–62 | 1,961 | December 1965 | 0.45 |
| 1966 Census of Population and Dwellings Statistical Area Supplements: | |||
| No. 1. Northland | .. | April 1967 | 0.10 |
| No. 2. Central Auckland | .. | July 1967 | 0.10 |
| No. 3. South Auckland—Bay of Plenty | .. | September 1967 | 0.10 |
| Provisional Report on Population and Dwellings | 1,966 | November 1966 | 0.45 |
| Monthly Abstract of Statistics | .. | .. | 0.50* |
| Special Supplements: | |||
| Compound Interest, Annuity-certain and Life Annuity Tables | .. | August 1963 | 0.75 |
| Consumers' Price Index, 1965 Revision | .. | September 1966 | 0.55 |
| External Trade, Country Analyses | Jul-Mar | August 1967 | 0.50 |
| Life Annuity Tables, 1960–62 Mortality Experience | .. | June 1966 | 0.10 |
| Population and Labour Force Projections | 1965–1990 | February 1966 | 0.85 |
| Supplements: | |||
| Accounts of the Government Sector | 1965–66 | December 1966 | 0.05 |
| Balance of Payments | 1965–66 | September 1966 | 0.05 |
| Census, 1961: Summary Results | 1,961 | August 1963 | 0.05 |
| Census of Mining and Quarrying, 1963–64 | .. | December 1965 | 0.05 |
| Company Shares: Dividend Yields on Market Prices | .. | June 1963 | 0.05 |
| External Trade | Jul 66–Jun 67 | July 1967 | 0.10 |
| Export Prices and Terms of Trade | .. | July 1961 | 0.05 |
| Ex-Nuptial Births | .. | January 1967 | 0.05 |
| Factory Production, General Summary | 1964–65 | July 1966 | 0.05 |
| Gross Domestic Product in Constant Prices | .. | July 1966 | 0.05 |
| Import Prices and Volume Index Numbers | .. | June 1961 | 0.05 |
| Incomes and Dwellings of Maoris, 1961 | .. | March 1964 | 0.05 |
| Income Trends | 1965–66 | April 1967 | 0.05 |
| Industrial Classification of Salary and Wage Payments | 1964–65 | May 1966 | 0.05 |
| Inter-Industry Study—Gross Capital Formation | 1959–60 | May 1966 | 0.05 |
| Inter-Industry Study—Net Domestic Output | 1959–60 | April 1966 | 0.05 |
| Land Transfers | 1966–67 | July 1967 | 0.05 |
| Livestock Estimates | 1,967 | June 1967 | 0.05 |
| Livestock Numbers and Other Farm Statistics | 1,966 | April 1967 | 0.05 |
| Manufacturers' Stocks | Mar Quarter | May 1967 | 0.05 |
| Mortgages | 1966–67 | July 1967 | 0.05 |
| Moving-Annual Index of Production to June 1966 | .. | Oct-Nov 1966 | 0.05 |
| National Income and Expenditure | 1965–66 | August 1966 | 0.05 |
| Population at 1 April 1967 | .. | September 1967 | 0.05 |
| Prices and Wage Index Numbers, 1913–1957 | .. | April 1958 | 0.05 |
| Productivity and Volume of Production Indexes | .. | July 1966 | 0.05 |
| Projection of Net Family Formation | .. | September 1965 | 0.05 |
| Projections of Permanent Private Dwellings up to 1977 | .. | Oct-Nov 1966 | 0.05 |
| Projection of the Industrial Distribution of the Labour Force, 1962–72 | .. | March 1963 | 0.05 |
| Remarriage and Length of Widowhood, 1955–57 | .. | May 1961 | 0.05 |
| Retail Trade | Mar Quarter | May 1967 | 0.05 |
| Seasonal Correction of Statistics | .. | April 1964 | 0.05 |
| Share Prices Index; 1960 Revision | .. | March 1961 | 0.05 |
| Study of Population Age Structures | .. | January 1964 | 0.05 |
| Survey of Commercial Gardeners' Incomes | 1963–64 | March 1965 | 0.05 |
| Survey of Dairy Farmers' Incomes | 1963–64 | July 1967 | 0.05 |
| Survey of Sheep Farmers' Incomes | 1962–63 | January 1966 | 0.05 |
| Survey of Town Milk Producers' Incomes | 1962–63 | October 1965 | 0.05 |
| Wholesale Prices Index | .. | October 1959 | 0.05 |
| Wholesale Trade | Mar Quarter | May 1967 | 0.05 |
| Wool Price Index Revision | .. | December 1964 | 0.05 |
NOTE-Where more than one reference to a subject is given, the chief reference, wherever it has been possible to determine it, is indicated by bold type. Two or more references to a subject so indicated signify major, and approximately equal, importance.
A
- Abortion, 116, 156, 157
- Accident insurance, 887-891, 900, 901, 1074
- Accidents—
- aircraft, 118, 158
- cases treated in hospitals, 157, 158-159
- causes of, 336-337, 979, 982
- deaths from, 103, 104, 117-119, 337, 975, 978, 979, 981, 983
- drowning, 117
- farming, 118-119, 982-983
- frequency and severity rates, 975-976
- industrial, 117-118, 971-982
- in home, 117-119, 159
- mining, 462, 464, 977, 978
- motor-vehicle, 103, 104, 117-118
- railway, 118, 158, 323
- time lost through, 975, 977, 981
- transport, 103, 104, 117-118, 158, 336-337
- Acclimatisation of fish, 5, 457
- Accommodation licences, 1015
- Accounts—
- Government sector, 730-731
- inter-industry study, 746
- public, 747-754
- Acreage and yield of crops, 413-427, 1057
- Acreage of holdings, 271-272
- Acts
- Legislation
- Added value in manufacturing, 476-477, 498-501, 1065
- Administrative tribunals, 1036-1040
- Adolescent dental service, 137
- Adoptions, 94, 177, 237
- Adult education, 233
- Adultery, 125
- Advances—
- bank, 825, 827, 829, 830-831, 1070
- bank, control policy, 831
- bank, reserve ratio, 831
- building societies, 871-872, 873, 874-875
- rural, 279-280, 865-871
- Advertisements, medical, 133
- Advertising, radio, television, and press, 362-366, 370
- Aerated water and cordial industry, 480, 515
- Aerial—
- land survey, 295
- work operations, 282, 343, 349
- Aero clubs, 352
- Aerodromes, 343
- Afforestation, 433-440
- Age benefits, 169, 173-175
- Age distribution of population, 83-84
- Agricultural—
- aviation, 282, 343, 349
- imports of, 669, 673
- consumed locally, 397, 400-401, 708-710
- exported, 636, 638, 656-657
- colleges, 226, 228-229
- imports of, 669, 673
- consumed locally, 397, 400-401, 708-710
- exported, 636, 638, 656-657
- gross farming income, 394-396
- imports of, 669, 673
- consumed locally, 397, 400-401, 708-710
- exported, 636, 638, 656-657
- machinery, 412, 483-508, 527, 669, 672
- imports of, 669, 673
- consumed locally, 397, 400-401, 708-710
- exported, 636, 638, 656-657
- produce,
- consumed locally, 397, 400-401, 708-710
- exported, 636, 638, 656-657
- production, 394-404, 411-418, 1057-1058
- research, 405-409, 1119
- Workers Act, 906
- Agriculture, 387-432, 1057
- Department of, 404-406
- occupational safety, 982-983
- publications on, 1105-1107
- Aid—
- commonwealth schemes, 40-41
- distribution of New Zealand, 41-43
- Air—
- Force, Royal New Zealand, 264-266, 348-349
- mails, 346, 348, 351, 355
- navigation services, 345
- accidents, 118, 158
- licensing and control, 343, 344, 353
- safety of, 986
- types on domestic services, 347, 1004
- types on international services, 349-350
- Air New Zealand, 343-344, 349-351, 777, 1043
- air pollution, 132
- Airport statistics, 352
- Aitutaki Island, 2
- Alcoholic liquors—
- consumption of, 710
- duty on, 677, 748, 749, 755, 757
- exports of, 636, 638
- imports of, 661, 662, 667, 671
- sale of, 1014-1016
- Alexander Turnbull Library, 370-371, 1093
- Aliens, naturalisation and registration of, 77-79
- Ambulance, St. John, 143
- Amortisation of debt, 783
- Amputees, 197-203
- Amusement tax, 376-377, 755, 772
- Angling, 457, 1005
- Animal life, publications on, 1103-1104
- Animals, noxious, 440
- Anniversary Days, 1024
- Annual Holidays Act, 905
- Annual value system of rating, 785-786
- Annuities, 197-203
- Antarctic, N.Z. activities in the, 997-999, 1081
- Antarctica, publications on, 1117
- Ante-natal services, 149
- Antimony, ore, 465
- Antipodes Islands, 1, 988
- Anzac Day Act, 905
- ANZUS Treaty, 30, 31, 39, 260
- Apiaries or apiculture, 432
- Apples, 413-415, 424-425
- consumption of, 425, 709
- exported, 425, 636, 638, 656, 1062
- marketing of, 573-574
- Apprentices, 941-942, 971
- Maori, 943-944
- Arable farming, 387-396, 405, 413-427, 1057
- Aramoana, G.M.V., 315, 348
- Aranui, G.M.V., 315
- Arbitration Court, 50, 239, 380, 903-905, 910-911, 953, 959, 1041, 1079
- Architecture, publications on, 1108
- Ares—
- of crops, 415-421, 1057
- land holdings, 271-273
- New Zealand, 1-2, 71, 271
- reserves and national parks, 290-291
- statistical areas, 71
- Armed Forces—
- honours and awards conferred, 1047, 1048
- at census dates, 60
- in war, 268-270
- in war, 268-270, 1078, 1079
- at census dates, 60
- in war, 268-270
- overseas at census dates, 60
- at census dates, 60
- in war, 268-270
- pay and allowances, 717, 718, 722-726
- at census dates, 60
- in war, 268-270
- serving overseas, 260, 266-268
- at census dates, 60
- in war, 268-270
- strengths of, 259, 261, 264, 266
- in war, 268-270
- superannuation, 198
- Army, 262-264, 267-270
- Arrivals
- Migration
- Arson and incendiarism, 897
- Art galleries, 1087-1089
- Articles on special subjects in previous issues, 1084-1085
- Artificial aids, (under Social Security), 170, 185, 187
- Arts—
- Advisory Council, 1086-1087
- in New Zealand, 1086-1092
- publications on the, 1108
- Asbestos, 466
- Asian Development Bank, 856
- Assessable income, 804-818
- Assessment of—
- income tax, 758-765, 804-818.
- land tax, 765-766
- Assets of—
- bankrupts, 1010-1011, 1073
- banks, 825, 827, 848-850, 1070
- building societies, 875
- electric-power undertakings, 559
- fire insurance companies, 893-894
- friendly societies, 204
- life assurance companies, 886-887
- local government, 790-791
- manufacturing industries, 502-503
- Assurance, life, 880-887, 899-900, 1074
- Atafu Island, 2, 25, 996-997
- Atiu Island, 2
- Auckland Harbour Bridge, 325-326
- Harbour Bridge Authority
- Auckland Islands, 1, 988
- Audio-visual teaching aids, 224
- Australia—
- Free Trade Agreement with, 614
- New Zealand representation in, 1049, 1050
- prices in, 687
- reciprocal trade with, 614, 620-623, 630, 679
- representation in New Zealand, 1049
- shipping to and from, 306, 310
- visitors and migrants from, 75, 1001
- Aviation, 343-353
- agricultural, 282
- Awards, cultural, 1086-1087
- Awards in literature and the arts, 1091
- Awards to armed forces personnel, 1047, 1048
B
- Bacon and ham—
- consumption of, 708
- curing, 480, 511
- Balance of payments, 731-746
- capital account, 735-737, 739, 741
- current account, 733-735, 736-737, 740
- regional accounts, 738-742
- survey of companies with overseas affiliations, 742-746
- Balance of trade, 617
- Bananas—
- consumption of, 709
- imports of, 575, 666, 671
- Bank notes, 823, 825, 832, 833, 847.
- denominations of, 847
- in circulation, 832, 1070
- Bank of New Zealand, 777, 826, 833
- Banking and currency, 821-856, 1070-1071
- Banking and economics publications, 1096-1097
- Bankruptcy, 912, 1010-1012, 1073
- industry groups of bankrupts, 1012
- Banks, overseas assets of, 825, 827, 848-850, 1070
- Banks, Savings—
- Post Office, 835-838, 845, 1071
- private, 838, 845
- school, 837-838
- trustee, 838-840, 845
- Barley, 414-416, 418-419, 1057
- Beds, hospital, 147-148
- Beef—
- cattle, 427-431, 1058
- chilled, 503, 648-649
- consumption of, 400-401
- export of, 564-565, 648-649, 708
- production of, 394-396, 400-402, 510
- retail prices of, 685
- slaughterings for, 402
- Beer—
- consumption of, 710
- duty on, 677, 748
- export of, 636, 638
- production of, 514
- Bees, 432
- Benefits, social security, 168-187, 714, 718, 722-726, 751
- Bentonite, 459, 466
- Beverage industries, 480, 484-508, 514-515
- Bibliography—
- New Zealand publications, 1093-1117
- Bills of exchange, 823, 847-848
- Bills, Treasury, 780
- Biographies and autobiographies, 1116-1117
- Biology publications, 1103
- Birth rate, 89-91
- Birthplaces of population, 85
- Births, 88-95, 1052
- ex-nuptial, 93-94
- first, 92-93
- multiple, 90-91
- of Maoris, 89
- registration of, 88
- still, 91, 95
- Biscuit industry, 480, 513
- Bituminous coal, 460, 461
- Blind, benefits for and education of, 178, 208, 209
- Board of school children, 220
- Board of Trade, 676
- Boards, Producers
- New Zealand Wool
- Meat
- Bonds, National Savings, 834
- Bonus issue tax, 759
- Books—
- imports of, 671
- library, 370-374
- New Zealand, 1093-1117
- Boroughs, 53, 54, 64-66, 786-797
- area of, 64-66
- bridges in, 325
- capital and unimproved values, 299-300, 786
- debt, 790, 792-796, 1069
- employees of, 796-797
- milage of streets, 325
- number of, 54
- population, 64-66
- stores in, 589
- Borstal institutions and training, 251-253
- Boundaries of New Zealand, 1
- Bounty Island, 1, 988
- Bread subsidy, 712
- Breeding ewes, 428-429
- Breweries, 481, 514
- Brick production, 523
- Brides and grooms, 121-123
- Bridges and bridging, 325-326, 328
- Brigades, fire, 898
- Briquettes and carbonettes, 463
- Britain—
- New Zealand representation in, 1049
- representation in New Zealand, 1049
- British—
- Drama League, 1086
- Overseas Airways Corporation, 343-344, 350
- postal orders, 356
- preference, 678
- sovereignty, 28-29
- Broadcasting, radio and television, 362-369
- for schools, 224
- stations, 363-364
- time signals, 365, 1022-1023
- Building, 529-549, 865-871
- Advisory Council, 529-530
- imports of, 539, 667, 672
- costs, 529
- imports of, 539, 667, 672
- index of production, 380, 381
- imports of, 539, 667, 672
- materials, 523, 537-539
- imports of, 539, 667, 672
- permits, 532-536
- persons engaged in, 530, 929, 933-935, 938, 945
- wages and working hours of employees, 530, 924, 926
- work put in place, 537
- Building societies, 871-875
- deposits, 873-875
- Bulk purchase agreement, 572
- Bullion production, 464
- Burials, 95, 132
- Bursaries—
- academic, 219
- dental, 138
- Department of Health, 130, 141, 227
- ex-servicemen's, 227
- ex-servicemen's children, 192
- forestry, 441
- medical, 226-227
- physiotherapy, 139
- secondary schools, 219
- secondary teachers', 223
- technical schools, 219
- university, 207, 226-227
- Buses, 318, 323-324, 375, 339-342
- Bush, 273, 433-440
- Bushel units, weights of, 415
- Business and management publications, 1107
- Business, census of, 585-598
- Business failures, 912, 1010-1012, 1073
- Business loans, 866, 869
- Butter
- Dairy produce
- Butterfat production, 397-398, 1064
- Butterfat yields, 398-399
C
- Cabinet, 48
- Cable tramway, 342
- Cables, overseas, 359
- Cadets—
- army, 263
- navy, 261
- Calf-skins exported, 636, 637-638, 654-655, 1063
- Calves, slaughter and marketing of, 402
- Campbell Island, 1, 54, 988
- Camps, health, 135, 143
- Canada—
- exchange rate with, 848
- New Zealand representation, 1049, 1050
- prices in, 687
- reciprocal trade with, 621, 623, 642, 645, 646, 648-651, 656, 665, 666, 679, 734
- representation in New Zealand, 1049
- Canberra Pact, 30
- Cancer—
- ages of decedents, 107
- deaths from, 106-109, 111, 155
- site of disease, 108, 109
- Canned and preserved meats, etc.,
- exported, 636, 637, 651
- production of, 510
- Canned fish—
- exports of, 455
- imports of, 671
- Canned fruits—
- consumption of, 709
- production of, 513-514
- Canned vegetables—
- consumption of, 709
- exports of, 636, 638
- production of, 513-514
- Capital—
- expenditure of Government, 748, 753
- expenditure on farms, 1139
- formation, 715, 717
- invested in electric-power undertakings, 558-559, 561
- invested in manufacturing industries, 502-503
- of companies, 876-878, 1073
- transfers,, 851, 852
- value of land, 298-299, 785-786
- Capitalisation of family benefit, 169, 177-178
- Carbonettes, 463
- Cargo carried by air transport, 346-348, 352
- Cargo handled at ports, 301-310
- Carnegie Corporation, 232
- Casein exported, 636, 637, 653
- Casein produced, 399
- Casualties in war, 268-269
- Casualties, shipping, 313
- Catchment boards, 280-281, 787-790, 795-797
- number of, 54
- Cattle, 381-396, 400-402, 427-431, 1058, 1076
- hides exported, 636, 637-638, 654-655, 1063
- slaughtered, 402
- Cement—
- exports of, 635-637
- industry, 472, 482, 524
- production of, 524
- Cemeteries, 132
- Census, 59-60, 63-69
- employment statistics, 944-950
- income earners in each household, 820
- incomes of individuals, 819-820
- major industrial groups, 946-947
- occupations of married women, 949-950
- occupations of population, 947-949
- of agriculture, 390
- of building and construction, 529-530
- of distribution, 585-598
- of dwellings, 544-549
- of libraries, 372-373
- of mining and quarrying, 469
- of poultry, 431-432
- of religious professions, 82-83
- publications, 1174
- Central Government finance, 727-730, 747-784, 1066-1067
- Cereals, 414-416, 421, 1057
- consumption of, 711
- Cerebral palsy, 139
- Certificates of title, 274
- Chatham Islands, 1
- schools, 215
- Cheese
- Dairy produce
- Chemicals and chemical products industry, 482, 484-508, 521-522
- Chemists, 142-143, 170
- Child health and welfare, 134-135, 208, 234-237, 246-249
- Childbirth accidents, etc., 103, 104, 111-117, 131, 157-158
- Children—
- accidents affecting, 119
- Infant mortality
- adopted, 94, 177, 237
- Infant mortality
- affected by divorce proceedings, 127
- Infant mortality
- allowances, 168, 172, 173, 177-178
- Infant mortality
- born, numbers and sexes, 89-90, 1052
- Infant mortality
- dental treatment of, 136-137
- Infant mortality
- dependent, 81-82, 234-237
- Infant mortality
- handicapped, 134, 144-145, 208, 237
- Infant mortality
- health of, 134-135
- Infant mortality
- legitimated, 94
- Infant mortality
- of deceased or incapacitated ex-servicemen, 192
- Infant mortality
- offences by, 235-236, 247-249
- Infant mortality
- restrictions on employment of, 906
- Infant mortality
- school, 211-212, 1053
- Infant mortality
- under one, deaths of
- Infant mortality
- Children's courts, 235-236, 247-249
- Children's homes, 144, 236
- Churches, 124
- Cigarettes and tobacco—
- duty on, 677
- imports of, 661, 662, 667, 671
- production of, 480, 515
- Cinemas, 374-379
- Cinematograph film-hire tax, 773
- Cinematograph Films Regulations, 986
- Cities, population of, 65-66
- Citizenship, 77-79
- Citrus fruits, 426, 709
- consumption of, 709
- imports of, 575, 666, 671, 675
- Civil—
- aviation, 343-353
- defence, 270
- jurisdiction, 240-241
- list, 46-47, 750
- Claims, insurance—
- accident, 888-889, 891, 900-901
- fire, 893, 894-898, 900-901
- motor vehicle (third party), 890-891
- Clays, 523
- Clergy of each church, and marriages by, 124
- Climate, 15-23
- Clinics—
- ante-natal, 149
- dental, 137, 187
- Closing hours of shops, 906
- Clothing and footwear, retail prices of, 686, 691
- Clothing, imports of, 664, 670
- Clothing industry, 480, 434-508, 516-517
- Clover seed
- Grass and clover seed
- Club charters, 1015
- Clubs—
- agricultural, 221
- rifle, 264
- Coal—
- and petroleum products industry, 482, 484-508
- disputes, 966-967
- wages and hours worked, 925
- welfare and research fund, 464
- consumption of, 462, 493-494
- disputes, 966-967
- wages and hours worked, 925
- welfare and research fund, 464
- deposits, 8
- disputes, 966-967
- wages and hours worked, 925
- welfare and research fund, 464
- exports of, 635, 637
- disputes, 966-967
- wages and hours worked, 925
- welfare and research fund, 464
- mining, 458-464
- disputes, 966-967
- wages and hours worked, 925
- welfare and research fund, 464
- production of, 458, 462, 463
- research 460, 468
- resources, 460, 461-462
- used in gas industry, 563
- Coastal shipping, 301, 302, 306-307
- Co-education, 209
- Cocoa imported, 667, 671
- Coffee imported, 666, 671
- Coin and coinage, 846-847, 1126-1127
- held by banks, 827, 833
- imported and exported, 625, 846, 1059
- Colleges—
- agricultural, 226, 228-229
- air force, 266
- military, 263-264
- naval, 261
- pharmacy, 143
- teachers' 222-223
- Colombo Plan, 31, 40, 740, 1081
- Commerce, overseas, 613-682, 1059-1063
- Commercial failures, 912, 1010-1012, 1073
- Commercial radio and television, 362-366
- Commodity sales—
- retail, 585-592, 596, 600-601
- wholesale, 594, 597, 608-609
- Common Market
- European Economic Community
- Commonwealth, 33, 40-41
- defence, 259, 260, 267
- Commonwealth Strategic Reserve, 267
- Communications, 354-379
- Communications, radio, 360
- Community centres, 234
- Companies—
- balance dates of, 819
- in manufacturing industries, 504-505
- in manufacturing industries, 504-505
- bank advances to, 830
- in manufacturing industries, 504-505
- in manufacturing industries, 504-505
- co-operative dairy, 400
- in manufacturing industries, 504-505
- in manufacturing industries, 504-505
- deposits with, 842-844
- in manufacturing industries, 504-505
- in manufacturing industries, 504-505
- financial statements, analysis of, 878-879
- in manufacturing industries, 504-505
- in manufacturing industries, 504-505
- income of, 720, 722-726, 803, 804, 810-819
- in manufacturing industries, 504-505
- in manufacturing industries, 504-505
- joint stock, 590, 817-818, 876-879
- in manufacturing industries, 504-505
- in manufacturing industries, 504-505
- overseas, 876-877
- in manufacturing industries, 504-505
- paid-up capital, 816-818
- in manufacturing industries, 504-505
- private, 590, 817-818, 876-877
- in manufacturing industries, 504-505
- public, 817-818, 876-877
- registered, 876-878, 1073
- share prices indices, 703-705, 706-707
- taxation of, 759, 804, 812-818
- with overseas affiliations, 742-746
- Comparisons with other countries
- International comparisons
- Compensation—
- Court, 50, 239, 973-974, 1041
- criminal injuries, 253
- workers' 239, 971-974, 975, 977
- Compulsory—
- arbitration, 959
- insurance, 901, 974
- unionism, 953
- Conciliation Council, 953, 959-960
- Concrete products industry, 482, 524
- Condensate, natural gas, 458, 465-466, 469
- Confectionery industry, 480, 513
- Confinement, deaths in, 103, 104, 116-117, 156
- Confinements, 148
- Conjugal status of persons marrying, 121, 123
- Conservation of forests, 433-440
- Conservation of soil, 280-282
- Consolidated Revenue Account, 168-169, 747-752, 754, 755, 1066, 1134-1137
- Constitution of New Zealand, 43
- Construction Act, 984
- Construction, building, and housing, 529-549, 865-871, 924, 926
- wages and hours worked of employees, 915, 916, 918-920, 922, 924, 926
- Consumer Council, 684
- Consumer prices, 683-687
- index, 688-696, 706-707, 1133
- Consumption of—
- coal, 462, 493-494
- electricity, 553-554, 558-560
- farm produce, 397, 400, 401, 708-710
- food, 705-712
- meat, 400-401
- motor spirits, 332
- wheat, 417
- Contact lenses, 187
- Contagious diseases,
- Diseases
- Contingent liabilities, state, 775-776
- Control of—
- bank advances, 831
- exchange 822-823, 846, 853, 854
- prices, 683-685
- Convictions, 241-246
- for drunkenness, 245
- for traffic offences, 243-244, 337-339
- of juveniles, 249
- of women, 247
- Convictions in Magistrates' Courts, 241-242, 1054
- Convictions in Supreme Court, 245-246, 1054
- Cook Islands, 1, 2, 24-25, 29, 31, 34, 197, 988, 989-993, 1077, 1083
- immigrants from, 75, 77, 85
- population, 59, 990-991
- public finance, 993
- trade, 660, 674, 992
- Cook Strait, 4
- air freight service, 347, 348
- submarine power cable, 550, 552
- vehicular ferry service, 315, 322
- Co-operative credit associations, 866-867
- Co-operative dairy companies, 400
- Copper ore, 458, 465
- Copra, 993, 995, 997
- Copyright, 1009
- Cordial and aerated-water industry, 480, 515
- Corn crops, 414-419
- Correspondence schools and classes, 221, 230
- Cosmetics, manufacture of, 522
- Cost of living, 685-696
- Costs—
- building, 529
- roading, 328-330
- Cotton piece-goods, imports of, 672
- Council for—
- Educational Research, 232
- Technical Education, 232
- Adult Education, 233
- Counties, 53, 54, 67-68, 786-797
- bridges in, 325
- building values, 536
- capital and unimproved values, 299-300, 786
- debt, 790, 792-796, 1069
- employees of, 796-797
- franchise, 55
- milage of roads, 325
- population, 67-68
- roads and roading, 330
- Country lands, mortgages on, 859-860, 862-864, 865-866
- Country Library Service, 371-372
- Court of Appeal, 50, 238, 246-247, 1041
- Court of Arbitration, 50, 239, 380, 903-905, 910-911, 953, 959, 1041, 1079
- Courts (see also Supreme, Magistrates, etc), 238-246
- Judges of, 238-239, 1041
- structure and types of, 238-239
- Cranes, inspection of, 1001
- Crayfish, 453, 455, 456
- exports of, 635, 637
- Cream, consumption of, 708
- Cream separators on farms, 412
- Credit, rural intermediate, 866-867
- Creditors' petitions, 1010-1011
- Cremation, 132
- Crews of overseas vessels, 73, 74
- Crime, law and, 238-257, 1054
- Criminal—
- appeals, 247
- injuries compensation, 253
- jurisdiction, 241-246
- Criminals, habitual, 254
- Crippled children, 143
- Handicapped children
- Crops, 273, 387-396, 413-423, 1057
- research, 406-408, 1121
- Crown land, 282-288, 433
- Crown tenants, 283-288
- Cultivation, area in, 273, 414
- Cultural awards, 1086-1087
- Currency and banking, (see also Exchange), 821-856, 1070-1071
- Customary land, 292
- Customs tariff and revenue, 675-682
- Customs taxation, 675-678, 728, 748
D
- Dairy—
- Board, 398-400, 402, 404, 572
- account, 585
- basic prices for, 580-582
- consumption of, 708
- export of, 564-565, 613, 614, 633, 634, 636, 637, 639, 652-653, 656, 708, 851, 1061-1062
- export price index, 700-701
- prices for, 576-582
- subsidies on, 712
- marketing of, 564, 566-567, 568-572
- cows, 398, 427-435, 1058
- account, 585
- basic prices for, 580-582
- consumption of, 708
- export of, 564-565, 613, 614, 633, 634, 636, 637, 639, 652-653, 656, 708, 851, 1061-1062
- export price index, 700-701
- prices for, 576-582
- subsidies on, 712
- marketing of, 564, 566-567, 568-572
- factories, 398-400, 481, 511
- account, 585
- basic prices for, 580-582
- consumption of, 708
- export of, 564-565, 613, 614, 633, 634, 636, 637, 639, 652-653, 656, 708, 851, 1061-1062
- export price index, 700-701
- prices for, 576-582
- subsidies on, 712
- marketing of, 564, 566-567, 568-572
- farming, 381, 396, 397-400, 427-431, 912
- account, 585
- basic prices for, 580-582
- consumption of, 708
- export of, 564-565, 613, 614, 633, 634, 636, 637, 639, 652-653, 656, 708, 851, 1061-1062
- export price index, 700-701
- prices for, 576-582
- subsidies on, 712
- marketing of, 564, 566-567, 568-572
- machinery, 638
- account, 585
- basic prices for, 580-582
- consumption of, 708
- export of, 564-565, 613, 614, 633, 634, 636, 637, 639, 652-653, 656, 708, 851, 1061-1062
- export price index, 700-701
- prices for, 576-582
- subsidies on, 712
- marketing of, 564, 566-567, 568-572
- produce, 397-400, 405, 511
- account, 585
- basic prices for, 580-582
- consumption of, 708
- export of, 564-565, 613, 614, 633, 634, 636, 637, 639, 652-653, 656, 708, 851, 1061-1062
- export price index, 700-701
- prices for, 576-582
- subsidies on, 712
- marketing of, 564, 566-567, 568-572
- Deaf, education of, 208
- Death duty, 769-771
- estates passed for, 769-771
- Death rates, 96-119
- international comparisons, 111
- Maori - non Maori comparisons, 96, 97, 104
- Deaths, 87, 95-119, 155-159, 1052
- accidental
- Accidents
- by ages, 98-100
- by causes, 102-119, 979
- distribution over year, 98
- due to earthquakes, 13
- foetal, 95
- from accidents on farms, 983
- from external causes, 103, 104, 117-119
- from puerperal causes, 103, 104, 116-117, 156
- in hospitals, 155-156, 159
- in mental hospitals, 167
- neo-natal and perinatal, 103, 104, 116
- of friendly society members, 204
- of infants, 103, 104, 111-115, 1052
- of insured persons, 883, 884-885
- of Maoris, 95-98
- of servicemen overseas, 96, 268-269
- Debenture Tax, 759
- Debentures, 792, 794, 840
- Debits, bank, 832
- Debt—
- conversion of, 779
- local government, 741, 784, 790, 791, 792-796, 1068-1069
- location of, 779-780, 1067
- public, 741, 748, 750, 775-784, 779, 781-782, 783, 1067
- Debtors' petitions, 1010-1011
- Deceased persons' estates, 769-771
- Decimal currency, 846, 1126-1127
- Deeds registration, 274, 857
- Defence, 258-270
- civil, 270
- expenditure on, 262, 264, 266, 728, 748, 751
- Ministry of, 258
- publications on, 1100
- science, 259
- Degrees, university, 207-208, 203, 227-230
- Delinquency, juvenile, 235-236, 247-249
- Demography, 58-86, 1051, 1052
- Denominational schools, 208-209
- Density of population, 70-71
- Dental—
- benefits (social security), 136, 170, 186-187
- bursaries, 137
- nurses, 136-137, 187
- services hygiene, etc., 136-138, 187
- research, 138
- Dentistry publications, 1104-1105
- Department of—
- Agriculture, 404-406, 1120-1123
- Civil Aviation, 344-345, 986
- Health, 129-130, 985, 1121-1123
- Internal Affairs, 986
- Labour, 932, 939-940, 984-985, 1028
- Marine, 452, 985, 1028
- Mines, 458, 985, 1028
- Scientific and Industrial Research, 408-409, 473-474, 998, 1118-1125
- Departments, Government, (see also under individual Departments), 49-50, 1028, 1050-1054, 1058-1060
- Departures
- Migration
- Dependants of servicemen, pensions for, 187-195
- Dependent children, 81-82, 234-235
- Deposits—
- interest rates on, 836, 837, 841, 843-844, 845
- with building societies, 875
- with Reserve Bank, 825
- with savings banks, 834, 836, 838-839, 1071
- with stock and station agencies, 840-842
- with trading banks, 826, 827, 828-829, 833, 845
- with trading companies, 842-844
- Depreciation allowances, 714, 717, 721, 758-759
- Desertion in marriage, 126, 176
- Designs, registration of, 1009
- Detention—
- preventative, reformative, etc., 250-253
- Development Finance Corporation, 856
- Diagnostic laboratory services, 170, 186-187
- Diagnostic, x-ray, services, 132, 153, 170, 185-186
- Diagrams and graphs (see Contents, viii)
- Diesel and diesel-electric rail transport, 314-317
- Dietitians, 142
- Diphtheria, whooping cough, and tetanus immunisation, 135
- Diplomas, 213, 228-229
- Diplomatic representation, 1048-1050
- Directories and encyclopaedias, 1095
- Disabilities from industrial accidents, 975, 978-979, 981
- Disability war pensions, 193-195
- Disabled servicemen, 187-195
- Discount rates, 824
- Diseases—
- deaths from, 102-111, 155-156
- notification of, by type, 131, 151-153
- prevention of, 135
- treated in hospitals, 155-157
- tropical, 991, 994
- Disengaged persons, 936, 939
- Disputes, industrial, 958-970, 1075, 1080
- causes of, 967-968, 970
- Dissolution of marriage, 125-127
- Distribution—
- census of, 585-598
- by ages, 83-84
- by industries, 946-947
- of labour force, 929, 933-938, 946-949
- by ages, 83-84
- by industries, 946-947
- of population, 62-71
- by ages, 83-84
- by industries, 946-947
- District high schools, 206, 211, 217, 218
- Dividends—
- taxation on, 760
- totalisator, 773
- Divorce, 125-127
- Divorced persons remarrying, 121, 123
- Doctors (see Medical practitioners)
- Dogs, 431
- Domains, public, 288-292
- Domestic assistance, 170, 182, 186
- Domestic trade, 585-612, 1131-1133
- Domicile of debt, 779-780, 1067
- Dominion Museum, 1087, 1089-1090
- Drainage boards, 281, 787
- number of, 54
- Drama in New Zealand, publications on the, 1112
- Dredging, gold, 464-465
- Drivers' licences, 330
- Drowning accidents, 117
- Drugs, 132-133, 184
- dangerous, 133
- Drunkenness, 126, 242, 245, 338
- Ducks, 431
- Duties—
- customs and excise, 675-682, 728, 748, 749, 755, 757
- death, 769-771
- gift, 749, 755, 766, 767-768
- on instruments, 755, 722
- on lottery tickets, 772, 1014
- stamp, 749
- Dwellings
- amenities of, 547
- census of, 544-549
- materials used, 548
- number of rooms and occupants, 548-549
- projections of, 532
- tenure of, 546, 549
E
- Earthquake and war damage insurance, 901-903
- Earthquakes, 13-14, 1079
- Earths, types of, 387-389
- Economic Commission for Asia and the Far East (ECAFE), 36
- Economic pensions, 191
- Economic stabilisation, 748, 750
- Economic and banking publications, 1096-1097
- Education, 26, 205-237, 1053, 1077
- adult, 233
- annual appropriations, 748, 751
- boards, 205, 908
- buildings, 210, 771
- certificate of, 207
- Commission on, 206
- Department of, 205-237
- dental health, 137
- districts, 214, 215
- expenditure on, 209-210, 220, 728, 751
- health, 135, 136
- higher, 207-208, 209, 211, 219, 222-223, 225-230, 1053
- of ex-servicemen, 196
- of new settlers, 234
- Pacific Islands, 234, 991, 994
- physical, 145
- pre-school, 209, 211
- primary, 206, 290, 211, 213-217, 220, 1053
- publications, 225, 1099-1100
- rural, 220-221
- secondary, 206-212, 217-219, 220, 1053
- system, 206-209
- technical, 209, 211, 218, 219, 228, 230-231, 1053
- training of teachers, 211, 213, 219, 222-224
- Educational research, 232
- Effective weekly wage-rates, 922-923
- Eggs, 431-432
- consumption of, 710
- export of, 636, 637, 639
- marketing of, 432, 574
- retail price of, 574, 685
- subsidy on, 574
- Elections, general, 44-45, 1016-1021
- Electoral, 44, 50-52, 1016-1021
- Act 1956, 44, 46
- districts, 50-51
- qualifications, 51
- registrations, 51
- Representation Commission, 44, 46, 50
- roll, 50-51, 1016
- Electric—
- power boards, 54, 554-555, 558, 787-790, 795-797, 1069
- power, development of, 550-553, 1082
- power, generation and supply, 550-561
- steam stations, 463, 550, 552
- power in manufacturing industries, 492-493
- power, review of operations, 557-561
- railways, 314-317
- supply account, 753
- Electrical machinery and appliances imported, 663, 670, 673
- Electrical machinery and appliances industry, 483-508
- Electricity, consumption of, 553-455, 558-560
- Embassies, 1048
- Emergency benefits, 169, 173, 181
- Emigration, 72-78
- Employees—
- electric supply, 558
- factory, 484-489
- farm, 392-393
- forest industries, 448
- gas industry, 563
- government, 937-939, 951
- in industry, 929, 933-935, 937-938, 946-949
- legislation affecting, 910-913
- local government, 796-797, 937-939, 951
- manufacturing industries, 476-489, 929, 933-935, 937-938, 946-949, 1065
- mining, 462-463
- post office, 362, 1043, 1055
- public service, 1043
- public works, 951
- railway, 323, 1043
- retail trade, 590, 592
- service establishments, 595
- state services, 1043
- unions of, 953-958, 959-960, 962, 963
- wholesale trade, 594
- Employers, 954, 955, 958
- liability insurance, 887, 889, 974
- unions, 954, 955, 958
- Employment, 927-952
- districts, production in, 477-479
- index of, 382
- on farms, 392-393
- placement service, 932, 940
- promotion, 932, 942-944
- regulations affecting, 903-909
- seasonal fluctuations in, 950
- service, national, 932
- structure, 1140-1145
- subsidised, 940
- survey of, 932-939
- vacancies, 936, 939
- Encyclopaedias and directories, 1095
- Endowment land, 284-287
- Engineering industries, 483-508, 562-528
- Engines—
- employed in manufacturing industries, 492-493
- railway, 315-317
- English and Maori language publications, 1107
- Ensilage
- Silage
- Erosion, 7-12, 281
- protection, forest, 438-439
- Estate Duty, 749, 755, 766-767, 769-711
- Estates—
- administered by Public Trust Office, 1008
- assigned, 1010-1012
- passed for death duty, 769-771
- European Economic Community (EEC), 569, 728, 1081, 1082, 1083
- trade with, 615, 621, 623, 642, 645, 665-666
- European Free Trade Association (EFTA), 570
- Ewes, breeding, 428-429
- Examinations, 207, 213
- marine officers, 312
- medical, of school children, 134-135
- Excess retention tax, 759
- Exchange allocation, 853-854
- Exchange (currency), 847-848
- bills of, 823, 847-848
- control of, 822-823, 846, 853, 854
- New Zealand—London, 847-848
- rates of, 823, 847-848
- Exchange transactions, overseas, 850-855, 1138
- Exchanges, telephone, 357-358
- Excise duties, 677, 728, 749, 755, 757
- Executive council, 44, 47-49, 1028
- Exemptions from taxation—
- income tax, 758, 761, 809-810
- land tax, 765-766
- Ex-nuptial infants—
- ages of mothers, 94
- births of, 93-94
- legitimation of, 94
- protection of, 237
- Exotic forests, 433-448
- Expectation of life, 100-102
- Expeditionary forces, 268-269, 1078, 1079
- Expenditure—
- air force, 266
- roads, 327-330, 753, 754
- army, 264
- roads, 327-330, 753, 754
- broadcasting and television, 366-367
- roads, 327-330, 753, 754
- cinemas, 376
- roads, 327-330, 753, 754
- civil aviation, 345
- roads, 327-330, 753, 754
- defence, 748, 751
- roads, 327-330, 753, 754
- education, 209-210, 220, 232, 751
- roads, 327-330, 753, 754
- electric power, 558-559, 561
- roads, 327-330, 753, 754
- Forest Service 442
- roads, 327-330, 753, 754
- government, 727-730, 750-752, 753, 754, 1066
- roads, 327-330, 753, 754
- health, 130, 751
- roads, 327-330, 753, 754
- hospital boards, 150
- roads, 327-330, 753, 754
- insurance companies, 883, 885, 888, 894-895, 899, 902, 1074
- roads, 327-330, 753, 754
- local government, 329-330, 788-789
- roads, 327-330, 753, 754
- mental hospitals, 167
- roads, 327-330, 753, 754
- national, 713-731
- roads, 327-330, 753, 754
- National Roads Fund, 328, 754
- roads, 327-330, 753, 754
- naval, 262
- roads, 327-330, 753, 754
- Post Office, 356, 361
- roads, 327-330, 753, 754
- railway, 317-319, 753
- roads, 327-330, 753, 754
- rehabilitation, 196-197
- roads, 327-330, 753, 754
- social security, 171
- social services, 748, 751
- urban transport, 339-349
- Explosives, 986
- Export—
- Development conference, 614
- incentive scheme, 628
- licences, 625
- Exports, 613-626, 632-660, 738, 851, 852, 1059-1063
- by ports, 309, 659
- value, 633-634, 637-644, 646-660
- volume, 635-636, 648-658
- dairy produce, 572
- meat, 572
- by ports, 309
- index numbers, 699-702, 706-707
- classification of, 639-640
- value, 633-634, 637-644, 646-660
- volume, 635-636, 648-658
- dairy produce, 572
- meat, 572
- by ports, 309
- index numbers, 699-702, 706-707
- commodities exported,
- value, 633-634, 637-644, 646-660
- volume, 635-636, 648-658
- dairy produce, 572
- meat, 572
- by ports, 309
- index numbers, 699-702, 706-707
- control of, 625
- dairy produce, 572
- meat, 572
- by ports, 309
- index numbers, 699-702, 706-707
- dairy produce, 564, 570, 613, 614, 633, 634, 636, 637, 639, 652-653, 656, 708-710, 851, 1061-1062
- by ports, 309
- index numbers, 699-702, 706-707
- destination of, 614-615, 620-623, 641-658
- index numbers, 699-702, 706-707
- fish, 455
- index numbers, 699-702, 706-707
- fruit, 636, 638, 656, 1062
- index numbers, 699-702, 706-707
- hides, skins, and pelts, 636-638, 654-655, 1063
- index numbers, 699-702, 706-707
- licences, 625
- index numbers, 699-702, 706-707
- meat, 564-565, 613, 633-634, 636, 637, 639, 648-651, 708-710, 851, 1060
- index numbers, 699-702, 706-707
- prices, 576-579
- index numbers, 699-702, 706-707
- seeds, grass and clover, 636, 638, 657, 1062
- re-exports, 659-660
- specie, 625, 1059
- value of, 616, 617-623, 632-635, 637-645, 647-660, 851, 852, 1132
- volume index numbers, 624
- wool, 309, 613, 633, 634, 636, 638, 647, 648, 851, 1060
- Ex-servicemen—
- acquisition of land by, 286, 287-288
- dependants of, 187-195
- disabled, 187-196
- pensions for, 187-195
- rehabilitation, 196-197, 286-288, 866, 869
- External—
- Affairs, Department of, 32
- annual appropriations, 750
- migration, 61, 72-78, 1051
- trade, 613-682, 1059-1063, 1132-1133
F
- Factories, 470-528, 1065
- accidents in, 975-978
- Act, 905-906
- classification of, 475, 481-483
- classified by value of production, 496-497
- classified by size, 488-489
- coal consumed in, 493-494
- dairy, 397-400
- employees, 476-489, 929, 933-935, 937-938, 946-949, 1065
- expenses of operation, 502-503
- fire losses, 898
- summary of operations, 508
- Factory production, 470-528, 1065
- by employment districts, 477
- Fakaofo Island, 2, 25, 996-997
- Fallow land, 273
- Family benefits, 169, 171, 177-178
- capitalisation of, 169, 177-178, 540, 866
- Farm—
- accidents, 118-119, 982-983
- classification by types, 390-392
- imports of, 669, 673
- production of, 527
- consumption of, 397, 400, 401
- export of, 309, 397, 613, 633, 635-639, 1060-1063
- marketing of, 564-585.
- index of, 381, 395-396
- advisory service, 405
- classification by types, 390-392
- imports of, 669, 673
- production of, 527
- consumption of, 397, 400, 401
- export of, 309, 397, 613, 633, 635-639, 1060-1063
- marketing of, 564-585.
- index of, 381, 395-396
- area in cultivation, 415-416
- classification by types, 390-392
- imports of, 669, 673
- production of, 527
- consumption of, 397, 400, 401
- export of, 309, 397, 613, 633, 635-639, 1060-1063
- marketing of, 564-585.
- index of, 381, 395-396
- employees, 392-393
- classification by types, 390-392
- imports of, 669, 673
- production of, 527
- consumption of, 397, 400, 401
- export of, 309, 397, 613, 633, 635-639, 1060-1063
- marketing of, 564-585.
- index of, 381, 395-396
- finance, 279-280, 830, 865-871
- classification by types, 390-392
- imports of, 669, 673
- production of, 527
- consumption of, 397, 400, 401
- export of, 309, 397, 613, 633, 635-639, 1060-1063
- marketing of, 564-585.
- index of, 381, 395-396
- holdings, 271-273
- classification by types, 390-392
- imports of, 669, 673
- production of, 527
- consumption of, 397, 400, 401
- export of, 309, 397, 613, 633, 635-639, 1060-1063
- marketing of, 564-585.
- index of, 381, 395-396
- incomes, 798, 799, 809
- imports of, 669, 673
- production of, 527
- consumption of, 397, 400, 401
- export of, 309, 397, 613, 633, 635-639, 1060-1063
- marketing of, 564-585.
- index of, 381, 395-396
- industry reserves, 585
- imports of, 669, 673
- production of, 527
- consumption of, 397, 400, 401
- export of, 309, 397, 613, 633, 635-639, 1060-1063
- marketing of, 564-585.
- index of, 381, 395-396
- machinery, 412, 483-508, 527, 669, 672
- imports of, 669, 673
- production of, 527
- consumption of, 397, 400, 401
- export of, 309, 397, 613, 633, 635-639, 1060-1063
- marketing of, 564-585.
- index of, 381, 395-396
- produce—
- consumption of, 397, 400, 401
- export of, 309, 397, 613, 633, 635-639, 1060-1063
- marketing of, 564-585.
- index of, 381, 395-396
- production, 394-404, 411-418, 1057-1058
- index of, 381, 395-396
- settlement and assistance, 278, 283
- subsidies, 410
- training and settlement of discharged service-men, 287-288
- Farmers' mutual insurance associations, 898
- Farming, 387-432
- capital expenditure on farms, 1139
- cattle, 427-431
- dairy, 381, 396, 397-400, 427-431, 912
- sheep, 387-396, 400-404
- Fathers, ages of, 91
- Fauna, publications on New Zealand, 1103-1104
- Female suffrage, 51
- Female wage rates, 921, 923, 925-926
- Ferry services, 315, 322
- Fertiliser—
- industry, 482, 521
- land top-dressed with, 282, 409
- imports of, 662, 667, 668, 672
- subsidy on transport of, 410
- Fiction, selected New Zealand, 1110-1112
- Film-hire tax, 773
- Finance—
- and investment, 857-879
- companies, 833
- farm, 279-280, 830, 865-871
- Government, 727-730, 747-748, 1066-1067, 1134-1137
- hospital board, 149-150
- housing, 539-540
- local government, 729-730, 785-796, 1068-1069
- Fire—
- boards, 54, 202, 787-790, 795-797, 896
- brigades, 898
- districts, 896
- insurance, 892-898, 900-901, 1074
- State, 900-901
- losses, 892, 893, 894, 895, 896-898
- prevention in forests, 439-440
- Service Council, 896
- Fires—
- causes of, 897
- on vessels, 313
- First births, 92-93
- Fish—
- acclimatisation of, 5
- and fisheries, 452-457
- consumption of, 710
- exported, 455, 635, 637, 639, 658, 671
- value of production, 453-455
- Fishing, 452-457
- big-game, 456-457, 1005
- industry, index of production, 380-381
- Fish-liver oil, 455, 635, 637, 639
- Fixed deposits, 828, 845
- Flats, 530, 531, 533, 534, 535-537
- pensioners', 143-144
- Flax, linen, 427
- Flax, phormium
- Phormium
- Floating debt, 778
- Flogging and whipping abolished, 246
- Flora, publications on New Zealand, 1104, 1107
- Flour—
- consumption of, 710
- production of, 512
- subsidy, 712
- Fodder crops, 413-414, 421
- Foetal deaths, 95
- Fog signals, 313
- Food—
- And Agriculture Organisation (F.A.O.), 37
- consumption, 705-712
- imports of, 661, 662, 666-667, 671
- inspection and sale of, 132
- poisoning, 131, 151-157
- production, 480, 484-508, 510-514
- retail prices of, 685, 687, 691, 692
- subsidies, 712
- Footwear and clothing, retail prices of, 686, 691
- Footwear industry, 481, 484-508, 517
- imports of, 664, 673
- Foreigners, naturalisation of, 77-79
- Forest—
- exotic, 433-448
- fire prevention, 439-440
- indigenous, 433-448
- private, 441
- produce exported, 635, 637, 658
- resources, 434-436
- service, 433, 437-431, 1120, 1121, 1123
- utilisation, 442-451
- Forestry, 380-381, 433-451
- persons engaged in, 448
- publications, 451, 1105-1107
- research, 439, 441
- training, 441
- Forty-hour week, 905
- Fowls, 431
- Franchise, central government, 51-52
- Franchise, local government, 54-55
- Freehold, Crown land made, 286-287
- Freehold land, 271, 272, 283
- Freight—
- carried by air transport, 346-348, 352
- carried by shipping, 301-310
- carried by trains, 321-322, 324, 1056
- Frequency rates of accidents, 975-976
- Freshwater fisheries, 457
- Friendly societies, 203-204
- Fruit—
- consumption of, 709
- export of, 636, 638, 656, 1062
- imports of, 662, 666, 671, 675
- industry, 273, 413-415, 424-426
- marketing of, 573-575
- Fruit and vegetable preserving industry, 480, 513-514
- Fuels and lubricants, imports of, 661, 602, 667, 672
- Furniture and fixtures industry, 481, 484-508, 518
G
- Galvanised-iron sheet, imports of, 539
- Gardens, market, and nurseries, 273, 413-415, 422-423
- Gardens, production in home, 423
- Gas—
- appliances in homes, 547
- number of, 54
- boards, 787-790, 795-797
- number of, 54
- council, 562
- generation and supply, 562-563
- price, 562
- retail sales of, 563
- subsidy, 562
- Gazetteers, 1112
- Geese, 431
- General—
- Agreement on Tariffs and Trade (GATT), 37, 567, 569, 680-681
- Parliament
- Assembly,
- Parliament
- Assembly Library, 370
- Elections, 44-45, 1016-1021
- wage orders, 910-911
- Geographical features, 2-6
- Geographic Board, 296
- Geology, 7-12, 467
- maps, 10-11
- publications, 13, 1102-1103
- Geothermal steam, electric power stations, 474, 550, 552
- Geysers,
- Thermal activity
- Gift duty, 766, 767-768
- Glaciers, 4, 9
- Glass and glass products industry, 482
- Gold—
- discovery of, 5, 25, 26, 1076, 1077
- exported, 638
- mining and production, 458, 464
- reserve, 825
- Goods carried on railways, 321-322, 324, 1056
- Goods, dangerous, 986
- Government—
- and public administration publications
- Act, 908
- Industrial Tribunal, 908, 911
- Departments (see also under individual names), 49-50, 1028, 1050-1054, 1058-1060
- Act, 908
- Industrial Tribunal, 908, 911
- employees, 937-939, 951
- Act, 908
- Industrial Tribunal, 908, 911
- expenditure, 727-730, 750-752, 753, 754, 1066
- Act, 908
- Industrial Tribunal, 908, 911
- finance, 727-730, 747-784, 1066-1067, 1134-1137
- Act, 908
- Industrial Tribunal, 908, 911
- houses, sale of, 868
- Act, 908
- Industrial Tribunal, 908, 911
- housing, 529-531, 535-537, 541-543, 751-752
- Act, 908
- Industrial Tribunal, 908, 911
- insurance, 899-902
- Act, 908
- Industrial Tribunal, 908, 911
- railways
- Act, 908
- Industrial Tribunal, 908, 911
- sector, accounts of, 730-731
- Service Tribunal Act, 907, 912
- Superannuation Fund, 197-199, 753
- system of, 40-46, 47-49
- Governor-General, 1025-1026
- powers, duties, etc., 43-48, 239
- Graduates, university, 207-208, 229-230,
- Grain—
- crops, 387-396, 1057
- milling, 480, 512, 924, 926
- Grapes and vineyards, 424
- Grass and clover seed, 421-422
- exports of, 636, 638, 657, 1062
- Grassland and grasses research, 408-409, 414-419
- Grasslands, 273, 406-409, 414
- Greenstone, 466
- Groceries, retail prices of, 685, 687, 691, 692
- Gross—
- capital formation, 715-717
- of central Government, 775-780, 1067
- of local government, 784, 790, 791, 792-796, 1068
- domestic product, 382-385
- of central Government, 775-780, 1067
- of local government, 784, 790, 791, 792-796, 1068
- farming income, 394-396
- of central Government, 775-780, 1067
- of local government, 784, 790, 791, 792-796, 1068
- indebtedness—
- of central Government, 775-780, 1067
- of local government, 784, 790, 791, 792-796, 1068
- national product, 382-384, 713-718
H
- Ham (see Bacon and ham)
- Handicapped children, 134, 144-145, 208, 237
- Harbour boards, 54, 202, 787-790, 795-797, 1069
- Harbour Bridge Authority, 54, 787-790, 795-797
- Harvests, 413-423, 1057
- Hay, 416-421
- Health—
- annual appropriations, 751
- benefits, 180-181
- camps, 135, 143
- child, 134-135
- dental, 136-132
- Department of, 129-130, 985, 1121-1123
- education, 135, 136
- mental, 160-167
- occupational, 133, 906
- public, 128-145
- Hearing aids, 187
- Heart disease, 110-111, 157
- deaths from, 103, 104, 155
- Heavy traffic fees, 327, 333
- Hepatitis, 131, 151, 152
- Herd testing, 405
- Hides, skins, and pelts exported, 636, 637-638, 654-655, 1063
- by ports, 309
- High commissions, 1049
- Higher education, 207-208, 225-230
- Higher School Certificate, 207
- Highways, 326-330
- taxation, 327-330, 749, 755, 757-758
- Hire purchase trade, 591, 609-612, 1132
- Historic Articles Act, 1091
- Historic Places Trust, 1092
- History of New Zealand, 24-29, 1076-1083
- publications on, 1114-1116
- Holdings (see Land holdings)
- Holidays, 905, 1024
- Home—
- economics publications, 1107
- garden vegetable production, 423
- lay-by accounts, Post Office Savings Bank, 837
- Science, School of, 142
- Homes—
- accidents in 117-119, 159
- children's, 144, 236
- joint family, 543-544
- old people's, 143-144
- Homicide, 103, 104, 116, 158, 246
- Honey, 432-433
- consumption of, 710
- exported, 636
- marketing of, 575
- Honours conferred, 1046-1048
- Hops, 426, 514
- export of, 636, 638
- Horse-racing, 772-773
- Horses, 431
- Horticulture, 387-396, 406, 413-427
- Hosiery and other knitting mills, 480, 516
- Hospital—
- benefits, 169, 170, 184-185
- finances of, 149-150
- indebtedness of, 776
- number of, 54
- boards, 54, 146-150, 788, 795, 961, 1043
- finances of, 149-150
- indebtedness of, 776
- number of, 54
- districts, 50, 146
- Queen Elizabeth, 138-139
- Hospitals, (see also Patients), 145-167, 1005-1006
- beds in, 147-148
- deaths in, 156-157, 159
- Karitane, 143
- maternity, 148-149
- mental, 160-167, 236
- private, 147-148
- public, 147-148, 153-159
- St. Helens, 148
- staff of, 148
- Hostels, 144, 932
- Hot springs, 12, 1005
- Hotels and restaurants, fire losses on, 898
- Hotels, licensed, 1003, 1014-1016
- Hours of labour, 507, 510-528, 905, 915-917
- House of Representatives, 28, 43-49, 1029, 1030, 1076-1083
- broadcasting of proceedings of, 365
- members of, 1029
- Houses and flats, 529-549
- census enumerations, 544-549
- completed, 531
- fire losses on, 898
- Maori, 540-541
- rents, 545-546, 685
- sale of State, 868
- State, 529-531, 541, 543
- Housing, 529-549, 752-753, 865-871
- Council, 530, 532
- debt, 776, 777
- Division, Ministry of Works, 541-543
- finance, 539-540
- group building scheme, 530
- of Maoris, 540-541
- of the elderly, 144
- State, 529-531, 541-543, 752-753, 868
- wages in housing industry, 924, 926
- Humidity, 19-20
- Hunting, 1005
- Hydatids, 131, 132, 151, 152
- Hydro-electric power, 45, 550-561
- development of, 550-553
- stations, 550-557
- Hygiene—
- environmental, 132
- industrial, 134
- social, 131-134
I
- Ice-cream—
- consumption of, 708
- industry, 480, 512
- Illegitimacy
- Ex-nuptial
- Immigration, 61, 72-78, 932, 1051
- ages of migrants, 74
- assisted, 75-76
- hostels, 932
- Immunisation, diphtheria, whooping cough, and tetanus, 135
- Import control and licences, 625-630
- Import price indexes, 702, 706-707
- Importers, bank advances to, 830
- Imports, 613-631, 661-675, 738, 851, 852, 1059
- by ports, 674
- index numbers, 624
- classification of, 661-664
- index numbers, 624
- excess of exports over, 617
- index numbers, 624
- gross national product, relation to, 384-386
- index numbers, 624
- licensing and control of, 625-630
- index numbers, 624
- origin of, 614-615, 620-623, 664-671
- index numbers, 624
- payments on account of, 851, 852
- index numbers, 624
- restrictions on, 625-630
- index numbers, 624
- specie, 625, 1059
- index numbers, 624
- value of, 616, 617-623, 661-671, 674-675, 1133
- index numbers, 624
- volume of, 671-673
- index numbers, 624
- Income—
- company, 717, 720, 722-726, 803, 804, 810-819
- earners in each household, 820
- gross farming, 394-396
- industrial classification of, 808-809, 813-815, 817-819
- investment, 798, 802, 807
- national, 713-731, 757
- of individuals, 798-802, 804, 805-810, 819-820
- of insurance companies, 883, 885, 888, 894-895 899, 902
- of salary and wage earners, 798, 801, 807-808, 809
- of self employed, 798, 800, 807-808, 809
- of women, 806, 819
- private, 713-719, 722-726
- returnable, 804, 812, 813
- Income tax, 728, 748, 749, 755, 756, 758-765, 798-820
- Indebtedness—
- of local government, 741, 784, 790, 791, 792-796, 1068-1069
- hospital boards, 150, 776
- State, 741, 748, 750, 775-784, 1067
- Index numbers—
- consumers' price, 688-696, 706-707, 1133
- by commodity groups, 700
- value and volume, 505-506, 510-528
- value and volume, 505-506, 510-528
- farm, value and volume of, 395-396
- manufacturing industries, value and volume of, 505-506, 510-528
- employment, 382
- by commodity groups, 700
- value and volume, 505-506, 510-528
- value and volume, 505-506, 510-528
- farm, value and volume of, 395-396
- manufacturing industries, value and volume of, 505-506, 510-528
- export prices, 699-702, 706-707
- by commodity groups, 700
- value and volume, 505-506, 510-528
- value and volume, 505-506, 510-528
- farm, value and volume of, 395-396
- manufacturing industries, value and volume of, 505-506, 510-528
- factory production—
- value and volume, 505-506, 510-528
- value and volume, 505-506, 510-528
- farm, value and volume of, 395-396
- manufacturing industries, value and volume of, 505-506, 510-528
- farm production, value and volume, 395-396
- value and volume, 505-506, 510-528
- farm, value and volume of, 395-396
- manufacturing industries, value and volume of, 505-506, 510-528
- gross domestic product, 382-385
- value and volume, 505-506, 510-528
- farm, value and volume of, 395-396
- manufacturing industries, value and volume of, 505-506, 510-528
- gross farming income, 395-396
- value and volume, 505-506, 510-528
- farm, value and volume of, 395-396
- manufacturing industries, value and volume of, 505-506, 510-528
- import prices, 702, 706-707
- value and volume, 505-506, 510-528
- farm, value and volume of, 395-396
- manufacturing industries, value and volume of, 505-506, 510-528
- manufacturing industries production—
- value and volume, 505-506, 510-528
- farm, value and volume of, 395-396
- manufacturing industries, value and volume of, 505-506, 510-528
- private income, 725, 726
- farm, value and volume of, 395-396
- manufacturing industries, value and volume of, 505-506, 510-528
- production, 380-381, 383
- farm, value and volume of, 395-396
- manufacturing industries, value and volume of, 505-506, 510-528
- productivity, 382
- retail prices, 688-696, 706-707
- share prices, 703-705, 706-707
- volume of exports, 624
- volume of external trade, 624
- volume of imports, 424
- volume of production, 380-381, 505-506
- wage rates, 918-923
- wholesale prices, 696-699, 706-707
- wool prices, 576
- Indigenous forest, 273, 433-436, 437-438
- Industrial—
- associations, 957-958
- assurance, 884-885
- conciliation and arbitration, 903-904, 910-911, 953-958, 959-962, 1078
- disputes, 959-970, 1075, 1080
- distribution of population, 946-947
- hygiene, 133
- production, 470-528
- Relations Act, 963
- stoppages, 963-970, 1075, 1080
- unions, 953-958, 959-960, 962, 963
- Industrial accidents, 117-118, 971-982
- ages of injured workers, 979
- compensation paid, 975, 977
- deaths from, 118-119
- frequency and severity rates, 975-976
- time and cause of, 979, 981-982
- Industries—
- bank advances to, 830
- classification of, 475, 481-483
- classification of salary and wage earners, 913
- manufacturing, 470-528, 1065
- Industry—
- earnings and hours worked in, 476-483, 489-492, 915-917
- fatigue in, and accidents, 981, 982
- groups of bankrupts, 1012
- organisation of, 504-505
- persons engaged in, 476-489, 929, 933-935 937-938, 946-949, 1065
- power and technology publications, 1105
- State aid to, 866, 869
- Infancy, diseases of, 103, 104, 115
- Infant mortality, 103, 104, 111-115, 1052
- Maori, 113-115
- Insanity, 160-167
- Insects and fungi, control in forests, 440
- Insolvency, 1010-1012, 1073
- Instruments, duty on, 755, 772
- Insurance, 740-741, 761, 880-902
- accident, 887-891, 900-901, 1074
- earthquake and war damage, 901-903
- employers' liability, 887, 889, 974
- fire, 892-898, 900-901, 1074
- life, 880-887, 899-900, 1074
- motor-vehicles, third party risks, 333, 889-891
- policies, 880-885, 982, 899, 1074
- State, 899-902
- trade, 736-737
- Inter-industry studies and sector accounts, 746
- Interest—
- credited by savings banks, 834, 836, 838-839, 1071
- Rates of interest
- on hospital board debt, 150
- Rates of interest
- on local government debt, 788-789, 796
- Rates of interest
- on mortgages, 857, 860-862, 863, 865, 867, 1072
- Rates of interest
- on Post Office capital liability, 361, 749
- Rates of interest
- on public debt, 714, 717, 720, 729, 748, 779, 781-782
- Rates of interest
- payments overseas, 782
- Rates of interest
- payments to consolidated revenue account, 753
- Rates of interest
- rates
- Rates of interest
- Intermediate schools, 216
- International—
- activities, New Zealand's, 27, 29-42
- air services, 349-351
- Bank for Reconstruction and Development, 37, 301, 748, 775, 777, 778, 855-856, 1082
- Finance Corporation, 37, 855-856
- Geophysical Year, 998, 1081
- investment income, 851
- Monetary Fund, 37, 748, 752, 775, 852, 855-856, 1082, 1083
- Sugar Agreement, 681-682
- Wheat Agreement, 681
- Wool Secretariat, 573
- International comparisons—
- birth and natural increase rates, 87
- cinema attendance, 379
- consumption of foodstuffs, 711
- dairy produce consumption, 711
- death rates from stated causes, 111
- expectation of life, 101
- external trade per head, 616
- infant-mortality rates, 112
- life assurances, 880
- marriage rates, 120
- motor accident death and injury rates, 337
- newspapers and libraries, 370, 374
- population, annual average increase, 60
- prices, 687-688
- standards of living, 1013
- suicide rates, 119
- television, 365
- Invalids' benefits, 169, 173, 178-179
- Investment—
- accounts, 837
- and finance, 857-879
- incomes, 798, 802, 807, 851
- in New Zealand and overseas, 742-746
- pool—National Provident Fund, 201-202
- societies, 871-875
- Reserve Bank, 825
- State, 777
- Invisible imports and exports, 851, 852
- Iron and steel—
- imports of, 669, 672
- industry, 483, 527
- Iron ores and ironsands, 458, 464
- Island territories, 1, 2, 31, 34, 234, 988-999
- Islands—
- administered on trust, 988, 999
- annexed, 29
- uninhabited, 1
J
- Jails, prisoners in, 254-256, 1054
- Joinery industry, 518
- Joint family homes, 543-544
- Judiciary, 46, 238-239
- members of, 1041
- superannuation of, 198
- Juries, 239, 241
- Justice, 238-257
- Justices of the Peace, 239, 241
- Juvenile offenders, 235-236, 247-249
- Juvenile wage-rates, 921-922, 926
K
- Kale, 421
- Karitane hospitals, 143
- Kauri gum, 466, 635, 637
- Kermadec Islands, 1, 14, 59, 988, 1077
- Kindergarten-schools, 209, 211
- Knitting mills and hosiery industry, 480, 516
L
- Laboratory diagnostic services, 170, 186, 187
- Labour—
- Department of, 932, 939-940, 984-985
- distribution of, 929, 933-938, 946-949
- projections, 929-931
- Disputes Investigation Act, 962-963
- distribution of, 929, 933-938, 946-949
- projections, 929-931
- force 472, 927-929
- distribution of, 929, 933-938, 946-949
- projections, 929-931
- hours, 507, 510-528
- laws and working conditions, 903-909
- Lakes, 5-6
- artificial, 551-552
- Lamb—
- consumption, 400-401, 708
- exported, 564-565, 649-650, 708
- produced, 394-396, 400-402
- Lambs, 427-430
- slaughtered, 402, 510
- Land—
- Act, 279, 285-287
- classification by farm types, 390-392
- mortgages on, 857-864, 865-867, 969, 886
- development, 279-280, 287-288
- classification by farm types, 390-392
- mortgages on, 857-864, 865-867, 969, 886
- districts, 273
- classification by farm types, 390-392
- mortgages on, 857-864, 865-867, 969, 886
- drainage boards, 54
- classification by farm types, 390-392
- mortgages on, 857-864, 865-867, 969, 886
- for ex-servicemen, 287-288
- classification by farm types, 390-392
- mortgages on, 857-864, 865-867, 969, 886
- holdings, 271-273
- classification by farm types, 390-392
- mortgages on, 857-864, 865-867, 969, 886
- marginal, 279-280
- purchase of, 25, 279
- sales, control of, 279
- settlement, 25, 267-292
- Settlement Board, 287
- Settlement Promotion Act, 279
- surveys, 295-296
- tax, 728, 765-766
- tenure and settlement, 25, 267-292
- titles, registration of, 274
- transfers, 275-279, 1072, 1140
- utilisation of, 271-273
- valuation of, 296-300
- Valuation Court, 50, 239, 279, 1041
- Language, Maori and English publications, 1107
- Latest statistical information, 1129-1143,
- Law—
- and crime, 238-257, 1054
- legislation
- mortgages, 857
- legislation
- publications, 1097-1098
- legislation
- revision of, 238
- legislation
- affecting labour, 903-909
- legislation
- Lead, 465
- Leasehold landholdings, 271, 283-287
- Leases, renewable, 283-288
- Leather and leather products, 482, 484-508, 520
- Legal profession, 239
- Legations, 1049-1050
- Legislation—
- in force in January 1967, 1031-1036
- influences on, in New Zealand, 27
- labour and allied, 903-909
- passed in 1966, 761-762, 1030-1031
- Legislative authority, 43-47
- Legislative Council, 28, 43
- Legitimation, 94
- Letters, etc., posted, 354-356, 1055
- Levies by fire authorities, 894, 895
- Levy—
- coal production, 464
- dairy produce, 400
- electric power, 555
- fishing industry, 543
- honey, 575
- hospital board, 788
- meat, 572
- milk, 574
- potato, 419
- totalisator, 772-773
- wool, 404, 573
- Liabilities of—
- bankrupts, 1010-1011, 1073
- banks, 825, 826-827, 849, 1070
- building societies, 875
- electric-power undertakings, 559
- fire insurance companies, 893-894
- friendly societies, 204
- life assurance companies, 886-887
- local government, 790-791
- reserve bank, 825
- Libraries, census of, 372-373
- Libraries, publications on, 1094
- Library school, 234, 372
- Library services, 209, 234, 370-374
- Licences—
- aerodrome, 353
- by local authorities, 786-787
- drivers', 330
- export, 625
- fishing, 457
- flight crew, etc., 353
- import, 625-630
- motor-vehicle, 330-333
- petroleum prospecting, 465
- publicans, 1015
- radio and television, 360, 361, 368-369, 1139
- restaurant, 1015
- transport, 334-335
- Licensing—
- authorities (road services), 334-336
- control commission (liquor), 1014-1016
- poll, 1021-1022
- trusts, 1015-1016
- Licensing of—
- commercial air services, 345
- goods and passenger services, 333-336
- lotteries and raffles, 1013-1014
- motor vehicles, 330-333, 334
- private hospitals, 148
- sale of alcoholic liquor, 1014-1015
- Life assurance, 880-887, 899-900, 1074
- international comparison, 880
- Life expectation of, 100-102
- Lighthouses, 313
- Lignite, 460, 461
- Lime—
- industry, 482
- land top-dressed with, 409
- subsidy on transport of, 403-404
- Limestone, 458, 469
- Linen flax, 427, 480
- Linseed, 420
- Liquor licensing, 1014-1016
- Literary awards, 1091
- Literature, New Zealand, 1093-1117
- Livestock, 427-432, 1058
- slaughtering of, 402
- Loans—
- allocation of, 777
- by building societies, 871-872, 873, 874-875
- conversion of, 779-780
- dates of maturity, 779-780
- domicile of, 779-780, 1067
- forestry, 442
- hospital board, 150
- housing, 531, 539-541
- land development, 279-280
- national development, 748, 752-753, 754, 865, 868, 870
- of local government, 330, 786, 792-796, 1068, 1069
- on assurance policies, 886-887, 900
- overseas, 778, 779
- raised for war purposes, 776, 779
- redemption of, 750, 754, 788-789
- rehabilitation, 197, 866, 869
- state advances, 531, 539-540, 865-871
- supplementary, 869
- suspensory, 869, 871
- to disabled war-pensioners, 191
- Local Authorities (see under Local Government and individual names, e.g., Hospital Boards, Counties, etc.) 53-57
- number of, 54
- subsidies to, 410
- Local government, 53-55, 785-796
- advances to, 329-330, 866, 869, 871
- assets and liabilities of, 790-791
- borrowing, 791, 794-796, 1068-1069
- Commission, 54
- constitution of districts, 53
- debt of, 741, 784, 790, 791, 792-796, 1068-1069
- employees of, 796-797, 937-939, 951
- expenditure of, 730, 788-789
- finance of, 729-730, 785-796, 1068-1069
- franchise, 54
- gas supplying, 563
- health and welfare responsibilities of, 129, 132, 143-144
- history of, 52
- housing by, 540-541
- investment pool, 201-202
- levies on, by hospital boards, 788
- number of local authorities, 54
- receipts of, 730, 786-787
- roading, 329-330
- stock, 791
- subsidies and grants to, 329-330, 540, 786-787
- superannuation, 201-202
- taxation by, 774, 785-787
- urban transport operated by, 339-342
- local railway board, 787-790, 795-797
- Lockouts, 959-970
- Locomotives, 315-317
- Lodges, friendly societies, 203-204
- Logging, 442-444
- London prices for dairy produce, 576-582
- London prices for meat, 582-584
- Losses from fire, 892, 893, 894, 895, 896-898
- Lotteries, 1013-1014
- duty on, 772, 1014
- grants from profits, 145
- Lubricants and fuels, imports of, 661, 662, 667, 672
- Lucerne, 421, 422
M
- Machinery—
- accidents, 979, 982
- farm, 412
- imports of, 663, 669-670, 673
- industry, 483-508, 526-528
- safety of, 984
- used in manufacturing industries, 492-493
- Magistrates, Stipendiary, 238-239
- Magistrates' Courts, 50, 240, 241-245, 973, 1054
- Mails, 354-356, 361, 1055
- air, 346, 348, 351, 355
- Maize, 414-416
- Malaysia, reciprocal trade with, 679
- Malting barley, 418
- Management and business publications, 1107
- Mangaia Island, 2
- Manganese ore, 465
- Manihiki Island, 2
- Manuae Island, 2
- Manufacturing industries, 380, 381, 470-528, 1065
- by employment districts, 477-479
- classification of, 475, 481-483
- coal consumed in, 493-494
- expenses of operation, 502-503
- motive power, 492-493
- net output (net value added) in, 498-501, 1065
- persons engaged in, 476-489, 929, 933-935, 937-938, 946-949, 1065
- stocks, 503-504
- summary of operations, 476, 508
- wages in, 476-483, 489-492, 915-917, 1065
- Manures (see Fertilisers)
- Maori—
- Affairs, Board of, 293-294
- and English language publications, 1113-1115
- Appellate Court, 294
- apprentices, registered, 944
- death rate, 96-97
- Education Foundation, 232
- electorates, 52, 1016, 1020-1021, 1029
- housing, 540-541
- Land Court, 239, 294
- lands, 292-294
- trustee, 294
- welfare, 1007
- youths, trade training for, 942-944
- Maoris—
- births of, 87, 89
- children attending schools, 215-216
- deaths of, 87, 95-98
- employment, 932
- expectation of life, 102
- franchise, 52
- infant mortality of, 113-115
- members of parliament, 46-47, 1020-1021, 1029, 1077
- natural increase of, 87
- population, 58, 71-72
- pre-European, 24
- publications and articles on, 1084-1085, 1101, 1107, 1113-1115
- relations with early settlers, 24-25
- schools for, 209, 211, 215-216, 219
- settled on farms, 293
- Maps—
- New Zealand (end of volume)
- factory production, 478-479
- geological, 10, 11, 467
- holdings by type of farming, 391
- mineral resources, 459
- power stations, 556-557
- rainfall, 18
- Marginal land, 279-280
- Marine Department, occupational safety, 985
- Marine officers' certificates, 312, 907
- Marital status, 80-81, 121
- Market gardens, 413-415, 422-423, 912
- Marketing of primary produce, 564-585
- Marriage guidance, 127
- Marriages, 120-127, 1052
- Masseurs
- Physiotherapists
- Materials used in manufacturing industries, 475-478, 494-496, 1065
- Maternal mortality, 103, 104, 116-117, 156
- Maternal welfare, 135, 148-149
- Maternity—
- benefits, 148, 169, 170, 185
- hospitals, 148-149
- nurses, 141, 148, 185
- Mauke Island, 2, 25
- Meat—
- consumption of, 400-402, 708
- export of, 400, 564-565, 613, 633-634, 636, 637, 639, 648-651, 851, 1060, 1077, 1078
- export price index, 700
- freezing and preserving industry, 480, 510, 830, 924, 926
- industry reserve account, 585
- inspection of, 402, 405
- marketing of, 564-565, 567-573
- prices for, 582-584
- production, 400-402, 1064
- retail prices of, 685, 687, 691, 692
- Meat Producers Board, 402, 404, 572-573
- Medical—
- advertisements, 133
- benefits, 168-170, 183-187
- bursaries, 226-227
- Council, 141
- practitioners, 141, 170, 184
- publications, 1104-1105
- Research Council, 130, 140-141, 1120, 1121, 1125
- Research Endowment Fund, 141
- services, 128-167, 183-187
- statistics, 140, 151-167, 204
- Medicine, physical, 138-139
- Members of Executive Council, 1028
- Members of Parliament, 1029
- salaries of, 46-47
- superannuation of, 47, 198
- Mental—
- diseases, 162-166
- health and psychology publications, 1095
- hospitals, 160-167, 185
- Mercantile marine, 269, 301-310
- pensions, 192
- Mercury, 465
- Metal products industry, 483-508, 526-527
- Meteorological—
- observations for year, 23
- Meteorology, 14-23
- Climate
- Midwives, 140-141, 148, 185
- Migration, external, 61, 72-78, 1051, 1130
- Milage of—
- bus, etc., routes, 340
- commercial air services, 347-349
- railways, 313-315, 1056
- roads, 325
- State highways, 325
- Milage tax, 327
- Military—
- colleges, 263-264
- forces, 262-264, 266-270
- pensions, 187-196
- Milk—
- boards, 54, 787-790, 795-797
- consumption, 708
- dried and condensed, exports of, 636, 637, 653, 1062
- dried and condensed, production of, 399
- in schools, 221
- marketing of, 574
- subsidy, 574, 712
- Milk products
- Dairy produce
- Milking machines, 412
- Minerals and mineral production, 458-469, 482
- Miners' benefits, 169, 173, 179
- Mines Department, 458, 985
- Mining and quarrying, census of, 469
- Mining, 380, 381, 458-469, 777
- accidents, 462, 464, 977, 978
- disputes, 966-967
- legislation, 458-459
- persons engaged in, 462-463, 937
- state aid to, 467
- value of production, 458
- Ministers of each church and marriages by, 124
- Ministers of the Crown, 1026-1028
- Ministries, successive, 1026-1027
- Minors, marriages of, 123
- Mitiaro Island, 2
- Monarch, the, 43
- Monetary and Economic Council, 76, 685, 856
- Monetary, Banking, and Credit Systems, Royal Commission on, 855
- Monetary policy and savings, 833-834
- Money orders, 356, 1055
- Money, volume of, in circulation, 833
- Morbidity, 151-159, 204
- Mortality
- Deaths
- Mortgage exemption, 765
- Mortgage guarantee scheme, 866
- Mortgages, 202, 840, 857-864, 865-867, 869, 886, 1072, 1140
- discharged, 864
- rates of interest on, 857, 860-862, 863, 865, 867, 1072
- sources of finance, 863-864, 865-866
- state advances, 865-871
- Motels, 1003, 1004
- Mothers—
- ages of, 91-94
- in ex-nuptial cases, 94
- average issue of, 92
- previous issue, 92
- Motor body building and repairs industry, 483, 526
- Motor spirits—
- consumption of, 332
- imports of, 667, 672
- retail price of, 685
- taxation on, 327, 333, 677, 749, 757-758
- Motor vehicles—
- accidents, 103, 104, 117-118
- assembly of, 483, 526
- drivers' licences, 330
- duty on, 667
- imports of, 670, 673
- insurance, 887, 889-891
- Post Office, 362
- registration and licensing of, 330-333
- repairs industry, 483, 526
- taxation, 327-330, 728, 758
- traffic offences, 242, 243-244, 337-338
- value of hire purchase sales, 610, 612
- Motor-engineering industry, 483, 526-527
- Motorways, 329
- Mountains, 2-4, 7-12, 1005
- heights of peaks, 3
- Multiple births, 90-91
- Murder, 103, 104, 117, 158, 246
- Museums, 225, 1087, 1089-1090
- Music in New Zealand, publications on, 1108
- Mussels, 453
- Mutton—
- consumption of, 400-401, 708
- exported, 564-565, 649-650, 708
- produced, 394-396, 400-402, 510
- retail prices of, 685
- Mutual insurance associations, 898
N
- Narcotics, 133
- Nassau Island, 2
- Nassella tussock boards
- Tussock boards
- National—
- accounts, 713-746
- central division, 371
- Airways Corporation, 343, 345-347, 777, 1004, 1043
- central division, 371
- Archives, 1092
- central division, 371
- Art Gallery, 1087-1088
- central division, 371
- development loans, 748, 752-753, 754, 865, 868, 870
- central division, 371
- employment services, 932
- central division, 371
- Film Library, 224
- central division, 371
- Health Institute, 140
- central division, 371
- income and expenditure, 713-731, 757
- central division, 371
- Library of New Zealand, 209, 234, 370-374
- central division, 371
- licensing poll, 1021-1022
- Military Service Act, 259
- parks, 288-292
- Provident Fund, 200-203
- Research Advisory Council, 1120-1125
- Roads Board, 54, 326-330
- Roads Fund, 326-330, 748
- Safety Association, 985, 987
- savings, 836
- song, 1024
- Nationality, 77-79
- of registered aliens, 78
- Native animals, birds, and fish, publications on, 1103-1104
- Native bush, 273, 333-338
- Natural gas, production of, 465-466, 562
- Natural increase of population, 58, 73
- Naturalisation, 77-79
- Nature Conservation Council, 292
- Nauru Island, 999
- Naval—
- bases, 260
- defence, 260-262, 268
- vessels, 260
- Navigational aids, air, 345
- Netherlands, immigration from, 75, 76, 78
- New Zealand—
- Apple and Pear Marketing Board, 573-574
- Ballet Company, 1086
- books, 1093-1117
- Broadcasting Corporation, 363-366, 777, 1043
- Dairy Board, 398-400, 402, 404, 572
- Drama Council, 1086
- Egg Marketing Authority, 575
- Electricity Department, 550-561, 951
- forest products, 446
- life and scenery, publications, 1113-1114
- Literary Fund, 1086, 1091
- mean time, 1022
- Meat Producers Board, 402, 404, 572-573
- Milk Board, 574
- Opera Company, 1086
- Players, 1086
- Red Cross Society, 143
- representation overseas, 1048-1049
- Road Safety Council, 337
- Standard Time, 1022-1023
- territory overseas, 1, 2, 31, 34, 234, 988-999
- Wool Board, 404, 573
- Wool Commission, 404, 565, 573, 576, 741
- Newspapers, 369-370
- produced, 509
- registered, 356
- Newsprint—
- exports of, 309, 451, 635, 637, 640, 658
- imports of, 450
- production, 445-446
- Niue Island, 1, 2, 24-25, 29, 31, 34, 59, 75, 77, 85, 660, 674, 988, 994-996
- Note issue, 823, 825, 832, 833, 847
- Notes in circulation, 832, 1070
- Noxious animals, 440
- Nukunono Island, 2, 25, 996-997
- Nullity of marriage, 125-127
- Nurseries, plant, 423
- Nurses—
- dental, 136-137, 187
- in public hospitals, 148
- industrial, 134
- male, 141
- maternity, 141, 148
- Plunket, 134, 143
- psychiatric, 141
- public health, 134, 148
- registration of, 141-142
- training of, 139-140
- war casualties, 269
- Nursing, 139-140, 141, 182
O
- Oatmeal, etc., 512, 710
- Oats, 414-416, 418, 1057
- Observatory, time signals from, 1022-1023
- Occupational—
- classification of population, 947-949
- of bankrupts, 1012
- health, 133
- of bankrupts, 1012
- safety, 984-987
- of bankrupts, 1012
- status, 945
- of bankrupts, 1012
- therapy, 138-139, 142
- Occupations of married women, 949-950
- Occupations of school-leavers, 219
- Offences, 241-245, 337-338
- by children, 247-249
- by women, 241-245, 247
- Office machines, imports of, 6·7, 673
- Officers' Certificates (Marine) 312
- Offices Act, Shops and, 906
- Official representation, 1048-1050
- Oil drilling and prospecting, 465-466
- Oil refinery, 301
- Ombudsman (Parliamentary Commissioner), 48, 1045-1046
- Onions, 414-416, 420
- exports of, 636, 638
- Opossum skins exported, 636, 637
- Opticians, registration of, 142
- Oranges, imports of, 666, 671
- Orchards, 273, 413-415, 424-426, 912
- Orchestras, N.Z.B.C., 366
- Orphans benefits, 169, 173, 175-176
- Ottawa Agreement, 676, 678
- Occupations—
- industrial, of population, 947-949
- of married women, 949-950
- Outlying islands, 1
- Outpatients, 147, 148
- Overdraft authorities, unexercised, 832
- Overdraft rates, 844
- Overseas—
- exchange transactions, 850-855
- reserves (banks), 825, 827, 848-850, 1070
- territories, 1, 2, 31, 34, 234, 988-999
- war service, persons with, 269-270
- Overtime, 507, 510-528, 915-917
- Owner-occupied houses, rental value of, 713-717, 718, 725, 726
- Oysters, 453, 456
P
- Pacific Islands
- publications dealing with, 1117
- Paint and varnish industry, 482, 509, 522
- Painting in New Zealand, publications on, 1108
- Palmerston Island, 2
- Paper and paper products industry, 445-447, 481, 484-508, 518-519
- Paper and pulp, external trade in, 309, 451-452
- Parcels post, 355
- Parents—
- ages of, 91-94
- births by duration of marriage, 93
- previous issue of, 92
- Parks, National, 288-292
- Parliament, 43-49, 1029, 1030-1031, 1076-1083
- Members of, 1016-1021
- Parliamentary—
- Commissioner (Ombudsman), 48, 1045-1046
- elections, 44-45, 1016-1021
- Parole boards, 251, 252-253
- Passenger services—
- railway, 319-320
- road, 333-336
- Passengers—
- buses, etc., 339-342
- commercial aircraft, 346-348
- overseas, 72-74, 77, 304, 1051
- railway, 319-320, 1056
- shipping, 304, 305
- Pastoral produce—
- consumed locally, 397, 400, 401, 708-710
- export of, 613, 633, 635-639, 648-658, 1060-1063
- Pasture grasses, 273, 408-409
- Patents, designs, trade marks, 1009
- Patients in hospitals, 147-148, 153-159
- Patients in mental hospitals, 161-167
- PAYE taxation, 762-765, 1081
- Payments, balance of, 731-746
- Payments, overseas, exchange transactions, 851, 852
- Pears, 413-415, 424-425
- export of, 425, 636, 638, 1062
- marketing of, 425, 573, 574
- Peas, 414-416, 419, 1057
- export of, 636, 638, 657
- Pelts
- Hides, pelts, and skins
- Penal system, 249-253
- Penrhyn (Tongareva) Island, 2
- Pensioners' flats, 144
- Pensions—
- social security, 169, 171-183
- war, 187-196
- Perinatal mortality and prematurity, 103, 104, 116
- Periodic detention, 250
- Perlite, 466
- Permanent heads of Government Departments, 1041-1042
- Permits, building, 532-536
- Petitions—
- bankruptcy, 1010
- divorce, 125-126
- Petrol
- Motor spirits
- Petroleum, 458, 465-466, 468, 469
- imports of, 661, 662, 667, 672
- industry, 482, 484-508
- Pharmaceutical benefits, 169, 170, 185
- Pharmaceutical chemists, 142, 170
- Pharmaceuticals, manufacture of, 482, 522
- Pharmacy Board, 142
- Phormium, 273, 427
- industry, 480
- Phosphate rock, 466, 521,
- from Nauru Island, 999, 1019
- imports of, 667
- Phthisis
- Miners', 179
- Physical welfare and recreation, 145
- Physiography, 1-23
- Physiotherapists, 138-139, 142
- Physiotherapy benefits, 170, 186
- Pig-meats—
- consumption of, 400-402, 708
- exports of, 708
- prices for, 584
- production of, 400-402
- Pigs, 394-396, 428-429, 431, 1058
- slaughtered, 402
- Pilots, air, 353
- Placement service, 932, 940
- Plaints, 240
- Planing mills, 481, 517
- Planning, town and country, 55-57
- Plantations, 273, 415, 422-423, 433-441
- Platinum, 465
- Plumbers, registration of, 142
- Plunket nurses, 134, 143
- Plunket Society, 143, 184
- subsidies to, 130
- Plywood and veneer, 447, 481, 524, 635, 637
- Poems, publications of, 1109-1110
- Poisoning, 131, 133, 151, 155-159, 979
- Poisons, 133
- Police, 236, 256-257, 908
- superannuation, 197-199
- Policies, insurance, 880-885, 892, 899, 1074
- Poliomyelitis, 103, 104, 131, 135, 152
- vaccination, 135
- Polling at—
- general elections, 1016-1021
- licensing poll, 1021-1022
- Pollution, air, 132
- Population, 58-86, 1051
- age distribution of, 83-84
- birthplaces of, 85-86
- country of birth, 85-86
- density of, 70-71
- distribution of, 62-71
- industrial distribution of, 946-947
- international comparisons, 60, 73
- Maori, 71-72
- projections, 61-62
- racial origins of, 84-85
- sex proportions of, 70
- urbanisation of, 68-70
- world, 86
- Pork
- Pig-meats
- Portfolios of Ministers, 1028
- Ports—
- fishing, 455
- of arrival and departure, 304
- shipping and trade of, 301-310, 659, 674
- Post Office, 354-362, 781, 1055
- debt, 777
- superannuation of, 197-199
- employees, 362, 1043, 1055
- superannuation of, 197-199
- wages and hours worked of, 916
- interest on capital liability, 361, 749
- Savings Bank, 748, 835-838, 845, 1071
- Staff Tribunal, 908, 911
- work performed for other departments, 361-362
- Potato Board, 574
- Potatoes, 413-416, 419-420, 574, 1057
- consumption of, 709
- export of, 636, 638
- levy on, 419
- marketing of, 419-420
- Pottery, china, and earthenware industry, 482, 523
- Poultry, 431-432, 1076
- consumption of, 710
- Pounamu (greenstone), 466
- Power—
- boards, 54, 554-555, 558, 787-790, 795-797, 1069
- development of, 550-553, 1082
- generation and supply, 550-561
- review of operations, 557-561
- technology and industry publications, 1118
- used in manufacturing, 492-493
- Preferential tariff, 675-682
- Pregnancy, diseases, etc., of, 116-117, 181
- deaths from, 103, 104, 156
- Premiums, insurance—
- accident, 888-891, 900-901
- fire, 892-893, 894, 895, 898, 900-901
- life, 881-885, 899
- motor vehicle (third party), 889-891
- Pre-school education, 209, 211
- Preserved meats, etc., production of, 510
- Preventive detention, 250-251
- Price Tribunal, 683
- Prices, 683-707
- basic, for dairy produce, 580-582
- index numbers, 696-699, 706-707
- comparisons with other countries, 687-688
- index numbers, 696-699, 706-707
- export, 576-579
- index numbers, 696-699, 706-707
- export, indices of, 699-702, 706-709
- index numbers, 696-699, 706-707
- import, indices of, 702, 706-707
- index numbers, 696-699, 706-707
- of New Zealand stocks, 781
- index numbers, 696-699, 706-707
- retail, 685-687
- index numbers, 696-699, 706-707
- index numbers, 688-696, 706-707.
- index numbers, 696-699, 706-707
- stabilisation of, 683-685
- index numbers, 696-699, 706-707
- Trade Practices Act, 683-684
- index numbers, 696-699, 706-707
- wholesale, 688
- index numbers, 696-699, 706-707
- Prices and Trade Practices Commission, 683
- Primary products—
- consumption of, 397, 400, 401, 708-710
- by ports, 309
- export of, 613, 633, 635-639, 648-658, 1060-1063
- by ports, 309
- marketing of, 564-585
- Primary schools, 206, 209, 211, 213-216
- Prime Ministers, successive, 1026-1027
- Principal events, 1076-1083
- Printing and publishing industry, 481, 484-508, 519
- Prisoners of war, 269
- Prisons and prisoners, 250-256, 1054
- Private—
- assignments, 1010
- income, 713-719, 722-726
- savings banks, 838, 845
- schools, 208-209, 216-217, 1053
- Privy council, 239
- Probation of offenders, 243, 246, 249-250, 253
- Production, 380-386
- building materials, 523
- clothing, 481, 484-508, 516-517
- dairy, 397-400, 1064
- farm, 394-404, 411-418
- fisheries, 453-456
- index numbers of, 380-381, 383
- local consumption of, 397, 400, 401, 708-710
- manufacturing industries, 470-528, 1065
- meat, 400-402, 510-511, 1064
- mineral, 458, 463, 464, 466, 467, 469
- pulp and paper, etc., 445-447
- timber, 442-448, 517-518, 1064
- value of (see gross domestic product)
- volume of, 380-381, 472
- wheat, 417-418
- wool, 394-396, 403-404, 1064
- Productivity index, 382
- Projections—
- labour force, 929-931
- permanent private dwellings, 532
- population, 61-62
- school population, 211-212
- Promotion of employment, 932, 942-944
- Properties transferred, 274-279
- Proprietors, working, 934-935
- Protection of wages, 912
- Psychology and mental health publications, 1095
- Public—
- accounts, 747-784
- interest on, 714, 717, 720, 729, 748
- repayment of, 783
- administration and government, publications on, 1098-1099
- interest on, 714, 717, 720, 729, 748
- repayment of, 783
- authority sector of national income and expenditure, 727-730
- interest on, 714, 717, 720, 729, 748
- repayment of, 783
- debt, 741, 748, 750, 775-784, 779, 781-782, 783, 1067
- interest on, 714, 717, 720, 729, 748
- repayment of, 783
- finance, 747-784, 1066-1067
- health, 128-145
- holidays, 905, 1024
- schools, 206-221
- Public Service, 907, 1044-1045
- employees, 1043
- superannuation, 197-199
- Public Trust Office, 1008
- Public works—
- employees, 951
- occupational safety, 986-987
- railway construction, 315-317
- road construction, 324-330
- services, maintenance of, 751
- Publicans' licences, 1015
- Publications—
- A Descriptive Atlas of New Zealand, 12, 387
- Bibliography of New Zealand, 1093-1117
- Education, Department of, 225, 1016
- Labour and Employment Gazette, 932
- Lands and Survey, Department of, 296
- New Zealand flora and fauna, 1103-1104, 1107
- New Zealand Forest Service, 451
- New Zealand Gazette, 337
- New Zealand Listener, 366
- overseas representatives in New Zealand and New Zealand representatives overseas, 1048
- register of newspapers, 356
- Statistics, Department of, 617, 624, 1095-1096
- Publishing and printing industry, 481, 484-508, 519
- Puerperal infections and causes of death, 103, 104, 116-117, 131, 151, 152, 156
- Pukapuka (Danger) Island, 2
- Pulp and paper industry, 445-447, 472, 481, 518
- export of, 309, 451, 635, 637, 639-640, 657-658, 1061
- import of, 450, 662, 667, 668, 672, 673
Q
- Qantas Empire Airways, 343-344, 350
- Quarries, 458, 469, 907
- accidents at, 977, 978
- persons engaged in, 937
- safety in, 907
- Quarrying and mining, census of, 469
- Quartz mining, 464
- Queen Elizabeth II Arts Council, 1086-1087
- Quick-frozen foods industry, 709
R
- Rabbit boards, 410, 787-790, 795-797
- number of, 54
- Rabbits, destruction of, 349
- Racial origins of population, 84-85
- Racing taxation, 749, 755, 772-773
- Radiation protection, 134, 138
- Radio and television, 362-369
- advertising, 362-366
- assembly and manufacture of sets, 483, 509, 525
- licences, 360, 361, 368-369
- Radio—
- beacons, 313
- communication, 360
- New Zealand, 364
- stations, 360, 363-365
- time signals, 365, 1022-1023
- Radioactivity, protection against, 138
- Radiologists, 138
- Radiotelephone services, 360
- Raffles, 1013-1014
- Railcars, 315-317, 1004
- Rail traffic—
- goods, 321
- passenger, 319-320
- Railway, equipment, imports of, 670
- Railways, 313-324, 752, 753, 1004, 1056, 1077, 1078
- accidents, 118, 158, 323, 336
- air freight service, 348
- debt, 777
- employees, 323
- licensing protection, 334-335
- private, 323
- revenue and expenditure, 317-319, 753, 1056
- road-rail ferry service, 315
- road services, 323
- superannuation, 197-199
- Tribunal, 323, 908
- wages and hours of employees, 925
- Rainfall, 16-18, 23, 280-281
- Rakahanga (Reirson) Island, 2
- Rangemaking industry, 483, 525
- Ranges
- Mountains
- Raoul Island, 1, 14, 988
- Rape, kale, and chou moellier, 421
- Rarotonga Island, 11, 2, 989
- Cook Islands
- Rates, local government, 730, 774, 785-787
- valuation for, 297-298, 300
- Rates of exchange, 823, 847-848
- Rates of interest—
- on company deposits, 843, 844
- on fixed deposits, 845
- on local government debt, 796
- on mortgages, 857, 860-862, 863, 865, 867, 1072
- on public debt, 779, 781-782
- on small savings, 836, 837, 845
- licensing protection, 334-335
- on stock and station agents' deposits, 841
- paid by savings banks, 837
- Rates of tax, 758-768, 814
- Receipts, overseas, exchange transactions, 851, 852
- Reciprocal tariff and trade, 678-682
- Recreation and physical welfare, 145, 439
- Recruiting—
- Air Force, 265
- Army, 263
- Navy, 261
- Police, 257
- Red Cross Society, 143
- Redemption of loans, 750, 754
- Re-exports, 659-660.
- Refrigerators, 509, 528
- Registrars, marriages before, 120, 124
- Registration of—
- adopted children, 94
- aircraft, 353
- aliens, 78-79
- apiaries, 432
- apprentices, 941-942, 944
- births, 88
- building societies, 871-875
- chemists, 142-143
- companies, 876-878, 1073
- deaths, 95-96
- deeds, 857
- dentists, 141
- designs, 1009
- dietitians, 141
- electors, 51, 1016-1021
- employers' unions, 954, 955, 958
- ex-nuptial births, 93-94
- friendly societies, 203
- land titles, 274
- land valuers, 300
- male nurses, 141
- Maori apprentices, 944
- Maori deaths, 95
- Maori electors, 52
- marriages, 120, 124
- maternity nurses, 141
- medical practitioners, 141
- midwives, 140-141
- mortgages, 857-863, 1072
- motor vehicles, 330-333
- newspapers, 356
- nurseries, 423
- nurses, 141-142
- nursing aids, 141
- occupational therapists, 141
- opticians, 141
- patents, 1009
- physiotherapists, 141
- plumbers, 141
- private schools, 208-209, 216-217
- psychiatric nurses, 141
- psychopaedic nurses, 141
- still-births, 95
- trade marks, 1009
- trade unions, 953
- unemployed, 944
- vessels, 312
- Regulation of prices, 683-685
- Rehabilitation, 196-197, 728, 866, 869
- disabled civilians, 139
- land settlement, 286-288
- Religious professions, 82-83
- marriages by ministers of, 120, 124
- publications on, 1095
- Renewable leases, 283-288
- Rental cars, 331
- Rental value, owner-occupied houses, 713-717, 718, 725, 726
- Rents, 545-546, 685
- stabilisation of, 549
- Repayment of public debt, 783
- Representation Commission, 44, 46, 50
- Representation in New Zealand, 1049-1050
- Representation overseas, 1048-1049
- Representatives, House of, 1029, 1030
- House of Representatives
- Reproduction index, 89-90
- Research, 1118-1125
- agricultural, 405-409, 1119
- antarctic, 998, 1081
- coal, 460, 468
- crop, 406-408, 1121
- dental, 138
- educational, 232
- forestry, 439, 441
- fruit, 407
- grassland and grasses, 406-409
- hops and tobacco, 406, 1121
- medical, 141, 1120, 1122-1123
- mining, 460-461
- oil, 465-466, 468
- plant, 406
- scientific and industrial, 473-475, 998, 1118-1125
- soil 406-407
- wheat, 406-408, 417-418, 1121
- wool, 404, 1121
- Research associations in industry, 474
- Reserve Bank, 27, 821-825, 847, 849, 853, 1000, 1079
- Reserve ratio bank advances, 831
- Reserves—
- air force, 266
- farm industry, 585
- military, 264
- naval, 261
- overseas (banks), 848-850
- public or scenic, 288-292
- Restaurant licences, 1015
- Restrictions on employment, 905-907
- Retail prices, 683-687
- index numbers, 688-696, 706-707
- Retail trade, 585-592, 597-598, 599-605
- Retailers, bank advances to, 830
- Revenue—
- broadcasting and television, 366-368
- cinemas, 376
- customs, 678, 748, 749, 755, 757
- electric power, 558, 560
- forest service, 442-451
- Government (see Government finance)
- insurance companies, 883, 885, 888, 894-895, 899, 902, 1074
- local government, 329-330, 730, 786-787
- National Roads Fund, 327-330, 748, 749, 754, 755, 757-758
- Post Office, 361
- railway, 317-319, 753, 1056
- urban transport, 339-342
- Rheumatism, 138
- River boards, 54, 787-790, 795-797
- Rivers, 4-5
- control of, 280-282
- hydro-electric development on, 550-551
- Road—
- accidents, 103, 104, 117-118
- bridges in, 325
- boards, 54
- bridges in, 325
- districts, 327, 786-797
- bridges in, 325
- safety, 337-339
- services, 318, 323-324, 335, 339-342
- transport, 324-342
- Tunnel Authority, 54, 326, 787-790, 795-797
- Roads, 325-330
- expenditure on, 328-330, 754, 777
- Rolling stock, railway, 315-317
- Roman Catholic schools, 208-209, 217
- Ross Dependency, 1, 2, 59, 296, 988, 997-999
- whaling, 999
- Royal New Zealand Air Force, 264-266, 348-349
- Royal New Zealand Naval Volunteer Reserve, 261
- Royal New Zealand Navy, 260-262, 268
- Rubber products, 482, 484-508, 520
- Rural—
- education, 220-221
- intermediate credit associations, 866-867
- mail deliveries, 355
- mortgages, 859-860, 862-864, 865-866
- population, 68-69
- reticulation council, 555
- Ryegrass, 421-422
S
- St. Helens Hospitals, 148
- St. John Ambulance, 143
- Safety of machinery, 948
- Safety of workers, 906, 984-987
- Salaries and wages, 717-719, 722-726, 798, 801, 809, 814, 913, 1065
- electric supply employees, 558
- gas employees, 563
- in manufacturing, 476-483, 489-492
- in retail trade, 590, 594, 595
- Salaries of members of—
- Executive Council, 46-47
- House of Representatives, 46-47
- Sales Tax, 728, 748, 773-774
- Salt, 458, 467, 473
- Samoa
- Western Samoa
- Sanatoria, 147
- Sanctuaries, bird and other wildlife, 291, 292
- Sand and gravel, 458
- Sand dunes, stabilisation of, 440
- Sanitation, 129-130
- Sausages, casings, export of, 636, 637, 651
- Savings—
- accounts and bonds (National), 834, 835
- banks, 834-840, 845, 1071
- private, 715/717, 719, 721
- small, 834-840, 845
- Sawmills, etc., 442-444, 481, 517
- wages and hours of employees, 924, 926
- Scholarships—
- for Pacific Islanders, 234
- university, 226
- School—
- Certificate, 207, 213, 217
- ages of, 214
- teachers
- intended occupations of, 219
- teachers
- medical examinations of, 134
- teachers
- milk for, 221
- teachers
- roll numbers of, 211-212
- teachers
- transport and board of, 220-221
- teachers
- children, 211-212, 1053
- ages of, 214
- teachers
- intended occupations of, 219
- teachers
- medical examinations of, 134
- teachers
- milk for, 221
- teachers
- roll numbers of, 211-212
- teachers
- transport and board of, 220-221
- teachers
- committees, 205
- teachers
- correspondence, 211, 221, 1053
- teachers
- dental service, 137, 186-187
- teachers
- inspectors, 214, 217
- teachers
- Journal, 225
- teachers
- Library Service, 234, 372
- teachers
- Savings Bank, 837-838
- teachers
- teachers
- teachers
- Schools—
- broadcasts to, 224,
- consolidation of, 220
- correspondence, 221, 230, 1053
- denominational, 208-209
- free textbooks for, 224
- military, 264
- primary, 206, 211, 212, 213-217, 220, 1053
- private, 208-209, 216-217, 1053
- secondary, 206-212, 217-219, 220, 1053
- special, 208, 209, 211
- technical, 209-211, 218, 219, 228, 230-231, 1053
- Science publications, 1102-1103, 1125
- Scientific and Industrial Research, Department of, 408-409, 473-474, 998, 1118-1125
- Scientific research in New Zealand, 473-475, 1118-1125
- Sea fisheries, 452-457
- Seals, 456
- Seamen, 907
- Seamen Act, Shipping and, 907
- Secondary education, 217-219
- duration of, 218
- Securities, Government and other, 827, 840, 849, 850, 854, 855, 869, 870, 894, 900
- Seed certification, 421
- Seed sowing, aerial, 349
- Seeds, grass and clover, 421-422
- exported, 636, 638, 657, 1062
- Self employed, incomes of, 798, 800, 807-808, 809
- Sentences on criminals, 243-246, 249-251, 255, 1054
- Separation, judicial, 125, 126
- Serpentine, 458, 466, 521
- Service establishments (trade) 595, 597-598
- Service-car licences, 331
- Servicemen—
- casualties on active service, 268-269
- dependants of, 188-196
- registration of deaths of, 95
- Services—
- Air Force, 259, 264-266, 267-268
- Army, 259, 262-264, 267-268
- Navy, 259, 260-262, 268
- Services sector of economy, 380-381
- Settlement of industrial disputes, 959-960, 968-969
- Settlement of land, 271-273
- Settlement, ex-servicemen's, 196, 286-288
- Settlement, small farms, 283
- Sex proportions of population, 70
- Sexes of—
- children born, 90
- factory employees, 486-492, 507
- patients in mental hospitals, 162
- patients in public hospitals, 154
- prisoners, 254
- Sexual offences, 251, 242, 246, 248
- Share prices, index numbers, 703-705, 706-707
- Shares in building societies, 871-873
- Shearers' wage rates and amenities, 907, 925
- Sheep, 472-430, 1058, 1076
- and lambs slaughtered, 402, 510
- fanning, 387-396, 400-404
- skins and pelts exported, 636, 655
- Sheetmetal working industry, 527
- Shipping, 301-313
- on inland waters, 310
- Shipping and Seamen Act, 907
- Ships
- Vessels
- Shoe and boot industry, 481, 517
- Shops, 587-594
- and Offices Act, 906
- fire losses on, 898
- Short-wave radio broadcasting, 364
- Sick funds, 204, 361
- Sickness, 151-167
- benefits, 169, 173, 180-181
- insurance, 204, 887, 889
- Silage, 416-421
- Silver, 458, 465
- Silviculture, 437-440
- Ski-ing, 1005
- Skins
- Hides, pelts and skins
- Slaughter of animals for food, 402
- Snares Islands, 1, 988
- Snow, 19
- Soap industry, 482, 509, 521
- Soaps, export of, 636, 638
- Social science and welfare publications, 1095-1096
- Social Security, 168-187, 1079
- annual appropriations, 748, 751
- benefits, 168-187, 714, 718, 722-726, 751
- fund, 747
- reciprocity with other countries, 168, 182-183
- supplementary assistance, 169, 173, 182
- taxation, 168-169, 728, 748, 749, 755, 756, 758-765, 804, 812, 813
- Social services, expenditure on, 748, 751
- Soil Bureau, 406
- Soil conservation, 280-282
- Soils, 387-389
- Solander Island, 1, 988
- Soldiers, 262-264, 266-270
- Sources of income, 798-802, 807-809
- South-East Asia Treaty Organisation (SEATO), 31, 37-39, 260
- Southern Alps, 3, 8, 9, 19
- South Pacific Airlines of New Zealand, 347
- South Pacific Commission, 34
- Souvenirs, 1004-1005
- Sovereignty, 28-29
- Spas, 1005-1006
- Specialist services, 170
- Specie, movement of, 624, 1059
- Speed limit, 337
- Spirits—
- consumption of, 710
- duty on, 677
- imports of, 671
- Sports, 145
- publications on, 1108-1109
- Stabilisation of prices, 683-685
- Stamp duties, 749
- Standard time, 1022-1023
- Standards Council, 1013
- Standards of living, international indicators of, 1013
- State—
- Advances Corporation, 531, 539-541, 864-871
- accident, 900-901
- earthquake and war damage, 901,-902
- fire, 900-901
- life, 899-900
- Commission, 986, 1043-1044
- coal mines, 460, 461-463, 753, 777
- accident, 900-901
- earthquake and war damage, 901,-902
- fire, 900-901
- life, 899-900
- Commission, 986, 1043-1044
- departments, 49-50
- accident, 900-901
- earthquake and war damage, 901,-902
- fire, 900-901
- life, 899-900
- Commission, 986, 1043-1044
- finance, 727-730, 747-784, 1066-1067
- accident, 900-901
- earthquake and war damage, 901,-902
- fire, 900-901
- life, 899-900
- Commission, 986, 1043-1044
- forests, 433-442, 777
- accident, 900-901
- earthquake and war damage, 901,-902
- fire, 900-901
- life, 899-900
- Commission, 986, 1043-1044
- housing, 529-531, 535-537, 541-543, 752-753, 868
- accident, 900-901
- earthquake and war damage, 901,-902
- fire, 900-901
- life, 899-900
- Commission, 986, 1043-1044
- indebtedness, 741, 748, 750, 775-784, 1067
- accident, 900-901
- earthquake and war damage, 901,-902
- fire, 900-901
- life, 899-900
- Commission, 986, 1043-1044
- insurance—
- accident, 900-901
- earthquake and war damage, 901,-902
- fire, 900-901
- life, 899-900
- Commission, 986, 1043-1044
- placement services, 932, 940
- Commission, 986, 1043-1044
- State services, 907, 1042-1045
- Commission, 986, 1043-1044
- wards, 236
- Statistical areas, 63
- area and population of, 63
- cinemas in, 376-377
- crops grown in, 414
- density of population in, 71
- industrial production by, 476
- livestock in, 429
- retail trade in, 587-593
- Statistical—
- information, latest, 1129-1143
- publications, 617, 624, 1095-1096
- summary, 1051-1075
- Statute of Westminster, 28, 33, 43
- Statutes—
- enacted during 1966, 1030-1031
- in force, 1967, 1031-1036
- Steam electric power stations, 550, 552
- Steel and iron, imports of, 669, 672
- Steel industry, 483, 527
- Sterling exchange rates, 847-848
- Sterling values of currency, 847-848
- Stewart Island, 1, 68
- Still-births, 91, 95, 115
- Stock and station agents—
- advances to, 830
- deposits, etc., with, 840-842
- Stock, quotations for, 781
- Stock, registered, local government, 791
- Stocks—
- manufacturers', 503-504
- retail, 587-592, 602,
- wholesale, 593-594, 606-607
- Stones, building and ornamental, 458, 467
- Stoppages, industrial, 963-970, 1075, 1080
- Stranding of vessels, 313
- Strikes, 959-970, 1075, 1080
- Students, 211-212, 1053
- Students, university, 207, 211, 227-229, 1053
- Studentships, secondary teacher, 223
- Submarine power cable, Cook Strait, 550, 552
- Subscribers, telephone, 357-358
- Subsidies—
- agricultural, 410
- highways, 327-330
- on butter, 712
- on transport of fertiliser, 410
- on food, 574-575, 712
- soil conservation and rivers control, 281
- superannuation fund, 753
- to gasworks, 562, 712
- to hospital boards, 149
- to local government, 329-330, 786-787
- to mining, 467
- Suffrage, 46, 51-52
- Sugar—
- consumption of, 710-711
- duty on, 677
- imports of, 662, 666, 671
- international agreement, 681-682
- used by factories, 512-514
- Suicides, 103, 104, 119, 158
- ages of, 119
- Sulphur, imports of, 667, 672
- Sulphur used in fertiliser industry, 521
- Summary convictions, 241-245
- Superannuation—
- government, 197-199, 661, 753
- private funds, 200
- social security 171, 172, 173-174
- Superphosphate and fertiliser industry, 482, 521
- Supreme Court, 50, 240, 245-246, 1041, 1054
- Survey of companies with overseas affiliations, 742-746
- Survey system, land, 295-296
- Surveys—
- aerial, land, 295-296
- employment, 932-939
- geological, 467-469
- of ships, 312
- standard, land, 295
- tidal, 295
- Suwarrow (Anchorage) Island, 2,
- Sweepstakes, 1014
- Swimming, 117
T
- Takutea Island, 2
- Tallow exported, 309, 636, 638, 653-654, 1060
- Tallow produced, 510
- Tanning industry, 482, 520
- Tariff and Development Board, 631
- Tariff, Customs, 675-682
- Tariffs and Trade Agreement (GATT), 567, 569, 680, 681
- Tasman Empire Airways Ltd. (see Air New Zealand)
- Tasman Pulp and Paper Co., 446
- Tax, income, 728, 748, 798-820
- Tax, land, 728, 765-766
- Taxation, 713-719, 727-730, 755-774, 798-820, 1134
- amendments to legislation, 761-762
- amusement, 755, 772
- companies, 759, 804, 812-818
- customs, 675-678, 728, 749, 755, 757
- direct, 713, 719, 720, 722-724, 727-730, 749, 755, 757, 758-765, 798-820
- film hire, 755
- forest 442
- highways 327-330 749, 755, 757-758
- indirect, 714, 717, 720, 728, 730, 749, 755, 757, 758
- local government, 728, 774, 785-787
- motor spirits, 327, 333, 677
- motor vehicles, 327-330, 728, 758
- racing, 749, 755, 772-773
- roads, 327-330
- sales, 728, 748
- social security, 168-169, 728, 748, 804, 812, 813
- Taxis, 331, 335
- Taxpayers, incomes of, 804-818
- Tea—
- consumption of, 710
- duty on, 676
- imports of, 667, 671
- Teacher studentships, 223
- Teachers, 222-224
- primary school, 223
- secondary school, 224
- superannuation, 197-199
- training of, 222-223
- Teaching aids, 224
- Technical Correspondence Institute, 231-232
- Technical education, 230-231
- Education
- Schools
- Technical Education, Council for, 232
- Technology, publications on, 1105
- Telecommunications, 360
- Telegraph services, 356-360
- Telephone services, 356-360
- Television, 362, 365-366
- stations, 366
- value of sets sold on hire purchase, 611, 612
- Television and radio assembly and manufacture, 483, 509, 525
- Telex (teleprinter) services, 359
- Temperature, 19-23
- Tenancy Act, 549
- Tenancy and rents, 549
- Tenure—
- of Crown lands, 282
- of dwellings, 546, 549
- of occupied land, 271-272, 283-287
- Territorial Air Force, 264
- Territorial Forces (Army) 262-264
- Tetanus immunisation, 135
- Textbooks in schools, free, 224
- Textiles, production of, 480, 484-508, 515-516
- Theatres, etc., fire losses on, 898
- Theft, 242, 246-248
- Therapists, occupational, 142, 160
- Thermal activity, 12, 1005
- Third-party risks insurance, 333, 889-891
- Three Kings Islands, 1, 988
- Thrift club accounts, Post Office Savings Banks, 837
- Timber, 433-451
- exports of, 309, 449, 635, 637, 658
- imports of, 449
- output, 442-448, 517-518, 1064
- plantations, 273, 415, 422-423, 433-441.
- preservation of, 447-448
- resources, 434-436
- Time service (radio), 365, 1022-1023
- Tin, 465
- Tobacco—
- consumption of, 710
- duty on, 677
- growers, 912
- imports of, 662, 667
- industry, 426, 427, 481, 515
- Tokelau (Union) Islands, 1, 2, 24, 25, 29, 59, 660, 674, 988, 996-997, 1079
- Toll service, 358-359
- Tonnage of registered vessels, 310-312
- Tonnage of shipping and cargo, 301-310
- Topdressing, 282, 343, 349, 409
- Topographical mapping, 295-296
- Totalisator—
- Agency Board, 772
- taxation, 772-773
- turnover on, 772-773
- Tourist—
- and Publicity Department, 1006
- attractions, 1000, 1005-1006
- Hotel Corporation, 1003, 1043
- industry, 1000-1006
- Tourists, 74, 1000-1003
- Town and country planning, 55-57
- Town districts, 53-55, 786-797
- area of, 66
- bridges in, 325
- capital and unimproved values, 299-300
- debt, 790, 792-796
- milage of streets, 325
- population, 66
- Tractors, imports of, 669, 673
- Tractors on farms, 412
- Trade—
- marks, 1009
- practices, 683-684
- retail, 585-592, 597-598, 599-605, 1131
- training of Maori youths, 942-944
- unions, 953-958, 959-960, 962, 963
- wholesale, 585, 592-594, 597-598, 605-609
- Trade, external, 613-682, 1059-1063, 1132
- agreements, 567-568, 678-682
- balance of, 617
- Board of, 676
- commissioner service, 631-632
- direction of exports, 614-615, 620-623, 641-658, 738
- origin of imports, 614-615, 620-623, 664-671
- per head, value of, 616
- Promotion Council, 614
- representation overseas, 1050
- statistics, compilation of, 617-624
- terms of, 702-703
- visible balance of, 617
- volume of, 624
- Trades Certification Board, 213
- Trades examinations, 213, 230
- Trading and works account, State, 748, 752, 753, 754
- Trading bank advances, classification of, 830-831
- Trading banks, 826-832, 845, 849-850, 1070
- Trading companies, deposits with, 842-844
- Traffic—
- accidents, 158, 336-337
- deaths from, 103, 104, 117-118, 337
- air, 343-353
- motor, 330-339
- offences, 242, 243-244, 338-339
- railways, 319-322, 1056
- Transhipment of cargo, 306-307
- Transport, 301-353, 1004, 1130-1131
- accidents, (see traffic accidents)
- boards 54
- equipment, imports of, 663, 670, 673
- equipment industry, 483-508,
- licensing, 334-335
- of school children, 220, 334
- research, 336
- urban, 339-342
- Transport and communications, publications on, 1100
- Travel allowances, overseas, 853
- Trawling, 452
- Treasury bills, 780
- Treaty of Waitangi, 28, 292, 1076
- Trees, forest, 433-452
- Tribunals, administrative, 1036-1040
- Trolley-buses, 340-341
- Trout, 5, 457
- Trust (liquor) control, 1015-1016
- Trust territory, 999
- Trustee, Maori, 294
- Trustee, Public, 1008
- Trustee savings banks, 838-840, 845
- Tuberculosis, 131-132, 143, 151, 153, 155, 173, 179
- deaths from 103, 104, 105-106, 155
- Tungsten ore, 465
- Tunnels, railway, 313-315
- Turkeys, 431
- Turnips, 421
- Tussock boards, nassella, 54, 410, 787
- Twins and triplets born, 90-91
- Tyre tax, 327
U
- Undergraduates, 228-229
- Unemployment, 944
- benefits, 169, 173, 180, 944
- Unexercised overdraft authorities, 832
- Unimproved occupied land, 273
- Unimproved value of land, 273, 298-299, 765, 785-786
- rating on, 785-786
- Unions, trade, 953-958, 959-960, 962, 963
- United Kingdom—
- communications with 350-351, 360
- dairy produce and meat imported into, 565-568, 570-571, 613, 648-653
- debt domiciled in, 778, 779-780, 1067
- New Zealand representation in, 1049
- prices in, 687
- relations with, 29-31
- representation in New Zealand, 1049
- shipping to and from, 306, 310
- social security reciprocity, 182-183
- trade agreements with, 567-568
- trade with, 613-614, 620, 623, 642, 645, 648-657, 664-666, 678-679, 734
- visitors and migrants from, 75, 1001
- United Nations, 34, 35-37, 260, 267, 988, 1081, 1082, 1083
- United States of America—
- debt domiciled in, 778, 779-780, 1067
- exchange rate with, 848
- New Zealand representation in, 1049, 1050
- prices in, 687
- representation in New Zealand, 1050
- trade with, 621, 623, 642, 645, 646, 648-651, 656, 665, 666, 679, 734
- visitors and migrants from, 75, 1001
- Universities, 142, 225, 226, 1122
- University—
- bursaries, 207, 226-227
- colleges of agriculture, 226, 228-229
- education, 207-208, 225-230, 1053
- entrance examination, 207, 213, 225
- Grants Committee, 208, 225
- scholarships, 226
- students, 207, 211, 227-229
- Uranium, 464, 469
- Urban—
- areas, 63-64
- cinemas in, 377
- population, 63-64
- stores in, 588
- drainage districts, 54, 787-780, 795-797
- mortgages, 859-860, 862-864, 865-866
- population, growth of, 68-70
- transport, 339-342
- transport boards, 54, 787-790, 795-797
- Urbanisation of population, 68-70
V
- Vacancies, employment, 936, 939
- Vaccination, 135, 153
- Valuation—
- of land, 296-300
- roll, 297, 785
- Value added in manufacturing, 476-477, 498-501, 1065
- Valuers' Registration Board, 300
- Veal—
- consumption of, 400-401
- export of, 648-649
- production of, 400-402, 510
- Vegetable growing, commercial, 413-414, 422-423
- Vegetables—
- consumption of, 709-710
- exported, canned and frozen, 636, 638
- grown in home gardens, 423
- retail prices of, 685
- Vehicles—
- motor
- Motor vehicles
- railway, 315-317
- Veneer and plywood, 445, 481, 524
- Venereal diseases, 103, 104, 131, 155
- Vessels—
- crews of, 73, 74
- entered and cleared, 301-310
- fishing, 452
- nationality of, 310
- radio communication with, 360
- safety of, 907
- wrecked, 313
- Veterans' allowances, 189, 191
- Veterinary services, 405
- Vineyards and grapes, 424
- Visitors to New Zealand, 74, 1000-1003
- points of arrival of, 1002
- Visual aids in teaching, 224
- Vital statistics, 87-127, 1052
- Vocational guidance, 220, 941
- Volcanoes, 2-4, 7-12, 1005, 1077, 1080
- Volume—
- exports, 624, 635-636, 648, 658
- farm production, 396
- imports, 624, 671-673
- manufacturing industries production, 505-506, 510-528
- money in circulation, 833
- production, 380-381, 472
- index of, 380-381
- trade, 624
- Voluntary welfare organisations, 143
- Voting—
- at general elections, 52, 1016-1021
- at licensing polls, 1021-1022
- qualifications, 51-52, 54
- Maoris, 52
W
- Wage and salary earners, 476-489, 507, 913, 958
- Salaries and wages
- Wage, basic, 911
- Wage minimum, 911, 912, 914, 917-926
- Wage rates, 910-926
- indexes of, 918-923
- Wages—
- and hours worked in industry, 915-917
- protection of, 912
- and wage rate legislation, 910-913
- protection of, 912
- average hourly wage in industry, 914-917
- protection of, 912
- average weekly earnings, 913-914, 923-926
- protection of, 912
- increases in, 910-926
- protection of, 912
- lost through industrial disputes, 963, 964, 965, 967, 969, 1075
- protection of, 912
- minimum weekly rates, 911, 912, 914, 917-926
- protection of, 912
- of manufacturing industry employees, 476-483, 489-492, 508, 510-527, 1065
- protection of, 912
- Waitangi, Treaty of, 28, 292, 1076
- War—
- bursaries for ex-servicemen's children, 192
- casualties, 268-269
- damage and earthquake insurance, 901-903
- debt, 776, 777
- loans, 776, 777
- pensions, 187-196
- pensions supplementary assistance, 191, 193
- publications, 1116
- veterans' allowances, 159, 191
- Warships, 260
- Washing machines, 509, 528
- Water—
- power, development of, 550-552
- safety campaign, 145
- supply boards, 54
- Waterfront control, 908-909, 1080
- Weather, 14-23, 1004
- Weights and measures, 415
- Welfare—
- Maori, 1007
- maternal, 135-136
- of workers, 906
- organisations, 143
- Western Samoa, 1, 2, 31, 34-35, 197, 620, 988, 1078, 1082
- Westminster, Statute of, 28, 33, 43, 1080
- Whales and whaling, 456, 635, 999, 1076
- Wheat, 414-416, 417-418, 1057
- Board, 417
- imports of, 417, 666, 671
- international agreement, 681
- milled, 512
- research, 406-408, 417-418
- Whey butter, 399
- Whitebait, 453, 457
- Whisky, imports of, 667, 671
- Whooping cough, immunisation, 135
- Wholesale—
- liquor licences, 1015
- prices, 688
- prices index, 696-699, 706-707
- trade, 585, 592-594, 597-598, 605-609
- Widowers, remarriages of, 121
- Widows—
- benefits, 169, 173, 175-176
- number of, 80
- remarriages of, 121
- war pensions, 188-189, 192
- Wildlife sanctuaries, 291, 292
- Wills administered by Public Trust Office, 1008
- Winds, 15-16
- Wine, consumption of, 710
- Wine licences, 1015
- Wine-making industry, 480
- Withdrawals from savings banks, 834, 836, 838-839, 1071
- Women—
- Air Force, Royal New Zealand, 264, 266
- Army Corps, Royal New Zealand, 262
- child bearing ages of, 89
- criminal charges and convictions against, 241, 245, 247
- deaths of, in childbirth, 103, 104, 116-117, 156
- employed in factories, 472, 486-492, 507, 929 933-935, 937-938, 946-949
- incomes of, 806, 819
- married, occupations of, 949-950
- nationality laws, re 77-79
- Naval Service, Royal New Zealand, 261
- offences by, 247
- on juries, 239
- police, 257
- wage rates of, 921, 923, 925-926
- working conditions of, 905, 906, 907,
- working hours of, 905, 906, 907
- Wood preservation, 447
- Wood pulp, exports of, 451, 635, 637, 639, 657
- Wood pulp, production of, 445-447, 481, 518
- Wool—
- Board, 404, 573
- commission, 404, 565, 573, 576, 741
- Commission Account, 585
- export price index, 700
- exports of, 309, 613, 633, 634, 636, 638, 647, 648, 851, 1060
- levy, 404
- marketing of, 564, 565-566, 573
- prices for, 576, 1064, 1131
- production, 394-396, 403-404, 510, 1064
- research, 404
- used at local mills, 515
- Woollen mills, 480, 515-516, 924-926
- Woollen piece-goods, imports of, 667, 668
- Works and trading account, state, 748, 752, 753, 754
- Workers' compensation, 239, 971-974, 975, 977
- Board, 971, 974, 987
- wages in, 924, 925, 926
- Workers—
- ages of injured, 979, 983
- safety of, 906, 984-987
- unions of, 953-958
- Working conditions, 903-909
- Working days lost through industrial disputes, 963, 964, 965, 967, 969
- Working hours, 507, 510-528, 915-917
- Working life expectancies, 951-952
- Working proprietors, 934-935
- Works, Ministry of, 986-987, 1121
- World Bank (see I.B.R.D.), 37, 301, 748, 775, 777, 778, 885-856, 1082
- World population, 86
- Wrecks, 313
X
- X-ray services, 132, 138, 153, 170, 185-186
Y
- Yields—
- butterfat, 398-399
- crops, 416-421, 1057
- Youth centres, 941
- Youth hostels, 130
- Youths—
- wage rates of, 921-922, 926
- working conditions of, 905-907
Z
- Zinc, 465